UNITED STATES
SECURITIES AND EXCHANGE COMMISSION
Washington, D.C. 20549
FORM N-CSR
CERTIFIED SHAREHOLDER REPORT OF REGISTERED
MANAGEMENT INVESTMENT COMPANIES
Investment Company Act file number 811-3759
Variable Insurance Products Fund IV
(Exact name of registrant as specified in charter)
245 Summer St., Boston, Massachusetts 02210
(Address of principal executive offices) (Zip code)
Marc Bryant, Secretary
245 Summer St.
Boston, Massachusetts 02210
(Name and address of agent for service)
Registrant's telephone number, including area code:
617-563-7000
| |
Date of fiscal year end: | December 31 |
| |
Date of reporting period: | December 31, 2016 |
Item 1.
Reports to Stockholders
Fidelity® Variable Insurance Products: Consumer Discretionary Portfolio
Annual Report December 31, 2016 |
 |
Contents
To view a fund's proxy voting guidelines and proxy voting record for the 12-month period ended June 30, visit http://www.fidelity.com/proxyvotingresults or visit the Securities and Exchange Commission's (SEC) web site at http://www.sec.gov.
You may also call 1-877-208-0098 to request a free copy of the proxy voting guidelines.
Fidelity® Variable Insurance Products are separate account options which are purchased through a variable insurance contract.
Standard & Poor's, S&P and S&P 500 are registered service marks of The McGraw-Hill Companies, Inc. and have been licensed for use by Fidelity Distributors Corporation.
Other third-party marks appearing herein are the property of their respective owners.
All other marks appearing herein are registered or unregistered trademarks or service marks of FMR LLC or an affiliated company. © 2017 FMR LLC. All rights reserved.
This report and the financial statements contained herein are submitted for the general information of the shareholders of the Fund. This report is not authorized for distribution to prospective investors in the Fund unless preceded or accompanied by an effective prospectus.
A fund files its complete schedule of portfolio holdings with the SEC for the first and third quarters of each fiscal year on Form N-Q. Forms N-Q are available on the SEC’s web site at http://www.sec.gov. A fund's Forms N-Q may be reviewed and copied at the SEC’s Public Reference Room in Washington, DC. Information regarding the operation of the SEC's Public Reference Room may be obtained by calling 1-800-SEC-0330.
For a complete list of a fund's portfolio holdings, view the most recent holdings listing, semiannual report, or annual report on Fidelity's web site at http://www.fidelity.com, http://www.institutional.fidelity.com, or http://www.401k.com, as applicable.
NOT FDIC INSURED •MAY LOSE VALUE •NO BANK GUARANTEE
Neither the Fund nor Fidelity Distributors Corporation is a bank.
Performance: The Bottom Line
Average annual total return reflects the change in the value of an investment, assuming reinvestment of distributions from dividend income and capital gains (the profits earned upon the sale of securities that have grown in value, if any) and assuming a constant rate of performance each year. During periods of reimbursement by Fidelity, a fund’s total return will be greater than it would be had the reimbursement not occurred. Performance numbers are net of all underlying fund operating expenses, but do not include any insurance charges imposed by your insurance company’s separate account. If performance information included the effect of these additional charges, the total returns would have been lower. How a fund did yesterday is no guarantee of how it will do tomorrow.
Average Annual Total Returns
| For the periods ended December 31, 2016 | Past 1 year | Past 5 years | Past 10 years |
| Initial Class | 5.24% | 15.71% | 8.40% |
| Investor Class | 5.12% | 15.61% | 8.31% |
$10,000 Over 10 Years
Let's say hypothetically that $10,000 was invested in VIP Consumer Discretionary Portfolio - Initial Class on December 31, 2006.
The chart shows how the value of your investment would have changed, and also shows how the S&P 500® Index performed over the same period.

| Period Ending Values |
| $22,403 | VIP Consumer Discretionary Portfolio - Initial Class |
| $19,572 | S&P 500® Index |
Management's Discussion of Fund Performance
Market Recap: The S&P 500 index returned 11.96% in 2016, rising sharply on post-election optimism for economic growth. The year began during a fairly volatile stretch, with stocks hampered by persistent oil-price weakness and U.S.-dollar strength. Markets regained momentum in February amid U.S. job gains, a rally in energy and other stimuli that helped keep the roughly seven-year uptrend intact. Markets tumbled briefly following the U.K.’s June 23 vote to exit the European Union – dubbed “Brexit” – then recovered quickly and settled into a flattish stretch until the November 8 U.S. presidential election. Stocks reacted to the outcome by reaching a series of all-time highs. For the year, energy (+27%) led the way amid two strong rallies in commodity prices, one in the spring and another in November. Telecommunication services (+23%) was close behind, as demand for dividend-paying equities was high early in the period. Cyclical sectors, including financials (+22%), industrials (+18%) and materials (+17%), also posted strong gains. Conversely, consumer staples (+5%) and consumer discretionary (+6%) lagged the index, the latter hurt as online competition continued to pressure brick-and-mortar retailers. Real estate (+3%) struggled due to expectations for rising interest rates, while health care (-2%) was hampered by an uncertain political and regulatory outlook.
Comments from Portfolio Manager Peter Dixon: For the year, the fund's share classes returned about 5%, underperforming both the 6.72% advance of the MSCI U.S. IMI Consumer Discretionary 25/50 Index. The sector fell short of the broader market but still produced a solid gain amid a number of positives, including wage growth and an improving job market. Versus the MSCI sector index, our biggest relative detractor the past year was major fund holding L Brands. The apparel maker and retailer, whose brands include Bath & Body Works, saw its shares return -27%. Shares began to sell off after the company’s estimates for fiscal-year 2016 were reduced after the management team restructured the Victoria's Secret brand – whose CEO left – and the company decided to exit certain categories. Then, in late October, the company announced disappointing comparable sales for Victoria's Secret. Another major laggard was Nike. The stock suffered amid mounting competition in the athletic apparel and footwear space. Conversely, our biggest individual contributor was large fund holding Charter Communications. Charter’s stock price advanced in August after the company reported solid earnings gains from its roughly $70 billion acquisition of Time Warner Cable (TWC) – along with internet provider Bright House Networks – completed in May. In December, Charter shares further benefited from expectations for greater-than-expected synergies resulting from the TWC acquisition. An overweighting in Amazon.com also boosted relative results.
The views expressed above reflect those of the portfolio manager(s) only through the end of the period as stated on the cover of this report and do not necessarily represent the views of Fidelity or any other person in the Fidelity organization. Any such views are subject to change at any time based upon market or other conditions and Fidelity disclaims any responsibility to update such views. These views may not be relied on as investment advice and, because investment decisions for a Fidelity fund are based on numerous factors, may not be relied on as an indication of trading intent on behalf of any Fidelity fund.
Investment Summary (Unaudited)
Top Ten Stocks as of December 31, 2016
| | % of fund's net assets | % of fund's net assets 6 months ago |
| Amazon.com, Inc. | 14.4 | 15.2 |
| The Walt Disney Co. | 9.7 | 8.4 |
| Home Depot, Inc. | 9.7 | 8.0 |
| Charter Communications, Inc. Class A | 6.8 | 7.1 |
| NIKE, Inc. Class B | 5.3 | 5.1 |
| L Brands, Inc. | 4.9 | 4.4 |
| Hilton Worldwide Holdings, Inc. | 4.6 | 4.1 |
| Ross Stores, Inc. | 3.5 | 4.8 |
| Dollar Tree, Inc. | 3.1 | 0.0 |
| Interpublic Group of Companies, Inc. | 3.0 | 2.8 |
| | 65.0 | |
Top Industries (% of fund's net assets)
| As of December 31, 2016 |
| | Media | 24.4% |
| | Specialty Retail | 24.0% |
| | Internet & Direct Marketing Retail | 17.0% |
| | Hotels, Restaurants & Leisure | 12.9% |
| | Textiles, Apparel & Luxury Goods | 8.4% |
| | All Others* | 13.3% |

| As of June 30, 2016 |
| | Specialty Retail | 25.1% |
| | Media | 24.2% |
| | Internet & Catalog Retail | 17.0% |
| | Hotels, Restaurants & Leisure | 13.5% |
| | Textiles, Apparel & Luxury Goods | 8.5% |
| | All Others* | 11.7% |

Prior period industry classifications reflect the categories in place as of the date indicated and have not been adjusted to reflect current industry classifications.
* Includes short-term investments and net other assets (liabilities).
Percentages shown as 0.0% may reflect amounts less than 0.05%.
Investments December 31, 2016
Showing Percentage of Net Assets
| Common Stocks - 99.0% | | | |
| | | Shares | Value |
| Auto Components - 1.1% | | | |
| Auto Parts & Equipment - 1.1% | | | |
| Tenneco, Inc. (a) | | 26,251 | $1,639,900 |
| Automobiles - 0.4% | | | |
| Automobile Manufacturers - 0.4% | | | |
| Ferrari NV | | 9,600 | 558,144 |
| Beverages - 1.2% | | | |
| Soft Drinks - 1.2% | | | |
| Monster Beverage Corp. (a) | | 40,090 | 1,777,591 |
| Distributors - 1.1% | | | |
| Distributors - 1.1% | | | |
| LKQ Corp. (a) | | 52,400 | 1,606,060 |
| Food & Staples Retailing - 0.1% | | | |
| Food Retail - 0.1% | | | |
| Zhou Hei Ya International Holdings Co. Ltd. | | 169,500 | 147,744 |
| Hotels, Restaurants & Leisure - 12.9% | | | |
| Casinos & Gaming - 1.3% | | | |
| Churchill Downs, Inc. | | 200 | 30,090 |
| Las Vegas Sands Corp. | | 35,159 | 1,877,842 |
| | | | 1,907,932 |
| Hotels, Resorts & Cruise Lines - 4.6% | | | |
| Hilton Worldwide Holdings, Inc. | | 248,840 | 6,768,448 |
| Leisure Facilities - 1.1% | | | |
| Vail Resorts, Inc. | | 10,460 | 1,687,303 |
| Restaurants - 5.9% | | | |
| Buffalo Wild Wings, Inc. (a) | | 12,800 | 1,976,320 |
| Darden Restaurants, Inc. | | 23,100 | 1,679,832 |
| Del Frisco's Restaurant Group, Inc. (a) | | 29,500 | 501,500 |
| Domino's Pizza, Inc. | | 6,500 | 1,035,060 |
| Jack in the Box, Inc. | | 1,100 | 122,804 |
| McDonald's Corp. | | 4,170 | 507,572 |
| Starbucks Corp. | | 50,470 | 2,802,094 |
| U.S. Foods Holding Corp. | | 2,500 | 68,700 |
| | | | 8,693,882 |
|
| TOTAL HOTELS, RESTAURANTS & LEISURE | | | 19,057,565 |
|
| Household Durables - 1.3% | | | |
| Household Appliances - 1.3% | | | |
| Techtronic Industries Co. Ltd. | | 535,908 | 1,917,735 |
| Household Products - 2.0% | | | |
| Household Products - 2.0% | | | |
| Spectrum Brands Holdings, Inc. | | 23,949 | 2,929,681 |
| Internet & Direct Marketing Retail - 17.0% | | | |
| Internet & Direct Marketing Retail - 17.0% | | | |
| Amazon.com, Inc. (a) | | 28,338 | 21,249,817 |
| Liberty Interactive Corp. QVC Group Series A (a) | | 108,300 | 2,163,834 |
| Ocado Group PLC (a)(b) | | 522,047 | 1,699,142 |
| | | | 25,112,793 |
| Leisure Products - 1.3% | | | |
| Leisure Products - 1.3% | | | |
| Mattel, Inc. | | 71,400 | 1,967,070 |
| Media - 24.1% | | | |
| Advertising - 3.0% | | | |
| Interpublic Group of Companies, Inc. | | 192,357 | 4,503,077 |
| Cable & Satellite - 10.9% | | | |
| Charter Communications, Inc. Class A (a) | | 34,977 | 10,070,578 |
| Comcast Corp. Class A | | 50,640 | 3,496,692 |
| DISH Network Corp. Class A (a) | | 13,500 | 782,055 |
| Naspers Ltd. Class N | | 5,240 | 764,996 |
| Sirius XM Holdings, Inc. (b) | | 226,600 | 1,008,370 |
| | | | 16,122,691 |
| Movies & Entertainment - 10.2% | | | |
| The Walt Disney Co. | | 137,957 | 14,377,879 |
| Time Warner, Inc. | | 7,200 | 695,016 |
| | | | 15,072,895 |
|
| TOTAL MEDIA | | | 35,698,663 |
|
| Multiline Retail - 4.0% | | | |
| General Merchandise Stores - 4.0% | | | |
| B&M European Value Retail S.A. | | 386,784 | 1,325,150 |
| Dollar Tree, Inc. (a) | | 59,642 | 4,603,170 |
| | | | 5,928,320 |
| Personal Products - 0.1% | | | |
| Personal Products - 0.1% | | | |
| Herbalife Ltd. (a) | | 3,400 | 163,676 |
| Specialty Retail - 24.0% | | | |
| Apparel Retail - 11.3% | | | |
| Express, Inc. (a) | | 23,600 | 253,936 |
| L Brands, Inc. | | 110,900 | 7,301,656 |
| Ross Stores, Inc. | | 78,500 | 5,149,600 |
| TJX Companies, Inc. | | 49,917 | 3,750,264 |
| Urban Outfitters, Inc. (a) | | 4,500 | 128,160 |
| Zumiez, Inc. (a)(b) | | 10,600 | 231,610 |
| | | | 16,815,226 |
| Automotive Retail - 3.0% | | | |
| Advance Auto Parts, Inc. | | 11,687 | 1,976,505 |
| O'Reilly Automotive, Inc. (a) | | 8,760 | 2,438,872 |
| | | | 4,415,377 |
| Home Improvement Retail - 9.7% | | | |
| Home Depot, Inc. | | 106,900 | 14,333,152 |
|
| TOTAL SPECIALTY RETAIL | | | 35,563,755 |
|
| Textiles, Apparel & Luxury Goods - 8.4% | | | |
| Apparel, Accessories & Luxury Goods - 3.1% | | | |
| G-III Apparel Group Ltd. (a) | | 10,452 | 308,961 |
| Michael Kors Holdings Ltd. (a) | | 10,100 | 434,098 |
| Regina Miracle International Holdings Ltd. (b) | | 258,019 | 213,384 |
| VF Corp. | | 67,500 | 3,601,125 |
| | | | 4,557,568 |
| Footwear - 5.3% | | | |
| NIKE, Inc. Class B | | 155,270 | 7,892,374 |
|
| TOTAL TEXTILES, APPAREL & LUXURY GOODS | | | 12,449,942 |
|
| TOTAL COMMON STOCKS | | | |
| (Cost $122,900,860) | | | 146,518,639 |
| | | Principal Amount | Value |
|
| Convertible Bonds - 0.3% | | | |
| Media - 0.3% | | | |
| Cable & Satellite - 0.3% | | | |
| DISH Network Corp. 3.375% 8/15/26 (c) | | | |
| (Cost $410,000) | | $410,000 | 466,631 |
| | | Shares | Value |
|
| Money Market Funds - 2.7% | | | |
| Fidelity Cash Central Fund, 0.60% (d) | | 762,010 | 762,162 |
| Fidelity Securities Lending Cash Central Fund 0.65% (d)(e) | | 3,213,090 | 3,213,412 |
| TOTAL MONEY MARKET FUNDS | | | |
| (Cost $3,975,274) | | | 3,975,574 |
| TOTAL INVESTMENT PORTFOLIO - 102.0% | | | |
| (Cost $127,286,134) | | | 150,960,844 |
| NET OTHER ASSETS (LIABILITIES) - (2.0)% | | | (3,011,919) |
| NET ASSETS - 100% | | | $147,948,925 |
Legend
(a) Non-income producing
(b) Security or a portion of the security is on loan at period end.
(c) Security exempt from registration under Rule 144A of the Securities Act of 1933. These securities may be resold in transactions exempt from registration, normally to qualified institutional buyers. At the end of the period, the value of these securities amounted to $466,631 or 0.3% of net assets.
(d) Affiliated fund that is generally available only to investment companies and other accounts managed by Fidelity Investments. The rate quoted is the annualized seven-day yield of the fund at period end. A complete unaudited listing of the fund's holdings as of its most recent quarter end is available upon request. In addition, each Fidelity Central Fund's financial statements, which are not covered by the Fund's Report of Independent Registered Public Accounting Firm, are available on the SEC's website or upon request.
(e) Investment made with cash collateral received from securities on loan.
Affiliated Central Funds
Information regarding fiscal year to date income earned by the Fund from investments in Fidelity Central Funds is as follows:
| Fund | Income earned |
| Fidelity Cash Central Fund | $10,928 |
| Fidelity Securities Lending Cash Central Fund | 183,377 |
| Total | $194,305 |
Investment Valuation
The following is a summary of the inputs used, as of December 31, 2016, involving the Fund's assets and liabilities carried at fair value. The inputs or methodology used for valuing securities may not be an indication of the risk associated with investing in those securities. For more information on valuation inputs, and their aggregation into the levels used below, please refer to the Investment Valuation section in the accompanying Notes to Financial Statements.
| | Valuation Inputs at Reporting Date: |
| Description | Total | Level 1 | Level 2 | Level 3 |
| Investments in Securities: | | | | |
| Common Stocks | $146,518,639 | $143,474,780 | $3,043,859 | $-- |
| Convertible Bonds | 466,631 | -- | 466,631 | -- |
| Money Market Funds | 3,975,574 | 3,975,574 | -- | -- |
| Total Investments in Securities: | $150,960,844 | $147,450,354 | $3,510,490 | $-- |
See accompanying notes which are an integral part of the financial statements.
Financial Statements
Statement of Assets and Liabilities
| | | December 31, 2016 |
| Assets | | |
Investment in securities, at value (including securities loaned of $3,104,935) — See accompanying schedule:
Unaffiliated issuers (cost $123,310,860) | $146,985,270 | |
| Fidelity Central Funds (cost $3,975,274) | 3,975,574 | |
| Total Investments (cost $127,286,134) | | $150,960,844 |
| Receivable for investments sold | | 886,113 |
| Dividends receivable | | 170,638 |
| Interest receivable | | 5,496 |
| Distributions receivable from Fidelity Central Funds | | 7,729 |
| Prepaid expenses | | 829 |
| Other receivables | | 2,757 |
| Total assets | | 152,034,406 |
| Liabilities | | |
| Payable for investments purchased | $73,666 | |
| Payable for fund shares redeemed | 665,021 | |
| Accrued management fee | 69,604 | |
| Other affiliated payables | 22,091 | |
| Other payables and accrued expenses | 42,119 | |
| Collateral on Securities Loaned | 3,212,980 | |
| Total liabilities | | 4,085,481 |
| Net Assets | | $147,948,925 |
| Net Assets consist of: | | |
| Paid in capital | | $126,936,989 |
| Undistributed net investment income | | 244,854 |
| Accumulated undistributed net realized gain (loss) on investments and foreign currency transactions | | (2,906,414) |
| Net unrealized appreciation (depreciation) on investments and assets and liabilities in foreign currencies | | 23,673,496 |
| Net Assets | | $147,948,925 |
| Initial Class: | | |
| Net Asset Value, offering price and redemption price per share ($23,677,425 ÷ 1,292,056 shares) | | $18.33 |
| Investor Class: | | |
| Net Asset Value, offering price and redemption price per share ($124,271,500 ÷ 6,799,791 shares) | | $18.28 |
See accompanying notes which are an integral part of the financial statements.
Statement of Operations
| | | Year ended December 31, 2016 |
| Investment Income | | |
| Dividends | | $2,371,022 |
| Interest | | 5,500 |
| Income from Fidelity Central Funds (including $183,377 from security lending) | | 194,305 |
| Total income | | 2,570,827 |
| Expenses | | |
| Management fee | $907,893 | |
| Transfer agent fees | 220,399 | |
| Accounting and security lending fees | 66,314 | |
| Custodian fees and expenses | 14,560 | |
| Independent trustees' fees and expenses | 3,637 | |
| Audit | 54,886 | |
| Legal | 3,683 | |
| Miscellaneous | 1,888 | |
| Total expenses before reductions | 1,273,260 | |
| Expense reductions | (7,467) | 1,265,793 |
| Net investment income (loss) | | 1,305,034 |
| Realized and Unrealized Gain (Loss) | | |
| Net realized gain (loss) on: | | |
| Investment securities: | | |
| Unaffiliated issuers | (1,784,098) | |
| Fidelity Central Funds | 896 | |
| Foreign currency transactions | (9,818) | |
| Total net realized gain (loss) | | (1,793,020) |
Change in net unrealized appreciation (depreciation) on:
Investment securities | 6,462,816 | |
| Assets and liabilities in foreign currencies | (123) | |
| Total change in net unrealized appreciation (depreciation) | | 6,462,693 |
| Net gain (loss) | | 4,669,673 |
| Net increase (decrease) in net assets resulting from operations | | $5,974,707 |
See accompanying notes which are an integral part of the financial statements.
Statement of Changes in Net Assets
| | Year ended December 31, 2016 | Year ended December 31, 2015 |
| Increase (Decrease) in Net Assets | | |
| Operations | | |
| Net investment income (loss) | $1,305,034 | $912,511 |
| Net realized gain (loss) | (1,793,020) | 2,600,750 |
| Change in net unrealized appreciation (depreciation) | 6,462,693 | 267,905 |
| Net increase (decrease) in net assets resulting from operations | 5,974,707 | 3,781,166 |
| Distributions to shareholders from net investment income | (1,035,303) | (888,137) |
| Distributions to shareholders from net realized gain | (3,068,756) | (12,074,620) |
| Total distributions | (4,104,059) | (12,962,757) |
| Share transactions - net increase (decrease) | (61,945,625) | 108,756,640 |
| Redemption fees | 48,581 | 73,024 |
| Total increase (decrease) in net assets | (60,026,396) | 99,648,073 |
| Net Assets | | |
| Beginning of period | 207,975,321 | 108,327,248 |
| End of period | $147,948,925 | $207,975,321 |
| Other Information | | |
| Undistributed net investment income end of period | $244,854 | $– |
See accompanying notes which are an integral part of the financial statements.
Financial Highlights — VIP Consumer Discretionary Portfolio Initial Class
| Years ended December 31, | 2016 | 2015 | 2014 | 2013 | 2012 |
| Selected Per–Share Data | | | | | |
| Net asset value, beginning of period | $17.88 | $19.01 | $18.54 | $14.24 | $12.26 |
| Income from Investment Operations | | | | | |
| Net investment income (loss)A | .15 | .13 | .08 | .03 | .07 |
| Net realized and unrealized gain (loss) | .73 | .73 | 1.59 | 5.58 | 2.55 |
| Total from investment operations | .88 | .86 | 1.67 | 5.61 | 2.62 |
| Distributions from net investment income | (.14) | (.09) | (.10) | (.02) | (.05) |
| Distributions from net realized gain | (.30) | (1.91) | (1.11) | (1.30) | (.60) |
| Total distributions | (.44) | (2.00) | (1.20)B | (1.32) | (.65) |
| Redemption fees added to paid in capitalA | .01 | .01 | –C | .01 | .01 |
| Net asset value, end of period | $18.33 | $17.88 | $19.01 | $18.54 | $14.24 |
| Total ReturnD,E | 5.24% | 4.71% | 9.64% | 41.10% | 21.67% |
| Ratios to Average Net AssetsF,G | | | | | |
| Expenses before reductions | .70% | .70% | .72% | .76% | .89% |
| Expenses net of fee waivers, if any | .70% | .70% | .72% | .75% | .89% |
| Expenses net of all reductions | .70% | .69% | .71% | .75% | .88% |
| Net investment income (loss) | .86% | .69% | .45% | .16% | .53% |
| Supplemental Data | | | | | |
| Net assets, end of period (000 omitted) | $23,677 | $42,048 | $21,446 | $32,004 | $11,950 |
| Portfolio turnover rateH | 43% | 46% | 129% | 122% | 190% |
A Calculated based on average shares outstanding during the period.
B Total distributions of $1.20 per share is comprised of distributions from net investment income of $0.097 and distributions from net realized gain of $1.106 per share.
C Amount represents less than $.005 per share.
D Total returns do not reflect charges attributable to your insurance company's separate account. Inclusion of these charges would reduce the total returns shown.
E Total returns would have been lower if certain expenses had not been reduced during the applicable periods shown.
F Fees and expenses of any underlying Fidelity Central Funds are not included in the Fund's expense ratio. The Fund indirectly bears its proportionate share of the expenses of any underlying Fidelity Central Funds.
G Expense ratios reflect operating expenses of the class. Expenses before reductions do not reflect amounts reimbursed by the investment adviser or reductions from brokerage service arrangements or reductions from other expense offset arrangements and do not represent the amount paid by the class during periods when reimbursements or reductions occur. Expenses net of fee waivers reflect expenses after reimbursement by the investment adviser but prior to reductions from brokerage service arrangements or other expense offset arrangements. Expenses net of all reductions represent the net expenses paid by the class.
H Amount does not include the portfolio activity of any underlying Fidelity Central Funds.
See accompanying notes which are an integral part of the financial statements.
Financial Highlights — VIP Consumer Discretionary Portfolio Investor Class
| Years ended December 31, | 2016 | 2015 | 2014 | 2013 | 2012 |
| Selected Per–Share Data | | | | | |
| Net asset value, beginning of period | $17.84 | $18.97 | $18.50 | $14.21 | $12.25 |
| Income from Investment Operations | | | | | |
| Net investment income (loss)A | .14 | .11 | .07 | .01 | .06 |
| Net realized and unrealized gain (loss) | .71 | .74 | 1.59 | 5.58 | 2.53 |
| Total from investment operations | .85 | .85 | 1.66 | 5.59 | 2.59 |
| Distributions from net investment income | (.13) | (.08) | (.08) | (.01) | (.04) |
| Distributions from net realized gain | (.30) | (1.91) | (1.11) | (1.30) | (.60) |
| Total distributions | (.42)B | (1.99) | (1.19) | (1.31) | (.64) |
| Redemption fees added to paid in capitalA | .01 | .01 | –C | .01 | .01 |
| Net asset value, end of period | $18.28 | $17.84 | $18.97 | $18.50 | $14.21 |
| Total ReturnD,E | 5.12% | 4.66% | 9.58% | 41.05% | 21.45% |
| Ratios to Average Net AssetsF,G | | | | | |
| Expenses before reductions | .78% | .78% | .80% | .83% | .96% |
| Expenses net of fee waivers, if any | .78% | .77% | .79% | .83% | .96% |
| Expenses net of all reductions | .78% | .77% | .78% | .83% | .94% |
| Net investment income (loss) | .78% | .61% | .38% | .08% | .46% |
| Supplemental Data | | | | | |
| Net assets, end of period (000 omitted) | $124,272 | $165,927 | $86,882 | $109,697 | $27,563 |
| Portfolio turnover rateH | 43% | 46% | 129% | 122% | 190% |
A Calculated based on average shares outstanding during the period.
B Total distributions of $.42 per share is comprised of distributions from net investment income of $.125 and distributions from net realized gain of $.298 per share.
C Amount represents less than $.005 per share.
D Total returns do not reflect charges attributable to your insurance company's separate account. Inclusion of these charges would reduce the total returns shown.
E Total returns would have been lower if certain expenses had not been reduced during the applicable periods shown.
F Fees and expenses of any underlying Fidelity Central Funds are not included in the Fund's expense ratio. The Fund indirectly bears its proportionate share of the expenses of any underlying Fidelity Central Funds.
G Expense ratios reflect operating expenses of the class. Expenses before reductions do not reflect amounts reimbursed by the investment adviser or reductions from brokerage service arrangements or reductions from other expense offset arrangements and do not represent the amount paid by the class during periods when reimbursements or reductions occur. Expenses net of fee waivers reflect expenses after reimbursement by the investment adviser but prior to reductions from brokerage service arrangements or other expense offset arrangements. Expenses net of all reductions represent the net expenses paid by the class.
H Amount does not include the portfolio activity of any underlying Fidelity Central Funds.
See accompanying notes which are an integral part of the financial statements.
Notes to Financial Statements
For the period ended December 31, 2016
1. Organization.
VIP Consumer Discretionary Portfolio (the Fund) is a non-diversified fund of Variable Insurance Products Fund IV (the Trust) and is authorized to issue an unlimited number of shares. The Trust is registered under the Investment Company Act of 1940, as amended (the 1940 Act), as an open-end management investment company organized as a Massachusetts business trust. Shares of the Fund may only be purchased by insurance companies for the purpose of funding variable annuity or variable life insurance contracts. The Fund offers the following classes of shares: Initial Class shares and Investor Class shares. All classes have equal rights and voting privileges, except for matters affecting a single class.
2. Investments in Fidelity Central Funds.
The Fund invests in Fidelity Central Funds, which are open-end investment companies generally available only to other investment companies and accounts managed by the investment adviser and its affiliates. The Fund's Schedule of Investments lists each of the Fidelity Central Funds held as of period end, if any, as an investment of the Fund, but does not include the underlying holdings of each Fidelity Central Fund. As an Investing Fund, the Fund indirectly bears its proportionate share of the expenses of the underlying Fidelity Central Funds.
The Money Market Central Funds seek preservation of capital and current income and are managed by Fidelity Investments Money Management, Inc. (FIMM), an affiliate of the investment adviser. Annualized expenses of the Money Market Central Funds as of their most recent shareholder report date are less than .005%.
A complete unaudited list of holdings for each Fidelity Central Fund is available upon request or at the Securities and Exchange Commission (the SEC) website at www.sec.gov. In addition, the financial statements of the Fidelity Central Funds, which are not covered by the Fund's Report of Independent Registered Public Accounting Firm, are available on the SEC website or upon request.
3. Significant Accounting Policies.
The financial statements have been prepared in conformity with accounting principles generally accepted in the United States of America (GAAP), which require management to make certain estimates and assumptions at the date of the financial statements. Actual results could differ from those estimates. Subsequent events, if any, through the date that the financial statements were issued have been evaluated in the preparation of the financial statements. The following summarizes the significant accounting policies of the Fund:
Investment Valuation. Investments are valued as of 4:00 p.m. Eastern time on the last calendar day of the period. The Board of Trustees (the Board) has delegated the day to day responsibility for the valuation of the Fund's investments to the Fair Value Committee (the Committee) established by the Fund's investment adviser. In accordance with valuation policies and procedures approved by the Board, the Fund attempts to obtain prices from one or more third party pricing vendors or brokers to value its investments. When current market prices, quotations or currency exchange rates are not readily available or reliable, investments will be fair valued in good faith by the Committee, in accordance with procedures adopted by the Board. Factors used in determining fair value vary by investment type and may include market or investment specific events, changes in interest rates and credit quality. The frequency with which these procedures are used cannot be predicted and they may be utilized to a significant extent. The Committee oversees the Fund's valuation policies and procedures and reports to the Board on the Committee's activities and fair value determinations. The Board monitors the appropriateness of the procedures used in valuing the Fund's investments and ratifies the fair value determinations of the Committee.
The Fund categorizes the inputs to valuation techniques used to value its investments into a disclosure hierarchy consisting of three levels as shown below:
- Level 1 – quoted prices in active markets for identical investments
- Level 2 – other significant observable inputs (including quoted prices for similar investments, interest rates, prepayment speeds, etc.)
- Level 3 – unobservable inputs (including the Fund's own assumptions based on the best information available)
Valuation techniques used to value the Fund's investments by major category are as follows:
Equity securities, including restricted securities, for which market quotations are readily available, are valued at the last reported sale price or official closing price as reported by a third party pricing vendor on the primary market or exchange on which they are traded and are categorized as Level 1 in the hierarchy. In the event there were no sales during the day or closing prices are not available, securities are valued at the last quoted bid price or may be valued using the last available price and are generally categorized as Level 2 in the hierarchy. For foreign equity securities, when market or security specific events arise, comparisons to the valuation of American Depositary Receipts (ADRs), futures contracts, Exchange-Traded Funds (ETFs) and certain indexes as well as quoted prices for similar securities may be used and would be categorized as Level 2 in the hierarchy. Utilizing these techniques may result in transfers between Level 1 and Level 2. For equity securities, including restricted securities, where observable inputs are limited, assumptions about market activity and risk are used and these securities may be categorized as Level 3 in the hierarchy.
Debt securities, including restricted securities, are valued based on evaluated prices received from third party pricing vendors or from brokers who make markets in such securities. Corporate bonds are valued by pricing vendors who utilize matrix pricing which considers yield or price of bonds of comparable quality, coupon, maturity and type or by broker-supplied prices. When independent prices are unavailable or unreliable, debt securities may be valued utilizing pricing methodologies which consider similar factors that would be used by third party pricing vendors. Debt securities are generally categorized as Level 2 in the hierarchy but may be Level 3 depending on the circumstances.
Investments in open-end mutual funds, including the Fidelity Central Funds, are valued at their closing net asset value (NAV) each business day and are categorized as Level 1 in the hierarchy.
Changes in valuation techniques may result in transfers in or out of an assigned level within the disclosure hierarchy. The aggregate value of investments by input level as of December 31, 2016 is included at the end of the Fund's Schedule of Investments.
Foreign Currency. The Fund may use foreign currency contracts to facilitate transactions in foreign-denominated securities. Gains and losses from these transactions may arise from changes in the value of the foreign currency or if the counterparties do not perform under the contracts' terms.
Foreign-denominated assets, including investment securities, and liabilities are translated into U.S. dollars at the exchange rates at period end. Purchases and sales of investment securities, income and dividends received and expenses denominated in foreign currencies are translated into U.S. dollars at the exchange rate in effect on the transaction date.
The effects of exchange rate fluctuations on investments are included with the net realized and unrealized gain (loss) on investment securities. Other foreign currency transactions resulting in realized and unrealized gain (loss) are disclosed separately.
Investment Transactions and Income. For financial reporting purposes, the Fund's investment holdings and NAV include trades executed through the end of the last business day of the period. The NAV per share for processing shareholder transactions is calculated as of the close of business of the New York Stock Exchange (NYSE), normally 4:00 p.m. Eastern time and includes trades executed through the end of the prior business day. Gains and losses on securities sold are determined on the basis of identified cost and may include proceeds received from litigation. Dividend income is recorded on the ex-dividend date, except for certain dividends from foreign securities where the ex-dividend date may have passed, which are recorded as soon as the Fund is informed of the ex-dividend date. Non-cash dividends included in dividend income, if any, are recorded at the fair market value of the securities received. Income and capital gain distributions from Fidelity Central Funds, if any, are recorded on the ex-dividend date. Certain distributions received by the Fund represent a return of capital or capital gain. The Fund determines the components of these distributions subsequent to the ex-dividend date, based upon receipt of tax filings or other correspondence relating to the underlying investment. These distributions are recorded as a reduction of cost of investments and/or as a realized gain. Interest income is accrued as earned and includes coupon interest and amortization of premium and accretion of discount on debt securities as applicable. Investment income is recorded net of foreign taxes withheld where recovery of such taxes is uncertain. Debt obligations may be placed on non-accrual status and related interest income may be reduced by ceasing current accruals and writing off interest receivables when the collection of all or a portion of interest has become doubtful based on consistently applied procedures. A debt obligation is removed from non-accrual status when the issuer resumes interest payments or when collectability of interest is reasonably assured.
Class Allocations and Expenses. Investment income, realized and unrealized capital gains and losses, common expenses of the Fund, and certain fund-level expense reductions, if any, are allocated daily on a pro-rata basis to each class based on the relative net assets of each class to the total net assets of the Fund. Each class differs with respect to transfer agent fees incurred. Certain expense reductions may also differ by class. For the reporting period, the allocated portion of income and expenses to each class as a percent of its average net assets may vary due to the timing of recording these transactions in relation to fluctuating net assets of the classes. Expenses directly attributable to a fund are charged to that fund. Expenses attributable to more than one fund are allocated among the respective funds on the basis of relative net assets or other appropriate methods. Expense estimates are accrued in the period to which they relate and adjustments are made when actual amounts are known.
Income Tax Information and Distributions to Shareholders. Each year, the Fund intends to qualify as a regulated investment company under Subchapter M of the Internal Revenue Code, including distributing substantially all of its taxable income and realized gains. As a result, no provision for U.S. Federal income taxes is required. As of December 31, 2016, the Fund did not have any unrecognized tax benefits in the financial statements; nor is the Fund aware of any tax positions for which it is reasonably possible that the total amounts of unrecognized tax benefits will significantly change in the next twelve months. The Fund files a U.S. federal tax return, in addition to state and local tax returns as required. The Fund's federal income tax returns are subject to examination by the Internal Revenue Service (IRS) for a period of three fiscal years after they are filed. State and local tax returns may be subject to examination for an additional fiscal year depending on the jurisdiction. Foreign taxes are provided for based on the Fund's understanding of the tax rules and rates that exist in the foreign markets in which it invests. The Fund is subject to a tax imposed on capital gains by certain countries in which it invests.
Distributions are declared and recorded on the ex-dividend date. Income dividends and capital gain distributions are declared separately for each class. Income and capital gain distributions are determined in accordance with income tax regulations, which may differ from GAAP.
Capital accounts within the financial statements are adjusted for permanent book-tax differences. These adjustments have no impact on net assets or the results of operations. Capital accounts are not adjusted for temporary book-tax differences which will reverse in a subsequent period.
Book-tax differences are primarily due to foreign currency transactions, capital loss carryforwards, certain foreign taxes, losses deferred due to wash sales and excise tax regulations.
The federal tax cost of investment securities and unrealized appreciation (depreciation) as of period end were as follows:
| Gross unrealized appreciation | $29,221,566 |
| Gross unrealized depreciation | (5,675,400) |
| Net unrealized appreciation (depreciation) on securities | $23,546,166 |
| Tax Cost | $127,414,678 |
The tax-based components of distributable earnings as of period end were as follows:
| Undistributed ordinary income | $244,853 |
| Capital loss carryforward | $(2,777,871) |
| Net unrealized appreciation (depreciation) on securities and other investments | $ 23,544,946 |
Capital loss carryforwards are only available to offset future capital gains of the Fund to the extent provided by regulations and may be limited. Under the Regulated Investment Company Modernization Act of 2010 (the Act), the Fund is permitted to carry forward capital losses incurred in taxable years beginning after December 22, 2010 for an unlimited period and such capital losses are required to be used prior to any losses that expire. The capital loss carryforward information presented below, including any applicable limitation, is estimated as of fiscal period end and is subject to adjustment.
| Fiscal year of expiration | |
| No expiration | |
| Short-term | $(2,777,871) |
The tax character of distributions paid was as follows:
| | December 31, 2016 | December 31, 2015 |
| Ordinary Income | $1,035,303 | $ 1,510,373 |
| Long-term Capital Gains | 3,068,756 | 11,452,384 |
| Total | $4,104,059 | $ 12,962,757 |
Trading (Redemption) Fees. Shares held by investors less than 60 days may be subject to a redemption fee equal to 1% of the NAV of shares redeemed. All redemption fees, which reduce the proceeds of the shareholder redemption, are retained by the Fund and accounted for as an addition to paid in capital.
Restricted Securities. The Fund may invest in securities that are subject to legal or contractual restrictions on resale. These securities generally may be resold in transactions exempt from registration or to the public if the securities are registered. Disposal of these securities may involve time-consuming negotiations and expense, and prompt sale at an acceptable price may be difficult. Information regarding restricted securities is included at the end of the Fund's Schedule of Investments.
4. Purchases and Sales of Investments.
Purchases and sales of securities, other than short-term securities, aggregated $70,694,884 and $126,211,227, respectively.
5. Fees and Other Transactions with Affiliates.
Management Fee. Fidelity SelectCo, LLC (the investment adviser) and its affiliates provide the Fund with investment management related services for which the Fund pays a monthly management fee. The management fee is the sum of an individual fund fee rate that is based on an annual rate of .30% of the Fund's average net assets and an annualized group fee rate that averaged .25% during the period. The group fee rate is based upon the average net assets of all the mutual funds advised by Fidelity Management & Research Company (FMR) and the investment adviser. The group fee rate decreases as assets under management increase and increases as assets under management decrease. For the reporting period, the total annual management fee rate was .55% of the Fund's average net assets.
Transfer Agent Fees. Fidelity Investments Institutional Operations Company, Inc. (FIIOC), an affiliate of the investment adviser, is the Fund's transfer, dividend disbursing, and shareholder servicing agent. FIIOC receives an asset-based fee with respect to each class. Each class (with the exception of Investor Class) pays a fee for transfer agent services, typesetting, and printing and mailing of shareholder reports, excluding mailing of proxy statements, equal to an annual rate of .07% (.15% for Investor Class) of class-level average net assets. For the period, transfer agent fees for each class were as follows:
| Initial Class | $18,665 |
| Investor Class | 201,734 |
| | $220,399 |
Accounting and Security Lending Fees. Fidelity Service Company, Inc. (FSC), an affiliate of the investment adviser, maintains the Fund's accounting records. The accounting fee is based on the level of average net assets for each month. Under a separate contract, FSC administers the security lending program. The security lending fee is based on the number and duration of lending transactions.
Brokerage Commissions. The Fund placed a portion of its portfolio transactions with brokerage firms which are affiliates of the investment adviser. Brokerage commissions are included in net realized gain (loss) and change in net unrealized appreciation (depreciation) in the Statement of Operations. The commissions paid to these affiliated firms were $1,655 for the period.
Interfund Trades. The Fund may purchase from or sell securities to other Fidelity Funds under procedures adopted by the Board. The procedures have been designed to ensure these interfund trades are executed in accordance with Rule 17a-7 of the 1940 Act. Interfund trades are included within the respective purchases and sales amounts shown in the Purchases and Sales of Investments note.
6. Committed Line of Credit.
The Fund participates with other funds managed by the investment adviser or an affiliate in a $4.25 billion credit facility (the "line of credit") to be utilized for temporary or emergency purposes to fund shareholder redemptions or for other short-term liquidity purposes. The Fund has agreed to pay commitment fees on its pro-rata portion of the line of credit, which amounted to $438 and is reflected in Miscellaneous expenses on the Statement of Operations. During the period, the Fund did not borrow on this line of credit.
7. Security Lending.
The Fund lends portfolio securities through a lending agent from time to time in order to earn additional income. On the settlement date of the loan, the Fund receives collateral (in the form of U.S. Treasury obligations, letters of credit and/or cash) against the loaned securities and maintains collateral in an amount not less than 100% of the market value of the loaned securities during the period of the loan. The market value of the loaned securities is determined at the close of business of the Fund and any additional required collateral is delivered to the Fund on the next business day. The Fund or borrower may terminate the loan at any time, and if the borrower defaults on its obligation to return the securities loaned because of insolvency or other reasons, the Fund may apply collateral received from the borrower against the obligation. The Fund may experience delays and costs in recovering the securities loaned. Any cash collateral received is invested in the Fidelity Securities Lending Cash Central Fund. The value of loaned securities and cash collateral at period end are disclosed on the Fund's Statement of Assets and Liabilities. Security lending income represents the income earned on investing cash collateral, less rebates paid to borrowers and any lending agent fees associated with the loan, plus any premium payments received for lending certain types of securities. Security lending income is presented in the Statement of Operations as a component of income from Fidelity Central Funds.
8. Expense Reductions.
Commissions paid to certain brokers with whom the investment adviser, or its affiliates, places trades on behalf of the Fund include an amount in addition to trade execution, which may be rebated back to the Fund to offset certain expenses. This amount totaled $6,007 for the period.
In addition, during the period the investment adviser reimbursed and/or waived a portion of fund-level operating expenses in the amount of $1,460.
9. Distributions to Shareholders.
Distributions to shareholders of each class were as follows:
| | Year ended
December 31, 2016 | Year ended
December 31, 2015 |
| From net investment income | | |
| Initial Class | $177,534 | $201,826 |
| Investor Class | 857,769 | 686,311 |
| Total | $1,035,303 | $888,137 |
| From net realized gain | | |
| Initial Class | $586,354 | $2,248,126 |
| Investor Class | 2,482,402 | 9,826,494 |
| Total | $3,068,756 | $12,074,620 |
10. Share Transactions.
Transactions for each class of shares were as follows:
| | Shares | Shares | Dollars | Dollars |
| | Year ended December 31, 2016 | Year ended December 31, 2015 | Year ended December 31, 2016 | Year ended December 31, 2015 |
| Initial Class | | | | |
| Shares sold | 122,020 | 1,350,232 | $2,169,098 | $24,894,236 |
| Reinvestment of distributions | 46,901 | 138,025 | 763,888 | 2,449,952 |
| Shares redeemed | (1,228,235) | (265,236) | (21,325,956) | (4,757,952) |
| Net increase (decrease) | (1,059,314) | 1,223,021 | $(18,392,970) | $22,586,236 |
| Investor Class | | | | |
| Shares sold | 609,221 | 4,742,177 | $10,778,576 | $86,676,987 |
| Reinvestment of distributions | 204,746 | 593,909 | 3,340,171 | 10,512,805 |
| Shares redeemed | (3,316,240) | (614,917) | (57,671,402) | (11,019,388) |
| Net increase (decrease) | (2,502,273) | 4,721,169 | $(43,552,655) | $86,170,404 |
11. Other.
The Fund's organizational documents provide former and current trustees and officers with a limited indemnification against liabilities arising in connection with the performance of their duties to the Fund. In the normal course of business, the Fund may also enter into contracts that provide general indemnifications. The Fund's maximum exposure under these arrangements is unknown as this would be dependent on future claims that may be made against the Fund. The risk of material loss from such claims is considered remote.
At the end of the period, the investment adviser or its affiliates were the owners of record of 100% of the total outstanding shares of the Fund.
Report of Independent Registered Public Accounting Firm
To the Trustees of Variable Insurance Products Fund IV and Shareholders of VIP Consumer Discretionary Portfolio:
In our opinion, the accompanying statement of assets and liabilities, including the schedule of investments, and the related statements of operations and of changes in net assets and the financial highlights present fairly, in all material respects, the financial position of VIP Consumer Discretionary Portfolio (a fund of Variable Insurance Products Fund IV) (the "Fund") as of December 31, 2016, the results of its operations for the year then ended, the changes in its net assets for each of the two years in the period then ended and the financial highlights for each of the five years in the period then ended, in conformity with accounting principles generally accepted in the United States of America. These financial statements and financial highlights (hereafter referred to as “financial statements”) are the responsibility of the Fund's management. Our responsibility is to express an opinion on these financial statements based on our audits. We conducted our audits of these financial statements in accordance with the standards of the Public Company Accounting Oversight Board (United States). Those standards require that we plan and perform the audit to obtain reasonable assurance about whether the financial statements are free of material misstatement. An audit includes examining, on a test basis, evidence supporting the amounts and disclosures in the financial statements, assessing the accounting principles used and significant estimates made by management, and evaluating the overall financial statement presentation. We believe that our audits, which included confirmation of securities as of December 31, 2016 by correspondence with the custodian and brokers, provide a reasonable basis for our opinion.
PricewaterhouseCoopers LLP
Boston, Massachusetts
February 16, 2017
Trustees and Officers
The Trustees, Members of the Advisory Board (if any), and officers of the trust and fund, as applicable, are listed below. The Board of Trustees governs the fund and is responsible for protecting the interests of shareholders. The Trustees are experienced executives who meet periodically throughout the year to oversee the fund's activities, review contractual arrangements with companies that provide services to the fund, oversee management of the risks associated with such activities and contractual arrangements, and review the fund's performance. Each of the Trustees oversees 83 funds.
The Trustees hold office without limit in time except that (a) any Trustee may resign; (b) any Trustee may be removed by written instrument, signed by at least two-thirds of the number of Trustees prior to such removal; (c) any Trustee who requests to be retired or who has become incapacitated by illness or injury may be retired by written instrument signed by a majority of the other Trustees; and (d) any Trustee may be removed at any special meeting of shareholders by a two-thirds vote of the outstanding voting securities of the trust. Each Trustee who is not an interested person (as defined in the 1940 Act) of the trust and the fund is referred to herein as an Independent Trustee. Each Independent Trustee shall retire not later than the last day of the calendar year in which his or her 75th birthday occurs. The Independent Trustees may waive this mandatory retirement age policy with respect to individual Trustees. Officers and Advisory Board Members hold office without limit in time, except that any officer or Advisory Board Member may resign or may be removed by a vote of a majority of the Trustees at any regular meeting or any special meeting of the Trustees. Except as indicated, each individual has held the office shown or other offices in the same company for the past five years.
The fund’s Statement of Additional Information (SAI) includes more information about the Trustees. To request a free copy, call Fidelity at 1-877-208-0098.
Experience, Skills, Attributes, and Qualifications of the Trustees. The Governance and Nominating Committee has adopted a statement of policy that describes the experience, qualifications, attributes, and skills that are necessary and desirable for potential Independent Trustee candidates (Statement of Policy). The Board believes that each Trustee satisfied at the time he or she was initially elected or appointed a Trustee, and continues to satisfy, the standards contemplated by the Statement of Policy. The Governance and Nominating Committee also engages professional search firms to help identify potential Independent Trustee candidates who have the experience, qualifications, attributes, and skills consistent with the Statement of Policy. From time to time, additional criteria based on the composition and skills of the current Independent Trustees, as well as experience or skills that may be appropriate in light of future changes to board composition, business conditions, and regulatory or other developments, have also been considered by the professional search firms and the Governance and Nominating Committee. In addition, the Board takes into account the Trustees' commitment and participation in Board and committee meetings, as well as their leadership of standing and ad hoc committees throughout their tenure.
In determining that a particular Trustee was and continues to be qualified to serve as a Trustee, the Board has considered a variety of criteria, none of which, in isolation, was controlling. The Board believes that, collectively, the Trustees have balanced and diverse experience, qualifications, attributes, and skills, which allow the Board to operate effectively in governing the fund and protecting the interests of shareholders. Information about the specific experience, skills, attributes, and qualifications of each Trustee, which in each case led to the Board's conclusion that the Trustee should serve (or continue to serve) as a trustee of the fund, is provided below.
Board Structure and Oversight Function. Brian B. Hogan is an interested person and currently serves as Chairman. The Trustees have determined that an interested Chairman is appropriate and benefits shareholders because an interested Chairman has a personal and professional stake in the quality and continuity of services provided to the fund. Independent Trustees exercise their informed business judgment to appoint an individual of their choosing to serve as Chairman, regardless of whether the Trustee happens to be independent or a member of management. The Independent Trustees have determined that they can act independently and effectively without having an Independent Trustee serve as Chairman and that a key structural component for assuring that they are in a position to do so is for the Independent Trustees to constitute a substantial majority for the Board. The Independent Trustees also regularly meet in executive session. Michael E. Wiley serves as Chairman of the Independent Trustees and as such (i) acts as a liaison between the Independent Trustees and management with respect to matters important to the Independent Trustees and (ii) with management prepares agendas for Board meetings.
Fidelity® funds are overseen by different Boards of Trustees. The fund's Board oversees Fidelity's sector portfolios. Other Boards oversee Fidelity's equity and high income funds, and Fidelity's investment grade bond, money market, and asset allocation funds. The use of separate Boards, each with its own committee structure, allows the Trustees of each group of Fidelity® funds to focus on the unique issues of the funds they oversee, including common research, investment, and operational issues. On occasion, the separate Boards establish joint committees to address issues of overlapping consequences for the Fidelity® funds overseen by each Board.
The Trustees operate using a system of committees to facilitate the timely and efficient consideration of all matters of importance to the Trustees, the fund, and fund shareholders and to facilitate compliance with legal and regulatory requirements and oversight of the fund's activities and associated risks. The Board, acting through its committees, has charged SelectCo and its affiliates with (i) identifying events or circumstances the occurrence of which could have demonstrably adverse effects on the fund's business and/or reputation; (ii) implementing processes and controls to lessen the possibility that such events or circumstances occur or to mitigate the effects of such events or circumstances if they do occur; and (iii) creating and maintaining a system designed to evaluate continuously business and market conditions in order to facilitate the identification and implementation processes described in (i) and (ii) above. Because the day-to-day operations and activities of the fund are carried out by or through SelectCo, its affiliates, and other service providers, the fund's exposure to risks is mitigated but not eliminated by the processes overseen by the Trustees. While each of the Board's committees has responsibility for overseeing different aspects of the fund's activities, oversight is exercised primarily through the Operations and Audit Committees. Appropriate personnel, including but not limited to the fund's Chief Compliance Officer (CCO), SelectCo's internal auditor, the independent accountants, the fund's Treasurer and portfolio management personnel, make periodic reports to the Board's committees, as appropriate. The responsibilities of each standing committee, including their oversight responsibilities, are described further under "Standing Committees of the Trustees."
Interested Trustees*:
Correspondence intended for a Trustee who is an interested person may be sent to Fidelity Investments, 245 Summer Street, Boston, Massachusetts 02210.
Name, Year of Birth; Principal Occupations and Other Relevant Experience+
Brian B. Hogan (1964)
Year of Election or Appointment: 2014
Trustee
Chairman of the Board of Trustees
Mr. Hogan also serves as Trustee or Vice President of other funds. Mr. Hogan serves as a Director of FMR Investment Management (UK) Limited (investment adviser firm, 2015-present) and Fidelity SelectCo, LLC (investment adviser firm, 2014-present) and President of the Equity Division of FMR (investment adviser firm, 2009-present). Previously, Mr. Hogan served as Senior Vice President, Equity Research of FMR (2006-2009) and as a portfolio manager. Mr. Brian B. Hogan is not related to Mr. Colm A. Hogan.
* Determined to be an "Interested Trustee" by virtue of, among other things, his or her affiliation with the trust or various entities under common control with SelectCo.
+ The information includes the Trustee's principal occupation during the last five years and other information relating to the experience, attributes, and skills relevant to the Trustee's qualifications to serve as a Trustee, which led to the conclusion that the Trustee should serve as a Trustee for the fund.
Independent Trustees:
Correspondence intended for an Independent Trustee may be sent to Fidelity Investments, P.O. Box 55235, Boston, Massachusetts 02205-5235.
Name, Year of Birth; Principal Occupations and Other Relevant Experience+
David A. Rosow (1942)
Year of Election or Appointment: 2013
Trustee
Mr. Rosow also serves as Trustee of other Fidelity® funds. Prior to his retirement in 2006, Mr. Rosow was the Chief Executive Officer, owner and operator of a number of private companies, which encompassed the oil refining, drilling and marketing of petroleum products (including specialty petroleum products), recreation industry, and real estate development. Mr. Rosow currently serves as a Director of Oxbow Carbon LLC (upgraders, marketers, and distributors of petroleum byproducts of the oil refining process, 2015-present) and Oxbridge Academy of the Palm Beaches (2015-present) and serves as its President and CEO. Previously, Mr. Rosow served on the Fairfield Country Day School Board for 27 years, including as its President for 3 years, stepping down in 2006. Mr. Rosow served as Lead Director and Chairman of the Audit Committee of Hudson United Bancorp (1996-2006), Chairman of the Board of Westport Bank and Trust (1992-1996), and as a Director of TD Banknorth (2006-2007). In addition, Mr. Rosow served as a member (2008-2014) and President (2009-2014) of the Town Council of Palm Beach, Florida. Mr. Rosow also served as a Member of the Advisory Board of certain Fidelity® funds (2012-2013).
Garnett A. Smith (1947)
Year of Election or Appointment: 2013
Trustee
Mr. Smith also serves as Trustee of other Fidelity® funds. Prior to Mr. Smith's retirement, he served as Chairman and Chief Executive Officer of Inbrand Corp. (manufacturer of personal absorbent products, 1990-1997). He also served as President (1986-1990) of Inbrand Corp. Prior to his employment with Inbrand Corp., he was employed by a retail fabric chain and North Carolina National Bank. In addition, Mr. Smith served as a Member of the Advisory Board of certain Fidelity® funds (2012-2013) and as a board member of the Jackson Hole Land Trust (2009-2012).
Michael E. Wiley (1950)
Year of Election or Appointment: 2008
Trustee
Chairman of the Independent Trustees
Mr. Wiley also serves as Trustee of other Fidelity® funds. Mr. Wiley serves as a Director of Tesoro Corporation (independent oil refiner and marketer, 2005-present), a Director of Tesoro Logistics LP (natural resources logistics, 2015-present), and a Director of Bill Barrett Corporation (exploration and production, 2005-present). In addition, Mr. Wiley also serves as a Director of Post Oak Bank (privately-held bank, 2004-present). Previously, Mr. Wiley served as a Trustee of other Fidelity® funds (2008-2013), as a Director of Asia Pacific Exploration Consolidated (international oil and gas exploration and production, 2008-2013), as a member of the Board of Trustees of the University of Tulsa (2000-2006; 2007-2010), as a Senior Energy Advisor of Katzenbach Partners, LLC (consulting, 2006-2007), as an Advisory Director of Riverstone Holdings (private investment), Chairman, President, and CEO of Baker Hughes, Inc. (oilfield services, 2000-2004), and as Director of Spinnaker Exploration Company (exploration and production, 2001-2005).
+ The information includes the Trustee's principal occupation during the last five years and other information relating to the experience, attributes, and skills relevant to the Trustee's qualifications to serve as a Trustee, which led to the conclusion that the Trustee should serve as a Trustee for the fund.
Advisory Board Members and Officers:
Correspondence intended for a Member of the Advisory Board may be sent to Fidelity Investments, P.O. Box 55235, Boston, Massachusetts 02205-5235. Except for Anthony R. Rochte, correspondence intended for an officer may be sent to Fidelity Investments, 245 Summer Street, Boston, Massachusetts 02210. Correspondence intended for Mr. Rochte may be sent to SelectCo, 1225 17th Street, Denver, Colorado 80202-5541. Officers appear below in alphabetical order.
Name, Year of Birth; Principal Occupation
Donald F. Donahue (1950)
Year of Election or Appointment: 2015
Member of the Advisory Board
Mr. Donahue also serves as a Trustee or Member of the Advisory Board of other Fidelity® funds. Mr. Donahue is President and Chief Executive Officer of Miranda Partners, LLC (risk consulting for the financial services industry, 2012-present) and a consultant for the Institute for Defense Analyses (national security, 2012-present). Previously, Mr. Donahue served as Chief Executive Officer (2006-2012), Chief Operating Officer (2003-2006), and Managing Director, Customer Marketing and Development (1999-2003) of The Depository Trust & Clearing Corporation (financial markets infrastructure). Mr. Donahue serves as a Member (2012-present) and Co-Chairman (2016-present) of the Board of Directors of United Way of New York, Member of the Board of Directors of NYC Leadership Academy (2012-present) and Member of the Board of Advisors of Ripple Labs, Inc. (financial services, 2015-present). He also served as Chairman (2010-2012) and Member of the Board of Directors (2012-2013) of Omgeo, LLC (financial services), Treasurer of United Way of New York (2012-2016), and Member of the Board of Directors of XBRL US (financial services non-profit, 2009-2012) and the International Securities Services Association (2009-2012).
Carol B. Tomé (1957)
Year of Election or Appointment: 2017
Member of the Advisory Board
Ms. Tomé also serves as Trustee or Member of the Advisory Board of other Fidelity® funds. Ms. Tomé is Chief Financial Officer (2001-present) and Executive Vice President of Corporate Services (2007-present) of The Home Depot, Inc. (home improvement retailer) and a Director (2003-present) and Chair of the Audit Committee (2004-present) of United Parcel Service, Inc. (package delivery and supply chain management). Previously, Ms. Tomé served as Senior Vice President of Finance and Accounting/Treasurer (2000-2007) and Vice President and Treasurer (1995-2000) of The Home Depot, Inc. and Chair of the Board (2010-2012), Vice Chair of the Board (2009 and 2013), and a Director (2008-2013) of the Federal Reserve Bank of Atlanta. Ms. Tomé is also a director or trustee of many community and professional organizations.
Marc R. Bryant (1966)
Year of Election or Appointment: 2013
Secretary and Chief Legal Officer (CLO)
Mr. Bryant also serves as Secretary and CLO of other funds. Mr. Bryant serves as CLO, Secretary, and Senior Vice President of Fidelity Management & Research Company (investment adviser firm, 2015-present) and FMR Co., Inc. (investment adviser firm, 2015-present); Secretary of Fidelity SelectCo, LLC (investment adviser firm, 2015-present) and Fidelity Investments Money Management, Inc. (investment adviser firm, 2015-present); and CLO of Fidelity Management & Research (Hong Kong) Limited and FMR Investment Management (UK) Limited (investment adviser firms, 2015-present) and Fidelity Management & Research (Japan) Limited (investment adviser firm, 2016-present). He is Senior Vice President and Deputy General Counsel of FMR LLC (diversified financial services company). Previously, Mr. Bryant served as Secretary and CLO of Fidelity Rutland Square Trust II (2010-2014) and Assistant Secretary of Fidelity's Fixed Income and Asset Allocation Funds (2013-2015). Prior to joining Fidelity Investments, Mr. Bryant served as a Senior Vice President and the Head of Global Retail Legal for AllianceBernstein L.P. (2006-2010), and as the General Counsel for ProFund Advisors LLC (2001-2006).
Jeffrey S. Christian (1961)
Year of Election or Appointment: 2016
Assistant Treasurer
Mr. Christian also serves as Assistant Treasurer of other funds. Mr. Christian is an employee of Fidelity Investments (2003-present).
William C. Coffey (1969)
Year of Election or Appointment: 2009
Assistant Secretary
Mr. Coffey also serves as Assistant Secretary of other funds. He is Senior Vice President and Deputy General Counsel of FMR LLC (diversified financial services company, 2010-present), and is an employee of Fidelity Investments. Previously, Mr. Coffey served as Vice President and Associate General Counsel of FMR LLC (2005-2009).
Jonathan Davis (1968)
Year of Election or Appointment: 2010
Assistant Treasurer
Mr. Davis also serves as Assistant Treasurer of other funds, and is an employee of Fidelity Investments. Previously, Mr. Davis served as Vice President and Associate General Counsel of FMR LLC (diversified financial services company, 2003-2010).
Adrien E. Deberghes (1967)
Year of Election or Appointment: 2013
President and Treasurer
Mr. Deberghes also serves as an officer of other funds. He serves as Executive Vice President of Fidelity Investments Money Management, Inc. (FIMM) (investment adviser firm, 2016-present) and is an employee of Fidelity Investments (2008-present). Prior to joining Fidelity Investments, Mr. Deberghes was Senior Vice President of Mutual Fund Administration at State Street Corporation (2007-2008), Senior Director of Mutual Fund Administration at Investors Bank & Trust (2005-2007), and Director of Finance for Dunkin' Brands (2000-2005). Previously, Mr. Deberghes served in other fund officer roles.
Joseph DeSantis (1959)
Year of Election or Appointment: 2015
Vice President
Mr. DeSantis also serves as Vice President of other funds. Mr. DeSantis serves as a Director of Fidelity Management & Research (Japan) Limited (investment adviser firm, 2016-present), Chief Investment Officer, Equities (2010-present) and is an employee of Fidelity Investments.
Stephanie J. Dorsey (1969)
Year of Election or Appointment: 2010
Assistant Treasurer
Ms. Dorsey also serves as an officer of other funds. She is an employee of Fidelity Investments (2008-present) and has served in other fund officer roles. Prior to joining Fidelity Investments, Ms. Dorsey served as Treasurer (2004-2008) of the JPMorgan Mutual Funds and Vice President (2004-2008) of JPMorgan Chase Bank.
Howard J. Galligan III (1966)
Year of Election or Appointment: 2014
Chief Financial Officer
Mr. Galligan also serves as Chief Financial Officer of other funds. Mr. Galligan serves as President of Fidelity Pricing and Cash Management Services (FPCMS) (2014-present) and as a Director of Strategic Advisers, Inc. (investment adviser firm, 2008-present). Previously, Mr. Galligan served as Chief Administrative Officer of Asset Management (2011-2014) and Chief Operating Officer and Senior Vice President of Investment Support for Strategic Advisers, Inc. (2003-2011).
Scott C. Goebel (1968)
Year of Election or Appointment: 2015
Vice President
Mr. Goebel serves as Vice President of other funds and is an employee of Fidelity Investments (2001-present). Previously, Mr. Goebel served as Senior Vice President of Fidelity Management & Research Company (FMR) (investment adviser firm, 2016), Secretary of Fidelity SelectCo, LLC (investment adviser firm, 2013-2015), Fidelity Investments Money Management, Inc. (FIMM) (investment adviser firm, 2010-2015), and Fidelity Research and Analysis Company (FRAC) (investment adviser firm, 2010-2015); General Counsel, Secretary, and Senior Vice President of FMR (investment adviser firm, 2008-2015) and FMR Co., Inc. (investment adviser firm, 2008-2015); Assistant Secretary of Fidelity Management & Research (Japan) Limited (investment adviser firm, 2008-2015) and Fidelity Management & Research (U.K.) Inc. (investment adviser firm, 2008-2015); Chief Legal Officer (CLO) of Fidelity Management & Research (Hong Kong) Limited (investment adviser firm, 2008-2015); Secretary and CLO of certain Fidelity® funds (2008-2015); Assistant Secretary of FIMM (2008-2010), FRAC (2008-2010), and certain funds (2007-2008); and as Vice President and Secretary of Fidelity Distributors Corporation (FDC) (2005-2007).
James D. Gryglewicz (1972)
Year of Election or Appointment: 2014
Chief Compliance Officer
Mr. Gryglewicz also serves as Chief Compliance Officer of other funds. Mr. Gryglewicz serves as Compliance Officer of Strategic Advisers, Inc. (investment adviser firm, 2015-present) and Fidelity SelectCo, LLC (investment adviser firm, 2014-present), Senior Vice President of Asset Management Compliance (2009-present), and is an employee of Fidelity Investments (2004-present).
Brian B. Hogan (1964)
Year of Election or Appointment: 2009
Vice President
Mr. Hogan also serves as Trustee or Vice President of other funds. Mr. Hogan serves as a Director of FMR Investment Management (UK) Limited (investment adviser firm, 2015-present) and Fidelity SelectCo, LLC (investment adviser firm, 2014-present) and President of the Equity Division of FMR (investment adviser firm, 2009-present). Previously, Mr. Hogan served as Senior Vice President, Equity Research of FMR (2006-2009) and as a portfolio manager. Mr. Brian B. Hogan is not related to Mr. Colm A. Hogan.
Colm A. Hogan (1973)
Year of Election or Appointment: 2016
Assistant Treasurer
Mr. Hogan also serves as an officer of other funds. Mr. Hogan is an employee of Fidelity Investments (2005-present). Mr. Colm A. Hogan is not related to Mr. Brian B. Hogan.
Chris Maher (1972)
Year of Election or Appointment: 2013
Assistant Treasurer
Mr. Maher serves as Assistant Treasurer of other funds. Mr. Maher is Vice President of Valuation Oversight and is an employee of Fidelity Investments. Previously, Mr. Maher served as Vice President of Asset Management Compliance (2013), Vice President of the Program Management Group of FMR (investment adviser firm, 2010-2013), and Vice President of Valuation Oversight (2008-2010).
John F. Papandrea (1972)
Year of Election or Appointment: 2016
Anti-Money Laundering (AML) Officer
Mr. Papandrea also serves as AML Officer of other funds. Mr. Papandrea is Vice President of FMR LLC (diversified financial services company, 2008-present) and is an employee of Fidelity Investments (2005-present).
Anthony R. Rochte (1968)
Year of Election or Appointment: 2013
Vice President
Mr. Rochte also serves as Vice President of other funds. Mr. Rochte serves as President of Fidelity SelectCo, LLC (investment adviser firm, 2012-present) and is an employee of Fidelity Investments (2012-present). Prior to joining Fidelity Investments, Mr. Rochte served as Senior Managing Director and head of State Street Global Advisors' North American Intermediary Business Group (2006-2012).
Stacie M. Smith (1974)
Year of Election or Appointment: 2013
Assistant Treasurer
Ms. Smith also serves as an officer of other funds. She is an employee of Fidelity Investments (2009-present) and has served in other fund officer roles. Prior to joining Fidelity Investments, Ms. Smith served as Senior Audit Manager of Ernst & Young LLP (accounting firm, 1996-2009). Previously, Ms. Smith served as Deputy Treasurer of certain Fidelity® funds (2013-2016).
Marc L. Spector (1972)
Year of Election or Appointment: 2017
Assistant Treasurer
Mr. Spector also serves as an officer of other funds. Mr. Spector is an employee of Fidelity Investments (2016-present). Prior to joining Fidelity Investments, Mr. Spector served as Director at the Siegfried Group (accounting firm, 2013-2016), and prior to Siegfried Group as audit senior manager at Deloitte & Touche (accounting firm, 2005-2013).
Renee Stagnone (1975)
Year of Election or Appointment: 2016
Assistant Treasurer
Ms. Stagnone also serves as an officer of other funds. Ms. Stagnone is an employee of Fidelity Investments (1997-present). Previously, Ms. Stagnone served as Deputy Treasurer of certain Fidelity® funds (2013-2016).
Shareholder Expense Example
As a shareholder of the Fund, you incur two types of costs: (1) transaction costs, including redemption fees and (2) ongoing costs, including management fees and other Fund expenses. This Example is intended to help you understand your ongoing costs (in dollars) of investing in the Fund and to compare these costs with the ongoing costs of investing in other mutual funds.
The Example is based on an investment of $1,000 invested at the beginning of the period and held for the entire period (July 1, 2016 to December 31, 2016).
Actual Expenses
The first line of the accompanying table for each class of the Fund provides information about actual account values and actual expenses. You may use the information in this line, together with the amount you invested, to estimate the expenses that you paid over the period. Simply divide your account value by $1,000.00 (for example, an $8,600 account value divided by $1,000.00 = 8.6), then multiply the result by the number in the first line for a class of the Fund under the heading entitled "Expenses Paid During Period" to estimate the expenses you paid on your account during this period. The estimate of expenses does not include any fees or other expenses of any variable annuity or variable life insurance product. If they were, the estimate of expenses you paid during the period would be higher, and your ending account value would be lower. In addition, the Fund, as a shareholder in the underlying Fidelity Central Funds, will indirectly bear its pro-rata share of the fees and expenses incurred by the underlying Fidelity Central Funds. These fees and expenses are not included in the Fund's annualized expense ratio used to calculate the expense estimate in the table below.
Hypothetical Example for Comparison Purposes
The second line of the accompanying table for each class of the Fund provides information about hypothetical account values and hypothetical expenses based on a Class' actual expense ratio and an assumed rate of return of 5% per year before expenses, which is not the Class' actual return. The hypothetical account values and expenses may not be used to estimate the actual ending account balance or expenses you paid for the period. You may use this information to compare the ongoing costs of investing in the Fund and other funds. To do so, compare this 5% hypothetical example with the 5% hypothetical examples that appear in the shareholder reports of the other funds. The estimate of expenses does not include any fees or other expenses of any variable annuity or variable life insurance product. If they were, the estimate of expenses you paid during the period would be higher, and your ending account value would be lower. In addition, the Fund, as a shareholder in the underlying Fidelity Central Funds, will indirectly bear its pro-rata share of the fees and expenses incurred by the underlying Fidelity Central Funds. These fees and expenses are not included in the Fund's annualized expense ratio used to calculate the expense estimate in the table below.
Please note that the expenses shown in the table are meant to highlight your ongoing costs only and do not reflect any transaction costs. Therefore, the second line of the table is useful in comparing ongoing costs only, and will not help you determine the relative total costs of owning different funds. In addition, if these transactional costs were included, your costs would have been higher.
| | Annualized Expense Ratio-A | Beginning
Account Value
July 1, 2016 | Ending
Account Value
December 31, 2016 | Expenses Paid
During Period-B
July 1, 2016
to December 31, 2016 |
| Initial Class | .70% | | | |
| Actual | | $1,000.00 | $1,046.20 | $3.60 |
| Hypothetical-C | | $1,000.00 | $1,021.62 | $3.56 |
| Investor Class | .78% | | | |
| Actual | | $1,000.00 | $1,046.20 | $4.01 |
| Hypothetical-C | | $1,000.00 | $1,021.22 | $3.96 |
A Annualized expense ratio reflects expenses net of applicable fee waivers.
B Expenses are equal to each Class' annualized expense ratio, multiplied by the average account value over the period, multiplied by 184/366 (to reflect the one-half year period).
C 5% return per year before expenses
Distributions (Unaudited)
Initial Class and Investor Class designate 100% of the dividends distributed in December 2016, during the fiscal year as qualifying for the dividends–received deduction for corporate shareholders.

VCONIC-ANN-0217
1.817355.111
Fidelity® Variable Insurance Products: Consumer Staples Portfolio
Annual Report December 31, 2016 |
|
Contents
To view a fund's proxy voting guidelines and proxy voting record for the 12-month period ended June 30, visit http://www.fidelity.com/proxyvotingresults or visit the Securities and Exchange Commission's (SEC) web site at http://www.sec.gov.
You may also call 1-877-208-0098 to request a free copy of the proxy voting guidelines.
Fidelity® Variable Insurance Products are separate account options which are purchased through a variable insurance contract.
Standard & Poor's, S&P and S&P 500 are registered service marks of The McGraw-Hill Companies, Inc. and have been licensed for use by Fidelity Distributors Corporation.
Other third-party marks appearing herein are the property of their respective owners.
All other marks appearing herein are registered or unregistered trademarks or service marks of FMR LLC or an affiliated company. © 2017 FMR LLC. All rights reserved.
This report and the financial statements contained herein are submitted for the general information of the shareholders of the Fund. This report is not authorized for distribution to prospective investors in the Fund unless preceded or accompanied by an effective prospectus.
A fund files its complete schedule of portfolio holdings with the SEC for the first and third quarters of each fiscal year on Form N-Q. Forms N-Q are available on the SEC’s web site at http://www.sec.gov. A fund's Forms N-Q may be reviewed and copied at the SEC’s Public Reference Room in Washington, DC. Information regarding the operation of the SEC's Public Reference Room may be obtained by calling 1-800-SEC-0330.
For a complete list of a fund's portfolio holdings, view the most recent holdings listing, semiannual report, or annual report on Fidelity's web site at http://www.fidelity.com, http://www.institutional.fidelity.com, or http://www.401k.com, as applicable.
NOT FDIC INSURED •MAY LOSE VALUE •NO BANK GUARANTEE
Neither the Fund nor Fidelity Distributors Corporation is a bank.
Performance: The Bottom Line
Average annual total return reflects the change in the value of an investment, assuming reinvestment of distributions from dividend income and capital gains (the profits earned upon the sale of securities that have grown in value, if any) and assuming a constant rate of performance each year. During periods of reimbursement by Fidelity, a fund’s total return will be greater than it would be had the reimbursement not occurred. Performance numbers are net of all underlying fund operating expenses, but do not include any insurance charges imposed by your insurance company’s separate account. If performance information included the effect of these additional charges, the total returns would have been lower. How a fund did yesterday is no guarantee of how it will do tomorrow.
Average Annual Total Returns
| For the periods ended December 31, 2016 | Past 1 year | Past 5 years | Life of fundA |
| Initial Class | 3.72% | 13.04% | 9.66% |
| Investor Class | 3.67% | 12.97% | 9.58% |
A From April 24, 2007
$10,000 Over Life of Fund
Let's say hypothetically that $10,000 was invested in VIP Consumer Staples Portfolio - Initial Class on April 24, 2007, when the fund started.
The chart shows how the value of your investment would have changed, and also shows how the S&P 500® Index performed over the same period.

| Period Ending Values |
| $24,451 | VIP Consumer Staples Portfolio - Initial Class |
| $18,651 | S&P 500® Index |
Management's Discussion of Fund Performance
Market Recap: The S&P 500 index returned 11.96% in 2016, rising sharply on post-election optimism for economic growth. The year began during a fairly volatile stretch, with stocks hampered by persistent oil-price weakness and U.S.-dollar strength. Markets regained momentum in February amid U.S. job gains, a rally in energy and other stimuli that helped keep the roughly seven-year uptrend intact. Markets tumbled briefly following the U.K.’s June 23 vote to exit the European Union – dubbed “Brexit” – then recovered quickly and settled into a flattish stretch until the November 8 U.S. presidential election. Stocks reacted to the outcome by reaching a series of all-time highs. For the year, energy (+27%) led the way amid two strong rallies in commodity prices, one in the spring and another in November. Telecommunication services (+23%) was close behind, as demand for dividend-paying equities was high early in the period. Cyclical sectors, including financials (+22%), industrials (+18%) and materials (+17%), also posted strong gains. Conversely, consumer staples (+5%) and consumer discretionary (+6%) lagged the index, the latter hurt as online competition continued to pressure brick-and-mortar retailers. Real estate (+3%) struggled due to expectations for rising interest rates, while health care (-2%) was hampered by an uncertain political and regulatory outlook.
Comments from Portfolio Manager James McElligott: For the year, the fund’s share classes returned about 4%, lagging the MSCI U.S. IMI Consumer Staples 25/50 Index, which gained 6.39%, and the broad-based S&P 500. A post-election investor rotation out of more defensive, expensive stocks into more economically sensitive, U.S.-based securities pressured the sector. Segment allocations, driven by bottom-up security selection, detracted from the fund’s relative performance versus the MSCI index, with added pressure from currency headwinds. Individual disappointments included beauty products company Coty, which saw its stock decline due to concern about the integration of a recent acquisition and a disappointing earnings report. Elsewhere, pricing missteps in the U.S. and the Philippines pressured the return of infant-formula company Mead Johnson Nutrition. An underweighting in U.S.-focused tobacco company Altria also hurt, as the stock rallied. By contrast, picks in the personal products and household products categories aided relative performance. Top contributors included beauty products company Avon Products and skin care company NuSkin Enterprises, direct sellers with substantial overseas exposure. Avon benefited from the involvement of a private investment firm, while Nu Skin gained from better execution after stumbling with a new product launch in China.
The views expressed above reflect those of the portfolio manager(s) only through the end of the period as stated on the cover of this report and do not necessarily represent the views of Fidelity or any other person in the Fidelity organization. Any such views are subject to change at any time based upon market or other conditions and Fidelity disclaims any responsibility to update such views. These views may not be relied on as investment advice and, because investment decisions for a Fidelity fund are based on numerous factors, may not be relied on as an indication of trading intent on behalf of any Fidelity fund.
Investment Summary (Unaudited)
Top Ten Stocks as of December 31, 2016
| | % of fund's net assets | % of fund's net assets 6 months ago |
| Procter & Gamble Co. | 10.2 | 10.8 |
| The Coca-Cola Co. | 9.0 | 10.4 |
| Philip Morris International, Inc. | 7.6 | 7.5 |
| Mead Johnson Nutrition Co. Class A | 5.9 | 3.8 |
| CVS Health Corp. | 4.2 | 4.9 |
| Monster Beverage Corp. | 4.1 | 4.0 |
| Coty, Inc. Class A | 3.7 | 2.1 |
| Walgreens Boots Alliance, Inc. | 3.6 | 3.8 |
| Altria Group, Inc. | 3.4 | 2.9 |
| Mondelez International, Inc. | 3.4 | 2.9 |
| | 55.1 | |
Top Industries (% of fund's net assets)
| As of December 31, 2016 |
| | Beverages | 24.9% |
| | Food Products | 18.9% |
| | Tobacco | 16.1% |
| | Household Products | 15.8% |
| | Food & Staples Retailing | 13.6% |
| | All Others* | 10.7% |

* Includes short-term investments and net other assets (liabilities).
| As of June 30, 2016 |
| | Beverages | 24.4% |
| | Food Products | 16.6% |
| | Household Products | 16.5% |
| | Tobacco | 15.7% |
| | Food & Staples Retailing | 14.6% |
| | All Others* | 12.2% |

Prior period industry classifications reflect the categories in place as of the date indicated and have not been adjusted to reflect current industry classifications.
* Includes short-term investments and net other assets (liabilities).
Investments December 31, 2016
Showing Percentage of Net Assets
| Common Stocks - 99.5% | | | |
| | | Shares | Value |
| Beverages - 24.9% | | | |
| Brewers - 1.3% | | | |
| Anheuser-Busch InBev SA NV | | 8,036 | $850,562 |
| China Resources Beer Holdings Co. Ltd. (a) | | 18,666 | 36,981 |
| Molson Coors Brewing Co. Class B | | 33,600 | 3,269,616 |
| | | | 4,157,159 |
| Distillers & Vintners - 1.6% | | | |
| Constellation Brands, Inc. Class A (sub. vtg.) | | 29,800 | 4,568,638 |
| Kweichow Moutai Co. Ltd. (A Shares) | | 9,950 | 478,732 |
| | | | 5,047,370 |
| Soft Drinks - 22.0% | | | |
| Britvic PLC | | 95,900 | 670,121 |
| Coca-Cola Bottling Co. Consolidated | | 42,730 | 7,642,261 |
| Coca-Cola Central Japan Co. Ltd. | | 114,200 | 2,517,041 |
| Coca-Cola European Partners PLC | | 151,300 | 4,750,820 |
| Coca-Cola HBC AG | | 62,000 | 1,352,436 |
| Fever-Tree Drinks PLC | | 79,944 | 1,122,177 |
| Fomento Economico Mexicano S.A.B. de CV sponsored ADR | | 3,285 | 250,350 |
| Monster Beverage Corp. (a) | | 290,200 | 12,867,468 |
| PepsiCo, Inc. | | 95,306 | 9,971,867 |
| The Coca-Cola Co. | | 692,338 | 28,704,333 |
| | | | 69,848,874 |
|
| TOTAL BEVERAGES | | | 79,053,403 |
|
| Biotechnology - 0.2% | | | |
| Biotechnology - 0.2% | | | |
| Enzymotec Ltd. (a) | | 84,900 | 556,095 |
| Capital Markets - 0.5% | | | |
| Diversified Capital Markets - 0.5% | | | |
| Beijing Yanjing Brewery ELS (UBS Warrant Programme) warrants 10/6/17 (a)(b) | | 1,724,279 | 1,725,520 |
| Chemicals - 0.5% | | | |
| Fertilizers & Agricultural Chemicals - 0.5% | | | |
| Syngenta AG (Switzerland) | | 4,095 | 1,617,947 |
| Food & Staples Retailing - 13.6% | | | |
| Drug Retail - 7.8% | | | |
| CVS Health Corp. | | 170,439 | 13,449,341 |
| Walgreens Boots Alliance, Inc. | | 137,500 | 11,379,500 |
| | | | 24,828,841 |
| Food Distributors - 0.8% | | | |
| Sysco Corp. | | 26,600 | 1,472,842 |
| United Natural Foods, Inc. (a) | | 19,000 | 906,680 |
| | | | 2,379,522 |
| Food Retail - 1.0% | | | |
| Kroger Co. | | 91,752 | 3,166,362 |
| Sprouts Farmers Market LLC (a) | | 1,700 | 32,164 |
| Whole Foods Market, Inc. | | 3,600 | 110,736 |
| | | | 3,309,262 |
| Hypermarkets & Super Centers - 4.0% | | | |
| Costco Wholesale Corp. | | 62,200 | 9,958,842 |
| Wal-Mart Stores, Inc. | | 39,804 | 2,751,252 |
| | | | 12,710,094 |
|
| TOTAL FOOD & STAPLES RETAILING | | | 43,227,719 |
|
| Food Products - 18.9% | | | |
| Agricultural Products - 0.3% | | | |
| Ingredion, Inc. | | 7,200 | 899,712 |
| Packaged Foods & Meats - 18.6% | | | |
| Amplify Snack Brands, Inc. (a) | | 108,400 | 955,004 |
| ConAgra Foods, Inc. | | 14,200 | 561,610 |
| Danone SA | | 14,450 | 914,375 |
| Greencore Group PLC | | 141,815 | 430,815 |
| Hostess Brands, Inc. Class A (a) | | 164,400 | 2,137,200 |
| JBS SA | | 582,300 | 2,008,986 |
| Kellogg Co. | | 1,800 | 132,678 |
| Mead Johnson Nutrition Co. Class A | | 262,800 | 18,595,728 |
| Mondelez International, Inc. | | 243,600 | 10,798,788 |
| Post Holdings, Inc. (a) | | 31,700 | 2,548,363 |
| The Hain Celestial Group, Inc. (a) | | 134,680 | 5,256,560 |
| The Hershey Co. | | 12,700 | 1,313,561 |
| The J.M. Smucker Co. | | 18,400 | 2,356,304 |
| The Kraft Heinz Co. | | 57,800 | 5,047,096 |
| TreeHouse Foods, Inc. (a) | | 81,600 | 5,890,704 |
| | | | 58,947,772 |
|
| TOTAL FOOD PRODUCTS | | | 59,847,484 |
|
| Health Care Providers & Services - 0.1% | | | |
| Health Care Services - 0.1% | | | |
| Diplomat Pharmacy, Inc. (a)(c) | | 19,300 | 243,180 |
| Hotels, Restaurants & Leisure - 0.2% | | | |
| Restaurants - 0.2% | | | |
| U.S. Foods Holding Corp. | | 21,400 | 588,072 |
| Household Durables - 0.7% | | | |
| Housewares & Specialties - 0.7% | | | |
| Newell Brands, Inc. | | 49,972 | 2,231,250 |
| Household Products - 15.8% | | | |
| Household Products - 15.8% | | | |
| Colgate-Palmolive Co. | | 70,290 | 4,599,778 |
| Procter & Gamble Co. | | 386,307 | 32,480,692 |
| Spectrum Brands Holdings, Inc. | | 73,400 | 8,979,022 |
| Svenska Cellulosa AB (SCA) (B Shares) | | 143,900 | 4,063,999 |
| | | | 50,123,491 |
| Personal Products - 7.9% | | | |
| Personal Products - 7.9% | | | |
| Avon Products, Inc. | | 905,400 | 4,563,216 |
| Coty, Inc. Class A | | 639,248 | 11,704,631 |
| Estee Lauder Companies, Inc. Class A | | 37,100 | 2,837,779 |
| Herbalife Ltd. (a) | | 71,900 | 3,461,266 |
| Nu Skin Enterprises, Inc. Class A | | 31,688 | 1,514,053 |
| Ontex Group NV | | 16,600 | 493,640 |
| Unilever NV (Certificaten Van Aandelen) (Bearer) (c) | | 15,830 | 650,278 |
| | | | 25,224,863 |
| Specialty Retail - 0.1% | | | |
| Specialty Stores - 0.1% | | | |
| GNC Holdings, Inc. | | 27,561 | 304,273 |
| Tobacco - 16.1% | | | |
| Tobacco - 16.1% | | | |
| Altria Group, Inc. | | 160,196 | 10,832,454 |
| British American Tobacco PLC sponsored ADR (c) | | 49,159 | 5,538,745 |
| Imperial Tobacco Group PLC | | 19,368 | 845,564 |
| Japan Tobacco, Inc. | | 23,000 | 756,466 |
| Philip Morris International, Inc. | | 262,734 | 24,037,534 |
| Reynolds American, Inc. | | 159,000 | 8,910,360 |
| | | | 50,921,123 |
| TOTAL COMMON STOCKS | | | |
| (Cost $278,104,341) | | | 315,664,420 |
|
| Convertible Preferred Stocks - 0.4% | | | |
| Internet & Direct Marketing Retail - 0.4% | | | |
| Internet & Direct Marketing Retail - 0.4% | | | |
| The Honest Co., Inc. Series D (a)(d) | | | |
| (Cost $1,499,986) | | 32,783 | 1,192,478 |
|
| Money Market Funds - 1.9% | | | |
| Fidelity Cash Central Fund, 0.60% (e) | | 111,643 | 111,666 |
| Fidelity Securities Lending Cash Central Fund 0.65% (e)(f) | | 5,891,060 | 5,891,649 |
| TOTAL MONEY MARKET FUNDS | | | |
| (Cost $6,003,274) | | | 6,003,315 |
| TOTAL INVESTMENT PORTFOLIO - 101.8% | | | |
| (Cost $285,607,601) | | | 322,860,213 |
| NET OTHER ASSETS (LIABILITIES) - (1.8)% | | | (5,676,193) |
| NET ASSETS - 100% | | | $317,184,020 |
Legend
(a) Non-income producing
(b) Security exempt from registration under Rule 144A of the Securities Act of 1933. These securities may be resold in transactions exempt from registration, normally to qualified institutional buyers. At the end of the period, the value of these securities amounted to $1,725,520 or 0.5% of net assets.
(c) Security or a portion of the security is on loan at period end.
(d) Restricted securities - Investment in securities not registered under the Securities Act of 1933 (excluding 144A issues). At the end of the period, the value of restricted securities (excluding 144A issues) amounted to $1,192,478 or 0.4% of net assets.
(e) Affiliated fund that is generally available only to investment companies and other accounts managed by Fidelity Investments. The rate quoted is the annualized seven-day yield of the fund at period end. A complete unaudited listing of the fund's holdings as of its most recent quarter end is available upon request. In addition, each Fidelity Central Fund's financial statements, which are not covered by the Fund's Report of Independent Registered Public Accounting Firm, are available on the SEC's website or upon request.
(f) Investment made with cash collateral received from securities on loan.
Additional information on each restricted holding is as follows:
| Security | Acquisition Date | Acquisition Cost |
| The Honest Co., Inc. Series D | 8/3/15 | $1,499,986 |
Affiliated Central Funds
Information regarding fiscal year to date income earned by the Fund from investments in Fidelity Central Funds is as follows:
| Fund | Income earned |
| Fidelity Cash Central Fund | $10,827 |
| Fidelity Securities Lending Cash Central Fund | 367,941 |
| Total | $378,768 |
Investment Valuation
The following is a summary of the inputs used, as of December 31, 2016, involving the Fund's assets and liabilities carried at fair value. The inputs or methodology used for valuing securities may not be an indication of the risk associated with investing in those securities. For more information on valuation inputs, and their aggregation into the levels used below, please refer to the Investment Valuation section in the accompanying Notes to Financial Statements.
| | Valuation Inputs at Reporting Date: |
| Description | Total | Level 1 | Level 2 | Level 3 |
| Investments in Securities: | | | | |
| Common Stocks | $315,664,420 | $308,710,333 | $6,954,087 | $-- |
| Convertible Preferred Stocks | 1,192,478 | -- | -- | 1,192,478 |
| Money Market Funds | 6,003,315 | 6,003,315 | -- | -- |
| Total Investments in Securities: | $322,860,213 | $314,713,648 | $6,954,087 | $1,192,478 |
The following is a summary of transfers between Level 1 and Level 2 for the period ended December 31, 2016. Transfers are assumed to have occurred at the beginning of the period, and are primarily attributable to the valuation techniques used for foreign equity securities, as discussed in the accompanying Notes to Financial Statements:
| Transfers | Total |
| Level 1 to Level 2 | $1,605,156 |
| Level 2 to Level 1 | $7,487,372 |
Other Information
Distribution of investments by country or territory of incorporation, as a percentage of Total Net Assets, is as follows (Unaudited):
| United States of America | 88.9% |
| United Kingdom | 4.7% |
| Sweden | 1.3% |
| Cayman Islands | 1.1% |
| Japan | 1.0% |
| Others (Individually Less Than 1%) | 3.0% |
| | 100.0% |
See accompanying notes which are an integral part of the financial statements.
Financial Statements
Statement of Assets and Liabilities
| | | December 31, 2016 |
| Assets | | |
Investment in securities, at value (including securities loaned of $5,775,834) — See accompanying schedule:
Unaffiliated issuers (cost $279,604,327) | $316,856,898 | |
| Fidelity Central Funds (cost $6,003,274) | 6,003,315 | |
| Total Investments (cost $285,607,601) | | $322,860,213 |
| Foreign currency held at value (cost $12,941) | | 12,941 |
| Receivable for investments sold | | 1,223,715 |
| Dividends receivable | | 797,850 |
| Distributions receivable from Fidelity Central Funds | | 3,931 |
| Prepaid expenses | | 1,927 |
| Other receivables | | 5,533 |
| Total assets | | 324,906,110 |
| Liabilities | | |
| Payable for investments purchased | $968,121 | |
| Payable for fund shares redeemed | 626,910 | |
| Accrued management fee | 146,799 | |
| Other affiliated payables | 47,416 | |
| Other payables and accrued expenses | 42,813 | |
| Collateral on Securities Loaned | 5,890,031 | |
| Total liabilities | | 7,722,090 |
| Net Assets | | $317,184,020 |
| Net Assets consist of: | | |
| Paid in capital | | $280,974,249 |
| Accumulated undistributed net realized gain (loss) on investments and foreign currency transactions | | (1,041,304) |
| Net unrealized appreciation (depreciation) on investments and assets and liabilities in foreign currencies | | 37,251,075 |
| Net Assets | | $317,184,020 |
| Initial Class: | | |
| Net Asset Value, offering price and redemption price per share ($38,192,327 ÷ 2,184,617 shares) | | $17.48 |
| Investor Class: | | |
| Net Asset Value, offering price and redemption price per share ($278,991,693 ÷ 16,018,004 shares) | | $17.42 |
See accompanying notes which are an integral part of the financial statements.
Statement of Operations
| | | Year ended December 31, 2016 |
| Investment Income | | |
| Dividends | | $7,773,699 |
| Income from Fidelity Central Funds | | 378,768 |
| Total income | | 8,152,467 |
| Expenses | | |
| Management fee | $1,806,202 | |
| Transfer agent fees | 449,646 | |
| Accounting and security lending fees | 130,046 | |
| Custodian fees and expenses | 21,728 | |
| Independent trustees' fees and expenses | 6,856 | |
| Audit | 51,674 | |
| Legal | 5,497 | |
| Interest | 1,332 | |
| Miscellaneous | 3,376 | |
| Total expenses before reductions | 2,476,357 | |
| Expense reductions | (17,974) | 2,458,383 |
| Net investment income (loss) | | 5,694,084 |
| Realized and Unrealized Gain (Loss) | | |
| Net realized gain (loss) on: | | |
| Investment securities: | | |
| Unaffiliated issuers | 6,794,739 | |
| Fidelity Central Funds | 1,212 | |
| Foreign currency transactions | (13,447) | |
| Total net realized gain (loss) | | 6,782,504 |
Change in net unrealized appreciation (depreciation) on:
Investment securities | (4,726,603) | |
| Assets and liabilities in foreign currencies | (1,087) | |
| Total change in net unrealized appreciation (depreciation) | | (4,727,690) |
| Net gain (loss) | | 2,054,814 |
| Net increase (decrease) in net assets resulting from operations | | $7,748,898 |
See accompanying notes which are an integral part of the financial statements.
Statement of Changes in Net Assets
| | Year ended December 31, 2016 | Year ended December 31, 2015 |
| Increase (Decrease) in Net Assets | | |
| Operations | | |
| Net investment income (loss) | $5,694,084 | $3,176,828 |
| Net realized gain (loss) | 6,782,504 | 10,517,975 |
| Change in net unrealized appreciation (depreciation) | (4,727,690) | 5,432,519 |
| Net increase (decrease) in net assets resulting from operations | 7,748,898 | 19,127,322 |
| Distributions to shareholders from net investment income | (5,680,637) | (3,318,744) |
| Distributions to shareholders from net realized gain | (16,432,186) | (12,937,830) |
| Total distributions | (22,112,823) | (16,256,574) |
| Share transactions - net increase (decrease) | 89,838,556 | 55,231,623 |
| Redemption fees | 57,248 | 15,606 |
| Total increase (decrease) in net assets | 75,531,879 | 58,117,977 |
| Net Assets | | |
| Beginning of period | 241,652,141 | 183,534,164 |
| End of period | $317,184,020 | $241,652,141 |
See accompanying notes which are an integral part of the financial statements.
Financial Highlights — VIP Consumer Staples Portfolio Initial Class
| Years ended December 31, | 2016 | 2015 | 2014 | 2013 | 2012 |
| Selected Per–Share Data | | | | | |
| Net asset value, beginning of period | $18.25 | $18.08 | $16.44 | $14.03 | $12.42 |
| Income from Investment Operations | | | | | |
| Net investment income (loss)A | .33 | .28 | .28 | .31 | .27 |
| Net realized and unrealized gain (loss) | .30 | 1.34 | 2.21 | 2.73 | 1.64 |
| Total from investment operations | .63 | 1.62 | 2.49 | 3.04 | 1.91 |
| Distributions from net investment income | (.33)B | (.27) | (.24) | (.31) | (.22) |
| Distributions from net realized gain | (1.07)B | (1.18) | (.61) | (.32) | (.09) |
| Total distributions | (1.40) | (1.45) | (.85) | (.63) | (.31) |
| Redemption fees added to paid in capitalA | –C | –C | –C | –C | .01 |
| Net asset value, end of period | $17.48 | $18.25 | $18.08 | $16.44 | $14.03 |
| Total ReturnD,E | 3.72% | 9.46% | 15.66% | 21.80% | 15.40% |
| Ratios to Average Net AssetsF,G | | | | | |
| Expenses before reductions | .68% | .69% | .71% | .73% | .75% |
| Expenses net of fee waivers, if any | .68% | .69% | .70% | .72% | .75% |
| Expenses net of all reductions | .67% | .68% | .70% | .72% | .74% |
| Net investment income (loss) | 1.79% | 1.61% | 1.66% | 1.94% | 1.95% |
| Supplemental Data | | | | | |
| Net assets, end of period (000 omitted) | $38,192 | $28,077 | $22,943 | $25,736 | $24,123 |
| Portfolio turnover rateH | 45% | 38% | 78% | 36% | 20% |
A Calculated based on average shares outstanding during the period.
B The amounts shown reflect certain reclassifications related to book to tax differences that were made in the year shown.
C Amount represents less than $.005 per share.
D Total returns do not reflect charges attributable to your insurance company's separate account. Inclusion of these charges would reduce the total returns shown.
E Total returns would have been lower if certain expenses had not been reduced during the applicable periods shown.
F Fees and expenses of any underlying Fidelity Central Funds are not included in the Fund's expense ratio. The Fund indirectly bears its proportionate share of the expenses of any underlying Fidelity Central Funds.
G Expense ratios reflect operating expenses of the class. Expenses before reductions do not reflect amounts reimbursed by the investment adviser or reductions from brokerage service arrangements or reductions from other expense offset arrangements and do not represent the amount paid by the class during periods when reimbursements or reductions occur. Expenses net of fee waivers reflect expenses after reimbursement by the investment adviser but prior to reductions from brokerage service arrangements or other expense offset arrangements. Expenses net of all reductions represent the net expenses paid by the class.
H Amount does not include the portfolio activity of any underlying Fidelity Central Funds.
See accompanying notes which are an integral part of the financial statements.
Financial Highlights — VIP Consumer Staples Portfolio Investor Class
| Years ended December 31, | 2016 | 2015 | 2014 | 2013 | 2012 |
| Selected Per–Share Data | | | | | |
| Net asset value, beginning of period | $18.19 | $18.02 | $16.40 | $13.99 | $12.39 |
| Income from Investment Operations | | | | | |
| Net investment income (loss)A | .32 | .27 | .26 | .30 | .25 |
| Net realized and unrealized gain (loss) | .30 | 1.34 | 2.20 | 2.73 | 1.64 |
| Total from investment operations | .62 | 1.61 | 2.46 | 3.03 | 1.89 |
| Distributions from net investment income | (.32)B | (.26) | (.23) | (.30) | (.21) |
| Distributions from net realized gain | (1.07)B | (1.18) | (.61) | (.32) | (.09) |
| Total distributions | (1.39) | (1.44) | (.84) | (.62) | (.30) |
| Redemption fees added to paid in capitalA | –C | –C | –C | –C | .01 |
| Net asset value, end of period | $17.42 | $18.19 | $18.02 | $16.40 | $13.99 |
| Total ReturnD,E | 3.67% | 9.41% | 15.52% | 21.79% | 15.30% |
| Ratios to Average Net AssetsF,G | | | | | |
| Expenses before reductions | .76% | .77% | .78% | .80% | .82% |
| Expenses net of fee waivers, if any | .76% | .76% | .78% | .80% | .82% |
| Expenses net of all reductions | .75% | .76% | .77% | .80% | .82% |
| Net investment income (loss) | 1.71% | 1.53% | 1.59% | 1.86% | 1.87% |
| Supplemental Data | | | | | |
| Net assets, end of period (000 omitted) | $278,992 | $213,575 | $160,591 | $140,485 | $89,648 |
| Portfolio turnover rateH | 45% | 38% | 78% | 36% | 20% |
A Calculated based on average shares outstanding during the period.
B The amounts shown reflect certain reclassifications related to book to tax differences that were made in the year shown.
C Amount represents less than $.005 per share.
D Total returns do not reflect charges attributable to your insurance company's separate account. Inclusion of these charges would reduce the total returns shown.
E Total returns would have been lower if certain expenses had not been reduced during the applicable periods shown.
F Fees and expenses of any underlying Fidelity Central Funds are not included in the Fund's expense ratio. The Fund indirectly bears its proportionate share of the expenses of any underlying Fidelity Central Funds.
G Expense ratios reflect operating expenses of the class. Expenses before reductions do not reflect amounts reimbursed by the investment adviser or reductions from brokerage service arrangements or reductions from other expense offset arrangements and do not represent the amount paid by the class during periods when reimbursements or reductions occur. Expenses net of fee waivers reflect expenses after reimbursement by the investment adviser but prior to reductions from brokerage service arrangements or other expense offset arrangements. Expenses net of all reductions represent the net expenses paid by the class.
H Amount does not include the portfolio activity of any underlying Fidelity Central Funds.
See accompanying notes which are an integral part of the financial statements.
Notes to Financial Statements
For the period ended December 31, 2016
1. Organization.
VIP Consumer Staples Portfolio (the Fund) is a non-diversified fund of Variable Insurance Products Fund IV (the Trust) and is authorized to issue an unlimited number of shares. The Trust is registered under the Investment Company Act of 1940, as amended (the 1940 Act), as an open-end management investment company organized as a Massachusetts business trust. Shares of the Fund may only be purchased by insurance companies for the purpose of funding variable annuity or variable life insurance contracts. The Fund offers the following classes of shares: Initial Class shares and Investor Class shares. All classes have equal rights and voting privileges, except for matters affecting a single class.
2. Investments in Fidelity Central Funds.
The Fund invests in Fidelity Central Funds, which are open-end investment companies generally available only to other investment companies and accounts managed by the investment adviser and its affiliates. The Fund's Schedule of Investments lists each of the Fidelity Central Funds held as of period end, if any, as an investment of the Fund, but does not include the underlying holdings of each Fidelity Central Fund. As an Investing Fund, the Fund indirectly bears its proportionate share of the expenses of the underlying Fidelity Central Funds.
The Money Market Central Funds seek preservation of capital and current income and are managed by Fidelity Investments Money Management, Inc. (FIMM), an affiliate of the investment adviser. Annualized expenses of the Money Market Central Funds as of their most recent shareholder report date are less than .005%.
A complete unaudited list of holdings for each Fidelity Central Fund is available upon request or at the Securities and Exchange Commission (the SEC) website at www.sec.gov. In addition, the financial statements of the Fidelity Central Funds, which are not covered by the Fund's Report of Independent Registered Public Accounting Firm, are available on the SEC website or upon request.
3. Significant Accounting Policies.
The financial statements have been prepared in conformity with accounting principles generally accepted in the United States of America (GAAP), which require management to make certain estimates and assumptions at the date of the financial statements. Actual results could differ from those estimates. Subsequent events, if any, through the date that the financial statements were issued have been evaluated in the preparation of the financial statements. The following summarizes the significant accounting policies of the Fund:
Investment Valuation. Investments are valued as of 4:00 p.m. Eastern time on the last calendar day of the period. The Board of Trustees (the Board) has delegated the day to day responsibility for the valuation of the Fund's investments to the Fair Value Committee (the Committee) established by the Fund's investment adviser. In accordance with valuation policies and procedures approved by the Board, the Fund attempts to obtain prices from one or more third party pricing vendors or brokers to value its investments. When current market prices, quotations or currency exchange rates are not readily available or reliable, investments will be fair valued in good faith by the Committee, in accordance with procedures adopted by the Board. Factors used in determining fair value vary by investment type and may include market or investment specific events. The frequency with which these procedures are used cannot be predicted and they may be utilized to a significant extent. The Committee oversees the Fund's valuation policies and procedures and reports to the Board on the Committee's activities and fair value determinations. The Board monitors the appropriateness of the procedures used in valuing the Fund's investments and ratifies the fair value determinations of the Committee.
The Fund categorizes the inputs to valuation techniques used to value its investments into a disclosure hierarchy consisting of three levels as shown below:
- Level 1 – quoted prices in active markets for identical investments
- Level 2 – other significant observable inputs (including quoted prices for similar investments, interest rates, prepayment speeds, etc.)
- Level 3 – unobservable inputs (including the Fund's own assumptions based on the best information available)
Valuation techniques used to value the Fund's investments by major category are as follows:
Equity securities, including restricted securities, for which market quotations are readily available, are valued at the last reported sale price or official closing price as reported by a third party pricing vendor on the primary market or exchange on which they are traded and are categorized as Level 1 in the hierarchy. In the event there were no sales during the day or closing prices are not available, securities are valued at the last quoted bid price or may be valued using the last available price and are generally categorized as Level 2 in the hierarchy. For foreign equity securities, when market or security specific events arise, comparisons to the valuation of American Depositary Receipts (ADRs), futures contracts, Exchange-Traded Funds (ETFs) and certain indexes as well as quoted prices for similar securities may be used and would be categorized as Level 2 in the hierarchy. Utilizing these techniques may result in transfers between Level 1 and Level 2. For equity securities, including restricted securities, where observable inputs are limited, assumptions about market activity and risk are used and these securities may be categorized as Level 3 in the hierarchy.
Investments in open-end mutual funds, including the Fidelity Central Funds, are valued at their closing net asset value (NAV) each business day and are categorized as Level 1 in the hierarchy.
Changes in valuation techniques may result in transfers in or out of an assigned level within the disclosure hierarchy. The aggregate value of investments by input level as of December 31, 2016, including information on transfers between Levels 1 and 2 is included at the end of the Fund's Schedule of Investments.
Foreign Currency. The Fund may use foreign currency contracts to facilitate transactions in foreign-denominated securities. Gains and losses from these transactions may arise from changes in the value of the foreign currency or if the counterparties do not perform under the contracts' terms.
Foreign-denominated assets, including investment securities, and liabilities are translated into U.S. dollars at the exchange rates at period end. Purchases and sales of investment securities, income and dividends received and expenses denominated in foreign currencies are translated into U.S. dollars at the exchange rate in effect on the transaction date.
The effects of exchange rate fluctuations on investments are included with the net realized and unrealized gain (loss) on investment securities. Other foreign currency transactions resulting in realized and unrealized gain (loss) are disclosed separately.
Investment Transactions and Income. For financial reporting purposes, the Fund's investment holdings and NAV include trades executed through the end of the last business day of the period. The NAV per share for processing shareholder transactions is calculated as of the close of business of the New York Stock Exchange (NYSE), normally 4:00 p.m. Eastern time and includes trades executed through the end of the prior business day. Gains and losses on securities sold are determined on the basis of identified cost. Dividend income is recorded on the ex-dividend date, except for certain dividends from foreign securities where the ex-dividend date may have passed, which are recorded as soon as the Fund is informed of the ex-dividend date. Non-cash dividends included in dividend income, if any, are recorded at the fair market value of the securities received. Income and capital gain distributions from Fidelity Central Funds, if any, are recorded on the ex-dividend date. Certain distributions received by the Fund represent a return of capital or capital gain. The Fund determines the components of these distributions subsequent to the ex-dividend date, based upon receipt of tax filings or other correspondence relating to the underlying investment. These distributions are recorded as a reduction of cost of investments and/or as a realized gain. Investment income is recorded net of foreign taxes withheld where recovery of such taxes is uncertain.
Class Allocations and Expenses. Investment income, realized and unrealized capital gains and losses, common expenses of the Fund, and certain fund-level expense reductions, if any, are allocated daily on a pro-rata basis to each class based on the relative net assets of each class to the total net assets of the Fund. Each class differs with respect to transfer agent fees incurred. Certain expense reductions may also differ by class. For the reporting period, the allocated portion of income and expenses to each class as a percent of its average net assets may vary due to the timing of recording these transactions in relation to fluctuating net assets of the classes. Expenses directly attributable to a fund are charged to that fund. Expenses attributable to more than one fund are allocated among the respective funds on the basis of relative net assets or other appropriate methods. Expense estimates are accrued in the period to which they relate and adjustments are made when actual amounts are known.
Income Tax Information and Distributions to Shareholders. Each year, the Fund intends to qualify as a regulated investment company under Subchapter M of the Internal Revenue Code, including distributing substantially all of its taxable income and realized gains. As a result, no provision for U.S. Federal income taxes is required. As of December 31, 2016, the Fund did not have any unrecognized tax benefits in the financial statements; nor is the Fund aware of any tax positions for which it is reasonably possible that the total amounts of unrecognized tax benefits will significantly change in the next twelve months. The Fund files a U.S. federal tax return, in addition to state and local tax returns as required. The Fund's federal income tax returns are subject to examination by the Internal Revenue Service (IRS) for a period of three fiscal years after they are filed. State and local tax returns may be subject to examination for an additional fiscal year depending on the jurisdiction. Foreign taxes are provided for based on the Fund's understanding of the tax rules and rates that exist in the foreign markets in which it invests.
Distributions are declared and recorded on the ex-dividend date. Income dividends and capital gain distributions are declared separately for each class. Income and capital gain distributions are determined in accordance with income tax regulations, which may differ from GAAP. These differences resulted in distribution reclassifications.
Capital accounts within the financial statements are adjusted for permanent book-tax differences. These adjustments have no impact on net assets or the results of operations. Capital accounts are not adjusted for temporary book-tax differences which will reverse in a subsequent period.
Book-tax differences are primarily due to foreign currency transactions and losses deferred due to wash sales and excise tax regulations.
The federal tax cost of investment securities and unrealized appreciation (depreciation) as of period end were as follows:
| Gross unrealized appreciation | $48,571,138 |
| Gross unrealized depreciation | (12,018,339) |
| Net unrealized appreciation (depreciation) on securities | $36,552,799 |
| Tax Cost | $286,307,414 |
At period end, the Fund intends to elect to defer to its next fiscal year $341,490 of capital losses recognized during the period November 1,2016 to December 31, 2016.
The tax-based components of distributable earnings as of period end were as follows:
| Net unrealized appreciation (depreciation) on securities and other investments | $36,551,262 |
The tax character of distributions paid was as follows:
| | December 31, 2016 | December 31, 2015 |
| Ordinary Income | $11,855,056 | $ 5,842,044 |
| Long-term Capital Gains | 10,257,767 | 10,414,530 |
| Total | $22,112,823 | $ 16,256,574 |
Trading (Redemption) Fees. Shares held by investors less than 60 days may be subject to a redemption fee equal to 1% of the NAV of shares redeemed. All redemption fees, which reduce the proceeds of the shareholder redemption, are retained by the Fund and accounted for as an addition to paid in capital.
Restricted Securities. The Fund may invest in securities that are subject to legal or contractual restrictions on resale. These securities generally may be resold in transactions exempt from registration or to the public if the securities are registered. Disposal of these securities may involve time-consuming negotiations and expense, and prompt sale at an acceptable price may be difficult. Information regarding restricted securities is included at the end of the Fund's Schedule of Investments.
4. Purchases and Sales of Investments.
Purchases and sales of securities, other than short-term securities, aggregated $217,060,557 and $144,748,808, respectively.
5. Fees and Other Transactions with Affiliates.
Management Fee. Fidelity SelectCo, LLC (the investment adviser) and its affiliates provide the Fund with investment management related services for which the Fund pays a monthly management fee. The management fee is the sum of an individual fund fee rate that is based on an annual rate of .30% of the Fund's average net assets and an annualized group fee rate that averaged .25% during the period. The group fee rate is based upon the average net assets of all the mutual funds advised by Fidelity Management & Research Company (FMR) and the investment adviser. The group fee rate decreases as assets under management increase and increases as assets under management decrease. For the reporting period, the total annual management fee rate was .55% of the Fund's average net assets.
Transfer Agent Fees. Fidelity Investments Institutional Operations Company, Inc. (FIIOC), an affiliate of the investment adviser, is the Fund's transfer, dividend disbursing, and shareholder servicing agent. FIIOC receives an asset-based fee with respect to each class. Each class (with the exception of Investor Class) pays a fee for transfer agent services, typesetting, and printing and mailing of shareholder reports, excluding mailing of proxy statements, equal to an annual rate of .07%(.15% for Investor Class) of class-level average net assets. For the period, transfer agent fees for each class were as follows:
| Initial Class | $28,295 |
| Investor Class | 421,351 |
| | $449,646 |
Accounting and Security Lending Fees. Fidelity Service Company, Inc. (FSC), an affiliate of the investment adviser, maintains the Fund's accounting records. The accounting fee is based on the level of average net assets for each month. Under a separate contract, FSC administers the security lending program. The security lending fee is based on the number and duration of lending transactions.
Brokerage Commissions. The Fund placed a portion of its portfolio transactions with brokerage firms which are affiliates of the investment adviser. Brokerage commissions are included in net realized gain (loss) and change in net unrealized appreciation (depreciation) in the Statement of Operations. The commissions paid to these affiliated firms were $4,181 for the period.
Interfund Lending Program. Pursuant to an Exemptive Order issued by the SEC, the Fund, along with other registered investment companies having management contracts with Fidelity Management & Research Company (FMR) or other affiliated entities of FMR, may participate in an interfund lending program. This program provides an alternative credit facility allowing the funds to borrow from, or lend money to, other participating affiliated funds. At period end, there were no interfund loans outstanding. The Fund's activity in this program during the period for which loans were outstanding was as follows:
| Borrower or Lender | Average Loan Balance | Weighted Average Interest Rate | Interest Expense |
| Borrower | $5,420,923 | .59% | $1,162 |
Interfund Trades. The Fund may purchase from or sell securities to other Fidelity Funds under procedures adopted by the Board. The procedures have been designed to ensure these interfund trades are executed in accordance with Rule 17a-7 of the 1940 Act. Interfund trades are included within the respective purchases and sales amounts shown in the Purchases and Sales of Investments note.
6. Committed Line of Credit.
The Fund participates with other funds managed by the investment adviser or an affiliate in a $4.25 billion credit facility (the "line of credit") to be utilized for temporary or emergency purposes to fund shareholder redemptions or for other short-term liquidity purposes. The Fund has agreed to pay commitment fees on its pro-rata portion of the line of credit, which amounted to $806 and is reflected in Miscellaneous expenses on the Statement of Operations. During the period, the Fund did not borrow on this line of credit.
7. Security Lending.
The Fund lends portfolio securities through a lending agent from time to time in order to earn additional income. On the settlement date of the loan, the Fund receives collateral (in the form of U.S. Treasury obligations, letters of credit and/or cash) against the loaned securities and maintains collateral in an amount not less than 100% of the market value of the loaned securities during the period of the loan. The market value of the loaned securities is determined at the close of business of the Fund and any additional required collateral is delivered to the Fund on the next business day. The Fund or borrower may terminate the loan at any time, and if the borrower defaults on its obligation to return the securities loaned because of insolvency or other reasons, the Fund may apply collateral received from the borrower against the obligation. The Fund may experience delays and costs in recovering the securities loaned. Any cash collateral received is invested in the Fidelity Securities Lending Cash Central Fund. The value of loaned securities and cash collateral at period end are disclosed on the Fund's Statement of Assets and Liabilities. Security lending income represents the income earned on investing cash collateral, less rebates paid to borrowers and any lending agent fees associated with the loan, plus any premium payments received for lending certain types of securities. Security lending income is presented in the Statement of Operations as a component of income from Fidelity Central Funds. Total security lending income during the period amounted to $367,941.
8. Bank Borrowings.
The Fund is permitted to have bank borrowings for temporary or emergency purposes to fund shareholder redemptions or for other short-term liquidity requirements. The Fund has established borrowing arrangements with certain banks. The interest rate on the borrowings is the bank's base rate, as revised from time to time. The average loan balance during the period for which loans were outstanding amounted to $3,364,500. The weighted average interest rate was .91%. The interest expense amounted to $170 under the bank borrowing program. At period end, there were no bank borrowings outstanding.
9. Expense Reductions.
Commissions paid to certain brokers with whom the investment adviser, or its affiliates, places trades on behalf of the Fund include an amount in addition to trade execution, which may be rebated back to the Fund to offset certain expenses. This amount totaled $16,283 for the period.
In addition, during the period the investment adviser reimbursed and/or waived a portion of fund-level operating expenses in the amount of $1,691.
10. Distributions to Shareholders.
Distributions to shareholders of each class were as follows:
| | Year ended
December 31, 2016 | Year ended
December 31, 2015 |
| From net investment income | | |
| Initial Class | $706,116 | $400,995 |
| Investor Class | 4,974,521 | 2,917,749 |
| Total | $5,680,637 | $3,318,744 |
| From net realized gain | | |
| Initial Class | $1,949,556 | $1,614,521 |
| Investor Class | 14,482,630 | 11,323,309 |
| Total | $16,432,186 | $12,937,830 |
11. Share Transactions.
Transactions for each class of shares were as follows:
| | Shares | Shares | Dollars | Dollars |
| | Year ended December 31, 2016 | Year ended December 31, 2015 | Year ended December 31, 2016 | Year ended December 31, 2015 |
| Initial Class | | | | |
| Shares sold | 1,382,930 | 441,760 | $25,523,374 | $7,883,291 |
| Reinvestment of distributions | 153,384 | 115,112 | 2,655,672 | 2,015,516 |
| Shares redeemed | (890,562) | (287,181) | (16,436,352) | (5,040,290) |
| Net increase (decrease) | 645,752 | 269,691 | $11,742,694 | $4,858,517 |
| Investor Class | | | | |
| Shares sold | 5,846,766 | 2,935,553 | $107,736,321 | $52,128,879 |
| Reinvestment of distributions | 1,128,506 | 815,517 | 19,457,151 | 14,241,058 |
| Shares redeemed | (2,701,599) | (916,976) | (49,097,610) | (15,996,831) |
| Net increase (decrease) | 4,273,673 | 2,834,094 | $78,095,862 | $50,373,106 |
12. Other.
The Fund's organizational documents provide former and current trustees and officers with a limited indemnification against liabilities arising in connection with the performance of their duties to the Fund. In the normal course of business, the Fund may also enter into contracts that provide general indemnifications. The Fund's maximum exposure under these arrangements is unknown as this would be dependent on future claims that may be made against the Fund. The risk of material loss from such claims is considered remote.
At the end of the period, the investment adviser or its affiliates were the owners of record of 100% of the total outstanding shares of the Fund.
Report of Independent Registered Public Accounting Firm
To the Trustees of Variable Insurance Products Fund IV and Shareholders of VIP Consumer Staples Portfolio:
In our opinion, the accompanying statement of assets and liabilities, including the schedule of investments, and the related statements of operations and of changes in net assets and the financial highlights present fairly, in all material respects, the financial position of VIP Consumer Staples Portfolio (a fund of Variable Insurance Products Fund IV) (the "Fund") as of December 31, 2016, the results of its operations for the year then ended, the changes in its net assets for each of the two years in the period then ended and the financial highlights for each of the five years in the period then ended, in conformity with accounting principles generally accepted in the United States of America. These financial statements and financial highlights (hereafter referred to as “financial statements”) are the responsibility of the Fund's management. Our responsibility is to express an opinion on these financial statements based on our audits. We conducted our audits of these financial statements in accordance with the standards of the Public Company Accounting Oversight Board (United States). Those standards require that we plan and perform the audit to obtain reasonable assurance about whether the financial statements are free of material misstatement. An audit includes examining, on a test basis, evidence supporting the amounts and disclosures in the financial statements, assessing the accounting principles used and significant estimates made by management, and evaluating the overall financial statement presentation. We believe that our audits, which included confirmation of securities as of December 31, 2016 by correspondence with the custodian and brokers, provide a reasonable basis for our opinion.
PricewaterhouseCoopers LLP
Boston, Massachusetts
February 17, 2017
Trustees and Officers
The Trustees, Members of the Advisory Board (if any), and officers of the trust and fund, as applicable, are listed below. The Board of Trustees governs the fund and is responsible for protecting the interests of shareholders. The Trustees are experienced executives who meet periodically throughout the year to oversee the fund's activities, review contractual arrangements with companies that provide services to the fund, oversee management of the risks associated with such activities and contractual arrangements, and review the fund's performance. Each of the Trustees oversees 83 funds.
The Trustees hold office without limit in time except that (a) any Trustee may resign; (b) any Trustee may be removed by written instrument, signed by at least two-thirds of the number of Trustees prior to such removal; (c) any Trustee who requests to be retired or who has become incapacitated by illness or injury may be retired by written instrument signed by a majority of the other Trustees; and (d) any Trustee may be removed at any special meeting of shareholders by a two-thirds vote of the outstanding voting securities of the trust. Each Trustee who is not an interested person (as defined in the 1940 Act) of the trust and the fund is referred to herein as an Independent Trustee. Each Independent Trustee shall retire not later than the last day of the calendar year in which his or her 75th birthday occurs. The Independent Trustees may waive this mandatory retirement age policy with respect to individual Trustees. Officers and Advisory Board Members hold office without limit in time, except that any officer or Advisory Board Member may resign or may be removed by a vote of a majority of the Trustees at any regular meeting or any special meeting of the Trustees. Except as indicated, each individual has held the office shown or other offices in the same company for the past five years.
The fund’s Statement of Additional Information (SAI) includes more information about the Trustees. To request a free copy, call Fidelity at 1-877-208-0098.
Experience, Skills, Attributes, and Qualifications of the Trustees. The Governance and Nominating Committee has adopted a statement of policy that describes the experience, qualifications, attributes, and skills that are necessary and desirable for potential Independent Trustee candidates (Statement of Policy). The Board believes that each Trustee satisfied at the time he or she was initially elected or appointed a Trustee, and continues to satisfy, the standards contemplated by the Statement of Policy. The Governance and Nominating Committee also engages professional search firms to help identify potential Independent Trustee candidates who have the experience, qualifications, attributes, and skills consistent with the Statement of Policy. From time to time, additional criteria based on the composition and skills of the current Independent Trustees, as well as experience or skills that may be appropriate in light of future changes to board composition, business conditions, and regulatory or other developments, have also been considered by the professional search firms and the Governance and Nominating Committee. In addition, the Board takes into account the Trustees' commitment and participation in Board and committee meetings, as well as their leadership of standing and ad hoc committees throughout their tenure.
In determining that a particular Trustee was and continues to be qualified to serve as a Trustee, the Board has considered a variety of criteria, none of which, in isolation, was controlling. The Board believes that, collectively, the Trustees have balanced and diverse experience, qualifications, attributes, and skills, which allow the Board to operate effectively in governing the fund and protecting the interests of shareholders. Information about the specific experience, skills, attributes, and qualifications of each Trustee, which in each case led to the Board's conclusion that the Trustee should serve (or continue to serve) as a trustee of the fund, is provided below.
Board Structure and Oversight Function. Brian B. Hogan is an interested person and currently serves as Chairman. The Trustees have determined that an interested Chairman is appropriate and benefits shareholders because an interested Chairman has a personal and professional stake in the quality and continuity of services provided to the fund. Independent Trustees exercise their informed business judgment to appoint an individual of their choosing to serve as Chairman, regardless of whether the Trustee happens to be independent or a member of management. The Independent Trustees have determined that they can act independently and effectively without having an Independent Trustee serve as Chairman and that a key structural component for assuring that they are in a position to do so is for the Independent Trustees to constitute a substantial majority for the Board. The Independent Trustees also regularly meet in executive session. Michael E. Wiley serves as Chairman of the Independent Trustees and as such (i) acts as a liaison between the Independent Trustees and management with respect to matters important to the Independent Trustees and (ii) with management prepares agendas for Board meetings.
Fidelity® funds are overseen by different Boards of Trustees. The fund's Board oversees Fidelity's sector portfolios. Other Boards oversee Fidelity's equity and high income funds, and Fidelity's investment grade bond, money market, and asset allocation funds. The use of separate Boards, each with its own committee structure, allows the Trustees of each group of Fidelity® funds to focus on the unique issues of the funds they oversee, including common research, investment, and operational issues. On occasion, the separate Boards establish joint committees to address issues of overlapping consequences for the Fidelity® funds overseen by each Board.
The Trustees operate using a system of committees to facilitate the timely and efficient consideration of all matters of importance to the Trustees, the fund, and fund shareholders and to facilitate compliance with legal and regulatory requirements and oversight of the fund's activities and associated risks. The Board, acting through its committees, has charged SelectCo and its affiliates with (i) identifying events or circumstances the occurrence of which could have demonstrably adverse effects on the fund's business and/or reputation; (ii) implementing processes and controls to lessen the possibility that such events or circumstances occur or to mitigate the effects of such events or circumstances if they do occur; and (iii) creating and maintaining a system designed to evaluate continuously business and market conditions in order to facilitate the identification and implementation processes described in (i) and (ii) above. Because the day-to-day operations and activities of the fund are carried out by or through SelectCo, its affiliates, and other service providers, the fund's exposure to risks is mitigated but not eliminated by the processes overseen by the Trustees. While each of the Board's committees has responsibility for overseeing different aspects of the fund's activities, oversight is exercised primarily through the Operations and Audit Committees. Appropriate personnel, including but not limited to the fund's Chief Compliance Officer (CCO), SelectCo's internal auditor, the independent accountants, the fund's Treasurer and portfolio management personnel, make periodic reports to the Board's committees, as appropriate. The responsibilities of each standing committee, including their oversight responsibilities, are described further under "Standing Committees of the Trustees."
Interested Trustees*:
Correspondence intended for a Trustee who is an interested person may be sent to Fidelity Investments, 245 Summer Street, Boston, Massachusetts 02210.
Name, Year of Birth; Principal Occupations and Other Relevant Experience+
Brian B. Hogan (1964)
Year of Election or Appointment: 2014
Trustee
Chairman of the Board of Trustees
Mr. Hogan also serves as Trustee or Vice President of other funds. Mr. Hogan serves as a Director of FMR Investment Management (UK) Limited (investment adviser firm, 2015-present) and Fidelity SelectCo, LLC (investment adviser firm, 2014-present) and President of the Equity Division of FMR (investment adviser firm, 2009-present). Previously, Mr. Hogan served as Senior Vice President, Equity Research of FMR (2006-2009) and as a portfolio manager. Mr. Brian B. Hogan is not related to Mr. Colm A. Hogan.
* Determined to be an "Interested Trustee" by virtue of, among other things, his or her affiliation with the trust or various entities under common control with SelectCo.
+ The information includes the Trustee's principal occupation during the last five years and other information relating to the experience, attributes, and skills relevant to the Trustee's qualifications to serve as a Trustee, which led to the conclusion that the Trustee should serve as a Trustee for the fund.
Independent Trustees:
Correspondence intended for an Independent Trustee may be sent to Fidelity Investments, P.O. Box 55235, Boston, Massachusetts 02205-5235.
Name, Year of Birth; Principal Occupations and Other Relevant Experience+
David A. Rosow (1942)
Year of Election or Appointment: 2013
Trustee
Mr. Rosow also serves as Trustee of other Fidelity® funds. Prior to his retirement in 2006, Mr. Rosow was the Chief Executive Officer, owner and operator of a number of private companies, which encompassed the oil refining, drilling and marketing of petroleum products (including specialty petroleum products), recreation industry, and real estate development. Mr. Rosow currently serves as a Director of Oxbow Carbon LLC (upgraders, marketers, and distributors of petroleum byproducts of the oil refining process, 2015-present) and Oxbridge Academy of the Palm Beaches (2015-present) and serves as its President and CEO. Previously, Mr. Rosow served on the Fairfield Country Day School Board for 27 years, including as its President for 3 years, stepping down in 2006. Mr. Rosow served as Lead Director and Chairman of the Audit Committee of Hudson United Bancorp (1996-2006), Chairman of the Board of Westport Bank and Trust (1992-1996), and as a Director of TD Banknorth (2006-2007). In addition, Mr. Rosow served as a member (2008-2014) and President (2009-2014) of the Town Council of Palm Beach, Florida. Mr. Rosow also served as a Member of the Advisory Board of certain Fidelity® funds (2012-2013).
Garnett A. Smith (1947)
Year of Election or Appointment: 2013
Trustee
Mr. Smith also serves as Trustee of other Fidelity® funds. Prior to Mr. Smith's retirement, he served as Chairman and Chief Executive Officer of Inbrand Corp. (manufacturer of personal absorbent products, 1990-1997). He also served as President (1986-1990) of Inbrand Corp. Prior to his employment with Inbrand Corp., he was employed by a retail fabric chain and North Carolina National Bank. In addition, Mr. Smith served as a Member of the Advisory Board of certain Fidelity® funds (2012-2013) and as a board member of the Jackson Hole Land Trust (2009-2012).
Michael E. Wiley (1950)
Year of Election or Appointment: 2008
Trustee
Chairman of the Independent Trustees
Mr. Wiley also serves as Trustee of other Fidelity® funds. Mr. Wiley serves as a Director of Tesoro Corporation (independent oil refiner and marketer, 2005-present), a Director of Tesoro Logistics LP (natural resources logistics, 2015-present), and a Director of Bill Barrett Corporation (exploration and production, 2005-present). In addition, Mr. Wiley also serves as a Director of Post Oak Bank (privately-held bank, 2004-present). Previously, Mr. Wiley served as a Trustee of other Fidelity® funds (2008-2013), as a Director of Asia Pacific Exploration Consolidated (international oil and gas exploration and production, 2008-2013), as a member of the Board of Trustees of the University of Tulsa (2000-2006; 2007-2010), as a Senior Energy Advisor of Katzenbach Partners, LLC (consulting, 2006-2007), as an Advisory Director of Riverstone Holdings (private investment), Chairman, President, and CEO of Baker Hughes, Inc. (oilfield services, 2000-2004), and as Director of Spinnaker Exploration Company (exploration and production, 2001-2005).
+ The information includes the Trustee's principal occupation during the last five years and other information relating to the experience, attributes, and skills relevant to the Trustee's qualifications to serve as a Trustee, which led to the conclusion that the Trustee should serve as a Trustee for the fund.
Advisory Board Members and Officers:
Correspondence intended for a Member of the Advisory Board may be sent to Fidelity Investments, P.O. Box 55235, Boston, Massachusetts 02205-5235. Except for Anthony R. Rochte, correspondence intended for an officer may be sent to Fidelity Investments, 245 Summer Street, Boston, Massachusetts 02210. Correspondence intended for Mr. Rochte may be sent to SelectCo, 1225 17th Street, Denver, Colorado 80202-5541. Officers appear below in alphabetical order.
Name, Year of Birth; Principal Occupation
Donald F. Donahue (1950)
Year of Election or Appointment: 2015
Member of the Advisory Board
Mr. Donahue also serves as a Trustee or Member of the Advisory Board of other Fidelity® funds. Mr. Donahue is President and Chief Executive Officer of Miranda Partners, LLC (risk consulting for the financial services industry, 2012-present) and a consultant for the Institute for Defense Analyses (national security, 2012-present). Previously, Mr. Donahue served as Chief Executive Officer (2006-2012), Chief Operating Officer (2003-2006), and Managing Director, Customer Marketing and Development (1999-2003) of The Depository Trust & Clearing Corporation (financial markets infrastructure). Mr. Donahue serves as a Member (2012-present) and Co-Chairman (2016-present) of the Board of Directors of United Way of New York, Member of the Board of Directors of NYC Leadership Academy (2012-present) and Member of the Board of Advisors of Ripple Labs, Inc. (financial services, 2015-present). He also served as Chairman (2010-2012) and Member of the Board of Directors (2012-2013) of Omgeo, LLC (financial services), Treasurer of United Way of New York (2012-2016), and Member of the Board of Directors of XBRL US (financial services non-profit, 2009-2012) and the International Securities Services Association (2009-2012).
Carol B. Tomé (1957)
Year of Election or Appointment: 2017
Member of the Advisory Board
Ms. Tomé also serves as Trustee or Member of the Advisory Board of other Fidelity® funds. Ms. Tomé is Chief Financial Officer (2001-present) and Executive Vice President of Corporate Services (2007-present) of The Home Depot, Inc. (home improvement retailer) and a Director (2003-present) and Chair of the Audit Committee (2004-present) of United Parcel Service, Inc. (package delivery and supply chain management). Previously, Ms. Tomé served as Senior Vice President of Finance and Accounting/Treasurer (2000-2007) and Vice President and Treasurer (1995-2000) of The Home Depot, Inc. and Chair of the Board (2010-2012), Vice Chair of the Board (2009 and 2013), and a Director (2008-2013) of the Federal Reserve Bank of Atlanta. Ms. Tomé is also a director or trustee of many community and professional organizations.
Marc R. Bryant (1966)
Year of Election or Appointment: 2013
Secretary and Chief Legal Officer (CLO)
Mr. Bryant also serves as Secretary and CLO of other funds. Mr. Bryant serves as CLO, Secretary, and Senior Vice President of Fidelity Management & Research Company (investment adviser firm, 2015-present) and FMR Co., Inc. (investment adviser firm, 2015-present); Secretary of Fidelity SelectCo, LLC (investment adviser firm, 2015-present) and Fidelity Investments Money Management, Inc. (investment adviser firm, 2015-present); and CLO of Fidelity Management & Research (Hong Kong) Limited and FMR Investment Management (UK) Limited (investment adviser firms, 2015-present) and Fidelity Management & Research (Japan) Limited (investment adviser firm, 2016-present). He is Senior Vice President and Deputy General Counsel of FMR LLC (diversified financial services company). Previously, Mr. Bryant served as Secretary and CLO of Fidelity Rutland Square Trust II (2010-2014) and Assistant Secretary of Fidelity's Fixed Income and Asset Allocation Funds (2013-2015). Prior to joining Fidelity Investments, Mr. Bryant served as a Senior Vice President and the Head of Global Retail Legal for AllianceBernstein L.P. (2006-2010), and as the General Counsel for ProFund Advisors LLC (2001-2006).
Jeffrey S. Christian (1961)
Year of Election or Appointment: 2016
Assistant Treasurer
Mr. Christian also serves as Assistant Treasurer of other funds. Mr. Christian is an employee of Fidelity Investments (2003-present).
William C. Coffey (1969)
Year of Election or Appointment: 2009
Assistant Secretary
Mr. Coffey also serves as Assistant Secretary of other funds. He is Senior Vice President and Deputy General Counsel of FMR LLC (diversified financial services company, 2010-present), and is an employee of Fidelity Investments. Previously, Mr. Coffey served as Vice President and Associate General Counsel of FMR LLC (2005-2009).
Jonathan Davis (1968)
Year of Election or Appointment: 2010
Assistant Treasurer
Mr. Davis also serves as Assistant Treasurer of other funds, and is an employee of Fidelity Investments. Previously, Mr. Davis served as Vice President and Associate General Counsel of FMR LLC (diversified financial services company, 2003-2010).
Adrien E. Deberghes (1967)
Year of Election or Appointment: 2013
President and Treasurer
Mr. Deberghes also serves as an officer of other funds. He serves as Executive Vice President of Fidelity Investments Money Management, Inc. (FIMM) (investment adviser firm, 2016-present) and is an employee of Fidelity Investments (2008-present). Prior to joining Fidelity Investments, Mr. Deberghes was Senior Vice President of Mutual Fund Administration at State Street Corporation (2007-2008), Senior Director of Mutual Fund Administration at Investors Bank & Trust (2005-2007), and Director of Finance for Dunkin' Brands (2000-2005). Previously, Mr. Deberghes served in other fund officer roles.
Joseph DeSantis (1959)
Year of Election or Appointment: 2015
Vice President
Mr. DeSantis also serves as Vice President of other funds. Mr. DeSantis serves as a Director of Fidelity Management & Research (Japan) Limited (investment adviser firm, 2016-present), Chief Investment Officer, Equities (2010-present) and is an employee of Fidelity Investments.
Stephanie J. Dorsey (1969)
Year of Election or Appointment: 2010
Assistant Treasurer
Ms. Dorsey also serves as an officer of other funds. She is an employee of Fidelity Investments (2008-present) and has served in other fund officer roles. Prior to joining Fidelity Investments, Ms. Dorsey served as Treasurer (2004-2008) of the JPMorgan Mutual Funds and Vice President (2004-2008) of JPMorgan Chase Bank.
Howard J. Galligan III (1966)
Year of Election or Appointment: 2014
Chief Financial Officer
Mr. Galligan also serves as Chief Financial Officer of other funds. Mr. Galligan serves as President of Fidelity Pricing and Cash Management Services (FPCMS) (2014-present) and as a Director of Strategic Advisers, Inc. (investment adviser firm, 2008-present). Previously, Mr. Galligan served as Chief Administrative Officer of Asset Management (2011-2014) and Chief Operating Officer and Senior Vice President of Investment Support for Strategic Advisers, Inc. (2003-2011).
Scott C. Goebel (1968)
Year of Election or Appointment: 2015
Vice President
Mr. Goebel serves as Vice President of other funds and is an employee of Fidelity Investments (2001-present). Previously, Mr. Goebel served as Senior Vice President of Fidelity Management & Research Company (FMR) (investment adviser firm, 2016), Secretary of Fidelity SelectCo, LLC (investment adviser firm, 2013-2015), Fidelity Investments Money Management, Inc. (FIMM) (investment adviser firm, 2010-2015), and Fidelity Research and Analysis Company (FRAC) (investment adviser firm, 2010-2015); General Counsel, Secretary, and Senior Vice President of FMR (investment adviser firm, 2008-2015) and FMR Co., Inc. (investment adviser firm, 2008-2015); Assistant Secretary of Fidelity Management & Research (Japan) Limited (investment adviser firm, 2008-2015) and Fidelity Management & Research (U.K.) Inc. (investment adviser firm, 2008-2015); Chief Legal Officer (CLO) of Fidelity Management & Research (Hong Kong) Limited (investment adviser firm, 2008-2015); Secretary and CLO of certain Fidelity® funds (2008-2015); Assistant Secretary of FIMM (2008-2010), FRAC (2008-2010), and certain funds (2007-2008); and as Vice President and Secretary of Fidelity Distributors Corporation (FDC) (2005-2007).
James D. Gryglewicz (1972)
Year of Election or Appointment: 2014
Chief Compliance Officer
Mr. Gryglewicz also serves as Chief Compliance Officer of other funds. Mr. Gryglewicz serves as Compliance Officer of Strategic Advisers, Inc. (investment adviser firm, 2015-present) and Fidelity SelectCo, LLC (investment adviser firm, 2014-present), Senior Vice President of Asset Management Compliance (2009-present), and is an employee of Fidelity Investments (2004-present).
Brian B. Hogan (1964)
Year of Election or Appointment: 2009
Vice President
Mr. Hogan also serves as Trustee or Vice President of other funds. Mr. Hogan serves as a Director of FMR Investment Management (UK) Limited (investment adviser firm, 2015-present) and Fidelity SelectCo, LLC (investment adviser firm, 2014-present) and President of the Equity Division of FMR (investment adviser firm, 2009-present). Previously, Mr. Hogan served as Senior Vice President, Equity Research of FMR (2006-2009) and as a portfolio manager. Mr. Brian B. Hogan is not related to Mr. Colm A. Hogan.
Colm A. Hogan (1973)
Year of Election or Appointment: 2016
Assistant Treasurer
Mr. Hogan also serves as an officer of other funds. Mr. Hogan is an employee of Fidelity Investments (2005-present). Mr. Colm A. Hogan is not related to Mr. Brian B. Hogan.
Chris Maher (1972)
Year of Election or Appointment: 2013
Assistant Treasurer
Mr. Maher serves as Assistant Treasurer of other funds. Mr. Maher is Vice President of Valuation Oversight and is an employee of Fidelity Investments. Previously, Mr. Maher served as Vice President of Asset Management Compliance (2013), Vice President of the Program Management Group of FMR (investment adviser firm, 2010-2013), and Vice President of Valuation Oversight (2008-2010).
John F. Papandrea (1972)
Year of Election or Appointment: 2016
Anti-Money Laundering (AML) Officer
Mr. Papandrea also serves as AML Officer of other funds. Mr. Papandrea is Vice President of FMR LLC (diversified financial services company, 2008-present) and is an employee of Fidelity Investments (2005-present).
Anthony R. Rochte (1968)
Year of Election or Appointment: 2013
Vice President
Mr. Rochte also serves as Vice President of other funds. Mr. Rochte serves as President of Fidelity SelectCo, LLC (investment adviser firm, 2012-present) and is an employee of Fidelity Investments (2012-present). Prior to joining Fidelity Investments, Mr. Rochte served as Senior Managing Director and head of State Street Global Advisors' North American Intermediary Business Group (2006-2012).
Stacie M. Smith (1974)
Year of Election or Appointment: 2013
Assistant Treasurer
Ms. Smith also serves as an officer of other funds. She is an employee of Fidelity Investments (2009-present) and has served in other fund officer roles. Prior to joining Fidelity Investments, Ms. Smith served as Senior Audit Manager of Ernst & Young LLP (accounting firm, 1996-2009). Previously, Ms. Smith served as Deputy Treasurer of certain Fidelity® funds (2013-2016).
Marc L. Spector (1972)
Year of Election or Appointment: 2017
Assistant Treasurer
Mr. Spector also serves as an officer of other funds. Mr. Spector is an employee of Fidelity Investments (2016-present). Prior to joining Fidelity Investments, Mr. Spector served as Director at the Siegfried Group (accounting firm, 2013-2016), and prior to Siegfried Group as audit senior manager at Deloitte & Touche (accounting firm, 2005-2013).
Renee Stagnone (1975)
Year of Election or Appointment: 2016
Assistant Treasurer
Ms. Stagnone also serves as an officer of other funds. Ms. Stagnone is an employee of Fidelity Investments (1997-present). Previously, Ms. Stagnone served as Deputy Treasurer of certain Fidelity® funds (2013-2016).
Shareholder Expense Example
As a shareholder of the Fund, you incur two types of costs: (1) transaction costs, including redemption fees and (2) ongoing costs, including management fees and other Fund expenses. This Example is intended to help you understand your ongoing costs (in dollars) of investing in the Fund and to compare these costs with the ongoing costs of investing in other mutual funds.
The Example is based on an investment of $1,000 invested at the beginning of the period and held for the entire period (July 1, 2016 to December 31, 2016).
Actual Expenses
The first line of the accompanying table for each class of the Fund provides information about actual account values and actual expenses. You may use the information in this line, together with the amount you invested, to estimate the expenses that you paid over the period. Simply divide your account value by $1,000.00 (for example, an $8,600 account value divided by $1,000.00 = 8.6), then multiply the result by the number in the first line for a class of the Fund under the heading entitled "Expenses Paid During Period" to estimate the expenses you paid on your account during this period. The estimate of expenses does not include any fees or other expenses of any variable annuity or variable life insurance product. If they were, the estimate of expenses you paid during the period would be higher, and your ending account value would be lower. In addition, the Fund, as a shareholder in the underlying Fidelity Central Funds, will indirectly bear its pro-rata share of the fees and expenses incurred by the underlying Fidelity Central Funds. These fees and expenses are not included in the Fund's annualized expense ratio used to calculate the expense estimate in the table below.
Hypothetical Example for Comparison Purposes
The second line of the accompanying table for each class of the Fund provides information about hypothetical account values and hypothetical expenses based on a Class' actual expense ratio and an assumed rate of return of 5% per year before expenses, which is not the Class' actual return. The hypothetical account values and expenses may not be used to estimate the actual ending account balance or expenses you paid for the period. You may use this information to compare the ongoing costs of investing in the Fund and other funds. To do so, compare this 5% hypothetical example with the 5% hypothetical examples that appear in the shareholder reports of the other funds. The estimate of expenses does not include any fees or other expenses of any variable annuity or variable life insurance product. If they were, the estimate of expenses you paid during the period would be higher, and your ending account value would be lower. In addition, the Fund, as a shareholder in the underlying Fidelity Central Funds, will indirectly bear its pro-rata share of the fees and expenses incurred by the underlying Fidelity Central Funds. These fees and expenses are not included in the Fund's annualized expense ratio used to calculate the expense estimate in the table below.
Please note that the expenses shown in the table are meant to highlight your ongoing costs only and do not reflect any transaction costs. Therefore, the second line of the table is useful in comparing ongoing costs only, and will not help you determine the relative total costs of owning different funds. In addition, if these transactional costs were included, your costs would have been higher.
| | Annualized Expense Ratio-A | Beginning
Account Value
July 1, 2016 | Ending
Account Value
December 31, 2016 | Expenses Paid
During Period-B
July 1, 2016
to December 31, 2016 |
| Initial Class | .68% | | | |
| Actual | | $1,000.00 | $944.10 | $3.32 |
| Hypothetical-C | | $1,000.00 | $1,021.72 | $3.46 |
| Investor Class | .76% | | | |
| Actual | | $1,000.00 | $944.30 | $3.71 |
| Hypothetical-C | | $1,000.00 | $1,021.32 | $3.86 |
A Annualized expense ratio reflects expenses net of applicable fee waivers.
B Expenses are equal to each Class' annualized expense ratio, multiplied by the average account value over the period, multiplied by 184/366 (to reflect the one-half year period).
C 5% return per year before expenses
Distributions (Unaudited)
The fund hereby designates as a capital gain dividend with respect to the taxable year ended December 31, 2016, $65,703, or, if subsequently determined to be different, the net capital gain of such year.
Initial Class designates 58% and Investor Class designates 59% of the dividends distributed during the fiscal year as qualifying for the dividends–received deduction for corporate shareholders.
VCSP-ANN-0217
1.850994.109
Fidelity® Variable Insurance Products: Utilities Portfolio
Annual Report December 31, 2016 |
|
Contents
To view a fund's proxy voting guidelines and proxy voting record for the 12-month period ended June 30, visit http://www.fidelity.com/proxyvotingresults or visit the Securities and Exchange Commission's (SEC) web site at http://www.sec.gov.
You may also call 1-877-208-0098 to request a free copy of the proxy voting guidelines.
Fidelity® Variable Insurance Products are separate account options which are purchased through a variable insurance contract.
Standard & Poor's, S&P and S&P 500 are registered service marks of The McGraw-Hill Companies, Inc. and have been licensed for use by Fidelity Distributors Corporation.
Other third-party marks appearing herein are the property of their respective owners.
All other marks appearing herein are registered or unregistered trademarks or service marks of FMR LLC or an affiliated company. © 2017 FMR LLC. All rights reserved.
This report and the financial statements contained herein are submitted for the general information of the shareholders of the Fund. This report is not authorized for distribution to prospective investors in the Fund unless preceded or accompanied by an effective prospectus.
A fund files its complete schedule of portfolio holdings with the SEC for the first and third quarters of each fiscal year on Form N-Q. Forms N-Q are available on the SEC’s web site at http://www.sec.gov. A fund's Forms N-Q may be reviewed and copied at the SEC’s Public Reference Room in Washington, DC. Information regarding the operation of the SEC's Public Reference Room may be obtained by calling 1-800-SEC-0330.
For a complete list of a fund's portfolio holdings, view the most recent holdings listing, semiannual report, or annual report on Fidelity's web site at http://www.fidelity.com, http://www.institutional.fidelity.com, or http://www.401k.com, as applicable.
NOT FDIC INSURED •MAY LOSE VALUE •NO BANK GUARANTEE
Neither the Fund nor Fidelity Distributors Corporation is a bank.
Performance: The Bottom Line
Average annual total return reflects the change in the value of an investment, assuming reinvestment of distributions from dividend income and capital gains (the profits earned upon the sale of securities that have grown in value, if any) and assuming a constant rate of performance each year. During periods of reimbursement by Fidelity, a fund’s total return will be greater than it would be had the reimbursement not occurred. Performance numbers are net of all underlying fund operating expenses, but do not include any insurance charges imposed by your insurance company’s separate account. If performance information included the effect of these additional charges, the total returns would have been lower. How a fund did yesterday is no guarantee of how it will do tomorrow.
Average Annual Total Returns
| For the periods ended December 31, 2016 | Past 1 year | Past 5 years | Past 10 years |
| Initial Class | 14.17% | 10.02% | 6.17% |
| Investor Class | 14.03% | 9.94% | 6.07% |
$10,000 Over 10 Years
Let's say hypothetically that $10,000 was invested in VIP Utilities Portfolio - Initial Class on December 31, 2006.
The chart shows how the value of your investment would have changed, and also shows how the S&P 500® Index performed over the same period.

| Period Ending Values |
| $18,202 | VIP Utilities Portfolio - Initial Class |
| $19,572 | S&P 500® Index |
Management's Discussion of Fund Performance
Market Recap: The S&P 500
® index returned 11.96% in 2016, rising sharply on post-election optimism for economic growth. The year began during a fairly volatile stretch, with stocks hampered by persistent oil-price weakness and U.S.-dollar strength. Markets regained momentum in February amid U.S. job gains, a rally in energy and other stimuli that helped keep the roughly seven-year uptrend intact. Markets tumbled briefly following the U.K.’s June 23 vote to exit the European Union – dubbed “Brexit” – then recovered quickly and settled into a flattish stretch until the November 8 U.S. presidential election. Stocks reacted to the outcome by reaching a series of all-time highs. For the year, energy (+27%) led the way amid two strong rallies in commodity prices, one in the spring and another in November. Telecommunication services (+23%) was close behind, as demand for dividend-paying equities was high early in the period. Cyclical sectors, including financials (+22%), industrials (+18%) and materials (+17%), also posted strong gains. Conversely, consumer staples (+5%) and consumer discretionary (+6%) lagged the index, the latter hurt as online competition continued to pressure brick-and-mortar retailers. Real estate (+3%) struggled due to expectations for rising interest rates, while health care (-2%) was hampered by an uncertain political and regulatory outlook.
Comments from Portfolio Manager Douglas Simmons: For the year, the fund’s share classes returned about 14%, underperforming the 17.62% return of the MSCI U.S. IMI Utilities 25/50 Index. However, the fund outpaced the broad-based S&P 500
®. Historically low interest rates bolstered demand for the utilities sector for much of the period, aiding the fund’s absolute return. However, the fund’s focus on companies increasing their dividends faster than the sector average did not keep up with the benchmark. Stock selection among independent power producers & energy traders detracted most from the fund’s results versus the MSCI index, with Calpine and Dynegy among the most significant individual detractors. These two companies do not pay a dividend and were heavily owned by energy companies that were forced to sell their holdings in these firms indiscriminately as the price of oil collapsed early in 2016. By period end, I reduced these two positions to invest in other opportunities. Our sizable position in electric utility Avangrid also detracted. At period end, Avangrid remained among our largest holdings, and we increased our stake this period at what we thought were attractive prices. Conversely, choices among electric utilities boosted the fund’s relative result, with the fund’s top two individual relative contributors, Exelon and Sothern Co., coming from this strong-performing group.
The views expressed above reflect those of the portfolio manager(s) only through the end of the period as stated on the cover of this report and do not necessarily represent the views of Fidelity or any other person in the Fidelity organization. Any such views are subject to change at any time based upon market or other conditions and Fidelity disclaims any responsibility to update such views. These views may not be relied on as investment advice and, because investment decisions for a Fidelity fund are based on numerous factors, may not be relied on as an indication of trading intent on behalf of any Fidelity fund.
Investment Summary (Unaudited)
Top Ten Stocks as of December 31, 2016
| | % of fund's net assets | % of fund's net assets 6 months ago |
| NextEra Energy, Inc. | 15.5 | 14.4 |
| Sempra Energy | 11.7 | 11.0 |
| PG&E Corp. | 8.3 | 7.7 |
| Dominion Resources, Inc. | 7.0 | 9.1 |
| Avangrid, Inc. | 5.3 | 5.2 |
| Exelon Corp. | 4.9 | 5.0 |
| DTE Energy Co. | 4.8 | 4.7 |
| FirstEnergy Corp. | 4.7 | 3.4 |
| CenterPoint Energy, Inc. | 4.1 | 1.8 |
| Great Plains Energy, Inc. | 4.0 | 0.0 |
| | 70.3 | |
Top Industries (% of fund's net assets)
| As of December 31, 2016 |
| | Electric Utilities | 48.1% |
| | Multi-Utilities | 39.3% |
| | Independent Power and Renewable Electricity Producers | 6.9% |
| | Media | 1.7% |
| | Gas Utilities | 1.3% |
| | All Others* | 2.7% |

* Includes short-term investments and net other assets (liabilities).
| As of June 30, 2016 |
| | Electric Utilities | 47.0% |
| | Multi-Utilities | 39.3% |
| | Independent Power and Renewable Electricity Producers | 7.4% |
| | Gas Utilities | 0.9% |
| | Oil, Gas & Consumable Fuels | 0.5% |
| | All Others* | 4.9% |

Prior period industry classifications reflect the categories in place as of the date indicated and have not been adjusted to reflect current industry classifications.
* Includes short-term investments and net other assets (liabilities).
Investments December 31, 2016
Showing Percentage of Net Assets
| Common Stocks - 98.0% | | | |
| | | Shares | Value |
| Electric Utilities - 48.1% | | | |
| Electric Utilities - 48.1% | | | |
| Edison International | | 55,877 | $4,022,585 |
| Exelon Corp. | | 170,971 | 6,067,761 |
| FirstEnergy Corp. | | 188,523 | 5,838,557 |
| Fortis, Inc. | | 51,981 | 1,605,173 |
| Great Plains Energy, Inc. | | 183,720 | 5,024,742 |
| NextEra Energy, Inc. | | 161,131 | 19,248,709 |
| OGE Energy Corp. | | 68,726 | 2,298,885 |
| PG&E Corp. | | 169,147 | 10,279,063 |
| PNM Resources, Inc. | | 87,100 | 2,987,530 |
| PPL Corp. | | 74,700 | 2,543,535 |
| | | | 59,916,540 |
| Gas Utilities - 1.3% | | | |
| Gas Utilities - 1.3% | | | |
| South Jersey Industries, Inc. | | 47,294 | 1,593,335 |
| Independent Power and Renewable Electricity Producers - 6.9% | | | |
| Independent Power Producers & Energy Traders - 3.4% | | | |
| Calpine Corp. (a) | | 52,134 | 595,892 |
| Dynegy, Inc. (a) | | 102,439 | 866,634 |
| NRG Energy, Inc. | | 88,099 | 1,080,094 |
| NRG Yield, Inc. Class C | | 110,299 | 1,742,724 |
| | | | 4,285,344 |
| Renewable Electricity - 3.5% | | | |
| NextEra Energy Partners LP | | 96,796 | 2,472,170 |
| Pattern Energy Group, Inc. | | 95,953 | 1,822,147 |
| | | | 4,294,317 |
|
| TOTAL INDEPENDENT POWER AND RENEWABLE ELECTRICITY PRODUCERS | | | 8,579,661 |
|
| Media - 1.7% | | | |
| Cable & Satellite - 1.7% | | | |
| Charter Communications, Inc. Class A (a) | | 7,220 | 2,078,782 |
| Multi-Utilities - 39.3% | | | |
| Multi-Utilities - 39.3% | | | |
| Avangrid, Inc. | | 175,910 | 6,663,471 |
| Black Hills Corp. | | 53,915 | 3,307,146 |
| CenterPoint Energy, Inc. | | 207,968 | 5,124,332 |
| Dominion Resources, Inc. | | 114,135 | 8,741,600 |
| DTE Energy Co. | | 61,211 | 6,029,896 |
| SCANA Corp. | | 62,272 | 4,563,292 |
| Sempra Energy | | 144,681 | 14,560,696 |
| | | | 48,990,433 |
| Oil, Gas & Consumable Fuels - 0.7% | | | |
| Oil & Gas Storage & Transport - 0.7% | | | |
| Cheniere Energy Partners LP Holdings LLC | | 41,900 | 937,303 |
| TOTAL COMMON STOCKS | | | |
| (Cost $107,580,563) | | | 122,096,054 |
|
| Money Market Funds - 0.9% | | | |
| Fidelity Cash Central Fund, 0.60% (b) | | | |
| (Cost $1,064,156) | | 1,063,944 | 1,064,156 |
| TOTAL INVESTMENT PORTFOLIO - 98.9% | | | |
| (Cost $108,644,719) | | | 123,160,210 |
| NET OTHER ASSETS (LIABILITIES) - 1.1% | | | 1,393,936 |
| NET ASSETS - 100% | | | $124,554,146 |
Legend
(a) Non-income producing
(b) Affiliated fund that is generally available only to investment companies and other accounts managed by Fidelity Investments. The rate quoted is the annualized seven-day yield of the fund at period end. A complete unaudited listing of the fund's holdings as of its most recent quarter end is available upon request. In addition, each Fidelity Central Fund's financial statements, which are not covered by the Fund's Report of Independent Registered Public Accounting Firm, are available on the SEC's website or upon request.
Affiliated Central Funds
Information regarding fiscal year to date income earned by the Fund from investments in Fidelity Central Funds is as follows:
| Fund | Income earned |
| Fidelity Cash Central Fund | $18,090 |
| Fidelity Securities Lending Cash Central Fund | 8,860 |
| Total | $26,950 |
Investment Valuation
All investments are categorized as Level 1 under the Fair Value Hierarchy. The inputs or methodology used for valuing securities may not be an indication of the risk associated with investing in those securities. For more information on valuation inputs please refer to the Investment Valuation section in the accompanying Notes to Financial Statements.
See accompanying notes which are an integral part of the financial statements.
Financial Statements
Statement of Assets and Liabilities
| | | December 31, 2016 |
| Assets | | |
Investment in securities, at value — See accompanying schedule:
Unaffiliated issuers (cost $107,580,563) | $122,096,054 | |
| Fidelity Central Funds (cost $1,064,156) | 1,064,156 | |
| Total Investments (cost $108,644,719) | | $123,160,210 |
| Receivable for investments sold | | 1,006,591 |
| Receivable for fund shares sold | | 33,446 |
| Dividends receivable | | 459,909 |
| Distributions receivable from Fidelity Central Funds | | 501 |
| Prepaid expenses | | 817 |
| Other receivables | | 6,918 |
| Total assets | | 124,668,392 |
| Liabilities | | |
| Payable for fund shares redeemed | $91 | |
| Accrued management fee | 56,656 | |
| Transfer agent fee payable | 13,497 | |
| Audit payable | 33,724 | |
| Custodian fee payable | 6,253 | |
| Other affiliated payables | 4,025 | |
| Total liabilities | | 114,246 |
| Net Assets | | $124,554,146 |
| Net Assets consist of: | | |
| Paid in capital | | $111,580,591 |
| Undistributed net investment income | | 676,171 |
| Accumulated undistributed net realized gain (loss) on investments and foreign currency transactions | | (2,217,941) |
| Net unrealized appreciation (depreciation) on investments and assets and liabilities in foreign currencies | | 14,515,325 |
| Net Assets | | $124,554,146 |
| Initial Class: | | |
| Net Asset Value, offering price and redemption price per share ($26,193,941 ÷ 1,807,880 shares) | | $14.49 |
| Investor Class: | | |
| Net Asset Value, offering price and redemption price per share ($98,360,205 ÷ 6,825,904 shares) | | $14.41 |
See accompanying notes which are an integral part of the financial statements.
Statement of Operations
| | | Year ended December 31, 2016 |
| Investment Income | | |
| Dividends | | $3,808,598 |
| Income from Fidelity Central Funds | | 26,950 |
| Total income | | 3,835,548 |
| Expenses | | |
| Management fee | $699,697 | |
| Transfer agent fees | 161,478 | |
| Accounting and security lending fees | 50,072 | |
| Custodian fees and expenses | 13,247 | |
| Independent trustees' fees and expenses | 2,632 | |
| Audit | 41,218 | |
| Legal | 1,876 | |
| Interest | 532 | |
| Miscellaneous | 1,513 | |
| Total expenses before reductions | 972,265 | |
| Expense reductions | (13,371) | 958,894 |
| Net investment income (loss) | | 2,876,654 |
| Realized and Unrealized Gain (Loss) | | |
| Net realized gain (loss) on: | | |
| Investment securities: | | |
| Unaffiliated issuers | (1,375,874) | |
| Fidelity Central Funds | 307 | |
| Foreign currency transactions | (1,601) | |
| Total net realized gain (loss) | | (1,377,168) |
Change in net unrealized appreciation (depreciation) on:
Investment securities | 10,056,658 | |
| Assets and liabilities in foreign currencies | (64) | |
| Total change in net unrealized appreciation (depreciation) | | 10,056,594 |
| Net gain (loss) | | 8,679,426 |
| Net increase (decrease) in net assets resulting from operations | | $11,556,080 |
See accompanying notes which are an integral part of the financial statements.
Statement of Changes in Net Assets
| | Year ended December 31, 2016 | Year ended December 31, 2015 |
| Increase (Decrease) in Net Assets | | |
| Operations | | |
| Net investment income (loss) | $2,876,654 | $2,111,168 |
| Net realized gain (loss) | (1,377,168) | 1,363,662 |
| Change in net unrealized appreciation (depreciation) | 10,056,594 | (15,607,631) |
| Net increase (decrease) in net assets resulting from operations | 11,556,080 | (12,132,801) |
| Distributions to shareholders from net investment income | (2,188,643) | (1,900,414) |
| Distributions to shareholders from net realized gain | (1,735,380) | (3,942,558) |
| Total distributions | (3,924,023) | (5,842,972) |
| Share transactions - net increase (decrease) | 37,214,122 | (35,269,674) |
| Redemption fees | 103,806 | 33,598 |
| Total increase (decrease) in net assets | 44,949,985 | (53,211,849) |
| Net Assets | | |
| Beginning of period | 79,604,161 | 132,816,010 |
| End of period | $124,554,146 | $79,604,161 |
| Other Information | | |
| Undistributed net investment income end of period | $676,171 | $– |
See accompanying notes which are an integral part of the financial statements.
Financial Highlights — VIP Utilities Portfolio Initial Class
| Years ended December 31, | 2016 | 2015 | 2014 | 2013 | 2012 |
| Selected Per–Share Data | | | | | |
| Net asset value, beginning of period | $13.17 | $15.62 | $13.45 | $11.41 | $10.93 |
| Income from Investment Operations | | | | | |
| Net investment income (loss)A | .34 | .31 | .31 | .32 | .29 |
| Net realized and unrealized gain (loss) | 1.49 | (1.98) | 2.63 | 2.06 | .51 |
| Total from investment operations | 1.83 | (1.67) | 2.94 | 2.38 | .80 |
| Distributions from net investment income | (.26) | (.33)B | (.27) | (.35) | (.32) |
| Distributions from net realized gain | (.25) | (.45)B | (.51) | – | (.01) |
| Total distributions | (.52)C | (.78) | (.77)D | (.35) | (.33) |
| Redemption fees added to paid in capitalA | .01 | –E | –E | .01 | .01 |
| Net asset value, end of period | $14.49 | $13.17 | $15.62 | $13.45 | $11.41 |
| Total ReturnF,G | 14.17% | (10.78)% | 21.77% | 21.02% | 7.40% |
| Ratios to Average Net AssetsH,I | | | | | |
| Expenses before reductions | .70% | .71% | .70% | .74% | .74% |
| Expenses net of fee waivers, if any | .70% | .71% | .70% | .73% | .74% |
| Expenses net of all reductions | .69% | .70% | .69% | .71% | .71% |
| Net investment income (loss) | 2.30% | 2.17% | 2.01% | 2.44% | 2.59% |
| Supplemental Data | | | | | |
| Net assets, end of period (000 omitted) | $26,194 | $21,960 | $36,599 | $25,824 | $25,947 |
| Portfolio turnover rateJ | 83% | 88% | 113% | 156% | 181% |
A Calculated based on average shares outstanding during the period.
B The amounts shown reflect certain reclassifications related to book to tax differences that were made in the year shown.
C Total distributions of $.52 per share is comprised of distributions from net investment income of $.263 and distributions from net realized gain of $.253 per share.
D Total distributions of $.77 per share is comprised of distributions from net investment income of $.267 and distributions from net realized gain of $.506 per share.
E Amount represents less than $.005 per share.
F Total returns do not reflect charges attributable to your insurance company's separate account. Inclusion of these charges would reduce the total returns shown.
G Total returns would have been lower if certain expenses had not been reduced during the applicable periods shown.
H Fees and expenses of any underlying Fidelity Central Funds are not included in the Fund's expense ratio. The Fund indirectly bears its proportionate share of the expenses of any underlying Fidelity Central Funds.
I Expense ratios reflect operating expenses of the class. Expenses before reductions do not reflect amounts reimbursed by the investment adviser or reductions from brokerage service arrangements or reductions from other expense offset arrangements and do not represent the amount paid by the class during periods when reimbursements or reductions occur. Expenses net of fee waivers reflect expenses after reimbursement by the investment adviser but prior to reductions from brokerage service arrangements or other expense offset arrangements. Expenses net of all reductions represent the net expenses paid by the class.
J Amount does not include the portfolio activity of any underlying Fidelity Central Funds.
See accompanying notes which are an integral part of the financial statements.
Financial Highlights — VIP Utilities Portfolio Investor Class
| Years ended December 31, | 2016 | 2015 | 2014 | 2013 | 2012 |
| Selected Per–Share Data | | | | | |
| Net asset value, beginning of period | $13.11 | $15.54 | $13.39 | $11.36 | $10.88 |
| Income from Investment Operations | | | | | |
| Net investment income (loss)A | .32 | .30 | .29 | .30 | .28 |
| Net realized and unrealized gain (loss) | 1.48 | (1.96) | 2.62 | 2.06 | .51 |
| Total from investment operations | 1.80 | (1.66) | 2.91 | 2.36 | .79 |
| Distributions from net investment income | (.26) | (.31)B | (.26) | (.34) | (.31) |
| Distributions from net realized gain | (.25) | (.45)B | (.51) | – | (.01) |
| Total distributions | (.51) | (.77)C | (.76)D | (.34) | (.32) |
| Redemption fees added to paid in capitalA | .01 | –E | –E | .01 | .01 |
| Net asset value, end of period | $14.41 | $13.11 | $15.54 | $13.39 | $11.36 |
| Total ReturnF,G | 14.03% | (10.80)% | 21.64% | 20.92% | 7.36% |
| Ratios to Average Net AssetsH,I | | | | | |
| Expenses before reductions | .78% | .79% | .78% | .82% | .82% |
| Expenses net of fee waivers, if any | .78% | .79% | .78% | .81% | .82% |
| Expenses net of all reductions | .77% | .78% | .77% | .79% | .79% |
| Net investment income (loss) | 2.22% | 2.09% | 1.93% | 2.36% | 2.50% |
| Supplemental Data | | | | | |
| Net assets, end of period (000 omitted) | $98,360 | $57,645 | $96,217 | $51,308 | $42,271 |
| Portfolio turnover rateJ | 83% | 88% | 113% | 156% | 181% |
A Calculated based on average shares outstanding during the period.
B The amounts shown reflect certain reclassifications related to book to tax differences that were made in the year shown.
C Total distributions of $.77 per share is comprised of distributions from net investment income of $.314 and distributions from net realized gain of $.454 per share.
D Total distributions of $.76 per share is comprised of distributions from net investment income of $.257 and distributions from net realized gain of $.506 per share.
E Amount represents less than $.005 per share.
F Total returns do not reflect charges attributable to your insurance company's separate account. Inclusion of these charges would reduce the total returns shown.
G Total returns would have been lower if certain expenses had not been reduced during the applicable periods shown.
H Fees and expenses of any underlying Fidelity Central Funds are not included in the Fund's expense ratio. The Fund indirectly bears its proportionate share of the expenses of any underlying Fidelity Central Funds.
I Expense ratios reflect operating expenses of the class. Expenses before reductions do not reflect amounts reimbursed by the investment adviser or reductions from brokerage service arrangements or reductions from other expense offset arrangements and do not represent the amount paid by the class during periods when reimbursements or reductions occur. Expenses net of fee waivers reflect expenses after reimbursement by the investment adviser but prior to reductions from brokerage service arrangements or other expense offset arrangements. Expenses net of all reductions represent the net expenses paid by the class.
J Amount does not include the portfolio activity of any underlying Fidelity Central Funds.
See accompanying notes which are an integral part of the financial statements.
Notes to Financial Statements
For the period ended December 31, 2016
1. Organization.
VIP Utilities Portfolio (the Fund) is a non-diversified fund of Variable Insurance Products Fund IV (the Trust) and is authorized to issue an unlimited number of shares. The Trust is registered under the Investment Company Act of 1940, as amended (the 1940 Act), as an open-end management investment company organized as a Massachusetts business trust. Shares of the Fund may only be purchased by insurance companies for the purpose of funding variable annuity or variable life insurance contracts. The Fund offers the following classes of shares: Initial Class shares and Investor Class shares. All classes have equal rights and voting privileges, except for matters affecting a single class.
2. Investments in Fidelity Central Funds.
The Fund invests in Fidelity Central Funds, which are open-end investment companies generally available only to other investment companies and accounts managed by the investment adviser and its affiliates. The Fund's Schedule of Investments lists each of the Fidelity Central Funds held as of period end, if any, as an investment of the Fund, but does not include the underlying holdings of each Fidelity Central Fund. As an Investing Fund, the Fund indirectly bears its proportionate share of the expenses of the underlying Fidelity Central Funds.
The Money Market Central Funds seek preservation of capital and current income and are managed by Fidelity Investments Money Management, Inc. (FIMM), an affiliate of the investment adviser. Annualized expenses of the Money Market Central Funds as of their most recent shareholder report date are less than .005%.
A complete unaudited list of holdings for each Fidelity Central Fund is available upon request or at the Securities and Exchange Commission (the SEC) website at www.sec.gov. In addition, the financial statements of the Fidelity Central Funds, which are not covered by the Fund's Report of Independent Registered Public Accounting Firm, are available on the SEC website or upon request.
3. Significant Accounting Policies.
The financial statements have been prepared in conformity with accounting principles generally accepted in the United States of America (GAAP), which require management to make certain estimates and assumptions at the date of the financial statements. Actual results could differ from those estimates. Subsequent events, if any, through the date that the financial statements were issued have been evaluated in the preparation of the financial statements. The following summarizes the significant accounting policies of the Fund:
Investment Valuation. Investments are valued as of 4:00 p.m. Eastern time on the last calendar day of the period. The Board of Trustees (the Board) has delegated the day to day responsibility for the valuation of the Fund's investments to the Fair Value Committee (the Committee) established by the Fund's investment adviser. In accordance with valuation policies and procedures approved by the Board, the Fund attempts to obtain prices from one or more third party pricing vendors or brokers to value its investments. When current market prices, quotations or currency exchange rates are not readily available or reliable, investments will be fair valued in good faith by the Committee, in accordance with procedures adopted by the Board. Factors used in determining fair value vary by investment type and may include market or investment specific events. The frequency with which these procedures are used cannot be predicted and they may be utilized to a significant extent. The Committee oversees the Fund's valuation policies and procedures and reports to the Board on the Committee's activities and fair value determinations. The Board monitors the appropriateness of the procedures used in valuing the Fund's investments and ratifies the fair value determinations of the Committee.
The Fund categorizes the inputs to valuation techniques used to value its investments into a disclosure hierarchy consisting of three levels as shown below:
- Level 1 – quoted prices in active markets for identical investments
- Level 2 – other significant observable inputs (including quoted prices for similar investments, interest rates, prepayment speeds, etc.)
- Level 3 – unobservable inputs (including the Fund's own assumptions based on the best information available)
Valuation techniques used to value the Fund's investments by major category are as follows:
Equity securities, including restricted securities, for which market quotations are readily available, are valued at the last reported sale price or official closing price as reported by a third party pricing vendor on the primary market or exchange on which they are traded and are categorized as Level 1 in the hierarchy. In the event there were no sales during the day or closing prices are not available, securities are valued at the last quoted bid price or may be valued using the last available price and are generally categorized as Level 2 in the hierarchy. For foreign equity securities, when market or security specific events arise, comparisons to the valuation of American Depositary Receipts (ADRs), futures contracts, Exchange-Traded Funds (ETFs) and certain indexes as well as quoted prices for similar securities may be used and would be categorized as Level 2 in the hierarchy. Utilizing these techniques may result in transfers between Level 1 and Level 2. For equity securities, including restricted securities, where observable inputs are limited, assumptions about market activity and risk are used and these securities may be categorized as Level 3 in the hierarchy.
Investments in open-end mutual funds, including the Fidelity Central Funds, are valued at their closing net asset value (NAV) each business day and are categorized as Level 1 in the hierarchy.
Changes in valuation techniques may result in transfers in or out of an assigned level within the disclosure hierarchy.
Foreign Currency. The Fund may use foreign currency contracts to facilitate transactions in foreign-denominated securities. Gains and losses from these transactions may arise from changes in the value of the foreign currency or if the counterparties do not perform under the contracts' terms.
Foreign-denominated assets, including investment securities, and liabilities are translated into U.S. dollars at the exchange rates at period end. Purchases and sales of investment securities, income and dividends received and expenses denominated in foreign currencies are translated into U.S. dollars at the exchange rate in effect on the transaction date.
The effects of exchange rate fluctuations on investments are included with the net realized and unrealized gain (loss) on investment securities. Other foreign currency transactions resulting in realized and unrealized gain (loss) are disclosed separately.
Investment Transactions and Income. For financial reporting purposes, the Fund's investment holdings and NAV include trades executed through the end of the last business day of the period. The NAV per share for processing shareholder transactions is calculated as of the close of business of the New York Stock Exchange (NYSE), normally 4:00 p.m. Eastern time and includes trades executed through the end of the prior business day. Gains and losses on securities sold are determined on the basis of identified cost and may include proceeds received from litigation. Dividend income is recorded on the ex-dividend date, except for certain dividends from foreign securities where the ex-dividend date may have passed, which are recorded as soon as the Fund is informed of the ex-dividend date. Non-cash dividends included in dividend income, if any, are recorded at the fair market value of the securities received. Income and capital gain distributions from Fidelity Central Funds, if any, are recorded on the ex-dividend date. Certain distributions received by the Fund represent a return of capital or capital gain. The Fund determines the components of these distributions subsequent to the ex-dividend date, based upon receipt of tax filings or other correspondence relating to the underlying investment. These distributions are recorded as a reduction of cost of investments and/or as a realized gain. Investment income is recorded net of foreign taxes withheld where recovery of such taxes is uncertain.
Class Allocations and Expenses. Investment income, realized and unrealized capital gains and losses, common expenses of the Fund, and certain fund-level expense reductions, if any, are allocated daily on a pro-rata basis to each class based on the relative net assets of each class to the total net assets of the Fund. Each class differs with respect to transfer agent fees incurred. Certain expense reductions may also differ by class. For the reporting period, the allocated portion of income and expenses to each class as a percent of its average net assets may vary due to the timing of recording these transactions in relation to fluctuating net assets of the classes. Expenses directly attributable to a fund are charged to that fund. Expenses attributable to more than one fund are allocated among the respective funds on the basis of relative net assets or other appropriate methods. Expense estimates are accrued in the period to which they relate and adjustments are made when actual amounts are known.
Income Tax Information and Distributions to Shareholders. Each year, the Fund intends to qualify as a regulated investment company under Subchapter M of the Internal Revenue Code, including distributing substantially all of its taxable income and realized gains. As a result, no provision for U.S. Federal income taxes is required. As of December 31, 2016, the Fund did not have any unrecognized tax benefits in the financial statements; nor is the Fund aware of any tax positions for which it is reasonably possible that the total amounts of unrecognized tax benefits will significantly change in the next twelve months. The Fund files a U.S. federal tax return, in addition to state and local tax returns as required. The Fund's federal income tax returns are subject to examination by the Internal Revenue Service (IRS) for a period of three fiscal years after they are filed. State and local tax returns may be subject to examination for an additional fiscal year depending on the jurisdiction. Foreign taxes are provided for based on the Fund's understanding of the tax rules and rates that exist in the foreign markets in which it invests.
Distributions are declared and recorded on the ex-dividend date. Income dividends and capital gain distributions are declared separately for each class. Income and capital gain distributions are determined in accordance with income tax regulations, which may differ from GAAP.
Capital accounts within the financial statements are adjusted for permanent book-tax differences. These adjustments have no impact on net assets or the results of operations. Capital accounts are not adjusted for temporary book-tax differences which will reverse in a subsequent period.
Book-tax differences are primarily due to foreign currency transactions, capital loss carryforwards and losses deferred due to wash sales.
The federal tax cost of investment securities and unrealized appreciation (depreciation) as of period end were as follows:
| Gross unrealized appreciation | $16,872,775 |
| Gross unrealized depreciation | (2,834,953) |
| Net unrealized appreciation (depreciation) on securities | $14,037,822 |
| Tax Cost | $109,122,388 |
The tax-based components of distributable earnings as of period end were as follows:
| Undistributed ordinary income | $676,173 |
| Capital loss carryforward | $(1,740,273) |
| Net unrealized appreciation (depreciation) on securities and other investments | $14,037,656 |
Capital loss carryforwards are only available to offset future capital gains of the Fund to the extent provided by regulations and may be limited. Under the Regulated Investment Company Modernization Act of 2010 (the Act), the Fund is permitted to carry forward capital losses incurred in taxable years beginning after December 22, 2010 for an unlimited period and such capital losses are required to be used prior to any losses that expire. The capital loss carryforward information presented below, including any applicable limitation, is estimated as of fiscal period end and is subject to adjustment.
| No expiration | |
| Short-term | $(1,683,910) |
| Long-term | (56,363) |
| Total capital loss carryforward | $(1,740,273) |
The tax character of distributions paid was as follows:
| | December 31, 2016 | December 31, 2015 |
| Ordinary Income | $2,188,643 | $ 1,900,414 |
| Long-term Capital Gains | 1,735,380 | 3,942,558 |
| Total | $3,924,023 | $ 5,842,972 |
Trading (Redemption) Fees. Shares held by investors less than 60 days may be subject to a redemption fee equal to 1% of the NAV of shares redeemed. All redemption fees, which reduce the proceeds of the shareholder redemption, are retained by the Fund and accounted for as an addition to paid in capital.
4. Purchases and Sales of Investments.
Purchases and sales of securities, other than short-term securities, aggregated $136,974,418 and $102,606,140, respectively.
5. Fees and Other Transactions with Affiliates.
Management Fee. Fidelity SelectCo, LLC (the investment adviser) and its affiliates provide the Fund with investment management related services for which the Fund pays a monthly management fee. The management fee is the sum of an individual fund fee rate that is based on an annual rate of .30% of the Fund's average net assets and an annualized group fee rate that averaged .25% during the period. The group fee rate is based upon the average net assets of all the mutual funds advised by Fidelity Management & Research Company (FMR) and the investment adviser. The group fee rate decreases as assets under management increase and increases as assets under management decrease. For the reporting period, the total annual management fee rate was .55% of the Fund's average net assets.
Transfer Agent Fees. Fidelity Investments Institutional Operations Company, Inc. (FIIOC), an affiliate of the investment adviser, is the Fund's transfer, dividend disbursing, and shareholder servicing agent. FIIOC receives an asset-based fee with respect to each class. Each class (with the exception of Investor Class) pays a fee for transfer agent services, typesetting, and printing and mailing of shareholder reports, excluding mailing of proxy statements, equal to an annual rate of .07% (.15% for Investor Class) of class-level average net assets. For the period, transfer agent fees for each class were as follows:
| Initial Class | $21,338 |
| Investor Class | 140,140 |
| | $161,478 |
Accounting and Security Lending Fees. Fidelity Service Company, Inc. (FSC), an affiliate of the investment adviser, maintains the Fund's accounting records. The accounting fee is based on the level of average net assets for each month. Under a separate contract, FSC administers the security lending program. The security lending fee is based on the number and duration of lending transactions.
Brokerage Commissions. The Fund placed a portion of its portfolio transactions with brokerage firms which are affiliates of the investment adviser. Brokerage commissions are included in net realized gain (loss) and change in net unrealized appreciation (depreciation) in the Statement of Operations. The commissions paid to these affiliated firms were $3,568 for the period.
Interfund Lending Program. Pursuant to an Exemptive Order issued by the SEC, the Fund, along with other registered investment companies having management contracts with Fidelity Management & Research Company (FMR) or other affiliated entities of FMR, may participate in an interfund lending program. This program provides an alternative credit facility allowing the funds to borrow from, or lend money to, other participating affiliated funds. At period end, there were no interfund loans outstanding. The Fund's activity in this program during the period for which loans were outstanding was as follows:
| Borrower or Lender | Average Loan Balance | Weighted Average Interest Rate | Interest Expense |
| Borrower | $8,218,250 | .58% | $532 |
Interfund Trades. The Fund may purchase from or sell securities to other Fidelity Funds under procedures adopted by the Board. The procedures have been designed to ensure these interfund trades are executed in accordance with Rule 17a-7 of the 1940 Act. Interfund trades are included within the respective purchases and sales amounts shown in the Purchases and Sales of Investments note.
6. Committed Line of Credit.
The Fund participates with other funds managed by the investment adviser or an affiliate in a $4.25 billion credit facility (the "line of credit") to be utilized for temporary or emergency purposes to fund shareholder redemptions or for other short-term liquidity purposes. The Fund has agreed to pay commitment fees on its pro-rata portion of the line of credit, which amounted to $315 and is reflected in Miscellaneous expenses on the Statement of Operations. During the period, the Fund did not borrow on this line of credit.
7. Security Lending.
The Fund lends portfolio securities through a lending agent from time to time in order to earn additional income. On the settlement date of the loan, the Fund receives collateral (in the form of U.S. Treasury obligations, letters of credit and/or cash) against the loaned securities and maintains collateral in an amount not less than 100% of the market value of the loaned securities during the period of the loan. The market value of the loaned securities is determined at the close of business of the Fund and any additional required collateral is delivered to the Fund on the next business day. The Fund or borrower may terminate the loan at any time, and if the borrower defaults on its obligation to return the securities loaned because of insolvency or other reasons, the Fund may apply collateral received from the borrower against the obligation. The Fund may experience delays and costs in recovering the securities loaned. Any cash collateral received is invested in the Fidelity Securities Lending Cash Central Fund. At period end, there were no security loans outstanding. Security lending income represents the income earned on investing cash collateral, less rebates paid to borrowers and any lending agent fees associated with the loan, plus any premium payments received for lending certain types of securities. Security lending income is presented in the Statement of Operations as a component of income from Fidelity Central Funds. Total security lending income during the period amounted to $8,860.
8. Expense Reductions.
Commissions paid to certain brokers with whom the investment adviser, or its affiliates, places trades on behalf of the Fund include an amount in addition to trade execution, which may be rebated back to the Fund to offset certain expenses. This amount totaled $12,795 for the period.
Through arrangements with the Fund's custodian and each class' transfer agent, credits realized as a result of certain uninvested cash balances were used to reduce the Fund's expenses. During the period, these credits reduced the Fund's custody expenses by $13.
In addition, the investment adviser reimbursed and/or waived a portion of fund-level operating expenses in the amount of $563.
9. Distributions to Shareholders.
Distributions to shareholders of each class were as follows:
| | Year ended
December 31, 2016 | Year ended December 31, 2015 |
| From net investment income | | |
| Initial Class | $473,942 | $538,338 |
| Investor Class | 1,714,701 | 1,362,076 |
| Total | $2,188,643 | $1,900,414 |
| From net realized gain | | |
| Initial Class | $470,790 | $1,070,343 |
| Investor Class | 1,264,590 | 2,872,215 |
| Total | $1,735,380 | $3,942,558 |
10. Share Transactions.
Transactions for each class of shares were as follows:
| | Shares | Shares | Dollars | Dollars |
| | Year ended December 31, 2016 | Year ended December 31, 2015 | Year ended December 31, 2016 | Year ended December 31, 2015 |
| Initial Class | | | | |
| Shares sold | 1,560,739 | 216,532 | $22,897,589 | $3,268,091 |
| Reinvestment of distributions | 68,510 | 115,760 | 944,732 | 1,608,681 |
| Shares redeemed | (1,488,181) | (1,009,319) | (21,844,831) | (14,602,864) |
| Net increase (decrease) | 141,068 | (677,027) | $1,997,490 | $(9,726,092) |
| Investor Class | | | | |
| Shares sold | 4,383,728 | 756,021 | $63,843,246 | $11,154,388 |
| Reinvestment of distributions | 215,675 | 305,398 | 2,979,291 | 4,234,291 |
| Shares redeemed | (2,170,596) | (2,856,599) | (31,605,905) | (40,932,261) |
| Net increase (decrease) | 2,428,807 | (1,795,180) | $35,216,632 | $(25,543,582) |
11. Other.
The Fund's organizational documents provide former and current trustees and officers with a limited indemnification against liabilities arising in connection with the performance of their duties to the Fund. In the normal course of business, the Fund may also enter into contracts that provide general indemnifications. The Fund's maximum exposure under these arrangements is unknown as this would be dependent on future claims that may be made against the Fund. The risk of material loss from such claims is considered remote.
At the end of the period, the investment adviser or its affiliates were the owners of record of 100% of the total outstanding shares of the fund.
Report of Independent Registered Public Accounting Firm
To the Trustees of Variable Insurance Products Fund IV and Shareholders of VIP Utilities Portfolio:
In our opinion, the accompanying statement of assets and liabilities, including the schedule of investments, and the related statements of operations and of changes in net assets and the financial highlights present fairly, in all material respects, the financial position of VIP Utilities Portfolio (a fund of Variable Insurance Products Fund IV) (the "Fund") as of December 31, 2016, the results of its operations for the year then ended, the changes in its net assets for each of the two years in the period then ended and the financial highlights for each of the five years in the period then ended, in conformity with accounting principles generally accepted in the United States of America. These financial statements and financial highlights (hereafter referred to as “financial statements”) are the responsibility of the Fund's management. Our responsibility is to express an opinion on these financial statements based on our audits. We conducted our audits of these financial statements in accordance with the standards of the Public Company Accounting Oversight Board (United States). Those standards require that we plan and perform the audit to obtain reasonable assurance about whether the financial statements are free of material misstatement. An audit includes examining, on a test basis, evidence supporting the amounts and disclosures in the financial statements, assessing the accounting principles used and significant estimates made by management, and evaluating the overall financial statement presentation. We believe that our audits, which included confirmation of securities as of December 31, 2016 by correspondence with the custodian and brokers, provide a reasonable basis for our opinion.
PricewaterhouseCoopers LLP
Boston, Massachusetts
February 16, 2017
Trustees and Officers
The Trustees, Members of the Advisory Board (if any), and officers of the trust and fund, as applicable, are listed below. The Board of Trustees governs the fund and is responsible for protecting the interests of shareholders. The Trustees are experienced executives who meet periodically throughout the year to oversee the fund's activities, review contractual arrangements with companies that provide services to the fund, oversee management of the risks associated with such activities and contractual arrangements, and review the fund's performance. Each of the Trustees oversees 83 funds.
The Trustees hold office without limit in time except that (a) any Trustee may resign; (b) any Trustee may be removed by written instrument, signed by at least two-thirds of the number of Trustees prior to such removal; (c) any Trustee who requests to be retired or who has become incapacitated by illness or injury may be retired by written instrument signed by a majority of the other Trustees; and (d) any Trustee may be removed at any special meeting of shareholders by a two-thirds vote of the outstanding voting securities of the trust. Each Trustee who is not an interested person (as defined in the 1940 Act) of the trust and the fund is referred to herein as an Independent Trustee. Each Independent Trustee shall retire not later than the last day of the calendar year in which his or her 75th birthday occurs. The Independent Trustees may waive this mandatory retirement age policy with respect to individual Trustees. Officers and Advisory Board Members hold office without limit in time, except that any officer or Advisory Board Member may resign or may be removed by a vote of a majority of the Trustees at any regular meeting or any special meeting of the Trustees. Except as indicated, each individual has held the office shown or other offices in the same company for the past five years.
The fund’s Statement of Additional Information (SAI) includes more information about the Trustees. To request a free copy, call Fidelity at 1-877-208-0098.
Experience, Skills, Attributes, and Qualifications of the Trustees. The Governance and Nominating Committee has adopted a statement of policy that describes the experience, qualifications, attributes, and skills that are necessary and desirable for potential Independent Trustee candidates (Statement of Policy). The Board believes that each Trustee satisfied at the time he or she was initially elected or appointed a Trustee, and continues to satisfy, the standards contemplated by the Statement of Policy. The Governance and Nominating Committee also engages professional search firms to help identify potential Independent Trustee candidates who have the experience, qualifications, attributes, and skills consistent with the Statement of Policy. From time to time, additional criteria based on the composition and skills of the current Independent Trustees, as well as experience or skills that may be appropriate in light of future changes to board composition, business conditions, and regulatory or other developments, have also been considered by the professional search firms and the Governance and Nominating Committee. In addition, the Board takes into account the Trustees' commitment and participation in Board and committee meetings, as well as their leadership of standing and ad hoc committees throughout their tenure.
In determining that a particular Trustee was and continues to be qualified to serve as a Trustee, the Board has considered a variety of criteria, none of which, in isolation, was controlling. The Board believes that, collectively, the Trustees have balanced and diverse experience, qualifications, attributes, and skills, which allow the Board to operate effectively in governing the fund and protecting the interests of shareholders. Information about the specific experience, skills, attributes, and qualifications of each Trustee, which in each case led to the Board's conclusion that the Trustee should serve (or continue to serve) as a trustee of the fund, is provided below.
Board Structure and Oversight Function. Brian B. Hogan is an interested person and currently serves as Chairman. The Trustees have determined that an interested Chairman is appropriate and benefits shareholders because an interested Chairman has a personal and professional stake in the quality and continuity of services provided to the fund. Independent Trustees exercise their informed business judgment to appoint an individual of their choosing to serve as Chairman, regardless of whether the Trustee happens to be independent or a member of management. The Independent Trustees have determined that they can act independently and effectively without having an Independent Trustee serve as Chairman and that a key structural component for assuring that they are in a position to do so is for the Independent Trustees to constitute a substantial majority for the Board. The Independent Trustees also regularly meet in executive session. Michael E. Wiley serves as Chairman of the Independent Trustees and as such (i) acts as a liaison between the Independent Trustees and management with respect to matters important to the Independent Trustees and (ii) with management prepares agendas for Board meetings.
Fidelity® funds are overseen by different Boards of Trustees. The fund's Board oversees Fidelity's sector portfolios. Other Boards oversee Fidelity's equity and high income funds, and Fidelity's investment grade bond, money market, and asset allocation funds. The use of separate Boards, each with its own committee structure, allows the Trustees of each group of Fidelity® funds to focus on the unique issues of the funds they oversee, including common research, investment, and operational issues. On occasion, the separate Boards establish joint committees to address issues of overlapping consequences for the Fidelity® funds overseen by each Board.
The Trustees operate using a system of committees to facilitate the timely and efficient consideration of all matters of importance to the Trustees, the fund, and fund shareholders and to facilitate compliance with legal and regulatory requirements and oversight of the fund's activities and associated risks. The Board, acting through its committees, has charged SelectCo and its affiliates with (i) identifying events or circumstances the occurrence of which could have demonstrably adverse effects on the fund's business and/or reputation; (ii) implementing processes and controls to lessen the possibility that such events or circumstances occur or to mitigate the effects of such events or circumstances if they do occur; and (iii) creating and maintaining a system designed to evaluate continuously business and market conditions in order to facilitate the identification and implementation processes described in (i) and (ii) above. Because the day-to-day operations and activities of the fund are carried out by or through SelectCo, its affiliates, and other service providers, the fund's exposure to risks is mitigated but not eliminated by the processes overseen by the Trustees. While each of the Board's committees has responsibility for overseeing different aspects of the fund's activities, oversight is exercised primarily through the Operations and Audit Committees. Appropriate personnel, including but not limited to the fund's Chief Compliance Officer (CCO), SelectCo's internal auditor, the independent accountants, the fund's Treasurer and portfolio management personnel, make periodic reports to the Board's committees, as appropriate. The responsibilities of each standing committee, including their oversight responsibilities, are described further under "Standing Committees of the Trustees."
Interested Trustees*:
Correspondence intended for a Trustee who is an interested person may be sent to Fidelity Investments, 245 Summer Street, Boston, Massachusetts 02210.
Name, Year of Birth; Principal Occupations and Other Relevant Experience+
Brian B. Hogan (1964)
Year of Election or Appointment: 2014
Trustee
Chairman of the Board of Trustees
Mr. Hogan also serves as Trustee or Vice President of other funds. Mr. Hogan serves as a Director of FMR Investment Management (UK) Limited (investment adviser firm, 2015-present) and Fidelity SelectCo, LLC (investment adviser firm, 2014-present) and President of the Equity Division of FMR (investment adviser firm, 2009-present). Previously, Mr. Hogan served as Senior Vice President, Equity Research of FMR (2006-2009) and as a portfolio manager. Mr. Brian B. Hogan is not related to Mr. Colm A. Hogan.
* Determined to be an "Interested Trustee" by virtue of, among other things, his or her affiliation with the trust or various entities under common control with SelectCo.
+ The information includes the Trustee's principal occupation during the last five years and other information relating to the experience, attributes, and skills relevant to the Trustee's qualifications to serve as a Trustee, which led to the conclusion that the Trustee should serve as a Trustee for the fund.
Independent Trustees:
Correspondence intended for an Independent Trustee may be sent to Fidelity Investments, P.O. Box 55235, Boston, Massachusetts 02205-5235.
Name, Year of Birth; Principal Occupations and Other Relevant Experience+
David A. Rosow (1942)
Year of Election or Appointment: 2013
Trustee
Mr. Rosow also serves as Trustee of other Fidelity® funds. Prior to his retirement in 2006, Mr. Rosow was the Chief Executive Officer, owner and operator of a number of private companies, which encompassed the oil refining, drilling and marketing of petroleum products (including specialty petroleum products), recreation industry, and real estate development. Mr. Rosow currently serves as a Director of Oxbow Carbon LLC (upgraders, marketers, and distributors of petroleum byproducts of the oil refining process, 2015-present) and Oxbridge Academy of the Palm Beaches (2015-present) and serves as its President and CEO. Previously, Mr. Rosow served on the Fairfield Country Day School Board for 27 years, including as its President for 3 years, stepping down in 2006. Mr. Rosow served as Lead Director and Chairman of the Audit Committee of Hudson United Bancorp (1996-2006), Chairman of the Board of Westport Bank and Trust (1992-1996), and as a Director of TD Banknorth (2006-2007). In addition, Mr. Rosow served as a member (2008-2014) and President (2009-2014) of the Town Council of Palm Beach, Florida. Mr. Rosow also served as a Member of the Advisory Board of certain Fidelity® funds (2012-2013).
Garnett A. Smith (1947)
Year of Election or Appointment: 2013
Trustee
Mr. Smith also serves as Trustee of other Fidelity® funds. Prior to Mr. Smith's retirement, he served as Chairman and Chief Executive Officer of Inbrand Corp. (manufacturer of personal absorbent products, 1990-1997). He also served as President (1986-1990) of Inbrand Corp. Prior to his employment with Inbrand Corp., he was employed by a retail fabric chain and North Carolina National Bank. In addition, Mr. Smith served as a Member of the Advisory Board of certain Fidelity® funds (2012-2013) and as a board member of the Jackson Hole Land Trust (2009-2012).
Michael E. Wiley (1950)
Year of Election or Appointment: 2008
Trustee
Chairman of the Independent Trustees
Mr. Wiley also serves as Trustee of other Fidelity® funds. Mr. Wiley serves as a Director of Tesoro Corporation (independent oil refiner and marketer, 2005-present), a Director of Tesoro Logistics LP (natural resources logistics, 2015-present), and a Director of Bill Barrett Corporation (exploration and production, 2005-present). In addition, Mr. Wiley also serves as a Director of Post Oak Bank (privately-held bank, 2004-present). Previously, Mr. Wiley served as a Trustee of other Fidelity® funds (2008-2013), as a Director of Asia Pacific Exploration Consolidated (international oil and gas exploration and production, 2008-2013), as a member of the Board of Trustees of the University of Tulsa (2000-2006; 2007-2010), as a Senior Energy Advisor of Katzenbach Partners, LLC (consulting, 2006-2007), as an Advisory Director of Riverstone Holdings (private investment), Chairman, President, and CEO of Baker Hughes, Inc. (oilfield services, 2000-2004), and as Director of Spinnaker Exploration Company (exploration and production, 2001-2005).
+ The information includes the Trustee's principal occupation during the last five years and other information relating to the experience, attributes, and skills relevant to the Trustee's qualifications to serve as a Trustee, which led to the conclusion that the Trustee should serve as a Trustee for the fund.
Advisory Board Members and Officers:
Correspondence intended for a Member of the Advisory Board may be sent to Fidelity Investments, P.O. Box 55235, Boston, Massachusetts 02205-5235. Except for Anthony R. Rochte, correspondence intended for an officer may be sent to Fidelity Investments, 245 Summer Street, Boston, Massachusetts 02210. Correspondence intended for Mr. Rochte may be sent to SelectCo, 1225 17th Street, Denver, Colorado 80202-5541. Officers appear below in alphabetical order.
Name, Year of Birth; Principal Occupation
Donald F. Donahue (1950)
Year of Election or Appointment: 2015
Member of the Advisory Board
Mr. Donahue also serves as a Trustee or Member of the Advisory Board of other Fidelity® funds. Mr. Donahue is President and Chief Executive Officer of Miranda Partners, LLC (risk consulting for the financial services industry, 2012-present) and a consultant for the Institute for Defense Analyses (national security, 2012-present). Previously, Mr. Donahue served as Chief Executive Officer (2006-2012), Chief Operating Officer (2003-2006), and Managing Director, Customer Marketing and Development (1999-2003) of The Depository Trust & Clearing Corporation (financial markets infrastructure). Mr. Donahue serves as a Member (2012-present) and Co-Chairman (2016-present) of the Board of Directors of United Way of New York, Member of the Board of Directors of NYC Leadership Academy (2012-present) and Member of the Board of Advisors of Ripple Labs, Inc. (financial services, 2015-present). He also served as Chairman (2010-2012) and Member of the Board of Directors (2012-2013) of Omgeo, LLC (financial services), Treasurer of United Way of New York (2012-2016), and Member of the Board of Directors of XBRL US (financial services non-profit, 2009-2012) and the International Securities Services Association (2009-2012).
Carol B. Tomé (1957)
Year of Election or Appointment: 2017
Member of the Advisory Board
Ms. Tomé also serves as Trustee or Member of the Advisory Board of other Fidelity® funds. Ms. Tomé is Chief Financial Officer (2001-present) and Executive Vice President of Corporate Services (2007-present) of The Home Depot, Inc. (home improvement retailer) and a Director (2003-present) and Chair of the Audit Committee (2004-present) of United Parcel Service, Inc. (package delivery and supply chain management). Previously, Ms. Tomé served as Senior Vice President of Finance and Accounting/Treasurer (2000-2007) and Vice President and Treasurer (1995-2000) of The Home Depot, Inc. and Chair of the Board (2010-2012), Vice Chair of the Board (2009 and 2013), and a Director (2008-2013) of the Federal Reserve Bank of Atlanta. Ms. Tomé is also a director or trustee of many community and professional organizations.
Marc R. Bryant (1966)
Year of Election or Appointment: 2013
Secretary and Chief Legal Officer (CLO)
Mr. Bryant also serves as Secretary and CLO of other funds. Mr. Bryant serves as CLO, Secretary, and Senior Vice President of Fidelity Management & Research Company (investment adviser firm, 2015-present) and FMR Co., Inc. (investment adviser firm, 2015-present); Secretary of Fidelity SelectCo, LLC (investment adviser firm, 2015-present) and Fidelity Investments Money Management, Inc. (investment adviser firm, 2015-present); and CLO of Fidelity Management & Research (Hong Kong) Limited and FMR Investment Management (UK) Limited (investment adviser firms, 2015-present) and Fidelity Management & Research (Japan) Limited (investment adviser firm, 2016-present). He is Senior Vice President and Deputy General Counsel of FMR LLC (diversified financial services company). Previously, Mr. Bryant served as Secretary and CLO of Fidelity Rutland Square Trust II (2010-2014) and Assistant Secretary of Fidelity's Fixed Income and Asset Allocation Funds (2013-2015). Prior to joining Fidelity Investments, Mr. Bryant served as a Senior Vice President and the Head of Global Retail Legal for AllianceBernstein L.P. (2006-2010), and as the General Counsel for ProFund Advisors LLC (2001-2006).
Jeffrey S. Christian (1961)
Year of Election or Appointment: 2016
Assistant Treasurer
Mr. Christian also serves as Assistant Treasurer of other funds. Mr. Christian is an employee of Fidelity Investments (2003-present).
William C. Coffey (1969)
Year of Election or Appointment: 2009
Assistant Secretary
Mr. Coffey also serves as Assistant Secretary of other funds. He is Senior Vice President and Deputy General Counsel of FMR LLC (diversified financial services company, 2010-present), and is an employee of Fidelity Investments. Previously, Mr. Coffey served as Vice President and Associate General Counsel of FMR LLC (2005-2009).
Jonathan Davis (1968)
Year of Election or Appointment: 2010
Assistant Treasurer
Mr. Davis also serves as Assistant Treasurer of other funds, and is an employee of Fidelity Investments. Previously, Mr. Davis served as Vice President and Associate General Counsel of FMR LLC (diversified financial services company, 2003-2010).
Adrien E. Deberghes (1967)
Year of Election or Appointment: 2013
President and Treasurer
Mr. Deberghes also serves as an officer of other funds. He serves as Executive Vice President of Fidelity Investments Money Management, Inc. (FIMM) (investment adviser firm, 2016-present) and is an employee of Fidelity Investments (2008-present). Prior to joining Fidelity Investments, Mr. Deberghes was Senior Vice President of Mutual Fund Administration at State Street Corporation (2007-2008), Senior Director of Mutual Fund Administration at Investors Bank & Trust (2005-2007), and Director of Finance for Dunkin' Brands (2000-2005). Previously, Mr. Deberghes served in other fund officer roles.
Joseph DeSantis (1959)
Year of Election or Appointment: 2015
Vice President
Mr. DeSantis also serves as Vice President of other funds. Mr. DeSantis serves as a Director of Fidelity Management & Research (Japan) Limited (investment adviser firm, 2016-present), Chief Investment Officer, Equities (2010-present) and is an employee of Fidelity Investments.
Stephanie J. Dorsey (1969)
Year of Election or Appointment: 2010
Assistant Treasurer
Ms. Dorsey also serves as an officer of other funds. She is an employee of Fidelity Investments (2008-present) and has served in other fund officer roles. Prior to joining Fidelity Investments, Ms. Dorsey served as Treasurer (2004-2008) of the JPMorgan Mutual Funds and Vice President (2004-2008) of JPMorgan Chase Bank.
Howard J. Galligan III (1966)
Year of Election or Appointment: 2014
Chief Financial Officer
Mr. Galligan also serves as Chief Financial Officer of other funds. Mr. Galligan serves as President of Fidelity Pricing and Cash Management Services (FPCMS) (2014-present) and as a Director of Strategic Advisers, Inc. (investment adviser firm, 2008-present). Previously, Mr. Galligan served as Chief Administrative Officer of Asset Management (2011-2014) and Chief Operating Officer and Senior Vice President of Investment Support for Strategic Advisers, Inc. (2003-2011).
Scott C. Goebel (1968)
Year of Election or Appointment: 2015
Vice President
Mr. Goebel serves as Vice President of other funds and is an employee of Fidelity Investments (2001-present). Previously, Mr. Goebel served as Senior Vice President of Fidelity Management & Research Company (FMR) (investment adviser firm, 2016), Secretary of Fidelity SelectCo, LLC (investment adviser firm, 2013-2015), Fidelity Investments Money Management, Inc. (FIMM) (investment adviser firm, 2010-2015), and Fidelity Research and Analysis Company (FRAC) (investment adviser firm, 2010-2015); General Counsel, Secretary, and Senior Vice President of FMR (investment adviser firm, 2008-2015) and FMR Co., Inc. (investment adviser firm, 2008-2015); Assistant Secretary of Fidelity Management & Research (Japan) Limited (investment adviser firm, 2008-2015) and Fidelity Management & Research (U.K.) Inc. (investment adviser firm, 2008-2015); Chief Legal Officer (CLO) of Fidelity Management & Research (Hong Kong) Limited (investment adviser firm, 2008-2015); Secretary and CLO of certain Fidelity® funds (2008-2015); Assistant Secretary of FIMM (2008-2010), FRAC (2008-2010), and certain funds (2007-2008); and as Vice President and Secretary of Fidelity Distributors Corporation (FDC) (2005-2007).
James D. Gryglewicz (1972)
Year of Election or Appointment: 2014
Chief Compliance Officer
Mr. Gryglewicz also serves as Chief Compliance Officer of other funds. Mr. Gryglewicz serves as Compliance Officer of Strategic Advisers, Inc. (investment adviser firm, 2015-present) and Fidelity SelectCo, LLC (investment adviser firm, 2014-present), Senior Vice President of Asset Management Compliance (2009-present), and is an employee of Fidelity Investments (2004-present).
Brian B. Hogan (1964)
Year of Election or Appointment: 2009
Vice President
Mr. Hogan also serves as Trustee or Vice President of other funds. Mr. Hogan serves as a Director of FMR Investment Management (UK) Limited (investment adviser firm, 2015-present) and Fidelity SelectCo, LLC (investment adviser firm, 2014-present) and President of the Equity Division of FMR (investment adviser firm, 2009-present). Previously, Mr. Hogan served as Senior Vice President, Equity Research of FMR (2006-2009) and as a portfolio manager. Mr. Brian B. Hogan is not related to Mr. Colm A. Hogan.
Colm A. Hogan (1973)
Year of Election or Appointment: 2016
Assistant Treasurer
Mr. Hogan also serves as an officer of other funds. Mr. Hogan is an employee of Fidelity Investments (2005-present). Mr. Colm A. Hogan is not related to Mr. Brian B. Hogan.
Chris Maher (1972)
Year of Election or Appointment: 2013
Assistant Treasurer
Mr. Maher serves as Assistant Treasurer of other funds. Mr. Maher is Vice President of Valuation Oversight and is an employee of Fidelity Investments. Previously, Mr. Maher served as Vice President of Asset Management Compliance (2013), Vice President of the Program Management Group of FMR (investment adviser firm, 2010-2013), and Vice President of Valuation Oversight (2008-2010).
John F. Papandrea (1972)
Year of Election or Appointment: 2016
Anti-Money Laundering (AML) Officer
Mr. Papandrea also serves as AML Officer of other funds. Mr. Papandrea is Vice President of FMR LLC (diversified financial services company, 2008-present) and is an employee of Fidelity Investments (2005-present).
Anthony R. Rochte (1968)
Year of Election or Appointment: 2013
Vice President
Mr. Rochte also serves as Vice President of other funds. Mr. Rochte serves as President of Fidelity SelectCo, LLC (investment adviser firm, 2012-present) and is an employee of Fidelity Investments (2012-present). Prior to joining Fidelity Investments, Mr. Rochte served as Senior Managing Director and head of State Street Global Advisors' North American Intermediary Business Group (2006-2012).
Stacie M. Smith (1974)
Year of Election or Appointment: 2013
Assistant Treasurer
Ms. Smith also serves as an officer of other funds. She is an employee of Fidelity Investments (2009-present) and has served in other fund officer roles. Prior to joining Fidelity Investments, Ms. Smith served as Senior Audit Manager of Ernst & Young LLP (accounting firm, 1996-2009). Previously, Ms. Smith served as Deputy Treasurer of certain Fidelity® funds (2013-2016).
Marc L. Spector (1972)
Year of Election or Appointment: 2017
Assistant Treasurer
Mr. Spector also serves as an officer of other funds. Mr. Spector is an employee of Fidelity Investments (2016-present). Prior to joining Fidelity Investments, Mr. Spector served as Director at the Siegfried Group (accounting firm, 2013-2016), and prior to Siegfried Group as audit senior manager at Deloitte & Touche (accounting firm, 2005-2013).
Renee Stagnone (1975)
Year of Election or Appointment: 2016
Assistant Treasurer
Ms. Stagnone also serves as an officer of other funds. Ms. Stagnone is an employee of Fidelity Investments (1997-present). Previously, Ms. Stagnone served as Deputy Treasurer of certain Fidelity® funds (2013-2016).
Shareholder Expense Example
As a shareholder of the Fund, you incur two types of costs: (1) transaction costs, including redemption fees and (2) ongoing costs, including management fees and other Fund expenses. This Example is intended to help you understand your ongoing costs (in dollars) of investing in the Fund and to compare these costs with the ongoing costs of investing in other mutual funds.
The Example is based on an investment of $1,000 invested at the beginning of the period and held for the entire period (July 1, 2016 to December 31, 2016).
Actual Expenses
The first line of the accompanying table for each class of the Fund provides information about actual account values and actual expenses. You may use the information in this line, together with the amount you invested, to estimate the expenses that you paid over the period. Simply divide your account value by $1,000.00 (for example, an $8,600 account value divided by $1,000.00 = 8.6), then multiply the result by the number in the first line for a class of the Fund under the heading entitled "Expenses Paid During Period" to estimate the expenses you paid on your account during this period. The estimate of expenses does not include any fees or other expenses of any variable annuity or variable life insurance product. If they were, the estimate of expenses you paid during the period would be higher, and your ending account value would be lower. In addition, the Fund, as a shareholder in the underlying Fidelity Central Funds, will indirectly bear its pro-rata share of the fees and expenses incurred by the underlying Fidelity Central Funds. These fees and expenses are not included in the Fund's annualized expense ratio used to calculate the expense estimate in the table below.
Hypothetical Example for Comparison Purposes
The second line of the accompanying table for each class of the Fund provides information about hypothetical account values and hypothetical expenses based on a Class' actual expense ratio and an assumed rate of return of 5% per year before expenses, which is not the Class' actual return. The hypothetical account values and expenses may not be used to estimate the actual ending account balance or expenses you paid for the period. You may use this information to compare the ongoing costs of investing in the Fund and other funds. To do so, compare this 5% hypothetical example with the 5% hypothetical examples that appear in the shareholder reports of the other funds. The estimate of expenses does not include any fees or other expenses of any variable annuity or variable life insurance product. If they were, the estimate of expenses you paid during the period would be higher, and your ending account value would be lower. In addition, the Fund, as a shareholder in the underlying Fidelity Central Funds, will indirectly bear its pro-rata share of the fees and expenses incurred by the underlying Fidelity Central Funds. These fees and expenses are not included in the Fund's annualized expense ratio used to calculate the expense estimate in the table below.
Please note that the expenses shown in the table are meant to highlight your ongoing costs only and do not reflect any transaction costs. Therefore, the second line of the table is useful in comparing ongoing costs only, and will not help you determine the relative total costs of owning different funds. In addition, if these transactional costs were included, your costs would have been higher.
| | Annualized Expense Ratio-A | Beginning
Account Value
July 1, 2016 | Ending
Account Value
December 31, 2016 | Expenses Paid
During Period-B
July 1, 2016
to December 31, 2016 |
| Initial Class | .70% | | | |
| Actual | | $1,000.00 | $939.70 | $3.41 |
| Hypothetical-C | | $1,000.00 | $1,021.62 | $3.56 |
| Investor Class | .78% | | | |
| Actual | | $1,000.00 | $939.50 | $3.80 |
| Hypothetical-C | | $1,000.00 | $1,021.22 | $3.96 |
A Annualized expense ratio reflects expenses net of applicable fee waivers.
B Expenses are equal to each Class' annualized expense ratio, multiplied by the average account value over the period, multiplied by 184/366 (to reflect the one-half year period).
C 5% return per year before expenses
Distributions (Unaudited)
Initial Class and Investor Class designate 100% of the dividends distributed in December 2016, as qualifying for the dividends–received deduction for corporate shareholders.
VTELIC-ANN-0217
1.817391.111
Fidelity® Variable Insurance Products: Materials Portfolio
Annual Report December 31, 2016 |
|
Contents
To view a fund's proxy voting guidelines and proxy voting record for the 12-month period ended June 30, visit http://www.fidelity.com/proxyvotingresults or visit the Securities and Exchange Commission's (SEC) web site at http://www.sec.gov.
You may also call 1-877-208-0098 to request a free copy of the proxy voting guidelines.
Fidelity® Variable Insurance Products are separate account options which are purchased through a variable insurance contract.
Standard & Poor's, S&P and S&P 500 are registered service marks of The McGraw-Hill Companies, Inc. and have been licensed for use by Fidelity Distributors Corporation.
Other third-party marks appearing herein are the property of their respective owners.
All other marks appearing herein are registered or unregistered trademarks or service marks of FMR LLC or an affiliated company. © 2017 FMR LLC. All rights reserved.
This report and the financial statements contained herein are submitted for the general information of the shareholders of the Fund. This report is not authorized for distribution to prospective investors in the Fund unless preceded or accompanied by an effective prospectus.
A fund files its complete schedule of portfolio holdings with the SEC for the first and third quarters of each fiscal year on Form N-Q. Forms N-Q are available on the SEC’s web site at http://www.sec.gov. A fund's Forms N-Q may be reviewed and copied at the SEC’s Public Reference Room in Washington, DC. Information regarding the operation of the SEC's Public Reference Room may be obtained by calling 1-800-SEC-0330.
For a complete list of a fund's portfolio holdings, view the most recent holdings listing, semiannual report, or annual report on Fidelity's web site at http://www.fidelity.com, http://www.institutional.fidelity.com, or http://www.401k.com, as applicable.
NOT FDIC INSURED •MAY LOSE VALUE •NO BANK GUARANTEE
Neither the Fund nor Fidelity Distributors Corporation is a bank.
Performance: The Bottom Line
Average annual total return reflects the change in the value of an investment, assuming reinvestment of distributions from dividend income and capital gains (the profits earned upon the sale of securities that have grown in value, if any) and assuming a constant rate of performance each year. During periods of reimbursement by Fidelity, a fund’s total return will be greater than it would be had the reimbursement not occurred. Performance numbers are net of all underlying fund operating expenses, but do not include any insurance charges imposed by your insurance company’s separate account. If performance information included the effect of these additional charges, the total returns would have been lower. How a fund did yesterday is no guarantee of how it will do tomorrow.
Average Annual Total Returns
| For the periods ended December 31, 2016 | Past 1 year | Past 5 years | Life of fundA |
| Initial Class | 12.20% | 8.50% | 6.84% |
| Investor Class | 12.06% | 8.42% | 6.74% |
A From April 24, 2007
$10,000 Over Life of Fund
Let's say hypothetically that $10,000 was invested in VIP Materials Portfolio - Initial Class on April 24, 2007, when the fund started.
The chart shows how the value of your investment would have changed, and also shows how the S&P 500® Index performed over the same period.

| Period Ending Values |
| $18,989 | VIP Materials Portfolio - Initial Class |
| $18,651 | S&P 500® Index |
Management's Discussion of Fund Performance
Market Recap: The S&P 500
® index returned 11.96% in 2016, rising sharply on post-election optimism for economic growth. The year began during a fairly volatile stretch, with stocks hampered by persistent oil-price weakness and U.S.-dollar strength. Markets regained momentum in February amid U.S. job gains, a rally in energy and other stimuli that helped keep the roughly seven-year uptrend intact. Markets tumbled briefly following the U.K.’s June 23 vote to exit the European Union – dubbed “Brexit” – then recovered quickly and settled into a flattish stretch until the November 8 U.S. presidential election. Stocks reacted to the outcome by reaching a series of all-time highs. For the year, energy (+27%) led the way amid two strong rallies in commodity prices, one in the spring and another in November. Telecommunication services (+23%) was close behind, as demand for dividend-paying equities was high early in the period. Cyclical sectors, including financials (+22%), industrials (+18%) and materials (+17%), also posted strong gains. Conversely, consumer staples (+5%) and consumer discretionary (+6%) lagged the index, the latter hurt as online competition continued to pressure brick-and-mortar retailers. Real estate (+3%) struggled due to expectations for rising interest rates, while health care (-2%) was hampered by an uncertain political and regulatory outlook.
Comments from Portfolio Manager Tobias Welo: For the year, the fund’s share classes had returns of roughly 12%, well behind the 21.53% return of the MSCI U.S. IMI Materials 25/50 Index but in line with the broader S&P 500. Versus the MSCI sector index, untimely exposure to gold equities and a sizable underweighting in steel weighed on results, as did stock picking in paper packaging and fertilizers & agricultural chemicals. Within specialty chemicals, a sizable overweighting in W.R. Grace was the fund’s largest relative detractor, sliding early in the year amid the market’s concern about companies with significant debt. A large overweighting in paperboard maker Graphic Packaging Holding hampered relative performance, as did not owning strong-performing index name Newmont Mining and purchasing several gold-mining stocks around the 2016 top in the gold market. Conversely, picks in construction materials and commodity chemicals were noteworthy positives. In the former category, Eagle Materials was a significant overweighting and finished the year as the fund’s top contributor. The firm makes cement, gypsum wallboard, recycled paperboard and materials used in the hydraulic fracturing process to explore for oil and gas. Overweighting specialty chemicals firm Ingevity and Valspar, a maker of coatings and paints, also paid off. The latter position was sold after the stock rallied on a buyout offer from Sherwin-Williams.
The views expressed above reflect those of the portfolio manager(s) only through the end of the period as stated on the cover of this report and do not necessarily represent the views of Fidelity or any other person in the Fidelity organization. Any such views are subject to change at any time based upon market or other conditions and Fidelity disclaims any responsibility to update such views. These views may not be relied on as investment advice and, because investment decisions for a Fidelity fund are based on numerous factors, may not be relied on as an indication of trading intent on behalf of any Fidelity fund.
Investment Summary (Unaudited)
Top Ten Stocks as of December 31, 2016
| | % of fund's net assets | % of fund's net assets 6 months ago |
| E.I. du Pont de Nemours & Co. | 15.2 | 15.0 |
| WestRock Co. | 6.4 | 7.5 |
| Monsanto Co. | 6.3 | 7.4 |
| LyondellBasell Industries NV Class A | 5.9 | 4.4 |
| Ball Corp. | 5.1 | 4.8 |
| Graphic Packaging Holding Co. | 4.9 | 5.6 |
| Ecolab, Inc. | 4.3 | 4.9 |
| Air Products & Chemicals, Inc. | 4.3 | 0.0 |
| PPG Industries, Inc. | 4.0 | 5.2 |
| Eagle Materials, Inc. | 4.0 | 4.4 |
| | 60.4 | |
Top Industries (% of fund's net assets)
| As of December 31, 2016 |
| | Chemicals | 66.8% |
| | Containers & Packaging | 16.4% |
| | Metals & Mining | 9.2% |
| | Construction Materials | 4.0% |
| | Trading Companies & Distributors | 1.8% |
| | All Others* | 1.8% |

* Includes short-term investments and net other assets (liabilities).
| As of June 30, 2016 |
| | Chemicals | 69.8% |
| | Containers & Packaging | 19.6% |
| | Construction Materials | 4.4% |
| | Metals & Mining | 3.2% |
| | Trading Companies & Distributors | 0.7% |
| | All Others* | 2.3% |

* Includes short-term investments and net other assets (liabilities).
Prior period industry classifications reflect the categories in place as of the date indicated and have not been adjusted to reflect current industry classifications.
Percentages shown as 0.0% may reflect amounts less than 0.05%.
Investments December 31, 2016
Showing Percentage of Net Assets
| Common Stocks - 98.2% | | | |
| | | Shares | Value |
| Chemicals - 66.8% | | | |
| Commodity Chemicals - 8.5% | | | |
| LyondellBasell Industries NV Class A | | 44,916 | $3,852,894 |
| Olin Corp. | | 32,300 | 827,203 |
| Trinseo SA | | 9,500 | 563,350 |
| Westlake Chemical Corp. | | 6,000 | 335,940 |
| | | | 5,579,387 |
| Diversified Chemicals - 27.5% | | | |
| Ashland Global Holdings, Inc. | | 10,900 | 1,191,261 |
| E.I. du Pont de Nemours & Co. | | 135,700 | 9,960,381 |
| Eastman Chemical Co. | | 32,435 | 2,439,436 |
| Ingevity Corp. (a) | | 9,733 | 533,952 |
| The Chemours Co. LLC | | 66,700 | 1,473,403 |
| The Dow Chemical Co. | | 42,600 | 2,437,572 |
| | | | 18,036,005 |
| Fertilizers & Agricultural Chemicals - 10.9% | | | |
| Agrium, Inc. | | 9,200 | 924,762 |
| CF Industries Holdings, Inc. | | 29,100 | 916,068 |
| Monsanto Co. | | 38,827 | 4,084,989 |
| The Scotts Miracle-Gro Co. Class A | | 12,300 | 1,175,265 |
| | | | 7,101,084 |
| Industrial Gases - 4.3% | | | |
| Air Products & Chemicals, Inc. | | 19,400 | 2,790,108 |
| Specialty Chemicals - 15.6% | | | |
| Axalta Coating Systems (a) | | 23,600 | 641,920 |
| Ecolab, Inc. | | 24,028 | 2,816,562 |
| Frutarom Industries Ltd. | | 9,200 | 470,742 |
| Platform Specialty Products Corp. (a) | | 66,900 | 656,289 |
| PPG Industries, Inc. | | 27,900 | 2,643,804 |
| Sherwin-Williams Co. | | 2,400 | 644,976 |
| W.R. Grace & Co. | | 34,846 | 2,356,983 |
| | | | 10,231,276 |
|
| TOTAL CHEMICALS | | | 43,737,860 |
|
| Construction Materials - 4.0% | | | |
| Construction Materials - 4.0% | | | |
| Eagle Materials, Inc. | | 26,288 | 2,590,157 |
| Containers & Packaging - 16.4% | | | |
| Metal & Glass Containers - 5.1% | | | |
| Ball Corp. | | 44,800 | 3,363,136 |
| Paper Packaging - 11.3% | | | |
| Graphic Packaging Holding Co. | | 256,700 | 3,203,616 |
| WestRock Co. | | 82,698 | 4,198,577 |
| | | | 7,402,193 |
|
| TOTAL CONTAINERS & PACKAGING | | | 10,765,329 |
|
| Metals & Mining - 9.2% | | | |
| Copper - 2.5% | | | |
| Freeport-McMoRan, Inc. (a) | | 125,100 | 1,650,069 |
| Diversified Metals & Mining - 3.3% | | | |
| Alcoa Corp. | | 22,000 | 617,760 |
| Glencore Xstrata PLC (a) | | 117,908 | 403,017 |
| Rio Tinto PLC | | 30,400 | 1,160,611 |
| | | | 2,181,388 |
| Gold - 2.5% | | | |
| B2Gold Corp. (a) | | 19,794 | 47,029 |
| Barrick Gold Corp. | | 33,300 | 532,988 |
| Franco-Nevada Corp. | | 8,500 | 508,234 |
| Randgold Resources Ltd. sponsored ADR (b) | | 7,400 | 564,916 |
| | | | 1,653,167 |
| Steel - 0.9% | | | |
| AK Steel Holding Corp. (a) | | 55,100 | 562,571 |
|
| TOTAL METALS & MINING | | | 6,047,195 |
|
| Trading Companies & Distributors - 1.8% | | | |
| Trading Companies & Distributors - 1.8% | | | |
| Nexeo Solutions, Inc. (c) | | 39,000 | 363,090 |
| Univar, Inc. (a) | | 29,100 | 825,567 |
| | | | 1,188,657 |
| TOTAL COMMON STOCKS | | | |
| (Cost $53,518,299) | | | 64,329,198 |
|
| Money Market Funds - 2.0% | | | |
| Fidelity Cash Central Fund, 0.60% (d) | | 935,413 | 935,600 |
| Fidelity Securities Lending Cash Central Fund 0.65% (d)(e) | | 371,392 | 371,429 |
| TOTAL MONEY MARKET FUNDS | | | |
| (Cost $1,306,984) | | | 1,307,029 |
| TOTAL INVESTMENT PORTFOLIO - 100.2% | | | |
| (Cost $54,825,283) | | | 65,636,227 |
| NET OTHER ASSETS (LIABILITIES) - (0.2)% | | | (124,729) |
| NET ASSETS - 100% | | | $65,511,498 |
Legend
(a) Non-income producing
(b) Security or a portion of the security is on loan at period end.
(c) Restricted securities - Investment in securities not registered under the Securities Act of 1933 (excluding 144A issues). At the end of the period, the value of restricted securities (excluding 144A issues) amounted to $363,090 or 0.6% of net assets.
(d) Affiliated fund that is generally available only to investment companies and other accounts managed by Fidelity Investments. The rate quoted is the annualized seven-day yield of the fund at period end. A complete unaudited listing of the fund's holdings as of its most recent quarter end is available upon request. In addition, each Fidelity Central Fund's financial statements, which are not covered by the Fund's Report of Independent Registered Public Accounting Firm, are available on the SEC's website or upon request.
(e) Investment made with cash collateral received from securities on loan.
Additional information on each restricted holding is as follows:
| Security | Acquisition Date | Acquisition Cost |
| Nexeo Solutions, Inc. | 6/9/16 | $390,000 |
Affiliated Central Funds
Information regarding fiscal year to date income earned by the Fund from investments in Fidelity Central Funds is as follows:
| Fund | Income earned |
| Fidelity Cash Central Fund | $4,106 |
| Fidelity Securities Lending Cash Central Fund | 6,175 |
| Total | $10,281 |
Investment Valuation
The following is a summary of the inputs used, as of December 31, 2016, involving the Fund's assets and liabilities carried at fair value. The inputs or methodology used for valuing securities may not be an indication of the risk associated with investing in those securities. For more information on valuation inputs, and their aggregation into the levels used below, please refer to the Investment Valuation section in the accompanying Notes to Financial Statements.
| | Valuation Inputs at Reporting Date: |
| Description | Total | Level 1 | Level 2 | Level 3 |
| Investments in Securities: | | | | |
| Common Stocks | $64,329,198 | $63,168,587 | $1,160,611 | $-- |
| Money Market Funds | 1,307,029 | 1,307,029 | -- | -- |
| Total Investments in Securities: | $65,636,227 | $64,475,616 | $1,160,611 | $-- |
Other Information
Distribution of investments by country or territory of incorporation, as a percentage of Total Net Assets, is as follows (Unaudited):
| United States of America | 86.3% |
| Netherlands | 5.9% |
| Canada | 3.1% |
| United Kingdom | 1.8% |
| Bailiwick of Jersey | 1.4% |
| Others (Individually Less Than 1%) | 1.5% |
| | 100.0% |
See accompanying notes which are an integral part of the financial statements.
Financial Statements
Statement of Assets and Liabilities
| | | December 31, 2016 |
| Assets | | |
Investment in securities, at value (including securities loaned of $351,164) — See accompanying schedule:
Unaffiliated issuers (cost $53,518,299) | $64,329,198 | |
| Fidelity Central Funds (cost $1,306,984) | 1,307,029 | |
| Total Investments (cost $54,825,283) | | $65,636,227 |
| Receivable for fund shares sold | | 245,513 |
| Dividends receivable | | 90,540 |
| Distributions receivable from Fidelity Central Funds | | 1,056 |
| Prepaid expenses | | 280 |
| Other receivables | | 1,999 |
| Total assets | | 65,975,615 |
| Liabilities | | |
| Payable for fund shares redeemed | $11,177 | |
| Accrued management fee | 29,715 | |
| Audit fees payable | 34,771 | |
| Other affiliated payables | 9,266 | |
| Other payables and accrued expenses | 7,738 | |
| Collateral on Securities Loaned | 371,450 | |
| Total liabilities | | 464,117 |
| Net Assets | | $65,511,498 |
| Net Assets consist of: | | |
| Paid in capital | | $54,225,282 |
| Undistributed net investment income | | 156,830 |
| Accumulated undistributed net realized gain (loss) on investments and foreign currency transactions | | 318,450 |
| Net unrealized appreciation (depreciation) on investments and assets and liabilities in foreign currencies | | 10,810,936 |
| Net Assets | | $65,511,498 |
| Initial Class: | | |
| Net Asset Value, offering price and redemption price per share ($12,725,907 ÷ 967,297 shares) | | $13.16 |
| Investor Class: | | |
| Net Asset Value, offering price and redemption price per share ($52,785,591 ÷ 4,014,602 shares) | | $13.15 |
See accompanying notes which are an integral part of the financial statements.
Statement of Operations
| | | Year ended December 31, 2016 |
| Investment Income | | |
| Dividends | | $1,130,054 |
| Income from Fidelity Central Funds | | 10,281 |
| Total income | | 1,140,335 |
| Expenses | | |
| Management fee | $292,318 | |
| Transfer agent fees | 69,244 | |
| Accounting and security lending fees | 20,944 | |
| Custodian fees and expenses | 14,234 | |
| Independent trustees' fees and expenses | 1,114 | |
| Audit | 44,118 | |
| Legal | 2,013 | |
| Miscellaneous | 783 | |
| Total expenses before reductions | 444,768 | |
| Expense reductions | (2,177) | 442,591 |
| Net investment income (loss) | | 697,744 |
| Realized and Unrealized Gain (Loss) | | |
| Net realized gain (loss) on: | | |
| Investment securities: | | |
| Unaffiliated issuers | 781,888 | |
| Fidelity Central Funds | 177 | |
| Foreign currency transactions | (2,422) | |
| Total net realized gain (loss) | | 779,643 |
Change in net unrealized appreciation (depreciation) on:
Investment securities | 4,464,443 | |
| Assets and liabilities in foreign currencies | 109 | |
| Total change in net unrealized appreciation (depreciation) | | 4,464,552 |
| Net gain (loss) | | 5,244,195 |
| Net increase (decrease) in net assets resulting from operations | | $5,941,939 |
See accompanying notes which are an integral part of the financial statements.
Statement of Changes in Net Assets
| | Year ended December 31, 2016 | Year ended December 31, 2015 |
| Increase (Decrease) in Net Assets | | |
| Operations | | |
| Net investment income (loss) | $697,744 | $725,536 |
| Net realized gain (loss) | 779,643 | 1,213,720 |
| Change in net unrealized appreciation (depreciation) | 4,464,552 | (7,132,161) |
| Net increase (decrease) in net assets resulting from operations | 5,941,939 | (5,192,905) |
| Distributions to shareholders from net investment income | (539,128) | (746,745) |
| Distributions to shareholders from net realized gain | (1,246,661) | (6,129,175) |
| Total distributions | (1,785,789) | (6,875,920) |
| Share transactions - net increase (decrease) | 10,103,624 | (9,007,350) |
| Redemption fees | 12,221 | 10,050 |
| Total increase (decrease) in net assets | 14,271,995 | (21,066,125) |
| Net Assets | | |
| Beginning of period | 51,239,503 | 72,305,628 |
| End of period | $65,511,498 | $51,239,503 |
| Other Information | | |
| Undistributed net investment income end of period | $156,830 | $3,496 |
See accompanying notes which are an integral part of the financial statements.
Financial Highlights — VIP Materials Portfolio Initial Class
| Years ended December 31, | 2016 | 2015 | 2014 | 2013 | 2012 |
| Selected Per–Share Data | | | | | |
| Net asset value, beginning of period | $12.18 | $14.84 | $15.53 | $13.27 | $11.67 |
| Income from Investment Operations | | | | | |
| Net investment income (loss)A | .17 | .17 | .15 | .11 | .12 |
| Net realized and unrealized gain (loss) | 1.23 | (1.33) | (.09) | 2.77 | 2.19 |
| Total from investment operations | 1.40 | (1.16) | .06 | 2.88 | 2.31 |
| Distributions from net investment income | (.11) | (.19) | (.15) | (.17) | (.12) |
| Distributions from net realized gain | (.31) | (1.32) | (.60) | (.45) | (.59) |
| Total distributions | (.42) | (1.50)B | (.75) | (.62) | (.71) |
| Redemption fees added to paid in capitalA,C | – | – | – | – | – |
| Net asset value, end of period | $13.16 | $12.18 | $14.84 | $15.53 | $13.27 |
| Total ReturnD,E | 12.20% | (9.01)% | .37% | 22.15% | 20.15% |
| Ratios to Average Net AssetsF,G | | | | | |
| Expenses before reductions | .77% | .75% | .75% | .76% | .75% |
| Expenses net of fee waivers, if any | .77% | .75% | .74% | .76% | .75% |
| Expenses net of all reductions | .76% | .75% | .73% | .75% | .74% |
| Net investment income (loss) | 1.37% | 1.23% | 1.00% | .77% | .96% |
| Supplemental Data | | | | | |
| Net assets, end of period (000 omitted) | $12,726 | $11,432 | $17,469 | $21,067 | $25,025 |
| Portfolio turnover rateH | 56% | 68% | 78% | 68% | 68% |
A Calculated based on average shares outstanding during the period.
B Total distributions of $1.50 per share is comprised of distributions from net investment income of $.185 and distributions from net realized gain of $1.319 per share.
C Amount represents less than $.005 per share.
D Total returns do not reflect charges attributable to your insurance company's separate account. Inclusion of these charges would reduce the total returns shown.
E Total returns would have been lower if certain expenses had not been reduced during the applicable periods shown.
F Fees and expenses of any underlying Fidelity Central Funds are not included in the Fund's expense ratio. The Fund indirectly bears its proportionate share of the expenses of any underlying Fidelity Central Funds.
G Expense ratios reflect operating expenses of the class. Expenses before reductions do not reflect amounts reimbursed by the investment adviser or reductions from brokerage service arrangements or reductions from other expense offset arrangements and do not represent the amount paid by the class during periods when reimbursements or reductions occur. Expenses net of fee waivers reflect expenses after reimbursement by the investment adviser but prior to reductions from brokerage service arrangements or other expense offset arrangements. Expenses net of all reductions represent the net expenses paid by the class.
H Amount does not include the portfolio activity of any underlying Fidelity Central Funds.
See accompanying notes which are an integral part of the financial statements.
Financial Highlights — VIP Materials Portfolio Investor Class
| Years ended December 31, | 2016 | 2015 | 2014 | 2013 | 2012 |
| Selected Per–Share Data | | | | | |
| Net asset value, beginning of period | $12.18 | $14.84 | $15.53 | $13.27 | $11.67 |
| Income from Investment Operations | | | | | |
| Net investment income (loss)A | .16 | .16 | .14 | .10 | .11 |
| Net realized and unrealized gain (loss) | 1.23 | (1.33) | (.09) | 2.77 | 2.19 |
| Total from investment operations | 1.39 | (1.17) | .05 | 2.87 | 2.30 |
| Distributions from net investment income | (.11) | (.17) | (.14) | (.16) | (.11) |
| Distributions from net realized gain | (.31) | (1.32) | (.60) | (.45) | (.59) |
| Total distributions | (.42) | (1.49) | (.74) | (.61) | (.70) |
| Redemption fees added to paid in capitalA,B | – | – | – | – | – |
| Net asset value, end of period | $13.15 | $12.18 | $14.84 | $15.53 | $13.27 |
| Total ReturnC,D | 12.06% | (9.09)% | .32% | 22.07% | 20.07% |
| Ratios to Average Net AssetsE,F | | | | | |
| Expenses before reductions | .85% | .83% | .82% | .83% | .83% |
| Expenses net of fee waivers, if any | .85% | .83% | .81% | .83% | .83% |
| Expenses net of all reductions | .85% | .82% | .81% | .83% | .82% |
| Net investment income (loss) | 1.29% | 1.16% | .93% | .69% | .88% |
| Supplemental Data | | | | | |
| Net assets, end of period (000 omitted) | $52,786 | $39,807 | $54,837 | $54,561 | $50,188 |
| Portfolio turnover rateG | 56% | 68% | 78% | 68% | 68% |
A Calculated based on average shares outstanding during the period.
B Amount represents less than $.005 per share.
C Total returns do not reflect charges attributable to your insurance company's separate account. Inclusion of these charges would reduce the total returns shown.
D Total returns would have been lower if certain expenses had not been reduced during the applicable periods shown.
E Fees and expenses of any underlying Fidelity Central Funds are not included in the Fund's expense ratio. The Fund indirectly bears its proportionate share of the expenses of any underlying Fidelity Central Funds.
F Expense ratios reflect operating expenses of the class. Expenses before reductions do not reflect amounts reimbursed by the investment adviser or reductions from brokerage service arrangements or reductions from other expense offset arrangements and do not represent the amount paid by the class during periods when reimbursements or reductions occur. Expenses net of fee waivers reflect expenses after reimbursement by the investment adviser but prior to reductions from brokerage service arrangements or other expense offset arrangements. Expenses net of all reductions represent the net expenses paid by the class.
G Amount does not include the portfolio activity of any underlying Fidelity Central Funds.
See accompanying notes which are an integral part of the financial statements.
Notes to Financial Statements
For the period ended December 31, 2016
1. Organization.
VIP Materials Portfolio (the Fund) is a non-diversified fund of Variable Insurance Products Fund IV (the Trust) and is authorized to issue an unlimited number of shares. The Trust is registered under the Investment Company Act of 1940, as amended (the 1940 Act), as an open-end management investment company organized as a Massachusetts business trust. Shares of the Fund may only be purchased by insurance companies for the purpose of funding variable annuity or variable life insurance contracts. The Fund offers the following classes of shares: Initial Class shares and Investor Class shares. All classes have equal rights and voting privileges, except for matters affecting a single class.
2. Investments in Fidelity Central Funds.
The Fund invests in Fidelity Central Funds, which are open-end investment companies generally available only to other investment companies and accounts managed by the investment adviser and its affiliates. The Fund's Schedule of Investments lists each of the Fidelity Central Funds held as of period end, if any, as an investment of the Fund, but does not include the underlying holdings of each Fidelity Central Fund. As an Investing Fund, the Fund indirectly bears its proportionate share of the expenses of the underlying Fidelity Central Funds.
The Money Market Central Funds seek preservation of capital and current income and are managed by Fidelity Investments Money Management, Inc. (FIMM), an affiliate of the investment adviser. Annualized expenses of the Money Market Central Funds as of their most recent shareholder report date are less than .005%.
A complete unaudited list of holdings for each Fidelity Central Fund is available upon request or at the Securities and Exchange Commission (the SEC) website at www.sec.gov. In addition, the financial statements of the Fidelity Central Funds, which are not covered by the Fund's Report of Independent Registered Public Accounting Firm, are available on the SEC website or upon request.
3. Significant Accounting Policies.
The financial statements have been prepared in conformity with accounting principles generally accepted in the United States of America (GAAP), which require management to make certain estimates and assumptions at the date of the financial statements. Actual results could differ from those estimates. Subsequent events, if any, through the date that the financial statements were issued have been evaluated in the preparation of the financial statements. The following summarizes the significant accounting policies of the Fund:
Investment Valuation. Investments are valued as of 4:00 p.m. Eastern time on the last calendar day of the period. The Board of Trustees (the Board) has delegated the day to day responsibility for the valuation of the Fund's investments to the Fair Value Committee (the Committee) established by the Fund's investment adviser. In accordance with valuation policies and procedures approved by the Board, the Fund attempts to obtain prices from one or more third party pricing vendors or brokers to value its investments. When current market prices, quotations or currency exchange rates are not readily available or reliable, investments will be fair valued in good faith by the Committee, in accordance with procedures adopted by the Board. Factors used in determining fair value vary by investment type and may include market or investment specific events. The frequency with which these procedures are used cannot be predicted and they may be utilized to a significant extent. The Committee oversees the Fund's valuation policies and procedures and reports to the Board on the Committee's activities and fair value determinations. The Board monitors the appropriateness of the procedures used in valuing the Fund's investments and ratifies the fair value determinations of the Committee.
The Fund categorizes the inputs to valuation techniques used to value its investments into a disclosure hierarchy consisting of three levels as shown below:
- Level 1 – quoted prices in active markets for identical investments
- Level 2 – other significant observable inputs (including quoted prices for similar investments, interest rates, prepayment speeds, etc.)
- Level 3 – unobservable inputs (including the Fund's own assumptions based on the best information available)
Valuation techniques used to value the Fund's investments by major category are as follows:
Equity securities, including restricted securities, for which market quotations are readily available, are valued at the last reported sale price or official closing price as reported by a third party pricing vendor on the primary market or exchange on which they are traded and are categorized as Level 1 in the hierarchy. In the event there were no sales during the day or closing prices are not available, securities are valued at the last quoted bid price or may be valued using the last available price and are generally categorized as Level 2 in the hierarchy. For foreign equity securities, when market or security specific events arise, comparisons to the valuation of American Depositary Receipts (ADRs), futures contracts, Exchange-Traded Funds (ETFs) and certain indexes as well as quoted prices for similar securities may be used and would be categorized as Level 2 in the hierarchy. Utilizing these techniques may result in transfers between Level 1 and Level 2. For equity securities, including restricted securities, where observable inputs are limited, assumptions about market activity and risk are used and these securities may be categorized as Level 3 in the hierarchy.
Investments in open-end mutual funds, including the Fidelity Central Funds, are valued at their closing net asset value (NAV) each business day and are categorized as Level 1 in the hierarchy.
Changes in valuation techniques may result in transfers in or out of an assigned level within the disclosure hierarchy. The aggregate value of investments by input level as of December 31, 2016 is included at the end of the Fund's Schedule of Investments.
Foreign Currency. The Fund may use foreign currency contracts to facilitate transactions in foreign-denominated securities. Gains and losses from these transactions may arise from changes in the value of the foreign currency or if the counterparties do not perform under the contracts' terms.
Foreign-denominated assets, including investment securities, and liabilities are translated into U.S. dollars at the exchange rates at period end. Purchases and sales of investment securities, income and dividends received and expenses denominated in foreign currencies are translated into U.S. dollars at the exchange rate in effect on the transaction date.
The effects of exchange rate fluctuations on investments are included with the net realized and unrealized gain (loss) on investment securities. Other foreign currency transactions resulting in realized and unrealized gain (loss) are disclosed separately.
Investment Transactions and Income. For financial reporting purposes, the Fund's investment holdings and NAV include trades executed through the end of the last business day of the period. The NAV per share for processing shareholder transactions is calculated as of the close of business of the New York Stock Exchange (NYSE), normally 4:00 p.m. Eastern time and includes trades executed through the end of the prior business day. Gains and losses on securities sold are determined on the basis of identified cost and may include proceeds received from litigation. Dividend income is recorded on the ex-dividend date, except for certain dividends from foreign securities where the ex-dividend date may have passed, which are recorded as soon as the Fund is informed of the ex-dividend date. Non-cash dividends included in dividend income, if any, are recorded at the fair market value of the securities received. Income and capital gain distributions from Fidelity Central Funds, if any, are recorded on the ex-dividend date. Certain distributions received by the Fund represent a return of capital or capital gain. The Fund determines the components of these distributions subsequent to the ex-dividend date, based upon receipt of tax filings or other correspondence relating to the underlying investment. These distributions are recorded as a reduction of cost of investments and/or as a realized gain. Investment income is recorded net of foreign taxes withheld where recovery of such taxes is uncertain.
Class Allocations and Expenses. Investment income, realized and unrealized capital gains and losses, common expenses of the Fund, and certain fund-level expense reductions, if any, are allocated daily on a pro-rata basis to each class based on the relative net assets of each class to the total net assets of the Fund. Each class differs with respect to transfer agent fees incurred. Certain expense reductions may also differ by class. For the reporting period, the allocated portion of income and expenses to each class as a percent of its average net assets may vary due to the timing of recording these transactions in relation to fluctuating net assets of the classes. Expenses directly attributable to a fund are charged to that fund. Expenses attributable to more than one fund are allocated among the respective funds on the basis of relative net assets or other appropriate methods. Expense estimates are accrued in the period to which they relate and adjustments are made when actual amounts are known.
Income Tax Information and Distributions to Shareholders. Each year, the Fund intends to qualify as a regulated investment company under Subchapter M of the Internal Revenue Code, including distributing substantially all of its taxable income and realized gains. As a result, no provision for U.S. Federal income taxes is required. As of December 31, 2016, the Fund did not have any unrecognized tax benefits in the financial statements; nor is the Fund aware of any tax positions for which it is reasonably possible that the total amounts of unrecognized tax benefits will significantly change in the next twelve months. The Fund files a U.S. federal tax return, in addition to state and local tax returns as required. The Fund's federal income tax returns are subject to examination by the Internal Revenue Service (IRS) for a period of three fiscal years after they are filed. State and local tax returns may be subject to examination for an additional fiscal year depending on the jurisdiction. Foreign taxes are provided for based on the Fund's understanding of the tax rules and rates that exist in the foreign markets in which it invests.
Distributions are declared and recorded on the ex-dividend date. Income dividends and capital gain distributions are declared separately for each class. Income and capital gain distributions are determined in accordance with income tax regulations, which may differ from GAAP.
Capital accounts within the financial statements are adjusted for permanent book-tax differences. These adjustments have no impact on net assets or the results of operations. Capital accounts are not adjusted for temporary book-tax differences which will reverse in a subsequent period.
Book-tax differences are primarily due to foreign currency transactions, and losses deferred due to wash sales.
The federal tax cost of investment securities and unrealized appreciation (depreciation) as of period end were as follows:
| Gross unrealized appreciation | $12,045,224 |
| Gross unrealized depreciation | (1,538,704) |
| Net unrealized appreciation (depreciation) on securities | $10,506,520 |
| Tax Cost | $55,129,707 |
The tax-based components of distributable earnings as of period end were as follows:
| Undistributed ordinary income | $156,830 |
| Undistributed long-term capital gain | $622,873 |
| Net unrealized appreciation (depreciation) on securities and other investments | $10,506,512 |
The tax character of distributions paid was as follows:
| | December 31, 2016 | December 31, 2015 |
| Ordinary Income | $547,250 | $ 789,083 |
| Long-term Capital Gains | 1,238,539 | 6,086,837 |
| Total | $1,785,789 | $ 6,875,920 |
Trading (Redemption) Fees. Shares held by investors less than 60 days may be subject to a redemption fee equal to 1% of the NAV of shares redeemed. All redemption fees, which reduce the proceeds of the shareholder redemption, are retained by the Fund and accounted for as an addition to paid in capital.
Restricted Securities. The Fund may invest in securities that are subject to legal or contractual restrictions on resale. These securities generally may be resold in transactions exempt from registration or to the public if the securities are registered. Disposal of these securities may involve time-consuming negotiations and expense, and prompt sale at an acceptable price may be difficult. Information regarding restricted securities is included at the end of the Fund's Schedule of Investments.
4. Purchases and Sales of Investments.
Purchases and sales of securities, other than short-term securities, aggregated $38,231,975 and $29,510,774, respectively.
5. Fees and Other Transactions with Affiliates.
Management Fee. Fidelity SelectCo, LLC (the investment adviser) and its affiliates provide the Fund with investment management related services for which the Fund pays a monthly management fee. The management fee is the sum of an individual fund fee rate that is based on an annual rate of .30% of the Fund's average net assets and an annualized group fee rate that averaged .25% during the period. The group fee rate is based upon the average net assets of all the mutual funds advised by Fidelity Management & Research Company (FMR) and the investment adviser. The group fee rate decreases as assets under management increase and increases as assets under management decrease. For the reporting period, the total annual management fee rate was .55% of the Fund's average net assets.
Transfer Agent Fees. Fidelity Investments Institutional Operations Company, Inc. (FIIOC), an affiliate of the investment adviser, is the Fund's transfer, dividend disbursing, and shareholder servicing agent. FIIOC receives an asset-based fee with respect to each class. Each class (with the exception of Investor Class) pays a fee for transfer agent services, typesetting, and printing and mailing of shareholder reports, excluding mailing of proxy statements, equal to an annual rate of .07% ( .15% for Investor Class) of class-level average net assets. For the period, transfer agent fees for each class were as follows:
| Initial Class | $7,445 |
| Investor Class | 61,799 |
| | $69,244 |
Accounting and Security Lending Fees. Fidelity Service Company, Inc. (FSC), an affiliate of the investment adviser, maintains the Fund's accounting records. The accounting fee is based on the level of average net assets for each month. Under a separate contract, FSC administers the security lending program. The security lending fee is based on the number and duration of lending transactions.
Brokerage Commissions. The Fund placed a portion of its portfolio transactions with brokerage firms which are affiliates of the investment adviser. Brokerage commissions are included in net realized gain (loss) and change in net unrealized appreciation (depreciation) in the Statement of Operations. The commissions paid to these affiliated firms were $916 for the period.
Interfund Trades. The Fund may purchase from or sell securities to other Fidelity Funds under procedures adopted by the Board. The procedures have been designed to ensure these interfund trades are executed in accordance with Rule 17a-7 of the 1940 Act. Interfund trades are included within the respective purchases and sales amounts shown in the Purchases and Sales of Investments note.
6. Committed Line of Credit.
The Fund participates with other funds managed by the investment adviser or an affiliate in a $4.25 billion credit facility (the "line of credit") to be utilized for temporary or emergency purposes to fund shareholder redemptions or for other short-term liquidity purposes. The Fund has agreed to pay commitment fees on its pro-rata portion of the line of credit, which amounted to $133 and is reflected in Miscellaneous expenses on the Statement of Operations. During the period, the Fund did not borrow on this line of credit.
7. Security Lending.
The Fund lends portfolio securities through a lending agent from time to time in order to earn additional income. On the settlement date of the loan, the Fund receives collateral (in the form of U.S. Treasury obligations, letters of credit and/or cash) against the loaned securities and maintains collateral in an amount not less than 100% of the market value of the loaned securities during the period of the loan. The market value of the loaned securities is determined at the close of business of the Fund and any additional required collateral is delivered to the Fund on the next business day. The Fund or borrower may terminate the loan at any time, and if the borrower defaults on its obligation to return the securities loaned because of insolvency or other reasons, the Fund may apply collateral received from the borrower against the obligation. The Fund may experience delays and costs in recovering the securities loaned. Any cash collateral received is invested in the Fidelity Securities Lending Cash Central Fund. The value of loaned securities and cash collateral at period end are disclosed on the Fund's Statement of Assets and Liabilities. Security lending income represents the income earned on investing cash collateral, less rebates paid to borrowers and any lending agent fees associated with the loan, plus any premium payments received for lending certain types of securities. Security lending income is presented in the Statement of Operations as a component of income from Fidelity Central Funds. Total security lending income during the period amounted to $6,175.
8. Expense Reductions.
Commissions paid to certain brokers with whom the investment adviser, or its affiliates, places trades on behalf of the Fund include an amount in addition to trade execution, which may be rebated back to the Fund to offset certain expenses. This amount totaled $1,803 for the period.
In addition, during the period the investment adviser reimbursed and/or waived a portion of fund-level operating expenses in the amount of $374.
9. Distributions to Shareholders.
Distributions to shareholders of each class were as follows:
| | Year ended December 31, 2016 | Year ended December 31, 2015 |
| From net investment income | | |
| Initial Class | $109,829 | $174,359 |
| Investor Class | 429,299 | 572,386 |
| Total | $539,128 | $746,745 |
| From net realized gain | | |
| Initial Class | $277,716 | $1,450,555 |
| Investor Class | 968,945 | 4,678,620 |
| Total | $1,246,661 | $6,129,175 |
10. Share Transactions.
Transactions for each class of shares were as follows:
| | Shares | Shares | Dollars | Dollars |
| | Year ended December 31, 2016 | Year ended December 31, 2015 | Year ended December 31, 2016 | Year ended December 31, 2015 |
| Initial Class | | | | |
| Shares sold | 231,288 | 104,321 | $2,906,388 | $1,435,872 |
| Reinvestment of distributions | 35,033 | 115,453 | 387,545 | 1,624,914 |
| Shares redeemed | (237,474) | (458,368) | (2,850,671) | (6,260,376) |
| Net increase (decrease) | 28,847 | (238,594) | $443,262 | $(3,199,590) |
| Investor Class | | | | |
| Shares sold | 1,455,195 | 529,379 | $18,450,449 | $7,121,617 |
| Reinvestment of distributions | 125,686 | 373,515 | 1,398,244 | 5,251,006 |
| Shares redeemed | (834,774) | (1,330,679) | (10,188,331) | (18,180,383) |
| Net increase (decrease) | 746,107 | (427,785) | $9,660,362 | $(5,807,760) |
11. Other.
The Fund's organizational documents provide former and current trustees and officers with a limited indemnification against liabilities arising in connection with the performance of their duties to the Fund. In the normal course of business, the Fund may also enter into contracts that provide general indemnifications. The Fund's maximum exposure under these arrangements is unknown as this would be dependent on future claims that may be made against the Fund. The risk of material loss from such claims is considered remote.
At the end of the period, the investment adviser or its affiliates were the owners of record of 100% of the total outstanding shares of the Fund.
Report of Independent Registered Public Accounting Firm
To the Trustees of Variable Insurance Products Fund IV and Shareholders of VIP Materials Portfolio:
In our opinion, the accompanying statement of assets and liabilities, including the schedule of investments, and the related statements of operations and of changes in net assets and the financial highlights present fairly, in all material respects, the financial position of VIP Materials Portfolio (a fund of Variable Insurance Products Fund IV) (the "Fund") as of December 31, 2016, the results of its operations for the year then ended, the changes in its net assets for each of the two years in the period then ended and the financial highlights for each of the five years in the period then ended, in conformity with accounting principles generally accepted in the United States of America. These financial statements and financial highlights (hereafter referred to as “financial statements”) are the responsibility of the Fund's management. Our responsibility is to express an opinion on these financial statements based on our audits. We conducted our audits of these financial statements in accordance with the standards of the Public Company Accounting Oversight Board (United States). Those standards require that we plan and perform the audit to obtain reasonable assurance about whether the financial statements are free of material misstatement. An audit includes examining, on a test basis, evidence supporting the amounts and disclosures in the financial statements, assessing the accounting principles used and significant estimates made by management, and evaluating the overall financial statement presentation. We believe that our audits, which included confirmation of securities as of December 31, 2016 by correspondence with the custodian and brokers, provide a reasonable basis for our opinion.
PricewaterhouseCoopers LLP
Boston, Massachusetts
February 16, 2017
Trustees and Officers
The Trustees, Members of the Advisory Board (if any), and officers of the trust and fund, as applicable, are listed below. The Board of Trustees governs the fund and is responsible for protecting the interests of shareholders. The Trustees are experienced executives who meet periodically throughout the year to oversee the fund's activities, review contractual arrangements with companies that provide services to the fund, oversee management of the risks associated with such activities and contractual arrangements, and review the fund's performance. Each of the Trustees oversees 83 funds.
The Trustees hold office without limit in time except that (a) any Trustee may resign; (b) any Trustee may be removed by written instrument, signed by at least two-thirds of the number of Trustees prior to such removal; (c) any Trustee who requests to be retired or who has become incapacitated by illness or injury may be retired by written instrument signed by a majority of the other Trustees; and (d) any Trustee may be removed at any special meeting of shareholders by a two-thirds vote of the outstanding voting securities of the trust. Each Trustee who is not an interested person (as defined in the 1940 Act) of the trust and the fund is referred to herein as an Independent Trustee. Each Independent Trustee shall retire not later than the last day of the calendar year in which his or her 75th birthday occurs. The Independent Trustees may waive this mandatory retirement age policy with respect to individual Trustees. Officers and Advisory Board Members hold office without limit in time, except that any officer or Advisory Board Member may resign or may be removed by a vote of a majority of the Trustees at any regular meeting or any special meeting of the Trustees. Except as indicated, each individual has held the office shown or other offices in the same company for the past five years.
The fund’s Statement of Additional Information (SAI) includes more information about the Trustees. To request a free copy, call Fidelity at 1-877-208-0098.
Experience, Skills, Attributes, and Qualifications of the Trustees. The Governance and Nominating Committee has adopted a statement of policy that describes the experience, qualifications, attributes, and skills that are necessary and desirable for potential Independent Trustee candidates (Statement of Policy). The Board believes that each Trustee satisfied at the time he or she was initially elected or appointed a Trustee, and continues to satisfy, the standards contemplated by the Statement of Policy. The Governance and Nominating Committee also engages professional search firms to help identify potential Independent Trustee candidates who have the experience, qualifications, attributes, and skills consistent with the Statement of Policy. From time to time, additional criteria based on the composition and skills of the current Independent Trustees, as well as experience or skills that may be appropriate in light of future changes to board composition, business conditions, and regulatory or other developments, have also been considered by the professional search firms and the Governance and Nominating Committee. In addition, the Board takes into account the Trustees' commitment and participation in Board and committee meetings, as well as their leadership of standing and ad hoc committees throughout their tenure.
In determining that a particular Trustee was and continues to be qualified to serve as a Trustee, the Board has considered a variety of criteria, none of which, in isolation, was controlling. The Board believes that, collectively, the Trustees have balanced and diverse experience, qualifications, attributes, and skills, which allow the Board to operate effectively in governing the fund and protecting the interests of shareholders. Information about the specific experience, skills, attributes, and qualifications of each Trustee, which in each case led to the Board's conclusion that the Trustee should serve (or continue to serve) as a trustee of the fund, is provided below.
Board Structure and Oversight Function. Brian B. Hogan is an interested person and currently serves as Chairman. The Trustees have determined that an interested Chairman is appropriate and benefits shareholders because an interested Chairman has a personal and professional stake in the quality and continuity of services provided to the fund. Independent Trustees exercise their informed business judgment to appoint an individual of their choosing to serve as Chairman, regardless of whether the Trustee happens to be independent or a member of management. The Independent Trustees have determined that they can act independently and effectively without having an Independent Trustee serve as Chairman and that a key structural component for assuring that they are in a position to do so is for the Independent Trustees to constitute a substantial majority for the Board. The Independent Trustees also regularly meet in executive session. Michael E. Wiley serves as Chairman of the Independent Trustees and as such (i) acts as a liaison between the Independent Trustees and management with respect to matters important to the Independent Trustees and (ii) with management prepares agendas for Board meetings.
Fidelity® funds are overseen by different Boards of Trustees. The fund's Board oversees Fidelity's sector portfolios. Other Boards oversee Fidelity's equity and high income funds, and Fidelity's investment grade bond, money market, and asset allocation funds. The use of separate Boards, each with its own committee structure, allows the Trustees of each group of Fidelity® funds to focus on the unique issues of the funds they oversee, including common research, investment, and operational issues. On occasion, the separate Boards establish joint committees to address issues of overlapping consequences for the Fidelity® funds overseen by each Board.
The Trustees operate using a system of committees to facilitate the timely and efficient consideration of all matters of importance to the Trustees, the fund, and fund shareholders and to facilitate compliance with legal and regulatory requirements and oversight of the fund's activities and associated risks. The Board, acting through its committees, has charged SelectCo and its affiliates with (i) identifying events or circumstances the occurrence of which could have demonstrably adverse effects on the fund's business and/or reputation; (ii) implementing processes and controls to lessen the possibility that such events or circumstances occur or to mitigate the effects of such events or circumstances if they do occur; and (iii) creating and maintaining a system designed to evaluate continuously business and market conditions in order to facilitate the identification and implementation processes described in (i) and (ii) above. Because the day-to-day operations and activities of the fund are carried out by or through SelectCo, its affiliates, and other service providers, the fund's exposure to risks is mitigated but not eliminated by the processes overseen by the Trustees. While each of the Board's committees has responsibility for overseeing different aspects of the fund's activities, oversight is exercised primarily through the Operations and Audit Committees. Appropriate personnel, including but not limited to the fund's Chief Compliance Officer (CCO), SelectCo's internal auditor, the independent accountants, the fund's Treasurer and portfolio management personnel, make periodic reports to the Board's committees, as appropriate. The responsibilities of each standing committee, including their oversight responsibilities, are described further under "Standing Committees of the Trustees."
Interested Trustees*:
Correspondence intended for a Trustee who is an interested person may be sent to Fidelity Investments, 245 Summer Street, Boston, Massachusetts 02210.
Name, Year of Birth; Principal Occupations and Other Relevant Experience+
Brian B. Hogan (1964)
Year of Election or Appointment: 2014
Trustee
Chairman of the Board of Trustees
Mr. Hogan also serves as Trustee or Vice President of other funds. Mr. Hogan serves as a Director of FMR Investment Management (UK) Limited (investment adviser firm, 2015-present) and Fidelity SelectCo, LLC (investment adviser firm, 2014-present) and President of the Equity Division of FMR (investment adviser firm, 2009-present). Previously, Mr. Hogan served as Senior Vice President, Equity Research of FMR (2006-2009) and as a portfolio manager. Mr. Brian B. Hogan is not related to Mr. Colm A. Hogan.
* Determined to be an "Interested Trustee" by virtue of, among other things, his or her affiliation with the trust or various entities under common control with SelectCo.
+ The information includes the Trustee's principal occupation during the last five years and other information relating to the experience, attributes, and skills relevant to the Trustee's qualifications to serve as a Trustee, which led to the conclusion that the Trustee should serve as a Trustee for the fund.
Independent Trustees:
Correspondence intended for an Independent Trustee may be sent to Fidelity Investments, P.O. Box 55235, Boston, Massachusetts 02205-5235.
Name, Year of Birth; Principal Occupations and Other Relevant Experience+
David A. Rosow (1942)
Year of Election or Appointment: 2013
Trustee
Mr. Rosow also serves as Trustee of other Fidelity® funds. Prior to his retirement in 2006, Mr. Rosow was the Chief Executive Officer, owner and operator of a number of private companies, which encompassed the oil refining, drilling and marketing of petroleum products (including specialty petroleum products), recreation industry, and real estate development. Mr. Rosow currently serves as a Director of Oxbow Carbon LLC (upgraders, marketers, and distributors of petroleum byproducts of the oil refining process, 2015-present) and Oxbridge Academy of the Palm Beaches (2015-present) and serves as its President and CEO. Previously, Mr. Rosow served on the Fairfield Country Day School Board for 27 years, including as its President for 3 years, stepping down in 2006. Mr. Rosow served as Lead Director and Chairman of the Audit Committee of Hudson United Bancorp (1996-2006), Chairman of the Board of Westport Bank and Trust (1992-1996), and as a Director of TD Banknorth (2006-2007). In addition, Mr. Rosow served as a member (2008-2014) and President (2009-2014) of the Town Council of Palm Beach, Florida. Mr. Rosow also served as a Member of the Advisory Board of certain Fidelity® funds (2012-2013).
Garnett A. Smith (1947)
Year of Election or Appointment: 2013
Trustee
Mr. Smith also serves as Trustee of other Fidelity® funds. Prior to Mr. Smith's retirement, he served as Chairman and Chief Executive Officer of Inbrand Corp. (manufacturer of personal absorbent products, 1990-1997). He also served as President (1986-1990) of Inbrand Corp. Prior to his employment with Inbrand Corp., he was employed by a retail fabric chain and North Carolina National Bank. In addition, Mr. Smith served as a Member of the Advisory Board of certain Fidelity® funds (2012-2013) and as a board member of the Jackson Hole Land Trust (2009-2012).
Michael E. Wiley (1950)
Year of Election or Appointment: 2008
Trustee
Chairman of the Independent Trustees
Mr. Wiley also serves as Trustee of other Fidelity® funds. Mr. Wiley serves as a Director of Tesoro Corporation (independent oil refiner and marketer, 2005-present), a Director of Tesoro Logistics LP (natural resources logistics, 2015-present), and a Director of Bill Barrett Corporation (exploration and production, 2005-present). In addition, Mr. Wiley also serves as a Director of Post Oak Bank (privately-held bank, 2004-present). Previously, Mr. Wiley served as a Trustee of other Fidelity® funds (2008-2013), as a Director of Asia Pacific Exploration Consolidated (international oil and gas exploration and production, 2008-2013), as a member of the Board of Trustees of the University of Tulsa (2000-2006; 2007-2010), as a Senior Energy Advisor of Katzenbach Partners, LLC (consulting, 2006-2007), as an Advisory Director of Riverstone Holdings (private investment), Chairman, President, and CEO of Baker Hughes, Inc. (oilfield services, 2000-2004), and as Director of Spinnaker Exploration Company (exploration and production, 2001-2005).
+ The information includes the Trustee's principal occupation during the last five years and other information relating to the experience, attributes, and skills relevant to the Trustee's qualifications to serve as a Trustee, which led to the conclusion that the Trustee should serve as a Trustee for the fund.
Advisory Board Members and Officers:
Correspondence intended for a Member of the Advisory Board may be sent to Fidelity Investments, P.O. Box 55235, Boston, Massachusetts 02205-5235. Except for Anthony R. Rochte, correspondence intended for an officer may be sent to Fidelity Investments, 245 Summer Street, Boston, Massachusetts 02210. Correspondence intended for Mr. Rochte may be sent to SelectCo, 1225 17th Street, Denver, Colorado 80202-5541. Officers appear below in alphabetical order.
Name, Year of Birth; Principal Occupation
Donald F. Donahue (1950)
Year of Election or Appointment: 2015
Member of the Advisory Board
Mr. Donahue also serves as a Trustee or Member of the Advisory Board of other Fidelity® funds. Mr. Donahue is President and Chief Executive Officer of Miranda Partners, LLC (risk consulting for the financial services industry, 2012-present) and a consultant for the Institute for Defense Analyses (national security, 2012-present). Previously, Mr. Donahue served as Chief Executive Officer (2006-2012), Chief Operating Officer (2003-2006), and Managing Director, Customer Marketing and Development (1999-2003) of The Depository Trust & Clearing Corporation (financial markets infrastructure). Mr. Donahue serves as a Member (2012-present) and Co-Chairman (2016-present) of the Board of Directors of United Way of New York, Member of the Board of Directors of NYC Leadership Academy (2012-present) and Member of the Board of Advisors of Ripple Labs, Inc. (financial services, 2015-present). He also served as Chairman (2010-2012) and Member of the Board of Directors (2012-2013) of Omgeo, LLC (financial services), Treasurer of United Way of New York (2012-2016), and Member of the Board of Directors of XBRL US (financial services non-profit, 2009-2012) and the International Securities Services Association (2009-2012).
Carol B. Tomé (1957)
Year of Election or Appointment: 2017
Member of the Advisory Board
Ms. Tomé also serves as Trustee or Member of the Advisory Board of other Fidelity® funds. Ms. Tomé is Chief Financial Officer (2001-present) and Executive Vice President of Corporate Services (2007-present) of The Home Depot, Inc. (home improvement retailer) and a Director (2003-present) and Chair of the Audit Committee (2004-present) of United Parcel Service, Inc. (package delivery and supply chain management). Previously, Ms. Tomé served as Senior Vice President of Finance and Accounting/Treasurer (2000-2007) and Vice President and Treasurer (1995-2000) of The Home Depot, Inc. and Chair of the Board (2010-2012), Vice Chair of the Board (2009 and 2013), and a Director (2008-2013) of the Federal Reserve Bank of Atlanta. Ms. Tomé is also a director or trustee of many community and professional organizations.
Marc R. Bryant (1966)
Year of Election or Appointment: 2013
Secretary and Chief Legal Officer (CLO)
Mr. Bryant also serves as Secretary and CLO of other funds. Mr. Bryant serves as CLO, Secretary, and Senior Vice President of Fidelity Management & Research Company (investment adviser firm, 2015-present) and FMR Co., Inc. (investment adviser firm, 2015-present); Secretary of Fidelity SelectCo, LLC (investment adviser firm, 2015-present) and Fidelity Investments Money Management, Inc. (investment adviser firm, 2015-present); and CLO of Fidelity Management & Research (Hong Kong) Limited and FMR Investment Management (UK) Limited (investment adviser firms, 2015-present) and Fidelity Management & Research (Japan) Limited (investment adviser firm, 2016-present). He is Senior Vice President and Deputy General Counsel of FMR LLC (diversified financial services company). Previously, Mr. Bryant served as Secretary and CLO of Fidelity Rutland Square Trust II (2010-2014) and Assistant Secretary of Fidelity's Fixed Income and Asset Allocation Funds (2013-2015). Prior to joining Fidelity Investments, Mr. Bryant served as a Senior Vice President and the Head of Global Retail Legal for AllianceBernstein L.P. (2006-2010), and as the General Counsel for ProFund Advisors LLC (2001-2006).
Jeffrey S. Christian (1961)
Year of Election or Appointment: 2016
Assistant Treasurer
Mr. Christian also serves as Assistant Treasurer of other funds. Mr. Christian is an employee of Fidelity Investments (2003-present).
William C. Coffey (1969)
Year of Election or Appointment: 2009
Assistant Secretary
Mr. Coffey also serves as Assistant Secretary of other funds. He is Senior Vice President and Deputy General Counsel of FMR LLC (diversified financial services company, 2010-present), and is an employee of Fidelity Investments. Previously, Mr. Coffey served as Vice President and Associate General Counsel of FMR LLC (2005-2009).
Jonathan Davis (1968)
Year of Election or Appointment: 2010
Assistant Treasurer
Mr. Davis also serves as Assistant Treasurer of other funds, and is an employee of Fidelity Investments. Previously, Mr. Davis served as Vice President and Associate General Counsel of FMR LLC (diversified financial services company, 2003-2010).
Adrien E. Deberghes (1967)
Year of Election or Appointment: 2013
President and Treasurer
Mr. Deberghes also serves as an officer of other funds. He serves as Executive Vice President of Fidelity Investments Money Management, Inc. (FIMM) (investment adviser firm, 2016-present) and is an employee of Fidelity Investments (2008-present). Prior to joining Fidelity Investments, Mr. Deberghes was Senior Vice President of Mutual Fund Administration at State Street Corporation (2007-2008), Senior Director of Mutual Fund Administration at Investors Bank & Trust (2005-2007), and Director of Finance for Dunkin' Brands (2000-2005). Previously, Mr. Deberghes served in other fund officer roles.
Joseph DeSantis (1959)
Year of Election or Appointment: 2015
Vice President
Mr. DeSantis also serves as Vice President of other funds. Mr. DeSantis serves as a Director of Fidelity Management & Research (Japan) Limited (investment adviser firm, 2016-present), Chief Investment Officer, Equities (2010-present) and is an employee of Fidelity Investments.
Stephanie J. Dorsey (1969)
Year of Election or Appointment: 2010
Assistant Treasurer
Ms. Dorsey also serves as an officer of other funds. She is an employee of Fidelity Investments (2008-present) and has served in other fund officer roles. Prior to joining Fidelity Investments, Ms. Dorsey served as Treasurer (2004-2008) of the JPMorgan Mutual Funds and Vice President (2004-2008) of JPMorgan Chase Bank.
Howard J. Galligan III (1966)
Year of Election or Appointment: 2014
Chief Financial Officer
Mr. Galligan also serves as Chief Financial Officer of other funds. Mr. Galligan serves as President of Fidelity Pricing and Cash Management Services (FPCMS) (2014-present) and as a Director of Strategic Advisers, Inc. (investment adviser firm, 2008-present). Previously, Mr. Galligan served as Chief Administrative Officer of Asset Management (2011-2014) and Chief Operating Officer and Senior Vice President of Investment Support for Strategic Advisers, Inc. (2003-2011).
Scott C. Goebel (1968)
Year of Election or Appointment: 2015
Vice President
Mr. Goebel serves as Vice President of other funds and is an employee of Fidelity Investments (2001-present). Previously, Mr. Goebel served as Senior Vice President of Fidelity Management & Research Company (FMR) (investment adviser firm, 2016), Secretary of Fidelity SelectCo, LLC (investment adviser firm, 2013-2015), Fidelity Investments Money Management, Inc. (FIMM) (investment adviser firm, 2010-2015), and Fidelity Research and Analysis Company (FRAC) (investment adviser firm, 2010-2015); General Counsel, Secretary, and Senior Vice President of FMR (investment adviser firm, 2008-2015) and FMR Co., Inc. (investment adviser firm, 2008-2015); Assistant Secretary of Fidelity Management & Research (Japan) Limited (investment adviser firm, 2008-2015) and Fidelity Management & Research (U.K.) Inc. (investment adviser firm, 2008-2015); Chief Legal Officer (CLO) of Fidelity Management & Research (Hong Kong) Limited (investment adviser firm, 2008-2015); Secretary and CLO of certain Fidelity® funds (2008-2015); Assistant Secretary of FIMM (2008-2010), FRAC (2008-2010), and certain funds (2007-2008); and as Vice President and Secretary of Fidelity Distributors Corporation (FDC) (2005-2007).
James D. Gryglewicz (1972)
Year of Election or Appointment: 2014
Chief Compliance Officer
Mr. Gryglewicz also serves as Chief Compliance Officer of other funds. Mr. Gryglewicz serves as Compliance Officer of Strategic Advisers, Inc. (investment adviser firm, 2015-present) and Fidelity SelectCo, LLC (investment adviser firm, 2014-present), Senior Vice President of Asset Management Compliance (2009-present), and is an employee of Fidelity Investments (2004-present).
Brian B. Hogan (1964)
Year of Election or Appointment: 2009
Vice President
Mr. Hogan also serves as Trustee or Vice President of other funds. Mr. Hogan serves as a Director of FMR Investment Management (UK) Limited (investment adviser firm, 2015-present) and Fidelity SelectCo, LLC (investment adviser firm, 2014-present) and President of the Equity Division of FMR (investment adviser firm, 2009-present). Previously, Mr. Hogan served as Senior Vice President, Equity Research of FMR (2006-2009) and as a portfolio manager. Mr. Brian B. Hogan is not related to Mr. Colm A. Hogan.
Colm A. Hogan (1973)
Year of Election or Appointment: 2016
Assistant Treasurer
Mr. Hogan also serves as an officer of other funds. Mr. Hogan is an employee of Fidelity Investments (2005-present). Mr. Colm A. Hogan is not related to Mr. Brian B. Hogan.
Chris Maher (1972)
Year of Election or Appointment: 2013
Assistant Treasurer
Mr. Maher serves as Assistant Treasurer of other funds. Mr. Maher is Vice President of Valuation Oversight and is an employee of Fidelity Investments. Previously, Mr. Maher served as Vice President of Asset Management Compliance (2013), Vice President of the Program Management Group of FMR (investment adviser firm, 2010-2013), and Vice President of Valuation Oversight (2008-2010).
John F. Papandrea (1972)
Year of Election or Appointment: 2016
Anti-Money Laundering (AML) Officer
Mr. Papandrea also serves as AML Officer of other funds. Mr. Papandrea is Vice President of FMR LLC (diversified financial services company, 2008-present) and is an employee of Fidelity Investments (2005-present).
Anthony R. Rochte (1968)
Year of Election or Appointment: 2013
Vice President
Mr. Rochte also serves as Vice President of other funds. Mr. Rochte serves as President of Fidelity SelectCo, LLC (investment adviser firm, 2012-present) and is an employee of Fidelity Investments (2012-present). Prior to joining Fidelity Investments, Mr. Rochte served as Senior Managing Director and head of State Street Global Advisors' North American Intermediary Business Group (2006-2012).
Stacie M. Smith (1974)
Year of Election or Appointment: 2013
Assistant Treasurer
Ms. Smith also serves as an officer of other funds. She is an employee of Fidelity Investments (2009-present) and has served in other fund officer roles. Prior to joining Fidelity Investments, Ms. Smith served as Senior Audit Manager of Ernst & Young LLP (accounting firm, 1996-2009). Previously, Ms. Smith served as Deputy Treasurer of certain Fidelity® funds (2013-2016).
Marc L. Spector (1972)
Year of Election or Appointment: 2017
Assistant Treasurer
Mr. Spector also serves as an officer of other funds. Mr. Spector is an employee of Fidelity Investments (2016-present). Prior to joining Fidelity Investments, Mr. Spector served as Director at the Siegfried Group (accounting firm, 2013-2016), and prior to Siegfried Group as audit senior manager at Deloitte & Touche (accounting firm, 2005-2013).
Renee Stagnone (1975)
Year of Election or Appointment: 2016
Assistant Treasurer
Ms. Stagnone also serves as an officer of other funds. Ms. Stagnone is an employee of Fidelity Investments (1997-present). Previously, Ms. Stagnone served as Deputy Treasurer of certain Fidelity® funds (2013-2016).
Shareholder Expense Example
As a shareholder of the Fund, you incur two types of costs: (1) transaction costs, including redemption fees and (2) ongoing costs, including management fees and other Fund expenses. This Example is intended to help you understand your ongoing costs (in dollars) of investing in the Fund and to compare these costs with the ongoing costs of investing in other mutual funds.
The Example is based on an investment of $1,000 invested at the beginning of the period and held for the entire period (July 1, 2016 to December 31, 2016).
Actual Expenses
The first line of the accompanying table for each class of the Fund provides information about actual account values and actual expenses. You may use the information in this line, together with the amount you invested, to estimate the expenses that you paid over the period. Simply divide your account value by $1,000.00 (for example, an $8,600 account value divided by $1,000.00 = 8.6), then multiply the result by the number in the first line for a class of the Fund under the heading entitled "Expenses Paid During Period" to estimate the expenses you paid on your account during this period. The estimate of expenses does not include any fees or other expenses of any variable annuity or variable life insurance product. If they were, the estimate of expenses you paid during the period would be higher, and your ending account value would be lower. In addition, the Fund, as a shareholder in the underlying Fidelity Central Funds, will indirectly bear its pro-rata share of the fees and expenses incurred by the underlying Fidelity Central Funds. These fees and expenses are not included in the Fund's annualized expense ratio used to calculate the expense estimate in the table below.
Hypothetical Example for Comparison Purposes
The second line of the accompanying table for each class of the Fund provides information about hypothetical account values and hypothetical expenses based on a Class' actual expense ratio and an assumed rate of return of 5% per year before expenses, which is not the Class' actual return. The hypothetical account values and expenses may not be used to estimate the actual ending account balance or expenses you paid for the period. You may use this information to compare the ongoing costs of investing in the Fund and other funds. To do so, compare this 5% hypothetical example with the 5% hypothetical examples that appear in the shareholder reports of the other funds. The estimate of expenses does not include any fees or other expenses of any variable annuity or variable life insurance product. If they were, the estimate of expenses you paid during the period would be higher, and your ending account value would be lower. In addition, the Fund, as a shareholder in the underlying Fidelity Central Funds, will indirectly bear its pro-rata share of the fees and expenses incurred by the underlying Fidelity Central Funds. These fees and expenses are not included in the Fund's annualized expense ratio used to calculate the expense estimate in the table below.
Please note that the expenses shown in the table are meant to highlight your ongoing costs only and do not reflect any transaction costs. Therefore, the second line of the table is useful in comparing ongoing costs only, and will not help you determine the relative total costs of owning different funds. In addition, if these transactional costs were included, your costs would have been higher.
| | Annualized Expense Ratio-A | Beginning
Account Value
July 1, 2016 | Ending
Account Value
December 31, 2016 | Expenses Paid
During Period-B
July 1, 2016
to December 31, 2016 |
| Initial Class | .78% | | | |
| Actual | | $1,000.00 | $1,099.50 | $4.12 |
| Hypothetical-C | | $1,000.00 | $1,021.22 | $3.96 |
| Investor Class | .86% | | | |
| Actual | | $1,000.00 | $1,099.10 | $4.54 |
| Hypothetical-C | | $1,000.00 | $1,020.81 | $4.37 |
A Annualized expense ratio reflects expenses net of applicable fee waivers.
B Expenses are equal to each Class' annualized expense ratio, multiplied by the average account value over the period, multiplied by 184/366 (to reflect the one-half year period).
C 5% return per year before expenses
Distributions (Unaudited)
The Board of Trustees of VIP Materials Portfolio voted to pay to shareholders of record at the opening of business on record date, the following distributions per share derived from capital gains realized from sales of portfolio securities, and dividends derived from net investment income:
| | Pay Date | Record Date | Dividends | Capital Gains |
| VIP Materials Portfolio | | | | |
| Initial Class | 02/10/2017 | 02/10/2017 | $0.032 | $0.116 |
| Investor Class | 02/10/2017 | 02/10/2017 | $0.031 | $0.116 |
|
The fund hereby designates as a capital gain dividend with respect to the taxable year ended December 31, 2016, $627,425, or, if subsequently determined to be different, the net capital gain of such year.
Initial Class and Investor Class designate 100% of the dividends distributed in February and December 2016, respectively during the fiscal year as qualifying for the dividends-received deduction for corporate shareholders.
VMATP-ANN-0217
1.850999.109
Fidelity® Variable Insurance Products: Telecommunications Portfolio
Annual Report December 31, 2016 |
|
Contents
To view a fund's proxy voting guidelines and proxy voting record for the 12-month period ended June 30, visit http://www.fidelity.com/proxyvotingresults or visit the Securities and Exchange Commission's (SEC) web site at http://www.sec.gov.
You may also call 1-877-208-0098 to request a free copy of the proxy voting guidelines.
Fidelity® Variable Insurance Products are separate account options which are purchased through a variable insurance contract.
Standard & Poor's, S&P and S&P 500 are registered service marks of The McGraw-Hill Companies, Inc. and have been licensed for use by Fidelity Distributors Corporation.
Other third-party marks appearing herein are the property of their respective owners.
All other marks appearing herein are registered or unregistered trademarks or service marks of FMR LLC or an affiliated company. © 2017 FMR LLC. All rights reserved.
This report and the financial statements contained herein are submitted for the general information of the shareholders of the Fund. This report is not authorized for distribution to prospective investors in the Fund unless preceded or accompanied by an effective prospectus.
A fund files its complete schedule of portfolio holdings with the SEC for the first and third quarters of each fiscal year on Form N-Q. Forms N-Q are available on the SEC’s web site at http://www.sec.gov. A fund's Forms N-Q may be reviewed and copied at the SEC’s Public Reference Room in Washington, DC. Information regarding the operation of the SEC's Public Reference Room may be obtained by calling 1-800-SEC-0330.
For a complete list of a fund's portfolio holdings, view the most recent holdings listing, semiannual report, or annual report on Fidelity's web site at http://www.fidelity.com, http://www.institutional.fidelity.com, or http://www.401k.com, as applicable.
NOT FDIC INSURED •MAY LOSE VALUE •NO BANK GUARANTEE
Neither the Fund nor Fidelity Distributors Corporation is a bank.
Performance: The Bottom Line
Average annual total return reflects the change in the value of an investment, assuming reinvestment of distributions from dividend income and capital gains (the profits earned upon the sale of securities that have grown in value, if any) and assuming a constant rate of performance each year. During periods of reimbursement by Fidelity, a fund’s total return will be greater than it would be had the reimbursement not occurred. Performance numbers are net of all underlying fund operating expenses, but do not include any insurance charges imposed by your insurance company’s separate account. If performance information included the effect of these additional charges, the total returns would have been lower. How a fund did yesterday is no guarantee of how it will do tomorrow.
Average Annual Total Returns
| For the periods ended December 31, 2016 | Past 1 year | Past 5 years | Life of fundA |
| Initial Class | 22.81% | 13.68% | 5.51% |
| Investor Class | 22.69% | 13.60% | 5.43% |
A From April 24, 2007
$10,000 Over Life of Fund
Let's say hypothetically that $10,000 was invested in VIP Telecommunications Portfolio - Initial Class on April 24, 2007, when the fund started.
The chart shows how the value of your investment would have changed, and also shows how the S&P 500® Index performed over the same period.

| Period Ending Values |
| $16,820 | VIP Telecommunications Portfolio - Initial Class |
| $18,651 | S&P 500® Index |
Management's Discussion of Fund Performance
Market Recap: The S&P 500
® index returned 11.96% in 2016, rising sharply on post-election optimism for economic growth. The year began during a fairly volatile stretch, with stocks hampered by persistent oil-price weakness and U.S.-dollar strength. Markets regained momentum in February amid U.S. job gains, a rally in energy and other stimuli that helped keep the roughly seven-year uptrend intact. Markets tumbled briefly following the U.K.’s June 23 vote to exit the European Union – dubbed “Brexit” – then recovered quickly and settled into a flattish stretch until the November 8 U.S. presidential election. Stocks reacted to the outcome by reaching a series of all-time highs. For the year, energy (+27%) led the way amid two strong rallies in commodity prices, one in the spring and another in November. Telecommunication services (+23%) was close behind, as demand for dividend-paying equities was high early in the period. Cyclical sectors, including financials (+22%), industrials (+18%) and materials (+17%), also posted strong gains. Conversely, consumer staples (+5%) and consumer discretionary (+6%) lagged the index, the latter hurt as online competition continued to pressure brick-and-mortar retailers. Real estate (+3%) struggled due to expectations for rising interest rates, while health care (-2%) was hampered by an uncertain political and regulatory outlook.
Comments from Portfolio Manager Matthew Drukker: For the year, the fund’s share classes gained roughly 23%, slightly outpacing the 22.45% result of the MSCI U.S. IMI Telecommunications Services 25/50 Index. The fund’s share classes also topped the S&P 500. Stock selection among wireless telecommunications services, specialized real estate investment trusts (REITs) and alternative carriers, which together accounted for about a third of the fund's holdings, helped the fund outperform the benchmark. In particular, largely avoiding wireless provider NII Holdings, which services the Latin American region, was additive. Timely ownership of voice services provider CenturyLink also helped, as did avoiding voice services provider pdvWireless. Conversely, choices among integrated telecommunications services names hindered the fund's relative returns, led by an underweighting in prepaid calling card provider IDT Corp., a strong-performing index component. We sold the position by period end. Underweighting satellite communications provider Globalstar was another miss. Lastly, I'd like to mention the fund's foreign holdings, such as U.K.-based wireless telecom carrier Vodafone, which were hurt partly due to the strength of the U.S. dollar relative to other major currencies.
The views expressed above reflect those of the portfolio manager(s) only through the end of the period as stated on the cover of this report and do not necessarily represent the views of Fidelity or any other person in the Fidelity organization. Any such views are subject to change at any time based upon market or other conditions and Fidelity disclaims any responsibility to update such views. These views may not be relied on as investment advice and, because investment decisions for a Fidelity fund are based on numerous factors, may not be relied on as an indication of trading intent on behalf of any Fidelity fund.
Investment Summary (Unaudited)
Top Ten Stocks as of December 31, 2016
| | % of fund's net assets | % of fund's net assets 6 months ago |
| Verizon Communications, Inc. | 17.7 | 10.5 |
| AT&T, Inc. | 15.7 | 21.6 |
| T-Mobile U.S., Inc. | 7.0 | 5.0 |
| Level 3 Communications, Inc. | 4.3 | 4.1 |
| SBA Communications Corp. Class A | 4.1 | 4.0 |
| CenturyLink, Inc. | 3.3 | 2.9 |
| Lumos Networks Corp. | 2.7 | 1.9 |
| Cogent Communications Group, Inc. | 2.6 | 3.0 |
| Iridium Communications, Inc. | 2.5 | 1.8 |
| Sprint Corp. | 2.2 | 1.6 |
| | 62.1 | |
Top Industries (% of fund's net assets)
| As of December 31, 2016 |
| | Diversified Telecommunication Services | 66.1% |
| | Wireless Telecommunication Services | 16.1% |
| | Media | 10.7% |
| | Equity Real Estate Investment Trusts (Reits) | 2.8% |
| | Internet Software & Services | 0.9% |
| | All Others* | 3.4% |

* Includes Short-Term investments and Net Other Assets (Liabilities).
| As of June 30, 2016 |
| | Diversified Telecommunication Services | 67.2% |
| | Wireless Telecommunication Services | 14.4% |
| | Media | 7.7% |
| | Real Estate Investment Trusts | 4.9% |
| | Internet Software & Services | 0.9% |
| | All Others* | 4.9% |

* Includes Short-Term investments and Net Other Assets (Liabilities).
Prior period industry classifications reflect the categories in place as of the date indicated and have not been adjusted to reflect current industry classifications.
Investments December 31, 2016
Showing Percentage of Net Assets
| Common Stocks - 97.5% | | | |
| | | Shares | Value |
| Commercial Services & Supplies - 0.4% | | | |
| Office Services & Supplies - 0.4% | | | |
| West Corp. | | 15,300 | $378,828 |
| Communications Equipment - 0.3% | | | |
| Communications Equipment - 0.3% | | | |
| NetScout Systems, Inc. (a) | | 8,300 | 261,450 |
| Diversified Telecommunication Services - 65.4% | | | |
| Alternative Carriers - 15.5% | | | |
| Cogent Communications Group, Inc. | | 56,190 | 2,323,457 |
| Globalstar, Inc. (a)(b) | | 267,900 | 423,282 |
| Iridium Communications, Inc. (a)(b) | | 235,463 | 2,260,445 |
| Level 3 Communications, Inc. (a) | | 68,930 | 3,884,895 |
| Lumos Networks Corp. (a) | | 155,018 | 2,421,381 |
| Vonage Holdings Corp. (a) | | 221,800 | 1,519,330 |
| Zayo Group Holdings, Inc. (a) | | 32,500 | 1,067,950 |
| | | | 13,900,740 |
| Integrated Telecommunication Services - 49.9% | | | |
| AT&T, Inc. | | 331,518 | 14,099,461 |
| Atlantic Tele-Network, Inc. | | 20,400 | 1,634,652 |
| CenturyLink, Inc. (b) | | 123,190 | 2,929,458 |
| Cincinnati Bell, Inc. (a) | | 56,907 | 1,271,871 |
| Consolidated Communications Holdings, Inc. | | 18,600 | 499,410 |
| FairPoint Communications, Inc. (a) | | 34,300 | 641,410 |
| Frontier Communications Corp. (b) | | 566,114 | 1,913,465 |
| General Communications, Inc. Class A (a) | | 58,435 | 1,136,561 |
| Nippon Telegraph & Telephone Corp. | | 600 | 25,257 |
| SBA Communications Corp. Class A (a) | | 35,436 | 3,659,121 |
| Spark New Zealand Ltd. | | 90,092 | 213,421 |
| Verizon Communications, Inc. | | 297,471 | 15,879,002 |
| Windstream Holdings, Inc. (b) | | 129,583 | 949,843 |
| | | | 44,852,932 |
|
| TOTAL DIVERSIFIED TELECOMMUNICATION SERVICES | | | 58,753,672 |
|
| Equity Real Estate Investment Trusts (REITs) - 2.8% | | | |
| Specialized REITs - 2.8% | | | |
| American Tower Corp. | | 17,882 | 1,889,770 |
| Communications Sales & Leasing, Inc. | | 25,200 | 640,332 |
| | | | 2,530,102 |
| Internet & Direct Marketing Retail - 0.5% | | | |
| Internet & Direct Marketing Retail - 0.5% | | | |
| Liberty Interactive Corp. QVC Group Series A (a) | | 22,700 | 453,546 |
| Internet Software & Services - 0.9% | | | |
| Internet Software & Services - 0.9% | | | |
| EarthLink Holdings Corp. | | 27,400 | 154,536 |
| Gogo, Inc. (a)(b) | | 76,500 | 705,330 |
| | | | 859,866 |
| Media - 9.7% | | | |
| Broadcasting - 0.9% | | | |
| Nexstar Broadcasting Group, Inc. Class A (b) | | 13,100 | 829,230 |
| Cable & Satellite - 7.0% | | | |
| Altice NV Class A (a) | | 64,712 | 1,282,682 |
| Charter Communications, Inc. Class A (a) | | 3,513 | 1,011,463 |
| Comcast Corp. Class A | | 16,400 | 1,132,420 |
| DISH Network Corp. Class A (a) | | 17,600 | 1,019,568 |
| Liberty Global PLC: | | | |
| Class C (a) | | 40,000 | 1,188,000 |
| LiLAC Class C (a) | | 8,336 | 176,473 |
| Megacable Holdings S.A.B. de CV unit | | 67,900 | 227,353 |
| NOS SGPS SA | | 43,900 | 260,540 |
| | | | 6,298,499 |
| Movies & Entertainment - 1.8% | | | |
| The Walt Disney Co. | | 6,500 | 677,430 |
| Time Warner, Inc. | | 9,500 | 917,035 |
| | | | 1,594,465 |
|
| TOTAL MEDIA | | | 8,722,194 |
|
| Semiconductors & Semiconductor Equipment - 0.9% | | | |
| Semiconductors - 0.9% | | | |
| Broadcom Ltd. | | 2,400 | 424,248 |
| Qorvo, Inc. (a) | | 7,400 | 390,202 |
| | | | 814,450 |
| Technology Hardware, Storage & Peripherals - 0.5% | | | |
| Technology Hardware, Storage & Peripherals - 0.5% | | | |
| Apple, Inc. | | 3,700 | 428,534 |
| Wireless Telecommunication Services - 16.1% | | | |
| Wireless Telecommunication Services - 16.1% | | | |
| KDDI Corp. | | 19,100 | 482,332 |
| Millicom International Cellular SA | | 3,900 | 165,165 |
| NII Holdings, Inc. (a) | | 163,500 | 351,525 |
| Shenandoah Telecommunications Co. | | 26,374 | 720,010 |
| Sprint Corp. (a) | | 240,116 | 2,021,777 |
| T-Mobile U.S., Inc. (a) | | 109,128 | 6,275,951 |
| Telephone & Data Systems, Inc. | | 68,125 | 1,966,769 |
| U.S. Cellular Corp. (a) | | 42,200 | 1,844,984 |
| VimpelCom Ltd. sponsored ADR | | 6,000 | 23,100 |
| Vodafone Group PLC | | 243,300 | 598,732 |
| | | | 14,450,345 |
| TOTAL COMMON STOCKS | | | |
| (Cost $75,389,485) | | | 87,652,987 |
|
| Nonconvertible Preferred Stocks - 0.7% | | | |
| Diversified Telecommunication Services - 0.7% | | | |
| Integrated Telecommunication Services - 0.7% | | | |
| Telecom Italia SpA (Risparmio Shares) | | | |
| (Cost $522,332) | | 845,000 | 611,079 |
| | | Principal Amount | Value |
|
| Convertible Bonds - 1.0% | | | |
| Media - 1.0% | | | |
| Cable & Satellite - 1.0% | | | |
| DISH Network Corp. 3.375% 8/15/26(c) | | | |
| (Cost $800,000) | | 800,000 | 910,500 |
| | | Shares | Value |
|
| Money Market Funds - 10.1% | | | |
| Fidelity Cash Central Fund, 0.60% (d) | | 1,804,271 | 1,804,632 |
| Fidelity Securities Lending Cash Central Fund 0.65% (d)(e) | | 7,224,475 | 7,225,198 |
| TOTAL MONEY MARKET FUNDS | | | |
| (Cost $9,029,247) | | | 9,029,830 |
| TOTAL INVESTMENT PORTFOLIO - 109.3% | | | |
| (Cost $85,741,064) | | | 98,204,396 |
| NET OTHER ASSETS (LIABILITIES) - (9.3)% | | | (8,348,364) |
| NET ASSETS - 100% | | | $89,856,032 |
Legend
(a) Non-income producing
(b) Security or a portion of the security is on loan at period end.
(c) Security exempt from registration under Rule 144A of the Securities Act of 1933. These securities may be resold in transactions exempt from registration, normally to qualified institutional buyers. At the end of the period, the value of these securities amounted to $910,500 or 1.0% of net assets.
(d) Affiliated fund that is generally available only to investment companies and other accounts managed by Fidelity Investments. The rate quoted is the annualized seven-day yield of the fund at period end. A complete unaudited listing of the fund's holdings as of its most recent quarter end is available upon request. In addition, each Fidelity Central Fund's financial statements, which are not covered by the Fund's Report of Independent Registered Public Accounting Firm, are available on the SEC's website or upon request.
(e) Investment made with cash collateral received from securities on loan.
Affiliated Central Funds
Information regarding fiscal year to date income earned by the Fund from investments in Fidelity Central Funds is as follows:
| Fund | Income earned |
| Fidelity Cash Central Fund | $6,262 |
| Fidelity Securities Lending Cash Central Fund | 64,641 |
| Total | $70,903 |
Investment Valuation
The following is a summary of the inputs used, as of December 31, 2016, involving the Fund's assets and liabilities carried at fair value. The inputs or methodology used for valuing securities may not be an indication of the risk associated with investing in those securities. For more information on valuation inputs, and their aggregation into the levels used below, please refer to the Investment Valuation section in the accompanying Notes to Financial Statements.
| | Valuation Inputs at Reporting Date: |
| Description | Total | Level 1 | Level 2 | Level 3 |
| Investments in Securities: | | | | |
| Common Stocks | $87,652,987 | $86,546,666 | $1,106,321 | $-- |
| Nonconvertible Preferred Stocks | 611,079 | 611,079 | -- | -- |
| Convertible Bonds | 910,500 | -- | 910,500 | -- |
| Money Market Funds | 9,029,830 | 9,029,830 | -- | -- |
| Total Investments in Securities: | $98,204,396 | $96,187,575 | $2,016,821 | $-- |
See accompanying notes which are an integral part of the financial statements.
Financial Statements
Statement of Assets and Liabilities
| | | December 31, 2016 |
| Assets | | |
Investment in securities, at value (including securities loaned of $6,861,648) — See accompanying schedule:
Unaffiliated issuers (cost $76,711,817) | $89,174,566 | |
| Fidelity Central Funds (cost $9,029,247) | 9,029,830 | |
| Total Investments (cost $85,741,064) | | $98,204,396 |
| Foreign currency held at value (cost $50,475) | | 50,475 |
| Receivable for fund shares sold | | 218,813 |
| Dividends receivable | | 69,626 |
| Interest receivable | | 10,725 |
| Distributions receivable from Fidelity Central Funds | | 10,452 |
| Prepaid expenses | | 439 |
| Other receivables | | 3,103 |
| Total assets | | 98,568,029 |
| Liabilities | | |
| Payable for investments purchased | $1,052,011 | |
| Payable for fund shares redeemed | 340,102 | |
| Accrued management fee | 39,056 | |
| Other affiliated payables | 12,310 | |
| Other payables and accrued expenses | 44,548 | |
| Collateral on Securities Loaned | 7,223,970 | |
| Total liabilities | | 8,711,997 |
| Net Assets | | $89,856,032 |
| Net Assets consist of: | | |
| Paid in capital | | $78,024,103 |
| Undistributed net investment income | | 6,594 |
| Accumulated undistributed net realized gain (loss) on investments and foreign currency transactions | | (637,284) |
| Net unrealized appreciation (depreciation) on investments and assets and liabilities in foreign currencies | | 12,462,619 |
| Net Assets | | $89,856,032 |
| Initial Class: | | |
| Net Asset Value, offering price and redemption price per share ($15,797,459 ÷ 1,205,482 shares) | | $13.10 |
| Investor Class: | | |
| Net Asset Value, offering price and redemption price per share ($74,058,573 ÷ 5,687,259 shares) | | $13.02 |
See accompanying notes which are an integral part of the financial statements.
Statement of Operations
| | | Year ended December 31, 2016 |
| Investment Income | | |
| Dividends | | $1,444,591 |
| Interest | | 11,932 |
| Income from Fidelity Central Funds | | 70,903 |
| Total income | | 1,527,426 |
| Expenses | | |
| Management fee | $363,503 | |
| Transfer agent fees | 87,570 | |
| Accounting and security lending fees | 26,881 | |
| Custodian fees and expenses | 33,639 | |
| Independent trustees' fees and expenses | 1,299 | |
| Audit | 49,357 | |
| Legal | 980 | |
| Miscellaneous | 732 | |
| Total expenses before reductions | 563,961 | |
| Expense reductions | (8,831) | 555,130 |
| Net investment income (loss) | | 972,296 |
| Realized and Unrealized Gain (Loss) | | |
| Net realized gain (loss) on: | | |
| Investment securities: | | |
| Unaffiliated issuers | 57,621 | |
| Fidelity Central Funds | 531 | |
| Foreign currency transactions | 2,965 | |
| Total net realized gain (loss) | | 61,117 |
Change in net unrealized appreciation (depreciation) on:
Investment securities | 10,317,791 | |
| Assets and liabilities in foreign currencies | (253) | |
| Total change in net unrealized appreciation (depreciation) | | 10,317,538 |
| Net gain (loss) | | 10,378,655 |
| Net increase (decrease) in net assets resulting from operations | | $11,350,951 |
See accompanying notes which are an integral part of the financial statements.
Statement of Changes in Net Assets
| | Year ended December 31, 2016 | Year ended December 31, 2015 |
| Increase (Decrease) in Net Assets | | |
| Operations | | |
| Net investment income (loss) | $972,296 | $312,537 |
| Net realized gain (loss) | 61,117 | 279,336 |
| Change in net unrealized appreciation (depreciation) | 10,317,538 | (372,405) |
| Net increase (decrease) in net assets resulting from operations | 11,350,951 | 219,468 |
| Distributions to shareholders from net investment income | (941,662) | (311,150) |
| Distributions to shareholders from net realized gain | (495,524) | (21,429) |
| Total distributions | (1,437,186) | (332,579) |
| Share transactions - net increase (decrease) | 51,997,297 | 8,141,341 |
| Redemption fees | 26,145 | 8,719 |
| Total increase (decrease) in net assets | 61,937,207 | 8,036,949 |
| Net Assets | | |
| Beginning of period | 27,918,825 | 19,881,876 |
| End of period | $89,856,032 | $27,918,825 |
| Other Information | | |
| Undistributed net investment income end of period | $6,594 | $– |
| Distributions in excess of net investment income end of period | $– | $(25,619) |
See accompanying notes which are an integral part of the financial statements.
Financial Highlights — VIP Telecommunications Portfolio Initial Class
| Years ended December 31, | 2016 | 2015 | 2014 | 2013 | 2012 |
| Selected Per–Share Data | | | | | |
| Net asset value, beginning of period | $10.85 | $10.74 | $10.77 | $9.27 | $7.81 |
| Income from Investment Operations | | | | | |
| Net investment income (loss)A | .19 | .15 | .36B | .17 | .17 |
| Net realized and unrealized gain (loss) | 2.28 | .10C | .03 | 1.77 | 1.41 |
| Total from investment operations | 2.47 | .25 | .39 | 1.94 | 1.58 |
| Distributions from net investment income | (.15) | (.13)D | (.40) | (.15) | (.12) |
| Distributions from net realized gain | (.08) | (.01)D | (.02) | (.30) | – |
| Total distributions | (.22)E | (.14) | (.42) | (.45) | (.12) |
| Redemption fees added to paid in capitalA | –F | –F | –F | .01 | –F |
| Net asset value, end of period | $13.10 | $10.85 | $10.74 | $10.77 | $9.27 |
| Total ReturnG,H | 22.81% | 2.34% | 3.59% | 21.28% | 20.24% |
| Ratios to Average Net AssetsI,J | | | | | |
| Expenses before reductions | .78% | .88% | .96% | 1.02% | 1.11% |
| Expenses net of fee waivers, if any | .78% | .88% | .95% | 1.00% | 1.00% |
| Expenses net of all reductions | .77% | .87% | .93% | .99% | .99% |
| Net investment income (loss) | 1.52% | 1.36% | 3.31%B | 1.64% | 1.94% |
| Supplemental Data | | | | | |
| Net assets, end of period (000 omitted) | $15,797 | $4,839 | $3,723 | $4,535 | $6,823 |
| Portfolio turnover rateK | 100% | 64% | 99% | 136% | 55% |
A Calculated based on average shares outstanding during the period.
B Net Investment income per share reflects a large, non-recurring dividend which amounted to $.21 per share. Excluding this non-recurring dividend, the ratio of net investment income (loss) to average net assets would have been 1.41%.
C The amount shown for a share outstanding does not correspond with the aggregate net gain (loss) on investments for the period due to the timing of sales and repurchases of shares in relation to fluctuating market values of the investments of the Fund.
D The amounts shown reflect certain reclassifications related to book to tax differences that were made in the year shown.
E Total distributions of $.22 per share is comprised of distributions from net investment income of $.147 and distributions from net realized gain of $.077 per share.
F Amount represents less than $.005 per share.
G Total returns do not reflect charges attributable to your insurance company's separate account. Inclusion of these charges would reduce the total returns shown.
H Total returns would have been lower if certain expenses had not been reduced during the applicable periods shown.
I Fees and expenses of any underlying Fidelity Central Funds are not included in the Fund's expense ratio. The Fund indirectly bears its proportionate share of the expenses of any underlying Fidelity Central Funds.
J Expense ratios reflect operating expenses of the class. Expenses before reductions do not reflect amounts reimbursed by the investment adviser or reductions from brokerage service arrangements or reductions from other expense offset arrangements and do not represent the amount paid by the class during periods when reimbursements or reductions occur. Expenses net of fee waivers reflect expenses after reimbursement by the investment adviser but prior to reductions from brokerage service arrangements or other expense offset arrangements. Expenses net of all reductions represent the net expenses paid by the class.
K Amount does not include the portfolio activity of any underlying Fidelity Central Funds.
See accompanying notes which are an integral part of the financial statements.
Financial Highlights — VIP Telecommunications Portfolio Investor Class
| Years ended December 31, | 2016 | 2015 | 2014 | 2013 | 2012 |
| Selected Per–Share Data | | | | | |
| Net asset value, beginning of period | $10.79 | $10.67 | $10.71 | $9.22 | $7.78 |
| Income from Investment Operations | | | | | |
| Net investment income (loss)A | .18 | .14 | .35B | .16 | .16 |
| Net realized and unrealized gain (loss) | 2.27 | .11C | .03 | 1.77 | 1.40 |
| Total from investment operations | 2.45 | .25 | .38 | 1.93 | 1.56 |
| Distributions from net investment income | (.14) | (.12)D | (.40) | (.15) | (.12) |
| Distributions from net realized gain | (.08) | (.01)D | (.02) | (.30) | – |
| Total distributions | (.22) | (.13) | (.42) | (.45) | (.12) |
| Redemption fees added to paid in capitalA | –E | –E | –E | .01 | –E |
| Net asset value, end of period | $13.02 | $10.79 | $10.67 | $10.71 | $9.22 |
| Total ReturnF,G | 22.69% | 2.38% | 3.48% | 21.27% | 20.00% |
| Ratios to Average Net AssetsH,I | | | | | |
| Expenses before reductions | .86% | .95% | 1.01% | 1.07% | 1.18% |
| Expenses net of fee waivers, if any | .86% | .95% | .99% | 1.07% | 1.08% |
| Expenses net of all reductions | .85% | .94% | .97% | 1.06% | 1.07% |
| Net investment income (loss) | 1.44% | 1.29% | 3.27%B | 1.57% | 1.86% |
| Supplemental Data | | | | | |
| Net assets, end of period (000 omitted) | $74,059 | $23,080 | $16,159 | $17,112 | $11,510 |
| Portfolio turnover rateJ | 100% | 64% | 99% | 136% | 55% |
A Calculated based on average shares outstanding during the period.
B Net Investment income per share reflects a large, non-recurring dividend which amounted to $.21 per share. Excluding this non-recurring dividend, the ratio of net investment income (loss) to average net assets would have been 1.37%.
C The amount shown for a share outstanding does not correspond with the aggregate net gain (loss) on investments for the period due to the timing of sales and repurchases of shares in relation to fluctuating market values of the investments of the Fund.
D The amounts shown reflect certain reclassifications related to book to tax differences that were made in the year shown.
E Amount represents less than $.005 per share.
F Total returns do not reflect charges attributable to your insurance company's separate account. Inclusion of these charges would reduce the total returns shown.
G Total returns would have been lower if certain expenses had not been reduced during the applicable periods shown.
H Fees and expenses of any underlying Fidelity Central Funds are not included in the Fund's expense ratio. The Fund indirectly bears its proportionate share of the expenses of any underlying Fidelity Central Funds.
I Expense ratios reflect operating expenses of the class. Expenses before reductions do not reflect amounts reimbursed by the investment adviser or reductions from brokerage service arrangements or reductions from other expense offset arrangements and do not represent the amount paid by the class during periods when reimbursements or reductions occur. Expenses net of fee waivers reflect expenses after reimbursement by the investment adviser but prior to reductions from brokerage service arrangements or other expense offset arrangements. Expenses net of all reductions represent the net expenses paid by the class.
J Amount does not include the portfolio activity of any underlying Fidelity Central Funds.
See accompanying notes which are an integral part of the financial statements.
Notes to Financial Statements
For the period ended December 31, 2016
1. Organization.
VIP Telecommunications Portfolio (the Fund) is a non-diversified fund of Variable Insurance Products Fund IV (the Trust) and is authorized to issue an unlimited number of shares. The Trust is registered under the Investment Company Act of 1940, as amended (the 1940 Act), as an open-end management investment company organized as a Massachusetts business trust. Shares of the Fund may only be purchased by insurance companies for the purpose of funding variable annuity or variable life insurance contracts. The Fund offers the following classes of shares: Initial Class shares and Investor Class shares. All classes have equal rights and voting privileges, except for matters affecting a single class.
2. Investments in Fidelity Central Funds.
The Fund invests in Fidelity Central Funds, which are open-end investment companies generally available only to other investment companies and accounts managed by the investment adviser and its affiliates. The Fund's Schedule of Investments lists each of the Fidelity Central Funds held as of period end, if any, as an investment of the Fund, but does not include the underlying holdings of each Fidelity Central Fund. As an Investing Fund, the Fund indirectly bears its proportionate share of the expenses of the underlying Fidelity Central Funds.
The Money Market Central Funds seek preservation of capital and current income and are managed by Fidelity Investments Money Management, Inc. (FIMM), an affiliate of the investment adviser. Annualized expenses of the Money Market Central Funds as of their most recent shareholder report date are less than .005%.
A complete unaudited list of holdings for each Fidelity Central Fund is available upon request or at the Securities and Exchange Commission (the SEC) website at www.sec.gov. In addition, the financial statements of the Fidelity Central Funds, which are not covered by the Fund's Report of Independent Registered Public Accounting Firm, are available on the SEC website or upon request.
3. Significant Accounting Policies.
The financial statements have been prepared in conformity with accounting principles generally accepted in the United States of America (GAAP), which require management to make certain estimates and assumptions at the date of the financial statements. Actual results could differ from those estimates. Subsequent events, if any, through the date that the financial statements were issued have been evaluated in the preparation of the financial statements. The following summarizes the significant accounting policies of the Fund:
Investment Valuation. Investments are valued as of 4:00 p.m. Eastern time on the last calendar day of the period. The Board of Trustees (the Board) has delegated the day to day responsibility for the valuation of the Fund's investments to the Fair Value Committee (the Committee) established by the Fund's investment adviser. In accordance with valuation policies and procedures approved by the Board, the Fund attempts to obtain prices from one or more third party pricing vendors or brokers to value its investments. When current market prices, quotations or currency exchange rates are not readily available or reliable, investments will be fair valued in good faith by the Committee, in accordance with procedures adopted by the Board. Factors used in determining fair value vary by investment type and may include market or investment specific events, changes in interest rates and credit quality. The frequency with which these procedures are used cannot be predicted and they may be utilized to a significant extent. The Committee oversees the Fund's valuation policies and procedures and reports to the Board on the Committee's activities and fair value determinations. The Board monitors the appropriateness of the procedures used in valuing the Fund's investments and ratifies the fair value determinations of the Committee.
The Fund categorizes the inputs to valuation techniques used to value its investments into a disclosure hierarchy consisting of three levels as shown below:
- Level 1 – quoted prices in active markets for identical investments
- Level 2 – other significant observable inputs (including quoted prices for similar investments, interest rates, prepayment speeds, etc.)
- Level 3 – unobservable inputs (including the Fund's own assumptions based on the best information available)
Valuation techniques used to value the Fund's investments by major category are as follows:
Equity securities, including restricted securities, for which market quotations are readily available, are valued at the last reported sale price or official closing price as reported by a third party pricing vendor on the primary market or exchange on which they are traded and are categorized as Level 1 in the hierarchy. In the event there were no sales during the day or closing prices are not available, securities are valued at the last quoted bid price or may be valued using the last available price and are generally categorized as Level 2 in the hierarchy. For foreign equity securities, when market or security specific events arise, comparisons to the valuation of American Depositary Receipts (ADRs), futures contracts, Exchange-Traded Funds (ETFs) and certain indexes as well as quoted prices for similar securities may be used and would be categorized as Level 2 in the hierarchy. Utilizing these techniques may result in transfers between Level 1 and Level 2. For equity securities, including restricted securities, where observable inputs are limited, assumptions about market activity and risk are used and these securities may be categorized as Level 3 in the hierarchy.
Debt securities, including restricted securities, are valued based on evaluated prices received from third party pricing vendors or from brokers who make markets in such securities. Corporate bonds are valued by pricing vendors who utilize matrix pricing which considers prepayment speed assumptions, attributes of the collateral, yield or price of bonds of comparable quality, coupon, maturity and type or by broker-supplied prices. When independent prices are unavailable or unreliable, debt securities may be valued utilizing pricing methodologies which consider similar factors that would be used by third party pricing vendors. Debt securities are generally categorized as Level 2 in the hierarchy but may be Level 3 depending on the circumstances.
Investments in open-end mutual funds, including the Fidelity Central Funds, are valued at their closing net asset value (NAV) each business day and are categorized as Level 1 in the hierarchy.
Changes in valuation techniques may result in transfers in or out of an assigned level within the disclosure hierarchy. The aggregate value of investments by input level as of December 31, 2016 is included at the end of the Fund's Schedule of Investments.
Foreign Currency. The Fund may use foreign currency contracts to facilitate transactions in foreign-denominated securities. Gains and losses from these transactions may arise from changes in the value of the foreign currency or if the counterparties do not perform under the contracts' terms.
Foreign-denominated assets, including investment securities, and liabilities are translated into U.S. dollars at the exchange rates at period end. Purchases and sales of investment securities, income and dividends received and expenses denominated in foreign currencies are translated into U.S. dollars at the exchange rate in effect on the transaction date.
The effects of exchange rate fluctuations on investments are included with the net realized and unrealized gain (loss) on investment securities. Other foreign currency transactions resulting in realized and unrealized gain (loss) are disclosed separately.
Investment Transactions and Income. For financial reporting purposes, the Fund's investment holdings and NAV include trades executed through the end of the last business day of the period. The NAV per share for processing shareholder transactions is calculated as of the close of business of the New York Stock Exchange (NYSE), normally 4:00 p.m. Eastern time and includes trades executed through the end of the prior business day. Gains and losses on securities sold are determined on the basis of identified cost and may include proceeds received from litigation. Dividend income is recorded on the ex-dividend date, except for certain dividends from foreign securities where the ex-dividend date may have passed, which are recorded as soon as the Fund is informed of the ex-dividend date. Non-cash dividends included in dividend income, if any, are recorded at the fair market value of the securities received. Income and capital gain distributions from Fidelity Central Funds, if any, are recorded on the ex-dividend date. Certain distributions received by the Fund represent a return of capital or capital gain. The Fund determines the components of these distributions subsequent to the ex-dividend date, based upon receipt of tax filings or other correspondence relating to the underlying investment. These distributions are recorded as a reduction of cost of investments and/or as a realized gain. Interest income is accrued as earned and includes coupon interest and amortization of premium and accretion of discount on debt securities as applicable. Investment income is recorded net of foreign taxes withheld where recovery of such taxes is uncertain.
Class Allocations and Expenses. Investment income, realized and unrealized capital gains and losses, common expenses of the Fund, and certain fund-level expense reductions, if any, are allocated daily on a pro-rata basis to each class based on the relative net assets of each class to the total net assets of the Fund. Each class differs with respect to transfer agent fees incurred. Certain expense reductions may also differ by class. For the reporting period, the allocated portion of income and expenses to each class as a percent of its average net assets may vary due to the timing of recording these transactions in relation to fluctuating net assets of the classes. Expenses directly attributable to a fund are charged to that fund. Expenses attributable to more than one fund are allocated among the respective funds on the basis of relative net assets or other appropriate methods. Expense estimates are accrued in the period to which they relate and adjustments are made when actual amounts are known.
Income Tax Information and Distributions to Shareholders. Each year, the Fund intends to qualify as a regulated investment company under Subchapter M of the Internal Revenue Code, including distributing substantially all of its taxable income and realized gains. As a result, no provision for U.S. Federal income taxes is required. As of December 31, 2016, the Fund did not have any unrecognized tax benefits in the financial statements; nor is the Fund aware of any tax positions for which it is reasonably possible that the total amounts of unrecognized tax benefits will significantly change in the next twelve months. The Fund files a U.S. federal tax return, in addition to state and local tax returns as required. The Fund's federal income tax returns are subject to examination by the Internal Revenue Service (IRS) for a period of three fiscal years after they are filed. State and local tax returns may be subject to examination for an additional fiscal year depending on the jurisdiction. Foreign taxes are provided for based on the Fund's understanding of the tax rules and rates that exist in the foreign markets in which it invests.
Distributions are declared and recorded on the ex-dividend date. Income dividends and capital gain distributions are declared separately for each class. Income and capital gain distributions are determined in accordance with income tax regulations, which may differ from GAAP.
Capital accounts within the financial statements are adjusted for permanent book-tax differences. These adjustments have no impact on net assets or the results of operations. Capital accounts are not adjusted for temporary book-tax differences which will reverse in a subsequent period.
Book-tax differences are primarily due to foreign currency transactions and losses deferred due to wash sales.
The federal tax cost of investment securities and unrealized appreciation (depreciation) as of period end were as follows:
| Gross unrealized appreciation | $13,371,602 |
| Gross unrealized depreciation | (2,112,222) |
| Net unrealized appreciation (depreciation) on securities | $11,259,380 |
| Tax Cost | $86,945,016 |
The tax-based components of distributable earnings as of period end were as follows:
| Undistributed ordinary income | $15,653 |
| Undistributed long-term capital gain | $557,608 |
| Net unrealized appreciation (depreciation) on securities and other investments | $11,258,667 |
The tax character of distributions paid was as follows:
| | December 31, 2016 | December 31, 2015 |
| Ordinary Income | $1,425,624 | $ 311,150 |
| Long-term Capital Gains | 11,562 | 21,429 |
| Total | $1,437,186 | $ 332,579 |
Trading (Redemption) Fees. Shares held by investors less than 60 days may be subject to a redemption fee equal to 1% of the NAV of shares redeemed. All redemption fees, which reduce the proceeds of the shareholder redemption, are retained by the Fund and accounted for as an addition to paid in capital.
Restricted Securities. The Fund may invest in securities that are subject to legal or contractual restrictions on resale. These securities generally may be resold in transactions exempt from registration or to the public if the securities are registered. Disposal of these securities may involve time-consuming negotiations and expense, and prompt sale at an acceptable price may be difficult. Information regarding restricted securities is included at the end of the Fund's Schedule of Investments.
4. Purchases and Sales of Investments.
Purchases and sales of securities, other than short-term securities, aggregated $116,293,632 and $64,979,907, respectively.
5. Fees and Other Transactions with Affiliates.
Management Fee. Fidelity SelectCo, LLC (the investment adviser) and its affiliates provide the Fund with investment management related services for which the Fund pays a monthly management fee. The management fee is the sum of an individual fund fee rate that is based on an annual rate of .30% of the Fund's average net assets and an annualized group fee rate that averaged .25% during the period. The group fee rate is based upon the average net assets of all the mutual funds advised by Fidelity Management & Research Company (FMR) and the investment adviser. The group fee rate decreases as assets under management increase and increases as assets under management decrease. For the reporting period, the total annual management fee rate was .54% of the Fund's average net assets.
Transfer Agent Fees. Fidelity Investments Institutional Operations Company, Inc. (FIIOC), an affiliate of the investment adviser, is the Fund's transfer, dividend disbursing, and shareholder servicing agent. FIIOC receives an asset-based fee with respect to each class. Each class (with the exception of Investor Class) pays a fee for transfer agent services, typesetting, and printing and mailing of shareholder reports, excluding mailing of proxy statements, equal to an annual rate of .07% (.15% for Investor Class) of class-level average net assets. For the period, transfer agent fees for each class were as follows:
| Initial Class | $8,131 |
| Investor Class | 79,439 |
| | $87,570 |
Accounting and Security Lending Fees. Fidelity Service Company, Inc. (FSC), an affiliate of the investment adviser, maintains the Fund's accounting records. The accounting fee is based on the level of average net assets for each month. Under a separate contract, FSC administers the security lending program. The security lending fee is based on the number and duration of lending transactions.
Brokerage Commissions. The Fund placed a portion of its portfolio transactions with brokerage firms which are affiliates of the investment adviser. Brokerage commissions are included in net realized gain (loss) and change in net unrealized appreciation (depreciation) in the Statement of Operations. The commissions paid to these affiliated firms were $4,658 for the period.
Interfund Trades. The Fund may purchase from or sell securities to other Fidelity Funds under procedures adopted by the Board. The procedures have been designed to ensure these interfund trades are executed in accordance with Rule 17a-7 of the 1940 Act. Interfund trades are included within the respective purchases and sales amounts shown in the Purchases and Sales of Investments note.
6. Committed Line of Credit.
The Fund participates with other funds managed by the investment adviser or an affiliate in a $4.25 billion credit facility (the "line of credit") to be utilized for temporary or emergency purposes to fund shareholder redemptions or for other short-term liquidity purposes. The Fund has agreed to pay commitment fees on its pro-rata portion of the line of credit, which amounted to $150 and is reflected in Miscellaneous expenses on the Statement of Operations. During the period, the Fund did not borrow on this line of credit.
7. Security Lending.
The Fund lends portfolio securities through a lending agent from time to time in order to earn additional income. On the settlement date of the loan, the Fund receives collateral (in the form of U.S. Treasury obligations, letters of credit and/or cash) against the loaned securities and maintains collateral in an amount not less than 100% of the market value of the loaned securities during the period of the loan. The market value of the loaned securities is determined at the close of business of the Fund and any additional required collateral is delivered to the Fund on the next business day. The Fund or borrower may terminate the loan at any time, and if the borrower defaults on its obligation to return the securities loaned because of insolvency or other reasons, the Fund may apply collateral received from the borrower against the obligation. The Fund may experience delays and costs in recovering the securities loaned. Any cash collateral received is invested in the Fidelity Securities Lending Cash Central Fund. The value of loaned securities and cash collateral at period end are disclosed on the Fund's Statement of Assets and Liabilities. Security lending income represents the income earned on investing cash collateral, less rebates paid to borrowers and any lending agent fees associated with the loan, plus any premium payments received for lending certain types of securities. Security lending income is presented in the Statement of Operations as a component of income from Fidelity Central Funds. Total security lending income during the period amounted to $64,641.
8. Expense Reductions.
Commissions paid to certain brokers with whom the investment adviser, or its affiliates, places trades on behalf of the Fund include an amount in addition to trade execution, which may be rebated back to the Fund to offset certain expenses. This amount totaled $8,635 for the period.
In addition, during the period the investment adviser reimbursed and/or waived a portion of fund-level operating expenses in the amount of $196.
9. Distributions to Shareholders.
Distributions to shareholders of each class were as follows:
| | Year ended
December 31, 2016 | Year ended
December 31, 2015 |
| From net investment income | | |
| Initial Class | $168,720 | $55,523 |
| Investor Class | 772,942 | 255,627 |
| Total | $941,662 | $311,150 |
| From net realized gain | | |
| Initial Class | $85,642 | $3,651 |
| Investor Class | 409,882 | 17,778 |
| Total | $495,524 | $21,429 |
10. Share Transactions.
Transactions for each class of shares were as follows:
| | Shares | Shares | Dollars | Dollars |
| | Year ended December 31, 2016 | Year ended December 31, 2015 | Year ended December 31, 2016 | Year ended December 31, 2015 |
| Initial Class | | | | |
| Shares sold | 1,468,085 | 219,127 | $17,998,963 | $2,438,121 |
| Reinvestment of distributions | 19,392 | 5,636 | 254,362 | 59,174 |
| Shares redeemed | (727,804) | (125,755) | (9,092,693) | (1,382,815) |
| Net increase (decrease) | 759,673 | 99,008 | $9,160,632 | $1,114,480 |
| Investor Class | | | | |
| Shares sold | 5,023,638 | 1,170,298 | $60,915,905 | $12,959,776 |
| Reinvestment of distributions | 90,815 | 26,188 | 1,182,824 | 273,405 |
| Shares redeemed | (1,566,095) | (571,453) | (19,262,064) | (6,206,320) |
| Net increase (decrease) | 3,548,358 | 625,033 | $42,836,665 | $7,026,861 |
11. Other.
The Fund's organizational documents provide former and current trustees and officers with a limited indemnification against liabilities arising in connection with the performance of their duties to the Fund. In the normal course of business, the Fund may also enter into contracts that provide general indemnifications. The Fund's maximum exposure under these arrangements is unknown as this would be dependent on future claims that may be made against the Fund. The risk of material loss from such claims is considered remote.
At the end of the period, the investment adviser or its affiliates were the owners of record of 100% of the total outstanding shares of the Fund.
Report of Independent Registered Public Accounting Firm
To the Trustees of Variable Insurance Products Fund IV and Shareholders of VIP Telecommunications Portfolio:
In our opinion, the accompanying statement of assets and liabilities, including the schedule of investments, and the related statements of operations and of changes in net assets and the financial highlights present fairly, in all material respects, the financial position of VIP Telecommunications Portfolio (a fund of Variable Insurance Products Fund IV) as of December 31,2016, the results of its operations for the year then ended and the financial highlights for each of the five years in the period then ended, in conformity with accounting principles generally accepted in the United States of America. These financial statements and financial highlights (hereafter referred to as “financial statements”) are the responsibility of the Fund's management. Our responsibility is to express an opinion on these financial statements based on our audits. We conducted our audits of these financial statements in accordance with the standards of the Public Company Accounting Oversight Board (United States). Those standards require that we plan and perform the audit to obtain reasonable assurance about whether the financial statements are free of material misstatement. An audit includes examining, on a test basis, evidence supporting the amounts and disclosures in the financial statements, assessing the accounting principles used and significant estimates made by management, and evaluating the overall financial statement presentation. We believe that our audits, which included confirmation of securities as of December 31,2016 by correspondence with the custodian and brokers, provide a reasonable basis for our opinion.
PricewaterhouseCoopers LLP
Boston, Massachusetts
February 16, 2017
Trustees and Officers
The Trustees, Members of the Advisory Board (if any), and officers of the trust and fund, as applicable, are listed below. The Board of Trustees governs the fund and is responsible for protecting the interests of shareholders. The Trustees are experienced executives who meet periodically throughout the year to oversee the fund's activities, review contractual arrangements with companies that provide services to the fund, oversee management of the risks associated with such activities and contractual arrangements, and review the fund's performance. Each of the Trustees oversees 83 funds.
The Trustees hold office without limit in time except that (a) any Trustee may resign; (b) any Trustee may be removed by written instrument, signed by at least two-thirds of the number of Trustees prior to such removal; (c) any Trustee who requests to be retired or who has become incapacitated by illness or injury may be retired by written instrument signed by a majority of the other Trustees; and (d) any Trustee may be removed at any special meeting of shareholders by a two-thirds vote of the outstanding voting securities of the trust. Each Trustee who is not an interested person (as defined in the 1940 Act) of the trust and the fund is referred to herein as an Independent Trustee. Each Independent Trustee shall retire not later than the last day of the calendar year in which his or her 75th birthday occurs. The Independent Trustees may waive this mandatory retirement age policy with respect to individual Trustees. Officers and Advisory Board Members hold office without limit in time, except that any officer or Advisory Board Member may resign or may be removed by a vote of a majority of the Trustees at any regular meeting or any special meeting of the Trustees. Except as indicated, each individual has held the office shown or other offices in the same company for the past five years.
The fund’s Statement of Additional Information (SAI) includes more information about the Trustees. To request a free copy, call Fidelity at 1-877-208-0098.
Experience, Skills, Attributes, and Qualifications of the Trustees. The Governance and Nominating Committee has adopted a statement of policy that describes the experience, qualifications, attributes, and skills that are necessary and desirable for potential Independent Trustee candidates (Statement of Policy). The Board believes that each Trustee satisfied at the time he or she was initially elected or appointed a Trustee, and continues to satisfy, the standards contemplated by the Statement of Policy. The Governance and Nominating Committee also engages professional search firms to help identify potential Independent Trustee candidates who have the experience, qualifications, attributes, and skills consistent with the Statement of Policy. From time to time, additional criteria based on the composition and skills of the current Independent Trustees, as well as experience or skills that may be appropriate in light of future changes to board composition, business conditions, and regulatory or other developments, have also been considered by the professional search firms and the Governance and Nominating Committee. In addition, the Board takes into account the Trustees' commitment and participation in Board and committee meetings, as well as their leadership of standing and ad hoc committees throughout their tenure.
In determining that a particular Trustee was and continues to be qualified to serve as a Trustee, the Board has considered a variety of criteria, none of which, in isolation, was controlling. The Board believes that, collectively, the Trustees have balanced and diverse experience, qualifications, attributes, and skills, which allow the Board to operate effectively in governing the fund and protecting the interests of shareholders. Information about the specific experience, skills, attributes, and qualifications of each Trustee, which in each case led to the Board's conclusion that the Trustee should serve (or continue to serve) as a trustee of the fund, is provided below.
Board Structure and Oversight Function. Brian B. Hogan is an interested person and currently serves as Chairman. The Trustees have determined that an interested Chairman is appropriate and benefits shareholders because an interested Chairman has a personal and professional stake in the quality and continuity of services provided to the fund. Independent Trustees exercise their informed business judgment to appoint an individual of their choosing to serve as Chairman, regardless of whether the Trustee happens to be independent or a member of management. The Independent Trustees have determined that they can act independently and effectively without having an Independent Trustee serve as Chairman and that a key structural component for assuring that they are in a position to do so is for the Independent Trustees to constitute a substantial majority for the Board. The Independent Trustees also regularly meet in executive session. Michael E. Wiley serves as Chairman of the Independent Trustees and as such (i) acts as a liaison between the Independent Trustees and management with respect to matters important to the Independent Trustees and (ii) with management prepares agendas for Board meetings.
Fidelity® funds are overseen by different Boards of Trustees. The fund's Board oversees Fidelity's sector portfolios. Other Boards oversee Fidelity's equity and high income funds, and Fidelity's investment grade bond, money market, and asset allocation funds. The use of separate Boards, each with its own committee structure, allows the Trustees of each group of Fidelity® funds to focus on the unique issues of the funds they oversee, including common research, investment, and operational issues. On occasion, the separate Boards establish joint committees to address issues of overlapping consequences for the Fidelity® funds overseen by each Board.
The Trustees operate using a system of committees to facilitate the timely and efficient consideration of all matters of importance to the Trustees, the fund, and fund shareholders and to facilitate compliance with legal and regulatory requirements and oversight of the fund's activities and associated risks. The Board, acting through its committees, has charged SelectCo and its affiliates with (i) identifying events or circumstances the occurrence of which could have demonstrably adverse effects on the fund's business and/or reputation; (ii) implementing processes and controls to lessen the possibility that such events or circumstances occur or to mitigate the effects of such events or circumstances if they do occur; and (iii) creating and maintaining a system designed to evaluate continuously business and market conditions in order to facilitate the identification and implementation processes described in (i) and (ii) above. Because the day-to-day operations and activities of the fund are carried out by or through SelectCo, its affiliates, and other service providers, the fund's exposure to risks is mitigated but not eliminated by the processes overseen by the Trustees. While each of the Board's committees has responsibility for overseeing different aspects of the fund's activities, oversight is exercised primarily through the Operations and Audit Committees. Appropriate personnel, including but not limited to the fund's Chief Compliance Officer (CCO), SelectCo's internal auditor, the independent accountants, the fund's Treasurer and portfolio management personnel, make periodic reports to the Board's committees, as appropriate. The responsibilities of each standing committee, including their oversight responsibilities, are described further under "Standing Committees of the Trustees."
Interested Trustees*:
Correspondence intended for a Trustee who is an interested person may be sent to Fidelity Investments, 245 Summer Street, Boston, Massachusetts 02210.
Name, Year of Birth; Principal Occupations and Other Relevant Experience+
Brian B. Hogan (1964)
Year of Election or Appointment: 2014
Trustee
Chairman of the Board of Trustees
Mr. Hogan also serves as Trustee or Vice President of other funds. Mr. Hogan serves as a Director of FMR Investment Management (UK) Limited (investment adviser firm, 2015-present) and Fidelity SelectCo, LLC (investment adviser firm, 2014-present) and President of the Equity Division of FMR (investment adviser firm, 2009-present). Previously, Mr. Hogan served as Senior Vice President, Equity Research of FMR (2006-2009) and as a portfolio manager. Mr. Brian B. Hogan is not related to Mr. Colm A. Hogan.
* Determined to be an "Interested Trustee" by virtue of, among other things, his or her affiliation with the trust or various entities under common control with SelectCo.
+ The information includes the Trustee's principal occupation during the last five years and other information relating to the experience, attributes, and skills relevant to the Trustee's qualifications to serve as a Trustee, which led to the conclusion that the Trustee should serve as a Trustee for the fund.
Independent Trustees:
Correspondence intended for an Independent Trustee may be sent to Fidelity Investments, P.O. Box 55235, Boston, Massachusetts 02205-5235.
Name, Year of Birth; Principal Occupations and Other Relevant Experience+
David A. Rosow (1942)
Year of Election or Appointment: 2013
Trustee
Mr. Rosow also serves as Trustee of other Fidelity® funds. Prior to his retirement in 2006, Mr. Rosow was the Chief Executive Officer, owner and operator of a number of private companies, which encompassed the oil refining, drilling and marketing of petroleum products (including specialty petroleum products), recreation industry, and real estate development. Mr. Rosow currently serves as a Director of Oxbow Carbon LLC (upgraders, marketers, and distributors of petroleum byproducts of the oil refining process, 2015-present) and Oxbridge Academy of the Palm Beaches (2015-present) and serves as its President and CEO. Previously, Mr. Rosow served on the Fairfield Country Day School Board for 27 years, including as its President for 3 years, stepping down in 2006. Mr. Rosow served as Lead Director and Chairman of the Audit Committee of Hudson United Bancorp (1996-2006), Chairman of the Board of Westport Bank and Trust (1992-1996), and as a Director of TD Banknorth (2006-2007). In addition, Mr. Rosow served as a member (2008-2014) and President (2009-2014) of the Town Council of Palm Beach, Florida. Mr. Rosow also served as a Member of the Advisory Board of certain Fidelity® funds (2012-2013).
Garnett A. Smith (1947)
Year of Election or Appointment: 2013
Trustee
Mr. Smith also serves as Trustee of other Fidelity® funds. Prior to Mr. Smith's retirement, he served as Chairman and Chief Executive Officer of Inbrand Corp. (manufacturer of personal absorbent products, 1990-1997). He also served as President (1986-1990) of Inbrand Corp. Prior to his employment with Inbrand Corp., he was employed by a retail fabric chain and North Carolina National Bank. In addition, Mr. Smith served as a Member of the Advisory Board of certain Fidelity® funds (2012-2013) and as a board member of the Jackson Hole Land Trust (2009-2012).
Michael E. Wiley (1950)
Year of Election or Appointment: 2008
Trustee
Chairman of the Independent Trustees
Mr. Wiley also serves as Trustee of other Fidelity® funds. Mr. Wiley serves as a Director of Tesoro Corporation (independent oil refiner and marketer, 2005-present), a Director of Tesoro Logistics LP (natural resources logistics, 2015-present), and a Director of Bill Barrett Corporation (exploration and production, 2005-present). In addition, Mr. Wiley also serves as a Director of Post Oak Bank (privately-held bank, 2004-present). Previously, Mr. Wiley served as a Trustee of other Fidelity® funds (2008-2013), as a Director of Asia Pacific Exploration Consolidated (international oil and gas exploration and production, 2008-2013), as a member of the Board of Trustees of the University of Tulsa (2000-2006; 2007-2010), as a Senior Energy Advisor of Katzenbach Partners, LLC (consulting, 2006-2007), as an Advisory Director of Riverstone Holdings (private investment), Chairman, President, and CEO of Baker Hughes, Inc. (oilfield services, 2000-2004), and as Director of Spinnaker Exploration Company (exploration and production, 2001-2005).
+ The information includes the Trustee's principal occupation during the last five years and other information relating to the experience, attributes, and skills relevant to the Trustee's qualifications to serve as a Trustee, which led to the conclusion that the Trustee should serve as a Trustee for the fund.
Advisory Board Members and Officers:
Correspondence intended for a Member of the Advisory Board may be sent to Fidelity Investments, P.O. Box 55235, Boston, Massachusetts 02205-5235. Except for Anthony R. Rochte, correspondence intended for an officer may be sent to Fidelity Investments, 245 Summer Street, Boston, Massachusetts 02210. Correspondence intended for Mr. Rochte may be sent to SelectCo, 1225 17th Street, Denver, Colorado 80202-5541. Officers appear below in alphabetical order.
Name, Year of Birth; Principal Occupation
Donald F. Donahue (1950)
Year of Election or Appointment: 2015
Member of the Advisory Board
Mr. Donahue also serves as a Trustee or Member of the Advisory Board of other Fidelity® funds. Mr. Donahue is President and Chief Executive Officer of Miranda Partners, LLC (risk consulting for the financial services industry, 2012-present) and a consultant for the Institute for Defense Analyses (national security, 2012-present). Previously, Mr. Donahue served as Chief Executive Officer (2006-2012), Chief Operating Officer (2003-2006), and Managing Director, Customer Marketing and Development (1999-2003) of The Depository Trust & Clearing Corporation (financial markets infrastructure). Mr. Donahue serves as a Member (2012-present) and Co-Chairman (2016-present) of the Board of Directors of United Way of New York, Member of the Board of Directors of NYC Leadership Academy (2012-present) and Member of the Board of Advisors of Ripple Labs, Inc. (financial services, 2015-present). He also served as Chairman (2010-2012) and Member of the Board of Directors (2012-2013) of Omgeo, LLC (financial services), Treasurer of United Way of New York (2012-2016), and Member of the Board of Directors of XBRL US (financial services non-profit, 2009-2012) and the International Securities Services Association (2009-2012).
Carol B. Tomé (1957)
Year of Election or Appointment: 2017
Member of the Advisory Board
Ms. Tomé also serves as Trustee or Member of the Advisory Board of other Fidelity® funds. Ms. Tomé is Chief Financial Officer (2001-present) and Executive Vice President of Corporate Services (2007-present) of The Home Depot, Inc. (home improvement retailer) and a Director (2003-present) and Chair of the Audit Committee (2004-present) of United Parcel Service, Inc. (package delivery and supply chain management). Previously, Ms. Tomé served as Senior Vice President of Finance and Accounting/Treasurer (2000-2007) and Vice President and Treasurer (1995-2000) of The Home Depot, Inc. and Chair of the Board (2010-2012), Vice Chair of the Board (2009 and 2013), and a Director (2008-2013) of the Federal Reserve Bank of Atlanta. Ms. Tomé is also a director or trustee of many community and professional organizations.
Marc R. Bryant (1966)
Year of Election or Appointment: 2013
Secretary and Chief Legal Officer (CLO)
Mr. Bryant also serves as Secretary and CLO of other funds. Mr. Bryant serves as CLO, Secretary, and Senior Vice President of Fidelity Management & Research Company (investment adviser firm, 2015-present) and FMR Co., Inc. (investment adviser firm, 2015-present); Secretary of Fidelity SelectCo, LLC (investment adviser firm, 2015-present) and Fidelity Investments Money Management, Inc. (investment adviser firm, 2015-present); and CLO of Fidelity Management & Research (Hong Kong) Limited and FMR Investment Management (UK) Limited (investment adviser firms, 2015-present) and Fidelity Management & Research (Japan) Limited (investment adviser firm, 2016-present). He is Senior Vice President and Deputy General Counsel of FMR LLC (diversified financial services company). Previously, Mr. Bryant served as Secretary and CLO of Fidelity Rutland Square Trust II (2010-2014) and Assistant Secretary of Fidelity's Fixed Income and Asset Allocation Funds (2013-2015). Prior to joining Fidelity Investments, Mr. Bryant served as a Senior Vice President and the Head of Global Retail Legal for AllianceBernstein L.P. (2006-2010), and as the General Counsel for ProFund Advisors LLC (2001-2006).
Jeffrey S. Christian (1961)
Year of Election or Appointment: 2016
Assistant Treasurer
Mr. Christian also serves as Assistant Treasurer of other funds. Mr. Christian is an employee of Fidelity Investments (2003-present).
William C. Coffey (1969)
Year of Election or Appointment: 2009
Assistant Secretary
Mr. Coffey also serves as Assistant Secretary of other funds. He is Senior Vice President and Deputy General Counsel of FMR LLC (diversified financial services company, 2010-present), and is an employee of Fidelity Investments. Previously, Mr. Coffey served as Vice President and Associate General Counsel of FMR LLC (2005-2009).
Jonathan Davis (1968)
Year of Election or Appointment: 2010
Assistant Treasurer
Mr. Davis also serves as Assistant Treasurer of other funds, and is an employee of Fidelity Investments. Previously, Mr. Davis served as Vice President and Associate General Counsel of FMR LLC (diversified financial services company, 2003-2010).
Adrien E. Deberghes (1967)
Year of Election or Appointment: 2013
President and Treasurer
Mr. Deberghes also serves as an officer of other funds. He serves as Executive Vice President of Fidelity Investments Money Management, Inc. (FIMM) (investment adviser firm, 2016-present) and is an employee of Fidelity Investments (2008-present). Prior to joining Fidelity Investments, Mr. Deberghes was Senior Vice President of Mutual Fund Administration at State Street Corporation (2007-2008), Senior Director of Mutual Fund Administration at Investors Bank & Trust (2005-2007), and Director of Finance for Dunkin' Brands (2000-2005). Previously, Mr. Deberghes served in other fund officer roles.
Joseph DeSantis (1959)
Year of Election or Appointment: 2015
Vice President
Mr. DeSantis also serves as Vice President of other funds. Mr. DeSantis serves as a Director of Fidelity Management & Research (Japan) Limited (investment adviser firm, 2016-present), Chief Investment Officer, Equities (2010-present) and is an employee of Fidelity Investments.
Stephanie J. Dorsey (1969)
Year of Election or Appointment: 2010
Assistant Treasurer
Ms. Dorsey also serves as an officer of other funds. She is an employee of Fidelity Investments (2008-present) and has served in other fund officer roles. Prior to joining Fidelity Investments, Ms. Dorsey served as Treasurer (2004-2008) of the JPMorgan Mutual Funds and Vice President (2004-2008) of JPMorgan Chase Bank.
Howard J. Galligan III (1966)
Year of Election or Appointment: 2014
Chief Financial Officer
Mr. Galligan also serves as Chief Financial Officer of other funds. Mr. Galligan serves as President of Fidelity Pricing and Cash Management Services (FPCMS) (2014-present) and as a Director of Strategic Advisers, Inc. (investment adviser firm, 2008-present). Previously, Mr. Galligan served as Chief Administrative Officer of Asset Management (2011-2014) and Chief Operating Officer and Senior Vice President of Investment Support for Strategic Advisers, Inc. (2003-2011).
Scott C. Goebel (1968)
Year of Election or Appointment: 2015
Vice President
Mr. Goebel serves as Vice President of other funds and is an employee of Fidelity Investments (2001-present). Previously, Mr. Goebel served as Senior Vice President of Fidelity Management & Research Company (FMR) (investment adviser firm, 2016), Secretary of Fidelity SelectCo, LLC (investment adviser firm, 2013-2015), Fidelity Investments Money Management, Inc. (FIMM) (investment adviser firm, 2010-2015), and Fidelity Research and Analysis Company (FRAC) (investment adviser firm, 2010-2015); General Counsel, Secretary, and Senior Vice President of FMR (investment adviser firm, 2008-2015) and FMR Co., Inc. (investment adviser firm, 2008-2015); Assistant Secretary of Fidelity Management & Research (Japan) Limited (investment adviser firm, 2008-2015) and Fidelity Management & Research (U.K.) Inc. (investment adviser firm, 2008-2015); Chief Legal Officer (CLO) of Fidelity Management & Research (Hong Kong) Limited (investment adviser firm, 2008-2015); Secretary and CLO of certain Fidelity® funds (2008-2015); Assistant Secretary of FIMM (2008-2010), FRAC (2008-2010), and certain funds (2007-2008); and as Vice President and Secretary of Fidelity Distributors Corporation (FDC) (2005-2007).
James D. Gryglewicz (1972)
Year of Election or Appointment: 2014
Chief Compliance Officer
Mr. Gryglewicz also serves as Chief Compliance Officer of other funds. Mr. Gryglewicz serves as Compliance Officer of Strategic Advisers, Inc. (investment adviser firm, 2015-present) and Fidelity SelectCo, LLC (investment adviser firm, 2014-present), Senior Vice President of Asset Management Compliance (2009-present), and is an employee of Fidelity Investments (2004-present).
Brian B. Hogan (1964)
Year of Election or Appointment: 2009
Vice President
Mr. Hogan also serves as Trustee or Vice President of other funds. Mr. Hogan serves as a Director of FMR Investment Management (UK) Limited (investment adviser firm, 2015-present) and Fidelity SelectCo, LLC (investment adviser firm, 2014-present) and President of the Equity Division of FMR (investment adviser firm, 2009-present). Previously, Mr. Hogan served as Senior Vice President, Equity Research of FMR (2006-2009) and as a portfolio manager. Mr. Brian B. Hogan is not related to Mr. Colm A. Hogan.
Colm A. Hogan (1973)
Year of Election or Appointment: 2016
Assistant Treasurer
Mr. Hogan also serves as an officer of other funds. Mr. Hogan is an employee of Fidelity Investments (2005-present). Mr. Colm A. Hogan is not related to Mr. Brian B. Hogan.
Chris Maher (1972)
Year of Election or Appointment: 2013
Assistant Treasurer
Mr. Maher serves as Assistant Treasurer of other funds. Mr. Maher is Vice President of Valuation Oversight and is an employee of Fidelity Investments. Previously, Mr. Maher served as Vice President of Asset Management Compliance (2013), Vice President of the Program Management Group of FMR (investment adviser firm, 2010-2013), and Vice President of Valuation Oversight (2008-2010).
John F. Papandrea (1972)
Year of Election or Appointment: 2016
Anti-Money Laundering (AML) Officer
Mr. Papandrea also serves as AML Officer of other funds. Mr. Papandrea is Vice President of FMR LLC (diversified financial services company, 2008-present) and is an employee of Fidelity Investments (2005-present).
Anthony R. Rochte (1968)
Year of Election or Appointment: 2013
Vice President
Mr. Rochte also serves as Vice President of other funds. Mr. Rochte serves as President of Fidelity SelectCo, LLC (investment adviser firm, 2012-present) and is an employee of Fidelity Investments (2012-present). Prior to joining Fidelity Investments, Mr. Rochte served as Senior Managing Director and head of State Street Global Advisors' North American Intermediary Business Group (2006-2012).
Stacie M. Smith (1974)
Year of Election or Appointment: 2013
Assistant Treasurer
Ms. Smith also serves as an officer of other funds. She is an employee of Fidelity Investments (2009-present) and has served in other fund officer roles. Prior to joining Fidelity Investments, Ms. Smith served as Senior Audit Manager of Ernst & Young LLP (accounting firm, 1996-2009). Previously, Ms. Smith served as Deputy Treasurer of certain Fidelity® funds (2013-2016).
Marc L. Spector (1972)
Year of Election or Appointment: 2017
Assistant Treasurer
Mr. Spector also serves as an officer of other funds. Mr. Spector is an employee of Fidelity Investments (2016-present). Prior to joining Fidelity Investments, Mr. Spector served as Director at the Siegfried Group (accounting firm, 2013-2016), and prior to Siegfried Group as audit senior manager at Deloitte & Touche (accounting firm, 2005-2013).
Renee Stagnone (1975)
Year of Election or Appointment: 2016
Assistant Treasurer
Ms. Stagnone also serves as an officer of other funds. Ms. Stagnone is an employee of Fidelity Investments (1997-present). Previously, Ms. Stagnone served as Deputy Treasurer of certain Fidelity® funds (2013-2016).
Shareholder Expense Example
As a shareholder of the Fund, you incur two types of costs: (1) transaction costs, including redemption fees and (2) ongoing costs, including management fees and other Fund expenses. This Example is intended to help you understand your ongoing costs (in dollars) of investing in the Fund and to compare these costs with the ongoing costs of investing in other mutual funds.
The Example is based on an investment of $1,000 invested at the beginning of the period and held for the entire period (July 1, 2016 to December 31, 2016).
Actual Expenses
The first line of the accompanying table for each class of the Fund provides information about actual account values and actual expenses. You may use the information in this line, together with the amount you invested, to estimate the expenses that you paid over the period. Simply divide your account value by $1,000.00 (for example, an $8,600 account value divided by $1,000.00 = 8.6), then multiply the result by the number in the first line for a class of the Fund under the heading entitled "Expenses Paid During Period" to estimate the expenses you paid on your account during this period. The estimate of expenses does not include any fees or other expenses of any variable annuity or variable life insurance product. If they were, the estimate of expenses you paid during the period would be higher, and your ending account value would be lower. In addition, the Fund, as a shareholder in the underlying Fidelity Central Funds, will indirectly bear its pro-rata share of the fees and expenses incurred by the underlying Fidelity Central Funds. These fees and expenses are not included in the Fund's annualized expense ratio used to calculate the expense estimate in the table below.
Hypothetical Example for Comparison Purposes
The second line of the accompanying table for each class of the Fund provides information about hypothetical account values and hypothetical expenses based on a Class' actual expense ratio and an assumed rate of return of 5% per year before expenses, which is not the Class' actual return. The hypothetical account values and expenses may not be used to estimate the actual ending account balance or expenses you paid for the period. You may use this information to compare the ongoing costs of investing in the Fund and other funds. To do so, compare this 5% hypothetical example with the 5% hypothetical examples that appear in the shareholder reports of the other funds. The estimate of expenses does not include any fees or other expenses of any variable annuity or variable life insurance product. If they were, the estimate of expenses you paid during the period would be higher, and your ending account value would be lower. In addition, the Fund, as a shareholder in the underlying Fidelity Central Funds, will indirectly bear its pro-rata share of the fees and expenses incurred by the underlying Fidelity Central Funds. These fees and expenses are not included in the Fund's annualized expense ratio used to calculate the expense estimate in the table below.
Please note that the expenses shown in the table are meant to highlight your ongoing costs only and do not reflect any transaction costs. Therefore, the second line of the table is useful in comparing ongoing costs only, and will not help you determine the relative total costs of owning different funds. In addition, if these transactional costs were included, your costs would have been higher.
| | Annualized Expense Ratio-A | Beginning
Account Value
July 1, 2016 | Ending
Account Value
December 31, 2016 | Expenses Paid
During Period-B
July 1, 2016
to December 31, 2016 |
| Initial Class | .77% | | | |
| Actual | | $1,000.00 | $1,052.10 | $3.97 |
| Hypothetical-C | | $1,000.00 | $1,021.27 | $3.91 |
| Investor Class | .85% | | | |
| Actual | | $1,000.00 | $1,051.90 | $4.38 |
| Hypothetical-C | | $1,000.00 | $1,020.86 | $4.32 |
A Annualized expense ratio reflects expenses net of applicable fee waivers.
B Expenses are equal to each Class' annualized expense ratio, multiplied by the average account value over the period, multiplied by 184/366 (to reflect the one-half year period).
C 5% return per year before expenses
Distributions (Unaudited)
The Board of Trustees of VIP Telecommunications Portfolio voted to pay to shareholders of record at the opening of business on record date, the following distributions per share derived from capital gains realized from sales of portfolio securities, and dividends derived from net investment income:
| | Pay Date | Record Date | Dividends | Capital Gains |
| VIP Telecommunications Portfolio | | | | |
| Initial Class | 02/10/17 | 02/10/17 | $0.002 | $0.08 |
| Investor Class | 02/10/17 | 02/10/17 | $0.001 | $0.08 |
|
The fund hereby designates as a capital gain dividend with respect to the taxable year ended December 31, 2016, $561,389, or, if subsequently determined to be different, the net capital gain of such year.
Initial Class designates 87%; Investor Class designates 89%; of the dividend distributed in December, during the fiscal year as qualifying for the dividends–received deduction for corporate shareholders.
VTELP-ANN-0217
1.851004.109
Fidelity® Variable Insurance Products: Technology Portfolio
Annual Report December 31, 2016 |
|
Contents
To view a fund's proxy voting guidelines and proxy voting record for the 12-month period ended June 30, visit http://www.fidelity.com/proxyvotingresults or visit the Securities and Exchange Commission's (SEC) web site at http://www.sec.gov.
You may also call 1-877-208-0098 to request a free copy of the proxy voting guidelines.
Fidelity® Variable Insurance Products are separate account options which are purchased through a variable insurance contract.
Standard & Poor's, S&P and S&P 500 are registered service marks of The McGraw-Hill Companies, Inc. and have been licensed for use by Fidelity Distributors Corporation.
Other third-party marks appearing herein are the property of their respective owners.
All other marks appearing herein are registered or unregistered trademarks or service marks of FMR LLC or an affiliated company. © 2017 FMR LLC. All rights reserved.
This report and the financial statements contained herein are submitted for the general information of the shareholders of the Fund. This report is not authorized for distribution to prospective investors in the Fund unless preceded or accompanied by an effective prospectus.
A fund files its complete schedule of portfolio holdings with the SEC for the first and third quarters of each fiscal year on Form N-Q. Forms N-Q are available on the SEC’s web site at http://www.sec.gov. A fund's Forms N-Q may be reviewed and copied at the SEC’s Public Reference Room in Washington, DC. Information regarding the operation of the SEC's Public Reference Room may be obtained by calling 1-800-SEC-0330.
For a complete list of a fund's portfolio holdings, view the most recent holdings listing, semiannual report, or annual report on Fidelity's web site at http://www.fidelity.com, http://www.institutional.fidelity.com, or http://www.401k.com, as applicable.
NOT FDIC INSURED •MAY LOSE VALUE •NO BANK GUARANTEE
Neither the Fund nor Fidelity Distributors Corporation is a bank.
Performance: The Bottom Line
Average annual total return reflects the change in the value of an investment, assuming reinvestment of distributions from dividend income and capital gains (the profits earned upon the sale of securities that have grown in value, if any) and assuming a constant rate of performance each year. During periods of reimbursement by Fidelity, a fund’s total return will be greater than it would be had the reimbursement not occurred. Performance numbers are net of all underlying fund operating expenses, but do not include any insurance charges imposed by your insurance company’s separate account. If performance information included the effect of these additional charges, the total returns would have been lower. How a fund did yesterday is no guarantee of how it will do tomorrow.
Average Annual Total Returns
| For the periods ended December 31, 2016 | Past 1 year | Past 5 years | Past 10 years |
| Initial Class | 11.37% | 14.75% | 9.82% |
| Investor Class | 11.34% | 14.68% | 9.72% |
$10,000 Over 10 Years
Let's say hypothetically that $10,000 was invested in VIP Technology Portfolio - Initial Class on December 31, 2006.
The chart shows how the value of your investment would have changed, and also shows how the S&P 500® Index performed over the same period.

| Period Ending Values |
| $25,523 | VIP Technology Portfolio - Initial Class |
| $19,572 | S&P 500® Index |
Management's Discussion of Fund Performance
Market Recap: The S&P 500
® index returned 11.96% in 2016, rising sharply on post-election optimism for economic growth. The year began during a fairly volatile stretch, with stocks hampered by persistent oil-price weakness and U.S.-dollar strength. Markets regained momentum in February amid U.S. job gains, a rally in energy and other stimuli that helped keep the roughly seven-year uptrend intact. Markets tumbled briefly following the U.K.’s June 23 vote to exit the European Union – dubbed “Brexit” – then recovered quickly and settled into a flattish stretch until the November 8 U.S. presidential election. Stocks reacted to the outcome by reaching a series of all-time highs. For the year, energy (+27%) led the way amid two strong rallies in commodity prices, one in the spring and another in November. Telecommunication services (+23%) was close behind, as demand for dividend-paying equities was high early in the period. Cyclical sectors, including financials (+22%), industrials (+18%) and materials (+17%), also posted strong gains. Conversely, consumer staples (+5%) and consumer discretionary (+6%) lagged the index, the latter hurt as online competition continued to pressure brick-and-mortar retailers. Real estate (+3%) struggled due to expectations for rising interest rates, while health care (-2%) was hampered by an uncertain political and regulatory outlook.
Comments from Portfolio Manager Charlie Chai: For the year, the fund’s share classes gained more than 11%, trailing the 13.85% return of the benchmark MSCI U.S. IMI Information Technology 25/50 Index, and also modestly behind the S&P 500
®. Versus the benchmark, stock selection and an overweighting in internet software & services weighed on results, along with non-benchmark exposure to internet & direct marketing retail. The fund’s two largest relative detractors both were non-benchmark companies based in China: online advertising provider 58.com and online travel services firm Qunar Cayman Islands, the latter of which I sold. Other detractors included an overweighting in electric vehicle maker Tesla Motors and untimely ownership of out-of-benchmark DeNA, a Japan-based provider of online gaming and e-commerce services. Overall, the fund’s holdings of foreign stocks were a drawback this period amid the U.S. dollar’s strong appreciation. Conversely, stock choices and an overweighting in semiconductors jointly made this industry the top contributor. A sizable overweighting in semiconductor maker Marvell Technology Group was the fund’s largest individual relative contributor. Overweighting digital memory maker Micron Technology also boosted our relative results. A non-benchmark stake in Japan-based SUMCO, a producer of silicon wafers for semiconductor manufacturers that I began buying in August, proved timely as well.
The views expressed above reflect those of the portfolio manager(s) only through the end of the period as stated on the cover of this report and do not necessarily represent the views of Fidelity or any other person in the Fidelity organization. Any such views are subject to change at any time based upon market or other conditions and Fidelity disclaims any responsibility to update such views. These views may not be relied on as investment advice and, because investment decisions for a Fidelity fund are based on numerous factors, may not be relied on as an indication of trading intent on behalf of any Fidelity fund.
Investment Summary (Unaudited)
Top Ten Stocks as of December 31, 2016
| | % of fund's net assets | % of fund's net assets 6 months ago |
| Apple, Inc. | 9.8 | 9.9 |
| Alphabet, Inc. Class C | 5.5 | 5.6 |
| Alphabet, Inc. Class A | 5.4 | 5.0 |
| Facebook, Inc. Class A | 4.4 | 5.9 |
| Autodesk, Inc. | 3.5 | 1.4 |
| Trimble, Inc. | 3.2 | 1.6 |
| Tesla Motors, Inc. | 2.3 | 1.6 |
| New Oriental Education & Technology Group, Inc. sponsored ADR | 1.9 | 0.6 |
| Microsoft Corp. | 1.9 | 2.0 |
| Micron Technology, Inc. | 1.5 | 2.6 |
| | 39.4 | |
Top Industries (% of fund's net assets)
| As of December 31, 2016 |
| | Internet Software & Services | 24.3% |
| | Semiconductors & Semiconductor Equipment | 19.1% |
| | Software | 16.1% |
| | Technology Hardware, Storage & Peripherals | 11.2% |
| | Electronic Equipment & Components | 11.1% |
| | All Others* | 18.2% |

* Includes Short-Term investments and Net Other Assets (Liabilities).
| As of June 30, 2016 |
| | Internet Software & Services | 29.4% |
| | Semiconductors & Semiconductor Equipment | 18.5% |
| | Software | 17.4% |
| | Technology Hardware, Storage & Peripherals | 10.7% |
| | IT Services | 6.3% |
| | All Others* | 17.7% |

* Includes Short-Term investments and Net Other Assets (Liabilities).
Prior period industry classifications reflect the categories in place as of the date indicated and have not been adjusted to reflect current industry classifications.
Investments December 31, 2016
Showing Percentage of Net Assets
| Common Stocks - 99.7% | | | |
| | | Shares | Value |
| Automobiles - 2.3% | | | |
| Automobile Manufacturers - 2.3% | | | |
| Tesla Motors, Inc. (a) | | 36,300 | $7,756,947 |
| Banks - 0.3% | | | |
| Diversified Banks - 0.3% | | | |
| Han's Laser Technology Industry Group Co. Ltd. ELS (A Shares) (HSBC Warrant Program) warrants 3/18/19 (a)(b) | | 260,200 | 846,727 |
| Biotechnology - 0.1% | | | |
| Biotechnology - 0.1% | | | |
| BeiGene Ltd. ADR | | 500 | 15,180 |
| Genscript Biotech Corp. | | 232,000 | 110,185 |
| Samsung Biologics Co. Ltd. (a) | | 1,752 | 219,135 |
| | | | 344,500 |
| Capital Markets - 0.5% | | | |
| Diversified Capital Markets - 0.5% | | | |
| iFlytek Co. Ltd. ELS (UBS Warrant Programme) warrants 11/24/17 (a)(b) | | 79,552 | 310,304 |
| Lens Technology Co., Ltd. ELS (UBS Warrant Programme) warrants 9/25/17 (a)(b) | | 366,531 | 1,457,152 |
| | | | 1,767,456 |
| Chemicals - 1.6% | | | |
| Industrial Gases - 0.7% | | | |
| SK Materials Co., Ltd. | | 10,750 | 1,597,467 |
| Wonik Materials Co. Ltd. (a) | | 11,904 | 663,604 |
| | | | 2,261,071 |
| Specialty Chemicals - 0.9% | | | |
| Duk San Neolux Co. Ltd. (a) | | 25,781 | 679,091 |
| Nitto Denko Corp. | | 9,500 | 729,031 |
| Shin-Etsu Chemical Co. Ltd. | | 7,000 | 543,050 |
| Soulbrain Co. Ltd. | | 21,494 | 1,075,363 |
| | | | 3,026,535 |
|
| TOTAL CHEMICALS | | | 5,287,606 |
|
| Commercial Services & Supplies - 0.7% | | | |
| Commercial Printing - 0.7% | | | |
| Nissha Printing Co. Ltd. (c) | | 96,500 | 2,325,082 |
| Communications Equipment - 0.3% | | | |
| Communications Equipment - 0.3% | | | |
| CommScope Holding Co., Inc. (a) | | 13,100 | 487,320 |
| Finisar Corp. (a) | | 700 | 21,189 |
| Infinera Corp. (a) | | 13,600 | 115,464 |
| Sandvine Corp. (U.K.) | | 19,488 | 40,786 |
| ShoreTel, Inc. (a) | | 9,900 | 70,785 |
| Wistron NeWeb Corp. | | 59,300 | 157,685 |
| | | | 893,229 |
| Diversified Consumer Services - 2.4% | | | |
| Education Services - 2.4% | | | |
| China Online Education Group sponsored ADR (a)(c) | | 1,229 | 19,111 |
| New Oriental Education & Technology Group, Inc. sponsored ADR (a) | | 149,400 | 6,289,740 |
| TAL Education Group ADR (a)(c) | | 22,000 | 1,543,300 |
| | | | 7,852,151 |
| Specialized Consumer Services - 0.0% | | | |
| ZTO Express (Cayman), Inc. sponsored ADR (c) | | 14,200 | 171,394 |
|
| TOTAL DIVERSIFIED CONSUMER SERVICES | | | 8,023,545 |
|
| Diversified Financial Services - 0.2% | | | |
| Other Diversified Financial Services - 0.2% | | | |
| GDS Holdings Ltd. ADR | | 76,400 | 657,040 |
| Diversified Telecommunication Services - 0.1% | | | |
| Integrated Telecommunication Services - 0.1% | | | |
| Bharti Infratel Ltd. | | 73,609 | 372,028 |
| Electrical Equipment - 0.5% | | | |
| Electrical Components & Equipment - 0.5% | | | |
| Acuity Brands, Inc. | | 3,400 | 784,924 |
| Rockwell Automation, Inc. | | 6,400 | 860,160 |
| | | | 1,645,084 |
| Electronic Equipment & Components - 11.1% | | | |
| Electronic Components - 3.6% | | | |
| Alps Electric Co. Ltd. | | 101,000 | 2,442,148 |
| Amphenol Corp. Class A | | 500 | 33,600 |
| AVX Corp. | | 1,300 | 20,319 |
| Corning, Inc. | | 1,200 | 29,124 |
| E Ink Holdings, Inc. GDR (b) | | 1,000 | 7,071 |
| InvenSense, Inc. (a) | | 204,000 | 2,609,160 |
| Iriso Electronics Co. Ltd. | | 17,400 | 995,987 |
| Knowles Corp. (a)(c) | | 6,827 | 114,079 |
| Largan Precision Co. Ltd. | | 22,000 | 2,569,135 |
| Ledlink Optics, Inc. | | 216,974 | 308,869 |
| Mitsumi Electric Co. Ltd. (a) | | 27,200 | 149,411 |
| Polytronics Technology Corp. | | 79,000 | 142,156 |
| Samsung SDI Co. Ltd. | | 8,282 | 747,761 |
| Sunny Optical Technology Group Co. Ltd. | | 81,000 | 353,078 |
| Taiyo Yuden Co. Ltd. | | 9,300 | 111,640 |
| Tong Hsing Electronics Industries Ltd. | | 15,000 | 50,840 |
| Universal Display Corp. (a) | | 4,800 | 270,240 |
| Vishay Intertechnology, Inc. | | 1,700 | 27,540 |
| Yageo Corp. | | 418,606 | 755,837 |
| Yaskawa Electric Corp. | | 3,000 | 46,665 |
| | | | 11,784,660 |
| Electronic Equipment & Instruments - 2.8% | | | |
| Chroma ATE, Inc. | | 913,415 | 2,122,094 |
| Cognex Corp. | | 23,000 | 1,463,260 |
| Control4 Corp. (a) | | 9,900 | 100,980 |
| Firich Enterprise Co. Ltd. | | 11,572 | 21,501 |
| Hexagon AB (B Shares) | | 44,100 | 1,575,588 |
| Itron, Inc. (a) | | 400 | 25,140 |
| National Instruments Corp. | | 26,476 | 815,990 |
| Test Research, Inc. | | 1,316,000 | 1,548,975 |
| Topcon Corp. | | 103,800 | 1,564,882 |
| VeriFone Systems, Inc. (a) | | 500 | 8,865 |
| | | | 9,247,275 |
| Electronic Manufacturing Services - 3.7% | | | |
| AAC Technology Holdings, Inc. | | 30,000 | 271,553 |
| AIC, Inc. | | 6,000 | 12,294 |
| KEMET Corp. (a) | | 2,800 | 18,564 |
| Merry Electronics Co. Ltd. | | 407,000 | 1,523,687 |
| Trimble, Inc. (a) | | 346,570 | 10,449,086 |
| | | | 12,275,184 |
| Technology Distributors - 1.0% | | | |
| Anixter International, Inc. (a) | | 300 | 24,315 |
| Arrow Electronics, Inc. (a) | | 600 | 42,780 |
| Dell Technologies, Inc. (a) | | 60,900 | 3,347,673 |
| | | | 3,414,768 |
|
| TOTAL ELECTRONIC EQUIPMENT & COMPONENTS | | | 36,721,887 |
|
| Health Care Equipment & Supplies - 0.1% | | | |
| Health Care Equipment - 0.1% | | | |
| China Medical Technologies, Inc. sponsored ADR (a) | | 300 | 0 |
| Intai Technology Corp. | | 69,000 | 323,160 |
| | | | 323,160 |
| Health Care Providers & Services - 0.0% | | | |
| Managed Health Care - 0.0% | | | |
| HealthEquity, Inc. (a) | | 600 | 24,312 |
| Health Care Technology - 1.0% | | | |
| Health Care Technology - 1.0% | | | |
| athenahealth, Inc. (a) | | 6,600 | 694,122 |
| Inovalon Holdings, Inc. Class A (a) | | 47,100 | 485,130 |
| M3, Inc. | | 18,400 | 463,641 |
| Medidata Solutions, Inc. (a) | | 31,000 | 1,539,770 |
| | | | 3,182,663 |
| Hotels, Restaurants & Leisure - 0.3% | | | |
| Casinos & Gaming - 0.1% | | | |
| 500.com Ltd. sponsored ADR Class A (a)(c) | | 25,600 | 392,448 |
| Hotels, Resorts & Cruise Lines - 0.2% | | | |
| Tuniu Corp. Class A sponsored ADR (a)(c) | | 65,300 | 571,375 |
|
| TOTAL HOTELS, RESTAURANTS & LEISURE | | | 963,823 |
|
| Household Durables - 1.1% | | | |
| Consumer Electronics - 1.1% | | | |
| Sky Light Holdings Ltd. | | 140,000 | 31,241 |
| Sony Corp. | | 53,700 | 1,500,482 |
| Sony Corp. sponsored ADR | | 72,200 | 2,023,766 |
| | | | 3,555,489 |
| Household Appliances - 0.0% | | | |
| iRobot Corp. (a) | | 500 | 29,225 |
|
| TOTAL HOUSEHOLD DURABLES | | | 3,584,714 |
|
| Independent Power and Renewable Electricity Producers - 0.0% | | | |
| Renewable Electricity - 0.0% | | | |
| Vivint Solar, Inc. (a)(c) | | 3,800 | 9,690 |
| Industrial Conglomerates - 0.3% | | | |
| Industrial Conglomerates - 0.3% | | | |
| Cheil Industries, Inc. | | 10,309 | 1,071,670 |
| Toshiba Corp. (a) | | 1,000 | 2,422 |
| | | | 1,074,092 |
| Internet & Direct Marketing Retail - 2.0% | | | |
| Internet & Direct Marketing Retail - 2.0% | | | |
| Amazon.com, Inc. (a) | | 4,400 | 3,299,428 |
| China Internet Plus Holdings Ltd. (d) | | 141,569 | 398,984 |
| Ctrip.com International Ltd. ADR (a) | | 800 | 32,000 |
| Etsy, Inc. (a) | | 900 | 10,602 |
| Groupon, Inc. Class A (a) | | 156,700 | 520,244 |
| InterPark INT Corp. | | 464 | 3,920 |
| JD.com, Inc. sponsored ADR (a) | | 51,100 | 1,299,984 |
| Jumei International Holding Ltd. sponsored ADR (a) | | 123,500 | 618,735 |
| MakeMyTrip Ltd. (a) | | 3,400 | 75,480 |
| Netflix, Inc. (a) | | 1,500 | 185,700 |
| Vipshop Holdings Ltd. ADR (a) | | 14,700 | 161,847 |
| Wayfair LLC Class A (a) | | 600 | 21,030 |
| | | | 6,627,954 |
| Internet Software & Services - 23.6% | | | |
| Internet Software & Services - 23.6% | | | |
| 58.com, Inc. ADR (a) | | 63,680 | 1,783,040 |
| Akamai Technologies, Inc. (a) | | 5,700 | 380,076 |
| Alarm.com Holdings, Inc. (a) | | 1,200 | 33,396 |
| Alibaba Group Holding Ltd. sponsored ADR (a) | | 7,700 | 676,137 |
| Alphabet, Inc.: | | | |
| Class A (a) | | 22,600 | 17,909,370 |
| Class C (a) | | 23,461 | 18,107,669 |
| Amber Road, Inc. (a) | | 20,000 | 181,600 |
| Apptio, Inc. Class A (c) | | 500 | 9,265 |
| Bazaarvoice, Inc. (a) | | 600 | 2,910 |
| Bitauto Holdings Ltd. ADR (a) | | 5,900 | 111,746 |
| blinkx PLC (a) | | 50,400 | 23,913 |
| ChannelAdvisor Corp. (a) | | 45,800 | 657,230 |
| Cimpress NV (a) | | 600 | 54,966 |
| Cornerstone OnDemand, Inc. (a) | | 4,400 | 186,164 |
| CoStar Group, Inc. (a) | | 18,300 | 3,449,367 |
| DeNA Co. Ltd. | | 100,360 | 2,193,108 |
| eBay, Inc. (a) | | 2,400 | 71,256 |
| eGain Communications Corp. (a) | | 113,400 | 238,140 |
| Endurance International Group Holdings, Inc. (a) | | 92,500 | 860,250 |
| Facebook, Inc. Class A (a) | | 126,989 | 14,610,084 |
| Hortonworks, Inc. (a) | | 400 | 3,324 |
| Leju Holdings Ltd. ADR (a) | | 654 | 3,139 |
| LivePerson, Inc. (a) | | 8,800 | 66,440 |
| LogMeIn, Inc. | | 9,391 | 906,701 |
| MercadoLibre, Inc. | | 200 | 31,228 |
| MINDBODY, Inc. (a)(c) | | 222,500 | 4,739,250 |
| mixi, Inc. | | 4,500 | 164,406 |
| NetEase, Inc. ADR | | 9,500 | 2,045,730 |
| New Relic, Inc. (a) | | 16,800 | 474,600 |
| Nutanix, Inc. Class B | | 6,397 | 161,409 |
| Phoenix New Media Ltd. ADR (a)(c) | | 8,800 | 27,632 |
| Q2 Holdings, Inc. (a) | | 25 | 721 |
| Renren, Inc. ADR (a)(c) | | 52,500 | 83,475 |
| SINA Corp. | | 4,800 | 291,792 |
| SMS Co., Ltd. (c) | | 95,000 | 2,106,053 |
| Tencent Holdings Ltd. | | 19,300 | 467,969 |
| The Trade Desk, Inc. | | 400 | 11,068 |
| Twilio, Inc. Class A | | 1,100 | 31,735 |
| Twitter, Inc. (a) | | 6,100 | 99,430 |
| Weibo Corp. sponsored ADR (a) | | 120 | 4,872 |
| Wix.com Ltd. (a) | | 20,600 | 917,730 |
| Xunlei Ltd. sponsored ADR (a) | | 192,407 | 742,691 |
| Yahoo!, Inc. (a) | | 71,600 | 2,768,772 |
| | | | 77,689,854 |
| IT Services - 3.8% | | | |
| Data Processing & Outsourced Services - 3.3% | | | |
| Alliance Data Systems Corp. | | 7,300 | 1,668,050 |
| eClerx Services Ltd. | | 6,371 | 131,255 |
| EVERTEC, Inc. | | 9,800 | 173,950 |
| Fidelity National Information Services, Inc. | | 25,600 | 1,936,384 |
| Fiserv, Inc. (a) | | 8,000 | 850,240 |
| FleetCor Technologies, Inc. (a) | | 7,000 | 990,640 |
| Global Payments, Inc. | | 21,000 | 1,457,610 |
| PayPal Holdings, Inc. (a) | | 2,400 | 94,728 |
| Paysafe Group PLC (a) | | 445,232 | 2,037,338 |
| Syntel, Inc. | | 4,000 | 79,160 |
| Teletech Holdings, Inc. | | 4,994 | 152,317 |
| The Western Union Co. | | 4,100 | 89,052 |
| Total System Services, Inc. | | 12,200 | 598,166 |
| Vantiv, Inc. (a) | | 12,200 | 727,364 |
| Visa, Inc. Class A | | 400 | 31,208 |
| | | | 11,017,462 |
| IT Consulting & Other Services - 0.5% | | | |
| China Information Technology, Inc. (a) | | 42 | 30 |
| CSRA, Inc. | | 12,300 | 391,632 |
| IBM Corp. | | 100 | 16,599 |
| Lionbridge Technologies, Inc. (a) | | 132,300 | 767,340 |
| ServiceSource International, Inc. (a) | | 22,300 | 126,664 |
| Virtusa Corp. (a) | | 10,000 | 251,200 |
| | | | 1,553,465 |
|
| TOTAL IT SERVICES | | | 12,570,927 |
|
| Leisure Products - 0.1% | | | |
| Leisure Products - 0.1% | | | |
| Bandai Namco Holdings, Inc. | | 11,200 | 309,048 |
| Life Sciences Tools & Services - 0.1% | | | |
| Life Sciences Tools & Services - 0.1% | | | |
| JHL Biotech, Inc. (a) | | 94,814 | 204,501 |
| Machinery - 0.1% | | | |
| Industrial Machinery - 0.1% | | | |
| HIWIN Technologies Corp. | | 57,000 | 259,933 |
| Minebea Mitsumi, Inc. | | 16,200 | 151,916 |
| | | | 411,849 |
| Media - 0.7% | | | |
| Advertising - 0.0% | | | |
| iCar Asia Ltd. (a)(c) | | 374,524 | 67,569 |
| Cable & Satellite - 0.7% | | | |
| DISH Network Corp. Class A (a) | | 500 | 28,965 |
| Naspers Ltd. Class N | | 15,900 | 2,321,268 |
| | | | 2,350,233 |
|
| TOTAL MEDIA | | | 2,417,802 |
|
| Metals & Mining - 0.0% | | | |
| Diversified Metals & Mining - 0.0% | | | |
| Timminco Ltd. (a) | | 700 | 0 |
| Semiconductors & Semiconductor Equipment - 19.1% | | | |
| Semiconductor Equipment - 3.8% | | | |
| Amkor Technology, Inc. (a) | | 30,100 | 317,555 |
| Applied Materials, Inc. | | 1,400 | 45,178 |
| Entegris, Inc. (a) | | 55,800 | 998,820 |
| EO Technics Co. Ltd. | | 13,070 | 972,194 |
| Lam Research Corp. | | 20,200 | 2,135,746 |
| Siltronic AG (a) | | 40,300 | 1,867,620 |
| SolarEdge Technologies, Inc. (a)(c) | | 10,600 | 131,440 |
| STR Holdings, Inc. (a) | | 433 | 65 |
| Sumco Corp. | | 310,650 | 4,013,532 |
| Tessera Holding Corp. | | 22,100 | 976,820 |
| Ultratech, Inc. (a) | | 26,600 | 637,868 |
| Wonik QnC Corp. (a) | | 24,848 | 367,393 |
| | | | 12,464,231 |
| Semiconductors - 15.3% | | | |
| Advanced Micro Devices, Inc. (a) | | 99,900 | 1,132,866 |
| Advanced Semiconductor Engineering, Inc. | | 2,635,700 | 2,668,390 |
| Advanced Semiconductor Engineering, Inc. sponsored ADR | | 215,518 | 1,086,211 |
| ams AG | | 55,440 | 1,573,422 |
| Applied Micro Circuits Corp. (a) | | 12,600 | 103,950 |
| ASPEED Tech, Inc. | | 61,000 | 889,029 |
| Broadcom Ltd. | | 22,900 | 4,048,033 |
| Cavium, Inc. (a) | | 8,991 | 561,398 |
| ChipMOS TECHNOLOGIES, Inc. sponsored ADR | | 35,564 | 501,808 |
| Dialog Semiconductor PLC (a) | | 42,200 | 1,784,203 |
| Diodes, Inc. (a) | | 3,600 | 92,412 |
| Energy Conversion Devices, Inc. (a) | | 2,100 | 0 |
| GlobalWafers Co. Ltd. | | 849,000 | 3,008,366 |
| Himax Technologies, Inc. sponsored ADR | | 1,400 | 8,456 |
| Hua Hong Semiconductor Ltd. | | 665,000 | 740,003 |
| Inphi Corp. (a) | | 16,500 | 736,230 |
| Integrated Device Technology, Inc. (a) | | 60,300 | 1,420,668 |
| M/A-COM Technology Solutions Holdings, Inc. (a) | | 10,400 | 481,312 |
| Macronix International Co. Ltd. (a) | | 88,000 | 12,554 |
| MagnaChip Semiconductor Corp. (a) | | 8,400 | 52,080 |
| Marvell Technology Group Ltd. | | 266,800 | 3,700,516 |
| Maxim Integrated Products, Inc. | | 4,400 | 169,708 |
| MaxLinear, Inc. Class A (a) | | 76,200 | 1,661,160 |
| Melexis NV | | 2,710 | 181,573 |
| Mellanox Technologies Ltd. (a) | | 25,700 | 1,051,130 |
| Micron Technology, Inc. (a) | | 219,700 | 4,815,824 |
| Microsemi Corp. (a) | | 9,882 | 533,332 |
| Monolithic Power Systems, Inc. | | 21,300 | 1,745,109 |
| NVIDIA Corp. | | 41,600 | 4,440,384 |
| NXP Semiconductors NV (a) | | 40,349 | 3,954,605 |
| ON Semiconductor Corp. (a) | | 106,000 | 1,352,560 |
| On-Bright Electronics, Inc. | | 18,000 | 122,572 |
| Power Integrations, Inc. | | 514 | 34,875 |
| Qualcomm, Inc. | | 37,650 | 2,454,780 |
| Sanken Electric Co. Ltd. | | 75,000 | 328,556 |
| Silergy Corp. | | 23,000 | 321,743 |
| Silicon Laboratories, Inc. (a) | | 19,100 | 1,241,500 |
| Silicon Motion Technology Corp. sponsored ADR | | 29,900 | 1,270,152 |
| Siliconware Precision Industries Co. Ltd. sponsored ADR | | 13,800 | 100,740 |
| Sitronix Technology Corp. | | 44,000 | 138,964 |
| SK Hynix, Inc. | | 87 | 3,221 |
| Skyworks Solutions, Inc. | | 400 | 29,864 |
| SunPower Corp. (a)(c) | | 364 | 2,406 |
| Vanguard International Semiconductor Corp. | | 17,000 | 29,438 |
| YoungTek Electronics Corp. | | 175 | 251 |
| | | | 50,586,354 |
|
| TOTAL SEMICONDUCTORS & SEMICONDUCTOR EQUIPMENT | | | 63,050,585 |
|
| Software - 16.1% | | | |
| Application Software - 8.3% | | | |
| 8x8, Inc. (a) | | 41,500 | 593,450 |
| Adobe Systems, Inc. (a) | | 3,300 | 339,735 |
| ANSYS, Inc. (a) | | 3,800 | 351,462 |
| Aspen Technology, Inc. (a) | | 6,700 | 366,356 |
| Atlassian Corp. PLC | | 900 | 21,672 |
| Autodesk, Inc. (a) | | 155,700 | 11,523,357 |
| Blackbaud, Inc. | | 2,600 | 166,400 |
| Broadleaf Co. Ltd. | | 53,400 | 288,760 |
| BroadSoft, Inc. (a) | | 16,800 | 693,000 |
| Callidus Software, Inc. (a) | | 82,726 | 1,389,797 |
| Citrix Systems, Inc. (a) | | 1,900 | 169,689 |
| Descartes Systems Group, Inc. (a) | | 75,500 | 1,609,924 |
| HubSpot, Inc. (a) | | 2,700 | 126,900 |
| Intuit, Inc. | | 13,200 | 1,512,852 |
| Jive Software, Inc. (a) | | 10,700 | 46,545 |
| Kingdee International Software Group Co. Ltd. (a) | | 72,400 | 27,123 |
| LINE Corp. ADR (c) | | 749 | 25,473 |
| Manhattan Associates, Inc. (a) | | 5,152 | 273,211 |
| MobileIron, Inc. (a) | | 2,800 | 10,500 |
| Mobileye NV (a) | | 40,300 | 1,536,236 |
| Parametric Technology Corp. (a) | | 8,300 | 384,041 |
| Pegasystems, Inc. | | 800 | 28,800 |
| Salesforce.com, Inc. (a) | | 43,900 | 3,005,394 |
| Sinosoft Tech Group Ltd. | | 720,000 | 226,268 |
| Splunk, Inc. (a) | | 6,100 | 312,015 |
| Ultimate Software Group, Inc. (a) | | 900 | 164,115 |
| Verint Systems, Inc. (a) | | 666 | 23,477 |
| Workday, Inc. Class A (a) | | 16,500 | 1,090,485 |
| Workiva, Inc. (a) | | 21,300 | 290,745 |
| Zendesk, Inc. (a) | | 39,000 | 826,800 |
| | | | 27,424,582 |
| Home Entertainment Software - 5.2% | | | |
| Activision Blizzard, Inc. | | 100,371 | 3,624,397 |
| Capcom Co. Ltd. | | 95,500 | 2,247,059 |
| Electronic Arts, Inc. (a) | | 46,700 | 3,678,092 |
| NCSOFT Corp. | | 3,365 | 689,860 |
| Nexon Co. Ltd. | | 49,300 | 714,560 |
| Nintendo Co. Ltd. | | 11,300 | 2,348,992 |
| Nintendo Co. Ltd. ADR | | 10,900 | 282,855 |
| Rosetta Stone, Inc. (a) | | 1,100 | 9,801 |
| Square Enix Holdings Co. Ltd. | | 59,400 | 1,527,247 |
| Take-Two Interactive Software, Inc. (a) | | 31,400 | 1,547,706 |
| WeMade Entertainment Co. Ltd. (a) | | 20,000 | 369,433 |
| | | | 17,040,002 |
| Systems Software - 2.6% | | | |
| Allot Communications Ltd. (a) | | 62,900 | 301,291 |
| CyberArk Software Ltd. (a) | | 5,500 | 250,250 |
| Microsoft Corp. | | 99,800 | 6,201,572 |
| Proofpoint, Inc. (a) | | 14,900 | 1,052,685 |
| Rapid7, Inc. (a) | | 500 | 6,085 |
| Tableau Software, Inc. (a) | | 14,000 | 590,100 |
| Totvs SA | | 14,700 | 106,949 |
| | | | 8,508,932 |
|
| TOTAL SOFTWARE | | | 52,973,516 |
|
| Technology Hardware, Storage & Peripherals - 11.2% | | | |
| Technology Hardware, Storage & Peripherals - 11.2% | | | |
| 3D Systems Corp. (a)(c) | | 2,050 | 27,245 |
| Apple, Inc. | | 279,415 | 32,361,848 |
| HP, Inc. | | 38,617 | 573,076 |
| HTC Corp. (a) | | 92,000 | 223,944 |
| Intevac, Inc. (a) | | 1,500 | 12,825 |
| Nimble Storage, Inc. (a) | | 30,300 | 239,976 |
| Pure Storage, Inc. Class A (a)(c) | | 2,600 | 29,406 |
| Samsung Electronics Co. Ltd. | | 2,217 | 3,309,188 |
| | | | 36,777,508 |
| TOTAL COMMON STOCKS | | | |
| (Cost $267,442,716) | | | 328,837,129 |
|
| Convertible Preferred Stocks - 1.5% | | | |
| Internet & Direct Marketing Retail - 0.8% | | | |
| Internet & Direct Marketing Retail - 0.8% | | | |
| China Internet Plus Holdings Ltd.: | | | |
| Series A-11 (a)(d) | | 259,152 | 819,154 |
| Series B (d) | | 401,913 | 1,861,983 |
| | | | 2,681,137 |
| Internet Software & Services - 0.7% | | | |
| Internet Software & Services - 0.7% | | | |
| Uber Technologies, Inc. Series D, 8.00% (a)(d) | | 45,124 | 2,200,798 |
| TOTAL CONVERTIBLE PREFERRED STOCKS | | | |
| (Cost $3,070,818) | | | 4,881,935 |
|
| Money Market Funds - 2.5% | | | |
| Fidelity Cash Central Fund, 0.60% (e) | | 1,175,614 | 1,175,849 |
| Fidelity Securities Lending Cash Central Fund 0.65% (e)(f) | | 6,953,650 | 6,954,345 |
| TOTAL MONEY MARKET FUNDS | | | |
| (Cost $8,129,811) | | | 8,130,194 |
| TOTAL INVESTMENT PORTFOLIO - 103.7% | | | |
| (Cost $278,643,345) | | | 341,849,258 |
| NET OTHER ASSETS (LIABILITIES) - (3.7)% | | | (12,082,608) |
| NET ASSETS - 100% | | | $329,766,650 |
Security Type Abbreviations
ELS – Equity-Linked Security
Legend
(a) Non-income producing
(b) Security exempt from registration under Rule 144A of the Securities Act of 1933. These securities may be resold in transactions exempt from registration, normally to qualified institutional buyers. At the end of the period, the value of these securities amounted to $2,621,254 or 0.8% of net assets.
(c) Security or a portion of the security is on loan at period end.
(d) Restricted securities - Investment in securities not registered under the Securities Act of 1933 (excluding 144A issues). At the end of the period, the value of restricted securities (excluding 144A issues) amounted to $5,280,919 or 1.6% of net assets.
(e) Affiliated fund that is generally available only to investment companies and other accounts managed by Fidelity Investments. The rate quoted is the annualized seven-day yield of the fund at period end. A complete unaudited listing of the fund's holdings as of its most recent quarter end is available upon request. In addition, each Fidelity Central Fund's financial statements, which are not covered by the Fund's Report of Independent Registered Public Accounting Firm, are available on the SEC's website or upon request.
(f) Investment made with cash collateral received from securities on loan.
Additional information on each restricted holding is as follows:
| Security | Acquisition Date | Acquisition Cost |
| China Internet Plus Holdings Ltd. | 11/16/16 | $398,984 |
| China Internet Plus Holdings Ltd. Series A-11 | 1/26/15 | $819,141 |
| China Internet Plus Holdings Ltd. Series B | 12/11/15 | $1,551,666 |
| Uber Technologies, Inc. Series D, 8.00% | 6/6/14 | $700,011 |
Affiliated Central Funds
Information regarding fiscal year to date income earned by the Fund from investments in Fidelity Central Funds is as follows:
| Fund | Income earned |
| Fidelity Cash Central Fund | $21,816 |
| Fidelity Securities Lending Cash Central Fund | 381,013 |
| Total | $402,829 |
Investment Valuation
The following is a summary of the inputs used, as of December 31, 2016, involving the Fund's assets and liabilities carried at fair value. The inputs or methodology used for valuing securities may not be an indication of the risk associated with investing in those securities. For more information on valuation inputs, and their aggregation into the levels used below, please refer to the Investment Valuation section in the accompanying Notes to Financial Statements.
| | Valuation Inputs at Reporting Date: |
| Description | Total | Level 1 | Level 2 | Level 3 |
| Investments in Securities: | | | | |
| Common Stocks | $328,837,129 | $314,489,052 | $13,949,093 | $398,984 |
| Convertible Preferred Stocks | 4,881,935 | -- | -- | 4,881,935 |
| Money Market Funds | 8,130,194 | 8,130,194 | -- | -- |
| Total Investments in Securities: | $341,849,258 | $322,619,246 | $13,949,093 | $5,280,919 |
The following is a summary of transfers between Level 1 and Level 2 for the period ended December 31, 2016. Transfers are assumed to have occurred at the beginning of the period, and are primarily attributable to the valuation techniques used for foreign equity securities, as discussed in the accompanying Notes to Financial Statements:
| Transfers | Total |
| Level 1 to Level 2 | $115,296 |
| Level 2 to Level 1 | $10,066,569 |
The following is a reconciliation of Investments in Securities for which Level 3 inputs were used in determining value:
| Investments in Securities: | |
| Convertible Preferred Stocks | |
| Beginning Balance | $4,848,479 |
| Total Realized Gain (Loss) | -- |
| Total Unrealized Gain (Loss) | 119,153 |
| Cost of Purchases | -- |
| Proceeds of Sales | (85,697) |
| Amortization/Accretion | -- |
| Transfers in to Level 3 | -- |
| Transfers out of Level 3 | -- |
| Ending Balance | $4,881,935 |
| The change in unrealized gain (loss) for the period attributable to Level 3 securities held at December 31, 2016 | $128,962 |
| Other Investments in Securities | |
| Beginning Balance | $-- |
| Total Realized Gain (Loss) | -- |
| Total Unrealized Gain (Loss) | -- |
| Cost of Purchases | 398,984 |
| Proceeds of Sales | -- |
| Amortization/Accretion | -- |
| Transfers in to Level 3 | -- |
| Transfers out of Level 3 | -- |
| Ending Balance | $398,984 |
| The change in unrealized gain (loss) for the period attributable to Level 3 securities held at December 31, 2016 | $-- |
The information used in the above reconciliations represents fiscal year to date activity for any Investments in Securities identified as using Level 3 inputs at either the beginning or the end of the current fiscal period. Transfers in or out of Level 3 represent the beginning value of any Security or Instrument where a change in the pricing level occurred from the beginning to the end of the period. The cost of purchases and the proceeds of sales may include securities received or delivered through corporate actions or exchanges. Realized and unrealized gains (losses) disclosed in the reconciliations are included in Net Gain (Loss) on the Fund's Statement of Operations.
Other Information
Distribution of investments by country or territory of incorporation, as a percentage of Total Net Assets, is as follows (Unaudited):
| United States of America | 65.1% |
| Japan | 9.1% |
| Cayman Islands | 6.9% |
| Taiwan | 5.4% |
| Korea (South) | 3.5% |
| Netherlands | 1.7% |
| United Kingdom | 1.3% |
| Singapore | 1.2% |
| Bermuda | 1.1% |
| Others (Individually Less Than 1%) | 4.7% |
| | 100.0% |
See accompanying notes which are an integral part of the financial statements.
Financial Statements
Statement of Assets and Liabilities
| | | December 31, 2016 |
| Assets | | |
Investment in securities, at value (including securities loaned of $6,658,635) — See accompanying schedule:
Unaffiliated issuers (cost $270,513,534) | $333,719,064 | |
| Fidelity Central Funds (cost $8,129,811) | 8,130,194 | |
| Total Investments (cost $278,643,345) | | $341,849,258 |
| Cash | | 8,597 |
| Receivable for fund shares sold | | 31,495 |
| Dividends receivable | | 119,133 |
| Distributions receivable from Fidelity Central Funds | | 11,792 |
| Prepaid expenses | | 1,403 |
| Other receivables | | 6,000 |
| Total assets | | 342,027,684 |
| Liabilities | | |
| Payable for investments purchased | $466,023 | |
| Payable for fund shares redeemed | 4,574,662 | |
| Accrued management fee | 154,622 | |
| Other affiliated payables | 47,276 | |
| Other payables and accrued expenses | 66,015 | |
| Collateral on Securities Loaned | 6,952,436 | |
| Total liabilities | | 12,261,034 |
| Net Assets | | $329,766,650 |
| Net Assets consist of: | | |
| Paid in capital | | $262,759,737 |
| Undistributed net investment income | | 63,220 |
| Accumulated undistributed net realized gain (loss) on investments and foreign currency transactions | | 3,737,729 |
| Net unrealized appreciation (depreciation) on investments and assets and liabilities in foreign currencies | | 63,205,964 |
| Net Assets | | $329,766,650 |
| Initial Class: | | |
| Net Asset Value, offering price and redemption price per share ($75,479,660 ÷ 5,915,888 shares) | | $12.76 |
| Investor Class: | | |
| Net Asset Value, offering price and redemption price per share ($254,286,990 ÷ 20,136,689 shares) | | $12.63 |
See accompanying notes which are an integral part of the financial statements.
Statement of Operations
| | | Year ended December 31, 2016 |
| Investment Income | | |
| Dividends | | $2,127,917 |
| Income from Fidelity Central Funds (including $381,013 from security lending) | | 402,829 |
| Total income | | 2,530,746 |
| Expenses | | |
| Management fee | $1,620,107 | |
| Transfer agent fees | 377,770 | |
| Accounting and security lending fees | 119,097 | |
| Custodian fees and expenses | 49,712 | |
| Independent trustees' fees and expenses | 6,248 | |
| Audit | 56,681 | |
| Legal | 9,479 | |
| Miscellaneous | 3,357 | |
| Total expenses before reductions | 2,242,451 | |
| Expense reductions | (21,812) | 2,220,639 |
| Net investment income (loss) | | 310,107 |
| Realized and Unrealized Gain (Loss) | | |
| Net realized gain (loss) on: | | |
| Investment securities: | | |
| Unaffiliated issuers | 5,119,245 | |
| Fidelity Central Funds | 1,503 | |
| Foreign currency transactions | 20,312 | |
| Total net realized gain (loss) | | 5,141,060 |
Change in net unrealized appreciation (depreciation) on:
Investment securities (net of decrease in deferred foreign taxes of $3,536) | 22,502,915 | |
| Assets and liabilities in foreign currencies | 695 | |
| Total change in net unrealized appreciation (depreciation) | | 22,503,610 |
| Net gain (loss) | | 27,644,670 |
| Net increase (decrease) in net assets resulting from operations | | $27,954,777 |
See accompanying notes which are an integral part of the financial statements.
Statement of Changes in Net Assets
| | Year ended December 31, 2016 | Year ended December 31, 2015 |
| Increase (Decrease) in Net Assets | | |
| Operations | | |
| Net investment income (loss) | $310,107 | $289,337 |
| Net realized gain (loss) | 5,141,060 | 11,514,392 |
| Change in net unrealized appreciation (depreciation) | 22,503,610 | 2,787,400 |
| Net increase (decrease) in net assets resulting from operations | 27,954,777 | 14,591,129 |
| Distributions to shareholders from net investment income | (251,567) | (297,796) |
| Distributions to shareholders from net realized gain | (9,124,552) | (14,033,896) |
| Total distributions | (9,376,119) | (14,331,692) |
| Share transactions - net increase (decrease) | (943,504) | 61,674,493 |
| Redemption fees | 44,404 | 42,386 |
| Total increase (decrease) in net assets | 17,679,558 | 61,976,316 |
| Net Assets | | |
| Beginning of period | 312,087,092 | 250,110,776 |
| End of period | $329,766,650 | $312,087,092 |
| Other Information | | |
| Undistributed net investment income end of period | $63,220 | $– |
See accompanying notes which are an integral part of the financial statements.
Financial Highlights — VIP Technology Portfolio Initial Class
| Years ended December 31, | 2016 | 2015 | 2014 | 2013 | 2012 |
| Selected Per–Share Data | | | | | |
| Net asset value, beginning of period | $11.91 | $11.83 | $12.43 | $10.33 | $9.81 |
| Income from Investment Operations | | | | | |
| Net investment income (loss)A | .02 | .02 | .01 | .01 | .01 |
| Net realized and unrealized gain (loss) | 1.22 | .71 | 1.38 | 2.78 | 1.66 |
| Total from investment operations | 1.24 | .73 | 1.39 | 2.79 | 1.67 |
| Distributions from net investment income | (.02) | (.02) | (.01) | (.02) | – |
| Distributions from net realized gain | (.37) | (.63) | (1.98) | (.67) | (1.15) |
| Total distributions | (.39) | (.65) | (1.99) | (.69) | (1.15) |
| Redemption fees added to paid in capitalA,B | – | – | – | – | – |
| Net asset value, end of period | $12.76 | $11.91 | $11.83 | $12.43 | $10.33 |
| Total ReturnC,D | 11.37% | 6.27% | 11.91% | 27.81% | 17.52% |
| Ratios to Average Net AssetsE,F | | | | | |
| Expenses before reductions | .70% | .69% | .70% | .73% | .71% |
| Expenses net of fee waivers, if any | .70% | .69% | .69% | .72% | .71% |
| Expenses net of all reductions | .69% | .68% | .69% | .72% | .70% |
| Net investment income (loss) | .17% | .16% | .13% | .10% | .09% |
| Supplemental Data | | | | | |
| Net assets, end of period (000 omitted) | $75,480 | $70,596 | $69,964 | $61,534 | $60,849 |
| Portfolio turnover rateG | 67% | 68% | 67% | 113% | 71% |
A Calculated based on average shares outstanding during the period.
B Amount represents less than $.005 per share.
C Total returns do not reflect charges attributable to your insurance company's separate account. Inclusion of these charges would reduce the total returns shown.
D Total returns would have been lower if certain expenses had not been reduced during the applicable periods shown.
E Fees and expenses of any underlying Fidelity Central Funds are not included in the Fund's expense ratio. The Fund indirectly bears its proportionate share of the expenses of any underlying Fidelity Central Funds.
F Expense ratios reflect operating expenses of the class. Expenses before reductions do not reflect amounts reimbursed by the investment adviser or reductions from brokerage service arrangements or reductions from other expense offset arrangements and do not represent the amount paid by the class during periods when reimbursements or reductions occur. Expenses net of fee waivers reflect expenses after reimbursement by the investment adviser but prior to reductions from brokerage service arrangements or other expense offset arrangements. Expenses net of all reductions represent the net expenses paid by the class.
G Amount does not include the portfolio activity of any underlying Fidelity Central Funds.
See accompanying notes which are an integral part of the financial statements.
Financial Highlights — VIP Technology Portfolio Investor Class
| Years ended December 31, | 2016 | 2015 | 2014 | 2013 | 2012 |
| Selected Per–Share Data | | | | | |
| Net asset value, beginning of period | $11.79 | $11.73 | $12.34 | $10.26 | $9.75 |
| Income from Investment Operations | | | | | |
| Net investment income (loss)A | .01 | .01 | .01 | –B | –B |
| Net realized and unrealized gain (loss) | 1.21 | .69 | 1.36 | 2.76 | 1.66 |
| Total from investment operations | 1.22 | .70 | 1.37 | 2.76 | 1.66 |
| Distributions from net investment income | (.01) | (.01) | (.01) | (.01) | – |
| Distributions from net realized gain | (.37) | (.63) | (1.98) | (.67) | (1.15) |
| Total distributions | (.38) | (.64) | (1.98)C | (.68) | (1.15) |
| Redemption fees added to paid in capitalA,B | – | – | – | – | – |
| Net asset value, end of period | $12.63 | $11.79 | $11.73 | $12.34 | $10.26 |
| Total ReturnD,E | 11.34% | 6.08% | 11.86% | 27.73% | 17.51% |
| Ratios to Average Net AssetsF,G | | | | | |
| Expenses before reductions | .78% | .77% | .78% | .81% | .79% |
| Expenses net of fee waivers, if any | .78% | .77% | .77% | .80% | .79% |
| Expenses net of all reductions | .77% | .76% | .77% | .80% | .78% |
| Net investment income (loss) | .09% | .08% | .05% | .02% | .01% |
| Supplemental Data | | | | | |
| Net assets, end of period (000 omitted) | $254,287 | $241,491 | $180,147 | $120,666 | $91,601 |
| Portfolio turnover rateH | 67% | 68% | 67% | 113% | 71% |
A Calculated based on average shares outstanding during the period.
B Amount represents less than $.005 per share.
C Total distributions of $1.98 per share is comprised of distributions from net investment income of $.005 and distributions from net realized gain of $1.977 per share.
D Total returns do not reflect charges attributable to your insurance company's separate account. Inclusion of these charges would reduce the total returns shown.
E Total returns would have been lower if certain expenses had not been reduced during the applicable periods shown.
F Fees and expenses of any underlying Fidelity Central Funds are not included in the Fund's expense ratio. The Fund indirectly bears its proportionate share of the expenses of any underlying Fidelity Central Funds.
G Expense ratios reflect operating expenses of the class. Expenses before reductions do not reflect amounts reimbursed by the investment adviser or reductions from brokerage service arrangements or reductions from other expense offset arrangements and do not represent the amount paid by the class during periods when reimbursements or reductions occur. Expenses net of fee waivers reflect expenses after reimbursement by the investment adviser but prior to reductions from brokerage service arrangements or other expense offset arrangements. Expenses net of all reductions represent the net expenses paid by the class.
H Amount does not include the portfolio activity of any underlying Fidelity Central Funds.
See accompanying notes which are an integral part of the financial statements.
Notes to Financial Statements
For the period ended December 31, 2016
1. Organization.
VIP Technology Portfolio (the Fund) is a non-diversified fund of Variable Insurance Products Fund IV (the Trust) and is authorized to issue an unlimited number of shares. The Trust is registered under the Investment Company Act of 1940, as amended (the 1940 Act), as an open-end management investment company organized as a Massachusetts business trust. Shares of the Fund may only be purchased by insurance companies for the purpose of funding variable annuity or variable life insurance contracts. The Fund offers the following classes of shares: Initial Class shares and Investor Class shares. All classes have equal rights and voting privileges, except for matters affecting a single class. The Fund's investments in emerging markets can be subject to social, economic, regulatory, and political uncertainties and can be extremely volatile.
2. Investments in Fidelity Central Funds.
The Fund invests in Fidelity Central Funds, which are open-end investment companies generally available only to other investment companies and accounts managed by the investment adviser and its affiliates. The Fund's Schedule of Investments lists each of the Fidelity Central Funds held as of period end, if any, as an investment of the Fund, but does not include the underlying holdings of each Fidelity Central Fund. As an Investing Fund, the Fund indirectly bears its proportionate share of the expenses of the underlying Fidelity Central Funds.
The Money Market Central Funds seek preservation of capital and current income and are managed by Fidelity Investments Money Management, Inc. (FIMM), an affiliate of the investment adviser. Annualized expenses of the Money Market Central Funds as of their most recent shareholder report date are less than .005%.
A complete unaudited list of holdings for each Fidelity Central Fund is available upon request or at the Securities and Exchange Commission (the SEC) website at www.sec.gov. In addition, the financial statements of the Fidelity Central Funds, which are not covered by the Fund's Report of Independent Registered Public Accounting Firm, are available on the SEC website or upon request.
3. Significant Accounting Policies.
The financial statements have been prepared in conformity with accounting principles generally accepted in the United States of America (GAAP), which require management to make certain estimates and assumptions at the date of the financial statements. Actual results could differ from those estimates. Subsequent events, if any, through the date that the financial statements were issued have been evaluated in the preparation of the financial statements. The following summarizes the significant accounting policies of the Fund:
Investment Valuation. Investments are valued as of 4:00 p.m. Eastern time on the last calendar day of the period. The Board of Trustees (the Board) has delegated the day to day responsibility for the valuation of the Fund's investments to the Fair Value Committee (the Committee) established by the Fund's investment adviser. In accordance with valuation policies and procedures approved by the Board, the Fund attempts to obtain prices from one or more third party pricing vendors or brokers to value its investments. When current market prices, quotations or currency exchange rates are not readily available or reliable, investments will be fair valued in good faith by the Committee, in accordance with procedures adopted by the Board. Factors used in determining fair value vary by investment type and may include market or investment specific events. The frequency with which these procedures are used cannot be predicted and they may be utilized to a significant extent. The Committee oversees the Fund's valuation policies and procedures and reports to the Board on the Committee's activities and fair value determinations. The Board monitors the appropriateness of the procedures used in valuing the Fund's investments and ratifies the fair value determinations of the Committee.
The Fund categorizes the inputs to valuation techniques used to value its investments into a disclosure hierarchy consisting of three levels as shown below:
- Level 1 – quoted prices in active markets for identical investments
- Level 2 – other significant observable inputs (including quoted prices for similar investments, interest rates, prepayment speeds, etc.)
- Level 3 – unobservable inputs (including the Fund's own assumptions based on the best information available)
Valuation techniques used to value the Fund's investments by major category are as follows:
Equity securities, including restricted securities, for which market quotations are readily available, are valued at the last reported sale price or official closing price as reported by a third party pricing vendor on the primary market or exchange on which they are traded and are categorized as Level 1 in the hierarchy. In the event there were no sales during the day or closing prices are not available, securities are valued at the last quoted bid price or may be valued using the last available price and are generally categorized as Level 2 in the hierarchy. For foreign equity securities, when market or security specific events arise, comparisons to the valuation of American Depositary Receipts (ADRs), futures contracts, Exchange-Traded Funds (ETFs) and certain indexes as well as quoted prices for similar securities may be used and would be categorized as Level 2 in the hierarchy. Utilizing these techniques may result in transfers between Level 1 and Level 2. For equity securities, including restricted securities, where observable inputs are limited, assumptions about market activity and risk are used and these securities may be categorized as Level 3 in the hierarchy. Equity securities, including restricted securities, for which observable inputs are not available are valued using alternate valuation approaches, including the market approach and the income approach and are categorized as Level 3 in the hierarchy. The market approach generally consists of using comparable market transactions while the income approach generally consists of using the net present value of estimated future cash flows, adjusted as appropriate for liquidity, credit, market and/or other risk factors.
Investments in open-end mutual funds, including the Fidelity Central Funds, are valued at their closing net asset value (NAV) each business day and are categorized as Level 1 in the hierarchy.
The following provides information on Level 3 securities held by the Fund that were valued at period end based on unobservable inputs. These amounts exclude valuations provided by a broker.
| Asset Type | Fair Value at 12/31/16 | Valuation Technique(s) | Unobservable Input | Amount or Range/Weighted Average | Impact to Valuation from an Increase in Input(a) |
| Equities | $5,280,919 | Market approach | Transaction price | $2.82 - $48.77 / $22.66 | Increase |
| | | | Premium rate | 20.0% | Increase |
| | | Recovery value | Recovery value | 0.0% | Increase |
(a) Represents the expected directional change in the fair value of the Level 3 investments that would result from an increase in the corresponding input. A decrease to the unobservable input would have the opposite effect. Significant changes in these inputs could result in significantly higher or lower fair value measurements.
Changes in valuation techniques may result in transfers in or out of an assigned level within the disclosure hierarchy. The aggregate value of investments by input level as of December 31, 2016, including information on transfers between Levels 1 and 2, as well as a roll forward of Level 3 investments, is included at the end of the Fund's Schedule of Investments.
Foreign Currency. The Fund may use foreign currency contracts to facilitate transactions in foreign-denominated securities. Gains and losses from these transactions may arise from changes in the value of the foreign currency or if the counterparties do not perform under the contracts' terms. Foreign-denominated assets, including investment securities, and liabilities are translated into U.S. dollars at the exchange rates at period end. Purchases and sales of investment securities, income and dividends received and expenses denominated in foreign currencies are translated into U.S. dollars at the exchange rate in effect on the transaction date.
The effects of exchange rate fluctuations on investments are included with the net realized and unrealized gain (loss) on investment securities. Other foreign currency transactions resulting in realized and unrealized gain (loss) are disclosed separately.
Investment Transactions and Income. For financial reporting purposes, the Fund's investment holdings and NAV include trades executed through the end of the last business day of the period. The NAV per share for processing shareholder transactions is calculated as of the close of business of the New York Stock Exchange (NYSE), normally 4:00 p.m. Eastern time and includes trades executed through the end of the prior business day. Gains and losses on securities sold are determined on the basis of identified cost and may include proceeds received from litigation. Dividend income is recorded on the ex-dividend date, except for certain dividends from foreign securities where the ex-dividend date may have passed, which are recorded as soon as the Fund is informed of the ex-dividend date. Non-cash dividends included in dividend income, if any, are recorded at the fair market value of the securities received. Income and capital gain distributions from Fidelity Central Funds, if any, are recorded on the ex-dividend date. Certain distributions received by the Fund represent a return of capital or capital gain. The Fund determines the components of these distributions subsequent to the ex-dividend date, based upon receipt of tax filings or other correspondence relating to the underlying investment. These distributions are recorded as a reduction of cost of investments and/or as a realized gain. Interest income is accrued as earned and includes coupon interest and amortization of premium and accretion of discount on debt securities as applicable. Investment income is recorded net of foreign taxes withheld where recovery of such taxes is uncertain.
Class Allocations and Expenses. Investment income, realized and unrealized capital gains and losses, common expenses of the Fund, and certain fund-level expense reductions, if any, are allocated daily on a pro-rata basis to each class based on the relative net assets of each class to the total net assets of the Fund. Each class differs with respect to transfer agent fees incurred. Certain expense reductions may also differ by class. For the reporting period, the allocated portion of income and expenses to each class as a percent of its average net assets may vary due to the timing of recording these transactions in relation to fluctuating net assets of the classes. Expenses directly attributable to a fund are charged to that fund. Expenses attributable to more than one fund are allocated among the respective funds on the basis of relative net assets or other appropriate methods. Expense estimates are accrued in the period to which they relate and adjustments are made when actual amounts are known.
Income Tax Information and Distributions to Shareholders. Each year, the Fund intends to qualify as a regulated investment company under Subchapter M of the Internal Revenue Code, including distributing substantially all of its taxable income and realized gains. As a result, no provision for U.S. Federal income taxes is required. As of December 31, 2016, the Fund did not have any unrecognized tax benefits in the financial statements; nor is the Fund aware of any tax positions for which it is reasonably possible that the total amounts of unrecognized tax benefits will significantly change in the next twelve months. The Fund files a U.S. federal tax return, in addition to state and local tax returns as required. The Fund's federal income tax returns are subject to examination by the Internal Revenue Service (IRS) for a period of three fiscal years after they are filed. State and local tax returns may be subject to examination for an additional fiscal year depending on the jurisdiction. Foreign taxes are provided for based on the Fund's understanding of the tax rules and rates that exist in the foreign markets in which it invests. The Fund is subject to a tax imposed on capital gains by certain countries in which it invests.
Distributions are declared and recorded on the ex-dividend date. Income dividends and capital gain distributions are declared separately for each class. Income and capital gain distributions are determined in accordance with income tax regulations, which may differ from GAAP.
Capital accounts within the financial statements are adjusted for permanent book-tax differences. These adjustments have no impact on net assets or the results of operations. Capital accounts are not adjusted for temporary book-tax differences which will reverse in a subsequent period.
Book-tax differences are primarily due to foreign currency transactions, certain foreign taxes, passive foreign investment companies (PFIC) and losses deferred due to wash sales and excise tax regulations.
The federal tax cost of investment securities and unrealized appreciation (depreciation) as of period end were as follows:
| Gross unrealized appreciation | $81,404,268 |
| Gross unrealized depreciation | (18,762,655) |
| Net unrealized appreciation (depreciation) on securities | $62,641,613 |
| Tax Cost | $279,207,645 |
The tax-based components of distributable earnings as of period end were as follows:
| Undistributed ordinary income | $77,318 |
| Undistributed long-term capital gain | $4,287,931 |
| Net unrealized appreciation (depreciation) on securities and other investments | $62,641,664 |
The tax character of distributions paid was as follows:
| | December 31, 2016 | December 31, 2015 |
| Ordinary Income | $330,385 | $ 3,868,271 |
| Long-term Capital Gains | 9,045,734 | 10,463,421 |
| Total | $9,376,119 | $ 14,331,692 |
Trading (Redemption) Fees. Shares held by investors less than 60 days may be subject to a redemption fee equal to 1% of the NAV of shares redeemed. All redemption fees, which reduce the proceeds of the shareholder redemption, are retained by the Fund and accounted for as an addition to paid in capital.
Restricted Securities. The Fund may invest in securities that are subject to legal or contractual restrictions on resale. These securities generally may be resold in transactions exempt from registration or to the public if the securities are registered. Disposal of these securities may involve time-consuming negotiations and expense, and prompt sale at an acceptable price may be difficult. Information regarding restricted securities is included at the end of the Fund's Schedule of Investments.
4. Purchases and Sales of Investments.
Purchases and sales of securities, other than short-term securities, aggregated $203,350,897 and $196,799,825, respectively.
5. Fees and Other Transactions with Affiliates.
Management Fee. Fidelity SelectCo, LLC (the investment adviser) and its affiliates provide the Fund with investment management related services for which the Fund pays a monthly management fee. The management fee is the sum of an individual fund fee rate that is based on an annual rate of .30% of the Fund's average net assets and an annualized group fee rate that averaged .25% during the period. The group fee rate is based upon the average net assets of all the mutual funds advised by Fidelity Management & Research Company (FMR) and the investment adviser. The group fee rate decreases as assets under management increase and increases as assets under management decrease. For the reporting period, the total annual management fee rate was .55% of the Fund's average net assets.
Transfer Agent Fees. Fidelity Investments Institutional Operations Company, Inc. (FIIOC), an affiliate of the investment adviser, is the Fund's transfer, dividend disbursing, and shareholder servicing agent. FIIOC receives an asset-based fee with respect to each class. Each class (with the exception of Investor Class) pays a fee for transfer agent services, typesetting, and printing and mailing of shareholder reports, excluding mailing of proxy statements, equal to an annual rate of .07% (.15% for Investor Class) of class-level average net assets. For the period, transfer agent fees for each class were as follows:
| Initial Class | $46,108 |
| Investor Class | 331,662 |
| | $377,770 |
Accounting and Security Lending Fees. Fidelity Service Company, Inc. (FSC), an affiliate of the investment adviser, maintains the Fund's accounting records. The accounting fee is based on the level of average net assets for each month. Under a separate contract, FSC administers the security lending program. The security lending fee is based on the number and duration of lending transactions.
Brokerage Commissions. The Fund placed a portion of its portfolio transactions with brokerage firms which are affiliates of the investment adviser. Brokerage commissions are included in net realized gain (loss) and change in net unrealized appreciation (depreciation) in the Statement of Operations. The commissions paid to these affiliated firms were $4,178 for the period.
Interfund Trades. The Fund may purchase from or sell securities to other Fidelity Funds under procedures adopted by the Board. The procedures have been designed to ensure these interfund trades are executed in accordance with Rule 17a-7 of the 1940 Act. Interfund trades are included within the respective purchases and sales amounts shown in the Purchases and Sales of Investments note.
6. Committed Line of Credit.
The Fund participates with other funds managed by the investment adviser or an affiliate in a $4.25 billion credit facility (the "line of credit") to be utilized for temporary or emergency purposes to fund shareholder redemptions or for other short-term liquidity purposes. The Fund has agreed to pay commitment fees on its pro-rata portion of the line of credit, which amounted to $724 and is reflected in Miscellaneous expenses on the Statement of Operations. During the period, the Fund did not borrow on this line of credit.
7. Security Lending.
The Fund lends portfolio securities through a lending agent from time to time in order to earn additional income. On the settlement date of the loan, the Fund receives collateral (in the form of U.S. Treasury obligations, letters of credit and/or cash) against the loaned securities and maintains collateral in an amount not less than 100% of the market value of the loaned securities during the period of the loan. The market value of the loaned securities is determined at the close of business of the Fund and any additional required collateral is delivered to the Fund on the next business day. The Fund or borrower may terminate the loan at any time, and if the borrower defaults on its obligation to return the securities loaned because of insolvency or other reasons, the Fund may apply collateral received from the borrower against the obligation. The Fund may experience delays and costs in recovering the securities loaned. Any cash collateral received is invested in the Fidelity Securities Lending Cash Central Fund. The value of loaned securities and cash collateral at period end are disclosed on the Fund's Statement of Assets and Liabilities. Security lending income represents the income earned on investing cash collateral, less rebates paid to borrowers and any lending agent fees associated with the loan, plus any premium payments received for lending certain types of securities. Security lending income is presented in the Statement of Operations as a component of income from Fidelity Central Funds.
8. Expense Reductions.
Commissions paid to certain brokers with whom the investment adviser, or its affiliates, places trades on behalf of the Fund include an amount in addition to trade execution, which may be rebated back to the Fund to offset certain expenses. This amount totaled $19,595 for the period.
In addition, during the period the investment adviser reimbursed and/or waived a portion of fund-level operating expenses in the amount of $2,217.
9. Distributions to Shareholders.
Distributions to shareholders of each class were as follows:
| | Year ended
December 31, 2016 | Year ended
December 31, 2015 |
| From net investment income | | |
| Initial Class | $88,680 | $99,395 |
| Investor Class | 162,887 | 198,401 |
| Total | $251,567 | $297,796 |
| From net realized gain | | |
| Initial Class | $2,064,829 | $3,666,747 |
| Investor Class | 7,059,723 | 10,367,149 |
| Total | $9,124,552 | $14,033,896 |
10. Share Transactions.
Transactions for each class of shares were as follows:
| | Shares | Shares | Dollars | Dollars |
| | Year ended December 31, 2016 | Year ended December 31, 2015 | Year ended December 31, 2016 | Year ended December 31, 2015 |
| Initial Class | | | | |
| Shares sold | 2,212,158 | 827,052 | $27,807,461 | $9,981,643 |
| Reinvestment of distributions | 220,170 | 320,044 | 2,153,509 | 3,766,142 |
| Shares redeemed | (2,445,002) | (1,132,307) | (29,362,382) | (13,373,077) |
| Net increase (decrease) | (12,674) | 14,789 | $598,588 | $374,708 |
| Investor Class | | | | |
| Shares sold | 3,963,774 | 5,695,629 | $48,389,591 | $67,818,059 |
| Reinvestment of distributions | 748,863 | 906,354 | 7,222,610 | 10,565,550 |
| Shares redeemed | (5,052,835) | (1,489,081) | (57,154,293) | (17,083,824) |
| Net increase (decrease) | (340,198) | 5,112,902 | $(1,542,092) | $61,299,785 |
11. Other.
The Fund's organizational documents provide former and current trustees and officers with a limited indemnification against liabilities arising in connection with the performance of their duties to the Fund. In the normal course of business, the Fund may also enter into contracts that provide general indemnifications. The Fund's maximum exposure under these arrangements is unknown as this would be dependent on future claims that may be made against the Fund. The risk of material loss from such claims is considered remote.
At the end of the period, the investment adviser or its affiliates were the owners of record of 100% of the total outstanding shares of the Fund.
Report of Independent Registered Public Accounting Firm
To the Trustees of Variable Insurance Products Fund IV and Shareholders of VIP Technology Portfolio:
In our opinion, the accompanying statement of assets and liabilities, including the schedule of investments, and the related statements of operations and of changes in net assets and the financial highlights present fairly, in all material respects, the financial position of VIP Technology Portfolio (a fund of Variable Insurance Products Fund IV) (the "Fund") as of December 31, 2016, the results of its operations for the year then ended, the changes in its net assets for each of the two years in the period then ended and the financial highlights for each of the five years in the period then ended, in conformity with accounting principles generally accepted in the United States of America. These financial statements and financial highlights (hereafter referred to as “financial statements”) are the responsibility of the Fund's management. Our responsibility is to express an opinion on these financial statements based on our audits. We conducted our audits of these financial statements in accordance with the standards of the Public Company Accounting Oversight Board (United States). Those standards require that we plan and perform the audit to obtain reasonable assurance about whether the financial statements are free of material misstatement. An audit includes examining, on a test basis, evidence supporting the amounts and disclosures in the financial statements, assessing the accounting principles used and significant estimates made by management, and evaluating the overall financial statement presentation. We believe that our audits, which included confirmation of securities as of December 31, 2016 by correspondence with the custodian, agent banks and brokers, provide a reasonable basis for our opinion.
PricewaterhouseCoopers LLP
Boston, Massachusetts
February 16, 2017
Trustees and Officers
The Trustees, Members of the Advisory Board (if any), and officers of the trust and fund, as applicable, are listed below. The Board of Trustees governs the fund and is responsible for protecting the interests of shareholders. The Trustees are experienced executives who meet periodically throughout the year to oversee the fund's activities, review contractual arrangements with companies that provide services to the fund, oversee management of the risks associated with such activities and contractual arrangements, and review the fund's performance. Each of the Trustees oversees 83 funds.
The Trustees hold office without limit in time except that (a) any Trustee may resign; (b) any Trustee may be removed by written instrument, signed by at least two-thirds of the number of Trustees prior to such removal; (c) any Trustee who requests to be retired or who has become incapacitated by illness or injury may be retired by written instrument signed by a majority of the other Trustees; and (d) any Trustee may be removed at any special meeting of shareholders by a two-thirds vote of the outstanding voting securities of the trust. Each Trustee who is not an interested person (as defined in the 1940 Act) of the trust and the fund is referred to herein as an Independent Trustee. Each Independent Trustee shall retire not later than the last day of the calendar year in which his or her 75th birthday occurs. The Independent Trustees may waive this mandatory retirement age policy with respect to individual Trustees. Officers and Advisory Board Members hold office without limit in time, except that any officer or Advisory Board Member may resign or may be removed by a vote of a majority of the Trustees at any regular meeting or any special meeting of the Trustees. Except as indicated, each individual has held the office shown or other offices in the same company for the past five years.
The fund’s Statement of Additional Information (SAI) includes more information about the Trustees. To request a free copy, call Fidelity at 1-877-208-0098.
Experience, Skills, Attributes, and Qualifications of the Trustees. The Governance and Nominating Committee has adopted a statement of policy that describes the experience, qualifications, attributes, and skills that are necessary and desirable for potential Independent Trustee candidates (Statement of Policy). The Board believes that each Trustee satisfied at the time he or she was initially elected or appointed a Trustee, and continues to satisfy, the standards contemplated by the Statement of Policy. The Governance and Nominating Committee also engages professional search firms to help identify potential Independent Trustee candidates who have the experience, qualifications, attributes, and skills consistent with the Statement of Policy. From time to time, additional criteria based on the composition and skills of the current Independent Trustees, as well as experience or skills that may be appropriate in light of future changes to board composition, business conditions, and regulatory or other developments, have also been considered by the professional search firms and the Governance and Nominating Committee. In addition, the Board takes into account the Trustees' commitment and participation in Board and committee meetings, as well as their leadership of standing and ad hoc committees throughout their tenure.
In determining that a particular Trustee was and continues to be qualified to serve as a Trustee, the Board has considered a variety of criteria, none of which, in isolation, was controlling. The Board believes that, collectively, the Trustees have balanced and diverse experience, qualifications, attributes, and skills, which allow the Board to operate effectively in governing the fund and protecting the interests of shareholders. Information about the specific experience, skills, attributes, and qualifications of each Trustee, which in each case led to the Board's conclusion that the Trustee should serve (or continue to serve) as a trustee of the fund, is provided below.
Board Structure and Oversight Function. Brian B. Hogan is an interested person and currently serves as Chairman. The Trustees have determined that an interested Chairman is appropriate and benefits shareholders because an interested Chairman has a personal and professional stake in the quality and continuity of services provided to the fund. Independent Trustees exercise their informed business judgment to appoint an individual of their choosing to serve as Chairman, regardless of whether the Trustee happens to be independent or a member of management. The Independent Trustees have determined that they can act independently and effectively without having an Independent Trustee serve as Chairman and that a key structural component for assuring that they are in a position to do so is for the Independent Trustees to constitute a substantial majority for the Board. The Independent Trustees also regularly meet in executive session. Michael E. Wiley serves as Chairman of the Independent Trustees and as such (i) acts as a liaison between the Independent Trustees and management with respect to matters important to the Independent Trustees and (ii) with management prepares agendas for Board meetings.
Fidelity® funds are overseen by different Boards of Trustees. The fund's Board oversees Fidelity's sector portfolios. Other Boards oversee Fidelity's equity and high income funds, and Fidelity's investment grade bond, money market, and asset allocation funds. The use of separate Boards, each with its own committee structure, allows the Trustees of each group of Fidelity® funds to focus on the unique issues of the funds they oversee, including common research, investment, and operational issues. On occasion, the separate Boards establish joint committees to address issues of overlapping consequences for the Fidelity® funds overseen by each Board.
The Trustees operate using a system of committees to facilitate the timely and efficient consideration of all matters of importance to the Trustees, the fund, and fund shareholders and to facilitate compliance with legal and regulatory requirements and oversight of the fund's activities and associated risks. The Board, acting through its committees, has charged SelectCo and its affiliates with (i) identifying events or circumstances the occurrence of which could have demonstrably adverse effects on the fund's business and/or reputation; (ii) implementing processes and controls to lessen the possibility that such events or circumstances occur or to mitigate the effects of such events or circumstances if they do occur; and (iii) creating and maintaining a system designed to evaluate continuously business and market conditions in order to facilitate the identification and implementation processes described in (i) and (ii) above. Because the day-to-day operations and activities of the fund are carried out by or through SelectCo, its affiliates, and other service providers, the fund's exposure to risks is mitigated but not eliminated by the processes overseen by the Trustees. While each of the Board's committees has responsibility for overseeing different aspects of the fund's activities, oversight is exercised primarily through the Operations and Audit Committees. Appropriate personnel, including but not limited to the fund's Chief Compliance Officer (CCO), SelectCo's internal auditor, the independent accountants, the fund's Treasurer and portfolio management personnel, make periodic reports to the Board's committees, as appropriate. The responsibilities of each standing committee, including their oversight responsibilities, are described further under "Standing Committees of the Trustees."
Interested Trustees*:
Correspondence intended for a Trustee who is an interested person may be sent to Fidelity Investments, 245 Summer Street, Boston, Massachusetts 02210.
Name, Year of Birth; Principal Occupations and Other Relevant Experience+
Brian B. Hogan (1964)
Year of Election or Appointment: 2014
Trustee
Chairman of the Board of Trustees
Mr. Hogan also serves as Trustee or Vice President of other funds. Mr. Hogan serves as a Director of FMR Investment Management (UK) Limited (investment adviser firm, 2015-present) and Fidelity SelectCo, LLC (investment adviser firm, 2014-present) and President of the Equity Division of FMR (investment adviser firm, 2009-present). Previously, Mr. Hogan served as Senior Vice President, Equity Research of FMR (2006-2009) and as a portfolio manager. Mr. Brian B. Hogan is not related to Mr. Colm A. Hogan.
* Determined to be an "Interested Trustee" by virtue of, among other things, his or her affiliation with the trust or various entities under common control with SelectCo.
+ The information includes the Trustee's principal occupation during the last five years and other information relating to the experience, attributes, and skills relevant to the Trustee's qualifications to serve as a Trustee, which led to the conclusion that the Trustee should serve as a Trustee for the fund.
Independent Trustees:
Correspondence intended for an Independent Trustee may be sent to Fidelity Investments, P.O. Box 55235, Boston, Massachusetts 02205-5235.
Name, Year of Birth; Principal Occupations and Other Relevant Experience+
David A. Rosow (1942)
Year of Election or Appointment: 2013
Trustee
Mr. Rosow also serves as Trustee of other Fidelity® funds. Prior to his retirement in 2006, Mr. Rosow was the Chief Executive Officer, owner and operator of a number of private companies, which encompassed the oil refining, drilling and marketing of petroleum products (including specialty petroleum products), recreation industry, and real estate development. Mr. Rosow currently serves as a Director of Oxbow Carbon LLC (upgraders, marketers, and distributors of petroleum byproducts of the oil refining process, 2015-present) and Oxbridge Academy of the Palm Beaches (2015-present) and serves as its President and CEO. Previously, Mr. Rosow served on the Fairfield Country Day School Board for 27 years, including as its President for 3 years, stepping down in 2006. Mr. Rosow served as Lead Director and Chairman of the Audit Committee of Hudson United Bancorp (1996-2006), Chairman of the Board of Westport Bank and Trust (1992-1996), and as a Director of TD Banknorth (2006-2007). In addition, Mr. Rosow served as a member (2008-2014) and President (2009-2014) of the Town Council of Palm Beach, Florida. Mr. Rosow also served as a Member of the Advisory Board of certain Fidelity® funds (2012-2013).
Garnett A. Smith (1947)
Year of Election or Appointment: 2013
Trustee
Mr. Smith also serves as Trustee of other Fidelity® funds. Prior to Mr. Smith's retirement, he served as Chairman and Chief Executive Officer of Inbrand Corp. (manufacturer of personal absorbent products, 1990-1997). He also served as President (1986-1990) of Inbrand Corp. Prior to his employment with Inbrand Corp., he was employed by a retail fabric chain and North Carolina National Bank. In addition, Mr. Smith served as a Member of the Advisory Board of certain Fidelity® funds (2012-2013) and as a board member of the Jackson Hole Land Trust (2009-2012).
Michael E. Wiley (1950)
Year of Election or Appointment: 2008
Trustee
Chairman of the Independent Trustees
Mr. Wiley also serves as Trustee of other Fidelity® funds. Mr. Wiley serves as a Director of Tesoro Corporation (independent oil refiner and marketer, 2005-present), a Director of Tesoro Logistics LP (natural resources logistics, 2015-present), and a Director of Bill Barrett Corporation (exploration and production, 2005-present). In addition, Mr. Wiley also serves as a Director of Post Oak Bank (privately-held bank, 2004-present). Previously, Mr. Wiley served as a Trustee of other Fidelity® funds (2008-2013), as a Director of Asia Pacific Exploration Consolidated (international oil and gas exploration and production, 2008-2013), as a member of the Board of Trustees of the University of Tulsa (2000-2006; 2007-2010), as a Senior Energy Advisor of Katzenbach Partners, LLC (consulting, 2006-2007), as an Advisory Director of Riverstone Holdings (private investment), Chairman, President, and CEO of Baker Hughes, Inc. (oilfield services, 2000-2004), and as Director of Spinnaker Exploration Company (exploration and production, 2001-2005).
+ The information includes the Trustee's principal occupation during the last five years and other information relating to the experience, attributes, and skills relevant to the Trustee's qualifications to serve as a Trustee, which led to the conclusion that the Trustee should serve as a Trustee for the fund.
Advisory Board Members and Officers:
Correspondence intended for a Member of the Advisory Board may be sent to Fidelity Investments, P.O. Box 55235, Boston, Massachusetts 02205-5235. Except for Anthony R. Rochte, correspondence intended for an officer may be sent to Fidelity Investments, 245 Summer Street, Boston, Massachusetts 02210. Correspondence intended for Mr. Rochte may be sent to SelectCo, 1225 17th Street, Denver, Colorado 80202-5541. Officers appear below in alphabetical order.
Name, Year of Birth; Principal Occupation
Donald F. Donahue (1950)
Year of Election or Appointment: 2015
Member of the Advisory Board
Mr. Donahue also serves as a Trustee or Member of the Advisory Board of other Fidelity® funds. Mr. Donahue is President and Chief Executive Officer of Miranda Partners, LLC (risk consulting for the financial services industry, 2012-present) and a consultant for the Institute for Defense Analyses (national security, 2012-present). Previously, Mr. Donahue served as Chief Executive Officer (2006-2012), Chief Operating Officer (2003-2006), and Managing Director, Customer Marketing and Development (1999-2003) of The Depository Trust & Clearing Corporation (financial markets infrastructure). Mr. Donahue serves as a Member (2012-present) and Co-Chairman (2016-present) of the Board of Directors of United Way of New York, Member of the Board of Directors of NYC Leadership Academy (2012-present) and Member of the Board of Advisors of Ripple Labs, Inc. (financial services, 2015-present). He also served as Chairman (2010-2012) and Member of the Board of Directors (2012-2013) of Omgeo, LLC (financial services), Treasurer of United Way of New York (2012-2016), and Member of the Board of Directors of XBRL US (financial services non-profit, 2009-2012) and the International Securities Services Association (2009-2012).
Carol B. Tomé (1957)
Year of Election or Appointment: 2017
Member of the Advisory Board
Ms. Tomé also serves as Trustee or Member of the Advisory Board of other Fidelity® funds. Ms. Tomé is Chief Financial Officer (2001-present) and Executive Vice President of Corporate Services (2007-present) of The Home Depot, Inc. (home improvement retailer) and a Director (2003-present) and Chair of the Audit Committee (2004-present) of United Parcel Service, Inc. (package delivery and supply chain management). Previously, Ms. Tomé served as Senior Vice President of Finance and Accounting/Treasurer (2000-2007) and Vice President and Treasurer (1995-2000) of The Home Depot, Inc. and Chair of the Board (2010-2012), Vice Chair of the Board (2009 and 2013), and a Director (2008-2013) of the Federal Reserve Bank of Atlanta. Ms. Tomé is also a director or trustee of many community and professional organizations.
Marc R. Bryant (1966)
Year of Election or Appointment: 2013
Secretary and Chief Legal Officer (CLO)
Mr. Bryant also serves as Secretary and CLO of other funds. Mr. Bryant serves as CLO, Secretary, and Senior Vice President of Fidelity Management & Research Company (investment adviser firm, 2015-present) and FMR Co., Inc. (investment adviser firm, 2015-present); Secretary of Fidelity SelectCo, LLC (investment adviser firm, 2015-present) and Fidelity Investments Money Management, Inc. (investment adviser firm, 2015-present); and CLO of Fidelity Management & Research (Hong Kong) Limited and FMR Investment Management (UK) Limited (investment adviser firms, 2015-present) and Fidelity Management & Research (Japan) Limited (investment adviser firm, 2016-present). He is Senior Vice President and Deputy General Counsel of FMR LLC (diversified financial services company). Previously, Mr. Bryant served as Secretary and CLO of Fidelity Rutland Square Trust II (2010-2014) and Assistant Secretary of Fidelity's Fixed Income and Asset Allocation Funds (2013-2015). Prior to joining Fidelity Investments, Mr. Bryant served as a Senior Vice President and the Head of Global Retail Legal for AllianceBernstein L.P. (2006-2010), and as the General Counsel for ProFund Advisors LLC (2001-2006).
Jeffrey S. Christian (1961)
Year of Election or Appointment: 2016
Assistant Treasurer
Mr. Christian also serves as Assistant Treasurer of other funds. Mr. Christian is an employee of Fidelity Investments (2003-present).
William C. Coffey (1969)
Year of Election or Appointment: 2009
Assistant Secretary
Mr. Coffey also serves as Assistant Secretary of other funds. He is Senior Vice President and Deputy General Counsel of FMR LLC (diversified financial services company, 2010-present), and is an employee of Fidelity Investments. Previously, Mr. Coffey served as Vice President and Associate General Counsel of FMR LLC (2005-2009).
Jonathan Davis (1968)
Year of Election or Appointment: 2010
Assistant Treasurer
Mr. Davis also serves as Assistant Treasurer of other funds, and is an employee of Fidelity Investments. Previously, Mr. Davis served as Vice President and Associate General Counsel of FMR LLC (diversified financial services company, 2003-2010).
Adrien E. Deberghes (1967)
Year of Election or Appointment: 2013
President and Treasurer
Mr. Deberghes also serves as an officer of other funds. He serves as Executive Vice President of Fidelity Investments Money Management, Inc. (FIMM) (investment adviser firm, 2016-present) and is an employee of Fidelity Investments (2008-present). Prior to joining Fidelity Investments, Mr. Deberghes was Senior Vice President of Mutual Fund Administration at State Street Corporation (2007-2008), Senior Director of Mutual Fund Administration at Investors Bank & Trust (2005-2007), and Director of Finance for Dunkin' Brands (2000-2005). Previously, Mr. Deberghes served in other fund officer roles.
Joseph DeSantis (1959)
Year of Election or Appointment: 2015
Vice President
Mr. DeSantis also serves as Vice President of other funds. Mr. DeSantis serves as a Director of Fidelity Management & Research (Japan) Limited (investment adviser firm, 2016-present), Chief Investment Officer, Equities (2010-present) and is an employee of Fidelity Investments.
Stephanie J. Dorsey (1969)
Year of Election or Appointment: 2010
Assistant Treasurer
Ms. Dorsey also serves as an officer of other funds. She is an employee of Fidelity Investments (2008-present) and has served in other fund officer roles. Prior to joining Fidelity Investments, Ms. Dorsey served as Treasurer (2004-2008) of the JPMorgan Mutual Funds and Vice President (2004-2008) of JPMorgan Chase Bank.
Howard J. Galligan III (1966)
Year of Election or Appointment: 2014
Chief Financial Officer
Mr. Galligan also serves as Chief Financial Officer of other funds. Mr. Galligan serves as President of Fidelity Pricing and Cash Management Services (FPCMS) (2014-present) and as a Director of Strategic Advisers, Inc. (investment adviser firm, 2008-present). Previously, Mr. Galligan served as Chief Administrative Officer of Asset Management (2011-2014) and Chief Operating Officer and Senior Vice President of Investment Support for Strategic Advisers, Inc. (2003-2011).
Scott C. Goebel (1968)
Year of Election or Appointment: 2015
Vice President
Mr. Goebel serves as Vice President of other funds and is an employee of Fidelity Investments (2001-present). Previously, Mr. Goebel served as Senior Vice President of Fidelity Management & Research Company (FMR) (investment adviser firm, 2016), Secretary of Fidelity SelectCo, LLC (investment adviser firm, 2013-2015), Fidelity Investments Money Management, Inc. (FIMM) (investment adviser firm, 2010-2015), and Fidelity Research and Analysis Company (FRAC) (investment adviser firm, 2010-2015); General Counsel, Secretary, and Senior Vice President of FMR (investment adviser firm, 2008-2015) and FMR Co., Inc. (investment adviser firm, 2008-2015); Assistant Secretary of Fidelity Management & Research (Japan) Limited (investment adviser firm, 2008-2015) and Fidelity Management & Research (U.K.) Inc. (investment adviser firm, 2008-2015); Chief Legal Officer (CLO) of Fidelity Management & Research (Hong Kong) Limited (investment adviser firm, 2008-2015); Secretary and CLO of certain Fidelity® funds (2008-2015); Assistant Secretary of FIMM (2008-2010), FRAC (2008-2010), and certain funds (2007-2008); and as Vice President and Secretary of Fidelity Distributors Corporation (FDC) (2005-2007).
James D. Gryglewicz (1972)
Year of Election or Appointment: 2014
Chief Compliance Officer
Mr. Gryglewicz also serves as Chief Compliance Officer of other funds. Mr. Gryglewicz serves as Compliance Officer of Strategic Advisers, Inc. (investment adviser firm, 2015-present) and Fidelity SelectCo, LLC (investment adviser firm, 2014-present), Senior Vice President of Asset Management Compliance (2009-present), and is an employee of Fidelity Investments (2004-present).
Brian B. Hogan (1964)
Year of Election or Appointment: 2009
Vice President
Mr. Hogan also serves as Trustee or Vice President of other funds. Mr. Hogan serves as a Director of FMR Investment Management (UK) Limited (investment adviser firm, 2015-present) and Fidelity SelectCo, LLC (investment adviser firm, 2014-present) and President of the Equity Division of FMR (investment adviser firm, 2009-present). Previously, Mr. Hogan served as Senior Vice President, Equity Research of FMR (2006-2009) and as a portfolio manager. Mr. Brian B. Hogan is not related to Mr. Colm A. Hogan.
Colm A. Hogan (1973)
Year of Election or Appointment: 2016
Assistant Treasurer
Mr. Hogan also serves as an officer of other funds. Mr. Hogan is an employee of Fidelity Investments (2005-present). Mr. Colm A. Hogan is not related to Mr. Brian B. Hogan.
Chris Maher (1972)
Year of Election or Appointment: 2013
Assistant Treasurer
Mr. Maher serves as Assistant Treasurer of other funds. Mr. Maher is Vice President of Valuation Oversight and is an employee of Fidelity Investments. Previously, Mr. Maher served as Vice President of Asset Management Compliance (2013), Vice President of the Program Management Group of FMR (investment adviser firm, 2010-2013), and Vice President of Valuation Oversight (2008-2010).
John F. Papandrea (1972)
Year of Election or Appointment: 2016
Anti-Money Laundering (AML) Officer
Mr. Papandrea also serves as AML Officer of other funds. Mr. Papandrea is Vice President of FMR LLC (diversified financial services company, 2008-present) and is an employee of Fidelity Investments (2005-present).
Anthony R. Rochte (1968)
Year of Election or Appointment: 2013
Vice President
Mr. Rochte also serves as Vice President of other funds. Mr. Rochte serves as President of Fidelity SelectCo, LLC (investment adviser firm, 2012-present) and is an employee of Fidelity Investments (2012-present). Prior to joining Fidelity Investments, Mr. Rochte served as Senior Managing Director and head of State Street Global Advisors' North American Intermediary Business Group (2006-2012).
Stacie M. Smith (1974)
Year of Election or Appointment: 2013
Assistant Treasurer
Ms. Smith also serves as an officer of other funds. She is an employee of Fidelity Investments (2009-present) and has served in other fund officer roles. Prior to joining Fidelity Investments, Ms. Smith served as Senior Audit Manager of Ernst & Young LLP (accounting firm, 1996-2009). Previously, Ms. Smith served as Deputy Treasurer of certain Fidelity® funds (2013-2016).
Marc L. Spector (1972)
Year of Election or Appointment: 2017
Assistant Treasurer
Mr. Spector also serves as an officer of other funds. Mr. Spector is an employee of Fidelity Investments (2016-present). Prior to joining Fidelity Investments, Mr. Spector served as Director at the Siegfried Group (accounting firm, 2013-2016), and prior to Siegfried Group as audit senior manager at Deloitte & Touche (accounting firm, 2005-2013).
Renee Stagnone (1975)
Year of Election or Appointment: 2016
Assistant Treasurer
Ms. Stagnone also serves as an officer of other funds. Ms. Stagnone is an employee of Fidelity Investments (1997-present). Previously, Ms. Stagnone served as Deputy Treasurer of certain Fidelity® funds (2013-2016).
Shareholder Expense Example
As a shareholder of the Fund, you incur two types of costs: (1) transaction costs, including redemption fees and (2) ongoing costs, including management fees and other Fund expenses. This Example is intended to help you understand your ongoing costs (in dollars) of investing in the Fund and to compare these costs with the ongoing costs of investing in other mutual funds.
The Example is based on an investment of $1,000 invested at the beginning of the period and held for the entire period (July 1, 2016 to December 31, 2016).
Actual Expenses
The first line of the accompanying table for each class of the Fund provides information about actual account values and actual expenses. You may use the information in this line, together with the amount you invested, to estimate the expenses that you paid over the period. Simply divide your account value by $1,000.00 (for example, an $8,600 account value divided by $1,000.00 = 8.6), then multiply the result by the number in the first line for a class of the Fund under the heading entitled "Expenses Paid During Period" to estimate the expenses you paid on your account during this period. The estimate of expenses does not include any fees or other expenses of any variable annuity or variable life insurance product. If they were, the estimate of expenses you paid during the period would be higher, and your ending account value would be lower. In addition, the Fund, as a shareholder in the underlying Fidelity Central Funds, will indirectly bear its pro-rata share of the fees and expenses incurred by the underlying Fidelity Central Funds. These fees and expenses are not included in the Fund's annualized expense ratio used to calculate the expense estimate in the table below.
Hypothetical Example for Comparison Purposes
The second line of the accompanying table for each class of the Fund provides information about hypothetical account values and hypothetical expenses based on a Class' actual expense ratio and an assumed rate of return of 5% per year before expenses, which is not the Class' actual return. The hypothetical account values and expenses may not be used to estimate the actual ending account balance or expenses you paid for the period. You may use this information to compare the ongoing costs of investing in the Fund and other funds. To do so, compare this 5% hypothetical example with the 5% hypothetical examples that appear in the shareholder reports of the other funds. The estimate of expenses does not include any fees or other expenses of any variable annuity or variable life insurance product. If they were, the estimate of expenses you paid during the period would be higher, and your ending account value would be lower. In addition, the Fund, as a shareholder in the underlying Fidelity Central Funds, will indirectly bear its pro-rata share of the fees and expenses incurred by the underlying Fidelity Central Funds. These fees and expenses are not included in the Fund's annualized expense ratio used to calculate the expense estimate in the table below.
Please note that the expenses shown in the table are meant to highlight your ongoing costs only and do not reflect any transaction costs. Therefore, the second line of the table is useful in comparing ongoing costs only, and will not help you determine the relative total costs of owning different funds. In addition, if these transactional costs were included, your costs would have been higher.
| | Annualized Expense Ratio-A | Beginning
Account Value
July 1, 2016 | Ending
Account Value
December 31, 2016 | Expenses Paid
During Period-B
July 1, 2016
to December 31, 2016 |
| Initial Class | .69% | | | |
| Actual | | $1,000.00 | $1,140.90 | $3.71 |
| Hypothetical-C | | $1,000.00 | $1,021.67 | $3.51 |
| Investor Class | .78% | | | |
| Actual | | $1,000.00 | $1,140.90 | $4.20 |
| Hypothetical-C | | $1,000.00 | $1,021.22 | $3.96 |
A Annualized expense ratio reflects expenses net of applicable fee waivers.
B Expenses are equal to each Class' annualized expense ratio, multiplied by the average account value over the period, multiplied by 184/366 (to reflect the one-half year period).
C 5% return per year before expenses
Distributions (Unaudited)
The Board of Trustees of VIP Technology Portfolio voted to pay to shareholders of record at the opening of business on record date, the following distributions per share derived from capital gains realized from sales of portfolio securities, and dividends derived from net investment income:
| | Pay Date | Record Date | Dividends | Capital Gains |
| VIP Technology Portfolio | | | | |
| Initial Class | 02/10/17 | 02/10/17 | $0.003 | $0.159 |
| Investor Class | 02/10/17 | 02/10/17 | $0.002 | $0.159 |
|
The fund hereby designates as a capital gain dividend with respect to the taxable year ended December 31, 2016, $4,333,391, or, if subsequently determined to be different, the net capital gain of such year.
Initial Class and Investor Class designate 100% of the dividends distributed in December 2016, as qualifying for the dividends–received deduction for corporate shareholders.
VTECIC-ANN-0217
1.817385.111
Fidelity® Variable Insurance Products: Financial Services Portfolio
Annual Report December 31, 2016 |
|
Contents
To view a fund's proxy voting guidelines and proxy voting record for the 12-month period ended June 30, visit http://www.fidelity.com/proxyvotingresults or visit the Securities and Exchange Commission's (SEC) web site at http://www.sec.gov.
You may also call 1-877-208-0098 to request a free copy of the proxy voting guidelines.
Fidelity® Variable Insurance Products are separate account options which are purchased through a variable insurance contract.
Standard & Poor's, S&P and S&P 500 are registered service marks of The McGraw-Hill Companies, Inc. and have been licensed for use by Fidelity Distributors Corporation.
Other third-party marks appearing herein are the property of their respective owners.
All other marks appearing herein are registered or unregistered trademarks or service marks of FMR LLC or an affiliated company. © 2017 FMR LLC. All rights reserved.
This report and the financial statements contained herein are submitted for the general information of the shareholders of the Fund. This report is not authorized for distribution to prospective investors in the Fund unless preceded or accompanied by an effective prospectus.
A fund files its complete schedule of portfolio holdings with the SEC for the first and third quarters of each fiscal year on Form N-Q. Forms N-Q are available on the SEC’s web site at http://www.sec.gov. A fund's Forms N-Q may be reviewed and copied at the SEC’s Public Reference Room in Washington, DC. Information regarding the operation of the SEC's Public Reference Room may be obtained by calling 1-800-SEC-0330.
For a complete list of a fund's portfolio holdings, view the most recent holdings listing, semiannual report, or annual report on Fidelity's web site at http://www.fidelity.com, http://www.institutional.fidelity.com, or http://www.401k.com, as applicable.
NOT FDIC INSURED •MAY LOSE VALUE •NO BANK GUARANTEE
Neither the Fund nor Fidelity Distributors Corporation is a bank.
Performance: The Bottom Line
Average annual total return reflects the change in the value of an investment, assuming reinvestment of distributions from dividend income and capital gains (the profits earned upon the sale of securities that have grown in value, if any) and assuming a constant rate of performance each year. During periods of reimbursement by Fidelity, a fund’s total return will be greater than it would be had the reimbursement not occurred. Performance numbers are net of all underlying fund operating expenses, but do not include any insurance charges imposed by your insurance company’s separate account. If performance information included the effect of these additional charges, the total returns would have been lower. How a fund did yesterday is no guarantee of how it will do tomorrow.
Average Annual Total Returns
| For the periods ended December 31, 2016 | Past 1 year | Past 5 years | Past 10 years |
| Initial Class | 18.72% | 16.88% | 0.24% |
| Investor Class | 18.51% | 16.76% | 0.14% |
$10,000 Over 10 Years
Let's say hypothetically that $10,000 was invested in VIP Financial Services Portfolio - Initial Class on December 31, 2006.
The chart shows how the value of your investment would have changed, and also shows how the S&P 500® Index performed over the same period.

| Period Ending Values |
| $10,240 | VIP Financial Services Portfolio - Initial Class |
| $19,572 | S&P 500® Index |
Management's Discussion of Fund Performance
Market Recap: The S&P 500 index returned 11.96% in 2016, rising sharply on post-election optimism for economic growth. The year began during a fairly volatile stretch, with stocks hampered by persistent oil-price weakness and U.S.-dollar strength. Markets regained momentum in February amid U.S. job gains, a rally in energy and other stimuli that helped keep the roughly seven-year uptrend intact. Markets tumbled briefly following the U.K.’s June 23 vote to exit the European Union – dubbed “Brexit” – then recovered quickly and settled into a flattish stretch until the November 8 U.S. presidential election. Stocks reacted to the outcome by reaching a series of all-time highs. For the year, energy (+27%) led the way amid two strong rallies in commodity prices, one in the spring and another in November. Telecommunication services (+23%) was close behind, as demand for dividend-paying equities was high early in the period. Cyclical sectors, including financials (+22%), industrials (+18%) and materials (+17%), also posted strong gains. Conversely, consumer staples (+5%) and consumer discretionary (+6%) lagged the index, the latter hurt as online competition continued to pressure brick-and-mortar retailers. Real estate (+3%) struggled due to expectations for rising interest rates, while health care (-2%) was hampered by an uncertain political and regulatory outlook.
Comments from Portfolio Manager Christopher Lee: For the year, the fund’s share classes returned roughly 19%, underperforming the 24.74% return of the benchmark MSCI U.S. IMI Financials 5% Capped Linked Index but leading the broad-based S&P 500. Versus the MSCI index, security selection in real estate segments – which were removed from the sector benchmark in September – as well as in the non-benchmark data processing & outsourced services group hindered performance. Individual detractors in the latter area included credit card processing and services company Visa, which lagged as investors shifted toward more U.S.-focused, interest-rate sensitive financials after the U.S. presidential election. Elsewhere, mortgage-title insurer Fidelity National Financial and real estate services company Realogy Holdings detracted amid concern that higher interest rates would slow demand for mortgages and home purchases. Several segments – including financial exchanges & data and insurance brokers – modestly aided relative results. Top individual contributors included Ventas, a health care REIT (real estate investment trust) that benefited from its stable cash flows during a volatile first half of the year. Ventas was not held at period end. A sizable underweighting in diversified bank and large benchmark component Wells Fargo also contributed, as a sales scandal this fall rocked the stock.
The views expressed above reflect those of the portfolio manager(s) only through the end of the period as stated on the cover of this report and do not necessarily represent the views of Fidelity or any other person in the Fidelity organization. Any such views are subject to change at any time based upon market or other conditions and Fidelity disclaims any responsibility to update such views. These views may not be relied on as investment advice and, because investment decisions for a Fidelity fund are based on numerous factors, may not be relied on as an indication of trading intent on behalf of any Fidelity fund.
Note to shareholders: On September 1, 2016, real estate became recognized as a standalone sector under the S&P and MSCI Global Industry Classification Standard, the basis for many equity-market indices. With this change, the structure of the fund’s supplemental sector benchmark was modified to exclude real estate as an industry group, with the exception of mortgage-related REITs. Additionally on September 1, 2016, the fund’s sector benchmark changed to the MSCI U.S. IMI Financials 5% Capped Index. This capped index precludes any single issuer from representing more than 5% of the index at the time of quarterly rebalance.
Investment Summary (Unaudited)
Top Ten Stocks as of December 31, 2016
| | % of fund's net assets | % of fund's net assets 6 months ago |
| Berkshire Hathaway, Inc. Class B | 5.9 | 5.8 |
| Capital One Financial Corp. | 5.0 | 2.6 |
| Wells Fargo & Co. | 5.0 | 3.7 |
| Bank of America Corp. | 5.0 | 3.6 |
| Goldman Sachs Group, Inc. | 5.0 | 1.9 |
| Citigroup, Inc. | 4.9 | 3.9 |
| American International Group, Inc. | 4.0 | 0.0 |
| U.S. Bancorp | 3.6 | 3.5 |
| JPMorgan Chase & Co. | 3.5 | 3.3 |
| Huntington Bancshares, Inc. | 3.2 | 1.0 |
| | 45.1 | |
Top Industries (% of fund's net assets)
| As of December 31, 2016 |
| | Banks | 37.7% |
| | Insurance | 22.1% |
| | Capital Markets | 17.3% |
| | Consumer Finance | 10.4% |
| | Diversified Financial Services | 6.4% |
| | All Others* | 6.1% |

* Includes short-term investments and net other assets (liabilities).
| As of June 30, 2016 |
| | Banks | 23.9% |
| | Real Estate Investment Trusts | 22.9% |
| | Insurance | 19.1% |
| | Diversified Financial Services | 9.5% |
| | Capital Markets | 6.3% |
| | All Others* | 18.3% |

Prior period industry classifications reflect the categories in place as of the date indicated and have not been adjusted to reflect current industry classifications.
* Includes short-term investments and net other assets (liabilities).
Percentages shown as 0.0% may reflect amounts less than 0.05%.
Investments December 31, 2016
Showing Percentage of Net Assets
| Common Stocks - 97.5% | | | |
| | | Shares | Value |
| Banks - 37.7% | | | |
| Diversified Banks - 22.8% | | | |
| Bank of America Corp. | | 386,266 | $8,536,479 |
| Citigroup, Inc. | | 140,639 | 8,358,176 |
| Comerica, Inc. | | 14,829 | 1,010,003 |
| JPMorgan Chase & Co. | | 69,454 | 5,993,186 |
| The Bank of NT Butterfield & Son Ltd. | | 13,400 | 421,296 |
| U.S. Bancorp | | 121,573 | 6,245,205 |
| Wells Fargo & Co. | | 155,196 | 8,552,852 |
| | | | 39,117,197 |
| Regional Banks - 14.9% | | | |
| Bank of the Ozarks, Inc. | | 34,100 | 1,793,319 |
| CIT Group, Inc. | | 52,100 | 2,223,628 |
| CoBiz, Inc. | | 51,956 | 877,537 |
| First Republic Bank | | 32,100 | 2,957,694 |
| Huntington Bancshares, Inc. | | 416,700 | 5,508,774 |
| M&T Bank Corp. | | 19,380 | 3,031,613 |
| PNC Financial Services Group, Inc. | | 44,400 | 5,193,024 |
| Popular, Inc. | | 40,200 | 1,761,564 |
| Preferred Bank, Los Angeles | | 7,000 | 366,940 |
| SVB Financial Group (a) | | 10,500 | 1,802,430 |
| | | | 25,516,523 |
|
| TOTAL BANKS | | | 64,633,720 |
|
| Capital Markets - 17.3% | | | |
| Asset Management & Custody Banks - 5.9% | | | |
| Affiliated Managers Group, Inc. (a) | | 13,684 | 1,988,285 |
| BlackRock, Inc. Class A | | 11,600 | 4,414,264 |
| Northern Trust Corp. | | 26,050 | 2,319,753 |
| Oaktree Capital Group LLC Class A | | 34,100 | 1,278,750 |
| | | | 10,001,052 |
| Financial Exchanges & Data - 4.1% | | | |
| CBOE Holdings, Inc. | | 29,100 | 2,150,199 |
| IntercontinentalExchange, Inc. | | 86,780 | 4,896,128 |
| | | | 7,046,327 |
| Investment Banking & Brokerage - 7.3% | | | |
| E*TRADE Financial Corp. (a) | | 91,100 | 3,156,615 |
| Goldman Sachs Group, Inc. | | 35,610 | 8,526,815 |
| Investment Technology Group, Inc. | | 42,646 | 841,832 |
| | | | 12,525,262 |
|
| TOTAL CAPITAL MARKETS | | | 29,572,641 |
|
| Consumer Finance - 10.4% | | | |
| Consumer Finance - 10.4% | | | |
| Capital One Financial Corp. | | 98,053 | 8,554,144 |
| Discover Financial Services | | 65,100 | 4,693,059 |
| Synchrony Financial | | 125,900 | 4,566,393 |
| | | | 17,813,596 |
| Diversified Financial Services - 6.4% | | | |
| Multi-Sector Holdings - 5.9% | | | |
| Berkshire Hathaway, Inc. Class B (a) | | 62,533 | 10,191,627 |
| Specialized Finance - 0.5% | | | |
| Bats Global Markets, Inc. | | 25,100 | 841,101 |
|
| TOTAL DIVERSIFIED FINANCIAL SERVICES | | | 11,032,728 |
|
| Insurance - 22.1% | | | |
| Insurance Brokers - 2.6% | | | |
| Brown & Brown, Inc. | | 40,300 | 1,807,858 |
| Willis Group Holdings PLC | | 21,700 | 2,653,476 |
| | | | 4,461,334 |
| Life & Health Insurance - 2.0% | | | |
| Torchmark Corp. | | 47,190 | 3,480,734 |
| Multi-Line Insurance - 5.3% | | | |
| American Financial Group, Inc. | | 25,600 | 2,255,872 |
| American International Group, Inc. | | 104,200 | 6,805,302 |
| | | | 9,061,174 |
| Property & Casualty Insurance - 11.1% | | | |
| Allied World Assurance Co. Holdings AG | | 34,300 | 1,842,253 |
| Allstate Corp. | | 47,770 | 3,540,712 |
| AmTrust Financial Services, Inc. | | 39,100 | 1,070,558 |
| Chubb Ltd. | | 36,456 | 4,816,567 |
| FNF Group | | 96,770 | 3,286,309 |
| The Travelers Companies, Inc. | | 36,412 | 4,457,557 |
| | | | 19,013,956 |
| Reinsurance - 1.1% | | | |
| Reinsurance Group of America, Inc. | | 15,300 | 1,925,199 |
|
| TOTAL INSURANCE | | | 37,942,397 |
|
| IT Services - 2.7% | | | |
| Data Processing & Outsourced Services - 2.7% | | | |
| Visa, Inc. Class A | | 43,440 | 3,389,189 |
| WEX, Inc. (a) | | 10,500 | 1,171,800 |
| | | | 4,560,989 |
| Mortgage Real Estate Investment Trusts - 0.4% | | | |
| Mortgage REITs - 0.4% | | | |
| American Capital Mortgage Investment Corp. | | 41,500 | 651,550 |
| Thrifts & Mortgage Finance - 0.5% | | | |
| Thrifts & Mortgage Finance - 0.5% | | | |
| MGIC Investment Corp. (a) | | 44,500 | 453,455 |
| Radian Group, Inc. | | 23,300 | 418,934 |
| Washington Mutual, Inc. (a) | | 5,300 | 0 |
| | | | 872,389 |
| TOTAL COMMON STOCKS | | | |
| (Cost $140,663,577) | | | 167,080,010 |
|
| Money Market Funds - 4.2% | | | |
| Fidelity Cash Central Fund, 0.60% (b) | | | |
| (Cost $7,157,950) | | 7,156,690 | 7,158,121 |
| TOTAL INVESTMENT PORTFOLIO - 101.7% | | | |
| (Cost $147,821,527) | | | 174,238,131 |
| NET OTHER ASSETS (LIABILITIES) - (1.7)% | | | (2,922,204) |
| NET ASSETS - 100% | | | $171,315,927 |
Legend
(a) Non-income producing
(b) Affiliated fund that is generally available only to investment companies and other accounts managed by Fidelity Investments. The rate quoted is the annualized seven-day yield of the fund at period end. A complete unaudited listing of the fund's holdings as of its most recent quarter end is available upon request. In addition, each Fidelity Central Fund's financial statements, which are not covered by the Fund's Report of Independent Registered Public Accounting Firm, are available on the SEC's website or upon request.
Affiliated Central Funds
Information regarding fiscal year to date income earned by the Fund from investments in Fidelity Central Funds is as follows:
| Fund | Income earned |
| Fidelity Cash Central Fund | $19,029 |
| Fidelity Securities Lending Cash Central Fund | 1,512 |
| Total | $20,541 |
Investment Valuation
All investments are categorized as Level 1 under the Fair Value Hierarchy. The inputs or methodology used for valuing securities may not be an indication of the risk associated with investing in those securities. For more information on valuation inputs please refer to the Investment Valuation section in the accompanying Notes to Financial Statements.
See accompanying notes which are an integral part of the financial statements.
Financial Statements
Statement of Assets and Liabilities
| | | December 31, 2016 |
| Assets | | |
Investment in securities, at value — See accompanying schedule:
Unaffiliated issuers (cost $140,663,577) | $167,080,010 | |
| Fidelity Central Funds (cost $7,157,950) | 7,158,121 | |
| Total Investments (cost $147,821,527) | | $174,238,131 |
| Receivable for fund shares sold | | 140,341 |
| Dividends receivable | | 144,112 |
| Distributions receivable from Fidelity Central Funds | | 3,905 |
| Prepaid expenses | | 469 |
| Other receivables | | 567 |
| Total assets | | 174,527,525 |
| Liabilities | | |
| Payable for investments purchased | $3,052,264 | |
| Payable for fund shares redeemed | 19,719 | |
| Accrued management fee | 71,863 | |
| Other affiliated payables | 22,068 | |
| Other payables and accrued expenses | 45,684 | |
| Total liabilities | | 3,211,598 |
| Net Assets | | $171,315,927 |
| Net Assets consist of: | | |
| Paid in capital | | $145,717,740 |
| Undistributed net investment income | | 231,292 |
| Accumulated undistributed net realized gain (loss) on investments and foreign currency transactions | | (1,049,569) |
| Net unrealized appreciation (depreciation) on investments and assets and liabilities in foreign currencies | | 26,416,464 |
| Net Assets | | $171,315,927 |
| Initial Class: | | |
| Net Asset Value, offering price and redemption price per share ($41,403,874 ÷ 3,601,092 shares) | | $11.50 |
| Investor Class: | | |
| Net Asset Value, offering price and redemption price per share ($129,912,053 ÷ 11,345,179 shares) | | $11.45 |
See accompanying notes which are an integral part of the financial statements.
Statement of Operations
| | | Year ended December 31, 2016 |
| Investment Income | | |
| Dividends | | $1,890,897 |
| Income from Fidelity Central Funds | | 20,541 |
| Total income | | 1,911,438 |
| Expenses | | |
| Management fee | $553,854 | |
| Transfer agent fees | 132,974 | |
| Accounting and security lending fees | 39,381 | |
| Custodian fees and expenses | 18,225 | |
| Independent trustees' fees and expenses | 2,078 | |
| Audit | 42,356 | |
| Legal | 3,142 | |
| Miscellaneous | 1,272 | |
| Total expenses before reductions | 793,282 | |
| Expense reductions | (5,945) | 787,337 |
| Net investment income (loss) | | 1,124,101 |
| Realized and Unrealized Gain (Loss) | | |
| Net realized gain (loss) on: | | |
| Investment securities: | | |
| Unaffiliated issuers | 1,133,467 | |
| Fidelity Central Funds | 21 | |
| Foreign currency transactions | 6 | |
| Total net realized gain (loss) | | 1,133,494 |
Change in net unrealized appreciation (depreciation) on:
Investment securities | 15,393,586 | |
| Assets and liabilities in foreign currencies | 24 | |
| Total change in net unrealized appreciation (depreciation) | | 15,393,610 |
| Net gain (loss) | | 16,527,104 |
| Net increase (decrease) in net assets resulting from operations | | $17,651,205 |
See accompanying notes which are an integral part of the financial statements.
Statement of Changes in Net Assets
| | Year ended December 31, 2016 | Year ended December 31, 2015 |
| Increase (Decrease) in Net Assets | | |
| Operations | | |
| Net investment income (loss) | $1,124,101 | $998,694 |
| Net realized gain (loss) | 1,133,494 | 1,794,403 |
| Change in net unrealized appreciation (depreciation) | 15,393,610 | (7,264,177) |
| Net increase (decrease) in net assets resulting from operations | 17,651,205 | (4,471,080) |
| Distributions to shareholders from net investment income | (866,490) | (1,186,136) |
| Share transactions - net increase (decrease) | 42,992,223 | 9,996,696 |
| Redemption fees | 18,785 | 12,528 |
| Total increase (decrease) in net assets | 59,795,723 | 4,352,008 |
| Net Assets | | |
| Beginning of period | 111,520,204 | 107,168,196 |
| End of period | $171,315,927 | $111,520,204 |
| Other Information | | |
| Undistributed net investment income end of period | $231,292 | $– |
See accompanying notes which are an integral part of the financial statements.
Financial Highlights — VIP Financial Services Portfolio Initial Class
| Years ended December 31, | 2016 | 2015 | 2014 | 2013 | 2012 |
| Selected Per–Share Data | | | | | |
| Net asset value, beginning of period | $9.74 | $10.23 | $9.33 | $7.05 | $5.55 |
| Income from Investment Operations | | | | | |
| Net investment income (loss)A | .12 | .10 | .12 | .11 | .11 |
| Net realized and unrealized gain (loss) | 1.70 | (.48) | .90 | 2.27 | 1.47 |
| Total from investment operations | 1.82 | (.38) | 1.02 | 2.38 | 1.58 |
| Distributions from net investment income | (.06) | (.11) | (.12) | (.10) | (.08) |
| Redemption fees added to paid in capitalA,B | – | – | – | – | – |
| Net asset value, end of period | $11.50 | $9.74 | $10.23 | $9.33 | $7.05 |
| Total ReturnC,D | 18.72% | (3.69)% | 10.88% | 33.86% | 28.55% |
| Ratios to Average Net AssetsE,F | | | | | |
| Expenses before reductions | .72% | .71% | .73% | .81% | .85% |
| Expenses net of fee waivers, if any | .72% | .71% | .72% | .81% | .85% |
| Expenses net of all reductions | .71% | .71% | .72% | .79% | .75% |
| Net investment income (loss) | 1.18% | 1.02% | 1.21% | 1.29% | 1.66% |
| Supplemental Data | | | | | |
| Net assets, end of period (000 omitted) | $41,404 | $20,570 | $23,351 | $27,726 | $17,438 |
| Portfolio turnover rateG | 87% | 59% | 58% | 211% | 323% |
A Calculated based on average shares outstanding during the period.
B Amount represents less than $.005 per share.
C Total returns do not reflect charges attributable to your insurance company's separate account. Inclusion of these charges would reduce the total returns shown.
D Total returns would have been lower if certain expenses had not been reduced during the applicable periods shown.
E Fees and expenses of any underlying Fidelity Central Funds are not included in the Fund's expense ratio. The Fund indirectly bears its proportionate share of the expenses of any underlying Fidelity Central Funds.
F Expense ratios reflect operating expenses of the class. Expenses before reductions do not reflect amounts reimbursed by the investment adviser or reductions from brokerage service arrangements or reductions from other expense offset arrangements and do not represent the amount paid by the class during periods when reimbursements or reductions occur. Expenses net of fee waivers reflect expenses after reimbursement by the investment adviser but prior to reductions from brokerage service arrangements or other expense offset arrangements. Expenses net of all reductions represent the net expenses paid by the class.
G Amount does not include the portfolio activity of any underlying Fidelity Central Funds.
See accompanying notes which are an integral part of the financial statements.
Financial Highlights — VIP Financial Services Portfolio Investor Class
| Years ended December 31, | 2016 | 2015 | 2014 | 2013 | 2012 |
| Selected Per–Share Data | | | | | |
| Net asset value, beginning of period | $9.71 | $10.19 | $9.30 | $7.03 | $5.54 |
| Income from Investment Operations | | | | | |
| Net investment income (loss)A | .11 | .09 | .11 | .10 | .10 |
| Net realized and unrealized gain (loss) | 1.69 | (.47) | .89 | 2.27 | 1.47 |
| Total from investment operations | 1.80 | (.38) | 1.00 | 2.37 | 1.57 |
| Distributions from net investment income | (.06) | (.10) | (.11) | (.10) | (.08) |
| Redemption fees added to paid in capitalA,B | – | – | – | – | – |
| Net asset value, end of period | $11.45 | $9.71 | $10.19 | $9.30 | $7.03 |
| Total ReturnC,D | 18.51% | (3.68)% | 10.75% | 33.74% | 28.36% |
| Ratios to Average Net AssetsE,F | | | | | |
| Expenses before reductions | .80% | .79% | .80% | .89% | .92% |
| Expenses net of fee waivers, if any | .80% | .79% | .80% | .89% | .92% |
| Expenses net of all reductions | .79% | .78% | .79% | .87% | .82% |
| Net investment income (loss) | 1.10% | .95% | 1.14% | 1.22% | 1.58% |
| Supplemental Data | | | | | |
| Net assets, end of period (000 omitted) | $129,912 | $90,950 | $83,817 | $60,357 | $30,690 |
| Portfolio turnover rateG | 87% | 59% | 58% | 211% | 323% |
A Calculated based on average shares outstanding during the period.
B Amount represents less than $.005 per share.
C Total returns do not reflect charges attributable to your insurance company's separate account. Inclusion of these charges would reduce the total returns shown.
D Total returns would have been lower if certain expenses had not been reduced during the applicable periods shown.
E Fees and expenses of any underlying Fidelity Central Funds are not included in the Fund's expense ratio. The Fund indirectly bears its proportionate share of the expenses of any underlying Fidelity Central Funds.
F Expense ratios reflect operating expenses of the class. Expenses before reductions do not reflect amounts reimbursed by the investment adviser or reductions from brokerage service arrangements or reductions from other expense offset arrangements and do not represent the amount paid by the class during periods when reimbursements or reductions occur. Expenses net of fee waivers reflect expenses after reimbursement by the investment adviser but prior to reductions from brokerage service arrangements or other expense offset arrangements. Expenses net of all reductions represent the net expenses paid by the class.
G Amount does not include the portfolio activity of any underlying Fidelity Central Funds.
See accompanying notes which are an integral part of the financial statements.
Notes to Financial Statements
For the period ended December 31, 2016
1. Organization.
VIP Financial Services Portfolio (the Fund) is a fund of Variable Insurance Products Fund IV (the Trust) and is authorized to issue an unlimited number of shares. The Trust is registered under the Investment Company Act of 1940, as amended (the 1940 Act), as an open-end management investment company organized as a Massachusetts business trust. Shares of the Fund may only be purchased by insurance companies for the purpose of funding variable annuity or variable life insurance contracts. The Fund offers the following classes of shares: Initial Class shares and Investor Class shares. All classes have equal rights and voting privileges, except for matters affecting a single class.
2. Investments in Fidelity Central Funds.
The Fund invests in Fidelity Central Funds, which are open-end investment companies generally available only to other investment companies and accounts managed by the investment adviser and its affiliates. The Fund's Schedule of Investments lists each of the Fidelity Central Funds held as of period end, if any, as an investment of the Fund, but does not include the underlying holdings of each Fidelity Central Fund. As an Investing Fund, the Fund indirectly bears its proportionate share of the expenses of the underlying Fidelity Central Funds.
The Money Market Central Funds seek preservation of capital and current income and are managed by Fidelity Investments Money Management, Inc. (FIMM), an affiliate of the investment adviser. Annualized expenses of the Money Market Central Funds as of their most recent shareholder report date are less than .005%.
A complete unaudited list of holdings for each Fidelity Central Fund is available upon request or at the Securities and Exchange Commission (the SEC) website at www.sec.gov. In addition, the financial statements of the Fidelity Central Funds, which are not covered by the Fund's Report of Independent Registered Public Accounting Firm, are available on the SEC website or upon request.
3. Significant Accounting Policies.
The financial statements have been prepared in conformity with accounting principles generally accepted in the United States of America (GAAP), which require management to make certain estimates and assumptions at the date of the financial statements. Actual results could differ from those estimates. Subsequent events, if any, through the date that the financial statements were issued have been evaluated in the preparation of the financial statements. The following summarizes the significant accounting policies of the Fund:
Investment Valuation. Investments are valued as of 4:00 p.m. Eastern time on the last calendar day of the period. The Board of Trustees (the Board) has delegated the day to day responsibility for the valuation of the Fund's investments to the Fair Value Committee (the Committee) established by the Fund's investment adviser. In accordance with valuation policies and procedures approved by the Board, the Fund attempts to obtain prices from one or more third party pricing vendors or brokers to value its investments. When current market prices, quotations or currency exchange rates are not readily available or reliable, investments will be fair valued in good faith by the Committee, in accordance with procedures adopted by the Board. Factors used in determining fair value vary by investment type and may include market or investment specific events. The frequency with which these procedures are used cannot be predicted and they may be utilized to a significant extent. The Committee oversees the Fund's valuation policies and procedures and reports to the Board on the Committee's activities and fair value determinations. The Board monitors the appropriateness of the procedures used in valuing the Fund's investments and ratifies the fair value determinations of the Committee.
The Fund categorizes the inputs to valuation techniques used to value its investments into a disclosure hierarchy consisting of three levels as shown below:
- Level 1 – quoted prices in active markets for identical investments
- Level 2 – other significant observable inputs (including quoted prices for similar investments, interest rates, prepayment speeds, etc.)
- Level 3 – unobservable inputs (including the Fund's own assumptions based on the best information available)
Valuation techniques used to value the Fund's investments by major category are as follows:
Equity securities, including restricted securities, for which market quotations are readily available, are valued at the last reported sale price or official closing price as reported by a third party pricing vendor on the primary market or exchange on which they are traded and are categorized as Level 1 in the hierarchy. In the event there were no sales during the day or closing prices are not available, securities are valued at the last quoted bid price or may be valued using the last available price and are generally categorized as Level 2 in the hierarchy. For foreign equity securities, when market or security specific events arise, comparisons to the valuation of American Depositary Receipts (ADRs), futures contracts, Exchange-Traded Funds (ETFs) and certain indexes as well as quoted prices for similar securities may be used and would be categorized as Level 2 in the hierarchy. Utilizing these techniques may result in transfers between Level 1 and Level 2. For equity securities, including restricted securities, where observable inputs are limited, assumptions about market activity and risk are used and these securities may be categorized as Level 3 in the hierarchy.
Investments in open-end mutual funds, including the Fidelity Central Funds, are valued at their closing net asset value (NAV) each business day and are categorized as Level 1 in the hierarchy.
Changes in valuation techniques may result in transfers in or out of an assigned level within the disclosure hierarchy.
Foreign Currency. The Fund may use foreign currency contracts to facilitate transactions in foreign-denominated securities. Gains and losses from these transactions may arise from changes in the value of the foreign currency or if the counterparties do not perform under the contracts' terms.
Foreign-denominated assets, including investment securities, and liabilities are translated into U.S. dollars at the exchange rates at period end. Purchases and sales of investment securities, income and dividends received and expenses denominated in foreign currencies are translated into U.S. dollars at the exchange rate in effect on the transaction date.
The effects of exchange rate fluctuations on investments are included with the net realized and unrealized gain (loss) on investment securities. Other foreign currency transactions resulting in realized and unrealized gain (loss) are disclosed separately.
Investment Transactions and Income. For financial reporting purposes, the Fund's investment holdings and NAV include trades executed through the end of the last business day of the period. The NAV per share for processing shareholder transactions is calculated as of the close of business of the New York Stock Exchange (NYSE), normally 4:00 p.m. Eastern time and includes trades executed through the end of the prior business day. Gains and losses on securities sold are determined on the basis of identified cost and may include proceeds received from litigation. Dividend income is recorded on the ex-dividend date, except for certain dividends from foreign securities where the ex-dividend date may have passed, which are recorded as soon as the Fund is informed of the ex-dividend date. Non-cash dividends included in dividend income, if any, are recorded at the fair market value of the securities received. Income and capital gain distributions from Fidelity Central Funds, if any, are recorded on the ex-dividend date. Certain distributions received by the Fund represent a return of capital or capital gain. The Fund determines the components of these distributions subsequent to the ex-dividend date, based upon receipt of tax filings or other correspondence relating to the underlying investment. These distributions are recorded as a reduction of cost of investments and/or as a realized gain.
Class Allocations and Expenses. Investment income, realized and unrealized capital gains and losses, common expenses of the Fund, and certain fund-level expense reductions, if any, are allocated daily on a pro-rata basis to each class based on the relative net assets of each class to the total net assets of the each Fund. Each class differs with respect to transfer agent fees incurred. Certain expense reductions may also differ by class. For the reporting period, the allocated portion of income and expenses to each class as a percent of its average net assets may vary due to the timing of recording these transactions in relation to fluctuating net assets of the classes. Expenses directly attributable to a fund are charged to that fund. Expenses attributable to more than one fund are allocated among the respective funds on the basis of relative net assets or other appropriate methods. Expense estimates are accrued in the period to which they relate and adjustments are made when actual amounts are known.
Income Tax Information and Distributions to Shareholders. Each year, the Fund intends to qualify as a regulated investment company under Subchapter M of the Internal Revenue Code, including distributing substantially all of its taxable income and realized gains. As a result, no provision for U.S. Federal income taxes is required. As of December 31, 2016, the Fund did not have any unrecognized tax benefits in the financial statements; nor is the Fund aware of any tax positions for which it is reasonably possible that the total amounts of unrecognized tax benefits will significantly change in the next twelve months. The Fund files a U.S. federal tax return, in addition to state and local tax returns as required. The Fund's federal income tax returns are subject to examination by the Internal Revenue Service (IRS) for a period of three fiscal years after they are filed. State and local tax returns may be subject to examination for an additional fiscal year depending on the jurisdiction. Foreign taxes are provided for based on the Fund's understanding of the tax rules and rates that exist in the foreign markets in which it invests.
Distributions are declared and recorded on the ex-dividend date. Income dividends and capital gain distributions are declared separately for each class. Income and capital gain distributions are determined in accordance with income tax regulations, which may differ from GAAP.
Capital accounts within the financial statements are adjusted for permanent book-tax differences. These adjustments have no impact on net assets or the results of operations. Capital accounts are not adjusted for temporary book-tax differences which will reverse in a subsequent period.
Book-tax differences are primarily due to foreign currency transactions, partnerships, capital loss carryforwards and losses deferred due to wash sales.
The federal tax cost of investment securities and unrealized appreciation (depreciation) as of period end were as follows:
| Gross unrealized appreciation | $26,842,510 |
| Gross unrealized depreciation | (829,762) |
| Net unrealized appreciation (depreciation) on securities | $26,012,748 |
| Tax Cost | $148,225,383 |
The tax-based components of distributable earnings as of period end were as follows:
| Undistributed ordinary income | $231,291 |
| Capital loss carryforward | $(645,714) |
| Net unrealized appreciation (depreciation) on securities and other investments | $26,012,608 |
Capital loss carryforwards are only available to offset future capital gains of the Fund to the extent provided by regulations and may be limited. Under the Regulated Investment Company Modernization Act of 2010 (the Act), the Fund is permitted to carry forward capital losses incurred in taxable years beginning after December 22, 2010 for an unlimited period and such capital losses are required to be used prior to any losses that expire. The capital loss carryforward information presented below, including any applicable limitation, is estimated as of fiscal period end and is subject to adjustment.
| Fiscal year of expiration | |
| 2017 | $(645,714) |
The tax character of distributions paid was as follows:
| | December 31, 2016 | December 31, 2015 |
| Ordinary Income | $866,490 | $ 1,186,136 |
Trading (Redemption) Fees. Shares held by investors less than 60 days may be subject to a redemption fee equal to 1% of the NAV of shares redeemed. All redemption fees, which reduce the proceeds of the shareholder redemption, are retained by the Fund and accounted for as an addition to paid in capital.
4. Purchases and Sales of Investments.
Purchases and sales of securities, other than short-term securities, aggregated $130,991,853 and $86,495,461, respectively.
5. Fees and Other Transactions with Affiliates.
Management Fee. Fidelity SelectCo, LLC (the investment adviser) and its affiliates provide the Fund with investment management related services for which the Fund pays a monthly management fee. The management fee is the sum of an individual fund fee rate that is based on an annual rate of .30% of the Fund's average net assets and an annualized group fee rate that averaged .25% during the period. The group fee rate is based upon the average net assets of all the mutual funds advised by Fidelity Management & Research Company (FMR) and the investment adviser. The group fee rate decreases as assets under management increase and increases as assets under management decrease. For the reporting period, the total annual management fee rate was .55% of the Fund's average net assets.
Transfer Agent Fees. Fidelity Investments Institutional Operations Company, Inc. (FIIOC), an affiliate of the investment adviser, is the Fund's transfer, dividend disbursing, and shareholder servicing agent. FIIOC receives an asset-based fee with respect to each class. Each class (with the exception of Investor Class) pays a fee for transfer agent services, typesetting, and printing and mailing of shareholder reports, excluding mailing of proxy statements, equal to an annual rate of .07% (.15% for Investor Class) of class-level average net assets. For the period, transfer agent fees for each class were as follows:
| Initial Class | $12,650 |
| Investor Class | 120,324 |
| | $132,974 |
Accounting and Security Lending Fees. Fidelity Service Company, Inc. (FSC), an affiliate of the investment adviser, maintains the Fund's accounting records. The accounting fee is based on the level of average net assets for each month. Under a separate contract, FSC administers the security lending program. The security lending fee is based on the number and duration of lending transactions.
Brokerage Commissions. The Fund placed a portion of its portfolio transactions with brokerage firms which are affiliates of the investment adviser. Brokerage commissions are included in net realized gain (loss) and change in net unrealized appreciation (depreciation) in the Statement of Operations. The commissions paid to these affiliated firms were $2,821 for the period.
Interfund Trades. The Fund may purchase from or sell securities to other Fidelity Funds under procedures adopted by the Board. The procedures have been designed to ensure these interfund trades are executed in accordance with Rule 17a-7 of the 1940 Act. Interfund trades are included within the respective purchases and sales amounts shown in the Purchases and Sales of Investments note.
6. Committed Line of Credit.
The Fund participates with other funds managed by the investment adviser or an affiliate in a $4.25 billion credit facility (the "line of credit") to be utilized for temporary or emergency purposes to fund shareholder redemptions or for other short-term liquidity purposes. The Fund has agreed to pay commitment fees on its pro-rata portion of the line of credit, which amounted to $246 and is reflected in Miscellaneous expenses on the Statement of Operations. During the period, the Fund did not borrow on this line of credit.
7. Security Lending.
The Fund lends portfolio securities through a lending agent from time to time in order to earn additional income. On the settlement date of the loan, the Fund receives collateral (in the form of U.S. Treasury obligations, letters of credit and/or cash) against the loaned securities and maintains collateral in an amount not less than 100% of the market value of the loaned securities during the period of the loan. The market value of the loaned securities is determined at the close of business of the Fund and any additional required collateral is delivered to the Fund on the next business day. The Fund or borrower may terminate the loan at any time, and if the borrower defaults on its obligation to return the securities loaned because of insolvency or other reasons, the Fund may apply collateral received from the borrower against the obligation. The Fund may experience delays and costs in recovering the securities loaned. Any cash collateral received is invested in the Fidelity Securities Lending Cash Central Fund. At period end, there were no security loans outstanding. Security lending income represents the income earned on investing cash collateral, less rebates paid to borrowers and any lending agent fees associated with the loan, plus any premium payments received for lending certain types of securities. Security lending income is presented in the Statement of Operations as a component of income from Fidelity Central Funds. Total security lending income during the period amounted to $1,512.
8. Expense Reductions.
Commissions paid to certain brokers with whom the investment adviser, or its affiliates, places trades on behalf of the Fund include an amount in addition to trade execution, which may be rebated back to the Fund to offset certain expenses. This amount totaled $5,114 for the period. In addition, through arrangements with the Fund's custodian, credits realized as a result of certain uninvested cash balances were used to reduce the Fund's expenses. During the period, these credits reduced the Fund's custody expenses by $29.
In addition, during the period the investment adviser reimbursed and/or waived a portion of fund-level operating expenses in the amount of $802.
9. Distributions to Shareholders.
Distributions to shareholders of each class were as follows:
| | Year ended December 31, 2016 | Year ended December 31, 2015 |
| From net investment income | | |
| Initial Class | $ 228,889 | $ 241,480 |
| Investor Class | 637,601 | 944,656 |
| Total | $866,490 | $1,186,136 |
10. Share Transactions.
Transactions for each class of shares were as follows:
| | Shares | Shares | Dollars | Dollars |
| | Year ended December 31, 2016 | Year ended December 31, 2015 | Year ended December 31, 2016 | Year ended December 31, 2015 |
| Initial Class | | | | |
| Shares sold | 2,053,972 | 629,305 | $22,916,293 | $6,415,342 |
| Reinvestment of distributions | 19,647 | 25,259 | 228,889 | 241,480 |
| Shares redeemed | (583,592) | (826,883) | (5,455,615) | (8,303,234) |
| Net increase (decrease) | 1,490,027 | (172,319) | $17,689,567 | $(1,646,412) |
| Investor Class | | | | |
| Shares sold | 4,529,275 | 3,306,441 | $48,842,893 | $33,530,950 |
| Reinvestment of distributions | 54,966 | 99,229 | 637,601 | 944,656 |
| Shares redeemed | (2,608,193) | (2,262,535) | (24,177,838) | (22,832,498) |
| Net increase (decrease) | 1,976,048 | 1,143,135 | $25,302,656 | $11,643,108 |
11. Other.
The Fund's organizational documents provide former and current trustees and officers with a limited indemnification against liabilities arising in connection with the performance of their duties to the Fund. In the normal course of business, the Fund may also enter into contracts that provide general indemnifications. The Fund's maximum exposure under these arrangements is unknown as this would be dependent on future claims that may be made against the Fund. The risk of material loss from such claims is considered remote.
At the end of the period, the investment adviser or its affiliates were the owners of record of 100% of the total outstanding shares of the Fund.
Report of Independent Registered Public Accounting Firm
To the Trustees of Variable Insurance Products Fund IV and Shareholders of VIP Financial Services Portfolio:
In our opinion, the accompanying statement of assets and liabilities, including the schedule of investments, and the related statements of operations and of changes in net assets and the financial highlights present fairly, in all material respects, the financial position of VIP Financial Services Portfolio (a fund of Variable Insurance Products Fund IV) (the "Fund") as of December 31, 2016, the results of its operations for the year then ended, the changes in its net assets for each of the two years in the period then ended and the financial highlights for each of the five years in the period then ended, in conformity with accounting principles generally accepted in the United States of America. These financial statements and financial highlights (hereafter referred to as “financial statements”) are the responsibility of the Fund's management. Our responsibility is to express an opinion on these financial statements based on our audits. We conducted our audits of these financial statements in accordance with the standards of the Public Company Accounting Oversight Board (United States). Those standards require that we plan and perform the audit to obtain reasonable assurance about whether the financial statements are free of material misstatement. An audit includes examining, on a test basis, evidence supporting the amounts and disclosures in the financial statements, assessing the accounting principles used and significant estimates made by management, and evaluating the overall financial statement presentation. We believe that our audits, which included confirmation of securities as of December 31, 2016 by correspondence with the custodian and brokers, provide a reasonable basis for our opinion.
PricewaterhouseCoopers LLP
Boston, Massachusetts
February 16, 2017
Trustees and Officers
The Trustees, Members of the Advisory Board (if any), and officers of the trust and fund, as applicable, are listed below. The Board of Trustees governs the fund and is responsible for protecting the interests of shareholders. The Trustees are experienced executives who meet periodically throughout the year to oversee the fund's activities, review contractual arrangements with companies that provide services to the fund, oversee management of the risks associated with such activities and contractual arrangements, and review the fund's performance. Each of the Trustees oversees 83 funds.
The Trustees hold office without limit in time except that (a) any Trustee may resign; (b) any Trustee may be removed by written instrument, signed by at least two-thirds of the number of Trustees prior to such removal; (c) any Trustee who requests to be retired or who has become incapacitated by illness or injury may be retired by written instrument signed by a majority of the other Trustees; and (d) any Trustee may be removed at any special meeting of shareholders by a two-thirds vote of the outstanding voting securities of the trust. Each Trustee who is not an interested person (as defined in the 1940 Act) of the trust and the fund is referred to herein as an Independent Trustee. Each Independent Trustee shall retire not later than the last day of the calendar year in which his or her 75th birthday occurs. The Independent Trustees may waive this mandatory retirement age policy with respect to individual Trustees. Officers and Advisory Board Members hold office without limit in time, except that any officer or Advisory Board Member may resign or may be removed by a vote of a majority of the Trustees at any regular meeting or any special meeting of the Trustees. Except as indicated, each individual has held the office shown or other offices in the same company for the past five years.
The fund’s Statement of Additional Information (SAI) includes more information about the Trustees. To request a free copy, call Fidelity at 1-877-208-0098.
Experience, Skills, Attributes, and Qualifications of the Trustees. The Governance and Nominating Committee has adopted a statement of policy that describes the experience, qualifications, attributes, and skills that are necessary and desirable for potential Independent Trustee candidates (Statement of Policy). The Board believes that each Trustee satisfied at the time he or she was initially elected or appointed a Trustee, and continues to satisfy, the standards contemplated by the Statement of Policy. The Governance and Nominating Committee also engages professional search firms to help identify potential Independent Trustee candidates who have the experience, qualifications, attributes, and skills consistent with the Statement of Policy. From time to time, additional criteria based on the composition and skills of the current Independent Trustees, as well as experience or skills that may be appropriate in light of future changes to board composition, business conditions, and regulatory or other developments, have also been considered by the professional search firms and the Governance and Nominating Committee. In addition, the Board takes into account the Trustees' commitment and participation in Board and committee meetings, as well as their leadership of standing and ad hoc committees throughout their tenure.
In determining that a particular Trustee was and continues to be qualified to serve as a Trustee, the Board has considered a variety of criteria, none of which, in isolation, was controlling. The Board believes that, collectively, the Trustees have balanced and diverse experience, qualifications, attributes, and skills, which allow the Board to operate effectively in governing the fund and protecting the interests of shareholders. Information about the specific experience, skills, attributes, and qualifications of each Trustee, which in each case led to the Board's conclusion that the Trustee should serve (or continue to serve) as a trustee of the fund, is provided below.
Board Structure and Oversight Function. Brian B. Hogan is an interested person and currently serves as Chairman. The Trustees have determined that an interested Chairman is appropriate and benefits shareholders because an interested Chairman has a personal and professional stake in the quality and continuity of services provided to the fund. Independent Trustees exercise their informed business judgment to appoint an individual of their choosing to serve as Chairman, regardless of whether the Trustee happens to be independent or a member of management. The Independent Trustees have determined that they can act independently and effectively without having an Independent Trustee serve as Chairman and that a key structural component for assuring that they are in a position to do so is for the Independent Trustees to constitute a substantial majority for the Board. The Independent Trustees also regularly meet in executive session. Michael E. Wiley serves as Chairman of the Independent Trustees and as such (i) acts as a liaison between the Independent Trustees and management with respect to matters important to the Independent Trustees and (ii) with management prepares agendas for Board meetings.
Fidelity® funds are overseen by different Boards of Trustees. The fund's Board oversees Fidelity's sector portfolios. Other Boards oversee Fidelity's equity and high income funds, and Fidelity's investment grade bond, money market, and asset allocation funds. The use of separate Boards, each with its own committee structure, allows the Trustees of each group of Fidelity® funds to focus on the unique issues of the funds they oversee, including common research, investment, and operational issues. On occasion, the separate Boards establish joint committees to address issues of overlapping consequences for the Fidelity® funds overseen by each Board.
The Trustees operate using a system of committees to facilitate the timely and efficient consideration of all matters of importance to the Trustees, the fund, and fund shareholders and to facilitate compliance with legal and regulatory requirements and oversight of the fund's activities and associated risks. The Board, acting through its committees, has charged SelectCo and its affiliates with (i) identifying events or circumstances the occurrence of which could have demonstrably adverse effects on the fund's business and/or reputation; (ii) implementing processes and controls to lessen the possibility that such events or circumstances occur or to mitigate the effects of such events or circumstances if they do occur; and (iii) creating and maintaining a system designed to evaluate continuously business and market conditions in order to facilitate the identification and implementation processes described in (i) and (ii) above. Because the day-to-day operations and activities of the fund are carried out by or through SelectCo, its affiliates, and other service providers, the fund's exposure to risks is mitigated but not eliminated by the processes overseen by the Trustees. While each of the Board's committees has responsibility for overseeing different aspects of the fund's activities, oversight is exercised primarily through the Operations and Audit Committees. Appropriate personnel, including but not limited to the fund's Chief Compliance Officer (CCO), SelectCo's internal auditor, the independent accountants, the fund's Treasurer and portfolio management personnel, make periodic reports to the Board's committees, as appropriate. The responsibilities of each standing committee, including their oversight responsibilities, are described further under "Standing Committees of the Trustees."
Interested Trustees*:
Correspondence intended for a Trustee who is an interested person may be sent to Fidelity Investments, 245 Summer Street, Boston, Massachusetts 02210.
Name, Year of Birth; Principal Occupations and Other Relevant Experience+
Brian B. Hogan (1964)
Year of Election or Appointment: 2014
Trustee
Chairman of the Board of Trustees
Mr. Hogan also serves as Trustee or Vice President of other funds. Mr. Hogan serves as a Director of FMR Investment Management (UK) Limited (investment adviser firm, 2015-present) and Fidelity SelectCo, LLC (investment adviser firm, 2014-present) and President of the Equity Division of FMR (investment adviser firm, 2009-present). Previously, Mr. Hogan served as Senior Vice President, Equity Research of FMR (2006-2009) and as a portfolio manager. Mr. Brian B. Hogan is not related to Mr. Colm A. Hogan.
* Determined to be an "Interested Trustee" by virtue of, among other things, his or her affiliation with the trust or various entities under common control with SelectCo.
+ The information includes the Trustee's principal occupation during the last five years and other information relating to the experience, attributes, and skills relevant to the Trustee's qualifications to serve as a Trustee, which led to the conclusion that the Trustee should serve as a Trustee for the fund.
Independent Trustees:
Correspondence intended for an Independent Trustee may be sent to Fidelity Investments, P.O. Box 55235, Boston, Massachusetts 02205-5235.
Name, Year of Birth; Principal Occupations and Other Relevant Experience+
David A. Rosow (1942)
Year of Election or Appointment: 2013
Trustee
Mr. Rosow also serves as Trustee of other Fidelity® funds. Prior to his retirement in 2006, Mr. Rosow was the Chief Executive Officer, owner and operator of a number of private companies, which encompassed the oil refining, drilling and marketing of petroleum products (including specialty petroleum products), recreation industry, and real estate development. Mr. Rosow currently serves as a Director of Oxbow Carbon LLC (upgraders, marketers, and distributors of petroleum byproducts of the oil refining process, 2015-present) and Oxbridge Academy of the Palm Beaches (2015-present) and serves as its President and CEO. Previously, Mr. Rosow served on the Fairfield Country Day School Board for 27 years, including as its President for 3 years, stepping down in 2006. Mr. Rosow served as Lead Director and Chairman of the Audit Committee of Hudson United Bancorp (1996-2006), Chairman of the Board of Westport Bank and Trust (1992-1996), and as a Director of TD Banknorth (2006-2007). In addition, Mr. Rosow served as a member (2008-2014) and President (2009-2014) of the Town Council of Palm Beach, Florida. Mr. Rosow also served as a Member of the Advisory Board of certain Fidelity® funds (2012-2013).
Garnett A. Smith (1947)
Year of Election or Appointment: 2013
Trustee
Mr. Smith also serves as Trustee of other Fidelity® funds. Prior to Mr. Smith's retirement, he served as Chairman and Chief Executive Officer of Inbrand Corp. (manufacturer of personal absorbent products, 1990-1997). He also served as President (1986-1990) of Inbrand Corp. Prior to his employment with Inbrand Corp., he was employed by a retail fabric chain and North Carolina National Bank. In addition, Mr. Smith served as a Member of the Advisory Board of certain Fidelity® funds (2012-2013) and as a board member of the Jackson Hole Land Trust (2009-2012).
Michael E. Wiley (1950)
Year of Election or Appointment: 2008
Trustee
Chairman of the Independent Trustees
Mr. Wiley also serves as Trustee of other Fidelity® funds. Mr. Wiley serves as a Director of Tesoro Corporation (independent oil refiner and marketer, 2005-present), a Director of Tesoro Logistics LP (natural resources logistics, 2015-present), and a Director of Bill Barrett Corporation (exploration and production, 2005-present). In addition, Mr. Wiley also serves as a Director of Post Oak Bank (privately-held bank, 2004-present). Previously, Mr. Wiley served as a Trustee of other Fidelity® funds (2008-2013), as a Director of Asia Pacific Exploration Consolidated (international oil and gas exploration and production, 2008-2013), as a member of the Board of Trustees of the University of Tulsa (2000-2006; 2007-2010), as a Senior Energy Advisor of Katzenbach Partners, LLC (consulting, 2006-2007), as an Advisory Director of Riverstone Holdings (private investment), Chairman, President, and CEO of Baker Hughes, Inc. (oilfield services, 2000-2004), and as Director of Spinnaker Exploration Company (exploration and production, 2001-2005).
+ The information includes the Trustee's principal occupation during the last five years and other information relating to the experience, attributes, and skills relevant to the Trustee's qualifications to serve as a Trustee, which led to the conclusion that the Trustee should serve as a Trustee for the fund.
Advisory Board Members and Officers:
Correspondence intended for a Member of the Advisory Board may be sent to Fidelity Investments, P.O. Box 55235, Boston, Massachusetts 02205-5235. Except for Anthony R. Rochte, correspondence intended for an officer may be sent to Fidelity Investments, 245 Summer Street, Boston, Massachusetts 02210. Correspondence intended for Mr. Rochte may be sent to SelectCo, 1225 17th Street, Denver, Colorado 80202-5541. Officers appear below in alphabetical order.
Name, Year of Birth; Principal Occupation
Donald F. Donahue (1950)
Year of Election or Appointment: 2015
Member of the Advisory Board
Mr. Donahue also serves as a Trustee or Member of the Advisory Board of other Fidelity® funds. Mr. Donahue is President and Chief Executive Officer of Miranda Partners, LLC (risk consulting for the financial services industry, 2012-present) and a consultant for the Institute for Defense Analyses (national security, 2012-present). Previously, Mr. Donahue served as Chief Executive Officer (2006-2012), Chief Operating Officer (2003-2006), and Managing Director, Customer Marketing and Development (1999-2003) of The Depository Trust & Clearing Corporation (financial markets infrastructure). Mr. Donahue serves as a Member (2012-present) and Co-Chairman (2016-present) of the Board of Directors of United Way of New York, Member of the Board of Directors of NYC Leadership Academy (2012-present) and Member of the Board of Advisors of Ripple Labs, Inc. (financial services, 2015-present). He also served as Chairman (2010-2012) and Member of the Board of Directors (2012-2013) of Omgeo, LLC (financial services), Treasurer of United Way of New York (2012-2016), and Member of the Board of Directors of XBRL US (financial services non-profit, 2009-2012) and the International Securities Services Association (2009-2012).
Carol B. Tomé (1957)
Year of Election or Appointment: 2017
Member of the Advisory Board
Ms. Tomé also serves as Trustee or Member of the Advisory Board of other Fidelity® funds. Ms. Tomé is Chief Financial Officer (2001-present) and Executive Vice President of Corporate Services (2007-present) of The Home Depot, Inc. (home improvement retailer) and a Director (2003-present) and Chair of the Audit Committee (2004-present) of United Parcel Service, Inc. (package delivery and supply chain management). Previously, Ms. Tomé served as Senior Vice President of Finance and Accounting/Treasurer (2000-2007) and Vice President and Treasurer (1995-2000) of The Home Depot, Inc. and Chair of the Board (2010-2012), Vice Chair of the Board (2009 and 2013), and a Director (2008-2013) of the Federal Reserve Bank of Atlanta. Ms. Tomé is also a director or trustee of many community and professional organizations.
Marc R. Bryant (1966)
Year of Election or Appointment: 2013
Secretary and Chief Legal Officer (CLO)
Mr. Bryant also serves as Secretary and CLO of other funds. Mr. Bryant serves as CLO, Secretary, and Senior Vice President of Fidelity Management & Research Company (investment adviser firm, 2015-present) and FMR Co., Inc. (investment adviser firm, 2015-present); Secretary of Fidelity SelectCo, LLC (investment adviser firm, 2015-present) and Fidelity Investments Money Management, Inc. (investment adviser firm, 2015-present); and CLO of Fidelity Management & Research (Hong Kong) Limited and FMR Investment Management (UK) Limited (investment adviser firms, 2015-present) and Fidelity Management & Research (Japan) Limited (investment adviser firm, 2016-present). He is Senior Vice President and Deputy General Counsel of FMR LLC (diversified financial services company). Previously, Mr. Bryant served as Secretary and CLO of Fidelity Rutland Square Trust II (2010-2014) and Assistant Secretary of Fidelity's Fixed Income and Asset Allocation Funds (2013-2015). Prior to joining Fidelity Investments, Mr. Bryant served as a Senior Vice President and the Head of Global Retail Legal for AllianceBernstein L.P. (2006-2010), and as the General Counsel for ProFund Advisors LLC (2001-2006).
Jeffrey S. Christian (1961)
Year of Election or Appointment: 2016
Assistant Treasurer
Mr. Christian also serves as Assistant Treasurer of other funds. Mr. Christian is an employee of Fidelity Investments (2003-present).
William C. Coffey (1969)
Year of Election or Appointment: 2009
Assistant Secretary
Mr. Coffey also serves as Assistant Secretary of other funds. He is Senior Vice President and Deputy General Counsel of FMR LLC (diversified financial services company, 2010-present), and is an employee of Fidelity Investments. Previously, Mr. Coffey served as Vice President and Associate General Counsel of FMR LLC (2005-2009).
Jonathan Davis (1968)
Year of Election or Appointment: 2010
Assistant Treasurer
Mr. Davis also serves as Assistant Treasurer of other funds, and is an employee of Fidelity Investments. Previously, Mr. Davis served as Vice President and Associate General Counsel of FMR LLC (diversified financial services company, 2003-2010).
Adrien E. Deberghes (1967)
Year of Election or Appointment: 2013
President and Treasurer
Mr. Deberghes also serves as an officer of other funds. He serves as Executive Vice President of Fidelity Investments Money Management, Inc. (FIMM) (investment adviser firm, 2016-present) and is an employee of Fidelity Investments (2008-present). Prior to joining Fidelity Investments, Mr. Deberghes was Senior Vice President of Mutual Fund Administration at State Street Corporation (2007-2008), Senior Director of Mutual Fund Administration at Investors Bank & Trust (2005-2007), and Director of Finance for Dunkin' Brands (2000-2005). Previously, Mr. Deberghes served in other fund officer roles.
Joseph DeSantis (1959)
Year of Election or Appointment: 2015
Vice President
Mr. DeSantis also serves as Vice President of other funds. Mr. DeSantis serves as a Director of Fidelity Management & Research (Japan) Limited (investment adviser firm, 2016-present), Chief Investment Officer, Equities (2010-present) and is an employee of Fidelity Investments.
Stephanie J. Dorsey (1969)
Year of Election or Appointment: 2010
Assistant Treasurer
Ms. Dorsey also serves as an officer of other funds. She is an employee of Fidelity Investments (2008-present) and has served in other fund officer roles. Prior to joining Fidelity Investments, Ms. Dorsey served as Treasurer (2004-2008) of the JPMorgan Mutual Funds and Vice President (2004-2008) of JPMorgan Chase Bank.
Howard J. Galligan III (1966)
Year of Election or Appointment: 2014
Chief Financial Officer
Mr. Galligan also serves as Chief Financial Officer of other funds. Mr. Galligan serves as President of Fidelity Pricing and Cash Management Services (FPCMS) (2014-present) and as a Director of Strategic Advisers, Inc. (investment adviser firm, 2008-present). Previously, Mr. Galligan served as Chief Administrative Officer of Asset Management (2011-2014) and Chief Operating Officer and Senior Vice President of Investment Support for Strategic Advisers, Inc. (2003-2011).
Scott C. Goebel (1968)
Year of Election or Appointment: 2015
Vice President
Mr. Goebel serves as Vice President of other funds and is an employee of Fidelity Investments (2001-present). Previously, Mr. Goebel served as Senior Vice President of Fidelity Management & Research Company (FMR) (investment adviser firm, 2016), Secretary of Fidelity SelectCo, LLC (investment adviser firm, 2013-2015), Fidelity Investments Money Management, Inc. (FIMM) (investment adviser firm, 2010-2015), and Fidelity Research and Analysis Company (FRAC) (investment adviser firm, 2010-2015); General Counsel, Secretary, and Senior Vice President of FMR (investment adviser firm, 2008-2015) and FMR Co., Inc. (investment adviser firm, 2008-2015); Assistant Secretary of Fidelity Management & Research (Japan) Limited (investment adviser firm, 2008-2015) and Fidelity Management & Research (U.K.) Inc. (investment adviser firm, 2008-2015); Chief Legal Officer (CLO) of Fidelity Management & Research (Hong Kong) Limited (investment adviser firm, 2008-2015); Secretary and CLO of certain Fidelity® funds (2008-2015); Assistant Secretary of FIMM (2008-2010), FRAC (2008-2010), and certain funds (2007-2008); and as Vice President and Secretary of Fidelity Distributors Corporation (FDC) (2005-2007).
James D. Gryglewicz (1972)
Year of Election or Appointment: 2014
Chief Compliance Officer
Mr. Gryglewicz also serves as Chief Compliance Officer of other funds. Mr. Gryglewicz serves as Compliance Officer of Strategic Advisers, Inc. (investment adviser firm, 2015-present) and Fidelity SelectCo, LLC (investment adviser firm, 2014-present), Senior Vice President of Asset Management Compliance (2009-present), and is an employee of Fidelity Investments (2004-present).
Brian B. Hogan (1964)
Year of Election or Appointment: 2009
Vice President
Mr. Hogan also serves as Trustee or Vice President of other funds. Mr. Hogan serves as a Director of FMR Investment Management (UK) Limited (investment adviser firm, 2015-present) and Fidelity SelectCo, LLC (investment adviser firm, 2014-present) and President of the Equity Division of FMR (investment adviser firm, 2009-present). Previously, Mr. Hogan served as Senior Vice President, Equity Research of FMR (2006-2009) and as a portfolio manager. Mr. Brian B. Hogan is not related to Mr. Colm A. Hogan.
Colm A. Hogan (1973)
Year of Election or Appointment: 2016
Assistant Treasurer
Mr. Hogan also serves as an officer of other funds. Mr. Hogan is an employee of Fidelity Investments (2005-present). Mr. Colm A. Hogan is not related to Mr. Brian B. Hogan.
Chris Maher (1972)
Year of Election or Appointment: 2013
Assistant Treasurer
Mr. Maher serves as Assistant Treasurer of other funds. Mr. Maher is Vice President of Valuation Oversight and is an employee of Fidelity Investments. Previously, Mr. Maher served as Vice President of Asset Management Compliance (2013), Vice President of the Program Management Group of FMR (investment adviser firm, 2010-2013), and Vice President of Valuation Oversight (2008-2010).
John F. Papandrea (1972)
Year of Election or Appointment: 2016
Anti-Money Laundering (AML) Officer
Mr. Papandrea also serves as AML Officer of other funds. Mr. Papandrea is Vice President of FMR LLC (diversified financial services company, 2008-present) and is an employee of Fidelity Investments (2005-present).
Anthony R. Rochte (1968)
Year of Election or Appointment: 2013
Vice President
Mr. Rochte also serves as Vice President of other funds. Mr. Rochte serves as President of Fidelity SelectCo, LLC (investment adviser firm, 2012-present) and is an employee of Fidelity Investments (2012-present). Prior to joining Fidelity Investments, Mr. Rochte served as Senior Managing Director and head of State Street Global Advisors' North American Intermediary Business Group (2006-2012).
Stacie M. Smith (1974)
Year of Election or Appointment: 2013
Assistant Treasurer
Ms. Smith also serves as an officer of other funds. She is an employee of Fidelity Investments (2009-present) and has served in other fund officer roles. Prior to joining Fidelity Investments, Ms. Smith served as Senior Audit Manager of Ernst & Young LLP (accounting firm, 1996-2009). Previously, Ms. Smith served as Deputy Treasurer of certain Fidelity® funds (2013-2016).
Marc L. Spector (1972)
Year of Election or Appointment: 2017
Assistant Treasurer
Mr. Spector also serves as an officer of other funds. Mr. Spector is an employee of Fidelity Investments (2016-present). Prior to joining Fidelity Investments, Mr. Spector served as Director at the Siegfried Group (accounting firm, 2013-2016), and prior to Siegfried Group as audit senior manager at Deloitte & Touche (accounting firm, 2005-2013).
Renee Stagnone (1975)
Year of Election or Appointment: 2016
Assistant Treasurer
Ms. Stagnone also serves as an officer of other funds. Ms. Stagnone is an employee of Fidelity Investments (1997-present). Previously, Ms. Stagnone served as Deputy Treasurer of certain Fidelity® funds (2013-2016).
Shareholder Expense Example
As a shareholder of the Fund, you incur two types of costs: (1) transaction costs, including redemption fees and (2) ongoing costs, including management fees and other Fund expenses. This Example is intended to help you understand your ongoing costs (in dollars) of investing in the Fund and to compare these costs with the ongoing costs of investing in other mutual funds.
The Example is based on an investment of $1,000 invested at the beginning of the period and held for the entire period (July 1, 2016 to December 31, 2016).
Actual Expenses
The first line of the accompanying table for each class of the Fund provides information about actual account values and actual expenses. You may use the information in this line, together with the amount you invested, to estimate the expenses that you paid over the period. Simply divide your account value by $1,000.00 (for example, an $8,600 account value divided by $1,000.00 = 8.6), then multiply the result by the number in the first line for a class of the Fund under the heading entitled "Expenses Paid During Period" to estimate the expenses you paid on your account during this period. The estimate of expenses does not include any fees or other expenses of any variable annuity or variable life insurance product. If they were, the estimate of expenses you paid during the period would be higher, and your ending account value would be lower. In addition, the Fund, as a shareholder in the underlying Fidelity Central Funds, will indirectly bear its pro-rata share of the fees and expenses incurred by the underlying Fidelity Central Funds. These fees and expenses are not included in the Fund's annualized expense ratio used to calculate the expense estimate in the table below.
Hypothetical Example for Comparison Purposes
The second line of the accompanying table for each class of the Fund provides information about hypothetical account values and hypothetical expenses based on a Class' actual expense ratio and an assumed rate of return of 5% per year before expenses, which is not the Class' actual return. The hypothetical account values and expenses may not be used to estimate the actual ending account balance or expenses you paid for the period. You may use this information to compare the ongoing costs of investing in the Fund and other funds. To do so, compare this 5% hypothetical example with the 5% hypothetical examples that appear in the shareholder reports of the other funds. The estimate of expenses does not include any fees or other expenses of any variable annuity or variable life insurance product. If they were, the estimate of expenses you paid during the period would be higher, and your ending account value would be lower. In addition, the Fund, as a shareholder in the underlying Fidelity Central Funds, will indirectly bear its pro-rata share of the fees and expenses incurred by the underlying Fidelity Central Funds. These fees and expenses are not included in the Fund's annualized expense ratio used to calculate the expense estimate in the table below.
Please note that the expenses shown in the table are meant to highlight your ongoing costs only and do not reflect any transaction costs. Therefore, the second line of the table is useful in comparing ongoing costs only, and will not help you determine the relative total costs of owning different funds. In addition, if these transactional costs were included, your costs would have been higher.
| | Annualized Expense Ratio-A | Beginning
Account Value
July 1, 2016 | Ending
Account Value
December 31, 2016 | Expenses Paid
During Period-B
July 1, 2016
to December 31, 2016 |
| Initial Class | .72% | | | |
| Actual | | $1,000.00 | $1,218.50 | $4.02 |
| Hypothetical-C | | $1,000.00 | $1,021.52 | $3.66 |
| Investor Class | .80% | | | |
| Actual | | $1,000.00 | $1,217.70 | $4.46 |
| Hypothetical-C | | $1,000.00 | $1,021.11 | $4.06 |
A Annualized expense ratio reflects expenses net of applicable fee waivers.
B Expenses are equal to each Class' annualized expense ratio, multiplied by the average account value over the period, multiplied by 184/366 (to reflect the one-half year period).
C 5% return per year before expenses
Distributions (Unaudited)
Initial Class and Investor Class designate 100% of the dividends distributed during the fiscal year as qualifying for the dividends–received deduction for corporate shareholders.
VFSIC-ANN-0217
1.817367.112
Fidelity® Variable Insurance Products: Real Estate Portfolio
Annual Report December 31, 2016 |
|
Contents
To view a fund's proxy voting guidelines and proxy voting record for the 12-month period ended June 30, visit http://www.fidelity.com/proxyvotingresults or visit the Securities and Exchange Commission's (SEC) web site at http://www.sec.gov.
You may also call 1-877-208-0098 to request a free copy of the proxy voting guidelines.
Fidelity® Variable Insurance Products are separate account options which are purchased through a variable insurance contract.
Standard & Poor's, S&P and S&P 500 are registered service marks of The McGraw-Hill Companies, Inc. and have been licensed for use by Fidelity Distributors Corporation.
Other third-party marks appearing herein are the property of their respective owners.
All other marks appearing herein are registered or unregistered trademarks or service marks of FMR LLC or an affiliated company. © 2017 FMR LLC. All rights reserved.
This report and the financial statements contained herein are submitted for the general information of the shareholders of the Fund. This report is not authorized for distribution to prospective investors in the Fund unless preceded or accompanied by an effective prospectus.
A fund files its complete schedule of portfolio holdings with the SEC for the first and third quarters of each fiscal year on Form N-Q. Forms N-Q are available on the SEC’s web site at http://www.sec.gov. A fund's Forms N-Q may be reviewed and copied at the SEC’s Public Reference Room in Washington, DC. Information regarding the operation of the SEC's Public Reference Room may be obtained by calling 1-800-SEC-0330.
For a complete list of a fund's portfolio holdings, view the most recent holdings listing, semiannual report, or annual report on Fidelity's web site at http://www.fidelity.com, http://www.institutional.fidelity.com, or http://www.401k.com, as applicable.
NOT FDIC INSURED •MAY LOSE VALUE •NO BANK GUARANTEE
Neither the Fund nor Fidelity Distributors Corporation is a bank.
Performance: The Bottom Line
Average annual total return reflects the change in the value of an investment, assuming reinvestment of distributions from dividend income and capital gains (the profits earned upon the sale of securities that have grown in value, if any) and assuming a constant rate of performance each year. During periods of reimbursement by Fidelity, a fund’s total return will be greater than it would be had the reimbursement not occurred. Performance numbers are net of all underlying fund operating expenses, but do not include any insurance charges imposed by your insurance company’s separate account. If performance information included the effect of these additional charges, the total returns would have been lower. How a fund did yesterday is no guarantee of how it will do tomorrow.
Average Annual Total Returns
| For the periods ended December 31, 2016 | Past 1 year | Past 5 years | Past 10 years |
| Initial Class | 5.75% | 11.51% | 5.17% |
| Service Class | 5.63% | 11.39% | 5.06% |
| Service Class 2 | 5.46% | 11.23% | 4.90% |
| Investor Class | 5.65% | 11.41% | 5.08% |
$10,000 Over 10 Years
Let's say hypothetically that $10,000 was invested in VIP Real Estate Portfolio - Initial Class on December 31, 2006.
The chart shows how the value of your investment would have changed, and also shows how the S&P 500® Index performed over the same period.
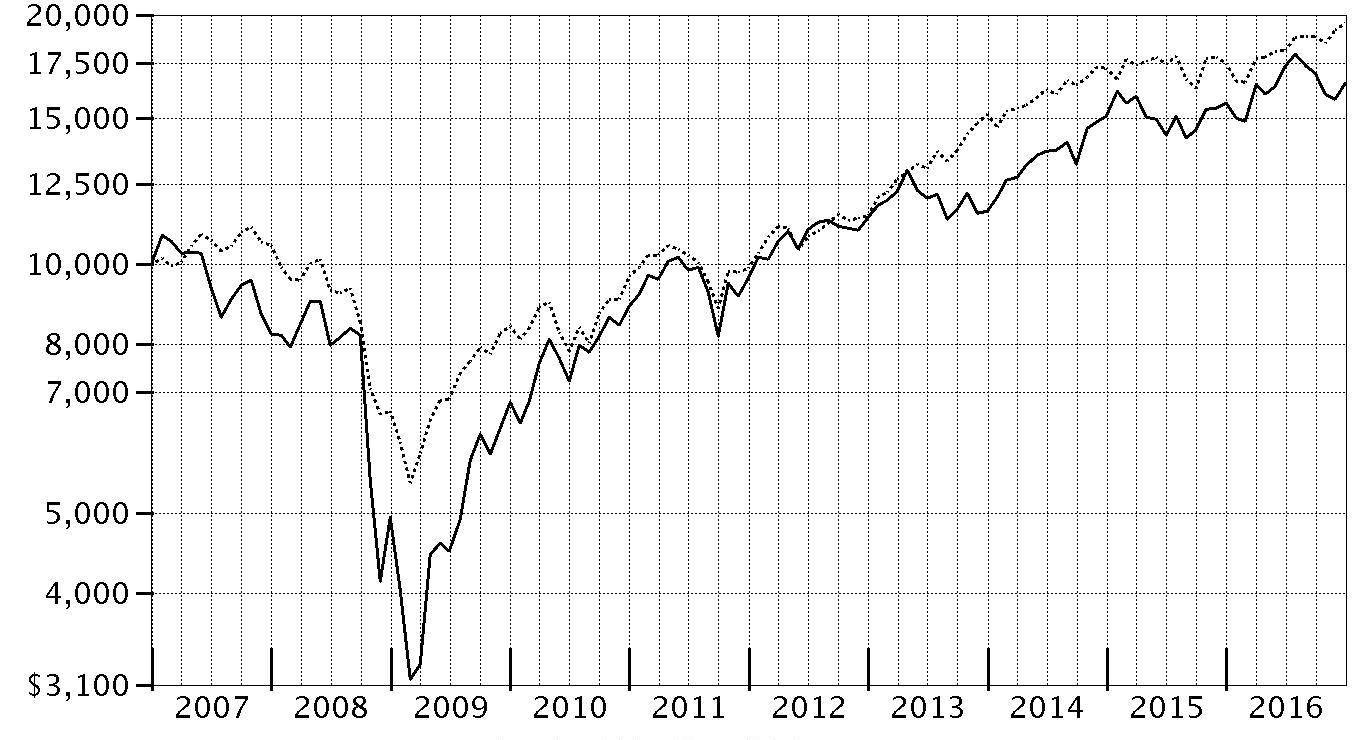
| Period Ending Values |
| $16,553 | VIP Real Estate Portfolio - Initial Class |
| $19,572 | S&P 500® Index |
Management's Discussion of Fund Performance
Market Recap: The S&P 500 index returned 11.96% in 2016, rising sharply on post-election optimism for economic growth. The year began during a fairly volatile stretch, with stocks hampered by persistent oil-price weakness and U.S.-dollar strength. Markets regained momentum in February amid U.S. job gains, a rally in energy and other stimuli that helped keep the roughly seven-year uptrend intact. Markets tumbled briefly following the U.K.’s June 23 vote to exit the European Union – dubbed “Brexit” – then recovered quickly and settled into a flattish stretch until the November 8 U.S. presidential election. Stocks reacted to the outcome by reaching a series of all-time highs. For the year, energy (+27%) led the way amid two strong rallies in commodity prices, one in the spring and another in November. Telecommunication services (+23%) was close behind, as demand for dividend-paying equities was high early in the period. Cyclical sectors, including financials (+22%), industrials (+18%) and materials (+17%), also posted strong gains. Conversely, consumer staples (+5%) and consumer discretionary (+6%) lagged the index, the latter hurt as online competition continued to pressure brick-and-mortar retailers. Real estate (+3%) struggled due to expectations for rising interest rates, while health care (-2%) was hampered by an uncertain political and regulatory outlook.
Comments from Portfolio Manager Samuel Wald: The fund’s share classes gained about 5% to 6%, trailing the 6.65% return of the Dow Jones U.S. Select Real Estate Securities Index, as well as the broader S&P 500. Compared with the Dow Jones index, stock picking among residential REITs (real estate investment trusts) hurt, as did positioning in the hotel category and underweighting the strong-performing industrial sector. Security selection among health care REITs and positioning in the retail group added value. Individually, the biggest relative detractor was underweighting strong-performing Digital Realty Trust, an operator of data center REITs benefiting from demand for its specialized data-storage and -processing facilities. However, simultaneous overweightings in data center REITs DuPont Fabros Technology and CoreSite Realty – the latter an out-of-benchmark holding – more than offset the negative impact. After DuPont’s large increase, I sold the fund’s position and reinvested proceeds into Digital Realty. During the year, industrial REITs enjoyed strong results, and meaningful underweightings in two such outperformers, Prologis and Duke Realty detracted, even as an overweighting in DCT Industrial Trust – one of the fund’s largest holdings at year end – proved helpful. The fund also benefited from overweighting office REIT Mack-Cali Realty, which so far has been a successful turnaround story. Lastly, a relative overweighting in self-storage REIT Extra Space Storage – another of the fund’s largest positions – detracted, reflecting the underperformance of self-storage REITs.
The views expressed above reflect those of the portfolio manager(s) only through the end of the period as stated on the cover of this report and do not necessarily represent the views of Fidelity or any other person in the Fidelity organization. Any such views are subject to change at any time based upon market or other conditions and Fidelity disclaims any responsibility to update such views. These views may not be relied on as investment advice and, because investment decisions for a Fidelity fund are based on numerous factors, may not be relied on as an indication of trading intent on behalf of any Fidelity fund.
Investment Summary (Unaudited)
Top Ten Stocks as of December 31, 2016
| | % of fund's net assets | % of fund's net assets 6 months ago |
| Simon Property Group, Inc. | 9.8 | 12.0 |
| AvalonBay Communities, Inc. | 5.6 | 4.2 |
| Ventas, Inc. | 5.2 | 5.8 |
| Boston Properties, Inc. | 4.9 | 5.9 |
| Extra Space Storage, Inc. | 4.4 | 4.7 |
| Public Storage | 4.0 | 4.7 |
| Mid-America Apartment Communities, Inc. | 3.7 | 3.6 |
| Urban Edge Properties | 3.3 | 3.3 |
| DCT Industrial Trust, Inc. | 3.1 | 3.4 |
| Essex Property Trust, Inc. | 2.7 | 3.6 |
| | 46.7 | |
Top Five REIT Sectors as of December 31, 2016
| | % of fund's net assets | % of fund's net assets 6 months ago |
| REITs - Apartments | 18.4 | 17.5 |
| REITs - Regional Malls | 14.1 | 15.7 |
| REITs - Office Property | 13.8 | 15.5 |
| REITs - Health Care | 11.1 | 11.7 |
| REITs - Storage | 8.4 | 9.4 |
Asset Allocation (% of fund's net assets)
| As of December 31, 2016 |
| | Stocks | 98.6% |
| | Short-Term Investments and Net Other Assets (Liabilities) | 1.4% |

| As of June 30, 2016 |
| | Stocks | 98.7% |
| | Short-Term Investments and Net Other Assets (Liabilities) | 1.3% |

Investments December 31, 2016
Showing Percentage of Net Assets
| Common Stocks - 98.6% | | | |
| | | Shares | Value |
| Equity Real Estate Investment Trusts (REITs) - 98.6% | | | |
| REITs - Apartments - 18.4% | | | |
| American Homes 4 Rent Class A | | 286,100 | $6,002,378 |
| Apartment Investment & Management Co. Class A | | 270,476 | 12,293,134 |
| AvalonBay Communities, Inc. | | 175,842 | 31,150,410 |
| Equity Residential (SBI) | | 188,770 | 12,149,237 |
| Essex Property Trust, Inc. | | 64,748 | 15,053,910 |
| Mid-America Apartment Communities, Inc. | | 213,917 | 20,946,753 |
| Monogram Residential Trust, Inc. | | 446,200 | 4,827,884 |
| | | | 102,423,706 |
| REITs - Diversified - 7.8% | | | |
| Digital Realty Trust, Inc. | | 22,700 | 2,230,502 |
| Duke Realty LP | | 156,400 | 4,153,984 |
| Equinix, Inc. | | 20,100 | 7,183,941 |
| Forest City Realty Trust, Inc. Class A | | 167,221 | 3,484,886 |
| Liberty Property Trust (SBI) | | 241,300 | 9,531,350 |
| The GEO Group, Inc. | | 60,000 | 2,155,800 |
| Vornado Realty Trust | | 98,510 | 10,281,489 |
| Washington REIT (SBI) | | 128,500 | 4,200,665 |
| | | | 43,222,617 |
| REITs - Health Care - 11.1% | | | |
| Healthcare Realty Trust, Inc. | | 437,200 | 13,255,904 |
| Sabra Health Care REIT, Inc. | | 272,014 | 6,642,582 |
| Ventas, Inc. | | 463,910 | 29,003,653 |
| Welltower, Inc. | | 190,628 | 12,758,732 |
| | | | 61,660,871 |
| REITs - Hotels - 5.9% | | | |
| Ashford Hospitality Prime, Inc. | | 5,797 | 79,129 |
| DiamondRock Hospitality Co. | | 566,000 | 6,525,980 |
| FelCor Lodging Trust, Inc. | | 865,586 | 6,933,344 |
| Host Hotels & Resorts, Inc. | | 651,178 | 12,268,194 |
| Sunstone Hotel Investors, Inc. | | 455,500 | 6,946,375 |
| | | | 32,753,022 |
| REITs - Management/Investment - 4.0% | | | |
| American Assets Trust, Inc. | | 149,401 | 6,436,195 |
| American Tower Corp. | | 25,100 | 2,652,568 |
| Coresite Realty Corp. | | 90,200 | 7,159,174 |
| Empire State Realty Trust, Inc. | | 280,200 | 5,657,238 |
| | | | 21,905,175 |
| REITs - Manufactured Homes - 1.7% | | | |
| Equity Lifestyle Properties, Inc. | | 133,610 | 9,633,281 |
| REITs - Office Property - 13.8% | | | |
| Boston Properties, Inc. | | 214,977 | 27,039,807 |
| Corporate Office Properties Trust (SBI) | | 25,500 | 796,110 |
| Douglas Emmett, Inc. | | 347,800 | 12,715,568 |
| Highwoods Properties, Inc. (SBI) | | 185,900 | 9,482,759 |
| Hudson Pacific Properties, Inc. | | 303,000 | 10,538,340 |
| Mack-Cali Realty Corp. | | 379,100 | 11,001,482 |
| New York (REIT), Inc. | | 159,100 | 1,610,092 |
| VEREIT, Inc. | | 426,300 | 3,606,498 |
| | | | 76,790,656 |
| REITs - Regional Malls - 14.1% | | | |
| General Growth Properties, Inc. | | 294,900 | 7,366,602 |
| Pennsylvania Real Estate Investment Trust (SBI) | | 286,000 | 5,422,560 |
| Simon Property Group, Inc. | | 305,399 | 54,260,239 |
| Taubman Centers, Inc. | | 153,700 | 11,363,041 |
| | | | 78,412,442 |
| REITs - Shopping Centers - 7.3% | | | |
| Brixmor Property Group, Inc. | | 432,900 | 10,571,418 |
| Cedar Shopping Centers, Inc. | | 782,691 | 5,110,972 |
| DDR Corp. | | 421,900 | 6,442,413 |
| Urban Edge Properties | | 665,705 | 18,313,545 |
| | | | 40,438,348 |
| REITs - Storage - 8.4% | | | |
| Extra Space Storage, Inc. | | 316,400 | 24,438,736 |
| Public Storage | | 99,555 | 22,250,543 |
| | | | 46,689,279 |
| REITs - Warehouse/Industrial - 6.1% | | | |
| DCT Industrial Trust, Inc. | | 361,850 | 17,325,378 |
| Prologis, Inc. | | 241,737 | 12,761,296 |
| Terreno Realty Corp. | | 139,881 | 3,985,210 |
| | | | 34,071,884 |
| TOTAL EQUITY REAL ESTATE INVESTMENT TRUSTS (REITS) | | | |
| (Cost $439,774,979) | | | 548,001,281 |
|
| Money Market Funds - 1.0% | | | |
| Fidelity Cash Central Fund, 0.60% (a) | | | |
| (Cost $5,764,360) | | 5,763,207 | 5,764,360 |
| TOTAL INVESTMENT PORTFOLIO - 99.6% | | | |
| (Cost $445,539,339) | | | 553,765,641 |
| NET OTHER ASSETS (LIABILITIES) - 0.4% | | | 2,185,555 |
| NET ASSETS - 100% | | | $555,951,196 |
Legend
(a) Affiliated fund that is generally available only to investment companies and other accounts managed by Fidelity Investments. The rate quoted is the annualized seven-day yield of the fund at period end. A complete unaudited listing of the fund's holdings as of its most recent quarter end is available upon request. In addition, each Fidelity Central Fund's financial statements, which are not covered by the Fund's Report of Independent Registered Public Accounting Firm, are available on the SEC's website or upon request.
Affiliated Central Funds
Information regarding fiscal year to date income earned by the Fund from investments in Fidelity Central Funds is as follows:
| Fund | Income earned |
| Fidelity Cash Central Fund | $30,840 |
| Fidelity Securities Lending Cash Central Fund | 2,827 |
| Total | $33,667 |
Investment Valuation
All investments are categorized as Level 1 under the Fair Value Hierarchy. The inputs or methodology used for valuing securities may not be an indication of the risk associated with investing in those securities. For more information on valuation inputs please refer to the Investment Valuation section in the accompanying Notes to Financial Statements.
See accompanying notes which are an integral part of the financial statements.
Financial Statements
Statement of Assets and Liabilities
| | | December 31, 2016 |
| Assets | | |
Investment in securities, at value — See accompanying schedule:
Unaffiliated issuers (cost $439,774,979) | $548,001,281 | |
| Fidelity Central Funds (cost $5,764,360) | 5,764,360 | |
| Total Investments (cost $445,539,339) | | $553,765,641 |
| Cash | | 254,924 |
| Receivable for investments sold | | 3,097,844 |
| Receivable for fund shares sold | | 480,816 |
| Dividends receivable | | 2,172,021 |
| Distributions receivable from Fidelity Central Funds | | 1,399 |
| Prepaid expenses | | 3,022 |
| Other receivables | | 8,681 |
| Total assets | | 559,784,348 |
| Liabilities | | |
| Payable for investments purchased | $2,454,765 | |
| Payable for fund shares redeemed | 959,585 | |
| Accrued management fee | 250,698 | |
| Distribution and service plan fees payable | 44,950 | |
| Other affiliated payables | 63,119 | |
| Other payables and accrued expenses | 60,035 | |
| Total liabilities | | 3,833,152 |
| Net Assets | | $555,951,196 |
| Net Assets consist of: | | |
| Paid in capital | | $418,624,535 |
| Undistributed net investment income | | 1,726,474 |
| Accumulated undistributed net realized gain (loss) on investments | | 27,373,885 |
| Net unrealized appreciation (depreciation) on investments | | 108,226,302 |
| Net Assets | | $555,951,196 |
| Initial Class: | | |
| Net Asset Value, offering price and redemption price per share ($102,665,863 ÷ 5,080,646 shares) | | $20.21 |
| Service Class: | | |
| Net Asset Value, offering price and redemption price per share ($8,780,721 ÷ 435,915 shares) | | $20.14 |
| Service Class 2: | | |
| Net Asset Value, offering price and redemption price per share ($213,983,968 ÷ 10,744,618 shares) | | $19.92 |
| Investor Class: | | |
| Net Asset Value, offering price and redemption price per share ($230,520,644 ÷ 11,464,460 shares) | | $20.11 |
See accompanying notes which are an integral part of the financial statements.
Statement of Operations
| | | Year ended December 31, 2016 |
| Investment Income | | |
| Dividends | | $11,734,808 |
| Special dividends | | 1,748,560 |
| Income from Fidelity Central Funds | | 33,667 |
| Total income | | 13,517,035 |
| Expenses | | |
| Management fee | $3,012,333 | |
| Transfer agent fees | 554,212 | |
| Distribution and service plan fees | 512,053 | |
| Accounting and security lending fees | 208,051 | |
| Custodian fees and expenses | 34,537 | |
| Independent trustees' fees and expenses | 11,662 | |
| Audit | 50,304 | |
| Legal | 7,744 | |
| Miscellaneous | 6,812 | |
| Total expenses before reductions | 4,397,708 | |
| Expense reductions | (40,376) | 4,357,332 |
| Net investment income (loss) | | 9,159,703 |
| Realized and Unrealized Gain (Loss) | | |
| Net realized gain (loss) on: | | |
| Investment securities: | | |
| Unaffiliated issuers | 31,868,252 | |
| Fidelity Central Funds | (43) | |
| Total net realized gain (loss) | | 31,868,209 |
| Change in net unrealized appreciation (depreciation) on investment securities | | (16,580,487) |
| Net gain (loss) | | 15,287,722 |
| Net increase (decrease) in net assets resulting from operations | | $24,447,425 |
See accompanying notes which are an integral part of the financial statements.
Statement of Changes in Net Assets
| | Year ended December 31, 2016 | Year ended December 31, 2015 |
| Increase (Decrease) in Net Assets | | |
| Operations | | |
| Net investment income (loss) | $9,159,703 | $9,508,712 |
| Net realized gain (loss) | 31,868,209 | 10,463,855 |
| Change in net unrealized appreciation (depreciation) | (16,580,487) | (4,887,060) |
| Net increase (decrease) in net assets resulting from operations | 24,447,425 | 15,085,507 |
| Distributions to shareholders from net investment income | (7,510,703) | (9,395,711) |
| Distributions to shareholders from net realized gain | (5,482,348) | (11,624,079) |
| Total distributions | (12,993,051) | (21,019,790) |
| Share transactions - net increase (decrease) | 23,397,951 | 11,196,306 |
| Total increase (decrease) in net assets | 34,852,325 | 5,262,023 |
| Net Assets | | |
| Beginning of period | 521,098,871 | 515,836,848 |
| End of period | $555,951,196 | $521,098,871 |
| Other Information | | |
| Undistributed net investment income end of period | $1,726,474 | $173,233 |
See accompanying notes which are an integral part of the financial statements.
Financial Highlights — VIP Real Estate Portfolio Initial Class
| Years ended December 31, | 2016 | 2015 | 2014 | 2013 | 2012 |
| Selected Per–Share Data | | | | | |
| Net asset value, beginning of period | $19.61 | $19.73 | $16.35 | $17.22 | $15.02 |
| Income from Investment Operations | | | | | |
| Net investment income (loss)A | .36B | .38 | .35 | .29 | .27 |
| Net realized and unrealized gain (loss) | .74 | .33 | 4.53 | –C | 2.50 |
| Total from investment operations | 1.10 | .71 | 4.88 | .29 | 2.77 |
| Distributions from net investment income | (.30) | (.39) | (.31)D | (.33) | (.25) |
| Distributions from net realized gain | (.20) | (.44) | (1.19)D | (.83) | (.32) |
| Total distributions | (.50) | (.83) | (1.50) | (1.16) | (.57) |
| Net asset value, end of period | $20.21 | $19.61 | $19.73 | $16.35 | $17.22 |
| Total ReturnE,F | 5.75% | 3.71% | 30.18% | 1.82% | 18.57% |
| Ratios to Average Net AssetsG,H | | | | | |
| Expenses before reductions | .67% | .67% | .68% | .69% | .70% |
| Expenses net of fee waivers, if any | .67% | .67% | .68% | .68% | .70% |
| Expenses net of all reductions | .66% | .67% | .67% | .68% | .69% |
| Net investment income (loss) | 1.79%B | 1.92% | 1.84% | 1.61% | 1.58% |
| Supplemental Data | | | | | |
| Net assets, end of period (000 omitted) | $102,666 | $99,804 | $91,749 | $57,396 | $71,364 |
| Portfolio turnover rateI | 65% | 72% | 65% | 59% | 52% |
A Calculated based on average shares outstanding during the period.
B Net Investment income per share reflects a large, non-recurring dividend which amounted to $.06 per share. Excluding this non-recurring dividend, the ratio of net investment income (loss) to average net assets would have been 1.47%.
C Amount represents less than $.005 per share.
D The amounts shown reflect certain reclassifications related to book to tax differences that were made in the year shown.
E Total returns do not reflect charges attributable to your insurance company's separate account. Inclusion of these charges would reduce the total returns shown.
F Total returns would have been lower if certain expenses had not been reduced during the applicable periods shown.
G Fees and expenses of any underlying Fidelity Central Funds are not included in the Fund's expense ratio. The Fund indirectly bears its proportionate share of the expenses of any underlying Fidelity Central Funds.
H Expense ratios reflect operating expenses of the class. Expenses before reductions do not reflect amounts reimbursed by the investment adviser or reductions from brokerage service arrangements or reductions from other expense offset arrangements and do not represent the amount paid by the class during periods when reimbursements or reductions occur. Expenses net of fee waivers reflect expenses after reimbursement by the investment adviser but prior to reductions from brokerage service arrangements or other expense offset arrangements. Expenses net of all reductions represent the net expenses paid by the class.
I Amount does not include the portfolio activity of any underlying Fidelity Central Funds.
See accompanying notes which are an integral part of the financial statements.
Financial Highlights — VIP Real Estate Portfolio Service Class
| Years ended December 31, | 2016 | 2015 | 2014 | 2013 | 2012 |
| Selected Per–Share Data | | | | | |
| Net asset value, beginning of period | $19.56 | $19.68 | $16.32 | $17.20 | $15.00 |
| Income from Investment Operations | | | | | |
| Net investment income (loss)A | .34B | .36 | .33 | .27 | .25 |
| Net realized and unrealized gain (loss) | .74 | .33 | 4.51 | .01C | 2.51 |
| Total from investment operations | 1.08 | .69 | 4.84 | .28 | 2.76 |
| Distributions from net investment income | (.29) | (.37) | (.29)D | (.32) | (.24) |
| Distributions from net realized gain | (.20) | (.44) | (1.19)D | (.83) | (.32) |
| Total distributions | (.50)E | (.81) | (1.48) | (1.16)F | (.56) |
| Net asset value, end of period | $20.14 | $19.56 | $19.68 | $16.32 | $17.20 |
| Total ReturnG,H | 5.63% | 3.61% | 29.98% | 1.73% | 18.49% |
| Ratios to Average Net AssetsI,J | | | | | |
| Expenses before reductions | .77% | .77% | .78% | .78% | .79% |
| Expenses net of fee waivers, if any | .77% | .77% | .78% | .78% | .79% |
| Expenses net of all reductions | .76% | .76% | .77% | .78% | .78% |
| Net investment income (loss) | 1.69%B | 1.82% | 1.75% | 1.52% | 1.49% |
| Supplemental Data | | | | | |
| Net assets, end of period (000 omitted) | $8,781 | $4,060 | $4,056 | $3,255 | $1,634 |
| Portfolio turnover rateK | 65% | 72% | 65% | 59% | 52% |
A Calculated based on average shares outstanding during the period.
B Net Investment income per share reflects a large, non-recurring dividend which amounted to $.06 per share. Excluding this non-recurring dividend, the ratio of net investment income (loss) to average net assets would have been 1.38%.
C The amount shown for a share outstanding does not correspond with the aggregate net gain (loss) on investments for the period due to the timing of sales and repurchases of shares in relation to fluctuating market values of the investments of the Fund.
D The amounts shown reflect certain reclassifications related to book to tax differences that were made in the year shown.
E Total distributions of $.50 per share is comprised of distributions from net investment income of $.292 and distributions from net realized gain of $.204 per share.
F Total distributions of $1.16 per share is comprised of distributions from net investment income of $.324 and distributions from net realized gain of $.833 per share.
G Total returns do not reflect charges attributable to your insurance company's separate account. Inclusion of these charges would reduce the total returns shown.
H Total returns would have been lower if certain expenses had not been reduced during the applicable periods shown.
I Fees and expenses of any underlying Fidelity Central Funds are not included in the Fund's expense ratio. The Fund indirectly bears its proportionate share of the expenses of any underlying Fidelity Central Funds.
J Expense ratios reflect operating expenses of the class. Expenses before reductions do not reflect amounts reimbursed by the investment adviser or reductions from brokerage service arrangements or reductions from other expense offset arrangements and do not represent the amount paid by the class during periods when reimbursements or reductions occur. Expenses net of fee waivers reflect expenses after reimbursement by the investment adviser but prior to reductions from brokerage service arrangements or other expense offset arrangements. Expenses net of all reductions represent the net expenses paid by the class.
K Amount does not include the portfolio activity of any underlying Fidelity Central Funds.
See accompanying notes which are an integral part of the financial statements.
Financial Highlights — VIP Real Estate Portfolio Service Class 2
| Years ended December 31, | 2016 | 2015 | 2014 | 2013 | 2012 |
| Selected Per–Share Data | | | | | |
| Net asset value, beginning of period | $19.35 | $19.47 | $16.16 | $17.03 | $14.86 |
| Income from Investment Operations | | | | | |
| Net investment income (loss)A | .31B | .33 | .30 | .24 | .22 |
| Net realized and unrealized gain (loss) | .72 | .33 | 4.46 | .01C | 2.48 |
| Total from investment operations | 1.03 | .66 | 4.76 | .25 | 2.70 |
| Distributions from net investment income | (.26) | (.34) | (.26)D | (.29) | (.21) |
| Distributions from net realized gain | (.20) | (.44) | (1.19)D | (.83) | (.32) |
| Total distributions | (.46) | (.78) | (1.45) | (1.12) | (.53) |
| Net asset value, end of period | $19.92 | $19.35 | $19.47 | $16.16 | $17.03 |
| Total ReturnE,F | 5.46% | 3.49% | 29.80% | 1.61% | 18.30% |
| Ratios to Average Net AssetsG,H | | | | | |
| Expenses before reductions | .92% | .92% | .93% | .94% | .94% |
| Expenses net of fee waivers, if any | .92% | .92% | .93% | .93% | .94% |
| Expenses net of all reductions | .91% | .91% | .92% | .93% | .93% |
| Net investment income (loss) | 1.54%B | 1.67% | 1.60% | 1.37% | 1.33% |
| Supplemental Data | | | | | |
| Net assets, end of period (000 omitted) | $213,984 | $194,640 | $200,481 | $165,134 | $145,738 |
| Portfolio turnover rateI | 65% | 72% | 65% | 59% | 52% |
A Calculated based on average shares outstanding during the period.
B Net Investment income per share reflects a large, non-recurring dividend which amounted to $.06 per share. Excluding this non-recurring dividend, the ratio of net investment income (loss) to average net assets would have been 1.23%.
C The amount shown for a share outstanding does not correspond with the aggregate net gain (loss) on investments for the period due to the timing of sales and repurchases of shares in relation to fluctuating market values of the investments of the Fund.
D The amounts shown reflect certain reclassifications related to book to tax differences that were made in the year shown.
E Total returns do not reflect charges attributable to your insurance company's separate account. Inclusion of these charges would reduce the total returns shown.
F Total returns would have been lower if certain expenses had not been reduced during the applicable periods shown.
G Fees and expenses of any underlying Fidelity Central Funds are not included in the Fund's expense ratio. The Fund indirectly bears its proportionate share of the expenses of any underlying Fidelity Central Funds.
H Expense ratios reflect operating expenses of the class. Expenses before reductions do not reflect amounts reimbursed by the investment adviser or reductions from brokerage service arrangements or reductions from other expense offset arrangements and do not represent the amount paid by the class during periods when reimbursements or reductions occur. Expenses net of fee waivers reflect expenses after reimbursement by the investment adviser but prior to reductions from brokerage service arrangements or other expense offset arrangements. Expenses net of all reductions represent the net expenses paid by the class.
I Amount does not include the portfolio activity of any underlying Fidelity Central Funds.
See accompanying notes which are an integral part of the financial statements.
Financial Highlights — VIP Real Estate Portfolio Investor Class
| Years ended December 31, | 2016 | 2015 | 2014 | 2013 | 2012 |
| Selected Per–Share Data | | | | | |
| Net asset value, beginning of period | $19.52 | $19.64 | $16.29 | $17.15 | $14.97 |
| Income from Investment Operations | | | | | |
| Net investment income (loss)A | .35B | .36 | .33 | .28 | .25 |
| Net realized and unrealized gain (loss) | .73 | .33 | 4.50 | .01C | 2.49 |
| Total from investment operations | 1.08 | .69 | 4.83 | .29 | 2.74 |
| Distributions from net investment income | (.28) | (.37) | (.30)D | (.32) | (.24) |
| Distributions from net realized gain | (.20) | (.44) | (1.19)D | (.83) | (.32) |
| Total distributions | (.49)E | (.81) | (1.48)F | (1.15) | (.56) |
| Net asset value, end of period | $20.11 | $19.52 | $19.64 | $16.29 | $17.15 |
| Total ReturnG,H | 5.65% | 3.64% | 30.02% | 1.81% | 18.42% |
| Ratios to Average Net AssetsI,J | | | | | |
| Expenses before reductions | .75% | .75% | .76% | .77% | .78% |
| Expenses net of fee waivers, if any | .75% | .75% | .76% | .76% | .78% |
| Expenses net of all reductions | .74% | .74% | .75% | .76% | .77% |
| Net investment income (loss) | 1.71%B | 1.84% | 1.76% | 1.53% | 1.50% |
| Supplemental Data | | | | | |
| Net assets, end of period (000 omitted) | $230,521 | $222,596 | $219,550 | $138,855 | $130,397 |
| Portfolio turnover rateK | 65% | 72% | 65% | 59% | 52% |
A Calculated based on average shares outstanding during the period.
B Net Investment income per share reflects a large, non-recurring dividend which amounted to $.06 per share. Excluding this non-recurring dividend, the ratio of net investment income (loss) to average net assets would have been 1.39%.
C The amount shown for a share outstanding does not correspond with the aggregate net gain (loss) on investments for the period due to the timing of sales and repurchases of shares in relation to fluctuating market values of the investments of the Fund.
D The amounts shown reflect certain reclassifications related to book to tax differences that were made in the year shown.
E Total distributions of $.49 per share is comprised of distributions from net investment income of $.282 and distributions from net realized gain of $.204 per share.
F Total distributions of $1.48 per share is comprised of distributions from net investment income of $.296 and distributions from net realized gain of $1.188 per share.
G Total returns do not reflect charges attributable to your insurance company's separate account. Inclusion of these charges would reduce the total returns shown.
H Total returns would have been lower if certain expenses had not been reduced during the applicable periods shown.
I Fees and expenses of any underlying Fidelity Central Funds are not included in the Fund's expense ratio. The Fund indirectly bears its proportionate share of the expenses of any underlying Fidelity Central Funds.
J Expense ratios reflect operating expenses of the class. Expenses before reductions do not reflect amounts reimbursed by the investment adviser or reductions from brokerage service arrangements or reductions from other expense offset arrangements and do not represent the amount paid by the class during periods when reimbursements or reductions occur. Expenses net of fee waivers reflect expenses after reimbursement by the investment adviser but prior to reductions from brokerage service arrangements or other expense offset arrangements. Expenses net of all reductions represent the net expenses paid by the class.
K Amount does not include the portfolio activity of any underlying Fidelity Central Funds.
See accompanying notes which are an integral part of the financial statements.
Notes to Financial Statements
For the period ended December 31, 2016
1. Organization.
VIP Real Estate Portfolio (the Fund) is a non-diversified fund of Variable Insurance Products Fund IV (the Trust) and is authorized to issue an unlimited number of shares. The Trust is registered under the Investment Company Act of 1940, as amended (the 1940 Act), as an open-end management investment company organized as a Massachusetts business trust. Shares of the Fund may only be purchased by insurance companies for the purpose of funding variable annuity or variable life insurance contracts. The Fund offers the following classes of shares: Initial Class shares, Service Class shares, Service Class 2 shares and Investor Class shares. All classes have equal rights and voting privileges, except for matters affecting a single class.
2. Investments in Fidelity Central Funds.
The Fund invests in Fidelity Central Funds, which are open-end investment companies generally available only to other investment companies and accounts managed by the investment adviser and its affiliates. The Fund's Schedule of Investments lists each of the Fidelity Central Funds held as of period end, if any, as an investment of the Fund, but does not include the underlying holdings of each Fidelity Central Fund. As an Investing Fund, the Fund indirectly bears its proportionate share of the expenses of the underlying Fidelity Central Funds.
The Money Market Central Funds seek preservation of capital and current income and are managed by Fidelity Investments Money Management, Inc. (FIMM), an affiliate of the investment adviser. Annualized expenses of the Money Market Central Funds as of their most recent shareholder report date are less than .005%.
A complete unaudited list of holdings for each Fidelity Central Fund is available upon request or at the Securities and Exchange Commission (the SEC) website at www.sec.gov. In addition, the financial statements of the Fidelity Central Funds, which are not covered by the Fund's Report of Independent Registered Public Accounting Firm, are available on the SEC website or upon request.
3. Significant Accounting Policies.
The financial statements have been prepared in conformity with accounting principles generally accepted in the United States of America (GAAP), which require management to make certain estimates and assumptions at the date of the financial statements. Actual results could differ from those estimates. Subsequent events, if any, through the date that the financial statements were issued have been evaluated in the preparation of the financial statements. The following summarizes the significant accounting policies of the Fund:
Investment Valuation. Investments are valued as of 4:00 p.m. Eastern time on the last calendar day of the period. The Board of Trustees (the Board) has delegated the day to day responsibility for the valuation of the Fund's investments to the Fair Value Committee (the Committee) established by the Fund's investment adviser. In accordance with valuation policies and procedures approved by the Board, the Fund attempts to obtain prices from one or more third party pricing vendors or brokers to value its investments. When current market prices, quotations or currency exchange rates are not readily available or reliable, investments will be fair valued in good faith by the Committee, in accordance with procedures adopted by the Board. Factors used in determining fair value vary by investment type and may include market or investment specific events. The frequency with which these procedures are used cannot be predicted and they may be utilized to a significant extent. The Committee oversees the Fund's valuation policies and procedures and reports to the Board on the Committee's activities and fair value determinations. The Board monitors the appropriateness of the procedures used in valuing the Fund's investments and ratifies the fair value determinations of the Committee.
The Fund categorizes the inputs to valuation techniques used to value its investments into a disclosure hierarchy consisting of three levels as shown below:
- Level 1 – quoted prices in active markets for identical investments
- Level 2 – other significant observable inputs (including quoted prices for similar investments, interest rates, prepayment speeds, etc.)
- Level 3 – unobservable inputs (including the Fund's own assumptions based on the best information available)
Valuation techniques used to value the Fund's investments by major category are as follows:
Equity securities, including restricted securities, for which market quotations are readily available, are valued at the last reported sale price or official closing price as reported by a third party pricing vendor on the primary market or exchange on which they are traded and are categorized as Level 1 in the hierarchy. In the event there were no sales during the day or closing prices are not available, securities are valued at the last quoted bid price or may be valued using the last available price and are generally categorized as Level 2 in the hierarchy. For foreign equity securities, when market or security specific events arise, comparisons to the valuation of American Depositary Receipts (ADRs), futures contracts, Exchange-Traded Funds (ETFs) and certain indexes as well as quoted prices for similar securities may be used and would be categorized as Level 2 in the hierarchy. Utilizing these techniques may result in transfers between Level 1 and Level 2. For equity securities, including restricted securities, where observable inputs are limited, assumptions about market activity and risk are used and these securities may be categorized as Level 3 in the hierarchy.
Investments in open-end mutual funds, including the Fidelity Central Funds, are valued at their closing net asset value (NAV) each business day and are categorized as Level 1 in the hierarchy.
Changes in valuation techniques may result in transfers in or out of an assigned level within the disclosure hierarchy.
Investment Transactions and Income. For financial reporting purposes, the Fund's investment holdings and NAV include trades executed through the end of the last business day of the period. The NAV per share for processing shareholder transactions is calculated as of the close of business of the New York Stock Exchange (NYSE), normally 4:00 p.m. Eastern time and includes trades executed through the end of the prior business day. Gains and losses on securities sold are determined on the basis of identified cost and may include proceeds received from litigation. Dividend income is recorded on the ex-dividend date, except for certain dividends from foreign securities where the ex-dividend date may have passed, which are recorded as soon as the Fund is informed of the ex-dividend date. Non-cash dividends included in dividend income, if any, are recorded at the fair market value of the securities received. Income and capital gain distributions from Fidelity Central Funds, if any, are recorded on the ex-dividend date. Certain distributions received by the Fund represent a return of capital or capital gain. The Fund determines the components of these distributions subsequent to the ex-dividend date, based upon receipt of tax filings or other correspondence relating to the underlying investment. These distributions are recorded as a reduction of cost of investments and/or as a realized gain. Large, non-recurring dividends recognized by the Fund are presented separately on the Statement of Operations as "Special Dividends" and the impact of these dividends is presented in the Financial Highlights.
Class Allocations and Expenses. Investment income, realized and unrealized capital gains and losses, common expenses of the Fund, and certain fund-level expense reductions, if any, are allocated daily on a pro-rata basis to each class based on the relative net assets of each class to the total net assets of the Fund. Each class differs with respect to transfer agent and distribution and service plan fees incurred. Certain expense reductions may also differ by class. For the reporting period, the allocated portion of income and expenses to each class as a percent of its average net assets may vary due to the timing of recording these transactions in relation to fluctuating net assets of the classes. Expenses directly attributable to a fund are charged to that fund. Expenses attributable to more than one fund are allocated among the respective funds on the basis of relative net assets or other appropriate methods. Expense estimates are accrued in the period to which they relate and adjustments are made when actual amounts are known.
Income Tax Information and Distributions to Shareholders. Each year, the Fund intends to qualify as a regulated investment company under Subchapter M of the Internal Revenue Code, including distributing substantially all of its taxable income and realized gains. As a result, no provision for U.S. Federal income taxes is required. As of December 31, 2016, the Fund did not have any unrecognized tax benefits in the financial statements; nor is the Fund aware of any tax positions for which it is reasonably possible that the total amounts of unrecognized tax benefits will significantly change in the next twelve months. The Fund files a U.S. federal tax return, in addition to state and local tax returns as required. The Fund's federal income tax returns are subject to examination by the Internal Revenue Service (IRS) for a period of three fiscal years after they are filed. State and local tax returns may be subject to examination for an additional fiscal year depending on the jurisdiction.
Distributions are declared and recorded on the ex-dividend date. Income dividends and capital gain distributions are declared separately for each class. Income and capital gain distributions are determined in accordance with income tax regulations, which may differ from GAAP.
Capital accounts within the financial statements are adjusted for permanent book-tax differences. These adjustments have no impact on net assets or the results of operations. Capital accounts are not adjusted for temporary book-tax differences which will reverse in a subsequent period.
Book-tax differences are primarily due to short-term capital gains and losses deferred due to wash sales and excise tax regulations.
The federal tax cost of investment securities and unrealized appreciation (depreciation) as of period end were as follows:
| Gross unrealized appreciation | $114,505,513 |
| Gross unrealized depreciation | (8,645,189) |
| Net unrealized appreciation (depreciation) on securities | $105,860,324 |
| Tax Cost | $447,905,317 |
The tax-based components of distributable earnings as of period end were as follows:
| Undistributed ordinary income | $1,711,359 |
| Undistributed long-term capital gain | $32,576,203 |
| Net unrealized appreciation (depreciation) on securities and other investments | $105,860,324 |
The Fund intends to elect to defer to its next fiscal year $2,836,339 of capital losses recognized during the period November 1, 2016 to December 31, 2016.
The tax character of distributions paid was as follows:
| | December 31, 2016 | December 31, 2015 |
| Ordinary Income | $10,428,962 | $ 9,480,663 |
| Long-term Capital Gains | 2,564,089 | 11,539,127 |
| Total | $12,993,051 | $ 21,019,790 |
4. Purchases and Sales of Investments.
Purchases and sales of securities, other than short-term securities, aggregated $384,303,185 and $352,779,988, respectively.
5. Fees and Other Transactions with Affiliates.
Management Fee. Fidelity SelectCo, LLC (the investment adviser) and its affiliates provide the Fund with investment management related services for which the Fund pays a monthly management fee. The management fee is the sum of an individual fund fee rate that is based on an annual rate of .30% of the Fund's average net assets and an annualized group fee rate that averaged .25% during the period. The group fee rate is based upon the average net assets of all the mutual funds advised by Fidelity Management & Research Company (FMR) and the investment adviser. The group fee rate decreases as assets under management increase and increases as assets under management decrease. For the reporting period, the total annual management fee rate was .55% of the Fund's average net assets.
Distribution and Service Plan Fees. In accordance with Rule 12b-1 of the 1940 Act, the Fund has adopted separate 12b-1 Plans for each Service Class of shares. Each Service Class pays Fidelity Distributors Corporation (FDC), an affiliate of the investment adviser, a service fee. For the period, the service fee is based on an annual rate of .10% of Service Class' average net assets and .25% of Service Class 2's average net assets.
For the period, total fees, all of which were re-allowed to insurance companies for the distribution of shares and providing shareholder support services, were as follows:
| Service Class | $5,704 |
| Service Class 2 | 506,349 |
| | $512,053 |
Transfer Agent Fees. Fidelity Investments Institutional Operations Company, Inc. (FIIOC), an affiliate of the investment adviser, is the Fund's transfer, dividend disbursing, and shareholder servicing agent. FIIOC receives an asset-based fee with respect to each class. Each class (with the exception of Investor Class) pays a fee for transfer agent services, typesetting, and printing and mailing of shareholder reports, excluding mailing of proxy statements, equal to an annual rate of .07% (.15% for Investor Class) of class-level average net assets. For the period, transfer agent fees for each class were as follows:
| Initial Class | $69,020 |
| Service Class | 3,764 |
| Service Class 2 | 133,676 |
| Investor Class | 347,752 |
| | $554,212 |
Accounting and Security Lending Fees. Fidelity Service Company, Inc. (FSC), an affiliate of the investment adviser, maintains the Fund's accounting records. The accounting fee is based on the level of average net assets for each month. Under a separate contract, FSC administers the security lending program. The security lending fee is based on the number and duration of lending transactions.
Brokerage Commissions. The Fund placed a portion of its portfolio transactions with brokerage firms which are affiliates of the investment adviser. Brokerage commissions are included in net realized gain (loss) and change in net unrealized appreciation (depreciation) in the Statement of Operations. The commissions paid to these affiliated firms were $4,721 for the period.
Interfund Trades. The Fund may purchase from or sell securities to other Fidelity Funds under procedures adopted by the Board. The procedures have been designed to ensure these interfund trades are executed in accordance with Rule 17a-7 of the 1940 Act. Interfund trades are included within the respective purchases and sales amounts shown in the Purchases and Sales of Investments note.
6. Committed Line of Credit.
The Fund participates with other funds managed by the investment adviser or an affiliate in a $4.25 billion credit facility (the "line of credit") to be utilized for temporary or emergency purposes to fund shareholder redemptions or for other short-term liquidity purposes. The Fund has agreed to pay commitment fees on its pro-rata portion of the line of credit, which amounted to $1,395 and is reflected in Miscellaneous expenses on the Statement of Operations. During the period, the Fund did not borrow on this line of credit.
7. Security Lending.
The Fund lends portfolio securities through a lending agent from time to time in order to earn additional income. On the settlement date of the loan, the Fund receives collateral (in the form of U.S. Treasury obligations, letters of credit and/or cash) against the loaned securities and maintains collateral in an amount not less than 100% of the market value of the loaned securities during the period of the loan. The market value of the loaned securities is determined at the close of business of the Fund and any additional required collateral is delivered to the Fund on the next business day. The Fund or borrower may terminate the loan at any time, and if the borrower defaults on its obligation to return the securities loaned because of insolvency or other reasons, the Fund may apply collateral received from the borrower against the obligation. The Fund may experience delays and costs in recovering the securities loaned. Any cash collateral received is invested in the Fidelity Securities Lending Cash Central Fund. At period end, there were no security loans outstanding. Security lending income represents the income earned on investing cash collateral, less rebates paid to borrowers and any lending agent fees associated with the loan, plus any premium payments received for lending certain types of securities. Security lending income is presented in the Statement of Operations as a component of income from Fidelity Central Funds. Total security lending income during the period amounted to $2,827.
8. Expense Reductions.
Commissions paid to certain brokers with whom the investment adviser, or its affiliates, places trades on behalf of the Fund include an amount in addition to trade execution, which may be rebated back to the Fund to offset certain expenses. This amount totaled $36,650 for the period. In addition, through arrangements with the Fund's custodian, credits realized as a result of certain uninvested cash balances were used to reduce the Fund's expenses. During the period, these credits reduced the Fund's custody expenses by $43.
In addition, during the period the investment adviser reimbursed and/or waived a portion of fund-level operating expenses in the amount of $3,683.
9. Distributions to Shareholders.
Distributions to shareholders of each class were as follows:
| | Year ended
December 31, 2016 | Year ended
December 31, 2015 |
| From net investment income | | |
| Initial Class | $1,479,452 | $1,876,785 |
| Service Class | 122,867 | 74,715 |
| Service Class 2 | 2,720,253 | 3,396,742 |
| Investor Class | 3,188,131 | 4,047,469 |
| Total | $7,510,703 | $9,395,711 |
| From net realized gain | | |
| Initial Class | $1,022,548 | $2,154,318 |
| Service Class | 65,959 | 87,715 |
| Service Class 2 | 2,089,069 | 4,463,646 |
| Investor Class | 2,304,772 | 4,918,400 |
| Total | $5,482,348 | $11,624,079 |
10. Share Transactions.
Transactions for each class of shares were as follows:
| | Shares | Shares | Dollars | Dollars |
| | Year ended
December 31, 2016 | Year ended December 31, 2015 | Year ended
December 31, 2016 | Year ended December 31, 2015 |
| Initial Class | | | | |
| Shares sold | 912,880 | 1,580,142 | $18,825,356 | $32,090,007 |
| Reinvestment of distributions | 129,764 | 210,726 | 2,502,000 | 4,031,103 |
| Shares redeemed | (1,051,234) | (1,352,422) | (21,038,349) | (26,706,157) |
| Net increase (decrease) | (8,590) | 438,446 | $289,007 | $9,414,953 |
| Service Class | | | | |
| Shares sold | 378,336 | 50,439 | $7,872,935 | $993,059 |
| Reinvestment of distributions | 9,704 | 8,517 | 188,826 | 162,430 |
| Shares redeemed | (159,632) | (57,538) | (3,149,906) | (1,157,937) |
| Net increase (decrease) | 228,408 | 1,418 | $4,911,855 | $(2,448) |
| Service Class 2 | | | | |
| Shares sold | 3,592,079 | 3,606,249 | $73,409,037 | $70,363,168 |
| Reinvestment of distributions | 253,108 | 416,191 | 4,809,322 | 7,860,388 |
| Shares redeemed | (3,162,022) | (4,258,625) | (63,089,300) | (82,542,395) |
| Net increase (decrease) | 683,165 | (236,185) | $15,129,059 | $(4,318,839) |
| Investor Class | | | | |
| Shares sold | 1,914,454 | 2,482,401 | $40,035,719 | $50,545,190 |
| Reinvestment of distributions | 286,439 | 470,583 | 5,492,903 | 8,965,869 |
| Shares redeemed | (2,141,295) | (2,729,055) | (42,460,592) | (53,408,419) |
| Net increase (decrease) | 59,598 | 223,929 | $3,068,030 | $6,102,640 |
11. Other.
The Fund's organizational documents provide former and current trustees and officers with a limited indemnification against liabilities arising in connection with the performance of their duties to the Fund. In the normal course of business, the Fund may also enter into contracts that provide general indemnifications. The Fund's maximum exposure under these arrangements is unknown as this would be dependent on future claims that may be made against the Fund. The risk of material loss from such claims is considered remote.
At the end of the period, the investment adviser or its affiliates were the owners of record of 51% of the total outstanding shares of the Fund and one otherwise unaffiliated shareholder was the owner of record of 28% of the total outstanding shares of the Fund.
Report of Independent Registered Public Accounting Firm
To the Trustees of Variable Insurance Products Fund IV and Shareholders of VIP Real Estate Portfolio:
In our opinion, the accompanying statement of assets and liabilities, including the schedule of investments, and the related statements of operations and of changes in net assets and the financial highlights present fairly, in all material respects, the financial position of VIP Real Estate Portfolio (a fund of Variable Insurance Products Fund IV) (the "Fund") as of December 31, 2016, the results of its operations for the year then ended, the changes in its net assets for each of the two years in the period then ended and the financial highlights for each of the five years in the period then ended, in conformity with accounting principles generally accepted in the United States of America. These financial statements and financial highlights (hereafter referred to as “financial statements”) are the responsibility of the Fund's management. Our responsibility is to express an opinion on these financial statements based on our audits. We conducted our audits of these financial statements in accordance with the standards of the Public Company Accounting Oversight Board (United States). Those standards require that we plan and perform the audit to obtain reasonable assurance about whether the financial statements are free of material misstatement. An audit includes examining, on a test basis, evidence supporting the amounts and disclosures in the financial statements, assessing the accounting principles used and significant estimates made by management, and evaluating the overall financial statement presentation. We believe that our audits, which included confirmation of securities as of December 31, 2016 by correspondence with the custodian and brokers, provide a reasonable basis for our opinion.
PricewaterhouseCoopers LLP
Boston, Massachusetts
February 16, 2017
Trustees and Officers
The Trustees, Members of the Advisory Board (if any), and officers of the trust and fund, as applicable, are listed below. The Board of Trustees governs the fund and is responsible for protecting the interests of shareholders. The Trustees are experienced executives who meet periodically throughout the year to oversee the fund's activities, review contractual arrangements with companies that provide services to the fund, oversee management of the risks associated with such activities and contractual arrangements, and review the fund's performance. Each of the Trustees oversees 83 funds.
The Trustees hold office without limit in time except that (a) any Trustee may resign; (b) any Trustee may be removed by written instrument, signed by at least two-thirds of the number of Trustees prior to such removal; (c) any Trustee who requests to be retired or who has become incapacitated by illness or injury may be retired by written instrument signed by a majority of the other Trustees; and (d) any Trustee may be removed at any special meeting of shareholders by a two-thirds vote of the outstanding voting securities of the trust. Each Trustee who is not an interested person (as defined in the 1940 Act) of the trust and the fund is referred to herein as an Independent Trustee. Each Independent Trustee shall retire not later than the last day of the calendar year in which his or her 75th birthday occurs. The Independent Trustees may waive this mandatory retirement age policy with respect to individual Trustees. Officers and Advisory Board Members hold office without limit in time, except that any officer or Advisory Board Member may resign or may be removed by a vote of a majority of the Trustees at any regular meeting or any special meeting of the Trustees. Except as indicated, each individual has held the office shown or other offices in the same company for the past five years.
The fund’s Statement of Additional Information (SAI) includes more information about the Trustees. To request a free copy, call Fidelity at 1-877-208-0098.
Experience, Skills, Attributes, and Qualifications of the Trustees. The Governance and Nominating Committee has adopted a statement of policy that describes the experience, qualifications, attributes, and skills that are necessary and desirable for potential Independent Trustee candidates (Statement of Policy). The Board believes that each Trustee satisfied at the time he or she was initially elected or appointed a Trustee, and continues to satisfy, the standards contemplated by the Statement of Policy. The Governance and Nominating Committee also engages professional search firms to help identify potential Independent Trustee candidates who have the experience, qualifications, attributes, and skills consistent with the Statement of Policy. From time to time, additional criteria based on the composition and skills of the current Independent Trustees, as well as experience or skills that may be appropriate in light of future changes to board composition, business conditions, and regulatory or other developments, have also been considered by the professional search firms and the Governance and Nominating Committee. In addition, the Board takes into account the Trustees' commitment and participation in Board and committee meetings, as well as their leadership of standing and ad hoc committees throughout their tenure.
In determining that a particular Trustee was and continues to be qualified to serve as a Trustee, the Board has considered a variety of criteria, none of which, in isolation, was controlling. The Board believes that, collectively, the Trustees have balanced and diverse experience, qualifications, attributes, and skills, which allow the Board to operate effectively in governing the fund and protecting the interests of shareholders. Information about the specific experience, skills, attributes, and qualifications of each Trustee, which in each case led to the Board's conclusion that the Trustee should serve (or continue to serve) as a trustee of the fund, is provided below.
Board Structure and Oversight Function. Brian B. Hogan is an interested person and currently serves as Chairman. The Trustees have determined that an interested Chairman is appropriate and benefits shareholders because an interested Chairman has a personal and professional stake in the quality and continuity of services provided to the fund. Independent Trustees exercise their informed business judgment to appoint an individual of their choosing to serve as Chairman, regardless of whether the Trustee happens to be independent or a member of management. The Independent Trustees have determined that they can act independently and effectively without having an Independent Trustee serve as Chairman and that a key structural component for assuring that they are in a position to do so is for the Independent Trustees to constitute a substantial majority for the Board. The Independent Trustees also regularly meet in executive session. Michael E. Wiley serves as Chairman of the Independent Trustees and as such (i) acts as a liaison between the Independent Trustees and management with respect to matters important to the Independent Trustees and (ii) with management prepares agendas for Board meetings.
Fidelity® funds are overseen by different Boards of Trustees. The fund's Board oversees Fidelity's sector portfolios. Other Boards oversee Fidelity's equity and high income funds, and Fidelity's investment grade bond, money market, and asset allocation funds. The use of separate Boards, each with its own committee structure, allows the Trustees of each group of Fidelity® funds to focus on the unique issues of the funds they oversee, including common research, investment, and operational issues. On occasion, the separate Boards establish joint committees to address issues of overlapping consequences for the Fidelity® funds overseen by each Board.
The Trustees operate using a system of committees to facilitate the timely and efficient consideration of all matters of importance to the Trustees, the fund, and fund shareholders and to facilitate compliance with legal and regulatory requirements and oversight of the fund's activities and associated risks. The Board, acting through its committees, has charged SelectCo and its affiliates with (i) identifying events or circumstances the occurrence of which could have demonstrably adverse effects on the fund's business and/or reputation; (ii) implementing processes and controls to lessen the possibility that such events or circumstances occur or to mitigate the effects of such events or circumstances if they do occur; and (iii) creating and maintaining a system designed to evaluate continuously business and market conditions in order to facilitate the identification and implementation processes described in (i) and (ii) above. Because the day-to-day operations and activities of the fund are carried out by or through SelectCo, its affiliates, and other service providers, the fund's exposure to risks is mitigated but not eliminated by the processes overseen by the Trustees. While each of the Board's committees has responsibility for overseeing different aspects of the fund's activities, oversight is exercised primarily through the Operations and Audit Committees. Appropriate personnel, including but not limited to the fund's Chief Compliance Officer (CCO), SelectCo's internal auditor, the independent accountants, the fund's Treasurer and portfolio management personnel, make periodic reports to the Board's committees, as appropriate. The responsibilities of each standing committee, including their oversight responsibilities, are described further under "Standing Committees of the Trustees."
Interested Trustees*:
Correspondence intended for a Trustee who is an interested person may be sent to Fidelity Investments, 245 Summer Street, Boston, Massachusetts 02210.
Name, Year of Birth; Principal Occupations and Other Relevant Experience+
Brian B. Hogan (1964)
Year of Election or Appointment: 2014
Trustee
Chairman of the Board of Trustees
Mr. Hogan also serves as Trustee or Vice President of other funds. Mr. Hogan serves as a Director of FMR Investment Management (UK) Limited (investment adviser firm, 2015-present) and Fidelity SelectCo, LLC (investment adviser firm, 2014-present) and President of the Equity Division of FMR (investment adviser firm, 2009-present). Previously, Mr. Hogan served as Senior Vice President, Equity Research of FMR (2006-2009) and as a portfolio manager. Mr. Brian B. Hogan is not related to Mr. Colm A. Hogan.
* Determined to be an "Interested Trustee" by virtue of, among other things, his or her affiliation with the trust or various entities under common control with SelectCo.
+ The information includes the Trustee's principal occupation during the last five years and other information relating to the experience, attributes, and skills relevant to the Trustee's qualifications to serve as a Trustee, which led to the conclusion that the Trustee should serve as a Trustee for the fund.
Independent Trustees:
Correspondence intended for an Independent Trustee may be sent to Fidelity Investments, P.O. Box 55235, Boston, Massachusetts 02205-5235.
Name, Year of Birth; Principal Occupations and Other Relevant Experience+
David A. Rosow (1942)
Year of Election or Appointment: 2013
Trustee
Mr. Rosow also serves as Trustee of other Fidelity® funds. Prior to his retirement in 2006, Mr. Rosow was the Chief Executive Officer, owner and operator of a number of private companies, which encompassed the oil refining, drilling and marketing of petroleum products (including specialty petroleum products), recreation industry, and real estate development. Mr. Rosow currently serves as a Director of Oxbow Carbon LLC (upgraders, marketers, and distributors of petroleum byproducts of the oil refining process, 2015-present) and Oxbridge Academy of the Palm Beaches (2015-present) and serves as its President and CEO. Previously, Mr. Rosow served on the Fairfield Country Day School Board for 27 years, including as its President for 3 years, stepping down in 2006. Mr. Rosow served as Lead Director and Chairman of the Audit Committee of Hudson United Bancorp (1996-2006), Chairman of the Board of Westport Bank and Trust (1992-1996), and as a Director of TD Banknorth (2006-2007). In addition, Mr. Rosow served as a member (2008-2014) and President (2009-2014) of the Town Council of Palm Beach, Florida. Mr. Rosow also served as a Member of the Advisory Board of certain Fidelity® funds (2012-2013).
Garnett A. Smith (1947)
Year of Election or Appointment: 2013
Trustee
Mr. Smith also serves as Trustee of other Fidelity® funds. Prior to Mr. Smith's retirement, he served as Chairman and Chief Executive Officer of Inbrand Corp. (manufacturer of personal absorbent products, 1990-1997). He also served as President (1986-1990) of Inbrand Corp. Prior to his employment with Inbrand Corp., he was employed by a retail fabric chain and North Carolina National Bank. In addition, Mr. Smith served as a Member of the Advisory Board of certain Fidelity® funds (2012-2013) and as a board member of the Jackson Hole Land Trust (2009-2012).
Michael E. Wiley (1950)
Year of Election or Appointment: 2008
Trustee
Chairman of the Independent Trustees
Mr. Wiley also serves as Trustee of other Fidelity® funds. Mr. Wiley serves as a Director of Tesoro Corporation (independent oil refiner and marketer, 2005-present), a Director of Tesoro Logistics LP (natural resources logistics, 2015-present), and a Director of Bill Barrett Corporation (exploration and production, 2005-present). In addition, Mr. Wiley also serves as a Director of Post Oak Bank (privately-held bank, 2004-present). Previously, Mr. Wiley served as a Trustee of other Fidelity® funds (2008-2013), as a Director of Asia Pacific Exploration Consolidated (international oil and gas exploration and production, 2008-2013), as a member of the Board of Trustees of the University of Tulsa (2000-2006; 2007-2010), as a Senior Energy Advisor of Katzenbach Partners, LLC (consulting, 2006-2007), as an Advisory Director of Riverstone Holdings (private investment), Chairman, President, and CEO of Baker Hughes, Inc. (oilfield services, 2000-2004), and as Director of Spinnaker Exploration Company (exploration and production, 2001-2005).
+ The information includes the Trustee's principal occupation during the last five years and other information relating to the experience, attributes, and skills relevant to the Trustee's qualifications to serve as a Trustee, which led to the conclusion that the Trustee should serve as a Trustee for the fund.
Advisory Board Members and Officers:
Correspondence intended for a Member of the Advisory Board may be sent to Fidelity Investments, P.O. Box 55235, Boston, Massachusetts 02205-5235. Except for Anthony R. Rochte, correspondence intended for an officer may be sent to Fidelity Investments, 245 Summer Street, Boston, Massachusetts 02210. Correspondence intended for Mr. Rochte may be sent to SelectCo, 1225 17th Street, Denver, Colorado 80202-5541. Officers appear below in alphabetical order.
Name, Year of Birth; Principal Occupation
Donald F. Donahue (1950)
Year of Election or Appointment: 2015
Member of the Advisory Board
Mr. Donahue also serves as a Trustee or Member of the Advisory Board of other Fidelity® funds. Mr. Donahue is President and Chief Executive Officer of Miranda Partners, LLC (risk consulting for the financial services industry, 2012-present) and a consultant for the Institute for Defense Analyses (national security, 2012-present). Previously, Mr. Donahue served as Chief Executive Officer (2006-2012), Chief Operating Officer (2003-2006), and Managing Director, Customer Marketing and Development (1999-2003) of The Depository Trust & Clearing Corporation (financial markets infrastructure). Mr. Donahue serves as a Member (2012-present) and Co-Chairman (2016-present) of the Board of Directors of United Way of New York, Member of the Board of Directors of NYC Leadership Academy (2012-present) and Member of the Board of Advisors of Ripple Labs, Inc. (financial services, 2015-present). He also served as Chairman (2010-2012) and Member of the Board of Directors (2012-2013) of Omgeo, LLC (financial services), Treasurer of United Way of New York (2012-2016), and Member of the Board of Directors of XBRL US (financial services non-profit, 2009-2012) and the International Securities Services Association (2009-2012).
Carol B. Tomé (1957)
Year of Election or Appointment: 2017
Member of the Advisory Board
Ms. Tomé also serves as Trustee or Member of the Advisory Board of other Fidelity® funds. Ms. Tomé is Chief Financial Officer (2001-present) and Executive Vice President of Corporate Services (2007-present) of The Home Depot, Inc. (home improvement retailer) and a Director (2003-present) and Chair of the Audit Committee (2004-present) of United Parcel Service, Inc. (package delivery and supply chain management). Previously, Ms. Tomé served as Senior Vice President of Finance and Accounting/Treasurer (2000-2007) and Vice President and Treasurer (1995-2000) of The Home Depot, Inc. and Chair of the Board (2010-2012), Vice Chair of the Board (2009 and 2013), and a Director (2008-2013) of the Federal Reserve Bank of Atlanta. Ms. Tomé is also a director or trustee of many community and professional organizations.
Marc R. Bryant (1966)
Year of Election or Appointment: 2013
Secretary and Chief Legal Officer (CLO)
Mr. Bryant also serves as Secretary and CLO of other funds. Mr. Bryant serves as CLO, Secretary, and Senior Vice President of Fidelity Management & Research Company (investment adviser firm, 2015-present) and FMR Co., Inc. (investment adviser firm, 2015-present); Secretary of Fidelity SelectCo, LLC (investment adviser firm, 2015-present) and Fidelity Investments Money Management, Inc. (investment adviser firm, 2015-present); and CLO of Fidelity Management & Research (Hong Kong) Limited and FMR Investment Management (UK) Limited (investment adviser firms, 2015-present) and Fidelity Management & Research (Japan) Limited (investment adviser firm, 2016-present). He is Senior Vice President and Deputy General Counsel of FMR LLC (diversified financial services company). Previously, Mr. Bryant served as Secretary and CLO of Fidelity Rutland Square Trust II (2010-2014) and Assistant Secretary of Fidelity's Fixed Income and Asset Allocation Funds (2013-2015). Prior to joining Fidelity Investments, Mr. Bryant served as a Senior Vice President and the Head of Global Retail Legal for AllianceBernstein L.P. (2006-2010), and as the General Counsel for ProFund Advisors LLC (2001-2006).
Jeffrey S. Christian (1961)
Year of Election or Appointment: 2016
Assistant Treasurer
Mr. Christian also serves as Assistant Treasurer of other funds. Mr. Christian is an employee of Fidelity Investments (2003-present).
William C. Coffey (1969)
Year of Election or Appointment: 2009
Assistant Secretary
Mr. Coffey also serves as Assistant Secretary of other funds. He is Senior Vice President and Deputy General Counsel of FMR LLC (diversified financial services company, 2010-present), and is an employee of Fidelity Investments. Previously, Mr. Coffey served as Vice President and Associate General Counsel of FMR LLC (2005-2009).
Jonathan Davis (1968)
Year of Election or Appointment: 2010
Assistant Treasurer
Mr. Davis also serves as Assistant Treasurer of other funds, and is an employee of Fidelity Investments. Previously, Mr. Davis served as Vice President and Associate General Counsel of FMR LLC (diversified financial services company, 2003-2010).
Adrien E. Deberghes (1967)
Year of Election or Appointment: 2013
President and Treasurer
Mr. Deberghes also serves as an officer of other funds. He serves as Executive Vice President of Fidelity Investments Money Management, Inc. (FIMM) (investment adviser firm, 2016-present) and is an employee of Fidelity Investments (2008-present). Prior to joining Fidelity Investments, Mr. Deberghes was Senior Vice President of Mutual Fund Administration at State Street Corporation (2007-2008), Senior Director of Mutual Fund Administration at Investors Bank & Trust (2005-2007), and Director of Finance for Dunkin' Brands (2000-2005). Previously, Mr. Deberghes served in other fund officer roles.
Joseph DeSantis (1959)
Year of Election or Appointment: 2015
Vice President
Mr. DeSantis also serves as Vice President of other funds. Mr. DeSantis serves as a Director of Fidelity Management & Research (Japan) Limited (investment adviser firm, 2016-present), Chief Investment Officer, Equities (2010-present) and is an employee of Fidelity Investments.
Stephanie J. Dorsey (1969)
Year of Election or Appointment: 2010
Assistant Treasurer
Ms. Dorsey also serves as an officer of other funds. She is an employee of Fidelity Investments (2008-present) and has served in other fund officer roles. Prior to joining Fidelity Investments, Ms. Dorsey served as Treasurer (2004-2008) of the JPMorgan Mutual Funds and Vice President (2004-2008) of JPMorgan Chase Bank.
Howard J. Galligan III (1966)
Year of Election or Appointment: 2014
Chief Financial Officer
Mr. Galligan also serves as Chief Financial Officer of other funds. Mr. Galligan serves as President of Fidelity Pricing and Cash Management Services (FPCMS) (2014-present) and as a Director of Strategic Advisers, Inc. (investment adviser firm, 2008-present). Previously, Mr. Galligan served as Chief Administrative Officer of Asset Management (2011-2014) and Chief Operating Officer and Senior Vice President of Investment Support for Strategic Advisers, Inc. (2003-2011).
Scott C. Goebel (1968)
Year of Election or Appointment: 2015
Vice President
Mr. Goebel serves as Vice President of other funds and is an employee of Fidelity Investments (2001-present). Previously, Mr. Goebel served as Senior Vice President of Fidelity Management & Research Company (FMR) (investment adviser firm, 2016), Secretary of Fidelity SelectCo, LLC (investment adviser firm, 2013-2015), Fidelity Investments Money Management, Inc. (FIMM) (investment adviser firm, 2010-2015), and Fidelity Research and Analysis Company (FRAC) (investment adviser firm, 2010-2015); General Counsel, Secretary, and Senior Vice President of FMR (investment adviser firm, 2008-2015) and FMR Co., Inc. (investment adviser firm, 2008-2015); Assistant Secretary of Fidelity Management & Research (Japan) Limited (investment adviser firm, 2008-2015) and Fidelity Management & Research (U.K.) Inc. (investment adviser firm, 2008-2015); Chief Legal Officer (CLO) of Fidelity Management & Research (Hong Kong) Limited (investment adviser firm, 2008-2015); Secretary and CLO of certain Fidelity® funds (2008-2015); Assistant Secretary of FIMM (2008-2010), FRAC (2008-2010), and certain funds (2007-2008); and as Vice President and Secretary of Fidelity Distributors Corporation (FDC) (2005-2007).
James D. Gryglewicz (1972)
Year of Election or Appointment: 2014
Chief Compliance Officer
Mr. Gryglewicz also serves as Chief Compliance Officer of other funds. Mr. Gryglewicz serves as Compliance Officer of Strategic Advisers, Inc. (investment adviser firm, 2015-present) and Fidelity SelectCo, LLC (investment adviser firm, 2014-present), Senior Vice President of Asset Management Compliance (2009-present), and is an employee of Fidelity Investments (2004-present).
Brian B. Hogan (1964)
Year of Election or Appointment: 2009
Vice President
Mr. Hogan also serves as Trustee or Vice President of other funds. Mr. Hogan serves as a Director of FMR Investment Management (UK) Limited (investment adviser firm, 2015-present) and Fidelity SelectCo, LLC (investment adviser firm, 2014-present) and President of the Equity Division of FMR (investment adviser firm, 2009-present). Previously, Mr. Hogan served as Senior Vice President, Equity Research of FMR (2006-2009) and as a portfolio manager. Mr. Brian B. Hogan is not related to Mr. Colm A. Hogan.
Colm A. Hogan (1973)
Year of Election or Appointment: 2016
Assistant Treasurer
Mr. Hogan also serves as an officer of other funds. Mr. Hogan is an employee of Fidelity Investments (2005-present). Mr. Colm A. Hogan is not related to Mr. Brian B. Hogan.
Chris Maher (1972)
Year of Election or Appointment: 2013
Assistant Treasurer
Mr. Maher serves as Assistant Treasurer of other funds. Mr. Maher is Vice President of Valuation Oversight and is an employee of Fidelity Investments. Previously, Mr. Maher served as Vice President of Asset Management Compliance (2013), Vice President of the Program Management Group of FMR (investment adviser firm, 2010-2013), and Vice President of Valuation Oversight (2008-2010).
John F. Papandrea (1972)
Year of Election or Appointment: 2016
Anti-Money Laundering (AML) Officer
Mr. Papandrea also serves as AML Officer of other funds. Mr. Papandrea is Vice President of FMR LLC (diversified financial services company, 2008-present) and is an employee of Fidelity Investments (2005-present).
Anthony R. Rochte (1968)
Year of Election or Appointment: 2013
Vice President
Mr. Rochte also serves as Vice President of other funds. Mr. Rochte serves as President of Fidelity SelectCo, LLC (investment adviser firm, 2012-present) and is an employee of Fidelity Investments (2012-present). Prior to joining Fidelity Investments, Mr. Rochte served as Senior Managing Director and head of State Street Global Advisors' North American Intermediary Business Group (2006-2012).
Stacie M. Smith (1974)
Year of Election or Appointment: 2013
Assistant Treasurer
Ms. Smith also serves as an officer of other funds. She is an employee of Fidelity Investments (2009-present) and has served in other fund officer roles. Prior to joining Fidelity Investments, Ms. Smith served as Senior Audit Manager of Ernst & Young LLP (accounting firm, 1996-2009). Previously, Ms. Smith served as Deputy Treasurer of certain Fidelity® funds (2013-2016).
Marc L. Spector (1972)
Year of Election or Appointment: 2017
Assistant Treasurer
Mr. Spector also serves as an officer of other funds. Mr. Spector is an employee of Fidelity Investments (2016-present). Prior to joining Fidelity Investments, Mr. Spector served as Director at the Siegfried Group (accounting firm, 2013-2016), and prior to Siegfried Group as audit senior manager at Deloitte & Touche (accounting firm, 2005-2013).
Renee Stagnone (1975)
Year of Election or Appointment: 2016
Assistant Treasurer
Ms. Stagnone also serves as an officer of other funds. Ms. Stagnone is an employee of Fidelity Investments (1997-present). Previously, Ms. Stagnone served as Deputy Treasurer of certain Fidelity® funds (2013-2016).
Shareholder Expense Example
As a shareholder of the Fund, you incur two types of costs: (1) transaction costs and (2) ongoing costs, including management fees, distribution and/or service (12b-1) fees and other Fund expenses. This Example is intended to help you understand your ongoing costs (in dollars) of investing in the Fund and to compare these costs with the ongoing costs of investing in other mutual funds.
The Example is based on an investment of $1,000 invested at the beginning of the period and held for the entire period (July 1, 2016 to December 31, 2016).
Actual Expenses
The first line of the accompanying table for each class of the Fund provides information about actual account values and actual expenses. You may use the information in this line, together with the amount you invested, to estimate the expenses that you paid over the period. Simply divide your account value by $1,000.00 (for example, an $8,600 account value divided by $1,000.00 = 8.6), then multiply the result by the number in the first line for a class of the Fund under the heading entitled "Expenses Paid During Period" to estimate the expenses you paid on your account during this period. The estimate of expenses does not include any fees or other expenses of any variable annuity or variable life insurance product. If they were, the estimate of expenses you paid during the period would be higher, and your ending account value would be lower. In addition, the Fund, as a shareholder in the underlying Fidelity Central Funds, will indirectly bear its pro-rata share of the fees and expenses incurred by the underlying Fidelity Central Funds. These fees and expenses are not included in the Fund's annualized expense ratio used to calculate the expense estimate in the table below.
Hypothetical Example for Comparison Purposes
The second line of the accompanying table for each class of the Fund provides information about hypothetical account values and hypothetical expenses based on a Class' actual expense ratio and an assumed rate of return of 5% per year before expenses, which is not the Class' actual return. The hypothetical account values and expenses may not be used to estimate the actual ending account balance or expenses you paid for the period. You may use this information to compare the ongoing costs of investing in the Fund and other funds. To do so, compare this 5% hypothetical example with the 5% hypothetical examples that appear in the shareholder reports of the other funds. The estimate of expenses does not include any fees or other expenses of any variable annuity or variable life insurance product. If they were, the estimate of expenses you paid during the period would be higher, and your ending account value would be lower. In addition, the Fund, as a shareholder in the underlying Fidelity Central Funds, will indirectly bear its pro-rata share of the fees and expenses incurred by the underlying Fidelity Central Funds. These fees and expenses are not included in the Fund's annualized expense ratio used to calculate the expense estimate in the table below.
Please note that the expenses shown in the table are meant to highlight your ongoing costs only and do not reflect any transaction costs. Therefore, the second line of the table is useful in comparing ongoing costs only, and will not help you determine the relative total costs of owning different funds.
| | Annualized Expense Ratio-A | Beginning
Account Value
July 1, 2016 | Ending
Account Value
December 31, 2016 | Expenses Paid
During Period-B
July 1, 2016
to December 31, 2016 |
| Initial Class | .67% | | | |
| Actual | | $1,000.00 | $955.30 | $3.29 |
| Hypothetical-C | | $1,000.00 | $1,021.77 | $3.40 |
| Service Class | .77% | | | |
| Actual | | $1,000.00 | $954.40 | $3.78 |
| Hypothetical-C | | $1,000.00 | $1,021.27 | $3.91 |
| Service Class 2 | .92% | | | |
| Actual | | $1,000.00 | $954.10 | $4.52 |
| Hypothetical-C | | $1,000.00 | $1,020.51 | $4.67 |
| Investor Class | .75% | | | |
| Actual | | $1,000.00 | $954.80 | $3.69 |
| Hypothetical-C | | $1,000.00 | $1,021.37 | $3.81 |
A Annualized expense ratio reflects expenses net of applicable fee waivers.
B Expenses are equal to each Class' annualized expense ratio, multiplied by the average account value over the period, multiplied by 184/366 (to reflect the one-half year period).
C 5% return per year before expenses
Distributions (Unaudited)
The Board of Trustees of VIP Real Estate Portfolio voted to pay to shareholders of record at the opening of business on record date, the following distributions per share derived from capital gains realized from sales of portfolio securities, and dividends derived from net investment income:
| | Pay Date | Record Date | Dividends | Capital Gains |
| VIP Real Estate Portfolio | | | | |
| Initial Class | 02/10/17 | 02/10/17 | $0.068 | $1.189 |
| Service Class | 02/10/17 | 02/10/17 | $0.065 | $1.189 |
| Service Class 2 | 02/10/17 | 02/10/17 | $0.061 | $1.189 |
| Investor Class | 02/10/17 | 02/10/17 | $0.066 | $1.189 |
|
The fund hereby designates as a capital gain dividend with respect to the taxable year ended December 31, 2016, $32,576,202, or, if subsequently determined to be different, the net capital gain of such year.
VIPRE-ANN-0217
1.781992.114
Fidelity® Variable Insurance Products: Industrials Portfolio
Annual Report December 31, 2016 |
|
Contents
To view a fund's proxy voting guidelines and proxy voting record for the 12-month period ended June 30, visit http://www.fidelity.com/proxyvotingresults or visit the Securities and Exchange Commission's (SEC) web site at http://www.sec.gov.
You may also call 1-877-208-0098 to request a free copy of the proxy voting guidelines.
Fidelity® Variable Insurance Products are separate account options which are purchased through a variable insurance contract.
Standard & Poor's, S&P and S&P 500 are registered service marks of The McGraw-Hill Companies, Inc. and have been licensed for use by Fidelity Distributors Corporation.
Other third-party marks appearing herein are the property of their respective owners.
All other marks appearing herein are registered or unregistered trademarks or service marks of FMR LLC or an affiliated company. © 2017 FMR LLC. All rights reserved.
This report and the financial statements contained herein are submitted for the general information of the shareholders of the Fund. This report is not authorized for distribution to prospective investors in the Fund unless preceded or accompanied by an effective prospectus.
A fund files its complete schedule of portfolio holdings with the SEC for the first and third quarters of each fiscal year on Form N-Q. Forms N-Q are available on the SEC’s web site at http://www.sec.gov. A fund's Forms N-Q may be reviewed and copied at the SEC’s Public Reference Room in Washington, DC. Information regarding the operation of the SEC's Public Reference Room may be obtained by calling 1-800-SEC-0330.
For a complete list of a fund's portfolio holdings, view the most recent holdings listing, semiannual report, or annual report on Fidelity's web site at http://www.fidelity.com, http://www.institutional.fidelity.com, or http://www.401k.com, as applicable.
NOT FDIC INSURED •MAY LOSE VALUE •NO BANK GUARANTEE
Neither the Fund nor Fidelity Distributors Corporation is a bank.
Performance: The Bottom Line
Average annual total return reflects the change in the value of an investment, assuming reinvestment of distributions from dividend income and capital gains (the profits earned upon the sale of securities that have grown in value, if any) and assuming a constant rate of performance each year. During periods of reimbursement by Fidelity, a fund’s total return will be greater than it would be had the reimbursement not occurred. Performance numbers are net of all underlying fund operating expenses, but do not include any insurance charges imposed by your insurance company’s separate account. If performance information included the effect of these additional charges, the total returns would have been lower. How a fund did yesterday is no guarantee of how it will do tomorrow.
Average Annual Total Returns
| For the periods ended December 31, 2016 | Past 1 year | Past 5 years | Past 10 years |
| Initial Class | 15.87% | 15.13% | 9.69% |
| Investor Class | 15.73% | 15.02% | 9.59% |
$10,000 Over 10 Years
Let's say hypothetically that $10,000 was invested in VIP Industrials Portfolio - Initial Class on December 31, 2006.
The chart shows how the value of your investment would have changed, and also shows how the S&P 500® Index performed over the same period.

| Period Ending Values |
| $25,209 | VIP Industrials Portfolio - Initial Class |
| $19,572 | S&P 500® Index |
Management's Discussion of Fund Performance
Market Recap: The S&P 500
® index returned 11.96% in 2016, rising sharply on post-election optimism for economic growth. The year began during a fairly volatile stretch, with stocks hampered by persistent oil-price weakness and U.S.-dollar strength. Markets regained momentum in February amid U.S. job gains, a rally in energy and other stimuli that helped keep the roughly seven-year uptrend intact. Markets tumbled briefly following the U.K.’s June 23 vote to exit the European Union – dubbed “Brexit” – then recovered quickly and settled into a flattish stretch until the November 8 U.S. presidential election. Stocks reacted to the outcome by reaching a series of all-time highs. For the year, energy (+27%) led the way amid two strong rallies in commodity prices, one in the spring and another in November. Telecommunication services (+23%) was close behind, as demand for dividend-paying equities was high early in the period. Cyclical sectors, including financials (+22%), industrials (+18%) and materials (+17%), also posted strong gains. Conversely, consumer staples (+5%) and consumer discretionary (+6%) lagged the index, the latter hurt as online competition continued to pressure brick-and-mortar retailers. Real estate (+3%) struggled due to expectations for rising interest rates, while health care (-2%) was hampered by an uncertain political and regulatory outlook.
Comments from Portfolio Manager Tobias Welo: For the year, the fund’s share classes recorded gains of roughly 16%, trailing the 20.43% return of the MSCI U.S. IMI Industrials 25/50 Index, but topping the S&P 500
®. Versus the MSCI sector index, positioning in industrial machinery and construction machinery & heavy trucks detracted, as did a sizable underweighting in the strong-performing railroads group. Ametek, a large overweighting for the fund, also was its largest relative detractor. Shares of the maker of electronic instruments and motors for aerospace, power and industrial markets struggled this period, as some of the company’s customers faced challenges from lower sales to the oil & gas and metals industries. A sizable non-index stake in Netherlands-based commercial aircraft and engine lessor AerCap Holdings also hampered relative results, and I sold the stock from the fund. Overweighting Southwest Airlines also detracted. Conversely, stock picking in trucking added value, mainly due to our significant overweighting in J.B. Hunt Transport Services, which I considered to be “best in class” among freight haulers. J.B. Hunt finished the year as our top individual contributor. Our position here returned roughly 34%, most of which occurred in the month following the U.S. presidential election. A large overweighting in HD Supply Holdings also paid off.
The views expressed above reflect those of the portfolio manager(s) only through the end of the period as stated on the cover of this report and do not necessarily represent the views of Fidelity or any other person in the Fidelity organization. Any such views are subject to change at any time based upon market or other conditions and Fidelity disclaims any responsibility to update such views. These views may not be relied on as investment advice and, because investment decisions for a Fidelity fund are based on numerous factors, may not be relied on as an indication of trading intent on behalf of any Fidelity fund.
Investment Summary (Unaudited)
Top Ten Stocks as of December 31, 2016
| | % of fund's net assets | % of fund's net assets 6 months ago |
| General Electric Co. | 10.9 | 13.5 |
| Honeywell International, Inc. | 5.2 | 5.8 |
| United Technologies Corp. | 4.6 | 4.8 |
| General Dynamics Corp. | 4.5 | 3.8 |
| J.B. Hunt Transport Services, Inc. | 3.9 | 4.1 |
| Caterpillar, Inc. | 3.7 | 2.9 |
| Northrop Grumman Corp. | 3.7 | 3.8 |
| AECOM | 3.1 | 4.2 |
| Southwest Airlines Co. | 2.9 | 3.1 |
| Norfolk Southern Corp. | 2.8 | 0.0 |
| | 45.3 | |
Top Industries (% of fund's net assets)
| As of December 31, 2016 |
| | Aerospace & Defense | 20.7% |
| | Machinery | 19.1% |
| | Industrial Conglomerates | 17.3% |
| | Road & Rail | 9.7% |
| | Electrical Equipment | 7.8% |
| | All Others* | 25.4% |

* Includes short-term investments and net other assets (liabilities).
| As of June 30, 2016 |
| | Aerospace & Defense | 29.8% |
| | Industrial Conglomerates | 20.3% |
| | Machinery | 13.6% |
| | Electrical Equipment | 5.2% |
| | Road & Rail | 5.0% |
| | All Others* | 26.1% |

Prior period industry classifications reflect the categories in place as of the date indicated and have not been adjusted to reflect current industry classifications.
* Includes short-term investments and net other assets (liabilities).
Percentages shown as 0.0% may reflect amounts less than 0.05%.
Investments December 31, 2016
Showing Percentage of Net Assets
| Common Stocks - 97.3% | | | |
| | | Shares | Value |
| Aerospace & Defense - 20.7% | | | |
| Aerospace & Defense - 20.7% | | | |
| Astronics Corp. (a) | | 25,100 | $849,384 |
| Astronics Corp. Class B | | 1,590 | 53,583 |
| BWX Technologies, Inc. | | 16,800 | 666,960 |
| General Dynamics Corp. | | 50,300 | 8,684,798 |
| Hexcel Corp. | | 53,700 | 2,762,328 |
| Huntington Ingalls Industries, Inc. | | 8,500 | 1,565,615 |
| Northrop Grumman Corp. | | 30,600 | 7,116,948 |
| Raytheon Co. | | 33,400 | 4,742,800 |
| Teledyne Technologies, Inc. (a) | | 27,878 | 3,428,994 |
| TransDigm Group, Inc. | | 5,700 | 1,419,072 |
| United Technologies Corp. | | 81,023 | 8,881,741 |
| | | | 40,172,223 |
| Airlines - 3.5% | | | |
| Airlines - 3.5% | | | |
| Southwest Airlines Co. | | 113,100 | 5,636,904 |
| Spirit Airlines, Inc. (a) | | 21,200 | 1,226,632 |
| | | | 6,863,536 |
| Building Products - 3.2% | | | |
| Building Products - 3.2% | | | |
| A.O. Smith Corp. | | 46,184 | 2,186,812 |
| Fortune Brands Home & Security, Inc. | | 44,500 | 2,378,970 |
| Masco Corp. | | 53,500 | 1,691,670 |
| | | | 6,257,452 |
| Commercial Services & Supplies - 5.5% | | | |
| Commercial Printing - 0.4% | | | |
| Deluxe Corp. | | 10,200 | 730,422 |
| Diversified Support Services - 2.1% | | | |
| Cintas Corp. | | 15,500 | 1,791,180 |
| KAR Auction Services, Inc. | | 54,000 | 2,301,480 |
| | | | 4,092,660 |
| Environmental & Facility Services - 1.6% | | | |
| Stericycle, Inc. (a) | | 12,300 | 947,592 |
| Team, Inc. (a) | | 54,600 | 2,143,050 |
| | | | 3,090,642 |
| Office Services & Supplies - 1.4% | | | |
| West Corp. | | 112,206 | 2,778,221 |
|
| TOTAL COMMERCIAL SERVICES & SUPPLIES | | | 10,691,945 |
|
| Construction & Engineering - 4.4% | | | |
| Construction & Engineering - 4.4% | | | |
| AECOM (a) | | 164,132 | 5,967,840 |
| Dycom Industries, Inc. (a)(b) | | 20,800 | 1,670,032 |
| Fluor Corp. | | 18,000 | 945,360 |
| | | | 8,583,232 |
| Electrical Equipment - 7.8% | | | |
| Electrical Components & Equipment - 7.3% | | | |
| Acuity Brands, Inc. | | 7,900 | 1,823,794 |
| AMETEK, Inc. | | 96,000 | 4,665,600 |
| Eaton Corp. PLC | | 38,300 | 2,569,547 |
| Fortive Corp. | | 74,092 | 3,973,554 |
| Regal Beloit Corp. | | 15,600 | 1,080,300 |
| | | | 14,112,795 |
| Heavy Electrical Equipment - 0.5% | | | |
| TPI Composites, Inc. (b) | | 67,580 | 1,083,983 |
|
| TOTAL ELECTRICAL EQUIPMENT | | | 15,196,778 |
|
| Industrial Conglomerates - 17.3% | | | |
| Industrial Conglomerates - 17.3% | | | |
| General Electric Co. | | 667,646 | 21,097,614 |
| Honeywell International, Inc. | | 87,527 | 10,140,003 |
| Roper Technologies, Inc. | | 12,400 | 2,270,192 |
| | | | 33,507,809 |
| Machinery - 19.1% | | | |
| Construction Machinery & Heavy Trucks - 9.0% | | | |
| Allison Transmission Holdings, Inc. | | 122,500 | 4,127,025 |
| Caterpillar, Inc. | | 77,800 | 7,215,172 |
| PACCAR, Inc. | | 32,500 | 2,076,750 |
| Wabtec Corp. (b) | | 48,700 | 4,043,074 |
| | | | 17,462,021 |
| Industrial Machinery - 10.1% | | | |
| Colfax Corp. (a) | | 30,600 | 1,099,458 |
| Flowserve Corp. | | 47,700 | 2,291,985 |
| IDEX Corp. | | 23,640 | 2,129,018 |
| Illinois Tool Works, Inc. | | 6,800 | 832,728 |
| Ingersoll-Rand PLC | | 54,600 | 4,097,184 |
| Pentair PLC | | 29,400 | 1,648,458 |
| Rexnord Corp. (a) | | 117,100 | 2,293,989 |
| Snap-On, Inc. | | 15,500 | 2,654,685 |
| TriMas Corp. (a) | | 110,962 | 2,607,607 |
| | | | 19,655,112 |
|
| TOTAL MACHINERY | | | 37,117,133 |
|
| Professional Services - 1.1% | | | |
| Human Resource & Employment Services - 0.5% | | | |
| Robert Half International, Inc. | | 19,200 | 936,576 |
| Research & Consulting Services - 0.6% | | | |
| IHS Markit Ltd. (a) | | 35,400 | 1,253,514 |
|
| TOTAL PROFESSIONAL SERVICES | | | 2,190,090 |
|
| Road & Rail - 9.7% | | | |
| Railroads - 4.4% | | | |
| CSX Corp. | | 83,300 | 2,992,969 |
| Norfolk Southern Corp. | | 50,400 | 5,446,728 |
| | | | 8,439,697 |
| Trucking - 5.3% | | | |
| J.B. Hunt Transport Services, Inc. | | 77,746 | 7,546,804 |
| Old Dominion Freight Lines, Inc. (a) | | 26,500 | 2,273,435 |
| YRC Worldwide, Inc. (a) | | 37,800 | 501,984 |
| | | | 10,322,223 |
|
| TOTAL ROAD & RAIL | | | 18,761,920 |
|
| Trading Companies & Distributors - 4.5% | | | |
| Trading Companies & Distributors - 4.5% | | | |
| HD Supply Holdings, Inc. (a) | | 80,900 | 3,439,059 |
| MSC Industrial Direct Co., Inc. Class A | | 18,300 | 1,690,737 |
| Univar, Inc. (a) | | 84,600 | 2,400,102 |
| Wolseley PLC | | 20,791 | 1,269,211 |
| | | | 8,799,109 |
| Water Utilities - 0.5% | | | |
| Water Utilities - 0.5% | | | |
| AquaVenture Holdings Ltd. | | 40,900 | 1,003,277 |
| TOTAL COMMON STOCKS | | | |
| (Cost $157,187,784) | | | 189,144,504 |
|
| Money Market Funds - 4.5% | | | |
| Fidelity Cash Central Fund, 0.60% (c) | | 5,637,040 | 5,638,168 |
| Fidelity Securities Lending Cash Central Fund 0.65% (c)(d) | | 3,021,222 | 3,021,523 |
| TOTAL MONEY MARKET FUNDS | | | |
| (Cost $8,659,333) | | | 8,659,691 |
| TOTAL INVESTMENT PORTFOLIO - 101.8% | | | |
| (Cost $165,847,117) | | | 197,804,195 |
| NET OTHER ASSETS (LIABILITIES) - (1.8)% | | | (3,514,784) |
| NET ASSETS - 100% | | | $194,289,411 |
Legend
(a) Non-income producing
(b) Security or a portion of the security is on loan at period end.
(c) Affiliated fund that is generally available only to investment companies and other accounts managed by Fidelity Investments. The rate quoted is the annualized seven-day yield of the fund at period end. A complete unaudited listing of the fund's holdings as of its most recent quarter end is available upon request. In addition, each Fidelity Central Fund's financial statements, which are not covered by the Fund's Report of Independent Registered Public Accounting Firm, are available on the SEC's website or upon request.
(d) Investment made with cash collateral received from securities on loan.
Affiliated Central Funds
Information regarding fiscal year to date income earned by the Fund from investments in Fidelity Central Funds is as follows:
| Fund | Income earned |
| Fidelity Cash Central Fund | $12,944 |
| Fidelity Securities Lending Cash Central Fund | 2,506 |
| Total | $15,450 |
Investment Valuation
The following is a summary of the inputs used, as of December 31, 2016, involving the Fund's assets and liabilities carried at fair value. The inputs or methodology used for valuing securities may not be an indication of the risk associated with investing in those securities. For more information on valuation inputs, and their aggregation into the levels used below, please refer to the Investment Valuation section in the accompanying Notes to Financial Statements.
| | Valuation Inputs at Reporting Date: |
| Description | Total | Level 1 | Level 2 | Level 3 |
| Investments in Securities: | | | | |
| Common Stocks | $189,144,504 | $187,875,293 | $1,269,211 | $-- |
| Money Market Funds | 8,659,691 | 8,659,691 | -- | -- |
| Total Investments in Securities: | $197,804,195 | $196,534,984 | $1,269,211 | $-- |
See accompanying notes which are an integral part of the financial statements.
Financial Statements
Statement of Assets and Liabilities
| | | December 31, 2016 |
| Assets | | |
Investment in securities, at value (including securities loaned of $2,925,423) — See accompanying schedule:
Unaffiliated issuers (cost $157,187,784) | $189,144,504 | |
| Fidelity Central Funds (cost $8,659,333) | 8,659,691 | |
| Total Investments (cost $165,847,117) | | $197,804,195 |
| Receivable for fund shares sold | | 277,945 |
| Dividends receivable | | 228,970 |
| Distributions receivable from Fidelity Central Funds | | 4,267 |
| Prepaid expenses | | 785 |
| Other receivables | | 1,675 |
| Total assets | | 198,317,837 |
| Liabilities | | |
| Payable for investments purchased | $851,057 | |
| Payable for fund shares redeemed | 10 | |
| Accrued management fee | 85,910 | |
| Other affiliated payables | 26,435 | |
| Other payables and accrued expenses | 43,489 | |
| Collateral on Securities Loaned | 3,021,525 | |
| Total liabilities | | 4,028,426 |
| Net Assets | | $194,289,411 |
| Net Assets consist of: | | |
| Paid in capital | | $154,419,611 |
| Undistributed net investment income | | 233,516 |
| Accumulated undistributed net realized gain (loss) on investments and foreign currency transactions | | 7,679,206 |
| Net unrealized appreciation (depreciation) on investments | | 31,957,078 |
| Net Assets | | $194,289,411 |
| Initial Class: | | |
| Net Asset Value, offering price and redemption price per share ($42,322,126 ÷ 2,027,075 shares) | | $20.88 |
| Investor Class: | | |
| Net Asset Value, offering price and redemption price per share ($151,967,285 ÷ 7,323,834 shares) | | $20.75 |
See accompanying notes which are an integral part of the financial statements.
Statement of Operations
| | | Year ended December 31, 2016 |
| Investment Income | | |
| Dividends | | $2,446,797 |
| Income from Fidelity Central Funds | | 15,450 |
| Total income | | 2,462,247 |
| Expenses | | |
| Management fee | $827,845 | |
| Transfer agent fees | 193,349 | |
| Accounting and security lending fees | 58,794 | |
| Custodian fees and expenses | 15,905 | |
| Independent trustees' fees and expenses | 3,149 | |
| Audit | 41,644 | |
| Legal | 3,105 | |
| Miscellaneous | 1,875 | |
| Total expenses before reductions | 1,145,666 | |
| Expense reductions | (5,512) | 1,140,154 |
| Net investment income (loss) | | 1,322,093 |
| Realized and Unrealized Gain (Loss) | | |
| Net realized gain (loss) on: | | |
| Investment securities: | | |
| Unaffiliated issuers | 8,047,241 | |
| Fidelity Central Funds | (87) | |
| Foreign currency transactions | 65 | |
| Total net realized gain (loss) | | 8,047,219 |
Change in net unrealized appreciation (depreciation) on:
Investment securities | 12,638,806 | |
| Assets and liabilities in foreign currencies | 63 | |
| Total change in net unrealized appreciation (depreciation) | | 12,638,869 |
| Net gain (loss) | | 20,686,088 |
| Net increase (decrease) in net assets resulting from operations | | $22,008,181 |
See accompanying notes which are an integral part of the financial statements.
Statement of Changes in Net Assets
| | Year ended December 31, 2016 | Year ended December 31, 2015 |
| Increase (Decrease) in Net Assets | | |
| Operations | | |
| Net investment income (loss) | $1,322,093 | $1,198,734 |
| Net realized gain (loss) | 8,047,219 | 13,789,945 |
| Change in net unrealized appreciation (depreciation) | 12,638,869 | (18,122,864) |
| Net increase (decrease) in net assets resulting from operations | 22,008,181 | (3,134,185) |
| Distributions to shareholders from net investment income | (1,088,641) | (1,228,504) |
| Distributions to shareholders from net realized gain | (13,584,564) | (15,311,972) |
| Total distributions | (14,673,205) | (16,540,476) |
| Share transactions - net increase (decrease) | 40,670,901 | (6,897,803) |
| Redemption fees | 20,824 | 11,974 |
| Total increase (decrease) in net assets | 48,026,701 | (26,560,490) |
| Net Assets | | |
| Beginning of period | 146,262,710 | 172,823,200 |
| End of period | $194,289,411 | $146,262,710 |
| Other Information | | |
| Undistributed net investment income end of period | $233,516 | $– |
See accompanying notes which are an integral part of the financial statements.
Financial Highlights — VIP Industrials Portfolio Initial Class
| Years ended December 31, | 2016 | 2015 | 2014 | 2013 | 2012 |
| Selected Per–Share Data | | | | | |
| Net asset value, beginning of period | $20.25 | $22.92 | $22.17 | $16.88 | $14.29 |
| Income from Investment Operations | | | | | |
| Net investment income (loss)A | .18 | .17 | .18 | .17 | .21 |
| Net realized and unrealized gain (loss) | 2.50 | (.55) | 1.17 | 6.48 | 2.62 |
| Total from investment operations | 2.68 | (.38) | 1.35 | 6.65 | 2.83 |
| Distributions from net investment income | (.13) | (.18) | (.20) | (.16) | (.24) |
| Distributions from net realized gain | (1.92) | (2.11) | (.40) | (1.20) | – |
| Total distributions | (2.05) | (2.29) | (.60) | (1.36) | (.24) |
| Redemption fees added to paid in capitalA,B | – | – | – | – | – |
| Net asset value, end of period | $20.88 | $20.25 | $22.92 | $22.17 | $16.88 |
| Total ReturnC,D | 15.87% | (1.89)% | 6.21% | 39.80% | 19.82% |
| Ratios to Average Net AssetsE,F | | | | | |
| Expenses before reductions | .70% | .69% | .69% | .72% | .74% |
| Expenses net of fee waivers, if any | .70% | .69% | .69% | .72% | .74% |
| Expenses net of all reductions | .69% | .69% | .69% | .72% | .73% |
| Net investment income (loss) | .94% | .83% | .81% | .84% | 1.30% |
| Supplemental Data | | | | | |
| Net assets, end of period (000 omitted) | $42,322 | $35,852 | $46,692 | $55,234 | $31,784 |
| Portfolio turnover rateG | 62% | 69% | 70% | 64% | 80% |
A Calculated based on average shares outstanding during the period.
B Amount represents less than $.005 per share.
C Total returns do not reflect charges attributable to your insurance company's separate account. Inclusion of these charges would reduce the total returns shown.
D Total returns would have been lower if certain expenses had not been reduced during the applicable periods shown.
E Fees and expenses of any underlying Fidelity Central Funds are not included in the Fund's expense ratio. The Fund indirectly bears its proportionate share of the expenses of any underlying Fidelity Central Funds.
F Expense ratios reflect operating expenses of the class. Expenses before reductions do not reflect amounts reimbursed by the investment adviser or reductions from brokerage service arrangements or reductions from other expense offset arrangements and do not represent the amount paid by the class during periods when reimbursements or reductions occur. Expenses net of fee waivers reflect expenses after reimbursement by the investment adviser but prior to reductions from brokerage service arrangements or other expense offset arrangements. Expenses net of all reductions represent the net expenses paid by the class.
G Amount does not include the portfolio activity of any underlying Fidelity Central Funds.
See accompanying notes which are an integral part of the financial statements.
Financial Highlights — VIP Industrials Portfolio Investor Class
| Years ended December 31, | 2016 | 2015 | 2014 | 2013 | 2012 |
| Selected Per–Share Data | | | | | |
| Net asset value, beginning of period | $20.15 | $22.82 | $22.07 | $16.81 | $14.24 |
| Income from Investment Operations | | | | | |
| Net investment income (loss)A | .16 | .16 | .16 | .15 | .19 |
| Net realized and unrealized gain (loss) | 2.48 | (.56) | 1.17 | 6.46 | 2.61 |
| Total from investment operations | 2.64 | (.40) | 1.33 | 6.61 | 2.80 |
| Distributions from net investment income | (.12) | (.17) | (.18) | (.15) | (.23) |
| Distributions from net realized gain | (1.92) | (2.11) | (.40) | (1.20) | – |
| Total distributions | (2.04) | (2.27)B | (.58) | (1.35) | (.23) |
| Redemption fees added to paid in capitalA,C | – | – | – | – | – |
| Net asset value, end of period | $20.75 | $20.15 | $22.82 | $22.07 | $16.81 |
| Total ReturnD,E | 15.73% | (1.97)% | 6.16% | 39.72% | 19.65% |
| Ratios to Average Net AssetsF,G | | | | | |
| Expenses before reductions | .78% | .77% | .77% | .80% | .82% |
| Expenses net of fee waivers, if any | .78% | .77% | .77% | .80% | .82% |
| Expenses net of all reductions | .77% | .77% | .77% | .79% | .81% |
| Net investment income (loss) | .86% | .76% | .73% | .77% | 1.22% |
| Supplemental Data | | | | | |
| Net assets, end of period (000 omitted) | $151,967 | $110,411 | $126,131 | $136,117 | $49,596 |
| Portfolio turnover rateH | 62% | 69% | 70% | 64% | 80% |
A Calculated based on average shares outstanding during the period.
B Total distributions of $2.27 per share is comprised of distributions from net investment income of $.166 and distributions from net realized gain of $2.105 per share.
C Amount represents less than $.005 per share.
D Total returns do not reflect charges attributable to your insurance company's separate account. Inclusion of these charges would reduce the total returns shown.
E Total returns would have been lower if certain expenses had not been reduced during the applicable periods shown.
F Fees and expenses of any underlying Fidelity Central Funds are not included in the Fund's expense ratio. The Fund indirectly bears its proportionate share of the expenses of any underlying Fidelity Central Funds.
G Expense ratios reflect operating expenses of the class. Expenses before reductions do not reflect amounts reimbursed by the investment adviser or reductions from brokerage service arrangements or reductions from other expense offset arrangements and do not represent the amount paid by the class during periods when reimbursements or reductions occur. Expenses net of fee waivers reflect expenses after reimbursement by the investment adviser but prior to reductions from brokerage service arrangements or other expense offset arrangements. Expenses net of all reductions represent the net expenses paid by the class.
H Amount does not include the portfolio activity of any underlying Fidelity Central Funds.
See accompanying notes which are an integral part of the financial statements.
Notes to Financial Statements
For the period ended December 31, 2016
1. Organization.
VIP Industrials Portfolio (the Fund) is a non-diversified fund of Variable Insurance Products Fund IV (the Trust) and is authorized to issue an unlimited number of shares. The Trust is registered under the Investment Company Act of 1940, as amended (the 1940 Act), as an open-end management investment company organized as a Massachusetts business trust. Shares of the Fund may only be purchased by insurance companies for the purpose of funding variable annuity or variable life insurance contracts. The Fund offers the following classes of shares: Initial Class shares and Investor Class shares. All classes have equal rights and voting privileges, except for matters affecting a single class.
2. Investments in Fidelity Central Funds.
The Fund invests in Fidelity Central Funds, which are open-end investment companies generally available only to other investment companies and accounts managed by the investment adviser and its affiliates. The Fund's Schedule of Investments lists each of the Fidelity Central Funds held as of period end, if any, as an investment of the Fund, but does not include the underlying holdings of each Fidelity Central Fund. As an Investing Fund, the Fund indirectly bears its proportionate share of the expenses of the underlying Fidelity Central Funds.
The Money Market Central Funds seek preservation of capital and current income and are managed by Fidelity Investments Money Management, Inc. (FIMM), an affiliate of the investment adviser. Annualized expenses of the Money Market Central Funds as of their most recent shareholder report date are less than .005%.
A complete unaudited list of holdings for each Fidelity Central Fund is available upon request or at the Securities and Exchange Commission (the SEC) website at www.sec.gov. In addition, the financial statements of the Fidelity Central Funds, which are not covered by the Fund's Report of Independent Registered Public Accounting Firm, are available on the SEC website or upon request.
3. Significant Accounting Policies.
The financial statements have been prepared in conformity with accounting principles generally accepted in the United States of America (GAAP), which require management to make certain estimates and assumptions at the date of the financial statements. Actual results could differ from those estimates. Subsequent events, if any, through the date that the financial statements were issued have been evaluated in the preparation of the financial statements. The following summarizes the significant accounting policies of the Fund:
Investment Valuation. Investments are valued as of 4:00 p.m. Eastern time on the last calendar day of the period. The Board of Trustees (the Board) has delegated the day to day responsibility for the valuation of the Fund's investments to the Fair Value Committee (the Committee) established by the Fund's investment adviser. In accordance with valuation policies and procedures approved by the Board, the Fund attempts to obtain prices from one or more third party pricing vendors or brokers to value its investments. When current market prices, quotations or currency exchange rates are not readily available or reliable, investments will be fair valued in good faith by the Committee, in accordance with procedures adopted by the Board. Factors used in determining fair value vary by investment type and may include market or investment specific events. The frequency with which these procedures are used cannot be predicted and they may be utilized to a significant extent. The Committee oversees the Fund's valuation policies and procedures and reports to the Board on the Committee's activities and fair value determinations. The Board monitors the appropriateness of the procedures used in valuing the Fund's investments and ratifies the fair value determinations of the Committee.
The Fund categorizes the inputs to valuation techniques used to value its investments into a disclosure hierarchy consisting of three levels as shown below:
- Level 1 – quoted prices in active markets for identical investments
- Level 2 – other significant observable inputs (including quoted prices for similar investments, interest rates, prepayment speeds, etc.)
- Level 3 – unobservable inputs (including the Fund's own assumptions based on the best information available)
Valuation techniques used to value the Fund's investments by major category are as follows:
Equity securities, including restricted securities, for which market quotations are readily available, are valued at the last reported sale price or official closing price as reported by a third party pricing vendor on the primary market or exchange on which they are traded and are categorized as Level 1 in the hierarchy. In the event there were no sales during the day or closing prices are not available, securities are valued at the last quoted bid price or may be valued using the last available price and are generally categorized as Level 2 in the hierarchy. For foreign equity securities, when market or security specific events arise, comparisons to the valuation of American Depositary Receipts (ADRs), futures contracts, Exchange-Traded Funds (ETFs) and certain indexes as well as quoted prices for similar securities may be used and would be categorized as Level 2 in the hierarchy. Utilizing these techniques may result in transfers between Level 1 and Level 2. For equity securities, including restricted securities, where observable inputs are limited, assumptions about market activity and risk are used and these securities may be categorized as Level 3 in the hierarchy.
Investments in open-end mutual funds, including the Fidelity Central Funds, are valued at their closing net asset value (NAV) each business day and are categorized as Level 1 in the hierarchy.
Changes in valuation techniques may result in transfers in or out of an assigned level within the disclosure hierarchy. The aggregate value of investments by input level as of December 31, 2016 is included at the end of the Fund's Schedule of Investments.
Foreign Currency. The Fund may use foreign currency contracts to facilitate transactions in foreign-denominated securities. Gains and losses from these transactions may arise from changes in the value of the foreign currency or if the counterparties do not perform under the contracts' terms.
Foreign-denominated assets, including investment securities, and liabilities are translated into U.S. dollars at the exchange rates at period end. Purchases and sales of investment securities, income and dividends received and expenses denominated in foreign currencies are translated into U.S. dollars at the exchange rate in effect on the transaction date.
The effects of exchange rate fluctuations on investments are included with the net realized and unrealized gain (loss) on investment securities. Other foreign currency transactions resulting in realized and unrealized gain (loss) are disclosed separately.
Investment Transactions and Income. For financial reporting purposes, the Fund's investment holdings and NAV include trades executed through the end of the last business day of the period. The NAV per share for processing shareholder transactions is calculated as of the close of business of the New York Stock Exchange (NYSE), normally 4:00 p.m. Eastern time and includes trades executed through the end of the prior business day. Gains and losses on securities sold are determined on the basis of identified cost and may include proceeds received from litigation. Dividend income is recorded on the ex-dividend date, except for certain dividends from foreign securities where the ex-dividend date may have passed, which are recorded as soon as the Fund is informed of the ex-dividend date. Non-cash dividends included in dividend income, if any, are recorded at the fair market value of the securities received. Income and capital gain distributions from Fidelity Central Funds, if any, are recorded on the ex-dividend date. Certain distributions received by the Fund represent a return of capital or capital gain. The Fund determines the components of these distributions subsequent to the ex-dividend date, based upon receipt of tax filings or other correspondence relating to the underlying investment. These distributions are recorded as a reduction of cost of investments and/or as a realized gain. Investment income is recorded net of foreign taxes withheld where recovery of such taxes is uncertain.
Class Allocations and Expenses. Investment income, realized and unrealized capital gains and losses, common expenses of the Fund, and certain fund-level expense reductions, if any, are allocated daily on a pro-rata basis to each class based on the relative net assets of each class to the total net assets of the Fund. Each class differs with respect to transfer agent fees incurred. Certain expense reductions may also differ by class. For the reporting period, the allocated portion of income and expenses to each class as a percent of its average net assets may vary due to the timing of recording these transactions in relation to fluctuating net assets of the classes. Expenses directly attributable to a fund are charged to that fund. Expenses attributable to more than one fund are allocated among the respective funds on the basis of relative net assets or other appropriate methods. Expense estimates are accrued in the period to which they relate and adjustments are made when actual amounts are known.
Income Tax Information and Distributions to Shareholders. Each year, the Fund intends to qualify as a regulated investment company under Subchapter M of the Internal Revenue Code, including distributing substantially all of its taxable income and realized gains. As a result, no provision for U.S. Federal income taxes is required. As of December 31, 2016, the Fund did not have any unrecognized tax benefits in the financial statements; nor is the Fund aware of any tax positions for which it is reasonably possible that the total amounts of unrecognized tax benefits will significantly change in the next twelve months. The Fund files a U.S. federal tax return, in addition to state and local tax returns as required. The Fund's federal income tax returns are subject to examination by the Internal Revenue Service (IRS) for a period of three fiscal years after they are filed. State and local tax returns may be subject to examination for an additional fiscal year depending on the jurisdiction. Foreign taxes are provided for based on the Fund's understanding of the tax rules and rates that exist in the foreign markets in which it invests.
Distributions are declared and recorded on the ex-dividend date. Income dividends and capital gain distributions are declared separately for each class. Income and capital gain distributions are determined in accordance with income tax regulations, which may differ from GAAP.
Capital accounts within the financial statements are adjusted for permanent book-tax differences. These adjustments have no impact on net assets or the results of operations. Capital accounts are not adjusted for temporary book-tax differences which will reverse in a subsequent period.
Book-tax differences are primarily due to foreign currency transactions and losses deferred due to wash sales.
The federal tax cost of investment securities and unrealized appreciation (depreciation) as of period end were as follows:
| Gross unrealized appreciation | $33,637,041 |
| Gross unrealized depreciation | (1,983,467) |
| Net unrealized appreciation (depreciation) on securities | $31,653,574 |
| Tax Cost | $166,150,621 |
The tax-based components of distributable earnings as of period end were as follows:
| Undistributed ordinary income | $233,516 |
| Undistributed long-term capital gain | $7,982,710 |
| Net unrealized appreciation (depreciation) on securities and other investments | $31,653,574 |
The tax character of distributions paid was as follows:
| | December 31, 2016 | December 31, 2015 |
| Ordinary Income | $1,088,641 | $ 1,336,984 |
| Long-term Capital Gains | 13,584,564 | 15,203,492 |
| Total | $14,673,205 | $ 16,540,476 |
Trading (Redemption) Fees. Shares held by investors less than 60 days may be subject to a redemption fee equal to 1% of the NAV of shares redeemed. All redemption fees, which reduce the proceeds of the shareholder redemption, are retained by the Fund and accounted for as an addition to paid in capital.
4. Purchases and Sales of Investments.
Purchases and sales of securities, other than short-term securities, aggregated $118,149,038 and $92,333,481, respectively.
5. Fees and Other Transactions with Affiliates.
Management Fee. Fidelity SelectCo, LLC (the investment adviser) and its affiliates provide the Fund with investment management related services for which the Fund pays a monthly management fee. The management fee is the sum of an individual fund fee rate that is based on an annual rate of .30% of the Fund's average net assets and an annualized group fee rate that averaged .25% during the period. The group fee rate is based upon the average net assets of all the mutual funds advised by Fidelity Management & Research Company (FMR) and the investment adviser. The group fee rate decreases as assets under management increase and increases as assets under management decrease. For the reporting period, the total annual management fee rate was .55% of the Fund's average net assets.
Transfer Agent Fees. Fidelity Investments Institutional Operations Company, Inc. (FIIOC), an affiliate of the investment adviser, is the Fund's transfer, dividend disbursing, and shareholder servicing agent. FIIOC receives an asset-based fee with respect to each class. Each class (with the exception of Investor Class) pays a fee for transfer agent services, typesetting, and printing and mailing of shareholder reports, excluding mailing of proxy statements, equal to an annual rate of .07% ( .15% for Investor Class) of class-level average net assets. For the period, transfer agent fees for each class were as follows:
| Initial Class | $23,316 |
| Investor Class | 170,033 |
| | $193,349 |
Accounting and Security Lending Fees. Fidelity Service Company, Inc. (FSC), an affiliate of the investment adviser, maintains the Fund's accounting records. The accounting fee is based on the level of average net assets for each month. Under a separate contract, FSC administers the security lending program. The security lending fee is based on the number and duration of lending transactions.
Brokerage Commissions. The Fund placed a portion of its portfolio transactions with brokerage firms which are affiliates of the investment adviser. Brokerage commissions are included in net realized gain (loss) and change in net unrealized appreciation (depreciation) in the Statement of Operations. The commissions paid to these affiliated firms were $2,688 for the period.
Interfund Trades. The Fund may purchase from or sell securities to other Fidelity Funds under procedures adopted by the Board. The procedures have been designed to ensure these interfund trades are executed in accordance with Rule 17a-7 of the 1940 Act. Interfund trades are included within the respective purchases and sales amounts shown in the Purchases and Sales of Investments note.
6. Committed Line of Credit.
The Fund participates with other funds managed by the investment adviser or an affiliate in a $4.25 billion credit facility (the "line of credit") to be utilized for temporary or emergency purposes to fund shareholder redemptions or for other short-term liquidity purposes. The Fund has agreed to pay commitment fees on its pro-rata portion of the line of credit, which amounted to $375 and is reflected in Miscellaneous expenses on the Statement of Operations. During the period, the Fund did not borrow on this line of credit.
7. Security Lending.
The Fund lends portfolio securities through a lending agent from time to time in order to earn additional income. On the settlement date of the loan, the Fund receives collateral (in the form of U.S. Treasury obligations, letters of credit and/or cash) against the loaned securities and maintains collateral in an amount not less than 100% of the market value of the loaned securities during the period of the loan. The market value of the loaned securities is determined at the close of business of the Fund and any additional required collateral is delivered to the Fund on the next business day. The Fund or borrower may terminate the loan at any time, and if the borrower defaults on its obligation to return the securities loaned because of insolvency or other reasons, the Fund may apply collateral received from the borrower against the obligation. The Fund may experience delays and costs in recovering the securities loaned. Any cash collateral received is invested in the Fidelity Securities Lending Cash Central Fund. The value of loaned securities and cash collateral at period end are disclosed on the Fund's Statement of Assets and Liabilities. Security lending income represents the income earned on investing cash collateral, less rebates paid to borrowers and any lending agent fees associated with the loan, plus any premium payments received for lending certain types of securities. Security lending income is presented in the Statement of Operations as a component of income from Fidelity Central Funds. Total security lending income during the period amounted to $2,506.
8. Expense Reductions.
Commissions paid to certain brokers with whom the investment adviser, or its affiliates, places trades on behalf of the Fund include an amount in addition to trade execution, which may be rebated back to the Fund to offset certain expenses. This amount totaled $4,456 for the period. In addition, through arrangements with the Fund's custodian, credits realized as a result of certain uninvested cash balances were used to reduce the Fund's expenses. During the period, these credits reduced the Fund's custody expenses by $2.
In addition, during the period the investment adviser reimbursed and/or waived a portion of fund-level operating expenses in the amount of $1,054.
9. Distributions to Shareholders.
Distributions to shareholders of each class were as follows:
| | Year ended
December 31, 2016 | Year ended December 31, 2015 |
| From net investment income | | |
| Initial Class | 254,160 | 318,378 |
| Investor Class | 834,481 | 910,126 |
| Total | $1,088,641 | $1,228,504 |
| From net realized gain | | |
| Initial Class | 3,274,688 | 4,034,538 |
| Investor Class | 10,309,876 | 11,277,434 |
| Total | $13,584,564 | $15,311,972 |
10. Share Transactions.
Transactions for each class of shares were as follows:
| | Shares | Shares | Dollars | Dollars |
| | Year ended
December 31, 2016 | Year ended December 31, 2015 | Year ended
December 31, 2016 | Year ended December 31, 2015 |
| Initial Class | | | | |
| Shares sold | 366,918 | 109,300 | $7,447,757 | $2,261,401 |
| Reinvestment of distributions | 211,467 | 208,401 | 3,528,848 | 4,352,916 |
| Shares redeemed | (321,699) | (584,161) | (6,144,469) | (12,393,683) |
| Net increase (decrease) | 256,686 | (266,460) | $4,832,136 | $(5,779,366) |
| Investor Class | | | | |
| Shares sold | 2,019,265 | 613,734 | $40,663,972 | $12,747,303 |
| Reinvestment of distributions | 671,102 | 586,625 | 11,144,357 | 12,187,560 |
| Shares redeemed | (847,086) | (1,247,826) | (15,969,564) | (26,053,300) |
| Net increase (decrease) | 1,843,281 | (47,467) | $35,838,765 | $(1,118,437) |
11. Other.
The Fund's organizational documents provide former and current trustees and officers with a limited indemnification against liabilities arising in connection with the performance of their duties to the Fund. In the normal course of business, the Fund may also enter into contracts that provide general indemnifications. The Fund's maximum exposure under these arrangements is unknown as this would be dependent on future claims that may be made against the Fund. The risk of material loss from such claims is considered remote.
At the end of the period, the investment adviser or its affiliates were the owners of record of 100% of the total outstanding shares of the Fund.
Report of Independent Registered Public Accounting Firm
To the Trustees of Variable Insurance Products Fund IV and Shareholders of VIP Industrials Portfolio:
In our opinion, the accompanying statement of assets and liabilities, including the schedule of investments, and the related statements of operations and of changes in net assets and the financial highlights present fairly, in all material respects, the financial position of VIP Industrials Portfolio (a fund of Variable Insurance Products Fund IV) (the "Fund") as of December 31, 2016, the results of its operations for the year then ended, the changes in its net assets for each of the two years in the period then ended and the financial highlights for each of the five years in the period then ended, in conformity with accounting principles generally accepted in the United States of America. These financial statements and financial highlights (hereafter referred to as “financial statements”) are the responsibility of the Fund's management. Our responsibility is to express an opinion on these financial statements based on our audits. We conducted our audits of these financial statements in accordance with the standards of the Public Company Accounting Oversight Board (United States). Those standards require that we plan and perform the audit to obtain reasonable assurance about whether the financial statements are free of material misstatement. An audit includes examining, on a test basis, evidence supporting the amounts and disclosures in the financial statements, assessing the accounting principles used and significant estimates made by management, and evaluating the overall financial statement presentation. We believe that our audits, which included confirmation of securities as of December 31, 2016 by correspondence with the custodian and brokers, provide a reasonable basis for our opinion.
PricewaterhouseCoopers LLP
Boston, Massachusetts
February 16, 2017
Trustees and Officers
The Trustees, Members of the Advisory Board (if any), and officers of the trust and fund, as applicable, are listed below. The Board of Trustees governs the fund and is responsible for protecting the interests of shareholders. The Trustees are experienced executives who meet periodically throughout the year to oversee the fund's activities, review contractual arrangements with companies that provide services to the fund, oversee management of the risks associated with such activities and contractual arrangements, and review the fund's performance. Each of the Trustees oversees 83 funds.
The Trustees hold office without limit in time except that (a) any Trustee may resign; (b) any Trustee may be removed by written instrument, signed by at least two-thirds of the number of Trustees prior to such removal; (c) any Trustee who requests to be retired or who has become incapacitated by illness or injury may be retired by written instrument signed by a majority of the other Trustees; and (d) any Trustee may be removed at any special meeting of shareholders by a two-thirds vote of the outstanding voting securities of the trust. Each Trustee who is not an interested person (as defined in the 1940 Act) of the trust and the fund is referred to herein as an Independent Trustee. Each Independent Trustee shall retire not later than the last day of the calendar year in which his or her 75th birthday occurs. The Independent Trustees may waive this mandatory retirement age policy with respect to individual Trustees. Officers and Advisory Board Members hold office without limit in time, except that any officer or Advisory Board Member may resign or may be removed by a vote of a majority of the Trustees at any regular meeting or any special meeting of the Trustees. Except as indicated, each individual has held the office shown or other offices in the same company for the past five years.
The fund’s Statement of Additional Information (SAI) includes more information about the Trustees. To request a free copy, call Fidelity at 1-877-208-0098.
Experience, Skills, Attributes, and Qualifications of the Trustees. The Governance and Nominating Committee has adopted a statement of policy that describes the experience, qualifications, attributes, and skills that are necessary and desirable for potential Independent Trustee candidates (Statement of Policy). The Board believes that each Trustee satisfied at the time he or she was initially elected or appointed a Trustee, and continues to satisfy, the standards contemplated by the Statement of Policy. The Governance and Nominating Committee also engages professional search firms to help identify potential Independent Trustee candidates who have the experience, qualifications, attributes, and skills consistent with the Statement of Policy. From time to time, additional criteria based on the composition and skills of the current Independent Trustees, as well as experience or skills that may be appropriate in light of future changes to board composition, business conditions, and regulatory or other developments, have also been considered by the professional search firms and the Governance and Nominating Committee. In addition, the Board takes into account the Trustees' commitment and participation in Board and committee meetings, as well as their leadership of standing and ad hoc committees throughout their tenure.
In determining that a particular Trustee was and continues to be qualified to serve as a Trustee, the Board has considered a variety of criteria, none of which, in isolation, was controlling. The Board believes that, collectively, the Trustees have balanced and diverse experience, qualifications, attributes, and skills, which allow the Board to operate effectively in governing the fund and protecting the interests of shareholders. Information about the specific experience, skills, attributes, and qualifications of each Trustee, which in each case led to the Board's conclusion that the Trustee should serve (or continue to serve) as a trustee of the fund, is provided below.
Board Structure and Oversight Function. Brian B. Hogan is an interested person and currently serves as Chairman. The Trustees have determined that an interested Chairman is appropriate and benefits shareholders because an interested Chairman has a personal and professional stake in the quality and continuity of services provided to the fund. Independent Trustees exercise their informed business judgment to appoint an individual of their choosing to serve as Chairman, regardless of whether the Trustee happens to be independent or a member of management. The Independent Trustees have determined that they can act independently and effectively without having an Independent Trustee serve as Chairman and that a key structural component for assuring that they are in a position to do so is for the Independent Trustees to constitute a substantial majority for the Board. The Independent Trustees also regularly meet in executive session. Michael E. Wiley serves as Chairman of the Independent Trustees and as such (i) acts as a liaison between the Independent Trustees and management with respect to matters important to the Independent Trustees and (ii) with management prepares agendas for Board meetings.
Fidelity® funds are overseen by different Boards of Trustees. The fund's Board oversees Fidelity's sector portfolios. Other Boards oversee Fidelity's equity and high income funds, and Fidelity's investment grade bond, money market, and asset allocation funds. The use of separate Boards, each with its own committee structure, allows the Trustees of each group of Fidelity® funds to focus on the unique issues of the funds they oversee, including common research, investment, and operational issues. On occasion, the separate Boards establish joint committees to address issues of overlapping consequences for the Fidelity® funds overseen by each Board.
The Trustees operate using a system of committees to facilitate the timely and efficient consideration of all matters of importance to the Trustees, the fund, and fund shareholders and to facilitate compliance with legal and regulatory requirements and oversight of the fund's activities and associated risks. The Board, acting through its committees, has charged SelectCo and its affiliates with (i) identifying events or circumstances the occurrence of which could have demonstrably adverse effects on the fund's business and/or reputation; (ii) implementing processes and controls to lessen the possibility that such events or circumstances occur or to mitigate the effects of such events or circumstances if they do occur; and (iii) creating and maintaining a system designed to evaluate continuously business and market conditions in order to facilitate the identification and implementation processes described in (i) and (ii) above. Because the day-to-day operations and activities of the fund are carried out by or through SelectCo, its affiliates, and other service providers, the fund's exposure to risks is mitigated but not eliminated by the processes overseen by the Trustees. While each of the Board's committees has responsibility for overseeing different aspects of the fund's activities, oversight is exercised primarily through the Operations and Audit Committees. Appropriate personnel, including but not limited to the fund's Chief Compliance Officer (CCO), SelectCo's internal auditor, the independent accountants, the fund's Treasurer and portfolio management personnel, make periodic reports to the Board's committees, as appropriate. The responsibilities of each standing committee, including their oversight responsibilities, are described further under "Standing Committees of the Trustees."
Interested Trustees*:
Correspondence intended for a Trustee who is an interested person may be sent to Fidelity Investments, 245 Summer Street, Boston, Massachusetts 02210.
Name, Year of Birth; Principal Occupations and Other Relevant Experience+
Brian B. Hogan (1964)
Year of Election or Appointment: 2014
Trustee
Chairman of the Board of Trustees
Mr. Hogan also serves as Trustee or Vice President of other funds. Mr. Hogan serves as a Director of FMR Investment Management (UK) Limited (investment adviser firm, 2015-present) and Fidelity SelectCo, LLC (investment adviser firm, 2014-present) and President of the Equity Division of FMR (investment adviser firm, 2009-present). Previously, Mr. Hogan served as Senior Vice President, Equity Research of FMR (2006-2009) and as a portfolio manager. Mr. Brian B. Hogan is not related to Mr. Colm A. Hogan.
* Determined to be an "Interested Trustee" by virtue of, among other things, his or her affiliation with the trust or various entities under common control with SelectCo.
+ The information includes the Trustee's principal occupation during the last five years and other information relating to the experience, attributes, and skills relevant to the Trustee's qualifications to serve as a Trustee, which led to the conclusion that the Trustee should serve as a Trustee for the fund.
Independent Trustees:
Correspondence intended for an Independent Trustee may be sent to Fidelity Investments, P.O. Box 55235, Boston, Massachusetts 02205-5235.
Name, Year of Birth; Principal Occupations and Other Relevant Experience+
David A. Rosow (1942)
Year of Election or Appointment: 2013
Trustee
Mr. Rosow also serves as Trustee of other Fidelity® funds. Prior to his retirement in 2006, Mr. Rosow was the Chief Executive Officer, owner and operator of a number of private companies, which encompassed the oil refining, drilling and marketing of petroleum products (including specialty petroleum products), recreation industry, and real estate development. Mr. Rosow currently serves as a Director of Oxbow Carbon LLC (upgraders, marketers, and distributors of petroleum byproducts of the oil refining process, 2015-present) and Oxbridge Academy of the Palm Beaches (2015-present) and serves as its President and CEO. Previously, Mr. Rosow served on the Fairfield Country Day School Board for 27 years, including as its President for 3 years, stepping down in 2006. Mr. Rosow served as Lead Director and Chairman of the Audit Committee of Hudson United Bancorp (1996-2006), Chairman of the Board of Westport Bank and Trust (1992-1996), and as a Director of TD Banknorth (2006-2007). In addition, Mr. Rosow served as a member (2008-2014) and President (2009-2014) of the Town Council of Palm Beach, Florida. Mr. Rosow also served as a Member of the Advisory Board of certain Fidelity® funds (2012-2013).
Garnett A. Smith (1947)
Year of Election or Appointment: 2013
Trustee
Mr. Smith also serves as Trustee of other Fidelity® funds. Prior to Mr. Smith's retirement, he served as Chairman and Chief Executive Officer of Inbrand Corp. (manufacturer of personal absorbent products, 1990-1997). He also served as President (1986-1990) of Inbrand Corp. Prior to his employment with Inbrand Corp., he was employed by a retail fabric chain and North Carolina National Bank. In addition, Mr. Smith served as a Member of the Advisory Board of certain Fidelity® funds (2012-2013) and as a board member of the Jackson Hole Land Trust (2009-2012).
Michael E. Wiley (1950)
Year of Election or Appointment: 2008
Trustee
Chairman of the Independent Trustees
Mr. Wiley also serves as Trustee of other Fidelity® funds. Mr. Wiley serves as a Director of Tesoro Corporation (independent oil refiner and marketer, 2005-present), a Director of Tesoro Logistics LP (natural resources logistics, 2015-present), and a Director of Bill Barrett Corporation (exploration and production, 2005-present). In addition, Mr. Wiley also serves as a Director of Post Oak Bank (privately-held bank, 2004-present). Previously, Mr. Wiley served as a Trustee of other Fidelity® funds (2008-2013), as a Director of Asia Pacific Exploration Consolidated (international oil and gas exploration and production, 2008-2013), as a member of the Board of Trustees of the University of Tulsa (2000-2006; 2007-2010), as a Senior Energy Advisor of Katzenbach Partners, LLC (consulting, 2006-2007), as an Advisory Director of Riverstone Holdings (private investment), Chairman, President, and CEO of Baker Hughes, Inc. (oilfield services, 2000-2004), and as Director of Spinnaker Exploration Company (exploration and production, 2001-2005).
+ The information includes the Trustee's principal occupation during the last five years and other information relating to the experience, attributes, and skills relevant to the Trustee's qualifications to serve as a Trustee, which led to the conclusion that the Trustee should serve as a Trustee for the fund.
Advisory Board Members and Officers:
Correspondence intended for a Member of the Advisory Board may be sent to Fidelity Investments, P.O. Box 55235, Boston, Massachusetts 02205-5235. Except for Anthony R. Rochte, correspondence intended for an officer may be sent to Fidelity Investments, 245 Summer Street, Boston, Massachusetts 02210. Correspondence intended for Mr. Rochte may be sent to SelectCo, 1225 17th Street, Denver, Colorado 80202-5541. Officers appear below in alphabetical order.
Name, Year of Birth; Principal Occupation
Donald F. Donahue (1950)
Year of Election or Appointment: 2015
Member of the Advisory Board
Mr. Donahue also serves as a Trustee or Member of the Advisory Board of other Fidelity® funds. Mr. Donahue is President and Chief Executive Officer of Miranda Partners, LLC (risk consulting for the financial services industry, 2012-present) and a consultant for the Institute for Defense Analyses (national security, 2012-present). Previously, Mr. Donahue served as Chief Executive Officer (2006-2012), Chief Operating Officer (2003-2006), and Managing Director, Customer Marketing and Development (1999-2003) of The Depository Trust & Clearing Corporation (financial markets infrastructure). Mr. Donahue serves as a Member (2012-present) and Co-Chairman (2016-present) of the Board of Directors of United Way of New York, Member of the Board of Directors of NYC Leadership Academy (2012-present) and Member of the Board of Advisors of Ripple Labs, Inc. (financial services, 2015-present). He also served as Chairman (2010-2012) and Member of the Board of Directors (2012-2013) of Omgeo, LLC (financial services), Treasurer of United Way of New York (2012-2016), and Member of the Board of Directors of XBRL US (financial services non-profit, 2009-2012) and the International Securities Services Association (2009-2012).
Carol B. Tomé (1957)
Year of Election or Appointment: 2017
Member of the Advisory Board
Ms. Tomé also serves as Trustee or Member of the Advisory Board of other Fidelity® funds. Ms. Tomé is Chief Financial Officer (2001-present) and Executive Vice President of Corporate Services (2007-present) of The Home Depot, Inc. (home improvement retailer) and a Director (2003-present) and Chair of the Audit Committee (2004-present) of United Parcel Service, Inc. (package delivery and supply chain management). Previously, Ms. Tomé served as Senior Vice President of Finance and Accounting/Treasurer (2000-2007) and Vice President and Treasurer (1995-2000) of The Home Depot, Inc. and Chair of the Board (2010-2012), Vice Chair of the Board (2009 and 2013), and a Director (2008-2013) of the Federal Reserve Bank of Atlanta. Ms. Tomé is also a director or trustee of many community and professional organizations.
Marc R. Bryant (1966)
Year of Election or Appointment: 2013
Secretary and Chief Legal Officer (CLO)
Mr. Bryant also serves as Secretary and CLO of other funds. Mr. Bryant serves as CLO, Secretary, and Senior Vice President of Fidelity Management & Research Company (investment adviser firm, 2015-present) and FMR Co., Inc. (investment adviser firm, 2015-present); Secretary of Fidelity SelectCo, LLC (investment adviser firm, 2015-present) and Fidelity Investments Money Management, Inc. (investment adviser firm, 2015-present); and CLO of Fidelity Management & Research (Hong Kong) Limited and FMR Investment Management (UK) Limited (investment adviser firms, 2015-present) and Fidelity Management & Research (Japan) Limited (investment adviser firm, 2016-present). He is Senior Vice President and Deputy General Counsel of FMR LLC (diversified financial services company). Previously, Mr. Bryant served as Secretary and CLO of Fidelity Rutland Square Trust II (2010-2014) and Assistant Secretary of Fidelity's Fixed Income and Asset Allocation Funds (2013-2015). Prior to joining Fidelity Investments, Mr. Bryant served as a Senior Vice President and the Head of Global Retail Legal for AllianceBernstein L.P. (2006-2010), and as the General Counsel for ProFund Advisors LLC (2001-2006).
Jeffrey S. Christian (1961)
Year of Election or Appointment: 2016
Assistant Treasurer
Mr. Christian also serves as Assistant Treasurer of other funds. Mr. Christian is an employee of Fidelity Investments (2003-present).
William C. Coffey (1969)
Year of Election or Appointment: 2009
Assistant Secretary
Mr. Coffey also serves as Assistant Secretary of other funds. He is Senior Vice President and Deputy General Counsel of FMR LLC (diversified financial services company, 2010-present), and is an employee of Fidelity Investments. Previously, Mr. Coffey served as Vice President and Associate General Counsel of FMR LLC (2005-2009).
Jonathan Davis (1968)
Year of Election or Appointment: 2010
Assistant Treasurer
Mr. Davis also serves as Assistant Treasurer of other funds, and is an employee of Fidelity Investments. Previously, Mr. Davis served as Vice President and Associate General Counsel of FMR LLC (diversified financial services company, 2003-2010).
Adrien E. Deberghes (1967)
Year of Election or Appointment: 2013
President and Treasurer
Mr. Deberghes also serves as an officer of other funds. He serves as Executive Vice President of Fidelity Investments Money Management, Inc. (FIMM) (investment adviser firm, 2016-present) and is an employee of Fidelity Investments (2008-present). Prior to joining Fidelity Investments, Mr. Deberghes was Senior Vice President of Mutual Fund Administration at State Street Corporation (2007-2008), Senior Director of Mutual Fund Administration at Investors Bank & Trust (2005-2007), and Director of Finance for Dunkin' Brands (2000-2005). Previously, Mr. Deberghes served in other fund officer roles.
Joseph DeSantis (1959)
Year of Election or Appointment: 2015
Vice President
Mr. DeSantis also serves as Vice President of other funds. Mr. DeSantis serves as a Director of Fidelity Management & Research (Japan) Limited (investment adviser firm, 2016-present), Chief Investment Officer, Equities (2010-present) and is an employee of Fidelity Investments.
Stephanie J. Dorsey (1969)
Year of Election or Appointment: 2010
Assistant Treasurer
Ms. Dorsey also serves as an officer of other funds. She is an employee of Fidelity Investments (2008-present) and has served in other fund officer roles. Prior to joining Fidelity Investments, Ms. Dorsey served as Treasurer (2004-2008) of the JPMorgan Mutual Funds and Vice President (2004-2008) of JPMorgan Chase Bank.
Howard J. Galligan III (1966)
Year of Election or Appointment: 2014
Chief Financial Officer
Mr. Galligan also serves as Chief Financial Officer of other funds. Mr. Galligan serves as President of Fidelity Pricing and Cash Management Services (FPCMS) (2014-present) and as a Director of Strategic Advisers, Inc. (investment adviser firm, 2008-present). Previously, Mr. Galligan served as Chief Administrative Officer of Asset Management (2011-2014) and Chief Operating Officer and Senior Vice President of Investment Support for Strategic Advisers, Inc. (2003-2011).
Scott C. Goebel (1968)
Year of Election or Appointment: 2015
Vice President
Mr. Goebel serves as Vice President of other funds and is an employee of Fidelity Investments (2001-present). Previously, Mr. Goebel served as Senior Vice President of Fidelity Management & Research Company (FMR) (investment adviser firm, 2016), Secretary of Fidelity SelectCo, LLC (investment adviser firm, 2013-2015), Fidelity Investments Money Management, Inc. (FIMM) (investment adviser firm, 2010-2015), and Fidelity Research and Analysis Company (FRAC) (investment adviser firm, 2010-2015); General Counsel, Secretary, and Senior Vice President of FMR (investment adviser firm, 2008-2015) and FMR Co., Inc. (investment adviser firm, 2008-2015); Assistant Secretary of Fidelity Management & Research (Japan) Limited (investment adviser firm, 2008-2015) and Fidelity Management & Research (U.K.) Inc. (investment adviser firm, 2008-2015); Chief Legal Officer (CLO) of Fidelity Management & Research (Hong Kong) Limited (investment adviser firm, 2008-2015); Secretary and CLO of certain Fidelity® funds (2008-2015); Assistant Secretary of FIMM (2008-2010), FRAC (2008-2010), and certain funds (2007-2008); and as Vice President and Secretary of Fidelity Distributors Corporation (FDC) (2005-2007).
James D. Gryglewicz (1972)
Year of Election or Appointment: 2014
Chief Compliance Officer
Mr. Gryglewicz also serves as Chief Compliance Officer of other funds. Mr. Gryglewicz serves as Compliance Officer of Strategic Advisers, Inc. (investment adviser firm, 2015-present) and Fidelity SelectCo, LLC (investment adviser firm, 2014-present), Senior Vice President of Asset Management Compliance (2009-present), and is an employee of Fidelity Investments (2004-present).
Brian B. Hogan (1964)
Year of Election or Appointment: 2009
Vice President
Mr. Hogan also serves as Trustee or Vice President of other funds. Mr. Hogan serves as a Director of FMR Investment Management (UK) Limited (investment adviser firm, 2015-present) and Fidelity SelectCo, LLC (investment adviser firm, 2014-present) and President of the Equity Division of FMR (investment adviser firm, 2009-present). Previously, Mr. Hogan served as Senior Vice President, Equity Research of FMR (2006-2009) and as a portfolio manager. Mr. Brian B. Hogan is not related to Mr. Colm A. Hogan.
Colm A. Hogan (1973)
Year of Election or Appointment: 2016
Assistant Treasurer
Mr. Hogan also serves as an officer of other funds. Mr. Hogan is an employee of Fidelity Investments (2005-present). Mr. Colm A. Hogan is not related to Mr. Brian B. Hogan.
Chris Maher (1972)
Year of Election or Appointment: 2013
Assistant Treasurer
Mr. Maher serves as Assistant Treasurer of other funds. Mr. Maher is Vice President of Valuation Oversight and is an employee of Fidelity Investments. Previously, Mr. Maher served as Vice President of Asset Management Compliance (2013), Vice President of the Program Management Group of FMR (investment adviser firm, 2010-2013), and Vice President of Valuation Oversight (2008-2010).
John F. Papandrea (1972)
Year of Election or Appointment: 2016
Anti-Money Laundering (AML) Officer
Mr. Papandrea also serves as AML Officer of other funds. Mr. Papandrea is Vice President of FMR LLC (diversified financial services company, 2008-present) and is an employee of Fidelity Investments (2005-present).
Anthony R. Rochte (1968)
Year of Election or Appointment: 2013
Vice President
Mr. Rochte also serves as Vice President of other funds. Mr. Rochte serves as President of Fidelity SelectCo, LLC (investment adviser firm, 2012-present) and is an employee of Fidelity Investments (2012-present). Prior to joining Fidelity Investments, Mr. Rochte served as Senior Managing Director and head of State Street Global Advisors' North American Intermediary Business Group (2006-2012).
Stacie M. Smith (1974)
Year of Election or Appointment: 2013
Assistant Treasurer
Ms. Smith also serves as an officer of other funds. She is an employee of Fidelity Investments (2009-present) and has served in other fund officer roles. Prior to joining Fidelity Investments, Ms. Smith served as Senior Audit Manager of Ernst & Young LLP (accounting firm, 1996-2009). Previously, Ms. Smith served as Deputy Treasurer of certain Fidelity® funds (2013-2016).
Marc L. Spector (1972)
Year of Election or Appointment: 2017
Assistant Treasurer
Mr. Spector also serves as an officer of other funds. Mr. Spector is an employee of Fidelity Investments (2016-present). Prior to joining Fidelity Investments, Mr. Spector served as Director at the Siegfried Group (accounting firm, 2013-2016), and prior to Siegfried Group as audit senior manager at Deloitte & Touche (accounting firm, 2005-2013).
Renee Stagnone (1975)
Year of Election or Appointment: 2016
Assistant Treasurer
Ms. Stagnone also serves as an officer of other funds. Ms. Stagnone is an employee of Fidelity Investments (1997-present). Previously, Ms. Stagnone served as Deputy Treasurer of certain Fidelity® funds (2013-2016).
Shareholder Expense Example
As a shareholder of the Fund, you incur two types of costs: (1) transaction costs, including redemption fees and (2) ongoing costs, including management fees and other Fund expenses. This Example is intended to help you understand your ongoing costs (in dollars) of investing in the Fund and to compare these costs with the ongoing costs of investing in other mutual funds.
The Example is based on an investment of $1,000 invested at the beginning of the period and held for the entire period (July 1, 2016 to December 31, 2016).
Actual Expenses
The first line of the accompanying table for each class of the Fund provides information about actual account values and actual expenses. You may use the information in this line, together with the amount you invested, to estimate the expenses that you paid over the period. Simply divide your account value by $1,000.00 (for example, an $8,600 account value divided by $1,000.00 = 8.6), then multiply the result by the number in the first line for a class of the Fund under the heading entitled "Expenses Paid During Period" to estimate the expenses you paid on your account during this period. The estimate of expenses does not include any fees or other expenses of any variable annuity or variable life insurance product. If they were, the estimate of expenses you paid during the period would be higher, and your ending account value would be lower. In addition, the Fund, as a shareholder in the underlying Fidelity Central Funds, will indirectly bear its pro-rata share of the fees and expenses incurred by the underlying Fidelity Central Funds. These fees and expenses are not included in the Fund's annualized expense ratio used to calculate the expense estimate in the table below.
Hypothetical Example for Comparison Purposes
The second line of the accompanying table for each class of the Fund provides information about hypothetical account values and hypothetical expenses based on a Class' actual expense ratio and an assumed rate of return of 5% per year before expenses, which is not the Class' actual return. The hypothetical account values and expenses may not be used to estimate the actual ending account balance or expenses you paid for the period. You may use this information to compare the ongoing costs of investing in the Fund and other funds. To do so, compare this 5% hypothetical example with the 5% hypothetical examples that appear in the shareholder reports of the other funds. The estimate of expenses does not include any fees or other expenses of any variable annuity or variable life insurance product. If they were, the estimate of expenses you paid during the period would be higher, and your ending account value would be lower. In addition, the Fund, as a shareholder in the underlying Fidelity Central Funds, will indirectly bear its pro-rata share of the fees and expenses incurred by the underlying Fidelity Central Funds. These fees and expenses are not included in the Fund's annualized expense ratio used to calculate the expense estimate in the table below.
Please note that the expenses shown in the table are meant to highlight your ongoing costs only and do not reflect any transaction costs. Therefore, the second line of the table is useful in comparing ongoing costs only, and will not help you determine the relative total costs of owning different funds. In addition, if these transactional costs were included, your costs would have been higher.
| | Annualized Expense Ratio-A | Beginning
Account Value
July 1, 2016 | Ending
Account Value
December 31, 2016 | Expenses Paid
During Period-B
July 1, 2016
to December 31, 2016 |
| Initial Class | .70% | | | |
| Actual | | $1,000.00 | $1,110.20 | $3.71 |
| Hypothetical-C | | $1,000.00 | $1,021.62 | $3.56 |
| Investor Class | .78% | | | |
| Actual | | $1,000.00 | $1,109.30 | $4.14 |
| Hypothetical-C | | $1,000.00 | $1,021.22 | $3.96 |
A Annualized expense ratio reflects expenses net of applicable fee waivers.
B Expenses are equal to each Class' annualized expense ratio, multiplied by the average account value over the period, multiplied by 184/366 (to reflect the one-half year period).
C 5% return per year before expenses
Distributions (Unaudited)
The Board of Trustees of VIP Industrials Portfolio voted to pay to shareholders of record at the opening of business on record date, the following distributions per share derived from capital gains realized from sales of portfolio securities, and dividends derived from net investment income:
| | Pay Date | Record Date | Dividends | Capital Gains |
| VIP Industrials Portfolio | | | | |
| Initial Class | 02/10/17 | 02/10/17 | $0.028 | $0.816 |
| Investor Class | 02/10/17 | 02/10/17 | $0.026 | $0.816 |
|
The fund hereby designates as a capital gain dividend with respect to the taxable year ended December 31, 2016, $ 7,996,779, or, if subsequently determined to be different, the net capital gain of such year.
Initial Class and Investor Class designate 100% of the dividends distributed in December 2016, as qualifying for the dividends–received deduction for corporate shareholders.
VCYLIC-ANN-0217
1.817361.111
Fidelity® Variable Insurance Products: Health Care Portfolio
Annual Report December 31, 2016 |
|
Contents
To view a fund's proxy voting guidelines and proxy voting record for the 12-month period ended June 30, visit http://www.fidelity.com/proxyvotingresults or visit the Securities and Exchange Commission's (SEC) web site at http://www.sec.gov.
You may also call 1-877-208-0098 to request a free copy of the proxy voting guidelines.
Fidelity® Variable Insurance Products are separate account options which are purchased through a variable insurance contract.
Standard & Poor's, S&P and S&P 500 are registered service marks of The McGraw-Hill Companies, Inc. and have been licensed for use by Fidelity Distributors Corporation.
Other third-party marks appearing herein are the property of their respective owners.
All other marks appearing herein are registered or unregistered trademarks or service marks of FMR LLC or an affiliated company. © 2017 FMR LLC. All rights reserved.
This report and the financial statements contained herein are submitted for the general information of the shareholders of the Fund. This report is not authorized for distribution to prospective investors in the Fund unless preceded or accompanied by an effective prospectus.
A fund files its complete schedule of portfolio holdings with the SEC for the first and third quarters of each fiscal year on Form N-Q. Forms N-Q are available on the SEC’s web site at http://www.sec.gov. A fund's Forms N-Q may be reviewed and copied at the SEC’s Public Reference Room in Washington, DC. Information regarding the operation of the SEC's Public Reference Room may be obtained by calling 1-800-SEC-0330.
For a complete list of a fund's portfolio holdings, view the most recent holdings listing, semiannual report, or annual report on Fidelity's web site at http://www.fidelity.com, http://www.institutional.fidelity.com, or http://www.401k.com, as applicable.
NOT FDIC INSURED •MAY LOSE VALUE •NO BANK GUARANTEE
Neither the Fund nor Fidelity Distributors Corporation is a bank.
Performance: The Bottom Line
Average annual total return reflects the change in the value of an investment, assuming reinvestment of distributions from dividend income and capital gains (the profits earned upon the sale of securities that have grown in value, if any) and assuming a constant rate of performance each year. During periods of reimbursement by Fidelity, a fund’s total return will be greater than it would be had the reimbursement not occurred. Performance numbers are net of all underlying fund operating expenses, but do not include any insurance charges imposed by your insurance company’s separate account. If performance information included the effect of these additional charges, the total returns would have been lower. How a fund did yesterday is no guarantee of how it will do tomorrow.
Average Annual Total Returns
| For the periods ended December 31, 2016 | Past 1 year | Past 5 years | Past 10 years |
| Initial Class | (10.43)% | 19.01% | 11.63% |
| Investor Class | (10.51)% | 18.90% | 11.53% |
$10,000 Over 10 Years
Let's say hypothetically that $10,000 was invested in VIP Health Care Portfolio - Initial Class on December 31, 2006.
The chart shows how the value of your investment would have changed, and also shows how the S&P 500® Index performed over the same period.

| Period Ending Values |
| $30,057 | VIP Health Care Portfolio - Initial Class |
| $19,572 | S&P 500® Index |
Management's Discussion of Fund Performance
Market Recap: The S&P 500
® index returned 11.96% in 2016, rising sharply on post-election optimism for economic growth. The year began during a fairly volatile stretch, with stocks hampered by persistent oil-price weakness and U.S.-dollar strength. Markets regained momentum in February amid U.S. job gains, a rally in energy and other stimuli that helped keep the roughly seven-year uptrend intact. Markets tumbled briefly following the U.K.’s June 23 vote to exit the European Union – dubbed “Brexit” – then recovered quickly and settled into a flattish stretch until the November 8 U.S. presidential election. Stocks reacted to the outcome by reaching a series of all-time highs. For the year, energy (+27%) led the way amid two strong rallies in commodity prices, one in the spring and another in November. Telecommunication services (+23%) was close behind, as demand for dividend-paying equities was high early in the period. Cyclical sectors, including financials (+22%), industrials (+18%) and materials (+17%), also posted strong gains. Conversely, consumer staples (+5%) and consumer discretionary (+6%) lagged the index, the latter hurt as online competition continued to pressure brick-and-mortar retailers. Real estate (+3%) struggled due to expectations for rising interest rates, while health care (-2%) was hampered by an uncertain political and regulatory outlook.
Comments from Portfolio Manager Eddie Yoon: For the year, the fund's share classes significantly underperforming both the -3.26% return of the MSCI U.S. IMI Health Care 25/50 Index and the broadly based S&P 500
®. Versus the sector index, the fund was held back most by choices in the pharmaceuticals and biotechnology industries. Stocks here also were hampered by increasing concern over potential legislation for drug pricing practices, particularly in the lead-up the November U.S. presidential election. A sizable out-of-index position in Israel-based Teva Pharmaceutical Industries was our biggest relative detractor, as significant concern over the generic drug-pricing environment and the durability of its key multiple sclerosis drug, Copaxone
®, pressured the stock price. The fund was overweighted Allergan (-33%), which also hurt relative performance this year. A confluence of factors weighed on Allergan’s stock, including the earnings dilution related to the sale of its generics business, as well as perceived exposure to drug-pricing risks. Conversely, our large stake in Boston Scientific was a big plus. The medical devices firm reported consecutive quarters of better-than-expected sales and revenue growth, along with U.S. Food and Drug Administration approval for several new devices, and reported stronger adoption of the company’s Watchman™ surgical device, which seeks to prevent strokes. Oncology-focused biopharmaceutical firm Tesaro was another contributor, as the stock rose 158% during the past year.
The views expressed above reflect those of the portfolio manager(s) only through the end of the period as stated on the cover of this report and do not necessarily represent the views of Fidelity or any other person in the Fidelity organization. Any such views are subject to change at any time based upon market or other conditions and Fidelity disclaims any responsibility to update such views. These views may not be relied on as investment advice and, because investment decisions for a Fidelity fund are based on numerous factors, may not be relied on as an indication of trading intent on behalf of any Fidelity fund.
Investment Summary (Unaudited)
Top Ten Stocks as of December 31, 2016
| | % of fund's net assets | % of fund's net assets 6 months ago |
| Amgen, Inc. | 7.5 | 6.2 |
| Allergan PLC | 7.3 | 5.9 |
| Medtronic PLC | 7.1 | 10.2 |
| UnitedHealth Group, Inc. | 5.5 | 3.1 |
| Boston Scientific Corp. | 5.2 | 5.1 |
| Alexion Pharmaceuticals, Inc. | 3.8 | 2.5 |
| Vertex Pharmaceuticals, Inc. | 3.4 | 3.6 |
| Bristol-Myers Squibb Co. | 2.5 | 3.0 |
| Anthem, Inc. | 2.5 | 1.4 |
| Intuitive Surgical, Inc. | 2.3 | 2.0 |
| | 47.1 | |
Top Industries (% of fund's net assets)
| As of December 31, 2016 |
| | Biotechnology | 31.0% |
| | Health Care Equipment & Supplies | 24.9% |
| | Pharmaceuticals | 19.2% |
| | Health Care Providers & Services | 18.0% |
| | Health Care Technology | 3.1% |
| | All Others* | 3.8% |

* Includes short-term investments and net other assets (liabilities).
| As of June 30, 2016 |
| | Health Care Equipment & Supplies | 28.0% |
| | Biotechnology | 26.5% |
| | Pharmaceuticals | 21.3% |
| | Health Care Providers & Services | 16.8% |
| | Health Care Technology | 3.5% |
| | All Others* | 3.9% |

Prior period industry classifications reflect the categories in place as of the date indicated and have not been adjusted to reflect current industry classifications.
* Includes short-term investments and net other assets (liabilities).
Investments December 31, 2016
Showing Percentage of Net Assets
| Common Stocks - 99.5% | | | |
| | | Shares | Value |
| Biotechnology - 31.0% | | | |
| Biotechnology - 31.0% | | | |
| Ablynx NV (a)(b) | | 251,400 | $2,862,041 |
| AC Immune SA | | 66,000 | 856,680 |
| ACADIA Pharmaceuticals, Inc. (a) | | 8,400 | 242,256 |
| Acorda Therapeutics, Inc. (a) | | 172,284 | 3,238,939 |
| Advanced Accelerator Applications SA sponsored ADR (a)(b) | | 61,100 | 1,635,036 |
| Advaxis, Inc. (a)(b) | | 180,000 | 1,288,800 |
| Alexion Pharmaceuticals, Inc. (a) | | 204,100 | 24,971,635 |
| Alnylam Pharmaceuticals, Inc. (a) | | 63,313 | 2,370,439 |
| Amgen, Inc. | | 340,000 | 49,711,399 |
| Amicus Therapeutics, Inc. (a)(b) | | 342,400 | 1,701,728 |
| Arena Pharmaceuticals, Inc. (a) | | 310,300 | 440,626 |
| Array BioPharma, Inc. (a) | | 330,000 | 2,900,700 |
| BeiGene Ltd. ADR (b) | | 38,100 | 1,156,716 |
| Biogen, Inc. (a) | | 28,500 | 8,082,030 |
| BioMarin Pharmaceutical, Inc. (a) | | 45,300 | 3,752,652 |
| bluebird bio, Inc. (a)(b) | | 21,500 | 1,326,550 |
| Blueprint Medicines Corp. (a)(b) | | 69,300 | 1,943,865 |
| Celgene Corp. (a) | | 34,000 | 3,935,500 |
| Cellectis SA sponsored ADR (a)(b) | | 86,200 | 1,461,090 |
| Curis, Inc. (a) | | 114,590 | 352,937 |
| Cytokinetics, Inc. (a)(b) | | 128,000 | 1,555,200 |
| CytomX Therapeutics, Inc. (a) | | 53,800 | 591,262 |
| Five Prime Therapeutics, Inc. (a) | | 44,000 | 2,204,840 |
| Galapagos Genomics NV sponsored ADR (a)(b) | | 48,200 | 3,093,958 |
| Gilead Sciences, Inc. | | 140,300 | 10,046,883 |
| Heron Therapeutics, Inc. (a)(b) | | 72,775 | 953,353 |
| Incyte Corp. (a) | | 17,200 | 1,724,644 |
| Insmed, Inc. (a) | | 330,000 | 4,365,900 |
| Intercept Pharmaceuticals, Inc. (a)(b) | | 31,592 | 3,432,471 |
| Neurocrine Biosciences, Inc. (a) | | 82,000 | 3,173,400 |
| Proteostasis Therapeutics, Inc. | | 63,300 | 776,058 |
| Puma Biotechnology, Inc. (a) | | 85,100 | 2,612,570 |
| Radius Health, Inc. (a)(b) | | 60,000 | 2,281,800 |
| Regeneron Pharmaceuticals, Inc. (a) | | 30,400 | 11,159,536 |
| Spark Therapeutics, Inc. (a)(b) | | 57,548 | 2,871,645 |
| TESARO, Inc. (a)(b) | | 70,000 | 9,413,600 |
| Ultragenyx Pharmaceutical, Inc. (a)(b) | | 75,000 | 5,273,250 |
| Vertex Pharmaceuticals, Inc. (a) | | 304,100 | 22,403,047 |
| Xencor, Inc. (a) | | 105,700 | 2,782,024 |
| | | | 204,947,060 |
| Capital Markets - 0.4% | | | |
| Asset Management & Custody Banks - 0.4% | | | |
| RPI International Holdings LP (c) | | 21,133 | 2,778,461 |
| Diversified Consumer Services - 0.4% | | | |
| Specialized Consumer Services - 0.4% | | | |
| Carriage Services, Inc. | | 83,959 | 2,404,586 |
| Health Care Equipment & Supplies - 24.9% | | | |
| Health Care Equipment - 23.1% | | | |
| Atricure, Inc. (a) | | 180,000 | 3,522,600 |
| Boston Scientific Corp. (a) | | 1,600,000 | 34,608,000 |
| DexCom, Inc. (a) | | 105,000 | 6,268,500 |
| Insulet Corp. (a) | | 178,800 | 6,737,184 |
| Integra LifeSciences Holdings Corp. (a) | | 90,000 | 7,721,100 |
| Intuitive Surgical, Inc. (a) | | 24,000 | 15,220,080 |
| Medtronic PLC | | 660,000 | 47,011,800 |
| Nevro Corp. (a)(b) | | 20,800 | 1,511,328 |
| NxStage Medical, Inc. (a) | | 85,000 | 2,227,850 |
| Penumbra, Inc. (a)(b) | | 100,000 | 6,380,000 |
| Wright Medical Group NV (a) | | 360,000 | 8,272,800 |
| Zeltiq Aesthetics, Inc. (a)(b) | | 170,000 | 7,398,400 |
| Zimmer Biomet Holdings, Inc. | | 58,000 | 5,985,600 |
| | | | 152,865,242 |
| Health Care Supplies - 1.8% | | | |
| The Cooper Companies, Inc. | | 45,374 | 7,937,274 |
| The Spectranetics Corp. (a) | | 155,962 | 3,821,069 |
| | | | 11,758,343 |
|
| TOTAL HEALTH CARE EQUIPMENT & SUPPLIES | | | 164,623,585 |
|
| Health Care Providers & Services - 17.8% | | | |
| Health Care Distributors & Services - 2.0% | | | |
| Amplifon SpA | | 230,000 | 2,191,091 |
| EBOS Group Ltd. | | 380,000 | 4,408,566 |
| McKesson Corp. | | 40,400 | 5,674,180 |
| Oriola-KD Oyj | | 232,800 | 1,056,195 |
| | | | 13,330,032 |
| Health Care Facilities - 1.6% | | | |
| Surgical Care Affiliates, Inc. (a) | | 110,000 | 5,089,700 |
| Universal Health Services, Inc. Class B | | 49,700 | 5,287,086 |
| | | | 10,376,786 |
| Health Care Services - 2.7% | | | |
| American Renal Associates Holdings, Inc. | | 109,900 | 2,338,672 |
| Envision Healthcare Corp. (a) | | 133,600 | 8,455,544 |
| Premier, Inc. (a) | | 100,000 | 3,036,000 |
| Teladoc, Inc. (a)(b) | | 110,000 | 1,815,000 |
| United Drug PLC (United Kingdom) | | 251,400 | 2,071,183 |
| | | | 17,716,399 |
| Managed Health Care - 11.5% | | | |
| Anthem, Inc. | | 114,300 | 16,432,911 |
| Cigna Corp. | | 98,300 | 13,112,237 |
| Humana, Inc. | | 48,800 | 9,956,664 |
| UnitedHealth Group, Inc. | | 228,800 | 36,617,152 |
| | | | 76,118,964 |
|
| TOTAL HEALTH CARE PROVIDERS & SERVICES | | | 117,542,181 |
|
| Health Care Technology - 3.1% | | | |
| Health Care Technology - 3.1% | | | |
| athenahealth, Inc. (a)(b) | | 83,000 | 8,729,110 |
| Castlight Health, Inc. (a) | | 104,900 | 519,255 |
| Evolent Health, Inc. (a)(b) | | 90,000 | 1,332,000 |
| HealthStream, Inc. (a) | | 170,000 | 4,258,500 |
| Medidata Solutions, Inc. (a) | | 120,000 | 5,960,400 |
| | | | 20,799,265 |
| Internet Software & Services - 0.4% | | | |
| Internet Software & Services - 0.4% | | | |
| Benefitfocus, Inc. (a)(b) | | 85,500 | 2,539,350 |
| Life Sciences Tools & Services - 1.3% | | | |
| Life Sciences Tools & Services - 1.3% | | | |
| Agilent Technologies, Inc. | | 183,450 | 8,357,982 |
| Pharmaceuticals - 19.2% | | | |
| Pharmaceuticals - 19.2% | | | |
| Allergan PLC | | 230,000 | 48,302,300 |
| AstraZeneca PLC (United Kingdom) | | 118,683 | 6,481,013 |
| Bristol-Myers Squibb Co. | | 282,200 | 16,491,768 |
| Catalent, Inc. (a) | | 290,000 | 7,818,400 |
| Dechra Pharmaceuticals PLC | | 210,000 | 3,480,914 |
| Eisai Co. Ltd. | | 70,000 | 4,017,626 |
| Endo International PLC (a) | | 42,400 | 698,328 |
| GlaxoSmithKline PLC | | 342,800 | 6,584,676 |
| Jazz Pharmaceuticals PLC (a) | | 41,000 | 4,470,230 |
| Jiangsu Hengrui Medicine Co. Ltd. (A Shares) | | 446,464 | 2,924,998 |
| Lee's Pharmaceutical Holdings Ltd. | | 1,786,500 | 1,442,304 |
| Sun Pharmaceutical Industries Ltd. | | 221,358 | 2,052,188 |
| Teva Pharmaceutical Industries Ltd. sponsored ADR | | 316,600 | 11,476,750 |
| The Medicines Company (a)(b) | | 110,500 | 3,750,370 |
| TherapeuticsMD, Inc. (a)(b) | | 700,000 | 4,039,000 |
| Theravance Biopharma, Inc. (a)(b) | | 97,140 | 3,096,823 |
| | | | 127,127,688 |
| Professional Services - 1.0% | | | |
| Human Resource & Employment Services - 1.0% | | | |
| WageWorks, Inc. (a) | | 90,000 | 6,525,000 |
| TOTAL COMMON STOCKS | | | |
| (Cost $585,432,820) | | | 657,645,158 |
|
| Convertible Preferred Stocks - 0.2% | | | |
| Health Care Providers & Services - 0.2% | | | |
| Health Care Services - 0.2% | | | |
| 1Life Healthcare, Inc. Series G (a)(c) | | | |
| (Cost $1,193,163) | | 181,172 | 1,163,124 |
|
| Money Market Funds - 6.9% | | | |
| Fidelity Securities Lending Cash Central Fund 0.65% (d)(e) | | | |
| (Cost $45,451,447) | | 45,450,526 | 45,455,071 |
| TOTAL INVESTMENT PORTFOLIO - 106.6% | | | |
| (Cost $632,077,430) | | | 704,263,353 |
| NET OTHER ASSETS (LIABILITIES) - (6.6)% | | | (43,548,072) |
| NET ASSETS - 100% | | | $660,715,281 |
Legend
(a) Non-income producing
(b) Security or a portion of the security is on loan at period end.
(c) Restricted securities - Investment in securities not registered under the Securities Act of 1933 (excluding 144A issues). At the end of the period, the value of restricted securities (excluding 144A issues) amounted to $3,941,585 or 0.6% of net assets.
(d) Affiliated fund that is generally available only to investment companies and other accounts managed by Fidelity Investments. The rate quoted is the annualized seven-day yield of the fund at period end. A complete unaudited listing of the fund's holdings as of its most recent quarter end is available upon request. In addition, each Fidelity Central Fund's financial statements, which are not covered by the Fund's Report of Independent Registered Public Accounting Firm, are available on the SEC's website or upon request.
(e) Investment made with cash collateral received from securities on loan.
Additional information on each restricted holding is as follows:
| Security | Acquisition Date | Acquisition Cost |
| 1Life Healthcare, Inc. Series G | 4/10/14 | $1,193,163 |
| RPI International Holdings LP | 5/21/15 - 3/23/16 | $2,801,500 |
Affiliated Central Funds
Information regarding fiscal year to date income earned by the Fund from investments in Fidelity Central Funds is as follows:
| Fund | Income earned |
| Fidelity Cash Central Fund | $17,241 |
| Fidelity Securities Lending Cash Central Fund | 485,239 |
| Total | $502,480 |
Investment Valuation
The following is a summary of the inputs used, as of December 31, 2016, involving the Fund's assets and liabilities carried at fair value. The inputs or methodology used for valuing securities may not be an indication of the risk associated with investing in those securities. For more information on valuation inputs, and their aggregation into the levels used below, please refer to the Investment Valuation section in the accompanying Notes to Financial Statements.
| | Valuation Inputs at Reporting Date: |
| Description | Total | Level 1 | Level 2 | Level 3 |
| Investments in Securities: | | | | |
| Common Stocks | $657,645,158 | $640,358,704 | $14,507,993 | $2,778,461 |
| Convertible Preferred Stocks | 1,163,124 | -- | -- | 1,163,124 |
| Money Market Funds | 45,455,071 | 45,455,071 | -- | -- |
| Total Investments in Securities: | $704,263,353 | $685,813,775 | $14,507,993 | $3,941,585 |
The following is a summary of transfers between Level 1 and Level 2 for the period ended December 31, 2016. Transfers are assumed to have occurred at the beginning of the period, and are primarily attributable to the valuation techniques used for foreign equity securities, as discussed in the accompanying Notes to Financial Statements:
| Transfers | Total |
| Level 1 to Level 2 | $0 |
| Level 2 to Level 1 | $19,222,645 |
Other Information
Distribution of investments by country or territory of incorporation, as a percentage of Total Net Assets, is as follows (Unaudited):
| United States of America | 74.4% |
| Ireland | 15.5% |
| United Kingdom | 2.5% |
| Israel | 1.7% |
| Netherlands | 1.3% |
| Others (Individually Less Than 1%) | 4.6% |
| | 100.0% |
See accompanying notes which are an integral part of the financial statements.
Financial Statements
Statement of Assets and Liabilities
| | | December 31, 2016 |
| Assets | | |
Investment in securities, at value (including securities loaned of $44,319,776) — See accompanying schedule:
Unaffiliated issuers (cost $586,625,983) | $658,808,282 | |
| Fidelity Central Funds (cost $45,451,447) | 45,455,071 | |
| Total Investments (cost $632,077,430) | | $704,263,353 |
| Receivable for investments sold | | 2,906,255 |
| Dividends receivable | | 424,844 |
| Distributions receivable from Fidelity Central Funds | | 42,753 |
| Prepaid expenses | | 4,361 |
| Other receivables | | 5,780 |
| Total assets | | 707,647,346 |
| Liabilities | | |
| Payable to custodian bank | $560,907 | |
| Payable for fund shares redeemed | 462,472 | |
| Accrued management fee | 308,486 | |
| Other affiliated payables | 94,484 | |
| Other payables and accrued expenses | 54,704 | |
| Collateral on Securities Loaned | 45,451,012 | |
| Total liabilities | | 46,932,065 |
| Net Assets | | $660,715,281 |
| Net Assets consist of: | | |
| Paid in capital | | $623,710,767 |
| Undistributed net investment income | | 186,713 |
| Accumulated undistributed net realized gain (loss) on investments and foreign currency transactions | | (35,364,696) |
| Net unrealized appreciation (depreciation) on investments and assets and liabilities in foreign currencies | | 72,182,497 |
| Net Assets | | $660,715,281 |
| Initial Class: | | |
| Net Asset Value, offering price and redemption price per share ($130,887,325 ÷ 6,151,835 shares) | | $21.28 |
| Investor Class: | | |
| Net Asset Value, offering price and redemption price per share ($529,827,956 ÷ 25,102,620 shares) | | $21.11 |
See accompanying notes which are an integral part of the financial statements.
Statement of Operations
| | | Year ended December 31, 2016 |
| Investment Income | | |
| Dividends | | $6,546,147 |
| Income from Fidelity Central Funds (including $485,239 from security lending) | | 502,480 |
| Total income | | 7,048,627 |
| Expenses | | |
| Management fee | $4,522,088 | |
| Transfer agent fees | 1,075,066 | |
| Accounting and security lending fees | 291,885 | |
| Custodian fees and expenses | 47,855 | |
| Independent trustees' fees and expenses | 18,299 | |
| Audit | 50,732 | |
| Legal | 20,549 | |
| Interest | 2,472 | |
| Miscellaneous | 12,675 | |
| Total expenses before reductions | 6,041,621 | |
| Expense reductions | (40,495) | 6,001,126 |
| Net investment income (loss) | | 1,047,501 |
| Realized and Unrealized Gain (Loss) | | |
| Net realized gain (loss) on: | | |
| Investment securities: | | |
| Unaffiliated issuers | (28,872,176) | |
| Fidelity Central Funds | (80) | |
| Foreign currency transactions | (5,349) | |
| Total net realized gain (loss) | | (28,877,605) |
Change in net unrealized appreciation (depreciation) on:
Investment securities | (75,557,979) | |
| Assets and liabilities in foreign currencies | (901) | |
| Total change in net unrealized appreciation (depreciation) | | (75,558,880) |
| Net gain (loss) | | (104,436,485) |
| Net increase (decrease) in net assets resulting from operations | | $(103,388,984) |
See accompanying notes which are an integral part of the financial statements.
Statement of Changes in Net Assets
| | Year ended December 31, 2016 | Year ended December 31, 2015 |
| Increase (Decrease) in Net Assets | | |
| Operations | | |
| Net investment income (loss) | $1,047,501 | $(622,053) |
| Net realized gain (loss) | (28,877,605) | 94,684,617 |
| Change in net unrealized appreciation (depreciation) | (75,558,880) | (49,851,177) |
| Net increase (decrease) in net assets resulting from operations | (103,388,984) | 44,211,387 |
| Distributions to shareholders from net investment income | (773,247) | – |
| Distributions to shareholders from net realized gain | (68,524,802) | (123,218,031) |
| Total distributions | (69,298,049) | (123,218,031) |
| Share transactions - net increase (decrease) | (213,049,661) | 218,815,782 |
| Redemption fees | 89,999 | 224,880 |
| Total increase (decrease) in net assets | (385,646,695) | 140,034,018 |
| Net Assets | | |
| Beginning of period | 1,046,361,976 | 906,327,958 |
| End of period | $660,715,281 | $1,046,361,976 |
| Other Information | | |
| Undistributed net investment income end of period | $186,713 | $– |
See accompanying notes which are an integral part of the financial statements.
Financial Highlights — VIP Health Care Portfolio Initial Class
| Years ended December 31, | 2016 | 2015 | 2014 | 2013 | 2012 |
| Selected Per–Share Data | | | | | |
| Net asset value, beginning of period | $25.92 | $27.70 | $22.56 | $15.51 | $13.69 |
| Income from Investment Operations | | | | | |
| Net investment income (loss)A | .04 | –B | (.02) | –B | .07 |
| Net realized and unrealized gain (loss) | (2.86) | 1.70 | 7.21 | 8.42 | 2.74 |
| Total from investment operations | (2.82) | 1.70 | 7.19 | 8.42 | 2.81 |
| Distributions from net investment income | (.04) | – | – | – | (.06) |
| Distributions from net realized gain | (1.78) | (3.49) | (2.06) | (1.37) | (.92) |
| Total distributions | (1.82) | (3.49) | (2.06) | (1.37) | (.99)C |
| Redemption fees added to paid in capitalA | –B | .01 | .01 | –B | –B |
| Net asset value, end of period | $21.28 | $25.92 | $27.70 | $22.56 | $15.51 |
| Total ReturnD,E | (10.43)% | 6.37% | 32.83% | 56.12% | 20.81% |
| Ratios to Average Net AssetsF,G | | | | | |
| Expenses before reductions | .67% | .66% | .67% | .69% | .72% |
| Expenses net of fee waivers, if any | .67% | .66% | .67% | .69% | .72% |
| Expenses net of all reductions | .66% | .65% | .66% | .68% | .71% |
| Net investment income (loss) | .19% | - %H | (.07)% | (.01)% | .47% |
| Supplemental Data | | | | | |
| Net assets, end of period (000 omitted) | $130,887 | $226,283 | $236,566 | $167,493 | $69,363 |
| Portfolio turnover rateI | 53% | 77% | 104% | 93% | 98% |
A Calculated based on average shares outstanding during the period.
B Amount represents less than $.005 per share.
C Total distributions of $.99 per share is comprised of distributions from net investment income of $.063 and distributions from net realized gain of $.924 per share.
D Total returns do not reflect charges attributable to your insurance company's separate account. Inclusion of these charges would reduce the total returns shown.
E Total returns would have been lower if certain expenses had not been reduced during the applicable periods shown.
F Fees and expenses of any underlying Fidelity Central Funds are not included in the Fund's expense ratio. The Fund indirectly bears its proportionate share of the expenses of any underlying Fidelity Central Funds.
G Expense ratios reflect operating expenses of the class. Expenses before reductions do not reflect amounts reimbursed by the investment adviser or reductions from brokerage service arrangements or reductions from other expense offset arrangements and do not represent the amount paid by the class during periods when reimbursements or reductions occur. Expenses net of fee waivers reflect expenses after reimbursement by the investment adviser but prior to reductions from brokerage service arrangements or other expense offset arrangements. Expenses net of all reductions represent the net expenses paid by the class.
H Amount represents less than .005%.
I Amount does not include the portfolio activity of any underlying Fidelity Central Funds.
See accompanying notes which are an integral part of the financial statements.
Financial Highlights — VIP Health Care Portfolio Investor Class
| Years ended December 31, | 2016 | 2015 | 2014 | 2013 | 2012 |
| Selected Per–Share Data | | | | | |
| Net asset value, beginning of period | $25.73 | $27.52 | $22.43 | $15.44 | $13.63 |
| Income from Investment Operations | | | | | |
| Net investment income (loss)A | .02 | (.02) | (.04) | (.02) | .06 |
| Net realized and unrealized gain (loss) | (2.84) | 1.69 | 7.17 | 8.37 | 2.73 |
| Total from investment operations | (2.82) | 1.67 | 7.13 | 8.35 | 2.79 |
| Distributions from net investment income | (.02) | – | – | – | (.05) |
| Distributions from net realized gain | (1.78) | (3.47) | (2.05) | (1.36) | (.92) |
| Total distributions | (1.80) | (3.47) | (2.05) | (1.36) | (.98)B |
| Redemption fees added to paid in capitalA | –C | .01 | .01 | –C | –C |
| Net asset value, end of period | $21.11 | $25.73 | $27.52 | $22.43 | $15.44 |
| Total ReturnD,E | (10.51)% | 6.29% | 32.72% | 55.91% | 20.75% |
| Ratios to Average Net AssetsF,G | | | | | |
| Expenses before reductions | .75% | .74% | .75% | .77% | .80% |
| Expenses net of fee waivers, if any | .75% | .74% | .75% | .77% | .80% |
| Expenses net of all reductions | .75% | .73% | .74% | .76% | .79% |
| Net investment income (loss) | .11% | (.08)% | (.15)% | (.10)% | .39% |
| Supplemental Data | | | | | |
| Net assets, end of period (000 omitted) | $529,828 | $820,079 | $669,762 | $384,285 | $115,132 |
| Portfolio turnover rateH | 53% | 77% | 104% | 93% | 98% |
A Calculated based on average shares outstanding during the period.
B Total distributions of $.98 per share is comprised of distributions from net investment income of $.052 and distributions from net realized gain of $.924 per share.
C Amount represents less than $.005 per share.
D Total returns do not reflect charges attributable to your insurance company's separate account. Inclusion of these charges would reduce the total returns shown.
E Total returns would have been lower if certain expenses had not been reduced during the applicable periods shown.
F Fees and expenses of any underlying Fidelity Central Funds are not included in the Fund's expense ratio. The Fund indirectly bears its proportionate share of the expenses of any underlying Fidelity Central Funds.
G Expense ratios reflect operating expenses of the class. Expenses before reductions do not reflect amounts reimbursed by the investment adviser or reductions from brokerage service arrangements or reductions from other expense offset arrangements and do not represent the amount paid by the class during periods when reimbursements or reductions occur. Expenses net of fee waivers reflect expenses after reimbursement by the investment adviser but prior to reductions from brokerage service arrangements or other expense offset arrangements. Expenses net of all reductions represent the net expenses paid by the class.
H Amount does not include the portfolio activity of any underlying Fidelity Central Funds.
See accompanying notes which are an integral part of the financial statements.
Notes to Financial Statements
For the period ended December 31, 2016
1. Organization.
VIP Health Care Portfolio (the Fund) is a fund of Variable Insurance Products Fund IV (the Trust) and is authorized to issue an unlimited number of shares. The Trust is registered under the Investment Company Act of 1940, as amended (the 1940 Act), as an open-end management investment company organized as a Massachusetts business trust. Shares of the Fund may only be purchased by insurance companies for the purpose of funding variable annuity or variable life insurance contracts. The Fund offers the following classes of shares: Initial Class shares and Investor Class shares. All classes have equal rights and voting privileges, except for matters affecting a single class.
2. Investments in Fidelity Central Funds.
The Fund invests in Fidelity Central Funds, which are open-end investment companies generally available only to other investment companies and accounts managed by the investment adviser and its affiliates. The Fund's Schedule of Investments lists each of the Fidelity Central Funds held as of period end, if any, as an investment of the Fund, but does not include the underlying holdings of each Fidelity Central Fund. As an Investing Fund, the Fund indirectly bears its proportionate share of the expenses of the underlying Fidelity Central Funds.
The Money Market Central Funds seek preservation of capital and current income and are managed by Fidelity Investments Money Management, Inc. (FIMM), an affiliate of the investment adviser. Annualized expenses of the Money Market Central Funds as of their most recent shareholder report date are less than .005%.
A complete unaudited list of holdings for each Fidelity Central Fund is available upon request or at the Securities and Exchange Commission (the SEC) website at www.sec.gov. In addition, the financial statements of the Fidelity Central Funds, which are not covered by the Fund's Report of Independent Registered Public Accounting Firm, are available on the SEC website or upon request.
3. Significant Accounting Policies.
The financial statements have been prepared in conformity with accounting principles generally accepted in the United States of America (GAAP), which require management to make certain estimates and assumptions at the date of the financial statements. Actual results could differ from those estimates. Subsequent events, if any, through the date that the financial statements were issued have been evaluated in the preparation of the financial statements. The following summarizes the significant accounting policies of the Fund:
Investment Valuation. Investments are valued as of 4:00 p.m. Eastern time on the last calendar day of the period. The Board of Trustees (the Board) has delegated the day to day responsibility for the valuation of the Fund's investments to the Fair Value Committee (the Committee) established by the Fund's investment adviser. In accordance with valuation policies and procedures approved by the Board, the Fund attempts to obtain prices from one or more third party pricing vendors or brokers to value its investments. When current market prices, quotations or currency exchange rates are not readily available or reliable, investments will be fair valued in good faith by the Committee, in accordance with procedures adopted by the Board. Factors used in determining fair value vary by investment type and may include market or investment specific events. The frequency with which these procedures are used cannot be predicted and they may be utilized to a significant extent. The Committee oversees the Fund's valuation policies and procedures and reports to the Board on the Committee's activities and fair value determinations. The Board monitors the appropriateness of the procedures used in valuing the Fund's investments and ratifies the fair value determinations of the Committee.
The Fund categorizes the inputs to valuation techniques used to value its investments into a disclosure hierarchy consisting of three levels as shown below:
- Level 1 – quoted prices in active markets for identical investments
- Level 2 – other significant observable inputs (including quoted prices for similar investments, interest rates, prepayment speeds, etc.)
- Level 3 – unobservable inputs (including the Fund's own assumptions based on the best information available)
Valuation techniques used to value the Fund's investments by major category are as follows:
Equity securities, including restricted securities, for which market quotations are readily available, are valued at the last reported sale price or official closing price as reported by a third party pricing vendor on the primary market or exchange on which they are traded and are categorized as Level 1 in the hierarchy. In the event there were no sales during the day or closing prices are not available, securities are valued at the last quoted bid price or may be valued using the last available price and are generally categorized as Level 2 in the hierarchy. For foreign equity securities, when market or security specific events arise, comparisons to the valuation of American Depositary Receipts (ADRs), futures contracts, Exchange-Traded Funds (ETFs) and certain indexes as well as quoted prices for similar securities may be used and would be categorized as Level 2 in the hierarchy. Utilizing these techniques may result in transfers between Level 1 and Level 2. For equity securities, including restricted securities, where observable inputs are limited, assumptions about market activity and risk are used and these securities may be categorized as Level 3 in the hierarchy.
Investments in open-end mutual funds, including Fidelity Central Funds, are valued at their closing net asset value (NAV) each business day and are categorized as Level 1 in the hierarchy.
Changes in valuation techniques may result in transfers in or out of an assigned level within the disclosure hierarchy. The aggregate value of investments by input level as of December 31, 2016, including information on transfers between Levels 1 and 2, is included at the end of the Fund's Schedule of Investments.
Foreign Currency. The Fund may use foreign currency contracts to facilitate transactions in foreign-denominated securities. Gains and losses from these transactions may arise from changes in the value of the foreign currency or if the counterparties do not perform under the contracts' terms.
Foreign-denominated assets, including investment securities, and liabilities are translated into U.S. dollars at the exchange rates at period end. Purchases and sales of investment securities, income and dividends received and expenses denominated in foreign currencies are translated into U.S. dollars at the exchange rate in effect on the transaction date.
The effects of exchange rate fluctuations on investments are included with the net realized and unrealized gain (loss) on investment securities. Other foreign currency transactions resulting in realized and unrealized gain (loss) are disclosed separately.
Investment Transactions and Income. For financial reporting purposes, the Fund's investment holdings and NAV include trades executed through the end of the last business day of the period. The NAV per share for processing shareholder transactions is calculated as of the close of business of the New York Stock Exchange (NYSE), normally 4:00 p.m. Eastern time and includes trades executed through the end of the prior business day. Gains and losses on securities sold are determined on the basis of identified cost and may include proceeds received from litigation. Dividend income is recorded on the ex-dividend date, except for certain dividends from foreign securities where the ex-dividend date may have passed, which are recorded as soon as the Fund is informed of the ex-dividend date. Non-cash dividends included in dividend income, if any, are recorded at the fair market value of the securities received. Income and capital gain distributions from Fidelity Central Funds, if any, are recorded on the ex-dividend date. Interest income is accrued as earned and includes coupon interest and amortization of premium and accretion of discount on debt securities as applicable. Investment income is recorded net of foreign taxes withheld where recovery of such taxes is uncertain.
Class Allocations and Expenses. Investment income, realized and unrealized capital gains and losses, common expenses of the Fund, and certain fund-level expense reductions, if any, are allocated daily on a pro-rata basis to each class based on the relative net assets of each class to the total net assets of the Fund. Each class differs with respect to transfer agent fees incurred. Certain expense reductions may also differ by class. For the reporting period, the allocated portion of income and expenses to each class as a percent of its average net assets may vary due to the timing of recording these transactions in relation to fluctuating net assets of the classes. Expenses directly attributable to a fund are charged to that fund. Expenses attributable to more than one fund are allocated among the respective funds on the basis of relative net assets or other appropriate methods. Expense estimates are accrued in the period to which they relate and adjustments are made when actual amounts are known.
Income Tax Information and Distributions to Shareholders. Each year, the Fund intends to qualify as a regulated investment company under Subchapter M of the Internal Revenue Code, including distributing substantially all of its taxable income and realized gains. As a result, no provision for U.S. Federal income taxes is required. As of December 31, 2016, the Fund did not have any unrecognized tax benefits in the financial statements; nor is the Fund aware of any tax positions for which it is reasonably possible that the total amounts of unrecognized tax benefits will significantly change in the next twelve months. The Fund files a U.S. federal tax return, in addition to state and local tax returns as required. The Fund's federal income tax returns are subject to examination by the Internal Revenue Service (IRS) for a period of three fiscal years after they are filed. State and local tax returns may be subject to examination for an additional fiscal year depending on the jurisdiction. Foreign taxes are provided for based on the Fund's understanding of the tax rules and rates that exist in the foreign markets in which it invests.
Distributions are declared and recorded on the ex-dividend date. Income dividends and capital gain distributions are declared separately for each class. Income and capital gain distributions are determined in accordance with income tax regulations, which may differ from GAAP.
Capital accounts within the financial statements are adjusted for permanent book-tax differences. These adjustments have no impact on net assets or the results of operations. Capital accounts are not adjusted for temporary book-tax differences which will reverse in a subsequent period.
Book-tax differences are primarily due to foreign currency transactions, passive foreign investment companies (PFIC), capital loss carryforwards, and losses deferred due to wash sales.
The federal tax cost of investment securities and unrealized appreciation (depreciation) as of period end were as follows:
| Gross unrealized appreciation | $123,690,684 |
| Gross unrealized depreciation | (55,754,453) |
| Net unrealized appreciation (depreciation) on securities | $67,936,231 |
| Tax Cost | $636,327,122 |
The tax-based components of distributable earnings as of period end were as follows:
| Undistributed ordinary income | $186,714 |
| Capital loss carryforward | $(31,115,005) |
| Net unrealized appreciation (depreciation) on securities and other investments | $67,932,805 |
Capital loss carryforwards are only available to offset future capital gains of the Fund to the extent provided by regulations and may be limited. Under the Regulated Investment Company Modernization Act of 2010 (the Act), the Fund is permitted to carry forward capital losses incurred in taxable years beginning after December 22, 2010 for an unlimited period and such capital losses are required to be used prior to any losses that expire. The capital loss carryforward information presented below, including any applicable limitation, is estimated as of fiscal period end and is subject to adjustment.
| No expiration | |
| Short-term | $(31,115,005) |
| Total capital loss carryforward | $(31,115,005) |
The tax character of distributions paid was as follows:
| | December 31, 2016 | December 31, 2015 |
| Ordinary Income | $4,545,960 | $ 51,352,174 |
| Long-term Capital Gains | 64,752,089 | 71,865,857 |
| Total | $69,298,049 | $ 123,218,031 |
Trading (Redemption) Fees. Shares held by investors less than 60 days may be subject to a redemption fee equal to 1% of the NAV of shares redeemed. All redemption fees, which reduce the proceeds of the shareholder redemption, are retained by the Fund and accounted for as an addition to paid in capital.
Restricted Securities. The Fund may invest in securities that are subject to legal or contractual restrictions on resale. These securities generally may be resold in transactions exempt from registration or to the public if the securities are registered. Disposal of these securities may involve time-consuming negotiations and expense, and prompt sale at an acceptable price may be difficult. Information regarding restricted securities is included at the end of the Fund's Schedule of Investments.
4. Purchases and Sales of Investments.
Purchases and sales of securities, other than short-term securities, aggregated $435,769,977 and $703,717,643, respectively.
5. Fees and Other Transactions with Affiliates.
Management Fee. Fidelity SelectCo, LLC (the investment adviser) and its affiliates provide the Fund with investment management related services for which the Fund pays a monthly management fee. The management fee is the sum of an individual fund fee rate that is based on an annual rate of .30% of the Fund's average net assets and an annualized group fee rate that averaged .25% during the period. The group fee rate is based upon the average net assets of all the mutual funds advised by Fidelity Management & Research Company (FMR) and the investment adviser. The group fee rate decreases as assets under management increase and increases as assets under management decrease. For the reporting period, the total annual management fee rate was .55% of the Fund's average net assets.
Transfer Agent Fees. Fidelity Investments Institutional Operations Company, Inc. (FIIOC), an affiliate of the investment adviser, is the Fund's transfer, dividend disbursing, and shareholder servicing agent. FIIOC receives an asset-based fee with respect to each class. Each class (with the exception of Investor Class) pays a fee for transfer agent services, typesetting, and printing and mailing of shareholder reports, excluding mailing of proxy statements, equal to an annual rate of .07% (.15% for Investor Class) of class-level average net assets. For the period, transfer agent fees for each class were as follows:
| Initial Class | $111,419 |
| Investor Class | 963,647 |
| | $1,075,066 |
Accounting and Security Lending Fees. Fidelity Service Company, Inc. (FSC), an affiliate of the investment adviser, maintains the Fund's accounting records. The accounting fee is based on the level of average net assets for each month. Under a separate contract, FSC administers the security lending program. The security lending fee is based on the number and duration of lending transactions.
Brokerage Commissions. The Fund placed a portion of its portfolio transactions with brokerage firms which are affiliates of the investment adviser. Brokerage commissions are included in net realized gain (loss) and change in net unrealized appreciation (depreciation) in the Statement of Operations. The commissions paid to these affiliated firms were $15,282 for the period.
Interfund Lending Program. Pursuant to an Exemptive Order issued by the SEC, the Fund, along with other registered investment companies having management contracts with Fidelity Management & Research Company (FMR) or other affiliated entities of FMR, may participate in an interfund lending program. This program provides an alternative credit facility allowing the funds to borrow from, or lend money to, other participating affiliated funds. At period end, there were no interfund loans outstanding. The Fund's activity in this program during the period for which loans were outstanding was as follows:
| Borrower or Lender | Average Loan Balance | Weighted Average Interest Rate | Interest Expense |
| Borrower | $4,125,857 | .59% | $2,358 |
Interfund Trades. The Fund may purchase from or sell securities to other Fidelity Funds under procedures adopted by the Board. The procedures have been designed to ensure these interfund trades are executed in accordance with Rule 17a-7 of the 1940 Act. Interfund trades are included within the respective purchases and sales amounts shown in the Purchases and Sales of Investments note.
6. Committed Line of Credit.
The Fund participates with other funds managed by the investment adviser or an affiliate in a $4.25 billion credit facility (the "line of credit") to be utilized for temporary or emergency purposes to fund shareholder redemptions or for other short-term liquidity purposes. The Fund has agreed to pay commitment fees on its pro-rata portion of the line of credit, which amounted to $2,261 and is reflected in Miscellaneous expenses on the Statement of Operations. During the period, the Fund did not borrow on this line of credit.
7. Security Lending.
The Fund lends portfolio securities through a lending agent from time to time in order to earn additional income. On the settlement date of the loan, the Fund receives collateral (in the form of U.S. Treasury obligations, letters of credit and/or cash) against the loaned securities and maintains collateral in an amount not less than 100% of the market value of the loaned securities during the period of the loan. The market value of the loaned securities is determined at the close of business of the Fund and any additional required collateral is delivered to the Fund on the next business day. The Fund or borrower may terminate the loan at any time, and if the borrower defaults on its obligation to return the securities loaned because of insolvency or other reasons, the Fund may apply collateral received from the borrower against the obligation. The Fund may experience delays and costs in recovering the securities loaned. Any cash collateral received is invested in the Fidelity Securities Lending Cash Central Fund. The value of loaned securities and cash collateral at period end are disclosed on the Fund's Statement of Assets and Liabilities. Security lending income represents the income earned on investing cash collateral, less rebates paid to borrowers and any lending agent fees associated with the loan, plus any premium payments received for lending certain types of securities. Security lending income is presented in the Statement of Operations as a component of income from Fidelity Central Funds.
8. Bank Borrowings.
The Fund is permitted to have bank borrowings for temporary or emergency purposes to fund shareholder redemptions or for other short-term liquidity requirements. The Fund has established borrowing arrangements with certain banks. The interest rate on the borrowings is the bank's base rate, as revised from time to time. The average loan balance during the period for which loans were outstanding amounted to $1,142,250. The weighted average interest rate was .90%. The interest expense amounted to $114 under the bank borrowing program. At period end, there were no bank borrowings outstanding.
9. Expense Reductions.
Commissions paid to certain brokers with whom the investment adviser, or its affiliates, places trades on behalf of the Fund include an amount in addition to trade execution, which may be rebated back to the Fund to offset certain expenses. This amount totaled $33,117 for the period.
In addition, during the period the investment adviser reimbursed and/or waived a portion of the fund-level operating expenses in the amount of $7,378.
10. Distributions to Shareholders.
Distributions to shareholders of each class were as follows:
| | Year ended
December 31, 2016 | Year ended
December 31, 2015 |
| From net investment income | | |
| Initial Class | $241,998 | $– |
| Investor Class | 531,249 | – |
| Total | $773,247 | $– |
| From net realized gain | | |
| Initial Class | $14,284,342 | $30,210,181 |
| Investor Class | 54,240,460 | 93,007,850 |
| Total | $68,524,802 | $123,218,031 |
11. Share Transactions.
Transactions for each class of shares were as follows:
| | Shares | Shares | Dollars | Dollars |
| | Year ended December 31, 2016 | Year ended December 31, 2015 | Year ended December 31, 2016 | Year ended December 31, 2015 |
| Initial Class | | | | |
| Shares sold | 420,434 | 1,478,196 | $9,271,229 | $41,537,933 |
| Reinvestment of distributions | 725,648 | 1,154,539 | 14,526,340 | 30,210,181 |
| Shares redeemed | (3,723,446) | (2,443,437) | (82,827,974) | (64,565,178) |
| Net increase (decrease) | (2,577,364) | 189,298 | $(59,030,405) | $7,182,936 |
| Investor Class | | | | |
| Shares sold | 973,822 | 7,956,795 | $21,453,416 | $222,275,001 |
| Reinvestment of distributions | 2,759,192 | 3,588,210 | 54,771,709 | 93,007,850 |
| Shares redeemed | (10,500,085) | (4,010,905) | (230,244,381) | (103,650,005) |
| Net increase (decrease) | (6,767,071) | 7,534,100 | $(154,019,256) | $211,632,846 |
12. Other.
The Fund's organizational documents provide former and current trustees and officers with a limited indemnification against liabilities arising in connection with the performance of their duties to the Fund. In the normal course of business, the Fund may also enter into contracts that provide general indemnifications. The Fund's maximum exposure under these arrangements is unknown as this would be dependent on future claims that may be made against the Fund. The risk of material loss from such claims is considered remote.
At the end of the period, the investment adviser or its affiliates were the owners of record of 100% of the total outstanding shares of the Fund.
Report of Independent Registered Public Accounting Firm
To the Trustees of Variable Insurance Products Fund IV and Shareholders of VIP Health Care Portfolio:
In our opinion, the accompanying statement of assets and liabilities, including the schedule of investments, and the related statements of operations and of changes in net assets and the financial highlights present fairly, in all material respects, the financial position of VIP Health Care Portfolio (a fund of Variable Insurance Products Fund IV) (the "Fund") as of December 31, 2016, the results of its operations for the year then ended, the changes in its net assets for each of the two years in the period then ended and the financial highlights for each of the five years in the period then ended, in conformity with accounting principles generally accepted in the United States of America. These financial statements and financial highlights (hereafter referred to as “financial statements”) are the responsibility of the Fund's management. Our responsibility is to express an opinion on these financial statements based on our audits. We conducted our audits of these financial statements in accordance with the standards of the Public Company Accounting Oversight Board (United States). Those standards require that we plan and perform the audit to obtain reasonable assurance about whether the financial statements are free of material misstatement. An audit includes examining, on a test basis, evidence supporting the amounts and disclosures in the financial statements, assessing the accounting principles used and significant estimates made by management, and evaluating the overall financial statement presentation. We believe that our audits, which included confirmation of securities as of December 31, 2016 by correspondence with the custodian and brokers, provide a reasonable basis for our opinion.
PricewaterhouseCoopers LLP
Boston, Massachusetts
February 16, 2017
Trustees and Officers
The Trustees, Members of the Advisory Board (if any), and officers of the trust and fund, as applicable, are listed below. The Board of Trustees governs the fund and is responsible for protecting the interests of shareholders. The Trustees are experienced executives who meet periodically throughout the year to oversee the fund's activities, review contractual arrangements with companies that provide services to the fund, oversee management of the risks associated with such activities and contractual arrangements, and review the fund's performance. Each of the Trustees oversees 83 funds.
The Trustees hold office without limit in time except that (a) any Trustee may resign; (b) any Trustee may be removed by written instrument, signed by at least two-thirds of the number of Trustees prior to such removal; (c) any Trustee who requests to be retired or who has become incapacitated by illness or injury may be retired by written instrument signed by a majority of the other Trustees; and (d) any Trustee may be removed at any special meeting of shareholders by a two-thirds vote of the outstanding voting securities of the trust. Each Trustee who is not an interested person (as defined in the 1940 Act) of the trust and the fund is referred to herein as an Independent Trustee. Each Independent Trustee shall retire not later than the last day of the calendar year in which his or her 75th birthday occurs. The Independent Trustees may waive this mandatory retirement age policy with respect to individual Trustees. Officers and Advisory Board Members hold office without limit in time, except that any officer or Advisory Board Member may resign or may be removed by a vote of a majority of the Trustees at any regular meeting or any special meeting of the Trustees. Except as indicated, each individual has held the office shown or other offices in the same company for the past five years.
The fund’s Statement of Additional Information (SAI) includes more information about the Trustees. To request a free copy, call Fidelity at 1-877-208-0098.
Experience, Skills, Attributes, and Qualifications of the Trustees. The Governance and Nominating Committee has adopted a statement of policy that describes the experience, qualifications, attributes, and skills that are necessary and desirable for potential Independent Trustee candidates (Statement of Policy). The Board believes that each Trustee satisfied at the time he or she was initially elected or appointed a Trustee, and continues to satisfy, the standards contemplated by the Statement of Policy. The Governance and Nominating Committee also engages professional search firms to help identify potential Independent Trustee candidates who have the experience, qualifications, attributes, and skills consistent with the Statement of Policy. From time to time, additional criteria based on the composition and skills of the current Independent Trustees, as well as experience or skills that may be appropriate in light of future changes to board composition, business conditions, and regulatory or other developments, have also been considered by the professional search firms and the Governance and Nominating Committee. In addition, the Board takes into account the Trustees' commitment and participation in Board and committee meetings, as well as their leadership of standing and ad hoc committees throughout their tenure.
In determining that a particular Trustee was and continues to be qualified to serve as a Trustee, the Board has considered a variety of criteria, none of which, in isolation, was controlling. The Board believes that, collectively, the Trustees have balanced and diverse experience, qualifications, attributes, and skills, which allow the Board to operate effectively in governing the fund and protecting the interests of shareholders. Information about the specific experience, skills, attributes, and qualifications of each Trustee, which in each case led to the Board's conclusion that the Trustee should serve (or continue to serve) as a trustee of the fund, is provided below.
Board Structure and Oversight Function. Brian B. Hogan is an interested person and currently serves as Chairman. The Trustees have determined that an interested Chairman is appropriate and benefits shareholders because an interested Chairman has a personal and professional stake in the quality and continuity of services provided to the fund. Independent Trustees exercise their informed business judgment to appoint an individual of their choosing to serve as Chairman, regardless of whether the Trustee happens to be independent or a member of management. The Independent Trustees have determined that they can act independently and effectively without having an Independent Trustee serve as Chairman and that a key structural component for assuring that they are in a position to do so is for the Independent Trustees to constitute a substantial majority for the Board. The Independent Trustees also regularly meet in executive session. Michael E. Wiley serves as Chairman of the Independent Trustees and as such (i) acts as a liaison between the Independent Trustees and management with respect to matters important to the Independent Trustees and (ii) with management prepares agendas for Board meetings.
Fidelity® funds are overseen by different Boards of Trustees. The fund's Board oversees Fidelity's sector portfolios. Other Boards oversee Fidelity's equity and high income funds, and Fidelity's investment grade bond, money market, and asset allocation funds. The use of separate Boards, each with its own committee structure, allows the Trustees of each group of Fidelity® funds to focus on the unique issues of the funds they oversee, including common research, investment, and operational issues. On occasion, the separate Boards establish joint committees to address issues of overlapping consequences for the Fidelity® funds overseen by each Board.
The Trustees operate using a system of committees to facilitate the timely and efficient consideration of all matters of importance to the Trustees, the fund, and fund shareholders and to facilitate compliance with legal and regulatory requirements and oversight of the fund's activities and associated risks. The Board, acting through its committees, has charged SelectCo and its affiliates with (i) identifying events or circumstances the occurrence of which could have demonstrably adverse effects on the fund's business and/or reputation; (ii) implementing processes and controls to lessen the possibility that such events or circumstances occur or to mitigate the effects of such events or circumstances if they do occur; and (iii) creating and maintaining a system designed to evaluate continuously business and market conditions in order to facilitate the identification and implementation processes described in (i) and (ii) above. Because the day-to-day operations and activities of the fund are carried out by or through SelectCo, its affiliates, and other service providers, the fund's exposure to risks is mitigated but not eliminated by the processes overseen by the Trustees. While each of the Board's committees has responsibility for overseeing different aspects of the fund's activities, oversight is exercised primarily through the Operations and Audit Committees. Appropriate personnel, including but not limited to the fund's Chief Compliance Officer (CCO), SelectCo's internal auditor, the independent accountants, the fund's Treasurer and portfolio management personnel, make periodic reports to the Board's committees, as appropriate. The responsibilities of each standing committee, including their oversight responsibilities, are described further under "Standing Committees of the Trustees."
Interested Trustees*:
Correspondence intended for a Trustee who is an interested person may be sent to Fidelity Investments, 245 Summer Street, Boston, Massachusetts 02210.
Name, Year of Birth; Principal Occupations and Other Relevant Experience+
Brian B. Hogan (1964)
Year of Election or Appointment: 2014
Trustee
Chairman of the Board of Trustees
Mr. Hogan also serves as Trustee or Vice President of other funds. Mr. Hogan serves as a Director of FMR Investment Management (UK) Limited (investment adviser firm, 2015-present) and Fidelity SelectCo, LLC (investment adviser firm, 2014-present) and President of the Equity Division of FMR (investment adviser firm, 2009-present). Previously, Mr. Hogan served as Senior Vice President, Equity Research of FMR (2006-2009) and as a portfolio manager. Mr. Brian B. Hogan is not related to Mr. Colm A. Hogan.
* Determined to be an "Interested Trustee" by virtue of, among other things, his or her affiliation with the trust or various entities under common control with SelectCo.
+ The information includes the Trustee's principal occupation during the last five years and other information relating to the experience, attributes, and skills relevant to the Trustee's qualifications to serve as a Trustee, which led to the conclusion that the Trustee should serve as a Trustee for the fund.
Independent Trustees:
Correspondence intended for an Independent Trustee may be sent to Fidelity Investments, P.O. Box 55235, Boston, Massachusetts 02205-5235.
Name, Year of Birth; Principal Occupations and Other Relevant Experience+
David A. Rosow (1942)
Year of Election or Appointment: 2013
Trustee
Mr. Rosow also serves as Trustee of other Fidelity® funds. Prior to his retirement in 2006, Mr. Rosow was the Chief Executive Officer, owner and operator of a number of private companies, which encompassed the oil refining, drilling and marketing of petroleum products (including specialty petroleum products), recreation industry, and real estate development. Mr. Rosow currently serves as a Director of Oxbow Carbon LLC (upgraders, marketers, and distributors of petroleum byproducts of the oil refining process, 2015-present) and Oxbridge Academy of the Palm Beaches (2015-present) and serves as its President and CEO. Previously, Mr. Rosow served on the Fairfield Country Day School Board for 27 years, including as its President for 3 years, stepping down in 2006. Mr. Rosow served as Lead Director and Chairman of the Audit Committee of Hudson United Bancorp (1996-2006), Chairman of the Board of Westport Bank and Trust (1992-1996), and as a Director of TD Banknorth (2006-2007). In addition, Mr. Rosow served as a member (2008-2014) and President (2009-2014) of the Town Council of Palm Beach, Florida. Mr. Rosow also served as a Member of the Advisory Board of certain Fidelity® funds (2012-2013).
Garnett A. Smith (1947)
Year of Election or Appointment: 2013
Trustee
Mr. Smith also serves as Trustee of other Fidelity® funds. Prior to Mr. Smith's retirement, he served as Chairman and Chief Executive Officer of Inbrand Corp. (manufacturer of personal absorbent products, 1990-1997). He also served as President (1986-1990) of Inbrand Corp. Prior to his employment with Inbrand Corp., he was employed by a retail fabric chain and North Carolina National Bank. In addition, Mr. Smith served as a Member of the Advisory Board of certain Fidelity® funds (2012-2013) and as a board member of the Jackson Hole Land Trust (2009-2012).
Michael E. Wiley (1950)
Year of Election or Appointment: 2008
Trustee
Chairman of the Independent Trustees
Mr. Wiley also serves as Trustee of other Fidelity® funds. Mr. Wiley serves as a Director of Tesoro Corporation (independent oil refiner and marketer, 2005-present), a Director of Tesoro Logistics LP (natural resources logistics, 2015-present), and a Director of Bill Barrett Corporation (exploration and production, 2005-present). In addition, Mr. Wiley also serves as a Director of Post Oak Bank (privately-held bank, 2004-present). Previously, Mr. Wiley served as a Trustee of other Fidelity® funds (2008-2013), as a Director of Asia Pacific Exploration Consolidated (international oil and gas exploration and production, 2008-2013), as a member of the Board of Trustees of the University of Tulsa (2000-2006; 2007-2010), as a Senior Energy Advisor of Katzenbach Partners, LLC (consulting, 2006-2007), as an Advisory Director of Riverstone Holdings (private investment), Chairman, President, and CEO of Baker Hughes, Inc. (oilfield services, 2000-2004), and as Director of Spinnaker Exploration Company (exploration and production, 2001-2005).
+ The information includes the Trustee's principal occupation during the last five years and other information relating to the experience, attributes, and skills relevant to the Trustee's qualifications to serve as a Trustee, which led to the conclusion that the Trustee should serve as a Trustee for the fund.
Advisory Board Members and Officers:
Correspondence intended for a Member of the Advisory Board may be sent to Fidelity Investments, P.O. Box 55235, Boston, Massachusetts 02205-5235. Except for Anthony R. Rochte, correspondence intended for an officer may be sent to Fidelity Investments, 245 Summer Street, Boston, Massachusetts 02210. Correspondence intended for Mr. Rochte may be sent to SelectCo, 1225 17th Street, Denver, Colorado 80202-5541. Officers appear below in alphabetical order.
Name, Year of Birth; Principal Occupation
Donald F. Donahue (1950)
Year of Election or Appointment: 2015
Member of the Advisory Board
Mr. Donahue also serves as a Trustee or Member of the Advisory Board of other Fidelity® funds. Mr. Donahue is President and Chief Executive Officer of Miranda Partners, LLC (risk consulting for the financial services industry, 2012-present) and a consultant for the Institute for Defense Analyses (national security, 2012-present). Previously, Mr. Donahue served as Chief Executive Officer (2006-2012), Chief Operating Officer (2003-2006), and Managing Director, Customer Marketing and Development (1999-2003) of The Depository Trust & Clearing Corporation (financial markets infrastructure). Mr. Donahue serves as a Member (2012-present) and Co-Chairman (2016-present) of the Board of Directors of United Way of New York, Member of the Board of Directors of NYC Leadership Academy (2012-present) and Member of the Board of Advisors of Ripple Labs, Inc. (financial services, 2015-present). He also served as Chairman (2010-2012) and Member of the Board of Directors (2012-2013) of Omgeo, LLC (financial services), Treasurer of United Way of New York (2012-2016), and Member of the Board of Directors of XBRL US (financial services non-profit, 2009-2012) and the International Securities Services Association (2009-2012).
Carol B. Tomé (1957)
Year of Election or Appointment: 2017
Member of the Advisory Board
Ms. Tomé also serves as Trustee or Member of the Advisory Board of other Fidelity® funds. Ms. Tomé is Chief Financial Officer (2001-present) and Executive Vice President of Corporate Services (2007-present) of The Home Depot, Inc. (home improvement retailer) and a Director (2003-present) and Chair of the Audit Committee (2004-present) of United Parcel Service, Inc. (package delivery and supply chain management). Previously, Ms. Tomé served as Senior Vice President of Finance and Accounting/Treasurer (2000-2007) and Vice President and Treasurer (1995-2000) of The Home Depot, Inc. and Chair of the Board (2010-2012), Vice Chair of the Board (2009 and 2013), and a Director (2008-2013) of the Federal Reserve Bank of Atlanta. Ms. Tomé is also a director or trustee of many community and professional organizations.
Marc R. Bryant (1966)
Year of Election or Appointment: 2013
Secretary and Chief Legal Officer (CLO)
Mr. Bryant also serves as Secretary and CLO of other funds. Mr. Bryant serves as CLO, Secretary, and Senior Vice President of Fidelity Management & Research Company (investment adviser firm, 2015-present) and FMR Co., Inc. (investment adviser firm, 2015-present); Secretary of Fidelity SelectCo, LLC (investment adviser firm, 2015-present) and Fidelity Investments Money Management, Inc. (investment adviser firm, 2015-present); and CLO of Fidelity Management & Research (Hong Kong) Limited and FMR Investment Management (UK) Limited (investment adviser firms, 2015-present) and Fidelity Management & Research (Japan) Limited (investment adviser firm, 2016-present). He is Senior Vice President and Deputy General Counsel of FMR LLC (diversified financial services company). Previously, Mr. Bryant served as Secretary and CLO of Fidelity Rutland Square Trust II (2010-2014) and Assistant Secretary of Fidelity's Fixed Income and Asset Allocation Funds (2013-2015). Prior to joining Fidelity Investments, Mr. Bryant served as a Senior Vice President and the Head of Global Retail Legal for AllianceBernstein L.P. (2006-2010), and as the General Counsel for ProFund Advisors LLC (2001-2006).
Jeffrey S. Christian (1961)
Year of Election or Appointment: 2016
Assistant Treasurer
Mr. Christian also serves as Assistant Treasurer of other funds. Mr. Christian is an employee of Fidelity Investments (2003-present).
William C. Coffey (1969)
Year of Election or Appointment: 2009
Assistant Secretary
Mr. Coffey also serves as Assistant Secretary of other funds. He is Senior Vice President and Deputy General Counsel of FMR LLC (diversified financial services company, 2010-present), and is an employee of Fidelity Investments. Previously, Mr. Coffey served as Vice President and Associate General Counsel of FMR LLC (2005-2009).
Jonathan Davis (1968)
Year of Election or Appointment: 2010
Assistant Treasurer
Mr. Davis also serves as Assistant Treasurer of other funds, and is an employee of Fidelity Investments. Previously, Mr. Davis served as Vice President and Associate General Counsel of FMR LLC (diversified financial services company, 2003-2010).
Adrien E. Deberghes (1967)
Year of Election or Appointment: 2013
President and Treasurer
Mr. Deberghes also serves as an officer of other funds. He serves as Executive Vice President of Fidelity Investments Money Management, Inc. (FIMM) (investment adviser firm, 2016-present) and is an employee of Fidelity Investments (2008-present). Prior to joining Fidelity Investments, Mr. Deberghes was Senior Vice President of Mutual Fund Administration at State Street Corporation (2007-2008), Senior Director of Mutual Fund Administration at Investors Bank & Trust (2005-2007), and Director of Finance for Dunkin' Brands (2000-2005). Previously, Mr. Deberghes served in other fund officer roles.
Joseph DeSantis (1959)
Year of Election or Appointment: 2015
Vice President
Mr. DeSantis also serves as Vice President of other funds. Mr. DeSantis serves as a Director of Fidelity Management & Research (Japan) Limited (investment adviser firm, 2016-present), Chief Investment Officer, Equities (2010-present) and is an employee of Fidelity Investments.
Stephanie J. Dorsey (1969)
Year of Election or Appointment: 2010
Assistant Treasurer
Ms. Dorsey also serves as an officer of other funds. She is an employee of Fidelity Investments (2008-present) and has served in other fund officer roles. Prior to joining Fidelity Investments, Ms. Dorsey served as Treasurer (2004-2008) of the JPMorgan Mutual Funds and Vice President (2004-2008) of JPMorgan Chase Bank.
Howard J. Galligan III (1966)
Year of Election or Appointment: 2014
Chief Financial Officer
Mr. Galligan also serves as Chief Financial Officer of other funds. Mr. Galligan serves as President of Fidelity Pricing and Cash Management Services (FPCMS) (2014-present) and as a Director of Strategic Advisers, Inc. (investment adviser firm, 2008-present). Previously, Mr. Galligan served as Chief Administrative Officer of Asset Management (2011-2014) and Chief Operating Officer and Senior Vice President of Investment Support for Strategic Advisers, Inc. (2003-2011).
Scott C. Goebel (1968)
Year of Election or Appointment: 2015
Vice President
Mr. Goebel serves as Vice President of other funds and is an employee of Fidelity Investments (2001-present). Previously, Mr. Goebel served as Senior Vice President of Fidelity Management & Research Company (FMR) (investment adviser firm, 2016), Secretary of Fidelity SelectCo, LLC (investment adviser firm, 2013-2015), Fidelity Investments Money Management, Inc. (FIMM) (investment adviser firm, 2010-2015), and Fidelity Research and Analysis Company (FRAC) (investment adviser firm, 2010-2015); General Counsel, Secretary, and Senior Vice President of FMR (investment adviser firm, 2008-2015) and FMR Co., Inc. (investment adviser firm, 2008-2015); Assistant Secretary of Fidelity Management & Research (Japan) Limited (investment adviser firm, 2008-2015) and Fidelity Management & Research (U.K.) Inc. (investment adviser firm, 2008-2015); Chief Legal Officer (CLO) of Fidelity Management & Research (Hong Kong) Limited (investment adviser firm, 2008-2015); Secretary and CLO of certain Fidelity® funds (2008-2015); Assistant Secretary of FIMM (2008-2010), FRAC (2008-2010), and certain funds (2007-2008); and as Vice President and Secretary of Fidelity Distributors Corporation (FDC) (2005-2007).
James D. Gryglewicz (1972)
Year of Election or Appointment: 2014
Chief Compliance Officer
Mr. Gryglewicz also serves as Chief Compliance Officer of other funds. Mr. Gryglewicz serves as Compliance Officer of Strategic Advisers, Inc. (investment adviser firm, 2015-present) and Fidelity SelectCo, LLC (investment adviser firm, 2014-present), Senior Vice President of Asset Management Compliance (2009-present), and is an employee of Fidelity Investments (2004-present).
Brian B. Hogan (1964)
Year of Election or Appointment: 2009
Vice President
Mr. Hogan also serves as Trustee or Vice President of other funds. Mr. Hogan serves as a Director of FMR Investment Management (UK) Limited (investment adviser firm, 2015-present) and Fidelity SelectCo, LLC (investment adviser firm, 2014-present) and President of the Equity Division of FMR (investment adviser firm, 2009-present). Previously, Mr. Hogan served as Senior Vice President, Equity Research of FMR (2006-2009) and as a portfolio manager. Mr. Brian B. Hogan is not related to Mr. Colm A. Hogan.
Colm A. Hogan (1973)
Year of Election or Appointment: 2016
Assistant Treasurer
Mr. Hogan also serves as an officer of other funds. Mr. Hogan is an employee of Fidelity Investments (2005-present). Mr. Colm A. Hogan is not related to Mr. Brian B. Hogan.
Chris Maher (1972)
Year of Election or Appointment: 2013
Assistant Treasurer
Mr. Maher serves as Assistant Treasurer of other funds. Mr. Maher is Vice President of Valuation Oversight and is an employee of Fidelity Investments. Previously, Mr. Maher served as Vice President of Asset Management Compliance (2013), Vice President of the Program Management Group of FMR (investment adviser firm, 2010-2013), and Vice President of Valuation Oversight (2008-2010).
John F. Papandrea (1972)
Year of Election or Appointment: 2016
Anti-Money Laundering (AML) Officer
Mr. Papandrea also serves as AML Officer of other funds. Mr. Papandrea is Vice President of FMR LLC (diversified financial services company, 2008-present) and is an employee of Fidelity Investments (2005-present).
Anthony R. Rochte (1968)
Year of Election or Appointment: 2013
Vice President
Mr. Rochte also serves as Vice President of other funds. Mr. Rochte serves as President of Fidelity SelectCo, LLC (investment adviser firm, 2012-present) and is an employee of Fidelity Investments (2012-present). Prior to joining Fidelity Investments, Mr. Rochte served as Senior Managing Director and head of State Street Global Advisors' North American Intermediary Business Group (2006-2012).
Stacie M. Smith (1974)
Year of Election or Appointment: 2013
Assistant Treasurer
Ms. Smith also serves as an officer of other funds. She is an employee of Fidelity Investments (2009-present) and has served in other fund officer roles. Prior to joining Fidelity Investments, Ms. Smith served as Senior Audit Manager of Ernst & Young LLP (accounting firm, 1996-2009). Previously, Ms. Smith served as Deputy Treasurer of certain Fidelity® funds (2013-2016).
Marc L. Spector (1972)
Year of Election or Appointment: 2017
Assistant Treasurer
Mr. Spector also serves as an officer of other funds. Mr. Spector is an employee of Fidelity Investments (2016-present). Prior to joining Fidelity Investments, Mr. Spector served as Director at the Siegfried Group (accounting firm, 2013-2016), and prior to Siegfried Group as audit senior manager at Deloitte & Touche (accounting firm, 2005-2013).
Renee Stagnone (1975)
Year of Election or Appointment: 2016
Assistant Treasurer
Ms. Stagnone also serves as an officer of other funds. Ms. Stagnone is an employee of Fidelity Investments (1997-present). Previously, Ms. Stagnone served as Deputy Treasurer of certain Fidelity® funds (2013-2016).
Shareholder Expense Example
As a shareholder of the Fund, you incur two types of costs: (1) transaction costs, including redemption fees and (2) ongoing costs, including management fees and other Fund expenses. This Example is intended to help you understand your ongoing costs (in dollars) of investing in the Fund and to compare these costs with the ongoing costs of investing in other mutual funds.
The Example is based on an investment of $1,000 invested at the beginning of the period and held for the entire period (July 1, 2016 to December 31, 2016).
Actual Expenses
The first line of the accompanying table for each class of the Fund provides information about actual account values and actual expenses. You may use the information in this line, together with the amount you invested, to estimate the expenses that you paid over the period. Simply divide your account value by $1,000.00 (for example, an $8,600 account value divided by $1,000.00 = 8.6), then multiply the result by the number in the first line for a class of the Fund under the heading entitled "Expenses Paid During Period" to estimate the expenses you paid on your account during this period. The estimate of expenses does not include any fees or other expenses of any variable annuity or variable life insurance product. If they were, the estimate of expenses you paid during the period would be higher, and your ending account value would be lower. In addition, the Fund, as a shareholder in the underlying Fidelity Central Funds, will indirectly bear its pro-rata share of the fees and expenses incurred by the underlying Fidelity Central Funds. These fees and expenses are not included in the Fund's annualized expense ratio used to calculate the expense estimate in the table below.
Hypothetical Example for Comparison Purposes
The second line of the accompanying table for each class of the Fund provides information about hypothetical account values and hypothetical expenses based on a Class' actual expense ratio and an assumed rate of return of 5% per year before expenses, which is not the Class' actual return. The hypothetical account values and expenses may not be used to estimate the actual ending account balance or expenses you paid for the period. You may use this information to compare the ongoing costs of investing in the Fund and other funds. To do so, compare this 5% hypothetical example with the 5% hypothetical examples that appear in the shareholder reports of the other funds. The estimate of expenses does not include any fees or other expenses of any variable annuity or variable life insurance product. If they were, the estimate of expenses you paid during the period would be higher, and your ending account value would be lower. In addition, the Fund, as a shareholder in the underlying Fidelity Central Funds, will indirectly bear its pro-rata share of the fees and expenses incurred by the underlying Fidelity Central Funds. These fees and expenses are not included in the Fund's annualized expense ratio used to calculate the expense estimate in the table below.
Please note that the expenses shown in the table are meant to highlight your ongoing costs only and do not reflect any transaction costs. Therefore, the second line of the table is useful in comparing ongoing costs only, and will not help you determine the relative total costs of owning different funds. In addition, if these transactional costs were included, your costs would have been higher.
| | Annualized Expense Ratio-A | Beginning
Account Value
July 1, 2016 | Ending
Account Value
December 31, 2016 | Expenses Paid
During Period-B
July 1, 2016
to December 31, 2016 |
| Initial Class | .67% | | | |
| Actual | | $1,000.00 | $962.50 | $3.31 |
| Hypothetical-C | | $1,000.00 | $1,021.77 | $3.40 |
| Investor Class | .75% | | | |
| Actual | | $1,000.00 | $962.30 | $3.70 |
| Hypothetical-C | | $1,000.00 | $1,021.37 | $3.81 |
A Annualized expense ratio reflects expenses net of applicable fee waivers.
B Expenses are equal to each Class' annualized expense ratio, multiplied by the average account value over the period, multiplied by 184/366 (to reflect the one-half year period).
C 5% return per year before expenses
Distributions (Unaudited)
A percentage of the dividends distributed during the fiscal year for the fund qualifies for the dividends–received deduction for corporate shareholders:
| | Record Date | Percentage |
| | | |
| Initial Class | 02/12/2016 | 9% |
| | 12/21/2016 | 100% |
| Investor Class | 02/12/2016 | 9% |
| | 12/21/2016 | 100% |
VHCIC-ANN-0217
1.817373.111
Fidelity® Variable Insurance Products: Energy Portfolio
Annual Report December 31, 2016 |
|
Contents
To view a fund's proxy voting guidelines and proxy voting record for the 12-month period ended June 30, visit http://www.fidelity.com/proxyvotingresults or visit the Securities and Exchange Commission's (SEC) web site at http://www.sec.gov.
You may also call 1-877-208-0098 to request a free copy of the proxy voting guidelines.
Fidelity® Variable Insurance Products are separate account options which are purchased through a variable insurance contract.
Standard & Poor's, S&P and S&P 500 are registered service marks of The McGraw-Hill Companies, Inc. and have been licensed for use by Fidelity Distributors Corporation.
Other third-party marks appearing herein are the property of their respective owners.
All other marks appearing herein are registered or unregistered trademarks or service marks of FMR LLC or an affiliated company. © 2017 FMR LLC. All rights reserved.
This report and the financial statements contained herein are submitted for the general information of the shareholders of the Fund. This report is not authorized for distribution to prospective investors in the Fund unless preceded or accompanied by an effective prospectus.
A fund files its complete schedule of portfolio holdings with the SEC for the first and third quarters of each fiscal year on Form N-Q. Forms N-Q are available on the SEC’s web site at http://www.sec.gov. A fund's Forms N-Q may be reviewed and copied at the SEC’s Public Reference Room in Washington, DC. Information regarding the operation of the SEC's Public Reference Room may be obtained by calling 1-800-SEC-0330.
For a complete list of a fund's portfolio holdings, view the most recent holdings listing, semiannual report, or annual report on Fidelity's web site at http://www.fidelity.com, http://www.institutional.fidelity.com, or http://www.401k.com, as applicable.
NOT FDIC INSURED •MAY LOSE VALUE •NO BANK GUARANTEE
Neither the Fund nor Fidelity Distributors Corporation is a bank.
Performance: The Bottom Line
Average annual total return reflects the change in the value of an investment, assuming reinvestment of distributions from dividend income and capital gains (the profits earned upon the sale of securities that have grown in value, if any) and assuming a constant rate of performance each year. During periods of reimbursement by Fidelity, a fund’s total return will be greater than it would be had the reimbursement not occurred. Performance numbers are net of all underlying fund operating expenses, but do not include any insurance charges imposed by your insurance company’s separate account. If performance information included the effect of these additional charges, the total returns would have been lower. How a fund did yesterday is no guarantee of how it will do tomorrow.
Average Annual Total Returns
| For the periods ended December 31, 2016 | Past 1 year | Past 5 years | Past 10 years |
| Initial Class | 33.84% | 3.97% | 3.13% |
| Service Class 2 | 33.51% | 3.72% | 2.88% |
| Investor Class | 33.70% | 3.89% | 3.05% |
$10,000 Over 10 Years
Let's say hypothetically that $10,000 was invested in VIP Energy Portfolio - Initial Class on December 31, 2006.
The chart shows how the value of your investment would have changed, and also shows how the S&P 500® Index performed over the same period.

| Period Ending Values |
| $13,614 | VIP Energy Portfolio - Initial Class |
| $19,572 | S&P 500® Index |
Management's Discussion of Fund Performance
Market Recap: The S&P 500 index returned 11.96% in 2016, rising sharply on post-election optimism for economic growth. The year began during a fairly volatile stretch, with stocks hampered by persistent oil-price weakness and U.S.-dollar strength. Markets regained momentum in February amid U.S. job gains, a rally in energy and other stimuli that helped keep the roughly seven-year uptrend intact. Markets tumbled briefly following the U.K.’s June 23 vote to exit the European Union – dubbed “Brexit” – then recovered quickly and settled into a flattish stretch until the November 8 U.S. presidential election. Stocks reacted to the outcome by reaching a series of all-time highs. For the year, energy (+27%) led the way amid two strong rallies in commodity prices, one in the spring and another in November. Telecommunication services (+23%) was close behind, as demand for dividend-paying equities was high early in the period. Cyclical sectors, including financials (+22%), industrials (+18%) and materials (+17%), also posted strong gains. Conversely, consumer staples (+5%) and consumer discretionary (+6%) lagged the index, the latter hurt as online competition continued to pressure brick-and-mortar retailers. Real estate (+3%) struggled due to expectations for rising interest rates, while health care (-2%) was hampered by an uncertain political and regulatory outlook.
Comments from Portfolio Manager John Dowd: For the year, the fund’s share classes gained roughly 34%, outpacing the 29.56% return of the industry benchmark, the MSCI U.S. IMI Energy 25/50 Index. Fund results also outdistanced the broader S&P 500 index. Energy stocks strongly rebounded from a blistering two-year collapse in crude oil prices brought on by massive global oversupply. Shrinking inventories and a November agreement among major oil-producing countries to cut production lifted global crude oil prices 50% for the year, closing at $55 a barrel and easing profit pressure at many cash-strapped firms. Versus the MSCI benchmark, fund’s results were fueled by stock picks and a large overweighting in the outperforming oil & gas exploration & production (E&P) segment, which accounted for 55% of the fund’s assets at period end. Here, we’ve had a long-standing bias toward U.S.-based E&Ps that we believe have improved productivity and profitability through new technology and good management. A significant underweighting in the weaker integrated oil & gas segment – the benchmark’s largest component – also boosted relative results, along with an underweighting in the lackluster refining & marketing group. Among individual stocks, our modest stake in underperforming index stalwart Exxon Mobil by far added the most value to the fund’s relative results. Although Exxon was among our largest-holdings, we continued to pare our position, and it remained the fund’s biggest underweighting at period end. An underweighting in global E&P ConocoPhillips also added value, as its stock fell far short of the sector index. Conversely, stock picks in storage & transportation and equipment & services detracted from relative results. The fund’s biggest relative detractor by far was Valero Energy, an oil & gas refining and marketing firm that posted a near-flat return.
The views expressed above reflect those of the portfolio manager(s) only through the end of the period as stated on the cover of this report and do not necessarily represent the views of Fidelity or any other person in the Fidelity organization. Any such views are subject to change at any time based upon market or other conditions and Fidelity disclaims any responsibility to update such views. These views may not be relied on as investment advice and, because investment decisions for a Fidelity fund are based on numerous factors, may not be relied on as an indication of trading intent on behalf of any Fidelity fund.
Investment Summary (Unaudited)
Top Ten Stocks as of December 31, 2016
| | % of fund's net assets | % of fund's net assets 6 months ago |
| EOG Resources, Inc. | 5.8 | 6.2 |
| Baker Hughes, Inc. | 5.7 | 4.0 |
| Chevron Corp. | 5.2 | 3.5 |
| Anadarko Petroleum Corp. | 4.9 | 4.2 |
| Pioneer Natural Resources Co. | 4.1 | 2.2 |
| Halliburton Co. | 3.9 | 1.8 |
| Schlumberger Ltd. | 3.5 | 6.5 |
| Diamondback Energy, Inc. | 3.3 | 3.3 |
| Cimarex Energy Co. | 3.0 | 3.0 |
| Exxon Mobil Corp. | 2.7 | 2.0 |
| | 42.1 | |
Top Industries (% of fund's net assets)
| As of December 31, 2016 |
| | Oil, Gas & Consumable Fuels | 77.6% |
| | Energy Equipment & Services | 17.9% |
| | Electric Utilities | 1.0% |
| | Chemicals | 0.6% |
| | Independent Power and Renewable Electricity Producers | 0.5% |
| | All Others* | 2.4% |

* Includes short-term investments and net other assets (liabilities).
| As of June 30, 2016 |
| | Oil, Gas & Consumable Fuels | 79.3% |
| | Energy Equipment & Services | 17.6% |
| | Independent Power and Renewable Electricity Producers | 0.8% |
| | Chemicals | 0.6% |
| | Metals & Mining | 0.4% |
| | All Others* | 1.3% |

Prior period industry classifications reflect the categories in place as of the date indicated and have not been adjusted to reflect current industry classifications.
* Includes short-term investments and net other assets (liabilities).
Investments December 31, 2016
Showing Percentage of Net Assets
| Common Stocks - 98.7% | | | |
| | | Shares | Value |
| Chemicals - 0.6% | | | |
| Commodity Chemicals - 0.6% | | | |
| LyondellBasell Industries NV Class A | | 25,800 | $2,213,124 |
| Diversified Financial Services - 0.3% | | | |
| Other Diversified Financial Services - 0.3% | | | |
| Smart Sand, Inc. | | 58,700 | 971,485 |
| Electric Utilities - 1.0% | | | |
| Electric Utilities - 1.0% | | | |
| DONG Energy A/S | | 99,500 | 3,770,081 |
| Energy Equipment & Services - 17.9% | | | |
| Oil & Gas Drilling - 0.7% | | | |
| Nabors Industries Ltd. | | 84,800 | 1,390,720 |
| Odfjell Drilling A/S (a)(b) | | 238,050 | 476,908 |
| Trinidad Drilling Ltd. | | 91,100 | 226,622 |
| Xtreme Drilling & Coil Services Corp. (a) | | 345,800 | 721,141 |
| | | | 2,815,391 |
| Oil & Gas Equipment & Services - 17.2% | | | |
| Baker Hughes, Inc. | | 328,100 | 21,316,657 |
| Dril-Quip, Inc. (a) | | 55,344 | 3,323,407 |
| Exterran Corp. (a) | | 22,400 | 535,360 |
| Frank's International NV (b) | | 213,300 | 2,625,723 |
| Halliburton Co. | | 273,500 | 14,793,615 |
| Newpark Resources, Inc. (a) | | 324,300 | 2,432,250 |
| Oceaneering International, Inc. | | 80,149 | 2,261,003 |
| RigNet, Inc. (a) | | 41,838 | 968,550 |
| Schlumberger Ltd. | | 157,209 | 13,197,696 |
| Superior Energy Services, Inc. | | 46,200 | 779,856 |
| Tesco Corp. | | 96,200 | 793,650 |
| Total Energy Services, Inc. | | 13,800 | 149,856 |
| Weatherford International PLC (a) | | 338,300 | 1,688,117 |
| | | | 64,865,740 |
|
| TOTAL ENERGY EQUIPMENT & SERVICES | | | 67,681,131 |
|
| Gas Utilities - 0.3% | | | |
| Gas Utilities - 0.3% | | | |
| Indraprastha Gas Ltd. | | 75,386 | 1,018,669 |
| Independent Power and Renewable Electricity Producers - 0.5% | | | |
| Renewable Electricity - 0.5% | | | |
| NextEra Energy Partners LP | | 81,100 | 2,071,294 |
| Metals & Mining - 0.5% | | | |
| Diversified Metals & Mining - 0.5% | | | |
| Hi-Crush Partners LP (a) | | 90,900 | 1,799,820 |
| Oil, Gas & Consumable Fuels - 77.6% | | | |
| Coal & Consumable Fuels - 0.3% | | | |
| CONSOL Energy, Inc. | | 65,200 | 1,188,596 |
| Integrated Oil & Gas - 8.2% | | | |
| Chevron Corp. | | 167,431 | 19,706,629 |
| Exxon Mobil Corp. | | 110,848 | 10,005,140 |
| Suncor Energy, Inc. | | 34,400 | 1,124,761 |
| | | | 30,836,530 |
| Oil & Gas Exploration & Production - 54.6% | | | |
| Anadarko Petroleum Corp. | | 267,634 | 18,662,119 |
| Apache Corp. | | 40,400 | 2,564,188 |
| ARC Resources Ltd. | | 26,400 | 454,403 |
| California Resources Corp. (a) | | 1 | 21 |
| Callon Petroleum Co. (a) | | 433,100 | 6,656,747 |
| Canadian Natural Resources Ltd. | | 21,100 | 672,453 |
| Carrizo Oil & Gas, Inc. (a) | | 107,900 | 4,030,065 |
| Centennial Resource Development, Inc. Class A (c) | | 14,400 | 283,968 |
| Cimarex Energy Co. | | 82,687 | 11,237,163 |
| Clayton Williams Energy, Inc. (a)(b) | | 6,600 | 787,116 |
| Concho Resources, Inc. (a) | | 30,200 | 4,004,520 |
| ConocoPhillips Co. | | 120,800 | 6,056,912 |
| Continental Resources, Inc. (a) | | 92,200 | 4,751,988 |
| Devon Energy Corp. | | 112,500 | 5,137,875 |
| Diamondback Energy, Inc. (a) | | 123,400 | 12,470,804 |
| Encana Corp. | | 306,300 | 3,595,344 |
| EOG Resources, Inc. | | 217,742 | 22,013,714 |
| Extraction Oil & Gas, Inc. (b) | | 161,516 | 3,236,781 |
| Gran Tierra Energy, Inc. (Canada) (a) | | 163,800 | 495,310 |
| Hess Corp. | | 52,500 | 3,270,225 |
| Jones Energy, Inc. (a)(b) | | 122,000 | 610,000 |
| Marathon Oil Corp. | | 323,200 | 5,594,592 |
| Matador Resources Co. (a)(b) | | 7,300 | 188,048 |
| Newfield Exploration Co. (a) | | 194,500 | 7,877,250 |
| Noble Energy, Inc. | | 190,412 | 7,247,081 |
| Oasis Petroleum, Inc. (a) | | 153,100 | 2,317,934 |
| Parsley Energy, Inc. Class A (a) | | 165,630 | 5,836,801 |
| PDC Energy, Inc. (a) | | 107,834 | 7,826,592 |
| Pioneer Natural Resources Co. | | 86,165 | 15,515,732 |
| QEP Resources, Inc. | | 188,800 | 3,475,808 |
| Resolute Energy Corp. (a)(b) | | 46,236 | 1,904,461 |
| Rice Energy, Inc. (a) | | 367,311 | 7,842,090 |
| Ring Energy, Inc. (a) | | 122,700 | 1,593,873 |
| RSP Permian, Inc. (a) | | 178,200 | 7,951,284 |
| Seven Generations Energy Ltd. (a) | | 248,000 | 5,783,250 |
| SM Energy Co. | | 179,110 | 6,175,713 |
| Southwestern Energy Co. (a) | | 30,000 | 324,600 |
| TAG Oil Ltd. (a) | | 120,900 | 69,335 |
| Trilogy Energy Corp. (a) | | 54,000 | 303,653 |
| Whiting Petroleum Corp. (a) | | 308,500 | 3,708,170 |
| WPX Energy, Inc. (a) | | 217,900 | 3,174,803 |
| | | | 205,702,786 |
| Oil & Gas Refining & Marketing - 7.6% | | | |
| Alon U.S.A. Energy, Inc. | | 46,000 | 523,480 |
| Delek U.S. Holdings, Inc. | | 37,300 | 897,811 |
| HollyFrontier Corp. | | 67,600 | 2,214,576 |
| Keyera Corp. | | 93,700 | 2,823,597 |
| Marathon Petroleum Corp. | | 7,800 | 392,730 |
| Phillips 66 Co. | | 103,951 | 8,982,406 |
| Valero Energy Corp. | | 77,088 | 5,266,652 |
| Western Refining, Inc. | | 137,100 | 5,189,235 |
| World Fuel Services Corp. | | 52,965 | 2,431,623 |
| | | | 28,722,110 |
| Oil & Gas Storage & Transport - 6.9% | | | |
| Cheniere Energy Partners LP Holdings LLC | | 66,700 | 1,492,079 |
| Enable Midstream Partners LP | | 38,800 | 610,324 |
| Enterprise Products Partners LP | | 113,800 | 3,077,152 |
| Gener8 Maritime, Inc. (a) | | 27,900 | 124,992 |
| Golar LNG Ltd. | | 67,700 | 1,553,038 |
| Magellan Midstream Partners LP | | 6,170 | 466,637 |
| Noble Midstream Partners LP | | 43,200 | 1,555,200 |
| Plains All American Pipeline LP | | 149,700 | 4,833,813 |
| Rice Midstream Partners LP | | 105,000 | 2,580,900 |
| Tallgrass Energy GP LP | | 26,400 | 707,520 |
| Targa Resources Corp. | | 67,100 | 3,762,297 |
| Teekay LNG Partners LP | | 20,900 | 302,005 |
| The Williams Companies, Inc. | | 165,600 | 5,156,784 |
| | | | 26,222,741 |
|
| TOTAL OIL, GAS & CONSUMABLE FUELS | | | 292,672,763 |
|
| TOTAL COMMON STOCKS | | | |
| (Cost $296,149,666) | | | 372,198,367 |
|
| Money Market Funds - 2.4% | | | |
| Fidelity Cash Central Fund, 0.60% (d) | | 3,645,007 | 3,645,736 |
| Fidelity Securities Lending Cash Central Fund 0.65% (d)(e) | | 5,358,891 | 5,359,427 |
| TOTAL MONEY MARKET FUNDS | | | |
| (Cost $9,004,404) | | | 9,005,163 |
| TOTAL INVESTMENT PORTFOLIO - 101.1% | | | |
| (Cost $305,154,070) | | | 381,203,530 |
| NET OTHER ASSETS (LIABILITIES) - (1.1)% | | | (4,269,626) |
| NET ASSETS - 100% | | | $376,933,904 |
Legend
(a) Non-income producing
(b) Security or a portion of the security is on loan at period end.
(c) Restricted securities - Investment in securities not registered under the Securities Act of 1933 (excluding 144A issues). At the end of the period, the value of restricted securities (excluding 144A issues) amounted to $283,968 or 0.1% of net assets.
(d) Affiliated fund that is generally available only to investment companies and other accounts managed by Fidelity Investments. The rate quoted is the annualized seven-day yield of the fund at period end. A complete unaudited listing of the fund's holdings as of its most recent quarter end is available upon request. In addition, each Fidelity Central Fund's financial statements, which are not covered by the Fund's Report of Independent Registered Public Accounting Firm, are available on the SEC's website or upon request.
(e) Investment made with cash collateral received from securities on loan.
Additional information on each restricted holding is as follows:
| Security | Acquisition Date | Acquisition Cost |
| Centennial Resource Development, Inc. Class A | 10/11/16 | $144,000 |
Affiliated Central Funds
Information regarding fiscal year to date income earned by the Fund from investments in Fidelity Central Funds is as follows:
| Fund | Income earned |
| Fidelity Cash Central Fund | $16,063 |
| Fidelity Securities Lending Cash Central Fund | 70,195 |
| Total | $86,258 |
Investment Valuation
All investments are categorized as Level 1 under the Fair Value Hierarchy. The inputs or methodology used for valuing securities may not be an indication of the risk associated with investing in those securities. For more information on valuation inputs please refer to the Investment Valuation section in the accompanying Notes to Financial Statements.
Other Information
Distribution of investments by country or territory of incorporation, as a percentage of Total Net Assets, is as follows (Unaudited):
| United States of America | 88.0% |
| Canada | 4.4% |
| Curacao | 3.5% |
| Netherlands | 1.3% |
| Denmark | 1.0% |
| Others (Individually Less Than 1%) | 1.8% |
| | 100.0% |
See accompanying notes which are an integral part of the financial statements.
Financial Statements
Statement of Assets and Liabilities
| | | December 31, 2016 |
| Assets | | |
Investment in securities, at value (including securities loaned of $5,208,744) — See accompanying schedule:
Unaffiliated issuers (cost $296,149,666) | $372,198,367 | |
| Fidelity Central Funds (cost $9,004,404) | 9,005,163 | |
| Total Investments (cost $305,154,070) | | $381,203,530 |
| Foreign currency held at value (cost $1,499) | | 1,499 |
| Receivable for investments sold | | 1,139,773 |
| Receivable for fund shares sold | | 1,101,714 |
| Dividends receivable | | 98,861 |
| Distributions receivable from Fidelity Central Funds | | 18,685 |
| Prepaid expenses | | 1,531 |
| Other receivables | | 7,007 |
| Total assets | | 383,572,600 |
| Liabilities | | |
| Payable for investments purchased | $829,622 | |
| Payable for fund shares redeemed | 152,591 | |
| Accrued management fee | 171,710 | |
| Distribution and service plan fees payable | 31,699 | |
| Other affiliated payables | 43,853 | |
| Other payables and accrued expenses | 50,911 | |
| Collateral on Securities Loaned | 5,358,310 | |
| Total liabilities | | 6,638,696 |
| Net Assets | | $376,933,904 |
| Net Assets consist of: | | |
| Paid in capital | | $362,766,804 |
| Distributions in excess of net investment income | | (121,713) |
| Accumulated undistributed net realized gain (loss) on investments and foreign currency transactions | | (61,753,445) |
| Net unrealized appreciation (depreciation) on investments and assets and liabilities in foreign currencies | | 76,042,258 |
| Net Assets | | $376,933,904 |
| Initial Class: | | |
| Net Asset Value, offering price and redemption price per share ($63,954,820 ÷ 3,086,258 shares) | | $20.72 |
| Service Class 2: | | |
| Net Asset Value, offering price and redemption price per share ($150,743,670 ÷ 7,311,438 shares) | | $20.62 |
| Investor Class: | | |
| Net Asset Value, offering price and redemption price per share ($162,235,414 ÷ 7,845,316 shares) | | $20.68 |
See accompanying notes which are an integral part of the financial statements.
Statement of Operations
| | | Year ended December 31, 2016 |
| Investment Income | | |
| Dividends | | $3,985,526 |
| Income from Fidelity Central Funds | | 86,258 |
| Total income | | 4,071,784 |
| Expenses | | |
| Management fee | $1,606,301 | |
| Transfer agent fees | 291,620 | |
| Distribution and service plan fees | 300,082 | |
| Accounting and security lending fees | 115,364 | |
| Custodian fees and expenses | 35,263 | |
| Independent trustees' fees and expenses | 6,009 | |
| Audit | 42,295 | |
| Legal | 4,437 | |
| Miscellaneous | 3,459 | |
| Total expenses before reductions | 2,404,830 | |
| Expense reductions | (34,228) | 2,370,602 |
| Net investment income (loss) | | 1,701,182 |
| Realized and Unrealized Gain (Loss) | | |
| Net realized gain (loss) on: | | |
| Investment securities: | | |
| Unaffiliated issuers | (19,355,185) | |
| Fidelity Central Funds | 1,657 | |
| Foreign currency transactions | 4,572 | |
| Total net realized gain (loss) | | (19,348,956) |
Change in net unrealized appreciation (depreciation) on:
Investment securities (net of increase in deferred foreign taxes of $6,348) | 103,567,738 | |
| Assets and liabilities in foreign currencies | (871) | |
| Total change in net unrealized appreciation (depreciation) | | 103,566,867 |
| Net gain (loss) | | 84,217,911 |
| Net increase (decrease) in net assets resulting from operations | | $85,919,093 |
See accompanying notes which are an integral part of the financial statements.
Statement of Changes in Net Assets
| | Year ended December 31, 2016 | Year ended December 31, 2015 |
| Increase (Decrease) in Net Assets | | |
| Operations | | |
| Net investment income (loss) | $1,701,182 | $3,231,077 |
| Net realized gain (loss) | (19,348,956) | (34,613,566) |
| Change in net unrealized appreciation (depreciation) | 103,566,867 | (33,356,756) |
| Net increase (decrease) in net assets resulting from operations | 85,919,093 | (64,739,245) |
| Distributions to shareholders from net investment income | (1,879,963) | (3,145,334) |
| Distributions to shareholders from net realized gain | – | (8,790,082) |
| Total distributions | (1,879,963) | (11,935,416) |
| Share transactions - net increase (decrease) | 50,287,637 | 30,868,032 |
| Redemption fees | 52,216 | 90,979 |
| Total increase (decrease) in net assets | 134,378,983 | (45,715,650) |
| Net Assets | | |
| Beginning of period | 242,554,921 | 288,270,571 |
| End of period | $376,933,904 | $242,554,921 |
| Other Information | | |
| Distributions in excess of net investment income end of period | $(121,713) | $(142,617) |
See accompanying notes which are an integral part of the financial statements.
Financial Highlights — VIP Energy Portfolio Initial Class
| Years ended December 31, | 2016 | 2015 | 2014 | 2013 | 2012 |
| Selected Per–Share Data | | | | | |
| Net asset value, beginning of period | $15.57 | $20.45 | $23.95 | $19.53 | $18.81 |
| Income from Investment Operations | | | | | |
| Net investment income (loss)A | .13 | .24 | .22 | .20 | .19 |
| Net realized and unrealized gain (loss) | 5.14 | (4.30) | (3.23) | 4.58 | .74 |
| Total from investment operations | 5.27 | (4.06) | (3.01) | 4.78 | .93 |
| Distributions from net investment income | (.12) | (.23) | (.23) | (.22) | (.21) |
| Distributions from net realized gain | – | (.60) | (.28) | (.14) | – |
| Total distributions | (.12) | (.83) | (.50)B | (.36) | (.21) |
| Redemption fees added to paid in capitalA | –C | .01 | .01 | –C | –C |
| Net asset value, end of period | $20.72 | $15.57 | $20.45 | $23.95 | $19.53 |
| Total ReturnD,E | 33.84% | (20.54)% | (12.59)% | 24.55% | 4.94% |
| Ratios to Average Net AssetsF,G | | | | | |
| Expenses before reductions | .68% | .68% | .68% | .70% | .69% |
| Expenses net of fee waivers, if any | .68% | .68% | .67% | .69% | .69% |
| Expenses net of all reductions | .67% | .67% | .67% | .69% | .68% |
| Net investment income (loss) | .71% | 1.25% | .91% | .88% | .98% |
| Supplemental Data | | | | | |
| Net assets, end of period (000 omitted) | $63,955 | $46,360 | $70,828 | $94,202 | $96,822 |
| Portfolio turnover rateH | 87% | 70% | 99% | 90% | 81% |
A Calculated based on average shares outstanding during the period.
B Total distributions of $.50 per share is comprised of distributions from net investment income of $.227 and distributions from net realized gain of $.273 per share.
C Amount represents less than $.005 per share.
D Total returns do not reflect charges attributable to your insurance company's separate account. Inclusion of these charges would reduce the total returns shown.
E Total returns would have been lower if certain expenses had not been reduced during the applicable periods shown.
F Fees and expenses of any underlying Fidelity Central Funds are not included in the Fund's expense ratio. The Fund indirectly bears its proportionate share of the expenses of any underlying Fidelity Central Funds.
G Expense ratios reflect operating expenses of the class. Expenses before reductions do not reflect amounts reimbursed by the investment adviser or reductions from brokerage service arrangements or reductions from other expense offset arrangements and do not represent the amount paid by the class during periods when reimbursements or reductions occur. Expenses net of fee waivers reflect expenses after reimbursement by the investment adviser but prior to reductions from brokerage service arrangements or other expense offset arrangements. Expenses net of all reductions represent the net expenses paid by the class.
H Amount does not include the portfolio activity of any underlying Fidelity Central Funds.
See accompanying notes which are an integral part of the financial statements.
See accompanying notes which are an integral part of the financial statements.
Financial Highlights — VIP Energy Portfolio Service Class 2
| Years ended December 31, | 2016 | 2015 | 2014 | 2013 | 2012 |
| Selected Per–Share Data | | | | | |
| Net asset value, beginning of period | $15.51 | $20.37 | $23.83 | $19.44 | $18.72 |
| Income from Investment Operations | | | | | |
| Net investment income (loss)A | .08 | .19 | .16 | .14 | .14 |
| Net realized and unrealized gain (loss) | 5.12 | (4.28) | (3.19) | 4.55 | .73 |
| Total from investment operations | 5.20 | (4.09) | (3.03) | 4.69 | .87 |
| Distributions from net investment income | (.09) | (.18) | (.16) | (.16) | (.15) |
| Distributions from net realized gain | – | (.60) | (.28) | (.14) | – |
| Total distributions | (.09) | (.78) | (.44) | (.30) | (.15) |
| Redemption fees added to paid in capitalA | –B | .01 | .01 | –B | –B |
| Net asset value, end of period | $20.62 | $15.51 | $20.37 | $23.83 | $19.44 |
| Total ReturnC,D | 33.51% | (20.75)% | (12.76)% | 24.21% | 4.68% |
| Ratios to Average Net AssetsE,F | | | | | |
| Expenses before reductions | .93% | .93% | .93% | .94% | .94% |
| Expenses net of fee waivers, if any | .93% | .93% | .92% | .94% | .94% |
| Expenses net of all reductions | .92% | .92% | .92% | .94% | .93% |
| Net investment income (loss) | .47% | 1.00% | .66% | .64% | .74% |
| Supplemental Data | | | | | |
| Net assets, end of period (000 omitted) | $150,744 | $97,286 | $116,228 | $130,100 | $112,819 |
| Portfolio turnover rateG | 87% | 70% | 99% | 90% | 81% |
A Calculated based on average shares outstanding during the period.
B Amount represents less than $.005 per share.
C Total returns do not reflect charges attributable to your insurance company's separate account. Inclusion of these charges would reduce the total returns shown.
D Total returns would have been lower if certain expenses had not been reduced during the applicable periods shown.
E Fees and expenses of any underlying Fidelity Central Funds are not included in the Fund's expense ratio. The Fund indirectly bears its proportionate share of the expenses of any underlying Fidelity Central Funds.
F Expense ratios reflect operating expenses of the class. Expenses before reductions do not reflect amounts reimbursed by the investment adviser or reductions from brokerage service arrangements or reductions from other expense offset arrangements and do not represent the amount paid by the class during periods when reimbursements or reductions occur. Expenses net of fee waivers reflect expenses after reimbursement by the investment adviser but prior to reductions from brokerage service arrangements or other expense offset arrangements. Expenses net of all reductions represent the net expenses paid by the class.
G Amount does not include the portfolio activity of any underlying Fidelity Central Funds.
See accompanying notes which are an integral part of the financial statements.
Financial Highlights — VIP Energy Portfolio Investor Class
| Years ended December 31, | 2016 | 2015 | 2014 | 2013 | 2012 |
| Selected Per–Share Data | | | | | |
| Net asset value, beginning of period | $15.55 | $20.42 | $23.90 | $19.49 | $18.77 |
| Income from Investment Operations | | | | | |
| Net investment income (loss)A | .11 | .22 | .20 | .18 | .17 |
| Net realized and unrealized gain (loss) | 5.13 | (4.29) | (3.21) | 4.57 | .74 |
| Total from investment operations | 5.24 | (4.07) | (3.01) | 4.75 | .91 |
| Distributions from net investment income | (.11) | (.22) | (.20) | (.20) | (.19) |
| Distributions from net realized gain | – | (.60) | (.28) | (.14) | – |
| Total distributions | (.11) | (.81)B | (.48) | (.34) | (.19) |
| Redemption fees added to paid in capitalA | –C | .01 | .01 | –C | –C |
| Net asset value, end of period | $20.68 | $15.55 | $20.42 | $23.90 | $19.49 |
| Total ReturnD,E | 33.70% | (20.58)% | (12.65)% | 24.45% | 4.86% |
| Ratios to Average Net AssetsF,G | | | | | |
| Expenses before reductions | .76% | .76% | .76% | .78% | .77% |
| Expenses net of fee waivers, if any | .76% | .76% | .75% | .77% | .77% |
| Expenses net of all reductions | .75% | .75% | .75% | .77% | .76% |
| Net investment income (loss) | .63% | 1.17% | .83% | .80% | .90% |
| Supplemental Data | | | | | |
| Net assets, end of period (000 omitted) | $162,235 | $98,909 | $101,214 | $108,077 | $92,334 |
| Portfolio turnover rateH | 87% | 70% | 99% | 90% | 81% |
A Calculated based on average shares outstanding during the period.
B Total distributions of $.81 per share is comprised of distributions from net investment income of $.215 and distributions from net realized gain of $.599 per share.
C Amount represents less than $.005 per share.
D Total returns do not reflect charges attributable to your insurance company's separate account. Inclusion of these charges would reduce the total returns shown.
E Total returns would have been lower if certain expenses had not been reduced during the applicable periods shown.
F Fees and expenses of any underlying Fidelity Central Funds are not included in the Fund's expense ratio. The Fund indirectly bears its proportionate share of the expenses of any underlying Fidelity Central Funds.
G Expense ratios reflect operating expenses of the class. Expenses before reductions do not reflect amounts reimbursed by the investment adviser or reductions from brokerage service arrangements or reductions from other expense offset arrangements and do not represent the amount paid by the class during periods when reimbursements or reductions occur. Expenses net of fee waivers reflect expenses after reimbursement by the investment adviser but prior to reductions from brokerage service arrangements or other expense offset arrangements. Expenses net of all reductions represent the net expenses paid by the class.
H Amount does not include the portfolio activity of any underlying Fidelity Central Funds.
See accompanying notes which are an integral part of the financial statements.
Notes to Financial Statements
For the period ended December 31, 2016
1. Organization.
VIP Energy Portfolio (the Fund) is a non-diversified fund of Variable Insurance Products Fund IV (the Trust) and is authorized to issue an unlimited number of shares. The Trust is registered under the Investment Company Act of 1940, as amended (the 1940 Act), as an open-end management investment company organized as a Massachusetts business trust. Shares of the Fund may only be purchased by insurance companies for the purpose of funding variable annuity or variable life insurance contracts. The Fund offers the following classes of shares: Initial Class shares, Service Class 2 shares and Investor Class shares. All classes have equal rights and voting privileges, except for matters affecting a single class.
2. Investments in Fidelity Central Funds.
The Fund invests in Fidelity Central Funds, which are open-end investment companies generally available only to other investment companies and accounts managed by the investment adviser and its affiliates. The Fund's Schedule of Investments lists each of the Fidelity Central Funds held as of period end, if any, as an investment of the Fund, but does not include the underlying holdings of each Fidelity Central Fund. As an Investing Fund, the Fund indirectly bears its proportionate share of the expenses of the underlying Fidelity Central Funds.
The Money Market Central Funds seek preservation of capital and current income and are managed by Fidelity Investments Money Management, Inc. (FIMM), an affiliate of the investment adviser. Annualized expenses of the Money Market Central Funds as of their most recent shareholder report date are less than .005%.
A complete unaudited list of holdings for each Fidelity Central Fund is available upon request or at the Securities and Exchange Commission (the SEC) website at www.sec.gov. In addition, the financial statements of the Fidelity Central Funds, which are not covered by the Fund's Report of Independent Registered Public Accounting Firm, are available on the SEC website or upon request.
3. Significant Accounting Policies.
The financial statements have been prepared in conformity with accounting principles generally accepted in the United States of America (GAAP), which require management to make certain estimates and assumptions at the date of the financial statements. Actual results could differ from those estimates. Subsequent events, if any, through the date that the financial statements were issued have been evaluated in the preparation of the financial statements. The following summarizes the significant accounting policies of the Fund:
Investment Valuation. Investments are valued as of 4:00 p.m. Eastern time on the last calendar day of the period. The Board of Trustees (the Board) has delegated the day to day responsibility for the valuation of the Fund's investments to the Fair Value Committee (the Committee) established by the Fund's investment adviser. In accordance with valuation policies and procedures approved by the Board, the Fund attempts to obtain prices from one or more third party pricing vendors or brokers to value its investments. When current market prices, quotations or currency exchange rates are not readily available or reliable, investments will be fair valued in good faith by the Committee, in accordance with procedures adopted by the Board. Factors used in determining fair value vary by investment type and may include market or investment specific events. The frequency with which these procedures are used cannot be predicted and they may be utilized to a significant extent. The Committee oversees the Fund's valuation policies and procedures and reports to the Board on the Committee's activities and fair value determinations. The Board monitors the appropriateness of the procedures used in valuing the Fund's investments and ratifies the fair value determinations of the Committee.
The Fund categorizes the inputs to valuation techniques used to value its investments into a disclosure hierarchy consisting of three levels as shown below:
- Level 1 – quoted prices in active markets for identical investments
- Level 2 – other significant observable inputs (including quoted prices for similar investments, interest rates, prepayment speeds, etc.)
- Level 3 – unobservable inputs (including the Fund's own assumptions based on the best information available)
Valuation techniques used to value the Fund's investments by major category are as follows:
Equity securities, including restricted securities, for which market quotations are readily available, are valued at the last reported sale price or official closing price as reported by a third party pricing vendor on the primary market or exchange on which they are traded and are categorized as Level 1 in the hierarchy. In the event there were no sales during the day or closing prices are not available, securities are valued at the last quoted bid price or may be valued using the last available price and are generally categorized as Level 2 in the hierarchy. For foreign equity securities, when market or security specific events arise, comparisons to the valuation of American Depositary Receipts (ADRs), futures contracts, Exchange-Traded Funds (ETFs) and certain indexes as well as quoted prices for similar securities may be used and would be categorized as Level 2 in the hierarchy. Utilizing these techniques may result in transfers between Level 1 and Level 2. For equity securities, including restricted securities, where observable inputs are limited, assumptions about market activity and risk are used and these securities may be categorized as Level 3 in the hierarchy.
Investments in open-end mutual funds, including the Fidelity Central Funds, are valued at their closing net asset value (NAV) each business day and are categorized as Level 1 in the hierarchy.
Changes in valuation techniques may result in transfers in or out of an assigned level within the disclosure hierarchy.
Foreign Currency. The Fund may use foreign currency contracts to facilitate transactions in foreign-denominated securities. Gains and losses from these transactions may arise from changes in the value of the foreign currency or if the counterparties do not perform under the contracts' terms.
Foreign-denominated assets, including investment securities, and liabilities are translated into U.S. dollars at the exchange rates at period end. Purchases and sales of investment securities, income and dividends received and expenses denominated in foreign currencies are translated into U.S. dollars at the exchange rate in effect on the transaction date.
The effects of exchange rate fluctuations on investments are included with the net realized and unrealized gain (loss) on investment securities. Other foreign currency transactions resulting in realized and unrealized gain (loss) are disclosed separately.
Investment Transactions and Income. For financial reporting purposes, the Fund's investment holdings and NAV include trades executed through the end of the last business day of the period. The NAV per share for processing shareholder transactions is calculated as of the close of business of the New York Stock Exchange (NYSE), normally 4:00 p.m. Eastern time and includes trades executed through the end of the prior business day. Gains and losses on securities sold are determined on the basis of identified cost and may include proceeds received from litigation. Dividend income is recorded on the ex-dividend date, except for certain dividends from foreign securities where the ex-dividend date may have passed, which are recorded as soon as the Fund is informed of the ex-dividend date. Non-cash dividends included in dividend income, if any, are recorded at the fair market value of the securities received. Income and capital gain distributions from Fidelity Central Funds, if any, are recorded on the ex-dividend date. Certain distributions received by the Fund represent a return of capital or capital gain. The Fund determines the components of these distributions subsequent to the ex-dividend date, based upon receipt of tax filings or other correspondence relating to the underlying investment. These distributions are recorded as a reduction of cost of investments and/or as a realized gain. Investment income is recorded net of foreign taxes withheld where recovery of such taxes is uncertain.
Class Allocations and Expenses. Investment income, realized and unrealized capital gains and losses, common expenses of the Fund, and certain fund-level expense reductions, if any, are allocated daily on a pro-rata basis to each class based on the relative net assets of each class to the total net assets of the Fund. Each class differs with respect to transfer agent and distribution and service plan fees incurred. Certain expense reductions may also differ by class. For the reporting period, the allocated portion of income and expenses to each class as a percent of its average net assets may vary due to the timing of recording these transactions in relation to fluctuating net assets of the classes. Expenses directly attributable to a fund are charged to that fund. Expenses attributable to more than one fund are allocated among the respective funds on the basis of relative net assets or other appropriate methods. Expense estimates are accrued in the period to which they relate and adjustments are made when actual amounts are known.
Income Tax Information and Distributions to Shareholders. Each year, the Fund intends to qualify as a regulated investment company under Subchapter M of the Internal Revenue Code, including distributing substantially all of its taxable income and realized gains. As a result, no provision for U.S. Federal income taxes is required. As of December 31, 2016, the Fund did not have any unrecognized tax benefits in the financial statements; nor is the Fund aware of any tax positions for which it is reasonably possible that the total amounts of unrecognized tax benefits will significantly change in the next twelve months. The Fund files a U.S. federal tax return, in addition to state and local tax returns as required. The Fund's federal income tax returns are subject to examination by the Internal Revenue Service (IRS) for a period of three fiscal years after they are filed. State and local tax returns may be subject to examination for an additional fiscal year depending on the jurisdiction. Foreign taxes are provided for based on the Fund's understanding of the tax rules and rates that exist in the foreign markets in which it invests. The Fund is subject to a tax imposed on capital gains by certain countries in which it invests. An estimated deferred tax liability for net unrealized appreciation on the applicable securities is included in Other payables and accrued expenses on the Statement of Assets & Liabilities.
Distributions are declared and recorded on the ex-dividend date. Income dividends and capital gain distributions are declared separately for each class. Income and capital gain distributions are determined in accordance with income tax regulations, which may differ from GAAP.
Capital accounts within the financial statements are adjusted for permanent book-tax differences. These adjustments have no impact on net assets or the results of operations. Capital accounts are not adjusted for temporary book-tax differences which will reverse in a subsequent period.
Book-tax differences are primarily due to foreign currency transactions, partnerships, capital loss carryforwards and losses deferred due to wash sales.
The federal tax cost of investment securities and unrealized appreciation (depreciation) as of period end were as follows:
| Gross unrealized appreciation | $83,289,853 |
| Gross unrealized depreciation | (11,914,220) |
| Net unrealized appreciation (depreciation) on securities | $71,375,633 |
| Tax Cost | $309,827,897 |
The tax-based components of distributable earnings as of period end were as follows:
| Undistributed ordinary income | $32,547 |
| Capital loss carryforward | $(57,079,616) |
| Net unrealized appreciation (depreciation) on securities and other investments | $71,220,518 |
Capital loss carryforwards are only available to offset future capital gains of the Fund to the extent provided by regulations and may be limited. Under the Regulated Investment Company Modernization Act of 2010 (the Act), the Fund is permitted to carry forward capital losses incurred in taxable years beginning after December 22, 2010 for an unlimited period and such capital losses are required to be used prior to any losses that expire. The capital loss carryforward information presented below, including any applicable limitation, is estimated as of fiscal period end and is subject to adjustment.
| No expiration | |
| Short-term | $(35,006,253) |
| Long-term | (22,073,363) |
| Total capital loss carryforward | $(57,079,616) |
The tax character of distributions paid was as follows:
| | December 31, 2016 | December 31, 2015 |
| Ordinary Income | $1,879,963 | $ 3,399,885 |
| Long-term Capital Gains | – | 8,535,531 |
| Total | $1,879,963 | $ 11,935,416 |
Trading (Redemption) Fees. Shares held by investors less than 60 days may be subject to a redemption fee equal to 1% of the NAV of shares redeemed. All redemption fees, which reduce the proceeds of the shareholder redemption, are retained by the Fund and accounted for as an addition to paid in capital.
Restricted Securities. The Fund may invest in securities that are subject to legal or contractual restrictions on resale. These securities generally may be resold in transactions exempt from registration or to the public if the securities are registered. Disposal of these securities may involve time-consuming negotiations and expense, and prompt sale at an acceptable price may be difficult. Information regarding restricted securities is included at the end of the Fund's Schedule of Investments.
4. Purchases and Sales of Investments.
Purchases and sales of securities, other than short-term securities, aggregated $304,115,803 and $255,433,530, respectively.
5. Fees and Other Transactions with Affiliates.
Management Fee. Fidelity SelectCo, LLC (the investment adviser) and its affiliates provide the Fund with investment management related services for which the Fund pays a monthly management fee. The management fee is the sum of an individual fund fee rate that is based on an annual rate of .30% of the Fund's average net assets and an annualized group fee rate that averaged .25% during the period. The group fee rate is based upon the average net assets of all the mutual funds advised by Fidelity Management & Research Company (FMR) and the investment adviser. The group fee rate decreases as assets under management increase and increases as assets under management decrease. For the reporting period, the total annual management fee rate was .55% of the Fund's average net assets.
Distribution and Service Plan Fees. In accordance with Rule 12b-1 of the 1940 Act, the Fund has adopted a separate 12b-1 Plan for Service Class 2 shares. Service Class 2 pays Fidelity Distributors Corporation (FDC), an affiliate of the investment adviser, a service fee. For the period, the service fee is based on an annual rate of .25% of Service Class 2's average net assets.
For the period, total fees for Service Class 2, all of which was re-allowed to insurance companies for the distribution of shares and providing shareholder support services were $300,082.
Transfer Agent Fees. Fidelity Investments Institutional Operations Company, Inc. (FIIOC), an affiliate of the investment adviser, is the Fund's transfer, dividend disbursing, and shareholder servicing agent. FIIOC receives an asset-based fee with respect to each class. Each class (with the exception of Investor Class) pays a fee for transfer agent services, typesetting, and printing and mailing of shareholder reports, excluding mailing of proxy statements, equal to an annual rate of .07% (.15% for Investor Class) of class-level average net assets. For the period, transfer agent fees for each class were as follows:
| Initial Class | $34,142 |
| Service Class 2 | 79,222 |
| Investor Class | 178,256 |
| | $291,620 |
Accounting and Security Lending Fees. Fidelity Service Company, Inc. (FSC), an affiliate of the investment adviser, maintains the Fund's accounting records. The accounting fee is based on the level of average net assets for each month. Under a separate contract, FSC administers the security lending program. The security lending fee is based on the number and duration of lending transactions.
Brokerage Commissions. The Fund placed a portion of its portfolio transactions with brokerage firms which are affiliates of the investment adviser. Brokerage commissions are included in net realized gain (loss) and change in net unrealized appreciation (depreciation) in the Statement of Operations. The commissions paid to these affiliated firms were $10,224 for the period.
Interfund Trades. The Fund may purchase from or sell securities to other Fidelity Funds under procedures adopted by the Board. The procedures have been designed to ensure these interfund trades are executed in accordance with Rule 17a-7 of the 1940 Act. Interfund trades are included within the respective purchases and sales amounts shown in the Purchases and Sales of Investments note.
6. Committed Line of Credit.
The Fund participates with other funds managed by the investment adviser or an affiliate in a $4.25 billion credit facility (the "line of credit") to be utilized for temporary or emergency purposes to fund shareholder redemptions or for other short-term liquidity purposes. The Fund has agreed to pay commitment fees on its pro-rata portion of the line of credit, which amounted to $709 and is reflected in Miscellaneous expenses on the Statement of Operations. During the period, the Fund did not borrow on this line of credit.
7. Security Lending.
The Fund lends portfolio securities through a lending agent from time to time in order to earn additional income. On the settlement date of the loan, the Fund receives collateral (in the form of U.S. Treasury obligations, letters of credit and/or cash) against the loaned securities and maintains collateral in an amount not less than 100% of the market value of the loaned securities during the period of the loan. The market value of the loaned securities is determined at the close of business of the Fund and any additional required collateral is delivered to the Fund on the next business day. The Fund or borrower may terminate the loan at any time, and if the borrower defaults on its obligation to return the securities loaned because of insolvency or other reasons, the Fund may apply collateral received from the borrower against the obligation. The Fund may experience delays and costs in recovering the securities loaned. Any cash collateral received is invested in the Fidelity Securities Lending Cash Central Fund. The value of loaned securities and cash collateral at period end are disclosed on the Fund's Statement of Assets and Liabilities. Security lending income represents the income earned on investing cash collateral, less rebates paid to borrowers and any lending agent fees associated with the loan, plus any premium payments received for lending certain types of securities. Security lending income is presented in the Statement of Operations as a component of income from Fidelity Central Funds. Total security lending income during the period amounted to $70,195.
8. Expense Reductions.
Commissions paid to certain brokers with whom the investment adviser, or its affiliates, places trades on behalf of the Fund include an amount in addition to trade execution, which may be rebated back to the Fund to offset certain expenses. This amount totaled $32,445 for the period.
In addition, during the period the investment adviser reimbursed and/or waived a portion of the fund-level operating expenses in the amount of $1,783.
9. Distributions to Shareholders.
Distributions to shareholders of each class were as follows:
| | Year ended
December 31, 2016 | Year ended
December 31, 2015 |
| From net investment income | | |
| Initial Class | $368,235 | $671,471 |
| Service Class 2 | 643,085 | 1,125,062 |
| Investor Class | 868,643 | 1,348,801 |
| Total | $1,879,963 | $3,145,334 |
| From net realized gain | | |
| Initial Class | $– | $2,006,215 |
| Service Class 2 | – | 3,490,558 |
| Investor Class | – | 3,293,309 |
| Total | $– | $8,790,082 |
10. Share Transactions.
Transactions for each class of shares were as follows:
| | Shares | Shares | Dollars | Dollars |
| | Year ended December 31, 2016 | Year ended December 31, 2015 | Year ended December 31, 2016 | Year ended December 31, 2015 |
| Initial Class | | | | |
| Shares sold | 637,783 | 318,964 | $11,858,299 | $6,258,167 |
| Reinvestment of distributions | 17,560 | 138,900 | 368,235 | 2,677,686 |
| Shares redeemed | (546,131) | (943,712) | (9,245,983) | (17,847,770) |
| Net increase (decrease) | 109,212 | (485,848) | $2,980,551 | $(8,911,917) |
| Service Class 2 | | | | |
| Shares sold | 1,872,653 | 1,207,923 | $33,298,327 | $23,068,062 |
| Reinvestment of distributions | 30,829 | 240,121 | 643,085 | 4,615,620 |
| Shares redeemed | (865,169) | (881,739) | (15,123,742) | (16,309,856) |
| Net increase (decrease) | 1,038,313 | 566,305 | $18,817,670 | $11,373,826 |
| Investor Class | | | | |
| Shares sold | 2,479,480 | 2,321,424 | $45,760,835 | $45,120,504 |
| Reinvestment of distributions | 41,502 | 244,179 | 868,643 | 4,642,110 |
| Shares redeemed | (1,037,998) | (1,159,593) | (18,140,062) | (21,356,491) |
| Net increase (decrease) | 1,482,984 | 1,406,010 | $28,489,416 | $28,406,123 |
11. Other.
The Fund's organizational documents provide former and current trustees and officers with a limited indemnification against liabilities arising in connection with the performance of their duties to the Fund. In the normal course of business, the Fund may also enter into contracts that provide general indemnifications. The Fund's maximum exposure under these arrangements is unknown as this would be dependent on future claims that may be made against the Fund. The risk of material loss from such claims is considered remote.
At the end of the period, the investment adviser or its affiliates were the owners of record of 60% of the total outstanding shares of the Fund and one otherwise unaffiliated shareholder was the owner of record of 38% of the total outstanding shares of the Fund.
Report of Independent Registered Public Accounting Firm
To the Trustees of Variable Insurance Products Fund IV and Shareholders of VIP Energy Portfolio:
In our opinion, the accompanying statement of assets and liabilities, including the schedule of investments, and the related statements of operations and of changes in net assets and the financial highlights present fairly, in all material respects, the financial position of VIP Energy Portfolio (a fund of Variable Insurance Products Fund IV) (the "Fund") as of December 31, 2016, the results of its operations for the year then ended, the changes in its net assets for each of the two years in the period then ended and the financial highlights for each of the five years in the period then ended, in conformity with accounting principles generally accepted in the United States of America. These financial statements and financial highlights (hereafter referred to as “financial statements”) are the responsibility of the Fund's management. Our responsibility is to express an opinion on these financial statements based on our audits. We conducted our audits of these financial statements in accordance with the standards of the Public Company Accounting Oversight Board (United States). Those standards require that we plan and perform the audit to obtain reasonable assurance about whether the financial statements are free of material misstatement. An audit includes examining, on a test basis, evidence supporting the amounts and disclosures in the financial statements, assessing the accounting principles used and significant estimates made by management, and evaluating the overall financial statement presentation. We believe that our audits, which included confirmation of securities as of December 31, 2016 by correspondence with the custodian and brokers, provide a reasonable basis for our opinion.
PricewaterhouseCoopers LLP
Boston, Massachusetts
February 16, 2017
Trustees and Officers
The Trustees, Members of the Advisory Board (if any), and officers of the trust and fund, as applicable, are listed below. The Board of Trustees governs the fund and is responsible for protecting the interests of shareholders. The Trustees are experienced executives who meet periodically throughout the year to oversee the fund's activities, review contractual arrangements with companies that provide services to the fund, oversee management of the risks associated with such activities and contractual arrangements, and review the fund's performance. Each of the Trustees oversees 83 funds.
The Trustees hold office without limit in time except that (a) any Trustee may resign; (b) any Trustee may be removed by written instrument, signed by at least two-thirds of the number of Trustees prior to such removal; (c) any Trustee who requests to be retired or who has become incapacitated by illness or injury may be retired by written instrument signed by a majority of the other Trustees; and (d) any Trustee may be removed at any special meeting of shareholders by a two-thirds vote of the outstanding voting securities of the trust. Each Trustee who is not an interested person (as defined in the 1940 Act) of the trust and the fund is referred to herein as an Independent Trustee. Each Independent Trustee shall retire not later than the last day of the calendar year in which his or her 75th birthday occurs. The Independent Trustees may waive this mandatory retirement age policy with respect to individual Trustees. Officers and Advisory Board Members hold office without limit in time, except that any officer or Advisory Board Member may resign or may be removed by a vote of a majority of the Trustees at any regular meeting or any special meeting of the Trustees. Except as indicated, each individual has held the office shown or other offices in the same company for the past five years.
The fund’s Statement of Additional Information (SAI) includes more information about the Trustees. To request a free copy, call Fidelity at 1-877-208-0098.
Experience, Skills, Attributes, and Qualifications of the Trustees. The Governance and Nominating Committee has adopted a statement of policy that describes the experience, qualifications, attributes, and skills that are necessary and desirable for potential Independent Trustee candidates (Statement of Policy). The Board believes that each Trustee satisfied at the time he or she was initially elected or appointed a Trustee, and continues to satisfy, the standards contemplated by the Statement of Policy. The Governance and Nominating Committee also engages professional search firms to help identify potential Independent Trustee candidates who have the experience, qualifications, attributes, and skills consistent with the Statement of Policy. From time to time, additional criteria based on the composition and skills of the current Independent Trustees, as well as experience or skills that may be appropriate in light of future changes to board composition, business conditions, and regulatory or other developments, have also been considered by the professional search firms and the Governance and Nominating Committee. In addition, the Board takes into account the Trustees' commitment and participation in Board and committee meetings, as well as their leadership of standing and ad hoc committees throughout their tenure.
In determining that a particular Trustee was and continues to be qualified to serve as a Trustee, the Board has considered a variety of criteria, none of which, in isolation, was controlling. The Board believes that, collectively, the Trustees have balanced and diverse experience, qualifications, attributes, and skills, which allow the Board to operate effectively in governing the fund and protecting the interests of shareholders. Information about the specific experience, skills, attributes, and qualifications of each Trustee, which in each case led to the Board's conclusion that the Trustee should serve (or continue to serve) as a trustee of the fund, is provided below.
Board Structure and Oversight Function. Brian B. Hogan is an interested person and currently serves as Chairman. The Trustees have determined that an interested Chairman is appropriate and benefits shareholders because an interested Chairman has a personal and professional stake in the quality and continuity of services provided to the fund. Independent Trustees exercise their informed business judgment to appoint an individual of their choosing to serve as Chairman, regardless of whether the Trustee happens to be independent or a member of management. The Independent Trustees have determined that they can act independently and effectively without having an Independent Trustee serve as Chairman and that a key structural component for assuring that they are in a position to do so is for the Independent Trustees to constitute a substantial majority for the Board. The Independent Trustees also regularly meet in executive session. Michael E. Wiley serves as Chairman of the Independent Trustees and as such (i) acts as a liaison between the Independent Trustees and management with respect to matters important to the Independent Trustees and (ii) with management prepares agendas for Board meetings.
Fidelity® funds are overseen by different Boards of Trustees. The fund's Board oversees Fidelity's sector portfolios. Other Boards oversee Fidelity's equity and high income funds, and Fidelity's investment grade bond, money market, and asset allocation funds. The use of separate Boards, each with its own committee structure, allows the Trustees of each group of Fidelity® funds to focus on the unique issues of the funds they oversee, including common research, investment, and operational issues. On occasion, the separate Boards establish joint committees to address issues of overlapping consequences for the Fidelity® funds overseen by each Board.
The Trustees operate using a system of committees to facilitate the timely and efficient consideration of all matters of importance to the Trustees, the fund, and fund shareholders and to facilitate compliance with legal and regulatory requirements and oversight of the fund's activities and associated risks. The Board, acting through its committees, has charged SelectCo and its affiliates with (i) identifying events or circumstances the occurrence of which could have demonstrably adverse effects on the fund's business and/or reputation; (ii) implementing processes and controls to lessen the possibility that such events or circumstances occur or to mitigate the effects of such events or circumstances if they do occur; and (iii) creating and maintaining a system designed to evaluate continuously business and market conditions in order to facilitate the identification and implementation processes described in (i) and (ii) above. Because the day-to-day operations and activities of the fund are carried out by or through SelectCo, its affiliates, and other service providers, the fund's exposure to risks is mitigated but not eliminated by the processes overseen by the Trustees. While each of the Board's committees has responsibility for overseeing different aspects of the fund's activities, oversight is exercised primarily through the Operations and Audit Committees. Appropriate personnel, including but not limited to the fund's Chief Compliance Officer (CCO), SelectCo's internal auditor, the independent accountants, the fund's Treasurer and portfolio management personnel, make periodic reports to the Board's committees, as appropriate. The responsibilities of each standing committee, including their oversight responsibilities, are described further under "Standing Committees of the Trustees."
Interested Trustees*:
Correspondence intended for a Trustee who is an interested person may be sent to Fidelity Investments, 245 Summer Street, Boston, Massachusetts 02210.
Name, Year of Birth; Principal Occupations and Other Relevant Experience+
Brian B. Hogan (1964)
Year of Election or Appointment: 2014
Trustee
Chairman of the Board of Trustees
Mr. Hogan also serves as Trustee or Vice President of other funds. Mr. Hogan serves as a Director of FMR Investment Management (UK) Limited (investment adviser firm, 2015-present) and Fidelity SelectCo, LLC (investment adviser firm, 2014-present) and President of the Equity Division of FMR (investment adviser firm, 2009-present). Previously, Mr. Hogan served as Senior Vice President, Equity Research of FMR (2006-2009) and as a portfolio manager. Mr. Brian B. Hogan is not related to Mr. Colm A. Hogan.
* Determined to be an "Interested Trustee" by virtue of, among other things, his or her affiliation with the trust or various entities under common control with SelectCo.
+ The information includes the Trustee's principal occupation during the last five years and other information relating to the experience, attributes, and skills relevant to the Trustee's qualifications to serve as a Trustee, which led to the conclusion that the Trustee should serve as a Trustee for the fund.
Independent Trustees:
Correspondence intended for an Independent Trustee may be sent to Fidelity Investments, P.O. Box 55235, Boston, Massachusetts 02205-5235.
Name, Year of Birth; Principal Occupations and Other Relevant Experience+
David A. Rosow (1942)
Year of Election or Appointment: 2013
Trustee
Mr. Rosow also serves as Trustee of other Fidelity® funds. Prior to his retirement in 2006, Mr. Rosow was the Chief Executive Officer, owner and operator of a number of private companies, which encompassed the oil refining, drilling and marketing of petroleum products (including specialty petroleum products), recreation industry, and real estate development. Mr. Rosow currently serves as a Director of Oxbow Carbon LLC (upgraders, marketers, and distributors of petroleum byproducts of the oil refining process, 2015-present) and Oxbridge Academy of the Palm Beaches (2015-present) and serves as its President and CEO. Previously, Mr. Rosow served on the Fairfield Country Day School Board for 27 years, including as its President for 3 years, stepping down in 2006. Mr. Rosow served as Lead Director and Chairman of the Audit Committee of Hudson United Bancorp (1996-2006), Chairman of the Board of Westport Bank and Trust (1992-1996), and as a Director of TD Banknorth (2006-2007). In addition, Mr. Rosow served as a member (2008-2014) and President (2009-2014) of the Town Council of Palm Beach, Florida. Mr. Rosow also served as a Member of the Advisory Board of certain Fidelity® funds (2012-2013).
Garnett A. Smith (1947)
Year of Election or Appointment: 2013
Trustee
Mr. Smith also serves as Trustee of other Fidelity® funds. Prior to Mr. Smith's retirement, he served as Chairman and Chief Executive Officer of Inbrand Corp. (manufacturer of personal absorbent products, 1990-1997). He also served as President (1986-1990) of Inbrand Corp. Prior to his employment with Inbrand Corp., he was employed by a retail fabric chain and North Carolina National Bank. In addition, Mr. Smith served as a Member of the Advisory Board of certain Fidelity® funds (2012-2013) and as a board member of the Jackson Hole Land Trust (2009-2012).
Michael E. Wiley (1950)
Year of Election or Appointment: 2008
Trustee
Chairman of the Independent Trustees
Mr. Wiley also serves as Trustee of other Fidelity® funds. Mr. Wiley serves as a Director of Tesoro Corporation (independent oil refiner and marketer, 2005-present), a Director of Tesoro Logistics LP (natural resources logistics, 2015-present), and a Director of Bill Barrett Corporation (exploration and production, 2005-present). In addition, Mr. Wiley also serves as a Director of Post Oak Bank (privately-held bank, 2004-present). Previously, Mr. Wiley served as a Trustee of other Fidelity® funds (2008-2013), as a Director of Asia Pacific Exploration Consolidated (international oil and gas exploration and production, 2008-2013), as a member of the Board of Trustees of the University of Tulsa (2000-2006; 2007-2010), as a Senior Energy Advisor of Katzenbach Partners, LLC (consulting, 2006-2007), as an Advisory Director of Riverstone Holdings (private investment), Chairman, President, and CEO of Baker Hughes, Inc. (oilfield services, 2000-2004), and as Director of Spinnaker Exploration Company (exploration and production, 2001-2005).
+ The information includes the Trustee's principal occupation during the last five years and other information relating to the experience, attributes, and skills relevant to the Trustee's qualifications to serve as a Trustee, which led to the conclusion that the Trustee should serve as a Trustee for the fund.
Advisory Board Members and Officers:
Correspondence intended for a Member of the Advisory Board may be sent to Fidelity Investments, P.O. Box 55235, Boston, Massachusetts 02205-5235. Except for Anthony R. Rochte, correspondence intended for an officer may be sent to Fidelity Investments, 245 Summer Street, Boston, Massachusetts 02210. Correspondence intended for Mr. Rochte may be sent to SelectCo, 1225 17th Street, Denver, Colorado 80202-5541. Officers appear below in alphabetical order.
Name, Year of Birth; Principal Occupation
Donald F. Donahue (1950)
Year of Election or Appointment: 2015
Member of the Advisory Board
Mr. Donahue also serves as a Trustee or Member of the Advisory Board of other Fidelity® funds. Mr. Donahue is President and Chief Executive Officer of Miranda Partners, LLC (risk consulting for the financial services industry, 2012-present) and a consultant for the Institute for Defense Analyses (national security, 2012-present). Previously, Mr. Donahue served as Chief Executive Officer (2006-2012), Chief Operating Officer (2003-2006), and Managing Director, Customer Marketing and Development (1999-2003) of The Depository Trust & Clearing Corporation (financial markets infrastructure). Mr. Donahue serves as a Member (2012-present) and Co-Chairman (2016-present) of the Board of Directors of United Way of New York, Member of the Board of Directors of NYC Leadership Academy (2012-present) and Member of the Board of Advisors of Ripple Labs, Inc. (financial services, 2015-present). He also served as Chairman (2010-2012) and Member of the Board of Directors (2012-2013) of Omgeo, LLC (financial services), Treasurer of United Way of New York (2012-2016), and Member of the Board of Directors of XBRL US (financial services non-profit, 2009-2012) and the International Securities Services Association (2009-2012).
Carol B. Tomé (1957)
Year of Election or Appointment: 2017
Member of the Advisory Board
Ms. Tomé also serves as Trustee or Member of the Advisory Board of other Fidelity® funds. Ms. Tomé is Chief Financial Officer (2001-present) and Executive Vice President of Corporate Services (2007-present) of The Home Depot, Inc. (home improvement retailer) and a Director (2003-present) and Chair of the Audit Committee (2004-present) of United Parcel Service, Inc. (package delivery and supply chain management). Previously, Ms. Tomé served as Senior Vice President of Finance and Accounting/Treasurer (2000-2007) and Vice President and Treasurer (1995-2000) of The Home Depot, Inc. and Chair of the Board (2010-2012), Vice Chair of the Board (2009 and 2013), and a Director (2008-2013) of the Federal Reserve Bank of Atlanta. Ms. Tomé is also a director or trustee of many community and professional organizations.
Marc R. Bryant (1966)
Year of Election or Appointment: 2013
Secretary and Chief Legal Officer (CLO)
Mr. Bryant also serves as Secretary and CLO of other funds. Mr. Bryant serves as CLO, Secretary, and Senior Vice President of Fidelity Management & Research Company (investment adviser firm, 2015-present) and FMR Co., Inc. (investment adviser firm, 2015-present); Secretary of Fidelity SelectCo, LLC (investment adviser firm, 2015-present) and Fidelity Investments Money Management, Inc. (investment adviser firm, 2015-present); and CLO of Fidelity Management & Research (Hong Kong) Limited and FMR Investment Management (UK) Limited (investment adviser firms, 2015-present) and Fidelity Management & Research (Japan) Limited (investment adviser firm, 2016-present). He is Senior Vice President and Deputy General Counsel of FMR LLC (diversified financial services company). Previously, Mr. Bryant served as Secretary and CLO of Fidelity Rutland Square Trust II (2010-2014) and Assistant Secretary of Fidelity's Fixed Income and Asset Allocation Funds (2013-2015). Prior to joining Fidelity Investments, Mr. Bryant served as a Senior Vice President and the Head of Global Retail Legal for AllianceBernstein L.P. (2006-2010), and as the General Counsel for ProFund Advisors LLC (2001-2006).
Jeffrey S. Christian (1961)
Year of Election or Appointment: 2016
Assistant Treasurer
Mr. Christian also serves as Assistant Treasurer of other funds. Mr. Christian is an employee of Fidelity Investments (2003-present).
William C. Coffey (1969)
Year of Election or Appointment: 2009
Assistant Secretary
Mr. Coffey also serves as Assistant Secretary of other funds. He is Senior Vice President and Deputy General Counsel of FMR LLC (diversified financial services company, 2010-present), and is an employee of Fidelity Investments. Previously, Mr. Coffey served as Vice President and Associate General Counsel of FMR LLC (2005-2009).
Jonathan Davis (1968)
Year of Election or Appointment: 2010
Assistant Treasurer
Mr. Davis also serves as Assistant Treasurer of other funds, and is an employee of Fidelity Investments. Previously, Mr. Davis served as Vice President and Associate General Counsel of FMR LLC (diversified financial services company, 2003-2010).
Adrien E. Deberghes (1967)
Year of Election or Appointment: 2013
President and Treasurer
Mr. Deberghes also serves as an officer of other funds. He serves as Executive Vice President of Fidelity Investments Money Management, Inc. (FIMM) (investment adviser firm, 2016-present) and is an employee of Fidelity Investments (2008-present). Prior to joining Fidelity Investments, Mr. Deberghes was Senior Vice President of Mutual Fund Administration at State Street Corporation (2007-2008), Senior Director of Mutual Fund Administration at Investors Bank & Trust (2005-2007), and Director of Finance for Dunkin' Brands (2000-2005). Previously, Mr. Deberghes served in other fund officer roles.
Joseph DeSantis (1959)
Year of Election or Appointment: 2015
Vice President
Mr. DeSantis also serves as Vice President of other funds. Mr. DeSantis serves as a Director of Fidelity Management & Research (Japan) Limited (investment adviser firm, 2016-present), Chief Investment Officer, Equities (2010-present) and is an employee of Fidelity Investments.
Stephanie J. Dorsey (1969)
Year of Election or Appointment: 2010
Assistant Treasurer
Ms. Dorsey also serves as an officer of other funds. She is an employee of Fidelity Investments (2008-present) and has served in other fund officer roles. Prior to joining Fidelity Investments, Ms. Dorsey served as Treasurer (2004-2008) of the JPMorgan Mutual Funds and Vice President (2004-2008) of JPMorgan Chase Bank.
Howard J. Galligan III (1966)
Year of Election or Appointment: 2014
Chief Financial Officer
Mr. Galligan also serves as Chief Financial Officer of other funds. Mr. Galligan serves as President of Fidelity Pricing and Cash Management Services (FPCMS) (2014-present) and as a Director of Strategic Advisers, Inc. (investment adviser firm, 2008-present). Previously, Mr. Galligan served as Chief Administrative Officer of Asset Management (2011-2014) and Chief Operating Officer and Senior Vice President of Investment Support for Strategic Advisers, Inc. (2003-2011).
Scott C. Goebel (1968)
Year of Election or Appointment: 2015
Vice President
Mr. Goebel serves as Vice President of other funds and is an employee of Fidelity Investments (2001-present). Previously, Mr. Goebel served as Senior Vice President of Fidelity Management & Research Company (FMR) (investment adviser firm, 2016), Secretary of Fidelity SelectCo, LLC (investment adviser firm, 2013-2015), Fidelity Investments Money Management, Inc. (FIMM) (investment adviser firm, 2010-2015), and Fidelity Research and Analysis Company (FRAC) (investment adviser firm, 2010-2015); General Counsel, Secretary, and Senior Vice President of FMR (investment adviser firm, 2008-2015) and FMR Co., Inc. (investment adviser firm, 2008-2015); Assistant Secretary of Fidelity Management & Research (Japan) Limited (investment adviser firm, 2008-2015) and Fidelity Management & Research (U.K.) Inc. (investment adviser firm, 2008-2015); Chief Legal Officer (CLO) of Fidelity Management & Research (Hong Kong) Limited (investment adviser firm, 2008-2015); Secretary and CLO of certain Fidelity® funds (2008-2015); Assistant Secretary of FIMM (2008-2010), FRAC (2008-2010), and certain funds (2007-2008); and as Vice President and Secretary of Fidelity Distributors Corporation (FDC) (2005-2007).
James D. Gryglewicz (1972)
Year of Election or Appointment: 2014
Chief Compliance Officer
Mr. Gryglewicz also serves as Chief Compliance Officer of other funds. Mr. Gryglewicz serves as Compliance Officer of Strategic Advisers, Inc. (investment adviser firm, 2015-present) and Fidelity SelectCo, LLC (investment adviser firm, 2014-present), Senior Vice President of Asset Management Compliance (2009-present), and is an employee of Fidelity Investments (2004-present).
Brian B. Hogan (1964)
Year of Election or Appointment: 2009
Vice President
Mr. Hogan also serves as Trustee or Vice President of other funds. Mr. Hogan serves as a Director of FMR Investment Management (UK) Limited (investment adviser firm, 2015-present) and Fidelity SelectCo, LLC (investment adviser firm, 2014-present) and President of the Equity Division of FMR (investment adviser firm, 2009-present). Previously, Mr. Hogan served as Senior Vice President, Equity Research of FMR (2006-2009) and as a portfolio manager. Mr. Brian B. Hogan is not related to Mr. Colm A. Hogan.
Colm A. Hogan (1973)
Year of Election or Appointment: 2016
Assistant Treasurer
Mr. Hogan also serves as an officer of other funds. Mr. Hogan is an employee of Fidelity Investments (2005-present). Mr. Colm A. Hogan is not related to Mr. Brian B. Hogan.
Chris Maher (1972)
Year of Election or Appointment: 2013
Assistant Treasurer
Mr. Maher serves as Assistant Treasurer of other funds. Mr. Maher is Vice President of Valuation Oversight and is an employee of Fidelity Investments. Previously, Mr. Maher served as Vice President of Asset Management Compliance (2013), Vice President of the Program Management Group of FMR (investment adviser firm, 2010-2013), and Vice President of Valuation Oversight (2008-2010).
John F. Papandrea (1972)
Year of Election or Appointment: 2016
Anti-Money Laundering (AML) Officer
Mr. Papandrea also serves as AML Officer of other funds. Mr. Papandrea is Vice President of FMR LLC (diversified financial services company, 2008-present) and is an employee of Fidelity Investments (2005-present).
Anthony R. Rochte (1968)
Year of Election or Appointment: 2013
Vice President
Mr. Rochte also serves as Vice President of other funds. Mr. Rochte serves as President of Fidelity SelectCo, LLC (investment adviser firm, 2012-present) and is an employee of Fidelity Investments (2012-present). Prior to joining Fidelity Investments, Mr. Rochte served as Senior Managing Director and head of State Street Global Advisors' North American Intermediary Business Group (2006-2012).
Stacie M. Smith (1974)
Year of Election or Appointment: 2013
Assistant Treasurer
Ms. Smith also serves as an officer of other funds. She is an employee of Fidelity Investments (2009-present) and has served in other fund officer roles. Prior to joining Fidelity Investments, Ms. Smith served as Senior Audit Manager of Ernst & Young LLP (accounting firm, 1996-2009). Previously, Ms. Smith served as Deputy Treasurer of certain Fidelity® funds (2013-2016).
Marc L. Spector (1972)
Year of Election or Appointment: 2017
Assistant Treasurer
Mr. Spector also serves as an officer of other funds. Mr. Spector is an employee of Fidelity Investments (2016-present). Prior to joining Fidelity Investments, Mr. Spector served as Director at the Siegfried Group (accounting firm, 2013-2016), and prior to Siegfried Group as audit senior manager at Deloitte & Touche (accounting firm, 2005-2013).
Renee Stagnone (1975)
Year of Election or Appointment: 2016
Assistant Treasurer
Ms. Stagnone also serves as an officer of other funds. Ms. Stagnone is an employee of Fidelity Investments (1997-present). Previously, Ms. Stagnone served as Deputy Treasurer of certain Fidelity® funds (2013-2016).
Shareholder Expense Example
As a shareholder of the Fund, you incur two types of costs: (1) transaction costs, including redemption fees and (2) ongoing costs, including management fees, distribution and/or service (12b-1) fees and other Fund expenses. This Example is intended to help you understand your ongoing costs (in dollars) of investing in the Fund and to compare these costs with the ongoing costs of investing in other mutual funds.
The Example is based on an investment of $1,000 invested at the beginning of the period and held for the entire period (July 1, 2016 to December 31, 2016).
Actual Expenses
The first line of the accompanying table for each class of the Fund provides information about actual account values and actual expenses. You may use the information in this line, together with the amount you invested, to estimate the expenses that you paid over the period. Simply divide your account value by $1,000.00 (for example, an $8,600 account value divided by $1,000.00 = 8.6), then multiply the result by the number in the first line for a class of the Fund under the heading entitled "Expenses Paid During Period" to estimate the expenses you paid on your account during this period. The estimate of expenses does not include any fees or other expenses of any variable annuity or variable life insurance product. If they were, the estimate of expenses you paid during the period would be higher, and your ending account value would be lower. In addition, the Fund, as a shareholder in the underlying Fidelity Central Funds, will indirectly bear its pro-rata share of the fees and expenses incurred by the underlying Fidelity Central Funds. These fees and expenses are not included in the Fund's annualized expense ratio used to calculate the expense estimate in the table below.
Hypothetical Example for Comparison Purposes
The second line of the accompanying table for each class of the Fund provides information about hypothetical account values and hypothetical expenses based on a Class' actual expense ratio and an assumed rate of return of 5% per year before expenses, which is not the Class' actual return. The hypothetical account values and expenses may not be used to estimate the actual ending account balance or expenses you paid for the period. You may use this information to compare the ongoing costs of investing in the Fund and other funds. To do so, compare this 5% hypothetical example with the 5% hypothetical examples that appear in the shareholder reports of the other funds. The estimate of expenses does not include any fees or other expenses of any variable annuity or variable life insurance product. If they were, the estimate of expenses you paid during the period would be higher, and your ending account value would be lower. In addition, the Fund, as a shareholder in the underlying Fidelity Central Funds, will indirectly bear its pro-rata share of the fees and expenses incurred by the underlying Fidelity Central Funds. These fees and expenses are not included in the Fund's annualized expense ratio used to calculate the expense estimate in the table below.
Please note that the expenses shown in the table are meant to highlight your ongoing costs only and do not reflect any transaction costs. Therefore, the second line of the table is useful in comparing ongoing costs only, and will not help you determine the relative total costs of owning different funds. In addition, if these transactional costs were included, your costs would have been higher.
| | Annualized Expense Ratio-A | Beginning
Account Value
July 1, 2016 | Ending
Account Value
December 31, 2016 | Expenses Paid
During Period-B
July 1, 2016
to December 31, 2016 |
| Initial Class | .68% | | | |
| Actual | | $1,000.00 | $1,152.00 | $3.68 |
| Hypothetical-C | | $1,000.00 | $1,021.72 | $3.46 |
| Service Class 2 | .93% | | | |
| Actual | | $1,000.00 | $1,150.40 | $5.03 |
| Hypothetical-C | | $1,000.00 | $1,020.46 | $4.72 |
| Investor Class | .76% | | | |
| Actual | | $1,000.00 | $1,151.20 | $4.11 |
| Hypothetical-C | | $1,000.00 | $1,021.32 | $3.86 |
A Annualized expense ratio reflects expenses net of applicable fee waivers.
B Expenses are equal to each Class' annualized expense ratio, multiplied by the average account value over the period, multiplied by 184/366 (to reflect the one-half year period).
C 5% return per year before expenses
Distributions (Unaudited)
Initial Class, Investor Class, and Service Class 2 designate 100% of the dividend distributed during the fiscal year as qualifying for the dividends–received deduction for corporate shareholders.
VNRIC-ANN-0217
1.817379.111
Item 2.
Code of Ethics
As of the end of the period, December 31, 2016, Variable Insurance Products Fund IV (the trust) has adopted a code of ethics, as defined in Item 2 of Form N-CSR, that applies to its President and Treasurer and its Chief Financial Officer. A copy of the code of ethics is filed as an exhibit to this Form N-CSR.
Item 3.
Audit Committee Financial Expert
The Board of Trustees of the trust has determined that David A. Rosow is an audit committee financial expert, as defined in Item 3 of Form N-CSR. Mr. Rosow is independent for purposes of Item 3 of Form N-CSR.
Item 4.
Principal Accountant Fees and Services
Fees and Services
The following table presents fees billed by PricewaterhouseCoopers LLP (“PwC”) in each of the last two fiscal years for services rendered to VIP Consumer Discretionary Portfolio, VIP Consumer Staples Portfolio, VIP Energy Portfolio, VIP Financial Services Portfolio, VIP Health Care Portfolio, VIP Industrials Portfolio, VIP Materials Portfolio, VIP Real Estate Portfolio, VIP Technology Portfolio, VIP Telecommunications Portfolio, and VIP Utilities Portfolio (the “Funds”):
Services Billed by PwC
December 31, 2016 FeesA
| | | | |
| Audit Fees | Audit-Related Fees | Tax Fees | All Other Fees |
VIP Consumer Discretionary Portfolio | $40,000 | $- | $2,600 | $1,400 |
VIP Consumer Staples Portfolio | $40,000 | $- | $2,600 | $1,400 |
VIP Energy Portfolio | $40,000 | $- | $3,400 | $1,400 |
VIP Financial Services Portfolio | $41,000 | $- | $2,800 | $1,400 |
VIP Health Care Portfolio | $43,000 | $- | $2,800 | $1,500 |
VIP Industrials Portfolio | $40,000 | $- | $2,600 | $1,400 |
VIP Materials Portfolio | $40,000 | $- | $2,600 | $1,400 |
VIP Real Estate Portfolio | $49,000 | $- | $3,700 | $1,700 |
VIP Technology Portfolio | $45,000 | $- | $2,600 | $1,500 |
VIP Telecommunications Portfolio | $40,000 | $- | $2,600 | $1,400 |
VIP Utilities Portfolio | $39,000 | $- | $3,400 | $1,300 |
| | | | |
| Audit Fees | Audit-Related Fees | Tax Fees | All Other Fees |
VIP Consumer Discretionary Portfolio | $40,000 | $- | $2,500 | $1,500 |
VIP Consumer Staples Portfolio | $40,000 | $- | $2,500 | $1,500 |
VIP Energy Portfolio | $40,000 | $- | $7,500 | $1,600 |
VIP Financial Services Portfolio | $40,000 | $- | $2,900 | $1,500 |
VIP Health Care Portfolio | $42,000 | $- | $2,500 | $1,800 |
VIP Industrials Portfolio | $40,000 | $- | $2,500 | $1,500 |
VIP Materials Portfolio | $39,000 | $- | $2,500 | $1,500 |
VIP Real Estate Portfolio | $47,000 | $- | $3,500 | $1,600 |
VIP Technology Portfolio | $44,000 | $- | $2,500 | $1,600 |
VIP Telecommunications Portfolio | $39,000 | $- | $2,500 | $1,500 |
VIP Utilities Portfolio | $39,000 | $- | $6,400 | $1,500 |
A Amounts may reflect rounding.
The following table presents fees billed by PwC that were required to be approved by the Audit Committee for services that relate directly to the operations and financial reporting of the Funds and that are rendered on behalf of Fidelity SelectCo, LLC (“SelectCo”) and entities controlling, controlled by, or under common control with SelectCo (not including any sub-adviser whose role is primarily portfolio management and is subcontracted with or overseen by another investment adviser) that provide ongoing services to the Funds (“Fund Service Providers”):
Services Billed by PwC
| | |
| December 31, 2016A | December 31, 2015A |
Audit-Related Fees | $6,240,000 | $5,290,000 |
Tax Fees | $10,000 | $- |
All Other Fees | $- | $- |
A Amounts may reflect rounding.
“Audit-Related Fees” represent fees billed for assurance and related services that are reasonably related to the performance of the fund audit or the review of the fund's financial statements and that are not reported under Audit Fees.
“Tax Fees” represent fees billed for tax compliance, tax advice or tax planning that relate directly to the operations and financial reporting of the fund.
“All Other Fees” represent fees billed for services provided to the fund or Fund Service Provider, a significant portion of which are assurance related, that relate directly to the operations and financial reporting of the fund, excluding those services that are reported under Audit Fees, Audit-Related Fees or Tax Fees.
Assurance services must be performed by an independent public accountant.
* * *
The aggregate non-audit fees billed by PwC for services rendered to the Funds, SelectCo (not including any sub-adviser whose role is primarily portfolio management and is subcontracted with or overseen by another investment adviser), and any Fund Service Provider for each of the last two fiscal years of the Funds are as follows:
| | |
Billed By | December 31, 2016 A | December 31, 2015 A |
PwC | $8,265,000 | $5,700,000 |
| | |
A Amounts may reflect rounding.
The trust's Audit Committee has considered non-audit services that were not pre-approved that were provided by PwC to Fund Service Providers to be compatible with maintaining the independence of PwC in its audit of the Funds, taking into account representations from PwC, in accordance with Public Company Accounting Oversight Board rules, regarding its independence from the Funds and their related entities and SelectCo’s review of the appropriateness and permissibility under applicable law of such non-audit services prior to their provision to the Fund Service Providers.
Audit Committee Pre-Approval Policies and Procedures
The trust’s Audit Committee must pre-approve all audit and non-audit services provided by a fund’s independent registered public accounting firm relating to the operations or financial reporting of the fund. Prior to the commencement of any audit or non-audit services to a fund, the Audit Committee reviews the services to determine whether they are appropriate and permissible under applicable law.
The Audit Committee has adopted policies and procedures to, among other purposes, provide a framework for the Committee’s consideration of non-audit services by the audit firms that audit the Fidelity funds. The policies and procedures require that any non-audit service provided by a fund audit firm to a Fidelity fund and any non-audit service provided by a fund auditor to a Fund Service Provider that relates directly to the operations and financial reporting of a Fidelity fund (“Covered Service”) are subject to approval by the Audit Committee before such service is provided.
All Covered Services must be approved in advance of provision of the service either: (i) by formal resolution of the Audit Committee, or (ii) by oral or written approval of the service by the Chair of the Audit Committee (or if the Chair is unavailable, such other member of the Audit Committee as may be designated by the Chair to act in the Chair’s absence). The approval contemplated by (ii) above is permitted where the Treasurer determines that action on such an engagement is necessary before the next meeting of the Audit Committee.
Non-audit services provided by a fund audit firm to a Fund Service Provider that do not relate directly to the operations and financial reporting of a Fidelity fund are reported to the Audit Committee on a periodic basis.
Non-Audit Services Approved Pursuant to Rule 2-01(c)(7)(i)(C) and (ii) of Regulation S-X (“De Minimis Exception”)
There were no non-audit services approved or required to be approved by the Audit Committee pursuant to the De Minimis Exception during the Funds’ last two fiscal years relating to services provided to (i) the Funds or (ii) any Fund Service Provider that relate directly to the operations and financial reporting of the Funds.
Item 5.
Audit Committee of Listed Registrants
Not applicable.
Item 6.
Investments
(a)
Not applicable.
(b)
Not applicable
Item 7.
Disclosure of Proxy Voting Policies and Procedures for Closed-End Management Investment Companies
Not applicable.
Item 8.
Portfolio Managers of Closed-End Management Investment Companies
Not applicable.
Item 9.
Purchase of Equity Securities by Closed-End Management Investment Company and Affiliated Purchasers
Not applicable.
Item 10.
Submission of Matters to a Vote of Security Holders
There were no material changes to the procedures by which shareholders may recommend nominees to the trust’s Board of Trustees.
Item 11.
Controls and Procedures
(a)(i) The President and Treasurer and the Chief Financial Officer have concluded that the trust’s disclosure controls and procedures (as defined in Rule 30a-3(c) under the Investment Company Act) provide reasonable assurances that material information relating to the trust is made known to them by the appropriate persons, based on their evaluation of these controls and procedures as of a date within 90 days of the filing date of this report.
(a)(ii) There was no change in the trust’s internal control over financial reporting (as defined in Rule 30a-3(d) under the Investment Company Act) that occurred during the second fiscal quarter of the period covered by this report that has materially affected, or is reasonably likely to materially affect, the trust’s internal control over financial reporting.
Item 12.
Exhibits
| | |
(a) | (1) | Code of Ethics pursuant to Item 2 of Form N-CSR is filed and attached hereto as EX-99.CODE ETH. |
(a) | (2) | Certification pursuant to Rule 30a-2(a) under the Investment Company Act of 1940 (17 CFR 270.30a-2(a)) is filed and attached hereto as Exhibit 99.CERT. |
(a) | (3) | Not applicable. |
(b) | | Certification pursuant to Rule 30a-2(b) under the Investment Company Act of 1940 (17 CFR 270.30a-2(b)) is furnished and attached hereto as Exhibit 99.906CERT. |
SIGNATURES
Pursuant to the requirements of the Securities Exchange Act of 1934 and the Investment Company Act of 1940, the registrant has duly caused this report to be signed on its behalf by the undersigned, thereunto duly authorized.
Variable Insurance Products Fund IV
| |
By: | /s/ Adrien E. Deberghes |
| Adrien E. Deberghes |
| President and Treasurer |
| |
Date: | February 22, 2017 |
Pursuant to the requirements of the Securities Exchange Act of 1934 and the Investment Company Act of 1940, this report has been signed below by the following persons on behalf of the registrant and in the capacities and on the dates indicated.
| |
By: | /s/Adrien E. Deberghes |
| Adrien E. Deberghes |
| President and Treasurer |
| |
Date: | February 22, 2017 |
| |
By: | /s/Howard J. Galligan III |
| Howard J. Galligan III |
| Chief Financial Officer |
| |
Date: | February 22, 2017 |