UNITED STATES
SECURITIES AND EXCHANGE COMMISSION
Washington, D.C. 20549
FORM N-CSR
CERTIFIED SHAREHOLDER REPORT OF REGISTERED
MANAGEMENT INVESTMENT COMPANIES
Investment Company Act file number 811-03759
Variable Insurance Products Fund IV
(Exact name of registrant as specified in charter)
245 Summer St., Boston, Massachusetts 02210
(Address of principal executive offices) (Zip code)
Cynthia Lo Bessette, Secretary
245 Summer St.
Boston, Massachusetts 02210
(Name and address of agent for service)
Registrant's telephone number, including area code:
617-563-7000
| |
Date of fiscal year end: | December 31 |
|
|
Date of reporting period: | December 31, 2019 |
Item 1.
Reports to Stockholders
Fidelity® Variable Insurance Products:
Consumer Discretionary Portfolio
Annual Report
December 31, 2019

See the inside front cover for important information about access to your fund’s shareholder reports.

Beginning on January 1, 2021, as permitted by regulations adopted by the Securities and Exchange Commission, and if your insurance carrier elects to participate, you may not be receiving paper copies of the Fund’s shareholder reports from the insurance company that offers your variable insurance product unless you specifically request paper copies from your financial professional or the administrator of your variable insurance product. Instead, the reports will be made available on a website, and you will be notified by mail each time a report is posted and provided with a website link to access the report.
If you already elected to receive shareholder reports electronically, you will not be affected by this change and you need not take any action. You may elect to receive shareholder reports and other communications from the Fund electronically, by contacting your financial professional or the administrator of your variable insurance product. If you own a Fidelity-administered variable insurance product, please visit fidelity.com/mailpreferences to make your election or call 1-800-343-3548.
You may elect to receive all future reports in paper free of charge. If you wish to continue receiving paper copies of your shareholder reports, you may contact your financial professional or the administrator of your variable insurance product. If you own a Fidelity-administered variable insurance product, please visit fidelity.com/mailpreferences to make your election or call 1-800-343-3548. Your election to receive reports in paper will apply to all funds available under your variable insurance product.
Contents
To view a fund's proxy voting guidelines and proxy voting record for the 12-month period ended June 30, visit http://www.fidelity.com/proxyvotingresults or visit the Securities and Exchange Commission's (SEC) web site at http://www.sec.gov.
You may also call 1-877-208-0098 to request a free copy of the proxy voting guidelines.
Fidelity® Variable Insurance Products are separate account options which are purchased through a variable insurance contract.
Standard & Poor's, S&P and S&P 500 are registered service marks of The McGraw-Hill Companies, Inc. and have been licensed for use by Fidelity Distributors Corporation.
Other third-party marks appearing herein are the property of their respective owners.
All other marks appearing herein are registered or unregistered trademarks or service marks of FMR LLC or an affiliated company. © 2020 FMR LLC. All rights reserved.
This report and the financial statements contained herein are submitted for the general information of the shareholders of the Fund. This report is not authorized for distribution to prospective investors in the Fund unless preceded or accompanied by an effective prospectus.
A fund files its complete schedule of portfolio holdings with the SEC for the first and third quarters of each fiscal year on Form N-PORT. Forms N-PORT are available on the SEC’s web site at http://www.sec.gov. A fund's Forms N-PORT may be reviewed and copied at the SEC’s Public Reference Room in Washington, DC. Information regarding the operation of the SEC's Public Reference Room may be obtained by calling 1-800-SEC-0330.
For a complete list of a fund's portfolio holdings, view the most recent holdings listing, semiannual report, or annual report on Fidelity's web site at http://www.fidelity.com, http://www.institutional.fidelity.com, or http://www.401k.com, as applicable.
NOT FDIC INSURED •MAY LOSE VALUE •NO BANK GUARANTEE
Neither the Fund nor Fidelity Distributors Corporation is a bank.
Note to shareholders:
As part of a regular review of its organizational structure, Fidelity has decided to merge certain entities to streamline operations, increase efficiency, simplify reporting, and reduce legal, compliance, and accounting complexity and costs. In separate events, Fidelity has merged four of its investment advisers and two of its broker-dealers.
Effective on or about January 1, 2020, following any required regulatory notices and approvals:
Investment advisers Fidelity Investments Money Management, Inc., FMR Co., Inc., and Fidelity SelectCo, LLC, merged with and into Fidelity Management & Research Company. In connection with the merger transactions, the resulting, merged investment adviser was then redomiciled from Massachusetts to Delaware, changed its corporate structure from a corporation to a limited liability company, and changed its name to “Fidelity Management & Research Company LLC”.
Broker-dealer Fidelity Distributors Corporation merged with and into Fidelity Investments Institutional Services Company, Inc. (“FIISC”). FIISC was then redomiciled from Massachusetts to Delaware, changed its corporate structure from a corporation to a limited liability company, and changed its name to “Fidelity Distributors Company LLC”.
These mergers are not expected to affect fund shareholders or Fidelity clients, nor are they expected to result in any changes to the day-to-day management of Fidelity’s brokerage services, the Fidelity funds, their investment policies and practices, their portfolio management teams, or the funds’ expenses.
Performance: The Bottom Line
Average annual total return reflects the change in the value of an investment, assuming reinvestment of distributions from dividend income and capital gains (the profits earned upon the sale of securities that have grown in value, if any) and assuming a constant rate of performance each year. During periods of reimbursement by Fidelity, a fund’s total return will be greater than it would be had the reimbursement not occurred. Performance numbers are net of all underlying fund operating expenses, but do not include any insurance charges imposed by your insurance company’s separate account. If performance information included the effect of these additional charges, the total returns would have been lower. How a fund did yesterday is no guarantee of how it will do tomorrow.
Average Annual Total Returns
| For the periods ended December 31, 2019 | Past 1 year | Past 5 years | Past 10 years |
| Initial Class | 27.19% | 11.11% | 15.19% |
| Investor Class | 27.12% | 11.03% | 15.10% |
$10,000 Over 10 Years
Let's say hypothetically that $10,000 was invested in VIP Consumer Discretionary Portfolio - Initial Class on December 31, 2009.
The chart shows how the value of your investment would have changed, and also shows how the S&P 500® Index performed over the same period.
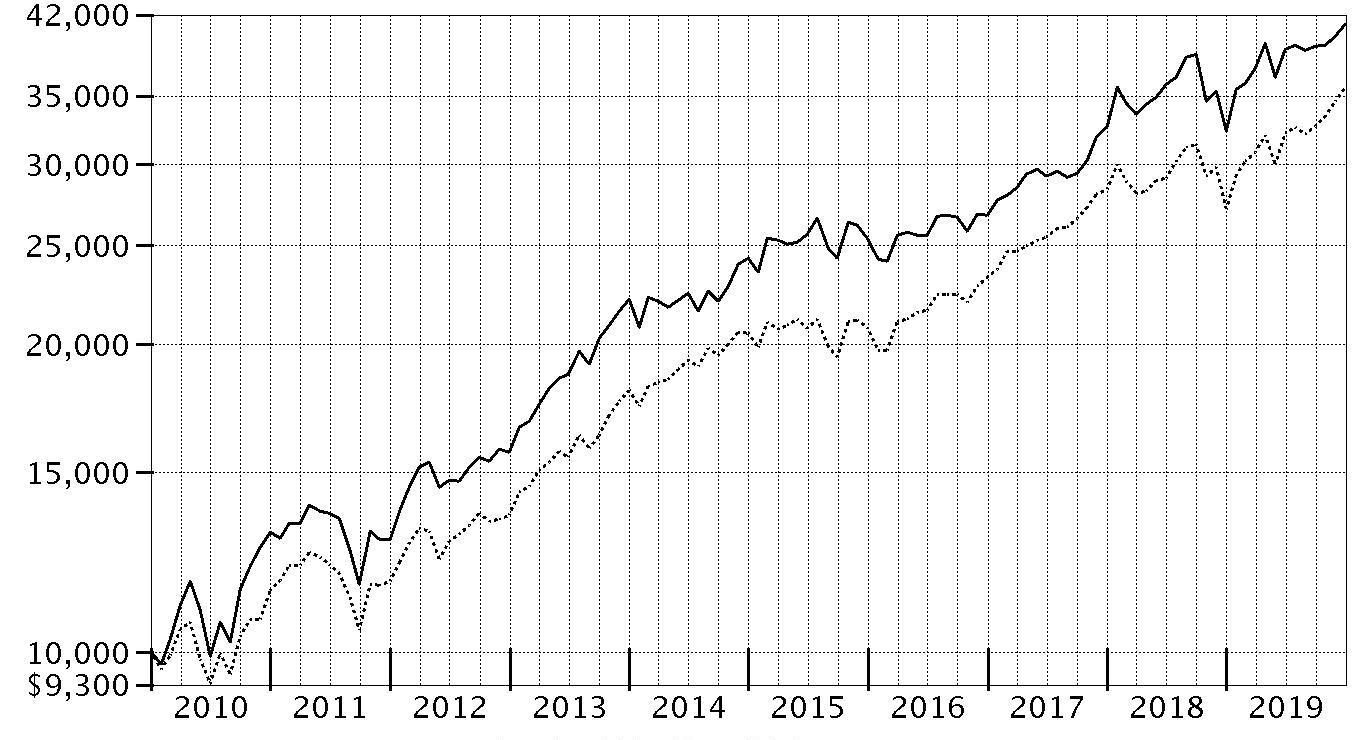
| Period Ending Values |
| $41,120 | VIP Consumer Discretionary Portfolio - Initial Class |
| $35,666 | S&P 500® Index |
Management's Discussion of Fund Performance
Market Recap: U.S. stocks continued to roll in 2019, with the S&P 500
® index soaring 31.49% and marking history as the longest and strongest bull market ever, despite persistent, nagging concerns about global economic growth and trade. After a rough end to 2018, equities sharply reversed course to begin the new year amid upbeat company earnings and signs the Federal Reserve may pause on rates. The uptrend continued until May, when the index sunk as trade negotiations between the U.S. and China broke down. The bull market roared back to record a series of highs in July, when the Fed cut interest rates for the first time since 2008. Volatility intensified in August, as the Treasury yield curve inverted, which some investors viewed as a sign the U.S. economy could be heading for recession. But the market proved resilient, hitting a new high on October 30, when the Fed lowered rates for the third time in 2019, and moving even higher through year-end. Gains were robust and broad-based, with information technology (+50%) leading the way with its best calendar-year result in a decade, amid strong growth trends. Communication services (+33%) and financials (+32%) also stood out. In contrast, energy (+12%) was by far the weakest group – struggling amid sluggish oil prices – while several strong gainers nonetheless fell short of the broader market: industrials and real estate (+29% each), consumer discretionary and consumer staples (+28% each), utilities (+26%), materials (+25%), and health care (+21%).
Comments from Portfolio Manager Katherine Shaw: For the fiscal year, the fund’s share classes gained about 27%, roughly in line with the 27.65% advance of the benchmark MSCI U.S. IMI Consumer Discretionary 25/50 Index, but behind the broad-market S&P 500 index. Consumer discretionary stocks benefited from the solid strength of U.S. consumers overall, with lower interest rates, near-historically low unemployment and slightly rising wages all supporting factors. However, the sector fell short of the broad market, in part due to bouts of uncertainty regarding the U.S.–China trade conflict and the U.S, economy throughout the year, which weighed at times on consumer confidence. The U.S. economy was viewed as being in the late-cycle phase of the business cycle in 2019, a phase in which consumer discretionary stocks often lag. Versus the sector index, my stock choices in apparel retail were a big plus the past year. Here, Burlington Stores, a sizable fund holding that gained 40%, was our top individual contributor versus the sector benchmark. The stock rose sharply in August and November on better-than-expected quarterly results. Picks in hotels, resorts & cruise lines also added value, including overweighted stakes in Marriott Vacations World (+86%) and Royal Caribbean Cruises (+40%). A large underweighting, on average, in automaker General Motors (+14%) also helped because the stock underperformed the sector index. We sold our stake in General Motors by period end. On the negative side, my stock choices in general merchandise stores hurt our relative result. This included not owning index component and retail giant Target (+100%). Largely avoiding electric vehicle maker Tesla (+26%) and underweighting coffee retailer Starbucks (+39%) also weighed on the fund’s relative performance in 2019. We exited the fund’s position in Tesla by December 31.
The views expressed above reflect those of the portfolio manager(s) only through the end of the period as stated on the cover of this report and do not necessarily represent the views of Fidelity or any other person in the Fidelity organization. Any such views are subject to change at any time based upon market or other conditions and Fidelity disclaims any responsibility to update such views. These views may not be relied on as investment advice and, because investment decisions for a Fidelity fund are based on numerous factors, may not be relied on as an indication of trading intent on behalf of any Fidelity fund.
Investment Summary (Unaudited)
Top Ten Stocks as of December 31, 2019
| | % of fund's net assets |
| Amazon.com, Inc. | 23.3 |
| The Home Depot, Inc. | 7.4 |
| McDonald's Corp. | 4.4 |
| Lowe's Companies, Inc. | 4.2 |
| Starbucks Corp. | 3.8 |
| Burlington Stores, Inc. | 3.8 |
| The Booking Holdings, Inc. | 3.8 |
| Royal Caribbean Cruises Ltd. | 3.5 |
| NIKE, Inc. Class B | 3.4 |
| TJX Companies, Inc. | 3.0 |
| | 60.6 |
Top Industries (% of fund's net assets)
| As of December 31, 2019 |
| | Internet & Direct Marketing Retail | 27.3% |
| | Specialty Retail | 26.4% |
| | Hotels, Restaurants & Leisure | 21.7% |
| | Textiles, Apparel & Luxury Goods | 10.0% |
| | Multiline Retail | 5.9% |
| | All Others* | 8.7% |

* Includes short-term investments and net other assets (liabilities).
Schedule of Investments December 31, 2019
Showing Percentage of Net Assets
| Common Stocks - 99.8% | | | |
| | | Shares | Value |
| Automobiles - 0.3% | | | |
| Automobile Manufacturers - 0.3% | | | |
| Ferrari NV | | 3,600 | $595,944 |
| Commercial Services & Supplies - 0.3% | | | |
| Diversified Support Services - 0.3% | | | |
| Copart, Inc. (a) | | 5,700 | 518,358 |
| Distributors - 0.4% | | | |
| Distributors - 0.4% | | | |
| LKQ Corp. (a) | | 25,600 | 913,920 |
| Diversified Consumer Services - 1.2% | | | |
| Education Services - 1.1% | | | |
| Grand Canyon Education, Inc. (a) | | 19,200 | 1,839,168 |
| New Oriental Education & Technology Group, Inc. sponsored ADR (a) | | 3,000 | 363,750 |
| | | | 2,202,918 |
| Specialized Consumer Services - 0.1% | | | |
| OneSpaWorld Holdings Ltd. (b) | | 15,800 | 266,072 |
|
| TOTAL DIVERSIFIED CONSUMER SERVICES | | | 2,468,990 |
|
| Entertainment - 0.5% | | | |
| Movies & Entertainment - 0.5% | | | |
| Live Nation Entertainment, Inc. (a) | | 2,800 | 200,116 |
| Netflix, Inc. (a) | | 900 | 291,213 |
| World Wrestling Entertainment, Inc. Class A | | 7,400 | 480,038 |
| | | | 971,367 |
| Food & Staples Retailing - 1.9% | | | |
| Food Distributors - 1.1% | | | |
| Performance Food Group Co. (a) | | 21,200 | 1,091,376 |
| U.S. Foods Holding Corp. (a) | | 25,213 | 1,056,173 |
| | | | 2,147,549 |
| Hypermarkets & Super Centers - 0.8% | | | |
| BJ's Wholesale Club Holdings, Inc. (a) | | 49,300 | 1,121,082 |
| Walmart, Inc. | | 4,800 | 570,432 |
| | | | 1,691,514 |
|
| TOTAL FOOD & STAPLES RETAILING | | | 3,839,063 |
|
| Hotels, Restaurants & Leisure - 21.7% | | | |
| Casinos & Gaming - 2.1% | | | |
| Churchill Downs, Inc. | | 8,900 | 1,221,080 |
| Eldorado Resorts, Inc. (a) | | 32,862 | 1,959,890 |
| Wynn Resorts Ltd. | | 8,098 | 1,124,569 |
| | | | 4,305,539 |
| Hotels, Resorts & Cruise Lines - 6.0% | | | |
| Hilton Grand Vacations, Inc. (a) | | 20,283 | 697,532 |
| Hilton Worldwide Holdings, Inc. | | 24,000 | 2,661,840 |
| Marriott Vacations Worldwide Corp. | | 13,899 | 1,789,635 |
| Royal Caribbean Cruises Ltd. | | 52,700 | 7,035,977 |
| | | | 12,184,984 |
| Leisure Facilities - 2.0% | | | |
| Drive Shack, Inc. (a) | | 63,621 | 232,853 |
| Planet Fitness, Inc. (a) | | 27,800 | 2,076,104 |
| Vail Resorts, Inc. | | 6,680 | 1,602,064 |
| | | | 3,911,021 |
| Restaurants - 11.6% | | | |
| ARAMARK Holdings Corp. | | 30,644 | 1,329,950 |
| Chipotle Mexican Grill, Inc. (a) | | 3,211 | 2,687,960 |
| McDonald's Corp. | | 45,500 | 8,991,255 |
| Starbucks Corp. | | 88,470 | 7,778,282 |
| Yum! Brands, Inc. | | 27,100 | 2,729,783 |
| | | | 23,517,230 |
|
| TOTAL HOTELS, RESTAURANTS & LEISURE | | | 43,918,774 |
|
| Household Durables - 3.2% | | | |
| Homebuilding - 3.2% | | | |
| D.R. Horton, Inc. | | 50,300 | 2,653,325 |
| Lennar Corp. Class A | | 30,000 | 1,673,700 |
| NVR, Inc. (a) | | 540 | 2,056,541 |
| | | | 6,383,566 |
| Interactive Media & Services - 0.4% | | | |
| Interactive Media & Services - 0.4% | | | |
| Alphabet, Inc. Class A (a) | | 670 | 897,391 |
| Internet & Direct Marketing Retail - 27.3% | | | |
| Internet & Direct Marketing Retail - 27.3% | | | |
| Amazon.com, Inc. (a) | | 25,509 | 47,136,551 |
| The Booking Holdings, Inc. (a) | | 3,700 | 7,598,801 |
| The RealReal, Inc. (b) | | 15,000 | 282,750 |
| Wayfair LLC Class A (a) | | 1,737 | 156,973 |
| | | | 55,175,075 |
| IT Services - 0.3% | | | |
| Data Processing & Outsourced Services - 0.3% | | | |
| PayPal Holdings, Inc. (a) | | 4,900 | 530,033 |
| Multiline Retail - 5.9% | | | |
| General Merchandise Stores - 5.9% | | | |
| B&M European Value Retail SA | | 86,970 | 471,861 |
| Dollar General Corp. | | 31,500 | 4,913,370 |
| Dollar Tree, Inc. (a) | | 54,600 | 5,135,130 |
| Ollie's Bargain Outlet Holdings, Inc. (a)(b) | | 21,100 | 1,378,041 |
| | | | 11,898,402 |
| Specialty Retail - 26.4% | | | |
| Apparel Retail - 9.5% | | | |
| Burlington Stores, Inc. (a) | | 33,383 | 7,612,325 |
| Ross Stores, Inc. | | 37,582 | 4,375,296 |
| The Children's Place Retail Stores, Inc. (b) | | 17,600 | 1,100,352 |
| TJX Companies, Inc. | | 101,334 | 6,187,454 |
| | | | 19,275,427 |
| Automotive Retail - 2.8% | | | |
| AutoZone, Inc. (a) | | 1,700 | 2,025,227 |
| Monro, Inc. | | 8,710 | 681,122 |
| O'Reilly Automotive, Inc. (a) | | 6,773 | 2,968,335 |
| | | | 5,674,684 |
| Computer & Electronics Retail - 1.0% | | | |
| Best Buy Co., Inc. | | 21,677 | 1,903,241 |
| Home Improvement Retail - 12.1% | | | |
| Floor & Decor Holdings, Inc. Class A (a) | | 19,763 | 1,004,158 |
| Lowe's Companies, Inc. | | 70,400 | 8,431,104 |
| The Home Depot, Inc. | | 68,900 | 15,046,382 |
| | | | 24,481,644 |
| Specialty Stores - 1.0% | | | |
| Five Below, Inc. (a) | | 8,316 | 1,063,284 |
| National Vision Holdings, Inc. (a) | | 8,500 | 275,655 |
| Ulta Beauty, Inc. (a) | | 2,600 | 658,164 |
| | | | 1,997,103 |
|
| TOTAL SPECIALTY RETAIL | | | 53,332,099 |
|
| Textiles, Apparel & Luxury Goods - 10.0% | | | |
| Apparel, Accessories & Luxury Goods - 5.8% | | | |
| adidas AG | | 3,121 | 1,014,539 |
| Canada Goose Holdings, Inc. (a)(b) | | 8,400 | 304,096 |
| Capri Holdings Ltd. (a) | | 35,500 | 1,354,325 |
| Carter's, Inc. | | 5,900 | 645,106 |
| G-III Apparel Group Ltd. (a) | | 7,900 | 264,650 |
| Hermes International SCA | | 300 | 224,183 |
| lululemon athletica, Inc. (a) | | 3,068 | 710,764 |
| LVMH Moet Hennessy Louis Vuitton SE | | 2,154 | 1,003,665 |
| PVH Corp. | | 26,400 | 2,775,960 |
| Tapestry, Inc. | | 71,646 | 1,932,293 |
| VF Corp. | | 15,400 | 1,534,764 |
| | | | 11,764,345 |
| Footwear - 4.2% | | | |
| Deckers Outdoor Corp. (a) | | 8,189 | 1,382,795 |
| NIKE, Inc. Class B | | 66,970 | 6,784,731 |
| Puma AG | | 3,130 | 239,971 |
| | | | 8,407,497 |
|
| TOTAL TEXTILES, APPAREL & LUXURY GOODS | | | 20,171,842 |
|
| TOTAL COMMON STOCKS | | | |
| (Cost $130,815,548) | | | 201,614,824 |
|
| Money Market Funds - 1.8% | | | |
| Fidelity Cash Central Fund 1.58% (c) | | 765,461 | 765,614 |
| Fidelity Securities Lending Cash Central Fund 1.58% (c)(d) | | 2,928,504 | 2,928,797 |
| TOTAL MONEY MARKET FUNDS | | | |
| (Cost $3,694,411) | | | 3,694,411 |
| TOTAL INVESTMENT IN SECURITIES - 101.6% | | | |
| (Cost $134,509,959) | | | 205,309,235 |
| NET OTHER ASSETS (LIABILITIES) - (1.6)% | | | (3,151,533) |
| NET ASSETS - 100% | | | $202,157,702 |
Legend
(a) Non-income producing
(b) Security or a portion of the security is on loan at period end.
(c) Affiliated fund that is generally available only to investment companies and other accounts managed by Fidelity Investments. The rate quoted is the annualized seven-day yield of the fund at period end. A complete unaudited listing of the fund's holdings as of its most recent quarter end is available upon request. In addition, each Fidelity Central Fund's financial statements, which are not covered by the Fund's Report of Independent Registered Public Accounting Firm, are available on the SEC's website or upon request.
(d) Investment made with cash collateral received from securities on loan.
Affiliated Central Funds
Information regarding fiscal year to date income earned by the Fund from investments in Fidelity Central Funds is as follows:
| Fund | Income earned |
| Fidelity Cash Central Fund | $10,482 |
| Fidelity Securities Lending Cash Central Fund | 20,997 |
| Total | $31,479 |
Amounts in the income column in the above table include any capital gain distributions from underlying funds, which are presented in the corresponding line-item in the Statement of Operations, if applicable. Amount for Fidelity Securities Lending Cash Central Fund represents the income earned on investing cash collateral, less rebates paid to borrowers and any lending agent fees associated with the loan, plus any premium payments received for lending certain types of securities.
Investment Valuation
The following is a summary of the inputs used, as of December 31, 2019, involving the Fund's assets and liabilities carried at fair value. The inputs or methodology used for valuing securities may not be an indication of the risk associated with investing in those securities. For more information on valuation inputs, and their aggregation into the levels used below, please refer to the Investment Valuation section in the accompanying Notes to Financial Statements.
| | Valuation Inputs at Reporting Date: |
| Description | Total | Level 1 | Level 2 | Level 3 |
| Investments in Securities: | | | | |
| Common Stocks | $201,614,824 | $200,611,159 | $1,003,665 | $-- |
| Money Market Funds | 3,694,411 | 3,694,411 | -- | -- |
| Total Investments in Securities: | $205,309,235 | $204,305,570 | $1,003,665 | $-- |
See accompanying notes which are an integral part of the financial statements.
Financial Statements
Statement of Assets and Liabilities
| | | December 31, 2019 |
| Assets | | |
Investment in securities, at value (including securities loaned of $2,867,571) — See accompanying schedule:
Unaffiliated issuers (cost $130,815,548) | $201,614,824 | |
| Fidelity Central Funds (cost $3,694,411) | 3,694,411 | |
| Total Investment in Securities (cost $134,509,959) | | $205,309,235 |
| Dividends receivable | | 98,058 |
| Distributions receivable from Fidelity Central Funds | | 3,595 |
| Prepaid expenses | | 1,399 |
| Other receivables | | 3,172 |
| Total assets | | 205,415,459 |
| Liabilities | | |
| Payable for fund shares redeemed | $171,452 | |
| Accrued management fee | 88,537 | |
| Other affiliated payables | 28,816 | |
| Other payables and accrued expenses | 40,727 | |
| Collateral on securities loaned | 2,928,225 | |
| Total liabilities | | 3,257,757 |
| Net Assets | | $202,157,702 |
| Net Assets consist of: | | |
| Paid in capital | | $132,106,836 |
| Total accumulated earnings (loss) | | 70,050,866 |
| Net Assets | | $202,157,702 |
| Net Asset Value and Maximum Offering Price | | |
| Initial Class: | | |
| Net Asset Value, offering price and redemption price per share ($25,622,968 ÷ 1,013,799 shares) | | $25.27 |
| Investor Class: | | |
| Net Asset Value, offering price and redemption price per share ($176,534,734 ÷ 7,006,209 shares) | | $25.20 |
See accompanying notes which are an integral part of the financial statements.
Statement of Operations
| | | Year ended December 31, 2019 |
| Investment Income | | |
| Dividends | | $1,990,184 |
| Income from Fidelity Central Funds (including $20,997 from security lending) | | 31,479 |
| Total income | | 2,021,663 |
| Expenses | | |
| Management fee | $1,088,281 | |
| Transfer agent fees | 271,087 | |
| Accounting and security lending fees | 79,039 | |
| Custodian fees and expenses | 20,175 | |
| Independent trustees' fees and expenses | 1,118 | |
| Audit | 49,381 | |
| Legal | 3,635 | |
| Miscellaneous | 1,388 | |
| Total expenses before reductions | 1,514,104 | |
| Expense reductions | (7,592) | |
| Total expenses after reductions | | 1,506,512 |
| Net investment income (loss) | | 515,151 |
| Realized and Unrealized Gain (Loss) | | |
| Net realized gain (loss) on: | | |
| Investment securities: | | |
| Unaffiliated issuers | 2,220,153 | |
| Fidelity Central Funds | 35 | |
| Foreign currency transactions | 1,910 | |
| Total net realized gain (loss) | | 2,222,098 |
| Change in net unrealized appreciation (depreciation) on: | | |
| Investment securities: | | |
| Unaffiliated issuers | 44,375,390 | |
| Assets and liabilities in foreign currencies | (54) | |
| Total change in net unrealized appreciation (depreciation) | | 44,375,336 |
| Net gain (loss) | | 46,597,434 |
| Net increase (decrease) in net assets resulting from operations | | $47,112,585 |
See accompanying notes which are an integral part of the financial statements.
Statement of Changes in Net Assets
| | Year ended December 31, 2019 | Year ended December 31, 2018 |
| Increase (Decrease) in Net Assets | | |
| Operations | | |
| Net investment income (loss) | $515,151 | $539,950 |
| Net realized gain (loss) | 2,222,098 | 7,936,610 |
| Change in net unrealized appreciation (depreciation) | 44,375,336 | (16,134,939) |
| Net increase (decrease) in net assets resulting from operations | 47,112,585 | (7,658,379) |
| Distributions to shareholders | (10,352,712) | (7,904,633) |
| Share transactions - net increase (decrease) | (21,193,150) | 52,445,882 |
| Total increase (decrease) in net assets | 15,566,723 | 36,882,870 |
| Net Assets | | |
| Beginning of period | 186,590,979 | 149,708,109 |
| End of period | $202,157,702 | $186,590,979 |
See accompanying notes which are an integral part of the financial statements.
Financial Highlights
VIP Consumer Discretionary Portfolio Initial Class
| Years ended December 31, | 2019 | 2018 | 2017 | 2016 | 2015 |
| Selected Per–Share Data | | | | | |
| Net asset value, beginning of period | $20.97 | $22.27 | $18.33 | $17.88 | $19.01 |
| Income from Investment Operations | | | | | |
| Net investment income (loss)A | .08 | .08 | .12 | .15 | .13 |
| Net realized and unrealized gain (loss) | 5.42 | (.30) | 3.93 | .73 | .73 |
| Total from investment operations | 5.50 | (.22) | 4.05 | .88 | .86 |
| Distributions from net investment income | (.08) | (.07) | (.11) | (.14) | (.09) |
| Distributions from net realized gain | (1.12) | (1.01) | – | (.30) | (1.91) |
| Total distributions | (1.20) | (1.08) | (.11) | (.44) | (2.00) |
| Redemption fees added to paid in capitalA | – | – | –B | .01 | .01 |
| Net asset value, end of period | $25.27 | $20.97 | $22.27 | $18.33 | $17.88 |
| Total ReturnC,D | 27.19% | (1.09)% | 22.16% | 5.24% | 4.71% |
| Ratios to Average Net AssetsE,F | | | | | |
| Expenses before reductions | .68% | .68% | .71% | .70% | .70% |
| Expenses net of fee waivers, if any | .68% | .68% | .71% | .70% | .70% |
| Expenses net of all reductions | .67% | .67% | .70% | .70% | .69% |
| Net investment income (loss) | .32% | .35% | .58% | .86% | .69% |
| Supplemental Data | | | | | |
| Net assets, end of period (000 omitted) | $25,623 | $25,079 | $22,057 | $23,677 | $42,048 |
| Portfolio turnover rateG | 40% | 38% | 81% | 43% | 46% |
A Calculated based on average shares outstanding during the period.
B Amount represents less than $.005 per share.
C Total returns do not reflect charges attributable to your insurance company's separate account. Inclusion of these charges would reduce the total returns shown.
D Total returns would have been lower if certain expenses had not been reduced during the applicable periods shown.
E Fees and expenses of any underlying Fidelity Central Funds are not included in the Fund's expense ratio. The Fund indirectly bears its proportionate share of the expenses of any underlying Fidelity Central Funds.
F Expense ratios reflect operating expenses of the class. Expenses before reductions do not reflect amounts reimbursed by the investment adviser or reductions from brokerage service arrangements or reductions from other expense offset arrangements and do not represent the amount paid by the class during periods when reimbursements or reductions occur. Expenses net of fee waivers reflect expenses after reimbursement by the investment adviser but prior to reductions from brokerage service arrangements or other expense offset arrangements. Expenses net of all reductions represent the net expenses paid by the class.
G Amount does not include the portfolio activity of any underlying Fidelity Central Funds.
See accompanying notes which are an integral part of the financial statements.
VIP Consumer Discretionary Portfolio Investor Class
| Years ended December 31, | 2019 | 2018 | 2017 | 2016 | 2015 |
| Selected Per–Share Data | | | | | |
| Net asset value, beginning of period | $20.91 | $22.21 | $18.28 | $17.84 | $18.97 |
| Income from Investment Operations | | | | | |
| Net investment income (loss)A | .06 | .06 | .10 | .14 | .11 |
| Net realized and unrealized gain (loss) | 5.41 | (.29) | 3.93 | .71 | .74 |
| Total from investment operations | 5.47 | (.23) | 4.03 | .85 | .85 |
| Distributions from net investment income | (.06) | (.06) | (.10) | (.13) | (.08) |
| Distributions from net realized gain | (1.12) | (1.01) | – | (.30) | (1.91) |
| Total distributions | (1.18) | (1.07) | (.10) | (.42)B | (1.99) |
| Redemption fees added to paid in capitalA | – | – | –C | .01 | .01 |
| Net asset value, end of period | $25.20 | $20.91 | $22.21 | $18.28 | $17.84 |
| Total ReturnD,E | 27.12% | (1.16)% | 22.07% | 5.12% | 4.66% |
| Ratios to Average Net AssetsF,G | | | | | |
| Expenses before reductions | .76% | .76% | .79% | .78% | .78% |
| Expenses net of fee waivers, if any | .76% | .76% | .79% | .78% | .77% |
| Expenses net of all reductions | .75% | .75% | .78% | .78% | .77% |
| Net investment income (loss) | .24% | .27% | .50% | .78% | .61% |
| Supplemental Data | | | | | |
| Net assets, end of period (000 omitted) | $176,535 | $161,512 | $127,651 | $124,272 | $165,927 |
| Portfolio turnover rateH | 40% | 38% | 81% | 43% | 46% |
A Calculated based on average shares outstanding during the period.
B Total distributions of $.42 per share is comprised of distributions from net investment income of $.125 and distributions from net realized gain of $.298 per share.
C Amount represents less than $.005 per share.
D Total returns do not reflect charges attributable to your insurance company's separate account. Inclusion of these charges would reduce the total returns shown.
E Total returns would have been lower if certain expenses had not been reduced during the applicable periods shown.
F Fees and expenses of any underlying Fidelity Central Funds are not included in the Fund's expense ratio. The Fund indirectly bears its proportionate share of the expenses of any underlying Fidelity Central Funds.
G Expense ratios reflect operating expenses of the class. Expenses before reductions do not reflect amounts reimbursed by the investment adviser or reductions from brokerage service arrangements or reductions from other expense offset arrangements and do not represent the amount paid by the class during periods when reimbursements or reductions occur. Expenses net of fee waivers reflect expenses after reimbursement by the investment adviser but prior to reductions from brokerage service arrangements or other expense offset arrangements. Expenses net of all reductions represent the net expenses paid by the class.
H Amount does not include the portfolio activity of any underlying Fidelity Central Funds.
See accompanying notes which are an integral part of the financial statements.
Notes to Financial Statements
For the period ended December 31, 2019
1. Organization.
VIP Consumer Discretionary Portfolio (the Fund) is a non-diversified fund of Variable Insurance Products Fund IV (the Trust) and is authorized to issue an unlimited number of shares. The Trust is registered under the Investment Company Act of 1940, as amended (the 1940 Act), as an open-end management investment company organized as a Massachusetts business trust. Shares of the Fund may only be purchased by insurance companies for the purpose of funding variable annuity or variable life insurance contracts. The Fund offers the following classes of shares: Initial Class shares and Investor Class shares. All classes have equal rights and voting privileges, except for matters affecting a single class.
2. Investments in Fidelity Central Funds.
The Fund invests in Fidelity Central Funds, which are open-end investment companies generally available only to other investment companies and accounts managed by the investment adviser and its affiliates. The Fund's Schedule of Investments lists each of the Fidelity Central Funds held as of period end, if any, as an investment of the Fund, but does not include the underlying holdings of each Fidelity Central Fund. As an Investing Fund, the Fund indirectly bears its proportionate share of the expenses of the underlying Fidelity Central Funds.
The Money Market Central Funds seek preservation of capital and current income and are managed by Fidelity Investments Money Management, Inc. (FIMM), an affiliate of the investment adviser. Annualized expenses of the Money Market Central Funds as of their most recent shareholder report date ranged from less than .005% to .01%.
A complete unaudited list of holdings for each Fidelity Central Fund is available upon request or at the Securities and Exchange Commission (the SEC) website at www.sec.gov. In addition, the financial statements of the Fidelity Central Funds, which are not covered by the Fund's Report of Independent Registered Public Accounting Firm, are available on the SEC website or upon request.
3. Significant Accounting Policies.
The Fund is an investment company and applies the accounting and reporting guidance of the Financial Accounting Standards Board (FASB) Accounting Standards Codification Topic 946 Financial Services – Investments Companies. The financial statements have been prepared in conformity with accounting principles generally accepted in the United States of America (GAAP), which require management to make certain estimates and assumptions at the date of the financial statements. Actual results could differ from those estimates. Subsequent events, if any, through the date that the financial statements were issued have been evaluated in the preparation of the financial statements. The following summarizes the significant accounting policies of the Fund:
Investment Valuation. Investments are valued as of 4:00 p.m. Eastern time on the last calendar day of the period. The Board of Trustees (the Board) has delegated the day to day responsibility for the valuation of the Fund's investments to the Fair Value Committee (the Committee) established by the Fund's investment adviser. In accordance with valuation policies and procedures approved by the Board, the Fund attempts to obtain prices from one or more third party pricing vendors or brokers to value its investments. When current market prices, quotations or currency exchange rates are not readily available or reliable, investments will be fair valued in good faith by the Committee, in accordance with procedures adopted by the Board. Factors used in determining fair value vary by investment type and may include market or investment specific events. The frequency with which these procedures are used cannot be predicted and they may be utilized to a significant extent. The Committee oversees the Fund's valuation policies and procedures and reports to the Board on the Committee's activities and fair value determinations. The Board monitors the appropriateness of the procedures used in valuing the Fund's investments and ratifies the fair value determinations of the Committee.
The Fund categorizes the inputs to valuation techniques used to value its investments into a disclosure hierarchy consisting of three levels as shown below:
- Level 1 – quoted prices in active markets for identical investments
- Level 2 – other significant observable inputs (including quoted prices for similar investments, interest rates, prepayment speeds, etc.)
- Level 3 – unobservable inputs (including the Fund's own assumptions based on the best information available)
Valuation techniques used to value the Fund's investments by major category are as follows:
Equity securities, including restricted securities, for which market quotations are readily available, are valued at the last reported sale price or official closing price as reported by a third party pricing vendor on the primary market or exchange on which they are traded and are categorized as Level 1 in the hierarchy. In the event there were no sales during the day or closing prices are not available, securities are valued at the last quoted bid price or may be valued using the last available price and are generally categorized as Level 2 in the hierarchy. For foreign equity securities, when market or security specific events arise, comparisons to the valuation of American Depositary Receipts (ADRs), futures contracts, Exchange-Traded Funds (ETFs) and certain indexes as well as quoted prices for similar securities may be used and would be categorized as Level 2 in the hierarchy. For equity securities, including restricted securities, where observable inputs are limited, assumptions about market activity and risk are used and these securities may be categorized as Level 3 in the hierarchy.
Investments in open-end mutual funds, including the Fidelity Central Funds, are valued at their closing net asset value (NAV) each business day and are categorized as Level 1 in the hierarchy.
Changes in valuation techniques may result in transfers in or out of an assigned level within the disclosure hierarchy. The aggregate value of investments by input level as of December 31, 2019 is included at the end of the Fund's Schedule of Investments.
Foreign Currency. The Fund may use foreign currency contracts to facilitate transactions in foreign-denominated securities. Gains and losses from these transactions may arise from changes in the value of the foreign currency or if the counterparties do not perform under the contracts' terms.
Foreign-denominated assets, including investment securities, and liabilities are translated into U.S. dollars at the exchange rates at period end. Purchases and sales of investment securities, income and dividends received and expenses denominated in foreign currencies are translated into U.S. dollars at the exchange rate in effect on the transaction date.
The effects of exchange rate fluctuations on investments are included with the net realized and unrealized gain (loss) on investment securities. Other foreign currency transactions resulting in realized and unrealized gain (loss) are disclosed separately.
Investment Transactions and Income. For financial reporting purposes, the Fund's investment holdings and NAV include trades executed through the end of the last business day of the period. The NAV per share for processing shareholder transactions is calculated as of the close of business of the New York Stock Exchange (NYSE), normally 4:00 p.m. Eastern time and includes trades executed through the end of the prior business day. Gains and losses on securities sold are determined on the basis of identified cost and include proceeds received from litigation. Dividend income is recorded on the ex-dividend date, except for certain dividends from foreign securities where the ex-dividend date may have passed, which are recorded as soon as the Fund is informed of the ex-dividend date. Non-cash dividends included in dividend income, if any, are recorded at the fair market value of the securities received. Income and capital gain distributions from Fidelity Central Funds, if any, are recorded on the ex-dividend date. Certain distributions received by the Fund represent a return of capital or capital gain. The Fund determines the components of these distributions subsequent to the ex-dividend date, based upon receipt of tax filings or other correspondence relating to the underlying investment. These distributions are recorded as a reduction of cost of investments and/or as a realized gain. Investment income is recorded net of foreign taxes withheld where recovery of such taxes is uncertain.
Class Allocations and Expenses. Investment income, realized and unrealized capital gains and losses, common expenses of the Fund, and certain fund-level expense reductions, if any, are allocated daily on a pro-rata basis to each class based on the relative net assets of each class to the total net assets of the Fund. Each class differs with respect to transfer agent fees incurred. Certain expense reductions may also differ by class. For the reporting period, the allocated portion of income and expenses to each class as a percent of its average net assets may vary due to the timing of recording these transactions in relation to fluctuating net assets of the classes. Expenses directly attributable to a fund are charged to that fund. Expenses attributable to more than one fund are allocated among the respective funds on the basis of relative net assets or other appropriate methods. Expense estimates are accrued in the period to which they relate and adjustments are made when actual amounts are known.
Income Tax Information and Distributions to Shareholders. Each year, the Fund intends to qualify as a regulated investment company under Subchapter M of the Internal Revenue Code, including distributing substantially all of its taxable income and realized gains. As a result, no provision for U.S. Federal income taxes is required. As of December 31, 2019, the Fund did not have any unrecognized tax benefits in the financial statements; nor is the Fund aware of any tax positions for which it is reasonably possible that the total amounts of unrecognized tax benefits will significantly change in the next twelve months. The Fund files a U.S. federal tax return, in addition to state and local tax returns as required. The Fund's federal income tax returns are subject to examination by the Internal Revenue Service (IRS) for a period of three fiscal years after they are filed. State and local tax returns may be subject to examination for an additional fiscal year depending on the jurisdiction. Foreign taxes are provided for based on the Fund's understanding of the tax rules and rates that exist in the foreign markets in which it invests.
Distributions are declared and recorded on the ex-dividend date. Income and capital gain distributions are declared separately for each class. Income and capital gain distributions are determined in accordance with income tax regulations, which may differ from GAAP.
Capital accounts within the financial statements are adjusted for permanent book-tax differences. These adjustments have no impact on net assets or the results of operations. Capital accounts are not adjusted for temporary book-tax differences which will reverse in a subsequent period.
Book-tax differences are primarily due to foreign currency transactions, partnerships, capital loss carryforwards and losses deferred due to wash sales and excise tax regulations.
As of period end, the cost and unrealized appreciation (depreciation) in securities, and derivatives if applicable, for federal income tax purposes were as follows:
| Gross unrealized appreciation | $73,086,740 |
| Gross unrealized depreciation | (2,570,935) |
| Net unrealized appreciation (depreciation) | $70,515,805 |
| Tax Cost | $134,793,430 |
The tax-based components of distributable earnings as of period end were as follows:
| Undistributed ordinary income | $183,690 |
| Capital loss carryforward | $(648,443) |
| Net unrealized appreciation (depreciation) on securities and other investments | $70,515,617 |
Capital loss carryforwards are only available to offset future capital gains of the Fund to the extent provided by regulations and may be limited. The capital loss carryforward information presented below, including any applicable limitation, is estimated as of fiscal period end and is subject to adjustment.
| No expiration | |
| Short-term | $(648,443) |
The tax character of distributions paid was as follows:
| | December 31, 2019 | December 31, 2018 |
| Ordinary Income | $511,951 | $ 1,589,696 |
| Long-term Capital Gains | 9,840,761 | 6,314,937 |
| Total | $10,352,712 | $ 7,904,633 |
4. Purchases and Sales of Investments.
Purchases and sales of securities, other than short-term securities, aggregated $80,276,389 and $111,236,175, respectively.
5. Fees and Other Transactions with Affiliates.
Management Fee. Fidelity SelectCo, LLC (the investment adviser) and its affiliates provide the Fund with investment management related services for which the Fund pays a monthly management fee. The management fee is the sum of an individual fund fee rate that is based on an annual rate of .30% of the Fund's average net assets and an annualized group fee rate that averaged .24% during the period. The group fee rate is based upon the average net assets of all the mutual funds advised by Fidelity Management & Research Company (FMR) and the investment adviser. The group fee rate decreases as assets under management increase and increases as assets under management decrease. For the reporting period, the total annual management fee rate was .54% of the Fund's average net assets.
Transfer Agent Fees. Fidelity Investments Institutional Operations Company, Inc. (FIIOC), an affiliate of the investment adviser, is the Fund's transfer, dividend disbursing, and shareholder servicing agent. FIIOC receives an asset-based fee with respect to each class. Each class pays a fee for transfer agent services, typesetting and printing and mailing of shareholder reports, excluding mailing of proxy statements, equal to an annual rate of class-level average net assets. The annual rate for Investor Class is .15% and the annual rate for all other classes is .07%. For the period, transfer agent fees for each class were as follows:
| Initial Class | $17,378 |
| Investor Class | 253,709 |
| | $271,087 |
Accounting and Security Lending Fees. Fidelity Service Company, Inc. (FSC), an affiliate of the investment adviser, maintains the Fund's accounting records. The accounting fee is based on the level of average net assets for each month. Prior to April 1, 2019, FSC had a separate agreement with the Fund for administration of the security lending program, based on the number and duration of lending transactions. For the period, the total fees paid for accounting and administration of securities lending were equivalent to the following annual rates:
| | % of Average Net Assets |
| VIP Consumer Discretionary Portfolio | .04 |
Brokerage Commissions. A portion of portfolio transactions were placed with brokerage firms which are affiliates of the investment adviser. Brokerage commissions are included in net realized gain (loss) and change in net unrealized appreciation (depreciation) in the Statement of Operations. The commissions paid to these affiliated firms were as follows:
| | Amount |
| VIP Consumer Discretionary Portfolio | $1,290 |
Interfund Trades. The Fund may purchase from or sell securities to other Fidelity Funds under procedures adopted by the Board. The procedures have been designed to ensure these interfund trades are executed in accordance with Rule 17a-7 of the 1940 Act. Interfund trades are included within the respective purchases and sales amounts shown in the Purchases and Sales of Investments note.
6. Committed Line of Credit.
The Fund participates with other funds managed by the investment adviser or an affiliate in a $4.25 billion credit facility (the "line of credit") to be utilized for temporary or emergency purposes to fund shareholder redemptions or for other short-term liquidity purposes. The Fund has agreed to pay commitment fees on its pro-rata portion of the line of credit, which amounted to $544 and is reflected in Miscellaneous expenses on the Statement of Operations. During the period, the Fund did not borrow on this line of credit.
7. Security Lending.
The Fund lends portfolio securities from time to time in order to earn additional income. For equity securities, lending agents are used, including National Financial Services (NFS), an affiliate of the Fund. Pursuant to a securities lending agreement, NFS will receive a fee, which is capped at 9.9% of daily lending revenue, for its services as lending agent. The Fund may lend securities to certain qualified borrowers. On the settlement date of the loan, the Fund receives collateral (in the form of U.S. Treasury obligations, letters of credit and/or cash) against the loaned securities and maintains collateral in an amount not less than 100% of the market value of the loaned securities during the period of the loan. The market value of the loaned securities is determined at the close of business of the Fund and any additional required collateral is delivered to the Fund on the next business day. The Fund or borrower may terminate the loan at any time, and if the borrower defaults on its obligation to return the securities loaned because of insolvency or other reasons, the Fund may apply collateral received from the borrower against the obligation. The Fund may experience delays and costs in recovering the securities loaned. Any cash collateral received is invested in the Fidelity Securities Lending Cash Central Fund. The value of loaned securities and cash collateral at period end are disclosed on the Fund's Statement of Assets and Liabilities. Total fees paid by the Fund to NFS amounted to $1,769. Security lending income represents the income earned on investing cash collateral, less rebates paid to borrowers and any lending agent fees associated with the loan, plus any premium payments received for lending certain types of securities. Security lending income is presented in the Statement of Operations as a component of income from Fidelity Central Funds.
8. Expense Reductions.
Commissions paid to certain brokers with whom the investment adviser, or its affiliates, places trades on behalf of the Fund include an amount in addition to trade execution, which may be rebated back to the Fund to offset certain expenses. This amount totaled $6,031 for the period.
In addition, during the period the investment adviser reimbursed and/or waived a portion of fund-level operating expenses in the amount of $1,561.
9. Distributions to Shareholders.
Distributions to shareholders of each class were as follows:
| | Year ended
December 31, 2019 | Year ended
December 31, 2018 |
| Distributions to shareholders | | |
| Initial Class | $1,396,756 | $1,134,568 |
| Investor Class | 8,955,956 | 6,770,065 |
| Total | $10,352,712 | $7,904,633 |
10. Share Transactions.
Transactions for each class of shares were as follows:
| | Shares | Shares | Dollars | Dollars |
| | Year ended December 31, 2019 | Year ended December 31, 2018 | Year ended December 31, 2019 | Year ended December 31, 2018 |
| Initial Class | | | | |
| Shares sold | 91,651 | 431,880 | $2,173,332 | $10,153,361 |
| Reinvestment of distributions | 64,458 | 52,520 | 1,396,756 | 1,134,568 |
| Shares redeemed | (338,052) | (279,023) | (7,915,821) | (6,318,800) |
| Net increase (decrease) | (181,943) | 205,377 | $(4,345,733) | $4,969,129 |
| Investor Class | | | | |
| Shares sold | 761,888 | 3,052,639 | $18,094,527 | $71,763,597 |
| Reinvestment of distributions | 414,953 | 314,264 | 8,955,956 | 6,770,065 |
| Shares redeemed | (1,893,596) | (1,391,020) | (43,897,900) | (31,056,909) |
| Net increase (decrease) | (716,755) | 1,975,883 | $(16,847,417) | $47,476,753 |
11. Other.
The Fund's organizational documents provide former and current trustees and officers with a limited indemnification against liabilities arising in connection with the performance of their duties to the Fund. In the normal course of business, the Fund may also enter into contracts that provide general indemnifications. The Fund's maximum exposure under these arrangements is unknown as this would be dependent on future claims that may be made against the Fund. The risk of material loss from such claims is considered remote.
At the end of the period, the investment adviser or its affiliates were the owners of record of 100% of the total outstanding shares of the Fund.
Effective January 1, 2020, following any required regulatory notices and approvals:
Investment advisers Fidelity Investments Money Management, Inc., FMR Co., Inc., and Fidelity SelectCo, LLC, merged with and into Fidelity Management & Research Company. In connection with the merger transactions, the resulting, merged investment adviser was then redomiciled from Massachusetts to Delaware, changed its corporate structure from a corporation to a limited liability company, and changed its name to "Fidelity Management & Research Company LLC".
Fidelity Investments Institutional Operations Company, Inc. (FIIOC) converted from a Massachusetts corporation to a Massachusetts LLC, and changed its name to "Fidelity Investments Institutional Operations Company LLC".
Report of Independent Registered Public Accounting Firm
To the Board of Trustees of Variable Insurance Products Fund IV and Shareholders of VIP Consumer Discretionary Portfolio:
Opinion on the Financial Statements
We have audited the accompanying statement of assets and liabilities, including the schedule of investments, of VIP Consumer Discretionary Portfolio (one of the funds constituting Variable Insurance Products Fund IV, referred to hereafter as the “Fund”) as of December 31, 2019, the related statement of operations for the year ended December 31, 2019, the statement of changes in net assets for each of the two years in the period ended December 31, 2019, including the related notes, and the financial highlights for each of the five years in the period ended December 31, 2019 (collectively referred to as the “financial statements”). In our opinion, the financial statements present fairly, in all material respects, the financial position of the Fund as of December 31, 2019, the results of its operations for the year then ended, the changes in its net assets for each of the two years in the period ended December 31, 2019 and the financial highlights for each of the five years in the period ended December 31, 2019 in conformity with accounting principles generally accepted in the United States of America.
Basis for Opinion
These financial statements are the responsibility of the Fund’s management. Our responsibility is to express an opinion on the Fund’s financial statements based on our audits. We are a public accounting firm registered with the Public Company Accounting Oversight Board (United States) (PCAOB) and are required to be independent with respect to the Fund in accordance with the U.S. federal securities laws and the applicable rules and regulations of the Securities and Exchange Commission and the PCAOB.
We conducted our audits of these financial statements in accordance with the standards of the PCAOB. Those standards require that we plan and perform the audit to obtain reasonable assurance about whether the financial statements are free of material misstatement, whether due to error or fraud.
Our audits included performing procedures to assess the risks of material misstatement of the financial statements, whether due to error or fraud, and performing procedures that respond to those risks. Such procedures included examining, on a test basis, evidence regarding the amounts and disclosures in the financial statements. Our audits also included evaluating the accounting principles used and significant estimates made by management, as well as evaluating the overall presentation of the financial statements. Our procedures included confirmation of securities owned as of December 31, 2019 by correspondence with the custodian. We believe that our audits provide a reasonable basis for our opinion.
PricewaterhouseCoopers LLP
Boston, Massachusetts
February 14, 2020
We have served as the auditor of one or more investment companies in the Fidelity group of funds since 1932.
Trustees and Officers
The Trustees, Members of the Advisory Board (if any), and officers of the trust and fund, as applicable, are listed below. The Board of Trustees governs the fund and is responsible for protecting the interests of shareholders. The Trustees are experienced executives who meet periodically throughout the year to oversee the fund's activities, review contractual arrangements with companies that provide services to the fund, oversee management of the risks associated with such activities and contractual arrangements, and review the fund's performance. Except for Michael E. Wiley, each of the Trustees oversees 302 funds. Mr. Wiley oversees 199 funds.
The Trustees hold office without limit in time except that (a) any Trustee may resign; (b) any Trustee may be removed by written instrument, signed by at least two-thirds of the number of Trustees prior to such removal; (c) any Trustee who requests to be retired or who has become incapacitated by illness or injury may be retired by written instrument signed by a majority of the other Trustees; and (d) any Trustee may be removed at any special meeting of shareholders by a two-thirds vote of the outstanding voting securities of the trust. Each Trustee who is not an interested person (as defined in the Investment Company Act of 1940 (1940 Act)) of the trust and the fund is referred to herein as an Independent Trustee. Each Independent Trustee shall retire not later than the last day of the calendar year in which his or her 75th birthday occurs. The Independent Trustees may waive this mandatory retirement age policy with respect to individual Trustees. Officers and Advisory Board Members hold office without limit in time, except that any officer or Advisory Board Member may resign or may be removed by a vote of a majority of the Trustees at any regular meeting or any special meeting of the Trustees. Except as indicated, each individual has held the office shown or other offices in the same company for the past five years.
The fund’s Statement of Additional Information (SAI) includes more information about the Trustees. To request a free copy, call Fidelity at 1-877-208-0098.
Experience, Skills, Attributes, and Qualifications of the Trustees. The Governance and Nominating Committee has adopted a statement of policy that describes the experience, qualifications, attributes, and skills that are necessary and desirable for potential Independent Trustee candidates (Statement of Policy). The Board believes that each Trustee satisfied at the time he or she was initially elected or appointed a Trustee, and continues to satisfy, the standards contemplated by the Statement of Policy. The Governance and Nominating Committee also engages professional search firms to help identify potential Independent Trustee candidates who have the experience, qualifications, attributes, and skills consistent with the Statement of Policy. From time to time, additional criteria based on the composition and skills of the current Independent Trustees, as well as experience or skills that may be appropriate in light of future changes to board composition, business conditions, and regulatory or other developments, have also been considered by the professional search firms and the Governance and Nominating Committee. In addition, the Board takes into account the Trustees' commitment and participation in Board and committee meetings, as well as their leadership of standing and ad hoc committees throughout their tenure.
In determining that a particular Trustee was and continues to be qualified to serve as a Trustee, the Board has considered a variety of criteria, none of which, in isolation, was controlling. The Board believes that, collectively, the Trustees have balanced and diverse experience, qualifications, attributes, and skills, which allow the Board to operate effectively in governing the fund and protecting the interests of shareholders. Information about the specific experience, skills, attributes, and qualifications of each Trustee, which in each case led to the Board's conclusion that the Trustee should serve (or continue to serve) as a trustee of the fund, is provided below.
Board Structure and Oversight Function. James C. Curvey is an interested person and currently serves as Chairman. The Trustees have determined that an interested Chairman is appropriate and benefits shareholders because an interested Chairman has a personal and professional stake in the quality and continuity of services provided to the fund. Independent Trustees exercise their informed business judgment to appoint an individual of their choosing to serve as Chairman, regardless of whether the Trustee happens to be independent or a member of management. The Independent Trustees have determined that they can act independently and effectively without having an Independent Trustee serve as Chairman and that a key structural component for assuring that they are in a position to do so is for the Independent Trustees to constitute a substantial majority for the Board. The Independent Trustees also regularly meet in executive session. Ned C. Lautenbach serves as Chairman of the Independent Trustees and as such (i) acts as a liaison between the Independent Trustees and management with respect to matters important to the Independent Trustees and (ii) with management prepares agendas for Board meetings.
Fidelity® funds are overseen by different Boards of Trustees. The fund's Board oversees Fidelity's high income and certain equity funds, and other Boards oversee Fidelity's investment-grade bond, money market, asset allocation, and other equity funds. The asset allocation funds may invest in Fidelity® funds overseen by the fund's Board. The use of separate Boards, each with its own committee structure, allows the Trustees of each group of Fidelity® funds to focus on the unique issues of the funds they oversee, including common research, investment, and operational issues. On occasion, the separate Boards establish joint committees to address issues of overlapping consequences for the Fidelity® funds overseen by each Board.
The Trustees operate using a system of committees to facilitate the timely and efficient consideration of all matters of importance to the Trustees, the fund, and fund shareholders and to facilitate compliance with legal and regulatory requirements and oversight of the fund's activities and associated risks. The Board, acting through its committees, has charged FMR and its affiliates with (i) identifying events or circumstances the occurrence of which could have demonstrably adverse effects on the fund's business and/or reputation; (ii) implementing processes and controls to lessen the possibility that such events or circumstances occur or to mitigate the effects of such events or circumstances if they do occur; and (iii) creating and maintaining a system designed to evaluate continuously business and market conditions in order to facilitate the identification and implementation processes described in (i) and (ii) above. Because the day-to-day operations and activities of the fund are carried out by or through FMR, its affiliates, and other service providers, the fund's exposure to risks is mitigated but not eliminated by the processes overseen by the Trustees. While each of the Board's committees has responsibility for overseeing different aspects of the fund's activities, oversight is exercised primarily through the Operations, Audit, and Compliance Committees. Appropriate personnel, including but not limited to the fund's Chief Compliance Officer (CCO), FMR's internal auditor, the independent accountants, the fund's Treasurer and portfolio management personnel, make periodic reports to the Board's committees, as appropriate, including an annual review of Fidelity's risk management program for the Fidelity® funds. The responsibilities of each standing committee, including their oversight responsibilities, are described further under "Standing Committees of the Trustees."
Interested Trustees*:
Correspondence intended for a Trustee who is an interested person may be sent to Fidelity Investments, 245 Summer Street, Boston, Massachusetts 02210.
Name, Year of Birth; Principal Occupations and Other Relevant Experience+
James C. Curvey (1935)
Year of Election or Appointment: 2018
Trustee
Chairman of the Board of Trustees
Mr. Curvey also serves as Trustee of other Fidelity® funds. Mr. Curvey is Vice Chairman (2007-present) and Director of FMR LLC (diversified financial services company). In addition, Mr. Curvey is an Overseer Emeritus for the Boston Symphony Orchestra, a Director of Artis-Naples, and a Trustee of Brewster Academy in Wolfeboro, New Hampshire. Previously, Mr. Curvey served as a Director of Fidelity Research & Analysis Co. (investment adviser firm, 2009-2018), Director of Fidelity Investments Money Management, Inc. (investment adviser firm, 2009-2014) and a Director of FMR and FMR Co., Inc. (investment adviser firms, 2007-2014).
* Determined to be an “Interested Trustee” by virtue of, among other things, his or her affiliation with the trust or various entities under common control with FMR.
+ The information includes the Trustee's principal occupation during the last five years and other information relating to the experience, attributes, and skills relevant to the Trustee's qualifications to serve as a Trustee, which led to the conclusion that the Trustee should serve as a Trustee for the fund.
Independent Trustees:
Correspondence intended for an Independent Trustee may be sent to Fidelity Investments, P.O. Box 55235, Boston, Massachusetts 02205-5235.
Name, Year of Birth; Principal Occupations and Other Relevant Experience+
Dennis J. Dirks (1948)
Year of Election or Appointment: 2018
Trustee
Mr. Dirks also serves as Trustee of other Fidelity® funds. Prior to his retirement in May 2003, Mr. Dirks was Chief Operating Officer and a member of the Board of The Depository Trust & Clearing Corporation (DTCC). He also served as President, Chief Operating Officer, and Board member of The Depository Trust Company (DTC) and President and Board member of the National Securities Clearing Corporation (NSCC). In addition, Mr. Dirks served as Chief Executive Officer and Board member of the Government Securities Clearing Corporation, Chief Executive Officer and Board member of the Mortgage-Backed Securities Clearing Corporation, as a Trustee and a member of the Finance Committee of Manhattan College (2005-2008), as a Trustee and a member of the Finance Committee of AHRC of Nassau County (2006-2008), as a member of the Independent Directors Council (IDC) Governing Council (2010-2015), and as a member of the Board of Directors for The Brookville Center for Children’s Services, Inc. (2009-2017). Mr. Dirks is a member of the Finance Committee (2016-present) and Board of Directors (2017-present) and is Treasurer (2018-present) of the Asolo Repertory Theatre.
Donald F. Donahue (1950)
Year of Election or Appointment: 2018
Trustee
Mr. Donahue also serves as a Trustee of other Fidelity® funds. Mr. Donahue is President and Chief Executive Officer of Miranda Partners, LLC (risk consulting for the financial services industry, 2012-present). Previously, Mr. Donahue served as a Member of the Advisory Board of certain Fidelity® funds (2015-2018) and Chief Executive Officer (2006-2012), Chief Operating Officer (2003-2006), and Managing Director, Customer Marketing and Development (1999-2003) of The Depository Trust & Clearing Corporation (financial markets infrastructure). Mr. Donahue serves as a Member (2007-present) and Co-Chairman (2016-present) of the Board of Directors of United Way of New York, Member of the Board of Directors of NYC Leadership Academy (2012-present) and Member of the Board of Advisors of Ripple Labs, Inc. (financial services, 2015-present). He also served as Chairman (2010-2012) and Member of the Board of Directors (2012-2013) of Omgeo, LLC (financial services), Treasurer of United Way of New York (2012-2016), and Member of the Board of Directors of XBRL US (financial services non-profit, 2009-2012) and the International Securities Services Association (2009-2012).
Alan J. Lacy (1953)
Year of Election or Appointment: 2018
Trustee
Mr. Lacy also serves as Trustee of other Fidelity® funds. Mr. Lacy serves as a Director of Bristol-Myers Squibb Company (global pharmaceuticals, 2008-present). He is a Trustee of the California Chapter of The Nature Conservancy (2015-present) and a Director of the Center for Advanced Study in the Behavioral Sciences at Stanford University (2015-present). In addition, Mr. Lacy served as Senior Adviser (2007-2014) of Oak Hill Capital Partners, L.P. (private equity) and also served as Chief Executive Officer (2005) and Vice Chairman (2005-2006) of Sears Holdings Corporation (retail) and Chief Executive Officer and Chairman of the Board of Sears, Roebuck and Co. (retail, 2000-2005). Previously, Mr. Lacy served as Chairman (2014-2017) and a member (2010-2017) of the Board of Directors of Dave & Buster’s Entertainment, Inc. (restaurant and entertainment complexes), as Chairman (2008-2011) and a member (2006-2015) of the Board of Trustees of the National Parks Conservation Association, and as a member of the Board of Directors for The Hillman Companies, Inc. (hardware wholesalers, 2010-2014), Earth Fare, Inc. (retail grocery, 2010-2014), and The Western Union Company (global money transfer, 2006-2011).
Ned C. Lautenbach (1944)
Year of Election or Appointment: 2018
Trustee
Chairman of the Independent Trustees
Mr. Lautenbach also serves as Trustee of other Fidelity® funds. Mr. Lautenbach currently serves as Chair (2018-present) and Member (2013-present) of the Board of Governors, State University System of Florida and is a member of the Council on Foreign Relations (1994-present). He is also a member and has most recently served as Chairman of the Board of Directors of Artis-Naples (2012-present). Previously, Mr. Lautenbach served as a member and then Lead Director of the Board of Directors of Eaton Corporation (diversified industrial, 1997-2016). He was also a Partner and Advisory Partner at Clayton, Dubilier & Rice, LLC (private equity investment, 1998-2010), as well as a Director of Sony Corporation (2006-2007). In addition, Mr. Lautenbach also had a 30-year career with IBM (technology company) during which time he served as Senior Vice President and a member of the Corporate Executive Committee (1968-1998).
Joseph Mauriello (1944)
Year of Election or Appointment: 2018
Trustee
Mr. Mauriello also serves as Trustee of other Fidelity® funds. Prior to his retirement in January 2006, Mr. Mauriello served in numerous senior management positions including Deputy Chairman and Chief Operating Officer (2004-2005), and Vice Chairman of Financial Services (2002-2004) of KPMG LLP US (professional services, 1965-2005). Mr. Mauriello currently serves as a member of the Independent Directors Council (IDC) Governing Council (2015-present). Previously, Mr. Mauriello served as a member of the Board of Directors of XL Group plc. (global insurance and re-insurance, 2006-2018).
Cornelia M. Small (1944)
Year of Election or Appointment: 2018
Trustee
Ms. Small also serves as Trustee of other Fidelity® funds. Ms. Small is a member of the Board of Directors (2009-present) and Chair of the Investment Committee (2010-present) of the Teagle Foundation. Ms. Small also serves on the Investment Committee of the Berkshire Taconic Community Foundation (2008-present). Previously, Ms. Small served as Chairperson (2002-2008) and a member of the Investment Committee and Chairperson (2008-2012) and a member of the Board of Trustees of Smith College. In addition, Ms. Small served as Chief Investment Officer, Director of Global Equity Investments, and a member of the Board of Directors of Scudder, Stevens & Clark and Scudder Kemper Investments.
Garnett A. Smith (1947)
Year of Election or Appointment: 2013
Trustee
Mr. Smith also serves as Trustee of other Fidelity® funds. Prior to Mr. Smith's retirement, he served as Chairman and Chief Executive Officer of Inbrand Corp. (manufacturer of personal absorbent products, 1990-1997). He also served as President (1986-1990) of Inbrand Corp. Prior to his employment with Inbrand Corp., he was employed by a retail fabric chain and North Carolina National Bank. In addition, Mr. Smith served as a Member of the Advisory Board of certain Fidelity® funds (2012-2013) and as a board member of the Jackson Hole Land Trust (2009-2012).
David M. Thomas (1949)
Year of Election or Appointment: 2018
Trustee
Mr. Thomas also serves as Trustee of other Fidelity® funds. Mr. Thomas serves as Non-Executive Chairman of the Board of Directors of Fortune Brands Home and Security (home and security products, 2011-present) and as a member of the Board of Directors (2004-present) and Presiding Director (2013-present) of Interpublic Group of Companies, Inc. (marketing communication). Previously, Mr. Thomas served as Executive Chairman (2005-2006) and Chairman and Chief Executive Officer (2000-2005) of IMS Health, Inc. (pharmaceutical and healthcare information solutions), a Director of Fortune Brands, Inc. (consumer products, 2000-2011), and a member of the Board of Trustees of the University of Florida (2013-2018).
Michael E. Wiley (1950)
Year of Election or Appointment: 2008
Trustee
Mr. Wiley also serves as Trustee or Member of the Advisory Board of other Fidelity® funds. Mr. Wiley serves as a Director of High Point Resources (exploration and production, 2005-present). Previously, Mr. Wiley served as a Director of Andeavor Corporation (independent oil refiner and marketer, 2005-2018), a Director of Andeavor Logistics LP (natural resources logistics, 2015-2018), a Director of Post Oak Bank (privately-held bank, 2004-2018), a Director of Asia Pacific Exploration Consolidated (international oil and gas exploration and production, 2008-2013), a member of the Board of Trustees of the University of Tulsa (2000-2006; 2007-2010), a Senior Energy Advisor of Katzenbach Partners, LLC (consulting, 2006-2007), an Advisory Director of Riverstone Holdings (private investment), a Director of Spinnaker Exploration Company (exploration and production, 2001-2005) and Chairman, President, and CEO of Baker Hughes, Inc. (oilfield services, 2000-2004).
+ The information includes the Trustee's principal occupation during the last five years and other information relating to the experience, attributes, and skills relevant to the Trustee's qualifications to serve as a Trustee, which led to the conclusion that the Trustee should serve as a Trustee for the fund.
Advisory Board Members and Officers:
Correspondence intended for a Member of the Advisory Board (if any) may be sent to Fidelity Investments, P.O. Box 55235, Boston, Massachusetts 02205-5235. Correspondence intended for an officer or Peter S. Lynch may be sent to Fidelity Investments, 245 Summer Street, Boston, Massachusetts 02210. Officers appear below in alphabetical order.
Name, Year of Birth; Principal Occupation
Vicki L. Fuller (1957)
Year of Election or Appointment: 2018
Member of the Advisory Board
Ms. Fuller also serves as Member of the Advisory Board of other Fidelity® funds. Ms. Fuller serves as a member of the Board of Directors, Audit Committee, and Nominating and Governance Committee of The Williams Companies, Inc. (natural gas infrastructure, 2018-present). Previously, Ms. Fuller served as the Chief Investment Officer of the New York State Common Retirement Fund (2012-2018) and held a variety of positions at AllianceBernstein L.P. (global asset management, 1985-2012), including Managing Director (2006-2012) and Senior Vice President and Senior Portfolio Manager (2001-2006).
Patricia L. Kampling (1959)
Year of Election or Appointment: 2020
Member of the Advisory Board
Ms. Kampling also serves as Member of the Advisory Board of other Fidelity® funds. Prior to her retirement, Ms. Kampling served as Chairman of the Board and Chief Executive Officer (2012-2019), President and Chief Operating Officer (2011-2012) and Executive Vice President and Chief Financial Officer (2010-2011) of Alliant Energy Corporation. Ms. Kampling currently serves as a member of the Board, Compensation Committee and Executive Committee and as Chair of the Audit Committee of Briggs & Stratton Corporation (manufacturing, 2011-present) and as a member of the Board, Audit, Finance and Risk Committee and Safety, Environmental, Technology and Operations Committee of American Water Works Company, Inc. (utilities company, 2019-present). In addition, Ms. Kampling currently serves as a member of the Board of the Nature Conservancy, Wisconsin Chapter (2019-present). Previously, Ms. Kampling served as a member of the Board of Interstate Power and Light Company (2012-2019) and Wisconsin Power and Light Company (2012-2019) (each a subsidiary of Alliant Energy Corporation) and as a member of the Board and Workforce Development Committee of the Business Roundtable (2018-2019).
Peter S. Lynch (1944)
Year of Election or Appointment: 2018
Member of the Advisory Board
Mr. Lynch also serves as Member of the Advisory Board of other Fidelity® funds. Mr. Lynch is Vice Chairman and a Director of Fidelity Management & Research Company LLC (investment adviser firm). In addition, Mr. Lynch serves as a Trustee of Boston College and as the Chairman of the Inner-City Scholarship Fund. Previously, Mr. Lynch served as Vice Chairman and a Director of FMR Co., Inc. (investment adviser firm) and on the Special Olympics International Board of Directors (1997-2006).
Susan Tomasky (1953)
Year of Election or Appointment: 2020
Member of the Advisory Board
Ms. Tomasky also serves as Member of the Advisory Board of other Fidelity® funds. Prior to her retirement, Ms. Tomasky served in various executive officer positions at American Electric Power Company, Inc. (1998-2011), including most recently as President of AEP Transmission (2007-2011). Ms. Tomasky currently serves as a member of the Board and Sustainability Committee and as Chair of the Audit Committee of Marathon Petroleum Corporation (2018-present) and as a member of the Board, Corporate Governance Committee and Organization and Compensation Committee and as Chair of the Audit Committee of Public Service Enterprise Group, Inc. (utilities company, 2012-present). In addition, Ms. Tomasky currently serves as a member of the Board of the Columbus Regional Airport Authority (2007-present), as a member of the Board of the Royal Shakespeare Company – America (2009-present), as a member of the Board of the Columbus Association for the Performing Arts (2011-present) and as a member of the Board of Kenyon College (2016-present). Previously, Ms. Tomasky served as a member of the Board (2011-2019) and as Lead Independent Director (2015-2018) of Andeavor Corporation (previously Tesoro Corporation) (independent oil refiner and marketer) and as a member of the Board of Summit Midstream Partners LP (energy, 2012-2018).
Elizabeth Paige Baumann (1968)
Year of Election or Appointment: 2017
Anti-Money Laundering (AML) Officer
Ms. Baumann also serves as AML Officer of other funds. She is Chief AML Officer (2012-present) and Senior Vice President (2014-present) of FMR LLC (diversified financial services company) and is an employee of Fidelity Investments. Previously, Ms. Baumann served as AML Officer of the funds (2012-2016), and Vice President (2007-2014) and Deputy Anti-Money Laundering Officer (2007-2012) of FMR LLC.
Craig S. Brown (1977)
Year of Election or Appointment: 2019
Assistant Treasurer
Mr. Brown also serves as Assistant Treasurer of other funds. Mr. Brown is an employee of Fidelity Investments (2013-present).
John J. Burke III (1964)
Year of Election or Appointment: 2018
Chief Financial Officer
Mr. Burke also serves as Chief Financial Officer of other funds. Mr. Burke serves as Head of Investment Operations for Fidelity Fund and Investment Operations (2018-present) and is an employee of Fidelity Investments (1998-present). Previously Mr. Burke served as head of Asset Management Investment Operations (2012-2018).
William C. Coffey (1969)
Year of Election or Appointment: 2019
Assistant Secretary
Mr. Coffey also serves as Assistant Secretary of other funds. He is Senior Vice President and Deputy General Counsel of FMR LLC (diversified financial services company, 2010-present), and is an employee of Fidelity Investments. Previously, Mr. Coffey served as Secretary and CLO of certain funds (2018-2019); CLO, Secretary, and Senior Vice President of Fidelity Management & Research Company and FMR Co., Inc. (investment adviser firms, 2018-2019); Secretary of Fidelity SelectCo, LLC and Fidelity Investments Money Management, Inc. (investment adviser firms, 2018-2019); CLO of Fidelity Management & Research (Hong Kong) Limited, FMR Investment Management (UK) Limited, and Fidelity Management & Research (Japan) Limited (investment adviser firms, 2018-2019); and Assistant Secretary of certain funds (2009-2018).
Timothy M. Cohen (1969)
Year of Election or Appointment: 2018
Vice President
Mr. Cohen also serves as Vice President of other funds. Mr. Cohen serves as Co-Head of Equity (2018-present), a Director of Fidelity Management & Research (Japan) Limited (investment adviser firm, 2016-present), and is an employee of Fidelity Investments. Previously, Mr. Cohen served as Executive Vice President of Fidelity SelectCo, LLC (2019), Head of Global Equity Research (2016-2018), Chief Investment Officer - Equity and a Director of Fidelity Management & Research (U.K.) Inc. (investment adviser firm, 2013-2015) and as a Director of Fidelity Management & Research (Hong Kong) Limited (investment adviser firm, 2017).
Jonathan Davis (1968)
Year of Election or Appointment: 2010
Assistant Treasurer
Mr. Davis also serves as Assistant Treasurer of other funds. Mr. Davis serves as Assistant Treasurer of FMR Capital, Inc. (2017-present) and is an employee of Fidelity Investments. Previously, Mr. Davis served as Vice President and Associate General Counsel of FMR LLC (diversified financial services company, 2003-2010).
Laura M. Del Prato (1964)
Year of Election or Appointment: 2018
Assistant Treasurer
Ms. Del Prato also serves as an officer of other funds. Ms. Del Prato is an employee of Fidelity Investments (2017-present). Prior to joining Fidelity Investments, Ms. Del Prato served as a Managing Director and Treasurer of the JPMorgan Mutual Funds (2014-2017). Prior to JPMorgan, Ms. Del Prato served as a partner at Cohen Fund Audit Services (accounting firm, 2012-2013) and KPMG LLP (accounting firm, 2004-2012).
Colm A. Hogan (1973)
Year of Election or Appointment: 2020
Assistant Treasurer
Mr. Hogan also serves as an officer of other funds. Mr. Hogan serves as Assistant Treasurer of FMR Capital, Inc. (2017-present) and is an employee of Fidelity Investments (2005-present). Previously, Mr. Hogan served as Deputy Treasurer of certain Fidelity® funds (2016-2020) and Assistant Treasurer of certain Fidelity® funds (2016-2018).
Pamela R. Holding (1964)
Year of Election or Appointment: 2018
Vice President
Ms. Holding also serves as Vice President of other funds. Ms. Holding serves as Co-Head of Equity (2018-present) and is an employee of Fidelity Investments (2013-present). Previously, Ms. Holding served as Executive Vice President of Fidelity SelectCo, LLC (2019) and as Chief Investment Officer of Fidelity Institutional Asset Management (2013-2018).
Cynthia Lo Bessette (1969)
Year of Election or Appointment: 2019
Secretary and Chief Legal Officer (CLO)
Ms. Lo Bessette also serves as an officer of other funds. Ms. Lo Bessette serves as CLO, Secretary, and Senior Vice President of Fidelity Management & Research Company LLC (investment adviser firm, 2019-present); and CLO of Fidelity Management & Research (Hong Kong) Limited, FMR Investment Management (UK) Limited, and Fidelity Management & Research (Japan) Limited (investment adviser firms, 2019-present). She is a Senior Vice President and Deputy General Counsel of FMR LLC (diversified financial services company, 2019-present), and is an employee of Fidelity Investments. Previously, Ms. Lo Bessette served as CLO, Secretary, and Senior Vice President of FMR Co., Inc. (investment adviser firm, 2019); Secretary of Fidelity SelectCo, LLC and Fidelity Investments Money Management, Inc. (investment adviser firms, 2019). Prior to joining Fidelity Investments, Ms. Lo Bessette was Executive Vice President, General Counsel (2016-2019) and Senior Vice President, Deputy General Counsel (2015-2016) of OppenheimerFunds (investment management company) and Deputy Chief Legal Officer (2013-2015) of Jennison Associates LLC (investment adviser firm).
Chris Maher (1972)
Year of Election or Appointment: 2020
Deputy Treasurer
Mr. Maher also serves as an officer of other funds. Mr. Maher serves as Assistant Treasurer of FMR Capital, Inc. (2017-present), and is an employee of Fidelity Investments (2008-present). Previously, Mr. Maher served as Assistant Treasurer of certain funds (2013-2020); Vice President of Asset Management Compliance (2013), Vice President of the Program Management Group of FMR (investment adviser firm, 2010-2013), and Vice President of Valuation Oversight (2008-2010).
Kenneth B. Robins (1969)
Year of Election or Appointment: 2018
Chief Compliance Officer
Mr. Robins also serves as an officer of other funds. Mr. Robins serves as Compliance Officer of Fidelity Management & Research Company LLC (investment adviser firm, 2016-present) and is an employee of Fidelity Investments (2004-present). Previously, Mr. Robins served as Compliance Officer of FMR Co., Inc. (investment adviser firm, 2016-2019), as Executive Vice President of Fidelity Investments Money Management, Inc. (investment adviser firm, 2013-2016) and served in other fund officer roles.
Stacie M. Smith (1974)
Year of Election or Appointment: 2018
President and Treasurer
Ms. Smith also serves as an officer of other funds. Ms. Smith serves as Assistant Treasurer of FMR Capital, Inc. (2017-present), is an employee of Fidelity Investments (2009-present), and has served in other fund officer roles. Prior to joining Fidelity Investments, Ms. Smith served as Senior Audit Manager of Ernst & Young LLP (accounting firm, 1996-2009). Previously, Ms. Smith served as Assistant Treasurer (2013-2019) and Deputy Treasurer (2013-2016) of certain Fidelity® funds.
Marc L. Spector (1972)
Year of Election or Appointment: 2017
Assistant Treasurer
Mr. Spector also serves as an officer of other funds. Mr. Spector serves as Assistant Treasurer of FMR Capital, Inc. (2017-present) and is an employee of Fidelity Investments (2016-present). Prior to joining Fidelity Investments, Mr. Spector served as Director at the Siegfried Group (accounting firm, 2013-2016), and prior to Siegfried Group as audit senior manager at Deloitte & Touche (accounting firm, 2005-2013).
Jim Wegmann (1979)
Year of Election or Appointment: 2019
Assistant Treasurer
Mr. Wegmann also serves as Assistant Treasurer of other funds. Mr. Wegmann is an employee of Fidelity Investments (2011-present).
Shareholder Expense Example
As a shareholder of the Fund, you incur two types of costs: (1) transaction costs and (2) ongoing costs, including management fees and other Fund expenses. This Example is intended to help you understand your ongoing costs (in dollars) of investing in the Fund and to compare these costs with the ongoing costs of investing in other mutual funds.
The Example is based on an investment of $1,000 invested at the beginning of the period and held for the entire period (July 1, 2019 to December 31, 2019).
Actual Expenses
The first line of the accompanying table for each class of the Fund provides information about actual account values and actual expenses. You may use the information in this line, together with the amount you invested, to estimate the expenses that you paid over the period. Simply divide your account value by $1,000.00 (for example, an $8,600 account value divided by $1,000.00 = 8.6), then multiply the result by the number in the first line for a class of the Fund under the heading entitled "Expenses Paid During Period" to estimate the expenses you paid on your account during this period. The estimate of expenses does not include any fees or other expenses of any variable annuity or variable life insurance product. If they were, the estimate of expenses you paid during the period would be higher, and your ending account value would be lower. In addition, the Fund, as a shareholder in the underlying Fidelity Central Funds, will indirectly bear its pro-rata share of the fees and expenses incurred by the underlying Fidelity Central Funds. These fees and expenses are not included in the Fund's annualized expense ratio used to calculate the expense estimate in the table below.
Hypothetical Example for Comparison Purposes
The second line of the accompanying table for each class of the Fund provides information about hypothetical account values and hypothetical expenses based on a Class' actual expense ratio and an assumed rate of return of 5% per year before expenses, which is not the Class' actual return. The hypothetical account values and expenses may not be used to estimate the actual ending account balance or expenses you paid for the period. You may use this information to compare the ongoing costs of investing in the Fund and other funds. To do so, compare this 5% hypothetical example with the 5% hypothetical examples that appear in the shareholder reports of the other funds. The estimate of expenses does not include any fees or other expenses of any variable annuity or variable life insurance product. If they were, the estimate of expenses you paid during the period would be higher, and your ending account value would be lower. In addition, the Fund, as a shareholder in the underlying Fidelity Central Funds, will indirectly bear its pro-rata share of the fees and expenses incurred by the underlying Fidelity Central Funds. These fees and expenses are not included in the Fund's annualized expense ratio used to calculate the expense estimate in the table below.
Please note that the expenses shown in the table are meant to highlight your ongoing costs only and do not reflect any transaction costs. Therefore, the second line of the table is useful in comparing ongoing costs only, and will not help you determine the relative total costs of owning different funds.
| | Annualized Expense Ratio-A | Beginning
Account Value
July 1, 2019 | Ending
Account Value
December 31, 2019 | Expenses Paid
During Period-B
July 1, 2019
to December 31, 2019 |
| Initial Class | .67% | | | |
| Actual | | $1,000.00 | $1,057.00 | $3.47 |
| Hypothetical-C | | $1,000.00 | $1,021.83 | $3.41 |
| Investor Class | .75% | | | |
| Actual | | $1,000.00 | $1,056.90 | $3.89 |
| Hypothetical-C | | $1,000.00 | $1,021.42 | $3.82 |
A Annualized expense ratio reflects expenses net of applicable fee waivers.
B Expenses are equal to each Class' annualized expense ratio, multiplied by the average account value over the period, multiplied by 184/365 (to reflect the one-half year period).
C 5% return per year before expenses
Distributions (Unaudited)
Initial Class and Investor Class designate 100% of the dividends distributed during the fiscal year as qualifying for the dividends–received deduction for corporate shareholders.
Board Approval of Investment Advisory Contracts
VIP Consumer Discretionary Portfolio
At its November 2019 meeting, the Board of Trustees, including the Independent Trustees (together, the Board), voted to approve an amended and restated management contract and amended and restated sub-advisory agreements (together, the Amended and Restated Contracts) for the fund, effective January 1, 2020, for a one month period through January 31, 2020, in connection with an upcoming consolidation of certain of Fidelity's advisory businesses.
The Board considered that, on or about January 1, 2020, each of FMR Co., Inc. (FMRC), Fidelity Investments Money Management, Inc. (FIMM), and SelectCo, LLC (SelectCo) will merge with and into Fidelity Management & Research Company (FMR) and that, after the merger, FMR will redomicile as a Delaware limited liability company. The Board also approved the termination of the sub-advisory agreement with FMRC upon the completion of the merger. The Board noted that the Amended and Restated Contracts would be updated to reflect the renamed adviser, Fidelity Management & Research Company LLC and its new form of organization and domicile. The Board also noted that the Amended and Restated Contracts will not change the investment processes, the level or nature of services provided, the resources and personnel allocated, trading and compliance operations, or any fees or expenses paid by the fund.
The Board concluded that the fund's Amended and Restated Contracts are fair and reasonable, and that the fund's Advisory Contracts should be approved through January 31, 2020.
In connection with its consideration of future renewals of the fund's Amended and Restated Contracts, the Board will consider: (i) the nature, extent and quality of services provided to the fund, including shareholder and administrative services and investment performance; (ii) the competitiveness of the management fee and total expenses for the fund; (iii) the costs of the services and profitability, including the revenues earned and the expenses incurred in conducting the business of developing, marketing, distributing, managing, administering, and servicing the fund and its shareholders, to the extent applicable; and (iv) whether there have been economies of scale in respect of the Fidelity funds, whether the Fidelity funds (including the fund) have appropriately benefited from any such economies of scale, and whether there is the potential for realization of any further economies.
Based on its evaluation of all of the conclusions noted above, and after considering all factors it believed relevant, the Board ultimately concluded that the fund's management fee structure is fair and reasonable, and that the continuation of the fund's Amended and Restated Contracts should be approved.

VCONIC-ANN-0220
1.817355.114
Fidelity® Variable Insurance Products:
Consumer Staples Portfolio
Annual Report
December 31, 2019
See the inside front cover for important information about access to your fund’s shareholder reports.
Beginning on January 1, 2021, as permitted by regulations adopted by the Securities and Exchange Commission, and if your insurance carrier elects to participate, you may not be receiving paper copies of the Fund’s shareholder reports from the insurance company that offers your variable insurance product unless you specifically request paper copies from your financial professional or the administrator of your variable insurance product. Instead, the reports will be made available on a website, and you will be notified by mail each time a report is posted and provided with a website link to access the report.
If you already elected to receive shareholder reports electronically, you will not be affected by this change and you need not take any action. You may elect to receive shareholder reports and other communications from the Fund electronically, by contacting your financial professional or the administrator of your variable insurance product. If you own a Fidelity-administered variable insurance product, please visit fidelity.com/mailpreferences to make your election or call 1-800-343-3548.
You may elect to receive all future reports in paper free of charge. If you wish to continue receiving paper copies of your shareholder reports, you may contact your financial professional or the administrator of your variable insurance product. If you own a Fidelity-administered variable insurance product, please visit fidelity.com/mailpreferences to make your election or call 1-800-343-3548. Your election to receive reports in paper will apply to all funds available under your variable insurance product.
Contents
To view a fund's proxy voting guidelines and proxy voting record for the 12-month period ended June 30, visit http://www.fidelity.com/proxyvotingresults or visit the Securities and Exchange Commission's (SEC) web site at http://www.sec.gov.
You may also call 1-877-208-0098 to request a free copy of the proxy voting guidelines.
Fidelity® Variable Insurance Products are separate account options which are purchased through a variable insurance contract.
Standard & Poor's, S&P and S&P 500 are registered service marks of The McGraw-Hill Companies, Inc. and have been licensed for use by Fidelity Distributors Corporation.
Other third-party marks appearing herein are the property of their respective owners.
All other marks appearing herein are registered or unregistered trademarks or service marks of FMR LLC or an affiliated company. © 2020 FMR LLC. All rights reserved.
This report and the financial statements contained herein are submitted for the general information of the shareholders of the Fund. This report is not authorized for distribution to prospective investors in the Fund unless preceded or accompanied by an effective prospectus.
A fund files its complete schedule of portfolio holdings with the SEC for the first and third quarters of each fiscal year on Form N-PORT. Forms N-PORT are available on the SEC’s web site at http://www.sec.gov. A fund's Forms N-PORT may be reviewed and copied at the SEC’s Public Reference Room in Washington, DC. Information regarding the operation of the SEC's Public Reference Room may be obtained by calling 1-800-SEC-0330.
For a complete list of a fund's portfolio holdings, view the most recent holdings listing, semiannual report, or annual report on Fidelity's web site at http://www.fidelity.com, http://www.institutional.fidelity.com, or http://www.401k.com, as applicable.
NOT FDIC INSURED •MAY LOSE VALUE •NO BANK GUARANTEE
Neither the Fund nor Fidelity Distributors Corporation is a bank.
Note to shareholders:
As part of a regular review of its organizational structure, Fidelity has decided to merge certain entities to streamline operations, increase efficiency, simplify reporting, and reduce legal, compliance, and accounting complexity and costs. In separate events, Fidelity has merged four of its investment advisers and two of its broker-dealers.
Effective on or about January 1, 2020, following any required regulatory notices and approvals:
Investment advisers Fidelity Investments Money Management, Inc., FMR Co., Inc., and Fidelity SelectCo, LLC, merged with and into Fidelity Management & Research Company. In connection with the merger transactions, the resulting, merged investment adviser was then redomiciled from Massachusetts to Delaware, changed its corporate structure from a corporation to a limited liability company, and changed its name to “Fidelity Management & Research Company LLC”.
Broker-dealer Fidelity Distributors Corporation merged with and into Fidelity Investments Institutional Services Company, Inc. (“FIISC”). FIISC was then redomiciled from Massachusetts to Delaware, changed its corporate structure from a corporation to a limited liability company, and changed its name to “Fidelity Distributors Company LLC”.
These mergers are not expected to affect fund shareholders or Fidelity clients, nor are they expected to result in any changes to the day-to-day management of Fidelity’s brokerage services, the Fidelity funds, their investment policies and practices, their portfolio management teams, or the funds’ expenses.
Performance: The Bottom Line
Average annual total return reflects the change in the value of an investment, assuming reinvestment of distributions from dividend income and capital gains (the profits earned upon the sale of securities that have grown in value, if any) and assuming a constant rate of performance each year. During periods of reimbursement by Fidelity, a fund’s total return will be greater than it would be had the reimbursement not occurred. Performance numbers are net of all underlying fund operating expenses, but do not include any insurance charges imposed by your insurance company’s separate account. If performance information included the effect of these additional charges, the total returns would have been lower. How a fund did yesterday is no guarantee of how it will do tomorrow.
Average Annual Total Returns
| For the periods ended December 31, 2019 | Past 1 year | Past 5 years | Past 10 years |
| Initial Class | 31.42% | 7.64% | 11.34% |
| Investor Class | 31.33% | 7.57% | 11.26% |
$10,000 Over 10 Years
Let's say hypothetically that $10,000 was invested in VIP Consumer Staples Portfolio - Initial Class on December 31, 2009.
The chart shows how the value of your investment would have changed, and also shows how the S&P 500® Index performed over the same period.
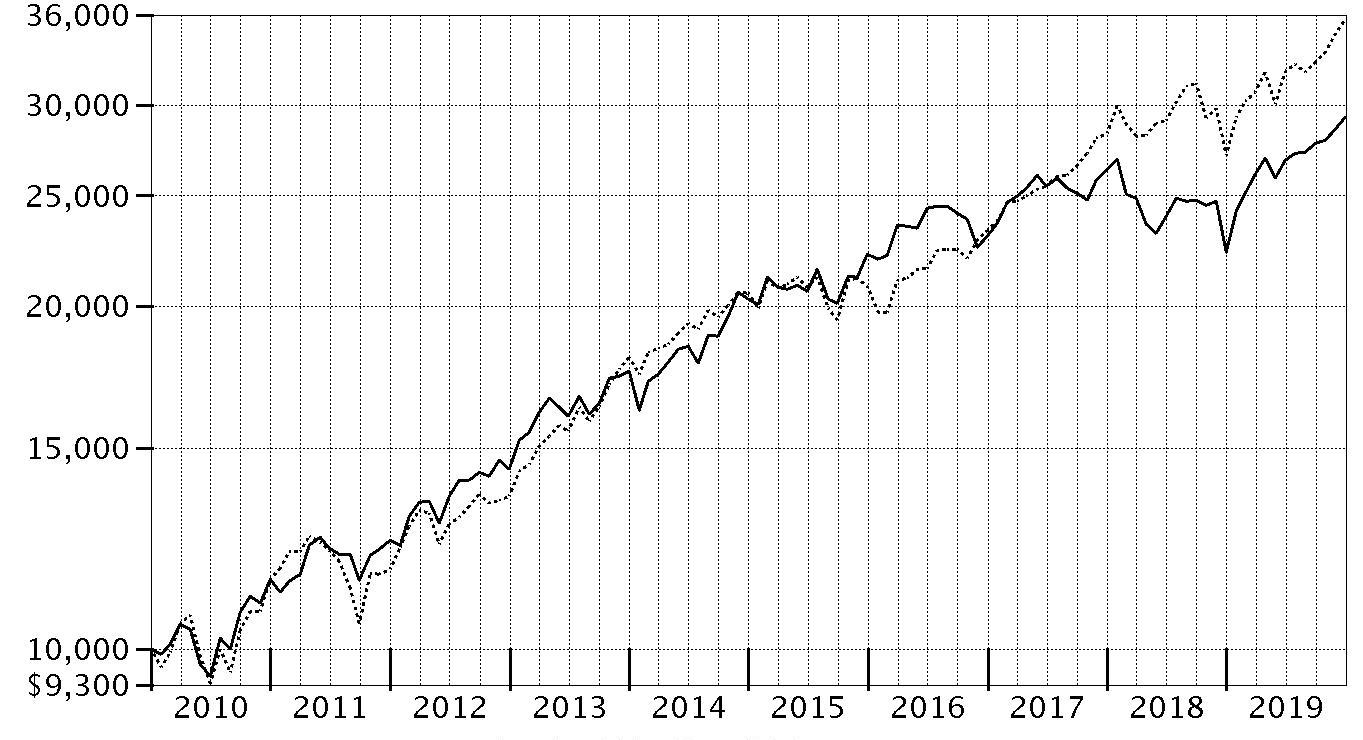
| Period Ending Values |
| $29,279 | VIP Consumer Staples Portfolio - Initial Class |
| $35,666 | S&P 500® Index |
Management's Discussion of Fund Performance
Market Recap: U.S. stocks continued to roll in 2019, with the S&P 500
® index soaring 31.49% and marking history as the longest and strongest bull market ever, despite persistent, nagging concerns about global economic growth and trade. After a rough end to 2018, equities sharply reversed course to begin the new year amid upbeat company earnings and signs the Federal Reserve may pause on rates. The uptrend continued until May, when the index sunk as trade negotiations between the U.S. and China broke down. The bull market roared back to record a series of highs in July, when the Fed cut interest rates for the first time since 2008. Volatility intensified in August, as the Treasury yield curve inverted, which some investors viewed as a sign the U.S. economy could be heading for recession. But the market proved resilient, hitting a new high on October 30, when the Fed lowered rates for the third time in 2019, and moving even higher through year-end. Gains were robust and broad-based, with information technology (+50%) leading the way with its best calendar-year result in a decade, amid strong growth trends. Communication services (+33%) and financials (+32%) also stood out. In contrast, energy (+12%) was by far the weakest group – struggling amid sluggish oil prices – while several strong gainers nonetheless fell short of the broader market: industrials and real estate (+29% each), consumer discretionary and consumer staples (+28% each), utilities (+26%), materials (+25%), and health care (+21%).
Comments from Co-Portfolio Managers Nicola Stafford and Ben Shuleva: For the fiscal year, the fund’s share classes gained roughly 31%, outpacing the 26.20% advance of the benchmark MSCI IMI Consumer Staples 25/50 Index and roughly in line with the broad-market S&P 500 index. Consumer staples, a traditionally defensive sector, lagged the broad market amid the largely “risk-on” investment backdrop. Versus the MSCI sector index, successful stock selection in personal products helped most, led by the fund’s overweighted positions in beauty products company Coty (+79%) and London-based Avon Products (+272%), a direct marketer of cosmetics in overseas markets. With Coty, investors were encouraged by the new CEO’s supply chain experience and his reassurance that he would remain focused on improving profitability. JAB Holding, a privately held investment group in Germany, increased its ownership stake in Coty, from 40% to 60%. Insiders also bought the stock, signaling confidence that the future value was worth more than the current price. Shares of Avon benefited from an all-stock buyout offer in May from Brazil-based Natura, a rival in Latin America. We sold down the fund’s stake in Coty and eliminated the position in Avon by period end. Security selection in household products also added value, including a large stake in Spectrum Brands Holdings (+57%), maker of a wide array of popular household brands such as IAMS
® pet food and Black+Decker
® appliances. On the flip side, an underweighting, on average, in consumer goods giant Procter & Gamble (+40%) hurt most, followed by a non-index stake in British-Dutch personal products firm Unilever (+9%), which we sold by December 31.
The views expressed above reflect those of the portfolio manager(s) only through the end of the period as stated on the cover of this report and do not necessarily represent the views of Fidelity or any other person in the Fidelity organization. Any such views are subject to change at any time based upon market or other conditions and Fidelity disclaims any responsibility to update such views. These views may not be relied on as investment advice and, because investment decisions for a Fidelity fund are based on numerous factors, may not be relied on as an indication of trading intent on behalf of any Fidelity fund.
Note to shareholders: On November 1, 2019, Nicola Stafford became sole Portfolio Manager of the fund, succeeding James McElligott. On December 31, 2019, Ben Shuleva assumed co-management responsibilities for the fund, joining Nicola Stafford. The two will manage the fund together until June 30, 2020, when Ben will assume sole management for the fund.
Investment Summary (Unaudited)
Top Ten Stocks as of December 31, 2019
| | % of fund's net assets |
| Procter & Gamble Co. | 10.5 |
| The Coca-Cola Co. | 9.2 |
| Philip Morris International, Inc. | 6.0 |
| Altria Group, Inc. | 5.8 |
| PepsiCo, Inc. | 5.5 |
| Mondelez International, Inc. | 4.9 |
| Walmart, Inc. | 4.7 |
| Spectrum Brands Holdings, Inc. | 4.3 |
| Monster Beverage Corp. | 3.9 |
| Kroger Co. | 2.6 |
| | 57.4 |
Top Industries (% of fund's net assets)
| As of December 31, 2019 |
| | Beverages | 24.9% |
| | Household Products | 19.5% |
| | Food Products | 18.7% |
| | Tobacco | 11.8% |
| | Food & Staples Retailing | 11.4% |
| | All Others* | 13.7% |

* Includes short-term investments and net other assets (liabilities).
Schedule of Investments December 31, 2019
Showing Percentage of Net Assets
| Common Stocks - 95.9% | | | |
| | | Shares | Value |
| Beverages - 24.9% | | | |
| Brewers - 1.9% | | | |
| Anheuser-Busch InBev SA NV | | 20,700 | $1,695,338 |
| Beijing Yanjing Brewery Co. Ltd. (A Shares) | | 882,479 | 826,310 |
| Boston Beer Co., Inc. Class A (a) | | 4,100 | 1,549,185 |
| Budweiser Brewing Co. APAC Ltd. (a)(b) | | 163,300 | 551,158 |
| | | | 4,621,991 |
| Distillers & Vintners - 2.5% | | | |
| Constellation Brands, Inc. Class A (sub. vtg.) | | 23,900 | 4,535,025 |
| Diageo PLC | | 29,500 | 1,243,033 |
| Kweichow Moutai Co. Ltd. (A Shares) | | 1,850 | 314,302 |
| | | | 6,092,360 |
| Soft Drinks - 20.5% | | | |
| Coca-Cola European Partners PLC | | 27,400 | 1,394,112 |
| Coca-Cola FEMSA S.A.B. de CV sponsored ADR | | 5,100 | 309,162 |
| Coca-Cola HBC AG | | 15,900 | 540,218 |
| Keurig Dr. Pepper, Inc. (c) | | 94,200 | 2,727,090 |
| Monster Beverage Corp. (a) | | 151,200 | 9,608,760 |
| PepsiCo, Inc. | | 99,606 | 13,613,152 |
| The Coca-Cola Co. | | 413,838 | 22,905,933 |
| | | | 51,098,427 |
|
| TOTAL BEVERAGES | | | 61,812,778 |
|
| Food & Staples Retailing - 11.4% | | | |
| Food Distributors - 2.0% | | | |
| Performance Food Group Co. (a) | | 45,300 | 2,332,044 |
| U.S. Foods Holding Corp. (a) | | 64,500 | 2,701,905 |
| | | | 5,033,949 |
| Food Retail - 2.6% | | | |
| Kroger Co. | | 225,452 | 6,535,853 |
| Hypermarkets & Super Centers - 6.8% | | | |
| Costco Wholesale Corp. | | 17,800 | 5,231,776 |
| Walmart, Inc. | | 97,504 | 11,587,375 |
| | | | 16,819,151 |
|
| TOTAL FOOD & STAPLES RETAILING | | | 28,388,953 |
|
| Food Products - 18.7% | | | |
| Agricultural Products - 1.1% | | | |
| Bunge Ltd. | | 19,300 | 1,110,715 |
| Darling International, Inc. (a) | | 56,300 | 1,580,904 |
| | | | 2,691,619 |
| Packaged Foods & Meats - 17.6% | | | |
| B&G Foods, Inc. Class A (c) | | 24,600 | 441,078 |
| Conagra Brands, Inc. | | 92,800 | 3,177,472 |
| Danone SA | | 47,456 | 3,941,029 |
| Freshpet, Inc. (a) | | 46,500 | 2,747,685 |
| General Mills, Inc. | | 55,800 | 2,988,648 |
| JBS SA | | 219,200 | 1,405,862 |
| Kellogg Co. | | 20,500 | 1,417,780 |
| Mondelez International, Inc. | | 220,000 | 12,117,600 |
| SunOpta, Inc. (a) | | 4,210 | 10,525 |
| The J.M. Smucker Co. | | 30,400 | 3,165,552 |
| The Kraft Heinz Co. | | 161,800 | 5,198,634 |
| TreeHouse Foods, Inc. (a) | | 46,400 | 2,250,400 |
| Tyson Foods, Inc. Class A | | 54,300 | 4,943,472 |
| | | | 43,805,737 |
|
| TOTAL FOOD PRODUCTS | | | 46,497,356 |
|
| Hotels, Restaurants & Leisure - 0.4% | | | |
| Restaurants - 0.4% | | | |
| Compass Group PLC | | 44,000 | 1,102,718 |
| Household Products - 19.5% | | | |
| Household Products - 19.5% | | | |
| C&S Paper Co. Ltd. (A Shares) | | 594,361 | 1,080,625 |
| Colgate-Palmolive Co. | | 48,490 | 3,338,052 |
| Energizer Holdings, Inc. (c) | | 63,600 | 3,193,992 |
| Essity AB Class B | | 113,700 | 3,663,611 |
| Procter & Gamble Co. | | 210,207 | 26,254,856 |
| Reckitt Benckiser Group PLC | | 5,164 | 419,464 |
| Spectrum Brands Holdings, Inc. | | 165,600 | 10,646,424 |
| | | | 48,597,024 |
| Internet & Direct Marketing Retail - 0.3% | | | |
| Internet & Direct Marketing Retail - 0.3% | | | |
| Ocado Group PLC (a) | | 50,500 | 855,553 |
| Multiline Retail - 1.2% | | | |
| General Merchandise Stores - 1.2% | | | |
| Dollar General Corp. | | 4,900 | 764,302 |
| Dollar Tree, Inc. (a) | | 23,300 | 2,191,365 |
| | | | 2,955,667 |
| Personal Products - 7.7% | | | |
| Personal Products - 7.7% | | | |
| BellRing Brands, Inc. Class A (a) | | 22,963 | 488,882 |
| Coty, Inc. Class A | | 403,964 | 4,544,595 |
| Edgewell Personal Care Co. (a) | | 138,400 | 4,284,864 |
| Estee Lauder Companies, Inc. Class A | | 3,700 | 764,198 |
| Ontex Group NV | | 176,285 | 3,707,604 |
| Unilever NV | | 93,086 | 5,342,273 |
| | | | 19,132,416 |
| Tobacco - 11.8% | | | |
| Tobacco - 11.8% | | | |
| Altria Group, Inc. | | 286,496 | 14,299,015 |
| Philip Morris International, Inc. | | 175,334 | 14,919,170 |
| | | | 29,218,185 |
| TOTAL COMMON STOCKS | | | |
| (Cost $187,839,038) | | | 238,560,650 |
|
| Convertible Preferred Stocks - 1.0% | | | |
| Internet & Direct Marketing Retail - 1.0% | | | |
| Internet & Direct Marketing Retail - 1.0% | | | |
| The Honest Co., Inc.: | | | |
| Series D (a)(d)(e) | | 32,783 | 1,500,150 |
| Series E (a)(d)(e) | | 51,008 | 999,757 |
| TOTAL CONVERTIBLE PREFERRED STOCKS | | | |
| (Cost $2,499,988) | | | 2,499,907 |
|
| Money Market Funds - 6.4% | | | |
| Fidelity Cash Central Fund 1.58% (f) | | 12,413,074 | 12,415,557 |
| Fidelity Securities Lending Cash Central Fund 1.58% (f)(g) | | 3,445,039 | 3,445,383 |
| TOTAL MONEY MARKET FUNDS | | | |
| (Cost $15,860,940) | | | 15,860,940 |
| TOTAL INVESTMENT IN SECURITIES - 103.3% | | | |
| (Cost $206,199,966) | | | 256,921,497 |
| NET OTHER ASSETS (LIABILITIES) - (3.3)% | | | (8,175,626) |
| NET ASSETS - 100% | | | $248,745,871 |
Legend
(a) Non-income producing
(b) Security exempt from registration under Rule 144A of the Securities Act of 1933. These securities may be resold in transactions exempt from registration, normally to qualified institutional buyers. At the end of the period, the value of these securities amounted to $551,158 or 0.2% of net assets.
(c) Security or a portion of the security is on loan at period end.
(d) Restricted securities (including private placements) - Investment in securities not registered under the Securities Act of 1933 (excluding 144A issues). At the end of the period, the value of restricted securities (excluding 144A issues) amounted to $2,499,907 or 1.0% of net assets.
(e) Level 3 security
(f) Affiliated fund that is generally available only to investment companies and other accounts managed by Fidelity Investments. The rate quoted is the annualized seven-day yield of the fund at period end. A complete unaudited listing of the fund's holdings as of its most recent quarter end is available upon request. In addition, each Fidelity Central Fund's financial statements, which are not covered by the Fund's Report of Independent Registered Public Accounting Firm, are available on the SEC's website or upon request.
(g) Investment made with cash collateral received from securities on loan.
Additional information on each restricted holding is as follows:
| Security | Acquisition Date | Acquisition Cost |
| The Honest Co., Inc. Series D | 8/3/15 | $1,499,986 |
| The Honest Co., Inc. Series E | 9/28/17 | $1,000,002 |
Affiliated Central Funds
Information regarding fiscal year to date income earned by the Fund from investments in Fidelity Central Funds is as follows:
| Fund | Income earned |
| Fidelity Cash Central Fund | $59,109 |
| Fidelity Securities Lending Cash Central Fund | 7,624 |
| Total | $66,733 |
Amounts in the income column in the above table include any capital gain distributions from underlying funds, which are presented in the corresponding line-item in the Statement of Operations, if applicable. Amount for Fidelity Securities Lending Cash Central Fund represents the income earned on investing cash collateral, less rebates paid to borrowers and any lending agent fees associated with the loan, plus any premium payments received for lending certain types of securities.
Investment Valuation
The following is a summary of the inputs used, as of December 31, 2019, involving the Fund's assets and liabilities carried at fair value. The inputs or methodology used for valuing securities may not be an indication of the risk associated with investing in those securities. For more information on valuation inputs, and their aggregation into the levels used below, please refer to the Investment Valuation section in the accompanying Notes to Financial Statements.
| | Valuation Inputs at Reporting Date: |
| Description | Total | Level 1 | Level 2 | Level 3 |
| Investments in Securities: | | | | |
| Common Stocks | $238,560,650 | $224,816,795 | $13,743,855 | $-- |
| Convertible Preferred Stocks | 2,499,907 | -- | -- | 2,499,907 |
| Money Market Funds | 15,860,940 | 15,860,940 | -- | -- |
| Total Investments in Securities: | $256,921,497 | $240,677,735 | $13,743,855 | $2,499,907 |
Other Information
Distribution of investments by country or territory of incorporation, as a percentage of Total Net Assets, is as follows (Unaudited):
| United States of America | 88.1% |
| Belgium | 2.2% |
| Netherlands | 2.2% |
| United Kingdom | 1.9% |
| France | 1.6% |
| Sweden | 1.5% |
| China | 1.0% |
| Others (Individually Less Than 1%) | 1.5% |
| | 100.0% |
See accompanying notes which are an integral part of the financial statements.
Financial Statements
Statement of Assets and Liabilities
| | | December 31, 2019 |
| Assets | | |
Investment in securities, at value (including securities loaned of $3,385,629) — See accompanying schedule:
Unaffiliated issuers (cost $190,339,026) | $241,060,557 | |
| Fidelity Central Funds (cost $15,860,940) | 15,860,940 | |
| Total Investment in Securities (cost $206,199,966) | | $256,921,497 |
| Foreign currency held at value (cost $133) | | 137 |
| Receivable for investments sold | | 1,434,297 |
| Receivable for fund shares sold | | 128,494 |
| Dividends receivable | | 646,651 |
| Distributions receivable from Fidelity Central Funds | | 20,715 |
| Prepaid expenses | | 1,947 |
| Other receivables | | 1,524 |
| Total assets | | 259,155,262 |
| Liabilities | | |
| Payable for investments purchased | $6,716,673 | |
| Payable for fund shares redeemed | 62,281 | |
| Accrued management fee | 109,089 | |
| Other affiliated payables | 36,211 | |
| Other payables and accrued expenses | 39,737 | |
| Collateral on securities loaned | 3,445,400 | |
| Total liabilities | | 10,409,391 |
| Net Assets | | $248,745,871 |
| Net Assets consist of: | | |
| Paid in capital | | $191,276,150 |
| Total accumulated earnings (loss) | | 57,469,721 |
| Net Assets | | $248,745,871 |
| Net Asset Value and Maximum Offering Price | | |
| Initial Class: | | |
| Net Asset Value, offering price and redemption price per share ($21,139,005 ÷ 1,126,815 shares) | | $18.76 |
| Investor Class: | | |
| Net Asset Value, offering price and redemption price per share ($227,606,866 ÷ 12,187,559 shares) | | $18.68 |
See accompanying notes which are an integral part of the financial statements.
Statement of Operations
| | | Year ended December 31, 2019 |
| Investment Income | | |
| Dividends | | $6,346,428 |
| Income from Fidelity Central Funds (including $7,624 from security lending) | | 66,733 |
| Total income | | 6,413,161 |
| Expenses | | |
| Management fee | $1,186,850 | |
| Transfer agent fees | 303,878 | |
| Accounting and security lending fees | 86,286 | |
| Custodian fees and expenses | 15,425 | |
| Independent trustees' fees and expenses | 1,194 | |
| Audit | 50,769 | |
| Legal | 2,038 | |
| Miscellaneous | 1,607 | |
| Total expenses before reductions | 1,648,047 | |
| Expense reductions | (7,261) | |
| Total expenses after reductions | | 1,640,786 |
| Net investment income (loss) | | 4,772,375 |
| Realized and Unrealized Gain (Loss) | | |
| Net realized gain (loss) on: | | |
| Investment securities: | | |
| Unaffiliated issuers | 7,831,396 | |
| Fidelity Central Funds | 113 | |
| Foreign currency transactions | 3,258 | |
| Total net realized gain (loss) | | 7,834,767 |
| Change in net unrealized appreciation (depreciation) on: | | |
| Investment securities: | | |
| Unaffiliated issuers | 45,500,157 | |
| Assets and liabilities in foreign currencies | (2,400) | |
| Total change in net unrealized appreciation (depreciation) | | 45,497,757 |
| Net gain (loss) | | 53,332,524 |
| Net increase (decrease) in net assets resulting from operations | | $58,104,899 |
See accompanying notes which are an integral part of the financial statements.
Statement of Changes in Net Assets
| | Year ended December 31, 2019 | Year ended December 31, 2018 |
| Increase (Decrease) in Net Assets | | |
| Operations | | |
| Net investment income (loss) | $4,772,375 | $5,671,592 |
| Net realized gain (loss) | 7,834,767 | 7,016,820 |
| Change in net unrealized appreciation (depreciation) | 45,497,757 | (51,944,128) |
| Net increase (decrease) in net assets resulting from operations | 58,104,899 | (39,255,716) |
| Distributions to shareholders | (11,874,207) | (22,676,118) |
| Share transactions - net increase (decrease) | 14,134,165 | (37,166,338) |
| Total increase (decrease) in net assets | 60,364,857 | (99,098,172) |
| Net Assets | | |
| Beginning of period | 188,381,014 | 287,479,186 |
| End of period | $248,745,871 | $188,381,014 |
See accompanying notes which are an integral part of the financial statements.
Financial Highlights
VIP Consumer Staples Portfolio Initial Class
| Years ended December 31, | 2019 | 2018 | 2017 | 2016 | 2015 |
| Selected Per–Share Data | | | | | |
| Net asset value, beginning of period | $15.10 | $19.72 | $17.48 | $18.25 | $18.08 |
| Income from Investment Operations | | | | | |
| Net investment income (loss)A | .39 | .44B | .32 | .33 | .28 |
| Net realized and unrealized gain (loss) | 4.22 | (3.36) | 2.24 | .30 | 1.34 |
| Total from investment operations | 4.61 | (2.92) | 2.56 | .63 | 1.62 |
| Distributions from net investment income | (.34) | (.50) | (.32) | (.33)C | (.27) |
| Distributions from net realized gain | (.61) | (1.19) | – | (1.07)C | (1.18) |
| Total distributions | (.95) | (1.70)D | (.32) | (1.40) | (1.45) |
| Redemption fees added to paid in capitalA | – | – | –E | –E | –E |
| Net asset value, end of period | $18.76 | $15.10 | $19.72 | $17.48 | $18.25 |
| Total ReturnF,G | 31.42% | (15.55)% | 14.66% | 3.72% | 9.46% |
| Ratios to Average Net AssetsH,I | | | | | |
| Expenses before reductions | .67% | .68% | .68% | .68% | .69% |
| Expenses net of fee waivers, if any | .67% | .68% | .68% | .68% | .69% |
| Expenses net of all reductions | .67% | .67% | .68% | .67% | .68% |
| Net investment income (loss) | 2.23% | 2.53%B | 1.69% | 1.79% | 1.61% |
| Supplemental Data | | | | | |
| Net assets, end of period (000 omitted) | $21,139 | $16,285 | $29,388 | $38,192 | $28,077 |
| Portfolio turnover rateJ | 46% | 38% | 41% | 45% | 38% |
A Calculated based on average shares outstanding during the period.
B Net investment income per share reflects a large, non-recurring dividend which amounted to $.14 per share. Excluding this non-recurring dividend, the ratio of net investment income (loss) to average net assets would have been 1.71%.
C The amounts shown reflect certain reclassifications related to book to tax differences that were made in the year shown.
D Total distributions of $1.70 per share is comprised of distributions from net investment income of $.501 and distributions from net realized gain of $1.194 per share.
E Amount represents less than $.005 per share.
F Total returns do not reflect charges attributable to your insurance company's separate account. Inclusion of these charges would reduce the total returns shown.
G Total returns would have been lower if certain expenses had not been reduced during the applicable periods shown.
H Fees and expenses of any underlying Fidelity Central Funds are not included in the Fund's expense ratio. The Fund indirectly bears its proportionate share of the expenses of any underlying Fidelity Central Funds.
I Expense ratios reflect operating expenses of the class. Expenses before reductions do not reflect amounts reimbursed by the investment adviser or reductions from brokerage service arrangements or reductions from other expense offset arrangements and do not represent the amount paid by the class during periods when reimbursements or reductions occur. Expenses net of fee waivers reflect expenses after reimbursement by the investment adviser but prior to reductions from brokerage service arrangements or other expense offset arrangements. Expenses net of all reductions represent the net expenses paid by the class.
J Amount does not include the portfolio activity of any underlying Fidelity Central Funds.
See accompanying notes which are an integral part of the financial statements.
VIP Consumer Staples Portfolio Investor Class
| Years ended December 31, | 2019 | 2018 | 2017 | 2016 | 2015 |
| Selected Per–Share Data | | | | | |
| Net asset value, beginning of period | $15.04 | $19.64 | $17.42 | $18.19 | $18.02 |
| Income from Investment Operations | | | | | |
| Net investment income (loss)A | .37 | .42B | .31 | .32 | .27 |
| Net realized and unrealized gain (loss) | 4.21 | (3.34) | 2.21 | .30 | 1.34 |
| Total from investment operations | 4.58 | (2.92) | 2.52 | .62 | 1.61 |
| Distributions from net investment income | (.33) | (.49) | (.30) | (.32)C | (.26) |
| Distributions from net realized gain | (.61) | (1.19) | – | (1.07)C | (1.18) |
| Total distributions | (.94) | (1.68) | (.30) | (1.39) | (1.44) |
| Redemption fees added to paid in capitalA | – | – | –D | –D | –D |
| Net asset value, end of period | $18.68 | $15.04 | $19.64 | $17.42 | $18.19 |
| Total ReturnE,F | 31.33% | (15.58)% | 14.52% | 3.67% | 9.41% |
| Ratios to Average Net AssetsG,H | | | | | |
| Expenses before reductions | .75% | .76% | .76% | .76% | .77% |
| Expenses net of fee waivers, if any | .75% | .76% | .76% | .76% | .76% |
| Expenses net of all reductions | .75% | .75% | .76% | .75% | .76% |
| Net investment income (loss) | 2.15% | 2.45%B | 1.61% | 1.71% | 1.53% |
| Supplemental Data | | | | | |
| Net assets, end of period (000 omitted) | $227,607 | $172,096 | $258,092 | $278,992 | $213,575 |
| Portfolio turnover rateI | 46% | 38% | 41% | 45% | 38% |
A Calculated based on average shares outstanding during the period.
B Net investment income per share reflects a large, non-recurring dividend which amounted to $.14 per share. Excluding this non-recurring dividend, the ratio of net investment income (loss) to average net assets would have been 1.63%.
C The amounts shown reflect certain reclassifications related to book to tax differences that were made in the year shown.
D Amount represents less than $.005 per share.
E Total returns do not reflect charges attributable to your insurance company's separate account. Inclusion of these charges would reduce the total returns shown.
F Total returns would have been lower if certain expenses had not been reduced during the applicable periods shown.
G Fees and expenses of any underlying Fidelity Central Funds are not included in the Fund's expense ratio. The Fund indirectly bears its proportionate share of the expenses of any underlying Fidelity Central Funds.
H Expense ratios reflect operating expenses of the class. Expenses before reductions do not reflect amounts reimbursed by the investment adviser or reductions from brokerage service arrangements or reductions from other expense offset arrangements and do not represent the amount paid by the class during periods when reimbursements or reductions occur. Expenses net of fee waivers reflect expenses after reimbursement by the investment adviser but prior to reductions from brokerage service arrangements or other expense offset arrangements. Expenses net of all reductions represent the net expenses paid by the class.
I Amount does not include the portfolio activity of any underlying Fidelity Central Funds.
See accompanying notes which are an integral part of the financial statements.
Notes to Financial Statements
For the period ended December 31, 2019
1. Organization.
VIP Consumer Staples Portfolio (the Fund) is a non-diversified fund of Variable Insurance Products Fund IV (the Trust) and is authorized to issue an unlimited number of shares. The Trust is registered under the Investment Company Act of 1940, as amended (the 1940 Act), as an open-end management investment company organized as a Massachusetts business trust. Shares of the Fund may only be purchased by insurance companies for the purpose of funding variable annuity or variable life insurance contracts. The Fund offers the following classes of shares: Initial Class shares and Investor Class shares. All classes have equal rights and voting privileges, except for matters affecting a single class.
2. Investments in Fidelity Central Funds.
The Fund invests in Fidelity Central Funds, which are open-end investment companies generally available only to other investment companies and accounts managed by the investment adviser and its affiliates. The Fund's Schedule of Investments lists each of the Fidelity Central Funds held as of period end, if any, as an investment of the Fund, but does not include the underlying holdings of each Fidelity Central Fund. As an Investing Fund, the Fund indirectly bears its proportionate share of the expenses of the underlying Fidelity Central Funds.
The Money Market Central Funds seek preservation of capital and current income and are managed by Fidelity Investments Money Management, Inc. (FIMM), an affiliate of the investment adviser. Annualized expenses of the Money Market Central Funds as of their most recent shareholder report date ranged from less than .005% to .01%.
A complete unaudited list of holdings for each Fidelity Central Fund is available upon request or at the Securities and Exchange Commission (the SEC) website at www.sec.gov. In addition, the financial statements of the Fidelity Central Funds, which are not covered by the Fund's Report of Independent Registered Public Accounting Firm, are available on the SEC website or upon request.
3. Significant Accounting Policies.
The Fund is an investment company and applies the accounting and reporting guidance of the Financial Accounting Standards Board (FASB) Accounting Standards Codification Topic 946 Financial Services – Investments Companies. The financial statements have been prepared in conformity with accounting principles generally accepted in the United States of America (GAAP), which require management to make certain estimates and assumptions at the date of the financial statements. Actual results could differ from those estimates. Subsequent events, if any, through the date that the financial statements were issued have been evaluated in the preparation of the financial statements. The following summarizes the significant accounting policies of the Fund:
Investment Valuation. Investments are valued as of 4:00 p.m. Eastern time on the last calendar day of the period. The Board of Trustees (the Board) has delegated the day to day responsibility for the valuation of the Fund's investments to the Fair Value Committee (the Committee) established by the Fund's investment adviser. In accordance with valuation policies and procedures approved by the Board, the Fund attempts to obtain prices from one or more third party pricing vendors or brokers to value its investments. When current market prices, quotations or currency exchange rates are not readily available or reliable, investments will be fair valued in good faith by the Committee, in accordance with procedures adopted by the Board. Factors used in determining fair value vary by investment type and may include market or investment specific events. The frequency with which these procedures are used cannot be predicted and they may be utilized to a significant extent. The Committee oversees the Fund's valuation policies and procedures and reports to the Board on the Committee's activities and fair value determinations. The Board monitors the appropriateness of the procedures used in valuing the Fund's investments and ratifies the fair value determinations of the Committee.
The Fund categorizes the inputs to valuation techniques used to value its investments into a disclosure hierarchy consisting of three levels as shown below:
- Level 1 – quoted prices in active markets for identical investments
- Level 2 – other significant observable inputs (including quoted prices for similar investments, interest rates, prepayment speeds, etc.)
- Level 3 – unobservable inputs (including the Fund's own assumptions based on the best information available)
Valuation techniques used to value the Fund's investments by major category are as follows:
Equity securities, including restricted securities, for which market quotations are readily available, are valued at the last reported sale price or official closing price as reported by a third party pricing vendor on the primary market or exchange on which they are traded and are categorized as Level 1 in the hierarchy. In the event there were no sales during the day or closing prices are not available, securities are valued at the last quoted bid price or may be valued using the last available price and are generally categorized as Level 2 in the hierarchy. For foreign equity securities, when market or security specific events arise, comparisons to the valuation of American Depositary Receipts (ADRs), futures contracts, Exchange-Traded Funds (ETFs) and certain indexes as well as quoted prices for similar securities may be used and would be categorized as Level 2 in the hierarchy. For equity securities, including restricted securities, where observable inputs are limited, assumptions about market activity and risk are used and these securities may be categorized as Level 3 in the hierarchy. Securities, including private placements or other restricted securities, for which observable inputs are not available are valued using alternate valuation approaches, including the market approach, income approach and cost approach and are categorized as Level 3 in the hierarchy. The market approach considers factors including the price of recent investments in the same or a similar security or financial metrics of comparable securities. The income approach considers factors including expected future cash flows, security specific risks and corresponding discount rates. The cost approach considers factors including the value of the security's underlying assets and liabilities.
Investments in open-end mutual funds, including the Fidelity Central Funds, are valued at their closing net asset value (NAV) each business day and are categorized as Level 1 in the hierarchy.
Changes in valuation techniques may result in transfers in or out of an assigned level within the disclosure hierarchy. The aggregate value of investments by input level as of December 31, 2019 is included at the end of the Fund's Schedule of Investments.
Foreign Currency. The Fund may use foreign currency contracts to facilitate transactions in foreign-denominated securities. Gains and losses from these transactions may arise from changes in the value of the foreign currency or if the counterparties do not perform under the contracts' terms.
Foreign-denominated assets, including investment securities, and liabilities are translated into U.S. dollars at the exchange rates at period end. Purchases and sales of investment securities, income and dividends received and expenses denominated in foreign currencies are translated into U.S. dollars at the exchange rate in effect on the transaction date.
The effects of exchange rate fluctuations on investments are included with the net realized and unrealized gain (loss) on investment securities. Other foreign currency transactions resulting in realized and unrealized gain (loss) are disclosed separately.
Investment Transactions and Income. For financial reporting purposes, the Fund's investment holdings and NAV include trades executed through the end of the last business day of the period. The NAV per share for processing shareholder transactions is calculated as of the close of business of the New York Stock Exchange (NYSE), normally 4:00 p.m. Eastern time and includes trades executed through the end of the prior business day. Gains and losses on securities sold are determined on the basis of identified cost and include proceeds received from litigation. Dividend income is recorded on the ex-dividend date, except for certain dividends from foreign securities where the ex-dividend date may have passed, which are recorded as soon as the Fund is informed of the ex-dividend date. Non-cash dividends included in dividend income, if any, are recorded at the fair market value of the securities received. Income and capital gain distributions from Fidelity Central Funds, if any, are recorded on the ex-dividend date. Certain distributions received by the Fund represent a return of capital or capital gain. The Fund determines the components of these distributions subsequent to the ex-dividend date, based upon receipt of tax filings or other correspondence relating to the underlying investment. These distributions are recorded as a reduction of cost of investments and/or as a realized gain. Investment income is recorded net of foreign taxes withheld where recovery of such taxes is uncertain.
Class Allocations and Expenses. Investment income, realized and unrealized capital gains and losses, common expenses of the Fund, and certain fund-level expense reductions, if any, are allocated daily on a pro-rata basis to each class based on the relative net assets of each class to the total net assets of the Fund. Each class differs with respect to transfer agent fees incurred. Certain expense reductions may also differ by class. For the reporting period, the allocated portion of income and expenses to each class as a percent of its average net assets may vary due to the timing of recording these transactions in relation to fluctuating net assets of the classes. Expenses directly attributable to a fund are charged to that fund. Expenses attributable to more than one fund are allocated among the respective funds on the basis of relative net assets or other appropriate methods. Expense estimates are accrued in the period to which they relate and adjustments are made when actual amounts are known.
Income Tax Information and Distributions to Shareholders. Each year, the Fund intends to qualify as a regulated investment company under Subchapter M of the Internal Revenue Code, including distributing substantially all of its taxable income and realized gains. As a result, no provision for U.S. Federal income taxes is required. As of December 31, 2019, the Fund did not have any unrecognized tax benefits in the financial statements; nor is the Fund aware of any tax positions for which it is reasonably possible that the total amounts of unrecognized tax benefits will significantly change in the next twelve months. The Fund files a U.S. federal tax return, in addition to state and local tax returns as required. The Fund's federal income tax returns are subject to examination by the Internal Revenue Service (IRS) for a period of three fiscal years after they are filed. State and local tax returns may be subject to examination for an additional fiscal year depending on the jurisdiction. Foreign taxes are provided for based on the Fund's understanding of the tax rules and rates that exist in the foreign markets in which it invests.
Distributions are declared and recorded on the ex-dividend date. Income and capital gain distributions are declared separately for each class. Income and capital gain distributions are determined in accordance with income tax regulations, which may differ from GAAP.
Capital accounts within the financial statements are adjusted for permanent book-tax differences. These adjustments have no impact on net assets or the results of operations. Capital accounts are not adjusted for temporary book-tax differences which will reverse in a subsequent period.
Book-tax differences are primarily due to foreign currency transactions and losses deferred due to wash sales and excise tax regulations.
As of period end, the cost and unrealized appreciation (depreciation) in securities, and derivatives if applicable, for federal income tax purposes were as follows:
| Gross unrealized appreciation | $61,086,174 |
| Gross unrealized depreciation | (11,925,922) |
| Net unrealized appreciation (depreciation) | $49,160,252 |
The tax-based components of distributable earnings as of period end were as follows:
| Undistributed ordinary income | $1,514,762 |
| Undistributed long-term capital gain | $6,797,416 |
| Net unrealized appreciation (depreciation) on securities and other investments | $49,157,544 |
The tax character of distributions paid was as follows:
| | December 31, 2019 | December 31, 2018 |
| Ordinary Income | $4,309,255 | $ 6,807,867 |
| Long-term Capital Gains | 7,564,952 | 15,868,251 |
| Total | $11,874,207 | $ 22,676,118 |
Restricted Securities (including Private Placements). The Fund may invest in securities that are subject to legal or contractual restrictions on resale. These securities generally may be resold in transactions exempt from registration or to the public if the securities are registered. Disposal of these securities may involve time-consuming negotiations and expense, and prompt sale at an acceptable price may be difficult. Information regarding restricted securities is included at the end of the Fund's Schedule of Investments.
4. Purchases and Sales of Investments.
Purchases and sales of securities, other than short-term securities, aggregated $99,338,315 and $99,261,231, respectively.
5. Fees and Other Transactions with Affiliates.
Management Fee. Fidelity SelectCo, LLC (the investment adviser) and its affiliates provide the Fund with investment management related services for which the Fund pays a monthly management fee. The management fee is the sum of an individual fund fee rate that is based on an annual rate of .30% of the Fund's average net assets and an annualized group fee rate that averaged .24% during the period. The group fee rate is based upon the average net assets of all the mutual funds advised by Fidelity Management & Research Company (FMR) and the investment adviser. The group fee rate decreases as assets under management increase and increases as assets under management decrease. For the reporting period, the total annual management fee rate was .54% of the Fund's average net assets.
Transfer Agent Fees. Fidelity Investments Institutional Operations Company, Inc. (FIIOC), an affiliate of the investment adviser, is the Fund's transfer, dividend disbursing, and shareholder servicing agent. FIIOC receives an asset-based fee with respect to each class. Each class pays a fee for transfer agent services, typesetting and printing and mailing of shareholder reports, excluding mailing of proxy statements, equal to an annual rate of class-level average net assets. The annual rate for Investor Class is .15% and the annual rate for all other classes is .07%. For the period, transfer agent fees for each class were as follows:
| Initial Class | $12,226 |
| Investor Class | 291,652 |
| | $303,878 |
Accounting and Security Lending Fees. Fidelity Service Company, Inc. (FSC), an affiliate of the investment adviser, maintains the Fund's accounting records. The accounting fee is based on the level of average net assets for each month. Prior to April 1, 2019, FSC had a separate agreement with the Fund for administration of the security lending program, based on the number and duration of lending transactions. For the period, the total fees paid for accounting and administration of securities lending were equivalent to the following annual rates:
| | % of Average Net Assets |
| VIP Consumer Staples Portfolio | .04 |
Brokerage Commissions. A portion of portfolio transactions were placed with brokerage firms which are affiliates of the investment adviser. Brokerage commissions are included in net realized gain (loss) and change in net unrealized appreciation (depreciation) in the Statement of Operations. The commissions paid to these affiliated firms were as follows:
| | Amount |
| VIP Consumer Staples Portfolio | $3,679 |
Interfund Trades. The Fund may purchase from or sell securities to other Fidelity Funds under procedures adopted by the Board. The procedures have been designed to ensure these interfund trades are executed in accordance with Rule 17a-7 of the 1940 Act. Interfund trades are included within the respective purchases and sales amounts shown in the Purchases and Sales of Investments note.
6. Committed Line of Credit.
The Fund participates with other funds managed by the investment adviser or an affiliate in a $4.25 billion credit facility (the "line of credit") to be utilized for temporary or emergency purposes to fund shareholder redemptions or for other short-term liquidity purposes. The Fund has agreed to pay commitment fees on its pro-rata portion of the line of credit, which amounted to $564 and is reflected in Miscellaneous expenses on the Statement of Operations. During the period, the Fund did not borrow on this line of credit.
7. Security Lending.
The Fund lends portfolio securities from time to time in order to earn additional income. For equity securities, lending agents are used, including National Financial Services (NFS), an affiliate of the Fund. Pursuant to a securities lending agreement, NFS will receive a fee, which is capped at 9.9% of daily lending revenue, for its services as lending agent. The Fund may lend securities to certain qualified borrowers. On the settlement date of the loan, the Fund receives collateral (in the form of U.S. Treasury obligations, letters of credit and/or cash) against the loaned securities and maintains collateral in an amount not less than 100% of the market value of the loaned securities during the period of the loan. The market value of the loaned securities is determined at the close of business of the Fund and any additional required collateral is delivered to the Fund on the next business day. The Fund or borrower may terminate the loan at any time, and if the borrower defaults on its obligation to return the securities loaned because of insolvency or other reasons, the Fund may apply collateral received from the borrower against the obligation. The Fund may experience delays and costs in recovering the securities loaned. Any cash collateral received is invested in the Fidelity Securities Lending Cash Central Fund. The value of loaned securities and cash collateral at period end are disclosed on the Fund's Statement of Assets and Liabilities. Total fees paid by the Fund to NFS amounted to $457. Security lending income represents the income earned on investing cash collateral, less rebates paid to borrowers and any lending agent fees associated with the loan, plus any premium payments received for lending certain types of securities. Security lending income is presented in the Statement of Operations as a component of income from Fidelity Central Funds.
8. Expense Reductions.
Commissions paid to certain brokers with whom the investment adviser, or its affiliates, places trades on behalf of the Fund include an amount in addition to trade execution, which may be rebated back to the Fund to offset certain expenses. This amount totaled $5,679 for the period.
In addition, during the period the investment adviser reimbursed and/or waived a portion of fund-level operating expenses in the amount of $1,582.
9. Distributions to Shareholders.
Distributions to shareholders of each class were as follows:
| | Year ended
December 31, 2019 | Year ended
December 31, 2018 |
| Distributions to shareholders | | |
| Initial Class | $1,021,137 | $2,244,849 |
| Investor Class | 10,853,070 | 20,431,269 |
| Total | $11,874,207 | $22,676,118 |
10. Share Transactions.
Transactions for each class of shares were as follows:
| | Shares | Shares | Dollars | Dollars |
| | Year ended December 31, 2019 | Year ended December 31, 2018 | Year ended December 31, 2019 | Year ended December 31, 2018 |
| Initial Class | | | | |
| Shares sold | 193,385 | 72,349 | $3,420,177 | $1,253,500 |
| Reinvestment of distributions | 61,157 | 132,625 | 1,021,137 | 2,244,849 |
| Shares redeemed | (205,927) | (617,276) | (3,563,265) | (10,591,791) |
| Net increase (decrease) | 48,615 | (412,302) | $878,049 | $(7,093,442) |
| Investor Class | | | | |
| Shares sold | 1,604,753 | 494,836 | $28,144,340 | $8,484,254 |
| Reinvestment of distributions | 653,541 | 1,216,231 | 10,853,070 | 20,431,269 |
| Shares redeemed | (1,513,064) | (3,410,323) | (25,741,294) | (58,988,419) |
| Net increase (decrease) | 745,230 | (1,699,256) | $13,256,116 | $(30,072,896) |
11. Other.
The Fund's organizational documents provide former and current trustees and officers with a limited indemnification against liabilities arising in connection with the performance of their duties to the Fund. In the normal course of business, the Fund may also enter into contracts that provide general indemnifications. The Fund's maximum exposure under these arrangements is unknown as this would be dependent on future claims that may be made against the Fund. The risk of material loss from such claims is considered remote.
At the end of the period, the investment adviser or its affiliates were the owners of record of 100% of the total outstanding shares of the Fund.
Effective January 1, 2020, following any required regulatory notices and approvals:
Investment advisers Fidelity Investments Money Management, Inc., FMR Co., Inc., and Fidelity SelectCo, LLC, merged with and into Fidelity Management & Research Company. In connection with the merger transactions, the resulting, merged investment adviser was then redomiciled from Massachusetts to Delaware, changed its corporate structure from a corporation to a limited liability company, and changed its name to "Fidelity Management & Research Company LLC".
Fidelity Investments Institutional Operations Company, Inc. (FIIOC) converted from a Massachusetts corporation to a Massachusetts LLC, and changed its name to "Fidelity Investments Institutional Operations Company LLC".
Report of Independent Registered Public Accounting Firm
To the Board of Trustees of Variable Insurance Products Fund IV and Shareholders of VIP Consumer Staples Portfolio:
Opinion on the Financial Statements
We have audited the accompanying statement of assets and liabilities, including the schedule of investments, of VIP Consumer Staples Portfolio (one of the funds constituting Variable Insurance Products Fund IV, referred to hereafter as the “Fund”) as of December 31, 2019, the related statement of operations for the year ended December 31, 2019, the statement of changes in net assets for each of the two years in the period ended December 31, 2019, including the related notes, and the financial highlights for each of the five years in the period ended December 31, 2019 (collectively referred to as the “financial statements”). In our opinion, the financial statements present fairly, in all material respects, the financial position of the Fund as of December 31, 2019, the results of its operations for the year then ended, the changes in its net assets for each of the two years in the period ended December 31, 2019 and the financial highlights for each of the five years in the period ended December 31, 2019 in conformity with accounting principles generally accepted in the United States of America.
Basis for Opinion
These financial statements are the responsibility of the Fund’s management. Our responsibility is to express an opinion on the Fund’s financial statements based on our audits. We are a public accounting firm registered with the Public Company Accounting Oversight Board (United States) (PCAOB) and are required to be independent with respect to the Fund in accordance with the U.S. federal securities laws and the applicable rules and regulations of the Securities and Exchange Commission and the PCAOB.
We conducted our audits of these financial statements in accordance with the standards of the PCAOB. Those standards require that we plan and perform the audit to obtain reasonable assurance about whether the financial statements are free of material misstatement, whether due to error or fraud.
Our audits included performing procedures to assess the risks of material misstatement of the financial statements, whether due to error or fraud, and performing procedures that respond to those risks. Such procedures included examining, on a test basis, evidence regarding the amounts and disclosures in the financial statements. Our audits also included evaluating the accounting principles used and significant estimates made by management, as well as evaluating the overall presentation of the financial statements. Our procedures included confirmation of securities owned as of December 31, 2019 by correspondence with the custodian, issuers of privately offered securities and brokers; when replies were not received from brokers, we performed other auditing procedures. We believe that our audits provide a reasonable basis for our opinion.
PricewaterhouseCoopers LLP
Boston, Massachusetts
February 12, 2020
We have served as the auditor of one or more investment companies in the Fidelity group of funds since 1932.
Trustees and Officers
The Trustees, Members of the Advisory Board (if any), and officers of the trust and fund, as applicable, are listed below. The Board of Trustees governs the fund and is responsible for protecting the interests of shareholders. The Trustees are experienced executives who meet periodically throughout the year to oversee the fund's activities, review contractual arrangements with companies that provide services to the fund, oversee management of the risks associated with such activities and contractual arrangements, and review the fund's performance. Except for Michael E. Wiley, each of the Trustees oversees 302 funds. Mr. Wiley oversees 199 funds.
The Trustees hold office without limit in time except that (a) any Trustee may resign; (b) any Trustee may be removed by written instrument, signed by at least two-thirds of the number of Trustees prior to such removal; (c) any Trustee who requests to be retired or who has become incapacitated by illness or injury may be retired by written instrument signed by a majority of the other Trustees; and (d) any Trustee may be removed at any special meeting of shareholders by a two-thirds vote of the outstanding voting securities of the trust. Each Trustee who is not an interested person (as defined in the Investment Company Act of 1940 (1940 Act)) of the trust and the fund is referred to herein as an Independent Trustee. Each Independent Trustee shall retire not later than the last day of the calendar year in which his or her 75th birthday occurs. The Independent Trustees may waive this mandatory retirement age policy with respect to individual Trustees. Officers and Advisory Board Members hold office without limit in time, except that any officer or Advisory Board Member may resign or may be removed by a vote of a majority of the Trustees at any regular meeting or any special meeting of the Trustees. Except as indicated, each individual has held the office shown or other offices in the same company for the past five years.
The fund’s Statement of Additional Information (SAI) includes more information about the Trustees. To request a free copy, call Fidelity at 1-877-208-0098.
Experience, Skills, Attributes, and Qualifications of the Trustees. The Governance and Nominating Committee has adopted a statement of policy that describes the experience, qualifications, attributes, and skills that are necessary and desirable for potential Independent Trustee candidates (Statement of Policy). The Board believes that each Trustee satisfied at the time he or she was initially elected or appointed a Trustee, and continues to satisfy, the standards contemplated by the Statement of Policy. The Governance and Nominating Committee also engages professional search firms to help identify potential Independent Trustee candidates who have the experience, qualifications, attributes, and skills consistent with the Statement of Policy. From time to time, additional criteria based on the composition and skills of the current Independent Trustees, as well as experience or skills that may be appropriate in light of future changes to board composition, business conditions, and regulatory or other developments, have also been considered by the professional search firms and the Governance and Nominating Committee. In addition, the Board takes into account the Trustees' commitment and participation in Board and committee meetings, as well as their leadership of standing and ad hoc committees throughout their tenure.
In determining that a particular Trustee was and continues to be qualified to serve as a Trustee, the Board has considered a variety of criteria, none of which, in isolation, was controlling. The Board believes that, collectively, the Trustees have balanced and diverse experience, qualifications, attributes, and skills, which allow the Board to operate effectively in governing the fund and protecting the interests of shareholders. Information about the specific experience, skills, attributes, and qualifications of each Trustee, which in each case led to the Board's conclusion that the Trustee should serve (or continue to serve) as a trustee of the fund, is provided below.
Board Structure and Oversight Function. James C. Curvey is an interested person and currently serves as Chairman. The Trustees have determined that an interested Chairman is appropriate and benefits shareholders because an interested Chairman has a personal and professional stake in the quality and continuity of services provided to the fund. Independent Trustees exercise their informed business judgment to appoint an individual of their choosing to serve as Chairman, regardless of whether the Trustee happens to be independent or a member of management. The Independent Trustees have determined that they can act independently and effectively without having an Independent Trustee serve as Chairman and that a key structural component for assuring that they are in a position to do so is for the Independent Trustees to constitute a substantial majority for the Board. The Independent Trustees also regularly meet in executive session. Ned C. Lautenbach serves as Chairman of the Independent Trustees and as such (i) acts as a liaison between the Independent Trustees and management with respect to matters important to the Independent Trustees and (ii) with management prepares agendas for Board meetings.
Fidelity® funds are overseen by different Boards of Trustees. The fund's Board oversees Fidelity's high income and certain equity funds, and other Boards oversee Fidelity's investment-grade bond, money market, asset allocation, and other equity funds. The asset allocation funds may invest in Fidelity® funds overseen by the fund's Board. The use of separate Boards, each with its own committee structure, allows the Trustees of each group of Fidelity® funds to focus on the unique issues of the funds they oversee, including common research, investment, and operational issues. On occasion, the separate Boards establish joint committees to address issues of overlapping consequences for the Fidelity® funds overseen by each Board.
The Trustees operate using a system of committees to facilitate the timely and efficient consideration of all matters of importance to the Trustees, the fund, and fund shareholders and to facilitate compliance with legal and regulatory requirements and oversight of the fund's activities and associated risks. The Board, acting through its committees, has charged FMR and its affiliates with (i) identifying events or circumstances the occurrence of which could have demonstrably adverse effects on the fund's business and/or reputation; (ii) implementing processes and controls to lessen the possibility that such events or circumstances occur or to mitigate the effects of such events or circumstances if they do occur; and (iii) creating and maintaining a system designed to evaluate continuously business and market conditions in order to facilitate the identification and implementation processes described in (i) and (ii) above. Because the day-to-day operations and activities of the fund are carried out by or through FMR, its affiliates, and other service providers, the fund's exposure to risks is mitigated but not eliminated by the processes overseen by the Trustees. While each of the Board's committees has responsibility for overseeing different aspects of the fund's activities, oversight is exercised primarily through the Operations, Audit, and Compliance Committees. Appropriate personnel, including but not limited to the fund's Chief Compliance Officer (CCO), FMR's internal auditor, the independent accountants, the fund's Treasurer and portfolio management personnel, make periodic reports to the Board's committees, as appropriate, including an annual review of Fidelity's risk management program for the Fidelity® funds. The responsibilities of each standing committee, including their oversight responsibilities, are described further under "Standing Committees of the Trustees."
Interested Trustees*:
Correspondence intended for a Trustee who is an interested person may be sent to Fidelity Investments, 245 Summer Street, Boston, Massachusetts 02210.
Name, Year of Birth; Principal Occupations and Other Relevant Experience+
James C. Curvey (1935)
Year of Election or Appointment: 2018
Trustee
Chairman of the Board of Trustees
Mr. Curvey also serves as Trustee of other Fidelity® funds. Mr. Curvey is Vice Chairman (2007-present) and Director of FMR LLC (diversified financial services company). In addition, Mr. Curvey is an Overseer Emeritus for the Boston Symphony Orchestra, a Director of Artis-Naples, and a Trustee of Brewster Academy in Wolfeboro, New Hampshire. Previously, Mr. Curvey served as a Director of Fidelity Research & Analysis Co. (investment adviser firm, 2009-2018), Director of Fidelity Investments Money Management, Inc. (investment adviser firm, 2009-2014) and a Director of FMR and FMR Co., Inc. (investment adviser firms, 2007-2014).
* Determined to be an “Interested Trustee” by virtue of, among other things, his or her affiliation with the trust or various entities under common control with FMR.
+ The information includes the Trustee's principal occupation during the last five years and other information relating to the experience, attributes, and skills relevant to the Trustee's qualifications to serve as a Trustee, which led to the conclusion that the Trustee should serve as a Trustee for the fund.
Independent Trustees:
Correspondence intended for an Independent Trustee may be sent to Fidelity Investments, P.O. Box 55235, Boston, Massachusetts 02205-5235.
Name, Year of Birth; Principal Occupations and Other Relevant Experience+
Dennis J. Dirks (1948)
Year of Election or Appointment: 2018
Trustee
Mr. Dirks also serves as Trustee of other Fidelity® funds. Prior to his retirement in May 2003, Mr. Dirks was Chief Operating Officer and a member of the Board of The Depository Trust & Clearing Corporation (DTCC). He also served as President, Chief Operating Officer, and Board member of The Depository Trust Company (DTC) and President and Board member of the National Securities Clearing Corporation (NSCC). In addition, Mr. Dirks served as Chief Executive Officer and Board member of the Government Securities Clearing Corporation, Chief Executive Officer and Board member of the Mortgage-Backed Securities Clearing Corporation, as a Trustee and a member of the Finance Committee of Manhattan College (2005-2008), as a Trustee and a member of the Finance Committee of AHRC of Nassau County (2006-2008), as a member of the Independent Directors Council (IDC) Governing Council (2010-2015), and as a member of the Board of Directors for The Brookville Center for Children’s Services, Inc. (2009-2017). Mr. Dirks is a member of the Finance Committee (2016-present) and Board of Directors (2017-present) and is Treasurer (2018-present) of the Asolo Repertory Theatre.
Donald F. Donahue (1950)
Year of Election or Appointment: 2018
Trustee
Mr. Donahue also serves as a Trustee of other Fidelity® funds. Mr. Donahue is President and Chief Executive Officer of Miranda Partners, LLC (risk consulting for the financial services industry, 2012-present). Previously, Mr. Donahue served as a Member of the Advisory Board of certain Fidelity® funds (2015-2018) and Chief Executive Officer (2006-2012), Chief Operating Officer (2003-2006), and Managing Director, Customer Marketing and Development (1999-2003) of The Depository Trust & Clearing Corporation (financial markets infrastructure). Mr. Donahue serves as a Member (2007-present) and Co-Chairman (2016-present) of the Board of Directors of United Way of New York, Member of the Board of Directors of NYC Leadership Academy (2012-present) and Member of the Board of Advisors of Ripple Labs, Inc. (financial services, 2015-present). He also served as Chairman (2010-2012) and Member of the Board of Directors (2012-2013) of Omgeo, LLC (financial services), Treasurer of United Way of New York (2012-2016), and Member of the Board of Directors of XBRL US (financial services non-profit, 2009-2012) and the International Securities Services Association (2009-2012).
Alan J. Lacy (1953)
Year of Election or Appointment: 2018
Trustee
Mr. Lacy also serves as Trustee of other Fidelity® funds. Mr. Lacy serves as a Director of Bristol-Myers Squibb Company (global pharmaceuticals, 2008-present). He is a Trustee of the California Chapter of The Nature Conservancy (2015-present) and a Director of the Center for Advanced Study in the Behavioral Sciences at Stanford University (2015-present). In addition, Mr. Lacy served as Senior Adviser (2007-2014) of Oak Hill Capital Partners, L.P. (private equity) and also served as Chief Executive Officer (2005) and Vice Chairman (2005-2006) of Sears Holdings Corporation (retail) and Chief Executive Officer and Chairman of the Board of Sears, Roebuck and Co. (retail, 2000-2005). Previously, Mr. Lacy served as Chairman (2014-2017) and a member (2010-2017) of the Board of Directors of Dave & Buster’s Entertainment, Inc. (restaurant and entertainment complexes), as Chairman (2008-2011) and a member (2006-2015) of the Board of Trustees of the National Parks Conservation Association, and as a member of the Board of Directors for The Hillman Companies, Inc. (hardware wholesalers, 2010-2014), Earth Fare, Inc. (retail grocery, 2010-2014), and The Western Union Company (global money transfer, 2006-2011).
Ned C. Lautenbach (1944)
Year of Election or Appointment: 2018
Trustee
Chairman of the Independent Trustees
Mr. Lautenbach also serves as Trustee of other Fidelity® funds. Mr. Lautenbach currently serves as Chair (2018-present) and Member (2013-present) of the Board of Governors, State University System of Florida and is a member of the Council on Foreign Relations (1994-present). He is also a member and has most recently served as Chairman of the Board of Directors of Artis-Naples (2012-present). Previously, Mr. Lautenbach served as a member and then Lead Director of the Board of Directors of Eaton Corporation (diversified industrial, 1997-2016). He was also a Partner and Advisory Partner at Clayton, Dubilier & Rice, LLC (private equity investment, 1998-2010), as well as a Director of Sony Corporation (2006-2007). In addition, Mr. Lautenbach also had a 30-year career with IBM (technology company) during which time he served as Senior Vice President and a member of the Corporate Executive Committee (1968-1998).
Joseph Mauriello (1944)
Year of Election or Appointment: 2018
Trustee
Mr. Mauriello also serves as Trustee of other Fidelity® funds. Prior to his retirement in January 2006, Mr. Mauriello served in numerous senior management positions including Deputy Chairman and Chief Operating Officer (2004-2005), and Vice Chairman of Financial Services (2002-2004) of KPMG LLP US (professional services, 1965-2005). Mr. Mauriello currently serves as a member of the Independent Directors Council (IDC) Governing Council (2015-present). Previously, Mr. Mauriello served as a member of the Board of Directors of XL Group plc. (global insurance and re-insurance, 2006-2018).
Cornelia M. Small (1944)
Year of Election or Appointment: 2018
Trustee
Ms. Small also serves as Trustee of other Fidelity® funds. Ms. Small is a member of the Board of Directors (2009-present) and Chair of the Investment Committee (2010-present) of the Teagle Foundation. Ms. Small also serves on the Investment Committee of the Berkshire Taconic Community Foundation (2008-present). Previously, Ms. Small served as Chairperson (2002-2008) and a member of the Investment Committee and Chairperson (2008-2012) and a member of the Board of Trustees of Smith College. In addition, Ms. Small served as Chief Investment Officer, Director of Global Equity Investments, and a member of the Board of Directors of Scudder, Stevens & Clark and Scudder Kemper Investments.
Garnett A. Smith (1947)
Year of Election or Appointment: 2013
Trustee
Mr. Smith also serves as Trustee of other Fidelity® funds. Prior to Mr. Smith's retirement, he served as Chairman and Chief Executive Officer of Inbrand Corp. (manufacturer of personal absorbent products, 1990-1997). He also served as President (1986-1990) of Inbrand Corp. Prior to his employment with Inbrand Corp., he was employed by a retail fabric chain and North Carolina National Bank. In addition, Mr. Smith served as a Member of the Advisory Board of certain Fidelity® funds (2012-2013) and as a board member of the Jackson Hole Land Trust (2009-2012).
David M. Thomas (1949)
Year of Election or Appointment: 2018
Trustee
Mr. Thomas also serves as Trustee of other Fidelity® funds. Mr. Thomas serves as Non-Executive Chairman of the Board of Directors of Fortune Brands Home and Security (home and security products, 2011-present) and as a member of the Board of Directors (2004-present) and Presiding Director (2013-present) of Interpublic Group of Companies, Inc. (marketing communication). Previously, Mr. Thomas served as Executive Chairman (2005-2006) and Chairman and Chief Executive Officer (2000-2005) of IMS Health, Inc. (pharmaceutical and healthcare information solutions), a Director of Fortune Brands, Inc. (consumer products, 2000-2011), and a member of the Board of Trustees of the University of Florida (2013-2018).
Michael E. Wiley (1950)
Year of Election or Appointment: 2008
Trustee
Mr. Wiley also serves as Trustee or Member of the Advisory Board of other Fidelity® funds. Mr. Wiley serves as a Director of High Point Resources (exploration and production, 2005-present). Previously, Mr. Wiley served as a Director of Andeavor Corporation (independent oil refiner and marketer, 2005-2018), a Director of Andeavor Logistics LP (natural resources logistics, 2015-2018), a Director of Post Oak Bank (privately-held bank, 2004-2018), a Director of Asia Pacific Exploration Consolidated (international oil and gas exploration and production, 2008-2013), a member of the Board of Trustees of the University of Tulsa (2000-2006; 2007-2010), a Senior Energy Advisor of Katzenbach Partners, LLC (consulting, 2006-2007), an Advisory Director of Riverstone Holdings (private investment), a Director of Spinnaker Exploration Company (exploration and production, 2001-2005) and Chairman, President, and CEO of Baker Hughes, Inc. (oilfield services, 2000-2004).
+ The information includes the Trustee's principal occupation during the last five years and other information relating to the experience, attributes, and skills relevant to the Trustee's qualifications to serve as a Trustee, which led to the conclusion that the Trustee should serve as a Trustee for the fund.
Advisory Board Members and Officers:
Correspondence intended for a Member of the Advisory Board (if any) may be sent to Fidelity Investments, P.O. Box 55235, Boston, Massachusetts 02205-5235. Correspondence intended for an officer or Peter S. Lynch may be sent to Fidelity Investments, 245 Summer Street, Boston, Massachusetts 02210. Officers appear below in alphabetical order.
Name, Year of Birth; Principal Occupation
Vicki L. Fuller (1957)
Year of Election or Appointment: 2018
Member of the Advisory Board
Ms. Fuller also serves as Member of the Advisory Board of other Fidelity® funds. Ms. Fuller serves as a member of the Board of Directors, Audit Committee, and Nominating and Governance Committee of The Williams Companies, Inc. (natural gas infrastructure, 2018-present). Previously, Ms. Fuller served as the Chief Investment Officer of the New York State Common Retirement Fund (2012-2018) and held a variety of positions at AllianceBernstein L.P. (global asset management, 1985-2012), including Managing Director (2006-2012) and Senior Vice President and Senior Portfolio Manager (2001-2006).
Patricia L. Kampling (1959)
Year of Election or Appointment: 2020
Member of the Advisory Board
Ms. Kampling also serves as Member of the Advisory Board of other Fidelity® funds. Prior to her retirement, Ms. Kampling served as Chairman of the Board and Chief Executive Officer (2012-2019), President and Chief Operating Officer (2011-2012) and Executive Vice President and Chief Financial Officer (2010-2011) of Alliant Energy Corporation. Ms. Kampling currently serves as a member of the Board, Compensation Committee and Executive Committee and as Chair of the Audit Committee of Briggs & Stratton Corporation (manufacturing, 2011-present) and as a member of the Board, Audit, Finance and Risk Committee and Safety, Environmental, Technology and Operations Committee of American Water Works Company, Inc. (utilities company, 2019-present). In addition, Ms. Kampling currently serves as a member of the Board of the Nature Conservancy, Wisconsin Chapter (2019-present). Previously, Ms. Kampling served as a member of the Board of Interstate Power and Light Company (2012-2019) and Wisconsin Power and Light Company (2012-2019) (each a subsidiary of Alliant Energy Corporation) and as a member of the Board and Workforce Development Committee of the Business Roundtable (2018-2019).
Peter S. Lynch (1944)
Year of Election or Appointment: 2018
Member of the Advisory Board
Mr. Lynch also serves as Member of the Advisory Board of other Fidelity® funds. Mr. Lynch is Vice Chairman and a Director of Fidelity Management & Research Company LLC (investment adviser firm). In addition, Mr. Lynch serves as a Trustee of Boston College and as the Chairman of the Inner-City Scholarship Fund. Previously, Mr. Lynch served as Vice Chairman and a Director of FMR Co., Inc. (investment adviser firm) and on the Special Olympics International Board of Directors (1997-2006).
Susan Tomasky (1953)
Year of Election or Appointment: 2020
Member of the Advisory Board
Ms. Tomasky also serves as Member of the Advisory Board of other Fidelity® funds. Prior to her retirement, Ms. Tomasky served in various executive officer positions at American Electric Power Company, Inc. (1998-2011), including most recently as President of AEP Transmission (2007-2011). Ms. Tomasky currently serves as a member of the Board and Sustainability Committee and as Chair of the Audit Committee of Marathon Petroleum Corporation (2018-present) and as a member of the Board, Corporate Governance Committee and Organization and Compensation Committee and as Chair of the Audit Committee of Public Service Enterprise Group, Inc. (utilities company, 2012-present). In addition, Ms. Tomasky currently serves as a member of the Board of the Columbus Regional Airport Authority (2007-present), as a member of the Board of the Royal Shakespeare Company – America (2009-present), as a member of the Board of the Columbus Association for the Performing Arts (2011-present) and as a member of the Board of Kenyon College (2016-present). Previously, Ms. Tomasky served as a member of the Board (2011-2019) and as Lead Independent Director (2015-2018) of Andeavor Corporation (previously Tesoro Corporation) (independent oil refiner and marketer) and as a member of the Board of Summit Midstream Partners LP (energy, 2012-2018).
Elizabeth Paige Baumann (1968)
Year of Election or Appointment: 2017
Anti-Money Laundering (AML) Officer
Ms. Baumann also serves as AML Officer of other funds. She is Chief AML Officer (2012-present) and Senior Vice President (2014-present) of FMR LLC (diversified financial services company) and is an employee of Fidelity Investments. Previously, Ms. Baumann served as AML Officer of the funds (2012-2016), and Vice President (2007-2014) and Deputy Anti-Money Laundering Officer (2007-2012) of FMR LLC.
Craig S. Brown (1977)
Year of Election or Appointment: 2019
Assistant Treasurer
Mr. Brown also serves as Assistant Treasurer of other funds. Mr. Brown is an employee of Fidelity Investments (2013-present).
John J. Burke III (1964)
Year of Election or Appointment: 2018
Chief Financial Officer
Mr. Burke also serves as Chief Financial Officer of other funds. Mr. Burke serves as Head of Investment Operations for Fidelity Fund and Investment Operations (2018-present) and is an employee of Fidelity Investments (1998-present). Previously Mr. Burke served as head of Asset Management Investment Operations (2012-2018).
William C. Coffey (1969)
Year of Election or Appointment: 2019
Assistant Secretary
Mr. Coffey also serves as Assistant Secretary of other funds. He is Senior Vice President and Deputy General Counsel of FMR LLC (diversified financial services company, 2010-present), and is an employee of Fidelity Investments. Previously, Mr. Coffey served as Secretary and CLO of certain funds (2018-2019); CLO, Secretary, and Senior Vice President of Fidelity Management & Research Company and FMR Co., Inc. (investment adviser firms, 2018-2019); Secretary of Fidelity SelectCo, LLC and Fidelity Investments Money Management, Inc. (investment adviser firms, 2018-2019); CLO of Fidelity Management & Research (Hong Kong) Limited, FMR Investment Management (UK) Limited, and Fidelity Management & Research (Japan) Limited (investment adviser firms, 2018-2019); and Assistant Secretary of certain funds (2009-2018).
Timothy M. Cohen (1969)
Year of Election or Appointment: 2018
Vice President
Mr. Cohen also serves as Vice President of other funds. Mr. Cohen serves as Co-Head of Equity (2018-present), a Director of Fidelity Management & Research (Japan) Limited (investment adviser firm, 2016-present), and is an employee of Fidelity Investments. Previously, Mr. Cohen served as Executive Vice President of Fidelity SelectCo, LLC (2019), Head of Global Equity Research (2016-2018), Chief Investment Officer - Equity and a Director of Fidelity Management & Research (U.K.) Inc. (investment adviser firm, 2013-2015) and as a Director of Fidelity Management & Research (Hong Kong) Limited (investment adviser firm, 2017).
Jonathan Davis (1968)
Year of Election or Appointment: 2010
Assistant Treasurer
Mr. Davis also serves as Assistant Treasurer of other funds. Mr. Davis serves as Assistant Treasurer of FMR Capital, Inc. (2017-present) and is an employee of Fidelity Investments. Previously, Mr. Davis served as Vice President and Associate General Counsel of FMR LLC (diversified financial services company, 2003-2010).
Laura M. Del Prato (1964)
Year of Election or Appointment: 2018
Assistant Treasurer
Ms. Del Prato also serves as an officer of other funds. Ms. Del Prato is an employee of Fidelity Investments (2017-present). Prior to joining Fidelity Investments, Ms. Del Prato served as a Managing Director and Treasurer of the JPMorgan Mutual Funds (2014-2017). Prior to JPMorgan, Ms. Del Prato served as a partner at Cohen Fund Audit Services (accounting firm, 2012-2013) and KPMG LLP (accounting firm, 2004-2012).
Colm A. Hogan (1973)
Year of Election or Appointment: 2020
Assistant Treasurer
Mr. Hogan also serves as an officer of other funds. Mr. Hogan serves as Assistant Treasurer of FMR Capital, Inc. (2017-present) and is an employee of Fidelity Investments (2005-present). Previously, Mr. Hogan served as Deputy Treasurer of certain Fidelity® funds (2016-2020) and Assistant Treasurer of certain Fidelity® funds (2016-2018).
Pamela R. Holding (1964)
Year of Election or Appointment: 2018
Vice President
Ms. Holding also serves as Vice President of other funds. Ms. Holding serves as Co-Head of Equity (2018-present) and is an employee of Fidelity Investments (2013-present). Previously, Ms. Holding served as Executive Vice President of Fidelity SelectCo, LLC (2019) and as Chief Investment Officer of Fidelity Institutional Asset Management (2013-2018).
Cynthia Lo Bessette (1969)
Year of Election or Appointment: 2019
Secretary and Chief Legal Officer (CLO)
Ms. Lo Bessette also serves as an officer of other funds. Ms. Lo Bessette serves as CLO, Secretary, and Senior Vice President of Fidelity Management & Research Company LLC (investment adviser firm, 2019-present); and CLO of Fidelity Management & Research (Hong Kong) Limited, FMR Investment Management (UK) Limited, and Fidelity Management & Research (Japan) Limited (investment adviser firms, 2019-present). She is a Senior Vice President and Deputy General Counsel of FMR LLC (diversified financial services company, 2019-present), and is an employee of Fidelity Investments. Previously, Ms. Lo Bessette served as CLO, Secretary, and Senior Vice President of FMR Co., Inc. (investment adviser firm, 2019); Secretary of Fidelity SelectCo, LLC and Fidelity Investments Money Management, Inc. (investment adviser firms, 2019). Prior to joining Fidelity Investments, Ms. Lo Bessette was Executive Vice President, General Counsel (2016-2019) and Senior Vice President, Deputy General Counsel (2015-2016) of OppenheimerFunds (investment management company) and Deputy Chief Legal Officer (2013-2015) of Jennison Associates LLC (investment adviser firm).
Chris Maher (1972)
Year of Election or Appointment: 2020
Deputy Treasurer
Mr. Maher also serves as an officer of other funds. Mr. Maher serves as Assistant Treasurer of FMR Capital, Inc. (2017-present), and is an employee of Fidelity Investments (2008-present). Previously, Mr. Maher served as Assistant Treasurer of certain funds (2013-2020); Vice President of Asset Management Compliance (2013), Vice President of the Program Management Group of FMR (investment adviser firm, 2010-2013), and Vice President of Valuation Oversight (2008-2010).
Kenneth B. Robins (1969)
Year of Election or Appointment: 2018
Chief Compliance Officer
Mr. Robins also serves as an officer of other funds. Mr. Robins serves as Compliance Officer of Fidelity Management & Research Company LLC (investment adviser firm, 2016-present) and is an employee of Fidelity Investments (2004-present). Previously, Mr. Robins served as Compliance Officer of FMR Co., Inc. (investment adviser firm, 2016-2019), as Executive Vice President of Fidelity Investments Money Management, Inc. (investment adviser firm, 2013-2016) and served in other fund officer roles.
Stacie M. Smith (1974)
Year of Election or Appointment: 2018
President and Treasurer
Ms. Smith also serves as an officer of other funds. Ms. Smith serves as Assistant Treasurer of FMR Capital, Inc. (2017-present), is an employee of Fidelity Investments (2009-present), and has served in other fund officer roles. Prior to joining Fidelity Investments, Ms. Smith served as Senior Audit Manager of Ernst & Young LLP (accounting firm, 1996-2009). Previously, Ms. Smith served as Assistant Treasurer (2013-2019) and Deputy Treasurer (2013-2016) of certain Fidelity® funds.
Marc L. Spector (1972)
Year of Election or Appointment: 2017
Assistant Treasurer
Mr. Spector also serves as an officer of other funds. Mr. Spector serves as Assistant Treasurer of FMR Capital, Inc. (2017-present) and is an employee of Fidelity Investments (2016-present). Prior to joining Fidelity Investments, Mr. Spector served as Director at the Siegfried Group (accounting firm, 2013-2016), and prior to Siegfried Group as audit senior manager at Deloitte & Touche (accounting firm, 2005-2013).
Jim Wegmann (1979)
Year of Election or Appointment: 2019
Assistant Treasurer
Mr. Wegmann also serves as Assistant Treasurer of other funds. Mr. Wegmann is an employee of Fidelity Investments (2011-present).
Shareholder Expense Example
As a shareholder of the Fund, you incur two types of costs: (1) transaction costs and (2) ongoing costs, including management fees and other Fund expenses. This Example is intended to help you understand your ongoing costs (in dollars) of investing in the Fund and to compare these costs with the ongoing costs of investing in other mutual funds.
The Example is based on an investment of $1,000 invested at the beginning of the period and held for the entire period (July 1, 2019 to December 31, 2019).
Actual Expenses
The first line of the accompanying table for each class of the Fund provides information about actual account values and actual expenses. You may use the information in this line, together with the amount you invested, to estimate the expenses that you paid over the period. Simply divide your account value by $1,000.00 (for example, an $8,600 account value divided by $1,000.00 = 8.6), then multiply the result by the number in the first line for a class of the Fund under the heading entitled "Expenses Paid During Period" to estimate the expenses you paid on your account during this period. The estimate of expenses does not include any fees or other expenses of any variable annuity or variable life insurance product. If they were, the estimate of expenses you paid during the period would be higher, and your ending account value would be lower. In addition, the Fund, as a shareholder in the underlying Fidelity Central Funds, will indirectly bear its pro-rata share of the fees and expenses incurred by the underlying Fidelity Central Funds. These fees and expenses are not included in the Fund's annualized expense ratio used to calculate the expense estimate in the table below.
Hypothetical Example for Comparison Purposes
The second line of the accompanying table for each class of the Fund provides information about hypothetical account values and hypothetical expenses based on a Class' actual expense ratio and an assumed rate of return of 5% per year before expenses, which is not the Class' actual return. The hypothetical account values and expenses may not be used to estimate the actual ending account balance or expenses you paid for the period. You may use this information to compare the ongoing costs of investing in the Fund and other funds. To do so, compare this 5% hypothetical example with the 5% hypothetical examples that appear in the shareholder reports of the other funds. The estimate of expenses does not include any fees or other expenses of any variable annuity or variable life insurance product. If they were, the estimate of expenses you paid during the period would be higher, and your ending account value would be lower. In addition, the Fund, as a shareholder in the underlying Fidelity Central Funds, will indirectly bear its pro-rata share of the fees and expenses incurred by the underlying Fidelity Central Funds. These fees and expenses are not included in the Fund's annualized expense ratio used to calculate the expense estimate in the table below.
Please note that the expenses shown in the table are meant to highlight your ongoing costs only and do not reflect any transaction costs. Therefore, the second line of the table is useful in comparing ongoing costs only, and will not help you determine the relative total costs of owning different funds.
| | Annualized Expense Ratio-A | Beginning
Account Value
July 1, 2019 | Ending
Account Value
December 31, 2019 | Expenses Paid
During Period-B
July 1, 2019
to December 31, 2019 |
| Initial Class | .67% | | | |
| Actual | | $1,000.00 | $1,089.60 | $3.53 |
| Hypothetical-C | | $1,000.00 | $1,021.83 | $3.41 |
| Investor Class | .74% | | | |
| Actual | | $1,000.00 | $1,089.40 | $3.90 |
| Hypothetical-C | | $1,000.00 | $1,021.48 | $3.77 |
A Annualized expense ratio reflects expenses net of applicable fee waivers.
B Expenses are equal to each Class' annualized expense ratio, multiplied by the average account value over the period, multiplied by 184/365 (to reflect the one-half year period).
C 5% return per year before expenses
Distributions (Unaudited)
The Board of Trustees of VIP Consumer Staples Portfolio voted to pay to shareholders of record at the opening of business on record date, the following distributions per share derived from capital gains realized from sales of portfolio securities, and dividends derived from net investment income:
| | Pay Date | Record Date | Dividends | Capital Gains |
| VIP Consumer Staples Portfolio | | | | |
| Initial Class | 02/07/20 | 02/07/20 | $0.075 | $0.571 |
| Investor Class | 02/07/20 | 02/07/20 | $0.073 | $0.571 |
|
The fund hereby designates as a capital gain dividend with respect to the taxable year ended December 31, 2019, $6,799,616, or, if subsequently determined to be different, the net capital gain of such year.
Initial Class and Investor Class designate 100% of the dividends distributed in February and December during the fiscal year as qualifying for the dividends–received deduction for corporate shareholders.
Board Approval of Investment Advisory Contracts
VIP Consumer Staples Portfolio
At its November 2019 meeting, the Board of Trustees, including the Independent Trustees (together, the Board), voted to approve an amended and restated management contract and amended and restated sub-advisory agreements (together, the Amended and Restated Contracts) for the fund, effective January 1, 2020, for a one month period through January 31, 2020, in connection with an upcoming consolidation of certain of Fidelity's advisory businesses.
The Board considered that, on or about January 1, 2020, each of FMR Co., Inc. (FMRC), Fidelity Investments Money Management, Inc. (FIMM), and SelectCo, LLC (SelectCo) will merge with and into Fidelity Management & Research Company (FMR) and that, after the merger, FMR will redomicile as a Delaware limited liability company. The Board also approved the termination of the sub-advisory agreement with FMRC upon the completion of the merger. The Board noted that the Amended and Restated Contracts would be updated to reflect the renamed adviser, Fidelity Management & Research Company LLC and its new form of organization and domicile. The Board also noted that the Amended and Restated Contracts will not change the investment processes, the level or nature of services provided, the resources and personnel allocated, trading and compliance operations, or any fees or expenses paid by the fund.
The Board concluded that the fund's Amended and Restated Contracts are fair and reasonable, and that the fund's Advisory Contracts should be approved through January 31, 2020.
In connection with its consideration of future renewals of the fund's Amended and Restated Contracts, the Board will consider: (i) the nature, extent and quality of services provided to the fund, including shareholder and administrative services and investment performance; (ii) the competitiveness of the management fee and total expenses for the fund; (iii) the costs of the services and profitability, including the revenues earned and the expenses incurred in conducting the business of developing, marketing, distributing, managing, administering, and servicing the fund and its shareholders, to the extent applicable; and (iv) whether there have been economies of scale in respect of the Fidelity funds, whether the Fidelity funds (including the fund) have appropriately benefited from any such economies of scale, and whether there is the potential for realization of any further economies.
Based on its evaluation of all of the conclusions noted above, and after considering all factors it believed relevant, the Board ultimately concluded that the fund's management fee structure is fair and reasonable, and that the continuation of the fund's Amended and Restated Contracts should be approved.
VCSP-ANN-0220
1.850994.112
Fidelity® Variable Insurance Products:
Industrials Portfolio
Annual Report
December 31, 2019
See the inside front cover for important information about access to your fund’s shareholder reports.
Beginning on January 1, 2021, as permitted by regulations adopted by the Securities and Exchange Commission, and if your insurance carrier elects to participate, you may not be receiving paper copies of the Fund’s shareholder reports from the insurance company that offers your variable insurance product unless you specifically request paper copies from your financial professional or the administrator of your variable insurance product. Instead, the reports will be made available on a website, and you will be notified by mail each time a report is posted and provided with a website link to access the report.
If you already elected to receive shareholder reports electronically, you will not be affected by this change and you need not take any action. You may elect to receive shareholder reports and other communications from the Fund electronically, by contacting your financial professional or the administrator of your variable insurance product. If you own a Fidelity-administered variable insurance product, please visit fidelity.com/mailpreferences to make your election or call 1-800-343-3548.
You may elect to receive all future reports in paper free of charge. If you wish to continue receiving paper copies of your shareholder reports, you may contact your financial professional or the administrator of your variable insurance product. If you own a Fidelity-administered variable insurance product, please visit fidelity.com/mailpreferences to make your election or call 1-800-343-3548. Your election to receive reports in paper will apply to all funds available under your variable insurance product.
Contents
To view a fund's proxy voting guidelines and proxy voting record for the 12-month period ended June 30, visit http://www.fidelity.com/proxyvotingresults or visit the Securities and Exchange Commission's (SEC) web site at http://www.sec.gov.
You may also call 1-877-208-0098 to request a free copy of the proxy voting guidelines.
Fidelity® Variable Insurance Products are separate account options which are purchased through a variable insurance contract.
Standard & Poor's, S&P and S&P 500 are registered service marks of The McGraw-Hill Companies, Inc. and have been licensed for use by Fidelity Distributors Corporation.
Other third-party marks appearing herein are the property of their respective owners.
All other marks appearing herein are registered or unregistered trademarks or service marks of FMR LLC or an affiliated company. © 2020 FMR LLC. All rights reserved.
This report and the financial statements contained herein are submitted for the general information of the shareholders of the Fund. This report is not authorized for distribution to prospective investors in the Fund unless preceded or accompanied by an effective prospectus.
A fund files its complete schedule of portfolio holdings with the SEC for the first and third quarters of each fiscal year on Form N-PORT. Forms N-PORT are available on the SEC’s web site at http://www.sec.gov. A fund's Forms N-PORT may be reviewed and copied at the SEC’s Public Reference Room in Washington, DC. Information regarding the operation of the SEC's Public Reference Room may be obtained by calling 1-800-SEC-0330.
For a complete list of a fund's portfolio holdings, view the most recent holdings listing, semiannual report, or annual report on Fidelity's web site at http://www.fidelity.com, http://www.institutional.fidelity.com, or http://www.401k.com, as applicable.
NOT FDIC INSURED •MAY LOSE VALUE •NO BANK GUARANTEE
Neither the Fund nor Fidelity Distributors Corporation is a bank.
Note to shareholders:
As part of a regular review of its organizational structure, Fidelity has decided to merge certain entities to streamline operations, increase efficiency, simplify reporting, and reduce legal, compliance, and accounting complexity and costs. In separate events, Fidelity has merged four of its investment advisers and two of its broker-dealers.
Effective on or about January 1, 2020, following any required regulatory notices and approvals:
Investment advisers Fidelity Investments Money Management, Inc., FMR Co., Inc., and Fidelity SelectCo, LLC, merged with and into Fidelity Management & Research Company. In connection with the merger transactions, the resulting, merged investment adviser was then redomiciled from Massachusetts to Delaware, changed its corporate structure from a corporation to a limited liability company, and changed its name to “Fidelity Management & Research Company LLC”.
Broker-dealer Fidelity Distributors Corporation merged with and into Fidelity Investments Institutional Services Company, Inc. (“FIISC”). FIISC was then redomiciled from Massachusetts to Delaware, changed its corporate structure from a corporation to a limited liability company, and changed its name to “Fidelity Distributors Company LLC”.
These mergers are not expected to affect fund shareholders or Fidelity clients, nor are they expected to result in any changes to the day-to-day management of Fidelity’s brokerage services, the Fidelity funds, their investment policies and practices, their portfolio management teams, or the funds’ expenses.
Performance: The Bottom Line
Average annual total return reflects the change in the value of an investment, assuming reinvestment of distributions from dividend income and capital gains (the profits earned upon the sale of securities that have grown in value, if any) and assuming a constant rate of performance each year. During periods of reimbursement by Fidelity, a fund’s total return will be greater than it would be had the reimbursement not occurred. Performance numbers are net of all underlying fund operating expenses, but do not include any insurance charges imposed by your insurance company’s separate account. If performance information included the effect of these additional charges, the total returns would have been lower. How a fund did yesterday is no guarantee of how it will do tomorrow.
Average Annual Total Returns
| For the periods ended December 31, 2019 | Past 1 year | Past 5 years | Past 10 years |
| Initial Class | 28.15% | 8.24% | 12.69% |
| Investor Class | 28.03% | 8.15% | 12.60% |
$10,000 Over 10 Years
Let's say hypothetically that $10,000 was invested in VIP Industrials Portfolio - Initial Class on December 31, 2009.
The chart shows how the value of your investment would have changed, and also shows how the S&P 500® Index performed over the same period.
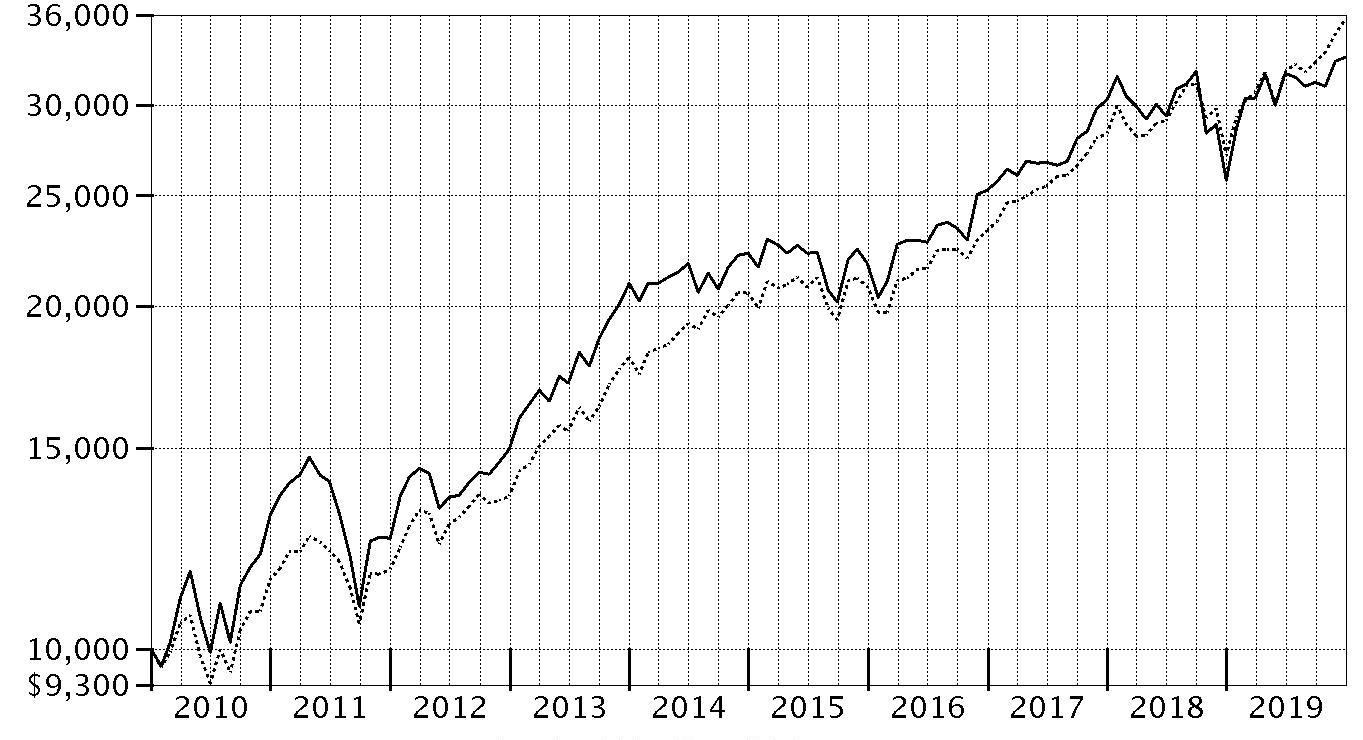
| Period Ending Values |
| $33,038 | VIP Industrials Portfolio - Initial Class |
| $35,666 | S&P 500® Index |
Management's Discussion of Fund Performance
Market Recap: U.S. stocks continued to roll in 2019, with the S&P 500
® index soaring 31.49% and marking history as the longest and strongest bull market ever, despite persistent, nagging concerns about global economic growth and trade. After a rough end to 2018, equities sharply reversed course to begin the new year amid upbeat company earnings and signs the Federal Reserve may pause on rates. The uptrend continued until May, when the index sunk as trade negotiations between the U.S. and China broke down. The bull market roared back to record a series of highs in July, when the Fed cut interest rates for the first time since 2008. Volatility intensified in August, as the Treasury yield curve inverted, which some investors viewed as a sign the U.S. economy could be heading for recession. But the market proved resilient, hitting a new high on October 30, when the Fed lowered rates for the third time in 2019, and moving even higher through year-end. Gains were robust and broad-based, with information technology (+50%) leading the way with its best calendar-year result in a decade, amid strong growth trends. Communication services (+33%) and financials (+32%) also stood out. In contrast, energy (+12%) was by far the weakest group – struggling amid sluggish oil prices – while several strong gainers nonetheless fell short of the broader market: industrials and real estate (+29% each), consumer discretionary and consumer staples (+28% each), utilities (+26%), materials (+25%), and health care (+21%).
Comments from Portfolio Manager Janet Glazer: For the year, the fund’s share classes gained about 28%, trailing the 30.28% advance of the MSCI U.S. IMI Industrials 25/50 Index, and lagging the broad-based S&P 500
® index by an even greater margin. Versus the MSCI index, stock selection within the trading companies & distributors segment weighed most on the fund’s performance, followed by positioning in research & consulting services. Stock choices in the airlines and environmental & facilities services groups also hurt, as did an underweighting in the strong-performing building products category. An overweighted stake in Spirit Airlines was the fund’s largest individual relative detractor for the year, returning -43%. Throughout the year, the company battled higher-than-expected costs and decelerating pricing. I exited this position during the period. Overweighting HD Supply Holdings (+7%) also weighed on our relative result, as did untimely positioning in TriNet Group (-9%), a provider of payroll and other human resources services. Conversely, a sizable overweighting and favorable stock picking in industrial machinery lifted the fund’s relative result. Security choices in industrial conglomerates also helped, along with positioning in aerospace & defense. Minimal exposure to industrial conglomerate 3M made this lagging benchmark component the fund's top contributor compared with the MSCI index. I sold our position here in March, in time to avoid a good portion of the stock’s decline. However, later in the year, I re-established an underweighted position in the stock. Overall, 3M returned roughly 2% for the fund, versus -4% in the MSCI index. The fund's largest position at year-end, electrical components & equipment maker Ametek, also bolstered our relative performance, returning 48% the past 12 months.
The views expressed above reflect those of the portfolio manager(s) only through the end of the period as stated on the cover of this report and do not necessarily represent the views of Fidelity or any other person in the Fidelity organization. Any such views are subject to change at any time based upon market or other conditions and Fidelity disclaims any responsibility to update such views. These views may not be relied on as investment advice and, because investment decisions for a Fidelity fund are based on numerous factors, may not be relied on as an indication of trading intent on behalf of any Fidelity fund.
Investment Summary (Unaudited)
Top Ten Stocks as of December 31, 2019
| | % of fund's net assets |
| AMETEK, Inc. | 5.7 |
| Honeywell International, Inc. | 5.6 |
| Fortive Corp. | 4.9 |
| ITT, Inc. | 4.8 |
| Union Pacific Corp. | 4.5 |
| General Electric Co. | 4.2 |
| United Technologies Corp. | 3.8 |
| Ingersoll-Rand PLC | 3.3 |
| Parker Hannifin Corp. | 3.0 |
| XPO Logistics, Inc. | 3.0 |
| | 42.8 |
Top Industries (% of fund's net assets)
| As of December 31, 2019 |
| | Machinery | 30.1% |
| | Aerospace & Defense | 19.9% |
| | Industrial Conglomerates | 14.9% |
| | Road & Rail | 10.9% |
| | Electrical Equipment | 7.2% |
| | All Others* | 17.0% |

* Includes short-term investments and net other assets (liabilities).
Schedule of Investments December 31, 2019
Showing Percentage of Net Assets
| Common Stocks - 99.5% | | | |
| | | Shares | Value |
| Aerospace & Defense - 19.9% | | | |
| Aerospace & Defense - 19.9% | | | |
| General Dynamics Corp. | | 5,700 | $1,005,195 |
| Harris Corp. | | 13,300 | 2,631,671 |
| HEICO Corp. Class A | | 7,400 | 662,522 |
| Huntington Ingalls Industries, Inc. | | 7,150 | 1,793,792 |
| Lockheed Martin Corp. | | 7,000 | 2,725,660 |
| Northrop Grumman Corp. | | 12,900 | 4,437,213 |
| Raytheon Co. | | 13,100 | 2,878,594 |
| Teledyne Technologies, Inc. (a) | | 8,778 | 3,041,928 |
| The Boeing Co. | | 13,800 | 4,495,488 |
| TransDigm Group, Inc. | | 7,200 | 4,032,000 |
| United Technologies Corp. | | 43,229 | 6,473,975 |
| | | | 34,178,038 |
| Air Freight & Logistics - 5.5% | | | |
| Air Freight & Logistics - 5.5% | | | |
| FedEx Corp. | | 13,200 | 1,995,972 |
| United Parcel Service, Inc. Class B | | 19,700 | 2,306,082 |
| XPO Logistics, Inc. (a) | | 64,000 | 5,100,800 |
| | | | 9,402,854 |
| Airlines - 0.4% | | | |
| Airlines - 0.4% | | | |
| Southwest Airlines Co. | | 14,500 | 782,710 |
| Building Products - 1.1% | | | |
| Building Products - 1.1% | | | |
| Fortune Brands Home & Security, Inc. | | 19,900 | 1,300,266 |
| Johnson Controls International PLC | | 12,700 | 517,017 |
| | | | 1,817,283 |
| Commercial Services & Supplies - 3.1% | | | |
| Diversified Support Services - 1.2% | | | |
| Cintas Corp. | | 4,402 | 1,184,490 |
| Copart, Inc. (a) | | 9,500 | 863,930 |
| | | | 2,048,420 |
| Environmental & Facility Services - 1.9% | | | |
| Waste Connection, Inc. (United States) | | 35,247 | 3,200,075 |
|
| TOTAL COMMERCIAL SERVICES & SUPPLIES | | | 5,248,495 |
|
| Construction & Engineering - 0.7% | | | |
| Construction & Engineering - 0.7% | | | |
| Jacobs Engineering Group, Inc. | | 13,600 | 1,221,688 |
| Electrical Equipment - 7.2% | | | |
| Electrical Components & Equipment - 7.2% | | | |
| AMETEK, Inc. | | 98,200 | 9,794,468 |
| Regal Beloit Corp. | | 31,000 | 2,653,910 |
| | | | 12,448,378 |
| Industrial Conglomerates - 14.9% | | | |
| Industrial Conglomerates - 14.9% | | | |
| 3M Co. | | 22,200 | 3,916,524 |
| General Electric Co. | | 650,446 | 7,258,977 |
| Honeywell International, Inc. | | 54,227 | 9,598,179 |
| Roper Technologies, Inc. | | 13,600 | 4,817,528 |
| | | | 25,591,208 |
| Machinery - 30.1% | | | |
| Construction Machinery & Heavy Trucks - 3.4% | | | |
| Allison Transmission Holdings, Inc. | | 64,600 | 3,121,472 |
| Caterpillar, Inc. | | 18,300 | 2,702,544 |
| | | | 5,824,016 |
| Industrial Machinery - 26.7% | | | |
| Evoqua Water Technologies Corp. (a) | | 4,400 | 83,380 |
| Fortive Corp. | | 109,392 | 8,356,455 |
| Gardner Denver Holdings, Inc. (a) | | 107,200 | 3,932,096 |
| IDEX Corp. | | 15,740 | 2,707,280 |
| Illinois Tool Works, Inc. | | 17,400 | 3,125,562 |
| Ingersoll-Rand PLC | | 42,100 | 5,595,932 |
| ITT, Inc. | | 111,656 | 8,252,495 |
| Kennametal, Inc. | | 48,884 | 1,803,331 |
| Nordson Corp. | | 14,700 | 2,393,748 |
| Parker Hannifin Corp. | | 25,000 | 5,145,500 |
| SPX Flow, Inc. (a) | | 37,877 | 1,851,049 |
| Woodward, Inc. | | 13,900 | 1,646,316 |
| Xylem, Inc. | | 11,000 | 866,690 |
| | | | 45,759,834 |
|
| TOTAL MACHINERY | | | 51,583,850 |
|
| Professional Services - 3.2% | | | |
| Human Resource & Employment Services - 1.6% | | | |
| TriNet Group, Inc. (a) | | 47,200 | 2,671,992 |
| Research & Consulting Services - 1.6% | | | |
| Equifax, Inc. | | 19,600 | 2,746,352 |
|
| TOTAL PROFESSIONAL SERVICES | | | 5,418,344 |
|
| Road & Rail - 10.9% | | | |
| Railroads - 9.1% | | | |
| CSX Corp. | | 22,300 | 1,613,628 |
| Kansas City Southern | | 15,000 | 2,297,400 |
| Norfolk Southern Corp. | | 20,650 | 4,008,785 |
| Union Pacific Corp. | | 42,900 | 7,755,891 |
| | | | 15,675,704 |
| Trucking - 1.8% | | | |
| Knight-Swift Transportation Holdings, Inc. Class A | | 83,400 | 2,989,056 |
|
| TOTAL ROAD & RAIL | | | 18,664,760 |
|
| Trading Companies & Distributors - 2.5% | | | |
| Trading Companies & Distributors - 2.5% | | | |
| HD Supply Holdings, Inc. (a) | | 64,200 | 2,582,124 |
| MRC Global, Inc. (a) | | 130,985 | 1,786,635 |
| | | | 4,368,759 |
| TOTAL COMMON STOCKS | | | |
| (Cost $130,406,926) | | | 170,726,367 |
|
| Money Market Funds - 0.5% | | | |
| Fidelity Cash Central Fund 1.58% (b) | | | |
| (Cost $822,076) | | 821,912 | 822,076 |
| TOTAL INVESTMENT IN SECURITIES - 100.0% | | | |
| (Cost $131,229,002) | | | 171,548,443 |
| NET OTHER ASSETS (LIABILITIES) - 0.0% | | | (53,554) |
| NET ASSETS - 100% | | | $171,494,889 |
Legend
(a) Non-income producing
(b) Affiliated fund that is generally available only to investment companies and other accounts managed by Fidelity Investments. The rate quoted is the annualized seven-day yield of the fund at period end. A complete unaudited listing of the fund's holdings as of its most recent quarter end is available upon request. In addition, each Fidelity Central Fund's financial statements, which are not covered by the Fund's Report of Independent Registered Public Accounting Firm, are available on the SEC's website or upon request.
Affiliated Central Funds
Information regarding fiscal year to date income earned by the Fund from investments in Fidelity Central Funds is as follows:
| Fund | Income earned |
| Fidelity Cash Central Fund | $35,084 |
| Fidelity Securities Lending Cash Central Fund | 569 |
| Total | $35,653 |
Amounts in the income column in the above table include any capital gain distributions from underlying funds, which are presented in the corresponding line-item in the Statement of Operations, if applicable. Amount for Fidelity Securities Lending Cash Central Fund represents the income earned on investing cash collateral, less rebates paid to borrowers and any lending agent fees associated with the loan, plus any premium payments received for lending certain types of securities.
Investment Valuation
All investments are categorized as Level 1 under the Fair Value Hierarchy. The inputs or methodology used for valuing securities may not be an indication of the risk associated with investing in those securities. For more information on valuation inputs please refer to the Investment Valuation section in the accompanying Notes to Financial Statements.
See accompanying notes which are an integral part of the financial statements.
Financial Statements
Statement of Assets and Liabilities
| | | December 31, 2019 |
| Assets | | |
Investment in securities, at value — See accompanying schedule:
Unaffiliated issuers (cost $130,406,926) | $170,726,367 | |
| Fidelity Central Funds (cost $822,076) | 822,076 | |
| Total Investment in Securities (cost $131,229,002) | | $171,548,443 |
| Cash | | 13,003 |
| Receivable for investments sold | | 335,176 |
| Receivable for fund shares sold | | 5,353 |
| Dividends receivable | | 312,062 |
| Distributions receivable from Fidelity Central Funds | | 587 |
| Prepaid expenses | | 1,650 |
| Other receivables | | 2,492 |
| Total assets | | 172,218,766 |
| Liabilities | | |
| Payable for investments purchased | $306,362 | |
| Payable for fund shares redeemed | 275,561 | |
| Accrued management fee | 76,361 | |
| Other affiliated payables | 24,112 | |
| Other payables and accrued expenses | 41,481 | |
| Total liabilities | | 723,877 |
| Net Assets | | $171,494,889 |
| Net Assets consist of: | | |
| Paid in capital | | $121,807,047 |
| Total accumulated earnings (loss) | | 49,687,842 |
| Net Assets | | $171,494,889 |
| Net Asset Value and Maximum Offering Price | | |
| Initial Class: | | |
| Net Asset Value, offering price and redemption price per share ($33,078,266 ÷ 1,504,633 shares) | | $21.98 |
| Investor Class: | | |
| Net Asset Value, offering price and redemption price per share ($138,416,623 ÷ 6,344,084 shares) | | $21.82 |
See accompanying notes which are an integral part of the financial statements.
Statement of Operations
| | | Year ended December 31, 2019 |
| Investment Income | | |
| Dividends | | $2,904,651 |
| Non-Cash dividends | | 226,911 |
| Income from Fidelity Central Funds (including $569 from security lending) | | 35,653 |
| Total income | | 3,167,215 |
| Expenses | | |
| Management fee | $947,329 | |
| Transfer agent fees | 226,963 | |
| Accounting and security lending fees | 68,719 | |
| Custodian fees and expenses | 15,462 | |
| Independent trustees' fees and expenses | 969 | |
| Audit | 41,277 | |
| Legal | 1,686 | |
| Miscellaneous | 1,375 | |
| Total expenses before reductions | 1,303,780 | |
| Expense reductions | (13,408) | |
| Total expenses after reductions | | 1,290,372 |
| Net investment income (loss) | | 1,876,843 |
| Realized and Unrealized Gain (Loss) | | |
| Net realized gain (loss) on: | | |
| Investment securities: | | |
| Unaffiliated issuers | 11,517,985 | |
| Fidelity Central Funds | 2 | |
| Foreign currency transactions | (47) | |
| Total net realized gain (loss) | | 11,517,940 |
| Change in net unrealized appreciation (depreciation) on: | | |
| Investment securities: | | |
| Unaffiliated issuers | 28,496,450 | |
| Assets and liabilities in foreign currencies | 9 | |
| Total change in net unrealized appreciation (depreciation) | | 28,496,459 |
| Net gain (loss) | | 40,014,399 |
| Net increase (decrease) in net assets resulting from operations | | $41,891,242 |
See accompanying notes which are an integral part of the financial statements.
Statement of Changes in Net Assets
| | Year ended December 31, 2019 | Year ended December 31, 2018 |
| Increase (Decrease) in Net Assets | | |
| Operations | | |
| Net investment income (loss) | $1,876,843 | $1,594,387 |
| Net realized gain (loss) | 11,517,940 | 15,323,336 |
| Change in net unrealized appreciation (depreciation) | 28,496,459 | (46,063,303) |
| Net increase (decrease) in net assets resulting from operations | 41,891,242 | (29,145,580) |
| Distributions to shareholders | (19,667,837) | (9,495,847) |
| Share transactions - net increase (decrease) | (5,983,872) | (24,953,454) |
| Total increase (decrease) in net assets | 16,239,533 | (63,594,881) |
| Net Assets | | |
| Beginning of period | 155,255,356 | 218,850,237 |
| End of period | $171,494,889 | $155,255,356 |
See accompanying notes which are an integral part of the financial statements.
Financial Highlights
VIP Industrials Portfolio Initial Class
| Years ended December 31, | 2019 | 2018 | 2017 | 2016 | 2015 |
| Selected Per–Share Data | | | | | |
| Net asset value, beginning of period | $19.29 | $23.85 | $20.88 | $20.25 | $22.92 |
| Income from Investment Operations | | | | | |
| Net investment income (loss)A | .24 | .19 | .16 | .18 | .17 |
| Net realized and unrealized gain (loss) | 4.92 | (3.68) | 3.91 | 2.50 | (.55) |
| Total from investment operations | 5.16 | (3.49) | 4.07 | 2.68 | (.38) |
| Distributions from net investment income | (.24) | (.18) | (.16) | (.13) | (.18) |
| Distributions from net realized gain | (2.23) | (.89) | (.94) | (1.92) | (2.11) |
| Total distributions | (2.47) | (1.07) | (1.10) | (2.05) | (2.29) |
| Redemption fees added to paid in capitalA | – | – | –B | –B | –B |
| Net asset value, end of period | $21.98 | $19.29 | $23.85 | $20.88 | $20.25 |
| Total ReturnC,D | 28.15% | (15.12)% | 20.15% | 15.87% | (1.89)% |
| Ratios to Average Net AssetsE,F | | | | | |
| Expenses before reductions | .67% | .67% | .69% | .70% | .69% |
| Expenses net of fee waivers, if any | .67% | .67% | .68% | .70% | .69% |
| Expenses net of all reductions | .67% | .66% | .68% | .69% | .69% |
| Net investment income (loss) | 1.13% | .85% | .72% | .94% | .83% |
| Supplemental Data | | | | | |
| Net assets, end of period (000 omitted) | $33,078 | $30,987 | $44,205 | $42,322 | $35,852 |
| Portfolio turnover rateG | 121% | 94% | 64% | 62% | 69% |
A Calculated based on average shares outstanding during the period.
B Amount represents less than $.005 per share.
C Total returns do not reflect charges attributable to your insurance company's separate account. Inclusion of these charges would reduce the total returns shown.
D Total returns would have been lower if certain expenses had not been reduced during the applicable periods shown.
E Fees and expenses of any underlying Fidelity Central Funds are not included in the Fund's expense ratio. The Fund indirectly bears its proportionate share of the expenses of any underlying Fidelity Central Funds.
F Expense ratios reflect operating expenses of the class. Expenses before reductions do not reflect amounts reimbursed by the investment adviser or reductions from brokerage service arrangements or reductions from other expense offset arrangements and do not represent the amount paid by the class during periods when reimbursements or reductions occur. Expenses net of fee waivers reflect expenses after reimbursement by the investment adviser but prior to reductions from brokerage service arrangements or other expense offset arrangements. Expenses net of all reductions represent the net expenses paid by the class.
G Amount does not include the portfolio activity of any underlying Fidelity Central Funds.
See accompanying notes which are an integral part of the financial statements.
VIP Industrials Portfolio Investor Class
| Years ended December 31, | 2019 | 2018 | 2017 | 2016 | 2015 |
| Selected Per–Share Data | | | | | |
| Net asset value, beginning of period | $19.17 | $23.69 | $20.75 | $20.15 | $22.82 |
| Income from Investment Operations | | | | | |
| Net investment income (loss)A | .22 | .17 | .14 | .16 | .16 |
| Net realized and unrealized gain (loss) | 4.88 | (3.64) | 3.88 | 2.48 | (.56) |
| Total from investment operations | 5.10 | (3.47) | 4.02 | 2.64 | (.40) |
| Distributions from net investment income | (.22) | (.16) | (.15) | (.12) | (.17) |
| Distributions from net realized gain | (2.23) | (.89) | (.94) | (1.92) | (2.11) |
| Total distributions | (2.45) | (1.05) | (1.08)B | (2.04) | (2.27)C |
| Redemption fees added to paid in capitalA | – | – | –D | –D | –D |
| Net asset value, end of period | $21.82 | $19.17 | $23.69 | $20.75 | $20.15 |
| Total ReturnE,F | 28.03% | (15.14)% | 20.05% | 15.73% | (1.97)% |
| Ratios to Average Net AssetsG,H | | | | | |
| Expenses before reductions | .75% | .75% | .77% | .78% | .77% |
| Expenses net of fee waivers, if any | .75% | .75% | .77% | .78% | .77% |
| Expenses net of all reductions | .75% | .74% | .76% | .77% | .77% |
| Net investment income (loss) | 1.05% | .77% | .64% | .86% | .76% |
| Supplemental Data | | | | | |
| Net assets, end of period (000 omitted) | $138,417 | $124,268 | $174,645 | $151,967 | $110,411 |
| Portfolio turnover rateI | 121% | 94% | 64% | 62% | 69% |
A Calculated based on average shares outstanding during the period.
B Total distributions of $1.08 per share is comprised of distributions from net investment income of $.145 and distributions from net realized gain of $.937 per share.
C Total distributions of $2.27 per share is comprised of distributions from net investment income of $.166 and distributions from net realized gain of $2.105 per share.
D Amount represents less than $.005 per share.
E Total returns do not reflect charges attributable to your insurance company's separate account. Inclusion of these charges would reduce the total returns shown.
F Total returns would have been lower if certain expenses had not been reduced during the applicable periods shown.
G Fees and expenses of any underlying Fidelity Central Funds are not included in the Fund's expense ratio. The Fund indirectly bears its proportionate share of the expenses of any underlying Fidelity Central Funds.
H Expense ratios reflect operating expenses of the class. Expenses before reductions do not reflect amounts reimbursed by the investment adviser or reductions from brokerage service arrangements or reductions from other expense offset arrangements and do not represent the amount paid by the class during periods when reimbursements or reductions occur. Expenses net of fee waivers reflect expenses after reimbursement by the investment adviser but prior to reductions from brokerage service arrangements or other expense offset arrangements. Expenses net of all reductions represent the net expenses paid by the class.
I Amount does not include the portfolio activity of any underlying Fidelity Central Funds.
See accompanying notes which are an integral part of the financial statements.
Notes to Financial Statements
For the period ended December 31, 2019
1. Organization.
VIP Industrials Portfolio (the Fund) is a non-diversified fund of Variable Insurance Products Fund IV (the Trust) and is authorized to issue an unlimited number of shares. The Trust is registered under the Investment Company Act of 1940, as amended (the 1940 Act), as an open-end management investment company organized as a Massachusetts business trust. Shares of the Fund may only be purchased by insurance companies for the purpose of funding variable annuity or variable life insurance contracts. The Fund offers the following classes of shares: Initial Class shares and Investor Class shares. All classes have equal rights and voting privileges, except for matters affecting a single class.
2. Investments in Fidelity Central Funds.
The Fund invests in Fidelity Central Funds, which are open-end investment companies generally available only to other investment companies and accounts managed by the investment adviser and its affiliates. The Fund's Schedule of Investments lists each of the Fidelity Central Funds held as of period end, if any, as an investment of the Fund, but does not include the underlying holdings of each Fidelity Central Fund. As an Investing Fund, the Fund indirectly bears its proportionate share of the expenses of the underlying Fidelity Central Funds.
The Money Market Central Funds seek preservation of capital and current income and are managed by Fidelity Investments Money Management, Inc. (FIMM), an affiliate of the investment adviser. Annualized expenses of the Money Market Central Funds as of their most recent shareholder report date ranged from less than .005% to .01%.
A complete unaudited list of holdings for each Fidelity Central Fund is available upon request or at the Securities and Exchange Commission (the SEC) website at www.sec.gov. In addition, the financial statements of the Fidelity Central Funds, which are not covered by the Fund's Report of Independent Registered Public Accounting Firm, are available on the SEC website or upon request.
3. Significant Accounting Policies.
The Fund is an investment company and applies the accounting and reporting guidance of the Financial Accounting Standards Board (FASB) Accounting Standards Codification Topic 946 Financial Services – Investments Companies. The financial statements have been prepared in conformity with accounting principles generally accepted in the United States of America (GAAP), which require management to make certain estimates and assumptions at the date of the financial statements. Actual results could differ from those estimates. Subsequent events, if any, through the date that the financial statements were issued have been evaluated in the preparation of the financial statements. The following summarizes the significant accounting policies of the Fund:
Investment Valuation. Investments are valued as of 4:00 p.m. Eastern time on the last calendar day of the period. The Board of Trustees (the Board) has delegated the day to day responsibility for the valuation of the Fund's investments to the Fair Value Committee (the Committee) established by the Fund's investment adviser. In accordance with valuation policies and procedures approved by the Board, the Fund attempts to obtain prices from one or more third party pricing vendors or brokers to value its investments. When current market prices, quotations or currency exchange rates are not readily available or reliable, investments will be fair valued in good faith by the Committee, in accordance with procedures adopted by the Board. Factors used in determining fair value vary by investment type and may include market or investment specific events. The frequency with which these procedures are used cannot be predicted and they may be utilized to a significant extent. The Committee oversees the Fund's valuation policies and procedures and reports to the Board on the Committee's activities and fair value determinations. The Board monitors the appropriateness of the procedures used in valuing the Fund's investments and ratifies the fair value determinations of the Committee.
The Fund categorizes the inputs to valuation techniques used to value its investments into a disclosure hierarchy consisting of three levels as shown below:
- Level 1 – quoted prices in active markets for identical investments
- Level 2 – other significant observable inputs (including quoted prices for similar investments, interest rates, prepayment speeds, etc.)
- Level 3 – unobservable inputs (including the Fund's own assumptions based on the best information available)
Valuation techniques used to value the Fund's investments by major category are as follows:
Equity securities, including restricted securities, for which market quotations are readily available, are valued at the last reported sale price or official closing price as reported by a third party pricing vendor on the primary market or exchange on which they are traded and are categorized as Level 1 in the hierarchy. In the event there were no sales during the day or closing prices are not available, securities are valued at the last quoted bid price or may be valued using the last available price and are generally categorized as Level 2 in the hierarchy. For foreign equity securities, when market or security specific events arise, comparisons to the valuation of American Depositary Receipts (ADRs), futures contracts, Exchange-Traded Funds (ETFs) and certain indexes as well as quoted prices for similar securities may be used and would be categorized as Level 2 in the hierarchy. For equity securities, including restricted securities, where observable inputs are limited, assumptions about market activity and risk are used and these securities may be categorized as Level 3 in the hierarchy.
Investments in open-end mutual funds, including the Fidelity Central Funds, are valued at their closing net asset value (NAV) each business day and are categorized as Level 1 in the hierarchy.
Changes in valuation techniques may result in transfers in or out of an assigned level within the disclosure hierarchy.
Foreign Currency. The Fund may use foreign currency contracts to facilitate transactions in foreign-denominated securities. Gains and losses from these transactions may arise from changes in the value of the foreign currency or if the counterparties do not perform under the contracts' terms.
Foreign-denominated assets, including investment securities, and liabilities are translated into U.S. dollars at the exchange rates at period end. Purchases and sales of investment securities, income and dividends received and expenses denominated in foreign currencies are translated into U.S. dollars at the exchange rate in effect on the transaction date.
The effects of exchange rate fluctuations on investments are included with the net realized and unrealized gain (loss) on investment securities. Other foreign currency transactions resulting in realized and unrealized gain (loss) are disclosed separately.
Investment Transactions and Income. For financial reporting purposes, the Fund's investment holdings and NAV include trades executed through the end of the last business day of the period. The NAV per share for processing shareholder transactions is calculated as of the close of business of the New York Stock Exchange (NYSE), normally 4:00 p.m. Eastern time and includes trades executed through the end of the prior business day. Gains and losses on securities sold are determined on the basis of identified cost. Dividend income is recorded on the ex-dividend date, except for certain dividends from foreign securities where the ex-dividend date may have passed, which are recorded as soon as the Fund is informed of the ex-dividend date. Non-cash dividends included in dividend income, if any, are recorded at the fair market value of the securities received. Income and capital gain distributions from Fidelity Central Funds, if any, are recorded on the ex-dividend date. Certain distributions received by the Fund represent a return of capital or capital gain. The Fund determines the components of these distributions subsequent to the ex-dividend date, based upon receipt of tax filings or other correspondence relating to the underlying investment. These distributions are recorded as a reduction of cost of investments and/or as a realized gain. Investment income is recorded net of foreign taxes withheld where recovery of such taxes is uncertain.
Class Allocations and Expenses. Investment income, realized and unrealized capital gains and losses, common expenses of the Fund, and certain fund-level expense reductions, if any, are allocated daily on a pro-rata basis to each class based on the relative net assets of each class to the total net assets of the Fund. Each class differs with respect to transfer agent fees incurred. Certain expense reductions may also differ by class. For the reporting period, the allocated portion of income and expenses to each class as a percent of its average net assets may vary due to the timing of recording these transactions in relation to fluctuating net assets of the classes. Expenses directly attributable to a fund are charged to that fund. Expenses attributable to more than one fund are allocated among the respective funds on the basis of relative net assets or other appropriate methods. Expense estimates are accrued in the period to which they relate and adjustments are made when actual amounts are known.
Income Tax Information and Distributions to Shareholders. Each year, the Fund intends to qualify as a regulated investment company under Subchapter M of the Internal Revenue Code, including distributing substantially all of its taxable income and realized gains. As a result, no provision for U.S. Federal income taxes is required. As of December 31, 2019, the Fund did not have any unrecognized tax benefits in the financial statements; nor is the Fund aware of any tax positions for which it is reasonably possible that the total amounts of unrecognized tax benefits will significantly change in the next twelve months. The Fund files a U.S. federal tax return, in addition to state and local tax returns as required. The Fund's federal income tax returns are subject to examination by the Internal Revenue Service (IRS) for a period of three fiscal years after they are filed. State and local tax returns may be subject to examination for an additional fiscal year depending on the jurisdiction. Foreign taxes are provided for based on the Fund's understanding of the tax rules and rates that exist in the foreign markets in which it invests.
Distributions are declared and recorded on the ex-dividend date. Income and capital gain distributions are declared separately for each class. Income and capital gain distributions are determined in accordance with income tax regulations, which may differ from GAAP.
Capital accounts within the financial statements are adjusted for permanent book-tax differences. These adjustments have no impact on net assets or the results of operations. Capital accounts are not adjusted for temporary book-tax differences which will reverse in a subsequent period.
Book-tax differences are primarily due to foreign currency transactions and losses deferred due to wash sales.
As of period end, the cost and unrealized appreciation (depreciation) in securities, and derivatives if applicable, for federal income tax purposes were as follows:
| Gross unrealized appreciation | $41,878,180 |
| Gross unrealized depreciation | (1,885,181) |
| Net unrealized appreciation (depreciation) | $39,992,999 |
| Tax Cost | $131,555,444 |
The tax-based components of distributable earnings as of period end were as follows:
| Undistributed ordinary income | $995,136 |
| Undistributed long-term capital gain | $8,699,705 |
| Net unrealized appreciation (depreciation) on securities and other investments | $39,992,999 |
The tax character of distributions paid was as follows:
| | December 31, 2019 | December 31, 2018 |
| Ordinary Income | $3,586,268 | $ 2,635,169 |
| Long-term Capital Gains | 16,081,569 | 6,860,678 |
| Total | $19,667,837 | $ 9,495,847 |
4. Purchases and Sales of Investments.
Purchases and sales of securities, other than short-term securities, aggregated $210,441,900 and $235,117,208, respectively.
5. Fees and Other Transactions with Affiliates.
Management Fee. Fidelity SelectCo, LLC (the investment adviser) and its affiliates provide the Fund with investment management related services for which the Fund pays a monthly management fee. The management fee is the sum of an individual fund fee rate that is based on an annual rate of .30% of the Fund's average net assets and an annualized group fee rate that averaged .24% during the period. The group fee rate is based upon the average net assets of all the mutual funds advised by Fidelity Management & Research Company (FMR) and the investment adviser. The group fee rate decreases as assets under management increase and increases as assets under management decrease. For the reporting period, the total annual management fee rate was .54% of the Fund's average net assets.
Transfer Agent Fees. Fidelity Investments Institutional Operations Company, Inc. (FIIOC), an affiliate of the investment adviser, is the Fund's transfer, dividend disbursing, and shareholder servicing agent. FIIOC receives an asset-based fee with respect to each class. Each class pays a fee for transfer agent services, typesetting and printing and mailing of shareholder reports, excluding mailing of proxy statements, equal to an annual rate of class-level average net assets. The annual rate for Investor Class is .15% and the annual rate for all other classes is .07%. For the period, transfer agent fees for each class were as follows:
| Initial Class | $22,465 |
| Investor Class | 204,498 |
| | $226,963 |
Accounting and Security Lending Fees. Fidelity Service Company, Inc. (FSC), an affiliate of the investment adviser, maintains the Fund's accounting records. The accounting fee is based on the level of average net assets for each month. Prior to April 1, 2019, FSC had a separate agreement with the Fund for administration of the security lending program, based on the number and duration of lending transactions. For the period, the total fees paid for accounting and administration of securities lending were equivalent to the following annual rates:
| | % of Average Net Assets |
| VIP Industrials Portfolio | .04 |
Brokerage Commissions. A portion of portfolio transactions were placed with brokerage firms which are affiliates of the investment adviser. Brokerage commissions are included in net realized gain (loss) and change in net unrealized appreciation (depreciation) in the Statement of Operations. The commissions paid to these affiliated firms were as follows:
| | Amount |
| VIP Industrials Portfolio | $4,477 |
Interfund Trades. The Fund may purchase from or sell securities to other Fidelity Funds under procedures adopted by the Board. The procedures have been designed to ensure these interfund trades are executed in accordance with Rule 17a-7 of the 1940 Act. Interfund trades are included within the respective purchases and sales amounts shown in the Purchases and Sales of Investments note.
6. Committed Line of Credit.
The Fund participates with other funds managed by the investment adviser or an affiliate in a $4.25 billion credit facility (the "line of credit") to be utilized for temporary or emergency purposes to fund shareholder redemptions or for other short-term liquidity purposes. The Fund has agreed to pay commitment fees on its pro-rata portion of the line of credit, which amounted to $474 and is reflected in Miscellaneous expenses on the Statement of Operations. During the period, the Fund did not borrow on this line of credit.
7. Security Lending.
The Fund lends portfolio securities from time to time in order to earn additional income. For equity securities, lending agents are used, including National Financial Services (NFS), an affiliate of the Fund. Pursuant to a securities lending agreement, NFS will receive a fee, which is capped at 9.9% of daily lending revenue, for its services as lending agent. The Fund may lend securities to certain qualified borrowers. On the settlement date of the loan, the Fund receives collateral (in the form of U.S. Treasury obligations, letters of credit and/or cash) against the loaned securities and maintains collateral in an amount not less than 100% of the market value of the loaned securities during the period of the loan. The market value of the loaned securities is determined at the close of business of the Fund and any additional required collateral is delivered to the Fund on the next business day. The Fund or borrower may terminate the loan at any time, and if the borrower defaults on its obligation to return the securities loaned because of insolvency or other reasons, the Fund may apply collateral received from the borrower against the obligation. The Fund may experience delays and costs in recovering the securities loaned. Any cash collateral received is invested in the Fidelity Securities Lending Cash Central Fund. At period end, there were no security loans outstanding. Total fees paid by the Fund to NFS amounted to $54. Security lending income represents the income earned on investing cash collateral, less rebates paid to borrowers and any lending agent fees associated with the loan, plus any premium payments received for lending certain types of securities. Security lending income is presented in the Statement of Operations as a component of income from Fidelity Central Funds.
8. Expense Reductions.
Commissions paid to certain brokers with whom the investment adviser, or its affiliates, places trades on behalf of the Fund include an amount in addition to trade execution, which may be rebated back to the Fund to offset certain expenses. This amount totaled $12,112 for the period
In addition, during the period the investment adviser reimbursed and/or waived a portion of fund-level operating expenses in the amount of $1,296.
9. Distributions to Shareholders.
Distributions to shareholders of each class were as follows:
| | Year ended
December 31, 2019 | Year ended
December 31, 2018 |
| Distributions to shareholders | | |
| Initial Class | $3,891,823 | $1,914,706 |
| Investor Class | 15,776,014 | 7,581,141 |
| Total | $19,667,837 | $9,495,847 |
10. Share Transactions.
Transactions for each class of shares were as follows:
| | Shares | Shares | Dollars | Dollars |
| | Year ended December 31, 2019 | Year ended December 31, 2018 | Year ended December 31, 2019 | Year ended December 31, 2018 |
| Initial Class | | | | |
| Shares sold | 108,846 | 64,045 | $2,291,076 | $1,518,621 |
| Reinvestment of distributions | 193,797 | 87,878 | 3,891,823 | 1,914,706 |
| Shares redeemed | (404,087) | (399,316) | (8,510,261) | (9,006,877) |
| Net increase (decrease) | (101,444) | (247,393) | $(2,327,362) | $(5,573,550) |
| Investor Class | | | | |
| Shares sold | 721,706 | 548,185 | $15,083,378 | $12,933,255 |
| Reinvestment of distributions | 791,476 | 349,657 | 15,776,014 | 7,581,141 |
| Shares redeemed | (1,653,102) | (1,785,165) | (34,515,902) | (39,894,300) |
| Net increase (decrease) | (139,920) | (887,323) | $(3,656,510) | $(19,379,904) |
11. Other.
The Fund's organizational documents provide former and current trustees and officers with a limited indemnification against liabilities arising in connection with the performance of their duties to the Fund. In the normal course of business, the Fund may also enter into contracts that provide general indemnifications. The Fund's maximum exposure under these arrangements is unknown as this would be dependent on future claims that may be made against the Fund. The risk of material loss from such claims is considered remote.
At the end of the period, the investment adviser or its affiliates were the owners of record of 100% of the total outstanding shares of the Fund.
Effective January 1, 2020, following any required regulatory notices and approvals:
Investment advisers Fidelity Investments Money Management, Inc., FMR Co., Inc., and Fidelity SelectCo, LLC, merged with and into Fidelity Management & Research Company. In connection with the merger transactions, the resulting, merged investment adviser was then redomiciled from Massachusetts to Delaware, changed its corporate structure from a corporation to a limited liability company, and changed its name to "Fidelity Management & Research Company LLC".
Fidelity Investments Institutional Operations Company, Inc. (FIIOC) converted from a Massachusetts corporation to a Massachusetts LLC, and changed its name to "Fidelity Investments Institutional Operations Company LLC".
Report of Independent Registered Public Accounting Firm
To the Board of Trustees of Variable Insurance Products Fund IV and Shareholders of VIP Industrials Portfolio:
Opinion on the Financial Statements
We have audited the accompanying statement of assets and liabilities, including the schedule of investments, of VIP Industrials Portfolio (one of the funds constituting Variable Insurance Products Fund IV, referred to hereafter as the “Fund”) as of December 31, 2019, the related statement of operations for the year ended December 31, 2019, the statement of changes in net assets for each of the two years in the period ended December 31, 2019, including the related notes, and the financial highlights for each of the five years in the period ended December 31, 2019 (collectively referred to as the “financial statements”). In our opinion, the financial statements present fairly, in all material respects, the financial position of the Fund as of December 31, 2019, the results of its operations for the year then ended, the changes in its net assets for each of the two years in the period ended December 31, 2019 and the financial highlights for each of the five years in the period ended December 31, 2019 in conformity with accounting principles generally accepted in the United States of America.
Basis for Opinion
These financial statements are the responsibility of the Fund’s management. Our responsibility is to express an opinion on the Fund’s financial statements based on our audits. We are a public accounting firm registered with the Public Company Accounting Oversight Board (United States) (PCAOB) and are required to be independent with respect to the Fund in accordance with the U.S. federal securities laws and the applicable rules and regulations of the Securities and Exchange Commission and the PCAOB.
We conducted our audits of these financial statements in accordance with the standards of the PCAOB. Those standards require that we plan and perform the audit to obtain reasonable assurance about whether the financial statements are free of material misstatement, whether due to error or fraud.
Our audits included performing procedures to assess the risks of material misstatement of the financial statements, whether due to error or fraud, and performing procedures that respond to those risks. Such procedures included examining, on a test basis, evidence regarding the amounts and disclosures in the financial statements. Our audits also included evaluating the accounting principles used and significant estimates made by management, as well as evaluating the overall presentation of the financial statements. Our procedures included confirmation of securities owned as of December 31, 2019 by correspondence with the custodian and brokers; when replies were not received from brokers, we performed other auditing procedures. We believe that our audits provide a reasonable basis for our opinion.
PricewaterhouseCoopers LLP
Boston, Massachusetts
February 13, 2020
We have served as the auditor of one or more investment companies in the Fidelity group of funds since 1932.
Trustees and Officers
The Trustees, Members of the Advisory Board (if any), and officers of the trust and fund, as applicable, are listed below. The Board of Trustees governs the fund and is responsible for protecting the interests of shareholders. The Trustees are experienced executives who meet periodically throughout the year to oversee the fund's activities, review contractual arrangements with companies that provide services to the fund, oversee management of the risks associated with such activities and contractual arrangements, and review the fund's performance. Except for Michael E. Wiley, each of the Trustees oversees 302 funds. Mr. Wiley oversees 199 funds.
The Trustees hold office without limit in time except that (a) any Trustee may resign; (b) any Trustee may be removed by written instrument, signed by at least two-thirds of the number of Trustees prior to such removal; (c) any Trustee who requests to be retired or who has become incapacitated by illness or injury may be retired by written instrument signed by a majority of the other Trustees; and (d) any Trustee may be removed at any special meeting of shareholders by a two-thirds vote of the outstanding voting securities of the trust. Each Trustee who is not an interested person (as defined in the Investment Company Act of 1940 (1940 Act)) of the trust and the fund is referred to herein as an Independent Trustee. Each Independent Trustee shall retire not later than the last day of the calendar year in which his or her 75th birthday occurs. The Independent Trustees may waive this mandatory retirement age policy with respect to individual Trustees. Officers and Advisory Board Members hold office without limit in time, except that any officer or Advisory Board Member may resign or may be removed by a vote of a majority of the Trustees at any regular meeting or any special meeting of the Trustees. Except as indicated, each individual has held the office shown or other offices in the same company for the past five years.
The fund’s Statement of Additional Information (SAI) includes more information about the Trustees. To request a free copy, call Fidelity at 1-877-208-0098.
Experience, Skills, Attributes, and Qualifications of the Trustees. The Governance and Nominating Committee has adopted a statement of policy that describes the experience, qualifications, attributes, and skills that are necessary and desirable for potential Independent Trustee candidates (Statement of Policy). The Board believes that each Trustee satisfied at the time he or she was initially elected or appointed a Trustee, and continues to satisfy, the standards contemplated by the Statement of Policy. The Governance and Nominating Committee also engages professional search firms to help identify potential Independent Trustee candidates who have the experience, qualifications, attributes, and skills consistent with the Statement of Policy. From time to time, additional criteria based on the composition and skills of the current Independent Trustees, as well as experience or skills that may be appropriate in light of future changes to board composition, business conditions, and regulatory or other developments, have also been considered by the professional search firms and the Governance and Nominating Committee. In addition, the Board takes into account the Trustees' commitment and participation in Board and committee meetings, as well as their leadership of standing and ad hoc committees throughout their tenure.
In determining that a particular Trustee was and continues to be qualified to serve as a Trustee, the Board has considered a variety of criteria, none of which, in isolation, was controlling. The Board believes that, collectively, the Trustees have balanced and diverse experience, qualifications, attributes, and skills, which allow the Board to operate effectively in governing the fund and protecting the interests of shareholders. Information about the specific experience, skills, attributes, and qualifications of each Trustee, which in each case led to the Board's conclusion that the Trustee should serve (or continue to serve) as a trustee of the fund, is provided below.
Board Structure and Oversight Function. James C. Curvey is an interested person and currently serves as Chairman. The Trustees have determined that an interested Chairman is appropriate and benefits shareholders because an interested Chairman has a personal and professional stake in the quality and continuity of services provided to the fund. Independent Trustees exercise their informed business judgment to appoint an individual of their choosing to serve as Chairman, regardless of whether the Trustee happens to be independent or a member of management. The Independent Trustees have determined that they can act independently and effectively without having an Independent Trustee serve as Chairman and that a key structural component for assuring that they are in a position to do so is for the Independent Trustees to constitute a substantial majority for the Board. The Independent Trustees also regularly meet in executive session. Ned C. Lautenbach serves as Chairman of the Independent Trustees and as such (i) acts as a liaison between the Independent Trustees and management with respect to matters important to the Independent Trustees and (ii) with management prepares agendas for Board meetings.
Fidelity® funds are overseen by different Boards of Trustees. The fund's Board oversees Fidelity's high income and certain equity funds, and other Boards oversee Fidelity's investment-grade bond, money market, asset allocation, and other equity funds. The asset allocation funds may invest in Fidelity® funds overseen by the fund's Board. The use of separate Boards, each with its own committee structure, allows the Trustees of each group of Fidelity® funds to focus on the unique issues of the funds they oversee, including common research, investment, and operational issues. On occasion, the separate Boards establish joint committees to address issues of overlapping consequences for the Fidelity® funds overseen by each Board.
The Trustees operate using a system of committees to facilitate the timely and efficient consideration of all matters of importance to the Trustees, the fund, and fund shareholders and to facilitate compliance with legal and regulatory requirements and oversight of the fund's activities and associated risks. The Board, acting through its committees, has charged FMR and its affiliates with (i) identifying events or circumstances the occurrence of which could have demonstrably adverse effects on the fund's business and/or reputation; (ii) implementing processes and controls to lessen the possibility that such events or circumstances occur or to mitigate the effects of such events or circumstances if they do occur; and (iii) creating and maintaining a system designed to evaluate continuously business and market conditions in order to facilitate the identification and implementation processes described in (i) and (ii) above. Because the day-to-day operations and activities of the fund are carried out by or through FMR, its affiliates, and other service providers, the fund's exposure to risks is mitigated but not eliminated by the processes overseen by the Trustees. While each of the Board's committees has responsibility for overseeing different aspects of the fund's activities, oversight is exercised primarily through the Operations, Audit, and Compliance Committees. Appropriate personnel, including but not limited to the fund's Chief Compliance Officer (CCO), FMR's internal auditor, the independent accountants, the fund's Treasurer and portfolio management personnel, make periodic reports to the Board's committees, as appropriate, including an annual review of Fidelity's risk management program for the Fidelity® funds. The responsibilities of each standing committee, including their oversight responsibilities, are described further under "Standing Committees of the Trustees."
Interested Trustees*:
Correspondence intended for a Trustee who is an interested person may be sent to Fidelity Investments, 245 Summer Street, Boston, Massachusetts 02210.
Name, Year of Birth; Principal Occupations and Other Relevant Experience+
James C. Curvey (1935)
Year of Election or Appointment: 2018
Trustee
Chairman of the Board of Trustees
Mr. Curvey also serves as Trustee of other Fidelity® funds. Mr. Curvey is Vice Chairman (2007-present) and Director of FMR LLC (diversified financial services company). In addition, Mr. Curvey is an Overseer Emeritus for the Boston Symphony Orchestra, a Director of Artis-Naples, and a Trustee of Brewster Academy in Wolfeboro, New Hampshire. Previously, Mr. Curvey served as a Director of Fidelity Research & Analysis Co. (investment adviser firm, 2009-2018), Director of Fidelity Investments Money Management, Inc. (investment adviser firm, 2009-2014) and a Director of FMR and FMR Co., Inc. (investment adviser firms, 2007-2014).
* Determined to be an “Interested Trustee” by virtue of, among other things, his or her affiliation with the trust or various entities under common control with FMR.
+ The information includes the Trustee's principal occupation during the last five years and other information relating to the experience, attributes, and skills relevant to the Trustee's qualifications to serve as a Trustee, which led to the conclusion that the Trustee should serve as a Trustee for the fund.
Independent Trustees:
Correspondence intended for an Independent Trustee may be sent to Fidelity Investments, P.O. Box 55235, Boston, Massachusetts 02205-5235.
Name, Year of Birth; Principal Occupations and Other Relevant Experience+
Dennis J. Dirks (1948)
Year of Election or Appointment: 2018
Trustee
Mr. Dirks also serves as Trustee of other Fidelity® funds. Prior to his retirement in May 2003, Mr. Dirks was Chief Operating Officer and a member of the Board of The Depository Trust & Clearing Corporation (DTCC). He also served as President, Chief Operating Officer, and Board member of The Depository Trust Company (DTC) and President and Board member of the National Securities Clearing Corporation (NSCC). In addition, Mr. Dirks served as Chief Executive Officer and Board member of the Government Securities Clearing Corporation, Chief Executive Officer and Board member of the Mortgage-Backed Securities Clearing Corporation, as a Trustee and a member of the Finance Committee of Manhattan College (2005-2008), as a Trustee and a member of the Finance Committee of AHRC of Nassau County (2006-2008), as a member of the Independent Directors Council (IDC) Governing Council (2010-2015), and as a member of the Board of Directors for The Brookville Center for Children’s Services, Inc. (2009-2017). Mr. Dirks is a member of the Finance Committee (2016-present) and Board of Directors (2017-present) and is Treasurer (2018-present) of the Asolo Repertory Theatre.
Donald F. Donahue (1950)
Year of Election or Appointment: 2018
Trustee
Mr. Donahue also serves as a Trustee of other Fidelity® funds. Mr. Donahue is President and Chief Executive Officer of Miranda Partners, LLC (risk consulting for the financial services industry, 2012-present). Previously, Mr. Donahue served as a Member of the Advisory Board of certain Fidelity® funds (2015-2018) and Chief Executive Officer (2006-2012), Chief Operating Officer (2003-2006), and Managing Director, Customer Marketing and Development (1999-2003) of The Depository Trust & Clearing Corporation (financial markets infrastructure). Mr. Donahue serves as a Member (2007-present) and Co-Chairman (2016-present) of the Board of Directors of United Way of New York, Member of the Board of Directors of NYC Leadership Academy (2012-present) and Member of the Board of Advisors of Ripple Labs, Inc. (financial services, 2015-present). He also served as Chairman (2010-2012) and Member of the Board of Directors (2012-2013) of Omgeo, LLC (financial services), Treasurer of United Way of New York (2012-2016), and Member of the Board of Directors of XBRL US (financial services non-profit, 2009-2012) and the International Securities Services Association (2009-2012).
Alan J. Lacy (1953)
Year of Election or Appointment: 2018
Trustee
Mr. Lacy also serves as Trustee of other Fidelity® funds. Mr. Lacy serves as a Director of Bristol-Myers Squibb Company (global pharmaceuticals, 2008-present). He is a Trustee of the California Chapter of The Nature Conservancy (2015-present) and a Director of the Center for Advanced Study in the Behavioral Sciences at Stanford University (2015-present). In addition, Mr. Lacy served as Senior Adviser (2007-2014) of Oak Hill Capital Partners, L.P. (private equity) and also served as Chief Executive Officer (2005) and Vice Chairman (2005-2006) of Sears Holdings Corporation (retail) and Chief Executive Officer and Chairman of the Board of Sears, Roebuck and Co. (retail, 2000-2005). Previously, Mr. Lacy served as Chairman (2014-2017) and a member (2010-2017) of the Board of Directors of Dave & Buster’s Entertainment, Inc. (restaurant and entertainment complexes), as Chairman (2008-2011) and a member (2006-2015) of the Board of Trustees of the National Parks Conservation Association, and as a member of the Board of Directors for The Hillman Companies, Inc. (hardware wholesalers, 2010-2014), Earth Fare, Inc. (retail grocery, 2010-2014), and The Western Union Company (global money transfer, 2006-2011).
Ned C. Lautenbach (1944)
Year of Election or Appointment: 2018
Trustee
Chairman of the Independent Trustees
Mr. Lautenbach also serves as Trustee of other Fidelity® funds. Mr. Lautenbach currently serves as Chair (2018-present) and Member (2013-present) of the Board of Governors, State University System of Florida and is a member of the Council on Foreign Relations (1994-present). He is also a member and has most recently served as Chairman of the Board of Directors of Artis-Naples (2012-present). Previously, Mr. Lautenbach served as a member and then Lead Director of the Board of Directors of Eaton Corporation (diversified industrial, 1997-2016). He was also a Partner and Advisory Partner at Clayton, Dubilier & Rice, LLC (private equity investment, 1998-2010), as well as a Director of Sony Corporation (2006-2007). In addition, Mr. Lautenbach also had a 30-year career with IBM (technology company) during which time he served as Senior Vice President and a member of the Corporate Executive Committee (1968-1998).
Joseph Mauriello (1944)
Year of Election or Appointment: 2018
Trustee
Mr. Mauriello also serves as Trustee of other Fidelity® funds. Prior to his retirement in January 2006, Mr. Mauriello served in numerous senior management positions including Deputy Chairman and Chief Operating Officer (2004-2005), and Vice Chairman of Financial Services (2002-2004) of KPMG LLP US (professional services, 1965-2005). Mr. Mauriello currently serves as a member of the Independent Directors Council (IDC) Governing Council (2015-present). Previously, Mr. Mauriello served as a member of the Board of Directors of XL Group plc. (global insurance and re-insurance, 2006-2018).
Cornelia M. Small (1944)
Year of Election or Appointment: 2018
Trustee
Ms. Small also serves as Trustee of other Fidelity® funds. Ms. Small is a member of the Board of Directors (2009-present) and Chair of the Investment Committee (2010-present) of the Teagle Foundation. Ms. Small also serves on the Investment Committee of the Berkshire Taconic Community Foundation (2008-present). Previously, Ms. Small served as Chairperson (2002-2008) and a member of the Investment Committee and Chairperson (2008-2012) and a member of the Board of Trustees of Smith College. In addition, Ms. Small served as Chief Investment Officer, Director of Global Equity Investments, and a member of the Board of Directors of Scudder, Stevens & Clark and Scudder Kemper Investments.
Garnett A. Smith (1947)
Year of Election or Appointment: 2013
Trustee
Mr. Smith also serves as Trustee of other Fidelity® funds. Prior to Mr. Smith's retirement, he served as Chairman and Chief Executive Officer of Inbrand Corp. (manufacturer of personal absorbent products, 1990-1997). He also served as President (1986-1990) of Inbrand Corp. Prior to his employment with Inbrand Corp., he was employed by a retail fabric chain and North Carolina National Bank. In addition, Mr. Smith served as a Member of the Advisory Board of certain Fidelity® funds (2012-2013) and as a board member of the Jackson Hole Land Trust (2009-2012).
David M. Thomas (1949)
Year of Election or Appointment: 2018
Trustee
Mr. Thomas also serves as Trustee of other Fidelity® funds. Mr. Thomas serves as Non-Executive Chairman of the Board of Directors of Fortune Brands Home and Security (home and security products, 2011-present) and as a member of the Board of Directors (2004-present) and Presiding Director (2013-present) of Interpublic Group of Companies, Inc. (marketing communication). Previously, Mr. Thomas served as Executive Chairman (2005-2006) and Chairman and Chief Executive Officer (2000-2005) of IMS Health, Inc. (pharmaceutical and healthcare information solutions), a Director of Fortune Brands, Inc. (consumer products, 2000-2011), and a member of the Board of Trustees of the University of Florida (2013-2018).
Michael E. Wiley (1950)
Year of Election or Appointment: 2008
Trustee
Mr. Wiley also serves as Trustee or Member of the Advisory Board of other Fidelity® funds. Mr. Wiley serves as a Director of High Point Resources (exploration and production, 2005-present). Previously, Mr. Wiley served as a Director of Andeavor Corporation (independent oil refiner and marketer, 2005-2018), a Director of Andeavor Logistics LP (natural resources logistics, 2015-2018), a Director of Post Oak Bank (privately-held bank, 2004-2018), a Director of Asia Pacific Exploration Consolidated (international oil and gas exploration and production, 2008-2013), a member of the Board of Trustees of the University of Tulsa (2000-2006; 2007-2010), a Senior Energy Advisor of Katzenbach Partners, LLC (consulting, 2006-2007), an Advisory Director of Riverstone Holdings (private investment), a Director of Spinnaker Exploration Company (exploration and production, 2001-2005) and Chairman, President, and CEO of Baker Hughes, Inc. (oilfield services, 2000-2004).
+ The information includes the Trustee's principal occupation during the last five years and other information relating to the experience, attributes, and skills relevant to the Trustee's qualifications to serve as a Trustee, which led to the conclusion that the Trustee should serve as a Trustee for the fund.
Advisory Board Members and Officers:
Correspondence intended for a Member of the Advisory Board (if any) may be sent to Fidelity Investments, P.O. Box 55235, Boston, Massachusetts 02205-5235. Correspondence intended for an officer or Peter S. Lynch may be sent to Fidelity Investments, 245 Summer Street, Boston, Massachusetts 02210. Officers appear below in alphabetical order.
Name, Year of Birth; Principal Occupation
Vicki L. Fuller (1957)
Year of Election or Appointment: 2018
Member of the Advisory Board
Ms. Fuller also serves as Member of the Advisory Board of other Fidelity® funds. Ms. Fuller serves as a member of the Board of Directors, Audit Committee, and Nominating and Governance Committee of The Williams Companies, Inc. (natural gas infrastructure, 2018-present). Previously, Ms. Fuller served as the Chief Investment Officer of the New York State Common Retirement Fund (2012-2018) and held a variety of positions at AllianceBernstein L.P. (global asset management, 1985-2012), including Managing Director (2006-2012) and Senior Vice President and Senior Portfolio Manager (2001-2006).
Patricia L. Kampling (1959)
Year of Election or Appointment: 2020
Member of the Advisory Board
Ms. Kampling also serves as Member of the Advisory Board of other Fidelity® funds. Prior to her retirement, Ms. Kampling served as Chairman of the Board and Chief Executive Officer (2012-2019), President and Chief Operating Officer (2011-2012) and Executive Vice President and Chief Financial Officer (2010-2011) of Alliant Energy Corporation. Ms. Kampling currently serves as a member of the Board, Compensation Committee and Executive Committee and as Chair of the Audit Committee of Briggs & Stratton Corporation (manufacturing, 2011-present) and as a member of the Board, Audit, Finance and Risk Committee and Safety, Environmental, Technology and Operations Committee of American Water Works Company, Inc. (utilities company, 2019-present). In addition, Ms. Kampling currently serves as a member of the Board of the Nature Conservancy, Wisconsin Chapter (2019-present). Previously, Ms. Kampling served as a member of the Board of Interstate Power and Light Company (2012-2019) and Wisconsin Power and Light Company (2012-2019) (each a subsidiary of Alliant Energy Corporation) and as a member of the Board and Workforce Development Committee of the Business Roundtable (2018-2019).
Peter S. Lynch (1944)
Year of Election or Appointment: 2018
Member of the Advisory Board
Mr. Lynch also serves as Member of the Advisory Board of other Fidelity® funds. Mr. Lynch is Vice Chairman and a Director of Fidelity Management & Research Company LLC (investment adviser firm). In addition, Mr. Lynch serves as a Trustee of Boston College and as the Chairman of the Inner-City Scholarship Fund. Previously, Mr. Lynch served as Vice Chairman and a Director of FMR Co., Inc. (investment adviser firm) and on the Special Olympics International Board of Directors (1997-2006).
Susan Tomasky (1953)
Year of Election or Appointment: 2020
Member of the Advisory Board
Ms. Tomasky also serves as Member of the Advisory Board of other Fidelity® funds. Prior to her retirement, Ms. Tomasky served in various executive officer positions at American Electric Power Company, Inc. (1998-2011), including most recently as President of AEP Transmission (2007-2011). Ms. Tomasky currently serves as a member of the Board and Sustainability Committee and as Chair of the Audit Committee of Marathon Petroleum Corporation (2018-present) and as a member of the Board, Corporate Governance Committee and Organization and Compensation Committee and as Chair of the Audit Committee of Public Service Enterprise Group, Inc. (utilities company, 2012-present). In addition, Ms. Tomasky currently serves as a member of the Board of the Columbus Regional Airport Authority (2007-present), as a member of the Board of the Royal Shakespeare Company – America (2009-present), as a member of the Board of the Columbus Association for the Performing Arts (2011-present) and as a member of the Board of Kenyon College (2016-present). Previously, Ms. Tomasky served as a member of the Board (2011-2019) and as Lead Independent Director (2015-2018) of Andeavor Corporation (previously Tesoro Corporation) (independent oil refiner and marketer) and as a member of the Board of Summit Midstream Partners LP (energy, 2012-2018).
Elizabeth Paige Baumann (1968)
Year of Election or Appointment: 2017
Anti-Money Laundering (AML) Officer
Ms. Baumann also serves as AML Officer of other funds. She is Chief AML Officer (2012-present) and Senior Vice President (2014-present) of FMR LLC (diversified financial services company) and is an employee of Fidelity Investments. Previously, Ms. Baumann served as AML Officer of the funds (2012-2016), and Vice President (2007-2014) and Deputy Anti-Money Laundering Officer (2007-2012) of FMR LLC.
Craig S. Brown (1977)
Year of Election or Appointment: 2019
Assistant Treasurer
Mr. Brown also serves as Assistant Treasurer of other funds. Mr. Brown is an employee of Fidelity Investments (2013-present).
John J. Burke III (1964)
Year of Election or Appointment: 2018
Chief Financial Officer
Mr. Burke also serves as Chief Financial Officer of other funds. Mr. Burke serves as Head of Investment Operations for Fidelity Fund and Investment Operations (2018-present) and is an employee of Fidelity Investments (1998-present). Previously Mr. Burke served as head of Asset Management Investment Operations (2012-2018).
William C. Coffey (1969)
Year of Election or Appointment: 2019
Assistant Secretary
Mr. Coffey also serves as Assistant Secretary of other funds. He is Senior Vice President and Deputy General Counsel of FMR LLC (diversified financial services company, 2010-present), and is an employee of Fidelity Investments. Previously, Mr. Coffey served as Secretary and CLO of certain funds (2018-2019); CLO, Secretary, and Senior Vice President of Fidelity Management & Research Company and FMR Co., Inc. (investment adviser firms, 2018-2019); Secretary of Fidelity SelectCo, LLC and Fidelity Investments Money Management, Inc. (investment adviser firms, 2018-2019); CLO of Fidelity Management & Research (Hong Kong) Limited, FMR Investment Management (UK) Limited, and Fidelity Management & Research (Japan) Limited (investment adviser firms, 2018-2019); and Assistant Secretary of certain funds (2009-2018).
Timothy M. Cohen (1969)
Year of Election or Appointment: 2018
Vice President
Mr. Cohen also serves as Vice President of other funds. Mr. Cohen serves as Co-Head of Equity (2018-present), a Director of Fidelity Management & Research (Japan) Limited (investment adviser firm, 2016-present), and is an employee of Fidelity Investments. Previously, Mr. Cohen served as Executive Vice President of Fidelity SelectCo, LLC (2019), Head of Global Equity Research (2016-2018), Chief Investment Officer - Equity and a Director of Fidelity Management & Research (U.K.) Inc. (investment adviser firm, 2013-2015) and as a Director of Fidelity Management & Research (Hong Kong) Limited (investment adviser firm, 2017).
Jonathan Davis (1968)
Year of Election or Appointment: 2010
Assistant Treasurer
Mr. Davis also serves as Assistant Treasurer of other funds. Mr. Davis serves as Assistant Treasurer of FMR Capital, Inc. (2017-present) and is an employee of Fidelity Investments. Previously, Mr. Davis served as Vice President and Associate General Counsel of FMR LLC (diversified financial services company, 2003-2010).
Laura M. Del Prato (1964)
Year of Election or Appointment: 2018
Assistant Treasurer
Ms. Del Prato also serves as an officer of other funds. Ms. Del Prato is an employee of Fidelity Investments (2017-present). Prior to joining Fidelity Investments, Ms. Del Prato served as a Managing Director and Treasurer of the JPMorgan Mutual Funds (2014-2017). Prior to JPMorgan, Ms. Del Prato served as a partner at Cohen Fund Audit Services (accounting firm, 2012-2013) and KPMG LLP (accounting firm, 2004-2012).
Colm A. Hogan (1973)
Year of Election or Appointment: 2020
Assistant Treasurer
Mr. Hogan also serves as an officer of other funds. Mr. Hogan serves as Assistant Treasurer of FMR Capital, Inc. (2017-present) and is an employee of Fidelity Investments (2005-present). Previously, Mr. Hogan served as Deputy Treasurer of certain Fidelity® funds (2016-2020) and Assistant Treasurer of certain Fidelity® funds (2016-2018).
Pamela R. Holding (1964)
Year of Election or Appointment: 2018
Vice President
Ms. Holding also serves as Vice President of other funds. Ms. Holding serves as Co-Head of Equity (2018-present) and is an employee of Fidelity Investments (2013-present). Previously, Ms. Holding served as Executive Vice President of Fidelity SelectCo, LLC (2019) and as Chief Investment Officer of Fidelity Institutional Asset Management (2013-2018).
Cynthia Lo Bessette (1969)
Year of Election or Appointment: 2019
Secretary and Chief Legal Officer (CLO)
Ms. Lo Bessette also serves as an officer of other funds. Ms. Lo Bessette serves as CLO, Secretary, and Senior Vice President of Fidelity Management & Research Company LLC (investment adviser firm, 2019-present); and CLO of Fidelity Management & Research (Hong Kong) Limited, FMR Investment Management (UK) Limited, and Fidelity Management & Research (Japan) Limited (investment adviser firms, 2019-present). She is a Senior Vice President and Deputy General Counsel of FMR LLC (diversified financial services company, 2019-present), and is an employee of Fidelity Investments. Previously, Ms. Lo Bessette served as CLO, Secretary, and Senior Vice President of FMR Co., Inc. (investment adviser firm, 2019); Secretary of Fidelity SelectCo, LLC and Fidelity Investments Money Management, Inc. (investment adviser firms, 2019). Prior to joining Fidelity Investments, Ms. Lo Bessette was Executive Vice President, General Counsel (2016-2019) and Senior Vice President, Deputy General Counsel (2015-2016) of OppenheimerFunds (investment management company) and Deputy Chief Legal Officer (2013-2015) of Jennison Associates LLC (investment adviser firm).
Chris Maher (1972)
Year of Election or Appointment: 2020
Deputy Treasurer
Mr. Maher also serves as an officer of other funds. Mr. Maher serves as Assistant Treasurer of FMR Capital, Inc. (2017-present), and is an employee of Fidelity Investments (2008-present). Previously, Mr. Maher served as Assistant Treasurer of certain funds (2013-2020); Vice President of Asset Management Compliance (2013), Vice President of the Program Management Group of FMR (investment adviser firm, 2010-2013), and Vice President of Valuation Oversight (2008-2010).
Kenneth B. Robins (1969)
Year of Election or Appointment: 2018
Chief Compliance Officer
Mr. Robins also serves as an officer of other funds. Mr. Robins serves as Compliance Officer of Fidelity Management & Research Company LLC (investment adviser firm, 2016-present) and is an employee of Fidelity Investments (2004-present). Previously, Mr. Robins served as Compliance Officer of FMR Co., Inc. (investment adviser firm, 2016-2019), as Executive Vice President of Fidelity Investments Money Management, Inc. (investment adviser firm, 2013-2016) and served in other fund officer roles.
Stacie M. Smith (1974)
Year of Election or Appointment: 2018
President and Treasurer
Ms. Smith also serves as an officer of other funds. Ms. Smith serves as Assistant Treasurer of FMR Capital, Inc. (2017-present), is an employee of Fidelity Investments (2009-present), and has served in other fund officer roles. Prior to joining Fidelity Investments, Ms. Smith served as Senior Audit Manager of Ernst & Young LLP (accounting firm, 1996-2009). Previously, Ms. Smith served as Assistant Treasurer (2013-2019) and Deputy Treasurer (2013-2016) of certain Fidelity® funds.
Marc L. Spector (1972)
Year of Election or Appointment: 2017
Assistant Treasurer
Mr. Spector also serves as an officer of other funds. Mr. Spector serves as Assistant Treasurer of FMR Capital, Inc. (2017-present) and is an employee of Fidelity Investments (2016-present). Prior to joining Fidelity Investments, Mr. Spector served as Director at the Siegfried Group (accounting firm, 2013-2016), and prior to Siegfried Group as audit senior manager at Deloitte & Touche (accounting firm, 2005-2013).
Jim Wegmann (1979)
Year of Election or Appointment: 2019
Assistant Treasurer
Mr. Wegmann also serves as Assistant Treasurer of other funds. Mr. Wegmann is an employee of Fidelity Investments (2011-present).
Shareholder Expense Example
As a shareholder of the Fund, you incur two types of costs: (1) transaction costs and (2) ongoing costs, including management fees and other Fund expenses. This Example is intended to help you understand your ongoing costs (in dollars) of investing in the Fund and to compare these costs with the ongoing costs of investing in other mutual funds.
The Example is based on an investment of $1,000 invested at the beginning of the period and held for the entire period (July 1, 2019 to December 31, 2019).
Actual Expenses
The first line of the accompanying table for each class of the Fund provides information about actual account values and actual expenses. You may use the information in this line, together with the amount you invested, to estimate the expenses that you paid over the period. Simply divide your account value by $1,000.00 (for example, an $8,600 account value divided by $1,000.00 = 8.6), then multiply the result by the number in the first line for a class of the Fund under the heading entitled "Expenses Paid During Period" to estimate the expenses you paid on your account during this period. The estimate of expenses does not include any fees or other expenses of any variable annuity or variable life insurance product. If they were, the estimate of expenses you paid during the period would be higher, and your ending account value would be lower. In addition, the Fund, as a shareholder in the underlying Fidelity Central Funds, will indirectly bear its pro-rata share of the fees and expenses incurred by the underlying Fidelity Central Funds. These fees and expenses are not included in the Fund's annualized expense ratio used to calculate the expense estimate in the table below.
Hypothetical Example for Comparison Purposes
The second line of the accompanying table for each class of the Fund provides information about hypothetical account values and hypothetical expenses based on a Class' actual expense ratio and an assumed rate of return of 5% per year before expenses, which is not the Class' actual return. The hypothetical account values and expenses may not be used to estimate the actual ending account balance or expenses you paid for the period. You may use this information to compare the ongoing costs of investing in the Fund and other funds. To do so, compare this 5% hypothetical example with the 5% hypothetical examples that appear in the shareholder reports of the other funds. The estimate of expenses does not include any fees or other expenses of any variable annuity or variable life insurance product. If they were, the estimate of expenses you paid during the period would be higher, and your ending account value would be lower. In addition, the Fund, as a shareholder in the underlying Fidelity Central Funds, will indirectly bear its pro-rata share of the fees and expenses incurred by the underlying Fidelity Central Funds. These fees and expenses are not included in the Fund's annualized expense ratio used to calculate the expense estimate in the table below.
Please note that the expenses shown in the table are meant to highlight your ongoing costs only and do not reflect any transaction costs. Therefore, the second line of the table is useful in comparing ongoing costs only, and will not help you determine the relative total costs of owning different funds.
| | Annualized Expense Ratio-A | Beginning
Account Value
July 1, 2019 | Ending
Account Value
December 31, 2019 | Expenses Paid
During Period-B
July 1, 2019
to December 31, 2019 |
| Initial Class | .67% | | | |
| Actual | | $1,000.00 | $1,031.70 | $3.43 |
| Hypothetical-C | | $1,000.00 | $1,021.83 | $3.41 |
| Investor Class | .75% | | | |
| Actual | | $1,000.00 | $1,031.30 | $3.84 |
| Hypothetical-C | | $1,000.00 | $1,021.42 | $3.82 |
A Annualized expense ratio reflects expenses net of applicable fee waivers.
B Expenses are equal to each Class' annualized expense ratio, multiplied by the average account value over the period, multiplied by 184/365 (to reflect the one-half year period).
C 5% return per year before expenses
Distributions (Unaudited)
The Board of Trustees of VIP Industrials Portfolio voted to pay to shareholders of record at the opening of business on record date, the following distributions per share derived from capital gains realized from sales of portfolio securities, and dividends derived from net investment income:
| | Pay Date | Record Date | Dividends | Capital Gains |
| VIP Industrials Portfolio | | | | |
| Initial Class | 02/07/20 | 02/07/20 | $0.068 | $1.179 |
| Investor Class | 02/07/20 | 02/07/20 | $0.065 | $1.179 |
|
The fund hereby designates as a capital gain dividend with respect to the taxable year ended December 31, 2019, $8,699,705, or, if subsequently determined to be different, the net capital gain of such year.
Initial Class designates 97%, and 88%; and Investor Class designates 100%, and 91%; of the dividends distributed in February and December 2019, respectively during the fiscal year as qualifying for the dividends–received deduction for corporate shareholders.
Board Approval of Investment Advisory Contracts
VIP Industrials Portfolio
At its November 2019 meeting, the Board of Trustees, including the Independent Trustees (together, the Board), voted to approve an amended and restated management contract and amended and restated sub-advisory agreements (together, the Amended and Restated Contracts) for the fund, effective January 1, 2020, for a one month period through January 31, 2020, in connection with an upcoming consolidation of certain of Fidelity's advisory businesses.
The Board considered that, on or about January 1, 2020, each of FMR Co., Inc. (FMRC), Fidelity Investments Money Management, Inc. (FIMM), and SelectCo, LLC (SelectCo) will merge with and into Fidelity Management & Research Company (FMR) and that, after the merger, FMR will redomicile as a Delaware limited liability company. The Board also approved the termination of the sub-advisory agreement with FMRC upon the completion of the merger. The Board noted that the Amended and Restated Contracts would be updated to reflect the renamed adviser, Fidelity Management & Research Company LLC and its new form of organization and domicile. The Board also noted that the Amended and Restated Contracts will not change the investment processes, the level or nature of services provided, the resources and personnel allocated, trading and compliance operations, or any fees or expenses paid by the fund.
The Board concluded that the fund's Amended and Restated Contracts are fair and reasonable, and that the fund's Advisory Contracts should be approved through January 31, 2020.
In connection with its consideration of future renewals of the fund's Amended and Restated Contracts, the Board will consider: (i) the nature, extent and quality of services provided to the fund, including shareholder and administrative services and investment performance; (ii) the competitiveness of the management fee and total expenses for the fund; (iii) the costs of the services and profitability, including the revenues earned and the expenses incurred in conducting the business of developing, marketing, distributing, managing, administering, and servicing the fund and its shareholders, to the extent applicable; and (iv) whether there have been economies of scale in respect of the Fidelity funds, whether the Fidelity funds (including the fund) have appropriately benefited from any such economies of scale, and whether there is the potential for realization of any further economies.
Based on its evaluation of all of the conclusions noted above, and after considering all factors it believed relevant, the Board ultimately concluded that the fund's management fee structure is fair and reasonable, and that the continuation of the fund's Amended and Restated Contracts should be approved.
VCYLIC-ANN-0220
1.817361.114
Fidelity® Variable Insurance Products:
Financial Services Portfolio
Annual Report
December 31, 2019
See the inside front cover for important information about access to your fund’s shareholder reports.
Beginning on January 1, 2021, as permitted by regulations adopted by the Securities and Exchange Commission, and if your insurance carrier elects to participate, you may not be receiving paper copies of the Fund’s shareholder reports from the insurance company that offers your variable insurance product unless you specifically request paper copies from your financial professional or the administrator of your variable insurance product. Instead, the reports will be made available on a website, and you will be notified by mail each time a report is posted and provided with a website link to access the report.
If you already elected to receive shareholder reports electronically, you will not be affected by this change and you need not take any action. You may elect to receive shareholder reports and other communications from the Fund electronically, by contacting your financial professional or the administrator of your variable insurance product. If you own a Fidelity-administered variable insurance product, please visit fidelity.com/mailpreferences to make your election or call 1-800-343-3548.
You may elect to receive all future reports in paper free of charge. If you wish to continue receiving paper copies of your shareholder reports, you may contact your financial professional or the administrator of your variable insurance product. If you own a Fidelity-administered variable insurance product, please visit fidelity.com/mailpreferences to make your election or call 1-800-343-3548. Your election to receive reports in paper will apply to all funds available under your variable insurance product.
Contents
To view a fund's proxy voting guidelines and proxy voting record for the 12-month period ended June 30, visit http://www.fidelity.com/proxyvotingresults or visit the Securities and Exchange Commission's (SEC) web site at http://www.sec.gov.
You may also call 1-877-208-0098 to request a free copy of the proxy voting guidelines.
Fidelity® Variable Insurance Products are separate account options which are purchased through a variable insurance contract.
Standard & Poor's, S&P and S&P 500 are registered service marks of The McGraw-Hill Companies, Inc. and have been licensed for use by Fidelity Distributors Corporation.
Other third-party marks appearing herein are the property of their respective owners.
All other marks appearing herein are registered or unregistered trademarks or service marks of FMR LLC or an affiliated company. © 2020 FMR LLC. All rights reserved.
This report and the financial statements contained herein are submitted for the general information of the shareholders of the Fund. This report is not authorized for distribution to prospective investors in the Fund unless preceded or accompanied by an effective prospectus.
A fund files its complete schedule of portfolio holdings with the SEC for the first and third quarters of each fiscal year on Form N-PORT. Forms N-PORT are available on the SEC’s web site at http://www.sec.gov. A fund's Forms N-PORT may be reviewed and copied at the SEC’s Public Reference Room in Washington, DC. Information regarding the operation of the SEC's Public Reference Room may be obtained by calling 1-800-SEC-0330.
For a complete list of a fund's portfolio holdings, view the most recent holdings listing, semiannual report, or annual report on Fidelity's web site at http://www.fidelity.com, http://www.institutional.fidelity.com, or http://www.401k.com, as applicable.
NOT FDIC INSURED •MAY LOSE VALUE •NO BANK GUARANTEE
Neither the Fund nor Fidelity Distributors Corporation is a bank.
Note to shareholders:
As part of a regular review of its organizational structure, Fidelity has decided to merge certain entities to streamline operations, increase efficiency, simplify reporting, and reduce legal, compliance, and accounting complexity and costs. In separate events, Fidelity has merged four of its investment advisers and two of its broker-dealers.
Effective on or about January 1, 2020, following any required regulatory notices and approvals:
Investment advisers Fidelity Investments Money Management, Inc., FMR Co., Inc., and Fidelity SelectCo, LLC, merged with and into Fidelity Management & Research Company. In connection with the merger transactions, the resulting, merged investment adviser was then redomiciled from Massachusetts to Delaware, changed its corporate structure from a corporation to a limited liability company, and changed its name to “Fidelity Management & Research Company LLC”.
Broker-dealer Fidelity Distributors Corporation merged with and into Fidelity Investments Institutional Services Company, Inc. (“FIISC”). FIISC was then redomiciled from Massachusetts to Delaware, changed its corporate structure from a corporation to a limited liability company, and changed its name to “Fidelity Distributors Company LLC”.
These mergers are not expected to affect fund shareholders or Fidelity clients, nor are they expected to result in any changes to the day-to-day management of Fidelity’s brokerage services, the Fidelity funds, their investment policies and practices, their portfolio management teams, or the funds’ expenses.
Performance: The Bottom Line
Average annual total return reflects the change in the value of an investment, assuming reinvestment of distributions from dividend income and capital gains (the profits earned upon the sale of securities that have grown in value, if any) and assuming a constant rate of performance each year. During periods of reimbursement by Fidelity, a fund’s total return will be greater than it would be had the reimbursement not occurred. Performance numbers are net of all underlying fund operating expenses, but do not include any insurance charges imposed by your insurance company’s separate account. If performance information included the effect of these additional charges, the total returns would have been lower. How a fund did yesterday is no guarantee of how it will do tomorrow.
Average Annual Total Returns
| For the periods ended December 31, 2019 | Past 1 year | Past 5 years | Past 10 years |
| Initial Class | 34.33% | 9.43% | 9.83% |
| Investor Class | 34.28% | 9.35% | 9.75% |
$10,000 Over 10 Years
Let's say hypothetically that $10,000 was invested in VIP Financial Services Portfolio - Initial Class on December 31, 2009.
The chart shows how the value of your investment would have changed, and also shows how the S&P 500® Index performed over the same period.
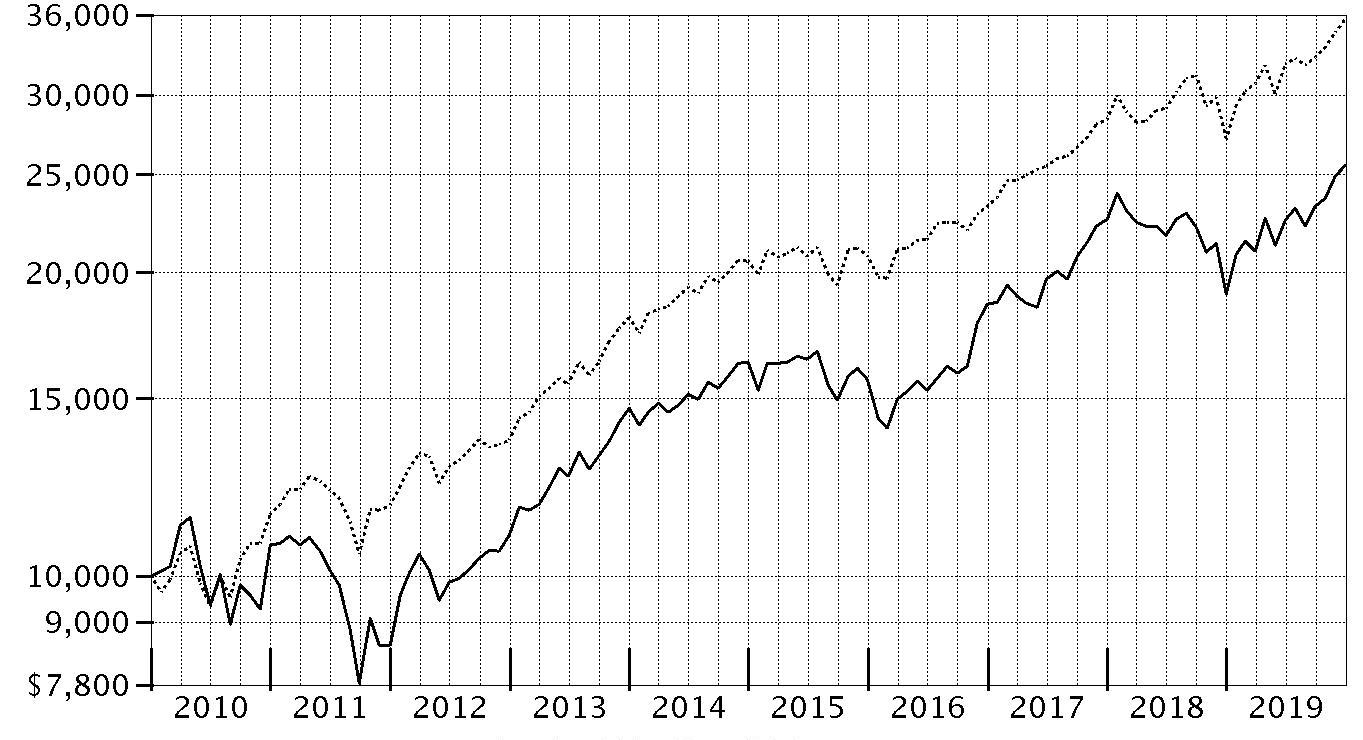
| Period Ending Values |
| $25,547 | VIP Financial Services Portfolio - Initial Class |
| $35,666 | S&P 500® Index |
Management's Discussion of Fund Performance
Market Recap: U.S. stocks continued to roll in 2019, with the S&P 500
® index soaring 31.49% and marking history as the longest and strongest bull market ever, despite persistent, nagging concerns about global economic growth and trade. After a rough end to 2018, equities sharply reversed course to begin the new year amid upbeat company earnings and signs the Federal Reserve may pause on rates. The uptrend continued until May, when the index sunk as trade negotiations between the U.S. and China broke down. The bull market roared back to record a series of highs in July, when the Fed cut interest rates for the first time since 2008. Volatility intensified in August, as the Treasury yield curve inverted, which some investors viewed as a sign the U.S. economy could be heading for recession. But the market proved resilient, hitting a new high on October 30, when the Fed lowered rates for the third time in 2019, and moving even higher through year-end. Gains were robust and broad-based, with information technology (+50%) leading the way with its best calendar-year result in a decade, amid strong growth trends. Communication services (+33%) and financials (+32%) also stood out. In contrast, energy (+12%) was by far the weakest group – struggling amid sluggish oil prices – while several strong gainers nonetheless fell short of the broader market: industrials and real estate (+29% each), consumer discretionary and consumer staples (+28% each), utilities (+26%), materials (+25%), and health care (+21%).
Comments from Portfolio Manager Matthew Reed: For the year, the fund’s share classes gained about 34%, topping the 31.39% advance of the MSCI U.S. IMI Financials 5% Capped Linked Index, and also outpacing the S&P 500
® index. Versus the MSCI index, stock selection and an underweighting in the asset management & custody banks category contributed most to the fund’s performance. Positioning in regional banks, consumer finance, and property & casualty insurance also helped. Our top relative contributor was an overweighted stake in Fidelity National Financial, a provider of title insurance. Recession worries and concerns about the housing market had depressed the stock at the end of 2018, and it rallied strongly when those fears receded in 2019, returning 50% for the fund. I exited the position in August. I’ll also mention OneMain Holdings (+88%), a provider of consumer finance and insurance products and services. In the asset management & custody banks segment, State Street and Apollo Global Management returned 58% and 59% in the fund, respectively, and bolstered the fund’s relative performance. Conversely, stock choices and an underweighting in financial exchanges & data hurt the past 12 months, as did picks in investment banking & brokerage. A modest cash position also was a drag on performance in such a strong market. At the stock level, the fund’s largest relative detractor was market maker Virtu Financial (-35%). Lower volatility and weaker trading volumes weighed on the stock. Online broker E*Trade Financial (+5%) also detracted.
The views expressed above reflect those of the portfolio manager(s) only through the end of the period as stated on the cover of this report and do not necessarily represent the views of Fidelity or any other person in the Fidelity organization. Any such views are subject to change at any time based upon market or other conditions and Fidelity disclaims any responsibility to update such views. These views may not be relied on as investment advice and, because investment decisions for a Fidelity fund are based on numerous factors, may not be relied on as an indication of trading intent on behalf of any Fidelity fund.
Note to shareholders: On June 1, 2019, Matthew Reed joined Christopher Lee as co-manager of the fund. On October 1, 2019, Chris came off the fund, leaving Matt as sole portfolio manager.
Investment Summary (Unaudited)
Top Ten Stocks as of December 31, 2019
| | % of fund's net assets |
| Citigroup, Inc. | 7.5 |
| Bank of America Corp. | 6.7 |
| Berkshire Hathaway, Inc. Class B | 6.2 |
| Wells Fargo & Co. | 5.5 |
| Morgan Stanley | 4.9 |
| Capital One Financial Corp. | 3.9 |
| The Travelers Companies, Inc. | 3.5 |
| BB&T Corp. | 2.9 |
| Goldman Sachs Group, Inc. | 2.5 |
| MetLife, Inc. | 2.1 |
| | 45.7 |
Top Industries (% of fund's net assets)
| As of December 31, 2019 |
| | Banks | 38.1% |
| | Capital Markets | 21.6% |
| | Insurance | 19.9% |
| | Consumer Finance | 7.2% |
| | Diversified Financial Services | 6.9% |
| | All Others* | 6.3% |

* Includes short-term investments and net other assets (liabilities).
Schedule of Investments December 31, 2019
Showing Percentage of Net Assets
| Common Stocks - 98.8% | | | |
| | | Shares | Value |
| Banks - 38.1% | | | |
| Diversified Banks - 19.7% | | | |
| Bank of America Corp. | | 314,000 | $11,059,080 |
| Citigroup, Inc. | | 154,700 | 12,358,981 |
| Wells Fargo & Co. | | 166,196 | 8,941,345 |
| | | | 32,359,406 |
| Regional Banks - 18.4% | | | |
| Amalgamated Bank | | 42,900 | 834,405 |
| Ameris Bancorp | | 21,200 | 901,848 |
| BB&T Corp. | | 85,077 | 4,791,537 |
| BOK Financial Corp. | | 7,942 | 694,131 |
| Cadence Bancorp Class A | | 51,900 | 940,947 |
| Cullen/Frost Bankers, Inc. | | 10,700 | 1,046,246 |
| East West Bancorp, Inc. | | 30,300 | 1,475,610 |
| First Citizens Bancshares, Inc. | | 2,200 | 1,170,862 |
| First Hawaiian, Inc. | | 39,700 | 1,145,345 |
| First Horizon National Corp. | | 71,662 | 1,186,723 |
| First Interstate Bancsystem, Inc. | | 22,700 | 951,584 |
| Great Western Bancorp, Inc. | | 15,600 | 541,944 |
| Huntington Bancshares, Inc. | | 210,170 | 3,169,364 |
| KeyCorp | | 93,600 | 1,894,464 |
| M&T Bank Corp. | | 12,800 | 2,172,800 |
| Regions Financial Corp. | | 121,800 | 2,090,088 |
| Signature Bank | | 14,600 | 1,994,506 |
| WesBanco, Inc. | | 32,500 | 1,228,175 |
| Wintrust Financial Corp. | | 16,600 | 1,176,940 |
| Zions Bancorp NA | | 16,700 | 867,064 |
| | | | 30,274,583 |
|
| TOTAL BANKS | | | 62,633,989 |
|
| Capital Markets - 21.6% | | | |
| Asset Management & Custody Banks - 6.6% | | | |
| Affiliated Managers Group, Inc. | | 10,600 | 898,244 |
| AllianceBernstein Holding LP | | 36,000 | 1,089,360 |
| Apollo Global Management LLC Class A | | 38,700 | 1,846,377 |
| Hamilton Lane, Inc. Class A | | 22,000 | 1,311,200 |
| Northern Trust Corp. | | 23,800 | 2,528,512 |
| State Street Corp. | | 40,800 | 3,227,280 |
| | | | 10,900,973 |
| Financial Exchanges & Data - 3.0% | | | |
| Cboe Global Markets, Inc. | | 25,927 | 3,111,240 |
| The NASDAQ OMX Group, Inc. | | 14,600 | 1,563,660 |
| Tradeweb Markets, Inc. Class A | | 6,800 | 315,180 |
| | | | 4,990,080 |
| Investment Banking & Brokerage - 12.0% | | | |
| E*TRADE Financial Corp. | | 52,800 | 2,395,536 |
| Goldman Sachs Group, Inc. | | 18,200 | 4,184,726 |
| Moelis & Co. Class A | | 9,000 | 287,280 |
| Morgan Stanley | | 158,500 | 8,102,520 |
| PJT Partners, Inc. | | 20,800 | 938,704 |
| Raymond James Financial, Inc. | | 24,800 | 2,218,608 |
| Virtu Financial, Inc. Class A (a) | | 95,700 | 1,530,243 |
| | | | 19,657,617 |
|
| TOTAL CAPITAL MARKETS | | | 35,548,670 |
|
| Consumer Finance - 7.2% | | | |
| Consumer Finance - 7.2% | | | |
| Capital One Financial Corp. | | 62,500 | 6,431,875 |
| OneMain Holdings, Inc. | | 65,200 | 2,748,180 |
| SLM Corp. | | 294,300 | 2,622,213 |
| | | | 11,802,268 |
| Diversified Financial Services - 6.9% | | | |
| Multi-Sector Holdings - 6.9% | | | |
| Berkshire Hathaway, Inc. Class B (b) | | 45,268 | 10,253,202 |
| Cannae Holdings, Inc. (b) | | 31,800 | 1,182,642 |
| | | | 11,435,844 |
| Insurance - 19.9% | | | |
| Insurance Brokers - 3.8% | | | |
| Arthur J. Gallagher & Co. | | 30,900 | 2,942,607 |
| Willis Group Holdings PLC | | 16,600 | 3,352,204 |
| | | | 6,294,811 |
| Life & Health Insurance - 3.4% | | | |
| CNO Financial Group, Inc. | | 69,600 | 1,261,848 |
| Globe Life, Inc. | | 990 | 104,198 |
| MetLife, Inc. | | 68,200 | 3,476,154 |
| Primerica, Inc. | | 5,900 | 770,304 |
| | | | 5,612,504 |
| Multi-Line Insurance - 4.9% | | | |
| American International Group, Inc. | | 63,800 | 3,274,854 |
| Assurant, Inc. | | 11,800 | 1,546,744 |
| Hartford Financial Services Group, Inc. | | 53,100 | 3,226,887 |
| | | | 8,048,485 |
| Property & Casualty Insurance - 5.8% | | | |
| Allstate Corp. | | 26,600 | 2,991,170 |
| FNF Group | | 70 | 3,175 |
| RSA Insurance Group PLC | | 108,600 | 813,624 |
| The Travelers Companies, Inc. | | 41,612 | 5,698,763 |
| | | | 9,506,732 |
| Reinsurance - 2.0% | | | |
| Reinsurance Group of America, Inc. | | 20,300 | 3,310,118 |
|
| TOTAL INSURANCE | | | 32,772,650 |
|
| IT Services - 3.5% | | | |
| Data Processing & Outsourced Services - 3.5% | | | |
| Black Knight, Inc. (b) | | 29,499 | 1,902,096 |
| Fidelity National Information Services, Inc. | | 12,100 | 1,682,989 |
| GreenSky, Inc. Class A (a)(b) | | 59,300 | 527,770 |
| Visa, Inc. Class A | | 9,000 | 1,691,100 |
| | | | 5,803,955 |
| Mortgage Real Estate Investment Trusts - 0.1% | | | |
| Mortgage REITs - 0.1% | | | |
| AGNC Investment Corp. | | 8,100 | 143,208 |
| Thrifts & Mortgage Finance - 1.5% | | | |
| Thrifts & Mortgage Finance - 1.5% | | | |
| Essent Group Ltd. | | 20,700 | 1,076,193 |
| MGIC Investment Corp. | | 94,500 | 1,339,065 |
| | | | 2,415,258 |
| TOTAL COMMON STOCKS | | | |
| (Cost $125,808,324) | | | 162,555,842 |
|
| Money Market Funds - 2.3% | | | |
| Fidelity Cash Central Fund 1.58% (c) | | 1,816,147 | 1,816,510 |
| Fidelity Securities Lending Cash Central Fund 1.58% (c)(d) | | 1,992,525 | 1,992,724 |
| TOTAL MONEY MARKET FUNDS | | | |
| (Cost $3,809,234) | | | 3,809,234 |
| TOTAL INVESTMENT IN SECURITIES - 101.1% | | | |
| (Cost $129,617,558) | | | 166,365,076 |
| NET OTHER ASSETS (LIABILITIES) - (1.1)% | | | (1,776,126) |
| NET ASSETS - 100% | | | $164,588,950 |
Legend
(a) Security or a portion of the security is on loan at period end.
(b) Non-income producing
(c) Affiliated fund that is generally available only to investment companies and other accounts managed by Fidelity Investments. The rate quoted is the annualized seven-day yield of the fund at period end. A complete unaudited listing of the fund's holdings as of its most recent quarter end is available upon request. In addition, each Fidelity Central Fund's financial statements, which are not covered by the Fund's Report of Independent Registered Public Accounting Firm, are available on the SEC's website or upon request.
(d) Investment made with cash collateral received from securities on loan.
Affiliated Central Funds
Information regarding fiscal year to date income earned by the Fund from investments in Fidelity Central Funds is as follows:
| Fund | Income earned |
| Fidelity Cash Central Fund | $37,248 |
| Fidelity Securities Lending Cash Central Fund | 7,069 |
| Total | $44,317 |
Amounts in the income column in the above table include any capital gain distributions from underlying funds, which are presented in the corresponding line-item in the Statement of Operations, if applicable. Amount for Fidelity Securities Lending Cash Central Fund represents the income earned on investing cash collateral, less rebates paid to borrowers and any lending agent fees associated with the loan, plus any premium payments received for lending certain types of securities.
Investment Valuation
All investments are categorized as Level 1 under the Fair Value Hierarchy. The inputs or methodology used for valuing securities may not be an indication of the risk associated with investing in those securities. For more information on valuation inputs please refer to the Investment Valuation section in the accompanying Notes to Financial Statements.
See accompanying notes which are an integral part of the financial statements.
Financial Statements
Statement of Assets and Liabilities
| | | December 31, 2019 |
| Assets | | |
Investment in securities, at value (including securities loaned of $1,938,979) — See accompanying schedule:
Unaffiliated issuers (cost $125,808,324) | $162,555,842 | |
| Fidelity Central Funds (cost $3,809,234) | 3,809,234 | |
| Total Investment in Securities (cost $129,617,558) | | $166,365,076 |
| Cash | | 37,919 |
| Receivable for investments sold | | 38,568 |
| Receivable for fund shares sold | | 135,475 |
| Dividends receivable | | 168,400 |
| Distributions receivable from Fidelity Central Funds | | 2,599 |
| Prepaid expenses | | 1,809 |
| Other receivables | | 4,658 |
| Total assets | | 166,754,504 |
| Liabilities | | |
| Payable for investments purchased | $37,919 | |
| Payable for fund shares redeemed | 52 | |
| Accrued management fee | 72,153 | |
| Other affiliated payables | 23,242 | |
| Other payables and accrued expenses | 39,463 | |
| Collateral on securities loaned | 1,992,725 | |
| Total liabilities | | 2,165,554 |
| Net Assets | | $164,588,950 |
| Net Assets consist of: | | |
| Paid in capital | | $115,010,219 |
| Total accumulated earnings (loss) | | 49,578,731 |
| Net Assets | | $164,588,950 |
| Net Asset Value and Maximum Offering Price | | |
| Initial Class: | | |
| Net Asset Value, offering price and redemption price per share ($24,758,058 ÷ 1,817,151 shares) | | $13.62 |
| Investor Class: | | |
| Net Asset Value, offering price and redemption price per share ($139,830,892 ÷ 10,309,712 shares) | | $13.56 |
See accompanying notes which are an integral part of the financial statements.
Statement of Operations
| | | Year ended December 31, 2019 |
| Investment Income | | |
| Dividends | | $3,963,251 |
| Income from Fidelity Central Funds (including $7,069 from security lending) | | 44,317 |
| Total income | | 4,007,568 |
| Expenses | | |
| Management fee | $861,359 | |
| Transfer agent fees | 212,030 | |
| Accounting and security lending fees | 62,477 | |
| Custodian fees and expenses | 9,375 | |
| Independent trustees' fees and expenses | 889 | |
| Audit | 41,835 | |
| Legal | 5,140 | |
| Miscellaneous | 1,388 | |
| Total expenses before reductions | 1,194,493 | |
| Expense reductions | (13,915) | |
| Total expenses after reductions | | 1,180,578 |
| Net investment income (loss) | | 2,826,990 |
| Realized and Unrealized Gain (Loss) | | |
| Net realized gain (loss) on: | | |
| Investment securities: | | |
| Unaffiliated issuers | 13,241,591 | |
| Fidelity Central Funds | 2 | |
| Foreign currency transactions | (981) | |
| Total net realized gain (loss) | | 13,240,612 |
| Change in net unrealized appreciation (depreciation) on: | | |
| Investment securities: | | |
| Unaffiliated issuers | 31,177,648 | |
| Assets and liabilities in foreign currencies | (7) | |
| Total change in net unrealized appreciation (depreciation) | | 31,177,641 |
| Net gain (loss) | | 44,418,253 |
| Net increase (decrease) in net assets resulting from operations | | $47,245,243 |
See accompanying notes which are an integral part of the financial statements.
Statement of Changes in Net Assets
| | Year ended December 31, 2019 | Year ended December 31, 2018 |
| Increase (Decrease) in Net Assets | | |
| Operations | | |
| Net investment income (loss) | $2,826,990 | $2,608,525 |
| Net realized gain (loss) | 13,240,612 | 12,057,883 |
| Change in net unrealized appreciation (depreciation) | 31,177,641 | (47,028,121) |
| Net increase (decrease) in net assets resulting from operations | 47,245,243 | (32,361,713) |
| Distributions to shareholders | (15,228,780) | (7,356,991) |
| Share transactions - net increase (decrease) | (25,560,098) | (37,604,333) |
| Redemption fees | – | 6,648 |
| Total increase (decrease) in net assets | 6,456,365 | (77,316,389) |
| Net Assets | | |
| Beginning of period | 158,132,585 | 235,448,974 |
| End of period | $164,588,950 | $158,132,585 |
See accompanying notes which are an integral part of the financial statements.
Financial Highlights
VIP Financial Services Portfolio Initial Class
| Years ended December 31, | 2019 | 2018 | 2017 | 2016 | 2015 |
| Selected Per–Share Data | | | | | |
| Net asset value, beginning of period | $11.15 | $13.72 | $11.50 | $9.74 | $10.23 |
| Income from Investment Operations | | | | | |
| Net investment income (loss)A | .22 | .17 | .11 | .12 | .10 |
| Net realized and unrealized gain (loss) | 3.39 | (2.28) | 2.33 | 1.70 | (.48) |
| Total from investment operations | 3.61 | (2.11) | 2.44 | 1.82 | (.38) |
| Distributions from net investment income | (.26) | (.16) | (.09) | (.06) | (.11) |
| Distributions from net realized gain | (.88) | (.29) | (.13) | – | – |
| Total distributions | (1.14) | (.46)B | (.22) | (.06) | (.11) |
| Redemption fees added to paid in capitalA | – | –C | –C | –C | –C |
| Net asset value, end of period | $13.62 | $11.15 | $13.72 | $11.50 | $9.74 |
| Total ReturnD,E | 34.33% | (15.73)% | 21.25% | 18.72% | (3.69)% |
| Ratios to Average Net AssetsF,G | | | | | |
| Expenses before reductions | .68% | .67% | .69% | .72% | .71% |
| Expenses net of fee waivers, if any | .68% | .67% | .69% | .72% | .71% |
| Expenses net of all reductions | .67% | .66% | .69% | .71% | .71% |
| Net investment income (loss) | 1.83% | 1.25% | .91% | 1.18% | 1.02% |
| Supplemental Data | | | | | |
| Net assets, end of period (000 omitted) | $24,758 | $24,142 | $44,248 | $41,404 | $20,570 |
| Portfolio turnover rateH | 58% | 59% | 72% | 87% | 59% |
A Calculated based on average shares outstanding during the period.
B Total distributions of $.46 per share is comprised of distributions from net investment income of $.163 and distributions from net realized gain of $.294 per share.
C Amount represents less than $.005 per share.
D Total returns do not reflect charges attributable to your insurance company's separate account. Inclusion of these charges would reduce the total returns shown.
E Total returns would have been lower if certain expenses had not been reduced during the applicable periods shown.
F Fees and expenses of any underlying Fidelity Central Funds are not included in the Fund's expense ratio. The Fund indirectly bears its proportionate share of the expenses of any underlying Fidelity Central Funds.
G Expense ratios reflect operating expenses of the class. Expenses before reductions do not reflect amounts reimbursed by the investment adviser or reductions from brokerage service arrangements or reductions from other expense offset arrangements and do not represent the amount paid by the class during periods when reimbursements or reductions occur. Expenses net of fee waivers reflect expenses after reimbursement by the investment adviser but prior to reductions from brokerage service arrangements or other expense offset arrangements. Expenses net of all reductions represent the net expenses paid by the class.
H Amount does not include the portfolio activity of any underlying Fidelity Central Funds.
See accompanying notes which are an integral part of the financial statements.
VIP Financial Services Portfolio Investor Class
| Years ended December 31, | 2019 | 2018 | 2017 | 2016 | 2015 |
| Selected Per–Share Data | | | | | |
| Net asset value, beginning of period | $11.10 | $13.66 | $11.45 | $9.71 | $10.19 |
| Income from Investment Operations | | | | | |
| Net investment income (loss)A | .21 | .15 | .10 | .11 | .09 |
| Net realized and unrealized gain (loss) | 3.38 | (2.26) | 2.32 | 1.69 | (.47) |
| Total from investment operations | 3.59 | (2.11) | 2.42 | 1.80 | (.38) |
| Distributions from net investment income | (.25) | (.15) | (.08) | (.06) | (.10) |
| Distributions from net realized gain | (.88) | (.29) | (.13) | – | – |
| Total distributions | (1.13) | (.45)B | (.21) | (.06) | (.10) |
| Redemption fees added to paid in capitalA | – | –C | –C | –C | –C |
| Net asset value, end of period | $13.56 | $11.10 | $13.66 | $11.45 | $9.71 |
| Total ReturnD,E | 34.28% | (15.82)% | 21.18% | 18.51% | (3.68)% |
| Ratios to Average Net AssetsF,G | | | | | |
| Expenses before reductions | .76% | .75% | .77% | .80% | .79% |
| Expenses net of fee waivers, if any | .76% | .75% | .77% | .80% | .79% |
| Expenses net of all reductions | .75% | .74% | .77% | .79% | .78% |
| Net investment income (loss) | 1.75% | 1.17% | .83% | 1.10% | .95% |
| Supplemental Data | | | | | |
| Net assets, end of period (000 omitted) | $139,831 | $133,990 | $191,201 | $129,912 | $90,950 |
| Portfolio turnover rateH | 58% | 59% | 72% | 87% | 59% |
A Calculated based on average shares outstanding during the period.
B Total distributions of $.45 per share is comprised of distributions from net investment income of $.151 and distributions from net realized gain of $.294 per share.
C Amount represents less than $.005 per share.
D Total returns do not reflect charges attributable to your insurance company's separate account. Inclusion of these charges would reduce the total returns shown.
E Total returns would have been lower if certain expenses had not been reduced during the applicable periods shown.
F Fees and expenses of any underlying Fidelity Central Funds are not included in the Fund's expense ratio. The Fund indirectly bears its proportionate share of the expenses of any underlying Fidelity Central Funds.
G Expense ratios reflect operating expenses of the class. Expenses before reductions do not reflect amounts reimbursed by the investment adviser or reductions from brokerage service arrangements or reductions from other expense offset arrangements and do not represent the amount paid by the class during periods when reimbursements or reductions occur. Expenses net of fee waivers reflect expenses after reimbursement by the investment adviser but prior to reductions from brokerage service arrangements or other expense offset arrangements. Expenses net of all reductions represent the net expenses paid by the class.
H Amount does not include the portfolio activity of any underlying Fidelity Central Funds.
See accompanying notes which are an integral part of the financial statements.
Notes to Financial Statements
For the period ended December 31, 2019
1. Organization.
VIP Financial Services Portfolio (the Fund) is a non-diversified fund of Variable Insurance Products Fund IV (the Trust) and is authorized to issue an unlimited number of shares. The Trust is registered under the Investment Company Act of 1940, as amended (the 1940 Act), as an open-end management investment company organized as a Massachusetts business trust. Shares of the Fund may only be purchased by insurance companies for the purpose of funding variable annuity or variable life insurance contracts. The Fund offers the following classes of shares: Initial Class shares and Investor Class shares. All classes have equal rights and voting privileges, except for matters affecting a single class.
2. Investments in Fidelity Central Funds.
The Fund invests in Fidelity Central Funds, which are open-end investment companies generally available only to other investment companies and accounts managed by the investment adviser and its affiliates. The Fund's Schedule of Investments lists each of the Fidelity Central Funds held as of period end, if any, as an investment of the Fund, but does not include the underlying holdings of each Fidelity Central Fund. As an Investing Fund, the Fund indirectly bears its proportionate share of the expenses of the underlying Fidelity Central Funds.
The Money Market Central Funds seek preservation of capital and current income and are managed by Fidelity Investments Money Management, Inc. (FIMM), an affiliate of the investment adviser. Annualized expenses of the Money Market Central Funds as of their most recent shareholder report date ranged from less than .005% to .01%.
A complete unaudited list of holdings for each Fidelity Central Fund is available upon request or at the Securities and Exchange Commission (the SEC) website at www.sec.gov. In addition, the financial statements of the Fidelity Central Funds, which are not covered by the Fund's Report of Independent Registered Public Accounting Firm, are available on the SEC website or upon request.
3. Significant Accounting Policies.
The Fund is an investment company and applies the accounting and reporting guidance of the Financial Accounting Standards Board (FASB) Accounting Standards Codification Topic 946 Financial Services – Investments Companies. The financial statements have been prepared in conformity with accounting principles generally accepted in the United States of America (GAAP), which require management to make certain estimates and assumptions at the date of the financial statements. Actual results could differ from those estimates. Subsequent events, if any, through the date that the financial statements were issued have been evaluated in the preparation of the financial statements. The following summarizes the significant accounting policies of the Fund:
Investment Valuation. Investments are valued as of 4:00 p.m. Eastern time on the last calendar day of the period. The Board of Trustees (the Board) has delegated the day to day responsibility for the valuation of the Fund's investments to the Fair Value Committee (the Committee) established by the Fund's investment adviser. In accordance with valuation policies and procedures approved by the Board, the Fund attempts to obtain prices from one or more third party pricing vendors or brokers to value its investments. When current market prices, quotations or currency exchange rates are not readily available or reliable, investments will be fair valued in good faith by the Committee, in accordance with procedures adopted by the Board. Factors used in determining fair value vary by investment type and may include market or investment specific events. The frequency with which these procedures are used cannot be predicted and they may be utilized to a significant extent. The Committee oversees the Fund's valuation policies and procedures and reports to the Board on the Committee's activities and fair value determinations. The Board monitors the appropriateness of the procedures used in valuing the Fund's investments and ratifies the fair value determinations of the Committee.
The Fund categorizes the inputs to valuation techniques used to value its investments into a disclosure hierarchy consisting of three levels as shown below:
- Level 1 – quoted prices in active markets for identical investments
- Level 2 – other significant observable inputs (including quoted prices for similar investments, interest rates, prepayment speeds, etc.)
- Level 3 – unobservable inputs (including the Fund's own assumptions based on the best information available)
Valuation techniques used to value the Fund's investments by major category are as follows:
Equity securities, including restricted securities, for which market quotations are readily available, are valued at the last reported sale price or official closing price as reported by a third party pricing vendor on the primary market or exchange on which they are traded and are categorized as Level 1 in the hierarchy. In the event there were no sales during the day or closing prices are not available, securities are valued at the last quoted bid price or may be valued using the last available price and are generally categorized as Level 2 in the hierarchy. For foreign equity securities, when market or security specific events arise, comparisons to the valuation of American Depositary Receipts (ADRs), futures contracts, Exchange-Traded Funds (ETFs) and certain indexes as well as quoted prices for similar securities may be used and would be categorized as Level 2 in the hierarchy. For equity securities, including restricted securities, where observable inputs are limited, assumptions about market activity and risk are used and these securities may be categorized as Level 3 in the hierarchy.
Investments in open-end mutual funds, including the Fidelity Central Funds, are valued at their closing net asset value (NAV) each business day and are categorized as Level 1 in the hierarchy.
Changes in valuation techniques may result in transfers in or out of an assigned level within the disclosure hierarchy.
Foreign Currency. The Fund may use foreign currency contracts to facilitate transactions in foreign-denominated securities. Gains and losses from these transactions may arise from changes in the value of the foreign currency or if the counterparties do not perform under the contracts' terms.
Foreign-denominated assets, including investment securities, and liabilities are translated into U.S. dollars at the exchange rates at period end. Purchases and sales of investment securities, income and dividends received and expenses denominated in foreign currencies are translated into U.S. dollars at the exchange rate in effect on the transaction date.
The effects of exchange rate fluctuations on investments are included with the net realized and unrealized gain (loss) on investment securities. Other foreign currency transactions resulting in realized and unrealized gain (loss) are disclosed separately.
Investment Transactions and Income. For financial reporting purposes, the Fund's investment holdings and NAV include trades executed through the end of the last business day of the period. The NAV per share for processing shareholder transactions is calculated as of the close of business of the New York Stock Exchange (NYSE), normally 4:00 p.m. Eastern time and includes trades executed through the end of the prior business day. Gains and losses on securities sold are determined on the basis of identified cost and include proceeds received from litigation. Dividend income is recorded on the ex-dividend date, except for certain dividends from foreign securities where the ex-dividend date may have passed, which are recorded as soon as the Fund is informed of the ex-dividend date. Non-cash dividends included in dividend income, if any, are recorded at the fair market value of the securities received. Income and capital gain distributions from Fidelity Central Funds, if any, are recorded on the ex-dividend date. Certain distributions received by the Fund represent a return of capital or capital gain. The Fund determines the components of these distributions subsequent to the ex-dividend date, based upon receipt of tax filings or other correspondence relating to the underlying investment. These distributions are recorded as a reduction of cost of investments and/or as a realized gain. Investment income is recorded net of foreign taxes withheld where recovery of such taxes is uncertain.
Class Allocations and Expenses. Investment income, realized and unrealized capital gains and losses, common expenses of the Fund, and certain fund-level expense reductions, if any, are allocated daily on a pro-rata basis to each class based on the relative net assets of each class to the total net assets of the Fund. Each class differs with respect to transfer agent fees incurred. Certain expense reductions may also differ by class. For the reporting period, the allocated portion of income and expenses to each class as a percent of its average net assets may vary due to the timing of recording these transactions in relation to fluctuating net assets of the classes. Expenses directly attributable to a fund are charged to that fund. Expenses attributable to more than one fund are allocated among the respective funds on the basis of relative net assets or other appropriate methods. Expense estimates are accrued in the period to which they relate and adjustments are made when actual amounts are known.
Income Tax Information and Distributions to Shareholders. Each year, the Fund intends to qualify as a regulated investment company under Subchapter M of the Internal Revenue Code, including distributing substantially all of its taxable income and realized gains. As a result, no provision for U.S. Federal income taxes is required. As of December 31, 2019, the Fund did not have any unrecognized tax benefits in the financial statements; nor is the Fund aware of any tax positions for which it is reasonably possible that the total amounts of unrecognized tax benefits will significantly change in the next twelve months. The Fund files a U.S. federal tax return, in addition to state and local tax returns as required. The Fund's federal income tax returns are subject to examination by the Internal Revenue Service (IRS) for a period of three fiscal years after they are filed. State and local tax returns may be subject to examination for an additional fiscal year depending on the jurisdiction. Foreign taxes are provided for based on the Fund's understanding of the tax rules and rates that exist in the foreign markets in which it invests.
Distributions are declared and recorded on the ex-dividend date. Income and capital gain distributions are declared separately for each class. Income and capital gain distributions are determined in accordance with income tax regulations, which may differ from GAAP.
Capital accounts within the financial statements are adjusted for permanent book-tax differences. These adjustments have no impact on net assets or the results of operations. Capital accounts are not adjusted for temporary book-tax differences which will reverse in a subsequent period.
Book-tax differences are primarily due to foreign currency transactions, partnerships and losses deferred due to wash sales.
As of period end, the cost and unrealized appreciation (depreciation) in securities, and derivatives if applicable, for federal income tax purposes were as follows:
| Gross unrealized appreciation | $38,068,592 |
| Gross unrealized depreciation | (1,735,616) |
| Net unrealized appreciation (depreciation) | $36,332,976 |
| Tax Cost | $130,032,100 |
The tax-based components of distributable earnings as of period end were as follows:
| Undistributed ordinary income | $786,445 |
| Undistributed long-term capital gain | $12,459,463 |
| Net unrealized appreciation (depreciation) on securities and other investments | $36,332,823 |
The tax character of distributions paid was as follows:
| | December 31, 2019 | December 31, 2018 |
| Ordinary Income | $3,137,696 | $2,344,419 |
| Long-term Capital Gains | 12,091,084 | 5,012,572 |
| Total | $15,228,780 | $7,356,991 |
4. Purchases and Sales of Investments.
Purchases and sales of securities, other than short-term securities, aggregated $91,928,350 and $127,688,021, respectively.
5. Fees and Other Transactions with Affiliates.
Management Fee. Fidelity SelectCo, LLC (the investment adviser) and its affiliates provide the Fund with investment management related services for which the Fund pays a monthly management fee. The management fee is the sum of an individual fund fee rate that is based on an annual rate of .30% of the Fund's average net assets and an annualized group fee rate that averaged .24% during the period. The group fee rate is based upon the average net assets of all the mutual funds advised by Fidelity Management & Research Company (FMR) and the investment adviser. The group fee rate decreases as assets under management increase and increases as assets under management decrease. For the reporting period, the total annual management fee rate was .54% of the Fund's average net assets.
Transfer Agent Fees. Fidelity Investments Institutional Operations Company, Inc. (FIIOC), an affiliate of the investment adviser, is the Fund's transfer, dividend disbursing, and shareholder servicing agent. FIIOC receives an asset-based fee with respect to each class. Each class pays a fee for transfer agent services, typesetting and printing and mailing of shareholder reports, excluding mailing of proxy statements, equal to an annual rate of class-level average net assets. The annual rate for Investor Class is .15% and the annual rate for all other classes is .07%. For the period, transfer agent fees for each class were as follows:
| Initial Class | $ 15,816 |
| Investor Class | 196,214 |
| | $212,030 |
Accounting and Security Lending Fees. Fidelity Service Company, Inc. (FSC), an affiliate of the investment adviser, maintains the Fund's accounting records. The accounting fee is based on the level of average net assets for each month. Prior to April 1, 2019, FSC had a separate agreement with the Fund for administration of the security lending program, based on the number and duration of lending transactions. For the period, the total fees paid for accounting and administration of securities lending were equivalent to the following annual rates:
| | % of Average Net Assets |
| VIP Financial Services Portfolio | .04 |
Brokerage Commissions. A portion of portfolio transactions were placed with brokerage firms which are affiliates of the investment adviser. Brokerage commissions are included in net realized gain (loss) and change in net unrealized appreciation (depreciation) in the Statement of Operations. The commissions paid to these affiliated firms were as follows:
| | Amount |
| VIP Financial Services Portfolio | $3,252 |
Interfund Trades. The Fund may purchase from or sell securities to other Fidelity Funds under procedures adopted by the Board. The procedures have been designed to ensure these interfund trades are executed in accordance with Rule 17a-7 of the 1940 Act. Interfund trades are included within the respective purchases and sales amounts shown in the Purchases and Sales of Investments note.
6. Committed Line of Credit.
The Fund participates with other funds managed by the investment adviser or an affiliate in a $4.25 billion credit facility (the "line of credit") to be utilized for temporary or emergency purposes to fund shareholder redemptions or for other short-term liquidity purposes. The Fund has agreed to pay commitment fees on its pro-rata portion of the line of credit, which amounted to $445 and is reflected in Miscellaneous expenses on the Statement of Operations. During the period, the Fund did not borrow on this line of credit.
7. Security Lending.
The Fund lends portfolio securities from time to time in order to earn additional income. For equity securities, lending agents are used, including National Financial Services (NFS), an affiliate of the Fund. Pursuant to a securities lending agreement, NFS will receive a fee, which is capped at 9.9% of daily lending revenue, for its services as lending agent. The Fund may lend securities to certain qualified borrowers. On the settlement date of the loan, the Fund receives collateral (in the form of U.S. Treasury obligations, letters of credit and/or cash) against the loaned securities and maintains collateral in an amount not less than 100% of the market value of the loaned securities during the period of the loan. The market value of the loaned securities is determined at the close of business of the Fund and any additional required collateral is delivered to the Fund on the next business day. The Fund or borrower may terminate the loan at any time, and if the borrower defaults on its obligation to return the securities loaned because of insolvency or other reasons, the Fund may apply collateral received from the borrower against the obligation. The Fund may experience delays and costs in recovering the securities loaned. Any cash collateral received is invested in the Fidelity Securities Lending Cash Central Fund. The value of loaned securities and cash collateral at period end are disclosed on the Fund's Statement of Assets and Liabilities. Total fees paid by the Fund to NFS amounted to $514. Security lending income represents the income earned on investing cash collateral, less rebates paid to borrowers and any lending agent fees associated with the loan, plus any premium payments received for lending certain types of securities. Security lending income is presented in the Statement of Operations as a component of income from Fidelity Central Funds.
8. Expense Reductions.
Commissions paid to certain brokers with whom the investment adviser, or its affiliates, places trades on behalf of the Fund include an amount in addition to trade execution, which may be rebated back to the Fund to offset certain expenses. This amount totaled $12,584 for the period.
In addition, during the period the investment adviser reimbursed and/or waived a portion of fund-level operating expenses in the amount of $1,331.
9. Distributions to Shareholders.
Distributions to shareholders of each class were as follows:
| | Year ended
December 31, 2019 | Year ended
December 31, 2018 |
| Distributions to shareholders | | |
| Initial Class | 2,301,545 | $1,262,668 |
| Investor Class | 12,927,235 | 6,094,323 |
| Total | $15,228,780 | $7,356,991 |
10. Share Transactions.
Transactions for each class of shares were as follows:
| | Shares | Shares | Dollars | Dollars |
| | Year ended December 31, 2019 | Year ended December 31, 2018 | Year ended December 31, 2019 | Year ended December 31, 2018 |
| Initial Class | | | | |
| Shares sold | 224,068 | 514,137 | $2,786,034 | $6,923,550 |
| Reinvestment of distributions | 199,101 | 100,069 | 2,301,545 | 1,262,668 |
| Shares redeemed | (771,890) | (1,673,395) | (9,396,245) | (22,265,392) |
| Net increase (decrease) | (348,721) | (1,059,189) | $(4,308,666) | $(14,079,174) |
| Investor Class | | | | |
| Shares sold | 1,009,374 | 2,212,552 | $12,746,891 | $30,015,916 |
| Reinvestment of distributions | 1,124,147 | 486,202 | 12,927,235 | 6,094,323 |
| Shares redeemed | (3,894,516) | (4,623,690) | (46,925,558) | (59,635,398) |
| Net increase (decrease) | (1,760,995) | (1,924,936) | $(21,251,432) | $(23,525,159) |
11. Other.
The Fund's organizational documents provide former and current trustees and officers with a limited indemnification against liabilities arising in connection with the performance of their duties to the Fund. In the normal course of business, the Fund may also enter into contracts that provide general indemnifications. The Fund's maximum exposure under these arrangements is unknown as this would be dependent on future claims that may be made against the Fund. The risk of material loss from such claims is considered remote.
At the end of the period, the investment adviser or its affiliates were the owners of record of 99% of the total outstanding shares of the Fund.
Effective January 1, 2020, following any required regulatory notices and approvals:
Investment advisers Fidelity Investments Money Management, Inc., FMR Co., Inc., and Fidelity SelectCo, LLC, merged with and into Fidelity Management & Research Company. In connection with the merger transactions, the resulting, merged investment adviser was then redomiciled from Massachusetts to Delaware, changed its corporate structure from a corporation to a limited liability company, and changed its name to "Fidelity Management & Research Company LLC".
Fidelity Investments Institutional Operations Company, Inc. (FIIOC) converted from a Massachusetts corporation to a Massachusetts LLC, and changed its name to "Fidelity Investments Institutional Operations Company LLC".
Report of Independent Registered Public Accounting Firm
To the Board of Trustees of Variable Insurance Products Fund IV and Shareholders of VIP Financial Services Portfolio:
Opinion on the Financial Statements
We have audited the accompanying statement of assets and liabilities, including the schedule of investments, of VIP Financial Services Portfolio (one of the funds constituting Variable Insurance Products Fund IV, referred to hereafter as the “Fund”) as of December 31, 2019, the related statement of operations for the year ended December 31, 2019, the statement of changes in net assets for each of the two years in the period ended December 31, 2019, including the related notes, and the financial highlights for each of the five years in the period ended December 31, 2019 (collectively referred to as the “financial statements”). In our opinion, the financial statements present fairly, in all material respects, the financial position of the Fund as of December 31, 2019, the results of its operations for the year then ended, the changes in its net assets for each of the two years in the period ended December 31, 2019 and the financial highlights for each of the five years in the period ended December 31, 2019 in conformity with accounting principles generally accepted in the United States of America.
Basis for Opinion
These financial statements are the responsibility of the Fund’s management. Our responsibility is to express an opinion on the Fund’s financial statements based on our audits. We are a public accounting firm registered with the Public Company Accounting Oversight Board (United States) (PCAOB) and are required to be independent with respect to the Fund in accordance with the U.S. federal securities laws and the applicable rules and regulations of the Securities and Exchange Commission and the PCAOB.
We conducted our audits of these financial statements in accordance with the standards of the PCAOB. Those standards require that we plan and perform the audit to obtain reasonable assurance about whether the financial statements are free of material misstatement, whether due to error or fraud.
Our audits included performing procedures to assess the risks of material misstatement of the financial statements, whether due to error or fraud, and performing procedures that respond to those risks. Such procedures included examining, on a test basis, evidence regarding the amounts and disclosures in the financial statements. Our audits also included evaluating the accounting principles used and significant estimates made by management, as well as evaluating the overall presentation of the financial statements. Our procedures included confirmation of securities owned as of December 31, 2019 by correspondence with the custodian. We believe that our audits provide a reasonable basis for our opinion.
PricewaterhouseCoopers LLP
Boston, Massachusetts
February 14, 2020
We have served as the auditor of one or more investment companies in the Fidelity group of funds since 1932.
Trustees and Officers
The Trustees, Members of the Advisory Board (if any), and officers of the trust and fund, as applicable, are listed below. The Board of Trustees governs the fund and is responsible for protecting the interests of shareholders. The Trustees are experienced executives who meet periodically throughout the year to oversee the fund's activities, review contractual arrangements with companies that provide services to the fund, oversee management of the risks associated with such activities and contractual arrangements, and review the fund's performance. Except for Michael E. Wiley, each of the Trustees oversees 302 funds. Mr. Wiley oversees 199 funds.
The Trustees hold office without limit in time except that (a) any Trustee may resign; (b) any Trustee may be removed by written instrument, signed by at least two-thirds of the number of Trustees prior to such removal; (c) any Trustee who requests to be retired or who has become incapacitated by illness or injury may be retired by written instrument signed by a majority of the other Trustees; and (d) any Trustee may be removed at any special meeting of shareholders by a two-thirds vote of the outstanding voting securities of the trust. Each Trustee who is not an interested person (as defined in the Investment Company Act of 1940 (1940 Act)) of the trust and the fund is referred to herein as an Independent Trustee. Each Independent Trustee shall retire not later than the last day of the calendar year in which his or her 75th birthday occurs. The Independent Trustees may waive this mandatory retirement age policy with respect to individual Trustees. Officers and Advisory Board Members hold office without limit in time, except that any officer or Advisory Board Member may resign or may be removed by a vote of a majority of the Trustees at any regular meeting or any special meeting of the Trustees. Except as indicated, each individual has held the office shown or other offices in the same company for the past five years.
The fund’s Statement of Additional Information (SAI) includes more information about the Trustees. To request a free copy, call Fidelity at 1-877-208-0098.
Experience, Skills, Attributes, and Qualifications of the Trustees. The Governance and Nominating Committee has adopted a statement of policy that describes the experience, qualifications, attributes, and skills that are necessary and desirable for potential Independent Trustee candidates (Statement of Policy). The Board believes that each Trustee satisfied at the time he or she was initially elected or appointed a Trustee, and continues to satisfy, the standards contemplated by the Statement of Policy. The Governance and Nominating Committee also engages professional search firms to help identify potential Independent Trustee candidates who have the experience, qualifications, attributes, and skills consistent with the Statement of Policy. From time to time, additional criteria based on the composition and skills of the current Independent Trustees, as well as experience or skills that may be appropriate in light of future changes to board composition, business conditions, and regulatory or other developments, have also been considered by the professional search firms and the Governance and Nominating Committee. In addition, the Board takes into account the Trustees' commitment and participation in Board and committee meetings, as well as their leadership of standing and ad hoc committees throughout their tenure.
In determining that a particular Trustee was and continues to be qualified to serve as a Trustee, the Board has considered a variety of criteria, none of which, in isolation, was controlling. The Board believes that, collectively, the Trustees have balanced and diverse experience, qualifications, attributes, and skills, which allow the Board to operate effectively in governing the fund and protecting the interests of shareholders. Information about the specific experience, skills, attributes, and qualifications of each Trustee, which in each case led to the Board's conclusion that the Trustee should serve (or continue to serve) as a trustee of the fund, is provided below.
Board Structure and Oversight Function. James C. Curvey is an interested person and currently serves as Chairman. The Trustees have determined that an interested Chairman is appropriate and benefits shareholders because an interested Chairman has a personal and professional stake in the quality and continuity of services provided to the fund. Independent Trustees exercise their informed business judgment to appoint an individual of their choosing to serve as Chairman, regardless of whether the Trustee happens to be independent or a member of management. The Independent Trustees have determined that they can act independently and effectively without having an Independent Trustee serve as Chairman and that a key structural component for assuring that they are in a position to do so is for the Independent Trustees to constitute a substantial majority for the Board. The Independent Trustees also regularly meet in executive session. Ned C. Lautenbach serves as Chairman of the Independent Trustees and as such (i) acts as a liaison between the Independent Trustees and management with respect to matters important to the Independent Trustees and (ii) with management prepares agendas for Board meetings.
Fidelity® funds are overseen by different Boards of Trustees. The fund's Board oversees Fidelity's high income and certain equity funds, and other Boards oversee Fidelity's investment-grade bond, money market, asset allocation, and other equity funds. The asset allocation funds may invest in Fidelity® funds overseen by the fund's Board. The use of separate Boards, each with its own committee structure, allows the Trustees of each group of Fidelity® funds to focus on the unique issues of the funds they oversee, including common research, investment, and operational issues. On occasion, the separate Boards establish joint committees to address issues of overlapping consequences for the Fidelity® funds overseen by each Board.
The Trustees operate using a system of committees to facilitate the timely and efficient consideration of all matters of importance to the Trustees, the fund, and fund shareholders and to facilitate compliance with legal and regulatory requirements and oversight of the fund's activities and associated risks. The Board, acting through its committees, has charged FMR and its affiliates with (i) identifying events or circumstances the occurrence of which could have demonstrably adverse effects on the fund's business and/or reputation; (ii) implementing processes and controls to lessen the possibility that such events or circumstances occur or to mitigate the effects of such events or circumstances if they do occur; and (iii) creating and maintaining a system designed to evaluate continuously business and market conditions in order to facilitate the identification and implementation processes described in (i) and (ii) above. Because the day-to-day operations and activities of the fund are carried out by or through FMR, its affiliates, and other service providers, the fund's exposure to risks is mitigated but not eliminated by the processes overseen by the Trustees. While each of the Board's committees has responsibility for overseeing different aspects of the fund's activities, oversight is exercised primarily through the Operations, Audit, and Compliance Committees. Appropriate personnel, including but not limited to the fund's Chief Compliance Officer (CCO), FMR's internal auditor, the independent accountants, the fund's Treasurer and portfolio management personnel, make periodic reports to the Board's committees, as appropriate, including an annual review of Fidelity's risk management program for the Fidelity® funds. The responsibilities of each standing committee, including their oversight responsibilities, are described further under "Standing Committees of the Trustees."
Interested Trustees*:
Correspondence intended for a Trustee who is an interested person may be sent to Fidelity Investments, 245 Summer Street, Boston, Massachusetts 02210.
Name, Year of Birth; Principal Occupations and Other Relevant Experience+
James C. Curvey (1935)
Year of Election or Appointment: 2018
Trustee
Chairman of the Board of Trustees
Mr. Curvey also serves as Trustee of other Fidelity® funds. Mr. Curvey is Vice Chairman (2007-present) and Director of FMR LLC (diversified financial services company). In addition, Mr. Curvey is an Overseer Emeritus for the Boston Symphony Orchestra, a Director of Artis-Naples, and a Trustee of Brewster Academy in Wolfeboro, New Hampshire. Previously, Mr. Curvey served as a Director of Fidelity Research & Analysis Co. (investment adviser firm, 2009-2018), Director of Fidelity Investments Money Management, Inc. (investment adviser firm, 2009-2014) and a Director of FMR and FMR Co., Inc. (investment adviser firms, 2007-2014).
* Determined to be an “Interested Trustee” by virtue of, among other things, his or her affiliation with the trust or various entities under common control with FMR.
+ The information includes the Trustee's principal occupation during the last five years and other information relating to the experience, attributes, and skills relevant to the Trustee's qualifications to serve as a Trustee, which led to the conclusion that the Trustee should serve as a Trustee for the fund.
Independent Trustees:
Correspondence intended for an Independent Trustee may be sent to Fidelity Investments, P.O. Box 55235, Boston, Massachusetts 02205-5235.
Name, Year of Birth; Principal Occupations and Other Relevant Experience+
Dennis J. Dirks (1948)
Year of Election or Appointment: 2018
Trustee
Mr. Dirks also serves as Trustee of other Fidelity® funds. Prior to his retirement in May 2003, Mr. Dirks was Chief Operating Officer and a member of the Board of The Depository Trust & Clearing Corporation (DTCC). He also served as President, Chief Operating Officer, and Board member of The Depository Trust Company (DTC) and President and Board member of the National Securities Clearing Corporation (NSCC). In addition, Mr. Dirks served as Chief Executive Officer and Board member of the Government Securities Clearing Corporation, Chief Executive Officer and Board member of the Mortgage-Backed Securities Clearing Corporation, as a Trustee and a member of the Finance Committee of Manhattan College (2005-2008), as a Trustee and a member of the Finance Committee of AHRC of Nassau County (2006-2008), as a member of the Independent Directors Council (IDC) Governing Council (2010-2015), and as a member of the Board of Directors for The Brookville Center for Children’s Services, Inc. (2009-2017). Mr. Dirks is a member of the Finance Committee (2016-present) and Board of Directors (2017-present) and is Treasurer (2018-present) of the Asolo Repertory Theatre.
Donald F. Donahue (1950)
Year of Election or Appointment: 2018
Trustee
Mr. Donahue also serves as a Trustee of other Fidelity® funds. Mr. Donahue is President and Chief Executive Officer of Miranda Partners, LLC (risk consulting for the financial services industry, 2012-present). Previously, Mr. Donahue served as a Member of the Advisory Board of certain Fidelity® funds (2015-2018) and Chief Executive Officer (2006-2012), Chief Operating Officer (2003-2006), and Managing Director, Customer Marketing and Development (1999-2003) of The Depository Trust & Clearing Corporation (financial markets infrastructure). Mr. Donahue serves as a Member (2007-present) and Co-Chairman (2016-present) of the Board of Directors of United Way of New York, Member of the Board of Directors of NYC Leadership Academy (2012-present) and Member of the Board of Advisors of Ripple Labs, Inc. (financial services, 2015-present). He also served as Chairman (2010-2012) and Member of the Board of Directors (2012-2013) of Omgeo, LLC (financial services), Treasurer of United Way of New York (2012-2016), and Member of the Board of Directors of XBRL US (financial services non-profit, 2009-2012) and the International Securities Services Association (2009-2012).
Alan J. Lacy (1953)
Year of Election or Appointment: 2018
Trustee
Mr. Lacy also serves as Trustee of other Fidelity® funds. Mr. Lacy serves as a Director of Bristol-Myers Squibb Company (global pharmaceuticals, 2008-present). He is a Trustee of the California Chapter of The Nature Conservancy (2015-present) and a Director of the Center for Advanced Study in the Behavioral Sciences at Stanford University (2015-present). In addition, Mr. Lacy served as Senior Adviser (2007-2014) of Oak Hill Capital Partners, L.P. (private equity) and also served as Chief Executive Officer (2005) and Vice Chairman (2005-2006) of Sears Holdings Corporation (retail) and Chief Executive Officer and Chairman of the Board of Sears, Roebuck and Co. (retail, 2000-2005). Previously, Mr. Lacy served as Chairman (2014-2017) and a member (2010-2017) of the Board of Directors of Dave & Buster’s Entertainment, Inc. (restaurant and entertainment complexes), as Chairman (2008-2011) and a member (2006-2015) of the Board of Trustees of the National Parks Conservation Association, and as a member of the Board of Directors for The Hillman Companies, Inc. (hardware wholesalers, 2010-2014), Earth Fare, Inc. (retail grocery, 2010-2014), and The Western Union Company (global money transfer, 2006-2011).
Ned C. Lautenbach (1944)
Year of Election or Appointment: 2018
Trustee
Chairman of the Independent Trustees
Mr. Lautenbach also serves as Trustee of other Fidelity® funds. Mr. Lautenbach currently serves as Chair (2018-present) and Member (2013-present) of the Board of Governors, State University System of Florida and is a member of the Council on Foreign Relations (1994-present). He is also a member and has most recently served as Chairman of the Board of Directors of Artis-Naples (2012-present). Previously, Mr. Lautenbach served as a member and then Lead Director of the Board of Directors of Eaton Corporation (diversified industrial, 1997-2016). He was also a Partner and Advisory Partner at Clayton, Dubilier & Rice, LLC (private equity investment, 1998-2010), as well as a Director of Sony Corporation (2006-2007). In addition, Mr. Lautenbach also had a 30-year career with IBM (technology company) during which time he served as Senior Vice President and a member of the Corporate Executive Committee (1968-1998).
Joseph Mauriello (1944)
Year of Election or Appointment: 2018
Trustee
Mr. Mauriello also serves as Trustee of other Fidelity® funds. Prior to his retirement in January 2006, Mr. Mauriello served in numerous senior management positions including Deputy Chairman and Chief Operating Officer (2004-2005), and Vice Chairman of Financial Services (2002-2004) of KPMG LLP US (professional services, 1965-2005). Mr. Mauriello currently serves as a member of the Independent Directors Council (IDC) Governing Council (2015-present). Previously, Mr. Mauriello served as a member of the Board of Directors of XL Group plc. (global insurance and re-insurance, 2006-2018).
Cornelia M. Small (1944)
Year of Election or Appointment: 2018
Trustee
Ms. Small also serves as Trustee of other Fidelity® funds. Ms. Small is a member of the Board of Directors (2009-present) and Chair of the Investment Committee (2010-present) of the Teagle Foundation. Ms. Small also serves on the Investment Committee of the Berkshire Taconic Community Foundation (2008-present). Previously, Ms. Small served as Chairperson (2002-2008) and a member of the Investment Committee and Chairperson (2008-2012) and a member of the Board of Trustees of Smith College. In addition, Ms. Small served as Chief Investment Officer, Director of Global Equity Investments, and a member of the Board of Directors of Scudder, Stevens & Clark and Scudder Kemper Investments.
Garnett A. Smith (1947)
Year of Election or Appointment: 2013
Trustee
Mr. Smith also serves as Trustee of other Fidelity® funds. Prior to Mr. Smith's retirement, he served as Chairman and Chief Executive Officer of Inbrand Corp. (manufacturer of personal absorbent products, 1990-1997). He also served as President (1986-1990) of Inbrand Corp. Prior to his employment with Inbrand Corp., he was employed by a retail fabric chain and North Carolina National Bank. In addition, Mr. Smith served as a Member of the Advisory Board of certain Fidelity® funds (2012-2013) and as a board member of the Jackson Hole Land Trust (2009-2012).
David M. Thomas (1949)
Year of Election or Appointment: 2018
Trustee
Mr. Thomas also serves as Trustee of other Fidelity® funds. Mr. Thomas serves as Non-Executive Chairman of the Board of Directors of Fortune Brands Home and Security (home and security products, 2011-present) and as a member of the Board of Directors (2004-present) and Presiding Director (2013-present) of Interpublic Group of Companies, Inc. (marketing communication). Previously, Mr. Thomas served as Executive Chairman (2005-2006) and Chairman and Chief Executive Officer (2000-2005) of IMS Health, Inc. (pharmaceutical and healthcare information solutions), a Director of Fortune Brands, Inc. (consumer products, 2000-2011), and a member of the Board of Trustees of the University of Florida (2013-2018).
Michael E. Wiley (1950)
Year of Election or Appointment: 2008
Trustee [Include if document contains trusts for which the individual serves as Trustee and trusts for which he/she does not serve as Trustee: of Name(s) of Trust(s)]
Mr. Wiley also serves as Trustee or Member of the Advisory Board of other Fidelity® funds. Mr. Wiley serves as a Director of High Point Resources (exploration and production, 2005-present). Previously, Mr. Wiley served as a Director of Andeavor Corporation (independent oil refiner and marketer, 2005-2018), a Director of Andeavor Logistics LP (natural resources logistics, 2015-2018), a Director of Post Oak Bank (privately-held bank, 2004-2018), a Director of Asia Pacific Exploration Consolidated (international oil and gas exploration and production, 2008-2013), a member of the Board of Trustees of the University of Tulsa (2000-2006; 2007-2010), a Senior Energy Advisor of Katzenbach Partners, LLC (consulting, 2006-2007), an Advisory Director of Riverstone Holdings (private investment), a Director of Spinnaker Exploration Company (exploration and production, 2001-2005) and Chairman, President, and CEO of Baker Hughes, Inc. (oilfield services, 2000-2004).
+ The information includes the Trustee's principal occupation during the last five years and other information relating to the experience, attributes, and skills relevant to the Trustee's qualifications to serve as a Trustee, which led to the conclusion that the Trustee should serve as a Trustee for the fund.
Advisory Board Members and Officers:
Correspondence intended for a Member of the Advisory Board (if any) may be sent to Fidelity Investments, P.O. Box 55235, Boston, Massachusetts 02205-5235. Correspondence intended for an officer or Peter S. Lynch may be sent to Fidelity Investments, 245 Summer Street, Boston, Massachusetts 02210. Officers appear below in alphabetical order.
Name, Year of Birth; Principal Occupation
Vicki L. Fuller (1957)
Year of Election or Appointment: 2018
Member of the Advisory Board
Ms. Fuller also serves as Member of the Advisory Board of other Fidelity® funds. Ms. Fuller serves as a member of the Board of Directors, Audit Committee, and Nominating and Governance Committee of The Williams Companies, Inc. (natural gas infrastructure, 2018-present). Previously, Ms. Fuller served as the Chief Investment Officer of the New York State Common Retirement Fund (2012-2018) and held a variety of positions at AllianceBernstein L.P. (global asset management, 1985-2012), including Managing Director (2006-2012) and Senior Vice President and Senior Portfolio Manager (2001-2006).
Patricia L. Kampling (1959)
Year of Election or Appointment: 2020
Member of the Advisory Board
Ms. Kampling also serves as Member of the Advisory Board of other Fidelity® funds. Prior to her retirement, Ms. Kampling served as Chairman of the Board and Chief Executive Officer (2012-2019), President and Chief Operating Officer (2011-2012) and Executive Vice President and Chief Financial Officer (2010-2011) of Alliant Energy Corporation. Ms. Kampling currently serves as a member of the Board, Compensation Committee and Executive Committee and as Chair of the Audit Committee of Briggs & Stratton Corporation (manufacturing, 2011-present) and as a member of the Board, Audit, Finance and Risk Committee and Safety, Environmental, Technology and Operations Committee of American Water Works Company, Inc. (utilities company, 2019-present). In addition, Ms. Kampling currently serves as a member of the Board of the Nature Conservancy, Wisconsin Chapter (2019-present). Previously, Ms. Kampling served as a member of the Board of Interstate Power and Light Company (2012-2019) and Wisconsin Power and Light Company (2012-2019) (each a subsidiary of Alliant Energy Corporation) and as a member of the Board and Workforce Development Committee of the Business Roundtable (2018-2019).
Peter S. Lynch (1944)
Year of Election or Appointment: 2018
Member of the Advisory Board
Mr. Lynch also serves as Member of the Advisory Board of other Fidelity® funds. Mr. Lynch is Vice Chairman and a Director of Fidelity Management & Research Company LLC (investment adviser firm). In addition, Mr. Lynch serves as a Trustee of Boston College and as the Chairman of the Inner-City Scholarship Fund. Previously, Mr. Lynch served as Vice Chairman and a Director of FMR Co., Inc. (investment adviser firm) and on the Special Olympics International Board of Directors (1997-2006).
Susan Tomasky (1953)
Year of Election or Appointment: 2020
Member of the Advisory Board
Ms. Tomasky also serves as Member of the Advisory Board of other Fidelity® funds. Prior to her retirement, Ms. Tomasky served in various executive officer positions at American Electric Power Company, Inc. (1998-2011), including most recently as President of AEP Transmission (2007-2011). Ms. Tomasky currently serves as a member of the Board and Sustainability Committee and as Chair of the Audit Committee of Marathon Petroleum Corporation (2018-present) and as a member of the Board, Corporate Governance Committee and Organization and Compensation Committee and as Chair of the Audit Committee of Public Service Enterprise Group, Inc. (utilities company, 2012-present). In addition, Ms. Tomasky currently serves as a member of the Board of the Columbus Regional Airport Authority (2007-present), as a member of the Board of the Royal Shakespeare Company – America (2009-present), as a member of the Board of the Columbus Association for the Performing Arts (2011-present) and as a member of the Board of Kenyon College (2016-present). Previously, Ms. Tomasky served as a member of the Board (2011-2019) and as Lead Independent Director (2015-2018) of Andeavor Corporation (previously Tesoro Corporation) (independent oil refiner and marketer) and as a member of the Board of Summit Midstream Partners LP (energy, 2012-2018).
Elizabeth Paige Baumann (1968)
Year of Election or Appointment: 2017
Anti-Money Laundering (AML) Officer
Ms. Baumann also serves as AML Officer of other funds. She is Chief AML Officer (2012-present) and Senior Vice President (2014-present) of FMR LLC (diversified financial services company) and is an employee of Fidelity Investments. Previously, Ms. Baumann served as AML Officer of the funds (2012-2016), and Vice President (2007-2014) and Deputy Anti-Money Laundering Officer (2007-2012) of FMR LLC.
Craig S. Brown (1977)
Year of Election or Appointment: 2019
Assistant Treasurer
Mr. Brown also serves as Assistant Treasurer of other funds. Mr. Brown is an employee of Fidelity Investments (2013-present).
John J. Burke III (1964)
Year of Election or Appointment: 2018
Chief Financial Officer
Mr. Burke also serves as Chief Financial Officer of other funds. Mr. Burke serves as Head of Investment Operations for Fidelity Fund and Investment Operations (2018-present) and is an employee of Fidelity Investments (1998-present). Previously Mr. Burke served as head of Asset Management Investment Operations (2012-2018).
William C. Coffey (1969)
Year of Election or Appointment: 2019
Assistant Secretary
Mr. Coffey also serves as Assistant Secretary of other funds. He is Senior Vice President and Deputy General Counsel of FMR LLC (diversified financial services company, 2010-present), and is an employee of Fidelity Investments. Previously, Mr. Coffey served as Secretary and CLO of certain funds (2018-2019); CLO, Secretary, and Senior Vice President of Fidelity Management & Research Company and FMR Co., Inc. (investment adviser firms, 2018-2019); Secretary of Fidelity SelectCo, LLC and Fidelity Investments Money Management, Inc. (investment adviser firms, 2018-2019); CLO of Fidelity Management & Research (Hong Kong) Limited, FMR Investment Management (UK) Limited, and Fidelity Management & Research (Japan) Limited (investment adviser firms, 2018-2019); and Assistant Secretary of certain funds (2009-2018).
Timothy M. Cohen (1969)
Year of Election or Appointment: 2018
Vice President
Mr. Cohen also serves as Vice President of other funds. Mr. Cohen serves as Co-Head of Equity (2018-present), a Director of Fidelity Management & Research (Japan) Limited (investment adviser firm, 2016-present), and is an employee of Fidelity Investments. Previously, Mr. Cohen served as Executive Vice President of Fidelity SelectCo, LLC (2019), Head of Global Equity Research (2016-2018), Chief Investment Officer - Equity and a Director of Fidelity Management & Research (U.K.) Inc. (investment adviser firm, 2013-2015) and as a Director of Fidelity Management & Research (Hong Kong) Limited (investment adviser firm, 2017).
Jonathan Davis (1968)
Year of Election or Appointment: 2010
Assistant Treasurer
Mr. Davis also serves as Assistant Treasurer of other funds. Mr. Davis serves as Assistant Treasurer of FMR Capital, Inc. (2017-present) and is an employee of Fidelity Investments. Previously, Mr. Davis served as Vice President and Associate General Counsel of FMR LLC (diversified financial services company, 2003-2010).
Laura M. Del Prato (1964)
Year of Election or Appointment: 2018
Assistant Treasurer
Ms. Del Prato also serves as an officer of other funds. Ms. Del Prato is an employee of Fidelity Investments (2017-present). Prior to joining Fidelity Investments, Ms. Del Prato served as a Managing Director and Treasurer of the JPMorgan Mutual Funds (2014-2017). Prior to JPMorgan, Ms. Del Prato served as a partner at Cohen Fund Audit Services (accounting firm, 2012-2013) and KPMG LLP (accounting firm, 2004-2012).
Colm A. Hogan (1973)
Year of Election or Appointment: 2020
Assistant Treasurer
Mr. Hogan also serves as an officer of other funds. Mr. Hogan serves as Assistant Treasurer of FMR Capital, Inc. (2017-present) and is an employee of Fidelity Investments (2005-present). Previously, Mr. Hogan served as Deputy Treasurer of certain Fidelity® funds (2016-2020) and Assistant Treasurer of certain Fidelity® funds (2016-2018).
Pamela R. Holding (1964)
Year of Election or Appointment: 2018
Vice President
Ms. Holding also serves as Vice President of other funds. Ms. Holding serves as Co-Head of Equity (2018-present) and is an employee of Fidelity Investments (2013-present). Previously, Ms. Holding served as Executive Vice President of Fidelity SelectCo, LLC (2019) and as Chief Investment Officer of Fidelity Institutional Asset Management (2013-2018).
Cynthia Lo Bessette (1969)
Year of Election or Appointment: 2019
Secretary and Chief Legal Officer (CLO)
Ms. Lo Bessette also serves as an officer of other funds. Ms. Lo Bessette serves as CLO, Secretary, and Senior Vice President of Fidelity Management & Research Company LLC (investment adviser firm, 2019-present); and CLO of Fidelity Management & Research (Hong Kong) Limited, FMR Investment Management (UK) Limited, and Fidelity Management & Research (Japan) Limited (investment adviser firms, 2019-present). She is a Senior Vice President and Deputy General Counsel of FMR LLC (diversified financial services company, 2019-present), and is an employee of Fidelity Investments. Previously, Ms. Lo Bessette served as CLO, Secretary, and Senior Vice President of FMR Co., Inc. (investment adviser firm, 2019); Secretary of Fidelity SelectCo, LLC and Fidelity Investments Money Management, Inc. (investment adviser firms, 2019). Prior to joining Fidelity Investments, Ms. Lo Bessette was Executive Vice President, General Counsel (2016-2019) and Senior Vice President, Deputy General Counsel (2015-2016) of OppenheimerFunds (investment management company) and Deputy Chief Legal Officer (2013-2015) of Jennison Associates LLC (investment adviser firm).
Chris Maher (1972)
Year of Election or Appointment: 2020
Deputy Treasurer
Mr. Maher also serves as an officer of other funds. Mr. Maher serves as Assistant Treasurer of FMR Capital, Inc. (2017-present), and is an employee of Fidelity Investments (2008-present). Previously, Mr. Maher served as Assistant Treasurer of certain funds (2013-2020); Vice President of Asset Management Compliance (2013), Vice President of the Program Management Group of FMR (investment adviser firm, 2010-2013), and Vice President of Valuation Oversight (2008-2010).
Kenneth B. Robins (1969)
Year of Election or Appointment: 2018
Chief Compliance Officer
Mr. Robins also serves as an officer of other funds. Mr. Robins serves as Compliance Officer of Fidelity Management & Research Company LLC (investment adviser firm, 2016-present) and is an employee of Fidelity Investments (2004-present). Previously, Mr. Robins served as Compliance Officer of FMR Co., Inc. (investment adviser firm, 2016-2019), as Executive Vice President of Fidelity Investments Money Management, Inc. (investment adviser firm, 2013-2016) and served in other fund officer roles.
Stacie M. Smith (1974)
Year of Election or Appointment: 2018
President and Treasurer
Ms. Smith also serves as an officer of other funds. Ms. Smith serves as Assistant Treasurer of FMR Capital, Inc. (2017-present), is an employee of Fidelity Investments (2009-present), and has served in other fund officer roles. Prior to joining Fidelity Investments, Ms. Smith served as Senior Audit Manager of Ernst & Young LLP (accounting firm, 1996-2009). Previously, Ms. Smith served as Assistant Treasurer (2013-2019) and Deputy Treasurer (2013-2016) of certain Fidelity® funds.
Marc L. Spector (1972)
Year of Election or Appointment: 2017
Assistant Treasurer
Mr. Spector also serves as an officer of other funds. Mr. Spector serves as Assistant Treasurer of FMR Capital, Inc. (2017-present) and is an employee of Fidelity Investments (2016-present). Prior to joining Fidelity Investments, Mr. Spector served as Director at the Siegfried Group (accounting firm, 2013-2016), and prior to Siegfried Group as audit senior manager at Deloitte & Touche (accounting firm, 2005-2013).
Jim Wegmann (1979)
Year of Election or Appointment: 2019
Assistant Treasurer
Mr. Wegmann also serves as Assistant Treasurer of other funds. Mr. Wegmann is an employee of Fidelity Investments (2011-present).
Shareholder Expense Example
As a shareholder of the Fund, you incur two types of costs: (1) transaction costs and (2) ongoing costs, including management fees and other Fund expenses. This Example is intended to help you understand your ongoing costs (in dollars) of investing in the Fund and to compare these costs with the ongoing costs of investing in other mutual funds.
The Example is based on an investment of $1,000 invested at the beginning of the period and held for the entire period (July 1, 2019 to December 31, 2019).
Actual Expenses
The first line of the accompanying table for each class of the Fund provides information about actual account values and actual expenses. You may use the information in this line, together with the amount you invested, to estimate the expenses that you paid over the period. Simply divide your account value by $1,000.00 (for example, an $8,600 account value divided by $1,000.00 = 8.6), then multiply the result by the number in the first line for a class of the Fund under the heading entitled "Expenses Paid During Period" to estimate the expenses you paid on your account during this period. The estimate of expenses does not include any fees or other expenses of any variable annuity or variable life insurance product. If they were, the estimate of expenses you paid during the period would be higher, and your ending account value would be lower. In addition, the Fund, as a shareholder in the underlying Fidelity Central Funds, will indirectly bear its pro-rata share of the fees and expenses incurred by the underlying Fidelity Central Funds. These fees and expenses are not included in the Fund's annualized expense ratio used to calculate the expense estimate in the table below.
Hypothetical Example for Comparison Purposes
The second line of the accompanying table for each class of the Fund provides information about hypothetical account values and hypothetical expenses based on a Class' actual expense ratio and an assumed rate of return of 5% per year before expenses, which is not the Class' actual return. The hypothetical account values and expenses may not be used to estimate the actual ending account balance or expenses you paid for the period. You may use this information to compare the ongoing costs of investing in the Fund and other funds. To do so, compare this 5% hypothetical example with the 5% hypothetical examples that appear in the shareholder reports of the other funds. The estimate of expenses does not include any fees or other expenses of any variable annuity or variable life insurance product. If they were, the estimate of expenses you paid during the period would be higher, and your ending account value would be lower. In addition, the Fund, as a shareholder in the underlying Fidelity Central Funds, will indirectly bear its pro-rata share of the fees and expenses incurred by the underlying Fidelity Central Funds. These fees and expenses are not included in the Fund's annualized expense ratio used to calculate the expense estimate in the table below.
Please note that the expenses shown in the table are meant to highlight your ongoing costs only and do not reflect any transaction costs. Therefore, the second line of the table is useful in comparing ongoing costs only, and will not help you determine the relative total costs of owning different funds.
| | Annualized Expense Ratio-A | Beginning
Account Value
July 1, 2019 | Ending
Account Value
December 31, 2019 | Expenses Paid
During Period-B
July 1, 2019
to December 31, 2019 |
| Initial Class | .67% | | | |
| Actual | | $1,000.00 | $1,134.10 | $3.60 |
| Hypothetical-C | | $1,000.00 | $1,021.83 | $3.41 |
| Investor Class | .75% | | | |
| Actual | | $1,000.00 | $1,134.00 | $4.03 |
| Hypothetical-C | | $1,000.00 | $1,021.42 | $3.82 |
A Annualized expense ratio reflects expenses net of applicable fee waivers.
B Expenses are equal to each Class' annualized expense ratio, multiplied by the average account value over the period, multiplied by 184/365 (to reflect the one-half year period).
C 5% return per year before expenses
Distributions (Unaudited)
The Board of Trustees of VIP Financial Services Portfolio voted to pay to shareholders of record at the opening of business on record date, the following distributions per share derived from capital gains realized from sales of portfolio securities, and dividends derived from net investment income:
| | Pay Date | Record Date | Dividends | Capital Gains |
| VIP Financial Services Portfolio | | | | |
| Initial Class | 02/14/2020 | 02/14/2020 | $0.041 | $1.082 |
| Investor Class | 02/14/2020 | 02/14/2020 | $0.040 | $1.082 |
|
The fund hereby designates as a capital gain dividend with respect to the taxable year ended December 31, 2019, $12,472,933, or, if subsequently determined to be different, the net capital gain of such year.
Initial Class and Investor Class designate 100% of the dividends distributed during the fiscal year as qualifying for the dividends–received deduction for corporate shareholders.
Board Approval of Investment Advisory Contracts
VIP Financial Services Portfolio
At its November 2019 meeting, the Board of Trustees, including the Independent Trustees (together, the Board), voted to approve an amended and restated management contract and amended and restated sub-advisory agreements (together, the Amended and Restated Contracts) for the fund, effective January 1, 2020, for a one month period through January 31, 2020, in connection with an upcoming consolidation of certain of Fidelity's advisory businesses.
The Board considered that, on or about January 1, 2020, each of FMR Co., Inc. (FMRC), Fidelity Investments Money Management, Inc. (FIMM), and SelectCo, LLC (SelectCo) will merge with and into Fidelity Management & Research Company (FMR) and that, after the merger, FMR will redomicile as a Delaware limited liability company. The Board also approved the termination of the sub-advisory agreement with FMRC upon the completion of the merger. The Board noted that the Amended and Restated Contracts would be updated to reflect the renamed adviser, Fidelity Management & Research Company LLC and its new form of organization and domicile. The Board also noted that the Amended and Restated Contracts will not change the investment processes, the level or nature of services provided, the resources and personnel allocated, trading and compliance operations, or any fees or expenses paid by the fund.
The Board concluded that the fund's Amended and Restated Contracts are fair and reasonable, and that the fund's Advisory Contracts should be approved through January 31, 2020.
In connection with its consideration of future renewals of the fund's Amended and Restated Contracts, the Board will consider: (i) the nature, extent and quality of services provided to the fund, including shareholder and administrative services and investment performance; (ii) the competitiveness of the management fee and total expenses for the fund; (iii) the costs of the services and profitability, including the revenues earned and the expenses incurred in conducting the business of developing, marketing, distributing, managing, administering, and servicing the fund and its shareholders, to the extent applicable; and (iv) whether there have been economies of scale in respect of the Fidelity funds, whether the Fidelity funds (including the fund) have appropriately benefited from any such economies of scale, and whether there is the potential for realization of any further economies.
Based on its evaluation of all of the conclusions noted above, and after considering all factors it believed relevant, the Board ultimately concluded that the fund's management fee structure is fair and reasonable, and that the continuation of the fund's Amended and Restated Contracts should be approved.
VFSIC-ANN-0220
1.817367.115
Fidelity® Variable Insurance Products:
Health Care Portfolio
Annual Report
December 31, 2019
See the inside front cover for important information about access to your fund’s shareholder reports.
Beginning on January 1, 2021, as permitted by regulations adopted by the Securities and Exchange Commission, and if your insurance carrier elects to participate, you may not be receiving paper copies of the Fund’s shareholder reports from the insurance company that offers your variable insurance product unless you specifically request paper copies from your financial professional or the administrator of your variable insurance product. Instead, the reports will be made available on a website, and you will be notified by mail each time a report is posted and provided with a website link to access the report.
If you already elected to receive shareholder reports electronically, you will not be affected by this change and you need not take any action. You may elect to receive shareholder reports and other communications from the Fund electronically, by contacting your financial professional or the administrator of your variable insurance product. If you own a Fidelity-administered variable insurance product, please visit fidelity.com/mailpreferences to make your election or call 1-800-343-3548.
You may elect to receive all future reports in paper free of charge. If you wish to continue receiving paper copies of your shareholder reports, you may contact your financial professional or the administrator of your variable insurance product. If you own a Fidelity-administered variable insurance product, please visit fidelity.com/mailpreferences to make your election or call 1-800-343-3548. Your election to receive reports in paper will apply to all funds available under your variable insurance product.
Contents
To view a fund's proxy voting guidelines and proxy voting record for the 12-month period ended June 30, visit http://www.fidelity.com/proxyvotingresults or visit the Securities and Exchange Commission's (SEC) web site at http://www.sec.gov.
You may also call 1-877-208-0098 to request a free copy of the proxy voting guidelines.
Fidelity® Variable Insurance Products are separate account options which are purchased through a variable insurance contract.
Standard & Poor's, S&P and S&P 500 are registered service marks of The McGraw-Hill Companies, Inc. and have been licensed for use by Fidelity Distributors Corporation.
Other third-party marks appearing herein are the property of their respective owners.
All other marks appearing herein are registered or unregistered trademarks or service marks of FMR LLC or an affiliated company. © 2020 FMR LLC. All rights reserved.
This report and the financial statements contained herein are submitted for the general information of the shareholders of the Fund. This report is not authorized for distribution to prospective investors in the Fund unless preceded or accompanied by an effective prospectus.
A fund files its complete schedule of portfolio holdings with the SEC for the first and third quarters of each fiscal year on Form N-PORT. Forms N-PORT are available on the SEC’s web site at http://www.sec.gov. A fund's Forms N-PORT may be reviewed and copied at the SEC’s Public Reference Room in Washington, DC. Information regarding the operation of the SEC's Public Reference Room may be obtained by calling 1-800-SEC-0330.
For a complete list of a fund's portfolio holdings, view the most recent holdings listing, semiannual report, or annual report on Fidelity's web site at http://www.fidelity.com, http://www.institutional.fidelity.com, or http://www.401k.com, as applicable.
NOT FDIC INSURED •MAY LOSE VALUE •NO BANK GUARANTEE
Neither the Fund nor Fidelity Distributors Corporation is a bank.
Note to shareholders:
As part of a regular review of its organizational structure, Fidelity has decided to merge certain entities to streamline operations, increase efficiency, simplify reporting, and reduce legal, compliance, and accounting complexity and costs. In separate events, Fidelity has merged four of its investment advisers and two of its broker-dealers.
Effective on or about January 1, 2020, following any required regulatory notices and approvals:
Investment advisers Fidelity Investments Money Management, Inc., FMR Co., Inc., and Fidelity SelectCo, LLC, merged with and into Fidelity Management & Research Company. In connection with the merger transactions, the resulting, merged investment adviser was then redomiciled from Massachusetts to Delaware, changed its corporate structure from a corporation to a limited liability company, and changed its name to “Fidelity Management & Research Company LLC”.
Broker-dealer Fidelity Distributors Corporation merged with and into Fidelity Investments Institutional Services Company, Inc. (“FIISC”). FIISC was then redomiciled from Massachusetts to Delaware, changed its corporate structure from a corporation to a limited liability company, and changed its name to “Fidelity Distributors Company LLC”.
These mergers are not expected to affect fund shareholders or Fidelity clients, nor are they expected to result in any changes to the day-to-day management of Fidelity’s brokerage services, the Fidelity funds, their investment policies and practices, their portfolio management teams, or the funds’ expenses.
Performance: The Bottom Line
Average annual total return reflects the change in the value of an investment, assuming reinvestment of distributions from dividend income and capital gains (the profits earned upon the sale of securities that have grown in value, if any) and assuming a constant rate of performance each year. During periods of reimbursement by Fidelity, a fund’s total return will be greater than it would be had the reimbursement not occurred. Performance numbers are net of all underlying fund operating expenses, but do not include any insurance charges imposed by your insurance company’s separate account. If performance information included the effect of these additional charges, the total returns would have been lower. How a fund did yesterday is no guarantee of how it will do tomorrow.
Average Annual Total Returns
| For the periods ended December 31, 2019 | Past 1 year | Past 5 years | Past 10 years |
| Initial Class | 28.37% | 10.53% | 18.04% |
| Service Class 2 | 28.15% | 10.49% | 18.02% |
| Investor Class | 28.29% | 10.44% | 17.95% |
The initial offering of Service Class 2 shares took place on April 11, 2019. Returns prior to April 11, 2019 are those of Initial Class.
$10,000 Over 10 Years
Let's say hypothetically that $10,000 was invested in VIP Health Care Portfolio - Initial Class on December 31, 2009.
The chart shows how the value of your investment would have changed, and also shows how the S&P 500® Index performed over the same period.
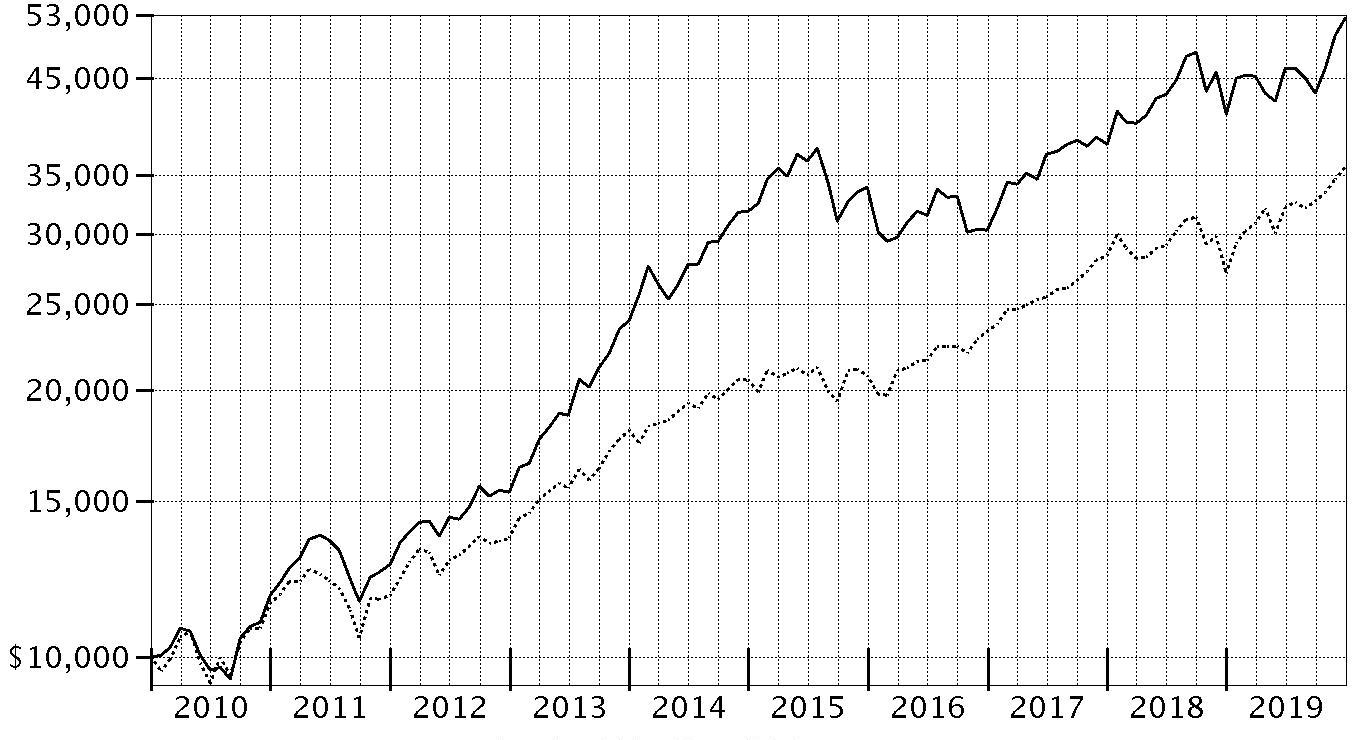
| Period Ending Values |
| $52,522 | VIP Health Care Portfolio - Initial Class |
| $35,666 | S&P 500® Index |
Management's Discussion of Fund Performance
Market Recap: U.S. stocks continued to roll in 2019, with the S&P 500
® index soaring 31.49% and marking history as the longest and strongest bull market ever, despite persistent, nagging concerns about global economic growth and trade. After a rough end to 2018, equities sharply reversed course to begin the new year amid upbeat company earnings and signs the Federal Reserve may pause on rates. The uptrend continued until May, when the index sunk as trade negotiations between the U.S. and China broke down. The bull market roared back to record a series of highs in July, when the Fed cut interest rates for the first time since 2008. Volatility intensified in August, as the Treasury yield curve inverted, which some investors viewed as a sign the U.S. economy could be heading for recession. But the market proved resilient, hitting a new high on October 30, when the Fed lowered rates for the third time in 2019, and moving even higher through year-end. Gains were robust and broad-based, with information technology (+50%) leading the way with its best calendar-year result in a decade, amid strong growth trends. Communication services (+33%) and financials (+32%) also stood out. In contrast, energy (+12%) was by far the weakest group – struggling amid sluggish oil prices – while several strong gainers nonetheless fell short of the broader market: industrials and real estate (+29% each), consumer discretionary and consumer staples (+28% each), utilities (+26%), materials (+25%), and health care (+21%).
Comments from Portfolio Manager Eddie Yoon: For the fiscal year, the fund’s share classes gained roughly 28%, handily outpacing the 22.03% advance of the benchmark MSCI U.S. IMI Health Care 25/50 Index, but trailing the broad-market S&P 500 index. Health care stocks underperformed the broader equity market in 2019 amid a resurgence of legal and political rhetoric around the Affordable Care Act (ACA) and the potential for a “Medicare-for-all” scenario after the 2020 U.S. election. The sector did post a solid gain, however, as health care companies benefited from strong demand for products and services on the back of secular trends, including an aging population. Many firms also boasted solid business fundamentals, and several industries continued to experience innovation and accelerating growth. Versus the sector index, strong security selection significantly contributed to the fund’s performance in 2019, especially within the biotechnology, pharmaceuticals and managed care industries. Avoiding index component and pharma giant Pfizer (-7%) was the fund’s biggest individual relative contributor this period. An overweighting in Array BioPharma (+237%) was another large relative contributor. Array was acquired by Pfizer in July, and thus the fund did not hold Array at period end. Conversely, an out-of-index position in Benefitfocus (-52%), a provider of cloud-based benefits software solutions, was the fund’s biggest individual detractor. Several headwinds hurt the stock this period, including Benefitfocus' announcement of its third CFO departure in three years and consecutive quarters of disappointing financial results. Avoiding index component and biopharma firm Celgene (+69%) also hurt the fund’s relative result the past year.
The views expressed above reflect those of the portfolio manager(s) only through the end of the period as stated on the cover of this report and do not necessarily represent the views of Fidelity or any other person in the Fidelity organization. Any such views are subject to change at any time based upon market or other conditions and Fidelity disclaims any responsibility to update such views. These views may not be relied on as investment advice and, because investment decisions for a Fidelity fund are based on numerous factors, may not be relied on as an indication of trading intent on behalf of any Fidelity fund.
Investment Summary (Unaudited)
Top Ten Stocks as of December 31, 2019
| | % of fund's net assets |
| UnitedHealth Group, Inc. | 7.9 |
| Boston Scientific Corp. | 6.8 |
| Roche Holding AG (participation certificate) | 5.8 |
| Becton, Dickinson & Co. | 5.0 |
| AstraZeneca PLC (United Kingdom) | 5.0 |
| Vertex Pharmaceuticals, Inc. | 4.7 |
| Cigna Corp. | 4.5 |
| Eli Lilly & Co. | 4.4 |
| Humana, Inc. | 3.6 |
| Intuitive Surgical, Inc. | 3.4 |
| | 51.1 |
Top Industries (% of fund's net assets)
| As of December 31, 2019 |
| | Health Care Equipment & Supplies | 26.0% |
| | Biotechnology | 25.4% |
| | Health Care Providers & Services | 24.6% |
| | Pharmaceuticals | 20.7% |
| | Life Sciences Tools & Services | 1.7% |
| | All Others* | 1.6% |

* Includes short-term investments and net other assets (liabilities).
Schedule of Investments December 31, 2019
Showing Percentage of Net Assets
| Common Stocks - 98.3% | | | |
| | | Shares | Value |
| Biotechnology - 25.4% | | | |
| Biotechnology - 25.4% | | | |
| AbbVie, Inc. | | 90,000 | $7,968,600 |
| Acceleron Pharma, Inc. (a) | | 100,000 | 5,302,000 |
| Alexion Pharmaceuticals, Inc. (a) | | 100,000 | 10,815,000 |
| Allogene Therapeutics, Inc. (a)(b) | | 34,000 | 883,320 |
| Alnylam Pharmaceuticals, Inc. (a) | | 86,000 | 9,904,620 |
| Amgen, Inc. | | 90,000 | 21,696,300 |
| Aprea Therapeutics, Inc. | | 50,000 | 2,294,500 |
| Argenx SE ADR (a) | | 74,000 | 11,878,480 |
| Ascendis Pharma A/S sponsored ADR (a) | | 96,300 | 13,397,256 |
| BeiGene Ltd. ADR (a) | | 30,000 | 4,972,800 |
| BELLUS Health, Inc. (a) | | 135,100 | 1,026,760 |
| BioNTech AG | | 186,138 | 5,675,720 |
| bluebird bio, Inc. (a)(b) | | 65,000 | 5,703,750 |
| Blueprint Medicines Corp. (a) | | 114,000 | 9,132,540 |
| Cellectis SA sponsored ADR (a) | | 96,000 | 1,643,520 |
| FibroGen, Inc. (a) | | 120,000 | 5,146,800 |
| G1 Therapeutics, Inc. (a) | | 116,000 | 3,065,880 |
| Gritstone Oncology, Inc. (a) | | 60,000 | 538,200 |
| Innovent Biolgics, Inc. (a)(c) | | 600,000 | 2,044,326 |
| Insmed, Inc. (a) | | 150,000 | 3,582,000 |
| Intercept Pharmaceuticals, Inc. (a)(b) | | 44,000 | 5,452,480 |
| Kura Oncology, Inc. (a) | | 120,000 | 1,650,000 |
| Morphic Holding, Inc. | | 14,300 | 245,388 |
| Morphosys AG (a) | | 23,079 | 3,282,562 |
| Neurocrine Biosciences, Inc. (a) | | 70,000 | 7,524,300 |
| Principia Biopharma, Inc. (a) | | 94,000 | 5,149,320 |
| Sage Therapeutics, Inc. (a) | | 13,500 | 974,565 |
| Sarepta Therapeutics, Inc. (a)(b) | | 140,000 | 18,065,600 |
| Scholar Rock Holding Corp. (a) | | 14,000 | 184,520 |
| Turning Point Therapeutics, Inc. | | 26,000 | 1,619,540 |
| uniQure B.V. (a) | | 44,000 | 3,153,040 |
| Vertex Pharmaceuticals, Inc. (a) | | 195,000 | 42,695,250 |
| Viela Bio, Inc. | | 90,800 | 2,465,220 |
| Viking Therapeutics, Inc. (a)(b) | | 140,000 | 1,122,800 |
| Xencor, Inc. (a) | | 140,000 | 4,814,600 |
| Zymeworks, Inc. (a) | | 100,407 | 4,564,502 |
| | | | 229,636,059 |
| Diversified Consumer Services - 0.2% | | | |
| Specialized Consumer Services - 0.2% | | | |
| Carriage Services, Inc. | | 80,000 | 2,048,000 |
| Health Care Equipment & Supplies - 26.0% | | | |
| Health Care Equipment - 26.0% | | | |
| Atricure, Inc. (a) | | 180,000 | 5,851,800 |
| Becton, Dickinson & Co. | | 167,000 | 45,418,990 |
| Boston Scientific Corp. (a) | | 1,360,000 | 61,499,200 |
| Danaher Corp. | | 86,000 | 13,199,280 |
| Hologic, Inc. (a) | | 240,000 | 12,530,400 |
| Insulet Corp. (a) | | 120,000 | 20,544,000 |
| Intuitive Surgical, Inc. (a) | | 52,000 | 30,739,800 |
| Masimo Corp. (a) | | 72,000 | 11,380,320 |
| Penumbra, Inc. (a) | | 84,712 | 13,915,640 |
| Stryker Corp. | | 94,000 | 19,734,360 |
| | | | 234,813,790 |
| Health Care Providers & Services - 24.3% | | | |
| Health Care Distributors & Services - 0.5% | | | |
| EBOS Group Ltd. | | 280,000 | 4,571,028 |
| Health Care Facilities - 2.2% | | | |
| HCA Holdings, Inc. | | 134,000 | 19,806,540 |
| Health Care Services - 4.7% | | | |
| Cigna Corp. | | 198,000 | 40,489,020 |
| Premier, Inc. (a) | | 56,000 | 2,121,280 |
| | | | 42,610,300 |
| Managed Health Care - 16.9% | | | |
| Centene Corp. (a) | | 470,000 | 29,548,900 |
| HealthEquity, Inc. (a) | | 80,000 | 5,925,600 |
| Humana, Inc. | | 88,000 | 32,253,760 |
| Molina Healthcare, Inc. (a) | | 72,000 | 9,769,680 |
| Notre Dame Intermedica Participacoes SA | | 210,000 | 3,562,906 |
| UnitedHealth Group, Inc. | | 244,000 | 71,731,118 |
| | | | 152,791,964 |
|
| TOTAL HEALTH CARE PROVIDERS & SERVICES | | | 219,779,832 |
|
| Health Care Technology - 0.1% | | | |
| Health Care Technology - 0.1% | | | |
| Castlight Health, Inc. (a) | | 103,200 | 137,256 |
| Castlight Health, Inc. Class B (a) | | 200,000 | 266,000 |
| Health Catalyst, Inc. (b) | | 18,000 | 624,600 |
| | | | 1,027,856 |
| Life Sciences Tools & Services - 1.7% | | | |
| Life Sciences Tools & Services - 1.7% | | | |
| 10X Genomics, Inc. (a)(b) | | 13,200 | 1,006,500 |
| Bruker Corp. | | 120,000 | 6,116,400 |
| Lonza Group AG | | 21,000 | 7,663,980 |
| | | | 14,786,880 |
| Pharmaceuticals - 20.3% | | | |
| Pharmaceuticals - 20.3% | | | |
| AstraZeneca PLC (United Kingdom) | | 450,000 | 45,041,378 |
| Bristol-Myers Squibb Co. | | 120,000 | 7,702,800 |
| Dechra Pharmaceuticals PLC | | 160,000 | 6,146,144 |
| Eli Lilly & Co. | | 305,000 | 40,086,150 |
| MyoKardia, Inc. (a) | | 67,000 | 4,883,295 |
| Nektar Therapeutics (a)(b) | | 154,000 | 3,324,090 |
| Recordati SpA | | 70,000 | 2,949,959 |
| Roche Holding AG (participation certificate) | | 160,000 | 52,000,451 |
| RPI International Holdings LP (a)(d)(e) | | 21,133 | 3,842,930 |
| Sanofi SA | | 80,000 | 8,034,197 |
| Theravance Biopharma, Inc. (a) | | 155,000 | 4,012,950 |
| Zogenix, Inc. (a) | | 105,800 | 5,515,354 |
| | | | 183,539,698 |
| Software - 0.3% | | | |
| Application Software - 0.3% | | | |
| Benefitfocus, Inc. (a) | | 100,000 | 2,194,000 |
| TOTAL COMMON STOCKS | | | |
| (Cost $553,211,394) | | | 887,826,115 |
|
| Convertible Preferred Stocks - 0.8% | | | |
| Biotechnology - 0.0% | | | |
| Biotechnology - 0.0% | | | |
| Generation Bio Series B (a)(d)(e) | | 14,000 | 127,260 |
| Health Care Providers & Services - 0.3% | | | |
| Health Care Services - 0.3% | | | |
| 1Life Healthcare, Inc. Series G (a)(d)(e) | | 181,172 | 2,668,664 |
| Pharmaceuticals - 0.4% | | | |
| Pharmaceuticals - 0.4% | | | |
| Harmony Biosciences II, Inc.: | | | |
| Series A (a)(d)(e) | | 1,195,827 | 2,343,821 |
| Series C (d)(e) | | 427,082 | 837,081 |
| | | | 3,180,902 |
| Software - 0.1% | | | |
| Application Software - 0.1% | | | |
| Outset Medical, Inc.: | | | |
| Series C (a)(d)(e) | | 308,701 | 506,270 |
| Series D (a)(d)(e) | | 321,544 | 556,271 |
| | | | 1,062,541 |
| TOTAL CONVERTIBLE PREFERRED STOCKS | | | |
| (Cost $5,154,112) | | | 7,039,367 |
|
| Money Market Funds - 2.3% | | | |
| Fidelity Cash Central Fund 1.58% (f) | | 7,928,753 | 7,930,339 |
| Fidelity Securities Lending Cash Central Fund 1.58% (f)(g) | | 12,972,114 | 12,973,411 |
| TOTAL MONEY MARKET FUNDS | | | |
| (Cost $20,903,750) | | | 20,903,750 |
| TOTAL INVESTMENT IN SECURITIES - 101.4% | | | |
| (Cost $579,269,256) | | | 915,769,232 |
| NET OTHER ASSETS (LIABILITIES) - (1.4)% | | | (12,299,298) |
| NET ASSETS - 100% | | | $903,469,934 |
Legend
(a) Non-income producing
(b) Security or a portion of the security is on loan at period end.
(c) Security exempt from registration under Rule 144A of the Securities Act of 1933. These securities may be resold in transactions exempt from registration, normally to qualified institutional buyers. At the end of the period, the value of these securities amounted to $2,044,326 or 0.2% of net assets.
(d) Restricted securities (including private placements) - Investment in securities not registered under the Securities Act of 1933 (excluding 144A issues). At the end of the period, the value of restricted securities (excluding 144A issues) amounted to $10,882,297 or 1.2% of net assets.
(e) Level 3 security
(f) Affiliated fund that is generally available only to investment companies and other accounts managed by Fidelity Investments. The rate quoted is the annualized seven-day yield of the fund at period end. A complete unaudited listing of the fund's holdings as of its most recent quarter end is available upon request. In addition, each Fidelity Central Fund's financial statements, which are not covered by the Fund's Report of Independent Registered Public Accounting Firm, are available on the SEC's website or upon request.
(g) Investment made with cash collateral received from securities on loan.
Additional information on each restricted holding is as follows:
| Security | Acquisition Date | Acquisition Cost |
| 1Life Healthcare, Inc. Series G | 4/10/14 | $1,193,163 |
| Generation Bio Series B | 2/21/18 | $128,040 |
| Harmony Biosciences II, Inc. Series A | 9/22/17 | $1,195,827 |
| Harmony Biosciences II, Inc. Series C | 8/9/19 | $837,081 |
| Outset Medical, Inc. Series C | 4/19/17 | $799,999 |
| Outset Medical, Inc. Series D | 8/20/18 | $1,000,002 |
| RPI International Holdings LP | 5/21/15 - 3/23/16 | $2,801,500 |
Affiliated Central Funds
Information regarding fiscal year to date income earned by the Fund from investments in Fidelity Central Funds is as follows:
| Fund | Income earned |
| Fidelity Cash Central Fund | $123,317 |
| Fidelity Securities Lending Cash Central Fund | 130,384 |
| Total | $253,701 |
Amounts in the income column in the above table include any capital gain distributions from underlying funds, which are presented in the corresponding line-item in the Statement of Operations, if applicable. Amount for Fidelity Securities Lending Cash Central Fund represents the income earned on investing cash collateral, less rebates paid to borrowers and any lending agent fees associated with the loan, plus any premium payments received for lending certain types of securities.
Investment Valuation
The following is a summary of the inputs used, as of December 31, 2019, involving the Fund's assets and liabilities carried at fair value. The inputs or methodology used for valuing securities may not be an indication of the risk associated with investing in those securities. For more information on valuation inputs, and their aggregation into the levels used below, please refer to the Investment Valuation section in the accompanying Notes to Financial Statements.
| | Valuation Inputs at Reporting Date: |
| Description | Total | Level 1 | Level 2 | Level 3 |
| Investments in Securities: | | | | |
| Common Stocks | $887,826,115 | $773,231,439 | $110,751,746 | $3,842,930 |
| Convertible Preferred Stocks | 7,039,367 | -- | -- | 7,039,367 |
| Money Market Funds | 20,903,750 | 20,903,750 | -- | -- |
| Total Investments in Securities: | $915,769,232 | $794,135,189 | $110,751,746 | $10,882,297 |
The following is a reconciliation of Investments in Securities for which Level 3 inputs were used in determining value:
| Investments in Securities: | |
| Beginning Balance | $11,703,879 |
| Total Realized Gain (Loss) | -- |
| Total Unrealized Gain (Loss) | 1,349,121 |
| Cost of Purchases | 837,081 |
| Proceeds of Sales | -- |
| Amortization/Accretion | -- |
| Transfers in to Level 3 | -- |
| Transfers out of Level 3 | (3,007,784) |
| Ending Balance | $10,882,297 |
| The change in unrealized gain (loss) for the period attributable to Level 3 securities held at December 31, 2019 | $1,349,121 |
The information used in the above reconciliations represents fiscal year to date activity for any Investments in Securities identified as using Level 3 inputs at either the beginning or the end of the current fiscal period. Transfers in or out of Level 3 represent the beginning value of any Security or Instrument where a change in the pricing level occurred from the beginning to the end of the period. The cost of purchases and the proceeds of sales may include securities received or delivered through corporate actions or exchanges. Realized and unrealized gains (losses) disclosed in the reconciliations are included in Net Gain (Loss) on the Fund's Statement of Operations.
Other Information
Distribution of investments by country or territory of incorporation, as a percentage of Total Net Assets, is as follows (Unaudited):
| United States of America | 79.0% |
| Switzerland | 6.7% |
| United Kingdom | 5.7% |
| Netherlands | 1.6% |
| Cayman Islands | 1.6% |
| Denmark | 1.5% |
| France | 1.1% |
| Germany | 1.0% |
| Others (Individually Less Than 1%) | 1.8% |
| | 100.0% |
See accompanying notes which are an integral part of the financial statements.
Financial Statements
Statement of Assets and Liabilities
| | | December 31, 2019 |
| Assets | | |
Investment in securities, at value (including securities loaned of $12,780,888) — See accompanying schedule:
Unaffiliated issuers (cost $558,365,506) | $894,865,482 | |
| Fidelity Central Funds (cost $20,903,750) | 20,903,750 | |
| Total Investment in Securities (cost $579,269,256) | | $915,769,232 |
| Cash | | 55,474 |
| Receivable for investments sold | | 1,818,737 |
| Receivable for fund shares sold | | 322,142 |
| Dividends receivable | | 504,255 |
| Distributions receivable from Fidelity Central Funds | | 14,801 |
| Prepaid expenses | | 5,907 |
| Other receivables | | 8,001 |
| Total assets | | 918,498,549 |
| Liabilities | | |
| Payable for investments purchased | $756,401 | |
| Payable for fund shares redeemed | 734,763 | |
| Accrued management fee | 391,148 | |
| Distribution and service plan fees payable | 3,735 | |
| Other affiliated payables | 120,560 | |
| Other payables and accrued expenses | 55,036 | |
| Collateral on securities loaned | 12,966,972 | |
| Total liabilities | | 15,028,615 |
| Net Assets | | $903,469,934 |
| Net Assets consist of: | | |
| Paid in capital | | $538,664,979 |
| Total accumulated earnings (loss) | | 364,804,955 |
| Net Assets | | $903,469,934 |
| Net Asset Value and Maximum Offering Price | | |
| Initial Class: | | |
| Net Asset Value, offering price and redemption price per share ($145,314,861 ÷ 4,361,749 shares) | | $33.32 |
| Service Class 2: | | |
| Net Asset Value, offering price and redemption price per share ($20,197,933 ÷ 607,168 shares) | | $33.27 |
| Investor Class: | | |
| Net Asset Value, offering price and redemption price per share ($737,957,140 ÷ 22,349,628 shares) | | $33.02 |
See accompanying notes which are an integral part of the financial statements.
Statement of Operations
| | | | Year ended December 31, 2019 |
| Investment Income | | | |
| Dividends | | | $7,017,248 |
| Income from Fidelity Central Funds (including $130,384 from security lending) | | | 253,701 |
| Total income | | | 7,270,949 |
| Expenses | | | |
| Management fee | $4,484,074 | | |
| Transfer agent fees | 1,090,557 | | |
| Distribution and service plan fees | 14,061 | | |
| Accounting and security lending fees | 288,634 | | |
| Custodian fees and expenses | 37,192 | | |
| Independent trustees' fees and expenses | 4,599 | | |
| Audit | 46,098 | | |
| Legal | 4,258 | | |
| Interest | 5,815 | | |
| Miscellaneous | 6,416 | | |
| Total expenses before reductions | 5,981,704 | | |
| Expense reductions | (26,394) | | |
| Total expenses after reductions | | | 5,955,310 |
| Net investment income (loss) | | | 1,315,639 |
| Realized and Unrealized Gain (Loss) | | | |
| Net realized gain (loss) on: | | | |
| Investment securities: | | | |
| Unaffiliated issuers | 36,354,604 | | |
| Fidelity Central Funds | 1,029 | | |
| Foreign currency transactions | (12,946) | | |
| Total net realized gain (loss) | | | 36,342,687 |
| Change in net unrealized appreciation (depreciation) on: | | | |
| Investment securities: | | | |
| Unaffiliated issuers | 170,048,975 | | |
| Assets and liabilities in foreign currencies | 12,521 | | |
| Total change in net unrealized appreciation (depreciation) | | | 170,061,496 |
| Net gain (loss) | | | 206,404,183 |
| Net increase (decrease) in net assets resulting from operations | | | $207,719,822 |
See accompanying notes which are an integral part of the financial statements.
Statement of Changes in Net Assets
| | Year ended December 31, 2019 | Year ended December 31, 2018 |
| Increase (Decrease) in Net Assets | | |
| Operations | | |
| Net investment income (loss) | $1,315,639 | $1,007,765 |
| Net realized gain (loss) | 36,342,687 | 60,295,929 |
| Change in net unrealized appreciation (depreciation) | 170,061,496 | (15,093,665) |
| Net increase (decrease) in net assets resulting from operations | 207,719,822 | 46,210,029 |
| Distributions to shareholders | (61,327,830) | (16,792,330) |
| Share transactions - net increase (decrease) | (56,059,065) | 69,663,281 |
| Total increase (decrease) in net assets | 90,332,927 | 99,080,980 |
| Net Assets | | |
| Beginning of period | 813,137,007 | 714,056,027 |
| End of period | $903,469,934 | $813,137,007 |
See accompanying notes which are an integral part of the financial statements.
Financial Highlights
VIP Health Care Portfolio Initial Class
| Years ended December 31, | 2019 | 2018 | 2017 | 2016 | 2015 |
| Selected Per–Share Data | | | | | |
| Net asset value, beginning of period | $27.86 | $26.44 | $21.28 | $25.92 | $27.70 |
| Income from Investment Operations | | | | | |
| Net investment income (loss)A | .07 | .06 | .07 | .04 | –B |
| Net realized and unrealized gain (loss) | 7.47 | 1.99 | 5.26 | (2.86) | 1.70 |
| Total from investment operations | 7.54 | 2.05 | 5.33 | (2.82) | 1.70 |
| Distributions from net investment income | (.07) | (.06) | (.07) | (.04) | – |
| Distributions from net realized gain | (2.01) | (.57) | (.10) | (1.78) | (3.49) |
| Total distributions | (2.08) | (.63) | (.17) | (1.82) | (3.49) |
| Redemption fees added to paid in capitalA | – | – | –B | –B | .01 |
| Net asset value, end of period | $33.32 | $27.86 | $26.44 | $21.28 | $25.92 |
| Total ReturnC,D | 28.37% | 7.86% | 25.05% | (10.43)% | 6.37% |
| Ratios to Average Net AssetsE,F | | | | | |
| Expenses before reductions | .65% | .65% | .67% | .67% | .66% |
| Expenses net of fee waivers, if any | .65% | .65% | .67% | .67% | .66% |
| Expenses net of all reductions | .65% | .64% | .66% | .66% | .65% |
| Net investment income (loss) | .23% | .19% | .30% | .19% | - %G |
| Supplemental Data | | | | | |
| Net assets, end of period (000 omitted) | $145,315 | $139,026 | $131,698 | $130,887 | $226,283 |
| Portfolio turnover rateH | 38% | 65% | 74% | 53% | 77% |
A Calculated based on average shares outstanding during the period.
B Amount represents less than $.005 per share.
C Total returns do not reflect charges attributable to your insurance company's separate account. Inclusion of these charges would reduce the total returns shown.
D Total returns would have been lower if certain expenses had not been reduced during the applicable periods shown.
E Fees and expenses of any underlying Fidelity Central Funds are not included in the Fund's expense ratio. The Fund indirectly bears its proportionate share of the expenses of any underlying Fidelity Central Funds.
F Expense ratios reflect operating expenses of the class. Expenses before reductions do not reflect amounts reimbursed by the investment adviser or reductions from brokerage service arrangements or reductions from other expense offset arrangements and do not represent the amount paid by the class during periods when reimbursements or reductions occur. Expenses net of fee waivers reflect expenses after reimbursement by the investment adviser but prior to reductions from brokerage service arrangements or other expense offset arrangements. Expenses net of all reductions represent the net expenses paid by the class.
G Amount represents less than .005%.
H Amount does not include the portfolio activity of any underlying Fidelity Central Funds.
See accompanying notes which are an integral part of the financial statements.
VIP Health Care Portfolio Service Class 2
| Years ended December 31, | 2019 A |
| Selected Per–Share Data | |
| Net asset value, beginning of period | $28.52 |
| Income from Investment Operations | |
| Net investment income (loss)B | (.04) |
| Net realized and unrealized gain (loss) | 4.85 |
| Total from investment operations | 4.81 |
| Distributions from net investment income | (.06) |
| Distributions from net realized gain | –C |
| Total distributions | (.06) |
| Net asset value, end of period | $33.27 |
| Total ReturnD,E,F | 16.87% |
| Ratios to Average Net AssetsG,H | |
| Expenses before reductions | .91%I |
| Expenses net of fee waivers, if any | .91%I |
| Expenses net of all reductions | .90%I |
| Net investment income (loss) | (.18)%I |
| Supplemental Data | |
| Net assets, end of period (000 omitted) | $20,198 |
| Portfolio turnover rateJ | 38% |
A For the period April 11, 2019 (commencement of sale of shares) to December 31, 2019.
B Calculated based on average shares outstanding during the period.
C Amount represents less than $.005 per share.
D Total returns for periods of less than one year are not annualized.
E Total returns do not reflect charges attributable to your insurance company's separate account. Inclusion of these charges would reduce the total returns shown.
F Total returns would have been lower if certain expenses had not been reduced during the applicable periods shown.
G Fees and expenses of any underlying Fidelity Central Funds are not included in the Fund's expense ratio. The Fund indirectly bears its proportionate share of the expenses of any underlying Fidelity Central Funds.
H Expense ratios reflect operating expenses of the class. Expenses before reductions do not reflect amounts reimbursed by the investment adviser or reductions from brokerage service arrangements or reductions from other expense offset arrangements and do not represent the amount paid by the class during periods when reimbursements or reductions occur. Expense ratios before reductions for start-up periods may not be representative of longer-term operating periods. Expenses net of fee waivers reflect expenses after reimbursement by the investment adviser but prior to reductions from brokerage service arrangements or other expense offset arrangements. Expenses net of all reductions represent the net expenses paid by the class.
I Annualized
J Amount does not include the portfolio activity of any underlying Fidelity Central Funds.
See accompanying notes which are an integral part of the financial statements.
VIP Health Care Portfolio Investor Class
| Years ended December 31, | 2019 | 2018 | 2017 | 2016 | 2015 |
| Selected Per–Share Data | | | | | |
| Net asset value, beginning of period | $27.62 | $26.23 | $21.11 | $25.73 | $27.52 |
| Income from Investment Operations | | | | | |
| Net investment income (loss)A | .04 | .03 | .05 | .02 | (.02) |
| Net realized and unrealized gain (loss) | 7.41 | 1.96 | 5.22 | (2.84) | 1.69 |
| Total from investment operations | 7.45 | 1.99 | 5.27 | (2.82) | 1.67 |
| Distributions from net investment income | (.05) | (.04) | (.05) | (.02) | – |
| Distributions from net realized gain | (2.01) | (.57) | (.10) | (1.78) | (3.47) |
| Total distributions | (2.05)B | (.60)C | (.15) | (1.80) | (3.47) |
| Redemption fees added to paid in capitalA | – | – | –D | –D | .01 |
| Net asset value, end of period | $33.02 | $27.62 | $26.23 | $21.11 | $25.73 |
| Total ReturnE,F | 28.29% | 7.72% | 24.97% | (10.51)% | 6.29% |
| Ratios to Average Net AssetsG,H | | | | | |
| Expenses before reductions | .73% | .73% | .75% | .75% | .74% |
| Expenses net of fee waivers, if any | .73% | .73% | .75% | .75% | .74% |
| Expenses net of all reductions | .73% | .72% | .74% | .75% | .73% |
| Net investment income (loss) | .15% | .11% | .22% | .11% | (.08)% |
| Supplemental Data | | | | | |
| Net assets, end of period (000 omitted) | $737,957 | $674,111 | $582,358 | $529,828 | $820,079 |
| Portfolio turnover rateI | 38% | 65% | 74% | 53% | 77% |
A Calculated based on average shares outstanding during the period.
B Total distributions of $2.05 per share is comprised of distributions from net investment income of $.045 and distributions from net realized gain of $2.007 per share.
C Total distributions of $.60 per share is comprised of distributions from net investment income of $.039 and distributions from net realized gain of $.565 per share.
D Amount represents less than $.005 per share.
E Total returns do not reflect charges attributable to your insurance company's separate account. Inclusion of these charges would reduce the total returns shown.
F Total returns would have been lower if certain expenses had not been reduced during the applicable periods shown.
G Fees and expenses of any underlying Fidelity Central Funds are not included in the Fund's expense ratio. The Fund indirectly bears its proportionate share of the expenses of any underlying Fidelity Central Funds.
H Expense ratios reflect operating expenses of the class. Expenses before reductions do not reflect amounts reimbursed by the investment adviser or reductions from brokerage service arrangements or reductions from other expense offset arrangements and do not represent the amount paid by the class during periods when reimbursements or reductions occur. Expenses net of fee waivers reflect expenses after reimbursement by the investment adviser but prior to reductions from brokerage service arrangements or other expense offset arrangements. Expenses net of all reductions represent the net expenses paid by the class.
I Amount does not include the portfolio activity of any underlying Fidelity Central Funds.
See accompanying notes which are an integral part of the financial statements.
Notes to Financial Statements
For the period ended December 31, 2019
1. Organization.
VIP Health Care Portfolio (the Fund) is a non-diversified fund of Variable Insurance Products Fund IV (the Trust) and is authorized to issue an unlimited number of shares. The Trust is registered under the Investment Company Act of 1940, as amended (the 1940 Act), as an open-end management investment company organized as a Massachusetts business trust. Shares of the Fund may only be purchased by insurance companies for the purpose of funding variable annuity or variable life insurance contracts. The Fund commenced sale of Service Class 2 shares on April 11, 2019. The Fund offers the following classes of shares: Initial Class shares, Service Class 2 shares and Investor Class shares. All classes have equal rights and voting privileges, except for matters affecting a single class.
2. Investments in Fidelity Central Funds.
The Fund invests in Fidelity Central Funds, which are open-end investment companies generally available only to other investment companies and accounts managed by the investment adviser and its affiliates. The Fund's Schedule of Investments lists each of the Fidelity Central Funds held as of period end, if any, as an investment of the Fund, but does not include the underlying holdings of each Fidelity Central Fund. As an Investing Fund, the Fund indirectly bears its proportionate share of the expenses of the underlying Fidelity Central Funds.
The Money Market Central Funds seek preservation of capital and current income and are managed by Fidelity Investments Money Management, Inc. (FIMM), an affiliate of the investment adviser. Annualized expenses of the Money Market Central Funds as of their most recent shareholder report date ranged from less than .005% to .01%.
A complete unaudited list of holdings for each Fidelity Central Fund is available upon request or at the Securities and Exchange Commission (the SEC) website at www.sec.gov. In addition, the financial statements of the Fidelity Central Funds, which are not covered by the Fund's Report of Independent Registered Public Accounting Firm, are available on the SEC website or upon request.
3. Significant Accounting Policies.
The Fund is an investment company and applies the accounting and reporting guidance of the Financial Accounting Standards Board (FASB) Accounting Standards Codification Topic 946 Financial Services – Investments Companies. The financial statements have been prepared in conformity with accounting principles generally accepted in the United States of America (GAAP), which require management to make certain estimates and assumptions at the date of the financial statements. Actual results could differ from those estimates. Subsequent events, if any, through the date that the financial statements were issued have been evaluated in the preparation of the financial statements. The following summarizes the significant accounting policies of the Fund:
Investment Valuation. Investments are valued as of 4:00 p.m. Eastern time on the last calendar day of the period. The Board of Trustees (the Board) has delegated the day to day responsibility for the valuation of the Fund's investments to the Fair Value Committee (the Committee) established by the Fund's investment adviser. In accordance with valuation policies and procedures approved by the Board, the Fund attempts to obtain prices from one or more third party pricing vendors or brokers to value its investments. When current market prices, quotations or currency exchange rates are not readily available or reliable, investments will be fair valued in good faith by the Committee, in accordance with procedures adopted by the Board. Factors used in determining fair value vary by investment type and may include market or investment specific events. The frequency with which these procedures are used cannot be predicted and they may be utilized to a significant extent. The Committee oversees the Fund's valuation policies and procedures and reports to the Board on the Committee's activities and fair value determinations. The Board monitors the appropriateness of the procedures used in valuing the Fund's investments and ratifies the fair value determinations of the Committee.
The Fund categorizes the inputs to valuation techniques used to value its investments into a disclosure hierarchy consisting of three levels as shown below:
- Level 1 – quoted prices in active markets for identical investments
- Level 2 – other significant observable inputs (including quoted prices for similar investments, interest rates, prepayment speeds, etc.)
- Level 3 – unobservable inputs (including the Fund's own assumptions based on the best information available)
Valuation techniques used to value the Fund's investments by major category are as follows:
Equity securities, including restricted securities, for which market quotations are readily available, are valued at the last reported sale price or official closing price as reported by a third party pricing vendor on the primary market or exchange on which they are traded and are categorized as Level 1 in the hierarchy. In the event there were no sales during the day or closing prices are not available, securities are valued at the last quoted bid price or may be valued using the last available price and are generally categorized as Level 2 in the hierarchy. For foreign equity securities, when market or security specific events arise, comparisons to the valuation of American Depositary Receipts (ADRs), futures contracts, Exchange-Traded Funds (ETFs) and certain indexes as well as quoted prices for similar securities may be used and would be categorized as Level 2 in the hierarchy. For equity securities, including restricted securities, where observable inputs are limited, assumptions about market activity and risk are used and these securities may be categorized as Level 3 in the hierarchy. Securities, including private placements or other restricted securities, for which observable inputs are not available are valued using alternate valuation approaches, including the market approach, income approach and cost approach and are categorized as Level 3 in the hierarchy. The market approach considers factors including the price of recent investments in the same or a similar security or financial metrics of comparable securities. The income approach considers factors including expected future cash flows, security specific risks and corresponding discount rates. The cost approach considers factors including the value of the security's underlying assets and liabilities.
Investments in open-end mutual funds, including the Fidelity Central Funds, are valued at their closing net asset value (NAV) each business day and are categorized as Level 1 in the hierarchy.
The following provides information on Level 3 securities held by the Fund that were valued at period end based on unobservable inputs. These amounts exclude valuations provided by a broker.
| Asset Type | Fair Value | Valuation Technique(s) | Unobservable Input | Amount or Range/Weighted Average | Impact to Valuation from an Increase in Input(a) |
| Equities | $ 10,882,297 | Market comparable | Enterprise value/Sales multiple (EV/S) | 5.1 - 5.7 / 5.5 | Increase |
| | | | Transaction price | $1.96 - $9.15 / $2.24 | Increase |
| | | | Discount rate | 24.0% | Decrease |
| | | | Premium rate | 98.5% | Increase |
| | | | Proxy discount | 0.6% | Decrease |
| | | | Expected distribution | $0.22 - $0.49 / $0.35 | Increase |
| | | | Conversion ratio | 1.3 | Increase |
| | | Market approach | Transaction price | $181.85 | Increase |
(a) Represents the directional change in the fair value of the Level 3 investments that could have resulted from an increase in the corresponding input as of period end. A decrease to the unobservable input would have had the opposite effect. Significant changes in these inputs may have resulted in a significantly higher or lower fair value measurement at period end.
Changes in valuation techniques may result in transfers in or out of an assigned level within the disclosure hierarchy. The aggregate value of investments by input level as of December 31, 2019, as well as a roll forward of Level 3 investments, is included at the end of the Fund's Schedule of Investments.
Foreign Currency. The Fund may use foreign currency contracts to facilitate transactions in foreign-denominated securities. Gains and losses from these transactions may arise from changes in the value of the foreign currency or if the counterparties do not perform under the contracts' terms.
Foreign-denominated assets, including investment securities, and liabilities are translated into U.S. dollars at the exchange rates at period end. Purchases and sales of investment securities, income and dividends received and expenses denominated in foreign currencies are translated into U.S. dollars at the exchange rate in effect on the transaction date.
The effects of exchange rate fluctuations on investments are included with the net realized and unrealized gain (loss) on investment securities. Other foreign currency transactions resulting in realized and unrealized gain (loss) are disclosed separately.
Investment Transactions and Income. For financial reporting purposes, the Fund's investment holdings and NAV include trades executed through the end of the last business day of the period. The NAV per share for processing shareholder transactions is calculated as of the close of business of the New York Stock Exchange (NYSE), normally 4:00 p.m. Eastern time and includes trades executed through the end of the prior business day. Gains and losses on securities sold are determined on the basis of identified cost and include proceeds received from litigation. Dividend income is recorded on the ex-dividend date, except for certain dividends from foreign securities where the ex-dividend date may have passed, which are recorded as soon as the Fund is informed of the ex-dividend date. Non-cash dividends included in dividend income, if any, are recorded at the fair market value of the securities received. Income and capital gain distributions from Fidelity Central Funds, if any, are recorded on the ex-dividend date. Certain distributions received by the Fund represent a return of capital or capital gain. The Fund determines the components of these distributions subsequent to the ex-dividend date, based upon receipt of tax filings or other correspondence relating to the underlying investment. These distributions are recorded as a reduction of cost of investments and/or as a realized gain. Investment income is recorded net of foreign taxes withheld where recovery of such taxes is uncertain.
Class Allocations and Expenses. Investment income, realized and unrealized capital gains and losses, common expenses of the Fund, and certain fund-level expense reductions, if any, are allocated daily on a pro-rata basis to each class based on the relative net assets of each class to the total net assets of the Fund. Each class differs with respect to transfer agent and distribution and service plan fees incurred. Certain expense reductions may also differ by class. For the reporting period, the allocated portion of income and expenses to each class as a percent of its average net assets may vary due to the timing of recording these transactions in relation to fluctuating net assets of the classes. Expenses directly attributable to a fund are charged to that fund. Expenses attributable to more than one fund are allocated among the respective funds on the basis of relative net assets or other appropriate methods. Expense estimates are accrued in the period to which they relate and adjustments are made when actual amounts are known.
Income Tax Information and Distributions to Shareholders. Each year, the Fund intends to qualify as a regulated investment company under Subchapter M of the Internal Revenue Code, including distributing substantially all of its taxable income and realized gains. As a result, no provision for U.S. Federal income taxes is required. As of December 31, 2019, the Fund did not have any unrecognized tax benefits in the financial statements; nor is the Fund aware of any tax positions for which it is reasonably possible that the total amounts of unrecognized tax benefits will significantly change in the next twelve months. The Fund files a U.S. federal tax return, in addition to state and local tax returns as required. The Fund's federal income tax returns are subject to examination by the Internal Revenue Service (IRS) for a period of three fiscal years after they are filed. State and local tax returns may be subject to examination for an additional fiscal year depending on the jurisdiction. Foreign taxes are provided for based on the Fund's understanding of the tax rules and rates that exist in the foreign markets in which it invests.
Distributions are declared and recorded on the ex-dividend date. Income and capital gain distributions are declared separately for each class. Income and capital gain distributions are determined in accordance with income tax regulations, which may differ from GAAP.
Capital accounts within the financial statements are adjusted for permanent book-tax differences. These adjustments have no impact on net assets or the results of operations. Capital accounts are not adjusted for temporary book-tax differences which will reverse in a subsequent period.
Book-tax differences are primarily due to foreign currency transactions, passive foreign investment companies (PFIC) and losses deferred due to wash sales and excise tax regulations.
As of period end, the cost and unrealized appreciation (depreciation) in securities, and derivatives if applicable, for federal income tax purposes were as follows:
| Gross unrealized appreciation | $345,009,604 |
| Gross unrealized depreciation | (13,094,170) |
| Net unrealized appreciation (depreciation) | $331,915,434 |
| Tax Cost | $583,853,798 |
The tax-based components of distributable earnings as of period end were as follows:
| Undistributed ordinary income | $6,024,360 |
| Undistributed long-term capital gain | $26,859,339 |
| Net unrealized appreciation (depreciation) on securities and other investments | $331,921,255 |
The tax character of distributions paid was as follows:
| | December 31, 2019 | December 31, 2018 |
| Ordinary Income | $1,445,696 | $ 5,396,975 |
| Long-term Capital Gains | 59,882,134 | 11,395,355 |
| Total | $61,327,830 | $ 16,792,330 |
Restricted Securities (including Private Placements). The Fund may invest in securities that are subject to legal or contractual restrictions on resale. These securities generally may be resold in transactions exempt from registration or to the public if the securities are registered. Disposal of these securities may involve time-consuming negotiations and expense, and prompt sale at an acceptable price may be difficult. Information regarding restricted securities is included at the end of the Fund's Schedule of Investments.
4. Purchases and Sales of Investments.
Purchases and sales of securities, other than short-term securities, aggregated $313,485,989 and $432,169,907, respectively.
5. Fees and Other Transactions with Affiliates.
Management Fee. Fidelity SelectCo, LLC (the investment adviser) and its affiliates provide the Fund with investment management related services for which the Fund pays a monthly management fee. The management fee is the sum of an individual fund fee rate that is based on an annual rate of .30% of the Fund's average net assets and an annualized group fee rate that averaged .24% during the period. The group fee rate is based upon the average net assets of all the mutual funds advised by Fidelity Management & Research Company (FMR) and the investment adviser. The group fee rate decreases as assets under management increase and increases as assets under management decrease. For the reporting period, the total annual management fee rate was .54% of the Fund's average net assets.
Distribution and Service Plan Fees. In accordance with Rule 12b-1 of the 1940 Act, the Fund has adopted separate 12b-1 Plans for each Service Class of shares. Each Service Class pays Fidelity Distributors Corporation (FDC), an affiliate of the investment adviser, a service fee. For the period, the service fee is based on an annual rate of.25% of Service Class 2's average net assets.
For the period, total fees, all of which were re-allowed to insurance companies for the distribution of shares and providing shareholder support services, were as follows:
Transfer Agent Fees. Fidelity Investments Institutional Operations Company, Inc. (FIIOC), an affiliate of the investment adviser, is the Fund's transfer, dividend disbursing, and shareholder servicing agent. FIIOC receives an asset-based fee with respect to each class. Each class pays a fee for transfer agent services, typesetting and printing and mailing of shareholder reports, excluding mailing of proxy statements, equal to an annual rate of class-level average net assets. The annual rate for Investor Class is .15% and the annual rate for all other classes is .07%. For the period, transfer agent fees for each class were as follows:
| Initial Class | $89,543 |
| Service Class 2 | 3,613 |
| Investor Class | 997,401 |
| | $1,090,557 |
Accounting and Security Lending Fees. Fidelity Service Company, Inc. (FSC), an affiliate of the investment adviser, maintains the Fund's accounting records. The accounting fee is based on the level of average net assets for each month. Prior to April 1, 2019, FSC had a separate agreement with the Fund for administration of the security lending program, based on the number and duration of lending transactions. For the period, the total fees paid for accounting and administration of securities lending were equivalent to the following annual rates:
| | % of Average Net Assets |
| VIP Health Care Portfolio | .03 |
Brokerage Commissions. A portion of portfolio transactions were placed with brokerage firms which are affiliates of the investment adviser. Brokerage commissions are included in net realized gain (loss) and change in net unrealized appreciation (depreciation) in the Statement of Operations. The commissions paid to these affiliated firms were as follows:
| | Amount |
| VIP Health Care Portfolio | $8,748 |
Interfund Lending Program. Pursuant to an Exemptive Order issued by the SEC, the fund, along with other registered investment companies having management contracts with Fidelity Management & Research Company (FMR) or other affiliated entities of FMR, may participate in an interfund lending program. This program provides an alternative credit facility allowing the fund to borrow from, or lend money to, other participating affiliated funds. At period end, there were no interfund loans outstanding. Activity in this program during the period for which loans were outstanding was as follows:
| | Borrower or Lender | Average Loan Balance | Weighted Average Interest Rate | Interest Expense |
| VIP Health Care Portfolio | Borrower | $8,171,556 | 2.69% | $5,490 |
Interfund Trades. The Fund may purchase from or sell securities to other Fidelity Funds under procedures adopted by the Board. The procedures have been designed to ensure these interfund trades are executed in accordance with Rule 17a-7 of the 1940 Act. Interfund trades are included within the respective purchases and sales amounts shown in the Purchases and Sales of Investments note.
Other. During the period, the investment adviser reimbursed the Fund for certain losses in the amount of $1,000.
6. Committed Line of Credit.
The Fund participates with other funds managed by the investment adviser or an affiliate in a $4.25 billion credit facility (the "line of credit") to be utilized for temporary or emergency purposes to fund shareholder redemptions or for other short-term liquidity purposes. The Fund has agreed to pay commitment fees on its pro-rata portion of the line of credit, which amounted to $2,270 and is reflected in Miscellaneous expenses on the Statement of Operations. During the period, the Fund did not borrow on this line of credit.
7. Security Lending.
The Fund lends portfolio securities from time to time in order to earn additional income. For equity securities, lending agents are used, including National Financial Services (NFS), an affiliate of the Fund. Pursuant to a securities lending agreement, NFS will receive a fee, which is capped at 9.9% of daily lending revenue, for its services as lending agent. The Fund may lend securities to certain qualified borrowers. On the settlement date of the loan, the Fund receives collateral (in the form of U.S. Treasury obligations, letters of credit and/or cash) against the loaned securities and maintains collateral in an amount not less than 100% of the market value of the loaned securities during the period of the loan. The market value of the loaned securities is determined at the close of business of the Fund and any additional required collateral is delivered to the Fund on the next business day. The Fund or borrower may terminate the loan at any time, and if the borrower defaults on its obligation to return the securities loaned because of insolvency or other reasons, the Fund may apply collateral received from the borrower against the obligation. The Fund may experience delays and costs in recovering the securities loaned. Any cash collateral received is invested in the Fidelity Securities Lending Cash Central Fund. The value of loaned securities and cash collateral at period end are disclosed on the Fund's Statement of Assets and Liabilities. Total fees paid by the Fund to NFS amounted to $5,550. Security lending income represents the income earned on investing cash collateral, less rebates paid to borrowers and any lending agent fees associated with the loan, plus any premium payments received for lending certain types of securities. Security lending income is presented in the Statement of Operations as a component of income from Fidelity Central Funds.
8. Bank Borrowings.
The Fund is permitted to have bank borrowings for temporary or emergency purposes to fund shareholder redemptions or for other short-term liquidity requirements. The Fund has established borrowing arrangements with certain banks. The interest rate on the borrowings is the bank's base rate, as revised from time to time. Any open loans, including accrued interest, at period end are presented under the caption "Notes payable" in the Statement of Assets and Liabilities, if applicable. Activity in this program during the period for which loans were outstanding was as follows:
| | Average Loan Balance | Weighted Average Interest Rate | Interest Expense |
| VIP Health Care Portfolio | $3,979,000 | 2.94% | $325 |
9. Expense Reductions.
Commissions paid to certain brokers with whom the investment adviser, or its affiliates, places trades on behalf of the Fund include an amount in addition to trade execution, which may be rebated back to the Fund to offset certain expenses. This amount totaled $19,630 for the period.
In addition, during the period the investment adviser reimbursed and/or waived a portion of fund-level operating expenses in the amount of $6,764.
10. Distributions to Shareholders.
Distributions to shareholders of each class were as follows:
| | Year ended
December 31, 2019 (a) | Year ended
December 31, 2018 |
| Distributions to shareholders | | |
| Initial Class | $10,207,539 | $3,055,353 |
| Service Class 2 | 30,420 | – |
| Investor Class | 51,089,871 | 13,736,977 |
| Total | $61,327,830 | $16,792,330 |
(a) Distributions for Service Class 2 are for the period April 11, 2019 (commencement of sale of shares) to December 31, 2019.
11. Share Transactions.
Transactions for each class of shares were as follows:
| | Shares | Shares | Dollars | Dollars |
| | Year ended December 31, 2019(a) | Year ended December 31, 2018 | Year ended December 31, 2019(a) | Year ended December 31, 2018 |
| Initial Class | | | | |
| Shares sold | 167,326 | 881,073 | $4,942,221 | $27,036,190 |
| Reinvestment of distributions | 359,666 | 114,782 | 10,207,539 | 3,055,353 |
| Shares redeemed | (1,156,055) | (985,506) | (33,063,665) | (28,636,641) |
| Net increase (decrease) | (629,063) | 10,349 | $(17,913,905) | $1,454,902 |
| Service Class 2 | | | | |
| Shares sold | 667,184 | – | $19,623,777 | $– |
| Reinvestment of distributions | 945 | – | 30,217 | – |
| Shares redeemed | (60,961) | – | (1,765,919) | – |
| Net increase (decrease) | 607,168 | – | $17,888,075 | $– |
| Investor Class | | | | |
| Shares sold | 1,383,582 | 3,955,718 | $40,623,418 | $119,018,545 |
| Reinvestment of distributions | 1,818,142 | 520,609 | 51,089,871 | 13,736,977 |
| Shares redeemed | (5,254,956) | (2,276,692) | (147,746,524) | (64,547,143) |
| Net increase (decrease) | (2,053,232) | 2,199,635 | $(56,033,235) | $68,208,379 |
(a) Share transactions for Service Class 2 are for the period April 11, 2019 (commencement of sale of shares) to December 31, 2019.
12. Other.
The Fund's organizational documents provide former and current trustees and officers with a limited indemnification against liabilities arising in connection with the performance of their duties to the Fund. In the normal course of business, the Fund may also enter into contracts that provide general indemnifications. The Fund's maximum exposure under these arrangements is unknown as this would be dependent on future claims that may be made against the Fund. The risk of material loss from such claims is considered remote.
At the end of the period, the investment adviser or its affiliates were the owners of record of 98% of the total outstanding shares of the Fund.
Effective January 1, 2020, following any required regulatory notices and approvals:
Investment advisers Fidelity Investments Money Management, Inc., FMR Co., Inc., and Fidelity SelectCo, LLC, merged with and into Fidelity Management & Research Company. In connection with the merger transactions, the resulting, merged investment adviser was then redomiciled from Massachusetts to Delaware, changed its corporate structure from a corporation to a limited liability company, and changed its name to "Fidelity Management & Research Company LLC".
Broker-dealer Fidelity Distributors Corporation merged with and into Fidelity Investments Institutional Services Company, Inc. ("FIISC"). FIISC was then redomiciled from Massachusetts to Delaware, changed its corporate structure from a corporation to a limited liability company, and changed its name to "Fidelity Distributors Company LLC".
Fidelity Investments Institutional Operations Company, Inc. (FIIOC) converted from a Massachusetts corporation to a Massachusetts LLC, and changed its name to "Fidelity Investments Institutional Operations Company LLC".
Report of Independent Registered Public Accounting Firm
To the Board of Trustees of Variable Insurance Products Fund IV and Shareholders of VIP Health Care Portfolio:
Opinion on the Financial Statements
We have audited the accompanying statement of assets and liabilities, including the schedule of investments, of VIP Health Care Portfolio (one of the funds constituting Variable Insurance Products Fund IV, referred to hereafter as the “Fund”) as of December 31, 2019, the related statement of operations for the year ended December 31, 2019, the statement of changes in net assets for each of the two years in the period ended December 31, 2019, including the related notes, and the financial highlights for each of the periods indicated therein (collectively referred to as the “financial statements”). In our opinion, the financial statements present fairly, in all material respects, the financial position of the Fund as of December 31, 2019, the results of its operations for the year then ended, the changes in its net assets for each of the two years in the period ended December 31, 2019 and the financial highlights for each of the periods indicated therein in conformity with accounting principles generally accepted in the United States of America.
Basis for Opinion
These financial statements are the responsibility of the Fund’s management. Our responsibility is to express an opinion on the Fund’s financial statements based on our audits. We are a public accounting firm registered with the Public Company Accounting Oversight Board (United States) (PCAOB) and are required to be independent with respect to the Fund in accordance with the U.S. federal securities laws and the applicable rules and regulations of the Securities and Exchange Commission and the PCAOB.
We conducted our audits of these financial statements in accordance with the standards of the PCAOB. Those standards require that we plan and perform the audit to obtain reasonable assurance about whether the financial statements are free of material misstatement, whether due to error or fraud.
Our audits included performing procedures to assess the risks of material misstatement of the financial statements, whether due to error or fraud, and performing procedures that respond to those risks. Such procedures included examining, on a test basis, evidence regarding the amounts and disclosures in the financial statements. Our audits also included evaluating the accounting principles used and significant estimates made by management, as well as evaluating the overall presentation of the financial statements. Our procedures included confirmation of securities owned as of December 31, 2019 by correspondence with the custodian, issuers of privately offered securities and brokers; when replies were not received from brokers, we performed other auditing procedures. We believe that our audits provide a reasonable basis for our opinion.
PricewaterhouseCoopers LLP
Boston, Massachusetts
February 14, 2020
We have served as the auditor of one or more investment companies in the Fidelity group of funds since 1932.
Trustees and Officers
The Trustees, Members of the Advisory Board (if any), and officers of the trust and fund, as applicable, are listed below. The Board of Trustees governs the fund and is responsible for protecting the interests of shareholders. The Trustees are experienced executives who meet periodically throughout the year to oversee the fund's activities, review contractual arrangements with companies that provide services to the fund, oversee management of the risks associated with such activities and contractual arrangements, and review the fund's performance. Except for Michael E. Wiley, each of the Trustees oversees 302 funds. Mr. Wiley oversees 199 funds.
The Trustees hold office without limit in time except that (a) any Trustee may resign; (b) any Trustee may be removed by written instrument, signed by at least two-thirds of the number of Trustees prior to such removal; (c) any Trustee who requests to be retired or who has become incapacitated by illness or injury may be retired by written instrument signed by a majority of the other Trustees; and (d) any Trustee may be removed at any special meeting of shareholders by a two-thirds vote of the outstanding voting securities of the trust. Each Trustee who is not an interested person (as defined in the Investment Company Act of 1940 (1940 Act)) of the trust and the fund is referred to herein as an Independent Trustee. Each Independent Trustee shall retire not later than the last day of the calendar year in which his or her 75th birthday occurs. The Independent Trustees may waive this mandatory retirement age policy with respect to individual Trustees. Officers and Advisory Board Members hold office without limit in time, except that any officer or Advisory Board Member may resign or may be removed by a vote of a majority of the Trustees at any regular meeting or any special meeting of the Trustees. Except as indicated, each individual has held the office shown or other offices in the same company for the past five years.
The fund’s Statement of Additional Information (SAI) includes more information about the Trustees. To request a free copy, call Fidelity at 1-877-208-0098.
Experience, Skills, Attributes, and Qualifications of the Trustees. The Governance and Nominating Committee has adopted a statement of policy that describes the experience, qualifications, attributes, and skills that are necessary and desirable for potential Independent Trustee candidates (Statement of Policy). The Board believes that each Trustee satisfied at the time he or she was initially elected or appointed a Trustee, and continues to satisfy, the standards contemplated by the Statement of Policy. The Governance and Nominating Committee also engages professional search firms to help identify potential Independent Trustee candidates who have the experience, qualifications, attributes, and skills consistent with the Statement of Policy. From time to time, additional criteria based on the composition and skills of the current Independent Trustees, as well as experience or skills that may be appropriate in light of future changes to board composition, business conditions, and regulatory or other developments, have also been considered by the professional search firms and the Governance and Nominating Committee. In addition, the Board takes into account the Trustees' commitment and participation in Board and committee meetings, as well as their leadership of standing and ad hoc committees throughout their tenure.
In determining that a particular Trustee was and continues to be qualified to serve as a Trustee, the Board has considered a variety of criteria, none of which, in isolation, was controlling. The Board believes that, collectively, the Trustees have balanced and diverse experience, qualifications, attributes, and skills, which allow the Board to operate effectively in governing the fund and protecting the interests of shareholders. Information about the specific experience, skills, attributes, and qualifications of each Trustee, which in each case led to the Board's conclusion that the Trustee should serve (or continue to serve) as a trustee of the fund, is provided below.
Board Structure and Oversight Function. James C. Curvey is an interested person and currently serves as Chairman. The Trustees have determined that an interested Chairman is appropriate and benefits shareholders because an interested Chairman has a personal and professional stake in the quality and continuity of services provided to the fund. Independent Trustees exercise their informed business judgment to appoint an individual of their choosing to serve as Chairman, regardless of whether the Trustee happens to be independent or a member of management. The Independent Trustees have determined that they can act independently and effectively without having an Independent Trustee serve as Chairman and that a key structural component for assuring that they are in a position to do so is for the Independent Trustees to constitute a substantial majority for the Board. The Independent Trustees also regularly meet in executive session. Ned C. Lautenbach serves as Chairman of the Independent Trustees and as such (i) acts as a liaison between the Independent Trustees and management with respect to matters important to the Independent Trustees and (ii) with management prepares agendas for Board meetings.
Fidelity® funds are overseen by different Boards of Trustees. The fund's Board oversees Fidelity's high income and certain equity funds, and other Boards oversee Fidelity's investment-grade bond, money market, asset allocation, and other equity funds. The asset allocation funds may invest in Fidelity® funds overseen by the fund's Board. The use of separate Boards, each with its own committee structure, allows the Trustees of each group of Fidelity® funds to focus on the unique issues of the funds they oversee, including common research, investment, and operational issues. On occasion, the separate Boards establish joint committees to address issues of overlapping consequences for the Fidelity® funds overseen by each Board.
The Trustees operate using a system of committees to facilitate the timely and efficient consideration of all matters of importance to the Trustees, the fund, and fund shareholders and to facilitate compliance with legal and regulatory requirements and oversight of the fund's activities and associated risks. The Board, acting through its committees, has charged FMR and its affiliates with (i) identifying events or circumstances the occurrence of which could have demonstrably adverse effects on the fund's business and/or reputation; (ii) implementing processes and controls to lessen the possibility that such events or circumstances occur or to mitigate the effects of such events or circumstances if they do occur; and (iii) creating and maintaining a system designed to evaluate continuously business and market conditions in order to facilitate the identification and implementation processes described in (i) and (ii) above. Because the day-to-day operations and activities of the fund are carried out by or through FMR, its affiliates, and other service providers, the fund's exposure to risks is mitigated but not eliminated by the processes overseen by the Trustees. While each of the Board's committees has responsibility for overseeing different aspects of the fund's activities, oversight is exercised primarily through the Operations, Audit, and Compliance Committees. Appropriate personnel, including but not limited to the fund's Chief Compliance Officer (CCO), FMR's internal auditor, the independent accountants, the fund's Treasurer and portfolio management personnel, make periodic reports to the Board's committees, as appropriate, including an annual review of Fidelity's risk management program for the Fidelity® funds. The responsibilities of each standing committee, including their oversight responsibilities, are described further under "Standing Committees of the Trustees."
Interested Trustees*:
Correspondence intended for a Trustee who is an interested person may be sent to Fidelity Investments, 245 Summer Street, Boston, Massachusetts 02210.
Name, Year of Birth; Principal Occupations and Other Relevant Experience+
James C. Curvey (1935)
Year of Election or Appointment: 2018
Trustee
Chairman of the Board of Trustees
Mr. Curvey also serves as Trustee of other Fidelity® funds. Mr. Curvey is Vice Chairman (2007-present) and Director of FMR LLC (diversified financial services company). In addition, Mr. Curvey is an Overseer Emeritus for the Boston Symphony Orchestra, a Director of Artis-Naples, and a Trustee of Brewster Academy in Wolfeboro, New Hampshire. Previously, Mr. Curvey served as a Director of Fidelity Research & Analysis Co. (investment adviser firm, 2009-2018), Director of Fidelity Investments Money Management, Inc. (investment adviser firm, 2009-2014) and a Director of FMR and FMR Co., Inc. (investment adviser firms, 2007-2014).
* Determined to be an “Interested Trustee” by virtue of, among other things, his or her affiliation with the trust or various entities under common control with FMR.
+ The information includes the Trustee's principal occupation during the last five years and other information relating to the experience, attributes, and skills relevant to the Trustee's qualifications to serve as a Trustee, which led to the conclusion that the Trustee should serve as a Trustee for the fund.
Independent Trustees:
Correspondence intended for an Independent Trustee may be sent to Fidelity Investments, P.O. Box 55235, Boston, Massachusetts 02205-5235.
Name, Year of Birth; Principal Occupations and Other Relevant Experience+
Dennis J. Dirks (1948)
Year of Election or Appointment: 2018
Trustee
Mr. Dirks also serves as Trustee of other Fidelity® funds. Prior to his retirement in May 2003, Mr. Dirks was Chief Operating Officer and a member of the Board of The Depository Trust & Clearing Corporation (DTCC). He also served as President, Chief Operating Officer, and Board member of The Depository Trust Company (DTC) and President and Board member of the National Securities Clearing Corporation (NSCC). In addition, Mr. Dirks served as Chief Executive Officer and Board member of the Government Securities Clearing Corporation, Chief Executive Officer and Board member of the Mortgage-Backed Securities Clearing Corporation, as a Trustee and a member of the Finance Committee of Manhattan College (2005-2008), as a Trustee and a member of the Finance Committee of AHRC of Nassau County (2006-2008), as a member of the Independent Directors Council (IDC) Governing Council (2010-2015), and as a member of the Board of Directors for The Brookville Center for Children’s Services, Inc. (2009-2017). Mr. Dirks is a member of the Finance Committee (2016-present) and Board of Directors (2017-present) and is Treasurer (2018-present) of the Asolo Repertory Theatre.
Donald F. Donahue (1950)
Year of Election or Appointment: 2018
Trustee
Mr. Donahue also serves as a Trustee of other Fidelity® funds. Mr. Donahue is President and Chief Executive Officer of Miranda Partners, LLC (risk consulting for the financial services industry, 2012-present). Previously, Mr. Donahue served as a Member of the Advisory Board of certain Fidelity® funds (2015-2018) and Chief Executive Officer (2006-2012), Chief Operating Officer (2003-2006), and Managing Director, Customer Marketing and Development (1999-2003) of The Depository Trust & Clearing Corporation (financial markets infrastructure). Mr. Donahue serves as a Member (2007-present) and Co-Chairman (2016-present) of the Board of Directors of United Way of New York, Member of the Board of Directors of NYC Leadership Academy (2012-present) and Member of the Board of Advisors of Ripple Labs, Inc. (financial services, 2015-present). He also served as Chairman (2010-2012) and Member of the Board of Directors (2012-2013) of Omgeo, LLC (financial services), Treasurer of United Way of New York (2012-2016), and Member of the Board of Directors of XBRL US (financial services non-profit, 2009-2012) and the International Securities Services Association (2009-2012).
Alan J. Lacy (1953)
Year of Election or Appointment: 2018
Trustee
Mr. Lacy also serves as Trustee of other Fidelity® funds. Mr. Lacy serves as a Director of Bristol-Myers Squibb Company (global pharmaceuticals, 2008-present). He is a Trustee of the California Chapter of The Nature Conservancy (2015-present) and a Director of the Center for Advanced Study in the Behavioral Sciences at Stanford University (2015-present). In addition, Mr. Lacy served as Senior Adviser (2007-2014) of Oak Hill Capital Partners, L.P. (private equity) and also served as Chief Executive Officer (2005) and Vice Chairman (2005-2006) of Sears Holdings Corporation (retail) and Chief Executive Officer and Chairman of the Board of Sears, Roebuck and Co. (retail, 2000-2005). Previously, Mr. Lacy served as Chairman (2014-2017) and a member (2010-2017) of the Board of Directors of Dave & Buster’s Entertainment, Inc. (restaurant and entertainment complexes), as Chairman (2008-2011) and a member (2006-2015) of the Board of Trustees of the National Parks Conservation Association, and as a member of the Board of Directors for The Hillman Companies, Inc. (hardware wholesalers, 2010-2014), Earth Fare, Inc. (retail grocery, 2010-2014), and The Western Union Company (global money transfer, 2006-2011).
Ned C. Lautenbach (1944)
Year of Election or Appointment: 2018
Trustee
Chairman of the Independent Trustees
Mr. Lautenbach also serves as Trustee of other Fidelity® funds. Mr. Lautenbach currently serves as Chair (2018-present) and Member (2013-present) of the Board of Governors, State University System of Florida and is a member of the Council on Foreign Relations (1994-present). He is also a member and has most recently served as Chairman of the Board of Directors of Artis-Naples (2012-present). Previously, Mr. Lautenbach served as a member and then Lead Director of the Board of Directors of Eaton Corporation (diversified industrial, 1997-2016). He was also a Partner and Advisory Partner at Clayton, Dubilier & Rice, LLC (private equity investment, 1998-2010), as well as a Director of Sony Corporation (2006-2007). In addition, Mr. Lautenbach also had a 30-year career with IBM (technology company) during which time he served as Senior Vice President and a member of the Corporate Executive Committee (1968-1998).
Joseph Mauriello (1944)
Year of Election or Appointment: 2018
Trustee
Mr. Mauriello also serves as Trustee of other Fidelity® funds. Prior to his retirement in January 2006, Mr. Mauriello served in numerous senior management positions including Deputy Chairman and Chief Operating Officer (2004-2005), and Vice Chairman of Financial Services (2002-2004) of KPMG LLP US (professional services, 1965-2005). Mr. Mauriello currently serves as a member of the Independent Directors Council (IDC) Governing Council (2015-present). Previously, Mr. Mauriello served as a member of the Board of Directors of XL Group plc. (global insurance and re-insurance, 2006-2018).
Cornelia M. Small (1944)
Year of Election or Appointment: 2018
Trustee
Ms. Small also serves as Trustee of other Fidelity® funds. Ms. Small is a member of the Board of Directors (2009-present) and Chair of the Investment Committee (2010-present) of the Teagle Foundation. Ms. Small also serves on the Investment Committee of the Berkshire Taconic Community Foundation (2008-present). Previously, Ms. Small served as Chairperson (2002-2008) and a member of the Investment Committee and Chairperson (2008-2012) and a member of the Board of Trustees of Smith College. In addition, Ms. Small served as Chief Investment Officer, Director of Global Equity Investments, and a member of the Board of Directors of Scudder, Stevens & Clark and Scudder Kemper Investments.
Garnett A. Smith (1947)
Year of Election or Appointment: 2013
Trustee
Mr. Smith also serves as Trustee of other Fidelity® funds. Prior to Mr. Smith's retirement, he served as Chairman and Chief Executive Officer of Inbrand Corp. (manufacturer of personal absorbent products, 1990-1997). He also served as President (1986-1990) of Inbrand Corp. Prior to his employment with Inbrand Corp., he was employed by a retail fabric chain and North Carolina National Bank. In addition, Mr. Smith served as a Member of the Advisory Board of certain Fidelity® funds (2012-2013) and as a board member of the Jackson Hole Land Trust (2009-2012).
David M. Thomas (1949)
Year of Election or Appointment: 2018
Trustee
Mr. Thomas also serves as Trustee of other Fidelity® funds. Mr. Thomas serves as Non-Executive Chairman of the Board of Directors of Fortune Brands Home and Security (home and security products, 2011-present) and as a member of the Board of Directors (2004-present) and Presiding Director (2013-present) of Interpublic Group of Companies, Inc. (marketing communication). Previously, Mr. Thomas served as Executive Chairman (2005-2006) and Chairman and Chief Executive Officer (2000-2005) of IMS Health, Inc. (pharmaceutical and healthcare information solutions), a Director of Fortune Brands, Inc. (consumer products, 2000-2011), and a member of the Board of Trustees of the University of Florida (2013-2018).
Michael E. Wiley (1950)
Year of Election or Appointment: 2008
Trustee
Mr. Wiley also serves as Trustee or Member of the Advisory Board of other Fidelity® funds. Mr. Wiley serves as a Director of High Point Resources (exploration and production, 2005-present). Previously, Mr. Wiley served as a Director of Andeavor Corporation (independent oil refiner and marketer, 2005-2018), a Director of Andeavor Logistics LP (natural resources logistics, 2015-2018), a Director of Post Oak Bank (privately-held bank, 2004-2018), a Director of Asia Pacific Exploration Consolidated (international oil and gas exploration and production, 2008-2013), a member of the Board of Trustees of the University of Tulsa (2000-2006; 2007-2010), a Senior Energy Advisor of Katzenbach Partners, LLC (consulting, 2006-2007), an Advisory Director of Riverstone Holdings (private investment), a Director of Spinnaker Exploration Company (exploration and production, 2001-2005) and Chairman, President, and CEO of Baker Hughes, Inc. (oilfield services, 2000-2004).
+ The information includes the Trustee's principal occupation during the last five years and other information relating to the experience, attributes, and skills relevant to the Trustee's qualifications to serve as a Trustee, which led to the conclusion that the Trustee should serve as a Trustee for the fund.
Advisory Board Members and Officers:
Correspondence intended for a Member of the Advisory Board (if any) may be sent to Fidelity Investments, P.O. Box 55235, Boston, Massachusetts 02205-5235. Correspondence intended for an officer or Peter S. Lynch may be sent to Fidelity Investments, 245 Summer Street, Boston, Massachusetts 02210. Officers appear below in alphabetical order.
Name, Year of Birth; Principal Occupation
Vicki L. Fuller (1957)
Year of Election or Appointment: 2018
Member of the Advisory Board
Ms. Fuller also serves as Member of the Advisory Board of other Fidelity® funds. Ms. Fuller serves as a member of the Board of Directors, Audit Committee, and Nominating and Governance Committee of The Williams Companies, Inc. (natural gas infrastructure, 2018-present). Previously, Ms. Fuller served as the Chief Investment Officer of the New York State Common Retirement Fund (2012-2018) and held a variety of positions at AllianceBernstein L.P. (global asset management, 1985-2012), including Managing Director (2006-2012) and Senior Vice President and Senior Portfolio Manager (2001-2006).
Patricia L. Kampling (1959)
Year of Election or Appointment: 2020
Member of the Advisory Board
Ms. Kampling also serves as Member of the Advisory Board of other Fidelity® funds. Prior to her retirement, Ms. Kampling served as Chairman of the Board and Chief Executive Officer (2012-2019), President and Chief Operating Officer (2011-2012) and Executive Vice President and Chief Financial Officer (2010-2011) of Alliant Energy Corporation. Ms. Kampling currently serves as a member of the Board, Compensation Committee and Executive Committee and as Chair of the Audit Committee of Briggs & Stratton Corporation (manufacturing, 2011-present) and as a member of the Board, Audit, Finance and Risk Committee and Safety, Environmental, Technology and Operations Committee of American Water Works Company, Inc. (utilities company, 2019-present). In addition, Ms. Kampling currently serves as a member of the Board of the Nature Conservancy, Wisconsin Chapter (2019-present). Previously, Ms. Kampling served as a member of the Board of Interstate Power and Light Company (2012-2019) and Wisconsin Power and Light Company (2012-2019) (each a subsidiary of Alliant Energy Corporation) and as a member of the Board and Workforce Development Committee of the Business Roundtable (2018-2019).
Peter S. Lynch (1944)
Year of Election or Appointment: 2018
Member of the Advisory Board
Mr. Lynch also serves as Member of the Advisory Board of other Fidelity® funds. Mr. Lynch is Vice Chairman and a Director of Fidelity Management & Research Company LLC (investment adviser firm). In addition, Mr. Lynch serves as a Trustee of Boston College and as the Chairman of the Inner-City Scholarship Fund. Previously, Mr. Lynch served as Vice Chairman and a Director of FMR Co., Inc. (investment adviser firm) and on the Special Olympics International Board of Directors (1997-2006).
Susan Tomasky (1953)
Year of Election or Appointment: 2020
Member of the Advisory Board
Ms. Tomasky also serves as Member of the Advisory Board of other Fidelity® funds. Prior to her retirement, Ms. Tomasky served in various executive officer positions at American Electric Power Company, Inc. (1998-2011), including most recently as President of AEP Transmission (2007-2011). Ms. Tomasky currently serves as a member of the Board and Sustainability Committee and as Chair of the Audit Committee of Marathon Petroleum Corporation (2018-present) and as a member of the Board, Corporate Governance Committee and Organization and Compensation Committee and as Chair of the Audit Committee of Public Service Enterprise Group, Inc. (utilities company, 2012-present). In addition, Ms. Tomasky currently serves as a member of the Board of the Columbus Regional Airport Authority (2007-present), as a member of the Board of the Royal Shakespeare Company – America (2009-present), as a member of the Board of the Columbus Association for the Performing Arts (2011-present) and as a member of the Board of Kenyon College (2016-present). Previously, Ms. Tomasky served as a member of the Board (2011-2019) and as Lead Independent Director (2015-2018) of Andeavor Corporation (previously Tesoro Corporation) (independent oil refiner and marketer) and as a member of the Board of Summit Midstream Partners LP (energy, 2012-2018).
Elizabeth Paige Baumann (1968)
Year of Election or Appointment: 2017
Anti-Money Laundering (AML) Officer
Ms. Baumann also serves as AML Officer of other funds. She is Chief AML Officer (2012-present) and Senior Vice President (2014-present) of FMR LLC (diversified financial services company) and is an employee of Fidelity Investments. Previously, Ms. Baumann served as AML Officer of the funds (2012-2016), and Vice President (2007-2014) and Deputy Anti-Money Laundering Officer (2007-2012) of FMR LLC.
Craig S. Brown (1977)
Year of Election or Appointment: 2019
Assistant Treasurer
Mr. Brown also serves as Assistant Treasurer of other funds. Mr. Brown is an employee of Fidelity Investments (2013-present).
John J. Burke III (1964)
Year of Election or Appointment: 2018
Chief Financial Officer
Mr. Burke also serves as Chief Financial Officer of other funds. Mr. Burke serves as Head of Investment Operations for Fidelity Fund and Investment Operations (2018-present) and is an employee of Fidelity Investments (1998-present). Previously Mr. Burke served as head of Asset Management Investment Operations (2012-2018).
William C. Coffey (1969)
Year of Election or Appointment: 2019
Assistant Secretary
Mr. Coffey also serves as Assistant Secretary of other funds. He is Senior Vice President and Deputy General Counsel of FMR LLC (diversified financial services company, 2010-present), and is an employee of Fidelity Investments. Previously, Mr. Coffey served as Secretary and CLO of certain funds (2018-2019); CLO, Secretary, and Senior Vice President of Fidelity Management & Research Company and FMR Co., Inc. (investment adviser firms, 2018-2019); Secretary of Fidelity SelectCo, LLC and Fidelity Investments Money Management, Inc. (investment adviser firms, 2018-2019); CLO of Fidelity Management & Research (Hong Kong) Limited, FMR Investment Management (UK) Limited, and Fidelity Management & Research (Japan) Limited (investment adviser firms, 2018-2019); and Assistant Secretary of certain funds (2009-2018).
Timothy M. Cohen (1969)
Year of Election or Appointment: 2018
Vice President
Mr. Cohen also serves as Vice President of other funds. Mr. Cohen serves as Co-Head of Equity (2018-present), a Director of Fidelity Management & Research (Japan) Limited (investment adviser firm, 2016-present), and is an employee of Fidelity Investments. Previously, Mr. Cohen served as Executive Vice President of Fidelity SelectCo, LLC (2019), Head of Global Equity Research (2016-2018), Chief Investment Officer - Equity and a Director of Fidelity Management & Research (U.K.) Inc. (investment adviser firm, 2013-2015) and as a Director of Fidelity Management & Research (Hong Kong) Limited (investment adviser firm, 2017).
Jonathan Davis (1968)
Year of Election or Appointment: 2010
Assistant Treasurer
Mr. Davis also serves as Assistant Treasurer of other funds. Mr. Davis serves as Assistant Treasurer of FMR Capital, Inc. (2017-present) and is an employee of Fidelity Investments. Previously, Mr. Davis served as Vice President and Associate General Counsel of FMR LLC (diversified financial services company, 2003-2010).
Laura M. Del Prato (1964)
Year of Election or Appointment: 2018
Assistant Treasurer
Ms. Del Prato also serves as an officer of other funds. Ms. Del Prato is an employee of Fidelity Investments (2017-present). Prior to joining Fidelity Investments, Ms. Del Prato served as a Managing Director and Treasurer of the JPMorgan Mutual Funds (2014-2017). Prior to JPMorgan, Ms. Del Prato served as a partner at Cohen Fund Audit Services (accounting firm, 2012-2013) and KPMG LLP (accounting firm, 2004-2012).
Colm A. Hogan (1973)
Year of Election or Appointment: 2020
Assistant Treasurer
Mr. Hogan also serves as an officer of other funds. Mr. Hogan serves as Assistant Treasurer of FMR Capital, Inc. (2017-present) and is an employee of Fidelity Investments (2005-present). Previously, Mr. Hogan served as Deputy Treasurer of certain Fidelity® funds (2016-2020) and Assistant Treasurer of certain Fidelity® funds (2016-2018).
Pamela R. Holding (1964)
Year of Election or Appointment: 2018
Vice President
Ms. Holding also serves as Vice President of other funds. Ms. Holding serves as Co-Head of Equity (2018-present) and is an employee of Fidelity Investments (2013-present). Previously, Ms. Holding served as Executive Vice President of Fidelity SelectCo, LLC (2019) and as Chief Investment Officer of Fidelity Institutional Asset Management (2013-2018).
Cynthia Lo Bessette (1969)
Year of Election or Appointment: 2019
Secretary and Chief Legal Officer (CLO)
Ms. Lo Bessette also serves as an officer of other funds. Ms. Lo Bessette serves as CLO, Secretary, and Senior Vice President of Fidelity Management & Research Company LLC (investment adviser firm, 2019-present); and CLO of Fidelity Management & Research (Hong Kong) Limited, FMR Investment Management (UK) Limited, and Fidelity Management & Research (Japan) Limited (investment adviser firms, 2019-present). She is a Senior Vice President and Deputy General Counsel of FMR LLC (diversified financial services company, 2019-present), and is an employee of Fidelity Investments. Previously, Ms. Lo Bessette served as CLO, Secretary, and Senior Vice President of FMR Co., Inc. (investment adviser firm, 2019); Secretary of Fidelity SelectCo, LLC and Fidelity Investments Money Management, Inc. (investment adviser firms, 2019). Prior to joining Fidelity Investments, Ms. Lo Bessette was Executive Vice President, General Counsel (2016-2019) and Senior Vice President, Deputy General Counsel (2015-2016) of OppenheimerFunds (investment management company) and Deputy Chief Legal Officer (2013-2015) of Jennison Associates LLC (investment adviser firm).
Chris Maher (1972)
Year of Election or Appointment: 2020
Deputy Treasurer
Mr. Maher also serves as an officer of other funds. Mr. Maher serves as Assistant Treasurer of FMR Capital, Inc. (2017-present), and is an employee of Fidelity Investments (2008-present). Previously, Mr. Maher served as Assistant Treasurer of certain funds (2013-2020); Vice President of Asset Management Compliance (2013), Vice President of the Program Management Group of FMR (investment adviser firm, 2010-2013), and Vice President of Valuation Oversight (2008-2010).
Kenneth B. Robins (1969)
Year of Election or Appointment: 2018
Chief Compliance Officer
Mr. Robins also serves as an officer of other funds. Mr. Robins serves as Compliance Officer of Fidelity Management & Research Company LLC (investment adviser firm, 2016-present) and is an employee of Fidelity Investments (2004-present). Previously, Mr. Robins served as Compliance Officer of FMR Co., Inc. (investment adviser firm, 2016-2019), as Executive Vice President of Fidelity Investments Money Management, Inc. (investment adviser firm, 2013-2016) and served in other fund officer roles.
Stacie M. Smith (1974)
Year of Election or Appointment: 2018
President and Treasurer
Ms. Smith also serves as an officer of other funds. Ms. Smith serves as Assistant Treasurer of FMR Capital, Inc. (2017-present), is an employee of Fidelity Investments (2009-present), and has served in other fund officer roles. Prior to joining Fidelity Investments, Ms. Smith served as Senior Audit Manager of Ernst & Young LLP (accounting firm, 1996-2009). Previously, Ms. Smith served as Assistant Treasurer (2013-2019) and Deputy Treasurer (2013-2016) of certain Fidelity® funds.
Marc L. Spector (1972)
Year of Election or Appointment: 2017
Assistant Treasurer
Mr. Spector also serves as an officer of other funds. Mr. Spector serves as Assistant Treasurer of FMR Capital, Inc. (2017-present) and is an employee of Fidelity Investments (2016-present). Prior to joining Fidelity Investments, Mr. Spector served as Director at the Siegfried Group (accounting firm, 2013-2016), and prior to Siegfried Group as audit senior manager at Deloitte & Touche (accounting firm, 2005-2013).
Jim Wegmann (1979)
Year of Election or Appointment: 2019
Assistant Treasurer
Mr. Wegmann also serves as Assistant Treasurer of other funds. Mr. Wegmann is an employee of Fidelity Investments (2011-present).
Shareholder Expense Example
As a shareholder of the Fund, you incur two types of costs: (1) transaction costs and (2) ongoing costs, including management fees, distribution and/or service (12b-1) fees and other Fund expenses. This Example is intended to help you understand your ongoing costs (in dollars) of investing in the Fund and to compare these costs with the ongoing costs of investing in other mutual funds.
The Example is based on an investment of $1,000 invested at the beginning of the period and held for the entire period (July 1, 2019 to December 31, 2019).
Actual Expenses
The first line of the accompanying table for each class of the Fund provides information about actual account values and actual expenses. You may use the information in this line, together with the amount you invested, to estimate the expenses that you paid over the period. Simply divide your account value by $1,000.00 (for example, an $8,600 account value divided by $1,000.00 = 8.6), then multiply the result by the number in the first line for a class of the Fund under the heading entitled "Expenses Paid During Period" to estimate the expenses you paid on your account during this period. The estimate of expenses does not include any fees or other expenses of any variable annuity or variable life insurance product. If they were, the estimate of expenses you paid during the period would be higher, and your ending account value would be lower. In addition, the Fund, as a shareholder in the underlying Fidelity Central Funds, will indirectly bear its pro-rata share of the fees and expenses incurred by the underlying Fidelity Central Funds. These fees and expenses are not included in the Fund's annualized expense ratio used to calculate the expense estimate in the table below.
Hypothetical Example for Comparison Purposes
The second line of the accompanying table for each class of the Fund provides information about hypothetical account values and hypothetical expenses based on a Class' actual expense ratio and an assumed rate of return of 5% per year before expenses, which is not the Class' actual return. The hypothetical account values and expenses may not be used to estimate the actual ending account balance or expenses you paid for the period. You may use this information to compare the ongoing costs of investing in the Fund and other funds. To do so, compare this 5% hypothetical example with the 5% hypothetical examples that appear in the shareholder reports of the other funds. The estimate of expenses does not include any fees or other expenses of any variable annuity or variable life insurance product. If they were, the estimate of expenses you paid during the period would be higher, and your ending account value would be lower. In addition, the Fund, as a shareholder in the underlying Fidelity Central Funds, will indirectly bear its pro-rata share of the fees and expenses incurred by the underlying Fidelity Central Funds. These fees and expenses are not included in the Fund's annualized expense ratio used to calculate the expense estimate in the table below.
Please note that the expenses shown in the table are meant to highlight your ongoing costs only and do not reflect any transaction costs. Therefore, the second line of the table is useful in comparing ongoing costs only, and will not help you determine the relative total costs of owning different funds.
| | Annualized Expense Ratio-A | Beginning
Account Value
July 1, 2019 | Ending
Account Value
December 31, 2019 | Expenses Paid
During Period-B
July 1, 2019
to December 31, 2019 |
| Initial Class | .65% | | | |
| Actual | | $1,000.00 | $1,137.90 | $3.50 |
| Hypothetical-C | | $1,000.00 | $1,021.93 | $3.31 |
| Service Class 2 | .91% | | | |
| Actual | | $1,000.00 | $1,136.80 | $4.90 |
| Hypothetical-C | | $1,000.00 | $1,020.62 | $4.63 |
| Investor Class | .72% | | | |
| Actual | | $1,000.00 | $1,137.40 | $3.88 |
| Hypothetical-C | | $1,000.00 | $1,021.58 | $3.67 |
A Annualized expense ratio reflects expenses net of applicable fee waivers.
B Expenses are equal to each Class' annualized expense ratio, multiplied by the average account value over the period, multiplied by 184/365 (to reflect the one-half year period).
C 5% return per year before expenses
Distributions (Unaudited)
The Board of Trustees of VIP Health Care Portfolio voted to pay to shareholders of record at the opening of business on record date, the following distributions per share derived from capital gains realized from sales of portfolio securities, and dividends derived from net investment income:
| | Pay Date | Record Date | Dividends | Capital Gains |
| VIP Health Care Portfolio | | | | |
| Initial Class | 02/14/20 | 02/14/20 | $0.006 | $1.200 |
| Service Class 2 | 02/14/20 | 02/14/20 | $0.002 | $1.200 |
| Investor Class | 02/14/20 | 02/14/20 | $0.004 | $1.200 |
|
The fund hereby designates as a capital gain dividend with respect to the taxable year ended December 31, 2019, $26,868,688, or, if subsequently determined to be different, the net capital gain of such year.
A percentage of the dividends distributed during the fiscal year for the following funds qualify for the dividends–received deduction for corporate shareholders:
| | February 2019 | December 2019 |
| VIP Health Care Portfolio | | |
| Initial Class | 16% | 100% |
| Service Class 2 | – | 100% |
| Investor Class | 27% | 100% |
|
Board Approval of Investment Advisory Contracts
VIP Health Care Portfolio
At its November 2019 meeting, the Board of Trustees, including the Independent Trustees (together, the Board), voted to approve an amended and restated management contract and amended and restated sub-advisory agreements (together, the Amended and Restated Contracts) for the fund, effective January 1, 2020, for a one month period through January 31, 2020, in connection with an upcoming consolidation of certain of Fidelity's advisory businesses.
The Board considered that, on or about January 1, 2020, each of FMR Co., Inc. (FMRC), Fidelity Investments Money Management, Inc. (FIMM), and SelectCo, LLC (SelectCo) will merge with and into Fidelity Management & Research Company (FMR) and that, after the merger, FMR will redomicile as a Delaware limited liability company. The Board also approved the termination of the sub-advisory agreement with FMRC upon the completion of the merger. The Board noted that the Amended and Restated Contracts would be updated to reflect the renamed adviser, Fidelity Management & Research Company LLC and its new form of organization and domicile. The Board also noted that the Amended and Restated Contracts will not change the investment processes, the level or nature of services provided, the resources and personnel allocated, trading and compliance operations, or any fees or expenses paid by the fund.
The Board concluded that the fund's Amended and Restated Contracts are fair and reasonable, and that the fund's Advisory Contracts should be approved through January 31, 2020.
In connection with its consideration of future renewals of the fund's Amended and Restated Contracts, the Board will consider: (i) the nature, extent and quality of services provided to the fund, including shareholder and administrative services and investment performance; (ii) the competitiveness of the management fee and total expenses for the fund; (iii) the costs of the services and profitability, including the revenues earned and the expenses incurred in conducting the business of developing, marketing, distributing, managing, administering, and servicing the fund and its shareholders, to the extent applicable; and (iv) whether there have been economies of scale in respect of the Fidelity funds, whether the Fidelity funds (including the fund) have appropriately benefited from any such economies of scale, and whether there is the potential for realization of any further economies.
Based on its evaluation of all of the conclusions noted above, and after considering all factors it believed relevant, the Board ultimately concluded that the fund's management fee structure is fair and reasonable, and that the continuation of the fund's Amended and Restated Contracts should be approved.
VHCIC-ANN-0220
1.817373.114
Fidelity® Variable Insurance Products:
Real Estate Portfolio
Annual Report
December 31, 2019
See the inside front cover for important information about access to your fund’s shareholder reports.
Beginning on January 1, 2021, as permitted by regulations adopted by the Securities and Exchange Commission, and if your insurance carrier elects to participate, you may not be receiving paper copies of the Fund’s shareholder reports from the insurance company that offers your variable insurance product unless you specifically request paper copies from your financial professional or the administrator of your variable insurance product. Instead, the reports will be made available on a website, and you will be notified by mail each time a report is posted and provided with a website link to access the report.
If you already elected to receive shareholder reports electronically, you will not be affected by this change and you need not take any action. You may elect to receive shareholder reports and other communications from the Fund electronically, by contacting your financial professional or the administrator of your variable insurance product. If you own a Fidelity-administered variable insurance product, please visit fidelity.com/mailpreferences to make your election or call 1-800-343-3548.
You may elect to receive all future reports in paper free of charge. If you wish to continue receiving paper copies of your shareholder reports, you may contact your financial professional or the administrator of your variable insurance product. If you own a Fidelity-administered variable insurance product, please visit fidelity.com/mailpreferences to make your election or call 1-800-343-3548. Your election to receive reports in paper will apply to all funds available under your variable insurance product.
Contents
To view a fund's proxy voting guidelines and proxy voting record for the 12-month period ended June 30, visit http://www.fidelity.com/proxyvotingresults or visit the Securities and Exchange Commission's (SEC) web site at http://www.sec.gov.
You may also call 1-877-208-0098 to request a free copy of the proxy voting guidelines.
Fidelity® Variable Insurance Products are separate account options which are purchased through a variable insurance contract.
Standard & Poor's, S&P and S&P 500 are registered service marks of The McGraw-Hill Companies, Inc. and have been licensed for use by Fidelity Distributors Corporation.
Other third-party marks appearing herein are the property of their respective owners.
All other marks appearing herein are registered or unregistered trademarks or service marks of FMR LLC or an affiliated company. © 2020 FMR LLC. All rights reserved.
This report and the financial statements contained herein are submitted for the general information of the shareholders of the Fund. This report is not authorized for distribution to prospective investors in the Fund unless preceded or accompanied by an effective prospectus.
A fund files its complete schedule of portfolio holdings with the SEC for the first and third quarters of each fiscal year on Form N-PORT. Forms N-PORT are available on the SEC’s web site at http://www.sec.gov. A fund's Forms N-PORT may be reviewed and copied at the SEC’s Public Reference Room in Washington, DC. Information regarding the operation of the SEC's Public Reference Room may be obtained by calling 1-800-SEC-0330.
For a complete list of a fund's portfolio holdings, view the most recent holdings listing, semiannual report, or annual report on Fidelity's web site at http://www.fidelity.com, http://www.institutional.fidelity.com, or http://www.401k.com, as applicable.
NOT FDIC INSURED •MAY LOSE VALUE •NO BANK GUARANTEE
Neither the Fund nor Fidelity Distributors Corporation is a bank.
Note to shareholders:
As part of a regular review of its organizational structure, Fidelity has decided to merge certain entities to streamline operations, increase efficiency, simplify reporting, and reduce legal, compliance, and accounting complexity and costs. In separate events, Fidelity has merged four of its investment advisers and two of its broker-dealers.
Effective on or about January 1, 2020, following any required regulatory notices and approvals:
Investment advisers Fidelity Investments Money Management, Inc., FMR Co., Inc., and Fidelity SelectCo, LLC, merged with and into Fidelity Management & Research Company. In connection with the merger transactions, the resulting, merged investment adviser was then redomiciled from Massachusetts to Delaware, changed its corporate structure from a corporation to a limited liability company, and changed its name to “Fidelity Management & Research Company LLC”.
Broker-dealer Fidelity Distributors Corporation merged with and into Fidelity Investments Institutional Services Company, Inc. (“FIISC”). FIISC was then redomiciled from Massachusetts to Delaware, changed its corporate structure from a corporation to a limited liability company, and changed its name to “Fidelity Distributors Company LLC”.
These mergers are not expected to affect fund shareholders or Fidelity clients, nor are they expected to result in any changes to the day-to-day management of Fidelity’s brokerage services, the Fidelity funds, their investment policies and practices, their portfolio management teams, or the funds’ expenses.
Performance: The Bottom Line
Average annual total return reflects the change in the value of an investment, assuming reinvestment of distributions from dividend income and capital gains (the profits earned upon the sale of securities that have grown in value, if any) and assuming a constant rate of performance each year. During periods of reimbursement by Fidelity, a fund’s total return will be greater than it would be had the reimbursement not occurred. Performance numbers are net of all underlying fund operating expenses, but do not include any insurance charges imposed by your insurance company’s separate account. If performance information included the effect of these additional charges, the total returns would have been lower. How a fund did yesterday is no guarantee of how it will do tomorrow.
Average Annual Total Returns
| For the periods ended December 31, 2019 | Past 1 year | Past 5 years | Past 10 years |
| Initial Class | 23.22% | 5.69% | 11.32% |
| Service Class | 23.09% | 5.59% | 11.21% |
| Service Class 2 | 22.95% | 5.43% | 11.04% |
| Investor Class | 23.15% | 5.60% | 11.22% |
$10,000 Over 10 Years
Let's say hypothetically that $10,000 was invested in VIP Real Estate Portfolio - Initial Class on December 31, 2009.
The chart shows how the value of your investment would have changed, and also shows how the S&P 500® Index performed over the same period.
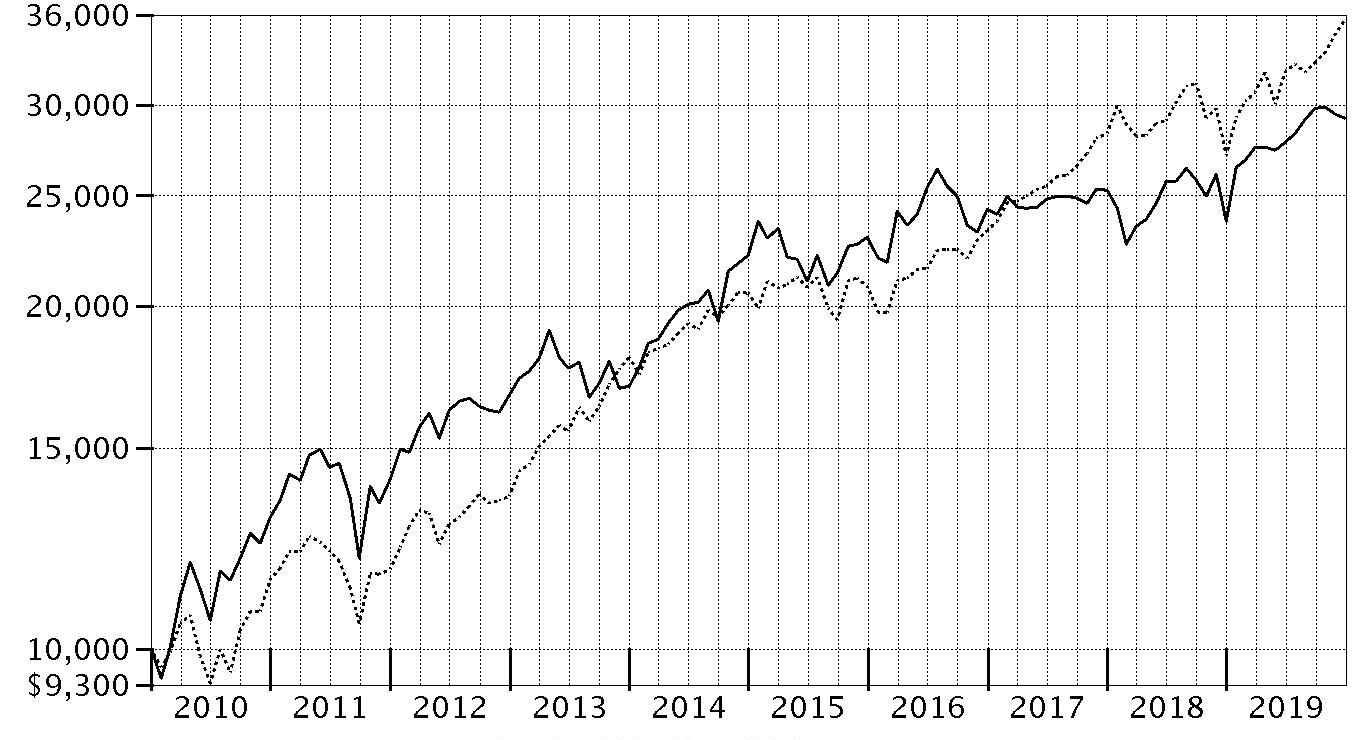
| Period Ending Values |
| $29,221 | VIP Real Estate Portfolio - Initial Class |
| $35,666 | S&P 500® Index |
Management's Discussion of Fund Performance
Market Recap: U.S. stocks continued to roll in 2019, with the S&P 500
® index soaring 31.49% and marking history as the longest and strongest bull market ever, despite persistent, nagging concerns about global economic growth and trade. After a rough end to 2018, equities sharply reversed course to begin the new year amid upbeat company earnings and signs the Federal Reserve may pause on rates. The uptrend continued until May, when the index sunk as trade negotiations between the U.S. and China broke down. The bull market roared back to record a series of highs in July, when the Fed cut interest rates for the first time since 2008. Volatility intensified in August, as the Treasury yield curve inverted, which some investors viewed as a sign the U.S. economy could be heading for recession. But the market proved resilient, hitting a new high on October 30, when the Fed lowered rates for the third time in 2019, and moving even higher through year-end. Gains were robust and broad-based, with information technology (+50%) leading the way with its best calendar-year result in a decade, amid strong growth trends. Communication services (+33%) and financials (+32%) also stood out. In contrast, energy (+12%) was by far the weakest group – struggling amid sluggish oil prices – while several strong gainers nonetheless fell short of the broader market: industrials and real estate (+29% each), consumer discretionary and consumer staples (+28% each), utilities (+26%), materials (+25%), and health care (+21%).
Comments from Portfolio Manager Samuel Wald: For the year, the fund's share classes rose about 23%, roughly matching the 23.10% gain of the Dow Jones U.S. Select Real Estate Securities Index℠. Compared with the index, the fund benefited from an overweighting in the strong-performing industrial REITs segment, along with picks among office and hotel REITs. Several wireless-communication tower REITs and the decision to limit exposure to mall REITs, whose business continued to face significant fundamental challenges, further contributed. In contrast, lackluster investment choices among apartments and healthcare REITs weighed on the portfolio's relative result in 2019. In terms of individual holdings, the fund's top contributor was data-center operator Equinix (+66%), an out-of-benchmark stock that gained sharply throughout 2019. As such, I sold the fund's holding in Equinix prior to year-end. Industrial REITs Prologis (+56%) and Terreno Realty (+57%) also added value, as did manufacturing housing REIT Equity Lifestyle Properties (+48%). As it relates to malls, the portfolio benefited from a notable underweighting in Simon Property Group (-7%) and lack of exposure to benchmark component Macerich (-32%). That said, the one mall stock I did overweight – Taubman Centers (-27%) – was the biggest individual detractor this period. The decision to avoid benchmark component Sun Communities (+51%) also pressured the fund's return versus the index. Lastly, Ventas (+3%) posed another relative performance challenge, as the health care REIT reported disappointing third-quarter earnings.
The views expressed above reflect those of the portfolio manager(s) only through the end of the period as stated on the cover of this report and do not necessarily represent the views of Fidelity or any other person in the Fidelity organization. Any such views are subject to change at any time based upon market or other conditions and Fidelity disclaims any responsibility to update such views. These views may not be relied on as investment advice and, because investment decisions for a Fidelity fund are based on numerous factors, may not be relied on as an indication of trading intent on behalf of any Fidelity fund.
Investment Summary (Unaudited)
Top Ten Stocks as of December 31, 2019
| | % of fund's net assets |
| Prologis, Inc. | 10.2 |
| AvalonBay Communities, Inc. | 6.5 |
| Digital Realty Trust, Inc. | 5.4 |
| Ventas, Inc. | 4.6 |
| Essex Property Trust, Inc. | 4.4 |
| UDR, Inc. | 4.1 |
| Equity Residential (SBI) | 4.1 |
| Equity Lifestyle Properties, Inc. | 4.0 |
| Highwoods Properties, Inc. (SBI) | 3.7 |
| Welltower, Inc. | 3.7 |
| | 50.7 |
Top Five REIT Sectors as of December 31, 2019
| | % of fund's net assets |
| REITs - Apartments | 22.1 |
| REITs - Warehouse/Industrial | 13.6 |
| REITs - Office Property | 12.3 |
| REITs - Health Care | 11.0 |
| REITs - Diversified | 9.7 |
Asset Allocation (% of fund's net assets)
| As of December 31, 2019 |
| | Stocks | 98.5% |
| | Short-Term Investments and Net Other Assets (Liabilities) | 1.5% |

Schedule of Investments December 31, 2019
Showing Percentage of Net Assets
| Common Stocks - 98.5% | | | |
| | | Shares | Value |
| Capital Markets - 0.0% | | | |
| Asset Management & Custody Banks - 0.0% | | | |
| Ashford, Inc. (a) | | 1,439 | $33,960 |
| Equity Real Estate Investment Trusts (REITs) - 97.2% | | | |
| REITs - Apartments - 22.1% | | | |
| AvalonBay Communities, Inc. | | 129,542 | 27,164,957 |
| Equity Residential (SBI) | | 212,570 | 17,201,164 |
| Essex Property Trust, Inc. | | 61,448 | 18,487,245 |
| Invitation Homes, Inc. | | 422,900 | 12,674,313 |
| UDR, Inc. | | 373,200 | 17,428,440 |
| | | | 92,956,119 |
| REITs - Diversified - 9.7% | | | |
| Clipper Realty, Inc. | | 224,700 | 2,381,820 |
| Crown Castle International Corp. | | 30,200 | 4,292,930 |
| Digital Realty Trust, Inc. | | 190,600 | 22,822,444 |
| Duke Realty Corp. | | 328,400 | 11,385,628 |
| | | | 40,882,822 |
| REITs - Health Care - 11.0% | | | |
| Healthcare Realty Trust, Inc. | | 342,000 | 11,412,540 |
| Ventas, Inc. | | 331,610 | 19,147,161 |
| Welltower, Inc. | | 189,128 | 15,466,888 |
| | | | 46,026,589 |
| REITs - Hotels - 4.5% | | | |
| Braemar Hotels & Resorts, Inc. | | 296,800 | 2,650,424 |
| RLJ Lodging Trust | | 570,100 | 10,102,172 |
| Sunstone Hotel Investors, Inc. | | 443,000 | 6,166,560 |
| | | | 18,919,156 |
| REITs - Management/Investment - 1.8% | | | |
| Lexington Corporate Properties Trust | | 426,800 | 4,532,616 |
| Weyerhaeuser Co. | | 106,000 | 3,201,200 |
| | | | 7,733,816 |
| REITs - Manufactured Homes - 4.0% | | | |
| Equity Lifestyle Properties, Inc. | | 238,920 | 16,817,579 |
| REITs - Office Property - 12.3% | | | |
| Alexandria Real Estate Equities, Inc. | | 69,600 | 11,245,968 |
| Boston Properties, Inc. | | 76,377 | 10,529,333 |
| Douglas Emmett, Inc. | | 236,300 | 10,373,570 |
| Highwoods Properties, Inc. (SBI) | | 317,700 | 15,538,707 |
| Mack-Cali Realty Corp. | | 166,200 | 3,844,206 |
| | | | 51,531,784 |
| REITs - Regional Malls - 4.4% | | | |
| Simon Property Group, Inc. | | 93,899 | 13,987,195 |
| Taubman Centers, Inc. | | 143,600 | 4,464,524 |
| | | | 18,451,719 |
| REITs - Shopping Centers - 5.6% | | | |
| Acadia Realty Trust (SBI) | | 263,300 | 6,827,369 |
| Cedar Realty Trust, Inc. | | 975,391 | 2,877,403 |
| SITE Centers Corp. | | 486,700 | 6,823,534 |
| Urban Edge Properties | | 355,905 | 6,826,258 |
| | | | 23,354,564 |
| REITs - Storage - 8.2% | | | |
| CubeSmart | | 460,500 | 14,496,540 |
| Extra Space Storage, Inc. | | 97,700 | 10,319,074 |
| Public Storage | | 45,655 | 9,722,689 |
| | | | 34,538,303 |
| REITs - Warehouse/Industrial - 13.6% | | | |
| Americold Realty Trust | | 283,800 | 9,950,028 |
| Prologis, Inc. | | 479,554 | 42,747,446 |
| Terreno Realty Corp. | | 83,900 | 4,542,346 |
| | | | 57,239,820 |
|
| TOTAL EQUITY REAL ESTATE INVESTMENT TRUSTS (REITS) | | | 408,452,271 |
|
| Hotels, Restaurants & Leisure - 1.3% | | | |
| Hotels, Resorts & Cruise Lines - 1.3% | | | |
| Marriott International, Inc. Class A | | 36,700 | 5,557,481 |
| TOTAL COMMON STOCKS | | | |
| (Cost $309,392,513) | | | 414,043,712 |
|
| Money Market Funds - 0.6% | | | |
| Fidelity Cash Central Fund 1.58% (b) | | | |
| (Cost $2,495,484) | | 2,495,313 | 2,495,812 |
| TOTAL INVESTMENT IN SECURITIES - 99.1% | | | |
| (Cost $311,887,997) | | | 416,539,524 |
| NET OTHER ASSETS (LIABILITIES) - 0.9% | | | 3,822,437 |
| NET ASSETS - 100% | | | $420,361,961 |
Legend
(a) Non-income producing
(b) Affiliated fund that is generally available only to investment companies and other accounts managed by Fidelity Investments. The rate quoted is the annualized seven-day yield of the fund at period end. A complete unaudited listing of the fund's holdings as of its most recent quarter end is available upon request. In addition, each Fidelity Central Fund's financial statements, which are not covered by the Fund's Report of Independent Registered Public Accounting Firm, are available on the SEC's website or upon request.
Affiliated Central Funds
Information regarding fiscal year to date income earned by the Fund from investments in Fidelity Central Funds is as follows:
| Fund | Income earned |
| Fidelity Cash Central Fund | $113,866 |
| Fidelity Securities Lending Cash Central Fund | 147 |
| Total | $114,013 |
Amounts in the income column in the above table include any capital gain distributions from underlying funds, which are presented in the corresponding line-item in the Statement of Operations, if applicable. Amount for Fidelity Securities Lending Cash Central Fund represents the income earned on investing cash collateral, less rebates paid to borrowers and any lending agent fees associated with the loan, plus any premium payments received for lending certain types of securities.
Investment Valuation
All investments are categorized as Level 1 under the Fair Value Hierarchy. The inputs or methodology used for valuing securities may not be an indication of the risk associated with investing in those securities. For more information on valuation inputs please refer to the Investment Valuation section in the accompanying Notes to Financial Statements.
See accompanying notes which are an integral part of the financial statements.
Financial Statements
Statement of Assets and Liabilities
| | | December 31, 2019 |
| Assets | | |
Investment in securities, at value — See accompanying schedule:
Unaffiliated issuers (cost $309,392,513) | $414,043,712 | |
| Fidelity Central Funds (cost $2,495,484) | 2,495,812 | |
| Total Investment in Securities (cost $311,887,997) | | $416,539,524 |
| Receivable for fund shares sold | | 2,164,219 |
| Dividends receivable | | 2,112,563 |
| Distributions receivable from Fidelity Central Funds | | 4,884 |
| Prepaid expenses | | 2,891 |
| Other receivables | | 2,203 |
| Total assets | | 420,826,284 |
| Liabilities | | |
| Payable for fund shares redeemed | 154,787 | |
| Accrued management fee | 184,846 | |
| Audit fee payable | 44,069 | |
| Transfer agent fee payable | 35,362 | |
| Distribution and service plan fees payable | 26,352 | |
| Other affiliated payables | 13,478 | |
| Other payables and accrued expenses | 5,429 | |
| Total liabilities | | 464,323 |
| Net Assets | | $420,361,961 |
| Net Assets consist of: | | |
| Paid in capital | | $299,897,764 |
| Total accumulated earnings (loss) | | 120,464,197 |
| Net Assets | | $420,361,961 |
| Net Asset Value and Maximum Offering Price | | |
| Initial Class: | | |
| Net Asset Value, offering price and redemption price per share ($90,028,621 ÷ 4,549,172 shares) | | $19.79 |
| Service Class: | | |
| Net Asset Value, offering price and redemption price per share ($12,932,883 ÷ 656,409 shares) | | $19.70 |
| Service Class 2: | | |
| Net Asset Value, offering price and redemption price per share ($124,525,955 ÷ 6,402,666 shares) | | $19.45 |
| Investor Class: | | |
| Net Asset Value, offering price and redemption price per share ($192,874,502 ÷ 9,804,500 shares) | | $19.67 |
See accompanying notes which are an integral part of the financial statements.
Statement of Operations
| | | Year ended December 31, 2019 |
| Investment Income | | |
| Dividends | | $11,438,225 |
| Income from Fidelity Central Funds (including $147 from security lending) | | 114,013 |
| Total income | | 11,552,238 |
| Expenses | | |
| Management fee | $2,164,502 | |
| Transfer agent fees | 406,975 | |
| Distribution and service plan fees | 312,769 | |
| Accounting and security lending fees | 157,086 | |
| Custodian fees and expenses | 12,102 | |
| Independent trustees' fees and expenses | 2,191 | |
| Audit | 50,294 | |
| Legal | 876 | |
| Miscellaneous | 2,769 | |
| Total expenses before reductions | 3,109,564 | |
| Expense reductions | (18,620) | |
| Total expenses after reductions | | 3,090,944 |
| Net investment income (loss) | | 8,461,294 |
| Realized and Unrealized Gain (Loss) | | |
| Net realized gain (loss) on: | | |
| Investment securities: | | |
| Unaffiliated issuers | 16,530,896 | |
| Total net realized gain (loss) | | 16,530,896 |
| Change in net unrealized appreciation (depreciation) on investment securities | | 52,833,799 |
| Net gain (loss) | | 69,364,695 |
| Net increase (decrease) in net assets resulting from operations | | $77,825,989 |
See accompanying notes which are an integral part of the financial statements.
Statement of Changes in Net Assets
| | Year ended December 31, 2019 | Year ended December 31, 2018 |
| Increase (Decrease) in Net Assets | | |
| Operations | | |
| Net investment income (loss) | $8,461,294 | $8,162,318 |
| Net realized gain (loss) | 16,530,896 | 6,629,182 |
| Change in net unrealized appreciation (depreciation) | 52,833,799 | (38,796,353) |
| Net increase (decrease) in net assets resulting from operations | 77,825,989 | (24,004,853) |
| Distributions to shareholders | (14,732,497) | (31,385,907) |
| Share transactions - net increase (decrease) | 17,708,050 | (27,132,122) |
| Total increase (decrease) in net assets | 80,801,542 | (82,522,882) |
| Net Assets | | |
| Beginning of period | 339,560,419 | 422,083,301 |
| End of period | $420,361,961 | $339,560,419 |
See accompanying notes which are an integral part of the financial statements.
Financial Highlights
VIP Real Estate Portfolio Initial Class
| Years ended December 31, | 2019 | 2018 | 2017 | 2016 | 2015 |
| Selected Per–Share Data | | | | | |
| Net asset value, beginning of period | $16.68 | $19.44 | $20.21 | $19.61 | $19.73 |
| Income from Investment Operations | | | | | |
| Net investment income (loss)A | .43 | .40 | .36 | .36B | .38 |
| Net realized and unrealized gain (loss) | 3.41 | (1.64) | .42 | .74 | .33 |
| Total from investment operations | 3.84 | (1.24) | .78 | 1.10 | .71 |
| Distributions from net investment income | (.34) | (.51) | (.36) | (.30) | (.39) |
| Distributions from net realized gain | (.39) | (1.00) | (1.19) | (.20) | (.44) |
| Total distributions | (.73) | (1.52)C | (1.55) | (.50) | (.83) |
| Net asset value, end of period | $19.79 | $16.68 | $19.44 | $20.21 | $19.61 |
| Total ReturnD,E | 23.22% | (6.22)% | 4.07% | 5.75% | 3.71% |
| Ratios to Average Net AssetsF,G | | | | | |
| Expenses before reductions | .66% | .67% | .68% | .67% | .67% |
| Expenses net of fee waivers, if any | .66% | .67% | .68% | .67% | .67% |
| Expenses net of all reductions | .65% | .67% | .67% | .66% | .67% |
| Net investment income (loss) | 2.21% | 2.23% | 1.84% | 1.79%B | 1.92% |
| Supplemental Data | | | | | |
| Net assets, end of period (000 omitted) | $90,029 | $74,259 | $107,038 | $102,666 | $99,804 |
| Portfolio turnover rateH | 44% | 50% | 52% | 65% | 72% |
A Calculated based on average shares outstanding during the period.
B Net investment income per share reflects a large, non-recurring dividend which amounted to $.06 per share. Excluding this non-recurring dividend, the ratio of net investment income (loss) to average net assets would have been 1.47%.
C Total distributions of $1.52 per share is comprised of distributions from net investment income of $.514 and distributions from net realized gain of $1.004 per share.
D Total returns do not reflect charges attributable to your insurance company's separate account. Inclusion of these charges would reduce the total returns shown.
E Total returns would have been lower if certain expenses had not been reduced during the applicable periods shown.
F Fees and expenses of any underlying Fidelity Central Funds are not included in the Fund's expense ratio. The Fund indirectly bears its proportionate share of the expenses of any underlying Fidelity Central Funds.
G Expense ratios reflect operating expenses of the class. Expenses before reductions do not reflect amounts reimbursed by the investment adviser or reductions from brokerage service arrangements or reductions from other expense offset arrangements and do not represent the amount paid by the class during periods when reimbursements or reductions occur. Expenses net of fee waivers reflect expenses after reimbursement by the investment adviser but prior to reductions from brokerage service arrangements or other expense offset arrangements. Expenses net of all reductions represent the net expenses paid by the class.
H Amount does not include the portfolio activity of any underlying Fidelity Central Funds.
See accompanying notes which are an integral part of the financial statements.
VIP Real Estate Portfolio Service Class
| Years ended December 31, | 2019 | 2018 | 2017 | 2016 | 2015 |
| Selected Per–Share Data | | | | | |
| Net asset value, beginning of period | $16.61 | $19.37 | $20.14 | $19.56 | $19.68 |
| Income from Investment Operations | | | | | |
| Net investment income (loss)A | .41 | .38 | .34 | .34B | .36 |
| Net realized and unrealized gain (loss) | 3.39 | (1.63) | .42 | .74 | .33 |
| Total from investment operations | 3.80 | (1.25) | .76 | 1.08 | .69 |
| Distributions from net investment income | (.33) | (.50) | (.34) | (.29) | (.37) |
| Distributions from net realized gain | (.39) | (1.00) | (1.19) | (.20) | (.44) |
| Total distributions | (.71)C | (1.51)D | (1.53) | (.50)E | (.81) |
| Net asset value, end of period | $19.70 | $16.61 | $19.37 | $20.14 | $19.56 |
| Total ReturnF,G | 23.09% | (6.31)% | 3.98% | 5.63% | 3.61% |
| Ratios to Average Net AssetsH,I | | | | | |
| Expenses before reductions | .76% | .77% | .78% | .77% | .77% |
| Expenses net of fee waivers, if any | .76% | .77% | .78% | .77% | .77% |
| Expenses net of all reductions | .75% | .77% | .77% | .76% | .76% |
| Net investment income (loss) | 2.11% | 2.13% | 1.74% | 1.69%B | 1.82% |
| Supplemental Data | | | | | |
| Net assets, end of period (000 omitted) | $12,933 | $9,737 | $7,877 | $8,781 | $4,060 |
| Portfolio turnover rateJ | 44% | 50% | 52% | 65% | 72% |
A Calculated based on average shares outstanding during the period.
B Net investment income per share reflects a large, non-recurring dividend which amounted to $.06 per share. Excluding this non-recurring dividend, the ratio of net investment income (loss) to average net assets would have been 1.38%.
C Total distributions of $.71 per share is comprised of distributions from net investment income of $.325 and distributions from net realized gain of $.389 per share.
D Total distributions of $1.51 per share is comprised of distributions from net investment income of $.503 and distributions from net realized gain of $1.004 per share.
E Total distributions of $.50 per share is comprised of distributions from net investment income of $.292 and distributions from net realized gain of $.204 per share.
F Total returns do not reflect charges attributable to your insurance company's separate account. Inclusion of these charges would reduce the total returns shown.
G Total returns would have been lower if certain expenses had not been reduced during the applicable periods shown.
H Fees and expenses of any underlying Fidelity Central Funds are not included in the Fund's expense ratio. The Fund indirectly bears its proportionate share of the expenses of any underlying Fidelity Central Funds.
I Expense ratios reflect operating expenses of the class. Expenses before reductions do not reflect amounts reimbursed by the investment adviser or reductions from brokerage service arrangements or reductions from other expense offset arrangements and do not represent the amount paid by the class during periods when reimbursements or reductions occur. Expenses net of fee waivers reflect expenses after reimbursement by the investment adviser but prior to reductions from brokerage service arrangements or other expense offset arrangements. Expenses net of all reductions represent the net expenses paid by the class.
J Amount does not include the portfolio activity of any underlying Fidelity Central Funds.
See accompanying notes which are an integral part of the financial statements.
VIP Real Estate Portfolio Service Class 2
| Years ended December 31, | 2019 | 2018 | 2017 | 2016 | 2015 |
| Selected Per–Share Data | | | | | |
| Net asset value, beginning of period | $16.40 | $19.14 | $19.92 | $19.35 | $19.47 |
| Income from Investment Operations | | | | | |
| Net investment income (loss)A | .37 | .35 | .31 | .31B | .33 |
| Net realized and unrealized gain (loss) | 3.36 | (1.62) | .41 | .72 | .33 |
| Total from investment operations | 3.73 | (1.27) | .72 | 1.03 | .66 |
| Distributions from net investment income | (.30) | (.47) | (.31) | (.26) | (.34) |
| Distributions from net realized gain | (.39) | (1.00) | (1.19) | (.20) | (.44) |
| Total distributions | (.68)C | (1.47) | (1.50) | (.46) | (.78) |
| Net asset value, end of period | $19.45 | $16.40 | $19.14 | $19.92 | $19.35 |
| Total ReturnD,E | 22.95% | (6.45)% | 3.77% | 5.46% | 3.49% |
| Ratios to Average Net AssetsF,G | | | | | |
| Expenses before reductions | .91% | .92% | .93% | .92% | .92% |
| Expenses net of fee waivers, if any | .91% | .92% | .93% | .92% | .92% |
| Expenses net of all reductions | .90% | .92% | .92% | .91% | .91% |
| Net investment income (loss) | 1.96% | 1.98% | 1.59% | 1.54%B | 1.67% |
| Supplemental Data | | | | | |
| Net assets, end of period (000 omitted) | $124,526 | $104,238 | $119,798 | $213,984 | $194,640 |
| Portfolio turnover rateH | 44% | 50% | 52% | 65% | 72% |
A Calculated based on average shares outstanding during the period.
B Net investment income per share reflects a large, non-recurring dividend which amounted to $.06 per share. Excluding this non-recurring dividend, the ratio of net investment income (loss) to average net assets would have been 1.23%.
C Total distributions of $.68 per share is comprised of distributions from net investment income of $.295 and distributions from net realized gain of $.389 per share.
D Total returns do not reflect charges attributable to your insurance company's separate account. Inclusion of these charges would reduce the total returns shown.
E Total returns would have been lower if certain expenses had not been reduced during the applicable periods shown.
F Fees and expenses of any underlying Fidelity Central Funds are not included in the Fund's expense ratio. The Fund indirectly bears its proportionate share of the expenses of any underlying Fidelity Central Funds.
G Expense ratios reflect operating expenses of the class. Expenses before reductions do not reflect amounts reimbursed by the investment adviser or reductions from brokerage service arrangements or reductions from other expense offset arrangements and do not represent the amount paid by the class during periods when reimbursements or reductions occur. Expenses net of fee waivers reflect expenses after reimbursement by the investment adviser but prior to reductions from brokerage service arrangements or other expense offset arrangements. Expenses net of all reductions represent the net expenses paid by the class.
H Amount does not include the portfolio activity of any underlying Fidelity Central Funds.
See accompanying notes which are an integral part of the financial statements.
VIP Real Estate Portfolio Investor Class
| Years ended December 31, | 2019 | 2018 | 2017 | 2016 | 2015 |
| Selected Per–Share Data | | | | | |
| Net asset value, beginning of period | $16.58 | $19.34 | $20.11 | $19.52 | $19.64 |
| Income from Investment Operations | | | | | |
| Net investment income (loss)A | .41 | .38 | .34 | .35B | .36 |
| Net realized and unrealized gain (loss) | 3.40 | (1.64) | .42 | .73 | .33 |
| Total from investment operations | 3.81 | (1.26) | .76 | 1.08 | .69 |
| Distributions from net investment income | (.33) | (.50) | (.35) | (.28) | (.37) |
| Distributions from net realized gain | (.39) | (1.00) | (1.19) | (.20) | (.44) |
| Total distributions | (.72) | (1.50) | (1.53)C | (.49)D | (.81) |
| Net asset value, end of period | $19.67 | $16.58 | $19.34 | $20.11 | $19.52 |
| Total ReturnE,F | 23.15% | (6.33)% | 3.99% | 5.65% | 3.64% |
| Ratios to Average Net AssetsG,H | | | | | |
| Expenses before reductions | .74% | .75% | .76% | .75% | .75% |
| Expenses net of fee waivers, if any | .73% | .75% | .76% | .75% | .75% |
| Expenses net of all reductions | .73% | .75% | .75% | .74% | .74% |
| Net investment income (loss) | 2.13% | 2.15% | 1.76% | 1.71%B | 1.84% |
| Supplemental Data | | | | | |
| Net assets, end of period (000 omitted) | $192,874 | $151,327 | $187,371 | $230,521 | $222,596 |
| Portfolio turnover rateI | 44% | 50% | 52% | 65% | 72% |
A Calculated based on average shares outstanding during the period.
B Net investment income per share reflects a large, non-recurring dividend which amounted to $.06 per share. Excluding this non-recurring dividend, the ratio of net investment income (loss) to average net assets would have been 1.39%.
C Total distributions of $1.53 per share is comprised of distributions from net investment income of $.345 and distributions from net realized gain of $1.189 per share.
D Total distributions of $.49 per share is comprised of distributions from net investment income of $.282 and distributions from net realized gain of $.204 per share.
E Total returns do not reflect charges attributable to your insurance company's separate account. Inclusion of these charges would reduce the total returns shown.
F Total returns would have been lower if certain expenses had not been reduced during the applicable periods shown.
G Fees and expenses of any underlying Fidelity Central Funds are not included in the Fund's expense ratio. The Fund indirectly bears its proportionate share of the expenses of any underlying Fidelity Central Funds.
H Expense ratios reflect operating expenses of the class. Expenses before reductions do not reflect amounts reimbursed by the investment adviser or reductions from brokerage service arrangements or reductions from other expense offset arrangements and do not represent the amount paid by the class during periods when reimbursements or reductions occur. Expenses net of fee waivers reflect expenses after reimbursement by the investment adviser but prior to reductions from brokerage service arrangements or other expense offset arrangements. Expenses net of all reductions represent the net expenses paid by the class.
I Amount does not include the portfolio activity of any underlying Fidelity Central Funds.
See accompanying notes which are an integral part of the financial statements.
Notes to Financial Statements
For the period ended December 31, 2019
1. Organization.
VIP Real Estate Portfolio (the Fund) is a non-diversified fund of Variable Insurance Products Fund IV (the Trust) and is authorized to issue an unlimited number of shares. The Trust is registered under the Investment Company Act of 1940, as amended (the 1940 Act), as an open-end management investment company organized as a Massachusetts business trust. Shares of the Fund may only be purchased by insurance companies for the purpose of funding variable annuity or variable life insurance contracts. The Fund offers the following classes of shares: Initial Class shares, Service Class shares, Service Class 2 shares and Investor Class shares. All classes have equal rights and voting privileges, except for matters affecting a single class.
2. Investments in Fidelity Central Funds.
The Fund invests in Fidelity Central Funds, which are open-end investment companies generally available only to other investment companies and accounts managed by the investment adviser and its affiliates. The Fund's Schedule of Investments lists each of the Fidelity Central Funds held as of period end, if any, as an investment of the Fund, but does not include the underlying holdings of each Fidelity Central Fund. As an Investing Fund, the Fund indirectly bears its proportionate share of the expenses of the underlying Fidelity Central Funds.
The Money Market Central Funds seek preservation of capital and current income and are managed by Fidelity Investments Money Management, Inc. (FIMM), an affiliate of the investment adviser. Annualized expenses of the Money Market Central Funds as of their most recent shareholder report date ranged from less than .005% to .01%.
A complete unaudited list of holdings for each Fidelity Central Fund is available upon request or at the Securities and Exchange Commission (the SEC) website at www.sec.gov. In addition, the financial statements of the Fidelity Central Funds, which are not covered by the Fund's Report of Independent Registered Public Accounting Firm, are available on the SEC website or upon request.
3. Significant Accounting Policies.
The Fund is an investment company and applies the accounting and reporting guidance of the Financial Accounting Standards Board (FASB) Accounting Standards Codification Topic 946 Financial Services – Investments Companies. The financial statements have been prepared in conformity with accounting principles generally accepted in the United States of America (GAAP), which require management to make certain estimates and assumptions at the date of the financial statements. Actual results could differ from those estimates. Subsequent events, if any, through the date that the financial statements were issued have been evaluated in the preparation of the financial statements. The following summarizes the significant accounting policies of the Fund:
Investment Valuation. Investments are valued as of 4:00 p.m. Eastern time on the last calendar day of the period. The Board of Trustees (the Board) has delegated the day to day responsibility for the valuation of the Fund's investments to the Fair Value Committee (the Committee) established by the Fund's investment adviser. In accordance with valuation policies and procedures approved by the Board, the Fund attempts to obtain prices from one or more third party pricing vendors or brokers to value its investments. When current market prices, quotations or currency exchange rates are not readily available or reliable, investments will be fair valued in good faith by the Committee, in accordance with procedures adopted by the Board. Factors used in determining fair value vary by investment type and may include market or investment specific events. The frequency with which these procedures are used cannot be predicted and they may be utilized to a significant extent. The Committee oversees the Fund's valuation policies and procedures and reports to the Board on the Committee's activities and fair value determinations. The Board monitors the appropriateness of the procedures used in valuing the Fund's investments and ratifies the fair value determinations of the Committee.
The Fund categorizes the inputs to valuation techniques used to value its investments into a disclosure hierarchy consisting of three levels as shown below:
- Level 1 – quoted prices in active markets for identical investments
- Level 2 – other significant observable inputs (including quoted prices for similar investments, interest rates, prepayment speeds, etc.)
- Level 3 – unobservable inputs (including the Fund's own assumptions based on the best information available)
Valuation techniques used to value the Fund's investments by major category are as follows:
Equity securities, including restricted securities, for which market quotations are readily available, are valued at the last reported sale price or official closing price as reported by a third party pricing vendor on the primary market or exchange on which they are traded and are categorized as Level 1 in the hierarchy. In the event there were no sales during the day or closing prices are not available, securities are valued at the last quoted bid price or may be valued using the last available price and are generally categorized as Level 2 in the hierarchy. For foreign equity securities, when market or security specific events arise, comparisons to the valuation of American Depositary Receipts (ADRs), futures contracts, Exchange-Traded Funds (ETFs) and certain indexes as well as quoted prices for similar securities may be used and would be categorized as Level 2 in the hierarchy. For equity securities, including restricted securities, where observable inputs are limited, assumptions about market activity and risk are used and these securities may be categorized as Level 3 in the hierarchy.
Investments in open-end mutual funds, including the Fidelity Central Funds, are valued at their closing net asset value (NAV) each business day and are categorized as Level 1 in the hierarchy.
Changes in valuation techniques may result in transfers in or out of an assigned level within the disclosure hierarchy.
Investment Transactions and Income. For financial reporting purposes, the Fund's investment holdings and NAV include trades executed through the end of the last business day of the period. The NAV per share for processing shareholder transactions is calculated as of the close of business of the New York Stock Exchange (NYSE), normally 4:00 p.m. Eastern time and includes trades executed through the end of the prior business day. Gains and losses on securities sold are determined on the basis of identified cost and include proceeds received from litigation. Dividend income is recorded on the ex-dividend date, except for certain dividends from foreign securities where the ex-dividend date may have passed, which are recorded as soon as the Fund is informed of the ex-dividend date. Non-cash dividends included in dividend income, if any, are recorded at the fair market value of the securities received. Income and capital gain distributions from Fidelity Central Funds, if any, are recorded on the ex-dividend date. Certain distributions received by the Fund represent a return of capital or capital gain. The Fund determines the components of these distributions subsequent to the ex-dividend date, based upon receipt of tax filings or other correspondence relating to the underlying investment. These distributions are recorded as a reduction of cost of investments and/or as a realized gain.
Class Allocations and Expenses. Investment income, realized and unrealized capital gains and losses, common expenses of the Fund, and certain fund-level expense reductions, if any, are allocated daily on a pro-rata basis to each class based on the relative net assets of each class to the total net assets of the Fund. Each class differs with respect to transfer agent and distribution and service plan fees incurred. Certain expense reductions may also differ by class. For the reporting period, the allocated portion of income and expenses to each class as a percent of its average net assets may vary due to the timing of recording these transactions in relation to fluctuating net assets of the classes. Expenses directly attributable to a fund are charged to that fund. Expenses attributable to more than one fund are allocated among the respective funds on the basis of relative net assets or other appropriate methods. Expense estimates are accrued in the period to which they relate and adjustments are made when actual amounts are known.
Income Tax Information and Distributions to Shareholders. Each year, the Fund intends to qualify as a regulated investment company under Subchapter M of the Internal Revenue Code, including distributing substantially all of its taxable income and realized gains. As a result, no provision for U.S. Federal income taxes is required. As of December 31, 2019, the Fund did not have any unrecognized tax benefits in the financial statements; nor is the Fund aware of any tax positions for which it is reasonably possible that the total amounts of unrecognized tax benefits will significantly change in the next twelve months. The Fund files a U.S. federal tax return, in addition to state and local tax returns as required. The Fund's federal income tax returns are subject to examination by the Internal Revenue Service (IRS) for a period of three fiscal years after they are filed. State and local tax returns may be subject to examination for an additional fiscal year depending on the jurisdiction.
Distributions are declared and recorded on the ex-dividend date. Income and capital gain distributions are declared separately for each class. Income and capital gain distributions are determined in accordance with income tax regulations, which may differ from GAAP.
Capital accounts within the financial statements are adjusted for permanent book-tax differences. These adjustments have no impact on net assets or the results of operations. Capital accounts are not adjusted for temporary book-tax differences which will reverse in a subsequent period.
Book-tax differences are primarily due to losses deferred due to wash sales.
As of period end, the cost and unrealized appreciation (depreciation) in securities, and derivatives if applicable, for federal income tax purposes were as follows:
| Gross unrealized appreciation | $112,967,566 |
| Gross unrealized depreciation | (10,052,204) |
| Net unrealized appreciation (depreciation) | $102,915,362 |
| Tax Cost | $313,624,162 |
The tax-based components of distributable earnings as of period end were as follows:
| Undistributed ordinary income | $1,625,636 |
| Undistributed long-term capital gain | $15,923,199 |
| Net unrealized appreciation (depreciation) on securities and other investments | $102,915,362 |
The tax character of distributions paid was as follows:
| | December 31, 2019 | December 31, 2018 |
| Ordinary Income | $7,726,968 | $ 10,086,687 |
| Long-term Capital Gains | 7,005,529 | 21,299,220 |
| Total | $14,732,497 | $ 31,385,907 |
4. Purchases and Sales of Investments.
Purchases and sales of securities, other than short-term securities, aggregated $184,130,280 and $173,124,850, respectively.
5. Fees and Other Transactions with Affiliates.
Management Fee. Fidelity Management & Research Company (the investment adviser) and its affiliates provide the Fund with investment management related services for which the Fund pays a monthly management fee. The management fee is the sum of an individual fund fee rate that is based on an annual rate of .30% of the Fund's average net assets and an annualized group fee rate that averaged .24% during the period. The group fee rate is based upon the average net assets of all the mutual funds advised by Fidelity Management & Research Company (FMR) and the investment adviser. The group fee rate decreases as assets under management increase and increases as assets under management decrease. For the reporting period, the total annual management fee rate was .54% of the Fund's average net assets.
Distribution and Service Plan Fees. In accordance with Rule 12b-1 of the 1940 Act, the Fund has adopted separate 12b-1 Plans for each Service Class of shares. Each Service Class pays Fidelity Distributors Corporation (FDC), an affiliate of the investment adviser, a service fee. For the period, the service fee is based on an annual rate of .10% of Service Class' average net assets and .25% of Service Class 2's average net assets.
For the period, total fees, all of which were re-allowed to insurance companies for the distribution of shares and providing shareholder support services, were as follows:
| Service Class | $12,021 |
| Service Class 2 | 300,748 |
| | $312,769 |
Transfer Agent Fees. Fidelity Investments Institutional Operations Company, Inc. (FIIOC), an affiliate of the investment adviser, is the Fund's transfer, dividend disbursing, and shareholder servicing agent. FIIOC receives an asset-based fee with respect to each class. Each class pays a fee for transfer agent services, typesetting and printing and mailing of shareholder reports, excluding mailing of proxy statements, equal to an annual rate of class-level average net assets. The annual rate for Investor Class is .15% and the annual rate for all other classes is .07%. For the period, transfer agent fees for each class were as follows:
| Initial Class | $56,421 |
| Service Class | 7,764 |
| Service Class 2 | 77,714 |
| Investor Class | 265,076 |
| | $406,975 |
Accounting and Security Lending Fees. Fidelity Service Company, Inc. (FSC), an affiliate of the investment adviser, maintains the Fund's accounting records. The accounting fee is based on the level of average net assets for each month. Prior to April 1, 2019, FSC had a separate agreement with the Fund for administration of the security lending program, based on the number and duration of lending transactions. For the period, the total fees paid for accounting and administration of securities lending were equivalent to the following annual rates:
| | % of Average Net Assets |
| VIP Real Estate Portfolio | .04 |
Brokerage Commissions. A portion of portfolio transactions were placed with brokerage firms which are affiliates of the investment adviser. Brokerage commissions are included in net realized gain (loss) and change in net unrealized appreciation (depreciation) in the Statement of Operations. The commissions paid to these affiliated firms were as follows:
| | Amount |
| VIP Real Estate Portfolio | $1,603 |
Interfund Trades. The Fund may purchase from or sell securities to other Fidelity Funds under procedures adopted by the Board. The procedures have been designed to ensure these interfund trades are executed in accordance with Rule 17a-7 of the 1940 Act. Interfund trades are included within the respective purchases and sales amounts shown in the Purchases and Sales of Investments note.
6. Committed Line of Credit.
The Fund participates with other funds managed by the investment adviser or an affiliate in a $4.25 billion credit facility (the "line of credit") to be utilized for temporary or emergency purposes to fund shareholder redemptions or for other short-term liquidity purposes. The Fund has agreed to pay commitment fees on its pro-rata portion of the line of credit, which amounted to $1,030 and is reflected in Miscellaneous expenses on the Statement of Operations. During the period, the Fund did not borrow on this line of credit.
7. Security Lending.
The Fund lends portfolio securities from time to time in order to earn additional income. For equity securities, lending agents are used, including National Financial Services (NFS), an affiliate of the Fund. Pursuant to a securities lending agreement, NFS will receive a fee, which is capped at 9.9% of daily lending revenue, for its services as lending agent. The Fund may lend securities to certain qualified borrowers. On the settlement date of the loan, the Fund receives collateral (in the form of U.S. Treasury obligations, letters of credit and/or cash) against the loaned securities and maintains collateral in an amount not less than 100% of the market value of the loaned securities during the period of the loan. The market value of the loaned securities is determined at the close of business of the Fund and any additional required collateral is delivered to the Fund on the next business day. The Fund or borrower may terminate the loan at any time, and if the borrower defaults on its obligation to return the securities loaned because of insolvency or other reasons, the Fund may apply collateral received from the borrower against the obligation. The Fund may experience delays and costs in recovering the securities loaned. Any cash collateral received is invested in the Fidelity Securities Lending Cash Central Fund. At period end, there were no security loans outstanding. Security lending income represents the income earned on investing cash collateral, less rebates paid to borrowers and any lending agent fees associated with the loan, plus any premium payments received for lending certain types of securities. Security lending income is presented in the Statement of Operations as a component of income from Fidelity Central Funds.
8. Expense Reductions.
Commissions paid to certain brokers with whom the investment adviser, or its affiliates, places trades on behalf of the Fund include an amount in addition to trade execution, which may be rebated back to the Fund to offset certain expenses. This amount totaled $15,291 for the period. In addition, through arrangements with the Fund's custodian, credits realized as a result of certain uninvested cash balances were used to reduce the Fund's expenses. During the period, custodian credits reduced the Fund's expenses by $457.
In addition, during the period the investment adviser reimbursed and/or waived a portion of fund-level operating expenses in the amount of $2,872.
9. Distributions to Shareholders.
Distributions to shareholders of each class were as follows:
| | Year ended
December 31, 2019 | Year ended
December 31, 2018 |
| Distributions to shareholders | | |
| Initial Class | $3,269,060 | $7,673,740 |
| Service Class | 435,567 | 713,768 |
| Service Class 2 | 4,254,402 | 9,221,236 |
| Investor Class | 6,773,468 | 13,777,163 |
| Total | $14,732,497 | $31,385,907 |
10. Share Transactions.
Transactions for each class of shares were as follows:
| | Shares | Shares | Dollars | Dollars |
| | Year ended December 31, 2019 | Year ended December 31, 2018 | Year ended December 31, 2019 | Year ended December 31, 2018 |
| Initial Class | | | | |
| Shares sold | 604,381 | 495,417 | $11,760,718 | $8,594,131 |
| Reinvestment of distributions | 170,521 | 462,425 | 3,269,060 | 7,673,740 |
| Shares redeemed | (677,817) | (2,012,593) | (13,152,357) | (36,655,697) |
| Net increase (decrease) | 97,085 | (1,054,751) | $1,877,421 | $(20,387,826) |
| Service Class | | | | |
| Shares sold | 205,317 | 266,146 | $3,978,899 | $4,748,357 |
| Reinvestment of distributions | 22,792 | 43,021 | 435,567 | 713,768 |
| Shares redeemed | (157,878) | (129,663) | (3,074,362) | (2,304,588) |
| Net increase (decrease) | 70,231 | 179,504 | $1,340,104 | $3,157,537 |
| Service Class 2 | | | | |
| Shares sold | 1,890,674 | 1,624,109 | $36,196,870 | $28,739,955 |
| Reinvestment of distributions | 226,182 | 564,331 | 4,254,402 | 9,221,236 |
| Shares redeemed | (2,068,384) | (2,092,364) | (39,464,142) | (36,826,165) |
| Net increase (decrease) | 48,472 | 96,076 | $987,130 | $1,135,026 |
| Investor Class | | | | |
| Shares sold | 1,776,425 | 286,688 | $34,621,226 | $5,147,252 |
| Reinvestment of distributions | 355,153 | 833,888 | 6,773,468 | 13,777,163 |
| Shares redeemed | (1,451,822) | (1,686,408) | (27,891,299) | (29,961,274) |
| Net increase (decrease) | 679,756 | (565,832) | $13,503,395 | $(11,036,859) |
11. Other.
The Fund's organizational documents provide former and current trustees and officers with a limited indemnification against liabilities arising in connection with the performance of their duties to the Fund. In the normal course of business, the Fund may also enter into contracts that provide general indemnifications. The Fund's maximum exposure under these arrangements is unknown as this would be dependent on future claims that may be made against the Fund. The risk of material loss from such claims is considered remote.
At the end of the period, the investment adviser or its affiliates were the owners of record of 55% of the total outstanding shares of the Fund and one otherwise unaffiliated shareholder was the owner of record of 11% of the total outstanding shares of the Fund.
Effective January 1, 2020, following any required regulatory notices and approvals:
Investment advisers Fidelity Investments Money Management, Inc., FMR Co., Inc., and Fidelity SelectCo, LLC, merged with and into Fidelity Management & Research Company. In connection with the merger transactions, the resulting, merged investment adviser was then redomiciled from Massachusetts to Delaware, changed its corporate structure from a corporation to a limited liability company, and changed its name to "Fidelity Management & Research Company LLC".
Broker-dealer Fidelity Distributors Corporation merged with and into Fidelity Investments Institutional Services Company, Inc. ("FIISC"). FIISC was then redomiciled from Massachusetts to Delaware, changed its corporate structure from a corporation to a limited liability company, and changed its name to "Fidelity Distributors Company LLC".
Fidelity Investments Institutional Operations Company, Inc. (FIIOC) converted from a Massachusetts corporation to a Massachusetts LLC, and changed its name to "Fidelity Investments Institutional Operations Company LLC".
Report of Independent Registered Public Accounting Firm
To the Board of Trustees of Variable Insurance Products Fund IV and Shareholders of VIP Real Estate Portfolio:
Opinion on the Financial Statements
We have audited the accompanying statement of assets and liabilities, including the schedule of investments, of VIP Real Estate Portfolio (one of the funds constituting Variable Insurance Products Fund IV, referred to hereafter as the “Fund”) as of December 31, 2019, the related statement of operations for the year ended December 31, 2019, the statement of changes in net assets for each of the two years in the period ended December 31, 2019, including the related notes, and the financial highlights for each of the five years in the period ended December 31, 2019 (collectively referred to as the “financial statements”). In our opinion, the financial statements present fairly, in all material respects, the financial position of the Fund as of December 31, 2019, the results of its operations for the year then ended, the changes in its net assets for each of the two years in the period ended December 31, 2019 and the financial highlights for each of the five years in the period ended December 31, 2019 in conformity with accounting principles generally accepted in the United States of America.
Basis for Opinion
These financial statements are the responsibility of the Fund’s management. Our responsibility is to express an opinion on the Fund’s financial statements based on our audits. We are a public accounting firm registered with the Public Company Accounting Oversight Board (United States) (PCAOB) and are required to be independent with respect to the Fund in accordance with the U.S. federal securities laws and the applicable rules and regulations of the Securities and Exchange Commission and the PCAOB.
We conducted our audits of these financial statements in accordance with the standards of the PCAOB. Those standards require that we plan and perform the audit to obtain reasonable assurance about whether the financial statements are free of material misstatement, whether due to error or fraud.
Our audits included performing procedures to assess the risks of material misstatement of the financial statements, whether due to error or fraud, and performing procedures that respond to those risks. Such procedures included examining, on a test basis, evidence regarding the amounts and disclosures in the financial statements. Our audits also included evaluating the accounting principles used and significant estimates made by management, as well as evaluating the overall presentation of the financial statements. Our procedures included confirmation of securities owned as of December 31, 2019 by correspondence with the custodian. We believe that our audits provide a reasonable basis for our opinion.
PricewaterhouseCoopers LLP
Boston, Massachusetts
February 11, 2020
We have served as the auditor of one or more investment companies in the Fidelity group of funds since 1932.
Trustees and Officers
The Trustees, Members of the Advisory Board (if any), and officers of the trust and fund, as applicable, are listed below. The Board of Trustees governs the fund and is responsible for protecting the interests of shareholders. The Trustees are experienced executives who meet periodically throughout the year to oversee the fund's activities, review contractual arrangements with companies that provide services to the fund, oversee management of the risks associated with such activities and contractual arrangements, and review the fund's performance. Each of the Trustees oversees 302 funds.
The Trustees hold office without limit in time except that (a) any Trustee may resign; (b) any Trustee may be removed by written instrument, signed by at least two-thirds of the number of Trustees prior to such removal; (c) any Trustee who requests to be retired or who has become incapacitated by illness or injury may be retired by written instrument signed by a majority of the other Trustees; and (d) any Trustee may be removed at any special meeting of shareholders by a two-thirds vote of the outstanding voting securities of the trust. Each Trustee who is not an interested person (as defined in the Investment Company Act of 1940 (1940 Act)) of the trust and the fund is referred to herein as an Independent Trustee. Each Independent Trustee shall retire not later than the last day of the calendar year in which his or her 75th birthday occurs. The Independent Trustees may waive this mandatory retirement age policy with respect to individual Trustees. Officers and Advisory Board Members hold office without limit in time, except that any officer or Advisory Board Member may resign or may be removed by a vote of a majority of the Trustees at any regular meeting or any special meeting of the Trustees. Except as indicated, each individual has held the office shown or other offices in the same company for the past five years.
The fund’s Statement of Additional Information (SAI) includes more information about the Trustees. To request a free copy, call Fidelity at 1-877-208-0098.
Experience, Skills, Attributes, and Qualifications of the Trustees. The Governance and Nominating Committee has adopted a statement of policy that describes the experience, qualifications, attributes, and skills that are necessary and desirable for potential Independent Trustee candidates (Statement of Policy). The Board believes that each Trustee satisfied at the time he or she was initially elected or appointed a Trustee, and continues to satisfy, the standards contemplated by the Statement of Policy. The Governance and Nominating Committee also engages professional search firms to help identify potential Independent Trustee candidates who have the experience, qualifications, attributes, and skills consistent with the Statement of Policy. From time to time, additional criteria based on the composition and skills of the current Independent Trustees, as well as experience or skills that may be appropriate in light of future changes to board composition, business conditions, and regulatory or other developments, have also been considered by the professional search firms and the Governance and Nominating Committee. In addition, the Board takes into account the Trustees' commitment and participation in Board and committee meetings, as well as their leadership of standing and ad hoc committees throughout their tenure.
In determining that a particular Trustee was and continues to be qualified to serve as a Trustee, the Board has considered a variety of criteria, none of which, in isolation, was controlling. The Board believes that, collectively, the Trustees have balanced and diverse experience, qualifications, attributes, and skills, which allow the Board to operate effectively in governing the fund and protecting the interests of shareholders. Information about the specific experience, skills, attributes, and qualifications of each Trustee, which in each case led to the Board's conclusion that the Trustee should serve (or continue to serve) as a trustee of the fund, is provided below.
Board Structure and Oversight Function. James C. Curvey is an interested person and currently serves as Chairman. The Trustees have determined that an interested Chairman is appropriate and benefits shareholders because an interested Chairman has a personal and professional stake in the quality and continuity of services provided to the fund. Independent Trustees exercise their informed business judgment to appoint an individual of their choosing to serve as Chairman, regardless of whether the Trustee happens to be independent or a member of management. The Independent Trustees have determined that they can act independently and effectively without having an Independent Trustee serve as Chairman and that a key structural component for assuring that they are in a position to do so is for the Independent Trustees to constitute a substantial majority for the Board. The Independent Trustees also regularly meet in executive session. Ned C. Lautenbach serves as Chairman of the Independent Trustees and as such (i) acts as a liaison between the Independent Trustees and management with respect to matters important to the Independent Trustees and (ii) with management prepares agendas for Board meetings.
Fidelity® funds are overseen by different Boards of Trustees. The fund's Board oversees Fidelity's high income and certain equity funds, and other Boards oversee Fidelity's investment-grade bond, money market, asset allocation, and other equity funds. The asset allocation funds may invest in Fidelity® funds overseen by the fund's Board. The use of separate Boards, each with its own committee structure, allows the Trustees of each group of Fidelity® funds to focus on the unique issues of the funds they oversee, including common research, investment, and operational issues. On occasion, the separate Boards establish joint committees to address issues of overlapping consequences for the Fidelity® funds overseen by each Board.
The Trustees operate using a system of committees to facilitate the timely and efficient consideration of all matters of importance to the Trustees, the fund, and fund shareholders and to facilitate compliance with legal and regulatory requirements and oversight of the fund's activities and associated risks. The Board, acting through its committees, has charged FMR and its affiliates with (i) identifying events or circumstances the occurrence of which could have demonstrably adverse effects on the fund's business and/or reputation; (ii) implementing processes and controls to lessen the possibility that such events or circumstances occur or to mitigate the effects of such events or circumstances if they do occur; and (iii) creating and maintaining a system designed to evaluate continuously business and market conditions in order to facilitate the identification and implementation processes described in (i) and (ii) above. Because the day-to-day operations and activities of the fund are carried out by or through FMR, its affiliates, and other service providers, the fund's exposure to risks is mitigated but not eliminated by the processes overseen by the Trustees. While each of the Board's committees has responsibility for overseeing different aspects of the fund's activities, oversight is exercised primarily through the Operations, Audit, and Compliance Committees. Appropriate personnel, including but not limited to the fund's Chief Compliance Officer (CCO), FMR's internal auditor, the independent accountants, the fund's Treasurer and portfolio management personnel, make periodic reports to the Board's committees, as appropriate, including an annual review of Fidelity's risk management program for the Fidelity® funds. The responsibilities of each standing committee, including their oversight responsibilities, are described further under "Standing Committees of the Trustees."
Interested Trustees*:
Correspondence intended for a Trustee who is an interested person may be sent to Fidelity Investments, 245 Summer Street, Boston, Massachusetts 02210.
Name, Year of Birth; Principal Occupations and Other Relevant Experience+
James C. Curvey (1935)
Year of Election or Appointment: 2018
Trustee
Chairman of the Board of Trustees
Mr. Curvey also serves as Trustee of other Fidelity® funds. Mr. Curvey is Vice Chairman (2007-present) and Director of FMR LLC (diversified financial services company). In addition, Mr. Curvey is an Overseer Emeritus for the Boston Symphony Orchestra, a Director of Artis-Naples, and a Trustee of Brewster Academy in Wolfeboro, New Hampshire. Previously, Mr. Curvey served as a Director of Fidelity Research & Analysis Co. (investment adviser firm, 2009-2018), Director of Fidelity Investments Money Management, Inc. (investment adviser firm, 2009-2014) and a Director of FMR and FMR Co., Inc. (investment adviser firms, 2007-2014).
* Determined to be an “Interested Trustee” by virtue of, among other things, his or her affiliation with the trust or various entities under common control with FMR.
+ The information includes the Trustee's principal occupation during the last five years and other information relating to the experience, attributes, and skills relevant to the Trustee's qualifications to serve as a Trustee, which led to the conclusion that the Trustee should serve as a Trustee for the fund.
Independent Trustees:
Correspondence intended for an Independent Trustee may be sent to Fidelity Investments, P.O. Box 55235, Boston, Massachusetts 02205-5235.
Name, Year of Birth; Principal Occupations and Other Relevant Experience+
Dennis J. Dirks (1948)
Year of Election or Appointment: 2018
Trustee
Mr. Dirks also serves as Trustee of other Fidelity® funds. Prior to his retirement in May 2003, Mr. Dirks was Chief Operating Officer and a member of the Board of The Depository Trust & Clearing Corporation (DTCC). He also served as President, Chief Operating Officer, and Board member of The Depository Trust Company (DTC) and President and Board member of the National Securities Clearing Corporation (NSCC). In addition, Mr. Dirks served as Chief Executive Officer and Board member of the Government Securities Clearing Corporation, Chief Executive Officer and Board member of the Mortgage-Backed Securities Clearing Corporation, as a Trustee and a member of the Finance Committee of Manhattan College (2005-2008), as a Trustee and a member of the Finance Committee of AHRC of Nassau County (2006-2008), as a member of the Independent Directors Council (IDC) Governing Council (2010-2015), and as a member of the Board of Directors for The Brookville Center for Children’s Services, Inc. (2009-2017). Mr. Dirks is a member of the Finance Committee (2016-present) and Board of Directors (2017-present) and is Treasurer (2018-present) of the Asolo Repertory Theatre.
Donald F. Donahue (1950)
Year of Election or Appointment: 2018
Trustee
Mr. Donahue also serves as a Trustee of other Fidelity® funds. Mr. Donahue is President and Chief Executive Officer of Miranda Partners, LLC (risk consulting for the financial services industry, 2012-present). Previously, Mr. Donahue served as a Member of the Advisory Board of certain Fidelity® funds (2015-2018) and Chief Executive Officer (2006-2012), Chief Operating Officer (2003-2006), and Managing Director, Customer Marketing and Development (1999-2003) of The Depository Trust & Clearing Corporation (financial markets infrastructure). Mr. Donahue serves as a Member (2007-present) and Co-Chairman (2016-present) of the Board of Directors of United Way of New York, Member of the Board of Directors of NYC Leadership Academy (2012-present) and Member of the Board of Advisors of Ripple Labs, Inc. (financial services, 2015-present). He also served as Chairman (2010-2012) and Member of the Board of Directors (2012-2013) of Omgeo, LLC (financial services), Treasurer of United Way of New York (2012-2016), and Member of the Board of Directors of XBRL US (financial services non-profit, 2009-2012) and the International Securities Services Association (2009-2012).
Alan J. Lacy (1953)
Year of Election or Appointment: 2018
Trustee
Mr. Lacy also serves as Trustee of other Fidelity® funds. Mr. Lacy serves as a Director of Bristol-Myers Squibb Company (global pharmaceuticals, 2008-present). He is a Trustee of the California Chapter of The Nature Conservancy (2015-present) and a Director of the Center for Advanced Study in the Behavioral Sciences at Stanford University (2015-present). In addition, Mr. Lacy served as Senior Adviser (2007-2014) of Oak Hill Capital Partners, L.P. (private equity) and also served as Chief Executive Officer (2005) and Vice Chairman (2005-2006) of Sears Holdings Corporation (retail) and Chief Executive Officer and Chairman of the Board of Sears, Roebuck and Co. (retail, 2000-2005). Previously, Mr. Lacy served as Chairman (2014-2017) and a member (2010-2017) of the Board of Directors of Dave & Buster’s Entertainment, Inc. (restaurant and entertainment complexes), as Chairman (2008-2011) and a member (2006-2015) of the Board of Trustees of the National Parks Conservation Association, and as a member of the Board of Directors for The Hillman Companies, Inc. (hardware wholesalers, 2010-2014), Earth Fare, Inc. (retail grocery, 2010-2014), and The Western Union Company (global money transfer, 2006-2011).
Ned C. Lautenbach (1944)
Year of Election or Appointment: 2018
Trustee
Chairman of the Independent Trustees
Mr. Lautenbach also serves as Trustee of other Fidelity® funds. Mr. Lautenbach currently serves as Chair (2018-present) and Member (2013-present) of the Board of Governors, State University System of Florida and is a member of the Council on Foreign Relations (1994-present). He is also a member and has most recently served as Chairman of the Board of Directors of Artis-Naples (2012-present). Previously, Mr. Lautenbach served as a member and then Lead Director of the Board of Directors of Eaton Corporation (diversified industrial, 1997-2016). He was also a Partner and Advisory Partner at Clayton, Dubilier & Rice, LLC (private equity investment, 1998-2010), as well as a Director of Sony Corporation (2006-2007). In addition, Mr. Lautenbach also had a 30-year career with IBM (technology company) during which time he served as Senior Vice President and a member of the Corporate Executive Committee (1968-1998).
Joseph Mauriello (1944)
Year of Election or Appointment: 2018
Trustee
Mr. Mauriello also serves as Trustee of other Fidelity® funds. Prior to his retirement in January 2006, Mr. Mauriello served in numerous senior management positions including Deputy Chairman and Chief Operating Officer (2004-2005), and Vice Chairman of Financial Services (2002-2004) of KPMG LLP US (professional services, 1965-2005). Mr. Mauriello currently serves as a member of the Independent Directors Council (IDC) Governing Council (2015-present). Previously, Mr. Mauriello served as a member of the Board of Directors of XL Group plc. (global insurance and re-insurance, 2006-2018).
Cornelia M. Small (1944)
Year of Election or Appointment: 2018
Trustee
Ms. Small also serves as Trustee of other Fidelity® funds. Ms. Small is a member of the Board of Directors (2009-present) and Chair of the Investment Committee (2010-present) of the Teagle Foundation. Ms. Small also serves on the Investment Committee of the Berkshire Taconic Community Foundation (2008-present). Previously, Ms. Small served as Chairperson (2002-2008) and a member of the Investment Committee and Chairperson (2008-2012) and a member of the Board of Trustees of Smith College. In addition, Ms. Small served as Chief Investment Officer, Director of Global Equity Investments, and a member of the Board of Directors of Scudder, Stevens & Clark and Scudder Kemper Investments.
Garnett A. Smith (1947)
Year of Election or Appointment: 2013
Trustee
Mr. Smith also serves as Trustee of other Fidelity® funds. Prior to Mr. Smith's retirement, he served as Chairman and Chief Executive Officer of Inbrand Corp. (manufacturer of personal absorbent products, 1990-1997). He also served as President (1986-1990) of Inbrand Corp. Prior to his employment with Inbrand Corp., he was employed by a retail fabric chain and North Carolina National Bank. In addition, Mr. Smith served as a Member of the Advisory Board of certain Fidelity® funds (2012-2013) and as a board member of the Jackson Hole Land Trust (2009-2012).
David M. Thomas (1949)
Year of Election or Appointment: 2018
Trustee
Mr. Thomas also serves as Trustee of other Fidelity® funds. Mr. Thomas serves as Non-Executive Chairman of the Board of Directors of Fortune Brands Home and Security (home and security products, 2011-present) and as a member of the Board of Directors (2004-present) and Presiding Director (2013-present) of Interpublic Group of Companies, Inc. (marketing communication). Previously, Mr. Thomas served as Executive Chairman (2005-2006) and Chairman and Chief Executive Officer (2000-2005) of IMS Health, Inc. (pharmaceutical and healthcare information solutions), a Director of Fortune Brands, Inc. (consumer products, 2000-2011), and a member of the Board of Trustees of the University of Florida (2013-2018).
Michael E. Wiley (1950)
Year of Election or Appointment: 2008
Trustee [Include if document contains trusts for which the individual serves as Trustee and trusts for which he/she does not serve as Trustee: of Name(s) of Trust(s)]
Mr. Wiley also serves as Trustee or Member of the Advisory Board of other Fidelity® funds. Mr. Wiley serves as a Director of High Point Resources (exploration and production, 2005-present). Previously, Mr. Wiley served as a Director of Andeavor Corporation (independent oil refiner and marketer, 2005-2018), a Director of Andeavor Logistics LP (natural resources logistics, 2015-2018), a Director of Post Oak Bank (privately-held bank, 2004-2018), a Director of Asia Pacific Exploration Consolidated (international oil and gas exploration and production, 2008-2013), a member of the Board of Trustees of the University of Tulsa (2000-2006; 2007-2010), a Senior Energy Advisor of Katzenbach Partners, LLC (consulting, 2006-2007), an Advisory Director of Riverstone Holdings (private investment), a Director of Spinnaker Exploration Company (exploration and production, 2001-2005) and Chairman, President, and CEO of Baker Hughes, Inc. (oilfield services, 2000-2004).
+ The information includes the Trustee's principal occupation during the last five years and other information relating to the experience, attributes, and skills relevant to the Trustee's qualifications to serve as a Trustee, which led to the conclusion that the Trustee should serve as a Trustee for the fund.
Advisory Board Members and Officers:
Correspondence intended for a Member of the Advisory Board (if any) may be sent to Fidelity Investments, P.O. Box 55235, Boston, Massachusetts 02205-5235. Correspondence intended for an officer or Peter S. Lynch may be sent to Fidelity Investments, 245 Summer Street, Boston, Massachusetts 02210. Officers appear below in alphabetical order.
Name, Year of Birth; Principal Occupation
Vicki L. Fuller (1957)
Year of Election or Appointment: 2018
Member of the Advisory Board
Ms. Fuller also serves as Member of the Advisory Board of other Fidelity® funds. Ms. Fuller serves as a member of the Board of Directors, Audit Committee, and Nominating and Governance Committee of The Williams Companies, Inc. (natural gas infrastructure, 2018-present). Previously, Ms. Fuller served as the Chief Investment Officer of the New York State Common Retirement Fund (2012-2018) and held a variety of positions at AllianceBernstein L.P. (global asset management, 1985-2012), including Managing Director (2006-2012) and Senior Vice President and Senior Portfolio Manager (2001-2006).
Patricia L. Kampling (1959)
Year of Election or Appointment: 2020
Member of the Advisory Board
Ms. Kampling also serves as Member of the Advisory Board of other Fidelity® funds. Prior to her retirement, Ms. Kampling served as Chairman of the Board and Chief Executive Officer (2012-2019), President and Chief Operating Officer (2011-2012) and Executive Vice President and Chief Financial Officer (2010-2011) of Alliant Energy Corporation. Ms. Kampling currently serves as a member of the Board, Compensation Committee and Executive Committee and as Chair of the Audit Committee of Briggs & Stratton Corporation (manufacturing, 2011-present) and as a member of the Board, Audit, Finance and Risk Committee and Safety, Environmental, Technology and Operations Committee of American Water Works Company, Inc. (utilities company, 2019-present). In addition, Ms. Kampling currently serves as a member of the Board of the Nature Conservancy, Wisconsin Chapter (2019-present). Previously, Ms. Kampling served as a member of the Board of Interstate Power and Light Company (2012-2019) and Wisconsin Power and Light Company (2012-2019) (each a subsidiary of Alliant Energy Corporation) and as a member of the Board and Workforce Development Committee of the Business Roundtable (2018-2019).
Peter S. Lynch (1944)
Year of Election or Appointment: 2018
Member of the Advisory Board
Mr. Lynch also serves as Member of the Advisory Board of other Fidelity® funds. Mr. Lynch is Vice Chairman and a Director of Fidelity Management & Research Company LLC (investment adviser firm). In addition, Mr. Lynch serves as a Trustee of Boston College and as the Chairman of the Inner-City Scholarship Fund. Previously, Mr. Lynch served as Vice Chairman and a Director of FMR Co., Inc. (investment adviser firm) and on the Special Olympics International Board of Directors (1997-2006).
Susan Tomasky (1953)
Year of Election or Appointment: 2020
Member of the Advisory Board
Ms. Tomasky also serves as Member of the Advisory Board of other Fidelity® funds. Prior to her retirement, Ms. Tomasky served in various executive officer positions at American Electric Power Company, Inc. (1998-2011), including most recently as President of AEP Transmission (2007-2011). Ms. Tomasky currently serves as a member of the Board and Sustainability Committee and as Chair of the Audit Committee of Marathon Petroleum Corporation (2018-present) and as a member of the Board, Corporate Governance Committee and Organization and Compensation Committee and as Chair of the Audit Committee of Public Service Enterprise Group, Inc. (utilities company, 2012-present). In addition, Ms. Tomasky currently serves as a member of the Board of the Columbus Regional Airport Authority (2007-present), as a member of the Board of the Royal Shakespeare Company – America (2009-present), as a member of the Board of the Columbus Association for the Performing Arts (2011-present) and as a member of the Board of Kenyon College (2016-present). Previously, Ms. Tomasky served as a member of the Board (2011-2019) and as Lead Independent Director (2015-2018) of Andeavor Corporation (previously Tesoro Corporation) (independent oil refiner and marketer) and as a member of the Board of Summit Midstream Partners LP (energy, 2012-2018).
Elizabeth Paige Baumann (1968)
Year of Election or Appointment: 2017
Anti-Money Laundering (AML) Officer
Ms. Baumann also serves as AML Officer of other funds. She is Chief AML Officer (2012-present) and Senior Vice President (2014-present) of FMR LLC (diversified financial services company) and is an employee of Fidelity Investments. Previously, Ms. Baumann served as AML Officer of the funds (2012-2016), and Vice President (2007-2014) and Deputy Anti-Money Laundering Officer (2007-2012) of FMR LLC.
Craig S. Brown (1977)
Year of Election or Appointment: 2019
Assistant Treasurer
Mr. Brown also serves as Assistant Treasurer of other funds. Mr. Brown is an employee of Fidelity Investments (2013-present).
John J. Burke III (1964)
Year of Election or Appointment: 2018
Chief Financial Officer
Mr. Burke also serves as Chief Financial Officer of other funds. Mr. Burke serves as Head of Investment Operations for Fidelity Fund and Investment Operations (2018-present) and is an employee of Fidelity Investments (1998-present). Previously Mr. Burke served as head of Asset Management Investment Operations (2012-2018).
William C. Coffey (1969)
Year of Election or Appointment: 2019
Assistant Secretary
Mr. Coffey also serves as Assistant Secretary of other funds. He is Senior Vice President and Deputy General Counsel of FMR LLC (diversified financial services company, 2010-present), and is an employee of Fidelity Investments. Previously, Mr. Coffey served as Secretary and CLO of certain funds (2018-2019); CLO, Secretary, and Senior Vice President of Fidelity Management & Research Company and FMR Co., Inc. (investment adviser firms, 2018-2019); Secretary of Fidelity SelectCo, LLC and Fidelity Investments Money Management, Inc. (investment adviser firms, 2018-2019); CLO of Fidelity Management & Research (Hong Kong) Limited, FMR Investment Management (UK) Limited, and Fidelity Management & Research (Japan) Limited (investment adviser firms, 2018-2019); and Assistant Secretary of certain funds (2009-2018).
Timothy M. Cohen (1969)
Year of Election or Appointment: 2018
Vice President
Mr. Cohen also serves as Vice President of other funds. Mr. Cohen serves as Co-Head of Equity (2018-present), a Director of Fidelity Management & Research (Japan) Limited (investment adviser firm, 2016-present), and is an employee of Fidelity Investments. Previously, Mr. Cohen served as Executive Vice President of Fidelity SelectCo, LLC (2019), Head of Global Equity Research (2016-2018), Chief Investment Officer - Equity and a Director of Fidelity Management & Research (U.K.) Inc. (investment adviser firm, 2013-2015) and as a Director of Fidelity Management & Research (Hong Kong) Limited (investment adviser firm, 2017).
Jonathan Davis (1968)
Year of Election or Appointment: 2010
Assistant Treasurer
Mr. Davis also serves as Assistant Treasurer of other funds. Mr. Davis serves as Assistant Treasurer of FMR Capital, Inc. (2017-present) and is an employee of Fidelity Investments. Previously, Mr. Davis served as Vice President and Associate General Counsel of FMR LLC (diversified financial services company, 2003-2010).
Laura M. Del Prato (1964)
Year of Election or Appointment: 2018
Assistant Treasurer
Ms. Del Prato also serves as an officer of other funds. Ms. Del Prato is an employee of Fidelity Investments (2017-present). Prior to joining Fidelity Investments, Ms. Del Prato served as a Managing Director and Treasurer of the JPMorgan Mutual Funds (2014-2017). Prior to JPMorgan, Ms. Del Prato served as a partner at Cohen Fund Audit Services (accounting firm, 2012-2013) and KPMG LLP (accounting firm, 2004-2012).
Colm A. Hogan (1973)
Year of Election or Appointment: 2020
Assistant Treasurer
Mr. Hogan also serves as an officer of other funds. Mr. Hogan serves as Assistant Treasurer of FMR Capital, Inc. (2017-present) and is an employee of Fidelity Investments (2005-present). Previously, Mr. Hogan served as Deputy Treasurer of certain Fidelity® funds (2016-2020) and Assistant Treasurer of certain Fidelity® funds (2016-2018).
Pamela R. Holding (1964)
Year of Election or Appointment: 2018
Vice President
Ms. Holding also serves as Vice President of other funds. Ms. Holding serves as Co-Head of Equity (2018-present) and is an employee of Fidelity Investments (2013-present). Previously, Ms. Holding served as Executive Vice President of Fidelity SelectCo, LLC (2019) and as Chief Investment Officer of Fidelity Institutional Asset Management (2013-2018).
Cynthia Lo Bessette (1969)
Year of Election or Appointment: 2019
Secretary and Chief Legal Officer (CLO)
Ms. Lo Bessette also serves as an officer of other funds. Ms. Lo Bessette serves as CLO, Secretary, and Senior Vice President of Fidelity Management & Research Company LLC (investment adviser firm, 2019-present); and CLO of Fidelity Management & Research (Hong Kong) Limited, FMR Investment Management (UK) Limited, and Fidelity Management & Research (Japan) Limited (investment adviser firms, 2019-present). She is a Senior Vice President and Deputy General Counsel of FMR LLC (diversified financial services company, 2019-present), and is an employee of Fidelity Investments. Previously, Ms. Lo Bessette served as CLO, Secretary, and Senior Vice President of FMR Co., Inc. (investment adviser firm, 2019); Secretary of Fidelity SelectCo, LLC and Fidelity Investments Money Management, Inc. (investment adviser firms, 2019). Prior to joining Fidelity Investments, Ms. Lo Bessette was Executive Vice President, General Counsel (2016-2019) and Senior Vice President, Deputy General Counsel (2015-2016) of OppenheimerFunds (investment management company) and Deputy Chief Legal Officer (2013-2015) of Jennison Associates LLC (investment adviser firm).
Chris Maher (1972)
Year of Election or Appointment: 2020
Deputy Treasurer
Mr. Maher also serves as an officer of other funds. Mr. Maher serves as Assistant Treasurer of FMR Capital, Inc. (2017-present), and is an employee of Fidelity Investments (2008-present). Previously, Mr. Maher served as Assistant Treasurer of certain funds (2013-2020); Vice President of Asset Management Compliance (2013), Vice President of the Program Management Group of FMR (investment adviser firm, 2010-2013), and Vice President of Valuation Oversight (2008-2010).
Kenneth B. Robins (1969)
Year of Election or Appointment: 2018
Chief Compliance Officer
Mr. Robins also serves as an officer of other funds. Mr. Robins serves as Compliance Officer of Fidelity Management & Research Company LLC (investment adviser firm, 2016-present) and is an employee of Fidelity Investments (2004-present). Previously, Mr. Robins served as Compliance Officer of FMR Co., Inc. (investment adviser firm, 2016-2019), as Executive Vice President of Fidelity Investments Money Management, Inc. (investment adviser firm, 2013-2016) and served in other fund officer roles.
Stacie M. Smith (1974)
Year of Election or Appointment: 2018
President and Treasurer
Ms. Smith also serves as an officer of other funds. Ms. Smith serves as Assistant Treasurer of FMR Capital, Inc. (2017-present), is an employee of Fidelity Investments (2009-present), and has served in other fund officer roles. Prior to joining Fidelity Investments, Ms. Smith served as Senior Audit Manager of Ernst & Young LLP (accounting firm, 1996-2009). Previously, Ms. Smith served as Assistant Treasurer (2013-2019) and Deputy Treasurer (2013-2016) of certain Fidelity® funds.
Marc L. Spector (1972)
Year of Election or Appointment: 2017
Assistant Treasurer
Mr. Spector also serves as an officer of other funds. Mr. Spector serves as Assistant Treasurer of FMR Capital, Inc. (2017-present) and is an employee of Fidelity Investments (2016-present). Prior to joining Fidelity Investments, Mr. Spector served as Director at the Siegfried Group (accounting firm, 2013-2016), and prior to Siegfried Group as audit senior manager at Deloitte & Touche (accounting firm, 2005-2013).
Jim Wegmann (1979)
Year of Election or Appointment: 2019
Assistant Treasurer
Mr. Wegmann also serves as Assistant Treasurer of other funds. Mr. Wegmann is an employee of Fidelity Investments (2011-present).
Shareholder Expense Example
As a shareholder of the Fund, you incur two types of costs: (1) transaction costs, and (2) ongoing costs, including management fees, distribution and/or service (12b-1) fees and other Fund expenses. This Example is intended to help you understand your ongoing costs (in dollars) of investing in the Fund and to compare these costs with the ongoing costs of investing in other mutual funds.
The Example is based on an investment of $1,000 invested at the beginning of the period and held for the entire period (July 1, 2019 to December 31, 2019).
Actual Expenses
The first line of the accompanying table for each class of the Fund provides information about actual account values and actual expenses. You may use the information in this line, together with the amount you invested, to estimate the expenses that you paid over the period. Simply divide your account value by $1,000.00 (for example, an $8,600 account value divided by $1,000.00 = 8.6), then multiply the result by the number in the first line for a class of the Fund under the heading entitled "Expenses Paid During Period" to estimate the expenses you paid on your account during this period. The estimate of expenses does not include any fees or other expenses of any variable annuity or variable life insurance product. If they were, the estimate of expenses you paid during the period would be higher, and your ending account value would be lower. In addition, the Fund, as a shareholder in the underlying Fidelity Central Funds, will indirectly bear its pro-rata share of the fees and expenses incurred by the underlying Fidelity Central Funds. These fees and expenses are not included in the Fund's annualized expense ratio used to calculate the expense estimate in the table below.
Hypothetical Example for Comparison Purposes
The second line of the accompanying table for each class of the Fund provides information about hypothetical account values and hypothetical expenses based on a Class' actual expense ratio and an assumed rate of return of 5% per year before expenses, which is not the Class' actual return. The hypothetical account values and expenses may not be used to estimate the actual ending account balance or expenses you paid for the period. You may use this information to compare the ongoing costs of investing in the Fund and other funds. To do so, compare this 5% hypothetical example with the 5% hypothetical examples that appear in the shareholder reports of the other funds. The estimate of expenses does not include any fees or other expenses of any variable annuity or variable life insurance product. If they were, the estimate of expenses you paid during the period would be higher, and your ending account value would be lower. In addition, the Fund, as a shareholder in the underlying Fidelity Central Funds, will indirectly bear its pro-rata share of the fees and expenses incurred by the underlying Fidelity Central Funds. These fees and expenses are not included in the Fund's annualized expense ratio used to calculate the expense estimate in the table below.
Please note that the expenses shown in the table are meant to highlight your ongoing costs only and do not reflect any transaction costs. Therefore, the second line of the table is useful in comparing ongoing costs only, and will not help you determine the relative total costs of owning different funds.
| | Annualized Expense Ratio-A | Beginning
Account Value
July 1, 2019 | Ending
Account Value
December 31, 2019 | Expenses Paid
During Period-B
July 1, 2019
to December 31, 2019 |
| Initial Class | .65% | | | |
| Actual | | $1,000.00 | $1,049.60 | $3.36 |
| Hypothetical-C | | $1,000.00 | $1,021.93 | $3.31 |
| Service Class | .75% | | | |
| Actual | | $1,000.00 | $1,049.10 | $3.87 |
| Hypothetical-C | | $1,000.00 | $1,021.42 | $3.82 |
| Service Class 2 | .90% | | | |
| Actual | | $1,000.00 | $1,048.40 | $4.65 |
| Hypothetical-C | | $1,000.00 | $1,020.67 | $4.58 |
| Investor Class | .73% | | | |
| Actual | | $1,000.00 | $1,049.30 | $3.77 |
| Hypothetical-C | | $1,000.00 | $1,021.53 | $3.72 |
A Annualized expense ratio reflects expenses net of applicable fee waivers.
B Expenses are equal to each Class' annualized expense ratio, multiplied by the average account value over the period, multiplied by 184/365 (to reflect the one-half year period).
C 5% return per year before expenses
Distributions (Unaudited)
The Board of Trustees of VIP Real Estate Portfolio voted to pay to shareholders of record at the opening of business on record date, the following distributions per share derived from capital gains realized from sales of portfolio securities, and dividends derived from net investment income:
| | Pay Date | Record Date | Dividends | Capital Gains |
| VIP Real Estate Portfolio | | | | |
| Initial Class | 02/07/20 | 02/07/20 | $0.074 | $0.760 |
| Service Class | 02/07/20 | 02/07/20 | $0.072 | $0.760 |
| Service Class 2 | 02/07/20 | 02/07/20 | $0.067 | $0.760 |
| Investor Class | 02/07/20 | 02/07/20 | $0.072 | $0.760 |
|
The fund hereby designates as a capital gain dividend with respect to the taxable year ended December 31, 2019, $15,924,140, or, if subsequently determined to be different, the net capital gain of such year.
Initial Class, Service Class, Service Class 2, and Investor Class designate 1% of the dividends distributed in December, 2019, as qualifying for the dividends–received deduction for corporate shareholders.
Board Approval of Investment Advisory Contracts
VIP Real Estate Portfolio
At its November 2019 meeting, the Board of Trustees, including the Independent Trustees (together, the Board), voted to approve an amended and restated management contract and amended and restated sub-advisory agreements (together, the Amended and Restated Contracts) for the fund, effective January 1, 2020, for a one month period through January 31, 2020, in connection with an upcoming consolidation of certain of Fidelity's advisory businesses.
The Board considered that, on or about January 1, 2020, each of FMR Co., Inc. (FMRC), Fidelity Investments Money Management, Inc. (FIMM), and SelectCo, LLC (SelectCo) will merge with and into Fidelity Management & Research Company (FMR) and that, after the merger, FMR will redomicile as a Delaware limited liability company. The Board also approved the termination of the sub-advisory agreement with FMRC upon the completion of the merger. The Board noted that the Amended and Restated Contracts would be updated to reflect the renamed adviser, Fidelity Management & Research Company LLC and its new form of organization and domicile. The Board also noted that the Amended and Restated Contracts will not change the investment processes, the level or nature of services provided, the resources and personnel allocated, trading and compliance operations, or any fees or expenses paid by the fund.
The Board concluded that the fund's Amended and Restated Contracts are fair and reasonable, and that the fund's Advisory Contracts should be approved through January 31, 2020.
In connection with its consideration of future renewals of the fund's Amended and Restated Contracts, the Board will consider: (i) the nature, extent and quality of services provided to the fund, including shareholder and administrative services and investment performance; (ii) the competitiveness of the management fee and total expenses for the fund; (iii) the costs of the services and profitability, including the revenues earned and the expenses incurred in conducting the business of developing, marketing, distributing, managing, administering, and servicing the fund and its shareholders, to the extent applicable; and (iv) whether there have been economies of scale in respect of the Fidelity funds, whether the Fidelity funds (including the fund) have appropriately benefited from any such economies of scale, and whether there is the potential for realization of any further economies.
Based on its evaluation of all of the conclusions noted above, and after considering all factors it believed relevant, the Board ultimately concluded that the fund's management fee structure is fair and reasonable, and that the continuation of the fund's Amended and Restated Contracts should be approved.
VIPRE-ANN-0220
1.781992.117
Fidelity® Variable Insurance Products:
Materials Portfolio
Annual Report
December 31, 2019
See the inside front cover for important information about access to your fund’s shareholder reports.
Beginning on January 1, 2021, as permitted by regulations adopted by the Securities and Exchange Commission, and if your insurance carrier elects to participate, you may not be receiving paper copies of the Fund’s shareholder reports from the insurance company that offers your variable insurance product unless you specifically request paper copies from your financial professional or the administrator of your variable insurance product. Instead, the reports will be made available on a website, and you will be notified by mail each time a report is posted and provided with a website link to access the report.
If you already elected to receive shareholder reports electronically, you will not be affected by this change and you need not take any action. You may elect to receive shareholder reports and other communications from the Fund electronically, by contacting your financial professional or the administrator of your variable insurance product. If you own a Fidelity-administered variable insurance product, please visit fidelity.com/mailpreferences to make your election or call 1-800-343-3548.
You may elect to receive all future reports in paper free of charge. If you wish to continue receiving paper copies of your shareholder reports, you may contact your financial professional or the administrator of your variable insurance product. If you own a Fidelity-administered variable insurance product, please visit fidelity.com/mailpreferences to make your election or call 1-800-343-3548. Your election to receive reports in paper will apply to all funds available under your variable insurance product.
Contents
To view a fund's proxy voting guidelines and proxy voting record for the 12-month period ended June 30, visit http://www.fidelity.com/proxyvotingresults or visit the Securities and Exchange Commission's (SEC) web site at http://www.sec.gov.
You may also call 1-877-208-0098 to request a free copy of the proxy voting guidelines.
Fidelity® Variable Insurance Products are separate account options which are purchased through a variable insurance contract.
Standard & Poor's, S&P and S&P 500 are registered service marks of The McGraw-Hill Companies, Inc. and have been licensed for use by Fidelity Distributors Corporation.
Other third-party marks appearing herein are the property of their respective owners.
All other marks appearing herein are registered or unregistered trademarks or service marks of FMR LLC or an affiliated company. © 2020 FMR LLC. All rights reserved.
This report and the financial statements contained herein are submitted for the general information of the shareholders of the Fund. This report is not authorized for distribution to prospective investors in the Fund unless preceded or accompanied by an effective prospectus.
A fund files its complete schedule of portfolio holdings with the SEC for the first and third quarters of each fiscal year on Form N-PORT. Forms N-PORT are available on the SEC’s web site at http://www.sec.gov. A fund's Forms N-PORT may be reviewed and copied at the SEC’s Public Reference Room in Washington, DC. Information regarding the operation of the SEC's Public Reference Room may be obtained by calling 1-800-SEC-0330.
For a complete list of a fund's portfolio holdings, view the most recent holdings listing, semiannual report, or annual report on Fidelity's web site at http://www.fidelity.com, http://www.institutional.fidelity.com, or http://www.401k.com, as applicable.
NOT FDIC INSURED •MAY LOSE VALUE •NO BANK GUARANTEE
Neither the Fund nor Fidelity Distributors Corporation is a bank.
Note to shareholders:
As part of a regular review of its organizational structure, Fidelity has decided to merge certain entities to streamline operations, increase efficiency, simplify reporting, and reduce legal, compliance, and accounting complexity and costs. In separate events, Fidelity has merged four of its investment advisers and two of its broker-dealers.
Effective on or about January 1, 2020, following any required regulatory notices and approvals:
Investment advisers Fidelity Investments Money Management, Inc., FMR Co., Inc., and Fidelity SelectCo, LLC, merged with and into Fidelity Management & Research Company. In connection with the merger transactions, the resulting, merged investment adviser was then redomiciled from Massachusetts to Delaware, changed its corporate structure from a corporation to a limited liability company, and changed its name to “Fidelity Management & Research Company LLC”.
Broker-dealer Fidelity Distributors Corporation merged with and into Fidelity Investments Institutional Services Company, Inc. (“FIISC”). FIISC was then redomiciled from Massachusetts to Delaware, changed its corporate structure from a corporation to a limited liability company, and changed its name to “Fidelity Distributors Company LLC”.
These mergers are not expected to affect fund shareholders or Fidelity clients, nor are they expected to result in any changes to the day-to-day management of Fidelity’s brokerage services, the Fidelity funds, their investment policies and practices, their portfolio management teams, or the funds’ expenses.
Performance: The Bottom Line
Average annual total return reflects the change in the value of an investment, assuming reinvestment of distributions from dividend income and capital gains (the profits earned upon the sale of securities that have grown in value, if any) and assuming a constant rate of performance each year. During periods of reimbursement by Fidelity, a fund’s total return will be greater than it would be had the reimbursement not occurred. Performance numbers are net of all underlying fund operating expenses, but do not include any insurance charges imposed by your insurance company’s separate account. If performance information included the effect of these additional charges, the total returns would have been lower. How a fund did yesterday is no guarantee of how it will do tomorrow.
Average Annual Total Returns
| For the periods ended December 31, 2019 | Past 1 year | Past 5 years | Past 10 years |
| Initial Class | 13.40% | 2.20% | 6.84% |
| Investor Class | 13.20% | 2.10% | 6.75% |
$10,000 Over 10 Years
Let's say hypothetically that $10,000 was invested in VIP Materials Portfolio - Initial Class on December 31, 2009.
The chart shows how the value of your investment would have changed, and also shows how the S&P 500® Index performed over the same period.
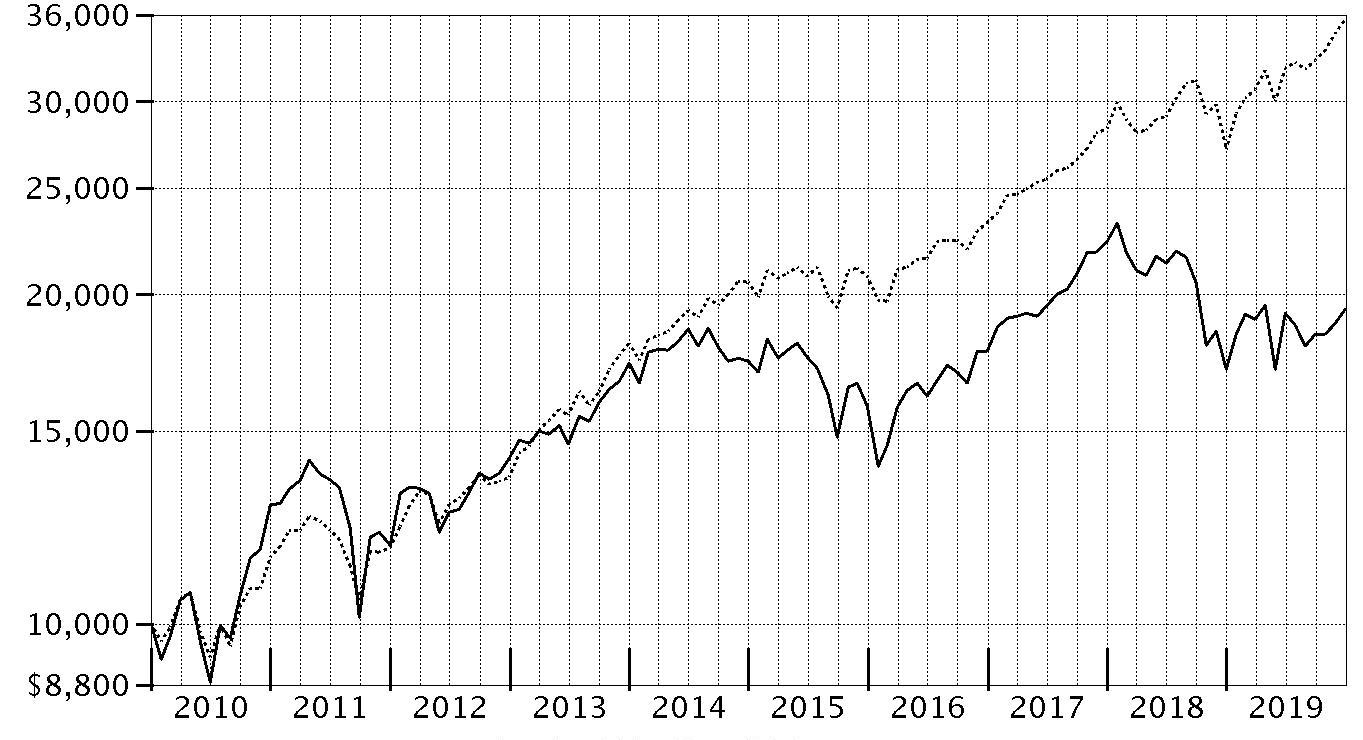
| Period Ending Values |
| $19,383 | VIP Materials Portfolio - Initial Class |
| $35,666 | S&P 500® Index |
Management's Discussion of Fund Performance
Market Recap: U.S. stocks continued to roll in 2019, with the S&P 500
® index soaring 31.49% and marking history as the longest and strongest bull market ever, despite persistent, nagging concerns about global economic growth and trade. After a rough end to 2018, equities sharply reversed course to begin the new year amid upbeat company earnings and signs the Federal Reserve may pause on rates. The uptrend continued until May, when the index sunk as trade negotiations between the U.S. and China broke down. The bull market roared back to record a series of highs in July, when the Fed cut interest rates for the first time since 2008. Volatility intensified in August, as the Treasury yield curve inverted, which some investors viewed as a sign the U.S. economy could be heading for recession. But the market proved resilient, hitting a new high on October 30, when the Fed lowered rates for the third time in 2019, and moving even higher through year-end. Gains were robust and broad-based, with information technology (+50%) leading the way with its best calendar-year result in a decade, amid strong growth trends. Communication services (+33%) and financials (+32%) also stood out. In contrast, energy (+12%) was by far the weakest group – struggling amid sluggish oil prices – while several strong gainers nonetheless fell short of the broader market: industrials and real estate (+29% each), consumer discretionary and consumer staples (+28% each), utilities (+26%), materials (+25%), and health care (+21%).
Comments from Co-Portfolio Managers Richard Malnight and Jody Simes: For the year, the fund’s share classes gained about 13%, well behind the 23.80% advance of the MSCI U.S. IMI Materials 25/50 Index, and also trailing the broad-market S&P 500
®. Versus the MSCI index, stock picking in specialty chemicals detracted most in 2019. Positioning in diversified chemicals and commodity chemicals also hurt – partly because of stock choices, but also because we overweighted these lagging groups. The fund’s largest individual relative detractor, by far, was Chemours (-33%). The company continued to struggle with implementation of the price-stabilization strategy for its TiO2 pigment. Overweighting specialty chemicals stock Dupont (-18%) also hampered performance versus the MSCI index. We eliminated our positions in Chemours and Dupont before the end of the year. Conversely, positioning in the copper, metal & glass containers, and construction materials groups added value. Among individual holdings, the fund benefited from a sizable overweighting in Tronox, another TiO2 producer. In March 2019, Tronox changed its domicile from Australia to the U.K. While it was listed in Australia, our position gained about 62%, but after the change our stake returned roughly -9%, yielding a net positive result from the combination of the two positions. Overweights in Vulcan Materials (+47%) and Martin Marietta Materials (+64%), two suppliers of aggregates and other construction materials, also proved timely. We sold off Vulcan entirely during the period.
The views expressed above reflect those of the portfolio manager(s) only through the end of the period as stated on the cover of this report and do not necessarily represent the views of Fidelity or any other person in the Fidelity organization. Any such views are subject to change at any time based upon market or other conditions and Fidelity disclaims any responsibility to update such views. These views may not be relied on as investment advice and, because investment decisions for a Fidelity fund are based on numerous factors, may not be relied on as an indication of trading intent on behalf of any Fidelity fund.
Note to shareholders: On November 8, 2019, Jody Simes assumed co-management responsibilities for the fund, joining Richard Malnight, who plans to retire from Fidelity on June 30, 2020.
Investment Summary (Unaudited)
Top Ten Stocks as of December 31, 2019
| | % of fund's net assets |
| Linde PLC | 9.5 |
| Air Products & Chemicals, Inc. | 9.1 |
| Crown Holdings, Inc. | 8.4 |
| Newmont Goldcorp Corp. | 7.8 |
| Freeport-McMoRan, Inc. | 5.2 |
| Ecolab, Inc. | 4.7 |
| Martin Marietta Materials, Inc. | 4.7 |
| FMC Corp. | 4.7 |
| CF Industries Holdings, Inc. | 4.6 |
| Reliance Steel & Aluminum Co. | 4.6 |
| | 63.3 |
Top Industries (% of fund's net assets)
| As of December 31, 2019 |
| | Chemicals | 46.6% |
| | Metals & Mining | 27.7% |
| | Containers & Packaging | 12.8% |
| | Construction Materials | 9.2% |
| | All Others* | 3.7% |

* Includes short-term investments and net other assets (liabilities).
Schedule of Investments December 31, 2019
Showing Percentage of Net Assets
| Common Stocks - 96.3% | | | |
| | | Shares | Value |
| Chemicals - 46.6% | | | |
| Commodity Chemicals - 6.9% | | | |
| LyondellBasell Industries NV Class A | | 18,243 | $1,723,599 |
| Tronox Holdings PLC | | 116,652 | 1,332,166 |
| | | | 3,055,765 |
| Fertilizers & Agricultural Chemicals - 9.3% | | | |
| CF Industries Holdings, Inc. | | 43,004 | 2,053,011 |
| FMC Corp. | | 20,709 | 2,067,172 |
| | | | 4,120,183 |
| Industrial Gases - 18.6% | | | |
| Air Products & Chemicals, Inc. | | 17,118 | 4,022,559 |
| Linde PLC | | 19,688 | 4,191,574 |
| | | | 8,214,133 |
| Specialty Chemicals - 11.8% | | | |
| Ecolab, Inc. | | 10,827 | 2,089,503 |
| Innospec, Inc. | | 11,327 | 1,171,665 |
| Sherwin-Williams Co. | | 3,328 | 1,942,021 |
| | | | 5,203,189 |
|
| TOTAL CHEMICALS | | | 20,593,270 |
|
| Construction Materials - 9.2% | | | |
| Construction Materials - 9.2% | | | |
| Martin Marietta Materials, Inc. | | 7,456 | 2,084,996 |
| Summit Materials, Inc. (a) | | 82,689 | 1,976,267 |
| | | | 4,061,263 |
| Containers & Packaging - 12.8% | | | |
| Metal & Glass Containers - 8.4% | | | |
| Crown Holdings, Inc. (a) | | 51,039 | 3,702,369 |
| Paper Packaging - 4.4% | | | |
| Avery Dennison Corp. | | 14,838 | 1,941,107 |
|
| TOTAL CONTAINERS & PACKAGING | | | 5,643,476 |
|
| Metals & Mining - 27.7% | | | |
| Aluminum - 3.6% | | | |
| Kaiser Aluminum Corp. | | 14,245 | 1,579,628 |
| Copper - 8.2% | | | |
| First Quantum Minerals Ltd. | | 129,500 | 1,313,400 |
| Freeport-McMoRan, Inc. | | 177,345 | 2,326,766 |
| | | | 3,640,166 |
| Gold - 7.8% | | | |
| Newmont Goldcorp Corp. | | 78,900 | 3,428,205 |
| Steel - 8.1% | | | |
| Commercial Metals Co. | | 70,351 | 1,566,717 |
| Reliance Steel & Aluminum Co. | | 16,888 | 2,022,507 |
| | | | 3,589,224 |
|
| TOTAL METALS & MINING | | | 12,237,223 |
|
| TOTAL COMMON STOCKS | | | |
| (Cost $36,972,710) | | | 42,535,232 |
|
| Money Market Funds - 4.2% | | | |
| Fidelity Cash Central Fund 1.58% (b) | | | |
| (Cost $1,848,097) | | 1,847,727 | 1,848,097 |
| TOTAL INVESTMENT IN SECURITIES - 100.5% | | | |
| (Cost $38,820,807) | | | 44,383,329 |
| NET OTHER ASSETS (LIABILITIES) - (0.5)% | | | (224,437) |
| NET ASSETS - 100% | | | $44,158,892 |
Legend
(a) Non-income producing
(b) Affiliated fund that is generally available only to investment companies and other accounts managed by Fidelity Investments. The rate quoted is the annualized seven-day yield of the fund at period end. A complete unaudited listing of the fund's holdings as of its most recent quarter end is available upon request. In addition, each Fidelity Central Fund's financial statements, which are not covered by the Fund's Report of Independent Registered Public Accounting Firm, are available on the SEC's website or upon request.
Affiliated Central Funds
Information regarding fiscal year to date income earned by the Fund from investments in Fidelity Central Funds is as follows:
| Fund | Income earned |
| Fidelity Cash Central Fund | $5,910 |
| Fidelity Securities Lending Cash Central Fund | 2,710 |
| Total | $8,620 |
Amounts in the income column in the above table include any capital gain distributions from underlying funds, which are presented in the corresponding line-item in the Statement of Operations, if applicable. Amount for Fidelity Securities Lending Cash Central Fund represents the income earned on investing cash collateral, less rebates paid to borrowers and any lending agent fees associated with the loan, plus any premium payments received for lending certain types of securities.
Investment Valuation
All investments are categorized as Level 1 under the Fair Value Hierarchy. The inputs or methodology used for valuing securities may not be an indication of the risk associated with investing in those securities. For more information on valuation inputs please refer to the Investment Valuation section in the accompanying Notes to Financial Statements.
Other Information
Distribution of investments by country or territory of incorporation, as a percentage of Total Net Assets, is as follows (Unaudited):
| United States of America | 80.6% |
| Ireland | 9.5% |
| Netherlands | 3.9% |
| United Kingdom | 3.0% |
| Canada | 3.0% |
| | 100.0% |
See accompanying notes which are an integral part of the financial statements.
Financial Statements
Statement of Assets and Liabilities
| | | December 31, 2019 |
| Assets | | |
Investment in securities, at value — See accompanying schedule:
Unaffiliated issuers (cost $36,972,710) | $42,535,232 | |
| Fidelity Central Funds (cost $1,848,097) | 1,848,097 | |
| Total Investment in Securities (cost $38,820,807) | | $44,383,329 |
| Dividends receivable | | 48,706 |
| Distributions receivable from Fidelity Central Funds | | 2,065 |
| Prepaid expenses | | 683 |
| Other receivables | | 416 |
| Total assets | | 44,435,199 |
| Liabilities | | |
| Payable for investments purchased | $96,456 | |
| Payable for fund shares redeemed | 116,087 | |
| Accrued management fee | 19,465 | |
| Audit fee payable | 36,062 | |
| Other affiliated payables | 6,122 | |
| Other payables and accrued expenses | 2,115 | |
| Total liabilities | | 276,307 |
| Net Assets | | $44,158,892 |
| Net Assets consist of: | | |
| Paid in capital | | $40,229,845 |
| Total accumulated earnings (loss) | | 3,929,047 |
| Net Assets | | $44,158,892 |
| Net Asset Value and Maximum Offering Price | | |
| Initial Class: | | |
| Net Asset Value, offering price and redemption price per share ($8,905,300 ÷ 758,725 shares) | | $11.74 |
| Investor Class: | | |
| Net Asset Value, offering price and redemption price per share ($35,253,592 ÷ 3,004,328 shares) | | $11.73 |
See accompanying notes which are an integral part of the financial statements.
Statement of Operations
| | | Year ended December 31, 2019 |
| Investment Income | | |
| Dividends | | $1,037,905 |
| Income from Fidelity Central Funds (including $2,710 from security lending) | | 8,620 |
| Total income | | 1,046,525 |
| Expenses | | |
| Management fee | $266,347 | |
| Transfer agent fees | 64,025 | |
| Accounting and security lending fees | 19,338 | |
| Custodian fees and expenses | 7,593 | |
| Independent trustees' fees and expenses | 279 | |
| Audit | 44,059 | |
| Legal | 121 | |
| Miscellaneous | 490 | |
| Total expenses before reductions | 402,252 | |
| Expense reductions | (4,453) | |
| Total expenses after reductions | | 397,799 |
| Net investment income (loss) | | 648,726 |
| Realized and Unrealized Gain (Loss) | | |
| Net realized gain (loss) on: | | |
| Investment securities: | | |
| Unaffiliated issuers | (1,503,026) | |
| Fidelity Central Funds | (32) | |
| Foreign currency transactions | 2,831 | |
| Total net realized gain (loss) | | (1,500,227) |
| Change in net unrealized appreciation (depreciation) on: | | |
| Investment securities: | | |
| Unaffiliated issuers | 7,139,368 | |
| Assets and liabilities in foreign currencies | (314) | |
| Total change in net unrealized appreciation (depreciation) | | 7,139,054 |
| Net gain (loss) | | 5,638,827 |
| Net increase (decrease) in net assets resulting from operations | | $6,287,553 |
See accompanying notes which are an integral part of the financial statements.
Statement of Changes in Net Assets
| | Year ended December 31, 2019 | Year ended December 31, 2018 |
| Increase (Decrease) in Net Assets | | |
| Operations | | |
| Net investment income (loss) | $648,726 | $960,216 |
| Net realized gain (loss) | (1,500,227) | 4,273,157 |
| Change in net unrealized appreciation (depreciation) | 7,139,054 | (23,387,385) |
| Net increase (decrease) in net assets resulting from operations | 6,287,553 | (18,154,012) |
| Distributions to shareholders | (5,148,992) | (6,273,404) |
| Share transactions - net increase (decrease) | (9,154,806) | (20,735,414) |
| Total increase (decrease) in net assets | (8,016,245) | (45,162,830) |
| Net Assets | | |
| Beginning of period | 52,175,137 | 97,337,967 |
| End of period | $44,158,892 | $52,175,137 |
See accompanying notes which are an integral part of the financial statements.
Financial Highlights
VIP Materials Portfolio Initial Class
| Years ended December 31, | 2019 | 2018 | 2017 | 2016 | 2015 |
| Selected Per–Share Data | | | | | |
| Net asset value, beginning of period | $11.46 | $16.18 | $13.16 | $12.18 | $14.84 |
| Income from Investment Operations | | | | | |
| Net investment income (loss)A | .16 | .18 | .15 | .17 | .17 |
| Net realized and unrealized gain (loss) | 1.31 | (3.83) | 3.25 | 1.23 | (1.33) |
| Total from investment operations | 1.47 | (3.65) | 3.40 | 1.40 | (1.16) |
| Distributions from net investment income | (.19) | (.21) | (.13) | (.11) | (.19) |
| Distributions from net realized gain | (1.00) | (.86) | (.25) | (.31) | (1.32) |
| Total distributions | (1.19) | (1.07) | (.38) | (.42) | (1.50)B |
| Redemption fees added to paid in capitalA | – | – | –C | –C | –C |
| Net asset value, end of period | $11.74 | $11.46 | $16.18 | $13.16 | $12.18 |
| Total ReturnD,E | 13.40% | (23.60)% | 26.08% | 12.20% | (9.01)% |
| Ratios to Average Net AssetsF,G | | | | | |
| Expenses before reductions | .75% | .72% | .73% | .77% | .75% |
| Expenses net of fee waivers, if any | .75% | .72% | .73% | .77% | .75% |
| Expenses net of all reductions | .74% | .71% | .72% | .76% | .75% |
| Net investment income (loss) | 1.37% | 1.26% | 1.05% | 1.37% | 1.23% |
| Supplemental Data | | | | | |
| Net assets, end of period (000 omitted) | $8,905 | $9,728 | $19,126 | $12,726 | $11,432 |
| Portfolio turnover rateH | 104% | 87% | 64% | 56% | 68% |
A Calculated based on average shares outstanding during the period.
B Total distributions of $1.50 per share is comprised of distributions from net investment income of $.185 and distributions from net realized gain of $1.319 per share.
C Amount represents less than $.005 per share.
D Total returns do not reflect charges attributable to your insurance company's separate account. Inclusion of these charges would reduce the total returns shown.
E Total returns would have been lower if certain expenses had not been reduced during the applicable periods shown.
F Fees and expenses of any underlying Fidelity Central Funds are not included in the Fund's expense ratio. The Fund indirectly bears its proportionate share of the expenses of any underlying Fidelity Central Funds.
G Expense ratios reflect operating expenses of the class. Expenses before reductions do not reflect amounts reimbursed by the investment adviser or reductions from brokerage service arrangements or reductions from other expense offset arrangements and do not represent the amount paid by the class during periods when reimbursements or reductions occur. Expenses net of fee waivers reflect expenses after reimbursement by the investment adviser but prior to reductions from brokerage service arrangements or other expense offset arrangements. Expenses net of all reductions represent the net expenses paid by the class.
H Amount does not include the portfolio activity of any underlying Fidelity Central Funds.
See accompanying notes which are an integral part of the financial statements.
VIP Materials Portfolio Investor Class
| Years ended December 31, | 2019 | 2018 | 2017 | 2016 | 2015 |
| Selected Per–Share Data | | | | | |
| Net asset value, beginning of period | $11.46 | $16.17 | $13.15 | $12.18 | $14.84 |
| Income from Investment Operations | | | | | |
| Net investment income (loss)A | .15 | .17 | .14 | .16 | .16 |
| Net realized and unrealized gain (loss) | 1.30 | (3.82) | 3.25 | 1.23 | (1.33) |
| Total from investment operations | 1.45 | (3.65) | 3.39 | 1.39 | (1.17) |
| Distributions from net investment income | (.18) | (.20) | (.12) | (.11) | (.17) |
| Distributions from net realized gain | (1.00) | (.86) | (.25) | (.31) | (1.32) |
| Total distributions | (1.18) | (1.06) | (.37) | (.42) | (1.49) |
| Redemption fees added to paid in capitalA | – | – | –B | –B | –B |
| Net asset value, end of period | $11.73 | $11.46 | $16.17 | $13.15 | $12.18 |
| Total ReturnC,D | 13.20% | (23.65)% | 26.02% | 12.06% | (9.09)% |
| Ratios to Average Net AssetsE,F | | | | | |
| Expenses before reductions | .83% | .80% | .81% | .85% | .83% |
| Expenses net of fee waivers, if any | .83% | .80% | .81% | .85% | .83% |
| Expenses net of all reductions | .82% | .79% | .80% | .85% | .82% |
| Net investment income (loss) | 1.29% | 1.18% | .97% | 1.29% | 1.16% |
| Supplemental Data | | | | | |
| Net assets, end of period (000 omitted) | $35,254 | $42,448 | $78,212 | $52,786 | $39,807 |
| Portfolio turnover rateG | 104% | 87% | 64% | 56% | 68% |
A Calculated based on average shares outstanding during the period.
B Amount represents less than $.005 per share.
C Total returns do not reflect charges attributable to your insurance company's separate account. Inclusion of these charges would reduce the total returns shown.
D Total returns would have been lower if certain expenses had not been reduced during the applicable periods shown.
E Fees and expenses of any underlying Fidelity Central Funds are not included in the Fund's expense ratio. The Fund indirectly bears its proportionate share of the expenses of any underlying Fidelity Central Funds.
F Expense ratios reflect operating expenses of the class. Expenses before reductions do not reflect amounts reimbursed by the investment adviser or reductions from brokerage service arrangements or reductions from other expense offset arrangements and do not represent the amount paid by the class during periods when reimbursements or reductions occur. Expenses net of fee waivers reflect expenses after reimbursement by the investment adviser but prior to reductions from brokerage service arrangements or other expense offset arrangements. Expenses net of all reductions represent the net expenses paid by the class.
G Amount does not include the portfolio activity of any underlying Fidelity Central Funds.
See accompanying notes which are an integral part of the financial statements.
Notes to Financial Statements
For the period ended December 31, 2019
1. Organization.
VIP Materials Portfolio (the Fund) is a non-diversified fund of Variable Insurance Products Fund IV (the Trust) and is authorized to issue an unlimited number of shares. The Trust is registered under the Investment Company Act of 1940, as amended (the 1940 Act), as an open-end management investment company organized as a Massachusetts business trust. Shares of the Fund may only be purchased by insurance companies for the purpose of funding variable annuity or variable life insurance contracts. The Fund offers the following classes of shares: Initial Class shares and Investor Class shares. All classes have equal rights and voting privileges, except for matters affecting a single class.
2. Investments in Fidelity Central Funds.
The Fund invests in Fidelity Central Funds, which are open-end investment companies generally available only to other investment companies and accounts managed by the investment adviser and its affiliates. The Fund's Schedule of Investments lists each of the Fidelity Central Funds held as of period end, if any, as an investment of the Fund, but does not include the underlying holdings of each Fidelity Central Fund. As an Investing Fund, the Fund indirectly bears its proportionate share of the expenses of the underlying Fidelity Central Funds.
The Money Market Central Funds seek preservation of capital and current income and are managed by Fidelity Investments Money Management, Inc. (FIMM), an affiliate of the investment adviser. Annualized expenses of the Money Market Central Funds as of their most recent shareholder report date ranged from less than .005% to .01%.
A complete unaudited list of holdings for each Fidelity Central Fund is available upon request or at the Securities and Exchange Commission (the SEC) website at www.sec.gov. In addition, the financial statements of the Fidelity Central Funds, which are not covered by the Fund's Report of Independent Registered Public Accounting Firm, are available on the SEC website or upon request.
3. Significant Accounting Policies.
The Fund is an investment company and applies the accounting and reporting guidance of the Financial Accounting Standards Board (FASB) Accounting Standards Codification Topic 946 Financial Services – Investments Companies. The financial statements have been prepared in conformity with accounting principles generally accepted in the United States of America (GAAP), which require management to make certain estimates and assumptions at the date of the financial statements. Actual results could differ from those estimates. Subsequent events, if any, through the date that the financial statements were issued have been evaluated in the preparation of the financial statements. The following summarizes the significant accounting policies of the Fund:
Investment Valuation. Investments are valued as of 4:00 p.m. Eastern time on the last calendar day of the period. The Board of Trustees (the Board) has delegated the day to day responsibility for the valuation of the Fund's investments to the Fair Value Committee (the Committee) established by the Fund's investment adviser. In accordance with valuation policies and procedures approved by the Board, the Fund attempts to obtain prices from one or more third party pricing vendors or brokers to value its investments. When current market prices, quotations or currency exchange rates are not readily available or reliable, investments will be fair valued in good faith by the Committee, in accordance with procedures adopted by the Board. Factors used in determining fair value vary by investment type and may include market or investment specific events. The frequency with which these procedures are used cannot be predicted and they may be utilized to a significant extent. The Committee oversees the Fund's valuation policies and procedures and reports to the Board on the Committee's activities and fair value determinations. The Board monitors the appropriateness of the procedures used in valuing the Fund's investments and ratifies the fair value determinations of the Committee.
The Fund categorizes the inputs to valuation techniques used to value its investments into a disclosure hierarchy consisting of three levels as shown below:
- Level 1 – quoted prices in active markets for identical investments
- Level 2 – other significant observable inputs (including quoted prices for similar investments, interest rates, prepayment speeds, etc.)
- Level 3 – unobservable inputs (including the Fund's own assumptions based on the best information available)
Valuation techniques used to value the Fund's investments by major category are as follows:
Equity securities, including restricted securities, for which market quotations are readily available, are valued at the last reported sale price or official closing price as reported by a third party pricing vendor on the primary market or exchange on which they are traded and are categorized as Level 1 in the hierarchy. In the event there were no sales during the day or closing prices are not available, securities are valued at the last quoted bid price or may be valued using the last available price and are generally categorized as Level 2 in the hierarchy. For foreign equity securities, when market or security specific events arise, comparisons to the valuation of American Depositary Receipts (ADRs), futures contracts, Exchange-Traded Funds (ETFs) and certain indexes as well as quoted prices for similar securities may be used and would be categorized as Level 2 in the hierarchy. For equity securities, including restricted securities, where observable inputs are limited, assumptions about market activity and risk are used and these securities may be categorized as Level 3 in the hierarchy.
Investments in open-end mutual funds, including the Fidelity Central Funds, are valued at their closing net asset value (NAV) each business day and are categorized as Level 1 in the hierarchy.
Changes in valuation techniques may result in transfers in or out of an assigned level within the disclosure hierarchy.
Foreign Currency. The Fund may use foreign currency contracts to facilitate transactions in foreign-denominated securities. Gains and losses from these transactions may arise from changes in the value of the foreign currency or if the counterparties do not perform under the contracts' terms.
Foreign-denominated assets, including investment securities, and liabilities are translated into U.S. dollars at the exchange rates at period end. Purchases and sales of investment securities, income and dividends received and expenses denominated in foreign currencies are translated into U.S. dollars at the exchange rate in effect on the transaction date.
The effects of exchange rate fluctuations on investments are included with the net realized and unrealized gain (loss) on investment securities. Other foreign currency transactions resulting in realized and unrealized gain (loss) are disclosed separately
Investment Transactions and Income. For financial reporting purposes, the Fund's investment holdings and NAV include trades executed through the end of the last business day of the period. The NAV per share for processing shareholder transactions is calculated as of the close of business of the New York Stock Exchange (NYSE), normally 4:00 p.m. Eastern time and includes trades executed through the end of the prior business day. Gains and losses on securities sold are determined on the basis of identified cost. Dividend income is recorded on the ex-dividend date, except for certain dividends from foreign securities where the ex-dividend date may have passed, which are recorded as soon as the Fund is informed of the ex-dividend date. Non-cash dividends included in dividend income, if any, are recorded at the fair market value of the securities received. Income and capital gain distributions from Fidelity Central Funds, if any, are recorded on the ex-dividend date. Certain distributions received by the Fund represent a return of capital or capital gain. The Fund determines the components of these distributions subsequent to the ex-dividend date, based upon receipt of tax filings or other correspondence relating to the underlying investment. These distributions are recorded as a reduction of cost of investments and/or as a realized gain. Investment income is recorded net of foreign taxes withheld where recovery of such taxes is uncertain.
Class Allocations and Expenses. Investment income, realized and unrealized capital gains and losses, common expenses of the Fund, and certain fund-level expense reductions, if any, are allocated daily on a pro-rata basis to each class based on the relative net assets of each class to the total net assets of the Fund. Each class differs with respect to transfer agent fees incurred. Certain expense reductions may also differ by class. For the reporting period, the allocated portion of income and expenses to each class as a percent of its average net assets may vary due to the timing of recording these transactions in relation to fluctuating net assets of the classes. Expenses directly attributable to a fund are charged to that fund. Expenses attributable to more than one fund are allocated among the respective funds on the basis of relative net assets or other appropriate methods. Expense estimates are accrued in the period to which they relate and adjustments are made when actual amounts are known.
Income Tax Information and Distributions to Shareholders. Each year, the Fund intends to qualify as a regulated investment company under Subchapter M of the Internal Revenue Code, including distributing substantially all of its taxable income and realized gains. As a result, no provision for U.S. Federal income taxes is required. As of December 31, 2019, the Fund did not have any unrecognized tax benefits in the financial statements; nor is the Fund aware of any tax positions for which it is reasonably possible that the total amounts of unrecognized tax benefits will significantly change in the next twelve months. The Fund files a U.S. federal tax return, in addition to state and local tax returns as required. The Fund's federal income tax returns are subject to examination by the Internal Revenue Service (IRS) for a period of three fiscal years after they are filed. State and local tax returns may be subject to examination for an additional fiscal year depending on the jurisdiction. Foreign taxes are provided for based on the Fund's understanding of the tax rules and rates that exist in the foreign markets in which it invests.
Distributions are declared and recorded on the ex-dividend date. Income and capital gain distributions are declared separately for each class. Income and capital gain distributions are determined in accordance with income tax regulations, which may differ from GAAP.
Capital accounts within the financial statements are adjusted for permanent book-tax differences. These adjustments have no impact on net assets or the results of operations. Capital accounts are not adjusted for temporary book-tax differences which will reverse in a subsequent period.
Book-tax differences are primarily due to foreign currency transactions, partnerships and losses deferred due to wash sales.
As of period end, the cost and unrealized appreciation (depreciation) in securities, and derivatives if applicable, for federal income tax purposes were as follows:
| Gross unrealized appreciation | $5,832,854 |
| Gross unrealized depreciation | (385,935) |
| Net unrealized appreciation (depreciation) | $5,446,919 |
| Tax Cost | $38,936,410 |
The tax-based components of distributable earnings as of period end were as follows:
| Undistributed ordinary income | $147,795 |
| Capital loss carryforward | $(1,664,828) |
| Net unrealized appreciation (depreciation) on securities and other investments | $5,446,078 |
Capital loss carryforwards are only available to offset future capital gains of the Fund to the extent provided by regulations and may be limited. The capital loss carryforward information presented below, including any applicable limitation, is estimated as of fiscal period end and is subject to adjustment.
| No expiration | |
| Short-term | $(507,106) |
| Long-term | (1,157,722) |
| Total capital loss carryforward | $(1,664,828) |
The tax character of distributions paid was as follows:
| | December 31, 2019 | December 31, 2018 |
| Ordinary Income | $699,652 | $ 1,215,427 |
| Long-term Capital Gains | 4,449,340 | 5,057,977 |
| Total | $5,148,992 | $ 6,273,404 |
4. Purchases and Sales of Investments.
Purchases and sales of securities, other than short-term securities, aggregated $50,887,088 and $65,562,583, respectively.
5. Fees and Other Transactions with Affiliates.
Management Fee. Fidelity SelectCo, LLC (the investment adviser) and its affiliates provide the Fund with investment management related services for which the Fund pays a monthly management fee. The management fee is the sum of an individual fund fee rate that is based on an annual rate of .30% of the Fund's average net assets and an annualized group fee rate that averaged .24% during the period. The group fee rate is based upon the average net assets of all the mutual funds advised by Fidelity Management & Research Company (FMR) and the investment adviser. The group fee rate decreases as assets under management increase and increases as assets under management decrease. For the reporting period, the total annual management fee rate was .54% of the Fund's average net assets.
Transfer Agent Fees. Fidelity Investments Institutional Operations Company, Inc. (FIIOC), an affiliate of the investment adviser, is the Fund's transfer, dividend disbursing, and shareholder servicing agent. FIIOC receives an asset-based fee with respect to each class. Each class pays a fee for transfer agent services, typesetting and printing and mailing of shareholder reports, excluding mailing of proxy statements, equal to an annual rate of class-level average net assets. The annual rate for Investor Class is .15% and the annual rate for all other classes is .07%. For the period, transfer agent fees for each class were as follows:
| Initial Class | $6,150 |
| Investor Class | 57,875 |
| | $64,025 |
Accounting and Security Lending Fees. Fidelity Service Company, Inc. (FSC), an affiliate of the investment adviser, maintains the Fund's accounting records. The accounting fee is based on the level of average net assets for each month. Prior to April 1, 2019, FSC had a separate agreement with the Fund for administration of the security lending program, based on the number and duration of lending transactions. For the period, the total fees paid for accounting and administration of securities lending were equivalent to the following annual rates:
| | % of Average Net Assets |
| VIP Materials Portfolio | .04 |
Brokerage Commissions. A portion of portfolio transactions were placed with brokerage firms which are affiliates of the investment adviser. Brokerage commissions are included in net realized gain (loss) and change in net unrealized appreciation (depreciation) in the Statement of Operations. The commissions paid to these affiliated firms were as follows:
| | Amount |
| VIP Materials Portfolio | $2,268 |
Interfund Trades. The Fund may purchase from or sell securities to other Fidelity Funds under procedures adopted by the Board. The procedures have been designed to ensure these interfund trades are executed in accordance with Rule 17a-7 of the 1940 Act. Interfund trades are included within the respective purchases and sales amounts shown in the Purchases and Sales of Investments note.
6. Committed Line of Credit.
The Fund participates with other funds managed by the investment adviser or an affiliate in a $4.25 billion credit facility (the "line of credit") to be utilized for temporary or emergency purposes to fund shareholder redemptions or for other short-term liquidity purposes. The Fund has agreed to pay commitment fees on its pro-rata portion of the line of credit, which amounted to $141 and is reflected in Miscellaneous expenses on the Statement of Operations. During the period, the Fund did not borrow on this line of credit.
7. Security Lending.
The Fund lends portfolio securities from time to time in order to earn additional income. For equity securities, lending agents are used, including National Financial Services (NFS), an affiliate of the Fund. Pursuant to a securities lending agreement, NFS will receive a fee, which is capped at 9.9% of daily lending revenue, for its services as lending agent. The Fund may lend securities to certain qualified borrowers. On the settlement date of the loan, the Fund receives collateral (in the form of U.S. Treasury obligations, letters of credit and/or cash) against the loaned securities and maintains collateral in an amount not less than 100% of the market value of the loaned securities during the period of the loan. The market value of the loaned securities is determined at the close of business of the Fund and any additional required collateral is delivered to the Fund on the next business day. The Fund or borrower may terminate the loan at any time, and if the borrower defaults on its obligation to return the securities loaned because of insolvency or other reasons, the Fund may apply collateral received from the borrower against the obligation. The Fund may experience delays and costs in recovering the securities loaned. Any cash collateral received is invested in the Fidelity Securities Lending Cash Central Fund. At period end, there were no security loans outstanding. Total fees paid by the Fund to NFS amounted to $56. Security lending income represents the income earned on investing cash collateral, less rebates paid to borrowers and any lending agent fees associated with the loan, plus any premium payments received for lending certain types of securities. Security lending income is presented in the Statement of Operations as a component of income from Fidelity Central Funds.
8. Expense Reductions.
Commissions paid to certain brokers with whom the investment adviser, or its affiliates, places trades on behalf of the Fund include an amount in addition to trade execution, which may be rebated back to the Fund to offset certain expenses. This amount totaled $4,032 for the period.
In addition, during the period the investment adviser reimbursed and/or waived a portion of fund-level operating expenses in the amount of $421.
9. Distributions to Shareholders.
Distributions to shareholders of each class were as follows:
| | Year ended
December 31, 2019 | Year ended
December 31, 2018 |
| Distributions to shareholders | | |
| Initial Class | 962,593 | 1,189,699 |
| Investor Class | 4,186,399 | 5,083,705 |
| Total | $5,148,992 | $6,273,404 |
10. Share Transactions.
Transactions for each class of shares were as follows:
| | Shares | Shares | Dollars | Dollars |
| | Year ended December 31, 2019 | Year ended December 31, 2018 | Year ended December 31, 2019 | Year ended December 31, 2018 |
| Initial Class | | | | |
| Shares sold | 43,693 | 134,745 | $510,036 | $2,077,924 |
| Reinvestment of distributions | 85,636 | 85,091 | 962,593 | 1,189,699 |
| Shares redeemed | (219,066) | (553,509) | (2,531,247) | (8,043,417) |
| Net increase (decrease) | (89,737) | (333,673) | $(1,058,618) | $(4,775,794) |
| Investor Class | | | | |
| Shares sold | 209,585 | 631,940 | $2,458,687 | $9,646,433 |
| Reinvestment of distributions | 372,843 | 363,152 | 4,186,399 | 5,083,705 |
| Shares redeemed | (1,281,593) | (2,129,331) | (14,741,274) | (30,689,758) |
| Net increase (decrease) | (699,165) | (1,134,239) | $(8,096,188) | $(15,959,620) |
11. Other.
The Fund's organizational documents provide former and current trustees and officers with a limited indemnification against liabilities arising in connection with the performance of their duties to the Fund. In the normal course of business, the Fund may also enter into contracts that provide general indemnifications. The Fund's maximum exposure under these arrangements is unknown as this would be dependent on future claims that may be made against the Fund. The risk of material loss from such claims is considered remote.
At the end of the period, the investment adviser or its affiliates were the owners of record of 100% of the total outstanding shares of the Fund.
Effective January 1, 2020, following any required regulatory notices and approvals:
Investment advisers Fidelity Investments Money Management, Inc., FMR Co., Inc., and Fidelity SelectCo, LLC, merged with and into Fidelity Management & Research Company. In connection with the merger transactions, the resulting, merged investment adviser was then redomiciled from Massachusetts to Delaware, changed its corporate structure from a corporation to a limited liability company, and changed its name to "Fidelity Management & Research Company LLC".
Fidelity Investments Institutional Operations Company, Inc. (FIIOC) converted from a Massachusetts corporation to a Massachusetts LLC, and changed its name to "Fidelity Investments Institutional Operations Company LLC".
Report of Independent Registered Public Accounting Firm
To the Board of Trustees of Variable Insurance Products Fund IV and Shareholders of VIP Materials Portfolio:
Opinion on the Financial Statements
We have audited the accompanying statement of assets and liabilities, including the schedule of investments, of VIP Materials Portfolio (one of the funds constituting Variable Insurance Products Fund IV, referred to hereafter as the “Fund”) as of December 31, 2019, the related statement of operations for the year ended December 31, 2019, the statement of changes in net assets for each of the two years in the period ended December 31, 2019, including the related notes, and the financial highlights for each of the five years in the period ended December 31, 2019 (collectively referred to as the “financial statements”). In our opinion, the financial statements present fairly, in all material respects, the financial position of the Fund as of December 31, 2019, the results of its operations for the year then ended, the changes in its net assets for each of the two years in the period ended December 31, 2019 and the financial highlights for each of the five years in the period ended December 31, 2019 in conformity with accounting principles generally accepted in the United States of America.
Basis for Opinion
These financial statements are the responsibility of the Fund’s management. Our responsibility is to express an opinion on the Fund’s financial statements based on our audits. We are a public accounting firm registered with the Public Company Accounting Oversight Board (United States) (PCAOB) and are required to be independent with respect to the Fund in accordance with the U.S. federal securities laws and the applicable rules and regulations of the Securities and Exchange Commission and the PCAOB.
We conducted our audits of these financial statements in accordance with the standards of the PCAOB. Those standards require that we plan and perform the audit to obtain reasonable assurance about whether the financial statements are free of material misstatement, whether due to error or fraud.
Our audits included performing procedures to assess the risks of material misstatement of the financial statements, whether due to error or fraud, and performing procedures that respond to those risks. Such procedures included examining, on a test basis, evidence regarding the amounts and disclosures in the financial statements. Our audits also included evaluating the accounting principles used and significant estimates made by management, as well as evaluating the overall presentation of the financial statements. Our procedures included confirmation of securities owned as of December 31, 2019 by correspondence with the custodian and brokers; when replies were not received from brokers, we performed other auditing procedures. We believe that our audits provide a reasonable basis for our opinion.
PricewaterhouseCoopers LLP
Boston, Massachusetts
February 12, 2020
We have served as the auditor of one or more investment companies in the Fidelity group of funds since 1932.
Trustees and Officers
The Trustees, Members of the Advisory Board (if any), and officers of the trust and fund, as applicable, are listed below. The Board of Trustees governs the fund and is responsible for protecting the interests of shareholders. The Trustees are experienced executives who meet periodically throughout the year to oversee the fund's activities, review contractual arrangements with companies that provide services to the fund, oversee management of the risks associated with such activities and contractual arrangements, and review the fund's performance. Except for Michael E. Wiley, each of the Trustees oversees 302 funds. Mr. Wiley oversees 199 funds.
The Trustees hold office without limit in time except that (a) any Trustee may resign; (b) any Trustee may be removed by written instrument, signed by at least two-thirds of the number of Trustees prior to such removal; (c) any Trustee who requests to be retired or who has become incapacitated by illness or injury may be retired by written instrument signed by a majority of the other Trustees; and (d) any Trustee may be removed at any special meeting of shareholders by a two-thirds vote of the outstanding voting securities of the trust. Each Trustee who is not an interested person (as defined in the Investment Company Act of 1940 (1940 Act)) of the trust and the fund is referred to herein as an Independent Trustee. Each Independent Trustee shall retire not later than the last day of the calendar year in which his or her 75th birthday occurs. The Independent Trustees may waive this mandatory retirement age policy with respect to individual Trustees. Officers and Advisory Board Members hold office without limit in time, except that any officer or Advisory Board Member may resign or may be removed by a vote of a majority of the Trustees at any regular meeting or any special meeting of the Trustees. Except as indicated, each individual has held the office shown or other offices in the same company for the past five years.
The fund’s Statement of Additional Information (SAI) includes more information about the Trustees. To request a free copy, call Fidelity at 1-877-208-0098.
Experience, Skills, Attributes, and Qualifications of the Trustees. The Governance and Nominating Committee has adopted a statement of policy that describes the experience, qualifications, attributes, and skills that are necessary and desirable for potential Independent Trustee candidates (Statement of Policy). The Board believes that each Trustee satisfied at the time he or she was initially elected or appointed a Trustee, and continues to satisfy, the standards contemplated by the Statement of Policy. The Governance and Nominating Committee also engages professional search firms to help identify potential Independent Trustee candidates who have the experience, qualifications, attributes, and skills consistent with the Statement of Policy. From time to time, additional criteria based on the composition and skills of the current Independent Trustees, as well as experience or skills that may be appropriate in light of future changes to board composition, business conditions, and regulatory or other developments, have also been considered by the professional search firms and the Governance and Nominating Committee. In addition, the Board takes into account the Trustees' commitment and participation in Board and committee meetings, as well as their leadership of standing and ad hoc committees throughout their tenure.
In determining that a particular Trustee was and continues to be qualified to serve as a Trustee, the Board has considered a variety of criteria, none of which, in isolation, was controlling. The Board believes that, collectively, the Trustees have balanced and diverse experience, qualifications, attributes, and skills, which allow the Board to operate effectively in governing the fund and protecting the interests of shareholders. Information about the specific experience, skills, attributes, and qualifications of each Trustee, which in each case led to the Board's conclusion that the Trustee should serve (or continue to serve) as a trustee of the fund, is provided below.
Board Structure and Oversight Function. James C. Curvey is an interested person and currently serves as Chairman. The Trustees have determined that an interested Chairman is appropriate and benefits shareholders because an interested Chairman has a personal and professional stake in the quality and continuity of services provided to the fund. Independent Trustees exercise their informed business judgment to appoint an individual of their choosing to serve as Chairman, regardless of whether the Trustee happens to be independent or a member of management. The Independent Trustees have determined that they can act independently and effectively without having an Independent Trustee serve as Chairman and that a key structural component for assuring that they are in a position to do so is for the Independent Trustees to constitute a substantial majority for the Board. The Independent Trustees also regularly meet in executive session. Ned C. Lautenbach serves as Chairman of the Independent Trustees and as such (i) acts as a liaison between the Independent Trustees and management with respect to matters important to the Independent Trustees and (ii) with management prepares agendas for Board meetings.
Fidelity® funds are overseen by different Boards of Trustees. The fund's Board oversees Fidelity's high income and certain equity funds, and other Boards oversee Fidelity's investment-grade bond, money market, asset allocation, and other equity funds. The asset allocation funds may invest in Fidelity® funds overseen by the fund's Board. The use of separate Boards, each with its own committee structure, allows the Trustees of each group of Fidelity® funds to focus on the unique issues of the funds they oversee, including common research, investment, and operational issues. On occasion, the separate Boards establish joint committees to address issues of overlapping consequences for the Fidelity® funds overseen by each Board.
The Trustees operate using a system of committees to facilitate the timely and efficient consideration of all matters of importance to the Trustees, the fund, and fund shareholders and to facilitate compliance with legal and regulatory requirements and oversight of the fund's activities and associated risks. The Board, acting through its committees, has charged FMR and its affiliates with (i) identifying events or circumstances the occurrence of which could have demonstrably adverse effects on the fund's business and/or reputation; (ii) implementing processes and controls to lessen the possibility that such events or circumstances occur or to mitigate the effects of such events or circumstances if they do occur; and (iii) creating and maintaining a system designed to evaluate continuously business and market conditions in order to facilitate the identification and implementation processes described in (i) and (ii) above. Because the day-to-day operations and activities of the fund are carried out by or through FMR, its affiliates, and other service providers, the fund's exposure to risks is mitigated but not eliminated by the processes overseen by the Trustees. While each of the Board's committees has responsibility for overseeing different aspects of the fund's activities, oversight is exercised primarily through the Operations, Audit, and Compliance Committees. Appropriate personnel, including but not limited to the fund's Chief Compliance Officer (CCO), FMR's internal auditor, the independent accountants, the fund's Treasurer and portfolio management personnel, make periodic reports to the Board's committees, as appropriate, including an annual review of Fidelity's risk management program for the Fidelity® funds. The responsibilities of each standing committee, including their oversight responsibilities, are described further under "Standing Committees of the Trustees."
Interested Trustees*:
Correspondence intended for a Trustee who is an interested person may be sent to Fidelity Investments, 245 Summer Street, Boston, Massachusetts 02210.
Name, Year of Birth; Principal Occupations and Other Relevant Experience+
James C. Curvey (1935)
Year of Election or Appointment: 2018
Trustee
Chairman of the Board of Trustees
Mr. Curvey also serves as Trustee of other Fidelity® funds. Mr. Curvey is Vice Chairman (2007-present) and Director of FMR LLC (diversified financial services company). In addition, Mr. Curvey is an Overseer Emeritus for the Boston Symphony Orchestra, a Director of Artis-Naples, and a Trustee of Brewster Academy in Wolfeboro, New Hampshire. Previously, Mr. Curvey served as a Director of Fidelity Research & Analysis Co. (investment adviser firm, 2009-2018), Director of Fidelity Investments Money Management, Inc. (investment adviser firm, 2009-2014) and a Director of FMR and FMR Co., Inc. (investment adviser firms, 2007-2014).
* Determined to be an “Interested Trustee” by virtue of, among other things, his or her affiliation with the trust or various entities under common control with FMR.
+ The information includes the Trustee's principal occupation during the last five years and other information relating to the experience, attributes, and skills relevant to the Trustee's qualifications to serve as a Trustee, which led to the conclusion that the Trustee should serve as a Trustee for the fund.
Independent Trustees:
Correspondence intended for an Independent Trustee may be sent to Fidelity Investments, P.O. Box 55235, Boston, Massachusetts 02205-5235.
Name, Year of Birth; Principal Occupations and Other Relevant Experience+
Dennis J. Dirks (1948)
Year of Election or Appointment: 2018
Trustee
Mr. Dirks also serves as Trustee of other Fidelity® funds. Prior to his retirement in May 2003, Mr. Dirks was Chief Operating Officer and a member of the Board of The Depository Trust & Clearing Corporation (DTCC). He also served as President, Chief Operating Officer, and Board member of The Depository Trust Company (DTC) and President and Board member of the National Securities Clearing Corporation (NSCC). In addition, Mr. Dirks served as Chief Executive Officer and Board member of the Government Securities Clearing Corporation, Chief Executive Officer and Board member of the Mortgage-Backed Securities Clearing Corporation, as a Trustee and a member of the Finance Committee of Manhattan College (2005-2008), as a Trustee and a member of the Finance Committee of AHRC of Nassau County (2006-2008), as a member of the Independent Directors Council (IDC) Governing Council (2010-2015), and as a member of the Board of Directors for The Brookville Center for Children’s Services, Inc. (2009-2017). Mr. Dirks is a member of the Finance Committee (2016-present) and Board of Directors (2017-present) and is Treasurer (2018-present) of the Asolo Repertory Theatre.
Donald F. Donahue (1950)
Year of Election or Appointment: 2018
Trustee
Mr. Donahue also serves as a Trustee of other Fidelity® funds. Mr. Donahue is President and Chief Executive Officer of Miranda Partners, LLC (risk consulting for the financial services industry, 2012-present). Previously, Mr. Donahue served as a Member of the Advisory Board of certain Fidelity® funds (2015-2018) and Chief Executive Officer (2006-2012), Chief Operating Officer (2003-2006), and Managing Director, Customer Marketing and Development (1999-2003) of The Depository Trust & Clearing Corporation (financial markets infrastructure). Mr. Donahue serves as a Member (2007-present) and Co-Chairman (2016-present) of the Board of Directors of United Way of New York, Member of the Board of Directors of NYC Leadership Academy (2012-present) and Member of the Board of Advisors of Ripple Labs, Inc. (financial services, 2015-present). He also served as Chairman (2010-2012) and Member of the Board of Directors (2012-2013) of Omgeo, LLC (financial services), Treasurer of United Way of New York (2012-2016), and Member of the Board of Directors of XBRL US (financial services non-profit, 2009-2012) and the International Securities Services Association (2009-2012).
Alan J. Lacy (1953)
Year of Election or Appointment: 2018
Trustee
Mr. Lacy also serves as Trustee of other Fidelity® funds. Mr. Lacy serves as a Director of Bristol-Myers Squibb Company (global pharmaceuticals, 2008-present). He is a Trustee of the California Chapter of The Nature Conservancy (2015-present) and a Director of the Center for Advanced Study in the Behavioral Sciences at Stanford University (2015-present). In addition, Mr. Lacy served as Senior Adviser (2007-2014) of Oak Hill Capital Partners, L.P. (private equity) and also served as Chief Executive Officer (2005) and Vice Chairman (2005-2006) of Sears Holdings Corporation (retail) and Chief Executive Officer and Chairman of the Board of Sears, Roebuck and Co. (retail, 2000-2005). Previously, Mr. Lacy served as Chairman (2014-2017) and a member (2010-2017) of the Board of Directors of Dave & Buster’s Entertainment, Inc. (restaurant and entertainment complexes), as Chairman (2008-2011) and a member (2006-2015) of the Board of Trustees of the National Parks Conservation Association, and as a member of the Board of Directors for The Hillman Companies, Inc. (hardware wholesalers, 2010-2014), Earth Fare, Inc. (retail grocery, 2010-2014), and The Western Union Company (global money transfer, 2006-2011).
Ned C. Lautenbach (1944)
Year of Election or Appointment: 2018
Trustee
Chairman of the Independent Trustees
Mr. Lautenbach also serves as Trustee of other Fidelity® funds. Mr. Lautenbach currently serves as Chair (2018-present) and Member (2013-present) of the Board of Governors, State University System of Florida and is a member of the Council on Foreign Relations (1994-present). He is also a member and has most recently served as Chairman of the Board of Directors of Artis-Naples (2012-present). Previously, Mr. Lautenbach served as a member and then Lead Director of the Board of Directors of Eaton Corporation (diversified industrial, 1997-2016). He was also a Partner and Advisory Partner at Clayton, Dubilier & Rice, LLC (private equity investment, 1998-2010), as well as a Director of Sony Corporation (2006-2007). In addition, Mr. Lautenbach also had a 30-year career with IBM (technology company) during which time he served as Senior Vice President and a member of the Corporate Executive Committee (1968-1998).
Joseph Mauriello (1944)
Year of Election or Appointment: 2018
Trustee
Mr. Mauriello also serves as Trustee of other Fidelity® funds. Prior to his retirement in January 2006, Mr. Mauriello served in numerous senior management positions including Deputy Chairman and Chief Operating Officer (2004-2005), and Vice Chairman of Financial Services (2002-2004) of KPMG LLP US (professional services, 1965-2005). Mr. Mauriello currently serves as a member of the Independent Directors Council (IDC) Governing Council (2015-present). Previously, Mr. Mauriello served as a member of the Board of Directors of XL Group plc. (global insurance and re-insurance, 2006-2018).
Cornelia M. Small (1944)
Year of Election or Appointment: 2018
Trustee
Ms. Small also serves as Trustee of other Fidelity® funds. Ms. Small is a member of the Board of Directors (2009-present) and Chair of the Investment Committee (2010-present) of the Teagle Foundation. Ms. Small also serves on the Investment Committee of the Berkshire Taconic Community Foundation (2008-present). Previously, Ms. Small served as Chairperson (2002-2008) and a member of the Investment Committee and Chairperson (2008-2012) and a member of the Board of Trustees of Smith College. In addition, Ms. Small served as Chief Investment Officer, Director of Global Equity Investments, and a member of the Board of Directors of Scudder, Stevens & Clark and Scudder Kemper Investments.
Garnett A. Smith (1947)
Year of Election or Appointment: 2013
Trustee
Mr. Smith also serves as Trustee of other Fidelity® funds. Prior to Mr. Smith's retirement, he served as Chairman and Chief Executive Officer of Inbrand Corp. (manufacturer of personal absorbent products, 1990-1997). He also served as President (1986-1990) of Inbrand Corp. Prior to his employment with Inbrand Corp., he was employed by a retail fabric chain and North Carolina National Bank. In addition, Mr. Smith served as a Member of the Advisory Board of certain Fidelity® funds (2012-2013) and as a board member of the Jackson Hole Land Trust (2009-2012).
David M. Thomas (1949)
Year of Election or Appointment: 2018
Trustee
Mr. Thomas also serves as Trustee of other Fidelity® funds. Mr. Thomas serves as Non-Executive Chairman of the Board of Directors of Fortune Brands Home and Security (home and security products, 2011-present) and as a member of the Board of Directors (2004-present) and Presiding Director (2013-present) of Interpublic Group of Companies, Inc. (marketing communication). Previously, Mr. Thomas served as Executive Chairman (2005-2006) and Chairman and Chief Executive Officer (2000-2005) of IMS Health, Inc. (pharmaceutical and healthcare information solutions), a Director of Fortune Brands, Inc. (consumer products, 2000-2011), and a member of the Board of Trustees of the University of Florida (2013-2018).
Michael E. Wiley (1950)
Year of Election or Appointment: 2008
Trustee
Mr. Wiley also serves as Trustee or Member of the Advisory Board of other Fidelity® funds. Mr. Wiley serves as a Director of High Point Resources (exploration and production, 2005-present). Previously, Mr. Wiley served as a Director of Andeavor Corporation (independent oil refiner and marketer, 2005-2018), a Director of Andeavor Logistics LP (natural resources logistics, 2015-2018), a Director of Post Oak Bank (privately-held bank, 2004-2018), a Director of Asia Pacific Exploration Consolidated (international oil and gas exploration and production, 2008-2013), a member of the Board of Trustees of the University of Tulsa (2000-2006; 2007-2010), a Senior Energy Advisor of Katzenbach Partners, LLC (consulting, 2006-2007), an Advisory Director of Riverstone Holdings (private investment), a Director of Spinnaker Exploration Company (exploration and production, 2001-2005) and Chairman, President, and CEO of Baker Hughes, Inc. (oilfield services, 2000-2004).
+ The information includes the Trustee's principal occupation during the last five years and other information relating to the experience, attributes, and skills relevant to the Trustee's qualifications to serve as a Trustee, which led to the conclusion that the Trustee should serve as a Trustee for the fund.
Advisory Board Members and Officers:
Correspondence intended for a Member of the Advisory Board (if any) may be sent to Fidelity Investments, P.O. Box 55235, Boston, Massachusetts 02205-5235. Correspondence intended for an officer or Peter S. Lynch may be sent to Fidelity Investments, 245 Summer Street, Boston, Massachusetts 02210. Officers appear below in alphabetical order.
Name, Year of Birth; Principal Occupation
Vicki L. Fuller (1957)
Year of Election or Appointment: 2018
Member of the Advisory Board
Ms. Fuller also serves as Member of the Advisory Board of other Fidelity® funds. Ms. Fuller serves as a member of the Board of Directors, Audit Committee, and Nominating and Governance Committee of The Williams Companies, Inc. (natural gas infrastructure, 2018-present). Previously, Ms. Fuller served as the Chief Investment Officer of the New York State Common Retirement Fund (2012-2018) and held a variety of positions at AllianceBernstein L.P. (global asset management, 1985-2012), including Managing Director (2006-2012) and Senior Vice President and Senior Portfolio Manager (2001-2006).
Patricia L. Kampling (1959)
Year of Election or Appointment: 2020
Member of the Advisory Board
Ms. Kampling also serves as Member of the Advisory Board of other Fidelity® funds. Prior to her retirement, Ms. Kampling served as Chairman of the Board and Chief Executive Officer (2012-2019), President and Chief Operating Officer (2011-2012) and Executive Vice President and Chief Financial Officer (2010-2011) of Alliant Energy Corporation. Ms. Kampling currently serves as a member of the Board, Compensation Committee and Executive Committee and as Chair of the Audit Committee of Briggs & Stratton Corporation (manufacturing, 2011-present) and as a member of the Board, Audit, Finance and Risk Committee and Safety, Environmental, Technology and Operations Committee of American Water Works Company, Inc. (utilities company, 2019-present). In addition, Ms. Kampling currently serves as a member of the Board of the Nature Conservancy, Wisconsin Chapter (2019-present). Previously, Ms. Kampling served as a member of the Board of Interstate Power and Light Company (2012-2019) and Wisconsin Power and Light Company (2012-2019) (each a subsidiary of Alliant Energy Corporation) and as a member of the Board and Workforce Development Committee of the Business Roundtable (2018-2019).
Peter S. Lynch (1944)
Year of Election or Appointment: 2018
Member of the Advisory Board
Mr. Lynch also serves as Member of the Advisory Board of other Fidelity® funds. Mr. Lynch is Vice Chairman and a Director of Fidelity Management & Research Company LLC (investment adviser firm). In addition, Mr. Lynch serves as a Trustee of Boston College and as the Chairman of the Inner-City Scholarship Fund. Previously, Mr. Lynch served as Vice Chairman and a Director of FMR Co., Inc. (investment adviser firm) and on the Special Olympics International Board of Directors (1997-2006).
Susan Tomasky (1953)
Year of Election or Appointment: 2020
Member of the Advisory Board
Ms. Tomasky also serves as Member of the Advisory Board of other Fidelity® funds. Prior to her retirement, Ms. Tomasky served in various executive officer positions at American Electric Power Company, Inc. (1998-2011), including most recently as President of AEP Transmission (2007-2011). Ms. Tomasky currently serves as a member of the Board and Sustainability Committee and as Chair of the Audit Committee of Marathon Petroleum Corporation (2018-present) and as a member of the Board, Corporate Governance Committee and Organization and Compensation Committee and as Chair of the Audit Committee of Public Service Enterprise Group, Inc. (utilities company, 2012-present). In addition, Ms. Tomasky currently serves as a member of the Board of the Columbus Regional Airport Authority (2007-present), as a member of the Board of the Royal Shakespeare Company – America (2009-present), as a member of the Board of the Columbus Association for the Performing Arts (2011-present) and as a member of the Board of Kenyon College (2016-present). Previously, Ms. Tomasky served as a member of the Board (2011-2019) and as Lead Independent Director (2015-2018) of Andeavor Corporation (previously Tesoro Corporation) (independent oil refiner and marketer) and as a member of the Board of Summit Midstream Partners LP (energy, 2012-2018).
Elizabeth Paige Baumann (1968)
Year of Election or Appointment: 2017
Anti-Money Laundering (AML) Officer
Ms. Baumann also serves as AML Officer of other funds. She is Chief AML Officer (2012-present) and Senior Vice President (2014-present) of FMR LLC (diversified financial services company) and is an employee of Fidelity Investments. Previously, Ms. Baumann served as AML Officer of the funds (2012-2016), and Vice President (2007-2014) and Deputy Anti-Money Laundering Officer (2007-2012) of FMR LLC.
Craig S. Brown (1977)
Year of Election or Appointment: 2019
Assistant Treasurer
Mr. Brown also serves as Assistant Treasurer of other funds. Mr. Brown is an employee of Fidelity Investments (2013-present).
John J. Burke III (1964)
Year of Election or Appointment: 2018
Chief Financial Officer
Mr. Burke also serves as Chief Financial Officer of other funds. Mr. Burke serves as Head of Investment Operations for Fidelity Fund and Investment Operations (2018-present) and is an employee of Fidelity Investments (1998-present). Previously Mr. Burke served as head of Asset Management Investment Operations (2012-2018).
William C. Coffey (1969)
Year of Election or Appointment: 2019
Assistant Secretary
Mr. Coffey also serves as Assistant Secretary of other funds. He is Senior Vice President and Deputy General Counsel of FMR LLC (diversified financial services company, 2010-present), and is an employee of Fidelity Investments. Previously, Mr. Coffey served as Secretary and CLO of certain funds (2018-2019); CLO, Secretary, and Senior Vice President of Fidelity Management & Research Company and FMR Co., Inc. (investment adviser firms, 2018-2019); Secretary of Fidelity SelectCo, LLC and Fidelity Investments Money Management, Inc. (investment adviser firms, 2018-2019); CLO of Fidelity Management & Research (Hong Kong) Limited, FMR Investment Management (UK) Limited, and Fidelity Management & Research (Japan) Limited (investment adviser firms, 2018-2019); and Assistant Secretary of certain funds (2009-2018).
Timothy M. Cohen (1969)
Year of Election or Appointment: 2018
Vice President
Mr. Cohen also serves as Vice President of other funds. Mr. Cohen serves as Co-Head of Equity (2018-present), a Director of Fidelity Management & Research (Japan) Limited (investment adviser firm, 2016-present), and is an employee of Fidelity Investments. Previously, Mr. Cohen served as Executive Vice President of Fidelity SelectCo, LLC (2019), Head of Global Equity Research (2016-2018), Chief Investment Officer - Equity and a Director of Fidelity Management & Research (U.K.) Inc. (investment adviser firm, 2013-2015) and as a Director of Fidelity Management & Research (Hong Kong) Limited (investment adviser firm, 2017).
Jonathan Davis (1968)
Year of Election or Appointment: 2010
Assistant Treasurer
Mr. Davis also serves as Assistant Treasurer of other funds. Mr. Davis serves as Assistant Treasurer of FMR Capital, Inc. (2017-present) and is an employee of Fidelity Investments. Previously, Mr. Davis served as Vice President and Associate General Counsel of FMR LLC (diversified financial services company, 2003-2010).
Laura M. Del Prato (1964)
Year of Election or Appointment: 2018
Assistant Treasurer
Ms. Del Prato also serves as an officer of other funds. Ms. Del Prato is an employee of Fidelity Investments (2017-present). Prior to joining Fidelity Investments, Ms. Del Prato served as a Managing Director and Treasurer of the JPMorgan Mutual Funds (2014-2017). Prior to JPMorgan, Ms. Del Prato served as a partner at Cohen Fund Audit Services (accounting firm, 2012-2013) and KPMG LLP (accounting firm, 2004-2012).
Colm A. Hogan (1973)
Year of Election or Appointment: 2020
Assistant Treasurer
Mr. Hogan also serves as an officer of other funds. Mr. Hogan serves as Assistant Treasurer of FMR Capital, Inc. (2017-present) and is an employee of Fidelity Investments (2005-present). Previously, Mr. Hogan served as Deputy Treasurer of certain Fidelity® funds (2016-2020) and Assistant Treasurer of certain Fidelity® funds (2016-2018).
Pamela R. Holding (1964)
Year of Election or Appointment: 2018
Vice President
Ms. Holding also serves as Vice President of other funds. Ms. Holding serves as Co-Head of Equity (2018-present) and is an employee of Fidelity Investments (2013-present). Previously, Ms. Holding served as Executive Vice President of Fidelity SelectCo, LLC (2019) and as Chief Investment Officer of Fidelity Institutional Asset Management (2013-2018).
Cynthia Lo Bessette (1969)
Year of Election or Appointment: 2019
Secretary and Chief Legal Officer (CLO)
Ms. Lo Bessette also serves as an officer of other funds. Ms. Lo Bessette serves as CLO, Secretary, and Senior Vice President of Fidelity Management & Research Company LLC (investment adviser firm, 2019-present); and CLO of Fidelity Management & Research (Hong Kong) Limited, FMR Investment Management (UK) Limited, and Fidelity Management & Research (Japan) Limited (investment adviser firms, 2019-present). She is a Senior Vice President and Deputy General Counsel of FMR LLC (diversified financial services company, 2019-present), and is an employee of Fidelity Investments. Previously, Ms. Lo Bessette served as CLO, Secretary, and Senior Vice President of FMR Co., Inc. (investment adviser firm, 2019); Secretary of Fidelity SelectCo, LLC and Fidelity Investments Money Management, Inc. (investment adviser firms, 2019). Prior to joining Fidelity Investments, Ms. Lo Bessette was Executive Vice President, General Counsel (2016-2019) and Senior Vice President, Deputy General Counsel (2015-2016) of OppenheimerFunds (investment management company) and Deputy Chief Legal Officer (2013-2015) of Jennison Associates LLC (investment adviser firm).
Chris Maher (1972)
Year of Election or Appointment: 2020
Deputy Treasurer
Mr. Maher also serves as an officer of other funds. Mr. Maher serves as Assistant Treasurer of FMR Capital, Inc. (2017-present), and is an employee of Fidelity Investments (2008-present). Previously, Mr. Maher served as Assistant Treasurer of certain funds (2013-2020); Vice President of Asset Management Compliance (2013), Vice President of the Program Management Group of FMR (investment adviser firm, 2010-2013), and Vice President of Valuation Oversight (2008-2010).
Kenneth B. Robins (1969)
Year of Election or Appointment: 2018
Chief Compliance Officer
Mr. Robins also serves as an officer of other funds. Mr. Robins serves as Compliance Officer of Fidelity Management & Research Company LLC (investment adviser firm, 2016-present) and is an employee of Fidelity Investments (2004-present). Previously, Mr. Robins served as Compliance Officer of FMR Co., Inc. (investment adviser firm, 2016-2019), as Executive Vice President of Fidelity Investments Money Management, Inc. (investment adviser firm, 2013-2016) and served in other fund officer roles.
Stacie M. Smith (1974)
Year of Election or Appointment: 2018
President and Treasurer
Ms. Smith also serves as an officer of other funds. Ms. Smith serves as Assistant Treasurer of FMR Capital, Inc. (2017-present), is an employee of Fidelity Investments (2009-present), and has served in other fund officer roles. Prior to joining Fidelity Investments, Ms. Smith served as Senior Audit Manager of Ernst & Young LLP (accounting firm, 1996-2009). Previously, Ms. Smith served as Assistant Treasurer (2013-2019) and Deputy Treasurer (2013-2016) of certain Fidelity® funds.
Marc L. Spector (1972)
Year of Election or Appointment: 2017
Assistant Treasurer
Mr. Spector also serves as an officer of other funds. Mr. Spector serves as Assistant Treasurer of FMR Capital, Inc. (2017-present) and is an employee of Fidelity Investments (2016-present). Prior to joining Fidelity Investments, Mr. Spector served as Director at the Siegfried Group (accounting firm, 2013-2016), and prior to Siegfried Group as audit senior manager at Deloitte & Touche (accounting firm, 2005-2013).
Jim Wegmann (1979)
Year of Election or Appointment: 2019
Assistant Treasurer
Mr. Wegmann also serves as Assistant Treasurer of other funds. Mr. Wegmann is an employee of Fidelity Investments (2011-present).
Shareholder Expense Example
As a shareholder of the Fund, you incur two types of costs: (1) transaction costs and (2) ongoing costs, including management fees and other Fund expenses. This Example is intended to help you understand your ongoing costs (in dollars) of investing in the Fund and to compare these costs with the ongoing costs of investing in other mutual funds.
The Example is based on an investment of $1,000 invested at the beginning of the period and held for the entire period (July 1, 2019 to December 31, 2019).
Actual Expenses
The first line of the accompanying table for each class of the Fund provides information about actual account values and actual expenses. You may use the information in this line, together with the amount you invested, to estimate the expenses that you paid over the period. Simply divide your account value by $1,000.00 (for example, an $8,600 account value divided by $1,000.00 = 8.6), then multiply the result by the number in the first line for a class of the Fund under the heading entitled "Expenses Paid During Period" to estimate the expenses you paid on your account during this period. The estimate of expenses does not include any fees or other expenses of any variable annuity or variable life insurance product. If they were, the estimate of expenses you paid during the period would be higher, and your ending account value would be lower. In addition, the Fund, as a shareholder in the underlying Fidelity Central Funds, will indirectly bear its pro-rata share of the fees and expenses incurred by the underlying Fidelity Central Funds. These fees and expenses are not included in the Fund's annualized expense ratio used to calculate the expense estimate in the table below.
Hypothetical Example for Comparison Purposes
The second line of the accompanying table for each class of the Fund provides information about hypothetical account values and hypothetical expenses based on a Class' actual expense ratio and an assumed rate of return of 5% per year before expenses, which is not the Class' actual return. The hypothetical account values and expenses may not be used to estimate the actual ending account balance or expenses you paid for the period. You may use this information to compare the ongoing costs of investing in the Fund and other funds. To do so, compare this 5% hypothetical example with the 5% hypothetical examples that appear in the shareholder reports of the other funds. The estimate of expenses does not include any fees or other expenses of any variable annuity or variable life insurance product. If they were, the estimate of expenses you paid during the period would be higher, and your ending account value would be lower. In addition, the Fund, as a shareholder in the underlying Fidelity Central Funds, will indirectly bear its pro-rata share of the fees and expenses incurred by the underlying Fidelity Central Funds. These fees and expenses are not included in the Fund's annualized expense ratio used to calculate the expense estimate in the table below.
Please note that the expenses shown in the table are meant to highlight your ongoing costs only and do not reflect any transaction costs. Therefore, the second line of the table is useful in comparing ongoing costs only, and will not help you determine the relative total costs of owning different funds.
| | Annualized Expense Ratio-A | Beginning
Account Value
July 1, 2019 | Ending
Account Value
December 31, 2019 | Expenses Paid
During Period-B
July 1, 2019
to December 31, 2019 |
| Initial Class | .76% | | | |
| Actual | | $1,000.00 | $1,008.70 | $3.85 |
| Hypothetical-C | | $1,000.00 | $1,021.37 | $3.87 |
| Investor Class | .84% | | | |
| Actual | | $1,000.00 | $1,007.90 | $4.25 |
| Hypothetical-C | | $1,000.00 | $1,020.97 | $4.28 |
A Annualized expense ratio reflects expenses net of applicable fee waivers.
B Expenses are equal to each Class' annualized expense ratio, multiplied by the average account value over the period, multiplied by 184/365 (to reflect the one-half year period).
C 5% return per year before expenses
Distributions (Unaudited)
Initial Class and Investor Class designate 100% of the dividends distributed in February and December, during the fiscal year as qualifying for the dividends–received deduction for corporate shareholders.
Board Approval of Investment Advisory Contracts
VIP Materials Portfolio
At its November 2019 meeting, the Board of Trustees, including the Independent Trustees (together, the Board), voted to approve an amended and restated management contract and amended and restated sub-advisory agreements (together, the Amended and Restated Contracts) for the fund, effective January 1, 2020, for a one month period through January 31, 2020, in connection with an upcoming consolidation of certain of Fidelity's advisory businesses.
The Board considered that, on or about January 1, 2020, each of FMR Co., Inc. (FMRC), Fidelity Investments Money Management, Inc. (FIMM), and SelectCo, LLC (SelectCo) will merge with and into Fidelity Management & Research Company (FMR) and that, after the merger, FMR will redomicile as a Delaware limited liability company. The Board also approved the termination of the sub-advisory agreement with FMRC upon the completion of the merger. The Board noted that the Amended and Restated Contracts would be updated to reflect the renamed adviser, Fidelity Management & Research Company LLC and its new form of organization and domicile. The Board also noted that the Amended and Restated Contracts will not change the investment processes, the level or nature of services provided, the resources and personnel allocated, trading and compliance operations, or any fees or expenses paid by the fund.
The Board concluded that the fund's Amended and Restated Contracts are fair and reasonable, and that the fund's Advisory Contracts should be approved through January 31, 2020.
In connection with its consideration of future renewals of the fund's Amended and Restated Contracts, the Board will consider: (i) the nature, extent and quality of services provided to the fund, including shareholder and administrative services and investment performance; (ii) the competitiveness of the management fee and total expenses for the fund; (iii) the costs of the services and profitability, including the revenues earned and the expenses incurred in conducting the business of developing, marketing, distributing, managing, administering, and servicing the fund and its shareholders, to the extent applicable; and (iv) whether there have been economies of scale in respect of the Fidelity funds, whether the Fidelity funds (including the fund) have appropriately benefited from any such economies of scale, and whether there is the potential for realization of any further economies.
Based on its evaluation of all of the conclusions noted above, and after considering all factors it believed relevant, the Board ultimately concluded that the fund's management fee structure is fair and reasonable, and that the continuation of the fund's Amended and Restated Contracts should be approved.
VMATP-ANN-0220
1.850999.112
Fidelity® Variable Insurance Products:
Energy Portfolio
Annual Report
December 31, 2019
See the inside front cover for important information about access to your fund’s shareholder reports.
Beginning on January 1, 2021, as permitted by regulations adopted by the Securities and Exchange Commission, and if your insurance carrier elects to participate, you may not be receiving paper copies of the Fund’s shareholder reports from the insurance company that offers your variable insurance product unless you specifically request paper copies from your financial professional or the administrator of your variable insurance product. Instead, the reports will be made available on a website, and you will be notified by mail each time a report is posted and provided with a website link to access the report.
If you already elected to receive shareholder reports electronically, you will not be affected by this change and you need not take any action. You may elect to receive shareholder reports and other communications from the Fund electronically, by contacting your financial professional or the administrator of your variable insurance product. If you own a Fidelity-administered variable insurance product, please visit fidelity.com/mailpreferences to make your election or call 1-800-343-3548.
You may elect to receive all future reports in paper free of charge. If you wish to continue receiving paper copies of your shareholder reports, you may contact your financial professional or the administrator of your variable insurance product. If you own a Fidelity-administered variable insurance product, please visit fidelity.com/mailpreferences to make your election or call 1-800-343-3548. Your election to receive reports in paper will apply to all funds available under your variable insurance product.
Contents
To view a fund's proxy voting guidelines and proxy voting record for the 12-month period ended June 30, visit http://www.fidelity.com/proxyvotingresults or visit the Securities and Exchange Commission's (SEC) web site at http://www.sec.gov.
You may also call 1-877-208-0098 to request a free copy of the proxy voting guidelines.
Fidelity® Variable Insurance Products are separate account options which are purchased through a variable insurance contract.
Standard & Poor's, S&P and S&P 500 are registered service marks of The McGraw-Hill Companies, Inc. and have been licensed for use by Fidelity Distributors Corporation.
Other third-party marks appearing herein are the property of their respective owners.
All other marks appearing herein are registered or unregistered trademarks or service marks of FMR LLC or an affiliated company. © 2020 FMR LLC. All rights reserved.
This report and the financial statements contained herein are submitted for the general information of the shareholders of the Fund. This report is not authorized for distribution to prospective investors in the Fund unless preceded or accompanied by an effective prospectus.
A fund files its complete schedule of portfolio holdings with the SEC for the first and third quarters of each fiscal year on Form N-PORT. Forms N-PORT are available on the SEC’s web site at http://www.sec.gov. A fund's Forms N-PORT may be reviewed and copied at the SEC’s Public Reference Room in Washington, DC. Information regarding the operation of the SEC's Public Reference Room may be obtained by calling 1-800-SEC-0330.
For a complete list of a fund's portfolio holdings, view the most recent holdings listing, semiannual report, or annual report on Fidelity's web site at http://www.fidelity.com, http://www.institutional.fidelity.com, or http://www.401k.com, as applicable.
NOT FDIC INSURED •MAY LOSE VALUE •NO BANK GUARANTEE
Neither the Fund nor Fidelity Distributors Corporation is a bank.
Performance: The Bottom Line
Average annual total return reflects the change in the value of an investment, assuming reinvestment of distributions from dividend income and capital gains (the profits earned upon the sale of securities that have grown in value, if any) and assuming a constant rate of performance each year. During periods of reimbursement by Fidelity, a fund’s total return will be greater than it would be had the reimbursement not occurred. Performance numbers are net of all underlying fund operating expenses, but do not include any insurance charges imposed by your insurance company’s separate account. If performance information included the effect of these additional charges, the total returns would have been lower. How a fund did yesterday is no guarantee of how it will do tomorrow.
Average Annual Total Returns
| For the periods ended December 31, 2019 | Past 1 year | Past 5 years | Past 10 years |
| Initial Class | 10.08% | (2.95)% | 1.11% |
| Service Class 2 | 9.82% | (3.20)% | 0.86% |
| Investor Class | 9.98% | (3.03)% | 1.02% |
$10,000 Over 10 Years
Let's say hypothetically that $10,000 was invested in VIP Energy Portfolio - Initial Class on December 31, 2009.
The chart shows how the value of your investment would have changed, and also shows how the S&P 500® Index performed over the same period.
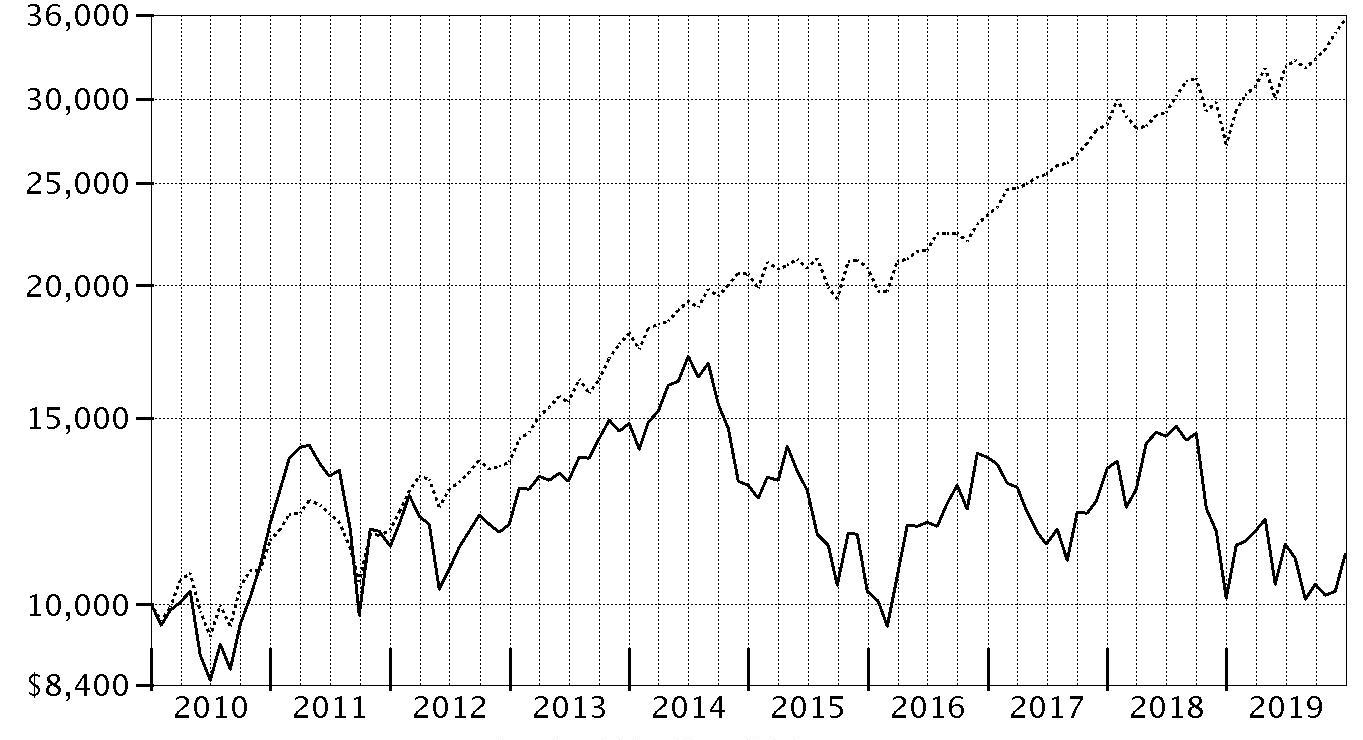
| Period Ending Values |
| $11,163 | VIP Energy Portfolio - Initial Class |
| $35,666 | S&P 500® Index |
Management's Discussion of Fund Performance
Market Recap: U.S. stocks continued to roll in 2019, with the S&P 500
® index soaring 31.49% and marking history as the longest and strongest bull market ever, despite persistent, nagging concerns about global economic growth and trade. After a rough end to 2018, equities sharply reversed course to begin the new year amid upbeat company earnings and signs the Federal Reserve may pause on rates. The uptrend continued until May, when the index sunk as trade negotiations between the U.S. and China broke down. The bull market roared back to record a series of highs in July, when the Fed cut interest rates for the first time since 2008. Volatility intensified in August, as the Treasury yield curve inverted, which some investors viewed as a sign the U.S. economy could be heading for recession. But the market proved resilient, hitting a new high on October 30, when the Fed lowered rates for the third time in 2019, and moving even higher through year-end. Gains were robust and broad-based, with information technology (+50%) leading the way with its best calendar-year result in a decade, amid strong growth trends. Communication services (+33%) and financials (+32%) also stood out. In contrast, energy (+12%) was by far the weakest group – struggling amid sluggish oil prices – while several strong gainers nonetheless fell short of the broader market: industrials and real estate (+29% each), consumer discretionary and consumer staples (+28% each), utilities (+26%), materials (+25%), and health care (+21%).
Comments from Portfolio Manager Maurice FitzMaurice: For the year, the fund's share classes gained about 10%, roughly in line with the MSCI U.S. IMI Energy 25/50 Index but well behind the broad-market S&P 500
®. Versus the sector index, security selection was the biggest contributor to the fund's performance, especially in the oil & gas exploration & production (E&P) industry. Favorable positioning in the oil & gas refining & marketing and integrated oil & gas segments also added notable value the past year. The fund's largest individual relative contributor by far was refining & marketing company Valero Energy (+30%), a large overweight position. Valero's stock price was supported by the company's better-than-expected quarterly earnings growth, reported throughout the period. In the E&P industry, a non-index stake in Parex Resources (+55%) and an overweighting in Hess (+68%), were notable contributors in 2019. In the integrated oil & gas segment, underweighting both Occidental Petroleum (-28%) and Exxon Mobil (+7%) helped, as each stock lagged the sector benchmark. Conversely, unfavorable stock choices and an underweighted stake in the strong-performing oil & gas storage & transportation group held back the fund's relative result. Here, not owning strong-performing index constituents Kinder Morgan (+44%) and ONEOK (+48%) hurt the portfolio's relative performance; both stocks were the largest individual relative detractors this period. Lastly, positioning among oil & gas equipment & services firms also detracted, as several names we overweighted performed poorly, including subsea oilfield services provider Forum Energy Technologies (-59%) and energy technology solutions company Rignet (-33%).
The views expressed above reflect those of the portfolio manager(s) only through the end of the period as stated on the cover of this report and do not necessarily represent the views of Fidelity or any other person in the Fidelity organization. Any such views are subject to change at any time based upon market or other conditions and Fidelity disclaims any responsibility to update such views. These views may not be relied on as investment advice and, because investment decisions for a Fidelity fund are based on numerous factors, may not be relied on as an indication of trading intent on behalf of any Fidelity fund.
Investment Summary (Unaudited)
Top Ten Stocks as of December 31, 2019
| | % of fund's net assets |
| Chevron Corp. | 15.9 |
| Exxon Mobil Corp. | 10.1 |
| Valero Energy Corp. | 7.3 |
| Pioneer Natural Resources Co. | 5.9 |
| ConocoPhillips Co. | 4.9 |
| EOG Resources, Inc. | 4.3 |
| Phillips 66 Co. | 4.2 |
| Noble Energy, Inc. | 3.5 |
| Marathon Petroleum Corp. | 3.5 |
| Diamondback Energy, Inc. | 3.3 |
| | 62.9 |
Top Industries (% of fund's net assets)
| As of December 31, 2019 |
| | Oil, Gas & Consumable Fuels | 91.9% |
| | Energy Equipment & Services | 6.3% |
| | Chemicals | 0.1% |
| | All Others* | 1.7% |

* Includes short-term investments and net other assets (liabilities).
Schedule of Investments December 31, 2019
Showing Percentage of Net Assets
| Common Stocks - 98.3% | | | |
| | | Shares | Value |
| Chemicals - 0.1% | | | |
| Commodity Chemicals - 0.1% | | | |
| LG Chemical Ltd. | | 787 | $216,220 |
| Electrical Equipment - 0.0% | | | |
| Electrical Components & Equipment - 0.0% | | | |
| Vivint Solar, Inc. (a) | | 800 | 5,808 |
| Energy Equipment & Services - 6.3% | | | |
| Oil & Gas Drilling - 0.6% | | | |
| AKITA Drilling Ltd. Class A (non-vtg.) | | 36,085 | 33,069 |
| Odfjell Drilling Ltd. (a) | | 118,850 | 442,948 |
| Patterson-UTI Energy, Inc. | | 29,200 | 306,600 |
| Shelf Drilling Ltd. (a)(b) | | 179,333 | 363,597 |
| | | | 1,146,214 |
| Oil & Gas Equipment & Services - 5.7% | | | |
| Baker Hughes, A GE Co. Class A | | 152,000 | 3,895,760 |
| DMC Global, Inc. (c) | | 4,000 | 179,760 |
| Forum Energy Technologies, Inc. (a) | | 104,600 | 175,728 |
| Halliburton Co. | | 38,800 | 949,436 |
| RigNet, Inc. (a) | | 93,800 | 619,080 |
| Schlumberger Ltd. | | 83,809 | 3,369,122 |
| Solaris Oilfield Infrastructure, Inc. Class A | | 99,600 | 1,394,400 |
| Tenaris SA sponsored ADR | | 23,000 | 520,720 |
| | | | 11,104,006 |
|
| TOTAL ENERGY EQUIPMENT & SERVICES | | | 12,250,220 |
|
| Oil, Gas & Consumable Fuels - 91.9% | | | |
| Coal & Consumable Fuels - 0.2% | | | |
| Arch Coal, Inc. (c) | | 2,300 | 165,002 |
| Peabody Energy Corp. | | 15,200 | 138,624 |
| | | | 303,626 |
| Integrated Oil & Gas - 29.9% | | | |
| Chevron Corp. | | 258,831 | 31,191,723 |
| Eni SpA | | 12,000 | 186,375 |
| Exxon Mobil Corp. | | 284,648 | 19,862,737 |
| Occidental Petroleum Corp. | | 87,700 | 3,614,117 |
| Suncor Energy, Inc. | | 71,700 | 2,349,969 |
| Total SA sponsored ADR | | 27,700 | 1,531,810 |
| | | | 58,736,731 |
| Oil & Gas Exploration & Production - 39.5% | | | |
| Black Stone Minerals LP | | 13,700 | 174,264 |
| Brigham Minerals, Inc. Class A | | 21,300 | 456,672 |
| Cabot Oil & Gas Corp. | | 91,800 | 1,598,238 |
| Canadian Natural Resources Ltd. | | 75,400 | 2,438,720 |
| Cimarex Energy Co. | | 47,700 | 2,503,773 |
| ConocoPhillips Co. | | 146,700 | 9,539,901 |
| Devon Energy Corp. | | 136,100 | 3,534,517 |
| Diamondback Energy, Inc. | | 69,699 | 6,472,249 |
| Encana Corp. (Toronto) | | 261,319 | 1,223,534 |
| EOG Resources, Inc. | | 99,842 | 8,362,766 |
| Hess Corp. | | 68,100 | 4,549,761 |
| Kosmos Energy Ltd. | | 281,200 | 1,602,840 |
| Lundin Petroleum AB | | 47,500 | 1,614,209 |
| Magnolia Oil & Gas Corp. Class A (a)(c) | | 206,100 | 2,592,738 |
| National Energy Services Reunited Corp. (a) | | 2,800 | 25,536 |
| Noble Energy, Inc. | | 278,800 | 6,925,392 |
| Northern Oil & Gas, Inc. (a)(c) | | 646,500 | 1,512,810 |
| Parex Resources, Inc. (a) | | 171,300 | 3,185,780 |
| Parsley Energy, Inc. Class A | | 169,430 | 3,203,921 |
| PDC Energy, Inc. (a) | | 93,434 | 2,445,168 |
| Pioneer Natural Resources Co. | | 76,065 | 11,513,959 |
| Texas Pacific Land Trust | | 200 | 156,244 |
| Viper Energy Partners LP | | 84,600 | 2,086,236 |
| | | | 77,719,228 |
| Oil & Gas Refining & Marketing - 17.3% | | | |
| Delek U.S. Holdings, Inc. (c) | | 36,077 | 1,209,662 |
| HollyFrontier Corp. | | 3,300 | 167,343 |
| Marathon Petroleum Corp. | | 114,536 | 6,900,794 |
| Par Pacific Holdings, Inc. (a)(c) | | 77,900 | 1,810,396 |
| Phillips 66 Co. | | 73,662 | 8,206,683 |
| Reliance Industries Ltd. | | 58,658 | 1,244,638 |
| Valero Energy Corp. | | 152,500 | 14,281,625 |
| World Fuel Services Corp. | | 4,900 | 212,758 |
| | | | 34,033,899 |
| Oil & Gas Storage & Transport - 5.0% | | | |
| Cheniere Energy, Inc. (a) | | 67,400 | 4,116,118 |
| Delek Logistics Partners LP | | 6,100 | 194,956 |
| Enterprise Products Partners LP | | 68,200 | 1,920,512 |
| Noble Midstream Partners LP (d) | | 14,739 | 389,994 |
| Noble Midstream Partners LP (d) | | 69,330 | 1,749,335 |
| Scorpio Tankers, Inc. | | 11,900 | 468,146 |
| Teekay LNG Partners LP | | 63,400 | 986,504 |
| | | | 9,825,565 |
|
| TOTAL OIL, GAS & CONSUMABLE FUELS | | | 180,619,049 |
|
| TOTAL COMMON STOCKS | | | |
| (Cost $174,704,194) | | | 193,091,297 |
|
| Money Market Funds - 3.1% | | | |
| Fidelity Cash Central Fund 1.58% (e) | | 3,363,817 | 3,364,490 |
| Fidelity Securities Lending Cash Central Fund 1.58% (e)(f) | | 2,840,986 | 2,841,270 |
| TOTAL MONEY MARKET FUNDS | | | |
| (Cost $6,205,760) | | | 6,205,760 |
| TOTAL INVESTMENT IN SECURITIES - 101.4% | | | |
| (Cost $180,909,954) | | | 199,297,057 |
| NET OTHER ASSETS (LIABILITIES) - (1.4)% | | | (2,793,658) |
| NET ASSETS - 100% | | | $196,503,399 |
Legend
(a) Non-income producing
(b) Security exempt from registration under Rule 144A of the Securities Act of 1933. These securities may be resold in transactions exempt from registration, normally to qualified institutional buyers. At the end of the period, the value of these securities amounted to $363,597 or 0.2% of net assets.
(c) Security or a portion of the security is on loan at period end.
(d) Restricted securities - Investment in securities not registered under the Securities Act of 1933 (excluding 144A issues). At the end of the period, the value of restricted securities (excluding 144A issues) amounted to $2,139,329 or 1.1% of net assets.
(e) Affiliated fund that is generally available only to investment companies and other accounts managed by Fidelity Investments. The rate quoted is the annualized seven-day yield of the fund at period end. A complete unaudited listing of the fund's holdings as of its most recent quarter end is available upon request. In addition, each Fidelity Central Fund's financial statements, which are not covered by the Fund's Report of Independent Registered Public Accounting Firm, are available on the SEC's website or upon request.
(f) Investment made with cash collateral received from securities on loan.
Additional information on each restricted holding is as follows:
| Security | Acquisition Date | Acquisition Cost |
| Noble Midstream Partners LP | 6/21/17 - 11/15/19 | $2,031,324 |
Affiliated Central Funds
Information regarding fiscal year to date income earned by the Fund from investments in Fidelity Central Funds is as follows:
| Fund | Income earned |
| Fidelity Cash Central Fund | $34,968 |
| Fidelity Securities Lending Cash Central Fund | 6,869 |
| Total | $41,837 |
Amounts in the income column in the above table include any capital gain distributions from underlying funds, which are presented in the corresponding line-item in the Statement of Operations, if applicable. Amount for Fidelity Securities Lending Cash Central Fund represents the income earned on investing cash collateral, less rebates paid to borrowers and any lending agent fees associated with the loan, plus any premium payments received for lending certain types of securities.
Investment Valuation
The following is a summary of the inputs used, as of December 31, 2019, involving the Fund's assets and liabilities carried at fair value. The inputs or methodology used for valuing securities may not be an indication of the risk associated with investing in those securities. For more information on valuation inputs, and their aggregation into the levels used below, please refer to the Investment Valuation section in the accompanying Notes to Financial Statements.
| | Valuation Inputs at Reporting Date: |
| Description | Total | Level 1 | Level 2 | Level 3 |
| Investments in Securities: | | | | |
| Common Stocks | $193,091,297 | $191,155,587 | $1,935,710 | $-- |
| Money Market Funds | 6,205,760 | 6,205,760 | -- | -- |
| Total Investments in Securities: | $199,297,057 | $197,361,347 | $1,935,710 | $-- |
Other Information
Distribution of investments by country or territory of incorporation, as a percentage of Total Net Assets, is as follows (Unaudited):
| United States of America | 89.9% |
| Canada | 4.6% |
| Curacao | 1.7% |
| Others (Individually Less Than 1%) | 3.8% |
| | 100.0% |
See accompanying notes which are an integral part of the financial statements.
Financial Statements
Statement of Assets and Liabilities
| | | December 31, 2019 |
| Assets | | |
Investment in securities, at value (including securities loaned of $2,729,384) — See accompanying schedule:
Unaffiliated issuers (cost $174,704,194) | $193,091,297 | |
| Fidelity Central Funds (cost $6,205,760) | 6,205,760 | |
| Total Investment in Securities (cost $180,909,954) | | $199,297,057 |
| Foreign currency held at value (cost $36) | | 36 |
| Receivable for investments sold | | 4,744 |
| Receivable for fund shares sold | | 110,498 |
| Dividends receivable | | 175,304 |
| Distributions receivable from Fidelity Central Funds | | 2,860 |
| Prepaid expenses | | 2,011 |
| Other receivables | | 14,772 |
| Total assets | | 199,607,282 |
| Liabilities | | |
| Payable to custodian bank | $4,744 | |
| Payable for fund shares redeemed | 52,728 | |
| Accrued management fee | 84,464 | |
| Distribution and service plan fees payable | 18,170 | |
| Other affiliated payables | 21,506 | |
| Other payables and accrued expenses | 82,831 | |
| Collateral on securities loaned | 2,839,440 | |
| Total liabilities | | 3,103,883 |
| Net Assets | | $196,503,399 |
| Net Assets consist of: | | |
| Paid in capital | | $259,465,611 |
| Total accumulated earnings (loss) | | (62,962,212) |
| Net Assets | | $196,503,399 |
| Net Asset Value and Maximum Offering Price | | |
| Initial Class: | | |
| Net Asset Value, offering price and redemption price per share ($27,956,526 ÷ 1,757,458 shares) | | $15.91 |
| Service Class 2: | | |
| Net Asset Value, offering price and redemption price per share ($90,208,099 ÷ 5,694,923 shares) | | $15.84 |
| Investor Class: | | |
| Net Asset Value, offering price and redemption price per share ($78,338,774 ÷ 4,932,952 shares) | | $15.88 |
See accompanying notes which are an integral part of the financial statements.
Statement of Operations
| | | Year ended December 31, 2019 |
| Investment Income | | |
| Dividends | | $5,286,557 |
| Income from Fidelity Central Funds (including $6,869 from security lending) | | 41,837 |
| Total income | | 5,328,394 |
| Expenses | | |
| Management fee | $1,146,203 | |
| Transfer agent fees | 209,357 | |
| Distribution and service plan fees | 235,462 | |
| Accounting and security lending fees | 83,265 | |
| Custodian fees and expenses | 14,794 | |
| Independent trustees' fees and expenses | 1,199 | |
| Audit | 48,350 | |
| Legal | 889 | |
| Miscellaneous | 1,814 | |
| Total expenses before reductions | 1,741,333 | |
| Expense reductions | (17,697) | |
| Total expenses after reductions | | 1,723,636 |
| Net investment income (loss) | | 3,604,758 |
| Realized and Unrealized Gain (Loss) | | |
| Net realized gain (loss) on: | | |
| Investment securities: | | |
| Unaffiliated issuers (net of foreign taxes of $9,307) | (20,047,746) | |
| Fidelity Central Funds | 46 | |
| Foreign currency transactions | (6,683) | |
| Total net realized gain (loss) | | (20,054,383) |
| Change in net unrealized appreciation (depreciation) on: | | |
| Investment securities: | | |
| Unaffiliated issuers (net of increase in deferred foreign taxes of $39,068) | 36,738,376 | |
| Fidelity Central Funds | (24) | |
| Assets and liabilities in foreign currencies | 2,036 | |
| Total change in net unrealized appreciation (depreciation) | | 36,740,388 |
| Net gain (loss) | | 16,686,005 |
| Net increase (decrease) in net assets resulting from operations | | $20,290,763 |
See accompanying notes which are an integral part of the financial statements.
Statement of Changes in Net Assets
| | Year ended December 31, 2019 | Year ended December 31, 2018 |
| Increase (Decrease) in Net Assets | | |
| Operations | | |
| Net investment income (loss) | $3,604,758 | $2,862,088 |
| Net realized gain (loss) | (20,054,383) | (629,792) |
| Change in net unrealized appreciation (depreciation) | 36,740,388 | (72,786,556) |
| Net increase (decrease) in net assets resulting from operations | 20,290,763 | (70,554,260) |
| Distributions to shareholders | (4,068,736) | (2,587,589) |
| Share transactions - net increase (decrease) | (30,747,123) | (8,755,164) |
| Total increase (decrease) in net assets | (14,525,096) | (81,897,013) |
| Net Assets | | |
| Beginning of period | 211,028,495 | 292,925,508 |
| End of period | $196,503,399 | $211,028,495 |
See accompanying notes which are an integral part of the financial statements.
Financial Highlights
VIP Energy Portfolio Initial Class
| Years ended December 31, | 2019 | 2018 | 2017 | 2016 | 2015 |
| Selected Per–Share Data | | | | | |
| Net asset value, beginning of period | $14.78 | $19.86 | $20.72 | $15.57 | $20.45 |
| Income from Investment Operations | | | | | |
| Net investment income (loss)A | .29 | .22 | .32B | .13 | .24 |
| Net realized and unrealized gain (loss) | 1.18 | (5.09) | (.85) | 5.14 | (4.30) |
| Total from investment operations | 1.47 | (4.87) | (.53) | 5.27 | (4.06) |
| Distributions from net investment income | (.33) | (.19) | (.32) | (.12) | (.23) |
| Distributions from net realized gain | (.01) | (.02) | (.01) | – | (.60) |
| Total distributions | (.34) | (.21) | (.33) | (.12) | (.83) |
| Redemption fees added to paid in capitalA | – | – | –C | –C | .01 |
| Net asset value, end of period | $15.91 | $14.78 | $19.86 | $20.72 | $15.57 |
| Total ReturnD,E | 10.08% | (24.58)% | (2.47)% | 33.84% | (20.54)% |
| Ratios to Average Net AssetsF,G | | | | | |
| Expenses before reductions | .67% | .67% | .69% | .68% | .68% |
| Expenses net of fee waivers, if any | .67% | .67% | .68% | .68% | .68% |
| Expenses net of all reductions | .66% | .66% | .67% | .67% | .67% |
| Net investment income (loss) | 1.83% | 1.12% | 1.73%B | .71% | 1.25% |
| Supplemental Data | | | | | |
| Net assets, end of period (000 omitted) | $27,957 | $28,999 | $43,633 | $63,955 | $46,360 |
| Portfolio turnover rateH | 58% | 58% | 66% | 87% | 70% |
A Calculated based on average shares outstanding during the period.
B Net investment income per share reflects a large, non-recurring dividend which amounted to $.21 per share. Excluding this non-recurring dividend, the ratio of net investment income (loss) to average net assets would have been .62%.
C Amount represents less than $.005 per share.
D Total returns do not reflect charges attributable to your insurance company's separate account. Inclusion of these charges would reduce the total returns shown.
E Total returns would have been lower if certain expenses had not been reduced during the applicable periods shown.
F Fees and expenses of any underlying Fidelity Central Funds are not included in the Fund's expense ratio. The Fund indirectly bears its proportionate share of the expenses of any underlying Fidelity Central Funds.
G Expense ratios reflect operating expenses of the class. Expenses before reductions do not reflect amounts reimbursed by the investment adviser or reductions from brokerage service arrangements or reductions from other expense offset arrangements and do not represent the amount paid by the class during periods when reimbursements or reductions occur. Expenses net of fee waivers reflect expenses after reimbursement by the investment adviser but prior to reductions from brokerage service arrangements or other expense offset arrangements. Expenses net of all reductions represent the net expenses paid by the class.
H Amount does not include the portfolio activity of any underlying Fidelity Central Funds.
See accompanying notes which are an integral part of the financial statements.
VIP Energy Portfolio Service Class 2
| Years ended December 31, | 2019 | 2018 | 2017 | 2016 | 2015 |
| Selected Per–Share Data | | | | | |
| Net asset value, beginning of period | $14.71 | $19.75 | $20.62 | $15.51 | $20.37 |
| Income from Investment Operations | | | | | |
| Net investment income (loss)A | .25 | .17 | .27B | .08 | .19 |
| Net realized and unrealized gain (loss) | 1.18 | (5.05) | (.86) | 5.12 | (4.28) |
| Total from investment operations | 1.43 | (4.88) | (.59) | 5.20 | (4.09) |
| Distributions from net investment income | (.29) | (.14) | (.27) | (.09) | (.18) |
| Distributions from net realized gain | (.01) | (.02) | (.01) | – | (.60) |
| Total distributions | (.30) | (.16) | (.28) | (.09) | (.78) |
| Redemption fees added to paid in capitalA | – | – | –C | –C | .01 |
| Net asset value, end of period | $15.84 | $14.71 | $19.75 | $20.62 | $15.51 |
| Total ReturnD,E | 9.82% | (24.77)% | (2.78)% | 33.51% | (20.75)% |
| Ratios to Average Net AssetsF,G | | | | | |
| Expenses before reductions | .92% | .92% | .94% | .93% | .93% |
| Expenses net of fee waivers, if any | .92% | .92% | .93% | .93% | .93% |
| Expenses net of all reductions | .91% | .91% | .93% | .92% | .92% |
| Net investment income (loss) | 1.58% | .88% | 1.48%B | .47% | 1.00% |
| Supplemental Data | | | | | |
| Net assets, end of period (000 omitted) | $90,208 | $90,093 | $128,346 | $150,744 | $97,286 |
| Portfolio turnover rateH | 58% | 58% | 66% | 87% | 70% |
A Calculated based on average shares outstanding during the period.
B Net investment income per share reflects a large, non-recurring dividend which amounted to $.20 per share. Excluding this non-recurring dividend, the ratio of net investment income (loss) to average net assets would have been .37%.
C Amount represents less than $.005 per share.
D Total returns do not reflect charges attributable to your insurance company's separate account. Inclusion of these charges would reduce the total returns shown.
E Total returns would have been lower if certain expenses had not been reduced during the applicable periods shown.
F Fees and expenses of any underlying Fidelity Central Funds are not included in the Fund's expense ratio. The Fund indirectly bears its proportionate share of the expenses of any underlying Fidelity Central Funds.
G Expense ratios reflect operating expenses of the class. Expenses before reductions do not reflect amounts reimbursed by the investment adviser or reductions from brokerage service arrangements or reductions from other expense offset arrangements and do not represent the amount paid by the class during periods when reimbursements or reductions occur. Expenses net of fee waivers reflect expenses after reimbursement by the investment adviser but prior to reductions from brokerage service arrangements or other expense offset arrangements. Expenses net of all reductions represent the net expenses paid by the class.
H Amount does not include the portfolio activity of any underlying Fidelity Central Funds.
See accompanying notes which are an integral part of the financial statements.
VIP Energy Portfolio Investor Class
| Years ended December 31, | 2019 | 2018 | 2017 | 2016 | 2015 |
| Selected Per–Share Data | | | | | |
| Net asset value, beginning of period | $14.75 | $19.82 | $20.68 | $15.55 | $20.42 |
| Income from Investment Operations | | | | | |
| Net investment income (loss)A | .28 | .21 | .30B | .11 | .22 |
| Net realized and unrealized gain (loss) | 1.18 | (5.09) | (.85) | 5.13 | (4.29) |
| Total from investment operations | 1.46 | (4.88) | (.55) | 5.24 | (4.07) |
| Distributions from net investment income | (.32) | (.17) | (.30) | (.11) | (.22) |
| Distributions from net realized gain | (.01) | (.02) | (.01) | – | (.60) |
| Total distributions | (.33) | (.19) | (.31) | (.11) | (.81)C |
| Redemption fees added to paid in capitalA | – | – | –D | –D | .01 |
| Net asset value, end of period | $15.88 | $14.75 | $19.82 | $20.68 | $15.55 |
| Total ReturnE,F | 9.98% | (24.65)% | (2.57)% | 33.70% | (20.58)% |
| Ratios to Average Net AssetsG,H | | | | | |
| Expenses before reductions | .75% | .75% | .77% | .76% | .76% |
| Expenses net of fee waivers, if any | .75% | .75% | .77% | .76% | .76% |
| Expenses net of all reductions | .74% | .74% | .76% | .75% | .75% |
| Net investment income (loss) | 1.75% | 1.05% | 1.65%B | .63% | 1.17% |
| Supplemental Data | | | | | |
| Net assets, end of period (000 omitted) | $78,339 | $91,936 | $120,946 | $162,235 | $98,909 |
| Portfolio turnover rateI | 58% | 58% | 66% | 87% | 70% |
A Calculated based on average shares outstanding during the period.
B Net investment income per share reflects a large, non-recurring dividend which amounted to $.20 per share. Excluding this non-recurring dividend, the ratio of net investment income (loss) to average net assets would have been .54%.
C Total distributions of $.81 per share is comprised of distributions from net investment income of $.215 and distributions from net realized gain of $.599 per share.
D Amount represents less than $.005 per share.
E Total returns do not reflect charges attributable to your insurance company's separate account. Inclusion of these charges would reduce the total returns shown.
F Total returns would have been lower if certain expenses had not been reduced during the applicable periods shown.
G Fees and expenses of any underlying Fidelity Central Funds are not included in the Fund's expense ratio. The Fund indirectly bears its proportionate share of the expenses of any underlying Fidelity Central Funds.
H Expense ratios reflect operating expenses of the class. Expenses before reductions do not reflect amounts reimbursed by the investment adviser or reductions from brokerage service arrangements or reductions from other expense offset arrangements and do not represent the amount paid by the class during periods when reimbursements or reductions occur. Expenses net of fee waivers reflect expenses after reimbursement by the investment adviser but prior to reductions from brokerage service arrangements or other expense offset arrangements. Expenses net of all reductions represent the net expenses paid by the class.
I Amount does not include the portfolio activity of any underlying Fidelity Central Funds.
See accompanying notes which are an integral part of the financial statements.
Notes to Financial Statements
For the period ended December 31, 2019
1. Organization.
VIP Energy Portfolio (the Fund) is a non-diversified fund of Variable Insurance Products Fund IV (the Trust) and is authorized to issue an unlimited number of shares. The Trust is registered under the Investment Company Act of 1940, as amended (the 1940 Act), as an open-end management investment company organized as a Massachusetts business trust. Shares of the Fund may only be purchased by insurance companies for the purpose of funding variable annuity or variable life insurance contracts. The Fund offers the following classes of shares: Initial Class shares, Service Class 2 shares and Investor Class shares.
2. Investments in Fidelity Central Funds.
The Fund invests in Fidelity Central Funds, which are open-end investment companies generally available only to other investment companies and accounts managed by the investment adviser and its affiliates. The Fund's Schedule of Investments lists each of the Fidelity Central Funds held as of period end, if any, as an investment of the Fund, but does not include the underlying holdings of each Fidelity Central Fund. As an Investing Fund, the Fund indirectly bears its proportionate share of the expenses of the underlying Fidelity Central Funds.
The Money Market Central Funds seek preservation of capital and current income and are managed by Fidelity Investments Money Management, Inc. (FIMM), an affiliate of the investment adviser. Annualized expenses of the Money Market Central Funds as of their most recent shareholder report date ranged from less than .005% to .01%.
A complete unaudited list of holdings for each Fidelity Central Fund is available upon request or at the Securities and Exchange Commission (the SEC) website at www.sec.gov. In addition, the financial statements of the Fidelity Central Funds, which are not covered by the Fund's Report of Independent Registered Public Accounting Firm, are available on the SEC website or upon request.
3. Significant Accounting Policies.
The Fund is an investment company and applies the accounting and reporting guidance of the Financial Accounting Standards Board (FASB) Accounting Standards Codification Topic 946 Financial Services – Investments Companies. The financial statements have been prepared in conformity with accounting principles generally accepted in the United States of America (GAAP), which require management to make certain estimates and assumptions at the date of the financial statements. Actual results could differ from those estimates. Subsequent events, if any, through the date that the financial statements were issued have been evaluated in the preparation of the financial statements. The following summarizes the significant accounting policies of the Fund:
Investment Valuation. Investments are valued as of 4:00 p.m. Eastern time on the last calendar day of the period. The Board of Trustees (the Board) has delegated the day to day responsibility for the valuation of the Fund's investments to the Fair Value Committee (the Committee) established by the Fund's investment adviser. In accordance with valuation policies and procedures approved by the Board, the Fund attempts to obtain prices from one or more third party pricing vendors or brokers to value its investments. When current market prices, quotations or currency exchange rates are not readily available or reliable, investments will be fair valued in good faith by the Committee, in accordance with procedures adopted by the Board. Factors used in determining fair value vary by investment type and may include market or investment specific events. The frequency with which these procedures are used cannot be predicted and they may be utilized to a significant extent. The Committee oversees the Fund's valuation policies and procedures and reports to the Board on the Committee's activities and fair value determinations. The Board monitors the appropriateness of the procedures used in valuing the Fund's investments and ratifies the fair value determinations of the Committee.
The Fund categorizes the inputs to valuation techniques used to value its investments into a disclosure hierarchy consisting of three levels as shown below:
- Level 1 – quoted prices in active markets for identical investments
- Level 2 – other significant observable inputs (including quoted prices for similar investments, interest rates, prepayment speeds, etc.)
- Level 3 – unobservable inputs (including the Fund's own assumptions based on the best information available)
Valuation techniques used to value the Fund's investments by major category are as follows:
Equity securities, including restricted securities, for which market quotations are readily available, are valued at the last reported sale price or official closing price as reported by a third party pricing vendor on the primary market or exchange on which they are traded and are categorized as Level 1 in the hierarchy. In the event there were no sales during the day or closing prices are not available, securities are valued at the last quoted bid price or may be valued using the last available price and are generally categorized as Level 2 in the hierarchy. For foreign equity securities, when market or security specific events arise, comparisons to the valuation of American Depositary Receipts (ADRs), futures contracts, Exchange-Traded Funds (ETFs) and certain indexes as well as quoted prices for similar securities may be used and would be categorized as Level 2 in the hierarchy. For equity securities, including restricted securities, where observable inputs are limited, assumptions about market activity and risk are used and these securities may be categorized as Level 3 in the hierarchy.
Investments in open-end mutual funds, including the Fidelity Central Funds, are valued at their closing net asset value (NAV) each business day and are categorized as Level 1 in the hierarchy.
Changes in valuation techniques may result in transfers in or out of an assigned level within the disclosure hierarchy.
Foreign Currency. The Fund may use foreign currency contracts to facilitate transactions in foreign-denominated securities. Gains and losses from these transactions may arise from changes in the value of the foreign currency or if the counterparties do not perform under the contracts' terms.
Foreign-denominated assets, including investment securities, and liabilities are translated into U.S. dollars at the exchange rates at period end. Purchases and sales of investment securities, income and dividends received and expenses denominated in foreign currencies are translated into U.S. dollars at the exchange rate in effect on the transaction date.
The effects of exchange rate fluctuations on investments are included with the net realized and unrealized gain (loss) on investment securities. Other foreign currency transactions resulting in realized and unrealized gain (loss) are disclosed separately.
Investment Transactions and Income. For financial reporting purposes, the Fund's investment holdings and NAV include trades executed through the end of the last business day of the period. The NAV per share for processing shareholder transactions is calculated as of the close of business of the New York Stock Exchange (NYSE), normally 4:00 p.m. Eastern time and includes trades executed through the end of the prior business day. Gains and losses on securities sold are determined on the basis of identified cost and include proceeds received from litigation. Dividend income is recorded on the ex-dividend date, except for certain dividends from foreign securities where the ex-dividend date may have passed, which are recorded as soon as the Fund is informed of the ex-dividend date. Non-cash dividends included in dividend income, if any, are recorded at the fair market value of the securities received. Income and capital gain distributions from Fidelity Central Funds, if any, are recorded on the ex-dividend date. Certain distributions received by the Fund represent a return of capital or capital gain. The Fund determines the components of these distributions subsequent to the ex-dividend date, based upon receipt of tax filings or other correspondence relating to the underlying investment. These distributions are recorded as a reduction of cost of investments and/or as a realized gain. Investment income is recorded net of foreign taxes withheld where recovery of such taxes is uncertain.
Class Allocations and Expenses. Investment income, realized and unrealized capital gains and losses, common expenses of the Fund, and certain fund-level expense reductions, if any, are allocated daily on a pro-rata basis to each class based on the relative net assets of each class to the total net assets of the Fund. Each class differs with respect to transfer agent and distribution and service plan fees incurred. Certain expense reductions may also differ by class. For the reporting period, the allocated portion of income and expenses to each class as a percent of its average net assets may vary due to the timing of recording these transactions in relation to fluctuating net assets of the classes. Expenses directly attributable to a fund are charged to that fund. Expenses attributable to more than one fund are allocated among the respective funds on the basis of relative net assets or other appropriate methods. Expense estimates are accrued in the period to which they relate and adjustments are made when actual amounts are known.
Income Tax Information and Distributions to Shareholders. Each year, the Fund intends to qualify as a regulated investment company under Subchapter M of the Internal Revenue Code, including distributing substantially all of its taxable income and realized gains. As a result, no provision for U.S. Federal income taxes is required. As of December 31, 2019, the Fund did not have any unrecognized tax benefits in the financial statements; nor is the Fund aware of any tax positions for which it is reasonably possible that the total amounts of unrecognized tax benefits will significantly change in the next twelve months. The Fund files a U.S. federal tax return, in addition to state and local tax returns as required. The Fund's federal income tax returns are subject to examination by the Internal Revenue Service (IRS) for a period of three fiscal years after they are filed. State and local tax returns may be subject to examination for an additional fiscal year depending on the jurisdiction. Foreign taxes are provided for based on the Fund's understanding of the tax rules and rates that exist in the foreign markets in which it invests. The Fund is subject to a tax imposed on capital gains by certain countries in which it invests. An estimated deferred tax liability for net unrealized appreciation on the applicable securities is included in Other payables and accrued expenses on the Statement of Assets & Liabilities.
Distributions are declared and recorded on the ex-dividend date. Income and capital gain distributions are declared separately for each class. Income and capital gain distributions are determined in accordance with income tax regulations, which may differ from GAAP.
Capital accounts within the financial statements are adjusted for permanent book-tax differences. These adjustments have no impact on net assets or the results of operations. Capital accounts are not adjusted for temporary book-tax differences which will reverse in a subsequent period.
Book-tax differences are primarily due to foreign currency transactions, certain foreign taxes, partnerships, capital loss carryforwards and losses deferred due to wash sales.
As of period end, the cost and unrealized appreciation (depreciation) in securities, and derivatives if applicable, for federal income tax purposes were as follows:
| Gross unrealized appreciation | $27,400,398 |
| Gross unrealized depreciation | (10,054,375) |
| Net unrealized appreciation (depreciation) | $17,346,023 |
| Tax Cost | $181,951,034 |
The tax-based components of distributable earnings as of period end were as follows:
| Undistributed ordinary income | $645,870 |
| Capital loss carryforward | $(79,872,735) |
| Net unrealized appreciation (depreciation) on securities and other investments | $16,305,399 |
Capital loss carryforwards are only available to offset future capital gains of the Fund to the extent provided by regulations and may be limited. The capital loss carryforward information presented below, including any applicable limitation, is estimated as of fiscal period end and is subject to adjustment.
| No expiration | |
| Short-term | $(49,750,704) |
| Long-term | (30,122,031) |
| Total capital loss carryforward | $(78,872,735) |
The tax character of distributions paid was as follows:
| | December 31, 2019 | December 31, 2018 |
| Ordinary Income | $ 4,068,736 | $ 2,587,589 |
Restricted Securities. The Fund may invest in securities that are subject to legal or contractual restrictions on resale. These securities generally may be resold in transactions exempt from registration or to the public if the securities are registered. Disposal of these securities may involve time-consuming negotiations and expense, and prompt sale at an acceptable price may be difficult. Information regarding restricted securities is included at the end of the Fund's Schedule of Investments.
4. Purchases and Sales of Investments.
Purchases and sales of securities, other than short-term securities, aggregated $121,350,516 and $153,503,480, respectively.
5. Fees and Other Transactions with Affiliates.
Management Fee. Fidelity SelectCo, LLC (the investment adviser) and its affiliates provide the Fund with investment management related services for which the Fund pays a monthly management fee. The management fee is the sum of an individual fund fee rate that is based on an annual rate of .30% of the Fund's average net assets and an annualized group fee rate that averaged .24% during the period. The group fee rate is based upon the average net assets of all the mutual funds advised by Fidelity Management & Research Company (FMR) and the investment adviser. The group fee rate decreases as assets under management increase and increases as assets under management decrease. For the reporting period, the total annual management fee rate was .54% of the Fund's average net assets.
Distribution and Service Plan Fees. In accordance with Rule 12b-1 of the 1940 Act, the Fund has adopted a separate 12b-1 Plan for Service Class 2 shares. Service Class 2 pays Fidelity Distributors Corporation (FDC), an affiliate of the investment adviser, a service fee. For the period, the service fee is based on an annual rate of .25% of Service Class 2's average net assets.
For the period, total fees for Service Class 2, all of which was re-allowed to insurance companies for the distribution of shares and providing shareholder support services were $235,462.
Transfer Agent Fees. Fidelity Investments Institutional Operations Company, Inc. (FIIOC), an affiliate of the investment adviser, is the Fund's transfer, dividend disbursing, and shareholder servicing agent. FIIOC receives an asset-based fee with respect to each class. Each class pays a fee for transfer agent services, typesetting and printing and mailing of shareholder reports, excluding mailing of proxy statements, equal to an annual rate of class-level average net assets. The annual rate for Investor Class is .15% and the annual rate for all other classes is .07%. For the period, transfer agent fees for each class were as follows:
| Initial Class | $19,348 |
| Service Class 2 | 60,882 |
| Investor Class | 129,127 |
| | $209,357 |
Accounting and Security Lending Fees. Fidelity Service Company, Inc. (FSC), an affiliate of the investment adviser, maintains the Fund's accounting records. The accounting fee is based on the level of average net assets for each month. Prior to April 1, 2019, FSC had a separate agreement with the Fund for administration of the security lending program, based on the number and duration of lending transactions. For the period, the total fees paid for accounting and administration of securities lending were equivalent to the following annual rates:
| | % of Average Net Assets |
| VIP Energy Portfolio | .04 |
Brokerage Commissions. A portion of portfolio transactions were placed with brokerage firms which are affiliates of the investment adviser. Brokerage commissions are included in net realized gain (loss) and change in net unrealized appreciation (depreciation) in the Statement of Operations. The commissions paid to these affiliated firms were as follows:
| | Amount |
| VIP Energy Portfolio | $4,467 |
Interfund Trades. The Fund may purchase from or sell securities to other Fidelity Funds under procedures adopted by the Board. The procedures have been designed to ensure these interfund trades are executed in accordance with Rule 17a-7 of the 1940 Act. Interfund trades are included within the respective purchases and sales amounts shown in the Purchases and Sales of Investments note.
6. Committed Line of Credit.
The Fund participates with other funds managed by the investment adviser or an affiliate in a $4.25 billion credit facility (the "line of credit") to be utilized for temporary or emergency purposes to fund shareholder redemptions or for other short-term liquidity purposes. The Fund has agreed to pay commitment fees on its pro-rata portion of the line of credit, which amounted to $615 and is reflected in Miscellaneous expenses on the Statement of Operations. During the period, the Fund did not borrow on this line of credit.
7. Security Lending.
The Fund lends portfolio securities from time to time in order to earn additional income. For equity securities, lending agents are used, including National Financial Services (NFS), an affiliate of the Fund. Pursuant to a securities lending agreement, NFS will receive a fee, which is capped at 9.9% of daily lending revenue, for its services as lending agent. The Fund may lend securities to certain qualified borrowers. On the settlement date of the loan, the Fund receives collateral (in the form of U.S. Treasury obligations, letters of credit and/or cash) against the loaned securities and maintains collateral in an amount not less than 100% of the market value of the loaned securities during the period of the loan. The market value of the loaned securities is determined at the close of business of the Fund and any additional required collateral is delivered to the Fund on the next business day. The Fund or borrower may terminate the loan at any time, and if the borrower defaults on its obligation to return the securities loaned because of insolvency or other reasons, the Fund may apply collateral received from the borrower against the obligation. The Fund may experience delays and costs in recovering the securities loaned. Any cash collateral received is invested in the Fidelity Securities Lending Cash Central Fund. The value of loaned securities and cash collateral at period end are disclosed on the Fund's Statement of Assets and Liabilities. Total fees paid by the Fund to NFS amounted to $73. Security lending income represents the income earned on investing cash collateral, less rebates paid to borrowers and any lending agent fees associated with the loan, plus any premium payments received for lending certain types of securities. Security lending income is presented in the Statement of Operations as a component of income from Fidelity Central Funds.
8. Expense Reductions.
Commissions paid to certain brokers with whom the investment adviser, or its affiliates, places trades on behalf of the Fund include an amount in addition to trade execution, which may be rebated back to the Fund to offset certain expenses. This amount totaled $15,914 for the period.
In addition, during the period the investment adviser reimbursed and/or waived a portion of fund-level operating expenses in the amount of $1,783.
9. Distributions to Shareholders.
Distributions to shareholders of each class were as follows:
| | Year ended
December 31, 2019 | Year ended
December 31, 2018 |
| Distributions to shareholders | | |
| Initial Class | $615,349 | $415,166 |
| Service Class 2 | 1,731,676 | 975,446 |
| Investor Class | 1,721,711 | 1,196,977 |
| Total | $4,068,736 | $2,587,589 |
10. Share Transactions.
Transactions for each class of shares were as follows:
| | Shares | Shares | Dollars | Dollars |
| | Year ended December 31, 2019 | Year ended December 31, 2018 | Year ended December 31, 2019 | Year ended December 31, 2018 |
| Initial Class | | | | |
| Shares sold | 224,579 | 324,800 | $3,698,258 | $6,787,219 |
| Reinvestment of distributions | 40,439 | 26,589 | 615,349 | 415,166 |
| Shares redeemed | (469,907) | (586,486) | (7,503,160) | (11,645,264) |
| Net increase (decrease) | (204,889) | (235,097) | $(3,189,553) | $(4,442,879) |
| Service Class 2 | | | | |
| Shares sold | 455,009 | 786,615 | $7,287,623 | $15,562,471 |
| Reinvestment of distributions | 114,287 | 62,498 | 1,731,676 | 975,446 |
| Shares redeemed | (997,768) | (1,223,238) | (15,910,977) | (24,180,037) |
| Net increase (decrease) | (428,472) | (374,125) | $(6,891,678) | $(7,642,120) |
| Investor Class | | | | |
| Shares sold | 651,182 | 1,754,150 | $10,414,967 | $35,327,039 |
| Reinvestment of distributions | 113,196 | 76,937 | 1,721,711 | 1,196,977 |
| Shares redeemed | (2,064,486) | (1,701,620) | (32,802,570) | (33,194,181) |
| Net increase (decrease) | (1,300,108) | 129,467 | $(20,665,892) | $3,329,835 |
11. Other.
The Fund's organizational documents provide former and current trustees and officers with a limited indemnification against liabilities arising in connection with the performance of their duties to the Fund. In the normal course of business, the Fund may also enter into contracts that provide general indemnifications. The Fund's maximum exposure under these arrangements is unknown as this would be dependent on future claims that may be made against the Fund. The risk of material loss from such claims is considered remote.
At the end of the period, the investment adviser or its affiliates were the owners of record of 54% of the total outstanding shares of the Fund and one otherwise unaffiliated shareholder was the owner of record of 40% of the total outstanding shares of the Fund.
Effective January 1, 2020, following any required regulatory notices and approvals:
Investment advisers Fidelity Investments Money Management, Inc., FMR Co., and Fidelity SelectCo, LLC, merged with and into Fidelity Management & Research Company. In connection with the merger transactions, the resulting, merged investment adviser was then redomiciled from Massachusetts to Delaware, changed its corporation to a limited liability company, and changed its name to "Fidelity Management & Research Company LLC".
Broker-dealer Fidelity Distributors Corporation merged with and into Fidelity Investments Institutional Services Company, Inc. ("FIISC"). FIISC was then redomiciled from Massachusetts to Delaware, changed its corporation structure from a corporation to a limited liability company, and changed its name to "Fidelity Distributors Company LLC".
Fidelity Investments Institutional Operations Company, Inc. (FIIOC)converted from a Massachusetts corporation to a Massachusetts LLC, and changed its name to Fidelity Investments Institutional Operations Company LLC".
Report of Independent Registered Public Accounting Firm
To the Board of Trustees of Variable Insurance Products Fund IV and Shareholders of VIP Energy Portfolio:
Opinion on the Financial Statements
We have audited the accompanying statement of assets and liabilities, including the schedule of investments, of VIP Energy Portfolio (one of the funds constituting Variable Insurance Products Fund IV, referred to hereafter as the “Fund”) as of December 31, 2019, the related statement of operations for the year ended December 31, 2019, the statement of changes in net assets for each of the two years in the period ended December 31, 2019, including the related notes, and the financial highlights for each of the five years in the period ended December 31, 2019 (collectively referred to as the “financial statements”). In our opinion, the financial statements present fairly, in all material respects, the financial position of the Fund as of December 31, 2019, the results of its operations for the year then ended, the changes in its net assets for each of the two years in the period ended December 31, 2019 and the financial highlights for each of the five years in the period ended December 31, 2019 in conformity with accounting principles generally accepted in the United States of America.
Basis for Opinion
These financial statements are the responsibility of the Fund’s management. Our responsibility is to express an opinion on the Fund’s financial statements based on our audits. We are a public accounting firm registered with the Public Company Accounting Oversight Board (United States) (PCAOB) and are required to be independent with respect to the Fund in accordance with the U.S. federal securities laws and the applicable rules and regulations of the Securities and Exchange Commission and the PCAOB.
We conducted our audits of these financial statements in accordance with the standards of the PCAOB. Those standards require that we plan and perform the audit to obtain reasonable assurance about whether the financial statements are free of material misstatement, whether due to error or fraud.
Our audits included performing procedures to assess the risks of material misstatement of the financial statements, whether due to error or fraud, and performing procedures that respond to those risks. Such procedures included examining, on a test basis, evidence regarding the amounts and disclosures in the financial statements. Our audits also included evaluating the accounting principles used and significant estimates made by management, as well as evaluating the overall presentation of the financial statements. Our procedures included confirmation of securities owned as of December 31, 2019 by correspondence with the custodian and issuers of privately offered securities. We believe that our audits provide a reasonable basis for our opinion.
PricewaterhouseCoopers LLP
Boston, Massachusetts
February 11, 2020
We have served as the auditor of one or more investment companies in the Fidelity group of funds since 1932.
Trustees and Officers
The Trustees, Members of the Advisory Board (if any), and officers of the trust fund, as applicable, are listed below. The Board of Trustees governs the fund and is responsible for protecting the interests of shareholders. The Trustees are experienced executives who meet periodically throughout the year to oversee the fund's activities, review contractual arrangements with companies that provide services to the fund, oversee management of the risks associated with such activities and contractual arrangements, and review the fund's performance. Except for Michael E. Wiley, each of the Trustees oversees 302 funds. Mr. Wiley oversees 199 funds.
The Trustees hold office without limit in time except that (a) any Trustee may resign; (b) any Trustee may be removed by written instrument, signed by at least two-thirds of the number of Trustees prior to such removal; (c) any Trustee who requests to be retired or who has become incapacitated by illness or injury may be retired by written instrument signed by a majority of the other Trustees; and (d) any Trustee may be removed at any special meeting of shareholders by a two-thirds vote of the outstanding voting securities of the trust. Each Trustee who is not an interested person (as defined in the Investment Company Act of 1940 (1940 Act)) of the trust and the fund is referred to herein as an Independent Trustee. Each Independent Trustee shall retire not later than the last day of the calendar year in which his or her 75th birthday occurs. The Independent Trustees may waive this mandatory retirement age policy with respect to individual Trustees. Officers and Advisory Board Members hold office without limit in time, except that any officer or Advisory Board Member may resign or may be removed by a vote of a majority of the Trustees at any regular meeting or any special meeting of the Trustees. Except as indicated, each individual has held the office shown or other offices in the same company for the past five years.
The fund’s Statement of Additional Information (SAI) includes more information about the Trustees. To request a free copy, call Fidelity at 1-877-208-0098.
Experience, Skills, Attributes, and Qualifications of the Trustees. The Governance and Nominating Committee has adopted a statement of policy that describes the experience, qualifications, attributes, and skills that are necessary and desirable for potential Independent Trustee candidates (Statement of Policy). The Board believes that each Trustee satisfied at the time he or she was initially elected or appointed a Trustee, and continues to satisfy, the standards contemplated by the Statement of Policy. The Governance and Nominating Committee also engages professional search firms to help identify potential Independent Trustee candidates who have the experience, qualifications, attributes, and skills consistent with the Statement of Policy. From time to time, additional criteria based on the composition and skills of the current Independent Trustees, as well as experience or skills that may be appropriate in light of future changes to board composition, business conditions, and regulatory or other developments, have also been considered by the professional search firms and the Governance and Nominating Committee. In addition, the Board takes into account the Trustees' commitment and participation in Board and committee meetings, as well as their leadership of standing and ad hoc committees throughout their tenure.
In determining that a particular Trustee was and continues to be qualified to serve as a Trustee, the Board has considered a variety of criteria, none of which, in isolation, was controlling. The Board believes that, collectively, the Trustees have balanced and diverse experience, qualifications, attributes, and skills, which allow the Board to operate effectively in governing the fund and protecting the interests of shareholders. Information about the specific experience, skills, attributes, and qualifications of each Trustee, which in each case led to the Board's conclusion that the Trustee should serve (or continue to serve) as a trustee of the fund, is provided below.
Board Structure and Oversight Function. James C. Curvey is an interested person and currently serves as Chairman. The Trustees have determined that an interested Chairman is appropriate and benefits shareholders because an interested Chairman has a personal and professional stake in the quality and continuity of services provided to the fund. Independent Trustees exercise their informed business judgment to appoint an individual of their choosing to serve as Chairman, regardless of whether the Trustee happens to be independent or a member of management. The Independent Trustees have determined that they can act independently and effectively without having an Independent Trustee serve as Chairman and that a key structural component for assuring that they are in a position to do so is for the Independent Trustees to constitute a substantial majority for the Board. The Independent Trustees also regularly meet in executive session. Ned C. Lautenbach serves as Chairman of the Independent Trustees and as such (i) acts as a liaison between the Independent Trustees and management with respect to matters important to the Independent Trustees and (ii) with management prepares agendas for Board meetings.
Fidelity® funds are overseen by different Boards of Trustees. The fund's Board oversees Fidelity's high income and certain equity funds, and other Boards oversee Fidelity's investment-grade bond, money market, asset allocation, and other equity funds. The asset allocation funds may invest in Fidelity® funds overseen by the fund's Board. The use of separate Boards, each with its own committee structure, allows the Trustees of each group of Fidelity® funds to focus on the unique issues of the funds they oversee, including common research, investment, and operational issues. On occasion, the separate Boards establish joint committees to address issues of overlapping consequences for the Fidelity® funds overseen by each Board.
The Trustees operate using a system of committees to facilitate the timely and efficient consideration of all matters of importance to the Trustees, the fund, and fund shareholders and to facilitate compliance with legal and regulatory requirements and oversight of the fund's activities and associated risks. The Board, acting through its committees, has charged FMR and its affiliates with (i) identifying events or circumstances the occurrence of which could have demonstrably adverse effects on the fund's business and/or reputation; (ii) implementing processes and controls to lessen the possibility that such events or circumstances occur or to mitigate the effects of such events or circumstances if they do occur; and (iii) creating and maintaining a system designed to evaluate continuously business and market conditions in order to facilitate the identification and implementation processes described in (i) and (ii) above. Because the day-to-day operations and activities of the fund are carried out by or through FMR, its affiliates, and other service providers, the fund's exposure to risks is mitigated but not eliminated by the processes overseen by the Trustees. While each of the Board's committees has responsibility for overseeing different aspects of the fund's activities, oversight is exercised primarily through the Operations, Audit, and Compliance Committees. Appropriate personnel, including but not limited to the fund's Chief Compliance Officer (CCO), FMR's internal auditor, the independent accountants, the fund's Treasurer and portfolio management personnel, make periodic reports to the Board's committees, as appropriate, including an annual review of Fidelity's risk management program for the Fidelity® funds. The responsibilities of each standing committee, including their oversight responsibilities, are described further under "Standing Committees of the Trustees."
Interested Trustees*:
Correspondence intended for a Trustee who is an interested person may be sent to Fidelity Investments, 245 Summer Street, Boston, Massachusetts 02210.
Name, Year of Birth; Principal Occupations and Other Relevant Experience+
James C. Curvey (1935)
Year of Election or Appointment: 2018
Trustee
Chairman of the Board of Trustees
Mr. Curvey also serves as Trustee of other Fidelity® funds. Mr. Curvey is Vice Chairman (2007-present) and Director of FMR LLC (diversified financial services company). In addition, Mr. Curvey is an Overseer Emeritus for the Boston Symphony Orchestra, a Director of Artis-Naples, and a Trustee of Brewster Academy in Wolfeboro, New Hampshire. Previously, Mr. Curvey served as a Director of Fidelity Research & Analysis Co. (investment adviser firm, 2009-2018), Director of Fidelity Investments Money Management, Inc. (investment adviser firm, 2009-2014) and a Director of FMR and FMR Co., Inc. (investment adviser firms, 2007-2014).
* Determined to be an “Interested Trustee” by virtue of, among other things, his or her affiliation with the trust or various entities under common control with FMR.
+ The information includes the Trustee's principal occupation during the last five years and other information relating to the experience, attributes, and skills relevant to the Trustee's qualifications to serve as a Trustee, which led to the conclusion that the Trustee should serve as a Trustee for the fund.
Independent Trustees:
Correspondence intended for an Independent Trustee may be sent to Fidelity Investments, P.O. Box 55235, Boston, Massachusetts 02205-5235.
Name, Year of Birth; Principal Occupations and Other Relevant Experience+
Dennis J. Dirks (1948)
Year of Election or Appointment: 2018
Trustee
Mr. Dirks also serves as Trustee of other Fidelity® funds. Prior to his retirement in May 2003, Mr. Dirks was Chief Operating Officer and a member of the Board of The Depository Trust & Clearing Corporation (DTCC). He also served as President, Chief Operating Officer, and Board member of The Depository Trust Company (DTC) and President and Board member of the National Securities Clearing Corporation (NSCC). In addition, Mr. Dirks served as Chief Executive Officer and Board member of the Government Securities Clearing Corporation, Chief Executive Officer and Board member of the Mortgage-Backed Securities Clearing Corporation, as a Trustee and a member of the Finance Committee of Manhattan College (2005-2008), as a Trustee and a member of the Finance Committee of AHRC of Nassau County (2006-2008), as a member of the Independent Directors Council (IDC) Governing Council (2010-2015), and as a member of the Board of Directors for The Brookville Center for Children’s Services, Inc. (2009-2017). Mr. Dirks is a member of the Finance Committee (2016-present) and Board of Directors (2017-present) and is Treasurer (2018-present) of the Asolo Repertory Theatre.
Donald F. Donahue (1950)
Year of Election or Appointment: 2018
Trustee
Mr. Donahue also serves as a Trustee of other Fidelity® funds. Mr. Donahue is President and Chief Executive Officer of Miranda Partners, LLC (risk consulting for the financial services industry, 2012-present). Previously, Mr. Donahue served as a Member of the Advisory Board of certain Fidelity® funds (2015-2018) and Chief Executive Officer (2006-2012), Chief Operating Officer (2003-2006), and Managing Director, Customer Marketing and Development (1999-2003) of The Depository Trust & Clearing Corporation (financial markets infrastructure). Mr. Donahue serves as a Member (2007-present) and Co-Chairman (2016-present) of the Board of Directors of United Way of New York, Member of the Board of Directors of NYC Leadership Academy (2012-present) and Member of the Board of Advisors of Ripple Labs, Inc. (financial services, 2015-present). He also served as Chairman (2010-2012) and Member of the Board of Directors (2012-2013) of Omgeo, LLC (financial services), Treasurer of United Way of New York (2012-2016), and Member of the Board of Directors of XBRL US (financial services non-profit, 2009-2012) and the International Securities Services Association (2009-2012).
Alan J. Lacy (1953)
Year of Election or Appointment: 2018
Trustee
Mr. Lacy also serves as Trustee of other Fidelity® funds. Mr. Lacy serves as a Director of Bristol-Myers Squibb Company (global pharmaceuticals, 2008-present). He is a Trustee of the California Chapter of The Nature Conservancy (2015-present) and a Director of the Center for Advanced Study in the Behavioral Sciences at Stanford University (2015-present). In addition, Mr. Lacy served as Senior Adviser (2007-2014) of Oak Hill Capital Partners, L.P. (private equity) and also served as Chief Executive Officer (2005) and Vice Chairman (2005-2006) of Sears Holdings Corporation (retail) and Chief Executive Officer and Chairman of the Board of Sears, Roebuck and Co. (retail, 2000-2005). Previously, Mr. Lacy served as Chairman (2014-2017) and a member (2010-2017) of the Board of Directors of Dave & Buster’s Entertainment, Inc. (restaurant and entertainment complexes), as Chairman (2008-2011) and a member (2006-2015) of the Board of Trustees of the National Parks Conservation Association, and as a member of the Board of Directors for The Hillman Companies, Inc. (hardware wholesalers, 2010-2014), Earth Fare, Inc. (retail grocery, 2010-2014), and The Western Union Company (global money transfer, 2006-2011).
Ned C. Lautenbach (1944)
Year of Election or Appointment: 2018
Trustee
Chairman of the Independent Trustees
Mr. Lautenbach also serves as Trustee of other Fidelity® funds. Mr. Lautenbach currently serves as Chair (2018-present) and Member (2013-present) of the Board of Governors, State University System of Florida and is a member of the Council on Foreign Relations (1994-present). He is also a member and has most recently served as Chairman of the Board of Directors of Artis-Naples (2012-present). Previously, Mr. Lautenbach served as a member and then Lead Director of the Board of Directors of Eaton Corporation (diversified industrial, 1997-2016). He was also a Partner and Advisory Partner at Clayton, Dubilier & Rice, LLC (private equity investment, 1998-2010), as well as a Director of Sony Corporation (2006-2007). In addition, Mr. Lautenbach also had a 30-year career with IBM (technology company) during which time he served as Senior Vice President and a member of the Corporate Executive Committee (1968-1998).
Joseph Mauriello (1944)
Year of Election or Appointment: 2018
Trustee
Mr. Mauriello also serves as Trustee of other Fidelity® funds. Prior to his retirement in January 2006, Mr. Mauriello served in numerous senior management positions including Deputy Chairman and Chief Operating Officer (2004-2005), and Vice Chairman of Financial Services (2002-2004) of KPMG LLP US (professional services, 1965-2005). Mr. Mauriello currently serves as a member of the Independent Directors Council (IDC) Governing Council (2015-present). Previously, Mr. Mauriello served as a member of the Board of Directors of XL Group plc. (global insurance and re-insurance, 2006-2018).
Cornelia M. Small (1944)
Year of Election or Appointment: 2018
Trustee
Ms. Small also serves as Trustee of other Fidelity® funds. Ms. Small is a member of the Board of Directors (2009-present) and Chair of the Investment Committee (2010-present) of the Teagle Foundation. Ms. Small also serves on the Investment Committee of the Berkshire Taconic Community Foundation (2008-present). Previously, Ms. Small served as Chairperson (2002-2008) and a member of the Investment Committee and Chairperson (2008-2012) and a member of the Board of Trustees of Smith College. In addition, Ms. Small served as Chief Investment Officer, Director of Global Equity Investments, and a member of the Board of Directors of Scudder, Stevens & Clark and Scudder Kemper Investments.
Garnett A. Smith (1947)
Year of Election or Appointment: 2013
Trustee
Mr. Smith also serves as Trustee of other Fidelity® funds. Prior to Mr. Smith's retirement, he served as Chairman and Chief Executive Officer of Inbrand Corp. (manufacturer of personal absorbent products, 1990-1997). He also served as President (1986-1990) of Inbrand Corp. Prior to his employment with Inbrand Corp., he was employed by a retail fabric chain and North Carolina National Bank. In addition, Mr. Smith served as a Member of the Advisory Board of certain Fidelity® funds (2012-2013) and as a board member of the Jackson Hole Land Trust (2009-2012).
David M. Thomas (1949)
Year of Election or Appointment: 2018
Trustee
Mr. Thomas also serves as Trustee of other Fidelity® funds. Mr. Thomas serves as Non-Executive Chairman of the Board of Directors of Fortune Brands Home and Security (home and security products, 2011-present) and as a member of the Board of Directors (2004-present) and Presiding Director (2013-present) of Interpublic Group of Companies, Inc. (marketing communication). Previously, Mr. Thomas served as Executive Chairman (2005-2006) and Chairman and Chief Executive Officer (2000-2005) of IMS Health, Inc. (pharmaceutical and healthcare information solutions), a Director of Fortune Brands, Inc. (consumer products, 2000-2011), and a member of the Board of Trustees of the University of Florida (2013-2018).
Michael E. Wiley (1950)
Year of Election or Appointment: 2008
Trustee
Mr. Wiley also serves as Trustee or Member of the Advisory Board of other Fidelity® funds. Mr. Wiley serves as a Director of High Point Resources (exploration and production, 2005-present). Previously, Mr. Wiley served as a Director of Andeavor Corporation (independent oil refiner and marketer, 2005-2018), a Director of Andeavor Logistics LP (natural resources logistics, 2015-2018), a Director of Post Oak Bank (privately-held bank, 2004-2018), a Director of Asia Pacific Exploration Consolidated (international oil and gas exploration and production, 2008-2013), a member of the Board of Trustees of the University of Tulsa (2000-2006; 2007-2010), a Senior Energy Advisor of Katzenbach Partners, LLC (consulting, 2006-2007), an Advisory Director of Riverstone Holdings (private investment), a Director of Spinnaker Exploration Company (exploration and production, 2001-2005) and Chairman, President, and CEO of Baker Hughes, Inc. (oilfield services, 2000-2004).
+ The information includes the Trustee's principal occupation during the last five years and other information relating to the experience, attributes, and skills relevant to the Trustee's qualifications to serve as a Trustee, which led to the conclusion that the Trustee should serve as a Trustee for the fund.
Advisory Board Members and Officers:
Correspondence intended for a Member of the Advisory Board (if any) may be sent to Fidelity Investments, P.O. Box 55235, Boston, Massachusetts 02205-5235. Correspondence intended for an officer or Peter S. Lynch may be sent to Fidelity Investments, 245 Summer Street, Boston, Massachusetts 02210. Officers appear below in alphabetical order.
Name, Year of Birth; Principal Occupation
Vicki L. Fuller (1957)
Year of Election or Appointment: 2018
Member of the Advisory Board
Ms. Fuller also serves as Member of the Advisory Board of other Fidelity® funds. Ms. Fuller serves as a member of the Board of Directors, Audit Committee, and Nominating and Governance Committee of The Williams Companies, Inc. (natural gas infrastructure, 2018-present). Previously, Ms. Fuller served as the Chief Investment Officer of the New York State Common Retirement Fund (2012-2018) and held a variety of positions at AllianceBernstein L.P. (global asset management, 1985-2012), including Managing Director (2006-2012) and Senior Vice President and Senior Portfolio Manager (2001-2006).
Patricia L. Kampling (1959)
Year of Election or Appointment: 2020
Member of the Advisory Board
Ms. Kampling also serves as Member of the Advisory Board of other Fidelity® funds. Prior to her retirement, Ms. Kampling served as Chairman of the Board and Chief Executive Officer (2012-2019), President and Chief Operating Officer (2011-2012) and Executive Vice President and Chief Financial Officer (2010-2011) of Alliant Energy Corporation. Ms. Kampling currently serves as a member of the Board, Compensation Committee and Executive Committee and as Chair of the Audit Committee of Briggs & Stratton Corporation (manufacturing, 2011-present) and as a member of the Board, Audit, Finance and Risk Committee and Safety, Environmental, Technology and Operations Committee of American Water Works Company, Inc. (utilities company, 2019-present). In addition, Ms. Kampling currently serves as a member of the Board of the Nature Conservancy, Wisconsin Chapter (2019-present). Previously, Ms. Kampling served as a member of the Board of Interstate Power and Light Company (2012-2019) and Wisconsin Power and Light Company (2012-2019) (each a subsidiary of Alliant Energy Corporation) and as a member of the Board and Workforce Development Committee of the Business Roundtable (2018-2019).
Peter S. Lynch (1944)
Year of Election or Appointment: 2018
Member of the Advisory Board
Mr. Lynch also serves as Member of the Advisory Board of other Fidelity® funds. Mr. Lynch is Vice Chairman and a Director of Fidelity Management & Research Company LLC (investment adviser firm). In addition, Mr. Lynch serves as a Trustee of Boston College and as the Chairman of the Inner-City Scholarship Fund. Previously, Mr. Lynch served as Vice Chairman and a Director of FMR Co., Inc. (investment adviser firm) and on the Special Olympics International Board of Directors (1997-2006).
Susan Tomasky (1953)
Year of Election or Appointment: 2020
Member of the Advisory Board
Ms. Tomasky also serves as Member of the Advisory Board of other Fidelity® funds. Prior to her retirement, Ms. Tomasky served in various executive officer positions at American Electric Power Company, Inc. (1998-2011), including most recently as President of AEP Transmission (2007-2011). Ms. Tomasky currently serves as a member of the Board and Sustainability Committee and as Chair of the Audit Committee of Marathon Petroleum Corporation (2018-present) and as a member of the Board, Corporate Governance Committee and Organization and Compensation Committee and as Chair of the Audit Committee of Public Service Enterprise Group, Inc. (utilities company, 2012-present). In addition, Ms. Tomasky currently serves as a member of the Board of the Columbus Regional Airport Authority (2007-present), as a member of the Board of the Royal Shakespeare Company – America (2009-present), as a member of the Board of the Columbus Association for the Performing Arts (2011-present) and as a member of the Board of Kenyon College (2016-present). Previously, Ms. Tomasky served as a member of the Board (2011-2019) and as Lead Independent Director (2015-2018) of Andeavor Corporation (previously Tesoro Corporation) (independent oil refiner and marketer) and as a member of the Board of Summit Midstream Partners LP (energy, 2012-2018).
Elizabeth Paige Baumann (1968)
Year of Election or Appointment: 2017
Anti-Money Laundering (AML) Officer
Ms. Baumann also serves as AML Officer of other funds. She is Chief AML Officer (2012-present) and Senior Vice President (2014-present) of FMR LLC (diversified financial services company) and is an employee of Fidelity Investments. Previously, Ms. Baumann served as AML Officer of the funds (2012-2016), and Vice President (2007-2014) and Deputy Anti-Money Laundering Officer (2007-2012) of FMR LLC.
Craig S. Brown (1977)
Year of Election or Appointment: 2019
Assistant Treasurer
Mr. Brown also serves as Assistant Treasurer of other funds. Mr. Brown is an employee of Fidelity Investments (2013-present).
John J. Burke III (1964)
Year of Election or Appointment: 2018
Chief Financial Officer
Mr. Burke also serves as Chief Financial Officer of other funds. Mr. Burke serves as Head of Investment Operations for Fidelity Fund and Investment Operations (2018-present) and is an employee of Fidelity Investments (1998-present). Previously Mr. Burke served as head of Asset Management Investment Operations (2012-2018).
William C. Coffey (1969)
Year of Election or Appointment: 2019
Assistant Secretary
Mr. Coffey also serves as Assistant Secretary of other funds. He is Senior Vice President and Deputy General Counsel of FMR LLC (diversified financial services company, 2010-present), and is an employee of Fidelity Investments. Previously, Mr. Coffey served as Secretary and CLO of certain funds (2018-2019); CLO, Secretary, and Senior Vice President of Fidelity Management & Research Company and FMR Co., Inc. (investment adviser firms, 2018-2019); Secretary of Fidelity SelectCo, LLC and Fidelity Investments Money Management, Inc. (investment adviser firms, 2018-2019); CLO of Fidelity Management & Research (Hong Kong) Limited, FMR Investment Management (UK) Limited, and Fidelity Management & Research (Japan) Limited (investment adviser firms, 2018-2019); and Assistant Secretary of certain funds (2009-2018).
Timothy M. Cohen (1969)
Year of Election or Appointment: 2018
Vice President
Mr. Cohen also serves as Vice President of other funds. Mr. Cohen serves as Co-Head of Equity (2018-present), a Director of Fidelity Management & Research (Japan) Limited (investment adviser firm, 2016-present), and is an employee of Fidelity Investments. Previously, Mr. Cohen served as Executive Vice President of Fidelity SelectCo, LLC (2019), Head of Global Equity Research (2016-2018), Chief Investment Officer - Equity and a Director of Fidelity Management & Research (U.K.) Inc. (investment adviser firm, 2013-2015) and as a Director of Fidelity Management & Research (Hong Kong) Limited (investment adviser firm, 2017).
Jonathan Davis (1968)
Year of Election or Appointment: 2010
Assistant Treasurer
Mr. Davis also serves as Assistant Treasurer of other funds. Mr. Davis serves as Assistant Treasurer of FMR Capital, Inc. (2017-present) and is an employee of Fidelity Investments. Previously, Mr. Davis served as Vice President and Associate General Counsel of FMR LLC (diversified financial services company, 2003-2010).
Laura M. Del Prato (1964)
Year of Election or Appointment: 2018
Assistant Treasurer
Ms. Del Prato also serves as an officer of other funds. Ms. Del Prato is an employee of Fidelity Investments (2017-present). Prior to joining Fidelity Investments, Ms. Del Prato served as a Managing Director and Treasurer of the JPMorgan Mutual Funds (2014-2017). Prior to JPMorgan, Ms. Del Prato served as a partner at Cohen Fund Audit Services (accounting firm, 2012-2013) and KPMG LLP (accounting firm, 2004-2012).
Colm A. Hogan (1973)
Year of Election or Appointment: 2020
Assistant Treasurer
Mr. Hogan also serves as an officer of other funds. Mr. Hogan serves as Assistant Treasurer of FMR Capital, Inc. (2017-present) and is an employee of Fidelity Investments (2005-present). Previously, Mr. Hogan served as Deputy Treasurer of certain Fidelity® funds (2016-2020) and Assistant Treasurer of certain Fidelity® funds (2016-2018).
Pamela R. Holding (1964)
Year of Election or Appointment: 2018
Vice President
Ms. Holding also serves as Vice President of other funds. Ms. Holding serves as Co-Head of Equity (2018-present) and is an employee of Fidelity Investments (2013-present). Previously, Ms. Holding served as Executive Vice President of Fidelity SelectCo, LLC (2019) and as Chief Investment Officer of Fidelity Institutional Asset Management (2013-2018).
Cynthia Lo Bessette (1969)
Year of Election or Appointment: 2019
Secretary and Chief Legal Officer (CLO)
Ms. Lo Bessette also serves as an officer of other funds. Ms. Lo Bessette serves as CLO, Secretary, and Senior Vice President of Fidelity Management & Research Company LLC (investment adviser firm, 2019-present); and CLO of Fidelity Management & Research (Hong Kong) Limited, FMR Investment Management (UK) Limited, and Fidelity Management & Research (Japan) Limited (investment adviser firms, 2019-present). She is a Senior Vice President and Deputy General Counsel of FMR LLC (diversified financial services company, 2019-present), and is an employee of Fidelity Investments. Previously, Ms. Lo Bessette served as CLO, Secretary, and Senior Vice President of FMR Co., Inc. (investment adviser firm, 2019); Secretary of Fidelity SelectCo, LLC and Fidelity Investments Money Management, Inc. (investment adviser firms, 2019). Prior to joining Fidelity Investments, Ms. Lo Bessette was Executive Vice President, General Counsel (2016-2019) and Senior Vice President, Deputy General Counsel (2015-2016) of OppenheimerFunds (investment management company) and Deputy Chief Legal Officer (2013-2015) of Jennison Associates LLC (investment adviser firm).
Chris Maher (1972)
Year of Election or Appointment: 2020
Deputy Treasurer
Mr. Maher also serves as an officer of other funds. Mr. Maher serves as Assistant Treasurer of FMR Capital, Inc. (2017-present), and is an employee of Fidelity Investments (2008-present). Previously, Mr. Maher served as Assistant Treasurer of certain funds (2013-2020); Vice President of Asset Management Compliance (2013), Vice President of the Program Management Group of FMR (investment adviser firm, 2010-2013), and Vice President of Valuation Oversight (2008-2010).
Kenneth B. Robins (1969)
Year of Election or Appointment: 2018
Chief Compliance Officer
Mr. Robins also serves as an officer of other funds. Mr. Robins serves as Compliance Officer of Fidelity Management & Research Company LLC (investment adviser firm, 2016-present) and is an employee of Fidelity Investments (2004-present). Previously, Mr. Robins served as Compliance Officer of FMR Co., Inc. (investment adviser firm, 2016-2019), as Executive Vice President of Fidelity Investments Money Management, Inc. (investment adviser firm, 2013-2016) and served in other fund officer roles.
Stacie M. Smith (1974)
Year of Election or Appointment: 2018
President and Treasurer
Ms. Smith also serves as an officer of other funds. Ms. Smith serves as Assistant Treasurer of FMR Capital, Inc. (2017-present), is an employee of Fidelity Investments (2009-present), and has served in other fund officer roles. Prior to joining Fidelity Investments, Ms. Smith served as Senior Audit Manager of Ernst & Young LLP (accounting firm, 1996-2009). Previously, Ms. Smith served as Assistant Treasurer (2013-2019) and Deputy Treasurer (2013-2016) of certain Fidelity® funds.
Marc L. Spector (1972)
Year of Election or Appointment: 2017
Assistant Treasurer
Mr. Spector also serves as an officer of other funds. Mr. Spector serves as Assistant Treasurer of FMR Capital, Inc. (2017-present) and is an employee of Fidelity Investments (2016-present). Prior to joining Fidelity Investments, Mr. Spector served as Director at the Siegfried Group (accounting firm, 2013-2016), and prior to Siegfried Group as audit senior manager at Deloitte & Touche (accounting firm, 2005-2013).
Jim Wegmann (1979)
Year of Election or Appointment: 2019
Assistant Treasurer
Mr. Wegmann also serves as Assistant Treasurer of other funds. Mr. Wegmann is an employee of Fidelity Investments (2011-present).
Shareholder Expense Example
As a shareholder of the Fund, you incur two types of costs: (1) transaction costs and (2) ongoing costs, including management fees, distribution and/or service (12b-1) fees and other Fund expenses. This Example is intended to help you understand your ongoing costs (in dollars) of investing in the Fund and to compare these costs with the ongoing costs of investing in other mutual funds.
The Example is based on an investment of $1,000 invested at the beginning of the period and held for the entire period (July 1, 2019 to December 31, 2019).
Actual Expenses
The first line of the accompanying table for each class of the Fund provides information about actual account values and actual expenses. You may use the information in this line, together with the amount you invested, to estimate the expenses that you paid over the period. Simply divide your account value by $1,000.00 (for example, an $8,600 account value divided by $1,000.00 = 8.6), then multiply the result by the number in the first line for a class of the Fund under the heading entitled "Expenses Paid During Period" to estimate the expenses you paid on your account during this period. The estimate of expenses does not include any fees or other expenses of any variable annuity or variable life insurance product. If they were, the estimate of expenses you paid during the period would be higher, and your ending account value would be lower. In addition, the Fund, as a shareholder in the underlying Fidelity Central Funds, will indirectly bear its pro-rata share of the fees and expenses incurred by the underlying Fidelity Central Funds. These fees and expenses are not included in the Fund's annualized expense ratio used to calculate the expense estimate in the table below.
Hypothetical Example for Comparison Purposes
The second line of the accompanying table for each class of the Fund provides information about hypothetical account values and hypothetical expenses based on a Class' actual expense ratio and an assumed rate of return of 5% per year before expenses, which is not the Class' actual return. The hypothetical account values and expenses may not be used to estimate the actual ending account balance or expenses you paid for the period. You may use this information to compare the ongoing costs of investing in the Fund and other funds. To do so, compare this 5% hypothetical example with the 5% hypothetical examples that appear in the shareholder reports of the other funds. The estimate of expenses does not include any fees or other expenses of any variable annuity or variable life insurance product. If they were, the estimate of expenses you paid during the period would be higher, and your ending account value would be lower. In addition, the Fund, as a shareholder in the underlying Fidelity Central Funds, will indirectly bear its pro-rata share of the fees and expenses incurred by the underlying Fidelity Central Funds. These fees and expenses are not included in the Fund's annualized expense ratio used to calculate the expense estimate in the table below.
Please note that the expenses shown in the table are meant to highlight your ongoing costs only and do not reflect any transaction costs. Therefore, the second line of the table is useful in comparing ongoing costs only, and will not help you determine the relative total costs of owning different funds.
| | Annualized Expense Ratio-A | Beginning
Account Value
July 1, 2019 | Ending
Account Value
December 31, 2019 | Expenses Paid
During Period-B
July 1, 2019
to December 31, 2019 |
| Initial Class | .67% | | | |
| Actual | | $1,000.00 | $978.30 | $3.34 |
| Hypothetical-C | | $1,000.00 | $1,021.83 | $3.41 |
| Service Class 2 | .92% | | | |
| Actual | | $1,000.00 | $977.10 | $4.58 |
| Hypothetical-C | | $1,000.00 | $1,020.57 | $4.69 |
| Investor Class | .75% | | | |
| Actual | | $1,000.00 | $978.00 | $3.74 |
| Hypothetical-C | | $1,000.00 | $1,021.42 | $3.82 |
A Annualized expense ratio reflects expenses net of applicable fee waivers.
B Expenses are equal to each Class' annualized expense ratio, multiplied by the average account value over the period, multiplied by 184/365 (to reflect the one-half year period).
C 5% return per year before expenses
Distributions (Unaudited)
Initial Class, Service Class 2 and Investor Class designate 100% of the dividends distributed during the fiscal year as qualifying for the dividends–received deduction for corporate shareholders.
Board Approval of Investment Advisory Contracts
VIP Energy Portfolio
At its November 2019 meeting, the Board of Trustees, including the Independent Trustees (together, the Board), voted to approve an amended and restated management contract and amended and restated sub-advisory agreements (together, the Amended and Restated Contracts) for the fund, effective January 1, 2020, for a one month period through January 31, 2020, in connection with an upcoming consolidation of certain of Fidelity's advisory businesses.
The Board considered that, on or about January 1, 2020, each of FMR Co., Inc. (FMRC), Fidelity Investments Money Management, Inc. (FIMM), and SelectCo, LLC (SelectCo) will merge with and into Fidelity Management & Research Company (FMR) and that, after the merger, FMR will redomicile as a Delaware limited liability company. The Board also approved the termination of the sub-advisory agreement with FMRC upon the completion of the merger. The Board noted that the Amended and Restated Contracts would be updated to reflect the renamed adviser, Fidelity Management & Research Company LLC and its new form of organization and domicile. The Board also noted that the Amended and Restated Contracts will not change the investment processes, the level or nature of services provided, the resources and personnel allocated, trading and compliance operations, or any fees or expenses paid by the fund.
The Board concluded that the fund's Amended and Restated Contracts are fair and reasonable, and that the fund's Advisory Contracts should be approved through January 31, 2020.
In connection with its consideration of future renewals of the fund's Amended and Restated Contracts, the Board will consider: (i) the nature, extent and quality of services provided to the fund, including shareholder and administrative services and investment performance; (ii) the competitiveness of the management fee and total expenses for the fund; (iii) the costs of the services and profitability, including the revenues earned and the expenses incurred in conducting the business of developing, marketing, distributing, managing, administering, and servicing the fund and its shareholders, to the extent applicable; and (iv) whether there have been economies of scale in respect of the Fidelity funds, whether the Fidelity funds (including the fund) have appropriately benefited from any such economies of scale, and whether there is the potential for realization of any further economies.
Based on its evaluation of all of the conclusions noted above, and after considering all factors it believed relevant, the Board ultimately concluded that the fund's management fee structure is fair and reasonable, and that the continuation of the fund's Amended and Restated Contracts should be approved.
VNRIC-ANN-0220
1.817379.114
Fidelity® Variable Insurance Products:
Technology Portfolio
Annual Report
December 31, 2019
See the inside front cover for important information about access to your fund’s shareholder reports.
Beginning on January 1, 2021, as permitted by regulations adopted by the Securities and Exchange Commission, and if your insurance carrier elects to participate, you may not be receiving paper copies of the Fund’s shareholder reports from the insurance company that offers your variable insurance product unless you specifically request paper copies from your financial professional or the administrator of your variable insurance product. Instead, the reports will be made available on a website, and you will be notified by mail each time a report is posted and provided with a website link to access the report.
If you already elected to receive shareholder reports electronically, you will not be affected by this change and you need not take any action. You may elect to receive shareholder reports and other communications from the Fund electronically, by contacting your financial professional or the administrator of your variable insurance product. If you own a Fidelity-administered variable insurance product, please visit fidelity.com/mailpreferences to make your election or call 1-800-343-3548.
You may elect to receive all future reports in paper free of charge. If you wish to continue receiving paper copies of your shareholder reports, you may contact your financial professional or the administrator of your variable insurance product. If you own a Fidelity-administered variable insurance product, please visit fidelity.com/mailpreferences to make your election or call 1-800-343-3548. Your election to receive reports in paper will apply to all funds available under your variable insurance product.
Contents
To view a fund's proxy voting guidelines and proxy voting record for the 12-month period ended June 30, visit http://www.fidelity.com/proxyvotingresults or visit the Securities and Exchange Commission's (SEC) web site at http://www.sec.gov.
You may also call 1-877-208-0098 to request a free copy of the proxy voting guidelines.
Fidelity® Variable Insurance Products are separate account options which are purchased through a variable insurance contract.
Standard & Poor's, S&P and S&P 500 are registered service marks of The McGraw-Hill Companies, Inc. and have been licensed for use by Fidelity Distributors Corporation.
Other third-party marks appearing herein are the property of their respective owners.
All other marks appearing herein are registered or unregistered trademarks or service marks of FMR LLC or an affiliated company. © 2020 FMR LLC. All rights reserved.
This report and the financial statements contained herein are submitted for the general information of the shareholders of the Fund. This report is not authorized for distribution to prospective investors in the Fund unless preceded or accompanied by an effective prospectus.
A fund files its complete schedule of portfolio holdings with the SEC for the first and third quarters of each fiscal year on Form N-PORT. Forms N-PORT are available on the SEC’s web site at http://www.sec.gov. A fund's Forms N-PORT may be reviewed and copied at the SEC’s Public Reference Room in Washington, DC. Information regarding the operation of the SEC's Public Reference Room may be obtained by calling 1-800-SEC-0330.
For a complete list of a fund's portfolio holdings, view the most recent holdings listing, semiannual report, or annual report on Fidelity's web site at http://www.fidelity.com, http://www.institutional.fidelity.com, or http://www.401k.com, as applicable.
NOT FDIC INSURED •MAY LOSE VALUE •NO BANK GUARANTEE
Neither the Fund nor Fidelity Distributors Corporation is a bank.
Note to shareholders:
As part of a regular review of its organizational structure, Fidelity has decided to merge certain entities to streamline operations, increase efficiency, simplify reporting, and reduce legal, compliance, and accounting complexity and costs. In separate events, Fidelity has merged four of its investment advisers and two of its broker-dealers.
Effective on or about January 1, 2020, following any required regulatory notices and approvals:
Investment advisers Fidelity Investments Money Management, Inc., FMR Co., Inc., and Fidelity SelectCo, LLC, merged with and into Fidelity Management & Research Company. In connection with the merger transactions, the resulting, merged investment adviser was then redomiciled from Massachusetts to Delaware, changed its corporate structure from a corporation to a limited liability company, and changed its name to “Fidelity Management & Research Company LLC”.
Broker-dealer Fidelity Distributors Corporation merged with and into Fidelity Investments Institutional Services Company, Inc. (“FIISC”). FIISC was then redomiciled from Massachusetts to Delaware, changed its corporate structure from a corporation to a limited liability company, and changed its name to “Fidelity Distributors Company LLC”.
These mergers are not expected to affect fund shareholders or Fidelity clients, nor are they expected to result in any changes to the day-to-day management of Fidelity’s brokerage services, the Fidelity funds, their investment policies and practices, their portfolio management teams, or the funds’ expenses.
Performance: The Bottom Line
Average annual total return reflects the change in the value of an investment, assuming reinvestment of distributions from dividend income and capital gains (the profits earned upon the sale of securities that have grown in value, if any) and assuming a constant rate of performance each year. During periods of reimbursement by Fidelity, a fund’s total return will be greater than it would be had the reimbursement not occurred. Performance numbers are net of all underlying fund operating expenses, but do not include any insurance charges imposed by your insurance company’s separate account. If performance information included the effect of these additional charges, the total returns would have been lower. How a fund did yesterday is no guarantee of how it will do tomorrow.
Average Annual Total Returns
| For the periods ended December 31, 2019 | Past 1 year | Past 5 years | Past 10 years |
| Initial Class | 51.32% | 20.06% | 17.06% |
| Investor Class | 51.26% | 19.96% | 16.97% |
$10,000 Over 10 Years
Let's say hypothetically that $10,000 was invested in VIP Technology Portfolio - Initial Class on December 31, 2009.
The chart shows how the value of your investment would have changed, and also shows how the S&P 500® Index performed over the same period.
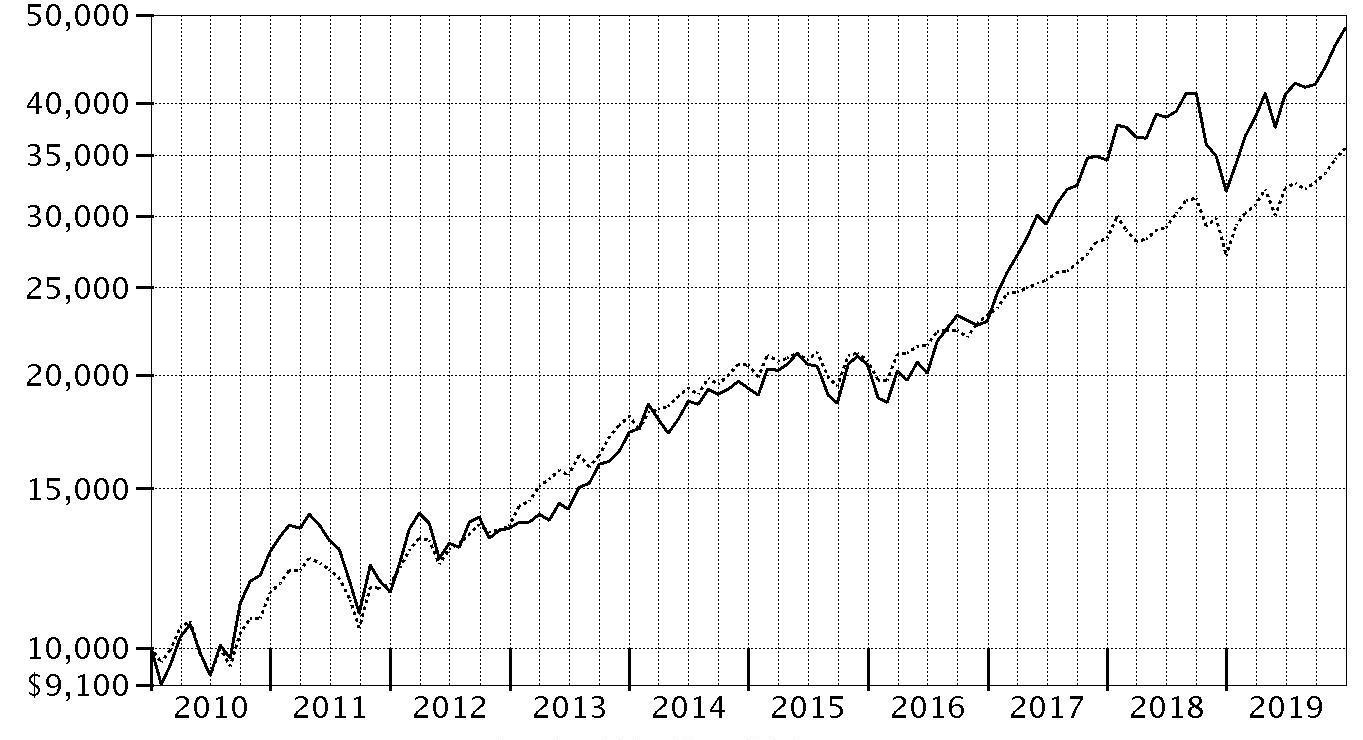
| Period Ending Values |
| $48,327 | VIP Technology Portfolio - Initial Class |
| $35,666 | S&P 500® Index |
Management's Discussion of Fund Performance
Market Recap: U.S. stocks continued to roll in 2019, with the S&P 500
® index soaring 31.49% and marking history as the longest and strongest bull market ever, despite persistent, nagging concerns about global economic growth and trade. After a rough end to 2018, equities sharply reversed course to begin the new year amid upbeat company earnings and signs the Federal Reserve may pause on rates. The uptrend continued until May, when the index sunk as trade negotiations between the U.S. and China broke down. The bull market roared back to record a series of highs in July, when the Fed cut interest rates for the first time since 2008. Volatility intensified in August, as the Treasury yield curve inverted, which some investors viewed as a sign the U.S. economy could be heading for recession. But the market proved resilient, hitting a new high on October 30, when the Fed lowered rates for the third time in 2019, and moving even higher through year-end. Gains were robust and broad-based, with information technology (+50%) leading the way with its best calendar-year result in a decade, amid strong growth trends. Communication services (+33%) and financials (+32%) also stood out. In contrast, energy (+12%) was by far the weakest group – struggling amid sluggish oil prices – while several strong gainers nonetheless fell short of the broader market: industrials and real estate (+29% each), consumer discretionary and consumer staples (+28% each), utilities (+26%), materials (+25%), and health care (+21%).
Comments from Portfolio Manager Nidhi Gupta: For the year, the fund’s share classes gained about 51%, topping the robust 48.85% advance of the MSCI U.S. IMI Information Technology 25/50 Index, and far ahead of the S&P 500
®. Versus the MSCI index, stock selection in systems software; technology hardware, storage & peripherals; and internet services & infrastructure notably aided performance, as did sizable underweights in the lagging communications equipment and IT consulting & other services segments. Among individual holdings, it helped to underweight or avoid four slower-growing, large-cap benchmark components: Cisco Systems (+14%), Oracle (+19%), IBM (+24%) and Intel (+31%). We didn’t own Oracle or IBM at all this period. Overweighting Apple (+89%), the fund’s largest holding during the year, also paid off. We moved to an overweighting around the time that weak equity markets and Apple’s early-January 2019 preannouncement of disappointing quarterly revenue guidance sent the stock into a tailspin. This proved to be a timely decision. Meituan Dianping (+111%), a fast-growing operator of a leading food-delivery service in China that I increased the fund's exposure to in August, also contributed. We exited the position later in the period to lock in profits. Conversely, my stock picks within the application software category detracted this period, as did out-of-benchmark exposure to streaming-entertainment provider Netflix (+22%) and digital advertising and search provider Alphabet (+29%), both of which lagged the index. Netflix was the fund’s largest detractor versus the benchmark the past year, suffering a sizable pullback over the summer, when the company reported signing up only 2.7 million new members in the second quarter, falling well short of management's guidance. Industrial software maker PTC (-21%) – which I sold from the fund – also worked against us this period.
The views expressed above reflect those of the portfolio manager(s) only through the end of the period as stated on the cover of this report and do not necessarily represent the views of Fidelity or any other person in the Fidelity organization. Any such views are subject to change at any time based upon market or other conditions and Fidelity disclaims any responsibility to update such views. These views may not be relied on as investment advice and, because investment decisions for a Fidelity fund are based on numerous factors, may not be relied on as an indication of trading intent on behalf of any Fidelity fund.
Investment Summary (Unaudited)
Top Ten Stocks as of December 31, 2019
| | % of fund's net assets |
| Apple, Inc. | 21.3 |
| Microsoft Corp. | 17.8 |
| Visa, Inc. Class A | 5.6 |
| MasterCard, Inc. Class A | 3.7 |
| Adobe, Inc. | 3.2 |
| Salesforce.com, Inc. | 2.8 |
| Applied Materials, Inc. | 2.2 |
| Fidelity National Information Services, Inc. | 2.1 |
| Netflix, Inc. | 2.0 |
| Facebook, Inc. Class A | 2.0 |
| | 62.7 |
Top Industries (% of fund's net assets)
| As of December 31, 2019 |
| | Software | 30.0% |
| | Technology Hardware, Storage & Peripherals | 21.5% |
| | IT Services | 19.0% |
| | Semiconductors & Semiconductor Equipment | 15.0% |
| | Interactive Media & Services | 3.5% |
| | All Others* | 11.0% |

* Includes short-term investments and net other assets (liabilities).
Schedule of Investments December 31, 2019
Showing Percentage of Net Assets
| Common Stocks - 97.4% | | | |
| | | Shares | Value |
| Communications Equipment - 1.2% | | | |
| Communications Equipment - 1.2% | | | |
| Cisco Systems, Inc. | | 223,683 | $10,727,837 |
| Electronic Equipment & Components - 0.5% | | | |
| Electronic Equipment & Instruments - 0.2% | | | |
| Zebra Technologies Corp. Class A (a) | | 6,600 | 1,685,904 |
| Technology Distributors - 0.3% | | | |
| CDW Corp. | | 19,100 | 2,728,244 |
|
| TOTAL ELECTRONIC EQUIPMENT & COMPONENTS | | | 4,414,148 |
|
| Entertainment - 2.5% | | | |
| Interactive Home Entertainment - 0.5% | | | |
| Activision Blizzard, Inc. | | 72,800 | 4,325,776 |
| Movies & Entertainment - 2.0% | | | |
| Netflix, Inc. (a) | | 55,832 | 18,065,560 |
|
| TOTAL ENTERTAINMENT | | | 22,391,336 |
|
| Equity Real Estate Investment Trusts (REITs) - 0.4% | | | |
| Diversified REITs - 0.4% | | | |
| Ant International Co. Ltd. Class C (a)(b)(c) | | 567,730 | 4,172,816 |
| Health Care Equipment & Supplies - 0.0% | | | |
| Health Care Equipment - 0.0% | | | |
| China Medical Technologies, Inc. sponsored ADR (a)(c) | | 300 | 0 |
| Interactive Media & Services - 3.5% | | | |
| Interactive Media & Services - 3.5% | | | |
| Alphabet, Inc. Class C (a) | | 10,061 | 13,451,758 |
| Facebook, Inc. Class A (a) | | 88,000 | 18,062,000 |
| | | | 31,513,758 |
| Internet & Direct Marketing Retail - 2.5% | | | |
| Internet & Direct Marketing Retail - 2.5% | | | |
| Amazon.com, Inc. (a) | | 4,200 | 7,760,928 |
| eBay, Inc. | | 228,600 | 8,254,746 |
| Pinduoduo, Inc. ADR (a) | | 169,611 | 6,414,688 |
| | | | 22,430,362 |
| IT Services - 19.0% | | | |
| Data Processing & Outsourced Services - 16.5% | | | |
| Automatic Data Processing, Inc. | | 32,301 | 5,507,321 |
| Fidelity National Information Services, Inc. | | 137,451 | 19,118,060 |
| Fiserv, Inc. (a) | | 87,137 | 10,075,651 |
| FleetCor Technologies, Inc. (a) | | 16,100 | 4,632,292 |
| Global Payments, Inc. | | 38,950 | 7,110,712 |
| MasterCard, Inc. Class A | | 114,200 | 34,098,978 |
| PagSeguro Digital Ltd. (a) | | 28,900 | 987,224 |
| PayPal Holdings, Inc. (a) | | 139,700 | 15,111,349 |
| Square, Inc. (a) | | 38,000 | 2,377,280 |
| Visa, Inc. Class A | | 268,600 | 50,469,940 |
| | | | 149,488,807 |
| Internet Services & Infrastructure - 1.0% | | | |
| GoDaddy, Inc. (a) | | 21,100 | 1,433,112 |
| MongoDB, Inc. Class A (a)(d) | | 43,600 | 5,738,196 |
| Okta, Inc. (a) | | 19,300 | 2,226,641 |
| | | | 9,397,949 |
| IT Consulting & Other Services - 1.5% | | | |
| Accenture PLC Class A | | 59,010 | 12,425,736 |
| Gartner, Inc. (a) | | 10,803 | 1,664,742 |
| | | | 14,090,478 |
|
| TOTAL IT SERVICES | | | 172,977,234 |
|
| Life Sciences Tools & Services - 0.0% | | | |
| Life Sciences Tools & Services - 0.0% | | | |
| JHL Biotech, Inc. (a)(c) | | 94,814 | 48,732 |
| Road & Rail - 1.3% | | | |
| Trucking - 1.3% | | | |
| Lyft, Inc. | | 135,397 | 5,824,779 |
| Uber Technologies, Inc. | | 204,624 | 6,085,518 |
| | | | 11,910,297 |
| Semiconductors & Semiconductor Equipment - 15.0% | | | |
| Semiconductor Equipment - 4.4% | | | |
| Applied Materials, Inc. | | 323,900 | 19,770,856 |
| ASML Holding NV (Netherlands) | | 13,700 | 4,055,975 |
| KLA-Tencor Corp. | | 21,200 | 3,777,204 |
| Lam Research Corp. | | 40,400 | 11,812,960 |
| | | | 39,416,995 |
| Semiconductors - 10.6% | | | |
| Advanced Micro Devices, Inc. (a) | | 122,200 | 5,604,092 |
| Broadcom, Inc. | | 20,803 | 6,574,164 |
| Intel Corp. | | 225,408 | 13,490,669 |
| Marvell Technology Group Ltd. | | 222,700 | 5,914,912 |
| Microchip Technology, Inc. (d) | | 28,600 | 2,994,992 |
| Micron Technology, Inc. (a) | | 151,300 | 8,136,914 |
| NVIDIA Corp. | | 72,600 | 17,082,780 |
| NXP Semiconductors NV | | 77,500 | 9,862,650 |
| Qualcomm, Inc. | | 177,550 | 15,665,237 |
| Texas Instruments, Inc. | | 87,148 | 11,180,217 |
| | | | 96,506,627 |
|
| TOTAL SEMICONDUCTORS & SEMICONDUCTOR EQUIPMENT | | | 135,923,622 |
|
| Software - 30.0% | | | |
| Application Software - 11.0% | | | |
| Adobe, Inc. (a) | | 89,000 | 29,353,090 |
| ANSYS, Inc. (a) | | 9,722 | 2,502,540 |
| Autodesk, Inc. (a) | | 29,400 | 5,393,724 |
| Cadence Design Systems, Inc. (a) | | 33,970 | 2,356,159 |
| Citrix Systems, Inc. | | 16,400 | 1,818,760 |
| Datadog, Inc. Class A (a)(d) | | 1,900 | 71,782 |
| Everbridge, Inc. (a) | | 61,200 | 4,778,496 |
| Intuit, Inc. | | 47,400 | 12,415,482 |
| Nutanix, Inc. Class B (a)(e) | | 6,397 | 199,970 |
| Salesforce.com, Inc. (a) | | 156,465 | 25,447,468 |
| Splunk, Inc. (a) | | 16,400 | 2,456,228 |
| SS&C Technologies Holdings, Inc. | | 69,700 | 4,279,580 |
| Synopsys, Inc. (a) | | 18,068 | 2,515,066 |
| Workday, Inc. Class A (a) | | 37,780 | 6,212,921 |
| | | | 99,801,266 |
| Systems Software - 19.0% | | | |
| Cloudflare, Inc. (a) | | 3,800 | 64,828 |
| Crowdstrike Holdings, Inc. (d) | | 1,200 | 59,844 |
| Fortinet, Inc. (a) | | 17,108 | 1,826,450 |
| Microsoft Corp. | | 1,026,900 | 161,942,130 |
| Palo Alto Networks, Inc. (a) | | 11,800 | 2,728,750 |
| ServiceNow, Inc. (a) | | 22,500 | 6,352,200 |
| | | | 172,974,202 |
|
| TOTAL SOFTWARE | | | 272,775,468 |
|
| Technology Hardware, Storage & Peripherals - 21.5% | | | |
| Technology Hardware, Storage & Peripherals - 21.5% | | | |
| Apple, Inc. | | 657,215 | 192,991,183 |
| Western Digital Corp. | | 34,900 | 2,215,103 |
| | | | 195,206,286 |
| TOTAL COMMON STOCKS | | | |
| (Cost $579,166,796) | | | 884,491,896 |
|
| Convertible Preferred Stocks - 0.4% | | | |
| Food & Staples Retailing - 0.2% | | | |
| Food Retail - 0.2% | | | |
| Roofoods Ltd. Series F (a)(b)(c) | | 4,211 | 1,985,823 |
| Internet & Direct Marketing Retail - 0.1% | | | |
| Internet & Direct Marketing Retail - 0.1% | | | |
| Reddit, Inc. Series D (b)(c) | | 33,900 | 1,064,460 |
| Road & Rail - 0.1% | | | |
| Trucking - 0.1% | | | |
| Convoy, Inc. Series D (b)(c) | | 28,479 | 385,606 |
| Software - 0.0% | | | |
| Application Software - 0.0% | | | |
| UiPath, Inc.: | | | |
| Series A1 (b)(c) | | 3,467 | 136,432 |
| Series B1 (b)(c) | | 173 | 6,808 |
| Series B2 (b)(c) | | 860 | 33,842 |
| | | | 177,082 |
| TOTAL CONVERTIBLE PREFERRED STOCKS | | | |
| (Cost $2,786,740) | | | 3,612,971 |
|
| Money Market Funds - 2.9% | | | |
| Fidelity Cash Central Fund 1.58% (f) | | 19,575,550 | 19,579,465 |
| Fidelity Securities Lending Cash Central Fund 1.58% (f)(g) | | 7,298,113 | 7,298,843 |
| TOTAL MONEY MARKET FUNDS | | | |
| (Cost $26,878,308) | | | 26,878,308 |
| TOTAL INVESTMENT IN SECURITIES - 100.7% | | | |
| (Cost $608,831,844) | | | 914,983,175 |
| NET OTHER ASSETS (LIABILITIES) - (0.7)% | | | (6,804,138) |
| NET ASSETS - 100% | | | $908,179,037 |
Legend
(a) Non-income producing
(b) Restricted securities - Investment in securities not registered under the Securities Act of 1933 (excluding 144A issues). At the end of the period, the value of restricted securities (excluding 144A issues) amounted to $7,785,787 or 0.9% of net assets.
(c) Level 3 security
(d) Security or a portion of the security is on loan at period end.
(e) Security exempt from registration under Rule 144A of the Securities Act of 1933. These securities may be resold in transactions exempt from registration, normally to qualified institutional buyers. At the end of the period, the value of these securities amounted to $199,970 or 0.0% of net assets.
(f) Affiliated fund that is generally available only to investment companies and other accounts managed by Fidelity Investments. The rate quoted is the annualized seven-day yield of the fund at period end. A complete unaudited listing of the fund's holdings as of its most recent quarter end is available upon request. In addition, each Fidelity Central Fund's financial statements, which are not covered by the Fund's Report of Independent Registered Public Accounting Firm, are available on the SEC's website or upon request.
(g) Investment made with cash collateral received from securities on loan.
Additional information on each restricted holding is as follows:
| Security | Acquisition Date | Acquisition Cost |
| Ant International Co. Ltd. Class C | 5/16/18 | $3,184,965 |
| Convoy, Inc. Series D | 10/30/19 | $385,606 |
| Reddit, Inc. Series D | 2/4/19 | $735,166 |
| Roofoods Ltd. Series F | 9/12/17 | $1,488,886 |
| UiPath, Inc. Series A1 | 6/14/19 | $136,432 |
| UiPath, Inc. Series B1 | 6/14/19 | $6,808 |
| UiPath, Inc. Series B2 | 6/14/19 | $33,842 |
Affiliated Central Funds
Information regarding fiscal year to date income earned by the Fund from investments in Fidelity Central Funds is as follows:
| Fund | Income earned |
| Fidelity Cash Central Fund | $185,761 |
| Fidelity Securities Lending Cash Central Fund | 536,899 |
| Total | $722,660 |
Amounts in the income column in the above table include any capital gain distributions from underlying funds, which are presented in the corresponding line-item in the Statement of Operations, if applicable. Amount for Fidelity Securities Lending Cash Central Fund represents the income earned on investing cash collateral, less rebates paid to borrowers and any lending agent fees associated with the loan, plus any premium payments received for lending certain types of securities.
Investment Valuation
The following is a summary of the inputs used, as of December 31, 2019, involving the Fund's assets and liabilities carried at fair value. The inputs or methodology used for valuing securities may not be an indication of the risk associated with investing in those securities. For more information on valuation inputs, and their aggregation into the levels used below, please refer to the Investment Valuation section in the accompanying Notes to Financial Statements.
| | Valuation Inputs at Reporting Date: |
| Description | Total | Level 1 | Level 2 | Level 3 |
| Investments in Securities: | | | | |
| Common Stocks | $884,491,896 | $876,214,373 | $4,055,975 | $4,221,548 |
| Convertible Preferred Stocks | 3,612,971 | -- | -- | 3,612,971 |
| Money Market Funds | 26,878,308 | 26,878,308 | -- | -- |
| Total Investments in Securities: | $914,983,175 | $903,092,681 | $4,055,975 | $7,834,519 |
See accompanying notes which are an integral part of the financial statements.
Financial Statements
Statement of Assets and Liabilities
| | | December 31, 2019 |
| Assets | | |
Investment in securities, at value (including securities loaned of $7,213,613) — See accompanying schedule:
Unaffiliated issuers (cost $581,953,536) | $888,104,867 | |
| Fidelity Central Funds (cost $26,878,308) | 26,878,308 | |
| Total Investment in Securities (cost $608,831,844) | | $914,983,175 |
| Receivable for fund shares sold | | 893,368 |
| Dividends receivable | | 115,849 |
| Distributions receivable from Fidelity Central Funds | | 25,139 |
| Prepaid expenses | | 5,990 |
| Other receivables | | 937 |
| Total assets | | 916,024,458 |
| Liabilities | | |
| Payable for fund shares redeemed | $523 | |
| Accrued management fee | 388,599 | |
| Other affiliated payables | 119,045 | |
| Other payables and accrued expenses | 45,254 | |
| Collateral on securities loaned | 7,292,000 | |
| Total liabilities | | 7,845,421 |
| Net Assets | | $908,179,037 |
| Net Assets consist of: | | |
| Paid in capital | | $609,432,892 |
| Total accumulated earnings (loss) | | 298,746,145 |
| Net Assets | | $908,179,037 |
| Net Asset Value and Maximum Offering Price | | |
| Initial Class: | | |
| Net Asset Value, offering price and redemption price per share ($175,680,138 ÷ 9,207,221 shares) | | $19.08 |
| Investor Class: | | |
| Net Asset Value, offering price and redemption price per share ($732,498,899 ÷ 38,967,454 shares) | | $18.80 |
See accompanying notes which are an integral part of the financial statements.
Statement of Operations
| | | Year ended December 31, 2019 |
| Investment Income | | |
| Dividends | | $8,085,503 |
| Income from Fidelity Central Funds (including $536,899 from security lending) | | 722,660 |
| Total income | | 8,808,163 |
| Expenses | | |
| Management fee | $4,046,236 | |
| Transfer agent fees | 968,110 | |
| Accounting and security lending fees | 264,997 | |
| Custodian fees and expenses | 18,122 | |
| Independent trustees' fees and expenses | 4,032 | |
| Audit | 58,262 | |
| Legal | 4,339 | |
| Miscellaneous | 7,161 | |
| Total expenses before reductions | 5,371,259 | |
| Expense reductions | (24,278) | |
| Total expenses after reductions | | 5,346,981 |
| Net investment income (loss) | | 3,461,182 |
| Realized and Unrealized Gain (Loss) | | |
| Net realized gain (loss) on: | | |
| Investment securities: | | |
| Unaffiliated issuers | 25,021,717 | |
| Fidelity Central Funds | 842 | |
| Foreign currency transactions | (4,339) | |
| Total net realized gain (loss) | | 25,018,220 |
| Change in net unrealized appreciation (depreciation) on: | | |
| Investment securities: | | |
| Unaffiliated issuers | 276,321,384 | |
| Fidelity Central Funds | (58) | |
| Assets and liabilities in foreign currencies | (821) | |
| Total change in net unrealized appreciation (depreciation) | | 276,320,505 |
| Net gain (loss) | | 301,338,725 |
| Net increase (decrease) in net assets resulting from operations | | $304,799,907 |
See accompanying notes which are an integral part of the financial statements.
Statement of Changes in Net Assets
| | Year ended December 31, 2019 | Year ended December 31, 2018 |
| Increase (Decrease) in Net Assets | | |
| Operations | | |
| Net investment income (loss) | $3,461,182 | $1,676,472 |
| Net realized gain (loss) | 25,018,220 | 102,912,665 |
| Change in net unrealized appreciation (depreciation) | 276,320,505 | (163,403,448) |
| Net increase (decrease) in net assets resulting from operations | 304,799,907 | (58,814,311) |
| Distributions to shareholders | (136,398,297) | (52,270,559) |
| Share transactions - net increase (decrease) | 127,675,258 | 30,975,773 |
| Total increase (decrease) in net assets | 296,076,868 | (80,109,097) |
| Net Assets | | |
| Beginning of period | 612,102,169 | 692,211,266 |
| End of period | $908,179,037 | $612,102,169 |
See accompanying notes which are an integral part of the financial statements.
Financial Highlights
VIP Technology Portfolio Initial Class
| Years ended December 31, | 2019 | 2018 | 2017 | 2016 | 2015 |
| Selected Per–Share Data | | | | | |
| Net asset value, beginning of period | $15.76 | $18.43 | $12.76 | $11.91 | $11.83 |
| Income from Investment Operations | | | | | |
| Net investment income (loss)A | .09 | .05 | .01 | .02 | .02 |
| Net realized and unrealized gain (loss) | 6.72 | (1.34) | 6.41 | 1.22 | .71 |
| Total from investment operations | 6.81 | (1.29) | 6.42 | 1.24 | .73 |
| Distributions from net investment income | (.08) | – | –B | (.02) | (.02) |
| Distributions from net realized gain | (3.42) | (1.38) | (.75) | (.37) | (.63) |
| Total distributions | (3.49)C | (1.38) | (.75) | (.39) | (.65) |
| Redemption fees added to paid in capitalA | – | – | –B | –B | –B |
| Net asset value, end of period | $19.08 | $15.76 | $18.43 | $12.76 | $11.91 |
| Total ReturnD,E | 51.32% | (7.62)% | 50.78% | 11.37% | 6.27% |
| Ratios to Average Net AssetsF,G | | | | | |
| Expenses before reductions | .65% | .66% | .68% | .70% | .69% |
| Expenses net of fee waivers, if any | .65% | .66% | .68% | .70% | .69% |
| Expenses net of all reductions | .64% | .64% | .67% | .69% | .68% |
| Net investment income (loss) | .52% | .27% | .03% | .17% | .16% |
| Supplemental Data | | | | | |
| Net assets, end of period (000 omitted) | $175,680 | $123,867 | $154,984 | $75,480 | $70,596 |
| Portfolio turnover rateH | 20% | 139% | 68% | 67% | 68% |
A Calculated based on average shares outstanding during the period.
B Amount represents less than $.005 per share.
C Total distributions of $3.49 per share is comprised of distributions from net investment income of $.075 and distributions from net realized gain of $3.415 per share.
D Total returns do not reflect charges attributable to your insurance company's separate account. Inclusion of these charges would reduce the total returns shown.
E Total returns would have been lower if certain expenses had not been reduced during the applicable periods shown.
F Fees and expenses of any underlying Fidelity Central Funds are not included in the Fund's expense ratio. The Fund indirectly bears its proportionate share of the expenses of any underlying Fidelity Central Funds.
G Expense ratios reflect operating expenses of the class. Expenses before reductions do not reflect amounts reimbursed by the investment adviser or reductions from brokerage service arrangements or reductions from other expense offset arrangements and do not represent the amount paid by the class during periods when reimbursements or reductions occur. Expenses net of fee waivers reflect expenses after reimbursement by the investment adviser but prior to reductions from brokerage service arrangements or other expense offset arrangements. Expenses net of all reductions represent the net expenses paid by the class.
H Amount does not include the portfolio activity of any underlying Fidelity Central Funds.
See accompanying notes which are an integral part of the financial statements.
VIP Technology Portfolio Investor Class
| Years ended December 31, | 2019 | 2018 | 2017 | 2016 | 2015 |
| Selected Per–Share Data | | | | | |
| Net asset value, beginning of period | $15.57 | $18.23 | $12.63 | $11.79 | $11.73 |
| Income from Investment Operations | | | | | |
| Net investment income (loss)A | .07 | .04 | (.01) | .01 | .01 |
| Net realized and unrealized gain (loss) | 6.64 | (1.34) | 6.35 | 1.21 | .69 |
| Total from investment operations | 6.71 | (1.30) | 6.34 | 1.22 | .70 |
| Distributions from net investment income | (.06) | – | –B | (.01) | (.01) |
| Distributions from net realized gain | (3.42) | (1.36) | (.74) | (.37) | (.63) |
| Total distributions | (3.48) | (1.36) | (.74) | (.38) | (.64) |
| Redemption fees added to paid in capitalA | – | – | –B | –B | –B |
| Net asset value, end of period | $18.80 | $15.57 | $18.23 | $12.63 | $11.79 |
| Total ReturnC,D | 51.26% | (7.73)% | 50.67% | 11.34% | 6.08% |
| Ratios to Average Net AssetsE,F | | | | | |
| Expenses before reductions | .73% | .74% | .76% | .78% | .77% |
| Expenses net of fee waivers, if any | .73% | .73% | .76% | .78% | .77% |
| Expenses net of all reductions | .72% | .72% | .75% | .77% | .76% |
| Net investment income (loss) | .44% | .20% | (.05)% | .09% | .08% |
| Supplemental Data | | | | | |
| Net assets, end of period (000 omitted) | $732,499 | $488,235 | $537,227 | $254,287 | $241,491 |
| Portfolio turnover rateG | 20% | 139% | 68% | 67% | 68% |
A Calculated based on average shares outstanding during the period.
B Amount represents less than $.005 per share.
C Total returns do not reflect charges attributable to your insurance company's separate account. Inclusion of these charges would reduce the total returns shown.
D Total returns would have been lower if certain expenses had not been reduced during the applicable periods shown.
E Fees and expenses of any underlying Fidelity Central Funds are not included in the Fund's expense ratio. The Fund indirectly bears its proportionate share of the expenses of any underlying Fidelity Central Funds.
F Expense ratios reflect operating expenses of the class. Expenses before reductions do not reflect amounts reimbursed by the investment adviser or reductions from brokerage service arrangements or reductions from other expense offset arrangements and do not represent the amount paid by the class during periods when reimbursements or reductions occur. Expenses net of fee waivers reflect expenses after reimbursement by the investment adviser but prior to reductions from brokerage service arrangements or other expense offset arrangements. Expenses net of all reductions represent the net expenses paid by the class.
G Amount does not include the portfolio activity of any underlying Fidelity Central Funds.
See accompanying notes which are an integral part of the financial statements.
Notes to Financial Statements
For the period ended December 31, 2019
1. Organization.
VIP Technology Portfolio (the Fund) is a non-diversified fund of Variable Insurance Products Fund IV (the Trust) and is authorized to issue an unlimited number of shares. The Trust is registered under the Investment Company Act of 1940, as amended (the 1940 Act), as an open-end management investment company organized as a Massachusetts business trust. Shares of the Fund may only be purchased by insurance companies for the purpose of funding variable annuity or variable life insurance contracts. The Fund offers the following classes of shares: Initial Class shares and Investor Class shares. All classes have equal rights and voting privileges, except for matters affecting a single class.
2. Investments in Fidelity Central Funds.
The Fund invests in Fidelity Central Funds, which are open-end investment companies generally available only to other investment companies and accounts managed by the investment adviser and its affiliates. The Fund's Schedule of Investments lists each of the Fidelity Central Funds held as of period end, if any, as an investment of the Fund, but does not include the underlying holdings of each Fidelity Central Fund. As an Investing Fund, the Fund indirectly bears its proportionate share of the expenses of the underlying Fidelity Central Funds.
The Money Market Central Funds seek preservation of capital and current income and are managed by Fidelity Investments Money Management, Inc. (FIMM), an affiliate of the investment adviser. Annualized expenses of the Money Market Central Funds as of their most recent shareholder report date ranged from less than .005% to .01%.
A complete unaudited list of holdings for each Fidelity Central Fund is available upon request or at the Securities and Exchange Commission (the SEC) website at www.sec.gov. In addition, the financial statements of the Fidelity Central Funds, which are not covered by the Fund's Report of Independent Registered Public Accounting Firm, are available on the SEC website or upon request.
3. Significant Accounting Policies.
The Fund is an investment company and applies the accounting and reporting guidance of the Financial Accounting Standards Board (FASB) Accounting Standards Codification Topic 946 Financial Services – Investments Companies. The financial statements have been prepared in conformity with accounting principles generally accepted in the United States of America (GAAP), which require management to make certain estimates and assumptions at the date of the financial statements. Actual results could differ from those estimates. Subsequent events, if any, through the date that the financial statements were issued have been evaluated in the preparation of the financial statements. The following summarizes the significant accounting policies of the Fund:
Investment Valuation. Investments are valued as of 4:00 p.m. Eastern time on the last calendar day of the period. The Board of Trustees (the Board) has delegated the day to day responsibility for the valuation of the Fund's investments to the Fair Value Committee (the Committee) established by the Fund's investment adviser. In accordance with valuation policies and procedures approved by the Board, the Fund attempts to obtain prices from one or more third party pricing vendors or brokers to value its investments. When current market prices, quotations or currency exchange rates are not readily available or reliable, investments will be fair valued in good faith by the Committee, in accordance with procedures adopted by the Board. Factors used in determining fair value vary by investment type and may include market or investment specific events. The frequency with which these procedures are used cannot be predicted and they may be utilized to a significant extent. The Committee oversees the Fund's valuation policies and procedures and reports to the Board on the Committee's activities and fair value determinations. The Board monitors the appropriateness of the procedures used in valuing the Fund's investments and ratifies the fair value determinations of the Committee.
The Fund categorizes the inputs to valuation techniques used to value its investments into a disclosure hierarchy consisting of three levels as shown below:
- Level 1 – quoted prices in active markets for identical investments
- Level 2 – other significant observable inputs (including quoted prices for similar investments, interest rates, prepayment speeds, etc.)
- Level 3 – unobservable inputs (including the Fund's own assumptions based on the best information available)
Valuation techniques used to value the Fund's investments by major category are as follows:
Equity securities, including restricted securities, for which market quotations are readily available, are valued at the last reported sale price or official closing price as reported by a third party pricing vendor on the primary market or exchange on which they are traded and are categorized as Level 1 in the hierarchy. In the event there were no sales during the day or closing prices are not available, securities are valued at the last quoted bid price or may be valued using the last available price and are generally categorized as Level 2 in the hierarchy. For foreign equity securities, when market or security specific events arise, comparisons to the valuation of American Depositary Receipts (ADRs), futures contracts, Exchange-Traded Funds (ETFs) and certain indexes as well as quoted prices for similar securities may be used and would be categorized as Level 2 in the hierarchy. For equity securities, including restricted securities, where observable inputs are limited, assumptions about market activity and risk are used and these securities may be categorized as Level 3 in the hierarchy.
Investments in open-end mutual funds, including the Fidelity Central Funds, are valued at their closing net asset value (NAV) each business day and are categorized as Level 1 in the hierarchy.
Changes in valuation techniques may result in transfers in or out of an assigned level within the disclosure hierarchy. The aggregate value of investments by input level as of December 31, 2019 is included at the end of the Fund's Schedule of Investments.
Foreign Currency. The Fund may use foreign currency contracts to facilitate transactions in foreign-denominated securities. Gains and losses from these transactions may arise from changes in the value of the foreign currency or if the counterparties do not perform under the contracts' terms.
Foreign-denominated assets, including investment securities, and liabilities are translated into U.S. dollars at the exchange rates at period end. Purchases and sales of investment securities, income and dividends received and expenses denominated in foreign currencies are translated into U.S. dollars at the exchange rate in effect on the transaction date.
The effects of exchange rate fluctuations on investments are included with the net realized and unrealized gain (loss) on investment securities. Other foreign currency transactions resulting in realized and unrealized gain (loss) are disclosed separately.
Investment Transactions and Income. For financial reporting purposes, the Fund's investment holdings and NAV include trades executed through the end of the last business day of the period. The NAV per share for processing shareholder transactions is calculated as of the close of business of the New York Stock Exchange (NYSE), normally 4:00 p.m. Eastern time and includes trades executed through the end of the prior business day. Gains and losses on securities sold are determined on the basis of identified cost and include proceeds received from litigation. Dividend income is recorded on the ex-dividend date, except for certain dividends from foreign securities where the ex-dividend date may have passed, which are recorded as soon as the Fund is informed of the ex-dividend date. Non-cash dividends included in dividend income, if any, are recorded at the fair market value of the securities received. Income and capital gain distributions from Fidelity Central Funds, if any, are recorded on the ex-dividend date. Certain distributions received by the Fund represent a return of capital or capital gain. The Fund determines the components of these distributions subsequent to the ex-dividend date, based upon receipt of tax filings or other correspondence relating to the underlying investment. These distributions are recorded as a reduction of cost of investments and/or as a realized gain. Investment income is recorded net of foreign taxes withheld where recovery of such taxes is uncertain.
Class Allocations and Expenses. Investment income, realized and unrealized capital gains and losses, common expenses of the Fund, and certain fund-level expense reductions, if any, are allocated daily on a pro-rata basis to each class based on the relative net assets of each class to the total net assets of the Fund. Each class differs with respect to transfer agent and fees incurred. Certain expense reductions may also differ by class. For the reporting period, the allocated portion of income and expenses to each class as a percent of its average net assets may vary due to the timing of recording these transactions in relation to fluctuating net assets of the classes. Expenses directly attributable to a fund are charged to that fund. Expenses attributable to more than one fund are allocated among the respective funds on the basis of relative net assets or other appropriate methods. Expense estimates are accrued in the period to which they relate and adjustments are made when actual amounts are known.
Income Tax Information and Distributions to Shareholders. Each year, the Fund intends to qualify as a regulated investment company under Subchapter M of the Internal Revenue Code, including distributing substantially all of its taxable income and realized gains. As a result, no provision for U.S. Federal income taxes is required. As of December 31, 2019, the Fund did not have any unrecognized tax benefits in the financial statements; nor is the Fund aware of any tax positions for which it is reasonably possible that the total amounts of unrecognized tax benefits will significantly change in the next twelve months. The Fund files a U.S. federal tax return, in addition to state and local tax returns as required. The Fund's federal income tax returns are subject to examination by the Internal Revenue Service (IRS) for a period of three fiscal years after they are filed. State and local tax returns may be subject to examination for an additional fiscal year depending on the jurisdiction. Foreign taxes are provided for based on the Fund's understanding of the tax rules and rates that exist in the foreign markets in which it invests.
Distributions are declared and recorded on the ex-dividend date. Income and capital gain distributions are declared separately for each class. Income and capital gain distributions are determined in accordance with income tax regulations, which may differ from GAAP.
Capital accounts within the financial statements are adjusted for permanent book-tax differences. These adjustments have no impact on net assets or the results of operations. Capital accounts are not adjusted for temporary book-tax differences which will reverse in a subsequent period.
Book-tax differences are primarily due to foreign currency transactions, passive foreign investment companies (PFIC), capital loss carryforwards and losses deferred due to wash sales and excise tax regulations.
As of period end, the cost and unrealized appreciation (depreciation) in securities, and derivatives if applicable, for federal income tax purposes were as follows:
| Gross unrealized appreciation | $305,569,989 |
| Gross unrealized depreciation | (2,513,724) |
| Net unrealized appreciation (depreciation) | $303,056,265 |
| Tax Cost | $611,926,910 |
The tax-based components of distributable earnings as of period end were as follows:
| Undistributed ordinary income | $1,227,082 |
| Capital loss carryforward | $(5,537,213) |
| Net unrealized appreciation (depreciation) on securities and other investments | $303,056,275 |
Capital loss carryforwards are only available to offset future capital gains of the Fund to the extent provided by regulations and may be limited. The capital loss carryforward information presented below, including any applicable limitation, is estimated as of fiscal period end and is subject to adjustment.
| No expiration | |
| Short-term | $(5,537,213) |
The tax character of distributions paid was as follows:
| | December 31, 2019 | December 31, 2018 |
| Ordinary Income | $3,538,082 | $ 16,221,126 |
| Long-term Capital Gains | 132,860,215 | 36,049,433 |
| Total | $136,398,297 | $ 52,270,559 |
Restricted Securities. The Fund may invest in securities that are subject to legal or contractual restrictions on resale. These securities generally may be resold in transactions exempt from registration or to the public if the securities are registered. Disposal of these securities may involve time-consuming negotiations and expense, and prompt sale at an acceptable price may be difficult. Information regarding restricted securities is included at the end of the Fund's Schedule of Investments.
4. Purchases and Sales of Investments.
Purchases and sales of securities, other than short-term securities, aggregated $151,182,116 and $170,367,965, respectively.
5. Fees and Other Transactions with Affiliates.
Management Fee. Fidelity SelectCo, LLC (the investment adviser) and its affiliates provide the Fund with investment management related services for which the Fund pays a monthly management fee. The management fee is the sum of an individual fund fee rate that is based on an annual rate of .30% of the Fund's average net assets and an annualized group fee rate that averaged .24% during the period. The group fee rate is based upon the average net assets of all the mutual funds advised by Fidelity Management & Research Company (FMR) and the investment adviser. The group fee rate decreases as assets under management increase and increases as assets under management decrease. For the reporting period, the total annual management fee rate was .54% of the Fund's average net assets.
Transfer Agent Fees. Fidelity Investments Institutional Operations Company, Inc. (FIIOC), an affiliate of the investment adviser, is the Fund's transfer, dividend disbursing, and shareholder servicing agent. FIIOC receives an asset-based fee with respect to each class. Each class pays a fee for transfer agent services, typesetting and printing and mailing of shareholder reports, excluding mailing of proxy statements, equal to an annual rate of class-level average net assets. The annual rate for Investor Class is .15% and the annual rate for all other classes is .07%. For the period, transfer agent fees for each class were as follows:
| Initial Class | $96,849 |
| Investor Class | 871,261 |
| | $968,110 |
Accounting and Security Lending Fees. Fidelity Service Company, Inc. (FSC), an affiliate of the investment adviser, maintains the Fund's accounting records. The accounting fee is based on the level of average net assets for each month. Prior to April 1, 2019, FSC had a separate agreement with the Fund for administration of the security lending program, based on the number and duration of lending transactions. For the period, the total fees paid for accounting and administration of securities lending were equivalent to the following annual rates:
| | % of Average Net Assets |
| VIP Technology Portfolio | .04 |
Brokerage Commissions. A portion of portfolio transactions were placed with brokerage firms which are affiliates of the investment adviser. Brokerage commissions are included in net realized gain (loss) and change in net unrealized appreciation (depreciation) in the Statement of Operations. The commissions paid to these affiliated firms were as follows:
| | Amount |
| VIP Technology Portfolio | $3,987 |
Interfund Trades. The Fund may purchase from or sell securities to other Fidelity Funds under procedures adopted by the Board. The procedures have been designed to ensure these interfund trades are executed in accordance with Rule 17a-7 of the 1940 Act. Interfund trades are included within the respective purchases and sales amounts shown in the Purchases and Sales of Investments note.
6. Committed Line of Credit.
The Fund participates with other funds managed by the investment adviser or an affiliate in a $4.25 billion credit facility (the "line of credit") to be utilized for temporary or emergency purposes to fund shareholder redemptions or for other short-term liquidity purposes. The Fund has agreed to pay commitment fees on its pro-rata portion of the line of credit, which amounted to $1,918 and is reflected in Miscellaneous expenses on the Statement of Operations. During the period, the Fund did not borrow on this line of credit.
7. Security Lending.
The Fund lends portfolio securities from time to time in order to earn additional income. For equity securities, lending agents are used, including National Financial Services (NFS), an affiliate of the Fund. Pursuant to a securities lending agreement, NFS will receive a fee, which is capped at 9.9% of daily lending revenue, for its services as lending agent. The Fund may lend securities to certain qualified borrowers. On the settlement date of the loan, the Fund receives collateral (in the form of U.S. Treasury obligations, letters of credit and/or cash) against the loaned securities and maintains collateral in an amount not less than 100% of the market value of the loaned securities during the period of the loan. The market value of the loaned securities is determined at the close of business of the Fund and any additional required collateral is delivered to the Fund on the next business day. The Fund or borrower may terminate the loan at any time, and if the borrower defaults on its obligation to return the securities loaned because of insolvency or other reasons, the Fund may apply collateral received from the borrower against the obligation. The Fund may experience delays and costs in recovering the securities loaned. Any cash collateral received is invested in the Fidelity Securities Lending Cash Central Fund. The value of loaned securities and cash collateral at period end are disclosed on the Fund's Statement of Assets and Liabilities. Total fees paid by the Fund to NFS amounted to $1,236. Security lending income represents the income earned on investing cash collateral, less rebates paid to borrowers and any lending agent fees associated with the loan, plus any premium payments received for lending certain types of securities. Security lending income is presented in the Statement of Operations as a component of income from Fidelity Central Funds.
8. Expense Reductions.
Commissions paid to certain brokers with whom the investment adviser, or its affiliates, places trades on behalf of the Fund include an amount in addition to trade execution, which may be rebated back to the Fund to offset certain expenses. This amount totaled $19,151 for the period.
In addition, during the period the investment adviser reimbursed and/or waived portion of fund-level operating expenses in the amount of $5,127.
9. Distributions to Shareholders.
Distributions to shareholders of each class were as follows:
| | Year ended
December 31, 2019 | Year ended
December 31, 2018 |
| Distributions to shareholders | | |
| Initial Class | $27,245,168 | $11,544,861 |
| Investor Class | 109,153,129 | 40,725,698 |
| Total | $136,398,297 | $52,270,559 |
10. Share Transactions.
Transactions for each class of shares were as follows:
| | Shares | Shares | Dollars | Dollars |
| | Year ended December 31, 2019 | Year ended December 31, 2018 | Year ended December 31, 2019 | Year ended December 31, 2018 |
| Initial Class | | | | |
| Shares sold | 1,321,158 | 1,652,009 | $21,834,669 | $31,765,341 |
| Reinvestment of distributions | 1,941,740 | 670,181 | 27,245,168 | 11,544,861 |
| Shares redeemed | (1,915,157) | (2,873,325) | (30,560,743) | (53,337,180) |
| Net increase (decrease) | 1,347,741 | (551,135) | $18,519,094 | $(10,026,978) |
| Investor Class | | | | |
| Shares sold | 4,920,807 | 7,335,943 | $81,295,545 | $138,857,274 |
| Reinvestment of distributions | 7,896,767 | 2,392,513 | 109,153,128 | 40,725,698 |
| Shares redeemed | (5,198,104) | (7,857,912) | (81,292,509) | (138,580,221) |
| Net increase (decrease) | 7,619,470 | 1,870,544 | $109,156,164 | $41,002,751 |
11. Other.
The Fund's organizational documents provide former and current trustees and officers with a limited indemnification against liabilities arising in connection with the performance of their duties to the Fund. In the normal course of business, the Fund may also enter into contracts that provide general indemnifications. The Fund's maximum exposure under these arrangements is unknown as this would be dependent on future claims that may be made against the Fund. The risk of material loss from such claims is considered remote.
At the end of the period, the investment adviser or its affiliates were the owners of record of 100% of the total outstanding shares of the Fund.
Effective January 1, 2020, following any required regulatory notices and approvals:
Investment advisers Fidelity Investments Money Management, Inc., FMR Co., Inc., and Fidelity SelectCo, LLC, merged with and into Fidelity Management & Research Company. In connection with the merger transactions, the resulting, merged investment adviser was then redomiciled from Massachusetts to Delaware, changed its corporate structure from a corporation to a limited liability company, and changed its name to "Fidelity Management & Research Company LLC".
Fidelity Investments Institutional Operations Company, Inc. (FIIOC) converted from a Massachusetts corporation to a Massachusetts LLC, and changed its name to "Fidelity Investments Institutional Operations Company LLC".
Report of Independent Registered Public Accounting Firm
To the Board of Trustees of Variable Insurance Products Fund IV and Shareholders of VIP Technology Portfolio:
Opinion on the Financial Statements
We have audited the accompanying statement of assets and liabilities, including the schedule of investments, of VIP Technology Portfolio (one of the funds constituting Variable Insurance Products Fund IV, referred to hereafter as the “Fund”) as of December 31, 2019, the related statement of operations for the year ended December 31, 2019, the statement of changes in net assets for each of the two years in the period ended December 31, 2019, including the related notes, and the financial highlights for each of the five years in the period ended December 31, 2019 (collectively referred to as the “financial statements”). In our opinion, the financial statements present fairly, in all material respects, the financial position of the Fund as of December 31, 2019, the results of its operations for the year then ended, the changes in its net assets for each of the two years in the period ended December 31, 2019 and the financial highlights for each of the five years in the period ended December 31, 2019 in conformity with accounting principles generally accepted in the United States of America.
Basis for Opinion
These financial statements are the responsibility of the Fund’s management. Our responsibility is to express an opinion on the Fund’s financial statements based on our audits. We are a public accounting firm registered with the Public Company Accounting Oversight Board (United States) (PCAOB) and are required to be independent with respect to the Fund in accordance with the U.S. federal securities laws and the applicable rules and regulations of the Securities and Exchange Commission and the PCAOB.
We conducted our audits of these financial statements in accordance with the standards of the PCAOB. Those standards require that we plan and perform the audit to obtain reasonable assurance about whether the financial statements are free of material misstatement, whether due to error or fraud.
Our audits included performing procedures to assess the risks of material misstatement of the financial statements, whether due to error or fraud, and performing procedures that respond to those risks. Such procedures included examining, on a test basis, evidence regarding the amounts and disclosures in the financial statements. Our audits also included evaluating the accounting principles used and significant estimates made by management, as well as evaluating the overall presentation of the financial statements. Our procedures included confirmation of securities owned as of December 31, 2019 by correspondence with the custodian and issuers of privately offered securities. We believe that our audits provide a reasonable basis for our opinion.
PricewaterhouseCoopers LLP
Boston, Massachusetts
February 13, 2020
We have served as the auditor of one or more investment companies in the Fidelity group of funds since 1932.
Trustees and Officers
The Trustees, Members of the Advisory Board (if any), and officers of the trust and fund, as applicable, are listed below. The Board of Trustees governs the fund and is responsible for protecting the interests of shareholders. The Trustees are experienced executives who meet periodically throughout the year to oversee the fund's activities, review contractual arrangements with companies that provide services to the fund, oversee management of the risks associated with such activities and contractual arrangements, and review the fund's performance. Except for Michael E. Wiley, each of the Trustees oversees 302 funds. Mr. Wiley oversees 199 funds.
The Trustees hold office without limit in time except that (a) any Trustee may resign; (b) any Trustee may be removed by written instrument, signed by at least two-thirds of the number of Trustees prior to such removal; (c) any Trustee who requests to be retired or who has become incapacitated by illness or injury may be retired by written instrument signed by a majority of the other Trustees; and (d) any Trustee may be removed at any special meeting of shareholders by a two-thirds vote of the outstanding voting securities of the trust. Each Trustee who is not an interested person (as defined in the Investment Company Act of 1940 (1940 Act)) of the trust and the fund is referred to herein as an Independent Trustee. Each Independent Trustee shall retire not later than the last day of the calendar year in which his or her 75th birthday occurs. The Independent Trustees may waive this mandatory retirement age policy with respect to individual Trustees. Officers and Advisory Board Members hold office without limit in time, except that any officer or Advisory Board Member may resign or may be removed by a vote of a majority of the Trustees at any regular meeting or any special meeting of the Trustees. Except as indicated, each individual has held the office shown or other offices in the same company for the past five years.
The fund’s Statement of Additional Information (SAI) includes more information about the Trustees. To request a free copy, call Fidelity at 1-877-208-0098.
Experience, Skills, Attributes, and Qualifications of the Trustees. The Governance and Nominating Committee has adopted a statement of policy that describes the experience, qualifications, attributes, and skills that are necessary and desirable for potential Independent Trustee candidates (Statement of Policy). The Board believes that each Trustee satisfied at the time he or she was initially elected or appointed a Trustee, and continues to satisfy, the standards contemplated by the Statement of Policy. The Governance and Nominating Committee also engages professional search firms to help identify potential Independent Trustee candidates who have the experience, qualifications, attributes, and skills consistent with the Statement of Policy. From time to time, additional criteria based on the composition and skills of the current Independent Trustees, as well as experience or skills that may be appropriate in light of future changes to board composition, business conditions, and regulatory or other developments, have also been considered by the professional search firms and the Governance and Nominating Committee. In addition, the Board takes into account the Trustees' commitment and participation in Board and committee meetings, as well as their leadership of standing and ad hoc committees throughout their tenure.
In determining that a particular Trustee was and continues to be qualified to serve as a Trustee, the Board has considered a variety of criteria, none of which, in isolation, was controlling. The Board believes that, collectively, the Trustees have balanced and diverse experience, qualifications, attributes, and skills, which allow the Board to operate effectively in governing the fund and protecting the interests of shareholders. Information about the specific experience, skills, attributes, and qualifications of each Trustee, which in each case led to the Board's conclusion that the Trustee should serve (or continue to serve) as a trustee of the fund, is provided below.
Board Structure and Oversight Function. James C. Curvey is an interested person and currently serves as Chairman. The Trustees have determined that an interested Chairman is appropriate and benefits shareholders because an interested Chairman has a personal and professional stake in the quality and continuity of services provided to the fund. Independent Trustees exercise their informed business judgment to appoint an individual of their choosing to serve as Chairman, regardless of whether the Trustee happens to be independent or a member of management. The Independent Trustees have determined that they can act independently and effectively without having an Independent Trustee serve as Chairman and that a key structural component for assuring that they are in a position to do so is for the Independent Trustees to constitute a substantial majority for the Board. The Independent Trustees also regularly meet in executive session. Ned C. Lautenbach serves as Chairman of the Independent Trustees and as such (i) acts as a liaison between the Independent Trustees and management with respect to matters important to the Independent Trustees and (ii) with management prepares agendas for Board meetings.
Fidelity® funds are overseen by different Boards of Trustees. The fund's Board oversees Fidelity's high income and certain equity funds, and other Boards oversee Fidelity's investment-grade bond, money market, asset allocation, and other equity funds. The asset allocation funds may invest in Fidelity® funds overseen by the fund's Board. The use of separate Boards, each with its own committee structure, allows the Trustees of each group of Fidelity® funds to focus on the unique issues of the funds they oversee, including common research, investment, and operational issues. On occasion, the separate Boards establish joint committees to address issues of overlapping consequences for the Fidelity® funds overseen by each Board.
The Trustees operate using a system of committees to facilitate the timely and efficient consideration of all matters of importance to the Trustees, the fund, and fund shareholders and to facilitate compliance with legal and regulatory requirements and oversight of the fund's activities and associated risks. The Board, acting through its committees, has charged FMR and its affiliates with (i) identifying events or circumstances the occurrence of which could have demonstrably adverse effects on the fund's business and/or reputation; (ii) implementing processes and controls to lessen the possibility that such events or circumstances occur or to mitigate the effects of such events or circumstances if they do occur; and (iii) creating and maintaining a system designed to evaluate continuously business and market conditions in order to facilitate the identification and implementation processes described in (i) and (ii) above. Because the day-to-day operations and activities of the fund are carried out by or through FMR, its affiliates, and other service providers, the fund's exposure to risks is mitigated but not eliminated by the processes overseen by the Trustees. While each of the Board's committees has responsibility for overseeing different aspects of the fund's activities, oversight is exercised primarily through the Operations, Audit, and Compliance Committees. Appropriate personnel, including but not limited to the fund's Chief Compliance Officer (CCO), FMR's internal auditor, the independent accountants, the fund's Treasurer and portfolio management personnel, make periodic reports to the Board's committees, as appropriate, including an annual review of Fidelity's risk management program for the Fidelity® funds. The responsibilities of each standing committee, including their oversight responsibilities, are described further under "Standing Committees of the Trustees."
Interested Trustees*:
Correspondence intended for a Trustee who is an interested person may be sent to Fidelity Investments, 245 Summer Street, Boston, Massachusetts 02210.
Name, Year of Birth; Principal Occupations and Other Relevant Experience+
James C. Curvey (1935)
Year of Election or Appointment: 2018
Trustee
Chairman of the Board of Trustees
Mr. Curvey also serves as Trustee of other Fidelity® funds. Mr. Curvey is Vice Chairman (2007-present) and Director of FMR LLC (diversified financial services company). In addition, Mr. Curvey is an Overseer Emeritus for the Boston Symphony Orchestra, a Director of Artis-Naples, and a Trustee of Brewster Academy in Wolfeboro, New Hampshire. Previously, Mr. Curvey served as a Director of Fidelity Research & Analysis Co. (investment adviser firm, 2009-2018), Director of Fidelity Investments Money Management, Inc. (investment adviser firm, 2009-2014) and a Director of FMR and FMR Co., Inc. (investment adviser firms, 2007-2014).
* Determined to be an “Interested Trustee” by virtue of, among other things, his or her affiliation with the trust or various entities under common control with FMR.
+ The information includes the Trustee's principal occupation during the last five years and other information relating to the experience, attributes, and skills relevant to the Trustee's qualifications to serve as a Trustee, which led to the conclusion that the Trustee should serve as a Trustee for the fund.
Independent Trustees:
Correspondence intended for an Independent Trustee may be sent to Fidelity Investments, P.O. Box 55235, Boston, Massachusetts 02205-5235.
Name, Year of Birth; Principal Occupations and Other Relevant Experience+
Dennis J. Dirks (1948)
Year of Election or Appointment: 2018
Trustee
Mr. Dirks also serves as Trustee of other Fidelity® funds. Prior to his retirement in May 2003, Mr. Dirks was Chief Operating Officer and a member of the Board of The Depository Trust & Clearing Corporation (DTCC). He also served as President, Chief Operating Officer, and Board member of The Depository Trust Company (DTC) and President and Board member of the National Securities Clearing Corporation (NSCC). In addition, Mr. Dirks served as Chief Executive Officer and Board member of the Government Securities Clearing Corporation, Chief Executive Officer and Board member of the Mortgage-Backed Securities Clearing Corporation, as a Trustee and a member of the Finance Committee of Manhattan College (2005-2008), as a Trustee and a member of the Finance Committee of AHRC of Nassau County (2006-2008), as a member of the Independent Directors Council (IDC) Governing Council (2010-2015), and as a member of the Board of Directors for The Brookville Center for Children’s Services, Inc. (2009-2017). Mr. Dirks is a member of the Finance Committee (2016-present) and Board of Directors (2017-present) and is Treasurer (2018-present) of the Asolo Repertory Theatre.
Donald F. Donahue (1950)
Year of Election or Appointment: 2018
Trustee
Mr. Donahue also serves as a Trustee of other Fidelity® funds. Mr. Donahue is President and Chief Executive Officer of Miranda Partners, LLC (risk consulting for the financial services industry, 2012-present). Previously, Mr. Donahue served as a Member of the Advisory Board of certain Fidelity® funds (2015-2018) and Chief Executive Officer (2006-2012), Chief Operating Officer (2003-2006), and Managing Director, Customer Marketing and Development (1999-2003) of The Depository Trust & Clearing Corporation (financial markets infrastructure). Mr. Donahue serves as a Member (2007-present) and Co-Chairman (2016-present) of the Board of Directors of United Way of New York, Member of the Board of Directors of NYC Leadership Academy (2012-present) and Member of the Board of Advisors of Ripple Labs, Inc. (financial services, 2015-present). He also served as Chairman (2010-2012) and Member of the Board of Directors (2012-2013) of Omgeo, LLC (financial services), Treasurer of United Way of New York (2012-2016), and Member of the Board of Directors of XBRL US (financial services non-profit, 2009-2012) and the International Securities Services Association (2009-2012).
Alan J. Lacy (1953)
Year of Election or Appointment: 2018
Trustee
Mr. Lacy also serves as Trustee of other Fidelity® funds. Mr. Lacy serves as a Director of Bristol-Myers Squibb Company (global pharmaceuticals, 2008-present). He is a Trustee of the California Chapter of The Nature Conservancy (2015-present) and a Director of the Center for Advanced Study in the Behavioral Sciences at Stanford University (2015-present). In addition, Mr. Lacy served as Senior Adviser (2007-2014) of Oak Hill Capital Partners, L.P. (private equity) and also served as Chief Executive Officer (2005) and Vice Chairman (2005-2006) of Sears Holdings Corporation (retail) and Chief Executive Officer and Chairman of the Board of Sears, Roebuck and Co. (retail, 2000-2005). Previously, Mr. Lacy served as Chairman (2014-2017) and a member (2010-2017) of the Board of Directors of Dave & Buster’s Entertainment, Inc. (restaurant and entertainment complexes), as Chairman (2008-2011) and a member (2006-2015) of the Board of Trustees of the National Parks Conservation Association, and as a member of the Board of Directors for The Hillman Companies, Inc. (hardware wholesalers, 2010-2014), Earth Fare, Inc. (retail grocery, 2010-2014), and The Western Union Company (global money transfer, 2006-2011).
Ned C. Lautenbach (1944)
Year of Election or Appointment: 2018
Trustee
Chairman of the Independent Trustees
Mr. Lautenbach also serves as Trustee of other Fidelity® funds. Mr. Lautenbach currently serves as Chair (2018-present) and Member (2013-present) of the Board of Governors, State University System of Florida and is a member of the Council on Foreign Relations (1994-present). He is also a member and has most recently served as Chairman of the Board of Directors of Artis-Naples (2012-present). Previously, Mr. Lautenbach served as a member and then Lead Director of the Board of Directors of Eaton Corporation (diversified industrial, 1997-2016). He was also a Partner and Advisory Partner at Clayton, Dubilier & Rice, LLC (private equity investment, 1998-2010), as well as a Director of Sony Corporation (2006-2007). In addition, Mr. Lautenbach also had a 30-year career with IBM (technology company) during which time he served as Senior Vice President and a member of the Corporate Executive Committee (1968-1998).
Joseph Mauriello (1944)
Year of Election or Appointment: 2018
Trustee
Mr. Mauriello also serves as Trustee of other Fidelity® funds. Prior to his retirement in January 2006, Mr. Mauriello served in numerous senior management positions including Deputy Chairman and Chief Operating Officer (2004-2005), and Vice Chairman of Financial Services (2002-2004) of KPMG LLP US (professional services, 1965-2005). Mr. Mauriello currently serves as a member of the Independent Directors Council (IDC) Governing Council (2015-present). Previously, Mr. Mauriello served as a member of the Board of Directors of XL Group plc. (global insurance and re-insurance, 2006-2018).
Cornelia M. Small (1944)
Year of Election or Appointment: 2018
Trustee
Ms. Small also serves as Trustee of other Fidelity® funds. Ms. Small is a member of the Board of Directors (2009-present) and Chair of the Investment Committee (2010-present) of the Teagle Foundation. Ms. Small also serves on the Investment Committee of the Berkshire Taconic Community Foundation (2008-present). Previously, Ms. Small served as Chairperson (2002-2008) and a member of the Investment Committee and Chairperson (2008-2012) and a member of the Board of Trustees of Smith College. In addition, Ms. Small served as Chief Investment Officer, Director of Global Equity Investments, and a member of the Board of Directors of Scudder, Stevens & Clark and Scudder Kemper Investments.
Garnett A. Smith (1947)
Year of Election or Appointment: 2013
Trustee
Mr. Smith also serves as Trustee of other Fidelity® funds. Prior to Mr. Smith's retirement, he served as Chairman and Chief Executive Officer of Inbrand Corp. (manufacturer of personal absorbent products, 1990-1997). He also served as President (1986-1990) of Inbrand Corp. Prior to his employment with Inbrand Corp., he was employed by a retail fabric chain and North Carolina National Bank. In addition, Mr. Smith served as a Member of the Advisory Board of certain Fidelity® funds (2012-2013) and as a board member of the Jackson Hole Land Trust (2009-2012).
David M. Thomas (1949)
Year of Election or Appointment: 2018
Trustee
Mr. Thomas also serves as Trustee of other Fidelity® funds. Mr. Thomas serves as Non-Executive Chairman of the Board of Directors of Fortune Brands Home and Security (home and security products, 2011-present) and as a member of the Board of Directors (2004-present) and Presiding Director (2013-present) of Interpublic Group of Companies, Inc. (marketing communication). Previously, Mr. Thomas served as Executive Chairman (2005-2006) and Chairman and Chief Executive Officer (2000-2005) of IMS Health, Inc. (pharmaceutical and healthcare information solutions), a Director of Fortune Brands, Inc. (consumer products, 2000-2011), and a member of the Board of Trustees of the University of Florida (2013-2018).
Michael E. Wiley (1950)
Year of Election or Appointment: 2008
Trustee
Mr. Wiley also serves as Trustee or Member of the Advisory Board of other Fidelity® funds. Mr. Wiley serves as a Director of High Point Resources (exploration and production, 2005-present). Previously, Mr. Wiley served as a Director of Andeavor Corporation (independent oil refiner and marketer, 2005-2018), a Director of Andeavor Logistics LP (natural resources logistics, 2015-2018), a Director of Post Oak Bank (privately-held bank, 2004-2018), a Director of Asia Pacific Exploration Consolidated (international oil and gas exploration and production, 2008-2013), a member of the Board of Trustees of the University of Tulsa (2000-2006; 2007-2010), a Senior Energy Advisor of Katzenbach Partners, LLC (consulting, 2006-2007), an Advisory Director of Riverstone Holdings (private investment), a Director of Spinnaker Exploration Company (exploration and production, 2001-2005) and Chairman, President, and CEO of Baker Hughes, Inc. (oilfield services, 2000-2004).
+ The information includes the Trustee's principal occupation during the last five years and other information relating to the experience, attributes, and skills relevant to the Trustee's qualifications to serve as a Trustee, which led to the conclusion that the Trustee should serve as a Trustee for the fund.
Advisory Board Members and Officers:
Correspondence intended for a Member of the Advisory Board (if any) may be sent to Fidelity Investments, P.O. Box 55235, Boston, Massachusetts 02205-5235. Correspondence intended for an officer or Peter S. Lynch may be sent to Fidelity Investments, 245 Summer Street, Boston, Massachusetts 02210. Officers appear below in alphabetical order.
Name, Year of Birth; Principal Occupation
Vicki L. Fuller (1957)
Year of Election or Appointment: 2018
Member of the Advisory Board
Ms. Fuller also serves as Member of the Advisory Board of other Fidelity® funds. Ms. Fuller serves as a member of the Board of Directors, Audit Committee, and Nominating and Governance Committee of The Williams Companies, Inc. (natural gas infrastructure, 2018-present). Previously, Ms. Fuller served as the Chief Investment Officer of the New York State Common Retirement Fund (2012-2018) and held a variety of positions at AllianceBernstein L.P. (global asset management, 1985-2012), including Managing Director (2006-2012) and Senior Vice President and Senior Portfolio Manager (2001-2006).
Patricia L. Kampling (1959)
Year of Election or Appointment: 2020
Member of the Advisory Board
Ms. Kampling also serves as Member of the Advisory Board of other Fidelity® funds. Prior to her retirement, Ms. Kampling served as Chairman of the Board and Chief Executive Officer (2012-2019), President and Chief Operating Officer (2011-2012) and Executive Vice President and Chief Financial Officer (2010-2011) of Alliant Energy Corporation. Ms. Kampling currently serves as a member of the Board, Compensation Committee and Executive Committee and as Chair of the Audit Committee of Briggs & Stratton Corporation (manufacturing, 2011-present) and as a member of the Board, Audit, Finance and Risk Committee and Safety, Environmental, Technology and Operations Committee of American Water Works Company, Inc. (utilities company, 2019-present). In addition, Ms. Kampling currently serves as a member of the Board of the Nature Conservancy, Wisconsin Chapter (2019-present). Previously, Ms. Kampling served as a member of the Board of Interstate Power and Light Company (2012-2019) and Wisconsin Power and Light Company (2012-2019) (each a subsidiary of Alliant Energy Corporation) and as a member of the Board and Workforce Development Committee of the Business Roundtable (2018-2019).
Peter S. Lynch (1944)
Year of Election or Appointment: 2018
Member of the Advisory Board
Mr. Lynch also serves as Member of the Advisory Board of other Fidelity® funds. Mr. Lynch is Vice Chairman and a Director of Fidelity Management & Research Company LLC (investment adviser firm). In addition, Mr. Lynch serves as a Trustee of Boston College and as the Chairman of the Inner-City Scholarship Fund. Previously, Mr. Lynch served as Vice Chairman and a Director of FMR Co., Inc. (investment adviser firm) and on the Special Olympics International Board of Directors (1997-2006).
Susan Tomasky (1953)
Year of Election or Appointment: 2020
Member of the Advisory Board
Ms. Tomasky also serves as Member of the Advisory Board of other Fidelity® funds. Prior to her retirement, Ms. Tomasky served in various executive officer positions at American Electric Power Company, Inc. (1998-2011), including most recently as President of AEP Transmission (2007-2011). Ms. Tomasky currently serves as a member of the Board and Sustainability Committee and as Chair of the Audit Committee of Marathon Petroleum Corporation (2018-present) and as a member of the Board, Corporate Governance Committee and Organization and Compensation Committee and as Chair of the Audit Committee of Public Service Enterprise Group, Inc. (utilities company, 2012-present). In addition, Ms. Tomasky currently serves as a member of the Board of the Columbus Regional Airport Authority (2007-present), as a member of the Board of the Royal Shakespeare Company – America (2009-present), as a member of the Board of the Columbus Association for the Performing Arts (2011-present) and as a member of the Board of Kenyon College (2016-present). Previously, Ms. Tomasky served as a member of the Board (2011-2019) and as Lead Independent Director (2015-2018) of Andeavor Corporation (previously Tesoro Corporation) (independent oil refiner and marketer) and as a member of the Board of Summit Midstream Partners LP (energy, 2012-2018).
Elizabeth Paige Baumann (1968)
Year of Election or Appointment: 2017
Anti-Money Laundering (AML) Officer
Ms. Baumann also serves as AML Officer of other funds. She is Chief AML Officer (2012-present) and Senior Vice President (2014-present) of FMR LLC (diversified financial services company) and is an employee of Fidelity Investments. Previously, Ms. Baumann served as AML Officer of the funds (2012-2016), and Vice President (2007-2014) and Deputy Anti-Money Laundering Officer (2007-2012) of FMR LLC.
Craig S. Brown (1977)
Year of Election or Appointment: 2019
Assistant Treasurer
Mr. Brown also serves as Assistant Treasurer of other funds. Mr. Brown is an employee of Fidelity Investments (2013-present).
John J. Burke III (1964)
Year of Election or Appointment: 2018
Chief Financial Officer
Mr. Burke also serves as Chief Financial Officer of other funds. Mr. Burke serves as Head of Investment Operations for Fidelity Fund and Investment Operations (2018-present) and is an employee of Fidelity Investments (1998-present). Previously Mr. Burke served as head of Asset Management Investment Operations (2012-2018).
William C. Coffey (1969)
Year of Election or Appointment: 2019
Assistant Secretary
Mr. Coffey also serves as Assistant Secretary of other funds. He is Senior Vice President and Deputy General Counsel of FMR LLC (diversified financial services company, 2010-present), and is an employee of Fidelity Investments. Previously, Mr. Coffey served as Secretary and CLO of certain funds (2018-2019); CLO, Secretary, and Senior Vice President of Fidelity Management & Research Company and FMR Co., Inc. (investment adviser firms, 2018-2019); Secretary of Fidelity SelectCo, LLC and Fidelity Investments Money Management, Inc. (investment adviser firms, 2018-2019); CLO of Fidelity Management & Research (Hong Kong) Limited, FMR Investment Management (UK) Limited, and Fidelity Management & Research (Japan) Limited (investment adviser firms, 2018-2019); and Assistant Secretary of certain funds (2009-2018).
Timothy M. Cohen (1969)
Year of Election or Appointment: 2018
Vice President
Mr. Cohen also serves as Vice President of other funds. Mr. Cohen serves as Co-Head of Equity (2018-present), a Director of Fidelity Management & Research (Japan) Limited (investment adviser firm, 2016-present), and is an employee of Fidelity Investments. Previously, Mr. Cohen served as Executive Vice President of Fidelity SelectCo, LLC (2019), Head of Global Equity Research (2016-2018), Chief Investment Officer - Equity and a Director of Fidelity Management & Research (U.K.) Inc. (investment adviser firm, 2013-2015) and as a Director of Fidelity Management & Research (Hong Kong) Limited (investment adviser firm, 2017).
Jonathan Davis (1968)
Year of Election or Appointment: 2010
Assistant Treasurer
Mr. Davis also serves as Assistant Treasurer of other funds. Mr. Davis serves as Assistant Treasurer of FMR Capital, Inc. (2017-present) and is an employee of Fidelity Investments. Previously, Mr. Davis served as Vice President and Associate General Counsel of FMR LLC (diversified financial services company, 2003-2010).
Laura M. Del Prato (1964)
Year of Election or Appointment: 2018
Assistant Treasurer
Ms. Del Prato also serves as an officer of other funds. Ms. Del Prato is an employee of Fidelity Investments (2017-present). Prior to joining Fidelity Investments, Ms. Del Prato served as a Managing Director and Treasurer of the JPMorgan Mutual Funds (2014-2017). Prior to JPMorgan, Ms. Del Prato served as a partner at Cohen Fund Audit Services (accounting firm, 2012-2013) and KPMG LLP (accounting firm, 2004-2012).
Colm A. Hogan (1973)
Year of Election or Appointment: 2020
Assistant Treasurer
Mr. Hogan also serves as an officer of other funds. Mr. Hogan serves as Assistant Treasurer of FMR Capital, Inc. (2017-present) and is an employee of Fidelity Investments (2005-present). Previously, Mr. Hogan served as Deputy Treasurer of certain Fidelity® funds (2016-2020) and Assistant Treasurer of certain Fidelity® funds (2016-2018).
Pamela R. Holding (1964)
Year of Election or Appointment: 2018
Vice President
Ms. Holding also serves as Vice President of other funds. Ms. Holding serves as Co-Head of Equity (2018-present) and is an employee of Fidelity Investments (2013-present). Previously, Ms. Holding served as Executive Vice President of Fidelity SelectCo, LLC (2019) and as Chief Investment Officer of Fidelity Institutional Asset Management (2013-2018).
Cynthia Lo Bessette (1969)
Year of Election or Appointment: 2019
Secretary and Chief Legal Officer (CLO)
Ms. Lo Bessette also serves as an officer of other funds. Ms. Lo Bessette serves as CLO, Secretary, and Senior Vice President of Fidelity Management & Research Company LLC (investment adviser firm, 2019-present); and CLO of Fidelity Management & Research (Hong Kong) Limited, FMR Investment Management (UK) Limited, and Fidelity Management & Research (Japan) Limited (investment adviser firms, 2019-present). She is a Senior Vice President and Deputy General Counsel of FMR LLC (diversified financial services company, 2019-present), and is an employee of Fidelity Investments. Previously, Ms. Lo Bessette served as CLO, Secretary, and Senior Vice President of FMR Co., Inc. (investment adviser firm, 2019); Secretary of Fidelity SelectCo, LLC and Fidelity Investments Money Management, Inc. (investment adviser firms, 2019). Prior to joining Fidelity Investments, Ms. Lo Bessette was Executive Vice President, General Counsel (2016-2019) and Senior Vice President, Deputy General Counsel (2015-2016) of OppenheimerFunds (investment management company) and Deputy Chief Legal Officer (2013-2015) of Jennison Associates LLC (investment adviser firm).
Chris Maher (1972)
Year of Election or Appointment: 2020
Deputy Treasurer
Mr. Maher also serves as an officer of other funds. Mr. Maher serves as Assistant Treasurer of FMR Capital, Inc. (2017-present), and is an employee of Fidelity Investments (2008-present). Previously, Mr. Maher served as Assistant Treasurer of certain funds (2013-2020); Vice President of Asset Management Compliance (2013), Vice President of the Program Management Group of FMR (investment adviser firm, 2010-2013), and Vice President of Valuation Oversight (2008-2010).
Kenneth B. Robins (1969)
Year of Election or Appointment: 2018
Chief Compliance Officer
Mr. Robins also serves as an officer of other funds. Mr. Robins serves as Compliance Officer of Fidelity Management & Research Company LLC (investment adviser firm, 2016-present) and is an employee of Fidelity Investments (2004-present). Previously, Mr. Robins served as Compliance Officer of FMR Co., Inc. (investment adviser firm, 2016-2019), as Executive Vice President of Fidelity Investments Money Management, Inc. (investment adviser firm, 2013-2016) and served in other fund officer roles.
Stacie M. Smith (1974)
Year of Election or Appointment: 2018
President and Treasurer
Ms. Smith also serves as an officer of other funds. Ms. Smith serves as Assistant Treasurer of FMR Capital, Inc. (2017-present), is an employee of Fidelity Investments (2009-present), and has served in other fund officer roles. Prior to joining Fidelity Investments, Ms. Smith served as Senior Audit Manager of Ernst & Young LLP (accounting firm, 1996-2009). Previously, Ms. Smith served as Assistant Treasurer (2013-2019) and Deputy Treasurer (2013-2016) of certain Fidelity® funds.
Marc L. Spector (1972)
Year of Election or Appointment: 2017
Assistant Treasurer
Mr. Spector also serves as an officer of other funds. Mr. Spector serves as Assistant Treasurer of FMR Capital, Inc. (2017-present) and is an employee of Fidelity Investments (2016-present). Prior to joining Fidelity Investments, Mr. Spector served as Director at the Siegfried Group (accounting firm, 2013-2016), and prior to Siegfried Group as audit senior manager at Deloitte & Touche (accounting firm, 2005-2013).
Jim Wegmann (1979)
Year of Election or Appointment: 2019
Assistant Treasurer
Mr. Wegmann also serves as Assistant Treasurer of other funds. Mr. Wegmann is an employee of Fidelity Investments (2011-present).
Shareholder Expense Example
As a shareholder of the Fund, you incur two types of costs: (1) transaction costs and (2) ongoing costs, including management fees and other Fund expenses. This Example is intended to help you understand your ongoing costs (in dollars) of investing in the Fund and to compare these costs with the ongoing costs of investing in other mutual funds.
The Example is based on an investment of $1,000 invested at the beginning of the period and held for the entire period (July 1, 2019 to December 31, 2019).
Actual Expenses
The first line of the accompanying table for each class of the Fund provides information about actual account values and actual expenses. You may use the information in this line, together with the amount you invested, to estimate the expenses that you paid over the period. Simply divide your account value by $1,000.00 (for example, an $8,600 account value divided by $1,000.00 = 8.6), then multiply the result by the number in the first line for a class of the Fund under the heading entitled "Expenses Paid During Period" to estimate the expenses you paid on your account during this period. The estimate of expenses does not include any fees or other expenses of any variable annuity or variable life insurance product. If they were, the estimate of expenses you paid during the period would be higher, and your ending account value would be lower. In addition, the Fund, as a shareholder in the underlying Fidelity Central Funds, will indirectly bear its pro-rata share of the fees and expenses incurred by the underlying Fidelity Central Funds. These fees and expenses are not included in the Fund's annualized expense ratio used to calculate the expense estimate in the table below.
Hypothetical Example for Comparison Purposes
The second line of the accompanying table for each class of the Fund provides information about hypothetical account values and hypothetical expenses based on a Class' actual expense ratio and an assumed rate of return of 5% per year before expenses, which is not the Class' actual return. The hypothetical account values and expenses may not be used to estimate the actual ending account balance or expenses you paid for the period. You may use this information to compare the ongoing costs of investing in the Fund and other funds. To do so, compare this 5% hypothetical example with the 5% hypothetical examples that appear in the shareholder reports of the other funds. The estimate of expenses does not include any fees or other expenses of any variable annuity or variable life insurance product. If they were, the estimate of expenses you paid during the period would be higher, and your ending account value would be lower. In addition, the Fund, as a shareholder in the underlying Fidelity Central Funds, will indirectly bear its pro-rata share of the fees and expenses incurred by the underlying Fidelity Central Funds. These fees and expenses are not included in the Fund's annualized expense ratio used to calculate the expense estimate in the table below.
Please note that the expenses shown in the table are meant to highlight your ongoing costs only and do not reflect any transaction costs. Therefore, the second line of the table is useful in comparing ongoing costs only, and will not help you determine the relative total costs of owning different funds.
| | Annualized Expense Ratio-A | Beginning
Account Value
July 1, 2019 | Ending
Account Value
December 31, 2019 | Expenses Paid
During Period-B
July 1, 2019
to December 31, 2019 |
| Initial Class | .64% | | | |
| Actual | | $1,000.00 | $1,182.60 | $3.52 |
| Hypothetical-C | | $1,000.00 | $1,021.98 | $3.26 |
| Investor Class | .72% | | | |
| Actual | | $1,000.00 | $1,182.10 | $3.96 |
| Hypothetical-C | | $1,000.00 | $1,021.58 | $3.67 |
A Annualized expense ratio reflects expenses net of applicable fee waivers.
B Expenses are equal to each Class' annualized expense ratio, multiplied by the average account value over the period, multiplied by 184/365 (to reflect the one-half year period).
C 5% return per year before expenses
Distributions (Unaudited)
The Board of Trustees of VIP Technology Portfolio voted to pay to shareholders of record at the opening of business on record date, the following distributions per share derived from capital gains realized from sales of portfolio securities, and dividends derived from net investment income:
| | Pay Date | Record Date | Dividends | Capital Gains |
| VIP Technology Portfolio | | | | |
| Initial Class | 02/07/20 | 02/07/20 | $0.018 | $0.01 |
| Investor Class | 02/07/20 | 02/07/20 | $0.016 | $0.01 |
|
Initial Class and Investor Class designate 100% of the dividend distributed during the fiscal year as qualifying for the dividends–received deduction for corporate shareholders.
Board Approval of Investment Advisory Contracts
VIP Technology Portfolio
At its November 2019 meeting, the Board of Trustees, including the Independent Trustees (together, the Board), voted to approve an amended and restated management contract and amended and restated sub-advisory agreements (together, the Amended and Restated Contracts) for the fund, effective January 1, 2020, for a one month period through January 31, 2020, in connection with an upcoming consolidation of certain of Fidelity's advisory businesses.
The Board considered that, on or about January 1, 2020, each of FMR Co., Inc. (FMRC), Fidelity Investments Money Management, Inc. (FIMM), and SelectCo, LLC (SelectCo) will merge with and into Fidelity Management & Research Company (FMR) and that, after the merger, FMR will redomicile as a Delaware limited liability company. The Board also approved the termination of the sub-advisory agreement with FMRC upon the completion of the merger. The Board noted that the Amended and Restated Contracts would be updated to reflect the renamed adviser, Fidelity Management & Research Company LLC and its new form of organization and domicile. The Board also noted that the Amended and Restated Contracts will not change the investment processes, the level or nature of services provided, the resources and personnel allocated, trading and compliance operations, or any fees or expenses paid by the fund.
The Board concluded that the fund's Amended and Restated Contracts are fair and reasonable, and that the fund's Advisory Contracts should be approved through January 31, 2020.
In connection with its consideration of future renewals of the fund's Amended and Restated Contracts, the Board will consider: (i) the nature, extent and quality of services provided to the fund, including shareholder and administrative services and investment performance; (ii) the competitiveness of the management fee and total expenses for the fund; (iii) the costs of the services and profitability, including the revenues earned and the expenses incurred in conducting the business of developing, marketing, distributing, managing, administering, and servicing the fund and its shareholders, to the extent applicable; and (iv) whether there have been economies of scale in respect of the Fidelity funds, whether the Fidelity funds (including the fund) have appropriately benefited from any such economies of scale, and whether there is the potential for realization of any further economies.
Based on its evaluation of all of the conclusions noted above, and after considering all factors it believed relevant, the Board ultimately concluded that the fund's management fee structure is fair and reasonable, and that the continuation of the fund's Amended and Restated Contracts should be approved.
VTECIC-ANN-0220
1.817385.114
Fidelity® Variable Insurance Products:
Utilities Portfolio
Annual Report
December 31, 2019
See the inside front cover for important information about access to your fund’s shareholder reports.
Beginning on January 1, 2021, as permitted by regulations adopted by the Securities and Exchange Commission, and if your insurance carrier elects to participate, you may not be receiving paper copies of the Fund’s shareholder reports from the insurance company that offers your variable insurance product unless you specifically request paper copies from your financial professional or the administrator of your variable insurance product. Instead, the reports will be made available on a website, and you will be notified by mail each time a report is posted and provided with a website link to access the report.
If you already elected to receive shareholder reports electronically, you will not be affected by this change and you need not take any action. You may elect to receive shareholder reports and other communications from the Fund electronically, by contacting your financial professional or the administrator of your variable insurance product. If you own a Fidelity-administered variable insurance product, please visit fidelity.com/mailpreferences to make your election or call 1-800-343-3548.
You may elect to receive all future reports in paper free of charge. If you wish to continue receiving paper copies of your shareholder reports, you may contact your financial professional or the administrator of your variable insurance product. If you own a Fidelity-administered variable insurance product, please visit fidelity.com/mailpreferences to make your election or call 1-800-343-3548. Your election to receive reports in paper will apply to all funds available under your variable insurance product.
Contents
To view a fund's proxy voting guidelines and proxy voting record for the 12-month period ended June 30, visit http://www.fidelity.com/proxyvotingresults or visit the Securities and Exchange Commission's (SEC) web site at http://www.sec.gov.
You may also call 1-877-208-0098 to request a free copy of the proxy voting guidelines.
Fidelity® Variable Insurance Products are separate account options which are purchased through a variable insurance contract.
Standard & Poor's, S&P and S&P 500 are registered service marks of The McGraw-Hill Companies, Inc. and have been licensed for use by Fidelity Distributors Corporation.
Other third-party marks appearing herein are the property of their respective owners.
All other marks appearing herein are registered or unregistered trademarks or service marks of FMR LLC or an affiliated company. © 2020 FMR LLC. All rights reserved.
This report and the financial statements contained herein are submitted for the general information of the shareholders of the Fund. This report is not authorized for distribution to prospective investors in the Fund unless preceded or accompanied by an effective prospectus.
A fund files its complete schedule of portfolio holdings with the SEC for the first and third quarters of each fiscal year on Form N-PORT. Forms N-PORT are available on the SEC’s web site at http://www.sec.gov. A fund's Forms N-PORT may be reviewed and copied at the SEC’s Public Reference Room in Washington, DC. Information regarding the operation of the SEC's Public Reference Room may be obtained by calling 1-800-SEC-0330.
For a complete list of a fund's portfolio holdings, view the most recent holdings listing, semiannual report, or annual report on Fidelity's web site at http://www.fidelity.com, http://www.institutional.fidelity.com, or http://www.401k.com, as applicable.
NOT FDIC INSURED •MAY LOSE VALUE •NO BANK GUARANTEE
Neither the Fund nor Fidelity Distributors Corporation is a bank.
Note to shareholders:
As part of a regular review of its organizational structure, Fidelity has decided to merge certain entities to streamline operations, increase efficiency, simplify reporting, and reduce legal, compliance, and accounting complexity and costs. In separate events, Fidelity has merged four of its investment advisers and two of its broker-dealers.
Effective on or about January 1, 2020, following any required regulatory notices and approvals:
Investment advisers Fidelity Investments Money Management, Inc., FMR Co., Inc., and Fidelity SelectCo, LLC, merged with and into Fidelity Management & Research Company. In connection with the merger transactions, the resulting, merged investment adviser was then redomiciled from Massachusetts to Delaware, changed its corporate structure from a corporation to a limited liability company, and changed its name to “Fidelity Management & Research Company LLC”.
Broker-dealer Fidelity Distributors Corporation merged with and into Fidelity Investments Institutional Services Company, Inc. (“FIISC”). FIISC was then redomiciled from Massachusetts to Delaware, changed its corporate structure from a corporation to a limited liability company, and changed its name to “Fidelity Distributors Company LLC”.
These mergers are not expected to affect fund shareholders or Fidelity clients, nor are they expected to result in any changes to the day-to-day management of Fidelity’s brokerage services, the Fidelity funds, their investment policies and practices, their portfolio management teams, or the funds’ expenses.
Performance: The Bottom Line
Average annual total return reflects the change in the value of an investment, assuming reinvestment of distributions from dividend income and capital gains (the profits earned upon the sale of securities that have grown in value, if any) and assuming a constant rate of performance each year. During periods of reimbursement by Fidelity, a fund’s total return will be greater than it would be had the reimbursement not occurred. Performance numbers are net of all underlying fund operating expenses, but do not include any insurance charges imposed by your insurance company’s separate account. If performance information included the effect of these additional charges, the total returns would have been lower. How a fund did yesterday is no guarantee of how it will do tomorrow.
Average Annual Total Returns
| For the periods ended December 31, 2019 | Past 1 year | Past 5 years | Past 10 years |
| Initial Class | 23.18% | 9.99% | 12.36% |
| Investor Class | 23.14% | 9.91% | 12.27% |
$10,000 Over 10 Years
Let's say hypothetically that $10,000 was invested in VIP Utilities Portfolio - Initial Class on December 31, 2009.
The chart shows how the value of your investment would have changed, and also shows how the S&P 500® Index performed over the same period.
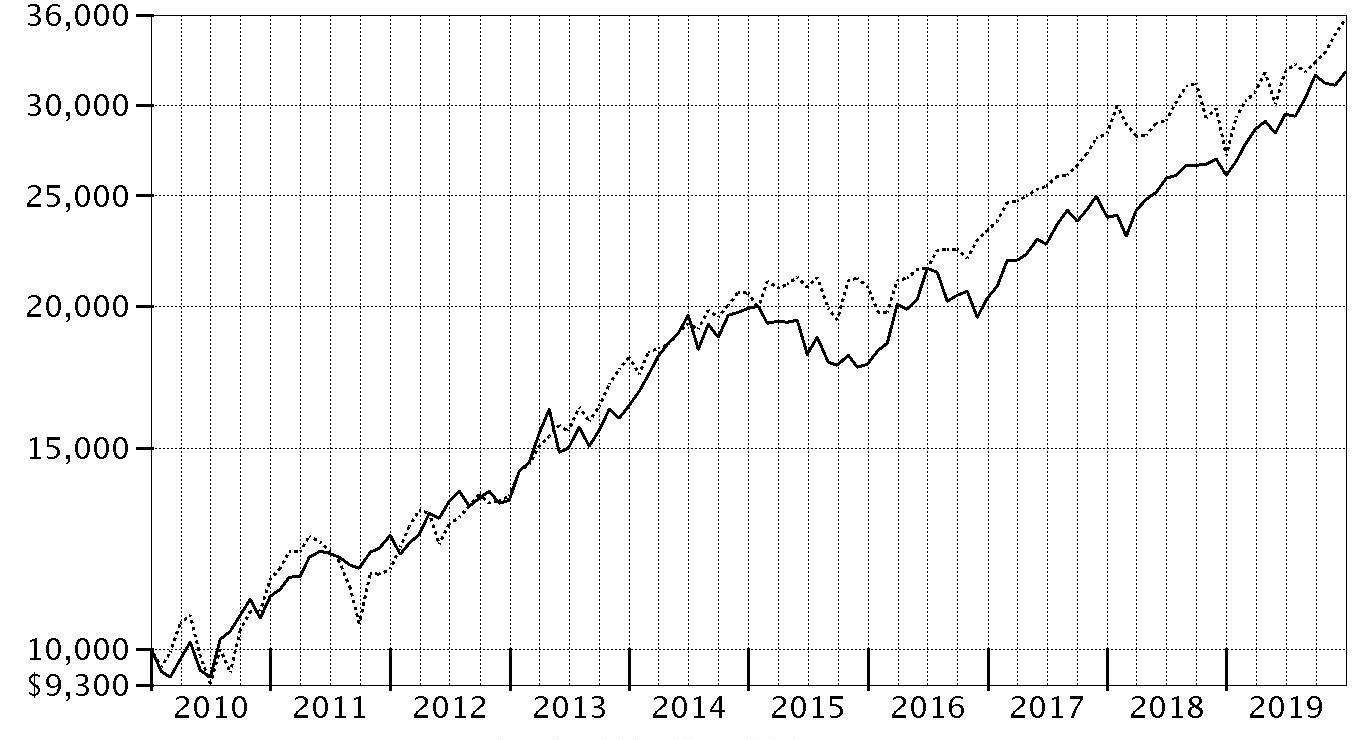
| Period Ending Values |
| $32,070 | VIP Utilities Portfolio - Initial Class |
| $35,666 | S&P 500® Index |
Management's Discussion of Fund Performance
Market Recap: U.S. stocks continued to roll in 2019, with the S&P 500
® index soaring 31.49% and marking history as the longest and strongest bull market ever, despite persistent, nagging concerns about global economic growth and trade. After a rough end to 2018, equities sharply reversed course to begin the new year amid upbeat company earnings and signs the Federal Reserve may pause on rates. The uptrend continued until May, when the index sunk as trade negotiations between the U.S. and China broke down. The bull market roared back to record a series of highs in July, when the Fed cut interest rates for the first time since 2008. Volatility intensified in August, as the Treasury yield curve inverted, which some investors viewed as a sign the U.S. economy could be heading for recession. But the market proved resilient, hitting a new high on October 30, when the Fed lowered rates for the third time in 2019, and moving even higher through year-end. Gains were robust and broad-based, with information technology (+50%) leading the way with its best calendar-year result in a decade, amid strong growth trends. Communication services (+33%) and financials (+32%) also stood out. In contrast, energy (+12%) was by far the weakest group – struggling amid sluggish oil prices – while several strong gainers nonetheless fell short of the broader market: industrials and real estate (+29% each), consumer discretionary and consumer staples (+28% each), utilities (+26%), materials (+25%), and health care (+21%).
Comments from Portfolio Manager Douglas Simmons: For the year, the fund's share classes gained roughly 23%, lagging the 25.03% advance of the sector benchmark, the MSCI U.S. IMI Utilities 25/50 Index, and the S&P 500
®. After finishing 2018 as the second-best-performing sector within the S&P 500, utilities stocks steadily posted gains this past year. However, while most equities rallied strongly after the May and August broad-market pullbacks, utilities rose more modestly by comparison. Versus the sector benchmark, security selection detracted most from the fund's relative result in 2019, whereas industry positioning added incremental value. Specifically, investment choices among electric utilities, coupled with the fund's out-of-benchmark exposure to the oil & gas storage & transportation group, proved most detrimental. On an individual stock basis, the portfolio's sizable overweight position in electric utility Exelon (+4%) was the biggest relative detractor. This unregulated nuclear power generator struggled, as Illinois failed to pass supportive legislation for the company's nuclear plants within the state. Underweighting the shares of strong-performing NextEra Energy (+42%) also hurt. Conversely, the portfolio's positioning among gas utilities lifted the fund's relative result this period. A notable underweighting in the stock of Duke Energy (+11%), an electric utility that significantly lagged the broader market, aided the fund's relative result most on an individual stock basis.
The views expressed above reflect those of the portfolio manager(s) only through the end of the period as stated on the cover of this report and do not necessarily represent the views of Fidelity or any other person in the Fidelity organization. Any such views are subject to change at any time based upon market or other conditions and Fidelity disclaims any responsibility to update such views. These views may not be relied on as investment advice and, because investment decisions for a Fidelity fund are based on numerous factors, may not be relied on as an indication of trading intent on behalf of any Fidelity fund.
Investment Summary (Unaudited)
Top Ten Stocks as of December 31, 2019
| | % of fund's net assets |
| Dominion Energy, Inc. | 10.7 |
| Exelon Corp. | 9.6 |
| Sempra Energy | 9.3 |
| Edison International | 7.5 |
| Southern Co. | 7.0 |
| Duke Energy Corp. | 4.9 |
| Entergy Corp. | 4.9 |
| CenterPoint Energy, Inc. | 4.7 |
| FirstEnergy Corp. | 4.5 |
| Evergy, Inc. | 4.3 |
| | 67.4 |
Top Industries (% of fund's net assets)
| As of December 31, 2019 |
| | Electric Utilities | 51.8% |
| | Multi-Utilities | 26.1% |
| | Independent Power and Renewable Electricity Producers | 14.5% |
| | Gas Utilities | 2.2% |
| | Water Utilities | 1.0% |
| | All Others* | 4.4% |

* Includes short-term investments and net other assets (liabilities).
Schedule of Investments December 31, 2019
Showing Percentage of Net Assets
| Common Stocks - 95.3% | | | |
| | | Shares | Value |
| Electric Utilities - 50.6% | | | |
| Electric Utilities - 50.6% | | | |
| Alliant Energy Corp. | | 38,408 | $2,101,686 |
| American Electric Power Co., Inc. | | 39,000 | 3,685,890 |
| Duke Energy Corp. | | 137,200 | 12,514,012 |
| Edison International | | 255,251 | 19,248,478 |
| Entergy Corp. | | 104,001 | 12,459,320 |
| Evergy, Inc. | | 167,861 | 10,926,072 |
| Exelon Corp. | | 539,486 | 24,595,167 |
| FirstEnergy Corp. | | 238,789 | 11,605,145 |
| NextEra Energy, Inc. | | 42,417 | 10,271,701 |
| PG&E Corp. (a) | | 42,900 | 466,323 |
| PNM Resources, Inc. | | 5,832 | 295,741 |
| PPL Corp. | | 45,822 | 1,644,093 |
| Scottish & Southern Energy PLC | | 104,800 | 1,998,771 |
| Southern Co. | | 279,900 | 17,829,630 |
| | | | 129,642,029 |
| Gas Utilities - 2.2% | | | |
| Gas Utilities - 2.2% | | | |
| Atmos Energy Corp. | | 50,000 | 5,593,000 |
| Independent Power and Renewable Electricity Producers - 14.5% | | | |
| Independent Power Producers & Energy Traders - 11.4% | | | |
| Clearway Energy, Inc.: | | | |
| Class A | | 20,800 | 397,696 |
| Class C | | 274,545 | 5,477,173 |
| NRG Energy, Inc. | | 147,109 | 5,847,583 |
| The AES Corp. | | 452,725 | 9,009,228 |
| Vistra Energy Corp. | | 370,449 | 8,516,623 |
| | | | 29,248,303 |
| Renewable Electricity - 3.1% | | | |
| Atlantica Yield PLC | | 133,333 | 3,518,658 |
| NextEra Energy Partners LP | | 82,899 | 4,364,632 |
| | | | 7,883,290 |
|
| TOTAL INDEPENDENT POWER AND RENEWABLE ELECTRICITY PRODUCERS | | | 37,131,593 |
|
| Multi-Utilities - 26.1% | | | |
| Multi-Utilities - 26.1% | | | |
| Ameren Corp. | | 47,705 | 3,663,744 |
| CenterPoint Energy, Inc. | | 438,245 | 11,950,941 |
| Dominion Energy, Inc. | | 330,757 | 27,393,294 |
| Sempra Energy | | 156,851 | 23,759,789 |
| | | | 66,767,768 |
| Oil, Gas & Consumable Fuels - 0.9% | | | |
| Oil & Gas Storage & Transport - 0.9% | | | |
| Cheniere Energy, Inc. (a) | | 36,461 | 2,226,673 |
| Water Utilities - 1.0% | | | |
| Water Utilities - 1.0% | | | |
| SJW Corp. | | 36,202 | 2,572,514 |
| TOTAL COMMON STOCKS | | | |
| (Cost $193,642,904) | | | 243,933,577 |
|
| Nonconvertible Preferred Stocks - 0.0% | | | |
| Water Utilities - 0.0% | | | |
| Water Utilities - 0.0% | | | |
| Companhia de Saneamento Basico do Estado de Sao Paulo (SABESP) sponsored ADR | | | |
| (Cost $99,976) | | 8,100 | 121,905 |
| | | Principal Amount | Value |
|
| Nonconvertible Bonds - 1.2% | | | |
| Electric Utilities - 1.2% | | | |
| Electric Utilities - 1.2% | | | |
| Pacific Gas & Electric Co. | | | |
| 3.95% 12/1/47 (b) | | 435,000 | 431,651 |
| 5.8% 3/1/37 (b) | | 1,300,000 | 1,355,250 |
| 6.05% 3/1/34 (b) | | 1,215,000 | 1,272,713 |
| (Cost $3,066,764) | | | 3,059,614 |
| | | Shares | Value |
|
| Money Market Funds - 3.5% | | | |
| Fidelity Cash Central Fund 1.58% (c) | | | |
| (Cost $8,997,375) | | 8,995,576 | 8,997,375 |
| TOTAL INVESTMENT IN SECURITIES - 100.0% | | | |
| (Cost $205,807,019) | | | 256,112,471 |
| NET OTHER ASSETS (LIABILITIES) - 0.0% | | | (14,582) |
| NET ASSETS - 100% | | | $256,097,889 |
Legend
(a) Non-income producing
(b) Non-income producing - Security is in default.
(c) Affiliated fund that is generally available only to investment companies and other accounts managed by Fidelity Investments. The rate quoted is the annualized seven-day yield of the fund at period end. A complete unaudited listing of the fund's holdings as of its most recent quarter end is available upon request. In addition, each Fidelity Central Fund's financial statements, which are not covered by the Fund's Report of Independent Registered Public Accounting Firm, are available on the SEC's website or upon request.
Affiliated Central Funds
Information regarding fiscal year to date income earned by the Fund from investments in Fidelity Central Funds is as follows:
| Fund | Income earned |
| Fidelity Cash Central Fund | $71,441 |
| Fidelity Securities Lending Cash Central Fund | 414 |
| Total | $71,855 |
Amounts in the income column in the above table include any capital gain distributions from underlying funds, which are presented in the corresponding line-item in the Statement of Operations, if applicable. Amount for Fidelity Securities Lending Cash Central Fund represents the income earned on investing cash collateral, less rebates paid to borrowers and any lending agent fees associated with the loan, plus any premium payments received for lending certain types of securities.
Investment Valuation
The following is a summary of the inputs used, as of December 31, 2019, involving the Fund's assets and liabilities carried at fair value. The inputs or methodology used for valuing securities may not be an indication of the risk associated with investing in those securities. For more information on valuation inputs, and their aggregation into the levels used below, please refer to the Investment Valuation section in the accompanying Notes to Financial Statements.
| | Valuation Inputs at Reporting Date: |
| Description | Total | Level 1 | Level 2 | Level 3 |
| Investments in Securities: | | | | |
| Common Stocks | $243,933,577 | $241,934,806 | $1,998,771 | $-- |
| Nonconvertible Preferred Stocks | 121,905 | 121,905 | -- | -- |
| Nonconvertible Bonds | 3,059,614 | -- | 3,059,614 | -- |
| Money Market Funds | 8,997,375 | 8,997,375 | -- | -- |
| Total Investments in Securities: | $256,112,471 | $251,054,086 | $5,058,385 | $-- |
See accompanying notes which are an integral part of the financial statements.
Financial Statements
Statement of Assets and Liabilities
| | | December 31, 2019 |
| Assets | | |
Investment in securities, at value — See accompanying schedule:
Unaffiliated issuers (cost $196,809,644) | $247,115,096 | |
| Fidelity Central Funds (cost $8,997,375) | 8,997,375 | |
| Total Investment in Securities (cost $205,807,019) | | $256,112,471 |
| Receivable for fund shares sold | | 120,723 |
| Dividends receivable | | 362,898 |
| Distributions receivable from Fidelity Central Funds | | 4,545 |
| Prepaid expenses | | 1,054 |
| Other receivables | | 4,071 |
| Total assets | | 256,605,762 |
| Liabilities | | |
| Payable for investments purchased | $304,852 | |
| Payable for fund shares redeemed | 17,454 | |
| Accrued management fee | 111,908 | |
| Audit fee payable | 35,104 | |
| Transfer agent fee payable | 27,708 | |
| Other affiliated payables | 8,160 | |
| Other payables and accrued expenses | 2,687 | |
| Total liabilities | | 507,873 |
| Net Assets | | $256,097,889 |
| Net Assets consist of: | | |
| Paid in capital | | $201,395,404 |
| Total accumulated earnings (loss) | | 54,702,485 |
| Net Assets | | $256,097,889 |
| Net Asset Value and Maximum Offering Price | | |
| Initial Class: | | |
| Net Asset Value, offering price and redemption price per share ($40,839,081 ÷ 2,173,756 shares) | | $18.79 |
| Investor Class: | | |
| Net Asset Value, offering price and redemption price per share ($215,258,808 ÷ 11,538,694 shares) | | $18.66 |
See accompanying notes which are an integral part of the financial statements.
Statement of Operations
| | | Year ended December 31, 2019 |
| Investment Income | | |
| Dividends | | $6,720,403 |
| Income from Fidelity Central Funds (including $414 from security lending) | | 71,855 |
| Total income | | 6,792,258 |
| Expenses | | |
| Management fee | $1,167,083 | |
| Transfer agent fees | 283,478 | |
| Accounting and security lending fees | 84,803 | |
| Custodian fees and expenses | 9,332 | |
| Independent trustees' fees and expenses | 1,152 | |
| Audit | 40,214 | |
| Legal | 626 | |
| Miscellaneous | 1,194 | |
| Total expenses before reductions | 1,587,882 | |
| Expense reductions | (15,177) | |
| Total expenses after reductions | | 1,572,705 |
| Net investment income (loss) | | 5,219,553 |
| Realized and Unrealized Gain (Loss) | | |
| Net realized gain (loss) on: | | |
| Investment securities: | | |
| Unaffiliated issuers | 4,252,567 | |
| Foreign currency transactions | 821 | |
| Total net realized gain (loss) | | 4,253,388 |
| Change in net unrealized appreciation (depreciation) on: | | |
| Investment securities: | | |
| Unaffiliated issuers | 33,302,489 | |
| Assets and liabilities in foreign currencies | (2) | |
| Total change in net unrealized appreciation (depreciation) | | 33,302,487 |
| Net gain (loss) | | 37,555,875 |
| Net increase (decrease) in net assets resulting from operations | | $42,775,428 |
See accompanying notes which are an integral part of the financial statements.
Statement of Changes in Net Assets
| | Year ended December 31, 2019 | Year ended December 31, 2018 |
| Increase (Decrease) in Net Assets | | |
| Operations | | |
| Net investment income (loss) | $5,219,553 | $3,174,542 |
| Net realized gain (loss) | 4,253,388 | 14,634,111 |
| Change in net unrealized appreciation (depreciation) | 33,302,487 | (8,610,508) |
| Net increase (decrease) in net assets resulting from operations | 42,775,428 | 9,198,145 |
| Distributions to shareholders | (17,786,711) | (10,866,229) |
| Share transactions - net increase (decrease) | 55,204,498 | 45,156,386 |
| Total increase (decrease) in net assets | 80,193,215 | 43,488,302 |
| Net Assets | | |
| Beginning of period | 175,904,674 | 132,416,372 |
| End of period | $256,097,889 | $175,904,674 |
See accompanying notes which are an integral part of the financial statements.
Financial Highlights
VIP Utilities Portfolio Initial Class
| Years ended December 31, | 2019 | 2018 | 2017 | 2016 | 2015 |
| Selected Per–Share Data | | | | | |
| Net asset value, beginning of period | $16.81 | $16.73 | $14.49 | $13.17 | $15.62 |
| Income from Investment Operations | | | | | |
| Net investment income (loss)A | .43 | .40 | .33 | .34 | .31 |
| Net realized and unrealized gain (loss) | 3.22 | .96 | 2.26 | 1.49 | (1.98) |
| Total from investment operations | 3.65 | 1.36 | 2.59 | 1.83 | (1.67) |
| Distributions from net investment income | (.39) | (.32) | (.35) | (.26) | (.33)B |
| Distributions from net realized gain | (1.28) | (.97) | – | (.25) | (.45)B |
| Total distributions | (1.67) | (1.28)C | (.35) | (.52)D | (.78) |
| Redemption fees added to paid in capitalA | – | – | –E | .01 | –E |
| Net asset value, end of period | $18.79 | $16.81 | $16.73 | $14.49 | $13.17 |
| Total ReturnF,G | 23.18% | 8.82% | 17.88% | 14.17% | (10.78)% |
| Ratios to Average Net AssetsH,I | | | | | |
| Expenses before reductions | .66% | .68% | .69% | .70% | .71% |
| Expenses net of fee waivers, if any | .66% | .68% | .69% | .70% | .71% |
| Expenses net of all reductions | .66% | .65% | .68% | .69% | .70% |
| Net investment income (loss) | 2.46% | 2.36% | 2.06% | 2.30% | 2.17% |
| Supplemental Data | | | | | |
| Net assets, end of period (000 omitted) | $40,839 | $38,270 | $26,377 | $26,194 | $21,960 |
| Portfolio turnover rateJ | 66% | 113% | 52% | 83% | 88% |
A Calculated based on average shares outstanding during the period.
B The amounts shown reflect certain reclassifications related to book to tax differences that were made in the year shown.
C Total distributions of $1.28 per share is comprised of distributions from net investment income of $.317 and distributions from net realized gain of $.966 per share.
D Total distributions of $.52 per share is comprised of distributions from net investment income of $.263 and distributions from net realized gain of $.253 per share.
E Amount represents less than $.005 per share.
F Total returns do not reflect charges attributable to your insurance company's separate account. Inclusion of these charges would reduce the total returns shown.
G Total returns would have been lower if certain expenses had not been reduced during the applicable periods shown.
H Fees and expenses of any underlying Fidelity Central Funds are not included in the Fund's expense ratio. The Fund indirectly bears its proportionate share of the expenses of any underlying Fidelity Central Funds.
I Expense ratios reflect operating expenses of the class. Expenses before reductions do not reflect amounts reimbursed by the investment adviser or reductions from brokerage service arrangements or reductions from other expense offset arrangements and do not represent the amount paid by the class during periods when reimbursements or reductions occur. Expenses net of fee waivers reflect expenses after reimbursement by the investment adviser but prior to reductions from brokerage service arrangements or other expense offset arrangements. Expenses net of all reductions represent the net expenses paid by the class.
J Amount does not include the portfolio activity of any underlying Fidelity Central Funds.
See accompanying notes which are an integral part of the financial statements.
VIP Utilities Portfolio Investor Class
| Years ended December 31, | 2019 | 2018 | 2017 | 2016 | 2015 |
| Selected Per–Share Data | | | | | |
| Net asset value, beginning of period | $16.70 | $16.64 | $14.41 | $13.11 | $15.54 |
| Income from Investment Operations | | | | | |
| Net investment income (loss)A | .42 | .38 | .32 | .32 | .30 |
| Net realized and unrealized gain (loss) | 3.19 | .95 | 2.25 | 1.48 | (1.96) |
| Total from investment operations | 3.61 | 1.33 | 2.57 | 1.80 | (1.66) |
| Distributions from net investment income | (.38) | (.31) | (.34) | (.26) | (.31)B |
| Distributions from net realized gain | (1.28) | (.97) | – | (.25) | (.45)B |
| Total distributions | (1.65)C | (1.27)D | (.34) | (.51) | (.77)E |
| Redemption fees added to paid in capitalA | – | – | –F | .01 | –F |
| Net asset value, end of period | $18.66 | $16.70 | $16.64 | $14.41 | $13.11 |
| Total ReturnG,H | 23.14% | 8.66% | 17.83% | 14.03% | (10.80)% |
| Ratios to Average Net AssetsI,J | | | | | |
| Expenses before reductions | .74% | .76% | .77% | .78% | .79% |
| Expenses net of fee waivers, if any | .74% | .76% | .77% | .78% | .79% |
| Expenses net of all reductions | .74% | .73% | .76% | .77% | .78% |
| Net investment income (loss) | 2.38% | 2.28% | 1.98% | 2.22% | 2.09% |
| Supplemental Data | | | | | |
| Net assets, end of period (000 omitted) | $215,259 | $137,635 | $106,040 | $98,360 | $57,645 |
| Portfolio turnover rateK | 66% | 113% | 52% | 83% | 88% |
A Calculated based on average shares outstanding during the period.
B The amounts shown reflect certain reclassifications related to book to tax differences that were made in the year shown.
C Total distributions of $1.65 per share is comprised of distributions from net investment income of $.376 and distributions from net realized gain of $1.278 per share.
D Total distributions of $1.27 per share is comprised of distributions from net investment income of $.305 and distributions from net realized gain of $.966 per share.
E Total distributions of $.77 per share is comprised of distributions from net investment income of $.314 and distributions from net realized gain of $.454 per share.
F Amount represents less than $.005 per share.
G Total returns do not reflect charges attributable to your insurance company's separate account. Inclusion of these charges would reduce the total returns shown.
H Total returns would have been lower if certain expenses had not been reduced during the applicable periods shown.
I Fees and expenses of any underlying Fidelity Central Funds are not included in the Fund's expense ratio. The Fund indirectly bears its proportionate share of the expenses of any underlying Fidelity Central Funds.
J Expense ratios reflect operating expenses of the class. Expenses before reductions do not reflect amounts reimbursed by the investment adviser or reductions from brokerage service arrangements or reductions from other expense offset arrangements and do not represent the amount paid by the class during periods when reimbursements or reductions occur. Expenses net of fee waivers reflect expenses after reimbursement by the investment adviser but prior to reductions from brokerage service arrangements or other expense offset arrangements. Expenses net of all reductions represent the net expenses paid by the class.
K Amount does not include the portfolio activity of any underlying Fidelity Central Funds.
See accompanying notes which are an integral part of the financial statements.
Notes to Financial Statements
For the period ended December 31, 2019
1. Organization.
VIP Utilities Portfolio (the Fund) is a non-diversified fund of Variable Insurance Products Fund IV (the Trust) and is authorized to issue an unlimited number of shares. The Trust is registered under the Investment Company Act of 1940, as amended (the 1940 Act), as an open-end management investment company organized as a Massachusetts business trust. Shares of the Fund may only be purchased by insurance companies for the purpose of funding variable annuity or variable life insurance contracts. The Fund offers the following classes of shares: Initial Class shares and Investor Class shares. All classes have equal rights and voting privileges, except for matters affecting a single class.
2. Investments in Fidelity Central Funds.
The Fund invests in Fidelity Central Funds, which are open-end investment companies generally available only to other investment companies and accounts managed by the investment adviser and its affiliates. The Fund's Schedule of Investments lists each of the Fidelity Central Funds held as of period end, if any, as an investment of the Fund, but does not include the underlying holdings of each Fidelity Central Fund. As an Investing Fund, the Fund indirectly bears its proportionate share of the expenses of the underlying Fidelity Central Funds.
The Money Market Central Funds seek preservation of capital and current income and are managed by Fidelity Investments Money Management, Inc. (FIMM), an affiliate of the investment adviser. Annualized expenses of the Money Market Central Funds as of their most recent shareholder report date ranged from less than .005% to .01%.
A complete unaudited list of holdings for each Fidelity Central Fund is available upon request or at the Securities and Exchange Commission (the SEC) website at www.sec.gov. In addition, the financial statements of the Fidelity Central Funds, which are not covered by the Fund's Report of Independent Registered Public Accounting Firm, are available on the SEC website or upon request.
3. Significant Accounting Policies.
The Fund is an investment company and applies the accounting and reporting guidance of the Financial Accounting Standards Board (FASB) Accounting Standards Codification Topic 946 Financial Services – Investments Companies. The financial statements have been prepared in conformity with accounting principles generally accepted in the United States of America (GAAP), which require management to make certain estimates and assumptions at the date of the financial statements. Actual results could differ from those estimates. Subsequent events, if any, through the date that the financial statements were issued have been evaluated in the preparation of the financial statements. The following summarizes the significant accounting policies of the Fund:
Investment Valuation. Investments are valued as of 4:00 p.m. Eastern time on the last calendar day of the period. The Board of Trustees (the Board) has delegated the day to day responsibility for the valuation of the Fund's investments to the Fair Value Committee (the Committee) established by the Fund's investment adviser. In accordance with valuation policies and procedures approved by the Board, the Fund attempts to obtain prices from one or more third party pricing vendors or brokers to value its investments. When current market prices, quotations or currency exchange rates are not readily available or reliable, investments will be fair valued in good faith by the Committee, in accordance with procedures adopted by the Board. Factors used in determining fair value vary by investment type and may include market or investment specific events, changes in interest rates and credit quality. The frequency with which these procedures are used cannot be predicted and they may be utilized to a significant extent. The Committee oversees the Fund's valuation policies and procedures and reports to the Board on the Committee's activities and fair value determinations. The Board monitors the appropriateness of the procedures used in valuing the Fund's investments and ratifies the fair value determinations of the Committee.
The Fund categorizes the inputs to valuation techniques used to value its investments into a disclosure hierarchy consisting of three levels as shown below:
- Level 1 – quoted prices in active markets for identical investments
- Level 2 – other significant observable inputs (including quoted prices for similar investments, interest rates, prepayment speeds, etc.)
- Level 3 – unobservable inputs (including the Fund's own assumptions based on the best information available)
Valuation techniques used to value the Fund's investments by major category are as follows:
Equity securities, including restricted securities, for which market quotations are readily available, are valued at the last reported sale price or official closing price as reported by a third party pricing vendor on the primary market or exchange on which they are traded and are categorized as Level 1 in the hierarchy. In the event there were no sales during the day or closing prices are not available, securities are valued at the last quoted bid price or may be valued using the last available price and are generally categorized as Level 2 in the hierarchy. For foreign equity securities, when market or security specific events arise, comparisons to the valuation of American Depositary Receipts (ADRs), futures contracts, Exchange-Traded Funds (ETFs) and certain indexes as well as quoted prices for similar securities may be used and would be categorized as Level 2 in the hierarchy. For equity securities, including restricted securities, where observable inputs are limited, assumptions about market activity and risk are used and these securities may be categorized as Level 3 in the hierarchy.
Debt securities, including restricted securities, are valued based on evaluated prices received from third party pricing vendors or from brokers who make markets in such securities. Corporate bonds are valued by pricing vendors who utilize matrix pricing which considers yield or price of bonds of comparable quality, coupon, maturity and type or by broker-supplied prices. When independent prices are unavailable or unreliable, debt securities may be valued utilizing pricing methodologies which consider similar factors that would be used by third party pricing vendors. Debt securities are generally categorized as Level 2 in the hierarchy but may be Level 3 depending on the circumstances.
Investments in open-end mutual funds, including the Fidelity Central Funds, are valued at their closing net asset value (NAV) each business day and are categorized as Level 1 in the hierarchy.
Changes in valuation techniques may result in transfers in or out of an assigned level within the disclosure hierarchy. The aggregate value of investments by input level as of December 31, 2019 is included at the end of the Fund's Schedule of Investments.
Foreign Currency. The Fund may use foreign currency contracts to facilitate transactions in foreign-denominated securities. Gains and losses from these transactions may arise from changes in the value of the foreign currency or if the counterparties do not perform under the contracts' terms.
Foreign-denominated assets, including investment securities, and liabilities are translated into U.S. dollars at the exchange rates at period end. Purchases and sales of investment securities, income and dividends received and expenses denominated in foreign currencies are translated into U.S. dollars at the exchange rate in effect on the transaction date.
The effects of exchange rate fluctuations on investments are included with the net realized and unrealized gain (loss) on investment securities. Other foreign currency transactions resulting in realized and unrealized gain (loss) are disclosed separately.
Investment Transactions and Income. For financial reporting purposes, the Fund's investment holdings and NAV include trades executed through the end of the last business day of the period. The NAV per share for processing shareholder transactions is calculated as of the close of business of the New York Stock Exchange (NYSE), normally 4:00 p.m. Eastern time and includes trades executed through the end of the prior business day. Gains and losses on securities sold are determined on the basis of identified cost and include proceeds received from litigation. Dividend income is recorded on the ex-dividend date, except for certain dividends from foreign securities where the ex-dividend date may have passed, which are recorded as soon as the Fund is informed of the ex-dividend date. Non-cash dividends included in dividend income, if any, are recorded at the fair market value of the securities received. Income and capital gain distributions from Fidelity Central Funds, if any, are recorded on the ex-dividend date. Certain distributions received by the Fund represent a return of capital or capital gain. The Fund determines the components of these distributions subsequent to the ex-dividend date, based upon receipt of tax filings or other correspondence relating to the underlying investment. These distributions are recorded as a reduction of cost of investments and/or as a realized gain. Investment income is recorded net of foreign taxes withheld where recovery of such taxes is uncertain.
Class Allocations and Expenses. Investment income, realized and unrealized capital gains and losses, common expenses of the Fund, and certain fund-level expense reductions, if any, are allocated daily on a pro-rata basis to each class based on the relative net assets of each class to the total net assets of the Fund. Each class differs with respect to transfer agent fees incurred. Certain expense reductions may also differ by class. For the reporting period, the allocated portion of income and expenses to each class as a percent of its average net assets may vary due to the timing of recording these transactions in relation to fluctuating net assets of the classes. Expenses directly attributable to a fund are charged to that fund. Expenses attributable to more than one fund are allocated among the respective funds on the basis of relative net assets or other appropriate methods. Expense estimates are accrued in the period to which they relate and adjustments are made when actual amounts are known.
Income Tax Information and Distributions to Shareholders. Each year, the Fund intends to qualify as a regulated investment company under Subchapter M of the Internal Revenue Code, including distributing substantially all of its taxable income and realized gains. As a result, no provision for U.S. Federal income taxes is required. As of December 31, 2019, the Fund did not have any unrecognized tax benefits in the financial statements; nor is the Fund aware of any tax positions for which it is reasonably possible that the total amounts of unrecognized tax benefits will significantly change in the next twelve months. The Fund files a U.S. federal tax return, in addition to state and local tax returns as required. The Fund's federal income tax returns are subject to examination by the Internal Revenue Service (IRS) for a period of three fiscal years after they are filed. State and local tax returns may be subject to examination for an additional fiscal year depending on the jurisdiction. Foreign taxes are provided for based on the Fund's understanding of the tax rules and rates that exist in the foreign markets in which it invests.
Distributions are declared and recorded on the ex-dividend date. Income and capital gain distributions are declared separately for each class. Income and capital gain distributions are determined in accordance with income tax regulations, which may differ from GAAP.
Capital accounts within the financial statements are adjusted for permanent book-tax differences. These adjustments have no impact on net assets or the results of operations. Capital accounts are not adjusted for temporary book-tax differences which will reverse in a subsequent period.
Book-tax differences are primarily due to foreign currency transactions and losses deferred due to wash sales and excise tax regulations.
As of period end, the cost and unrealized appreciation (depreciation) in securities, and derivatives if applicable, for federal income tax purposes were as follows:
| Gross unrealized appreciation | $51,259,156 |
| Gross unrealized depreciation | (1,493,975) |
| Net unrealized appreciation (depreciation) | $49,765,181 |
| Tax Cost | $206,347,290 |
The tax-based components of distributable earnings as of period end were as follows:
| Undistributed ordinary income | $1,147,511 |
| Undistributed long-term capital gain | $3,789,786 |
| Net unrealized appreciation (depreciation) on securities and other investments | $49,765,188 |
The tax character of distributions paid was as follows:
| | December 31, 2019 | December 31, 2018 |
| Ordinary Income | $4,949,320 | $ 5,509,206 |
| Long-term Capital Gains | 12,837,391 | 5,357,023 |
| Total | $17,786,711 | $ 10,866,229 |
4. Purchases and Sales of Investments.
Purchases and sales of securities, other than short-term securities, aggregated $178,206,529 and $141,999,924, respectively.
5. Fees and Other Transactions with Affiliates.
Management Fee. Fidelity SelectCo, LLC (the investment adviser) and its affiliates provide the Fund with investment management related services for which the Fund pays a monthly management fee. The management fee is the sum of an individual fund fee rate that is based on an annual rate of .30% of the Fund's average net assets and an annualized group fee rate that averaged .24% during the period. The group fee rate is based upon the average net assets of all the mutual funds advised by Fidelity Management & Research Company (FMR) and the investment adviser. The group fee rate decreases as assets under management increase and increases as assets under management decrease. For the reporting period, the total annual management fee rate was .54% of the Fund's average net assets.
Transfer Agent Fees. Fidelity Investments Institutional Operations Company, Inc. (FIIOC), an affiliate of the investment adviser, is the Fund's transfer, dividend disbursing, and shareholder servicing agent. FIIOC receives an asset-based fee with respect to each class. Each class pays a fee for transfer agent services, typesetting and printing and mailing of shareholder reports, excluding mailing of proxy statements, equal to an annual rate of class-level average net assets. The annual rate for Investor Class is .15% and the annual rate for all other classes is .07%. For the period, transfer agent fees for each class were as follows:
| Initial Class | $24,438 |
| Investor Class | 259,040 |
| | $283,478 |
Accounting and Security Lending Fees. Fidelity Service Company, Inc. (FSC), an affiliate of the investment adviser, maintains the Fund's accounting records. The accounting fee is based on the level of average net assets for each month. Prior to April 1, 2019, FSC had a separate agreement with the Fund for administration of the security lending program, based on the number and duration of lending transactions. For the period, the total fees paid for accounting and administration of securities lending were equivalent to the following annual rates:
| | % of Average Net Assets |
| VIP Utilities Portfolio | .04 |
Brokerage Commissions. A portion of portfolio transactions were placed with brokerage firms which are affiliates of the investment adviser. Brokerage commissions are included in net realized gain (loss) and change in net unrealized appreciation (depreciation) in the Statement of Operations. The commissions paid to these affiliated firms were as follows:
| | Amount |
| VIP Utilities Portfolio | $5,399 |
Interfund Trades. The Fund may purchase from or sell securities to other Fidelity Funds under procedures adopted by the Board. The procedures have been designed to ensure these interfund trades are executed in accordance with Rule 17a-7 of the 1940 Act. Interfund trades are included within the respective purchases and sales amounts shown in the Purchases and Sales of Investments note.
6. Committed Line of Credit.
The Fund participates with other funds managed by the investment adviser or an affiliate in a $4.25 billion credit facility (the "line of credit") to be utilized for temporary or emergency purposes to fund shareholder redemptions or for other short-term liquidity purposes. The Fund has agreed to pay commitment fees on its pro-rata portion of the line of credit, which amounted to $511 and is reflected in Miscellaneous expenses on the Statement of Operations. During the period, the Fund did not borrow on this line of credit.
7. Security Lending.
The Fund lends portfolio securities from time to time in order to earn additional income. For equity securities, lending agents are used, including National Financial Services (NFS), an affiliate of the Fund. Pursuant to a securities lending agreement, NFS will receive a fee, which is capped at 9.9% of daily lending revenue, for its services as lending agent. The Fund may lend securities to certain qualified borrowers. On the settlement date of the loan, the Fund receives collateral (in the form of U.S. Treasury obligations, letters of credit and/or cash) against the loaned securities and maintains collateral in an amount not less than 100% of the market value of the loaned securities during the period of the loan. The market value of the loaned securities is determined at the close of business of the Fund and any additional required collateral is delivered to the Fund on the next business day. The Fund or borrower may terminate the loan at any time, and if the borrower defaults on its obligation to return the securities loaned because of insolvency or other reasons, the Fund may apply collateral received from the borrower against the obligation. The Fund may experience delays and costs in recovering the securities loaned. Any cash collateral received is invested in the Fidelity Securities Lending Cash Central Fund. At period end, there were no security loans outstanding. Total fees paid by the Fund to NFS amounted to $7. Security lending income represents the income earned on investing cash collateral, less rebates paid to borrowers and any lending agent fees associated with the loan, plus any premium payments received for lending certain types of securities. Security lending income is presented in the Statement of Operations as a component of income from Fidelity Central Funds.
8. Expense Reductions.
Commissions paid to certain brokers with whom the investment adviser, or its affiliates, places trades on behalf of the Fund include an amount in addition to trade execution, which may be rebated back to the Fund to offset certain expenses. This amount totaled $13,777 for the period.
In addition, during the period the investment adviser reimbursed and/or waived a portion of fund-level operating expenses in the amount of $1,400.
9. Distributions to Shareholders.
Distributions to shareholders of each class were as follows:
| | Year ended
December 31, 2019 | Year ended
December 31, 2018 |
| Distributions to shareholders | | |
| Initial Class | $3,240,508 | $2,229,433 |
| Investor Class | 14,546,203 | 8,636,796 |
| Total | $17,786,711 | $10,866,229 |
10. Share Transactions.
Transactions for each class of shares were as follows:
| | Shares | Shares | Dollars | Dollars |
| | Year ended December 31, 2019 | Year ended December 31, 2018 | Year ended December 31, 2019 | Year ended December 31, 2018 |
| Initial Class | | | | |
| Shares sold | 676,488 | 912,835 | $11,962,840 | $16,146,381 |
| Reinvestment of distributions | 195,149 | 139,901 | 3,240,508 | 2,229,433 |
| Shares redeemed | (974,560) | (352,627) | (16,848,777) | (5,850,455) |
| Net increase (decrease) | (102,923) | 700,109 | $(1,645,429) | $12,525,359 |
| Investor Class | | | | |
| Shares sold | 3,978,636 | 2,551,740 | $69,721,769 | $44,264,874 |
| Reinvestment of distributions | 879,424 | 547,114 | 14,546,203 | 8,636,796 |
| Shares redeemed | (1,558,707) | (1,233,881) | (27,418,045) | (20,270,643) |
| Net increase (decrease) | 3,299,353 | 1,864,973 | $56,849,927 | $32,631,027 |
11. Other.
The Fund's organizational documents provide former and current trustees and officers with a limited indemnification against liabilities arising in connection with the performance of their duties to the Fund. In the normal course of business, the Fund may also enter into contracts that provide general indemnifications. The Fund's maximum exposure under these arrangements is unknown as this would be dependent on future claims that may be made against the Fund. The risk of material loss from such claims is considered remote.
At the end of the period, the investment adviser or its affiliates were the owners of record of 100% of the total outstanding shares of the Fund.
Effective January 1, 2020, following any required regulatory notices and approvals:
Investment advisers Fidelity Investments Money Management, Inc., FMR Co., Inc., and Fidelity SelectCo, LLC, merged with and into Fidelity Management & Research Company. In connection with the merger transactions, the resulting, merged investment adviser was then redomiciled from Massachusetts to Delaware, changed its corporate structure from a corporation to a limited liability company, and changed its name to "Fidelity Management & Research Company LLC".
Fidelity Investments Institutional Operations Company, Inc. (FIIOC) converted from a Massachusetts corporation to a Massachusetts LLC, and changed its name to "Fidelity Investments Institutional Operations Company LLC".
Report of Independent Registered Public Accounting Firm
To the Board of Trustees of Variable Insurance Products Fund IV and Shareholders of VIP Utilities Portfolio:
Opinion on the Financial Statements
We have audited the accompanying statement of assets and liabilities, including the schedule of investments, of VIP Utilities Portfolio (one of the funds constituting Variable Insurance Products Fund IV, referred to hereafter as the “Fund”) as of December 31, 2019, the related statement of operations for the year ended December 31, 2019, the statement of changes in net assets for each of the two years in the period ended December 31, 2019, including the related notes, and the financial highlights for each of the five years in the period ended December 31, 2019 (collectively referred to as the “financial statements”). In our opinion, the financial statements present fairly, in all material respects, the financial position of the Fund as of December 31, 2019, the results of its operations for the year then ended, the changes in its net assets for each of the two years in the period ended December 31, 2019 and the financial highlights for each of the five years in the period ended December 31, 2019 in conformity with accounting principles generally accepted in the United States of America.
Basis for Opinion
These financial statements are the responsibility of the Fund’s management. Our responsibility is to express an opinion on the Fund’s financial statements based on our audits. We are a public accounting firm registered with the Public Company Accounting Oversight Board (United States) (PCAOB) and are required to be independent with respect to the Fund in accordance with the U.S. federal securities laws and the applicable rules and regulations of the Securities and Exchange Commission and the PCAOB.
We conducted our audits of these financial statements in accordance with the standards of the PCAOB. Those standards require that we plan and perform the audit to obtain reasonable assurance about whether the financial statements are free of material misstatement, whether due to error or fraud.
Our audits included performing procedures to assess the risks of material misstatement of the financial statements, whether due to error or fraud, and performing procedures that respond to those risks. Such procedures included examining, on a test basis, evidence regarding the amounts and disclosures in the financial statements. Our audits also included evaluating the accounting principles used and significant estimates made by management, as well as evaluating the overall presentation of the financial statements. Our procedures included confirmation of securities owned as of December 31, 2019 by correspondence with the custodian and brokers; when replies were not received from brokers, we performed other auditing procedures. We believe that our audits provide a reasonable basis for our opinion.
PricewaterhouseCoopers LLP
Boston, Massachusetts
February 12, 2020
We have served as the auditor of one or more investment companies in the Fidelity group of funds since 1932.
Trustees and Officers
The Trustees, Members of the Advisory Board (if any), and officers of the trust and fund, as applicable, are listed below. The Board of Trustees governs the fund and is responsible for protecting the interests of shareholders. The Trustees are experienced executives who meet periodically throughout the year to oversee the fund's activities, review contractual arrangements with companies that provide services to the fund, oversee management of the risks associated with such activities and contractual arrangements, and review the fund's performance. Except for Michael Wiley, each of the Trustees oversees 302 funds. Mr. Wiley oversees 199 funds.
The Trustees hold office without limit in time except that (a) any Trustee may resign; (b) any Trustee may be removed by written instrument, signed by at least two-thirds of the number of Trustees prior to such removal; (c) any Trustee who requests to be retired or who has become incapacitated by illness or injury may be retired by written instrument signed by a majority of the other Trustees; and (d) any Trustee may be removed at any special meeting of shareholders by a two-thirds vote of the outstanding voting securities of the trust. Each Trustee who is not an interested person (as defined in the Investment Company Act of 1940 (1940 Act)) of the trust and the fund is referred to herein as an Independent Trustee. Each Independent Trustee shall retire not later than the last day of the calendar year in which his or her 75th birthday occurs. The Independent Trustees may waive this mandatory retirement age policy with respect to individual Trustees. Officers and Advisory Board Members hold office without limit in time, except that any officer or Advisory Board Member may resign or may be removed by a vote of a majority of the Trustees at any regular meeting or any special meeting of the Trustees. Except as indicated, each individual has held the office shown or other offices in the same company for the past five years.
The fund’s Statement of Additional Information (SAI) includes more information about the Trustees. To request a free copy, call Fidelity at 1-877-208-0098.
Experience, Skills, Attributes, and Qualifications of the Trustees. The Governance and Nominating Committee has adopted a statement of policy that describes the experience, qualifications, attributes, and skills that are necessary and desirable for potential Independent Trustee candidates (Statement of Policy). The Board believes that each Trustee satisfied at the time he or she was initially elected or appointed a Trustee, and continues to satisfy, the standards contemplated by the Statement of Policy. The Governance and Nominating Committee also engages professional search firms to help identify potential Independent Trustee candidates who have the experience, qualifications, attributes, and skills consistent with the Statement of Policy. From time to time, additional criteria based on the composition and skills of the current Independent Trustees, as well as experience or skills that may be appropriate in light of future changes to board composition, business conditions, and regulatory or other developments, have also been considered by the professional search firms and the Governance and Nominating Committee. In addition, the Board takes into account the Trustees' commitment and participation in Board and committee meetings, as well as their leadership of standing and ad hoc committees throughout their tenure.
In determining that a particular Trustee was and continues to be qualified to serve as a Trustee, the Board has considered a variety of criteria, none of which, in isolation, was controlling. The Board believes that, collectively, the Trustees have balanced and diverse experience, qualifications, attributes, and skills, which allow the Board to operate effectively in governing the fund and protecting the interests of shareholders. Information about the specific experience, skills, attributes, and qualifications of each Trustee, which in each case led to the Board's conclusion that the Trustee should serve (or continue to serve) as a trustee of the fund, is provided below.
Board Structure and Oversight Function. James C. Curvey is an interested person and currently serves as Chairman. The Trustees have determined that an interested Chairman is appropriate and benefits shareholders because an interested Chairman has a personal and professional stake in the quality and continuity of services provided to the fund. Independent Trustees exercise their informed business judgment to appoint an individual of their choosing to serve as Chairman, regardless of whether the Trustee happens to be independent or a member of management. The Independent Trustees have determined that they can act independently and effectively without having an Independent Trustee serve as Chairman and that a key structural component for assuring that they are in a position to do so is for the Independent Trustees to constitute a substantial majority for the Board. The Independent Trustees also regularly meet in executive session. Ned C. Lautenbach serves as Chairman of the Independent Trustees and as such (i) acts as a liaison between the Independent Trustees and management with respect to matters important to the Independent Trustees and (ii) with management prepares agendas for Board meetings.
Fidelity® funds are overseen by different Boards of Trustees. The fund's Board oversees Fidelity's high income and certain equity funds, and other Boards oversee Fidelity's investment-grade bond, money market, asset allocation, and other equity funds. The asset allocation funds may invest in Fidelity® funds overseen by the fund's Board. The use of separate Boards, each with its own committee structure, allows the Trustees of each group of Fidelity® funds to focus on the unique issues of the funds they oversee, including common research, investment, and operational issues. On occasion, the separate Boards establish joint committees to address issues of overlapping consequences for the Fidelity® funds overseen by each Board.
The Trustees operate using a system of committees to facilitate the timely and efficient consideration of all matters of importance to the Trustees, the fund, and fund shareholders and to facilitate compliance with legal and regulatory requirements and oversight of the fund's activities and associated risks. The Board, acting through its committees, has charged FMR and its affiliates with (i) identifying events or circumstances the occurrence of which could have demonstrably adverse effects on the fund's business and/or reputation; (ii) implementing processes and controls to lessen the possibility that such events or circumstances occur or to mitigate the effects of such events or circumstances if they do occur; and (iii) creating and maintaining a system designed to evaluate continuously business and market conditions in order to facilitate the identification and implementation processes described in (i) and (ii) above. Because the day-to-day operations and activities of the fund are carried out by or through FMR, its affiliates, and other service providers, the fund's exposure to risks is mitigated but not eliminated by the processes overseen by the Trustees. While each of the Board's committees has responsibility for overseeing different aspects of the fund's activities, oversight is exercised primarily through the Operations, Audit, and Compliance Committees. Appropriate personnel, including but not limited to the fund's Chief Compliance Officer (CCO), FMR's internal auditor, the independent accountants, the fund's Treasurer and portfolio management personnel, make periodic reports to the Board's committees, as appropriate, including an annual review of Fidelity's risk management program for the Fidelity® funds. The responsibilities of each standing committee, including their oversight responsibilities, are described further under "Standing Committees of the Trustees."
Interested Trustees*:
Correspondence intended for a Trustee who is an interested person may be sent to Fidelity Investments, 245 Summer Street, Boston, Massachusetts 02210.
Name, Year of Birth; Principal Occupations and Other Relevant Experience+
James C. Curvey (1935)
Year of Election or Appointment: 2018
Trustee
Chairman of the Board of Trustees
Mr. Curvey also serves as Trustee of other Fidelity® funds. Mr. Curvey is Vice Chairman (2007-present) and Director of FMR LLC (diversified financial services company). In addition, Mr. Curvey is an Overseer Emeritus for the Boston Symphony Orchestra, a Director of Artis-Naples, and a Trustee of Brewster Academy in Wolfeboro, New Hampshire. Previously, Mr. Curvey served as a Director of Fidelity Research & Analysis Co. (investment adviser firm, 2009-2018), Director of Fidelity Investments Money Management, Inc. (investment adviser firm, 2009-2014) and a Director of FMR and FMR Co., Inc. (investment adviser firms, 2007-2014).
* Determined to be an “Interested Trustee” by virtue of, among other things, his or her affiliation with the trust or various entities under common control with FMR.
+ The information includes the Trustee's principal occupation during the last five years and other information relating to the experience, attributes, and skills relevant to the Trustee's qualifications to serve as a Trustee, which led to the conclusion that the Trustee should serve as a Trustee for the fund.
Independent Trustees:
Correspondence intended for an Independent Trustee may be sent to Fidelity Investments, P.O. Box 55235, Boston, Massachusetts 02205-5235.
Name, Year of Birth; Principal Occupations and Other Relevant Experience+
Dennis J. Dirks (1948)
Year of Election or Appointment: 2018
Trustee
Mr. Dirks also serves as Trustee of other Fidelity® funds. Prior to his retirement in May 2003, Mr. Dirks was Chief Operating Officer and a member of the Board of The Depository Trust & Clearing Corporation (DTCC). He also served as President, Chief Operating Officer, and Board member of The Depository Trust Company (DTC) and President and Board member of the National Securities Clearing Corporation (NSCC). In addition, Mr. Dirks served as Chief Executive Officer and Board member of the Government Securities Clearing Corporation, Chief Executive Officer and Board member of the Mortgage-Backed Securities Clearing Corporation, as a Trustee and a member of the Finance Committee of Manhattan College (2005-2008), as a Trustee and a member of the Finance Committee of AHRC of Nassau County (2006-2008), as a member of the Independent Directors Council (IDC) Governing Council (2010-2015), and as a member of the Board of Directors for The Brookville Center for Children’s Services, Inc. (2009-2017). Mr. Dirks is a member of the Finance Committee (2016-present) and Board of Directors (2017-present) and is Treasurer (2018-present) of the Asolo Repertory Theatre.
Donald F. Donahue (1950)
Year of Election or Appointment: 2018
Trustee
Mr. Donahue also serves as a Trustee of other Fidelity® funds. Mr. Donahue is President and Chief Executive Officer of Miranda Partners, LLC (risk consulting for the financial services industry, 2012-present). Previously, Mr. Donahue served as a Member of the Advisory Board of certain Fidelity® funds (2015-2018) and Chief Executive Officer (2006-2012), Chief Operating Officer (2003-2006), and Managing Director, Customer Marketing and Development (1999-2003) of The Depository Trust & Clearing Corporation (financial markets infrastructure). Mr. Donahue serves as a Member (2007-present) and Co-Chairman (2016-present) of the Board of Directors of United Way of New York, Member of the Board of Directors of NYC Leadership Academy (2012-present) and Member of the Board of Advisors of Ripple Labs, Inc. (financial services, 2015-present). He also served as Chairman (2010-2012) and Member of the Board of Directors (2012-2013) of Omgeo, LLC (financial services), Treasurer of United Way of New York (2012-2016), and Member of the Board of Directors of XBRL US (financial services non-profit, 2009-2012) and the International Securities Services Association (2009-2012).
Alan J. Lacy (1953)
Year of Election or Appointment: 2018
Trustee
Mr. Lacy also serves as Trustee of other Fidelity® funds. Mr. Lacy serves as a Director of Bristol-Myers Squibb Company (global pharmaceuticals, 2008-present). He is a Trustee of the California Chapter of The Nature Conservancy (2015-present) and a Director of the Center for Advanced Study in the Behavioral Sciences at Stanford University (2015-present). In addition, Mr. Lacy served as Senior Adviser (2007-2014) of Oak Hill Capital Partners, L.P. (private equity) and also served as Chief Executive Officer (2005) and Vice Chairman (2005-2006) of Sears Holdings Corporation (retail) and Chief Executive Officer and Chairman of the Board of Sears, Roebuck and Co. (retail, 2000-2005). Previously, Mr. Lacy served as Chairman (2014-2017) and a member (2010-2017) of the Board of Directors of Dave & Buster’s Entertainment, Inc. (restaurant and entertainment complexes), as Chairman (2008-2011) and a member (2006-2015) of the Board of Trustees of the National Parks Conservation Association, and as a member of the Board of Directors for The Hillman Companies, Inc. (hardware wholesalers, 2010-2014), Earth Fare, Inc. (retail grocery, 2010-2014), and The Western Union Company (global money transfer, 2006-2011).
Ned C. Lautenbach (1944)
Year of Election or Appointment: 2018
Trustee
Chairman of the Independent Trustees
Mr. Lautenbach also serves as Trustee of other Fidelity® funds. Mr. Lautenbach currently serves as Chair (2018-present) and Member (2013-present) of the Board of Governors, State University System of Florida and is a member of the Council on Foreign Relations (1994-present). He is also a member and has most recently served as Chairman of the Board of Directors of Artis-Naples (2012-present). Previously, Mr. Lautenbach served as a member and then Lead Director of the Board of Directors of Eaton Corporation (diversified industrial, 1997-2016). He was also a Partner and Advisory Partner at Clayton, Dubilier & Rice, LLC (private equity investment, 1998-2010), as well as a Director of Sony Corporation (2006-2007). In addition, Mr. Lautenbach also had a 30-year career with IBM (technology company) during which time he served as Senior Vice President and a member of the Corporate Executive Committee (1968-1998).
Joseph Mauriello (1944)
Year of Election or Appointment: 2018
Trustee
Mr. Mauriello also serves as Trustee of other Fidelity® funds. Prior to his retirement in January 2006, Mr. Mauriello served in numerous senior management positions including Deputy Chairman and Chief Operating Officer (2004-2005), and Vice Chairman of Financial Services (2002-2004) of KPMG LLP US (professional services, 1965-2005). Mr. Mauriello currently serves as a member of the Independent Directors Council (IDC) Governing Council (2015-present). Previously, Mr. Mauriello served as a member of the Board of Directors of XL Group plc. (global insurance and re-insurance, 2006-2018).
Cornelia M. Small (1944)
Year of Election or Appointment: 2018
Trustee
Ms. Small also serves as Trustee of other Fidelity® funds. Ms. Small is a member of the Board of Directors (2009-present) and Chair of the Investment Committee (2010-present) of the Teagle Foundation. Ms. Small also serves on the Investment Committee of the Berkshire Taconic Community Foundation (2008-present). Previously, Ms. Small served as Chairperson (2002-2008) and a member of the Investment Committee and Chairperson (2008-2012) and a member of the Board of Trustees of Smith College. In addition, Ms. Small served as Chief Investment Officer, Director of Global Equity Investments, and a member of the Board of Directors of Scudder, Stevens & Clark and Scudder Kemper Investments.
Garnett A. Smith (1947)
Year of Election or Appointment: 2013
Trustee
Mr. Smith also serves as Trustee of other Fidelity® funds. Prior to Mr. Smith's retirement, he served as Chairman and Chief Executive Officer of Inbrand Corp. (manufacturer of personal absorbent products, 1990-1997). He also served as President (1986-1990) of Inbrand Corp. Prior to his employment with Inbrand Corp., he was employed by a retail fabric chain and North Carolina National Bank. In addition, Mr. Smith served as a Member of the Advisory Board of certain Fidelity® funds (2012-2013) and as a board member of the Jackson Hole Land Trust (2009-2012).
David M. Thomas (1949)
Year of Election or Appointment: 2018
Trustee
Mr. Thomas also serves as Trustee of other Fidelity® funds. Mr. Thomas serves as Non-Executive Chairman of the Board of Directors of Fortune Brands Home and Security (home and security products, 2011-present) and as a member of the Board of Directors (2004-present) and Presiding Director (2013-present) of Interpublic Group of Companies, Inc. (marketing communication). Previously, Mr. Thomas served as Executive Chairman (2005-2006) and Chairman and Chief Executive Officer (2000-2005) of IMS Health, Inc. (pharmaceutical and healthcare information solutions), a Director of Fortune Brands, Inc. (consumer products, 2000-2011), and a member of the Board of Trustees of the University of Florida (2013-2018).
Michael E. Wiley (1950)
Year of Election or Appointment: 2008
Trustee
Mr. Wiley also serves as Trustee or Member of the Advisory Board of other Fidelity® funds. Mr. Wiley serves as a Director of High Point Resources (exploration and production, 2005-present). Previously, Mr. Wiley served as a Director of Andeavor Corporation (independent oil refiner and marketer, 2005-2018), a Director of Andeavor Logistics LP (natural resources logistics, 2015-2018), a Director of Post Oak Bank (privately-held bank, 2004-2018), a Director of Asia Pacific Exploration Consolidated (international oil and gas exploration and production, 2008-2013), a member of the Board of Trustees of the University of Tulsa (2000-2006; 2007-2010), a Senior Energy Advisor of Katzenbach Partners, LLC (consulting, 2006-2007), an Advisory Director of Riverstone Holdings (private investment), a Director of Spinnaker Exploration Company (exploration and production, 2001-2005) and Chairman, President, and CEO of Baker Hughes, Inc. (oilfield services, 2000-2004).
+ The information includes the Trustee's principal occupation during the last five years and other information relating to the experience, attributes, and skills relevant to the Trustee's qualifications to serve as a Trustee, which led to the conclusion that the Trustee should serve as a Trustee for the fund.
Advisory Board Members and Officers:
Correspondence intended for a Member of the Advisory Board (if any) may be sent to Fidelity Investments, P.O. Box 55235, Boston, Massachusetts 02205-5235. Correspondence intended for an officer or Peter S. Lynch may be sent to Fidelity Investments, 245 Summer Street, Boston, Massachusetts 02210. Officers appear below in alphabetical order.
Name, Year of Birth; Principal Occupation
Vicki L. Fuller (1957)
Year of Election or Appointment: 2018
Member of the Advisory Board
Ms. Fuller also serves as Member of the Advisory Board of other Fidelity® funds. Ms. Fuller serves as a member of the Board of Directors, Audit Committee, and Nominating and Governance Committee of The Williams Companies, Inc. (natural gas infrastructure, 2018-present). Previously, Ms. Fuller served as the Chief Investment Officer of the New York State Common Retirement Fund (2012-2018) and held a variety of positions at AllianceBernstein L.P. (global asset management, 1985-2012), including Managing Director (2006-2012) and Senior Vice President and Senior Portfolio Manager (2001-2006).
Patricia L. Kampling (1959)
Year of Election or Appointment: 2020
Member of the Advisory Board
Ms. Kampling also serves as Member of the Advisory Board of other Fidelity® funds. Prior to her retirement, Ms. Kampling served as Chairman of the Board and Chief Executive Officer (2012-2019), President and Chief Operating Officer (2011-2012) and Executive Vice President and Chief Financial Officer (2010-2011) of Alliant Energy Corporation. Ms. Kampling currently serves as a member of the Board, Compensation Committee and Executive Committee and as Chair of the Audit Committee of Briggs & Stratton Corporation (manufacturing, 2011-present) and as a member of the Board, Audit, Finance and Risk Committee and Safety, Environmental, Technology and Operations Committee of American Water Works Company, Inc. (utilities company, 2019-present). In addition, Ms. Kampling currently serves as a member of the Board of the Nature Conservancy, Wisconsin Chapter (2019-present). Previously, Ms. Kampling served as a member of the Board of Interstate Power and Light Company (2012-2019) and Wisconsin Power and Light Company (2012-2019) (each a subsidiary of Alliant Energy Corporation) and as a member of the Board and Workforce Development Committee of the Business Roundtable (2018-2019).
Peter S. Lynch (1944)
Year of Election or Appointment: 2018
Member of the Advisory Board
Mr. Lynch also serves as Member of the Advisory Board of other Fidelity® funds. Mr. Lynch is Vice Chairman and a Director of Fidelity Management & Research Company LLC (investment adviser firm). In addition, Mr. Lynch serves as a Trustee of Boston College and as the Chairman of the Inner-City Scholarship Fund. Previously, Mr. Lynch served as Vice Chairman and a Director of FMR Co., Inc. (investment adviser firm) and on the Special Olympics International Board of Directors (1997-2006).
Susan Tomasky (1953)
Year of Election or Appointment: 2020
Member of the Advisory Board
Ms. Tomasky also serves as Member of the Advisory Board of other Fidelity® funds. Prior to her retirement, Ms. Tomasky served in various executive officer positions at American Electric Power Company, Inc. (1998-2011), including most recently as President of AEP Transmission (2007-2011). Ms. Tomasky currently serves as a member of the Board and Sustainability Committee and as Chair of the Audit Committee of Marathon Petroleum Corporation (2018-present) and as a member of the Board, Corporate Governance Committee and Organization and Compensation Committee and as Chair of the Audit Committee of Public Service Enterprise Group, Inc. (utilities company, 2012-present). In addition, Ms. Tomasky currently serves as a member of the Board of the Columbus Regional Airport Authority (2007-present), as a member of the Board of the Royal Shakespeare Company – America (2009-present), as a member of the Board of the Columbus Association for the Performing Arts (2011-present) and as a member of the Board of Kenyon College (2016-present). Previously, Ms. Tomasky served as a member of the Board (2011-2019) and as Lead Independent Director (2015-2018) of Andeavor Corporation (previously Tesoro Corporation) (independent oil refiner and marketer) and as a member of the Board of Summit Midstream Partners LP (energy, 2012-2018).
Elizabeth Paige Baumann (1968)
Year of Election or Appointment: 2017
Anti-Money Laundering (AML) Officer
Ms. Baumann also serves as AML Officer of other funds. She is Chief AML Officer (2012-present) and Senior Vice President (2014-present) of FMR LLC (diversified financial services company) and is an employee of Fidelity Investments. Previously, Ms. Baumann served as AML Officer of the funds (2012-2016), and Vice President (2007-2014) and Deputy Anti-Money Laundering Officer (2007-2012) of FMR LLC.
Craig S. Brown (1977)
Year of Election or Appointment: 2019
Assistant Treasurer
Mr. Brown also serves as Assistant Treasurer of other funds. Mr. Brown is an employee of Fidelity Investments (2013-present).
John J. Burke III (1964)
Year of Election or Appointment: 2018
Chief Financial Officer
Mr. Burke also serves as Chief Financial Officer of other funds. Mr. Burke serves as Head of Investment Operations for Fidelity Fund and Investment Operations (2018-present) and is an employee of Fidelity Investments (1998-present). Previously Mr. Burke served as head of Asset Management Investment Operations (2012-2018).
William C. Coffey (1969)
Year of Election or Appointment: 2019
Assistant Secretary
Mr. Coffey also serves as Assistant Secretary of other funds. He is Senior Vice President and Deputy General Counsel of FMR LLC (diversified financial services company, 2010-present), and is an employee of Fidelity Investments. Previously, Mr. Coffey served as Secretary and CLO of certain funds (2018-2019); CLO, Secretary, and Senior Vice President of Fidelity Management & Research Company and FMR Co., Inc. (investment adviser firms, 2018-2019); Secretary of Fidelity SelectCo, LLC and Fidelity Investments Money Management, Inc. (investment adviser firms, 2018-2019); CLO of Fidelity Management & Research (Hong Kong) Limited, FMR Investment Management (UK) Limited, and Fidelity Management & Research (Japan) Limited (investment adviser firms, 2018-2019); and Assistant Secretary of certain funds (2009-2018).
Timothy M. Cohen (1969)
Year of Election or Appointment: 2018
Vice President
Mr. Cohen also serves as Vice President of other funds. Mr. Cohen serves as Co-Head of Equity (2018-present), a Director of Fidelity Management & Research (Japan) Limited (investment adviser firm, 2016-present), and is an employee of Fidelity Investments. Previously, Mr. Cohen served as Executive Vice President of Fidelity SelectCo, LLC (2019), Head of Global Equity Research (2016-2018), Chief Investment Officer - Equity and a Director of Fidelity Management & Research (U.K.) Inc. (investment adviser firm, 2013-2015) and as a Director of Fidelity Management & Research (Hong Kong) Limited (investment adviser firm, 2017).
Jonathan Davis (1968)
Year of Election or Appointment: 2010
Assistant Treasurer
Mr. Davis also serves as Assistant Treasurer of other funds. Mr. Davis serves as Assistant Treasurer of FMR Capital, Inc. (2017-present) and is an employee of Fidelity Investments. Previously, Mr. Davis served as Vice President and Associate General Counsel of FMR LLC (diversified financial services company, 2003-2010).
Laura M. Del Prato (1964)
Year of Election or Appointment: 2018
Assistant Treasurer
Ms. Del Prato also serves as an officer of other funds. Ms. Del Prato is an employee of Fidelity Investments (2017-present). Prior to joining Fidelity Investments, Ms. Del Prato served as a Managing Director and Treasurer of the JPMorgan Mutual Funds (2014-2017). Prior to JPMorgan, Ms. Del Prato served as a partner at Cohen Fund Audit Services (accounting firm, 2012-2013) and KPMG LLP (accounting firm, 2004-2012).
Colm A. Hogan (1973)
Year of Election or Appointment: 2020
Assistant Treasurer
Mr. Hogan also serves as an officer of other funds. Mr. Hogan serves as Assistant Treasurer of FMR Capital, Inc. (2017-present) and is an employee of Fidelity Investments (2005-present). Previously, Mr. Hogan served as Deputy Treasurer of certain Fidelity® funds (2016-2020) and Assistant Treasurer of certain Fidelity® funds (2016-2018).
Pamela R. Holding (1964)
Year of Election or Appointment: 2018
Vice President
Ms. Holding also serves as Vice President of other funds. Ms. Holding serves as Co-Head of Equity (2018-present) and is an employee of Fidelity Investments (2013-present). Previously, Ms. Holding served as Executive Vice President of Fidelity SelectCo, LLC (2019) and as Chief Investment Officer of Fidelity Institutional Asset Management (2013-2018).
Cynthia Lo Bessette (1969)
Year of Election or Appointment: 2019
Secretary and Chief Legal Officer (CLO)
Ms. Lo Bessette also serves as an officer of other funds. Ms. Lo Bessette serves as CLO, Secretary, and Senior Vice President of Fidelity Management & Research Company LLC (investment adviser firm, 2019-present); and CLO of Fidelity Management & Research (Hong Kong) Limited, FMR Investment Management (UK) Limited, and Fidelity Management & Research (Japan) Limited (investment adviser firms, 2019-present). She is a Senior Vice President and Deputy General Counsel of FMR LLC (diversified financial services company, 2019-present), and is an employee of Fidelity Investments. Previously, Ms. Lo Bessette served as CLO, Secretary, and Senior Vice President of FMR Co., Inc. (investment adviser firm, 2019); Secretary of Fidelity SelectCo, LLC and Fidelity Investments Money Management, Inc. (investment adviser firms, 2019). Prior to joining Fidelity Investments, Ms. Lo Bessette was Executive Vice President, General Counsel (2016-2019) and Senior Vice President, Deputy General Counsel (2015-2016) of OppenheimerFunds (investment management company) and Deputy Chief Legal Officer (2013-2015) of Jennison Associates LLC (investment adviser firm).
Chris Maher (1972)
Year of Election or Appointment: 2020
Deputy Treasurer
Mr. Maher also serves as an officer of other funds. Mr. Maher serves as Assistant Treasurer of FMR Capital, Inc. (2017-present), and is an employee of Fidelity Investments (2008-present). Previously, Mr. Maher served as Assistant Treasurer of certain funds (2013-2020); Vice President of Asset Management Compliance (2013), Vice President of the Program Management Group of FMR (investment adviser firm, 2010-2013), and Vice President of Valuation Oversight (2008-2010).
Kenneth B. Robins (1969)
Year of Election or Appointment: 2018
Chief Compliance Officer
Mr. Robins also serves as an officer of other funds. Mr. Robins serves as Compliance Officer of Fidelity Management & Research Company LLC (investment adviser firm, 2016-present) and is an employee of Fidelity Investments (2004-present). Previously, Mr. Robins served as Compliance Officer of FMR Co., Inc. (investment adviser firm, 2016-2019), as Executive Vice President of Fidelity Investments Money Management, Inc. (investment adviser firm, 2013-2016) and served in other fund officer roles.
Stacie M. Smith (1974)
Year of Election or Appointment: 2018
President and Treasurer
Ms. Smith also serves as an officer of other funds. Ms. Smith serves as Assistant Treasurer of FMR Capital, Inc. (2017-present), is an employee of Fidelity Investments (2009-present), and has served in other fund officer roles. Prior to joining Fidelity Investments, Ms. Smith served as Senior Audit Manager of Ernst & Young LLP (accounting firm, 1996-2009). Previously, Ms. Smith served as Assistant Treasurer (2013-2019) and Deputy Treasurer (2013-2016) of certain Fidelity® funds.
Marc L. Spector (1972)
Year of Election or Appointment: 2017
Assistant Treasurer
Mr. Spector also serves as an officer of other funds. Mr. Spector serves as Assistant Treasurer of FMR Capital, Inc. (2017-present) and is an employee of Fidelity Investments (2016-present). Prior to joining Fidelity Investments, Mr. Spector served as Director at the Siegfried Group (accounting firm, 2013-2016), and prior to Siegfried Group as audit senior manager at Deloitte & Touche (accounting firm, 2005-2013).
Jim Wegmann (1979)
Year of Election or Appointment: 2019
Assistant Treasurer
Mr. Wegmann also serves as Assistant Treasurer of other funds. Mr. Wegmann is an employee of Fidelity Investments (2011-present).
Shareholder Expense Example
As a shareholder of the Fund, you incur two types of costs: (1) transaction costs and (2) ongoing costs, including management fees and other Fund expenses. This Example is intended to help you understand your ongoing costs (in dollars) of investing in the Fund and to compare these costs with the ongoing costs of investing in other mutual funds.
The Example is based on an investment of $1,000 invested at the beginning of the period and held for the entire period (July 1, 2019 to December 31, 2019).
Actual Expenses
The first line of the accompanying table for each class of the Fund provides information about actual account values and actual expenses. You may use the information in this line, together with the amount you invested, to estimate the expenses that you paid over the period. Simply divide your account value by $1,000.00 (for example, an $8,600 account value divided by $1,000.00 = 8.6), then multiply the result by the number in the first line for a class of the Fund under the heading entitled "Expenses Paid During Period" to estimate the expenses you paid on your account during this period. The estimate of expenses does not include any fees or other expenses of any variable annuity or variable life insurance product. If they were, the estimate of expenses you paid during the period would be higher, and your ending account value would be lower. In addition, the Fund, as a shareholder in the underlying Fidelity Central Funds, will indirectly bear its pro-rata share of the fees and expenses incurred by the underlying Fidelity Central Funds. These fees and expenses are not included in the Fund's annualized expense ratio used to calculate the expense estimate in the table below.
Hypothetical Example for Comparison Purposes
The second line of the accompanying table for each class of the Fund provides information about hypothetical account values and hypothetical expenses based on a Class' actual expense ratio and an assumed rate of return of 5% per year before expenses, which is not the Class' actual return. The hypothetical account values and expenses may not be used to estimate the actual ending account balance or expenses you paid for the period. You may use this information to compare the ongoing costs of investing in the Fund and other funds. To do so, compare this 5% hypothetical example with the 5% hypothetical examples that appear in the shareholder reports of the other funds. The estimate of expenses does not include any fees or other expenses of any variable annuity or variable life insurance product. If they were, the estimate of expenses you paid during the period would be higher, and your ending account value would be lower. In addition, the Fund, as a shareholder in the underlying Fidelity Central Funds, will indirectly bear its pro-rata share of the fees and expenses incurred by the underlying Fidelity Central Funds. These fees and expenses are not included in the Fund's annualized expense ratio used to calculate the expense estimate in the table below.
Please note that the expenses shown in the table are meant to highlight your ongoing costs only and do not reflect any transaction costs. Therefore, the second line of the table is useful in comparing ongoing costs only, and will not help you determine the relative total costs of owning different funds.
| | Annualized Expense Ratio-A | Beginning
Account Value
July 1, 2019 | Ending
Account Value
December 31, 2019 | Expenses Paid
During Period-B
July 1, 2019
to December 31, 2019 |
| Initial Class | .66% | | | |
| Actual | | $1,000.00 | $1,088.40 | $3.47 |
| Hypothetical-C | | $1,000.00 | $1,021.88 | $3.36 |
| Investor Class | .74% | | | |
| Actual | | $1,000.00 | $1,088.50 | $3.90 |
| Hypothetical-C | | $1,000.00 | $1,021.48 | $3.77 |
A Annualized expense ratio reflects expenses net of applicable fee waivers.
B Expenses are equal to each Class' annualized expense ratio, multiplied by the average account value over the period, multiplied by 184/365 (to reflect the one-half year period).
C 5% return per year before expenses
Distributions (Unaudited)
The Board of Trustees of VIP Utilities Portfolio Fund voted to pay to shareholders of record at the opening of business on record date, the following distributions per share derived from capital gains realized from sales of portfolio securities and dividends derived from net investment income:
| | Pay Date | Record Date | Dividends | Capital Gains |
| VIP Utilities Portfolio | | | | |
| Initial Class | 02/07/2020 | 02/07/2020 | $0.086 | $0.276 |
| Investor Class | 02/07/2020 | 02/07/2020 | $0.084 | $0.276 |
|
The fund hereby designates as a capital gain dividend with respect to the taxable year ended December 31, 2019, $3,789,786, or, if subsequently determined to be different, the net capital gain of such year.
Initial Class designates 96% and Investor Class designates 99% of the dividend distributed in December 2019 as qualifying for the dividends–received deduction for corporate shareholders.
Board Approval of Investment Advisory Contracts
VIP Utilities Portfolio
At its November 2019 meeting, the Board of Trustees, including the Independent Trustees (together, the Board), voted to approve an amended and restated management contract and amended and restated sub-advisory agreements (together, the Amended and Restated Contracts) for the fund, effective January 1, 2020, for a one month period through January 31, 2020, in connection with an upcoming consolidation of certain of Fidelity's advisory businesses.
The Board considered that, on or about January 1, 2020, each of FMR Co., Inc. (FMRC), Fidelity Investments Money Management, Inc. (FIMM), and SelectCo, LLC (SelectCo) will merge with and into Fidelity Management & Research Company (FMR) and that, after the merger, FMR will redomicile as a Delaware limited liability company. The Board also approved the termination of the sub-advisory agreement with FMRC upon the completion of the merger. The Board noted that the Amended and Restated Contracts would be updated to reflect the renamed adviser, Fidelity Management & Research Company LLC and its new form of organization and domicile. The Board also noted that the Amended and Restated Contracts will not change the investment processes, the level or nature of services provided, the resources and personnel allocated, trading and compliance operations, or any fees or expenses paid by the fund.
The Board concluded that the fund's Amended and Restated Contracts are fair and reasonable, and that the fund's Advisory Contracts should be approved through January 31, 2020.
In connection with its consideration of future renewals of the fund's Amended and Restated Contracts, the Board will consider: (i) the nature, extent and quality of services provided to the fund, including shareholder and administrative services and investment performance; (ii) the competitiveness of the management fee and total expenses for the fund; (iii) the costs of the services and profitability, including the revenues earned and the expenses incurred in conducting the business of developing, marketing, distributing, managing, administering, and servicing the fund and its shareholders, to the extent applicable; and (iv) whether there have been economies of scale in respect of the Fidelity funds, whether the Fidelity funds (including the fund) have appropriately benefited from any such economies of scale, and whether there is the potential for realization of any further economies.
Based on its evaluation of all of the conclusions noted above, and after considering all factors it believed relevant, the Board ultimately concluded that the fund's management fee structure is fair and reasonable, and that the continuation of the fund's Amended and Restated Contracts should be approved.
VTELIC-ANN-0220
1.817391.114
Fidelity® Variable Insurance Products:
Communication Services Portfolio
Annual Report
December 31, 2019
See the inside front cover for important information about access to your fund’s shareholder reports.
Beginning on January 1, 2021, as permitted by regulations adopted by the Securities and Exchange Commission, and if your insurance carrier elects to participate, you may not be receiving paper copies of the Fund’s shareholder reports from the insurance company that offers your variable insurance product unless you specifically request paper copies from your financial professional or the administrator of your variable insurance product. Instead, the reports will be made available on a website, and you will be notified by mail each time a report is posted and provided with a website link to access the report.
If you already elected to receive shareholder reports electronically, you will not be affected by this change and you need not take any action. You may elect to receive shareholder reports and other communications from the Fund electronically, by contacting your financial professional or the administrator of your variable insurance product. If you own a Fidelity-administered variable insurance product, please visit fidelity.com/mailpreferences to make your election or call 1-800-343-3548.
You may elect to receive all future reports in paper free of charge. If you wish to continue receiving paper copies of your shareholder reports, you may contact your financial professional or the administrator of your variable insurance product. If you own a Fidelity-administered variable insurance product, please visit fidelity.com/mailpreferences to make your election or call 1-800-343-3548. Your election to receive reports in paper will apply to all funds available under your variable insurance product.
Contents
To view a fund's proxy voting guidelines and proxy voting record for the 12-month period ended June 30, visit http://www.fidelity.com/proxyvotingresults or visit the Securities and Exchange Commission's (SEC) web site at http://www.sec.gov.
You may also call 1-877-208-0098 to request a free copy of the proxy voting guidelines.
Fidelity® Variable Insurance Products are separate account options which are purchased through a variable insurance contract.
Standard & Poor's, S&P and S&P 500 are registered service marks of The McGraw-Hill Companies, Inc. and have been licensed for use by Fidelity Distributors Corporation.
Other third-party marks appearing herein are the property of their respective owners.
All other marks appearing herein are registered or unregistered trademarks or service marks of FMR LLC or an affiliated company. © 2020 FMR LLC. All rights reserved.
This report and the financial statements contained herein are submitted for the general information of the shareholders of the Fund. This report is not authorized for distribution to prospective investors in the Fund unless preceded or accompanied by an effective prospectus.
A fund files its complete schedule of portfolio holdings with the SEC for the first and third quarters of each fiscal year on Form N-PORT. Forms N-PORT are available on the SEC’s web site at http://www.sec.gov. A fund's Forms N-PORT may be reviewed and copied at the SEC’s Public Reference Room in Washington, DC. Information regarding the operation of the SEC's Public Reference Room may be obtained by calling 1-800-SEC-0330.
For a complete list of a fund's portfolio holdings, view the most recent holdings listing, semiannual report, or annual report on Fidelity's web site at http://www.fidelity.com, http://www.institutional.fidelity.com, or http://www.401k.com, as applicable.
NOT FDIC INSURED •MAY LOSE VALUE •NO BANK GUARANTEE
Neither the Fund nor Fidelity Distributors Corporation is a bank.
Note to shareholders:
As part of a regular review of its organizational structure, Fidelity has decided to merge certain entities to streamline operations, increase efficiency, simplify reporting, and reduce legal, compliance, and accounting complexity and costs. In separate events, Fidelity has merged four of its investment advisers and two of its broker-dealers.
Effective on or about January 1, 2020, following any required regulatory notices and approvals:
Investment advisers Fidelity Investments Money Management, Inc., FMR Co., Inc., and Fidelity SelectCo, LLC, merged with and into Fidelity Management & Research Company. In connection with the merger transactions, the resulting, merged investment adviser was then redomiciled from Massachusetts to Delaware, changed its corporate structure from a corporation to a limited liability company, and changed its name to “Fidelity Management & Research Company LLC”.
Broker-dealer Fidelity Distributors Corporation merged with and into Fidelity Investments Institutional Services Company, Inc. (“FIISC”). FIISC was then redomiciled from Massachusetts to Delaware, changed its corporate structure from a corporation to a limited liability company, and changed its name to “Fidelity Distributors Company LLC”.
These mergers are not expected to affect fund shareholders or Fidelity clients, nor are they expected to result in any changes to the day-to-day management of Fidelity’s brokerage services, the Fidelity funds, their investment policies and practices, their portfolio management teams, or the funds’ expenses.
Performance: The Bottom Line
Average annual total return reflects the change in the value of an investment, assuming reinvestment of distributions from dividend income and capital gains (the profits earned upon the sale of securities that have grown in value, if any) and assuming a constant rate of performance each year. During periods of reimbursement by Fidelity, a fund’s total return will be greater than it would be had the reimbursement not occurred. Performance numbers are net of all underlying fund operating expenses, but do not include any insurance charges imposed by your insurance company’s separate account. If performance information included the effect of these additional charges, the total returns would have been lower. How a fund did yesterday is no guarantee of how it will do tomorrow.
Average Annual Total Returns
| For the periods ended December 31, 2019 | Past 1 year | Past 5 years | Past 10 years |
| Initial Class | 32.98% | 10.05% | 10.88% |
| Investor Class | 32.95% | 9.99% | 10.80% |
$10,000 Over 10 Years
Let's say hypothetically that $10,000 was invested in VIP Communication Services Portfolio - Initial Class on December 31, 2009.
The chart shows how the value of your investment would have changed, and also shows how the S&P 500® Index performed over the same period.

| Period Ending Values |
| $28,088 | VIP Communication Services Portfolio - Initial Class |
| $35,666 | S&P 500® Index |
Management's Discussion of Fund Performance
Market Recap: U.S. stocks continued to roll in 2019, with the S&P 500
® index soaring 31.49% and marking history as the longest and strongest bull market ever, despite persistent, nagging concerns about global economic growth and trade. After a rough end to 2018, equities sharply reversed course to begin the new year amid upbeat company earnings and signs the Federal Reserve may pause on rates. The uptrend continued until May, when the index sunk as trade negotiations between the U.S. and China broke down. The bull market roared back to record a series of highs in July, when the Fed cut interest rates for the first time since 2008. Volatility intensified in August, as the Treasury yield curve inverted, which some investors viewed as a sign the U.S. economy could be heading for recession. But the market proved resilient, hitting a new high on October 30, when the Fed lowered rates for the third time in 2019, and moving even higher through year-end. Gains were robust and broad-based, with information technology (+50%) leading the way with its best calendar-year result in a decade, amid strong growth trends. Communication services (+33%) and financials (+32%) also stood out. In contrast, energy (+12%) was by far the weakest group – struggling amid sluggish oil prices – while several strong gainers nonetheless fell short of the broader market: industrials and real estate (+29% each), consumer discretionary and consumer staples (+28% each), utilities (+26%), materials (+25%), and health care (+21%).
Comments from Portfolio Manager Matthew Drukker: For the fiscal year, the fund's share classes gained roughly 33%, notably outpacing the 27.94% result of the sector benchmark, the MSCI U.S. IMI Communication Services 25/50 Index, and ahead of the S&P 500
®. Communication services stocks benefited from their limited exposure to global trade uncertainty this year. Versus the sector benchmark, both stock and market selection propelled the fund's outperformance this period. Stock picking in the internet & direct marketing retail segment - namely, owning two non-index Chinese companies, Meituan Dianping and Pinduoduo - gave the fund a significant edge. Shares of Beijing-based Meituan Dianping (+40%), a holding company that owns mobile-centric dining services akin to those offered by U.S.-based OpenTable, GrubHub and Yelp, gained strongly, as the company increased the number of its transactions and capitalized on China's digitalization of the food industry. Pinduoduo (+66%), an e-commerce platform that hosts group coupon deals for its customers, posted robust revenue gains and notable increases in its monthly active users this year. Both Meituan Dianping and Pinduoduo were sold during the period to lock in profits. An underweighting in sector index component and telecommunication services provider Verizon Communications (+14%) also contributed. Conversely, an underweighted stake in strong-performing wireless carrier AT&T (+46%), which was also sold by period end, detracted more than any other individual position. On an individual basis, untimely ownership of Sinclair Broadcast Group (-46% fund return), which owns local television networks, dragged on the fund's relative return. An underweighting in strong-performing MSCI index constituent and telecommunications services provider AT&T (+46%) also detracted. The fund eliminated its stake in AT&T during the period.
The views expressed above reflect those of the portfolio manager(s) only through the end of the period as stated on the cover of this report and do not necessarily represent the views of Fidelity or any other person in the Fidelity organization. Any such views are subject to change at any time based upon market or other conditions and Fidelity disclaims any responsibility to update such views. These views may not be relied on as investment advice and, because investment decisions for a Fidelity fund are based on numerous factors, may not be relied on as an indication of trading intent on behalf of any Fidelity fund.
Investment Summary (Unaudited)
Top Ten Stocks as of December 31, 2019
| | % of fund's net assets |
| Alphabet, Inc. Class A | 23.6 |
| Facebook, Inc. Class A | 18.1 |
| Activision Blizzard, Inc. | 8.1 |
| Verizon Communications, Inc. | 4.8 |
| The Walt Disney Co. | 4.8 |
| Netflix, Inc. | 4.8 |
| Liberty Broadband Corp. Class A | 4.3 |
| Lyft, Inc. | 3.2 |
| T-Mobile U.S., Inc. | 2.7 |
| Electronic Arts, Inc. | 2.6 |
| | 77.0 |
Top Industries (% of fund's net assets)
| As of December 31, 2019 |
| | Interactive Media & Services | 43.7% |
| | Entertainment | 25.4% |
| | Media | 17.2% |
| | Diversified Telecommunication Services | 6.2% |
| | Wireless Telecommunication Services | 3.8% |
| | All Others* | 3.7% |

* Includes short-term investments and net other assets (liabilities).
Schedule of Investments December 31, 2019
Showing Percentage of Net Assets
| Common Stocks - 99.5% | | | |
| | | Shares | Value |
| Diversified Telecommunication Services - 6.2% | | | |
| Alternative Carriers - 1.4% | | | |
| GCI Liberty, Inc. (a) | | 3,682 | $260,870 |
| Iridium Communications, Inc. (a) | | 24,063 | 592,912 |
| Vonage Holdings Corp. (a) | | 37,200 | 275,652 |
| | | | 1,129,434 |
| Integrated Telecommunication Services - 4.8% | | | |
| Verizon Communications, Inc. | | 63,000 | 3,868,200 |
|
| TOTAL DIVERSIFIED TELECOMMUNICATION SERVICES | | | 4,997,634 |
|
| Entertainment - 25.4% | | | |
| Interactive Home Entertainment - 13.6% | | | |
| Activision Blizzard, Inc. | | 109,600 | 6,512,432 |
| DouYu International Holdings Ltd. ADR | | 74,074 | 627,407 |
| Electronic Arts, Inc. (a) | | 19,700 | 2,117,947 |
| Take-Two Interactive Software, Inc. (a) | | 11,400 | 1,395,702 |
| Zynga, Inc. (a) | | 54,300 | 332,316 |
| | | | 10,985,804 |
| Movies & Entertainment - 11.8% | | | |
| Lions Gate Entertainment Corp.: | | | |
| Class A (a)(b) | | 4,200 | 44,772 |
| Class B (a) | | 34,700 | 344,571 |
| Netflix, Inc. (a) | | 11,910 | 3,853,719 |
| The Walt Disney Co. | | 26,723 | 3,864,947 |
| World Wrestling Entertainment, Inc. Class A (b) | | 22,700 | 1,472,549 |
| | | | 9,580,558 |
|
| TOTAL ENTERTAINMENT | | | 20,566,362 |
|
| Interactive Media & Services - 43.7% | | | |
| Interactive Media & Services - 43.7% | | | |
| Alphabet, Inc. Class A (a) | | 14,290 | 19,139,883 |
| ANGI Homeservices, Inc. Class A (a)(b) | | 136,700 | 1,157,849 |
| Facebook, Inc. Class A (a) | | 71,300 | 14,634,325 |
| Match Group, Inc. (b) | | 2,500 | 205,275 |
| Zillow Group, Inc. Class A (a) | | 6,700 | 306,458 |
| | | | 35,443,790 |
| Media - 17.2% | | | |
| Broadcasting - 5.9% | | | |
| CBS Corp. Class B | | 30,300 | 1,271,691 |
| Discovery Communications, Inc. Class C (non-vtg.) (a) | | 14,000 | 426,860 |
| Liberty Media Corp.: | | | |
| Liberty Media Class A (a) | | 32,000 | 1,400,960 |
| Liberty SiriusXM Series A (a) | | 16,600 | 802,444 |
| Sinclair Broadcast Group, Inc. Class A | | 25,000 | 833,500 |
| | | | 4,735,455 |
| Cable & Satellite - 11.3% | | | |
| Comcast Corp. Class A | | 46,700 | 2,100,099 |
| DISH Network Corp. Class A (a) | | 13,054 | 463,025 |
| Grupo Televisa SA de CV (CPO) sponsored ADR | | 44,200 | 518,466 |
| Liberty Broadband Corp. Class A (a) | | 28,300 | 3,525,048 |
| Liberty Global PLC Class C (a) | | 97,000 | 2,114,115 |
| Liberty Latin America Ltd. Class C (a) | | 23,236 | 452,173 |
| | | | 9,172,926 |
|
| TOTAL MEDIA | | | 13,908,381 |
|
| Road & Rail - 3.2% | | | |
| Trucking - 3.2% | | | |
| Lyft, Inc. | | 60,500 | 2,602,710 |
| Wireless Telecommunication Services - 3.8% | | | |
| Wireless Telecommunication Services - 3.8% | | | |
| Millicom International Cellular SA | | 5,000 | 241,150 |
| Sprint Corp. (a) | | 134,800 | 702,308 |
| T-Mobile U.S., Inc. (a) | | 27,628 | 2,166,588 |
| | | | 3,110,046 |
| TOTAL COMMON STOCKS | | | |
| (Cost $67,110,300) | | | 80,628,923 |
|
| Money Market Funds - 3.3% | | | |
| Fidelity Cash Central Fund 1.58% (c) | | 329,407 | 329,473 |
| Fidelity Securities Lending Cash Central Fund 1.58% (c)(d) | | 2,299,595 | 2,299,825 |
| TOTAL MONEY MARKET FUNDS | | | |
| (Cost $2,629,298) | | | 2,629,298 |
| TOTAL INVESTMENT IN SECURITIES - 102.8% | | | |
| (Cost $69,739,598) | | | 83,258,221 |
| NET OTHER ASSETS (LIABILITIES) - (2.8)% | | | (2,256,200) |
| NET ASSETS - 100% | | | $81,002,021 |
Legend
(a) Non-income producing
(b) Security or a portion of the security is on loan at period end.
(c) Affiliated fund that is generally available only to investment companies and other accounts managed by Fidelity Investments. The rate quoted is the annualized seven-day yield of the fund at period end. A complete unaudited listing of the fund's holdings as of its most recent quarter end is available upon request. In addition, each Fidelity Central Fund's financial statements, which are not covered by the Fund's Report of Independent Registered Public Accounting Firm, are available on the SEC's website or upon request.
(d) Investment made with cash collateral received from securities on loan.
Affiliated Central Funds
Information regarding fiscal year to date income earned by the Fund from investments in Fidelity Central Funds is as follows:
| Fund | Income earned |
| Fidelity Cash Central Fund | $15,712 |
| Fidelity Securities Lending Cash Central Fund | 6,430 |
| Total | $22,142 |
Amounts in the income column in the above table include any capital gain distributions from underlying funds, which are presented in the corresponding line-item in the Statement of Operations, if applicable. Amount for Fidelity Securities Lending Cash Central Fund represents the income earned on investing cash collateral, less rebates paid to borrowers and any lending agent fees associated with the loan, plus any premium payments received for lending certain types of securities.
Investment Valuation
All investments are categorized as Level 1 under the Fair Value Hierarchy. The inputs or methodology used for valuing securities may not be an indication of the risk associated with investing in those securities. For more information on valuation inputs please refer to the Investment Valuation section in the accompanying Notes to Financial Statements.
See accompanying notes which are an integral part of the financial statements.
Financial Statements
Statement of Assets and Liabilities
| | | December 31, 2019 |
| Assets | | |
Investment in securities, at value (including securities loaned of $2,280,286) — See accompanying schedule:
Unaffiliated issuers (cost $67,110,300) | $80,628,923 | |
| Fidelity Central Funds (cost $2,629,298) | 2,629,298 | |
| Total Investment in Securities (cost $69,739,598) | | $83,258,221 |
| Cash | | 10,159 |
| Foreign currency held at value (cost $39) | | 39 |
| Receivable for fund shares sold | | 220,170 |
| Dividends receivable | | 30,260 |
| Distributions receivable from Fidelity Central Funds | | 2,708 |
| Prepaid expenses | | 333 |
| Other receivables | | 2,326 |
| Total assets | | 83,524,216 |
| Liabilities | | |
| Payable for fund shares redeemed | $136,006 | |
| Accrued management fee | 35,486 | |
| Other affiliated payables | 11,571 | |
| Other payables and accrued expenses | 39,377 | |
| Collateral on securities loaned | 2,299,755 | |
| Total liabilities | | 2,522,195 |
| Net Assets | | $81,002,021 |
| Net Assets consist of: | | |
| Paid in capital | | $67,101,801 |
| Total accumulated earnings (loss) | | 13,900,220 |
| Net Assets | | $81,002,021 |
| Net Asset Value and Maximum Offering Price | | |
| Initial Class: | | |
| Net Asset Value, offering price and redemption price per share ($9,865,267 ÷ 759,877 shares) | | $12.98 |
| Investor Class: | | |
| Net Asset Value, offering price and redemption price per share ($71,136,754 ÷ 5,525,163 shares) | | $12.88 |
See accompanying notes which are an integral part of the financial statements.
Statement of Operations
| | | Year ended December 31, 2019 |
| Investment Income | | |
| Dividends | | $394,910 |
| Income from Fidelity Central Funds (including $6,430 from security lending) | | 22,142 |
| Total income | | 417,052 |
| Expenses | | |
| Management fee | $362,143 | |
| Transfer agent fees | 90,616 | |
| Accounting and security lending fees | 26,292 | |
| Custodian fees and expenses | 11,306 | |
| Independent trustees' fees and expenses | 354 | |
| Audit | 43,443 | |
| Legal | 542 | |
| Miscellaneous | 365 | |
| Total expenses before reductions | 535,061 | |
| Expense reductions | (7,068) | |
| Total expenses after reductions | | 527,993 |
| Net investment income (loss) | | (110,941) |
| Realized and Unrealized Gain (Loss) | | |
| Net realized gain (loss) on: | | |
| Investment securities: | | |
| Unaffiliated issuers | 2,248,642 | |
| Fidelity Central Funds | 70 | |
| Foreign currency transactions | 97 | |
| Total net realized gain (loss) | | 2,248,809 |
| Change in net unrealized appreciation (depreciation) on: | | |
| Investment securities: | | |
| Unaffiliated issuers | 14,395,238 | |
| Assets and liabilities in foreign currencies | (16) | |
| Total change in net unrealized appreciation (depreciation) | | 14,395,222 |
| Net gain (loss) | | 16,644,031 |
| Net increase (decrease) in net assets resulting from operations | | $16,533,090 |
See accompanying notes which are an integral part of the financial statements.
Statement of Changes in Net Assets
| | Year ended December 31, 2019 | Year ended December 31, 2018 |
| Increase (Decrease) in Net Assets | | |
| Operations | | |
| Net investment income (loss) | $(110,941) | $735,952 |
| Net realized gain (loss) | 2,248,809 | 3,433,489 |
| Change in net unrealized appreciation (depreciation) | 14,395,222 | (7,025,738) |
| Net increase (decrease) in net assets resulting from operations | 16,533,090 | (2,856,297) |
| Distributions to shareholders | (4,620,909) | (4,870,900) |
| Share transactions - net increase (decrease) | 24,762,095 | 9,243,582 |
| Total increase (decrease) in net assets | 36,674,276 | 1,516,385 |
| Net Assets | | |
| Beginning of period | 44,327,745 | 42,811,360 |
| End of period | $81,002,021 | $44,327,745 |
See accompanying notes which are an integral part of the financial statements.
Financial Highlights
VIP Communication Services Portfolio Initial Class
| Years ended December 31, | 2019 | 2018 | 2017 | 2016 | 2015 |
| Selected Per–Share Data | | | | | |
| Net asset value, beginning of period | $10.58 | $12.74 | $13.10 | $10.85 | $10.74 |
| Income from Investment Operations | | | | | |
| Net investment income (loss)A | (.01) | .21B | .26 | .19 | .15 |
| Net realized and unrealized gain (loss) | 3.36 | (.89) | –C | 2.28 | .10 |
| Total from investment operations | 3.35 | (.68) | .26 | 2.47 | .25 |
| Distributions from net investment income | (.01) | (.19) | (.39) | (.15) | (.13)D |
| Distributions from net realized gain | (.94) | (1.29) | (.23) | (.08) | (.01)D |
| Total distributions | (.95) | (1.48) | (.62) | (.22)E | (.14) |
| Redemption fees added to paid in capitalA | – | – | –C | –C | –C |
| Net asset value, end of period | $12.98 | $10.58 | $12.74 | $13.10 | $10.85 |
| Total ReturnF,G | 32.98% | (5.36)% | 2.05% | 22.81% | 2.34% |
| Ratios to Average Net AssetsH,I | | | | | |
| Expenses before reductions | .72% | .81% | .76% | .78% | .88% |
| Expenses net of fee waivers, if any | .72% | .81% | .76% | .78% | .88% |
| Expenses net of all reductions | .71% | .79% | .74% | .77% | .87% |
| Net investment income (loss) | (.09)% | 1.87%B | 2.02% | 1.52% | 1.36% |
| Supplemental Data | | | | | |
| Net assets, end of period (000 omitted) | $9,865 | $5,702 | $6,067 | $15,797 | $4,839 |
| Portfolio turnover rateJ | 73% | 162% | 74% | 100% | 64% |
A Calculated based on average shares outstanding during the period.
B Net investment income per share reflects a large, non-recurring dividend which amounted to $.05 per share. Excluding this non-recurring dividend, the ratio of net investment income (loss) to average net assets would have been 1.45%.
C Amount represents less than $.005 per share.
D The amounts shown reflect certain reclassifications related to book to tax differences that were made in the year shown.
E Total distributions of $.22 per share is comprised of distributions from net investment income of $.147 and distributions from net realized gain of $.077 per share.
F Total returns do not reflect charges attributable to your insurance company's separate account. Inclusion of these charges would reduce the total returns shown.
G Total returns would have been lower if certain expenses had not been reduced during the applicable periods shown.
H Fees and expenses of any underlying Fidelity Central Funds are not included in the Fund's expense ratio. The Fund indirectly bears its proportionate share of the expenses of any underlying Fidelity Central Funds.
I Expense ratios reflect operating expenses of the class. Expenses before reductions do not reflect amounts reimbursed by the investment adviser or reductions from brokerage service arrangements or reductions from other expense offset arrangements and do not represent the amount paid by the class during periods when reimbursements or reductions occur. Expenses net of fee waivers reflect expenses after reimbursement by the investment adviser but prior to reductions from brokerage service arrangements or other expense offset arrangements. Expenses net of all reductions represent the net expenses paid by the class.
J Amount does not include the portfolio activity of any underlying Fidelity Central Funds.
See accompanying notes which are an integral part of the financial statements.
VIP Communication Services Portfolio Investor Class
| Years ended December 31, | 2019 | 2018 | 2017 | 2016 | 2015 |
| Selected Per–Share Data | | | | | |
| Net asset value, beginning of period | $10.50 | $12.65 | $13.02 | $10.79 | $10.67 |
| Income from Investment Operations | | | | | |
| Net investment income (loss)A | (.02) | .20B | .25 | .18 | .14 |
| Net realized and unrealized gain (loss) | 3.34 | (.88) | (.01) | 2.27 | .11 |
| Total from investment operations | 3.32 | (.68) | .24 | 2.45 | .25 |
| Distributions from net investment income | (.01) | (.18) | (.37) | (.14) | (.12)C |
| Distributions from net realized gain | (.93) | (1.29) | (.23) | (.08) | (.01)C |
| Total distributions | (.94) | (1.47) | (.61)D | (.22) | (.13) |
| Redemption fees added to paid in capitalA | – | – | –E | –E | –E |
| Net asset value, end of period | $12.88 | $10.50 | $12.65 | $13.02 | $10.79 |
| Total ReturnF,G | 32.95% | (5.39)% | 1.89% | 22.69% | 2.38% |
| Ratios to Average Net AssetsH,I | | | | | |
| Expenses before reductions | .80% | .89% | .84% | .86% | .95% |
| Expenses net of fee waivers, if any | .80% | .89% | .84% | .86% | .95% |
| Expenses net of all reductions | .79% | .87% | .83% | .85% | .94% |
| Net investment income (loss) | (.17)% | 1.79%B | 1.94% | 1.44% | 1.29% |
| Supplemental Data | | | | | |
| Net assets, end of period (000 omitted) | $71,137 | $38,626 | $36,744 | $74,059 | $23,080 |
| Portfolio turnover rateJ | 73% | 162% | 74% | 100% | 64% |
A Calculated based on average shares outstanding during the period.
B Net investment income per share reflects a large, non-recurring dividend which amounted to $.05 per share. Excluding this non-recurring dividend, the ratio of net investment income (loss) to average net assets would have been 1.37%.
C The amounts shown reflect certain reclassifications related to book to tax differences that were made in the year shown.
D Total distributions of $.61 per share is comprised of distributions from net investment income of $.373 and distributions from net realized gain of $.232 per share.
E Amount represents less than $.005 per share.
F Total returns do not reflect charges attributable to your insurance company's separate account. Inclusion of these charges would reduce the total returns shown.
G Total returns would have been lower if certain expenses had not been reduced during the applicable periods shown.
H Fees and expenses of any underlying Fidelity Central Funds are not included in the Fund's expense ratio. The Fund indirectly bears its proportionate share of the expenses of any underlying Fidelity Central Funds.
I Expense ratios reflect operating expenses of the class. Expenses before reductions do not reflect amounts reimbursed by the investment adviser or reductions from brokerage service arrangements or reductions from other expense offset arrangements and do not represent the amount paid by the class during periods when reimbursements or reductions occur. Expenses net of fee waivers reflect expenses after reimbursement by the investment adviser but prior to reductions from brokerage service arrangements or other expense offset arrangements. Expenses net of all reductions represent the net expenses paid by the class.
J Amount does not include the portfolio activity of any underlying Fidelity Central Funds.
See accompanying notes which are an integral part of the financial statements.
Notes to Financial Statements
For the period ended December 31, 2019
1. Organization.
VIP Communication Services Portfolio (the Fund) is a non-diversified fund of Variable Insurance Products Fund IV (the Trust) and is authorized to issue an unlimited number of shares. The Trust is registered under the Investment Company Act of 1940, as amended (the 1940 Act), as an open-end management investment company organized as a Massachusetts business trust. Shares of the Fund may only be purchased by insurance companies for the purpose of funding variable annuity or variable life insurance contracts. The Fund offers the following classes of shares: Initial Class shares and Investor Class shares. All classes have equal rights and voting privileges, except for matters affecting a single class.
2. Investments in Fidelity Central Funds.
The Fund invests in Fidelity Central Funds, which are open-end investment companies generally available only to other investment companies and accounts managed by the investment adviser and its affiliates. The Fund's Schedule of Investments lists each of the Fidelity Central Funds held as of period end, if any, as an investment of the Fund, but does not include the underlying holdings of each Fidelity Central Fund. As an Investing Fund, the Fund indirectly bears its proportionate share of the expenses of the underlying Fidelity Central Funds.
The Money Market Central Funds seek preservation of capital and current income and are managed by Fidelity Investments Money Management, Inc. (FIMM), an affiliate of the investment adviser. Annualized expenses of the Money Market Central Funds as of their most recent shareholder report date ranged from less than .005% to .01%.
A complete unaudited list of holdings for each Fidelity Central Fund is available upon request or at the Securities and Exchange Commission (the SEC) website at www.sec.gov. In addition, the financial statements of the Fidelity Central Funds, which are not covered by the Fund's Report of Independent Registered Public Accounting Firm, are available on the SEC website or upon request.
3. Significant Accounting Policies.
The Fund is an investment company and applies the accounting and reporting guidance of the Financial Accounting Standards Board (FASB) Accounting Standards Codification Topic 946 Financial Services – Investments Companies. The financial statements have been prepared in conformity with accounting principles generally accepted in the United States of America (GAAP), which require management to make certain estimates and assumptions at the date of the financial statements. Actual results could differ from those estimates. Subsequent events, if any, through the date that the financial statements were issued have been evaluated in the preparation of the financial statements. The following summarizes the significant accounting policies of the Fund:
Investment Valuation. Investments are valued as of 4:00 p.m. Eastern time on the last calendar day of the period. The Board of Trustees (the Board) has delegated the day to day responsibility for the valuation of the Fund's investments to the Fair Value Committee (the Committee) established by the Fund's investment adviser. In accordance with valuation policies and procedures approved by the Board, the Fund attempts to obtain prices from one or more third party pricing vendors or brokers to value its investments. When current market prices, quotations or currency exchange rates are not readily available or reliable, investments will be fair valued in good faith by the Committee, in accordance with procedures adopted by the Board. Factors used in determining fair value vary by investment type and may include market or investment specific events. The frequency with which these procedures are used cannot be predicted and they may be utilized to a significant extent. The Committee oversees the Fund's valuation policies and procedures and reports to the Board on the Committee's activities and fair value determinations. The Board monitors the appropriateness of the procedures used in valuing the Fund's investments and ratifies the fair value determinations of the Committee.
The Fund categorizes the inputs to valuation techniques used to value its investments into a disclosure hierarchy consisting of three levels as shown below:
- Level 1 – quoted prices in active markets for identical investments
- Level 2 – other significant observable inputs (including quoted prices for similar investments, interest rates, prepayment speeds, etc.)
- Level 3 – unobservable inputs (including the Fund's own assumptions based on the best information available)
Valuation techniques used to value the Fund's investments by major category are as follows:
Equity securities, including restricted securities, for which market quotations are readily available, are valued at the last reported sale price or official closing price as reported by a third party pricing vendor on the primary market or exchange on which they are traded and are categorized as Level 1 in the hierarchy. In the event there were no sales during the day or closing prices are not available, securities are valued at the last quoted bid price or may be valued using the last available price and are generally categorized as Level 2 in the hierarchy. For foreign equity securities, when market or security specific events arise, comparisons to the valuation of American Depositary Receipts (ADRs), futures contracts, Exchange-Traded Funds (ETFs) and certain indexes as well as quoted prices for similar securities may be used and would be categorized as Level 2 in the hierarchy. For equity securities, including restricted securities, where observable inputs are limited, assumptions about market activity and risk are used and these securities may be categorized as Level 3 in the hierarchy.
Investments in open-end mutual funds, including the Fidelity Central Funds, are valued at their closing net asset value (NAV) each business day and are categorized as Level 1 in the hierarchy.
Changes in valuation techniques may result in transfers in or out of an assigned level within the disclosure hierarchy.
Foreign Currency. The Fund may use foreign currency contracts to facilitate transactions in foreign-denominated securities. Gains and losses from these transactions may arise from changes in the value of the foreign currency or if the counterparties do not perform under the contracts' terms.
Foreign-denominated assets, including investment securities, and liabilities are translated into U.S. dollars at the exchange rates at period end. Purchases and sales of investment securities, income and dividends received and expenses denominated in foreign currencies are translated into U.S. dollars at the exchange rate in effect on the transaction date.
The effects of exchange rate fluctuations on investments are included with the net realized and unrealized gain (loss) on investment securities. Other foreign currency transactions resulting in realized and unrealized gain (loss) are disclosed separately.
Investment Transactions and Income. For financial reporting purposes, the Fund's investment holdings and NAV include trades executed through the end of the last business day of the period. The NAV per share for processing shareholder transactions is calculated as of the close of business of the New York Stock Exchange (NYSE), normally 4:00 p.m. Eastern time and includes trades executed through the end of the prior business day. Gains and losses on securities sold are determined on the basis of identified cost and include proceeds received from litigation. Dividend income is recorded on the ex-dividend date, except for certain dividends from foreign securities where the ex-dividend date may have passed, which are recorded as soon as the Fund is informed of the ex-dividend date. Non-cash dividends included in dividend income, if any, are recorded at the fair market value of the securities received. Income and capital gain distributions from Fidelity Central Funds, if any, are recorded on the ex-dividend date. Certain distributions received by the Fund represent a return of capital or capital gain. The Fund determines the components of these distributions subsequent to the ex-dividend date, based upon receipt of tax filings or other correspondence relating to the underlying investment. These distributions are recorded as a reduction of cost of investments and/or as a realized gain. Investment income is recorded net of foreign taxes withheld where recovery of such taxes is uncertain.
Class Allocations and Expenses. Investment income, realized and unrealized capital gains and losses, common expenses of the Fund, and certain fund-level expense reductions, if any, are allocated daily on a pro-rata basis to each class based on the relative net assets of each class to the total net assets of the Fund. Each class differs with respect to transfer agent fees incurred. Certain expense reductions may also differ by class. For the reporting period, the allocated portion of income and expenses to each class as a percent of its average net assets may vary due to the timing of recording these transactions in relation to fluctuating net assets of the classes. Expenses directly attributable to a fund are charged to that fund. Expenses attributable to more than one fund are allocated among the respective funds on the basis of relative net assets or other appropriate methods. Expense estimates are accrued in the period to which they relate and adjustments are made when actual amounts are known.
Income Tax Information and Distributions to Shareholders. Each year, the Fund intends to qualify as a regulated investment company under Subchapter M of the Internal Revenue Code, including distributing substantially all of its taxable income and realized gains. As a result, no provision for U.S. Federal income taxes is required. As of December 31, 2019, the Fund did not have any unrecognized tax benefits in the financial statements; nor is the Fund aware of any tax positions for which it is reasonably possible that the total amounts of unrecognized tax benefits will significantly change in the next twelve months. The Fund files a U.S. federal tax return, in addition to state and local tax returns as required. The Fund's federal income tax returns are subject to examination by the Internal Revenue Service (IRS) for a period of three fiscal years after they are filed. State and local tax returns may be subject to examination for an additional fiscal year depending on the jurisdiction. Foreign taxes are provided for based on the Fund's understanding of the tax rules and rates that exist in the foreign markets in which it invests.
Distributions are declared and recorded on the ex-dividend date. Income and capital gain distributions are declared separately for each class. Income and capital gain distributions are determined in accordance with income tax regulations, which may differ from GAAP.
Capital accounts within the financial statements are adjusted for permanent book-tax differences. These adjustments have no impact on net assets or the results of operations. Capital accounts are not adjusted for temporary book-tax differences which will reverse in a subsequent period.
Book-tax differences are primarily due to foreign currency transactions, net operating losses and losses deferred due to wash sales.
As of period end, the cost and unrealized appreciation (depreciation) in securities, and derivatives if applicable, for federal income tax purposes were as follows:
| Gross unrealized appreciation | $14,381,506 |
| Gross unrealized depreciation | (1,498,823) |
| Net unrealized appreciation (depreciation) | $12,882,683 |
| Tax Cost | $70,375,538 |
The tax-based components of distributable earnings as of period end were as follows:
| Undistributed ordinary income | $220,675 |
| Undistributed long-term capital gain | $797,361 |
| Net unrealized appreciation (depreciation) on securities and other investments | $12,882,183 |
The tax character of distributions paid was as follows:
| | December 31, 2019 | December 31, 2018 |
| Ordinary Income | $1,499,784 | $ 747,726 |
| Long-term Capital Gains | 3,121,125 | 4,123,174 |
| Total | $4,620,909 | $ 4,870,900 |
4. Purchases and Sales of Investments.
Purchases and sales of securities, other than short-term securities, aggregated $68,766,699 and $48,493,795, respectively.
5. Fees and Other Transactions with Affiliates.
Management Fee. Fidelity SelectCo, LLC (the investment adviser) and its affiliates provide the Fund with investment management related services for which the Fund pays a monthly management fee. The management fee is the sum of an individual fund fee rate that is based on an annual rate of .30% of the Fund's average net assets and an annualized group fee rate that averaged .24% during the period. The group fee rate is based upon the average net assets of all the mutual funds advised by Fidelity Management & Research Company (FMR) and the investment adviser. The group fee rate decreases as assets under management increase and increases as assets under management decrease. For the reporting period, the total annual management fee rate was .53% of the Fund's average net assets.
Transfer Agent Fees. Fidelity Investments Institutional Operations Company, Inc. (FIIOC), an affiliate of the investment adviser, is the Fund's transfer, dividend disbursing, and shareholder servicing agent. FIIOC receives an asset-based fee with respect to each class. Each class pays a fee for transfer agent services, typesetting and printing and mailing of shareholder reports, excluding mailing of proxy statements, equal to an annual rate of class-level average net assets. The annual rate for Investor Class is .15% and the annual rate for all other classes is .07%. For the period, transfer agent fees for each class were as follows:
| Initial Class | $5,434 |
| Investor Class | 85,182 |
| | $90,616 |
Accounting and Security Lending Fees. Fidelity Service Company, Inc. (FSC), an affiliate of the investment adviser, maintains the Fund's accounting records. The accounting fee is based on the level of average net assets for each month. Prior to April 1, 2019, FSC had a separate agreement with the Fund for administration of the security lending program, based on the number and duration of lending transactions. For the period, the total fees paid for accounting and administration of securities lending were equivalent to the following annual rates:
| | % of Average Net Assets |
| VIP Communication Services Portfolio | .04 |
Brokerage Commissions. A portion of portfolio transactions were placed with brokerage firms which are affiliates of the investment adviser. Brokerage commissions are included in net realized gain (loss) and change in net unrealized appreciation (depreciation) in the Statement of Operations. The commissions paid to these affiliated firms were as follows:
| | Amount |
| VIP Communication Services Portfolio | $1,590 |
Interfund Trades. The Fund may purchase from or sell securities to other Fidelity Funds under procedures adopted by the Board. The procedures have been designed to ensure these interfund trades are executed in accordance with Rule 17a-7 of the 1940 Act. Interfund trades are included within the respective purchases and sales amounts shown in the Purchases and Sales of Investments note.
6. Committed Line of Credit.
The Fund participates with other funds managed by the investment adviser or an affiliate in a $4.25 billion credit facility (the "line of credit") to be utilized for temporary or emergency purposes to fund shareholder redemptions or for other short-term liquidity purposes. The Fund has agreed to pay commitment fees on its pro-rata portion of the line of credit, which amounted to $157 and is reflected in Miscellaneous expenses on the Statement of Operations. During the period, the Fund did not borrow on this line of credit.
7. Security Lending.
The Fund lends portfolio securities from time to time in order to earn additional income. For equity securities, lending agents are used, including National Financial Services (NFS), an affiliate of the Fund. Pursuant to a securities lending agreement, NFS will receive a fee, which is capped at 9.9% of daily lending revenue, for its services as lending agent. The Fund may lend securities to certain qualified borrowers. On the settlement date of the loan, the Fund receives collateral (in the form of U.S. Treasury obligations, letters of credit and/or cash) against the loaned securities and maintains collateral in an amount not less than 100% of the market value of the loaned securities during the period of the loan. The market value of the loaned securities is determined at the close of business of the Fund and any additional required collateral is delivered to the Fund on the next business day. The Fund or borrower may terminate the loan at any time, and if the borrower defaults on its obligation to return the securities loaned because of insolvency or other reasons, the Fund may apply collateral received from the borrower against the obligation. The Fund may experience delays and costs in recovering the securities loaned. Any cash collateral received is invested in the Fidelity Securities Lending Cash Central Fund. The value of loaned securities and cash collateral at period end are disclosed on the Fund's Statement of Assets and Liabilities. Total fees paid by the Fund to NFS amounted to $614. Security lending income represents the income earned on investing cash collateral, less rebates paid to borrowers and any lending agent fees associated with the loan, plus any premium payments received for lending certain types of securities. Security lending income is presented in the Statement of Operations as a component of income from Fidelity Central Funds.
8. Expense Reductions.
Commissions paid to certain brokers with whom the investment adviser, or its affiliates, places trades on behalf of the Fund include an amount in addition to trade execution, which may be rebated back to the Fund to offset certain expenses. This amount totaled $6,698 for the period.
In addition, during the period the investment adviser reimbursed and/or waived a portion of fund-level operating expenses in the amount of $370.
9. Distributions to Shareholders.
Distributions to shareholders of each class were as follows:
| | Year ended
December 31, 2019 | Year ended
December 31, 2018 |
| Distributions to shareholders | | |
| Initial Class | $595,009 | $652,471 |
| Investor Class | 4,025,900 | 4,218,429 |
| Total | $4,620,909 | $4,870,900 |
10. Share Transactions.
Transactions for each class of shares were as follows:
| | Shares | Shares | Dollars | Dollars |
| | Year ended December 31, 2019 | Year ended December 31, 2018 | Year ended December 31, 2019 | Year ended December 31, 2018 |
| Initial Class | | | | |
| Shares sold | 568,742 | 196,801 | $6,916,427 | $2,250,219 |
| Reinvestment of distributions | 51,711 | 60,945 | 595,009 | 652,471 |
| Shares redeemed | (399,350) | (195,337) | (4,806,544) | (2,224,399) |
| Net increase (decrease) | 221,103 | 62,409 | $2,704,892 | $678,291 |
| Investor Class | | | | |
| Shares sold | 2,749,112 | 1,290,839 | $32,836,211 | $14,552,923 |
| Reinvestment of distributions | 351,950 | 396,674 | 4,025,900 | 4,218,429 |
| Shares redeemed | (1,253,317) | (914,084) | (14,804,908) | (10,206,061) |
| Net increase (decrease) | 1,847,745 | 773,429 | $22,057,203 | $8,565,291 |
11. Other.
The Fund's organizational documents provide former and current trustees and officers with a limited indemnification against liabilities arising in connection with the performance of their duties to the Fund. In the normal course of business, the Fund may also enter into contracts that provide general indemnifications. The Fund's maximum exposure under these arrangements is unknown as this would be dependent on future claims that may be made against the Fund. The risk of material loss from such claims is considered remote.
At the end of the period, the investment adviser or its affiliates were the owners of record of 100% of the total outstanding shares of the Fund.
Effective January 1, 2020, following any required regulatory notices and approvals:
Investment advisers Fidelity Investments Money Management, Inc., FMR Co., Inc., and Fidelity SelectCo, LLC, merged with and into Fidelity Management & Research Company. In connection with the merger transactions, the resulting, merged investment adviser was then redomiciled from Massachusetts to Delaware, changed its corporate structure from a corporation to a limited liability company, and changed its name to "Fidelity Management & Research Company LLC".
Fidelity Investments Institutional Operations Company, Inc. (FIIOC) converted from a Massachusetts corporation to a Massachusetts LLC, and changed its name to "Fidelity Investments Institutional Operations Company LLC".
Report of Independent Registered Public Accounting Firm
To the Board of Trustees of Variable Insurance Products Fund IV and Shareholders of VIP Communication Services Portfolio:
Opinion on the Financial Statements
We have audited the accompanying statement of assets and liabilities, including the schedule of investments, of VIP Communication Services Portfolio (one of the funds constituting Variable Insurance Products Fund IV, referred to hereafter as the “Fund”) as of December 31, 2019, the related statement of operations for the year ended December 31, 2019, the statement of changes in net assets for each of the two years in the period ended December 31, 2019, including the related notes, and the financial highlights for each of the five years in the period ended December 31, 2019 (collectively referred to as the “financial statements”). In our opinion, the financial statements present fairly, in all material respects, the financial position of the Fund as of December 31, 2019, the results of its operations for the year then ended, the changes in its net assets for each of the two years in the period ended December 31, 2019 and the financial highlights for each of the five years in the period ended December 31, 2019 in conformity with accounting principles generally accepted in the United States of America.
Basis for Opinion
These financial statements are the responsibility of the Fund’s management. Our responsibility is to express an opinion on the Fund’s financial statements based on our audits. We are a public accounting firm registered with the Public Company Accounting Oversight Board (United States) (PCAOB) and are required to be independent with respect to the Fund in accordance with the U.S. federal securities laws and the applicable rules and regulations of the Securities and Exchange Commission and the PCAOB.
We conducted our audits of these financial statements in accordance with the standards of the PCAOB. Those standards require that we plan and perform the audit to obtain reasonable assurance about whether the financial statements are free of material misstatement, whether due to error or fraud.
Our audits included performing procedures to assess the risks of material misstatement of the financial statements, whether due to error or fraud, and performing procedures that respond to those risks. Such procedures included examining, on a test basis, evidence regarding the amounts and disclosures in the financial statements. Our audits also included evaluating the accounting principles used and significant estimates made by management, as well as evaluating the overall presentation of the financial statements. Our procedures included confirmation of securities owned as of December 31, 2019 by correspondence with the custodian. We believe that our audits provide a reasonable basis for our opinion.
PricewaterhouseCoopers LLP
Boston, Massachusetts
February 12, 2020
We have served as the auditor of one or more investment companies in the Fidelity group of funds since 1932.
Trustees and Officers
The Trustees, Members of the Advisory Board (if any), and officers of the trust and fund, as applicable, are listed below. The Board of Trustees governs the fund and is responsible for protecting the interests of shareholders. The Trustees are experienced executives who meet periodically throughout the year to oversee the fund's activities, review contractual arrangements with companies that provide services to the fund, oversee management of the risks associated with such activities and contractual arrangements, and review the fund's performance. Except for Michael E. Wiley, each of the Trustees oversees 302 funds. Mr. Wiley oversees 199 funds.
The Trustees hold office without limit in time except that (a) any Trustee may resign; (b) any Trustee may be removed by written instrument, signed by at least two-thirds of the number of Trustees prior to such removal; (c) any Trustee who requests to be retired or who has become incapacitated by illness or injury may be retired by written instrument signed by a majority of the other Trustees; and (d) any Trustee may be removed at any special meeting of shareholders by a two-thirds vote of the outstanding voting securities of the trust. Each Trustee who is not an interested person (as defined in the Investment Company Act of 1940 (1940 Act)) of the trust and the fund is referred to herein as an Independent Trustee. Each Independent Trustee shall retire not later than the last day of the calendar year in which his or her 75th birthday occurs. The Independent Trustees may waive this mandatory retirement age policy with respect to individual Trustees. Officers and Advisory Board Members hold office without limit in time, except that any officer or Advisory Board Member may resign or may be removed by a vote of a majority of the Trustees at any regular meeting or any special meeting of the Trustees. Except as indicated, each individual has held the office shown or other offices in the same company for the past five years.
The fund’s Statement of Additional Information (SAI) includes more information about the Trustees. To request a free copy, call Fidelity at 1-877-208-0098.
Experience, Skills, Attributes, and Qualifications of the Trustees. The Governance and Nominating Committee has adopted a statement of policy that describes the experience, qualifications, attributes, and skills that are necessary and desirable for potential Independent Trustee candidates (Statement of Policy). The Board believes that each Trustee satisfied at the time he or she was initially elected or appointed a Trustee, and continues to satisfy, the standards contemplated by the Statement of Policy. The Governance and Nominating Committee also engages professional search firms to help identify potential Independent Trustee candidates who have the experience, qualifications, attributes, and skills consistent with the Statement of Policy. From time to time, additional criteria based on the composition and skills of the current Independent Trustees, as well as experience or skills that may be appropriate in light of future changes to board composition, business conditions, and regulatory or other developments, have also been considered by the professional search firms and the Governance and Nominating Committee. In addition, the Board takes into account the Trustees' commitment and participation in Board and committee meetings, as well as their leadership of standing and ad hoc committees throughout their tenure.
In determining that a particular Trustee was and continues to be qualified to serve as a Trustee, the Board has considered a variety of criteria, none of which, in isolation, was controlling. The Board believes that, collectively, the Trustees have balanced and diverse experience, qualifications, attributes, and skills, which allow the Board to operate effectively in governing the fund and protecting the interests of shareholders. Information about the specific experience, skills, attributes, and qualifications of each Trustee, which in each case led to the Board's conclusion that the Trustee should serve (or continue to serve) as a trustee of the fund, is provided below.
Board Structure and Oversight Function. James C. Curvey is an interested person and currently serves as Chairman. The Trustees have determined that an interested Chairman is appropriate and benefits shareholders because an interested Chairman has a personal and professional stake in the quality and continuity of services provided to the fund. Independent Trustees exercise their informed business judgment to appoint an individual of their choosing to serve as Chairman, regardless of whether the Trustee happens to be independent or a member of management. The Independent Trustees have determined that they can act independently and effectively without having an Independent Trustee serve as Chairman and that a key structural component for assuring that they are in a position to do so is for the Independent Trustees to constitute a substantial majority for the Board. The Independent Trustees also regularly meet in executive session. Ned C. Lautenbach serves as Chairman of the Independent Trustees and as such (i) acts as a liaison between the Independent Trustees and management with respect to matters important to the Independent Trustees and (ii) with management prepares agendas for Board meetings.
Fidelity® funds are overseen by different Boards of Trustees. The fund's Board oversees Fidelity's high income and certain equity funds, and other Boards oversee Fidelity's investment-grade bond, money market, asset allocation, and other equity funds. The asset allocation funds may invest in Fidelity® funds overseen by the fund's Board. The use of separate Boards, each with its own committee structure, allows the Trustees of each group of Fidelity® funds to focus on the unique issues of the funds they oversee, including common research, investment, and operational issues. On occasion, the separate Boards establish joint committees to address issues of overlapping consequences for the Fidelity® funds overseen by each Board.
The Trustees operate using a system of committees to facilitate the timely and efficient consideration of all matters of importance to the Trustees, the fund, and fund shareholders and to facilitate compliance with legal and regulatory requirements and oversight of the fund's activities and associated risks. The Board, acting through its committees, has charged FMR and its affiliates with (i) identifying events or circumstances the occurrence of which could have demonstrably adverse effects on the fund's business and/or reputation; (ii) implementing processes and controls to lessen the possibility that such events or circumstances occur or to mitigate the effects of such events or circumstances if they do occur; and (iii) creating and maintaining a system designed to evaluate continuously business and market conditions in order to facilitate the identification and implementation processes described in (i) and (ii) above. Because the day-to-day operations and activities of the fund are carried out by or through FMR, its affiliates, and other service providers, the fund's exposure to risks is mitigated but not eliminated by the processes overseen by the Trustees. While each of the Board's committees has responsibility for overseeing different aspects of the fund's activities, oversight is exercised primarily through the Operations, Audit, and Compliance Committees. Appropriate personnel, including but not limited to the fund's Chief Compliance Officer (CCO), FMR's internal auditor, the independent accountants, the fund's Treasurer and portfolio management personnel, make periodic reports to the Board's committees, as appropriate, including an annual review of Fidelity's risk management program for the Fidelity® funds. The responsibilities of each standing committee, including their oversight responsibilities, are described further under "Standing Committees of the Trustees."
Interested Trustees*:
Correspondence intended for a Trustee who is an interested person may be sent to Fidelity Investments, 245 Summer Street, Boston, Massachusetts 02210.
Name, Year of Birth; Principal Occupations and Other Relevant Experience+
James C. Curvey (1935)
Year of Election or Appointment: 2018
Trustee
Chairman of the Board of Trustees
Mr. Curvey also serves as Trustee of other Fidelity® funds. Mr. Curvey is Vice Chairman (2007-present) and Director of FMR LLC (diversified financial services company). In addition, Mr. Curvey is an Overseer Emeritus for the Boston Symphony Orchestra, a Director of Artis-Naples, and a Trustee of Brewster Academy in Wolfeboro, New Hampshire. Previously, Mr. Curvey served as a Director of Fidelity Research & Analysis Co. (investment adviser firm, 2009-2018), Director of Fidelity Investments Money Management, Inc. (investment adviser firm, 2009-2014) and a Director of FMR and FMR Co., Inc. (investment adviser firms, 2007-2014).
* Determined to be an “Interested Trustee” by virtue of, among other things, his or her affiliation with the trust or various entities under common control with FMR.
+ The information includes the Trustee's principal occupation during the last five years and other information relating to the experience, attributes, and skills relevant to the Trustee's qualifications to serve as a Trustee, which led to the conclusion that the Trustee should serve as a Trustee for the fund.
Independent Trustees:
Correspondence intended for an Independent Trustee may be sent to Fidelity Investments, P.O. Box 55235, Boston, Massachusetts 02205-5235.
Name, Year of Birth; Principal Occupations and Other Relevant Experience+
Dennis J. Dirks (1948)
Year of Election or Appointment: 2018
Trustee
Mr. Dirks also serves as Trustee of other Fidelity® funds. Prior to his retirement in May 2003, Mr. Dirks was Chief Operating Officer and a member of the Board of The Depository Trust & Clearing Corporation (DTCC). He also served as President, Chief Operating Officer, and Board member of The Depository Trust Company (DTC) and President and Board member of the National Securities Clearing Corporation (NSCC). In addition, Mr. Dirks served as Chief Executive Officer and Board member of the Government Securities Clearing Corporation, Chief Executive Officer and Board member of the Mortgage-Backed Securities Clearing Corporation, as a Trustee and a member of the Finance Committee of Manhattan College (2005-2008), as a Trustee and a member of the Finance Committee of AHRC of Nassau County (2006-2008), as a member of the Independent Directors Council (IDC) Governing Council (2010-2015), and as a member of the Board of Directors for The Brookville Center for Children’s Services, Inc. (2009-2017). Mr. Dirks is a member of the Finance Committee (2016-present) and Board of Directors (2017-present) and is Treasurer (2018-present) of the Asolo Repertory Theatre.
Donald F. Donahue (1950)
Year of Election or Appointment: 2018
Trustee
Mr. Donahue also serves as a Trustee of other Fidelity® funds. Mr. Donahue is President and Chief Executive Officer of Miranda Partners, LLC (risk consulting for the financial services industry, 2012-present). Previously, Mr. Donahue served as a Member of the Advisory Board of certain Fidelity® funds (2015-2018) and Chief Executive Officer (2006-2012), Chief Operating Officer (2003-2006), and Managing Director, Customer Marketing and Development (1999-2003) of The Depository Trust & Clearing Corporation (financial markets infrastructure). Mr. Donahue serves as a Member (2007-present) and Co-Chairman (2016-present) of the Board of Directors of United Way of New York, Member of the Board of Directors of NYC Leadership Academy (2012-present) and Member of the Board of Advisors of Ripple Labs, Inc. (financial services, 2015-present). He also served as Chairman (2010-2012) and Member of the Board of Directors (2012-2013) of Omgeo, LLC (financial services), Treasurer of United Way of New York (2012-2016), and Member of the Board of Directors of XBRL US (financial services non-profit, 2009-2012) and the International Securities Services Association (2009-2012).
Alan J. Lacy (1953)
Year of Election or Appointment: 2018
Trustee
Mr. Lacy also serves as Trustee of other Fidelity® funds. Mr. Lacy serves as a Director of Bristol-Myers Squibb Company (global pharmaceuticals, 2008-present). He is a Trustee of the California Chapter of The Nature Conservancy (2015-present) and a Director of the Center for Advanced Study in the Behavioral Sciences at Stanford University (2015-present). In addition, Mr. Lacy served as Senior Adviser (2007-2014) of Oak Hill Capital Partners, L.P. (private equity) and also served as Chief Executive Officer (2005) and Vice Chairman (2005-2006) of Sears Holdings Corporation (retail) and Chief Executive Officer and Chairman of the Board of Sears, Roebuck and Co. (retail, 2000-2005). Previously, Mr. Lacy served as Chairman (2014-2017) and a member (2010-2017) of the Board of Directors of Dave & Buster’s Entertainment, Inc. (restaurant and entertainment complexes), as Chairman (2008-2011) and a member (2006-2015) of the Board of Trustees of the National Parks Conservation Association, and as a member of the Board of Directors for The Hillman Companies, Inc. (hardware wholesalers, 2010-2014), Earth Fare, Inc. (retail grocery, 2010-2014), and The Western Union Company (global money transfer, 2006-2011).
Ned C. Lautenbach (1944)
Year of Election or Appointment: 2018
Trustee
Chairman of the Independent Trustees
Mr. Lautenbach also serves as Trustee of other Fidelity® funds. Mr. Lautenbach currently serves as Chair (2018-present) and Member (2013-present) of the Board of Governors, State University System of Florida and is a member of the Council on Foreign Relations (1994-present). He is also a member and has most recently served as Chairman of the Board of Directors of Artis-Naples (2012-present). Previously, Mr. Lautenbach served as a member and then Lead Director of the Board of Directors of Eaton Corporation (diversified industrial, 1997-2016). He was also a Partner and Advisory Partner at Clayton, Dubilier & Rice, LLC (private equity investment, 1998-2010), as well as a Director of Sony Corporation (2006-2007). In addition, Mr. Lautenbach also had a 30-year career with IBM (technology company) during which time he served as Senior Vice President and a member of the Corporate Executive Committee (1968-1998).
Joseph Mauriello (1944)
Year of Election or Appointment: 2018
Trustee
Mr. Mauriello also serves as Trustee of other Fidelity® funds. Prior to his retirement in January 2006, Mr. Mauriello served in numerous senior management positions including Deputy Chairman and Chief Operating Officer (2004-2005), and Vice Chairman of Financial Services (2002-2004) of KPMG LLP US (professional services, 1965-2005). Mr. Mauriello currently serves as a member of the Independent Directors Council (IDC) Governing Council (2015-present). Previously, Mr. Mauriello served as a member of the Board of Directors of XL Group plc. (global insurance and re-insurance, 2006-2018).
Cornelia M. Small (1944)
Year of Election or Appointment: 2018
Trustee
Ms. Small also serves as Trustee of other Fidelity® funds. Ms. Small is a member of the Board of Directors (2009-present) and Chair of the Investment Committee (2010-present) of the Teagle Foundation. Ms. Small also serves on the Investment Committee of the Berkshire Taconic Community Foundation (2008-present). Previously, Ms. Small served as Chairperson (2002-2008) and a member of the Investment Committee and Chairperson (2008-2012) and a member of the Board of Trustees of Smith College. In addition, Ms. Small served as Chief Investment Officer, Director of Global Equity Investments, and a member of the Board of Directors of Scudder, Stevens & Clark and Scudder Kemper Investments.
Garnett A. Smith (1947)
Year of Election or Appointment: 2013
Trustee
Mr. Smith also serves as Trustee of other Fidelity® funds. Prior to Mr. Smith's retirement, he served as Chairman and Chief Executive Officer of Inbrand Corp. (manufacturer of personal absorbent products, 1990-1997). He also served as President (1986-1990) of Inbrand Corp. Prior to his employment with Inbrand Corp., he was employed by a retail fabric chain and North Carolina National Bank. In addition, Mr. Smith served as a Member of the Advisory Board of certain Fidelity® funds (2012-2013) and as a board member of the Jackson Hole Land Trust (2009-2012).
David M. Thomas (1949)
Year of Election or Appointment: 2018
Trustee
Mr. Thomas also serves as Trustee of other Fidelity® funds. Mr. Thomas serves as Non-Executive Chairman of the Board of Directors of Fortune Brands Home and Security (home and security products, 2011-present) and as a member of the Board of Directors (2004-present) and Presiding Director (2013-present) of Interpublic Group of Companies, Inc. (marketing communication). Previously, Mr. Thomas served as Executive Chairman (2005-2006) and Chairman and Chief Executive Officer (2000-2005) of IMS Health, Inc. (pharmaceutical and healthcare information solutions), a Director of Fortune Brands, Inc. (consumer products, 2000-2011), and a member of the Board of Trustees of the University of Florida (2013-2018).
Michael E. Wiley (1950)
Year of Election or Appointment: 2008
Trustee
Mr. Wiley also serves as Trustee or Member of the Advisory Board of other Fidelity® funds. Mr. Wiley serves as a Director of High Point Resources (exploration and production, 2005-present). Previously, Mr. Wiley served as a Director of Andeavor Corporation (independent oil refiner and marketer, 2005-2018), a Director of Andeavor Logistics LP (natural resources logistics, 2015-2018), a Director of Post Oak Bank (privately-held bank, 2004-2018), a Director of Asia Pacific Exploration Consolidated (international oil and gas exploration and production, 2008-2013), a member of the Board of Trustees of the University of Tulsa (2000-2006; 2007-2010), a Senior Energy Advisor of Katzenbach Partners, LLC (consulting, 2006-2007), an Advisory Director of Riverstone Holdings (private investment), a Director of Spinnaker Exploration Company (exploration and production, 2001-2005) and Chairman, President, and CEO of Baker Hughes, Inc. (oilfield services, 2000-2004).
+ The information includes the Trustee's principal occupation during the last five years and other information relating to the experience, attributes, and skills relevant to the Trustee's qualifications to serve as a Trustee, which led to the conclusion that the Trustee should serve as a Trustee for the fund.
Advisory Board Members and Officers:
Correspondence intended for a Member of the Advisory Board (if any) may be sent to Fidelity Investments, P.O. Box 55235, Boston, Massachusetts 02205-5235. Correspondence intended for an officer or Peter S. Lynch may be sent to Fidelity Investments, 245 Summer Street, Boston, Massachusetts 02210. Officers appear below in alphabetical order.
Name, Year of Birth; Principal Occupation
Vicki L. Fuller (1957)
Year of Election or Appointment: 2018
Member of the Advisory Board
Ms. Fuller also serves as Member of the Advisory Board of other Fidelity® funds. Ms. Fuller serves as a member of the Board of Directors, Audit Committee, and Nominating and Governance Committee of The Williams Companies, Inc. (natural gas infrastructure, 2018-present). Previously, Ms. Fuller served as the Chief Investment Officer of the New York State Common Retirement Fund (2012-2018) and held a variety of positions at AllianceBernstein L.P. (global asset management, 1985-2012), including Managing Director (2006-2012) and Senior Vice President and Senior Portfolio Manager (2001-2006).
Patricia L. Kampling (1959)
Year of Election or Appointment: 2020
Member of the Advisory Board
Ms. Kampling also serves as Member of the Advisory Board of other Fidelity® funds. Prior to her retirement, Ms. Kampling served as Chairman of the Board and Chief Executive Officer (2012-2019), President and Chief Operating Officer (2011-2012) and Executive Vice President and Chief Financial Officer (2010-2011) of Alliant Energy Corporation. Ms. Kampling currently serves as a member of the Board, Compensation Committee and Executive Committee and as Chair of the Audit Committee of Briggs & Stratton Corporation (manufacturing, 2011-present) and as a member of the Board, Audit, Finance and Risk Committee and Safety, Environmental, Technology and Operations Committee of American Water Works Company, Inc. (utilities company, 2019-present). In addition, Ms. Kampling currently serves as a member of the Board of the Nature Conservancy, Wisconsin Chapter (2019-present). Previously, Ms. Kampling served as a member of the Board of Interstate Power and Light Company (2012-2019) and Wisconsin Power and Light Company (2012-2019) (each a subsidiary of Alliant Energy Corporation) and as a member of the Board and Workforce Development Committee of the Business Roundtable (2018-2019).
Peter S. Lynch (1944)
Year of Election or Appointment: 2018
Member of the Advisory Board
Mr. Lynch also serves as Member of the Advisory Board of other Fidelity® funds. Mr. Lynch is Vice Chairman and a Director of Fidelity Management & Research Company LLC (investment adviser firm). In addition, Mr. Lynch serves as a Trustee of Boston College and as the Chairman of the Inner-City Scholarship Fund. Previously, Mr. Lynch served as Vice Chairman and a Director of FMR Co., Inc. (investment adviser firm) and on the Special Olympics International Board of Directors (1997-2006).
Susan Tomasky (1953)
Year of Election or Appointment: 2020
Member of the Advisory Board
Ms. Tomasky also serves as Member of the Advisory Board of other Fidelity® funds. Prior to her retirement, Ms. Tomasky served in various executive officer positions at American Electric Power Company, Inc. (1998-2011), including most recently as President of AEP Transmission (2007-2011). Ms. Tomasky currently serves as a member of the Board and Sustainability Committee and as Chair of the Audit Committee of Marathon Petroleum Corporation (2018-present) and as a member of the Board, Corporate Governance Committee and Organization and Compensation Committee and as Chair of the Audit Committee of Public Service Enterprise Group, Inc. (utilities company, 2012-present). In addition, Ms. Tomasky currently serves as a member of the Board of the Columbus Regional Airport Authority (2007-present), as a member of the Board of the Royal Shakespeare Company – America (2009-present), as a member of the Board of the Columbus Association for the Performing Arts (2011-present) and as a member of the Board of Kenyon College (2016-present). Previously, Ms. Tomasky served as a member of the Board (2011-2019) and as Lead Independent Director (2015-2018) of Andeavor Corporation (previously Tesoro Corporation) (independent oil refiner and marketer) and as a member of the Board of Summit Midstream Partners LP (energy, 2012-2018).
Elizabeth Paige Baumann (1968)
Year of Election or Appointment: 2017
Anti-Money Laundering (AML) Officer
Ms. Baumann also serves as AML Officer of other funds. She is Chief AML Officer (2012-present) and Senior Vice President (2014-present) of FMR LLC (diversified financial services company) and is an employee of Fidelity Investments. Previously, Ms. Baumann served as AML Officer of the funds (2012-2016), and Vice President (2007-2014) and Deputy Anti-Money Laundering Officer (2007-2012) of FMR LLC.
Craig S. Brown (1977)
Year of Election or Appointment: 2019
Assistant Treasurer
Mr. Brown also serves as Assistant Treasurer of other funds. Mr. Brown is an employee of Fidelity Investments (2013-present).
John J. Burke III (1964)
Year of Election or Appointment: 2018
Chief Financial Officer
Mr. Burke also serves as Chief Financial Officer of other funds. Mr. Burke serves as Head of Investment Operations for Fidelity Fund and Investment Operations (2018-present) and is an employee of Fidelity Investments (1998-present). Previously Mr. Burke served as head of Asset Management Investment Operations (2012-2018).
William C. Coffey (1969)
Year of Election or Appointment: 2019
Assistant Secretary
Mr. Coffey also serves as Assistant Secretary of other funds. He is Senior Vice President and Deputy General Counsel of FMR LLC (diversified financial services company, 2010-present), and is an employee of Fidelity Investments. Previously, Mr. Coffey served as Secretary and CLO of certain funds (2018-2019); CLO, Secretary, and Senior Vice President of Fidelity Management & Research Company and FMR Co., Inc. (investment adviser firms, 2018-2019); Secretary of Fidelity SelectCo, LLC and Fidelity Investments Money Management, Inc. (investment adviser firms, 2018-2019); CLO of Fidelity Management & Research (Hong Kong) Limited, FMR Investment Management (UK) Limited, and Fidelity Management & Research (Japan) Limited (investment adviser firms, 2018-2019); and Assistant Secretary of certain funds (2009-2018).
Timothy M. Cohen (1969)
Year of Election or Appointment: 2018
Vice President
Mr. Cohen also serves as Vice President of other funds. Mr. Cohen serves as Co-Head of Equity (2018-present), a Director of Fidelity Management & Research (Japan) Limited (investment adviser firm, 2016-present), and is an employee of Fidelity Investments. Previously, Mr. Cohen served as Executive Vice President of Fidelity SelectCo, LLC (2019), Head of Global Equity Research (2016-2018), Chief Investment Officer - Equity and a Director of Fidelity Management & Research (U.K.) Inc. (investment adviser firm, 2013-2015) and as a Director of Fidelity Management & Research (Hong Kong) Limited (investment adviser firm, 2017).
Jonathan Davis (1968)
Year of Election or Appointment: 2010
Assistant Treasurer
Mr. Davis also serves as Assistant Treasurer of other funds. Mr. Davis serves as Assistant Treasurer of FMR Capital, Inc. (2017-present) and is an employee of Fidelity Investments. Previously, Mr. Davis served as Vice President and Associate General Counsel of FMR LLC (diversified financial services company, 2003-2010).
Laura M. Del Prato (1964)
Year of Election or Appointment: 2018
Assistant Treasurer
Ms. Del Prato also serves as an officer of other funds. Ms. Del Prato is an employee of Fidelity Investments (2017-present). Prior to joining Fidelity Investments, Ms. Del Prato served as a Managing Director and Treasurer of the JPMorgan Mutual Funds (2014-2017). Prior to JPMorgan, Ms. Del Prato served as a partner at Cohen Fund Audit Services (accounting firm, 2012-2013) and KPMG LLP (accounting firm, 2004-2012).
Colm A. Hogan (1973)
Year of Election or Appointment: 2020
Assistant Treasurer
Mr. Hogan also serves as an officer of other funds. Mr. Hogan serves as Assistant Treasurer of FMR Capital, Inc. (2017-present) and is an employee of Fidelity Investments (2005-present). Previously, Mr. Hogan served as Deputy Treasurer of certain Fidelity® funds (2016-2020) and Assistant Treasurer of certain Fidelity® funds (2016-2018).
Pamela R. Holding (1964)
Year of Election or Appointment: 2018
Vice President
Ms. Holding also serves as Vice President of other funds. Ms. Holding serves as Co-Head of Equity (2018-present) and is an employee of Fidelity Investments (2013-present). Previously, Ms. Holding served as Executive Vice President of Fidelity SelectCo, LLC (2019) and as Chief Investment Officer of Fidelity Institutional Asset Management (2013-2018).
Cynthia Lo Bessette (1969)
Year of Election or Appointment: 2019
Secretary and Chief Legal Officer (CLO)
Ms. Lo Bessette also serves as an officer of other funds. Ms. Lo Bessette serves as CLO, Secretary, and Senior Vice President of Fidelity Management & Research Company LLC (investment adviser firm, 2019-present); and CLO of Fidelity Management & Research (Hong Kong) Limited, FMR Investment Management (UK) Limited, and Fidelity Management & Research (Japan) Limited (investment adviser firms, 2019-present). She is a Senior Vice President and Deputy General Counsel of FMR LLC (diversified financial services company, 2019-present), and is an employee of Fidelity Investments. Previously, Ms. Lo Bessette served as CLO, Secretary, and Senior Vice President of FMR Co., Inc. (investment adviser firm, 2019); Secretary of Fidelity SelectCo, LLC and Fidelity Investments Money Management, Inc. (investment adviser firms, 2019). Prior to joining Fidelity Investments, Ms. Lo Bessette was Executive Vice President, General Counsel (2016-2019) and Senior Vice President, Deputy General Counsel (2015-2016) of OppenheimerFunds (investment management company) and Deputy Chief Legal Officer (2013-2015) of Jennison Associates LLC (investment adviser firm).
Chris Maher (1972)
Year of Election or Appointment: 2020
Deputy Treasurer
Mr. Maher also serves as an officer of other funds. Mr. Maher serves as Assistant Treasurer of FMR Capital, Inc. (2017-present), and is an employee of Fidelity Investments (2008-present). Previously, Mr. Maher served as Assistant Treasurer of certain funds (2013-2020); Vice President of Asset Management Compliance (2013), Vice President of the Program Management Group of FMR (investment adviser firm, 2010-2013), and Vice President of Valuation Oversight (2008-2010).
Kenneth B. Robins (1969)
Year of Election or Appointment: 2018
Chief Compliance Officer
Mr. Robins also serves as an officer of other funds. Mr. Robins serves as Compliance Officer of Fidelity Management & Research Company LLC (investment adviser firm, 2016-present) and is an employee of Fidelity Investments (2004-present). Previously, Mr. Robins served as Compliance Officer of FMR Co., Inc. (investment adviser firm, 2016-2019), as Executive Vice President of Fidelity Investments Money Management, Inc. (investment adviser firm, 2013-2016) and served in other fund officer roles.
Stacie M. Smith (1974)
Year of Election or Appointment: 2018
President and Treasurer
Ms. Smith also serves as an officer of other funds. Ms. Smith serves as Assistant Treasurer of FMR Capital, Inc. (2017-present), is an employee of Fidelity Investments (2009-present), and has served in other fund officer roles. Prior to joining Fidelity Investments, Ms. Smith served as Senior Audit Manager of Ernst & Young LLP (accounting firm, 1996-2009). Previously, Ms. Smith served as Assistant Treasurer (2013-2019) and Deputy Treasurer (2013-2016) of certain Fidelity® funds.
Marc L. Spector (1972)
Year of Election or Appointment: 2017
Assistant Treasurer
Mr. Spector also serves as an officer of other funds. Mr. Spector serves as Assistant Treasurer of FMR Capital, Inc. (2017-present) and is an employee of Fidelity Investments (2016-present). Prior to joining Fidelity Investments, Mr. Spector served as Director at the Siegfried Group (accounting firm, 2013-2016), and prior to Siegfried Group as audit senior manager at Deloitte & Touche (accounting firm, 2005-2013).
Jim Wegmann (1979)
Year of Election or Appointment: 2019
Assistant Treasurer
Mr. Wegmann also serves as Assistant Treasurer of other funds. Mr. Wegmann is an employee of Fidelity Investments (2011-present).
Shareholder Expense Example
As a shareholder of the Fund, you incur two types of costs: (1) transaction costs, and (2) ongoing costs, including management fees and other Fund expenses. This Example is intended to help you understand your ongoing costs (in dollars) of investing in the Fund and to compare these costs with the ongoing costs of investing in other mutual funds.
The Example is based on an investment of $1,000 invested at the beginning of the period and held for the entire period (July 1, 2019 to December 31, 2019).
Actual Expenses
The first line of the accompanying table for each class of the Fund provides information about actual account values and actual expenses. You may use the information in this line, together with the amount you invested, to estimate the expenses that you paid over the period. Simply divide your account value by $1,000.00 (for example, an $8,600 account value divided by $1,000.00 = 8.6), then multiply the result by the number in the first line for a class of the Fund under the heading entitled "Expenses Paid During Period" to estimate the expenses you paid on your account during this period. The estimate of expenses does not include any fees or other expenses of any variable annuity or variable life insurance product. If they were, the estimate of expenses you paid during the period would be higher, and your ending account value would be lower. In addition, the Fund, as a shareholder in the underlying Fidelity Central Funds, will indirectly bear its pro-rata share of the fees and expenses incurred by the underlying Fidelity Central Funds. These fees and expenses are not included in the Fund's annualized expense ratio used to calculate the expense estimate in the table below.
Hypothetical Example for Comparison Purposes
The second line of the accompanying table for each class of the Fund provides information about hypothetical account values and hypothetical expenses based on a Class' actual expense ratio and an assumed rate of return of 5% per year before expenses, which is not the Class' actual return. The hypothetical account values and expenses may not be used to estimate the actual ending account balance or expenses you paid for the period. You may use this information to compare the ongoing costs of investing in the Fund and other funds. To do so, compare this 5% hypothetical example with the 5% hypothetical examples that appear in the shareholder reports of the other funds. The estimate of expenses does not include any fees or other expenses of any variable annuity or variable life insurance product. If they were, the estimate of expenses you paid during the period would be higher, and your ending account value would be lower. In addition, the Fund, as a shareholder in the underlying Fidelity Central Funds, will indirectly bear its pro-rata share of the fees and expenses incurred by the underlying Fidelity Central Funds. These fees and expenses are not included in the Fund's annualized expense ratio used to calculate the expense estimate in the table below.
Please note that the expenses shown in the table are meant to highlight your ongoing costs only and do not reflect any transaction costs. Therefore, the second line of the table is useful in comparing ongoing costs only, and will not help you determine the relative total costs of owning different funds.
| | Annualized Expense Ratio-A | Beginning
Account Value
July 1, 2019 | Ending
Account Value
December 31, 2019 | Expenses Paid
During Period-B
July 1, 2019
to December 31, 2019 |
| Initial Class | .71% | | | |
| Actual | | $1,000.00 | $1,096.90 | $3.75 |
| Hypothetical-C | | $1,000.00 | $1,021.63 | $3.62 |
| Investor Class | .79% | | | |
| Actual | | $1,000.00 | $1,097.20 | $4.18 |
| Hypothetical-C | | $1,000.00 | $1,021.22 | $4.02 |
A Annualized expense ratio reflects expenses net of applicable fee waivers.
B Expenses are equal to each Class' annualized expense ratio, multiplied by the average account value over the period, multiplied by 184/365 (to reflect the one-half year period).
C 5% return per year before expenses
Distributions (Unaudited)
The Board of Trustees of VIP Communication Services Portfolio voted to pay to shareholders of record at the opening of business on record date, the following distributions per share derived from capital gains realized from sales of portfolio securities:
| | Pay Date | Record Date | Capital Gains |
| VIP Communication Services Portfolio | | | |
| Initial Class | 02/07/2020 | 02/07/2020 | $0.161 |
| Investor Class | 02/07/2020 | 02/07/2020 | $0.160 |
|
The fund hereby designates as a capital gain dividend with respect to the taxable year ended December 31, 2019, $797,361, or, if subsequently determined to be different, the net capital gain of such year.
Initial Class designates 58% and 24% and the Investor Class designates 77% and 24%, of the dividends distributed in February and December, respectively, during the fiscal year as qualifying for the dividends–received deduction for corporate shareholders.
Board Approval of Investment Advisory Contracts
VIP Communication Services Portfolio
At its November 2019 meeting, the Board of Trustees, including the Independent Trustees (together, the Board), voted to approve an amended and restated management contract and amended and restated sub-advisory agreements (together, the Amended and Restated Contracts) for the fund, effective January 1, 2020, for a one month period through January 31, 2020, in connection with an upcoming consolidation of certain of Fidelity's advisory businesses.
The Board considered that, on or about January 1, 2020, each of FMR Co., Inc. (FMRC), Fidelity Investments Money Management, Inc. (FIMM), and SelectCo, LLC (SelectCo) will merge with and into Fidelity Management & Research Company (FMR) and that, after the merger, FMR will redomicile as a Delaware limited liability company. The Board also approved the termination of the sub-advisory agreement with FMRC upon the completion of the merger. The Board noted that the Amended and Restated Contracts would be updated to reflect the renamed adviser, Fidelity Management & Research Company LLC and its new form of organization and domicile. The Board also noted that the Amended and Restated Contracts will not change the investment processes, the level or nature of services provided, the resources and personnel allocated, trading and compliance operations, or any fees or expenses paid by the fund.
The Board concluded that the fund's Amended and Restated Contracts are fair and reasonable, and that the fund's Advisory Contracts should be approved through January 31, 2020.
In connection with its consideration of future renewals of the fund's Amended and Restated Contracts, the Board will consider: (i) the nature, extent and quality of services provided to the fund, including shareholder and administrative services and investment performance; (ii) the competitiveness of the management fee and total expenses for the fund; (iii) the costs of the services and profitability, including the revenues earned and the expenses incurred in conducting the business of developing, marketing, distributing, managing, administering, and servicing the fund and its shareholders, to the extent applicable; and (iv) whether there have been economies of scale in respect of the Fidelity funds, whether the Fidelity funds (including the fund) have appropriately benefited from any such economies of scale, and whether there is the potential for realization of any further economies.
Based on its evaluation of all of the conclusions noted above, and after considering all factors it believed relevant, the Board ultimately concluded that the fund's management fee structure is fair and reasonable, and that the continuation of the fund's Amended and Restated Contracts should be approved.
VTELP-ANN-0220
1.851004.112
Item 2.
Code of Ethics
As of the end of the period, December 31, 2019, Variable Insurance Products Fund IV (the trust) has adopted a code of ethics, as defined in Item 2 of Form N-CSR, that applies to its President and Treasurer and its Chief Financial Officer. A copy of the code of ethics is filed as an exhibit to this Form N-CSR.
Item 3.
Audit Committee Financial Expert
The Board of Trustees of the trust has determined that Joseph Mauriello is an audit committee financial expert, as defined in Item 3 of Form N-CSR. Mr. Mauriello is independent for purposes of Item 3 of Form N-CSR.
Item 4.
Principal Accountant Fees and Services
Fees and Services
The following table presents fees billed by PricewaterhouseCoopers LLP (“PwC”) in each of the last two fiscal years for services rendered to VIP Communication Services Portfolio, VIP Consumer Discretionary Portfolio, VIP Consumer Staples Portfolio, VIP Energy Portfolio, VIP Financial Services Portfolio, VIP Health Care Portfolio, VIP Industrials Portfolio, VIP Materials Portfolio, VIP Real Estate Portfolio, VIP Technology Portfolio and VIP Utilities Portfolio (the “Funds”):
Services Billed by PwC
December 31, 2019 FeesA
| | | | |
| Audit Fees | Audit-Related Fees | Tax Fees | All Other Fees |
VIP Communication Services Portfolio | $37,000 | $3,000 | $2,400 | $1,300 |
VIP Consumer Discretionary Portfolio | $37,000 | $3,000 | $2,400 | $1,300 |
VIP Consumer Staples Portfolio | $37,000 | $3,000 | $2,400 | $1,300 |
VIP Energy Portfolio | $38,000 | $3,000 | $2,400 | $1,300 |
VIP Financial Services Portfolio | $38,000 | $3,100 | $2,400 | $1,300 |
VIP Health Care Portfolio | $40,000 | $3,200 | $2,400 | $1,400 |
VIP Industrials Portfolio | $37,000 | $3,000 | $2,400 | $1,300 |
VIP Materials Portfolio | $37,000 | $3,000 | $2,400 | $1,300 |
VIP Real Estate Portfolio | $45,000 | $3,700 | $3,500 | $1,600 |
VIP Technology Portfolio | $42,000 | $3,400 | $2,400 | $1,400 |
VIP Utilities Portfolio | $37,000 | $3,000 | $2,400 | $1,300 |
| | | | |
| Audit Fees | Audit-Related Fees | Tax Fees | All Other Fees |
VIP Communication Services Portfolio | $36,000 | $3,100 | $2,400 | $1,500 |
VIP Consumer Discretionary Portfolio | $36,000 | $3,100 | $2,400 | $1,500 |
VIP Consumer Staples Portfolio | $36,000 | $3,100 | $2,400 | $1,500 |
VIP Energy Portfolio | $36,000 | $3,100 | $2,600 | $1,500 |
VIP Financial Services Portfolio | $37,000 | $3,100 | $2,400 | $1,500 |
VIP Health Care Portfolio | $39,000 | $3,300 | $2,400 | $1,600 |
VIP Industrials Portfolio | $36,000 | $3,100 | $2,400 | $1,500 |
VIP Materials Portfolio | $36,000 | $3,100 | $2,400 | $1,500 |
VIP Real Estate Portfolio | $44,000 | $3,800 | $3,500 | $1,800 |
VIP Technology Portfolio | $41,000 | $3,400 | $2,400 | $1,700 |
VIP Utilities Portfolio | $35,000 | $3,000 | $2,400 | $1,500 |
AAmounts may reflect rounding.
The following table(s) present(s) fees billed by PwC that were required to be approved by the Audit Committee for services that relate directly to the operations and financial reporting of the Fund(s) and that are rendered on behalf of Fidelity Management & Research Company ("FMR") and entities controlling, controlled by, or under common control with FMR (not including any sub-adviser whose role is primarily portfolio management and is subcontracted with or overseen by another investment adviser) that provide ongoing services to the Fund(s) (“Fund Service Providers”):
Services Billed by PwC
| | |
| December 31, 2019A | December 31, 2018A |
Audit-Related Fees | $7,705,000 | $7,930,000 |
Tax Fees | $10,000 | $20,000 |
All Other Fees | $- | $- |
A Amounts may reflect rounding.
“Audit-Related Fees” represent fees billed for assurance and related services that are reasonably related to the performance of the fund audit or the review of the fund's financial statements and that are not reported under Audit Fees.
“Tax Fees” represent fees billed for tax compliance, tax advice or tax planning that relate directly to the operations and financial reporting of the fund.
“All Other Fees” represent fees billed for services provided to the fund or Fund Service Provider, a significant portion of which are assurance related, that relate directly to the operations and financial reporting of the fund, excluding those services that are reported under Audit Fees, Audit-Related Fees or Tax Fees.
Assurance services must be performed by an independent public accountant.
* * *
The aggregate non-audit fees billed by PwC for services rendered to the Fund(s), FMR (not including any sub-adviser whose role is primarily portfolio management and is subcontracted with or overseen by another investment adviser), and any Fund Service Provider for each of the last two fiscal years of the Fund(s) are as follows:
| | |
Billed By | December 31, 2019A | December 31, 2018A |
PwC | $12,430,000 | $11,205,000 |
|
|
|
A Amounts may reflect rounding.
The trust's Audit Committee has considered non-audit services that were not pre-approved that were provided by PwC to Fund Service Providers to be compatible with maintaining the independence of PwC in its(their) audit of the Fund(s), taking into account representations from PwC, in accordance with Public Company Accounting Oversight Board rules, regarding its independence from the Fund(s) and its(their) related entities and FMR’s review of the appropriateness and permissibility under applicable law of such non-audit services prior to their provision to the Fund(s) Service Providers.
Audit Committee Pre-Approval Policies and Procedures
The trust’s Audit Committee must pre-approve all audit and non-audit services provided by a fund’s independent registered public accounting firm relating to the operations or financial reporting of the fund. Prior to the commencement of any audit or non-audit services to a fund, the Audit Committee reviews the services to determine whether they are appropriate and permissible under applicable law.
The Audit Committee has adopted policies and procedures to, among other purposes, provide a framework for the Committee’s consideration of non-audit services by the audit firms that audit the Fidelity funds. The policies and procedures require that any non-audit service provided by a fund audit firm to a Fidelity fund and any non-audit service provided by a fund auditor to a Fund Service Provider that relates directly to the operations and financial reporting of a Fidelity fund (“Covered Service”) are subject to approval by the Audit Committee before such service is provided.
All Covered Services must be approved in advance of provision of the service either: (i) by formal resolution of the Audit Committee, or (ii) by oral or written approval of the service by the Chair of the Audit Committee (or if the Chair is unavailable, such other member of the Audit Committee as may be designated by the Chair to act in the Chair’s absence). The approval contemplated by (ii) above is permitted where the Treasurer determines that action on such an engagement is necessary before the next meeting of the Audit Committee.
Non-audit services provided by a fund audit firm to a Fund Service Provider that do not relate directly to the operations and financial reporting of a Fidelity fund are reported to the Audit Committee periodically.
Non-Audit Services Approved Pursuant to Rule 2-01(c)(7)(i)(C) and (ii) of Regulation S-X (“De Minimis Exception”)
There were no non-audit services approved or required to be approved by the Audit Committee pursuant to the De Minimis Exception during the Fund’s(s’) last two fiscal years relating to services provided to (i) the Fund(s) or (ii) any Fund Service Provider that relate directly to the operations and financial reporting of the Fund(s).
Item 5.
Audit Committee of Listed Registrants
Not applicable.
Item 6.
Investments
(a)
Not applicable.
(b)
Not applicable.
Item 7.
Disclosure of Proxy Voting Policies and Procedures for Closed-End Management Investment Companies
Not applicable.
Item 8.
Portfolio Managers of Closed-End Management Investment Companies
Not applicable.
Item 9.
Purchase of Equity Securities by Closed-End Management Investment Company and Affiliated Purchasers
Not applicable.
Item 10.
Submission of Matters to a Vote of Security Holders
There were no material changes to the procedures by which shareholders may recommend nominees to the trust’s Board of Trustees.
Item 11.
Controls and Procedures
(a)(i) The President and Treasurer and the Chief Financial Officer have concluded that the trust’s disclosure controls and procedures (as defined in Rule 30a-3(c) under the Investment Company Act) provide reasonable assurances that material information relating to the trust is made known to them by the appropriate persons, based on their evaluation of these controls and procedures as of a date within 90 days of the filing date of this report.
(a)(ii) There was no change in the trust’s internal control over financial reporting (as defined in Rule 30a-3(d) under the Investment Company Act) that occurred during the period covered by this report that has materially affected, or is reasonably likely to materially affect, the trust’s internal control over financial reporting.
Item 12.
Disclosure of Securities Lending Activities for Closed-End Management
Investment Companies
Not applicable.
Item 13.
Exhibits
| | |
(a) | (1) | Code of Ethics pursuant to Item 2 of Form N-CSR is filed and attached hereto as EX-99.CODE ETH. |
(a) | (2) | Certification pursuant to Rule 30a-2(a) under the Investment Company Act of 1940 (17 CFR 270.30a-2(a)) is filed and attached hereto as Exhibit 99.CERT. |
(a) | (3) | Not applicable. |
(b) |
| Certification pursuant to Rule 30a-2(b) under the Investment Company Act of 1940 (17 CFR 270.30a-2(b)) is furnished and attached hereto as Exhibit 99.906CERT. |
SIGNATURES
Pursuant to the requirements of the Securities Exchange Act of 1934 and the Investment Company Act of 1940, the registrant has duly caused this report to be signed on its behalf by the undersigned, thereunto duly authorized.
Variable Insurance Products Fund IV
| |
By: | /s/Stacie M. Smith |
| Stacie M. Smith |
| President and Treasurer |
|
|
Date: | February 20, 2020 |
Pursuant to the requirements of the Securities Exchange Act of 1934 and the Investment Company Act of 1940, this report has been signed below by the following persons on behalf of the registrant and in the capacities and on the dates indicated.
| |
By: | /s/Stacie M. Smith |
| Stacie M. Smith |
| President and Treasurer |
|
|
Date: | February 20, 2020 |
| |
By: | /s/John J. Burke III |
| John J. Burke III |
| Chief Financial Officer |
|
|
Date: | February 20, 2020 |