UNITED STATES
SECURITIES AND EXCHANGE COMMISSION
Washington, D.C. 20549
FORM N-CSR
CERTIFIED SHAREHOLDER REPORT OF REGISTERED
MANAGEMENT INVESTMENT COMPANIES
Investment Company Act file number 811-3759
Variable Insurance Products Fund IV
(Exact name of registrant as specified in charter)
245 Summer St., Boston, Massachusetts 02210
(Address of principal executive offices) (Zip code)
Marc Bryant, Secretary
245 Summer St.
Boston, Massachusetts 02210
(Name and address of agent for service)
Registrant's telephone number, including area code:
617-563-7000
| |
Date of fiscal year end: | December 31 |
| |
Date of reporting period: | December 31, 2017 |
Item 1.
Reports to Stockholders
Fidelity® Variable Insurance Products: Technology Portfolio
Annual Report December 31, 2017 |
 |
Contents
To view a fund's proxy voting guidelines and proxy voting record for the 12-month period ended June 30, visit http://www.fidelity.com/proxyvotingresults or visit the Securities and Exchange Commission's (SEC) web site at http://www.sec.gov.
You may also call 1-877-208-0098 to request a free copy of the proxy voting guidelines.
Fidelity® Variable Insurance Products are separate account options which are purchased through a variable insurance contract.
Standard & Poor's, S&P and S&P 500 are registered service marks of The McGraw-Hill Companies, Inc. and have been licensed for use by Fidelity Distributors Corporation.
Other third-party marks appearing herein are the property of their respective owners.
All other marks appearing herein are registered or unregistered trademarks or service marks of FMR LLC or an affiliated company. © 2018 FMR LLC. All rights reserved.
This report and the financial statements contained herein are submitted for the general information of the shareholders of the Fund. This report is not authorized for distribution to prospective investors in the Fund unless preceded or accompanied by an effective prospectus.
A fund files its complete schedule of portfolio holdings with the SEC for the first and third quarters of each fiscal year on Form N-Q. Forms N-Q are available on the SEC’s web site at http://www.sec.gov. A fund's Forms N-Q may be reviewed and copied at the SEC’s Public Reference Room in Washington, DC. Information regarding the operation of the SEC's Public Reference Room may be obtained by calling 1-800-SEC-0330.
For a complete list of a fund's portfolio holdings, view the most recent holdings listing, semiannual report, or annual report on Fidelity's web site at http://www.fidelity.com, http://www.institutional.fidelity.com, or http://www.401k.com, as applicable.
NOT FDIC INSURED •MAY LOSE VALUE •NO BANK GUARANTEE
Neither the Fund nor Fidelity Distributors Corporation is a bank.
Performance: The Bottom Line
Average annual total return reflects the change in the value of an investment, assuming reinvestment of distributions from dividend income and capital gains (the profits earned upon the sale of securities that have grown in value, if any) and assuming a constant rate of performance each year. During periods of reimbursement by Fidelity, a fund’s total return will be greater than it would be had the reimbursement not occurred. Performance numbers are net of all underlying fund operating expenses, but do not include any insurance charges imposed by your insurance company’s separate account. If performance information included the effect of these additional charges, the total returns would have been lower. How a fund did yesterday is no guarantee of how it will do tomorrow.
Average Annual Total Returns
| For the periods ended December 31, 2017 | Past 1 year | Past 5 years | Past 10 years |
| Initial Class | 50.78% | 20.61% | 12.80% |
| Investor Class | 50.67% | 20.52% | 12.71% |
$10,000 Over 10 Years
Let's say hypothetically that $10,000 was invested in VIP Technology Portfolio - Initial Class on December 31, 2007.
The chart shows how the value of your investment would have changed, and also shows how the S&P 500® Index performed over the same period.
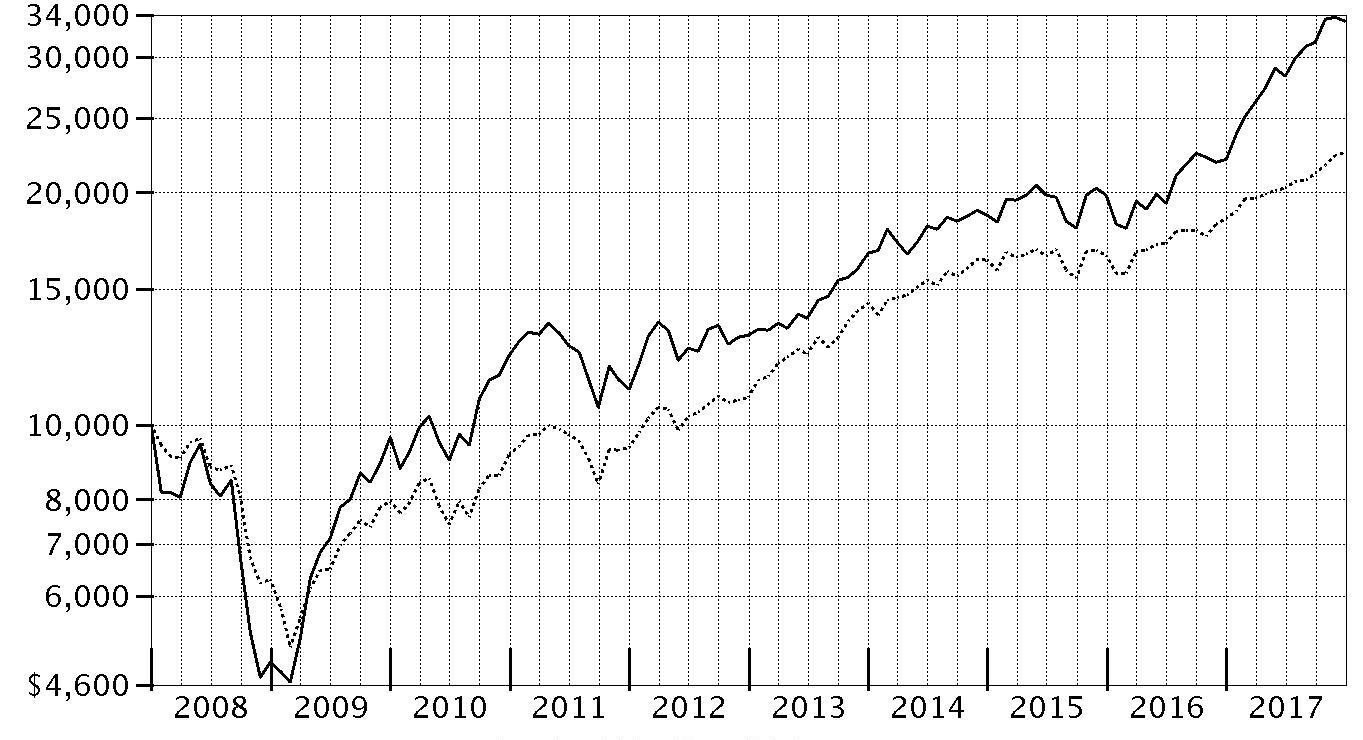
| Period Ending Values |
| $33,361 | VIP Technology Portfolio - Initial Class |
| $22,603 | S&P 500® Index |
Management's Discussion of Fund Performance
Market Recap: U.S. equities gained 21.83% in 2017, as the S&P 500
® index rose steadily and closed the year just shy of an all-time high after a particularly strong three-month finish. Early on, equities rallied on optimism for President Trump’s pro-business agenda but leveled off in March amid fading optimism and stalled efforts by Congress to repeal and replace the Affordable Care Act. Upward momentum soon returned and continued through year-end with consumer sentiment and other market indicators staying positive. The lone exception was a brief cooldown in August, when geopolitical tension escalated and uncertainty grew regarding the future of health care, tax reform and the debt ceiling. Sector-wise, information technology fared best by a wide margin, rising 39% amid strong earnings growth from several major index constituents. A 24% gain in materials was spurred by increased demand, especially from China. Consumer discretionary gained 23%, despite many brick-and-mortar retailers suffering from online competition, and financials edged the broader market on an uptick in bond yields. Conversely, the defensive energy and telecom services sectors returned about -1% each. Rising interest rates held back real estate (+11%), while consumer staples (+13%) and utilities (+12%) struggled due to investors’ general preference for risk assets.
Comments from Portfolio Manager Charlie Chai: For the year, the fund’s share classes gained roughly 51%, considerably outpacing the 37.20% return of the MSCI U.S. IMI Information Technology 25/50 Index and also topping the broad-market S&P 500
® index. Versus the MSCI sector benchmark, stock selection and an overweighting in semiconductor equipment contributed, as did picks in internet software & services and a sizable underweighting in the lagging IT consulting & other services industry. Overall, active management added roughly 14 percentage points to the fund’s performance. One standout in the semiconductor-equipment segment was an out-of-benchmark stake in GlobalWafers, a Taiwan-based firm specializing in silicon-wafer manufacturing. Tightening supply in the wafer market, coupled with optimism over the company’s recent acquisition of rival SunEdison Semiconductor, drove the stock’s robust performance. Another holding that bolstered the fund’s result was Austria-based AMS, also a non-benchmark position. The company makes optical sensors, including 3D sensors, and counts Apple and several other smartphone makers among its customers. Conversely, a modest cash position in a surging market weighed on performance. A few industry groups, such as electrical components & equipment, detracted, but the negative impact was minimal. Among individual holdings, Nanya Technology, a Taiwan-based manufacturer of DRAM and other kinds of digital memory, was our largest detractor. Apple also was a relative detractor, as we underweighted this strong-performing stock.
The views expressed above reflect those of the portfolio manager(s) only through the end of the period as stated on the cover of this report and do not necessarily represent the views of Fidelity or any other person in the Fidelity organization. Any such views are subject to change at any time based upon market or other conditions and Fidelity disclaims any responsibility to update such views. These views may not be relied on as investment advice and, because investment decisions for a Fidelity fund are based on numerous factors, may not be relied on as an indication of trading intent on behalf of any Fidelity fund.
Note to shareholders: On December 8, 2017, shareholders approved proposals from the Board of Trustees to eliminate each sector/industry fund's fundamental “invests primarily” policy and to modify the fundamental concentration policy for certain funds. The changes took effect on January 1, 2018, and do not impact how the funds are managed.
Investment Summary (Unaudited)
Top Ten Stocks as of December 31, 2017
| | % of fund's net assets |
| Apple, Inc. | 8.9 |
| Tesla, Inc. | 4.6 |
| Microsoft Corp. | 4.6 |
| Alphabet, Inc. Class A | 3.9 |
| Alibaba Group Holding Ltd. sponsored ADR | 3.5 |
| NVIDIA Corp. | 3.1 |
| Qualcomm, Inc. | 3.0 |
| Facebook, Inc. Class A | 3.0 |
| Alphabet, Inc. Class C | 3.0 |
| Autodesk, Inc. | 2.9 |
| | 40.5 |
Top Industries (% of fund's net assets)
| As of December 31, 2017 |
| | Software | 23.6% |
| | Semiconductors & Semiconductor Equipment | 22.5% |
| | Internet Software & Services | 19.8% |
| | Technology Hardware, Storage & Peripherals | 9.2% |
| | IT Services | 6.2% |
| | All Others* | 18.7% |

* Includes short-term investments and net other assets (liabilities).
Investments December 31, 2017
Showing Percentage of Net Assets
| Common Stocks - 97.3% | | | |
| | | Shares | Value |
| Air Freight & Logistics - 0.2% | | | |
| Air Freight & Logistics - 0.2% | | | |
| Best, Inc. ADR | | 118,800 | $1,066,824 |
| Automobiles - 4.6% | | | |
| Automobile Manufacturers - 4.6% | | | |
| Tesla, Inc. (a)(b) | | 101,700 | 31,664,295 |
| Biotechnology - 0.0% | | | |
| Biotechnology - 0.0% | | | |
| BeiGene Ltd. ADR (a) | | 500 | 48,860 |
| Zai Lab Ltd. ADR | | 5,000 | 106,150 |
| | | | 155,010 |
| Chemicals - 0.6% | | | |
| Industrial Gases - 0.1% | | | |
| SK Materials Co., Ltd. | | 4,406 | 743,019 |
| Specialty Chemicals - 0.5% | | | |
| Duk San Neolux Co. Ltd. | | 51,562 | 1,188,359 |
| Soulbrain Co. Ltd. | | 21,494 | 1,359,265 |
| Tokyo Ohka Kogyo Co. Ltd. | | 26,000 | 1,122,609 |
| | | | 3,670,233 |
|
| TOTAL CHEMICALS | | | 4,413,252 |
|
| Communications Equipment - 0.1% | | | |
| Communications Equipment - 0.1% | | | |
| Applied Optoelectronics, Inc. (a)(b) | | 14,700 | 555,954 |
| Diversified Consumer Services - 1.2% | | | |
| Education Services - 1.2% | | | |
| New Oriental Education & Technology Group, Inc. sponsored ADR | | 30,500 | 2,867,000 |
| TAL Education Group ADR | | 187,838 | 5,580,667 |
| | | | 8,447,667 |
| Diversified Financial Services - 0.4% | | | |
| Other Diversified Financial Services - 0.4% | | | |
| GDS Holdings Ltd. ADR (a) | | 67,695 | 1,525,168 |
| Jianpu Technology, Inc. ADR (a) | | 218,100 | 1,413,288 |
| | | | 2,938,456 |
| Diversified Telecommunication Services - 0.1% | | | |
| Integrated Telecommunication Services - 0.1% | | | |
| Bharti Infratel Ltd. | | 73,609 | 436,708 |
| Electrical Equipment - 0.3% | | | |
| Electrical Components & Equipment - 0.3% | | | |
| BizLink Holding, Inc. | | 55,000 | 516,314 |
| BizLink Holding, Inc. rights 1/9/18 (a) | | 1,141 | 2,635 |
| Rockwell Automation, Inc. | | 6,400 | 1,256,640 |
| | | | 1,775,589 |
| Electronic Equipment & Components - 3.8% | | | |
| Electronic Components - 0.4% | | | |
| E Ink Holdings, Inc. | | 980,000 | 1,585,600 |
| Universal Display Corp. | | 7,212 | 1,245,152 |
| | | | 2,830,752 |
| Electronic Equipment & Instruments - 2.5% | | | |
| Chroma ATE, Inc. | | 1,086,415 | 5,932,492 |
| Topcon Corp. | | 148,500 | 3,211,844 |
| Trimble, Inc. (a) | | 195,470 | 7,943,901 |
| | | | 17,088,237 |
| Electronic Manufacturing Services - 0.3% | | | |
| AIC, Inc. | | 6,000 | 8,413 |
| Merry Electronics Co. Ltd. | | 266,000 | 1,743,924 |
| | | | 1,752,337 |
| Technology Distributors - 0.6% | | | |
| Dell Technologies, Inc. (a) | | 55,200 | 4,486,656 |
|
| TOTAL ELECTRONIC EQUIPMENT & COMPONENTS | | | 26,157,982 |
|
| Health Care Equipment & Supplies - 0.1% | | | |
| Health Care Equipment - 0.0% | | | |
| China Medical Technologies, Inc. sponsored ADR (a)(c) | | 300 | 0 |
| Health Care Supplies - 0.1% | | | |
| Hoya Corp. | | 17,100 | 854,127 |
|
| TOTAL HEALTH CARE EQUIPMENT & SUPPLIES | | | 854,127 |
|
| Health Care Technology - 0.1% | | | |
| Health Care Technology - 0.1% | | | |
| athenahealth, Inc. (a) | | 6,600 | 878,064 |
| Hotels, Restaurants & Leisure - 0.0% | | | |
| Casinos & Gaming - 0.0% | | | |
| Sea Ltd. ADR (b) | | 11,100 | 147,963 |
| Hotels, Resorts & Cruise Lines - 0.0% | | | |
| Tuniu Corp. Class A sponsored ADR (a) | | 17,300 | 132,691 |
|
| TOTAL HOTELS, RESTAURANTS & LEISURE | | | 280,654 |
|
| Internet & Direct Marketing Retail - 2.3% | | | |
| Internet & Direct Marketing Retail - 2.3% | | | |
| Amazon.com, Inc. (a) | | 3,500 | 4,093,145 |
| China Internet Plus Holdings Ltd. Class B (a)(c)(d) | | 141,569 | 791,238 |
| Cogobuy Group (e) | | 56,000 | 29,746 |
| JD.com, Inc. sponsored ADR (a) | | 8,100 | 335,502 |
| Netflix, Inc. (a) | | 32,600 | 6,257,896 |
| Vipshop Holdings Ltd. ADR (a) | | 352,759 | 4,134,335 |
| | | | 15,641,862 |
| Internet Software & Services - 19.6% | | | |
| Internet Software & Services - 19.6% | | | |
| 58.com, Inc. ADR (a) | | 24,740 | 1,770,642 |
| Akamai Technologies, Inc. (a) | | 79,500 | 5,170,680 |
| Alibaba Group Holding Ltd. sponsored ADR (a) | | 142,200 | 24,519,546 |
| Alphabet, Inc.: | | | |
| Class A (a) | | 25,300 | 26,651,020 |
| Class C (a) | | 19,861 | 20,782,550 |
| Apptio, Inc. Class A (a) | | 500 | 11,760 |
| eGain Communications Corp. (a) | | 113,400 | 595,350 |
| Endurance International Group Holdings, Inc. (a) | | 92,500 | 777,000 |
| Facebook, Inc. Class A (a) | | 117,889 | 20,802,693 |
| GoDaddy, Inc. (a) | | 63,100 | 3,172,668 |
| LogMeIn, Inc. | | 56,817 | 6,505,547 |
| NetEase, Inc. ADR | | 20,500 | 7,073,935 |
| New Relic, Inc. (a) | | 16,800 | 970,536 |
| Nutanix, Inc.: | | | |
| Class A (a) | | 76,300 | 2,691,864 |
| Class B (e) | | 6,397 | 225,686 |
| Pandora Media, Inc. (a)(b) | | 31,300 | 150,866 |
| SMS Co., Ltd. | | 98,400 | 3,100,244 |
| Sogou, Inc. ADR (a)(b) | | 600 | 6,942 |
| Tencent Holdings Ltd. | | 69,000 | 3,571,299 |
| Twilio, Inc. Class A (a) | | 1,100 | 25,960 |
| Wix.com Ltd. (a) | | 16,700 | 961,085 |
| Xunlei Ltd. sponsored ADR (a)(b) | | 256,007 | 3,939,948 |
| Yandex NV Series A (a) | | 64,700 | 2,118,925 |
| | | | 135,596,746 |
| IT Services - 6.2% | | | |
| Data Processing & Outsourced Services - 4.0% | | | |
| Fidelity National Information Services, Inc. | | 25,600 | 2,408,704 |
| Fiserv, Inc. (a) | | 8,000 | 1,049,040 |
| FleetCor Technologies, Inc. (a) | | 29,800 | 5,734,414 |
| Global Payments, Inc. | | 21,000 | 2,105,040 |
| PayPal Holdings, Inc. (a) | | 150,000 | 11,043,000 |
| Square, Inc. (a) | | 55,300 | 1,917,251 |
| Total System Services, Inc. | | 12,200 | 964,898 |
| WEX, Inc. (a) | | 19,200 | 2,711,616 |
| | | | 27,933,963 |
| IT Consulting & Other Services - 2.2% | | | |
| China Information Technology, Inc. (a) | | 42 | 62 |
| Cognizant Technology Solutions Corp. Class A | | 171,400 | 12,172,828 |
| CSRA, Inc. | | 12,300 | 368,016 |
| DXC Technology Co. | | 28,600 | 2,714,140 |
| | | | 15,255,046 |
|
| TOTAL IT SERVICES | | | 43,189,009 |
|
| Life Sciences Tools & Services - 0.0% | | | |
| Life Sciences Tools & Services - 0.0% | | | |
| JHL Biotech, Inc. (a) | | 94,814 | 194,952 |
| Machinery - 1.0% | | | |
| Industrial Machinery - 1.0% | | | |
| HIWIN Technologies Corp. | | 100 | 1,085 |
| Minebea Mitsumi, Inc. | | 346,948 | 7,276,132 |
| | | | 7,277,217 |
| Media - 1.3% | | | |
| Advertising - 0.0% | | | |
| iCar Asia Ltd. (a) | | 439,097 | 68,521 |
| iCar Asia Ltd. warrants 6/12/19 (a) | | 64,573 | 2,492 |
| | | | 71,013 |
| Cable & Satellite - 1.1% | | | |
| Naspers Ltd. Class N | | 26,700 | 7,447,298 |
| Publishing - 0.2% | | | |
| China Literature Ltd. (a)(e) | | 108,072 | 1,152,947 |
|
| TOTAL MEDIA | | | 8,671,258 |
|
| Real Estate Management & Development - 0.1% | | | |
| Real Estate Services - 0.1% | | | |
| Relo Holdings Corp. | | 28,400 | 773,801 |
| Semiconductors & Semiconductor Equipment - 22.5% | | | |
| Semiconductor Equipment - 5.9% | | | |
| ASM Pacific Technology Ltd. | | 714,622 | 9,960,813 |
| ASML Holding NV | | 9,900 | 1,720,818 |
| Entegris, Inc. | | 55,800 | 1,699,110 |
| Experi Corp. | | 10,000 | 244,000 |
| Ferrotec Holdings Corp. | | 97,700 | 1,994,320 |
| GlobalWafers Co. Ltd. | | 598,400 | 8,017,798 |
| KLA-Tencor Corp. | | 30,300 | 3,183,621 |
| Lam Research Corp. | | 18,600 | 3,423,702 |
| Screen Holdings Co. Ltd. | | 23,500 | 1,922,964 |
| Siltronic AG (a) | | 15,000 | 2,183,127 |
| Sino-American Silicon Products, Inc. | | 2,249,000 | 5,784,161 |
| SolarEdge Technologies, Inc. (a) | | 10,600 | 398,030 |
| STR Holdings, Inc. (a) | | 433 | 100 |
| Veeco Instruments, Inc. (a) | | 7,115 | 105,658 |
| | | | 40,638,222 |
| Semiconductors - 16.6% | | | |
| Advanced Micro Devices, Inc. (a)(b) | | 466,000 | 4,790,480 |
| ams AG | | 109,460 | 9,935,591 |
| ASPEED Tech, Inc. | | 64,000 | 1,548,926 |
| Broadcom Ltd. | | 13,100 | 3,365,390 |
| Cavium, Inc. (a) | | 8,991 | 753,716 |
| ChipMOS TECHNOLOGIES, Inc. sponsored ADR | | 26,964 | 475,915 |
| Cree, Inc. (a) | | 163,100 | 6,057,534 |
| Global Unichip Corp. | | 99,000 | 850,945 |
| Himax Technologies, Inc. sponsored ADR (b) | | 756,400 | 7,881,688 |
| Inphi Corp. (a)(b) | | 70,000 | 2,562,000 |
| International Quantum Epitaxy PLC (a)(b) | | 1,282,500 | 2,372,247 |
| M/A-COM Technology Solutions Holdings, Inc. (a) | | 161,800 | 5,264,972 |
| Macronix International Co. Ltd. (a) | | 290 | 432 |
| Marvell Technology Group Ltd. | | 121,600 | 2,610,752 |
| Micron Technology, Inc. (a) | | 77,000 | 3,166,240 |
| Monolithic Power Systems, Inc. | | 21,300 | 2,393,268 |
| Nanya Technology Corp. | | 5,723,000 | 14,699,585 |
| NVIDIA Corp. | | 110,500 | 21,381,750 |
| Qualcomm, Inc. | | 325,150 | 20,816,103 |
| Renesas Electronics Corp. (a) | | 40,400 | 470,781 |
| Silergy Corp. | | 24,000 | 550,106 |
| Silicon Laboratories, Inc. (a) | | 19,100 | 1,686,530 |
| Silicon Motion Technology Corp. sponsored ADR (b) | | 26,200 | 1,387,552 |
| Skyworks Solutions, Inc. | | 400 | 37,980 |
| | | | 115,060,483 |
|
| TOTAL SEMICONDUCTORS & SEMICONDUCTOR EQUIPMENT | | | 155,698,705 |
|
| Software - 23.6% | | | |
| Application Software - 13.3% | | | |
| Adobe Systems, Inc. (a) | | 42,400 | 7,430,176 |
| Altair Engineering, Inc. Class A (a) | | 2,800 | 66,976 |
| Aspen Technology, Inc. (a) | | 6,700 | 443,540 |
| Autodesk, Inc. (a) | | 190,600 | 19,980,598 |
| Callidus Software, Inc. (a) | | 58,526 | 1,676,770 |
| Citrix Systems, Inc. (a) | | 138,400 | 12,179,200 |
| Ellie Mae, Inc. (a)(b) | | 38,400 | 3,432,960 |
| HubSpot, Inc. (a) | | 2,700 | 238,680 |
| Kingdee International Software Group Co. Ltd. (a) | | 3,966,000 | 2,233,551 |
| Parametric Technology Corp. (a) | | 187,600 | 11,400,452 |
| SailPoint Technologies Holding, Inc. (a) | | 4,200 | 60,900 |
| Salesforce.com, Inc. (a) | | 146,100 | 14,935,803 |
| Snap, Inc. Class A (a)(b) | | 99,400 | 1,452,234 |
| Ultimate Software Group, Inc. (a) | | 56,880 | 12,412,922 |
| Workday, Inc. Class A (a) | | 21,400 | 2,177,236 |
| Workiva, Inc. (a) | | 21,300 | 455,820 |
| Zendesk, Inc. (a) | | 39,000 | 1,319,760 |
| | | | 91,897,578 |
| Home Entertainment Software - 4.6% | | | |
| Activision Blizzard, Inc. | | 129,100 | 8,174,612 |
| Electronic Arts, Inc. (a) | | 116,900 | 12,281,514 |
| Nintendo Co. Ltd. | | 17,800 | 6,409,720 |
| Nintendo Co. Ltd. ADR | | 39,400 | 1,775,762 |
| Take-Two Interactive Software, Inc. (a) | | 31,400 | 3,447,092 |
| | | | 32,088,700 |
| Systems Software - 5.7% | | | |
| Microsoft Corp. | | 369,000 | 31,564,260 |
| Red Hat, Inc. (a) | | 23,900 | 2,870,390 |
| Tableau Software, Inc. (a)(b) | | 69,900 | 4,837,080 |
| | | | 39,271,730 |
|
| TOTAL SOFTWARE | | | 163,258,008 |
|
| Technology Hardware, Storage & Peripherals - 9.2% | | | |
| Technology Hardware, Storage & Peripherals - 9.2% | | | |
| Apple, Inc. | | 364,115 | 61,619,182 |
| HP, Inc. | | 2,217 | 46,579 |
| Primax Electronics Ltd. | | 680,000 | 1,810,766 |
| | | | 63,476,527 |
| TOTAL COMMON STOCKS | | | |
| (Cost $482,374,016) | | | 673,402,667 |
|
| Convertible Preferred Stocks - 1.0% | | | |
| Food & Staples Retailing - 0.2% | | | |
| Food Retail - 0.2% | | | |
| Roofoods Ltd. Series F (c)(d) | | 4,211 | 1,488,886 |
| Internet & Direct Marketing Retail - 0.6% | | | |
| Internet & Direct Marketing Retail - 0.6% | | | |
| China Internet Plus Holdings Ltd.: | | | |
| Series A-11 (a)(c)(d) | | 259,152 | 1,448,416 |
| Series B (a)(c)(d) | | 401,913 | 2,246,316 |
| | | | 3,694,732 |
| Internet Software & Services - 0.2% | | | |
| Internet Software & Services - 0.2% | | | |
| Uber Technologies, Inc. Series D, 8.00% (a)(c)(d) | | 45,124 | 1,575,730 |
| TOTAL CONVERTIBLE PREFERRED STOCKS | | | |
| (Cost $4,559,704) | | | 6,759,348 |
|
| Money Market Funds - 10.0% | | | |
| Fidelity Cash Central Fund, 1.36% (f) | | 11,587,215 | 11,589,533 |
| Fidelity Securities Lending Cash Central Fund 1.36% (f)(g) | | 57,991,047 | 58,002,645 |
| TOTAL MONEY MARKET FUNDS | | | |
| (Cost $69,586,379) | | | 69,592,178 |
| TOTAL INVESTMENT IN SECURITIES - 108.3% | | | |
| (Cost $556,520,099) | | | 749,754,193 |
| NET OTHER ASSETS (LIABILITIES) - (8.3)% | | | (57,542,927) |
| NET ASSETS - 100% | | | $692,211,266 |
Legend
(a) Non-income producing
(b) Security or a portion of the security is on loan at period end.
(c) Level 3 security
(d) Restricted securities - Investment in securities not registered under the Securities Act of 1933 (excluding 144A issues). At the end of the period, the value of restricted securities (excluding 144A issues) amounted to $7,550,586 or 1.1% of net assets.
(e) Security exempt from registration under Rule 144A of the Securities Act of 1933. These securities may be resold in transactions exempt from registration, normally to qualified institutional buyers. At the end of the period, the value of these securities amounted to $1,408,379 or 0.2% of net assets.
(f) Affiliated fund that is generally available only to investment companies and other accounts managed by Fidelity Investments. The rate quoted is the annualized seven-day yield of the fund at period end. A complete unaudited listing of the fund's holdings as of its most recent quarter end is available upon request. In addition, each Fidelity Central Fund's financial statements, which are not covered by the Fund's Report of Independent Registered Public Accounting Firm, are available on the SEC's website or upon request.
(g) Investment made with cash collateral received from securities on loan.
Additional information on each restricted holding is as follows:
| Security | Acquisition Date | Acquisition Cost |
| China Internet Plus Holdings Ltd. Class B | 11/16/16 | $398,984 |
| China Internet Plus Holdings Ltd. Series A-11 | 1/26/15 | $819,141 |
| China Internet Plus Holdings Ltd. Series B | 12/11/15 | $1,551,666 |
| Roofoods Ltd. Series F | 9/12/17 | $1,488,886 |
| Uber Technologies, Inc. Series D, 8.00% | 6/6/14 | $700,011 |
Affiliated Central Funds
Information regarding fiscal year to date income earned by the Fund from investments in Fidelity Central Funds is as follows:
| Fund | Income earned |
| Fidelity Cash Central Fund | $132,336 |
| Fidelity Securities Lending Cash Central Fund | 355,900 |
| Total | $488,236 |
Amounts in the income column in the above table include any capital gain distributions from underlying funds, which are presented in the corresponding line-item in the Statement of Operations if applicable.
Investment Valuation
The following is a summary of the inputs used, as of December 31, 2017, involving the Fund's assets and liabilities carried at fair value. The inputs or methodology used for valuing securities may not be an indication of the risk associated with investing in those securities. For more information on valuation inputs, and their aggregation into the levels used below, please refer to the Investment Valuation section in the accompanying Notes to Financial Statements.
| | Valuation Inputs at Reporting Date: |
| Description | Total | Level 1 | Level 2 | Level 3 |
| Investments in Securities: | | | | |
| Common Stocks | $673,402,667 | $662,625,283 | $9,986,146 | $791,238 |
| Convertible Preferred Stocks | 6,759,348 | -- | -- | 6,759,348 |
| Money Market Funds | 69,592,178 | 69,592,178 | -- | -- |
| Total Investments in Securities: | $749,754,193 | $732,217,461 | $9,986,146 | $7,550,586 |
The following is a reconciliation of Investments in Securities for which Level 3 inputs were used in determining value:
| Investments in Securities: | |
| Beginning Balance | $5,280,919 |
| Total Realized Gain (Loss) | (126,982) |
| Total Unrealized Gain (Loss) | 907,762 |
| Cost of Purchases | 1,488,887 |
| Proceeds of Sales | -- |
| Amortization/Accretion | -- |
| Transfers in to Level 3 | -- |
| Transfers out of Level 3 | -- |
| Ending Balance | $7,550,586 |
| The change in unrealized gain (loss) for the period attributable to Level 3 securities held at December 31, 2017 | $780,782 |
The information used in the above reconciliation represents fiscal year to date activity for any Investments in Securities identified as using Level 3 inputs at either the beginning or the end of the current fiscal period. Transfers in or out of Level 3 represent the beginning value of any Security or Instrument where a change in the pricing level occurred from the beginning to the end of the period. The cost of purchases and the proceeds of sales may include securities received or delivered through corporate actions or exchanges. Realized and unrealized gains (losses) disclosed in the reconciliations are included in Net Gain (Loss) on the Fund's Statement of Operations.
Other Information
Distribution of investments by country or territory of incorporation, as a percentage of Total Net Assets, is as follows (Unaudited):
| United States of America | 72.4% |
| Cayman Islands | 11.9% |
| Taiwan | 6.1% |
| Japan | 4.1% |
| Austria | 1.4% |
| South Africa | 1.1% |
| Others (Individually Less Than 1%) | 3.0% |
| | 100.0% |
See accompanying notes which are an integral part of the financial statements.
Financial Statements
Statement of Assets and Liabilities
| | | December 31, 2017 |
| Assets | | |
Investment in securities, at value (including securities loaned of $56,047,192) — See accompanying schedule:
Unaffiliated issuers (cost $486,933,720) | $680,162,015 | |
| Fidelity Central Funds (cost $69,586,379) | 69,592,178 | |
| Total Investment in Securities (cost $556,520,099) | | $749,754,193 |
| Receivable for investments sold | | 4,119,133 |
| Receivable for fund shares sold | | 431,334 |
| Dividends receivable | | 69,824 |
| Distributions receivable from Fidelity Central Funds | | 116,901 |
| Prepaid expenses | | 2,713 |
| Other receivables | | 5,088 |
| Total assets | | 754,499,186 |
| Liabilities | | |
| Payable for investments purchased | $243,712 | |
| Payable for fund shares redeemed | 3,524,390 | |
| Accrued management fee | 314,687 | |
| Other affiliated payables | 96,030 | |
| Other payables and accrued expenses | 115,411 | |
| Collateral on securities loaned | 57,993,690 | |
| Total liabilities | | 62,287,920 |
| Net Assets | | $692,211,266 |
| Net Assets consist of: | | |
| Paid in capital | | $450,781,860 |
| Accumulated undistributed net realized gain (loss) on investments and foreign currency transactions | | 48,195,120 |
| Net unrealized appreciation (depreciation) on investments and assets and liabilities in foreign currencies | | 193,234,286 |
| Net Assets | | $692,211,266 |
| Initial Class: | | |
| Net Asset Value, offering price and redemption price per share ($154,984,113 ÷ 8,410,615 shares) | | $18.43 |
| Investor Class: | | |
| Net Asset Value, offering price and redemption price per share ($537,227,153 ÷ 29,477,440 shares) | | $18.23 |
See accompanying notes which are an integral part of the financial statements.
Statement of Operations
| | | Year ended December 31, 2017 |
| Investment Income | | |
| Dividends | | $3,411,457 |
| Income from Fidelity Central Funds (including $355,900 from security lending) | | 488,236 |
| Total income | | 3,899,693 |
| Expenses | | |
| Management fee | $2,999,273 | |
| Transfer agent fees | 705,735 | |
| Accounting and security lending fees | 211,062 | |
| Custodian fees and expenses | 65,361 | |
| Independent trustees' fees and expenses | 11,700 | |
| Audit | 57,144 | |
| Legal | 8,898 | |
| Miscellaneous | 35,355 | |
| Total expenses before reductions | 4,094,528 | |
| Expense reductions | (35,537) | 4,058,991 |
| Net investment income (loss) | | (159,298) |
| Realized and Unrealized Gain (Loss) | | |
| Net realized gain (loss) on: | | |
| Investment securities: | | |
| Unaffiliated issuers | 71,009,101 | |
| Fidelity Central Funds | 1,631 | |
| Foreign currency transactions | (78,873) | |
| Total net realized gain (loss) | | 70,931,859 |
| Change in net unrealized appreciation (depreciation) on: | | |
| Investment securities: | | |
| Unaffiliated issuers | 130,022,765 | |
| Fidelity Central Funds | 5,416 | |
| Assets and liabilities in foreign currencies | 141 | |
| Total change in net unrealized appreciation (depreciation) | | 130,028,322 |
| Net gain (loss) | | 200,960,181 |
| Net increase (decrease) in net assets resulting from operations | | $200,800,883 |
See accompanying notes which are an integral part of the financial statements.
Statement of Changes in Net Assets
| | Year ended December 31, 2017 | Year ended December 31, 2016 |
| Increase (Decrease) in Net Assets | | |
| Operations | | |
| Net investment income (loss) | $(159,298) | $310,107 |
| Net realized gain (loss) | 70,931,859 | 5,141,060 |
| Change in net unrealized appreciation (depreciation) | 130,028,322 | 22,503,610 |
| Net increase (decrease) in net assets resulting from operations | 200,800,883 | 27,954,777 |
| Distributions to shareholders from net investment income | (61,212) | (251,567) |
| Distributions to shareholders from net realized gain | (26,317,179) | (9,124,552) |
| Total distributions | (26,378,391) | (9,376,119) |
| Share transactions - net increase (decrease) | 187,963,500 | (943,504) |
| Redemption fees | 58,624 | 44,404 |
| Total increase (decrease) in net assets | 362,444,616 | 17,679,558 |
| Net Assets | | |
| Beginning of period | 329,766,650 | 312,087,092 |
| End of period | $692,211,266 | $329,766,650 |
| Other Information | | |
| Undistributed net investment income end of period | $– | $63,220 |
See accompanying notes which are an integral part of the financial statements.
Financial Highlights
VIP Technology Portfolio Initial Class
| Years ended December 31, | 2017 | 2016 | 2015 | 2014 | 2013 |
| Selected Per–Share Data | | | | | |
| Net asset value, beginning of period | $12.76 | $11.91 | $11.83 | $12.43 | $10.33 |
| Income from Investment Operations | | | | | |
| Net investment income (loss)A | .01 | .02 | .02 | .01 | .01 |
| Net realized and unrealized gain (loss) | 6.41 | 1.22 | .71 | 1.38 | 2.78 |
| Total from investment operations | 6.42 | 1.24 | .73 | 1.39 | 2.79 |
| Distributions from net investment income | –B | (.02) | (.02) | (.01) | (.02) |
| Distributions from net realized gain | (.75) | (.37) | (.63) | (1.98) | (.67) |
| Total distributions | (.75) | (.39) | (.65) | (1.99) | (.69) |
| Redemption fees added to paid in capitalA,B | – | – | – | – | – |
| Net asset value, end of period | $18.43 | $12.76 | $11.91 | $11.83 | $12.43 |
| Total ReturnC,D | 50.78% | 11.37% | 6.27% | 11.91% | 27.81% |
| Ratios to Average Net AssetsE,F | | | | | |
| Expenses before reductions | .68% | .70% | .69% | .70% | .73% |
| Expenses net of fee waivers, if any | .68% | .70% | .69% | .69% | .72% |
| Expenses net of all reductions | .67% | .69% | .68% | .69% | .72% |
| Net investment income (loss) | .03% | .17% | .16% | .13% | .10% |
| Supplemental Data | | | | | |
| Net assets, end of period (000 omitted) | $154,984 | $75,480 | $70,596 | $69,964 | $61,534 |
| Portfolio turnover rateG | 68% | 67% | 68% | 67% | 113% |
A Calculated based on average shares outstanding during the period.
B Amount represents less than $.005 per share.
C Total returns do not reflect charges attributable to your insurance company's separate account. Inclusion of these charges would reduce the total returns shown.
D Total returns would have been lower if certain expenses had not been reduced during the applicable periods shown.
E Fees and expenses of any underlying Fidelity Central Funds are not included in the Fund's expense ratio. The Fund indirectly bears its proportionate share of the expenses of any underlying Fidelity Central Funds.
F Expense ratios reflect operating expenses of the class. Expenses before reductions do not reflect amounts reimbursed by the investment adviser or reductions from brokerage service arrangements or reductions from other expense offset arrangements and do not represent the amount paid by the class during periods when reimbursements or reductions occur. Expenses net of fee waivers reflect expenses after reimbursement by the investment adviser but prior to reductions from brokerage service arrangements or other expense offset arrangements. Expenses net of all reductions represent the net expenses paid by the class.
G Amount does not include the portfolio activity of any underlying Fidelity Central Funds.
See accompanying notes which are an integral part of the financial statements.
VIP Technology Portfolio Investor Class
| Years ended December 31, | 2017 | 2016 | 2015 | 2014 | 2013 |
| Selected Per–Share Data | | | | | |
| Net asset value, beginning of period | $12.63 | $11.79 | $11.73 | $12.34 | $10.26 |
| Income from Investment Operations | | | | | |
| Net investment income (loss)A | (.01) | .01 | .01 | .01 | –B |
| Net realized and unrealized gain (loss) | 6.35 | 1.21 | .69 | 1.36 | 2.76 |
| Total from investment operations | 6.34 | 1.22 | .70 | 1.37 | 2.76 |
| Distributions from net investment income | –B | (.01) | (.01) | (.01) | (.01) |
| Distributions from net realized gain | (.74) | (.37) | (.63) | (1.98) | (.67) |
| Total distributions | (.74) | (.38) | (.64) | (1.98)C | (.68) |
| Redemption fees added to paid in capitalA,B | – | – | – | – | – |
| Net asset value, end of period | $18.23 | $12.63 | $11.79 | $11.73 | $12.34 |
| Total ReturnD,E | 50.67% | 11.34% | 6.08% | 11.86% | 27.73% |
| Ratios to Average Net AssetsF,G | | | | | |
| Expenses before reductions | .76% | .78% | .77% | .78% | .81% |
| Expenses net of fee waivers, if any | .76% | .78% | .77% | .77% | .80% |
| Expenses net of all reductions | .75% | .77% | .76% | .77% | .80% |
| Net investment income (loss) | (.05)% | .09% | .08% | .05% | .02% |
| Supplemental Data | | | | | |
| Net assets, end of period (000 omitted) | $537,227 | $254,287 | $241,491 | $180,147 | $120,666 |
| Portfolio turnover rateH | 68% | 67% | 68% | 67% | 113% |
A Calculated based on average shares outstanding during the period.
B Amount represents less than $.005 per share.
C Total distributions of $1.98 per share is comprised of distributions from net investment income of $.005 and distributions from net realized gain of $1.977 per share.
D Total returns do not reflect charges attributable to your insurance company's separate account. Inclusion of these charges would reduce the total returns shown.
E Total returns would have been lower if certain expenses had not been reduced during the applicable periods shown.
F Fees and expenses of any underlying Fidelity Central Funds are not included in the Fund's expense ratio. The Fund indirectly bears its proportionate share of the expenses of any underlying Fidelity Central Funds.
G Expense ratios reflect operating expenses of the class. Expenses before reductions do not reflect amounts reimbursed by the investment adviser or reductions from brokerage service arrangements or reductions from other expense offset arrangements and do not represent the amount paid by the class during periods when reimbursements or reductions occur. Expenses net of fee waivers reflect expenses after reimbursement by the investment adviser but prior to reductions from brokerage service arrangements or other expense offset arrangements. Expenses net of all reductions represent the net expenses paid by the class.
H Amount does not include the portfolio activity of any underlying Fidelity Central Funds.
See accompanying notes which are an integral part of the financial statements.
Notes to Financial Statements
For the period ended December 31, 2017
1. Organization.
VIP Technology Portfolio (the Fund) is a non-diversified fund of Variable Insurance Products Fund IV (the Trust) and is authorized to issue an unlimited number of shares. The Trust is registered under the Investment Company Act of 1940, as amended (the 1940 Act), as an open-end management investment company organized as a Massachusetts business trust. Shares of the Fund may only be purchased by insurance companies for the purpose of funding variable annuity or variable life insurance contracts. The Fund offers the following classes of shares: Initial Class shares and Investor Class shares. All classes have equal rights and voting privileges, except for matters affecting a single class. The Fund's investments in emerging markets can be subject to social, economic, regulatory, and political uncertainties and can be extremely volatile.
2. Investments in Fidelity Central Funds.
The Fund invests in Fidelity Central Funds, which are open-end investment companies generally available only to other investment companies and accounts managed by the investment adviser and its affiliates. The Fund's Schedule of Investments lists each of the Fidelity Central Funds held as of period end, if any, as an investment of the Fund, but does not include the underlying holdings of each Fidelity Central Fund. As an Investing Fund, the Fund indirectly bears its proportionate share of the expenses of the underlying Fidelity Central Funds.
The Money Market Central Funds seek preservation of capital and current income and are managed by Fidelity Investments Money Management, Inc. (FIMM), an affiliate of the investment adviser. Annualized expenses of the Money Market Central Funds as of their most recent shareholder report date are less than .005%.
A complete unaudited list of holdings for each Fidelity Central Fund is available upon request or at the Securities and Exchange Commission (the SEC) website at www.sec.gov. In addition, the financial statements of the Fidelity Central Funds, which are not covered by the Fund's Report of Independent Registered Public Accounting Firm, are available on the SEC website or upon request.
3. Significant Accounting Policies.
The Fund is an investment company and applies the accounting and reporting guidance of the Financial Accounting Standards Board (FASB) Accounting Standards Codification Topic 946 Financial Services – Investments Companies. The financial statements have been prepared in conformity with accounting principles generally accepted in the United States of America (GAAP), which require management to make certain estimates and assumptions at the date of the financial statements. Actual results could differ from those estimates. Subsequent events, if any, through the date that the financial statements were issued have been evaluated in the preparation of the financial statements. The following summarizes the significant accounting policies of the Fund:
Investment Valuation. Investments are valued as of 4:00 p.m. Eastern time on the last calendar day of the period. The Board of Trustees (the Board) has delegated the day to day responsibility for the valuation of the Fund's investments to the Fair Value Committee (the Committee) established by the Fund's investment adviser. In accordance with valuation policies and procedures approved by the Board, the Fund attempts to obtain prices from one or more third party pricing vendors or brokers to value its investments. When current market prices, quotations or currency exchange rates are not readily available or reliable, investments will be fair valued in good faith by the Committee, in accordance with procedures adopted by the Board. Factors used in determining fair value vary by investment type and may include market or investment specific events. The frequency with which these procedures are used cannot be predicted and they may be utilized to a significant extent. The Committee oversees the Fund's valuation policies and procedures and reports to the Board on the Committee's activities and fair value determinations. The Board monitors the appropriateness of the procedures used in valuing the Fund's investments and ratifies the fair value determinations of the Committee.
The Fund categorizes the inputs to valuation techniques used to value its investments into a disclosure hierarchy consisting of three levels as shown below:
- Level 1 – quoted prices in active markets for identical investments
- Level 2 – other significant observable inputs (including quoted prices for similar investments, interest rates, prepayment speeds, etc.)
- Level 3 – unobservable inputs (including the Fund's own assumptions based on the best information available)
Valuation techniques used to value the Fund's investments by major category are as follows:
Equity securities, including restricted securities, for which market quotations are readily available, are valued at the last reported sale price or official closing price as reported by a third party pricing vendor on the primary market or exchange on which they are traded and are categorized as Level 1 in the hierarchy. In the event there were no sales during the day or closing prices are not available, securities are valued at the last quoted bid price or may be valued using the last available price and are generally categorized as Level 2 in the hierarchy. For foreign equity securities, when market or security specific events arise, comparisons to the valuation of American Depositary Receipts (ADRs), futures contracts, Exchange-Traded Funds (ETFs) and certain indexes as well as quoted prices for similar securities may be used and would be categorized as Level 2 in the hierarchy. Utilizing these techniques may result in transfers between Level 1 and Level 2. For equity securities, including restricted securities, where observable inputs are limited, assumptions about market activity and risk are used and these securities may be categorized as Level 3 in the hierarchy. Equity securities, including restricted securities, for which observable inputs are not available are valued using alternate valuation approaches, including the market approach and the income approach and are categorized as Level 3 in the hierarchy. The market approach generally consists of using comparable market transactions while the income approach generally consists of using the net present value of estimated future cash flows, adjusted as appropriate for liquidity, credit, market and/or other risk factors.
Investments in open-end mutual funds, including the Fidelity Central Funds, are valued at their closing net asset value (NAV) each business day and are categorized as Level 1 in the hierarchy.
The following provides information on Level 3 securities held by the Fund that were valued at period end based on unobservable inputs. These amounts exclude valuations provided by a broker.
| Asset Type | Fair Value | Valuation Technique (s) | Unobservable Input | Amount or Range / Weighted Average | Impact to Valuation from an Increase in Input(a) |
| Equities | $7,550,586 | Market approach | Transaction price | $5.59 - $353.57 / $74.54 | Increase |
| | | Recovery value | Recovery value | 0.0% | Increase |
(a) Represents the expected directional change in the fair value of the Level 3 investments that would result from an increase in the corresponding input. A decrease to the unobservable input would have the opposite effect. Significant changes in these inputs could result in significantly higher or lower fair value measurements.
Changes in valuation techniques may result in transfers in or out of an assigned level within the disclosure hierarchy. The aggregate value of investments by input level as of December 31, 2017, as well as a roll forward of Level 3 investments, is included at the end of the Fund's Schedule of Investments.
Foreign Currency. The Fund may use foreign currency contracts to facilitate transactions in foreign-denominated securities. Gains and losses from these transactions may arise from changes in the value of the foreign currency or if the counterparties do not perform under the contracts' terms.
Foreign-denominated assets, including investment securities, and liabilities are translated into U.S. dollars at the exchange rates at period end. Purchases and sales of investment securities, income and dividends received and expenses denominated in foreign currencies are translated into U.S. dollars at the exchange rate in effect on the transaction date.
The effects of exchange rate fluctuations on investments are included with the net realized and unrealized gain (loss) on investment securities. Other foreign currency transactions resulting in realized and unrealized gain (loss) are disclosed separately.
Investment Transactions and Income. For financial reporting purposes, the Fund's investment holdings and NAV include trades executed through the end of the last business day of the period. The NAV per share for processing shareholder transactions is calculated as of the close of business of the New York Stock Exchange (NYSE), normally 4:00 p.m. Eastern time and includes trades executed through the end of the prior business day. Gains and losses on securities sold are determined on the basis of identified cost and includes proceeds received from litigation. Dividend income is recorded on the ex-dividend date, except for certain dividends from foreign securities where the ex-dividend date may have passed, which are recorded as soon as the Fund is informed of the ex-dividend date. Non-cash dividends included in dividend income, if any, are recorded at the fair market value of the securities received. Income and capital gain distributions from Fidelity Central Funds, if any, are recorded on the ex-dividend date. Certain distributions received by the Fund represent a return of capital or capital gain. The Fund determines the components of these distributions subsequent to the ex-dividend date, based upon receipt of tax filings or other correspondence relating to the underlying investment. These distributions are recorded as a reduction of cost of investments and/or as a realized gain. Investment income is recorded net of foreign taxes withheld where recovery of such taxes is uncertain.
Class Allocations and Expenses. Investment income, realized and unrealized capital gains and losses, common expenses of the Fund, and certain fund-level expense reductions, if any, are allocated daily on a pro-rata basis to each class based on the relative net assets of each class to the total net assets of the Fund. Each class differs with respect to transfer agent fees incurred. Certain expense reductions may also differ by class. For the reporting period, the allocated portion of income and expenses to each class as a percent of its average net assets may vary due to the timing of recording these transactions in relation to fluctuating net assets of the classes. Expenses directly attributable to a fund are charged to that fund. Expenses attributable to more than one fund are allocated among the respective funds on the basis of relative net assets or other appropriate methods. Expense estimates are accrued in the period to which they relate and adjustments are made when actual amounts are known.
Income Tax Information and Distributions to Shareholders. Each year, the Fund intends to qualify as a regulated investment company under Subchapter M of the Internal Revenue Code, including distributing substantially all of its taxable income and realized gains. As a result, no provision for U.S. Federal income taxes is required. As of December 31, 2017, the Fund did not have any unrecognized tax benefits in the financial statements; nor is the Fund aware of any tax positions for which it is reasonably possible that the total amounts of unrecognized tax benefits will significantly change in the next twelve months. The Fund files a U.S. federal tax return, in addition to state and local tax returns as required. The Fund's federal income tax returns are subject to examination by the Internal Revenue Service (IRS) for a period of three fiscal years after they are filed. State and local tax returns may be subject to examination for an additional fiscal year depending on the jurisdiction. Foreign taxes are provided for based on the Fund's understanding of the tax rules and rates that exist in the foreign markets in which it invests.
Distributions are declared and recorded on the ex-dividend date. Income dividends and capital gain distributions are declared separately for each class. Income and capital gain distributions are determined in accordance with income tax regulations, which may differ from GAAP.
Capital accounts within the financial statements are adjusted for permanent book-tax differences. These adjustments have no impact on net assets or the results of operations. Capital accounts are not adjusted for temporary book-tax differences which will reverse in a subsequent period.
Book-tax differences are primarily due to foreign currency transactions, passive foreign investment companies (PFIC) and losses deferred due to wash sales.
As of period end, the cost and unrealized appreciation (depreciation) in securities, and derivatives if applicable, for federal income tax purposes were as follows:
| Gross unrealized appreciation | $200,526,787 |
| Gross unrealized depreciation | (8,759,462) |
| Net unrealized appreciation (depreciation) | $191,767,325 |
| Tax Cost | $557,986,868 |
The tax-based components of distributable earnings as of period end were as follows:
| Undistributed ordinary income | $13,598,939 |
| Undistributed long-term capital gain | $36,062,949 |
| Net unrealized appreciation (depreciation) on securities and other investments | $191,767,517 |
The tax character of distributions paid was as follows:
| | December 31, 2017 | December 31, 2016 |
| Ordinary Income | $22,081,207 | $ 330,385 |
| Long-term Capital Gains | 4,297,184 | 9,045,734 |
| Total | $26,378,391 | $ 9,376,119 |
Trading (Redemption) Fees. Shares held by investors less than 60 days may be subject to a redemption fee equal to 1% of the NAV of shares redeemed. All redemption fees, which reduce the proceeds of the shareholder redemption, are retained by the Fund and accounted for as an addition to paid in capital. In November 2017, the Board of Trustees approved the elimination of these redemption fees effective December 18, 2017.
Restricted Securities. The Fund may invest in securities that are subject to legal or contractual restrictions on resale. These securities generally may be resold in transactions exempt from registration or to the public if the securities are registered. Disposal of these securities may involve time-consuming negotiations and expense, and prompt sale at an acceptable price may be difficult. Information regarding restricted securities is included at the end of the Fund's Schedule of Investments.
4. Purchases and Sales of Investments.
Purchases and sales of securities, other than short-term securities, aggregated $511,464,463 and $364,701,662, respectively.
5. Fees and Other Transactions with Affiliates.
Management Fee. Fidelity SelectCo, LLC (the investment adviser) and its affiliates provide the Fund with investment management related services for which the Fund pays a monthly management fee. The management fee is the sum of an individual fund fee rate that is based on an annual rate of .30% of the Fund's average net assets and an annualized group fee rate that averaged .24% during the period. The group fee rate is based upon the average net assets of all the mutual funds advised by Fidelity Management & Research Company (FMR) and the investment adviser. The group fee rate decreases as assets under management increase and increases as assets under management decrease. For the reporting period, the total annual management fee rate was .54% of the Fund's average net assets.
Transfer Agent Fees. Fidelity Investments Institutional Operations Company, Inc. (FIIOC), an affiliate of the investment adviser, is the Fund's transfer, dividend disbursing, and shareholder servicing agent. FIIOC receives an asset-based fee with respect to each class. Each class pays a fee for transfer agent services, typesetting and printing and mailing of shareholder reports, excluding mailing of proxy statements, equal to an annual rate of class-level average net assets. The annual rate for Investor Class is .15% and the annual rate for all other classes is .07%. For the period, transfer agent fees for each class were as follows:
| Initial Class | $84,730 |
| Investor Class | 621,005 |
| | $705,735 |
Accounting and Security Lending Fees. Fidelity Service Company, Inc. (FSC), an affiliate of the investment adviser, maintains the Fund's accounting records. The accounting fee is based on the level of average net assets for each month. Under a separate contract, FSC administers the security lending program. The security lending fee is based on the number and duration of lending transactions.
Brokerage Commissions. The Fund placed a portion of its portfolio transactions with brokerage firms which are affiliates of the investment adviser. Brokerage commissions are included in net realized gain (loss) and change in net unrealized appreciation (depreciation) in the Statement of Operations. The commissions paid to these affiliated firms were $12,014 for the period.
Interfund Trades. The Fund may purchase from or sell securities to other Fidelity Funds under procedures adopted by the Board. The procedures have been designed to ensure these interfund trades are executed in accordance with Rule 17a-7 of the 1940 Act. Interfund trades are included within the respective purchases and sales amounts shown in the Purchases and Sales of Investments note.
6. Committed Line of Credit.
The Fund participates with other funds managed by the investment adviser or an affiliate in a $4.25 billion credit facility (the "line of credit") to be utilized for temporary or emergency purposes to fund shareholder redemptions or for other short-term liquidity purposes. The Fund has agreed to pay commitment fees on its pro-rata portion of the line of credit, which amounted to $1,453 and is reflected in Miscellaneous expenses on the Statement of Operations. During the period, the Fund did not borrow on this line of credit.
7. Security Lending.
The Fund lends portfolio securities through a lending agent from time to time in order to earn additional income. On the settlement date of the loan, the Fund receives collateral (in the form of U.S. Treasury obligations, letters of credit and/or cash) against the loaned securities and maintains collateral in an amount not less than 100% of the market value of the loaned securities during the period of the loan. The market value of the loaned securities is determined at the close of business of the Fund and any additional required collateral is delivered to the Fund on the next business day. The Fund or borrower may terminate the loan at any time, and if the borrower defaults on its obligation to return the securities loaned because of insolvency or other reasons, the Fund may apply collateral received from the borrower against the obligation. The Fund may experience delays and costs in recovering the securities loaned. Any cash collateral received is invested in the Fidelity Securities Lending Cash Central Fund. The value of loaned securities and cash collateral at period end are disclosed on the Fund's Statement of Assets and Liabilities. Security lending income represents the income earned on investing cash collateral, less rebates paid to borrowers and any lending agent fees associated with the loan, plus any premium payments received for lending certain types of securities. Security lending income is presented in the Statement of Operations as a component of income from Fidelity Central Funds.
8. Expense Reductions.
Commissions paid to certain brokers with whom the investment adviser, or its affiliates, places trades on behalf of the Fund include an amount in addition to trade execution, which may be rebated back to the Fund to offset certain expenses. This amount totaled $31,935 for the period.
Through arrangements with the Fund's custodian, credits realized as a result of certain uninvested cash balances were used to reduce the Fund's expenses. During the period, these credits reduced the Fund's custody expenses by $216.
In addition, during the period the investment adviser reimbursed and/or waived a portion of fund-level operating expenses in the amount of $3,386.
9. Distributions to Shareholders.
Distributions to shareholders of each class were as follows:
| | Year ended
December 31, 2017 | Year ended
December 31, 2016 |
| From net investment income | | |
| Initial Class | $18,359 | $88,680 |
| Investor Class | 42,853 | 162,887 |
| Total | $61,212 | $251,567 |
| From net realized gain | | |
| Initial Class | $5,924,655 | $2,064,829 |
| Investor Class | 20,392,524 | 7,059,723 |
| Total | $26,317,179 | $9,124,552 |
10. Share Transactions.
Transactions for each class of shares were as follows:
| | Shares | Shares | Dollars | Dollars |
| | Year ended December 31, 2017 | Year ended December 31, 2016 | Year ended December 31, 2017 | Year ended December 31, 2016 |
| Initial Class | | | | |
| Shares sold | 3,603,124 | 2,212,158 | $57,019,389 | $27,807,461 |
| Reinvestment of distributions | 338,642 | 220,170 | 5,943,014 | 2,153,509 |
| Shares redeemed | (1,447,039) | (2,445,002) | (24,749,490) | (29,362,382) |
| Net increase (decrease) | 2,494,727 | (12,674) | $38,212,913 | $598,588 |
| Investor Class | | | | |
| Shares sold | 11,306,903 | 3,963,774 | $182,711,660 | $48,389,591 |
| Reinvestment of distributions | 1,177,657 | 748,863 | 20,435,377 | 7,222,610 |
| Shares redeemed | (3,143,809) | (5,052,835) | (53,396,450) | (57,154,293) |
| Net increase (decrease) | 9,340,751 | (340,198) | $149,750,587 | $(1,542,092) |
11. Other.
The Fund's organizational documents provide former and current trustees and officers with a limited indemnification against liabilities arising in connection with the performance of their duties to the Fund. In the normal course of business, the Fund may also enter into contracts that provide general indemnifications. The Fund's maximum exposure under these arrangements is unknown as this would be dependent on future claims that may be made against the Fund. The risk of material loss from such claims is considered remote.
At the end of the period, the investment adviser or its affiliates were the owners of record of 100% of the total outstanding shares of the Fund.
Report of Independent Registered Public Accounting Firm
To the Board of Trustees of Variable Insurance Products Fund IV and Shareholders of VIP Technology Portfolio:
Opinion on the Financial Statements
We have audited the accompanying statement of assets and liabilities, including the schedule of investments, of VIP Technology Portfolio (one of the funds constituting Variable Insurance Products Fund IV, referred to hereafter as the “Fund”) as of December 31, 2017, the related statement of operations for the year ended December 31, 2017, the statement of changes in net assets for each of the two years in the period ended December 31, 2017, including the related notes, and the financial highlights for each of the five years in the period ended December 31, 2017 (collectively referred to as the “financial statements”). In our opinion, the financial statements present fairly, in all material respects, the financial position of the Fund as of December 31, 2017, the results of its operations for the year then ended, the changes in its net assets for each of the two years in the period ended December 31, 2017 and the financial highlights for each of the five years in the period ended December 31, 2017 in conformity with accounting principles generally accepted in the United States of America.
Basis for Opinion
These financial statements are the responsibility of the Fund’s management. Our responsibility is to express an opinion on the Fund’s financial statements based on our audits. We are a public accounting firm registered with the Public Company Accounting Oversight Board (United States) (“PCAOB”) and are required to be independent with respect to the Fund in accordance with the U.S. federal securities laws and the applicable rules and regulations of the Securities and Exchange Commission and the PCAOB.
We conducted our audits of these financial statements in accordance with the standards of the PCAOB. Those standards require that we plan and perform the audit to obtain reasonable assurance about whether the financial statements are free of material misstatement, whether due to error or fraud.
Our audits included performing procedures to assess the risks of material misstatement of the financial statements, whether due to error or fraud, and performing procedures that respond to those risks. Such procedures included examining, on a test basis, evidence regarding the amounts and disclosures in the financial statements. Our audits also included evaluating the accounting principles used and significant estimates made by management, as well as evaluating the overall presentation of the financial statements. Our procedures included confirmation of securities owned as of December 31, 2017 by correspondence with the custodian and brokers; when replies were not received from brokers, we performed other auditing procedures. We believe that our audits provide a reasonable basis for our opinion.
PricewaterhouseCoopers LLP
Boston, Massachusetts
February 14, 2018
We have served as the auditor of one or more investment companies in the Fidelity group of funds since 1932.
Trustees and Officers
The Trustees, Members of the Advisory Board (if any), and officers of the trust and fund, as applicable, are listed below. The Board of Trustees governs the fund and is responsible for protecting the interests of shareholders. The Trustees are experienced executives who meet periodically throughout the year to oversee the fund's activities, review contractual arrangements with companies that provide services to the fund, oversee management of the risks associated with such activities and contractual arrangements, and review the fund's performance. Each of the Trustees oversees 91 funds.
The Trustees hold office without limit in time except that (a) any Trustee may resign; (b) any Trustee may be removed by written instrument, signed by at least two-thirds of the number of Trustees prior to such removal; (c) any Trustee who requests to be retired or who has become incapacitated by illness or injury may be retired by written instrument signed by a majority of the other Trustees; and (d) any Trustee may be removed at any special meeting of shareholders by a two-thirds vote of the outstanding voting securities of the trust. Each Trustee who is not an interested person (as defined in the 1940 Act) of the trust and the fund is referred to herein as an Independent Trustee. Each Independent Trustee shall retire not later than the last day of the calendar year in which his or her 75th birthday occurs. The Independent Trustees may waive this mandatory retirement age policy with respect to individual Trustees. Officers and Advisory Board Members hold office without limit in time, except that any officer or Advisory Board Member may resign or may be removed by a vote of a majority of the Trustees at any regular meeting or any special meeting of the Trustees. Except as indicated, each individual has held the office shown or other offices in the same company for the past five years.
The fund’s Statement of Additional Information (SAI) includes more information about the Trustees. To request a free copy, call Fidelity at 1-877-208-0098.
Experience, Skills, Attributes, and Qualifications of the Trustees. The Governance and Nominating Committee has adopted a statement of policy that describes the experience, qualifications, attributes, and skills that are necessary and desirable for potential Independent Trustee candidates (Statement of Policy). The Board believes that each Trustee satisfied at the time he or she was initially elected or appointed a Trustee, and continues to satisfy, the standards contemplated by the Statement of Policy. The Governance and Nominating Committee also engages professional search firms to help identify potential Independent Trustee candidates who have the experience, qualifications, attributes, and skills consistent with the Statement of Policy. From time to time, additional criteria based on the composition and skills of the current Independent Trustees, as well as experience or skills that may be appropriate in light of future changes to board composition, business conditions, and regulatory or other developments, have also been considered by the professional search firms and the Governance and Nominating Committee. In addition, the Board takes into account the Trustees' commitment and participation in Board and committee meetings, as well as their leadership of standing and ad hoc committees throughout their tenure.
In determining that a particular Trustee was and continues to be qualified to serve as a Trustee, the Board has considered a variety of criteria, none of which, in isolation, was controlling. The Board believes that, collectively, the Trustees have balanced and diverse experience, qualifications, attributes, and skills, which allow the Board to operate effectively in governing the fund and protecting the interests of shareholders. Information about the specific experience, skills, attributes, and qualifications of each Trustee, which in each case led to the Board's conclusion that the Trustee should serve (or continue to serve) as a trustee of the fund, is provided below.
Board Structure and Oversight Function. Brian B. Hogan is an interested person and currently serves as Chairman. The Trustees have determined that an interested Chairman is appropriate and benefits shareholders because an interested Chairman has a personal and professional stake in the quality and continuity of services provided to the fund. Independent Trustees exercise their informed business judgment to appoint an individual of their choosing to serve as Chairman, regardless of whether the Trustee happens to be independent or a member of management. The Independent Trustees have determined that they can act independently and effectively without having an Independent Trustee serve as Chairman and that a key structural component for assuring that they are in a position to do so is for the Independent Trustees to constitute a substantial majority for the Board. The Independent Trustees also regularly meet in executive session. Michael E. Wiley serves as Chairman of the Independent Trustees and as such (i) acts as a liaison between the Independent Trustees and management with respect to matters important to the Independent Trustees and (ii) with management prepares agendas for Board meetings.
Fidelity® funds are overseen by different Boards of Trustees. The fund's Board oversees Fidelity's sector portfolios. Other Boards oversee Fidelity's equity and high income funds, and Fidelity's investment grade bond, money market, and asset allocation funds. The use of separate Boards, each with its own committee structure, allows the Trustees of each group of Fidelity® funds to focus on the unique issues of the funds they oversee, including common research, investment, and operational issues. On occasion, the separate Boards establish joint committees to address issues of overlapping consequences for the Fidelity® funds overseen by each Board.
The Trustees operate using a system of committees to facilitate the timely and efficient consideration of all matters of importance to the Trustees, the fund, and fund shareholders and to facilitate compliance with legal and regulatory requirements and oversight of the fund's activities and associated risks. The Board, acting through its committees, has charged SelectCo and its affiliates with (i) identifying events or circumstances the occurrence of which could have demonstrably adverse effects on the fund's business and/or reputation; (ii) implementing processes and controls to lessen the possibility that such events or circumstances occur or to mitigate the effects of such events or circumstances if they do occur; and (iii) creating and maintaining a system designed to evaluate continuously business and market conditions in order to facilitate the identification and implementation processes described in (i) and (ii) above. Because the day-to-day operations and activities of the fund are carried out by or through SelectCo, its affiliates, and other service providers, the fund's exposure to risks is mitigated but not eliminated by the processes overseen by the Trustees. While each of the Board's committees has responsibility for overseeing different aspects of the fund's activities, oversight is exercised primarily through the Operations and Audit Committees. Appropriate personnel, including but not limited to the fund's Chief Compliance Officer (CCO), SelectCo's internal auditor, the independent accountants, the fund's Treasurer and portfolio management personnel, make periodic reports to the Board's committees, as appropriate. The responsibilities of each standing committee, including their oversight responsibilities, are described further under "Standing Committees of the Trustees."
Interested Trustees*:
Correspondence intended for a Trustee who is an interested person may be sent to Fidelity Investments, 245 Summer Street, Boston, Massachusetts 02210.
Name, Year of Birth; Principal Occupations and Other Relevant Experience+
Brian B. Hogan (1964)
Year of Election or Appointment: 2014
Trustee
Chairman of the Board of Trustees
Mr. Hogan also serves as Trustee or Vice President of other funds. Mr. Hogan serves as a Director of FMR Investment Management (UK) Limited (investment adviser firm, 2015-present) and Fidelity SelectCo, LLC (investment adviser firm, 2014-present) and President of the Equity Division of FMR (investment adviser firm, 2009-present). Previously, Mr. Hogan served as Senior Vice President, Equity Research of FMR (2006-2009) and as a portfolio manager. Mr. Brian B. Hogan is not related to Mr. Colm A. Hogan.
* Determined to be an "Interested Trustee" by virtue of, among other things, his or her affiliation with the trust or various entities under common control with SelectCo.
+ The information includes the Trustee's principal occupation during the last five years and other information relating to the experience, attributes, and skills relevant to the Trustee's qualifications to serve as a Trustee, which led to the conclusion that the Trustee should serve as a Trustee for the fund.
Independent Trustees:
Correspondence intended for an Independent Trustee may be sent to Fidelity Investments, P.O. Box 55235, Boston, Massachusetts 02205-5235.
Name, Year of Birth; Principal Occupations and Other Relevant Experience+
David A. Rosow (1942)
Year of Election or Appointment: 2013
Trustee
Mr. Rosow also serves as Trustee of other Fidelity® funds. Prior to his retirement in 2006, Mr. Rosow was the Chief Executive Officer, owner and operator of a number of private companies, which encompassed the oil refining, drilling and marketing of petroleum products (including specialty petroleum products), recreation industry, and real estate development. Mr. Rosow currently serves as a Director of Oxbow Carbon LLC (upgraders, marketers, and distributors of petroleum byproducts of the oil refining process, 2015-present) and Oxbridge Academy of the Palm Beaches (2015-present) and serves as its President and CEO. Previously, Mr. Rosow served on the Fairfield Country Day School Board for 27 years, including as its President for 3 years, stepping down in 2006. Mr. Rosow served as Lead Director and Chairman of the Audit Committee of Hudson United Bancorp (1996-2006), Chairman of the Board of Westport Bank and Trust (1992-1996), and as a Director of TD Banknorth (2006-2007). In addition, Mr. Rosow served as a member (2008-2014) and President (2009-2014) of the Town Council of Palm Beach, Florida. Mr. Rosow also served as a Member of the Advisory Board of certain Fidelity® funds (2012-2013).
Garnett A. Smith (1947)
Year of Election or Appointment: 2013
Trustee
Mr. Smith also serves as Trustee of other Fidelity® funds. Prior to Mr. Smith's retirement, he served as Chairman and Chief Executive Officer of Inbrand Corp. (manufacturer of personal absorbent products, 1990-1997). He also served as President (1986-1990) of Inbrand Corp. Prior to his employment with Inbrand Corp., he was employed by a retail fabric chain and North Carolina National Bank. In addition, Mr. Smith served as a Member of the Advisory Board of certain Fidelity® funds (2012-2013) and as a board member of the Jackson Hole Land Trust (2009-2012).
Michael E. Wiley (1950)
Year of Election or Appointment: 2008
Trustee
Chairman of the Independent Trustees
Mr. Wiley also serves as Trustee of other Fidelity® funds. Mr. Wiley serves as a Director of Andeavor Corporation (independent oil refiner and marketer, 2005-present), a Director of Andeavor Logistics LP (natural resources logistics, 2015-present), and a Director of Bill Barrett Corporation (exploration and production, 2005-present). In addition, Mr. Wiley also serves as a Director of Post Oak Bank (privately-held bank, 2004-present). Previously, Mr. Wiley served as a Trustee of other Fidelity® funds (2008-2013), as a Director of Asia Pacific Exploration Consolidated (international oil and gas exploration and production, 2008-2013), as a member of the Board of Trustees of the University of Tulsa (2000-2006; 2007-2010), as a Senior Energy Advisor of Katzenbach Partners, LLC (consulting, 2006-2007), as an Advisory Director of Riverstone Holdings (private investment), Chairman, President, and CEO of Baker Hughes, Inc. (oilfield services, 2000-2004), and as Director of Spinnaker Exploration Company (exploration and production, 2001-2005).
+ The information includes the Trustee's principal occupation during the last five years and other information relating to the experience, attributes, and skills relevant to the Trustee's qualifications to serve as a Trustee, which led to the conclusion that the Trustee should serve as a Trustee for the fund.
Advisory Board Members and Officers:
Correspondence intended for a Member of the Advisory Board (if any) may be sent to Fidelity Investments, P.O. Box 55235, Boston, Massachusetts 02205-5235. Except for Anthony R. Rochte, correspondence intended for an officer may be sent to Fidelity Investments, 245 Summer Street, Boston, Massachusetts 02210. Correspondence intended for Mr. Rochte may be sent to Fidelity SelectCo, LLC (SelectCo), 1225 17th Street, Denver, Colorado 80202-5541. Officers appear below in alphabetical order.
Name, Year of Birth; Principal Occupation
Donald F. Donahue (1950)
Year of Election or Appointment: 2015
Member of the Advisory Board
Mr. Donahue also serves as a Trustee or Member of the Advisory Board of other Fidelity® funds. Mr. Donahue is President and Chief Executive Officer of Miranda Partners, LLC (risk consulting for the financial services industry, 2012-present). Previously, Mr. Donahue served as Chief Executive Officer (2006-2012), Chief Operating Officer (2003-2006), and Managing Director, Customer Marketing and Development (1999-2003) of The Depository Trust & Clearing Corporation (financial markets infrastructure). Mr. Donahue serves as a Member (2007-present) and Co-Chairman (2016-present) of the Board of Directors of United Way of New York, Member of the Board of Directors of NYC Leadership Academy (2012-present) and Member of the Board of Advisors of Ripple Labs, Inc. (financial services, 2015-present). He also served as Chairman (2010-2012) and Member of the Board of Directors (2012-2013) of Omgeo, LLC (financial services), Treasurer of United Way of New York (2012-2016), and Member of the Board of Directors of XBRL US (financial services non-profit, 2009-2012) and the International Securities Services Association (2009-2012).
Carol B. Tomé (1957)
Year of Election or Appointment: 2017
Member of the Advisory Board
Ms. Tomé also serves as Member of the Advisory Board of other Fidelity® funds. Ms. Tomé is Chief Financial Officer (2001-present) and Executive Vice President of Corporate Services (2007-present) of The Home Depot, Inc. (home improvement retailer) and a Director (2003-present) and Chair of the Audit Committee (2004-present) of United Parcel Service, Inc. (package delivery and supply chain management). Previously, Ms. Tomé served as Trustee of certain Fidelity® funds (2017), Senior Vice President of Finance and Accounting/Treasurer (2000-2007) and Vice President and Treasurer (1995-2000) of The Home Depot, Inc. and Chair of the Board (2010-2012), Vice Chair of the Board (2009 and 2013), and a Director (2008-2013) of the Federal Reserve Bank of Atlanta. Ms. Tomé is also a director or trustee of many community and professional organizations.
Elizabeth Paige Baumann (1968)
Year of Election or Appointment: 2017
Anti-Money Laundering (AML) Officer
Ms. Baumann also serves as AML Officer of other funds. She is Chief AML Officer (2012-present) and Senior Vice President (2014-present) of FMR LLC (diversified financial services company) and is an employee of Fidelity Investments. Previously, Ms. Baumann served as AML Officer of the funds (2012-2016), and Vice President (2007-2014) and Deputy Anti-Money Laundering Officer (2007-2012) of FMR LLC.
Marc R. Bryant (1966)
Year of Election or Appointment: 2013
Secretary and Chief Legal Officer (CLO)
Mr. Bryant also serves as Secretary and CLO of other funds. Mr. Bryant serves as CLO, Secretary, and Senior Vice President of Fidelity Management & Research Company (investment adviser firm, 2015-present) and FMR Co., Inc. (investment adviser firm, 2015-present); Secretary of Fidelity SelectCo, LLC (investment adviser firm, 2015-present) and Fidelity Investments Money Management, Inc. (investment adviser firm, 2015-present); and CLO of Fidelity Management & Research (Hong Kong) Limited and FMR Investment Management (UK) Limited (investment adviser firms, 2015-present) and Fidelity Management & Research (Japan) Limited (investment adviser firm, 2016-present). He is Senior Vice President and Deputy General Counsel of FMR LLC (diversified financial services company). Previously, Mr. Bryant served as Secretary and CLO of Fidelity Rutland Square Trust II (2010-2014) and Assistant Secretary of Fidelity's Fixed Income and Asset Allocation Funds (2013-2015). Prior to joining Fidelity Investments, Mr. Bryant served as a Senior Vice President and the Head of Global Retail Legal for AllianceBernstein L.P. (2006-2010), and as the General Counsel for ProFund Advisors LLC (2001-2006).
William C. Coffey (1969)
Year of Election or Appointment: 2009
Assistant Secretary
Mr. Coffey also serves as Assistant Secretary of other funds. He is Senior Vice President and Deputy General Counsel of FMR LLC (diversified financial services company, 2010-present), and is an employee of Fidelity Investments. Previously, Mr. Coffey served as Vice President and Associate General Counsel of FMR LLC (2005-2009).
Jonathan Davis (1968)
Year of Election or Appointment: 2010
Assistant Treasurer
Mr. Davis also serves as Assistant Treasurer of other funds. Mr. Davis serves as Assistant Treasurer of FMR Capital, Inc. (2017-present) and is an employee of Fidelity Investments. Previously, Mr. Davis served as Vice President and Associate General Counsel of FMR LLC (diversified financial services company, 2003-2010).
Adrien E. Deberghes (1967)
Year of Election or Appointment: 2013
President and Treasurer
Mr. Deberghes also serves as an officer of other funds. He serves as Assistant Treasurer of FMR Capital, Inc. (2017-present), Executive Vice President of Fidelity Investments Money Management, Inc. (FIMM) (investment adviser firm, 2016-present), and is an employee of Fidelity Investments (2008-present). Prior to joining Fidelity Investments, Mr. Deberghes was Senior Vice President of Mutual Fund Administration at State Street Corporation (2007-2008), Senior Director of Mutual Fund Administration at Investors Bank & Trust (2005-2007), and Director of Finance for Dunkin' Brands (2000-2005). Previously, Mr. Deberghes served in other fund officer roles.
Joseph DeSantis (1959)
Year of Election or Appointment: 2015
Vice President
Mr. DeSantis also serves as Vice President of other funds. Mr. DeSantis serves as a Director of Fidelity Management & Research (Japan) Limited (investment adviser firm, 2016-present), Chief Investment Officer, Equities (2010-present) and is an employee of Fidelity Investments.
Stephanie J. Dorsey (1969)
Year of Election or Appointment: 2010
Assistant Treasurer
Ms. Dorsey also serves as an officer of other funds. Ms. Dorsey serves as Assistant Treasurer of FMR Capital, Inc. (2017-present), is an employee of Fidelity Investments (2008-present), and has served in other fund officer roles. Prior to joining Fidelity Investments, Ms. Dorsey served as Treasurer (2004-2008) of the JPMorgan Mutual Funds and Vice President (2004-2008) of JPMorgan Chase Bank.
Howard J. Galligan III (1966)
Year of Election or Appointment: 2014
Chief Financial Officer
Mr. Galligan also serves as Chief Financial Officer of other funds. Mr. Galligan serves as President of Fidelity Pricing and Cash Management Services (FPCMS) (2014-present) and as a Director of Strategic Advisers, Inc. (investment adviser firm, 2008-present). Previously, Mr. Galligan served as Chief Administrative Officer of Asset Management (2011-2014) and Chief Operating Officer and Senior Vice President of Investment Support for Strategic Advisers, Inc. (2003-2011).
James D. Gryglewicz (1972)
Year of Election or Appointment: 2014
Chief Compliance Officer
Mr. Gryglewicz also serves as Chief Compliance Officer of other funds. Mr. Gryglewicz serves as Compliance Officer of Strategic Advisers, Inc. (investment adviser firm, 2015-present) and Fidelity SelectCo, LLC (investment adviser firm, 2014-present), Senior Vice President of Asset Management Compliance (2009-present), and is an employee of Fidelity Investments (2004-present).
Brian B. Hogan (1964)
Year of Election or Appointment: 2009
Vice President
Mr. Hogan also serves as Trustee or Vice President of other funds. Mr. Hogan serves as a Director of FMR Investment Management (UK) Limited (investment adviser firm, 2015-present) and Fidelity SelectCo, LLC (investment adviser firm, 2014-present) and President of the Equity Division of FMR (investment adviser firm, 2009-present). Previously, Mr. Hogan served as Senior Vice President, Equity Research of FMR (2006-2009) and as a portfolio manager. Mr. Brian B. Hogan is not related to Mr. Colm A. Hogan.
Colm A. Hogan (1973)
Year of Election or Appointment: 2016
Assistant Treasurer
Mr. Hogan also serves as an officer of other funds. Mr. Hogan serves as Assistant Treasurer of FMR Capital, Inc. (2017-present) and is an employee of Fidelity Investments (2005-present). Mr. Colm A. Hogan is not related to Mr. Brian B. Hogan.
Chris Maher (1972)
Year of Election or Appointment: 2013
Assistant Treasurer
Mr. Maher serves as Assistant Treasurer of other funds. Mr. Maher is Vice President of Valuation Oversight, serves as Assistant Treasurer of FMR Capital, Inc. (2017-present), and is an employee of Fidelity Investments. Previously, Mr. Maher served as Vice President of Asset Management Compliance (2013), Vice President of the Program Management Group of FMR (investment adviser firm, 2010-2013), and Vice President of Valuation Oversight (2008-2010).
Rieco E. Mello (1969)
Year of Election or Appointment: 2017
Assistant Treasurer
Mr. Mello also serves as Assistant Treasurer of other funds. Mr. Mello serves as Assistant Treasurer of FMR Capital, Inc. (2017-present) and is an employee of Fidelity Investments (1995-present).
Anthony R. Rochte (1968)
Year of Election or Appointment: 2013
Vice President
Mr. Rochte also serves as Vice President of other funds. Mr. Rochte serves as President of Fidelity SelectCo, LLC (investment adviser firm, 2012-present) and is an employee of Fidelity Investments (2012-present). Prior to joining Fidelity Investments, Mr. Rochte served as Senior Managing Director and head of State Street Global Advisors' North American Intermediary Business Group (2006-2012).
Stacie M. Smith (1974)
Year of Election or Appointment: 2013
Assistant Treasurer
Ms. Smith also serves as an officer of other funds. Ms. Smith serves as Assistant Treasurer of FMR Capital, Inc. (2017-present), is an employee of Fidelity Investments (2009-present), and has served in other fund officer roles. Prior to joining Fidelity Investments, Ms. Smith served as Senior Audit Manager of Ernst & Young LLP (accounting firm, 1996-2009). Previously, Ms. Smith served as Deputy Treasurer of certain Fidelity® funds (2013-2016).
Marc L. Spector (1972)
Year of Election or Appointment: 2017
Assistant Treasurer
Mr. Spector also serves as an officer of other funds. Mr. Spector serves as Assistant Treasurer of FMR Capital, Inc. (2017-present) and is an employee of Fidelity Investments (2016-present). Prior to joining Fidelity Investments, Mr. Spector served as Director at the Siegfried Group (accounting firm, 2013-2016), and prior to Siegfried Group as audit senior manager at Deloitte & Touche (accounting firm, 2005-2013).
Renee Stagnone (1975)
Year of Election or Appointment: 2016
Assistant Treasurer
Ms. Stagnone also serves as an officer of other funds. Ms. Stagnone serves as Assistant Treasurer of FMR Capital, Inc. (2017-present) and is an employee of Fidelity Investments (1997-present). Previously, Ms. Stagnone served as Deputy Treasurer of certain Fidelity® funds (2013-2016).
Shareholder Expense Example
As a shareholder of the Fund, you incur two types of costs: (1) transaction costs, including redemption fees and (2) ongoing costs, including management fees and other Fund expenses. This Example is intended to help you understand your ongoing costs (in dollars) of investing in the Fund and to compare these costs with the ongoing costs of investing in other mutual funds.
The Example is based on an investment of $1,000 invested at the beginning of the period and held for the entire period (July 1, 2017 to December 31, 2017).
Actual Expenses
The first line of the accompanying table for each class of the Fund provides information about actual account values and actual expenses. You may use the information in this line, together with the amount you invested, to estimate the expenses that you paid over the period. Simply divide your account value by $1,000.00 (for example, an $8,600 account value divided by $1,000.00 = 8.6), then multiply the result by the number in the first line for a class of the Fund under the heading entitled "Expenses Paid During Period" to estimate the expenses you paid on your account during this period. The estimate of expenses does not include any fees or other expenses of any variable annuity or variable life insurance product. If they were, the estimate of expenses you paid during the period would be higher, and your ending account value would be lower. In addition, the Fund, as a shareholder in the underlying Fidelity Central Funds, will indirectly bear its pro-rata share of the fees and expenses incurred by the underlying Fidelity Central Funds. These fees and expenses are not included in the Fund's annualized expense ratio used to calculate the expense estimate in the table below.
Hypothetical Example for Comparison Purposes
The second line of the accompanying table for each class of the Fund provides information about hypothetical account values and hypothetical expenses based on a Class' actual expense ratio and an assumed rate of return of 5% per year before expenses, which is not the Class' actual return. The hypothetical account values and expenses may not be used to estimate the actual ending account balance or expenses you paid for the period. You may use this information to compare the ongoing costs of investing in the Fund and other funds. To do so, compare this 5% hypothetical example with the 5% hypothetical examples that appear in the shareholder reports of the other funds. The estimate of expenses does not include any fees or other expenses of any variable annuity or variable life insurance product. If they were, the estimate of expenses you paid during the period would be higher, and your ending account value would be lower. In addition, the Fund, as a shareholder in the underlying Fidelity Central Funds, will indirectly bear its pro-rata share of the fees and expenses incurred by the underlying Fidelity Central Funds. These fees and expenses are not included in the Fund's annualized expense ratio used to calculate the expense estimate in the table below.
Please note that the expenses shown in the table are meant to highlight your ongoing costs only and do not reflect any transaction costs. Therefore, the second line of the table is useful in comparing ongoing costs only, and will not help you determine the relative total costs of owning different funds. In addition, if these transactional costs were included, your costs would have been higher.
| | Annualized Expense Ratio-A | Beginning
Account Value
July 1, 2017 | Ending
Account Value
December 31, 2017 | Expenses Paid
During Period-B
July 1, 2017
to December 31, 2017 |
| Initial Class | .68% | | | |
| Actual | | $1,000.00 | $1,176.30 | $3.73 |
| Hypothetical-C | | $1,000.00 | $1,021.78 | $3.47 |
| Investor Class | .76% | | | |
| Actual | | $1,000.00 | $1,175.80 | $4.17 |
| Hypothetical-C | | $1,000.00 | $1,021.37 | $3.87 |
A Annualized expense ratio reflects expenses net of applicable fee waivers.
B Expenses are equal to each Class' annualized expense ratio, multiplied by the average account value over the period, multiplied by 184/365 (to reflect the one-half year period).
C 5% return per year before expenses
Distributions (Unaudited)
The Board of Trustees of VIP Technology Portfolio voted to pay to shareholders of record at the opening of business on record date, the following distributions per share derived from capital gains realized from sales of portfolio securities:
| | Pay Date | Record Date | Capital Gains |
| VIP Technology Portfolio | | | |
| Initial Class | 02/09/2018 | 02/09/2018 | $1.304 |
| Investor Class | 02/09/2018 | 02/09/2018 | $1.302 |
|
The fund hereby designates as a capital gain dividend with respect to the taxable year ended December 31, 2017, $36,072,202, or, if subsequently determined to be different, the net capital gain of such year.
Initial Class designates 43%, and 9%; Investor Class designates 52%, and 9% of the dividends distributed in February and December, respectively during the fiscal year as qualifying for the dividends–received deduction for corporate shareholders.
Proxy Voting Results
A special meeting of shareholders was held on December 8, 2017. The results of votes taken among shareholders on the proposals before them are reported below. Each vote reported represents one dollar of net asset value held on the record date for the meeting.
PROPOSAL 1
To elect a Board of Trustees.
| | # of
Votes | % of
Votes |
| James C. Curvey |
| Affirmative | 3,005,845,657.89 | 94.803 |
| Withheld | 164,788,708.80 | 5.197 |
| TOTAL | 3,170,634,366.69 | 100.000 |
| Dennis J. Dirks |
| Affirmative | 3,025,050,303.47 | 95.409 |
| Withheld | 145,584,063.22 | 4.591 |
| TOTAL | 3,170,634,366.69 | 100.000 |
| Donald F. Donahue |
| Affirmative | 3,024,923,660.98 | 95.405 |
| Withheld | 145,710,705.71 | 4.595 |
| TOTAL | 3,170,634,366.69 | 100.000 |
| Alan J. Lacy |
| Affirmative | 3,024,272,946.71 | 95.384 |
| Withheld | 146,361,419.98 | 4.616 |
| TOTAL | 3,170,634,366.69 | 100.00 |
| Ned C. Lautenbach |
| Affirmative | 3,011,847,006.14 | 94.992 |
| Withheld | 158,787,360.55 | 5.008 |
| TOTAL | 3,170,634,366.69 | 100.000 |
| Joseph Mauriello |
| Affirmative | 3,021,074,746.00 | 95.283 |
| Withheld | 149,559,620.69 | 4.717 |
| TOTAL | 3,170,634,366.69 | 100.000 |
| Charles S. Morrison |
| Affirmative | 3,025,083,795.43 | 95.410 |
| Withheld | 145,550,571.26 | 4.590 |
| TOTAL | 3,170,634,366.69 | 100.000 |
| Cornelia M. Small |
| Affirmative | 3,016,566,905.34 | 95.141 |
| Withheld | 154,067,461.35 | 4.859 |
| TOTAL | 3,170,634,366.69 | 100.000 |
| Garnett A. Smith |
| Affirmative | 3,014,927,605.85 | 95.090 |
| Withheld | 155,706,760.84 | 4.910 |
| TOTAL | 3,170,634,366.69 | 100.000 |
| David M. Thomas |
| Affirmative | 3,025,900,428.75 | 95.436 |
| Withheld | 144,733,937.94 | 4.564 |
| TOTAL | 3,170,634,366.69 | 100.000 |
| Michael E. Wiley |
| Affirmative | 3,023,436,110.39 | 95.358 |
| Withheld | 147,198,256.30 | 4.642 |
| TOTAL | 3,170,634,366.69 | 100.000 |
PROPOSAL 2
To eliminate a fundamental investment policy.
| | # of
Votes | % of
Votes |
| Affirmative | 528,991,647.48 | 82.654 |
| Against | 65,007,609.51 | 10.158 |
| Abstain | 46,009,769.38 | 7.188 |
| TOTAL | 640,009,026.37 | 100.000 |
PROPOSAL 3
To modify the fund's fundamental concentration policy.
| | # of
Votes | % of
Votes |
| Affirmative | 548,213,949.11 | 85.658 |
| Against | 50,318,460.15 | 7.862 |
| Abstain | 41,476,617.11 | 6.480 |
| TOTAL | 640,009,026.37 | 100.000 |
|
| Proposal 1 reflects trust wide proposal and voting results. |

VTECIC-ANN-0218
1.817385.112
Fidelity® Variable Insurance Products: Energy Portfolio
Annual Report December 31, 2017 |
|
Contents
To view a fund's proxy voting guidelines and proxy voting record for the 12-month period ended June 30, visit http://www.fidelity.com/proxyvotingresults or visit the Securities and Exchange Commission's (SEC) web site at http://www.sec.gov.
You may also call 1-877-208-0098 to request a free copy of the proxy voting guidelines.
Fidelity® Variable Insurance Products are separate account options which are purchased through a variable insurance contract.
Standard & Poor's, S&P and S&P 500 are registered service marks of The McGraw-Hill Companies, Inc. and have been licensed for use by Fidelity Distributors Corporation.
Other third-party marks appearing herein are the property of their respective owners.
All other marks appearing herein are registered or unregistered trademarks or service marks of FMR LLC or an affiliated company. © 2018 FMR LLC. All rights reserved.
This report and the financial statements contained herein are submitted for the general information of the shareholders of the Fund. This report is not authorized for distribution to prospective investors in the Fund unless preceded or accompanied by an effective prospectus.
A fund files its complete schedule of portfolio holdings with the SEC for the first and third quarters of each fiscal year on Form N-Q. Forms N-Q are available on the SEC’s web site at http://www.sec.gov. A fund's Forms N-Q may be reviewed and copied at the SEC’s Public Reference Room in Washington, DC. Information regarding the operation of the SEC's Public Reference Room may be obtained by calling 1-800-SEC-0330.
For a complete list of a fund's portfolio holdings, view the most recent holdings listing, semiannual report, or annual report on Fidelity's web site at http://www.fidelity.com, http://www.institutional.fidelity.com, or http://www.401k.com, as applicable.
NOT FDIC INSURED •MAY LOSE VALUE •NO BANK GUARANTEE
Neither the Fund nor Fidelity Distributors Corporation is a bank.
Performance: The Bottom Line
Average annual total return reflects the change in the value of an investment, assuming reinvestment of distributions from dividend income and capital gains (the profits earned upon the sale of securities that have grown in value, if any) and assuming a constant rate of performance each year. During periods of reimbursement by Fidelity, a fund’s total return will be greater than it would be had the reimbursement not occurred. Performance numbers are net of all underlying fund operating expenses, but do not include any insurance charges imposed by your insurance company’s separate account. If performance information included the effect of these additional charges, the total returns would have been lower. How a fund did yesterday is no guarantee of how it will do tomorrow.
Average Annual Total Returns
| For the periods ended December 31, 2017 | Past 1 year | Past 5 years | Past 10 years |
| Initial Class | (2.47)% | 2.46% | (0.94)% |
| Service Class 2 | (2.78)% | 2.19% | (1.19)% |
| Investor Class | (2.57)% | 2.38% | (1.03)% |
$10,000 Over 10 Years
Let's say hypothetically that $10,000 was invested in VIP Energy Portfolio - Initial Class on December 31, 2007.
The chart shows how the value of your investment would have changed, and also shows how the S&P 500® Index performed over the same period.

| Period Ending Values |
| $9,095 | VIP Energy Portfolio - Initial Class |
| $22,603 | S&P 500® Index |
Management's Discussion of Fund Performance
Market Recap: U.S. equities gained 21.83% in 2017, as the S&P 500
® index rose steadily and closed the year just shy of an all-time high after a particularly strong three-month finish. Early on, equities rallied on optimism for President Trump’s pro-business agenda but leveled off in March amid fading optimism and stalled efforts by Congress to repeal and replace the Affordable Care Act. Upward momentum soon returned and continued through year-end with consumer sentiment and other market indicators staying positive. The lone exception was a brief cooldown in August, when geopolitical tension escalated and uncertainty grew regarding the future of health care, tax reform and the debt ceiling. Sector-wise, information technology fared best by a wide margin, rising 39% amid strong earnings growth from several major index constituents. A 24% gain in materials was spurred by increased demand, especially from China. Consumer discretionary gained 23%, despite many brick-and-mortar retailers suffering from online competition, and financials edged the broader market on an uptick in bond yields. Conversely, the defensive energy and telecom services sectors returned about -1% each. Rising interest rates held back real estate (+11%), while consumer staples (+13%) and utilities (+12%) struggled due to investors’ general preference for risk assets.
Comments from Portfolio Manager John Dowd: For the year, the fund’s share classes returned about -2% to -3%, roughly in line with the -2.33% return of the MSCI U.S. IMI Energy 25/50 Index and significantly trailing the broad-market S&P 500
® index. Versus the MSCI sector index, notable contributors included Portfolio Manager John Dowd’s stock picks in the three largest industry groups – integrated oil & gas, oil & gas exploration & production (E&P), and oil & gas equipment & services. Conversely, industry positioning detracted from relative results, especially an overweighting in lagging E&Ps and an underweighting in better-performing integrated oil & gas companies. Among individual stocks, our largest individual relative detractor was the fund's sizable underexposure to integrated oil & gas company Chevron, which performed well due to the completion of several projects and recognition for its capital-spending discipline. Chevron was among our biggest holdings on an absolute basis, but our position was roughly half of the 14% it represented in the sector index the past year. The fund’s largest contributor was a sizable stake in E&P Diamondback Energy, which was rewarded largely for reporting surprisingly strong earnings. Picks in oil & gas storage & transportation and an out-of-benchmark stake in the commodity chemicals industry also helped the fund's relative result. The fund's second-biggest individual contributor was an underweighting in offshore oil-services provider Schlumberger, which declined in large part due to the company's sizable exposure to international drillers, which were generally viewed as more cash-constrained than some U.S. shale-focused competitors.
The views expressed above reflect those of the portfolio manager(s) only through the end of the period as stated on the cover of this report and do not necessarily represent the views of Fidelity or any other person in the Fidelity organization. Any such views are subject to change at any time based upon market or other conditions and Fidelity disclaims any responsibility to update such views. These views may not be relied on as investment advice and, because investment decisions for a Fidelity fund are based on numerous factors, may not be relied on as an indication of trading intent on behalf of any Fidelity fund.
Note to shareholders: On December 8, 2017, shareholders approved proposals from the Board of Trustees to eliminate each sector/industry fund's fundamental “invests primarily” policy and to modify the fundamental concentration policy for certain funds. The changes took effect on January 1, 2018, and do not impact how the funds are managed.
Investment Summary (Unaudited)
Top Ten Stocks as of December 31, 2017
| | % of fund's net assets |
| EOG Resources, Inc. | 7.4 |
| Chevron Corp. | 6.9 |
| Diamondback Energy, Inc. | 6.0 |
| Halliburton Co. | 5.6 |
| Exxon Mobil Corp. | 4.4 |
| Pioneer Natural Resources Co. | 4.4 |
| Phillips 66 Co. | 3.4 |
| Encana Corp. | 3.1 |
| RSP Permian, Inc. | 3.0 |
| Devon Energy Corp. | 2.6 |
| | 46.8 |
Top Industries (% of fund's net assets)
| As of December 31, 2017 |
| | Oil, Gas & Consumable Fuels | 81.1% |
| | Energy Equipment & Services | 14.8% |
| | Chemicals | 1.9% |
| | Machinery | 0.5% |
| | Gas Utilities | 0.5% |
| | All Others* | 1.2% |

* Includes short-term investments and net other assets (liabilities).
Investments December 31, 2017
Showing Percentage of Net Assets
| Common Stocks - 99.0% | | | |
| | | Shares | Value |
| Chemicals - 1.9% | | | |
| Commodity Chemicals - 1.9% | | | |
| LG Chemical Ltd. | | 2,136 | $810,474 |
| LyondellBasell Industries NV Class A | | 43,100 | 4,754,792 |
| | | | 5,565,266 |
| Energy Equipment & Services - 14.8% | | | |
| Oil & Gas Drilling - 2.2% | | | |
| Nabors Industries Ltd. | | 343,412 | 2,345,504 |
| Odfjell Drilling Ltd. (a) | | 203,250 | 903,542 |
| Shelf Drilling Ltd. (b) | | 266,300 | 2,108,189 |
| Trinidad Drilling Ltd. (a) | | 287,900 | 389,364 |
| Xtreme Drilling & Coil Services Corp. (a) | | 317,600 | 568,496 |
| | | | 6,315,095 |
| Oil & Gas Equipment & Services - 12.6% | | | |
| Baker Hughes, a GE Co. Class A | | 174,400 | 5,518,016 |
| C&J Energy Services, Inc. | | 15,000 | 502,050 |
| Dril-Quip, Inc. (a) | | 46,144 | 2,201,069 |
| Frank's International NV | | 123,500 | 821,275 |
| Halliburton Co. | | 335,400 | 16,390,998 |
| NCS Multistage Holdings, Inc. | | 86,300 | 1,272,062 |
| Newpark Resources, Inc. (a) | | 242,400 | 2,084,640 |
| Oceaneering International, Inc. | | 80,149 | 1,694,350 |
| RigNet, Inc. (a) | | 86,200 | 1,288,690 |
| Schlumberger Ltd. | | 62,509 | 4,212,482 |
| Smart Sand, Inc. (a)(c) | | 35,500 | 307,430 |
| TETRA Technologies, Inc. (a) | | 134,800 | 575,596 |
| Total Energy Services, Inc. | | 13,800 | 163,141 |
| | | | 37,031,799 |
|
| TOTAL ENERGY EQUIPMENT & SERVICES | | | 43,346,894 |
|
| Gas Utilities - 0.5% | | | |
| Gas Utilities - 0.5% | | | |
| Indraprastha Gas Ltd. | | 269,645 | 1,418,339 |
| Machinery - 0.5% | | | |
| Industrial Machinery - 0.5% | | | |
| ProPetro Holding Corp. | | 82,200 | 1,657,152 |
| Oil, Gas & Consumable Fuels - 81.1% | | | |
| Integrated Oil & Gas - 14.5% | | | |
| Chevron Corp. | | 160,531 | 20,096,876 |
| Exxon Mobil Corp. | | 155,748 | 13,026,763 |
| Occidental Petroleum Corp. | | 78,800 | 5,804,408 |
| Suncor Energy, Inc. | | 93,100 | 3,418,111 |
| | | | 42,346,158 |
| Oil & Gas Exploration & Production - 51.7% | | | |
| Anadarko Petroleum Corp. | | 70,734 | 3,794,172 |
| Cabot Oil & Gas Corp. | | 215,600 | 6,166,160 |
| Callon Petroleum Co. (a)(c) | | 366,500 | 4,452,975 |
| Centennial Resource Development, Inc.: | | | |
| Class A (a) | | 14,400 | 285,120 |
| Class A (a) | | 118,600 | 2,348,280 |
| Cimarex Energy Co. | | 57,787 | 7,050,592 |
| Concho Resources, Inc. (a) | | 41,400 | 6,219,108 |
| ConocoPhillips Co. | | 52,800 | 2,898,192 |
| Continental Resources, Inc. (a) | | 130,100 | 6,891,397 |
| Devon Energy Corp. | | 187,200 | 7,750,080 |
| Diamondback Energy, Inc. (a) | | 138,500 | 17,485,625 |
| Encana Corp. | | 685,400 | 9,144,119 |
| EOG Resources, Inc. | | 199,542 | 21,532,578 |
| Extraction Oil & Gas, Inc. (a)(c) | | 159,995 | 2,289,528 |
| Hess Corp. | | 35,400 | 1,680,438 |
| Jagged Peak Energy, Inc. (c) | | 21,800 | 344,004 |
| Lilis Energy, Inc. (a)(c) | | 91,369 | 466,896 |
| Marathon Oil Corp. | | 64,200 | 1,086,906 |
| Murphy Oil Corp. | | 24,300 | 754,515 |
| Newfield Exploration Co. (a) | | 199,700 | 6,296,541 |
| Parsley Energy, Inc. Class A (a) | | 258,430 | 7,608,179 |
| PDC Energy, Inc. (a) | | 64,434 | 3,320,928 |
| Pioneer Natural Resources Co. | | 74,465 | 12,871,275 |
| PrairieSky Royalty Ltd. | | 27,000 | 688,640 |
| Range Resources Corp. | | 27,900 | 475,974 |
| Ring Energy, Inc. (a) | | 79,900 | 1,110,610 |
| RSP Permian, Inc. (a) | | 219,300 | 8,921,124 |
| Viper Energy Partners LP | | 168,200 | 3,924,106 |
| WPX Energy, Inc. (a) | | 250,800 | 3,528,756 |
| | | | 151,386,818 |
| Oil & Gas Refining & Marketing - 7.3% | | | |
| Andeavor | | 23,900 | 2,732,726 |
| Delek U.S. Holdings, Inc. | | 200,977 | 7,022,136 |
| Phillips 66 Co. | | 97,462 | 9,858,281 |
| Reliance Industries Ltd. | | 124,886 | 1,801,790 |
| | | | 21,414,933 |
| Oil & Gas Storage & Transport - 7.6% | | | |
| Cheniere Energy, Inc. (a) | | 49,900 | 2,686,616 |
| Enterprise Products Partners LP | | 118,600 | 3,144,086 |
| GasLog Partners LP | | 36,900 | 913,275 |
| Gener8 Maritime, Inc. (a) | | 346,286 | 2,292,413 |
| Golar LNG Ltd. (c) | | 62,200 | 1,854,182 |
| Noble Midstream Partners LP | | 38,800 | 1,940,000 |
| Noble Midstream Partners LP (d) | | 14,739 | 736,950 |
| Plains GP Holdings LP Class A | | 28,200 | 618,990 |
| Teekay LNG Partners LP | | 20,900 | 421,135 |
| The Williams Companies, Inc. | | 253,700 | 7,735,313 |
| | | | 22,342,960 |
|
| TOTAL OIL, GAS & CONSUMABLE FUELS | | | 237,490,869 |
|
| Semiconductors & Semiconductor Equipment - 0.2% | | | |
| Semiconductor Equipment - 0.2% | | | |
| SolarEdge Technologies, Inc. (a) | | 18,400 | 690,920 |
| TOTAL COMMON STOCKS | | | |
| (Cost $235,685,005) | | | 290,169,440 |
|
| Money Market Funds - 2.8% | | | |
| Fidelity Cash Central Fund, 1.36% (e) | | 3,721,112 | 3,721,856 |
| Fidelity Securities Lending Cash Central Fund 1.36% (e)(f) | | 4,371,363 | 4,372,238 |
| TOTAL MONEY MARKET FUNDS | | | |
| (Cost $8,093,656) | | | 8,094,094 |
| TOTAL INVESTMENT IN SECURITIES - 101.8% | | | |
| (Cost $243,778,661) | | | 298,263,534 |
| NET OTHER ASSETS (LIABILITIES) - (1.8)% | | | (5,338,026) |
| NET ASSETS - 100% | | | $292,925,508 |
Legend
(a) Non-income producing
(b) Security exempt from registration under Rule 144A of the Securities Act of 1933. These securities may be resold in transactions exempt from registration, normally to qualified institutional buyers. At the end of the period, the value of these securities amounted to $2,108,189 or 0.7% of net assets.
(c) Security or a portion of the security is on loan at period end.
(d) Restricted securities - Investment in securities not registered under the Securities Act of 1933 (excluding 144A issues). At the end of the period, the value of restricted securities (excluding 144A issues) amounted to $736,950 or 0.3% of net assets.
(e) Affiliated fund that is generally available only to investment companies and other accounts managed by Fidelity Investments. The rate quoted is the annualized seven-day yield of the fund at period end. A complete unaudited listing of the fund's holdings as of its most recent quarter end is available upon request. In addition, each Fidelity Central Fund's financial statements, which are not covered by the Fund's Report of Independent Registered Public Accounting Firm, are available on the SEC's website or upon request.
(f) Investment made with cash collateral received from securities on loan.
Additional information on each restricted holding is as follows:
| Security | Acquisition Date | Acquisition Cost |
| Noble Midstream Partners LP | 6/21/17 | $596,193 |
Affiliated Central Funds
Information regarding fiscal year to date income earned by the Fund from investments in Fidelity Central Funds is as follows:
| Fund | Income earned |
| Fidelity Cash Central Fund | $17,482 |
| Fidelity Securities Lending Cash Central Fund | 49,366 |
| Total | $66,848 |
Amounts in the income column in the above table include any capital gain distributions from underlying funds, which are presented in the corresponding line-item in the Statement of Operations if applicable.
Investment Valuation
All investments are categorized as Level 1 under the Fair Value Hierarchy. The inputs or methodology used for valuing securities may not be an indication of the risk associated with investing in those securities. For more information on valuation inputs please refer to the Investment Valuation section in the accompanying Notes to Financial Statements.
Other Information
Distribution of investments by country or territory of incorporation, as a percentage of Total Net Assets, is as follows (Unaudited):
| United States of America | 86.7% |
| Canada | 5.0% |
| Netherlands | 1.9% |
| Bermuda | 1.7% |
| Curacao | 1.4% |
| Marshall Islands | 1.2% |
| India | 1.1% |
| Others (Individually Less Than 1%) | 1.0% |
| | 100.0% |
See accompanying notes which are an integral part of the financial statements.
Financial Statements
Statement of Assets and Liabilities
| | | December 31, 2017 |
| Assets | | |
Investment in securities, at value (including securities loaned of $4,208,203) — See accompanying schedule:
Unaffiliated issuers (cost $235,685,005) | $290,169,440 | |
| Fidelity Central Funds (cost $8,093,656) | 8,094,094 | |
| Total Investment in Securities (cost $243,778,661) | | $298,263,534 |
| Cash | | 62,040 |
| Foreign currency held at value (cost $284,636) | | 288,269 |
| Receivable for fund shares sold | | 77,074 |
| Dividends receivable | | 124,919 |
| Distributions receivable from Fidelity Central Funds | | 4,173 |
| Prepaid expenses | | 1,276 |
| Other receivables | | 4,088 |
| Total assets | | 298,825,373 |
| Liabilities | | |
| Payable for fund shares redeemed | $1,201,260 | |
| Accrued management fee | 126,044 | |
| Distribution and service plan fees payable | 25,414 | |
| Other affiliated payables | 32,286 | |
| Other payables and accrued expenses | 144,715 | |
| Collateral on securities loaned | 4,370,146 | |
| Total liabilities | | 5,899,865 |
| Net Assets | | $292,925,508 |
| Net Assets consist of: | | |
| Paid in capital | | $299,262,734 |
| Undistributed net investment income | | 175,240 |
| Accumulated undistributed net realized gain (loss) on investments and foreign currency transactions | | (60,906,225) |
| Net unrealized appreciation (depreciation) on investments and assets and liabilities in foreign currencies | | 54,393,759 |
| Net Assets | | $292,925,508 |
| Initial Class: | | |
| Net Asset Value, offering price and redemption price per share ($43,632,906 ÷ 2,197,444 shares) | | $19.86 |
| Service Class 2: | | |
| Net Asset Value, offering price and redemption price per share ($128,346,158 ÷ 6,497,520 shares) | | $19.75 |
| Investor Class: | | |
| Net Asset Value, offering price and redemption price per share ($120,946,444 ÷ 6,103,593 shares) | | $19.82 |
See accompanying notes which are an integral part of the financial statements.
Statement of Operations
| | | Year ended December 31, 2017 |
| Investment Income | | |
| Dividends | | $3,787,829 |
| Special dividends | | 3,297,000 |
| Income from Fidelity Central Funds | | 66,848 |
| Total income | | 7,151,677 |
| Expenses | | |
| Management fee | $1,624,621 | |
| Transfer agent fees | 299,788 | |
| Distribution and service plan fees | 311,536 | |
| Accounting and security lending fees | 117,306 | |
| Custodian fees and expenses | 24,107 | |
| Independent trustees' fees and expenses | 7,066 | |
| Audit | 46,238 | |
| Legal | 6,131 | |
| Miscellaneous | 17,256 | |
| Total expenses before reductions | 2,454,049 | |
| Expense reductions | (31,460) | 2,422,589 |
| Net investment income (loss) | | 4,729,088 |
| Realized and Unrealized Gain (Loss) | | |
| Net realized gain (loss) on: | | |
| Investment securities: | | |
| Unaffiliated issuers (net of foreign taxes of $10,879) | 882,644 | |
| Fidelity Central Funds | 1,296 | |
| Foreign currency transactions | (6,748) | |
| Total net realized gain (loss) | | 877,192 |
| Change in net unrealized appreciation (depreciation) on: | | |
| Unaffiliated issuers (net of increase in deferred foreign taxes of $88,476) | (21,652,741) | |
| Fidelity Central Funds | (322) | |
| Assets and liabilities in foreign currencies | 4,564 | |
| Total change in net unrealized appreciation (depreciation) | | (21,648,499) |
| Net gain (loss) | | (20,771,307) |
| Net increase (decrease) in net assets resulting from operations | | $(16,042,219) |
See accompanying notes which are an integral part of the financial statements.
Statement of Changes in Net Assets
| | Year ended December 31, 2017 | Year ended December 31, 2016 |
| Increase (Decrease) in Net Assets | | |
| Operations | | |
| Net investment income (loss) | $4,729,088 | $1,701,182 |
| Net realized gain (loss) | 877,192 | (19,348,956) |
| Change in net unrealized appreciation (depreciation) | (21,648,499) | 103,566,867 |
| Net increase (decrease) in net assets resulting from operations | (16,042,219) | 85,919,093 |
| Distributions to shareholders from net investment income | (4,314,006) | (1,879,963) |
| Distributions to shareholders from net realized gain | (148,102) | – |
| Total distributions | (4,462,108) | (1,879,963) |
| Share transactions - net increase (decrease) | (63,570,468) | 50,287,637 |
| Redemption fees | 66,399 | 52,216 |
| Total increase (decrease) in net assets | (84,008,396) | 134,378,983 |
| Net Assets | | |
| Beginning of period | 376,933,904 | 242,554,921 |
| End of period | $292,925,508 | $376,933,904 |
| Other Information | | |
| Undistributed net investment income end of period | $175,240 | $– |
| Distributions in excess of net investment income end of period | $– | $(121,713) |
See accompanying notes which are an integral part of the financial statements.
Financial Highlights
VIP Energy Portfolio Initial Class
| Years ended December 31, | 2017 | 2016 | 2015 | 2014 | 2013 |
| Selected Per–Share Data | | | | | |
| Net asset value, beginning of period | $20.72 | $15.57 | $20.45 | $23.95 | $19.53 |
| Income from Investment Operations | | | | | |
| Net investment income (loss)A | .32B | .13 | .24 | .22 | .20 |
| Net realized and unrealized gain (loss) | (.85) | 5.14 | (4.30) | (3.23) | 4.58 |
| Total from investment operations | (.53) | 5.27 | (4.06) | (3.01) | 4.78 |
| Distributions from net investment income | (.32) | (.12) | (.23) | (.23) | (.22) |
| Distributions from net realized gain | (.01) | – | (.60) | (.28) | (.14) |
| Total distributions | (.33) | (.12) | (.83) | (.50)C | (.36) |
| Redemption fees added to paid in capitalA | –D | –D | .01 | .01 | –D |
| Net asset value, end of period | $19.86 | $20.72 | $15.57 | $20.45 | $23.95 |
| Total ReturnE,F | (2.47)% | 33.84% | (20.54)% | (12.59)% | 24.55% |
| Ratios to Average Net AssetsG,H | | | | | |
| Expenses before reductions | .69% | .68% | .68% | .68% | .70% |
| Expenses net of fee waivers, if any | .68% | .68% | .68% | .67% | .69% |
| Expenses net of all reductions | .67% | .67% | .67% | .67% | .69% |
| Net investment income (loss) | 1.73%B | .71% | 1.25% | .91% | .88% |
| Supplemental Data | | | | | |
| Net assets, end of period (000 omitted) | $43,633 | $63,955 | $46,360 | $70,828 | $94,202 |
| Portfolio turnover rateI | 66% | 87% | 70% | 99% | 90% |
A Calculated based on average shares outstanding during the period.
B Net Investment income per share reflects a large, non-recurring dividend which amounted to $.21 per share. Excluding this non-recurring dividend, the ratio of net investment income (loss) to average net assets would have been .62%.
C Total distributions of $.50 per share is comprised of distributions from net investment income of $.227 and distributions from net realized gain of $.273 per share.
D Amount represents less than $.005 per share.
E Total returns do not reflect charges attributable to your insurance company's separate account. Inclusion of these charges would reduce the total returns shown.
F Total returns would have been lower if certain expenses had not been reduced during the applicable periods shown.
G Fees and expenses of any underlying Fidelity Central Funds are not included in the Fund's expense ratio. The Fund indirectly bears its proportionate share of the expenses of any underlying Fidelity Central Funds.
H Expense ratios reflect operating expenses of the class. Expenses before reductions do not reflect amounts reimbursed by the investment adviser or reductions from brokerage service arrangements or reductions from other expense offset arrangements and do not represent the amount paid by the class during periods when reimbursements or reductions occur. Expenses net of fee waivers reflect expenses after reimbursement by the investment adviser but prior to reductions from brokerage service arrangements or other expense offset arrangements. Expenses net of all reductions represent the net expenses paid by the class.
I Amount does not include the portfolio activity of any underlying Fidelity Central Funds.
See accompanying notes which are an integral part of the financial statements.
VIP Energy Portfolio Service Class 2
| Years ended December 31, | 2017 | 2016 | 2015 | 2014 | 2013 |
| Selected Per–Share Data | | | | | |
| Net asset value, beginning of period | $20.62 | $15.51 | $20.37 | $23.83 | $19.44 |
| Income from Investment Operations | | | | | |
| Net investment income (loss)A | .27B | .08 | .19 | .16 | .14 |
| Net realized and unrealized gain (loss) | (.86) | 5.12 | (4.28) | (3.19) | 4.55 |
| Total from investment operations | (.59) | 5.20 | (4.09) | (3.03) | 4.69 |
| Distributions from net investment income | (.27) | (.09) | (.18) | (.16) | (.16) |
| Distributions from net realized gain | (.01) | – | (.60) | (.28) | (.14) |
| Total distributions | (.28) | (.09) | (.78) | (.44) | (.30) |
| Redemption fees added to paid in capitalA | –C | –C | .01 | .01 | –C |
| Net asset value, end of period | $19.75 | $20.62 | $15.51 | $20.37 | $23.83 |
| Total ReturnD,E | (2.78)% | 33.51% | (20.75)% | (12.76)% | 24.21% |
| Ratios to Average Net AssetsF,G | | | | | |
| Expenses before reductions | .94% | .93% | .93% | .93% | .94% |
| Expenses net of fee waivers, if any | .93% | .93% | .93% | .92% | .94% |
| Expenses net of all reductions | .93% | .92% | .92% | .92% | .94% |
| Net investment income (loss) | 1.48%B | .47% | 1.00% | .66% | .64% |
| Supplemental Data | | | | | |
| Net assets, end of period (000 omitted) | $128,346 | $150,744 | $97,286 | $116,228 | $130,100 |
| Portfolio turnover rateH | 66% | 87% | 70% | 99% | 90% |
A Calculated based on average shares outstanding during the period.
B Net Investment income per share reflects a large, non-recurring dividend which amounted to $.20 per share. Excluding this non-recurring dividend, the ratio of net investment income (loss) to average net assets would have been .37%.
C Amount represents less than $.005 per share.
D Total returns do not reflect charges attributable to your insurance company's separate account. Inclusion of these charges would reduce the total returns shown.
E Total returns would have been lower if certain expenses had not been reduced during the applicable periods shown.
F Fees and expenses of any underlying Fidelity Central Funds are not included in the Fund's expense ratio. The Fund indirectly bears its proportionate share of the expenses of any underlying Fidelity Central Funds.
G Expense ratios reflect operating expenses of the class. Expenses before reductions do not reflect amounts reimbursed or waived by the investment adviser or reductions from brokerage service arrangements or reductions from other expense offset arrangements and do not represent the amount paid by the class during periods when reimbursements, waivers or reductions occur. Expenses net of fee waivers reflect expenses after reimbursement and waivers by the investment adviser but prior to reductions from brokerage service arrangements or other expense offset arrangements. Expenses net of all reductions represent the net expenses paid by the class.
H Amount does not include the portfolio activity of any underlying Fidelity Central Funds.
See accompanying notes which are an integral part of the financial statements.
VIP Energy Portfolio Investor Class
| Years ended December 31, | 2017 | 2016 | 2015 | 2014 | 2013 |
| Selected Per–Share Data | | | | | |
| Net asset value, beginning of period | $20.68 | $15.55 | $20.42 | $23.90 | $19.49 |
| Income from Investment Operations | | | | | |
| Net investment income (loss)A | .30B | .11 | .22 | .20 | .18 |
| Net realized and unrealized gain (loss) | (.85) | 5.13 | (4.29) | (3.21) | 4.57 |
| Total from investment operations | (.55) | 5.24 | (4.07) | (3.01) | 4.75 |
| Distributions from net investment income | (.30) | (.11) | (.22) | (.20) | (.20) |
| Distributions from net realized gain | (.01) | – | (.60) | (.28) | (.14) |
| Total distributions | (.31) | (.11) | (.81)C | (.48) | (.34) |
| Redemption fees added to paid in capitalA | –D | –D | .01 | .01 | –D |
| Net asset value, end of period | $19.82 | $20.68 | $15.55 | $20.42 | $23.90 |
| Total ReturnE,F | (2.57)% | 33.70% | (20.58)% | (12.65)% | 24.45% |
| Ratios to Average Net AssetsG,H | | | | | |
| Expenses before reductions | .77% | .76% | .76% | .76% | .78% |
| Expenses net of fee waivers, if any | .77% | .76% | .76% | .75% | .77% |
| Expenses net of all reductions | .76% | .75% | .75% | .75% | .77% |
| Net investment income (loss) | 1.65%B | .63% | 1.17% | .83% | .80% |
| Supplemental Data | | | | | |
| Net assets, end of period (000 omitted) | $120,946 | $162,235 | $98,909 | $101,214 | $108,077 |
| Portfolio turnover rateI | 66% | 87% | 70% | 99% | 90% |
A Calculated based on average shares outstanding during the period.
B Net Investment income per share reflects a large, non-recurring dividend which amounted to $.20 per share. Excluding this non-recurring dividend, the ratio of net investment income (loss) to average net assets would have been .54%.
C Total distributions of $.81 per share is comprised of distributions from net investment income of $.215 and distributions from net realized gain of $.599 per share.
D Amount represents less than $.005 per share.
E Total returns do not reflect charges attributable to your insurance company's separate account. Inclusion of these charges would reduce the total returns shown.
F Total returns would have been lower if certain expenses had not been reduced during the applicable periods shown.
G Fees and expenses of any underlying Fidelity Central Funds are not included in the Fund's expense ratio. The Fund indirectly bears its proportionate share of the expenses of any underlying Fidelity Central Funds.
H Expense ratios reflect operating expenses of the class. Expenses before reductions do not reflect amounts reimbursed by the investment adviser or reductions from brokerage service arrangements or reductions from other expense offset arrangements and do not represent the amount paid by the class during periods when reimbursements or reductions occur. Expenses net of fee waivers reflect expenses after reimbursement by the investment adviser but prior to reductions from brokerage service arrangements or other expense offset arrangements. Expenses net of all reductions represent the net expenses paid by the class.
I Amount does not include the portfolio activity of any underlying Fidelity Central Funds.
See accompanying notes which are an integral part of the financial statements.
Notes to Financial Statements
For the period ended December 31, 2017
1. Organization.
VIP Energy Portfolio (the Fund) is a non-diversified fund of Variable Insurance Products Fund IV (the Trust) and is authorized to issue an unlimited number of shares. The Trust is registered under the Investment Company Act of 1940, as amended (the 1940 Act), as an open-end management investment company organized as a Massachusetts business trust. Shares of the Fund may only be purchased by insurance companies for the purpose of funding variable annuity or variable life insurance contracts. The Fund offers the following classes of shares: Initial Class shares, Service Class 2 shares and Investor Class shares. All classes have equal rights and voting privileges, except for matters affecting a single class.
2. Investments in Fidelity Central Funds.
The Fund invests in Fidelity Central Funds, which are open-end investment companies generally available only to other investment companies and accounts managed by the investment adviser and its affiliates. The Fund's Schedule of Investments lists each of the Fidelity Central Funds held as of period end, if any, as an investment of the Fund, but does not include the underlying holdings of each Fidelity Central Fund. As an Investing Fund, the Fund indirectly bears its proportionate share of the expenses of the underlying Fidelity Central Funds.
The Money Market Central Funds seek preservation of capital and current income and are managed by Fidelity Investments Money Management, Inc. (FIMM), an affiliate of the investment adviser. Annualized expenses of the Money Market Central Funds as of their most recent shareholder report date are less than .005%.
A complete unaudited list of holdings for each Fidelity Central Fund is available upon request or at the Securities and Exchange Commission (the SEC) website at www.sec.gov. In addition, the financial statements of the Fidelity Central Funds, which are not covered by the Fund's Report of Independent Registered Public Accounting Firm, are available on the SEC website or upon request.
3. Significant Accounting Policies.
The Fund is an investment company and applies the accounting and reporting guidance of the Financial Accounting Standards Board (FASB) Accounting Standards Codification Topic 946 Financial Services – Investments Companies. The financial statements have been prepared in conformity with accounting principles generally accepted in the United States of America (GAAP), which require management to make certain estimates and assumptions at the date of the financial statements. Actual results could differ from those estimates. Subsequent events, if any, through the date that the financial statements were issued have been evaluated in the preparation of the financial statements. The following summarizes the significant accounting policies of the Fund:
Investment Valuation. Investments are valued as of 4:00 p.m. Eastern time on the last calendar day of the period. The Board of Trustees (the Board) has delegated the day to day responsibility for the valuation of the Fund's investments to the Fair Value Committee (the Committee) established by the Fund's investment adviser. In accordance with valuation policies and procedures approved by the Board, the Fund attempts to obtain prices from one or more third party pricing vendors or brokers to value its investments. When current market prices, quotations or currency exchange rates are not readily available or reliable, investments will be fair valued in good faith by the Committee, in accordance with procedures adopted by the Board. Factors used in determining fair value vary by investment type and may include market or investment specific events. The frequency with which these procedures are used cannot be predicted and they may be utilized to a significant extent. The Committee oversees the Fund's valuation policies and procedures and reports to the Board on the Committee's activities and fair value determinations. The Board monitors the appropriateness of the procedures used in valuing the Fund's investments and ratifies the fair value determinations of the Committee.
The Fund categorizes the inputs to valuation techniques used to value its investments into a disclosure hierarchy consisting of three levels as shown below:
- Level 1 – quoted prices in active markets for identical investments
- Level 2 – other significant observable inputs (including quoted prices for similar investments, interest rates, prepayment speeds, etc.)
- Level 3 – unobservable inputs (including the Fund's own assumptions based on the best information available)
Valuation techniques used to value the Fund's investments by major category are as follows:
Equity securities, including restricted securities, for which market quotations are readily available, are valued at the last reported sale price or official closing price as reported by a third party pricing vendor on the primary market or exchange on which they are traded and are categorized as Level 1 in the hierarchy. In the event there were no sales during the day or closing prices are not available, securities are valued at the last quoted bid price or may be valued using the last available price and are generally categorized as Level 2 in the hierarchy. For foreign equity securities, when market or security specific events arise, comparisons to the valuation of American Depositary Receipts (ADRs), futures contracts, Exchange-Traded Funds (ETFs) and certain indexes as well as quoted prices for similar securities may be used and would be categorized as Level 2 in the hierarchy. Utilizing these techniques may result in transfers between Level 1 and Level 2. For equity securities, including restricted securities, where observable inputs are limited, assumptions about market activity and risk are used and these securities may be categorized as Level 3 in the hierarchy.
Investments in open-end mutual funds, including the Fidelity Central Funds, are valued at their closing net asset value (NAV) each business day and are categorized as Level 1 in the hierarchy.
Changes in valuation techniques may result in transfers in or out of an assigned level within the disclosure hierarchy.
Foreign Currency. The Fund may use foreign currency contracts to facilitate transactions in foreign-denominated securities. Gains and losses from these transactions may arise from changes in the value of the foreign currency or if the counterparties do not perform under the contracts' terms.
Foreign-denominated assets, including investment securities, and liabilities are translated into U.S. dollars at the exchange rates at period end. Purchases and sales of investment securities, income and dividends received and expenses denominated in foreign currencies are translated into U.S. dollars at the exchange rate in effect on the transaction date.
The effects of exchange rate fluctuations on investments are included with the net realized and unrealized gain (loss) on investment securities. Other foreign currency transactions resulting in realized and unrealized gain (loss) are disclosed separately.
Investment Transactions and Income. For financial reporting purposes, the Fund's investment holdings and NAV include trades executed through the end of the last business day of the period. The NAV per share for processing shareholder transactions is calculated as of the close of business of the New York Stock Exchange (NYSE), normally 4:00 p.m. Eastern time and includes trades executed through the end of the prior business day. Gains and losses on securities sold are determined on the basis of identified cost and includes proceeds received from litigation. Dividend income is recorded on the ex-dividend date, except for certain dividends from foreign securities where the ex-dividend date may have passed, which are recorded as soon as the Fund is informed of the ex-dividend date. Non-cash dividends included in dividend income, if any, are recorded at the fair market value of the securities received. Income and capital gain distributions from Fidelity Central Funds, if any, are recorded on the ex-dividend date. Certain distributions received by the Fund represent a return of capital or capital gain. The Fund determines the components of these distributions subsequent to the ex-dividend date, based upon receipt of tax filings or other correspondence relating to the underlying investment. These distributions are recorded as a reduction of cost of investments and/or as a realized gain. Large, non-recurring dividends recognized by the Fund are presented separately on the Statement of Operations as "Special Dividends" and the impact of these dividends is presented in the Financial Highlights. Investment income is recorded net of foreign taxes withheld where recovery of such taxes is uncertain.
Class Allocations and Expenses. Investment income, realized and unrealized capital gains and losses, common expenses of the Fund, and certain fund-level expense reductions, if any, are allocated daily on a pro-rata basis to each class based on the relative net assets of each class to the total net assets of the Fund. Each class differs with respect to transfer agent and distribution and service plan fees incurred. Certain expense reductions may also differ by class. For the reporting period, the allocated portion of income and expenses to each class as a percent of its average net assets may vary due to the timing of recording these transactions in relation to fluctuating net assets of the classes. Expenses directly attributable to a fund are charged to that fund. Expenses attributable to more than one fund are allocated among the respective funds on the basis of relative net assets or other appropriate methods. Expense estimates are accrued in the period to which they relate and adjustments are made when actual amounts are known.
Income Tax Information and Distributions to Shareholders. Each year, the Fund intends to qualify as a regulated investment company under Subchapter M of the Internal Revenue Code, including distributing substantially all of its taxable income and realized gains. As a result, no provision for U.S. Federal income taxes is required. As of December 31, 2017, the Fund did not have any unrecognized tax benefits in the financial statements; nor is the Fund aware of any tax positions for which it is reasonably possible that the total amounts of unrecognized tax benefits will significantly change in the next twelve months. The Fund files a U.S. federal tax return, in addition to state and local tax returns as required. The Fund's federal income tax returns are subject to examination by the Internal Revenue Service (IRS) for a period of three fiscal years after they are filed. State and local tax returns may be subject to examination for an additional fiscal year depending on the jurisdiction. Foreign taxes are provided for based on the Fund's understanding of the tax rules and rates that exist in the foreign markets in which it invests. The Fund is subject to a tax imposed on capital gains by certain countries in which it invests. An estimated deferred tax liability for net unrealized appreciation on the applicable securities is included in Other payables and accrued expenses on the Statement of Assets & Liabilities.
Distributions are declared and recorded on the ex-dividend date. Income dividends and capital gain distributions are declared separately for each class. Income and capital gain distributions are determined in accordance with income tax regulations, which may differ from GAAP.
Capital accounts within the financial statements are adjusted for permanent book-tax differences. These adjustments have no impact on net assets or the results of operations. Capital accounts are not adjusted for temporary book-tax differences which will reverse in a subsequent period.
Book-tax differences are primarily due to foreign currency transactions, certain foreign taxes, passive foreign investment companies (PFIC), partnerships, capital loss carryforwards and losses deferred due to wash sales.
As of period end, the cost and unrealized appreciation (depreciation) in securities, and derivatives if applicable, for federal income tax purposes were as follows:
| Gross unrealized appreciation | $66,025,116 |
| Gross unrealized depreciation | (12,832,728) |
| Net unrealized appreciation (depreciation) | $53,192,388 |
| Tax Cost | $245,071,146 |
The tax-based components of distributable earnings as of period end were as follows:
| Undistributed ordinary income | $592,599 |
| Capital loss carryforward | $(59,708,562) |
| Net unrealized appreciation (depreciation) on securities and other investments | $52,873,563 |
Capital loss carryforwards are only available to offset future capital gains of the Fund to the extent provided by regulations and may be limited. Under the Regulated Investment Company Modernization Act of 2010 (the Act), the Fund is permitted to carry forward capital losses incurred in taxable years beginning after December 22, 2010 for an unlimited period and such capital losses are required to be used prior to any losses that expire. The capital loss carryforward information presented below, including any applicable limitation, is estimated as of fiscal period end and is subject to adjustment.
| No expiration | |
| Short-term | $(39,230,248) |
| Long-term | (20,478,314) |
| Total capital loss carryforward | $(59,708,562) |
The tax character of distributions paid was as follows:
| | December 31, 2017 | December 31, 2016 |
| Ordinary Income | $4,462,108 | $ 1,879,963 |
Trading (Redemption) Fees. Shares held by investors less than 60 days may be subject to a redemption fee equal to 1% of the NAV of shares redeemed. All redemption fees, which reduce the proceeds of the shareholder redemption, are retained by the Fund and accounted for as an addition to paid in capital. In November 2017, the Board of Trustees approved the elimination of these redemption fees effective December 18, 2017.
Restricted Securities. The Fund may invest in securities that are subject to legal or contractual restrictions on resale. These securities generally may be resold in transactions exempt from registration or to the public if the securities are registered. Disposal of these securities may involve time-consuming negotiations and expense, and prompt sale at an acceptable price may be difficult. Information regarding restricted securities is included at the end of the Fund's Schedule of Investments.
4. Purchases and Sales of Investments.
Purchases and sales of securities, other than short-term securities, aggregated $196,583,156 and $257,062,037, respectively.
5. Fees and Other Transactions with Affiliates.
Management Fee. Fidelity SelectCo, LLC (the investment adviser) and its affiliates provide the Fund with investment management related services for which the Fund pays a monthly management fee. The management fee is the sum of an individual fund fee rate that is based on an annual rate of .30% of the Fund's average net assets and an annualized group fee rate that averaged .24% during the period. The group fee rate is based upon the average net assets of all the mutual funds advised by Fidelity Management & Research Company (FMR) and the investment adviser. The group fee rate decreases as assets under management increase and increases as assets under management decrease. For the reporting period, the total annual management fee rate was .55% of the Fund's average net assets.
Distribution and Service Plan Fees. In accordance with Rule 12b-1 of the 1940 Act, the Fund has adopted a separate 12b-1 Plan for Service Class 2 shares. Service Class 2 pays Fidelity Distributors Corporation (FDC), an affiliate of the investment adviser, a service fee. For the period, the service fee is based on an annual rate of .25% of Service Class 2's average net assets.
For the period, total fees for Service Class 2, all of which was re-allowed to insurance companies for the distribution of shares and providing shareholder support services were $311,536.
Transfer Agent Fees. Fidelity Investments Institutional Operations Company, Inc. (FIIOC), an affiliate of the investment adviser, is the Fund's transfer, dividend disbursing, and shareholder servicing agent. FIIOC receives an asset-based fee with respect to each class. Each class pays a fee for transfer agent services, typesetting and printing and mailing of shareholder reports, excluding mailing of proxy statements, equal to an annual rate of class-level average net assets. The annual rate for Investor Class is .15% and the annual rate for all other classes is .07%. For the period, transfer agent fees for each class were as follows:
| Initial Class | $30,687 |
| Service Class 2 | 82,154 |
| Investor Class | 186,947 |
| | $299,788 |
Accounting and Security Lending Fees. Fidelity Service Company, Inc. (FSC), an affiliate of the investment adviser, maintains the Fund's accounting records. The accounting fee is based on the level of average net assets for each month. Under a separate contract, FSC administers the security lending program. The security lending fee is based on the number and duration of lending transactions.
Brokerage Commissions. The Fund placed a portion of its portfolio transactions with brokerage firms which are affiliates of the investment adviser. Brokerage commissions are included in net realized gain (loss) and change in net unrealized appreciation (depreciation) in the Statement of Operations. The commissions paid to these affiliated firms were $6,938 for the period.
Interfund Trades. The Fund may purchase from or sell securities to other Fidelity Funds under procedures adopted by the Board. The procedures have been designed to ensure these interfund trades are executed in accordance with Rule 17a-7 of the 1940 Act. Interfund trades are included within the respective purchases and sales amounts shown in the Purchases and Sales of Investments note.
6. Committed Line of Credit.
The Fund participates with other funds managed by the investment adviser or an affiliate in a $4.25 billion credit facility (the "line of credit") to be utilized for temporary or emergency purposes to fund shareholder redemptions or for other short-term liquidity purposes. The Fund has agreed to pay commitment fees on its pro-rata portion of the line of credit, which amounted to $1,028 and is reflected in Miscellaneous expenses on the Statement of Operations. During the period, the Fund did not borrow on this line of credit.
7. Security Lending.
The Fund lends portfolio securities through a lending agent from time to time in order to earn additional income. On the settlement date of the loan, the Fund receives collateral (in the form of U.S. Treasury obligations, letters of credit and/or cash) against the loaned securities and maintains collateral in an amount not less than 100% of the market value of the loaned securities during the period of the loan. The market value of the loaned securities is determined at the close of business of the Fund and any additional required collateral is delivered to the Fund on the next business day. The Fund or borrower may terminate the loan at any time, and if the borrower defaults on its obligation to return the securities loaned because of insolvency or other reasons, the Fund may apply collateral received from the borrower against the obligation. The Fund may experience delays and costs in recovering the securities loaned. Any cash collateral received is invested in the Fidelity Securities Lending Cash Central Fund. The value of loaned securities and cash collateral at period end are disclosed on the Fund's Statement of Assets and Liabilities. Security lending income represents the income earned on investing cash collateral, less rebates paid to borrowers and any lending agent fees associated with the loan, plus any premium payments received for lending certain types of securities. Security lending income is presented in the Statement of Operations as a component of income from Fidelity Central Funds. Total security lending income during the period amounted to $49,366.
8. Expense Reductions.
Commissions paid to certain brokers with whom the investment adviser, or its affiliates, places trades on behalf of the Fund include an amount in addition to trade execution, which may be rebated back to the Fund to offset certain expenses. This amount totaled $27,697 for the period. In addition, during the period the investment adviser reimbursed and/or waived a portion of fund-level operating expenses in the amount of $3,763.
9. Distributions to Shareholders.
Distributions to shareholders of each class were as follows:
| | Year ended
December 31, 2017 | Year ended December 31, 2016 |
| From net investment income | | |
| Initial Class | $704,300 | $368,235 |
| Service Class 2 | 1,745,376 | 643,085 |
| Investor Class | 1,864,330 | 868,643 |
| Total | $4,314,006 | $1,879,963 |
| From net realized gain | | |
| Initial Class | $21,984 | $– |
| Service Class 2 | 64,405 | – |
| Investor Class | 61,713 | – |
| Total | $148,102 | $– |
10. Share Transactions.
Transactions for each class of shares were as follows:
| | Shares | Shares | Dollars | Dollars |
| | Year ended December 31, 2017 | Year ended December 31, 2016 | Year ended December 31, 2017 | Year ended December 31, 2016 |
| Initial Class | | | | |
| Shares sold | 152,915 | 637,783 | $2,910,797 | $11,858,299 |
| Reinvestment of distributions | 38,684 | 17,560 | 726,283 | 368,235 |
| Shares redeemed | (1,080,413) | (546,131) | (20,415,649) | (9,245,983) |
| Net increase (decrease) | (888,814) | 109,212 | $(16,778,569) | $2,980,551 |
| Service Class 2 | | | | |
| Shares sold | 752,096 | 1,872,653 | $14,010,538 | $33,298,327 |
| Reinvestment of distributions | 97,091 | 30,829 | 1,809,781 | 643,085 |
| Shares redeemed | (1,663,105) | (865,169) | (30,744,171) | (15,123,742) |
| Net increase (decrease) | (813,918) | 1,038,313 | $(14,923,852) | $18,817,670 |
| Investor Class | | | | |
| Shares sold | 912,948 | 2,479,480 | $17,075,657 | $45,760,835 |
| Reinvestment of distributions | 102,856 | 41,502 | 1,926,043 | 868,643 |
| Shares redeemed | (2,757,527) | (1,037,998) | (50,869,747) | (18,140,062) |
| Net increase (decrease) | (1,741,723) | 1,482,984 | $(31,868,047) | $28,489,416 |
11. Other.
The Fund's organizational documents provide former and current trustees and officers with a limited indemnification against liabilities arising in connection with the performance of their duties to the Fund. In the normal course of business, the Fund may also enter into contracts that provide general indemnifications. The Fund's maximum exposure under these arrangements is unknown as this would be dependent on future claims that may be made against the Fund. The risk of material loss from such claims is considered remote.
At the end of the period, the investment adviser or its affiliates were the owners of record of 56% of the total outstanding shares of the Fund and one otherwise unaffiliated shareholder was the owner of record of 38% of the total outstanding shares of the Fund.
Report of Independent Registered Public Accounting Firm
To the Board of Trustees of Variable Insurance Products Fund IV and Shareholders of VIP Energy Portfolio:
Opinion on the Financial Statements
We have audited the accompanying statement of assets and liabilities, including the schedule of investments, of VIP Energy Portfolio (one of the funds constituting Variable Insurance Products Fund IV, referred to hereafter as the “Fund”) as of December 31, 2017, the related statement of operations for the year ended December 31, 2017, the statement of changes in net assets for each of the two years in the period ended December 31, 2017, including the related notes, and the financial highlights for each of the five years in the period ended December 31, 2017 (collectively referred to as the “financial statements”). In our opinion, the financial statements present fairly, in all material respects, the financial position of the Fund as of December 31, 2017, the results of its operations for the year then ended, the changes in its net assets for each of the two years in the period ended December 31, 2017 and the financial highlights for each of the five years in the period ended December 31, 2017 in conformity with accounting principles generally accepted in the United States of America.
Basis for Opinion
These financial statements are the responsibility of the Fund’s management. Our responsibility is to express an opinion on the Fund’s financial statements based on our audits. We are a public accounting firm registered with the Public Company Accounting Oversight Board (United States) (“PCAOB”) and are required to be independent with respect to the Fund in accordance with the U.S. federal securities laws and the applicable rules and regulations of the Securities and Exchange Commission and the PCAOB.
We conducted our audits of these financial statements in accordance with the standards of the PCAOB. Those standards require that we plan and perform the audit to obtain reasonable assurance about whether the financial statements are free of material misstatement, whether due to error or fraud.
Our audits included performing procedures to assess the risks of material misstatement of the financial statements, whether due to error or fraud, and performing procedures that respond to those risks. Such procedures included examining, on a test basis, evidence regarding the amounts and disclosures in the financial statements. Our audits also included evaluating the accounting principles used and significant estimates made by management, as well as evaluating the overall presentation of the financial statements. Our procedures included confirmation of securities owned as of December 31, 2017 by correspondence with the custodian. We believe that our audits provide a reasonable basis for our opinion.
PricewaterhouseCoopers LLP
Boston, Massachusetts
February 14, 2018
We have served as the auditor of one or more investment companies in the Fidelity group of funds since 1932.
Trustees and Officers
The Trustees, Members of the Advisory Board (if any), and officers of the trust and fund, as applicable, are listed below. The Board of Trustees governs the fund and is responsible for protecting the interests of shareholders. The Trustees are experienced executives who meet periodically throughout the year to oversee the fund's activities, review contractual arrangements with companies that provide services to the fund, oversee management of the risks associated with such activities and contractual arrangements, and review the fund's performance. Each of the Trustees oversees 91 funds.
The Trustees hold office without limit in time except that (a) any Trustee may resign; (b) any Trustee may be removed by written instrument, signed by at least two-thirds of the number of Trustees prior to such removal; (c) any Trustee who requests to be retired or who has become incapacitated by illness or injury may be retired by written instrument signed by a majority of the other Trustees; and (d) any Trustee may be removed at any special meeting of shareholders by a two-thirds vote of the outstanding voting securities of the trust. Each Trustee who is not an interested person (as defined in the 1940 Act) of the trust and the fund is referred to herein as an Independent Trustee. Each Independent Trustee shall retire not later than the last day of the calendar year in which his or her 75th birthday occurs. The Independent Trustees may waive this mandatory retirement age policy with respect to individual Trustees. Officers and Advisory Board Members hold office without limit in time, except that any officer or Advisory Board Member may resign or may be removed by a vote of a majority of the Trustees at any regular meeting or any special meeting of the Trustees. Except as indicated, each individual has held the office shown or other offices in the same company for the past five years.
The fund’s Statement of Additional Information (SAI) includes more information about the Trustees. To request a free copy, call Fidelity at 1-877-208-0098.
Experience, Skills, Attributes, and Qualifications of the Trustees. The Governance and Nominating Committee has adopted a statement of policy that describes the experience, qualifications, attributes, and skills that are necessary and desirable for potential Independent Trustee candidates (Statement of Policy). The Board believes that each Trustee satisfied at the time he or she was initially elected or appointed a Trustee, and continues to satisfy, the standards contemplated by the Statement of Policy. The Governance and Nominating Committee also engages professional search firms to help identify potential Independent Trustee candidates who have the experience, qualifications, attributes, and skills consistent with the Statement of Policy. From time to time, additional criteria based on the composition and skills of the current Independent Trustees, as well as experience or skills that may be appropriate in light of future changes to board composition, business conditions, and regulatory or other developments, have also been considered by the professional search firms and the Governance and Nominating Committee. In addition, the Board takes into account the Trustees' commitment and participation in Board and committee meetings, as well as their leadership of standing and ad hoc committees throughout their tenure.
In determining that a particular Trustee was and continues to be qualified to serve as a Trustee, the Board has considered a variety of criteria, none of which, in isolation, was controlling. The Board believes that, collectively, the Trustees have balanced and diverse experience, qualifications, attributes, and skills, which allow the Board to operate effectively in governing the fund and protecting the interests of shareholders. Information about the specific experience, skills, attributes, and qualifications of each Trustee, which in each case led to the Board's conclusion that the Trustee should serve (or continue to serve) as a trustee of the fund, is provided below.
Board Structure and Oversight Function. Brian B. Hogan is an interested person and currently serves as Chairman. The Trustees have determined that an interested Chairman is appropriate and benefits shareholders because an interested Chairman has a personal and professional stake in the quality and continuity of services provided to the fund. Independent Trustees exercise their informed business judgment to appoint an individual of their choosing to serve as Chairman, regardless of whether the Trustee happens to be independent or a member of management. The Independent Trustees have determined that they can act independently and effectively without having an Independent Trustee serve as Chairman and that a key structural component for assuring that they are in a position to do so is for the Independent Trustees to constitute a substantial majority for the Board. The Independent Trustees also regularly meet in executive session. Michael E. Wiley serves as Chairman of the Independent Trustees and as such (i) acts as a liaison between the Independent Trustees and management with respect to matters important to the Independent Trustees and (ii) with management prepares agendas for Board meetings.
Fidelity® funds are overseen by different Boards of Trustees. The fund's Board oversees Fidelity's sector portfolios. Other Boards oversee Fidelity's equity and high income funds, and Fidelity's investment grade bond, money market, and asset allocation funds. The use of separate Boards, each with its own committee structure, allows the Trustees of each group of Fidelity® funds to focus on the unique issues of the funds they oversee, including common research, investment, and operational issues. On occasion, the separate Boards establish joint committees to address issues of overlapping consequences for the Fidelity® funds overseen by each Board.
The Trustees operate using a system of committees to facilitate the timely and efficient consideration of all matters of importance to the Trustees, the fund, and fund shareholders and to facilitate compliance with legal and regulatory requirements and oversight of the fund's activities and associated risks. The Board, acting through its committees, has charged SelectCo and its affiliates with (i) identifying events or circumstances the occurrence of which could have demonstrably adverse effects on the fund's business and/or reputation; (ii) implementing processes and controls to lessen the possibility that such events or circumstances occur or to mitigate the effects of such events or circumstances if they do occur; and (iii) creating and maintaining a system designed to evaluate continuously business and market conditions in order to facilitate the identification and implementation processes described in (i) and (ii) above. Because the day-to-day operations and activities of the fund are carried out by or through SelectCo, its affiliates, and other service providers, the fund's exposure to risks is mitigated but not eliminated by the processes overseen by the Trustees. While each of the Board's committees has responsibility for overseeing different aspects of the fund's activities, oversight is exercised primarily through the Operations and Audit Committees. Appropriate personnel, including but not limited to the fund's Chief Compliance Officer (CCO), SelectCo's internal auditor, the independent accountants, the fund's Treasurer and portfolio management personnel, make periodic reports to the Board's committees, as appropriate. The responsibilities of each standing committee, including their oversight responsibilities, are described further under "Standing Committees of the Trustees."
Interested Trustees*:
Correspondence intended for a Trustee who is an interested person may be sent to Fidelity Investments, 245 Summer Street, Boston, Massachusetts 02210.
Name, Year of Birth; Principal Occupations and Other Relevant Experience+
Brian B. Hogan (1964)
Year of Election or Appointment: 2014
Trustee
Chairman of the Board of Trustees
Mr. Hogan also serves as Trustee or Vice President of other funds. Mr. Hogan serves as a Director of FMR Investment Management (UK) Limited (investment adviser firm, 2015-present) and Fidelity SelectCo, LLC (investment adviser firm, 2014-present) and President of the Equity Division of FMR (investment adviser firm, 2009-present). Previously, Mr. Hogan served as Senior Vice President, Equity Research of FMR (2006-2009) and as a portfolio manager. Mr. Brian B. Hogan is not related to Mr. Colm A. Hogan.
* Determined to be an "Interested Trustee" by virtue of, among other things, his or her affiliation with the trusts or various entities under common control with SelectCo.
+ The information includes the Trustee's principal occupation during the last five years and other information relating to the experience, attributes, and skills relevant to the Trustee's qualifications to serve as a Trustee, which led to the conclusion that the Trustee should serve as a Trustee for the fund.
Independent Trustees:
Correspondence intended for an Independent Trustee may be sent to Fidelity Investments, P.O. Box 55235, Boston, Massachusetts 02205-5235.
Name, Year of Birth; Principal Occupations and Other Relevant Experience+
David A. Rosow (1942)
Year of Election or Appointment: 2013
Trustee
Mr. Rosow also serves as Trustee of other Fidelity® funds. Prior to his retirement in 2006, Mr. Rosow was the Chief Executive Officer, owner and operator of a number of private companies, which encompassed the oil refining, drilling and marketing of petroleum products (including specialty petroleum products), recreation industry, and real estate development. Mr. Rosow currently serves as a Director of Oxbow Carbon LLC (upgraders, marketers, and distributors of petroleum byproducts of the oil refining process, 2015-present) and Oxbridge Academy of the Palm Beaches (2015-present) and serves as its President and CEO. Previously, Mr. Rosow served on the Fairfield Country Day School Board for 27 years, including as its President for 3 years, stepping down in 2006. Mr. Rosow served as Lead Director and Chairman of the Audit Committee of Hudson United Bancorp (1996-2006), Chairman of the Board of Westport Bank and Trust (1992-1996), and as a Director of TD Banknorth (2006-2007). In addition, Mr. Rosow served as a member (2008-2014) and President (2009-2014) of the Town Council of Palm Beach, Florida. Mr. Rosow also served as a Member of the Advisory Board of certain Fidelity® funds (2012-2013).
Garnett A. Smith (1947)
Year of Election or Appointment: 2013
Trustee
Mr. Smith also serves as Trustee of other Fidelity® funds. Prior to Mr. Smith's retirement, he served as Chairman and Chief Executive Officer of Inbrand Corp. (manufacturer of personal absorbent products, 1990-1997). He also served as President (1986-1990) of Inbrand Corp. Prior to his employment with Inbrand Corp., he was employed by a retail fabric chain and North Carolina National Bank. In addition, Mr. Smith served as a Member of the Advisory Board of certain Fidelity® funds (2012-2013) and as a board member of the Jackson Hole Land Trust (2009-2012).
Michael E. Wiley (1950)
Year of Election or Appointment: 2008
Trustee
Chairman of the Independent Trustees
Mr. Wiley also serves as Trustee of other Fidelity® funds. Mr. Wiley serves as a Director of Andeavor Corporation (independent oil refiner and marketer, 2005-present), a Director of Andeavor Logistics LP (natural resources logistics, 2015-present), and a Director of Bill Barrett Corporation (exploration and production, 2005-present). In addition, Mr. Wiley also serves as a Director of Post Oak Bank (privately-held bank, 2004-present). Previously, Mr. Wiley served as a Trustee of other Fidelity® funds (2008-2013), as a Director of Asia Pacific Exploration Consolidated (international oil and gas exploration and production, 2008-2013), as a member of the Board of Trustees of the University of Tulsa (2000-2006; 2007-2010), as a Senior Energy Advisor of Katzenbach Partners, LLC (consulting, 2006-2007), as an Advisory Director of Riverstone Holdings (private investment), Chairman, President, and CEO of Baker Hughes, Inc. (oilfield services, 2000-2004), and as Director of Spinnaker Exploration Company (exploration and production, 2001-2005).
+ The information includes the Trustee's principal occupation during the last five years and other information relating to the experience, attributes, and skills relevant to the Trustee's qualifications to serve as a Trustee, which led to the conclusion that the Trustee should serve as a Trustee for the fund.
Advisory Board Members and Officers:
Correspondence intended for a Member of the Advisory Board (if any) may be sent to Fidelity Investments, P.O. Box 55235, Boston, Massachusetts 02205-5235. Except for Anthony R. Rochte, correspondence intended for an officer may be sent to Fidelity Investments, 245 Summer Street, Boston, Massachusetts 02210. Correspondence intended for Mr. Rochte may be sent to Fidelity SelectCo, LLC (SelectCo), 1225 17th Street, Denver, Colorado 80202-5541. Officers appear below in alphabetical order.
Name, Year of Birth; Principal Occupation
Donald F. Donahue (1950)
Year of Election or Appointment: 2015
Member of the Advisory Board
Mr. Donahue also serves as a Trustee or Member of the Advisory Board of other Fidelity® funds. Mr. Donahue is President and Chief Executive Officer of Miranda Partners, LLC (risk consulting for the financial services industry, 2012-present). Previously, Mr. Donahue served as Chief Executive Officer (2006-2012), Chief Operating Officer (2003-2006), and Managing Director, Customer Marketing and Development (1999-2003) of The Depository Trust & Clearing Corporation (financial markets infrastructure). Mr. Donahue serves as a Member (2007-present) and Co-Chairman (2016-present) of the Board of Directors of United Way of New York, Member of the Board of Directors of NYC Leadership Academy (2012-present) and Member of the Board of Advisors of Ripple Labs, Inc. (financial services, 2015-present). He also served as Chairman (2010-2012) and Member of the Board of Directors (2012-2013) of Omgeo, LLC (financial services), Treasurer of United Way of New York (2012-2016), and Member of the Board of Directors of XBRL US (financial services non-profit, 2009-2012) and the International Securities Services Association (2009-2012).
Carol B. Tomé (1957)
Year of Election or Appointment: 2017
Member of the Advisory Board
Ms. Tomé also serves as Member of the Advisory Board of other Fidelity® funds. Ms. Tomé is Chief Financial Officer (2001-present) and Executive Vice President of Corporate Services (2007-present) of The Home Depot, Inc. (home improvement retailer) and a Director (2003-present) and Chair of the Audit Committee (2004-present) of United Parcel Service, Inc. (package delivery and supply chain management). Previously, Ms. Tomé served as Trustee of certain Fidelity® funds (2017), Senior Vice President of Finance and Accounting/Treasurer (2000-2007) and Vice President and Treasurer (1995-2000) of The Home Depot, Inc. and Chair of the Board (2010-2012), Vice Chair of the Board (2009 and 2013), and a Director (2008-2013) of the Federal Reserve Bank of Atlanta. Ms. Tomé is also a director or trustee of many community and professional organizations.
Elizabeth Paige Baumann (1968)
Year of Election or Appointment: 2017
Anti-Money Laundering (AML) Officer
Ms. Baumann also serves as AML Officer of other funds. She is Chief AML Officer (2012-present) and Senior Vice President (2014-present) of FMR LLC (diversified financial services company) and is an employee of Fidelity Investments. Previously, Ms. Baumann served as AML Officer of the funds (2012-2016), and Vice President (2007-2014) and Deputy Anti-Money Laundering Officer (2007-2012) of FMR LLC.
Marc R. Bryant (1966)
Year of Election or Appointment: 2013
Secretary and Chief Legal Officer (CLO)
Mr. Bryant also serves as Secretary and CLO of other funds. Mr. Bryant serves as CLO, Secretary, and Senior Vice President of Fidelity Management & Research Company (investment adviser firm, 2015-present) and FMR Co., Inc. (investment adviser firm, 2015-present); Secretary of Fidelity SelectCo, LLC (investment adviser firm, 2015-present) and Fidelity Investments Money Management, Inc. (investment adviser firm, 2015-present); and CLO of Fidelity Management & Research (Hong Kong) Limited and FMR Investment Management (UK) Limited (investment adviser firms, 2015-present) and Fidelity Management & Research (Japan) Limited (investment adviser firm, 2016-present). He is Senior Vice President and Deputy General Counsel of FMR LLC (diversified financial services company). Previously, Mr. Bryant served as Secretary and CLO of Fidelity Rutland Square Trust II (2010-2014) and Assistant Secretary of Fidelity's Fixed Income and Asset Allocation Funds (2013-2015). Prior to joining Fidelity Investments, Mr. Bryant served as a Senior Vice President and the Head of Global Retail Legal for AllianceBernstein L.P. (2006-2010), and as the General Counsel for ProFund Advisors LLC (2001-2006).
William C. Coffey (1969)
Year of Election or Appointment: 2009
Assistant Secretary
Mr. Coffey also serves as Assistant Secretary of other funds. He is Senior Vice President and Deputy General Counsel of FMR LLC (diversified financial services company, 2010-present), and is an employee of Fidelity Investments. Previously, Mr. Coffey served as Vice President and Associate General Counsel of FMR LLC (2005-2009).
Jonathan Davis (1968)
Year of Election or Appointment: 2010
Assistant Treasurer
Mr. Davis also serves as Assistant Treasurer of other funds. Mr. Davis serves as Assistant Treasurer of FMR Capital, Inc. (2017-present) and is an employee of Fidelity Investments. Previously, Mr. Davis served as Vice President and Associate General Counsel of FMR LLC (diversified financial services company, 2003-2010).
Adrien E. Deberghes (1967)
Year of Election or Appointment: 2013
President and Treasurer
Mr. Deberghes also serves as an officer of other funds. He serves as Assistant Treasurer of FMR Capital, Inc. (2017-present), Executive Vice President of Fidelity Investments Money Management, Inc. (FIMM) (investment adviser firm, 2016-present), and is an employee of Fidelity Investments (2008-present). Prior to joining Fidelity Investments, Mr. Deberghes was Senior Vice President of Mutual Fund Administration at State Street Corporation (2007-2008), Senior Director of Mutual Fund Administration at Investors Bank & Trust (2005-2007), and Director of Finance for Dunkin' Brands (2000-2005). Previously, Mr. Deberghes served in other fund officer roles.
Joseph DeSantis (1959)
Year of Election or Appointment: 2015
Vice President
Mr. DeSantis also serves as Vice President of other funds. Mr. DeSantis serves as a Director of Fidelity Management & Research (Japan) Limited (investment adviser firm, 2016-present), Chief Investment Officer, Equities (2010-present) and is an employee of Fidelity Investments.
Stephanie J. Dorsey (1969)
Year of Election or Appointment: 2010
Assistant Treasurer
Ms. Dorsey also serves as an officer of other funds. Ms. Dorsey serves as Assistant Treasurer of FMR Capital, Inc. (2017-present), is an employee of Fidelity Investments (2008-present), and has served in other fund officer roles. Prior to joining Fidelity Investments, Ms. Dorsey served as Treasurer (2004-2008) of the JPMorgan Mutual Funds and Vice President (2004-2008) of JPMorgan Chase Bank.
Howard J. Galligan III (1966)
Year of Election or Appointment: 2014
Chief Financial Officer
Mr. Galligan also serves as Chief Financial Officer of other funds. Mr. Galligan serves as President of Fidelity Pricing and Cash Management Services (FPCMS) (2014-present) and as a Director of Strategic Advisers, Inc. (investment adviser firm, 2008-present). Previously, Mr. Galligan served as Chief Administrative Officer of Asset Management (2011-2014) and Chief Operating Officer and Senior Vice President of Investment Support for Strategic Advisers, Inc. (2003-2011).
James D. Gryglewicz (1972)
Year of Election or Appointment: 2014
Chief Compliance Officer
Mr. Gryglewicz also serves as Chief Compliance Officer of other funds. Mr. Gryglewicz serves as Compliance Officer of Strategic Advisers, Inc. (investment adviser firm, 2015-present) and Fidelity SelectCo, LLC (investment adviser firm, 2014-present), Senior Vice President of Asset Management Compliance (2009-present), and is an employee of Fidelity Investments (2004-present).
Brian B. Hogan (1964)
Year of Election or Appointment: 2009
Vice President
Mr. Hogan also serves as Trustee or Vice President of other funds. Mr. Hogan serves as a Director of FMR Investment Management (UK) Limited (investment adviser firm, 2015-present) and Fidelity SelectCo, LLC (investment adviser firm, 2014-present) and President of the Equity Division of FMR (investment adviser firm, 2009-present). Previously, Mr. Hogan served as Senior Vice President, Equity Research of FMR (2006-2009) and as a portfolio manager. Mr. Brian B. Hogan is not related to Mr. Colm A. Hogan.
Colm A. Hogan (1973)
Year of Election or Appointment: 2016
Assistant Treasurer
Mr. Hogan also serves as an officer of other funds. Mr. Hogan serves as Assistant Treasurer of FMR Capital, Inc. (2017-present) and is an employee of Fidelity Investments (2005-present). Mr. Colm A. Hogan is not related to Mr. Brian B. Hogan.
Chris Maher (1972)
Year of Election or Appointment: 2013
Assistant Treasurer
Mr. Maher serves as Assistant Treasurer of other funds. Mr. Maher is Vice President of Valuation Oversight, serves as Assistant Treasurer of FMR Capital, Inc. (2017-present), and is an employee of Fidelity Investments. Previously, Mr. Maher served as Vice President of Asset Management Compliance (2013), Vice President of the Program Management Group of FMR (investment adviser firm, 2010-2013), and Vice President of Valuation Oversight (2008-2010).
Rieco E. Mello (1969)
Year of Election or Appointment: 2017
Assistant Treasurer
Mr. Mello also serves as Assistant Treasurer of other funds. Mr. Mello serves as Assistant Treasurer of FMR Capital, Inc. (2017-present) and is an employee of Fidelity Investments (1995-present).
Anthony R. Rochte (1968)
Year of Election or Appointment: 2013
Vice President
Mr. Rochte also serves as Vice President of other funds. Mr. Rochte serves as President of Fidelity SelectCo, LLC (investment adviser firm, 2012-present) and is an employee of Fidelity Investments (2012-present). Prior to joining Fidelity Investments, Mr. Rochte served as Senior Managing Director and head of State Street Global Advisors' North American Intermediary Business Group (2006-2012).
Stacie M. Smith (1974)
Year of Election or Appointment: 2013
Assistant Treasurer
Ms. Smith also serves as an officer of other funds. Ms. Smith serves as Assistant Treasurer of FMR Capital, Inc. (2017-present), is an employee of Fidelity Investments (2009-present), and has served in other fund officer roles. Prior to joining Fidelity Investments, Ms. Smith served as Senior Audit Manager of Ernst & Young LLP (accounting firm, 1996-2009). Previously, Ms. Smith served as Deputy Treasurer of certain Fidelity® funds (2013-2016).
Marc L. Spector (1972)
Year of Election or Appointment: 2017
Assistant Treasurer
Mr. Spector also serves as an officer of other funds. Mr. Spector serves as Assistant Treasurer of FMR Capital, Inc. (2017-present) and is an employee of Fidelity Investments (2016-present). Prior to joining Fidelity Investments, Mr. Spector served as Director at the Siegfried Group (accounting firm, 2013-2016), and prior to Siegfried Group as audit senior manager at Deloitte & Touche (accounting firm, 2005-2013).
Renee Stagnone (1975)
Year of Election or Appointment: 2016
Assistant Treasurer
Ms. Stagnone also serves as an officer of other funds. Ms. Stagnone serves as Assistant Treasurer of FMR Capital, Inc. (2017-present) and is an employee of Fidelity Investments (1997-present). Previously, Ms. Stagnone served as Deputy Treasurer of certain Fidelity® funds (2013-2016).
Shareholder Expense Example
As a shareholder of a Fund, you incur two types of costs: (1) transaction costs, including redemption fees and (2) ongoing costs, including management fees and other Fund expenses. This Example is intended to help you understand your ongoing costs (in dollars) of investing in the Funds and to compare these costs with the ongoing costs of investing in other mutual funds.
The Example is based on an investment of $1,000 invested at the beginning of the period and held for the entire period (July 1, 2017 to December 31, 2017).
Actual Expenses
The first line of the accompanying table for each class of the Fund provides information about actual account values and actual expenses. You may use the information in this line, together with the amount you invested, to estimate the expenses that you paid over the period. Simply divide your account value by $1,000.00 (for example, an $8,600 account value divided by $1,000.00 = 8.6), then multiply the result by the number in the first line for a class of the Fund under the heading entitled "Expenses Paid During Period" to estimate the expenses you paid on your account during this period. The estimate of expenses does not include any fees or other expenses of any variable annuity or variable life insurance product. If they were, the estimate of expenses you paid during the period would be higher, and your ending account value would be lower. In addition, the Fund, as a shareholder in the underlying Fidelity Central Funds, will indirectly bear its pro-rata share of the fees and expenses incurred by the underlying Fidelity Central Funds. These fees and expenses are not included in the Fund's annualized expense ratio used to calculate the expense estimate in the table below.
Hypothetical Example for Comparison Purposes
The second line of the accompanying table for each class of the Fund provides information about hypothetical account values and hypothetical expenses based on a Class' actual expense ratio and an assumed rate of return of 5% per year before expenses, which is not the Class' actual return. The hypothetical account values and expenses may not be used to estimate the actual ending account balance or expenses you paid for the period. You may use this information to compare the ongoing costs of investing in the Fund and other funds. To do so, compare this 5% hypothetical example with the 5% hypothetical examples that appear in the shareholder reports of the other funds. The estimate of expenses does not include any fees or other expenses of any variable annuity or variable life insurance product. If they were, the estimate of expenses you paid during the period would be higher, and your ending account value would be lower. In addition, the Fund, as a shareholder in the underlying Fidelity Central Funds, will indirectly bear its pro-rata share of the fees and expenses incurred by the underlying Fidelity Central Funds. These fees and expenses are not included in the Fund's annualized expense ratio used to calculate the expense estimate in the table below.
Please note that the expenses shown in the table are meant to highlight your ongoing costs only and do not reflect any transaction costs. Therefore, the second line of the table is useful in comparing ongoing costs only, and will not help you determine the relative total costs of owning different funds. In addition, if these transactional costs were included, your costs would have been higher.
| | Annualized Expense Ratio-A | Beginning
Account Value
July 1, 2017 | Ending
Account Value
December 31, 2017 | Expenses Paid
During Period-B
July 1, 2017
to December 31, 2017 |
| Initial Class | .69% | | | |
| Actual | | $1,000.00 | $1,179.20 | $3.79 |
| Hypothetical-C | | $1,000.00 | $1,021.73 | $3.52 |
| Service Class 2 | .94% | | | |
| Actual | | $1,000.00 | $1,177.20 | $5.16 |
| Hypothetical-C | | $1,000.00 | $1,020.47 | $4.79 |
| Investor Class | .77% | | | |
| Actual | | $1,000.00 | $1,178.80 | $4.23 |
| Hypothetical-C | | $1,000.00 | $1,021.32 | $3.92 |
A Annualized expense ratio reflects expenses net of applicable fee waivers.
B Expenses are equal to each Class' annualized expense ratio, multiplied by the average account value over the period, multiplied by 184/365 (to reflect the one-half year period).
C 5% return per year before expenses
Distributions (Unaudited)
Initial Class, Service Class 2 and Investor Class designate 100% of the dividends distributed during the fiscal year as qualifying for the dividends–received deduction for corporate shareholders.
Proxy Voting Results
A special meeting of shareholders was held on December 8, 2017. The results of votes taken among shareholders on the proposals before them are reported below. Each vote reported represents one dollar of net asset value held on the record date for the meeting.
PROPOSAL 1
To elect a Board of Trustees.
| | # of
Votes | % of
Votes |
| James C. Curvey |
| Affirmative | 3,005,845,657.89 | 94.803 |
| Withheld | 164,788,708.80 | 5.197 |
| TOTAL | 3,170,634,366.69 | 100.000 |
| Dennis J. Dirks |
| Affirmative | 3,025,050,303.47 | 95.409 |
| Withheld | 145,584,063.22 | 4.591 |
| TOTAL | 3,170,634,366.69 | 100.000 |
| Donald F. Donahue |
| Affirmative | 3,024,923,660.98 | 95.405 |
| Withheld | 145,710,705.71 | 4.595 |
| TOTAL | 3,170,634,366.69 | 100.000 |
| Alan J. Lacy |
| Affirmative | 3,024,272,946.71 | 95.384 |
| Withheld | 146,361,419.98 | 4.616 |
| TOTAL | 3,170,634,366.69 | 100.00 |
| Ned C. Lautenbach |
| Affirmative | 3,011,847,006.14 | 94.992 |
| Withheld | 158,787,360.55 | 5.008 |
| TOTAL | 3,170,634,366.69 | 100.000 |
| Joseph Mauriello |
| Affirmative | 3,021,074,746.00 | 95.283 |
| Withheld | 149,559,620.69 | 4.717 |
| TOTAL | 3,170,634,366.69 | 100.000 |
| Charles S. Morrison |
| Affirmative | 3,025,083,795.43 | 95.410 |
| Withheld | 145,550,571.26 | 4.590 |
| TOTAL | 3,170,634,366.69 | 100.000 |
| Cornelia M. Small |
| Affirmative | 3,016,566,905.34 | 95.141 |
| Withheld | 154,067,461.35 | 4.859 |
| TOTAL | 3,170,634,366.69 | 100.000 |
| Garnett A. Smith |
| Affirmative | 3,014,927,605.85 | 95.090 |
| Withheld | 155,706,760.84 | 4.910 |
| TOTAL | 3,170,634,366.69 | 100.000 |
| David M. Thomas |
| Affirmative | 3,025,900,428.75 | 95.436 |
| Withheld | 144,733,937.94 | 4.564 |
| TOTAL | 3,170,634,366.69 | 100.000 |
| Michael E. Wiley |
| Affirmative | 3,023,436,110.39 | 95.358 |
| Withheld | 147,198,256.30 | 4.642 |
| TOTAL | 3,170,634,366.69 | 100.000 |
PROPOSAL 2
To eliminate a fundamental investment policy.
| | # of
Votes | % of
Votes |
| Affirmative | 219,209,160.07 | 79.707 |
| Against | 24,192,657.45 | 8.797 |
| Abstain | 31,616,955.45 | 11.496 |
| TOTAL | 275,018,772.97 | 100.000 |
|
| Proposal 1 reflects trust wide proposal and voting results. |
VNRIC-ANN-0218
1.817379.112
Fidelity® Variable Insurance Products: Health Care Portfolio
Annual Report December 31, 2017 |
|
Contents
To view a fund's proxy voting guidelines and proxy voting record for the 12-month period ended June 30, visit http://www.fidelity.com/proxyvotingresults or visit the Securities and Exchange Commission's (SEC) web site at http://www.sec.gov.
You may also call 1-877-208-0098 to request a free copy of the proxy voting guidelines.
Fidelity® Variable Insurance Products are separate account options which are purchased through a variable insurance contract.
Standard & Poor's, S&P and S&P 500 are registered service marks of The McGraw-Hill Companies, Inc. and have been licensed for use by Fidelity Distributors Corporation.
Other third-party marks appearing herein are the property of their respective owners.
All other marks appearing herein are registered or unregistered trademarks or service marks of FMR LLC or an affiliated company. © 2018 FMR LLC. All rights reserved.
This report and the financial statements contained herein are submitted for the general information of the shareholders of the Fund. This report is not authorized for distribution to prospective investors in the Fund unless preceded or accompanied by an effective prospectus.
A fund files its complete schedule of portfolio holdings with the SEC for the first and third quarters of each fiscal year on Form N-Q. Forms N-Q are available on the SEC’s web site at http://www.sec.gov. A fund's Forms N-Q may be reviewed and copied at the SEC’s Public Reference Room in Washington, DC. Information regarding the operation of the SEC's Public Reference Room may be obtained by calling 1-800-SEC-0330.
For a complete list of a fund's portfolio holdings, view the most recent holdings listing, semiannual report, or annual report on Fidelity's web site at http://www.fidelity.com, http://www.institutional.fidelity.com, or http://www.401k.com, as applicable.
NOT FDIC INSURED •MAY LOSE VALUE •NO BANK GUARANTEE
Neither the Fund nor Fidelity Distributors Corporation is a bank.
Performance: The Bottom Line
Average annual total return reflects the change in the value of an investment, assuming reinvestment of distributions from dividend income and capital gains (the profits earned upon the sale of securities that have grown in value, if any) and assuming a constant rate of performance each year. During periods of reimbursement by Fidelity, a fund’s total return will be greater than it would be had the reimbursement not occurred. Performance numbers are net of all underlying fund operating expenses, but do not include any insurance charges imposed by your insurance company’s separate account. If performance information included the effect of these additional charges, the total returns would have been lower. How a fund did yesterday is no guarantee of how it will do tomorrow.
Average Annual Total Returns
| For the periods ended December 31, 2017 | Past 1 year | Past 5 years | Past 10 years |
| Initial Class | 25.05% | 19.83% | 13.05% |
| Investor Class | 24.97% | 19.72% | 12.96% |
$10,000 Over 10 Years
Let's say hypothetically that $10,000 was invested in VIP Health Care Portfolio - Initial Class on December 31, 2007.
The chart shows how the value of your investment would have changed, and also shows how the S&P 500® Index performed over the same period.
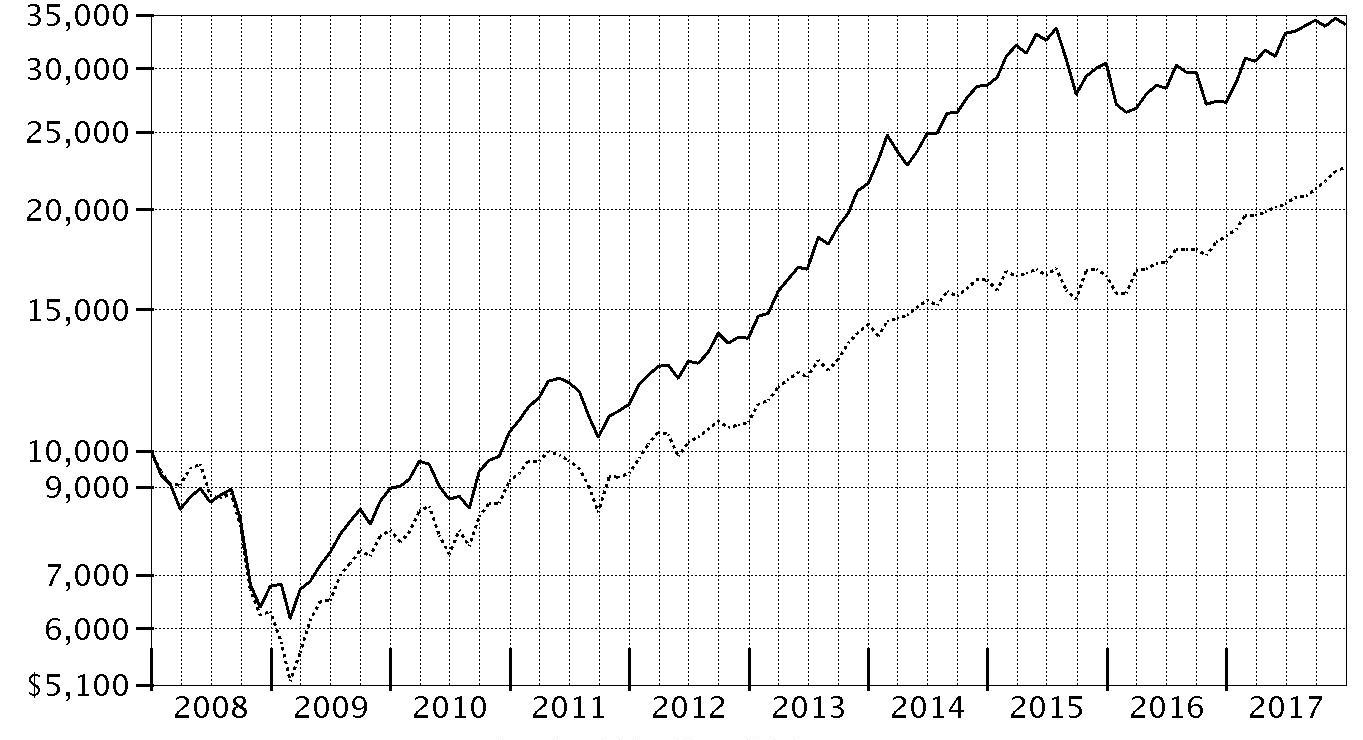
| Period Ending Values |
| $34,103 | VIP Health Care Portfolio - Initial Class |
| $22,603 | S&P 500® Index |
Management's Discussion of Fund Performance
Market Recap: U.S. equities gained 21.83% in 2017, as the S&P 500
® index rose steadily and closed the year just shy of an all-time high after a particularly strong three-month finish. Early on, equities rallied on optimism for President Trump’s pro-business agenda but leveled off in March amid fading optimism and stalled efforts by Congress to repeal and replace the Affordable Care Act. Upward momentum soon returned and continued through year-end with consumer sentiment and other market indicators staying positive. The lone exception was a brief cooldown in August, when geopolitical tension escalated and uncertainty grew regarding the future of health care, tax reform and the debt ceiling. Sector-wise, information technology fared best by a wide margin, rising 39% amid strong earnings growth from several major index constituents. A 24% gain in materials was spurred by increased demand, especially from China. Consumer discretionary gained 23%, despite many brick-and-mortar retailers suffering from online competition, and financials edged the broader market on an uptick in bond yields. Conversely, the defensive energy and telecom services sectors returned about -1% each. Rising interest rates held back real estate (+11%), while consumer staples (+13%) and utilities (+12%) struggled due to investors’ general preference for risk assets.
Comments from Portfolio Manager Eddie Yoon: For the year, the fund's share classes gained about 25%, outpacing the 23.44% result of the MSCI U.S. IMI Health Care 25/50 Index, as well as the broad-market S&P 500
® index. In general, health care companies enjoyed solid balance sheets, fair valuations and rising demand for their products and services the past year. Versus the MSCI sector index, the fund benefited from a combination of owning more-opportunistic stocks and avoiding some more-defensive index names. Security selection in the biotechnology industry was by far the most helpful. A large overweighting in Vertex Pharmaceuticals was the top individual relative contributor by a wide margin, as our position rose 103%, with notable jumps in March and July following news of positive trial results for its combination therapies. Largely avoiding Merck and Celgene also helped relative results, as both stocks lost ground the past year. Merck shares declined along with other large-cap, more-defensive names, while Celgene took an October tumble amid a flurry of negative news, including the announcement that the company would cease trials for its candidate compound to treat Crohn’s disease. Neither was held at year-end. I'll also note that the fund's foreign holdings contributed overall, aided in part by a broadly weaker U.S. dollar. Conversely, our large overweighting in Allergan was the biggest detractor by a wide margin, as shares of the drugmaker returned about -21% amid the firm’s legal battle related to intellectual property. In October, Allergan lost the patent lawsuit, potentially opening the door for early generic competition for one of its drugs. Relative performance was hurt by avoiding index component AbbVie (+60%), which made a strong advance in early September when the company secured surprise patent protection for its rheumatoid arthritis blockbuster, and had favorable clinical results.
The views expressed above reflect those of the portfolio manager(s) only through the end of the period as stated on the cover of this report and do not necessarily represent the views of Fidelity or any other person in the Fidelity organization. Any such views are subject to change at any time based upon market or other conditions and Fidelity disclaims any responsibility to update such views. These views may not be relied on as investment advice and, because investment decisions for a Fidelity fund are based on numerous factors, may not be relied on as an indication of trading intent on behalf of any Fidelity fund.
Note to shareholders: On December 8, 2017, shareholders approved proposals from the Board of Trustees to eliminate each sector/industry fund's fundamental “invests primarily” policy and to modify the fundamental concentration policy for certain funds. The changes took effect on January 1, 2018, and do not impact how the funds are managed.
Investment Summary (Unaudited)
Top Ten Stocks as of December 31, 2017
| | % of fund's net assets |
| UnitedHealth Group, Inc. | 8.4 |
| Amgen, Inc. | 7.4 |
| Becton, Dickinson & Co. | 6.3 |
| Boston Scientific Corp. | 4.5 |
| Cigna Corp. | 4.3 |
| Humana, Inc. | 4.0 |
| Biogen, Inc. | 3.6 |
| Bristol-Myers Squibb Co. | 3.2 |
| Cerner Corp. | 2.5 |
| Allergan PLC | 2.5 |
| | 46.7 |
Top Industries (% of fund's net assets)
| As of December 31, 2017 |
| | Biotechnology | 32.8% |
| | Health Care Providers & Services | 22.0% |
| | Health Care Equipment & Supplies | 21.5% |
| | Pharmaceuticals | 15.8% |
| | Health Care Technology | 3.6% |
| | All Others* | 4.3% |

* Includes short-term investments and net other assets (liabilities).
Investments December 31, 2017
Showing Percentage of Net Assets
| Common Stocks - 98.6% | | | |
| | | Shares | Value |
| Biotechnology - 32.6% | | | |
| Biotechnology - 32.6% | | | |
| Abeona Therapeutics, Inc. (a)(b) | | 130,000 | $2,060,500 |
| Ablynx NV (a)(b) | | 260,000 | 6,463,832 |
| Ablynx NV sponsored ADR | | 32,100 | 802,179 |
| AC Immune SA (a)(b) | | 116,000 | 1,484,800 |
| Acceleron Pharma, Inc. (a) | | 80,000 | 3,395,200 |
| Acorda Therapeutics, Inc. (a) | | 100,000 | 2,145,000 |
| Alexion Pharmaceuticals, Inc. (a) | | 90,000 | 10,763,100 |
| Alnylam Pharmaceuticals, Inc. (a) | | 72,900 | 9,261,945 |
| Amgen, Inc. | | 306,000 | 53,213,400 |
| Amicus Therapeutics, Inc. (a) | | 180,000 | 2,590,200 |
| AnaptysBio, Inc. | | 70,000 | 7,050,400 |
| Argenx SE ADR | | 22,100 | 1,395,394 |
| Ascendis Pharma A/S sponsored ADR (a) | | 85,700 | 3,433,142 |
| Audentes Therapeutics, Inc. (a) | | 66,700 | 2,084,375 |
| BeiGene Ltd. ADR (a) | | 43,600 | 4,260,592 |
| Biogen, Inc. (a) | | 80,000 | 25,485,600 |
| BioMarin Pharmaceutical, Inc. (a) | | 66,000 | 5,885,220 |
| bluebird bio, Inc. (a) | | 26,700 | 4,755,270 |
| Blueprint Medicines Corp. (a) | | 97,400 | 7,344,934 |
| Cellectis SA sponsored ADR (a)(b) | | 86,200 | 2,512,730 |
| Clovis Oncology, Inc. (a) | | 28,000 | 1,904,000 |
| Curis, Inc. (a) | | 82,800 | 57,960 |
| CytomX Therapeutics, Inc. (a) | | 58,200 | 1,228,602 |
| Five Prime Therapeutics, Inc. (a) | | 43,700 | 957,904 |
| GlycoMimetics, Inc. (a)(b) | | 90,100 | 1,512,779 |
| Heron Therapeutics, Inc. (a) | | 87,987 | 1,592,565 |
| Insmed, Inc. (a) | | 288,613 | 8,998,953 |
| Intercept Pharmaceuticals, Inc. (a)(b) | | 37,292 | 2,178,599 |
| La Jolla Pharmaceutical Co. (a) | | 34,900 | 1,123,082 |
| Loxo Oncology, Inc. (a)(b) | | 56,000 | 4,714,080 |
| Neurocrine Biosciences, Inc. (a) | | 116,900 | 9,070,271 |
| Prothena Corp. PLC (a) | | 5,906 | 221,416 |
| Puma Biotechnology, Inc. (a) | | 25,000 | 2,471,250 |
| Regeneron Pharmaceuticals, Inc. (a) | | 5,000 | 1,879,800 |
| Sarepta Therapeutics, Inc. (a)(b) | | 112,720 | 6,271,741 |
| Spark Therapeutics, Inc. (a) | | 80,000 | 4,113,600 |
| TESARO, Inc. (a)(b) | | 88,000 | 7,292,560 |
| uniQure B.V. (a) | | 52,893 | 1,036,174 |
| Vertex Pharmaceuticals, Inc. (a) | | 106,000 | 15,885,160 |
| Xencor, Inc. (a) | | 130,000 | 2,849,600 |
| Zai Lab Ltd. ADR (b) | | 60,000 | 1,273,800 |
| | | | 233,021,709 |
| Diversified Consumer Services - 0.3% | | | |
| Specialized Consumer Services - 0.3% | | | |
| Carriage Services, Inc. | | 80,759 | 2,076,314 |
| Diversified Financial Services - 0.4% | | | |
| Other Diversified Financial Services - 0.4% | | | |
| RPI International Holdings LP (a)(c)(d) | | 21,133 | 2,916,671 |
| Food & Staples Retailing - 1.3% | | | |
| Drug Retail - 1.3% | | | |
| CVS Health Corp. | | 128,000 | 9,280,000 |
| Health Care Equipment & Supplies - 21.0% | | | |
| Health Care Equipment - 20.4% | | | |
| Atricure, Inc. (a) | | 180,000 | 3,283,200�� |
| Becton, Dickinson & Co. | | 210,000 | 44,952,600 |
| Boston Scientific Corp. (a) | | 1,287,700 | 31,922,083 |
| Danaher Corp. | | 74,000 | 6,868,680 |
| DexCom, Inc. (a)(b) | | 110,000 | 6,312,900 |
| Fisher & Paykel Healthcare Corp. | | 200,000 | 2,033,969 |
| Insulet Corp. (a) | | 126,000 | 8,694,000 |
| Integra LifeSciences Holdings Corp. (a) | | 150,000 | 7,179,000 |
| Intuitive Surgical, Inc. (a) | | 48,200 | 17,590,108 |
| Medtronic PLC | | 28,000 | 2,261,000 |
| Penumbra, Inc. (a) | | 77,500 | 7,292,750 |
| Wright Medical Group NV (a) | | 325,000 | 7,215,000 |
| | | | 145,605,290 |
| Health Care Supplies - 0.6% | | | |
| Dentsply Sirona, Inc. | | 65,000 | 4,278,950 |
|
| TOTAL HEALTH CARE EQUIPMENT & SUPPLIES | | | 149,884,240 |
|
| Health Care Providers & Services - 21.8% | | | |
| Health Care Distributors & Services - 0.9% | | | |
| Amplifon SpA | | 120,000 | 1,848,729 |
| EBOS Group Ltd. | | 350,000 | 4,601,235 |
| | | | 6,449,964 |
| Health Care Facilities - 1.4% | | | |
| HCA Holdings, Inc. (a) | | 114,000 | 10,013,760 |
| Health Care Services - 2.6% | | | |
| G1 Therapeutics, Inc. | | 80,000 | 1,587,200 |
| Premier, Inc. (a) | | 120,000 | 3,502,800 |
| Teladoc, Inc. (a)(b) | | 290,000 | 10,106,500 |
| United Drug PLC (United Kingdom) | | 280,000 | 3,194,455 |
| | | | 18,390,955 |
| Managed Health Care - 16.9% | | | |
| Aetna, Inc. | | 10,000 | 1,803,900 |
| Cigna Corp. | | 150,000 | 30,463,500 |
| Humana, Inc. | | 116,000 | 28,776,120 |
| UnitedHealth Group, Inc. | | 272,000 | 59,965,119 |
| | | | 121,008,639 |
|
| TOTAL HEALTH CARE PROVIDERS & SERVICES | | | 155,863,318 |
|
| Health Care Technology - 3.6% | | | |
| Health Care Technology - 3.6% | | | |
| athenahealth, Inc. (a) | | 34,000 | 4,523,360 |
| Castlight Health, Inc. (a) | | 104,900 | 393,375 |
| Cerner Corp. (a) | | 265,000 | 17,858,350 |
| Medidata Solutions, Inc. (a) | | 48,000 | 3,041,760 |
| | | | 25,816,845 |
| Internet Software & Services - 0.8% | | | |
| Internet Software & Services - 0.8% | | | |
| Benefitfocus, Inc. (a)(b) | | 200,000 | 5,400,000 |
| Life Sciences Tools & Services - 1.0% | | | |
| Life Sciences Tools & Services - 1.0% | | | |
| Agilent Technologies, Inc. | | 100,000 | 6,697,000 |
| Pharmaceuticals - 15.8% | | | |
| Pharmaceuticals - 15.8% | | | |
| Allergan PLC | | 108,000 | 17,666,640 |
| AstraZeneca PLC (United Kingdom) | | 195,000 | 13,456,092 |
| Avexis, Inc. (a) | | 7,400 | 818,958 |
| Bristol-Myers Squibb Co. | | 370,000 | 22,673,600 |
| Dechra Pharmaceuticals PLC | | 220,000 | 6,225,812 |
| Eisai Co. Ltd. | | 40,000 | 2,277,701 |
| Indivior PLC (a) | | 720,000 | 3,968,145 |
| Jazz Pharmaceuticals PLC (a) | | 38,000 | 5,116,700 |
| Jiangsu Hengrui Medicine Co. Ltd. (A Shares) | | 599,937 | 6,360,209 |
| Mallinckrodt PLC (a) | | 155,000 | 3,496,800 |
| MyoKardia, Inc. (a) | | 8,840 | 372,164 |
| Nektar Therapeutics (a) | | 67,000 | 4,001,240 |
| Roche Holding AG (participation certificate) | | 56,000 | 14,159,901 |
| The Medicines Company (a)(b) | | 119,590 | 3,269,591 |
| TherapeuticsMD, Inc. (a)(b) | | 420,000 | 2,536,800 |
| Theravance Biopharma, Inc. (a)(b) | | 153,800 | 4,289,482 |
| Tonghua Dongbao Pharmaceutical Co. Ltd. Class A | | 660,000 | 2,321,840 |
| | | | 113,011,675 |
| TOTAL COMMON STOCKS | | | |
| (Cost $522,263,433) | | | 703,967,772 |
|
| Preferred Stocks - 1.2% | | | |
| Convertible Preferred Stocks - 0.7% | | | |
| Biotechnology - 0.2% | | | |
| Biotechnology - 0.2% | | | |
| BioNTech AG Series A (c)(d)(e) | | 6,948 | 1,521,672 |
| Health Care Providers & Services - 0.2% | | | |
| Health Care Services - 0.2% | | | |
| 1Life Healthcare, Inc. Series G (a)(c)(d) | | 181,172 | 1,329,802 |
| Software - 0.1% | | | |
| Application Software - 0.1% | | | |
| Outset Medical, Inc. Series C (c)(d) | | 308,701 | 676,055 |
| Textiles, Apparel & Luxury Goods - 0.2% | | | |
| Textiles - 0.2% | | | |
| Harmony Biosciences II, Inc. Series A (c)(d) | | 1,195,827 | 1,195,827 |
|
| TOTAL CONVERTIBLE PREFERRED STOCKS | | | 4,723,356 |
|
| Nonconvertible Preferred Stocks - 0.5% | | | |
| Health Care Equipment & Supplies - 0.5% | | | |
| Health Care Equipment - 0.5% | | | |
| Sartorius AG (non-vtg.) | | 40,000 | 3,817,443 |
| TOTAL PREFERRED STOCKS | | | |
| (Cost $8,713,819) | | | 8,540,799 |
|
| Money Market Funds - 7.4% | | | |
| Fidelity Cash Central Fund, 1.36% (f) | | 4,031,145 | 4,031,951 |
| Fidelity Securities Lending Cash Central Fund 1.36% (f)(g) | | 48,961,986 | 48,971,779 |
| TOTAL MONEY MARKET FUNDS | | | |
| (Cost $52,996,376) | | | 53,003,730 |
| TOTAL INVESTMENT IN SECURITIES - 107.2% | | | |
| (Cost $583,973,628) | | | 765,512,301 |
| NET OTHER ASSETS (LIABILITIES) - (7.2)% | | | (51,456,274) |
| NET ASSETS - 100% | | | $714,056,027 |
Legend
(a) Non-income producing
(b) Security or a portion of the security is on loan at period end.
(c) Restricted securities - Investment in securities not registered under the Securities Act of 1933 (excluding 144A issues). At the end of the period, the value of restricted securities (excluding 144A issues) amounted to $7,640,027 or 1.1% of net assets.
(d) Level 3 security
(e) Security or a portion of the security purchased on a delayed delivery or when-issued basis.
(f) Affiliated fund that is generally available only to investment companies and other accounts managed by Fidelity Investments. The rate quoted is the annualized seven-day yield of the fund at period end. A complete unaudited listing of the fund's holdings as of its most recent quarter end is available upon request. In addition, each Fidelity Central Fund's financial statements, which are not covered by the Fund's Report of Independent Registered Public Accounting Firm, are available on the SEC's website or upon request.
(g) Investment made with cash collateral received from securities on loan.
Additional information on each restricted holding is as follows:
| Security | Acquisition Date | Acquisition Cost |
| 1Life Healthcare, Inc. Series G | 4/10/14 | $1,193,163 |
| BioNTech AG Series A | 12/29/17 | $1,521,672 |
| Harmony Biosciences II, Inc. Series A | 9/22/17 | $1,195,827 |
| Outset Medical, Inc. Series C | 4/19/17 | $799,999 |
| RPI International Holdings LP | 5/21/15 - 3/23/16 | $2,801,500 |
Affiliated Central Funds
Information regarding fiscal year to date income earned by the Fund from investments in Fidelity Central Funds is as follows:
| Fund | Income earned |
| Fidelity Cash Central Fund | $75,995 |
| Fidelity Securities Lending Cash Central Fund | 563,301 |
| Total | $639,296 |
Amounts in the income column in the above table include any capital gain distributions from underlying funds, which are presented in the corresponding line-item in the Statement of Operations if applicable.
Investment Valuation
The following is a summary of the inputs used, as of December 31, 2017, involving the Fund's assets and liabilities carried at fair value. The inputs or methodology used for valuing securities may not be an indication of the risk associated with investing in those securities. For more information on valuation inputs, and their aggregation into the levels used below, please refer to the Investment Valuation section in the accompanying Notes to Financial Statements.
| | Valuation Inputs at Reporting Date: |
| Description | Total | Level 1 | Level 2 | Level 3 |
| Investments in Securities: | | | | |
| Common Stocks | $703,967,772 | $673,435,108 | $27,615,993 | $2,916,671 |
| Preferred Stocks | 8,540,799 | 3,817,443 | -- | 4,723,356 |
| Money Market Funds | 53,003,730 | 53,003,730 | -- | -- |
| Total Investments in Securities: | $765,512,301 | $730,256,281 | $27,615,993 | $7,640,027 |
The following is a reconciliation of Investments in Securities for which Level 3 inputs were used in determining value:
| Investments in Securities: | |
| Beginning Balance | $3,941,585 |
| Total Realized Gain (Loss) | -- |
| Total Unrealized Gain (Loss) | 180,945 |
| Cost of Purchases | 3,517,497 |
| Proceeds of Sales | -- |
| Amortization/Accretion | -- |
| Transfers in to Level 3 | -- |
| Transfers out of Level 3 | -- |
| Ending Balance | $7,640,027 |
| The change in unrealized gain (loss) for the period attributable to Level 3 securities held at December 31, 2017 | $180,945 |
The information used in the above reconciliation represents fiscal year to date activity for any Investments in Securities identified as using Level 3 inputs at either the beginning or the end of the current fiscal period. Transfers in or out of Level 3 represent the beginning value of any Security or Instrument where a change in the pricing level occurred from the beginning to the end of the period. The cost of purchases and the proceeds of sales may include securities received or delivered through corporate actions or exchanges. Realized and unrealized gains (losses) disclosed in the reconciliation are included in Net Gain (Loss) on the Fund's Statement of Operations.
Other Information
Distribution of investments by country or territory of incorporation, as a percentage of Total Net Assets, is as follows (Unaudited):
| United States of America | 82.3% |
| Ireland | 4.5% |
| United Kingdom | 3.3% |
| Switzerland | 2.2% |
| Cayman Islands | 1.4% |
| China | 1.2% |
| Netherlands | 1.1% |
| Belgium | 1.0% |
| Others (Individually Less Than 1%) | 3.0% |
| | 100.0% |
See accompanying notes which are an integral part of the financial statements.
Financial Statements
Statement of Assets and Liabilities
| | | December 31, 2017 |
| Assets | | |
Investment in securities, at value (including securities loaned of $47,342,830) — See accompanying schedule:
Unaffiliated issuers (cost $530,977,252) | $712,508,571 | |
| Fidelity Central Funds (cost $52,996,376) | 53,003,730 | |
| Total Investment in Securities (cost $583,973,628) | | $765,512,301 |
| Cash | | 62,577 |
| Receivable for investments sold | | 584,307 |
| Dividends receivable | | 140,418 |
| Distributions receivable from Fidelity Central Funds | | 51,566 |
| Prepaid expenses | | 3,494 |
| Other receivables | | 17,115 |
| Total assets | | 766,371,778 |
| Liabilities | | |
| Payable for investments purchased | | |
| Regular delivery | $1,115,581 | |
| Delayed delivery | 1,521,672 | |
| Payable for fund shares redeemed | 211,983 | |
| Accrued management fee | 324,354 | |
| Other affiliated payables | 100,671 | |
| Other payables and accrued expenses | 78,528 | |
| Collateral on securities loaned | 48,962,962 | |
| Total liabilities | | 52,315,751 |
| Net Assets | | $714,056,027 |
| Net Assets consist of: | | |
| Paid in capital | | $525,060,762 |
| Undistributed net investment income | | 354,945 |
| Accumulated undistributed net realized gain (loss) on investments and foreign currency transactions | | 7,102,354 |
| Net unrealized appreciation (depreciation) on investments and assets and liabilities in foreign currencies | | 181,537,966 |
| Net Assets | | $714,056,027 |
| Initial Class: | | |
| Net Asset Value, offering price and redemption price per share ($131,698,317 ÷ 4,980,463 shares) | | $26.44 |
| Investor Class: | | |
| Net Asset Value, offering price and redemption price per share ($582,357,710 ÷ 22,203,225 shares) | | $26.23 |
See accompanying notes which are an integral part of the financial statements.
Statement of Operations
| | | Year ended December 31, 2017 |
| Investment Income | | |
| Dividends | | $6,310,946 |
| Income from Fidelity Central Funds (including $563,301 from security lending) | | 639,296 |
| Total income | | 6,950,242 |
| Expenses | | |
| Management fee | $3,938,834 | |
| Transfer agent fees | 951,874 | |
| Accounting and security lending fees | 266,176 | |
| Custodian fees and expenses | 35,601 | |
| Independent trustees' fees and expenses | 16,397 | |
| Audit | 47,699 | |
| Legal | 13,021 | |
| Miscellaneous | 45,979 | |
| Total expenses before reductions | 5,315,581 | |
| Expense reductions | (45,941) | 5,269,640 |
| Net investment income (loss) | | 1,680,602 |
| Realized and Unrealized Gain (Loss) | | |
| Net realized gain (loss) on: | | |
| Investment securities: | | |
| Unaffiliated issuers | 45,234,022 | |
| Fidelity Central Funds | 1,028 | |
| Foreign currency transactions | (33,276) | |
| Total net realized gain (loss) | | 45,201,774 |
| Change in net unrealized appreciation (depreciation) on: | | |
| Investment securities: | | |
| Unaffiliated issuers | 109,349,020 | |
| Fidelity Central Funds | 3,730 | |
| Assets and liabilities in foreign currencies | 2,719 | |
| Total change in net unrealized appreciation (depreciation) | | 109,355,469 |
| Net gain (loss) | | 154,557,243 |
| Net increase (decrease) in net assets resulting from operations | | $156,237,845 |
See accompanying notes which are an integral part of the financial statements.
Statement of Changes in Net Assets
| | Year ended December 31, 2017 | Year ended December 31, 2016 |
| Increase (Decrease) in Net Assets | | |
| Operations | | |
| Net investment income (loss) | $1,680,602 | $1,047,501 |
| Net realized gain (loss) | 45,201,774 | (28,877,605) |
| Change in net unrealized appreciation (depreciation) | 109,355,469 | (75,558,880) |
| Net increase (decrease) in net assets resulting from operations | 156,237,845 | (103,388,984) |
| Distributions to shareholders from net investment income | (1,512,371) | (773,247) |
| Distributions to shareholders from net realized gain | (2,734,725) | (68,524,802) |
| Total distributions | (4,247,096) | (69,298,049) |
| Share transactions - net increase (decrease) | (98,699,996) | (213,049,661) |
| Redemption fees | 49,993 | 89,999 |
| Total increase (decrease) in net assets | 53,340,746 | (385,646,695) |
| Net Assets | | |
| Beginning of period | 660,715,281 | 1,046,361,976 |
| End of period | $714,056,027 | $660,715,281 |
| Other Information | | |
| Undistributed net investment income end of period | $354,945 | $186,713 |
See accompanying notes which are an integral part of the financial statements.
Financial Highlights
VIP Health Care Portfolio Initial Class
| Years ended December 31, | 2017 | 2016 | 2015 | 2014 | 2013 |
| Selected Per–Share Data | | | | | |
| Net asset value, beginning of period | $21.28 | $25.92 | $27.70 | $22.56 | $15.51 |
| Income from Investment Operations | | | | | |
| Net investment income (loss)A | .07 | .04 | –B | (.02) | –B |
| Net realized and unrealized gain (loss) | 5.26 | (2.86) | 1.70 | 7.21 | 8.42 |
| Total from investment operations | 5.33 | (2.82) | 1.70 | 7.19 | 8.42 |
| Distributions from net investment income | (.07) | (.04) | – | – | – |
| Distributions from net realized gain | (.10) | (1.78) | (3.49) | (2.06) | (1.37) |
| Total distributions | (.17) | (1.82) | (3.49) | (2.06) | (1.37) |
| Redemption fees added to paid in capitalA | –B | –B | .01 | .01 | –B |
| Net asset value, end of period | $26.44 | $21.28 | $25.92 | $27.70 | $22.56 |
| Total ReturnC,D | 25.05% | (10.43)% | 6.37% | 32.83% | 56.12% |
| Ratios to Average Net AssetsE,F | | | | | |
| Expenses before reductions | .67% | .67% | .66% | .67% | .69% |
| Expenses net of fee waivers, if any | .67% | .67% | .66% | .67% | .69% |
| Expenses net of all reductions | .66% | .66% | .65% | .66% | .68% |
| Net investment income (loss) | .30% | .19% | - %G | (.07)% | (.01)% |
| Supplemental Data | | | | | |
| Net assets, end of period (000 omitted) | $131,698 | $130,887 | $226,283 | $236,566 | $167,493 |
| Portfolio turnover rateH | 74% | 53% | 77% | 104% | 93% |
A Calculated based on average shares outstanding during the period.
B Amount represents less than $.005 per share.
C Total returns do not reflect charges attributable to your insurance company's separate account. Inclusion of these charges would reduce the total returns shown.
D Total returns would have been lower if certain expenses had not been reduced during the applicable periods shown.
E Fees and expenses of any underlying Fidelity Central Funds are not included in the Fund's expense ratio. The Fund indirectly bears its proportionate share of the expenses of any underlying Fidelity Central Funds.
F Expense ratios reflect operating expenses of the class. Expenses before reductions do not reflect amounts reimbursed by the investment adviser or reductions from brokerage service arrangements or reductions from other expense offset arrangements and do not represent the amount paid by the class during periods when reimbursements or reductions occur. Expenses net of fee waivers reflect expenses after reimbursement by the investment adviser but prior to reductions from brokerage service arrangements or other expense offset arrangements. Expenses net of all reductions represent the net expenses paid by the class.
G Amount represents less than .005%.
H Amount does not include the portfolio activity of any underlying Fidelity Central Funds.
See accompanying notes which are an integral part of the financial statements.
VIP Health Care Portfolio Investor Class
| Years ended December 31, | 2017 | 2016 | 2015 | 2014 | 2013 |
| Selected Per–Share Data | | | | | |
| Net asset value, beginning of period | $21.11 | $25.73 | $27.52 | $22.43 | $15.44 |
| Income from Investment Operations | | | | | |
| Net investment income (loss)A | .05 | .02 | (.02) | (.04) | (.02) |
| Net realized and unrealized gain (loss) | 5.22 | (2.84) | 1.69 | 7.17 | 8.37 |
| Total from investment operations | 5.27 | (2.82) | 1.67 | 7.13 | 8.35 |
| Distributions from net investment income | (.05) | (.02) | – | – | – |
| Distributions from net realized gain | (.10) | (1.78) | (3.47) | (2.05) | (1.36) |
| Total distributions | (.15) | (1.80) | (3.47) | (2.05) | (1.36) |
| Redemption fees added to paid in capitalA | –B | –B | .01 | .01 | –B |
| Net asset value, end of period | $26.23 | $21.11 | $25.73 | $27.52 | $22.43 |
| Total ReturnC,D | 24.97% | (10.51)% | 6.29% | 32.72% | 55.91% |
| Ratios to Average Net AssetsE,F | | | | | |
| Expenses before reductions | .75% | .75% | .74% | .75% | .77% |
| Expenses net of fee waivers, if any | .75% | .75% | .74% | .75% | .77% |
| Expenses net of all reductions | .74% | .75% | .73% | .74% | .76% |
| Net investment income (loss) | .22% | .11% | (.08)% | (.15)% | (.10)% |
| Supplemental Data | | | | | |
| Net assets, end of period (000 omitted) | $582,358 | $529,828 | $820,079 | $669,762 | $384,285 |
| Portfolio turnover rateG | 74% | 53% | 77% | 104% | 93% |
A Calculated based on average shares outstanding during the period.
B Amount represents less than $.005 per share.
C Total returns do not reflect charges attributable to your insurance company's separate account. Inclusion of these charges would reduce the total returns shown.
D Total returns would have been lower if certain expenses had not been reduced during the applicable periods shown.
E Fees and expenses of any underlying Fidelity Central Funds are not included in the Fund's expense ratio. The Fund indirectly bears its proportionate share of the expenses of any underlying Fidelity Central Funds.
F Expense ratios reflect operating expenses of the class. Expenses before reductions do not reflect amounts reimbursed by the investment adviser or reductions from brokerage service arrangements or reductions from other expense offset arrangements and do not represent the amount paid by the class during periods when reimbursements or reductions occur. Expenses net of fee waivers reflect expenses after reimbursement by the investment adviser but prior to reductions from brokerage service arrangements or other expense offset arrangements. Expenses net of all reductions represent the net expenses paid by the class.
G Amount does not include the portfolio activity of any underlying Fidelity Central Funds.
See accompanying notes which are an integral part of the financial statements.
Notes to Financial Statements
For the period ended December 31, 2017
1. Organization.
VIP Health Care Portfolio (the Fund) is a non-diversified fund of Variable Insurance Products Fund IV (the Trust) and is authorized to issue an unlimited number of shares. The Trust is registered under the Investment Company Act of 1940, as amended (the 1940 Act), as an open-end management investment company organized as a Massachusetts business trust. Shares of the Fund may only be purchased by insurance companies for the purpose of funding variable annuity or variable life insurance contracts. The Fund offers the following classes of shares: Initial Class shares and Investor Class shares. All classes have equal rights and voting privileges, except for matters affecting a single class.
2. Investments in Fidelity Central Funds.
The Fund invests in Fidelity Central Funds, which are open-end investment companies generally available only to other investment companies and accounts managed by the investment adviser and its affiliates. The Fund's Schedule of Investments lists each of the Fidelity Central Funds held as of period end, if any, as an investment of the Fund, but does not include the underlying holdings of each Fidelity Central Fund. As an Investing Fund, the Fund indirectly bears its proportionate share of the expenses of the underlying Fidelity Central Funds.
The Money Market Central Funds seek preservation of capital and current income and are managed by Fidelity Investments Money Management, Inc. (FIMM), an affiliate of the investment adviser. Annualized expenses of the Money Market Central Funds as of their most recent shareholder report date are less than .005%.
A complete unaudited list of holdings for each Fidelity Central Fund is available upon request or at the Securities and Exchange Commission (the SEC) website at www.sec.gov. In addition, the financial statements of the Fidelity Central Funds, which are not covered by the Fund's Report of Independent Registered Public Accounting Firm, are available on the SEC website or upon request.
3. Significant Accounting Policies.
The Fund is an investment company and applies the accounting and reporting guidance of the Financial Accounting Standards Board (FASB) Accounting Standards Codification Topic 946 Financial Services – Investments Companies. The financial statements have been prepared in conformity with accounting principles generally accepted in the United States of America (GAAP), which require management to make certain estimates and assumptions at the date of the financial statements. Actual results could differ from those estimates. Subsequent events, if any, through the date that the financial statements were issued have been evaluated in the preparation of the financial statements. The following summarizes the significant accounting policies of the Fund:
Investment Valuation. Investments are valued as of 4:00 p.m. Eastern time on the last calendar day of the period. The Board of Trustees (the Board) has delegated the day to day responsibility for the valuation of the Fund's investments to the Fair Value Committee (the Committee) established by the Fund's investment adviser. In accordance with valuation policies and procedures approved by the Board, the Fund attempts to obtain prices from one or more third party pricing vendors or brokers to value its investments. When current market prices, quotations or currency exchange rates are not readily available or reliable, investments will be fair valued in good faith by the Committee, in accordance with procedures adopted by the Board. Factors used in determining fair value vary by investment type and may include market or investment specific events. The frequency with which these procedures are used cannot be predicted and they may be utilized to a significant extent. The Committee oversees the Fund's valuation policies and procedures and reports to the Board on the Committee's activities and fair value determinations. The Board monitors the appropriateness of the procedures used in valuing the Fund's investments and ratifies the fair value determinations of the Committee.
The Fund categorizes the inputs to valuation techniques used to value its investments into a disclosure hierarchy consisting of three levels as shown below:
- Level 1 – quoted prices in active markets for identical investments
- Level 2 – other significant observable inputs (including quoted prices for similar investments, interest rates, prepayment speeds, etc.)
- Level 3 – unobservable inputs (including the Fund's own assumptions based on the best information available)
Valuation techniques used to value the Fund's investments by major category are as follows:
Equity securities, including restricted securities, for which market quotations are readily available, are valued at the last reported sale price or official closing price as reported by a third party pricing vendor on the primary market or exchange on which they are traded and are categorized as Level 1 in the hierarchy. In the event there were no sales during the day or closing prices are not available, securities are valued at the last quoted bid price or may be valued using the last available price and are generally categorized as Level 2 in the hierarchy. For foreign equity securities, when market or security specific events arise, comparisons to the valuation of American Depositary Receipts (ADRs, futures contracts, Exchange-Traded Funds (ETFs) and certain indexes as well as quoted prices for similar securities may be used and would be categorized as Level 2 in the hierarchy. Utilizing these techniques may result in transfers between Level 1 and Level 2. For equity securities, including restricted securities, where observable inputs are limited, assumptions about market activity and risk are used and these securities may be categorized as Level 3 in the hierarchy.
Investments in open-end mutual funds, including the Fidelity Central Funds, are valued at their closing net asset value (NAV) each business day and are categorized as Level 1 in the hierarchy.
Changes in valuation techniques may result in transfers in or out of an assigned level within the disclosure hierarchy. The aggregate value of investments by input level as of December 31, 2017, as well as a roll forward of Level 3 investments, is included at the end of the Fund's Schedule of Investments.
Foreign Currency. The Fund may use foreign currency contracts to facilitate transactions in foreign-denominated securities. Gains and losses from these transactions may arise from changes in the value of the foreign currency or if the counterparties do not perform under the contracts' terms.
Foreign-denominated assets, including investment securities, and liabilities are translated into U.S. dollars at the exchange rates at period end. Purchases and sales of investment securities, income and dividends received and expenses denominated in foreign currencies are translated into U.S. dollars at the exchange rate in effect on the transaction date.
The effects of exchange rate fluctuations on investments are included with the net realized and unrealized gain (loss) on investment securities. Other foreign currency transactions resulting in realized and unrealized gain (loss) are disclosed separately.
Investment Transactions and Income. For financial reporting purposes, the Fund's investment holdings and NAV include trades executed through the end of the last business day of the period. The NAV per share for processing shareholder transactions is calculated as of the close of business of the New York Stock Exchange (NYSE), normally 4:00 p.m. Eastern time and includes trades executed through the end of the prior business day. Gains and losses on securities sold are determined on the basis of identified cost and includes proceeds received from litigation. Dividend income is recorded on the ex-dividend date, except for certain dividends from foreign securities where the ex-dividend date may have passed, which are recorded as soon as the Fund is informed of the ex-dividend date. Non-cash dividends included in dividend income, if any, are recorded at the fair market value of the securities received. Income and capital gain distributions from Fidelity Central Funds, if any, are recorded on the ex-dividend date. Certain distributions received by the Fund represent a return of capital or capital gain. The Fund determines the components of these distributions subsequent to the ex-dividend date, based upon receipt of tax filings or other correspondence relating to the underlying investment. These distributions are recorded as a reduction of cost of investments and/or as a realized gain. Investment income is recorded net of foreign taxes withheld where recovery of such taxes is uncertain.
Class Allocations and Expenses. Investment income, realized and unrealized capital gains and losses, common expenses of the Fund, and certain fund-level expense reductions, if any, are allocated daily on a pro-rata basis to each class based on the relative net assets of each class to the total net assets of the Fund. Each class differs with respect to transfer agent fees incurred. Certain expense reductions may also differ by class. For the reporting period, the allocated portion of income and expenses to each class as a percent of its average net assets may vary due to the timing of recording these transactions in relation to fluctuating net assets of the classes. Expenses directly attributable to a fund are charged to that fund. Expenses attributable to more than one fund are allocated among the respective funds on the basis of relative net assets or other appropriate methods. Expense estimates are accrued in the period to which they relate and adjustments are made when actual amounts are known.
Income Tax Information and Distributions to Shareholders. Each year, the Fund intends to qualify as a regulated investment company under Subchapter M of the Internal Revenue Code, including distributing substantially all of its taxable income and realized gains. As a result, no provision for U.S. Federal income taxes is required. As of December 31, 2017, the Fund did not have any unrecognized tax benefits in the financial statements; nor is the Fund aware of any tax positions for which it is reasonably possible that the total amounts of unrecognized tax benefits will significantly change in the next twelve months. The Fund files a U.S. federal tax return, in addition to state and local tax returns as required. The Fund's federal income tax returns are subject to examination by the Internal Revenue Service (IRS) for a period of three fiscal years after they are filed. State and local tax returns may be subject to examination for an additional fiscal year depending on the jurisdiction. Foreign taxes are provided for based on the Fund's understanding of the tax rules and rates that exist in the foreign markets in which it invests.
Distributions are declared and recorded on the ex-dividend date. Income dividends and capital gain distributions are declared separately for each class. Income and capital gain distributions are determined in accordance with income tax regulations, which may differ from GAAP.
Capital accounts within the financial statements are adjusted for permanent book-tax differences. These adjustments have no impact on net assets or the results of operations. Capital accounts are not adjusted for temporary book-tax differences which will reverse in a subsequent period.
Book-tax differences are primarily due to foreign currency transactions, passive foreign investment companies (PFIC), capital loss carryforwards, and losses deferred due to wash sales.
As of period end, the cost and unrealized appreciation (depreciation) in securities, and derivatives if applicable, for federal income tax purposes were as follows:
| Gross unrealized appreciation | $194,459,712 |
| Gross unrealized depreciation | (17,549,465) |
| Net unrealized appreciation (depreciation) | $176,910,247 |
| Tax Cost | $588,602,054 |
The tax-based components of distributable earnings as of period end were as follows:
| Undistributed ordinary income | $689,625 |
| Undistributed long-term capital gain | $11,396,099 |
| Net unrealized appreciation (depreciation) on securities and other investments | $176,909,540 |
The tax character of distributions paid was as follows:
| | December 31, 2017 | December 31, 2016 |
| Ordinary Income | $4,247,096 | $ 4,545,960 |
| Long-term Capital Gains | – | 64,752,089 |
| Total | $4,247,096 | $ 69,298,049 |
Trading (Redemption) Fees. Shares held by investors less than 60 days may be subject to a redemption fee equal to 1% of the NAV of shares redeemed. All redemption fees, which reduce the proceeds of the shareholder redemption, are retained by the Fund and accounted for as an addition to paid in capital. In November 2017, the Board of Trustees approved the elimination of these redemption fees effective December 18, 2017.
Delayed Delivery Transactions and When-Issued Securities. During the period, the Fund transacted in securities on a delayed delivery or when-issued basis. Payment and delivery may take place after the customary settlement period for that security. The price of the underlying securities and the date when the securities will be delivered and paid for are fixed at the time the transaction is negotiated. The securities purchased on a delayed delivery or when-issued basis are identified as such in the Fund's Schedule of Investments. With respect to purchase commitments, the Fund identifies securities as segregated in its records with a value at least equal to the amount of the commitment. Losses may arise due to changes in the value of the underlying securities or if the counterparty does not perform under the contract's terms, or if the issuer does not issue the securities due to political, economic, or other factors.
Restricted Securities. The Fund may invest in securities that are subject to legal or contractual restrictions on resale. These securities generally may be resold in transactions exempt from registration or to the public if the securities are registered. Disposal of these securities may involve time-consuming negotiations and expense, and prompt sale at an acceptable price may be difficult. Information regarding restricted securities is included at the end of the Fund's Schedule of Investments.
4. Purchases and Sales of Investments.
Purchases and sales of securities, other than short-term securities, aggregated $527,125,778 and $627,879,299, respectively.
5. Fees and Other Transactions with Affiliates.
Management Fee. Fidelity SelectCo, LLC (the investment adviser) and its affiliates provide the Fund with investment management related services for which the Fund pays a monthly management fee. The management fee is the sum of an individual fund fee rate that is based on an annual rate of .30% of the Fund's average net assets and an annualized group fee rate that averaged .24% during the period. The group fee rate is based upon the average net assets of all the mutual funds advised by Fidelity Management & Research Company (FMR) and the investment adviser. The group fee rate decreases as assets under management increase and increases as assets under management decrease. For the reporting period, the total annual management fee rate was .54% of the Fund's average net assets.
Transfer Agent Fees. Fidelity Investments Institutional Operations Company, Inc. (FIIOC), an affiliate of the investment adviser, is the Fund's transfer, dividend disbursing, and shareholder servicing agent. FIIOC receives an asset-based fee with respect to each class. Each class pays a fee for transfer agent services, typesetting and printing and mailing of shareholder reports, excluding mailing of proxy statements, equal to an annual rate of class-level average net assets. The annual rate for Investor Class is .15% and the annual rate for all other classes is .07%. For the period, transfer agent fees for each class were as follows:
| Initial Class | $90,495 |
| Investor Class | 861,379 |
| | $951,874 |
Accounting and Security Lending Fees. Fidelity Service Company, Inc. (FSC), an affiliate of the investment adviser, maintains the Fund's accounting records. The accounting fee is based on the level of average net assets for each month. Under a separate contract, FSC administers the security lending program. The security lending fee is based on the number and duration of lending transactions.
Brokerage Commissions. The Fund placed a portion of its portfolio transactions with brokerage firms which are affiliates of the investment adviser. Brokerage commissions are included in net realized gain (loss) and change in net unrealized appreciation (depreciation) in the Statement of Operations. The commissions paid to these affiliated firms were $13,317 for the period.
Interfund Trades. The Fund may purchase from or sell securities to other Fidelity Funds under procedures adopted by the Board. The procedures have been designed to ensure these interfund trades are executed in accordance with Rule 17a-7 of the 1940 Act. Interfund trades are included within the respective purchases and sales amounts shown in the Purchases and Sales of Investments note.
6. Committed Line of Credit.
The Fund participates with other funds managed by the investment adviser or an affiliate in a $4.25 billion credit facility (the "line of credit") to be utilized for temporary or emergency purposes to fund shareholder redemptions or for other short-term liquidity purposes. The Fund has agreed to pay commitment fees on its pro-rata portion of the line of credit, which amounted to $2,293 and is reflected in Miscellaneous expenses on the Statement of Operations. During the period, the Fund did not borrow on this line of credit.
7. Security Lending.
The Fund lends portfolio securities through a lending agent from time to time in order to earn additional income. On the settlement date of the loan, the Fund receives collateral (in the form of U.S. Treasury obligations, letters of credit and/or cash) against the loaned securities and maintains collateral in an amount not less than 100% of the market value of the loaned securities during the period of the loan. The market value of the loaned securities is determined at the close of business of the Fund and any additional required collateral is delivered to the Fund on the next business day. The Fund or borrower may terminate the loan at any time, and if the borrower defaults on its obligation to return the securities loaned because of insolvency or other reasons, the Fund may apply collateral received from the borrower against the obligation. The Fund may experience delays and costs in recovering the securities loaned. Any cash collateral received is invested in the Fidelity Securities Lending Cash Central Fund. The value of loaned securities and cash collateral at period end are disclosed on the Fund's Statement of Assets and Liabilities. Security lending income represents the income earned on investing cash collateral, less rebates paid to borrowers and any lending agent fees associated with the loan, plus any premium payments received for lending certain types of securities. Security lending income is presented in the Statement of Operations as a component of income from Fidelity Central Funds.
8. Expense Reductions.
Commissions paid to certain brokers with whom the investment adviser, or its affiliates, places trades on behalf of the Fund include an amount in addition to trade execution, which may be rebated back to the Fund to offset certain expenses. This amount totaled $38,906 for the period. Through arrangements with the Fund's custodian, credits realized as a result of certain uninvested cash balances were used to reduce the Fund's expenses. During the period, these credits reduced the Fund's custody expenses by $282.
In addition, during the period the investment adviser reimbursed and/or waived a portion of fund-level operating expenses in the amount of $6,753.
9. Distributions to Shareholders.
Distributions to shareholders of each class were as follows:
| | Year ended
December 31, 2017 | Year ended December 31, 2016 |
| From net investment income | | |
| Initial Class | $360,506 | $241,998 |
| Investor Class | 1,151,865 | 531,249 |
| Total | $1,512,371 | $773,247 |
| From net realized gain | | |
| Initial Class | $505,025 | $14,284,342 |
| Investor Class | 2,229,700 | 54,240,460 |
| Total | $2,734,725 | $68,524,802 |
10. Share Transactions.
Transactions for each class of shares were as follows:
| | Shares | Shares | Dollars | Dollars |
| | Year ended December 31, 2017 | Year ended December 31, 2016 | Year ended December 31, 2017 | Year ended December 31, 2016 |
| Initial Class | | | | |
| Shares sold | 312,878 | 420,434 | $7,964,347 | $9,271,229 |
| Reinvestment of distributions | 32,737 | 725,648 | 865,531 | 14,526,340 |
| Shares redeemed | (1,516,987) | (3,723,446) | (37,362,086) | (82,827,974) |
| Net increase (decrease) | (1,171,372) | (2,577,364) | $(28,532,208) | $(59,030,405) |
| Investor Class | | | | |
| Shares sold | 1,445,926 | 973,822 | $36,356,330 | $21,453,416 |
| Reinvestment of distributions | 128,748 | 2,759,192 | 3,381,565 | 54,771,709 |
| Shares redeemed | (4,474,069) | (10,500,085) | (109,905,683) | (230,244,381) |
| Net increase (decrease) | (2,899,395) | (6,767,071) | $(70,167,788) | $(154,019,256) |
11. Other.
The Fund's organizational documents provide former and current trustees and officers with a limited indemnification against liabilities arising in connection with the performance of their duties to the Fund. In the normal course of business, the Fund may also enter into contracts that provide general indemnifications. The Fund's maximum exposure under these arrangements is unknown as this would be dependent on future claims that may be made against the Fund. The risk of material loss from such claims is considered remote.
At the end of the period, the investment adviser or its affiliates were the owners of record of 100% of the total outstanding shares of the Fund.
Report of Independent Registered Public Accounting Firm
To the Trustees of Variable Insurance Products Fund IV and Shareholders of VIP Health Care Portfolio:
Opinion on the Financial Statements
We have audited the accompanying statement of assets and liabilities, including the schedule of investments, of VIP Health Care Portfolio (one of the funds constituting Variable Insurance Products Fund IV, referred to hereafter as the “Fund”) as of December 31, 2017, the related statements of operations for the year ended December 31, 2017, the statement of changes in net assets for each of the two years in the period ended December 31, 2017, including the related notes, and the financial highlights for each of the five years in the period ended December 31, 2017 (collectively referred to as the “financial statements”). In our opinion, the financial statements present fairly, in all material respects, the financial position of the Fund as of December 31, 2017, the results of its operations for the year then ended, the changes in its net assets for each of the two years in the period ended December 31, 2017 and the financial highlights for each of the five years in the period ended December 31, 2017 in conformity with accounting principles generally accepted in the United States of America.
Basis for Opinion
These financial statements are the responsibility of the Fund’s management. Our responsibility is to express an opinion on the Fund’s financial statements based on our audits. We are a public accounting firm registered with the Public Company Accounting Oversight Board (United States) (“PCAOB”) and are required to be independent with respect to the Fund in accordance with the U.S. federal securities laws and the applicable rules and regulations of the Securities and Exchange Commission and the PCAOB.
We conducted our audits of these financial statements in accordance with the standards of the PCAOB. Those standards require that we plan and perform the audit to obtain reasonable assurance about whether the financial statements are free of material misstatement, whether due to error or fraud.
Our audits included performing procedures to assess the risks of material misstatement of the financial statements, whether due to error or fraud, and performing procedures that respond to those risks. Such procedures included examining, on a test basis, evidence regarding the amounts and disclosures in the financial statements. Our audits also included evaluating the accounting principles used and significant estimates made by management, as well as evaluating the overall presentation of the financial statements. Our procedures included confirmation of securities owned as of December 31, 2017 by correspondence with the custodian and brokers; when replies were not received from brokers, we performed other auditing procedures. We believe that our audits provide a reasonable basis for our opinion.
PricewaterhouseCoopers LLP
Boston, Massachusetts
February 15, 2018
We have served as the auditor of one or more investment companies in the Fidelity group of funds since 1932.
Trustees and Officers
The Trustees, Members of the Advisory Board (if any), and officers of the trust and fund, as applicable, are listed below. The Board of Trustees governs the fund and is responsible for protecting the interests of shareholders. The Trustees are experienced executives who meet periodically throughout the year to oversee the fund's activities, review contractual arrangements with companies that provide services to the fund, oversee management of the risks associated with such activities and contractual arrangements, and review the fund's performance. Each of the Trustees oversees 91 funds.
The Trustees hold office without limit in time except that (a) any Trustee may resign; (b) any Trustee may be removed by written instrument, signed by at least two-thirds of the number of Trustees prior to such removal; (c) any Trustee who requests to be retired or who has become incapacitated by illness or injury may be retired by written instrument signed by a majority of the other Trustees; and (d) any Trustee may be removed at any special meeting of shareholders by a two-thirds vote of the outstanding voting securities of the trust. Each Trustee who is not an interested person (as defined in the 1940 Act) of the trust and the fund is referred to herein as an Independent Trustee. Each Independent Trustee shall retire not later than the last day of the calendar year in which his or her 75th birthday occurs. The Independent Trustees may waive this mandatory retirement age policy with respect to individual Trustees. Officers and Advisory Board Members hold office without limit in time, except that any officer or Advisory Board Member may resign or may be removed by a vote of a majority of the Trustees at any regular meeting or any special meeting of the Trustees. Except as indicated, each individual has held the office shown or other offices in the same company for the past five years.
The fund’s Statement of Additional Information (SAI) includes more information about the Trustees. To request a free copy, call Fidelity at 1-877-208-0098.
Experience, Skills, Attributes, and Qualifications of the Trustees. The Governance and Nominating Committee has adopted a statement of policy that describes the experience, qualifications, attributes, and skills that are necessary and desirable for potential Independent Trustee candidates (Statement of Policy). The Board believes that each Trustee satisfied at the time he or she was initially elected or appointed a Trustee, and continues to satisfy, the standards contemplated by the Statement of Policy. The Governance and Nominating Committee also engages professional search firms to help identify potential Independent Trustee candidates who have the experience, qualifications, attributes, and skills consistent with the Statement of Policy. From time to time, additional criteria based on the composition and skills of the current Independent Trustees, as well as experience or skills that may be appropriate in light of future changes to board composition, business conditions, and regulatory or other developments, have also been considered by the professional search firms and the Governance and Nominating Committee. In addition, the Board takes into account the Trustees' commitment and participation in Board and committee meetings, as well as their leadership of standing and ad hoc committees throughout their tenure.
In determining that a particular Trustee was and continues to be qualified to serve as a Trustee, the Board has considered a variety of criteria, none of which, in isolation, was controlling. The Board believes that, collectively, the Trustees have balanced and diverse experience, qualifications, attributes, and skills, which allow the Board to operate effectively in governing the fund and protecting the interests of shareholders. Information about the specific experience, skills, attributes, and qualifications of each Trustee, which in each case led to the Board's conclusion that the Trustee should serve (or continue to serve) as a trustee of the fund, is provided below.
Board Structure and Oversight Function. Brian B. Hogan is an interested person and currently serves as Chairman. The Trustees have determined that an interested Chairman is appropriate and benefits shareholders because an interested Chairman has a personal and professional stake in the quality and continuity of services provided to the fund. Independent Trustees exercise their informed business judgment to appoint an individual of their choosing to serve as Chairman, regardless of whether the Trustee happens to be independent or a member of management. The Independent Trustees have determined that they can act independently and effectively without having an Independent Trustee serve as Chairman and that a key structural component for assuring that they are in a position to do so is for the Independent Trustees to constitute a substantial majority for the Board. The Independent Trustees also regularly meet in executive session. Michael E. Wiley serves as Chairman of the Independent Trustees and as such (i) acts as a liaison between the Independent Trustees and management with respect to matters important to the Independent Trustees and (ii) with management prepares agendas for Board meetings.
Fidelity® funds are overseen by different Boards of Trustees. The fund's Board oversees Fidelity's sector portfolios. Other Boards oversee Fidelity's equity and high income funds, and Fidelity's investment grade bond, money market, and asset allocation funds. The use of separate Boards, each with its own committee structure, allows the Trustees of each group of Fidelity® funds to focus on the unique issues of the funds they oversee, including common research, investment, and operational issues. On occasion, the separate Boards establish joint committees to address issues of overlapping consequences for the Fidelity® funds overseen by each Board.
The Trustees operate using a system of committees to facilitate the timely and efficient consideration of all matters of importance to the Trustees, the fund, and fund shareholders and to facilitate compliance with legal and regulatory requirements and oversight of the fund's activities and associated risks. The Board, acting through its committees, has charged SelectCo and its affiliates with (i) identifying events or circumstances the occurrence of which could have demonstrably adverse effects on the fund's business and/or reputation; (ii) implementing processes and controls to lessen the possibility that such events or circumstances occur or to mitigate the effects of such events or circumstances if they do occur; and (iii) creating and maintaining a system designed to evaluate continuously business and market conditions in order to facilitate the identification and implementation processes described in (i) and (ii) above. Because the day-to-day operations and activities of the fund are carried out by or through SelectCo, its affiliates, and other service providers, the fund's exposure to risks is mitigated but not eliminated by the processes overseen by the Trustees. While each of the Board's committees has responsibility for overseeing different aspects of the fund's activities, oversight is exercised primarily through the Operations and Audit Committees. Appropriate personnel, including but not limited to the fund's Chief Compliance Officer (CCO), SelectCo's internal auditor, the independent accountants, the fund's Treasurer and portfolio management personnel, make periodic reports to the Board's committees, as appropriate. The responsibilities of each standing committee, including their oversight responsibilities, are described further under "Standing Committees of the Trustees."
Interested Trustees*:
Correspondence intended for a Trustee who is an interested person may be sent to Fidelity Investments, 245 Summer Street, Boston, Massachusetts 02210.
Name, Year of Birth; Principal Occupations and Other Relevant Experience+
Brian B. Hogan (1964)
Year of Election or Appointment: 2014
Trustee
Chairman of the Board of Trustees
Mr. Hogan also serves as Trustee or Vice President of other funds. Mr. Hogan serves as a Director of FMR Investment Management (UK) Limited (investment adviser firm, 2015-present) and Fidelity SelectCo, LLC (investment adviser firm, 2014-present) and President of the Equity Division of FMR (investment adviser firm, 2009-present). Previously, Mr. Hogan served as Senior Vice President, Equity Research of FMR (2006-2009) and as a portfolio manager. Mr. Brian B. Hogan is not related to Mr. Colm A. Hogan.
* Determined to be an "Interested Trustee" by virtue of, among other things, his or her affiliation with the trust or various entities under common control with SelectCo.
+ The information includes the Trustee's principal occupation during the last five years and other information relating to the experience, attributes, and skills relevant to the Trustee's qualifications to serve as a Trustee, which led to the conclusion that the Trustee should serve as a Trustee for the fund.
Independent Trustees:
Correspondence intended for an Independent Trustee may be sent to Fidelity Investments, P.O. Box 55235, Boston, Massachusetts 02205-5235.
Name, Year of Birth; Principal Occupations and Other Relevant Experience+
David A. Rosow (1942)
Year of Election or Appointment: 2013
Trustee
Mr. Rosow also serves as Trustee of other Fidelity® funds. Prior to his retirement in 2006, Mr. Rosow was the Chief Executive Officer, owner and operator of a number of private companies, which encompassed the oil refining, drilling and marketing of petroleum products (including specialty petroleum products), recreation industry, and real estate development. Mr. Rosow currently serves as a Director of Oxbow Carbon LLC (upgraders, marketers, and distributors of petroleum byproducts of the oil refining process, 2015-present) and Oxbridge Academy of the Palm Beaches (2015-present) and serves as its President and CEO. Previously, Mr. Rosow served on the Fairfield Country Day School Board for 27 years, including as its President for 3 years, stepping down in 2006. Mr. Rosow served as Lead Director and Chairman of the Audit Committee of Hudson United Bancorp (1996-2006), Chairman of the Board of Westport Bank and Trust (1992-1996), and as a Director of TD Banknorth (2006-2007). In addition, Mr. Rosow served as a member (2008-2014) and President (2009-2014) of the Town Council of Palm Beach, Florida. Mr. Rosow also served as a Member of the Advisory Board of certain Fidelity® funds (2012-2013).
Garnett A. Smith (1947)
Year of Election or Appointment: 2013
Trustee
Mr. Smith also serves as Trustee of other Fidelity® funds. Prior to Mr. Smith's retirement, he served as Chairman and Chief Executive Officer of Inbrand Corp. (manufacturer of personal absorbent products, 1990-1997). He also served as President (1986-1990) of Inbrand Corp. Prior to his employment with Inbrand Corp., he was employed by a retail fabric chain and North Carolina National Bank. In addition, Mr. Smith served as a Member of the Advisory Board of certain Fidelity® funds (2012-2013) and as a board member of the Jackson Hole Land Trust (2009-2012).
Michael E. Wiley (1950)
Year of Election or Appointment: 2008
Trustee
Chairman of the Independent Trustees
Mr. Wiley also serves as Trustee of other Fidelity® funds. Mr. Wiley serves as a Director of Andeavor Corporation (independent oil refiner and marketer, 2005-present), a Director of Andeavor Logistics LP (natural resources logistics, 2015-present), and a Director of Bill Barrett Corporation (exploration and production, 2005-present). In addition, Mr. Wiley also serves as a Director of Post Oak Bank (privately-held bank, 2004-present). Previously, Mr. Wiley served as a Trustee of other Fidelity® funds (2008-2013), as a Director of Asia Pacific Exploration Consolidated (international oil and gas exploration and production, 2008-2013), as a member of the Board of Trustees of the University of Tulsa (2000-2006; 2007-2010), as a Senior Energy Advisor of Katzenbach Partners, LLC (consulting, 2006-2007), as an Advisory Director of Riverstone Holdings (private investment), Chairman, President, and CEO of Baker Hughes, Inc. (oilfield services, 2000-2004), and as Director of Spinnaker Exploration Company (exploration and production, 2001-2005).
+ The information includes the Trustee's principal occupation during the last five years and other information relating to the experience, attributes, and skills relevant to the Trustee's qualifications to serve as a Trustee, which led to the conclusion that the Trustee should serve as a Trustee for the fund.
Advisory Board Members and Officers:
Correspondence intended for a Member of the Advisory Board (if any) may be sent to Fidelity Investments, P.O. Box 55235, Boston, Massachusetts 02205-5235. Except for Anthony R. Rochte, correspondence intended for an officer may be sent to Fidelity Investments, 245 Summer Street, Boston, Massachusetts 02210. Correspondence intended for Mr. Rochte may be sent to Fidelity SelectCo, LLC (SelectCo), 1225 17th Street, Denver, Colorado 80202-5541. Officers appear below in alphabetical order.
Name, Year of Birth; Principal Occupation
Donald F. Donahue (1950)
Year of Election or Appointment: 2015
Member of the Advisory Board
Mr. Donahue also serves as a Trustee or Member of the Advisory Board of other Fidelity® funds. Mr. Donahue is President and Chief Executive Officer of Miranda Partners, LLC (risk consulting for the financial services industry, 2012-present). Previously, Mr. Donahue served as Chief Executive Officer (2006-2012), Chief Operating Officer (2003-2006), and Managing Director, Customer Marketing and Development (1999-2003) of The Depository Trust & Clearing Corporation (financial markets infrastructure). Mr. Donahue serves as a Member (2007-present) and Co-Chairman (2016-present) of the Board of Directors of United Way of New York, Member of the Board of Directors of NYC Leadership Academy (2012-present) and Member of the Board of Advisors of Ripple Labs, Inc. (financial services, 2015-present). He also served as Chairman (2010-2012) and Member of the Board of Directors (2012-2013) of Omgeo, LLC (financial services), Treasurer of United Way of New York (2012-2016), and Member of the Board of Directors of XBRL US (financial services non-profit, 2009-2012) and the International Securities Services Association (2009-2012).
Carol B. Tomé (1957)
Year of Election or Appointment: 2017
Member of the Advisory Board
Ms. Tomé also serves as Member of the Advisory Board of other Fidelity® funds. Ms. Tomé is Chief Financial Officer (2001-present) and Executive Vice President of Corporate Services (2007-present) of The Home Depot, Inc. (home improvement retailer) and a Director (2003-present) and Chair of the Audit Committee (2004-present) of United Parcel Service, Inc. (package delivery and supply chain management). Previously, Ms. Tomé served as Trustee of certain Fidelity® funds (2017), Senior Vice President of Finance and Accounting/Treasurer (2000-2007) and Vice President and Treasurer (1995-2000) of The Home Depot, Inc. and Chair of the Board (2010-2012), Vice Chair of the Board (2009 and 2013), and a Director (2008-2013) of the Federal Reserve Bank of Atlanta. Ms. Tomé is also a director or trustee of many community and professional organizations.
Elizabeth Paige Baumann (1968)
Year of Election or Appointment: 2017
Anti-Money Laundering (AML) Officer
Ms. Baumann also serves as AML Officer of other funds. She is Chief AML Officer (2012-present) and Senior Vice President (2014-present) of FMR LLC (diversified financial services company) and is an employee of Fidelity Investments. Previously, Ms. Baumann served as AML Officer of the funds (2012-2016), and Vice President (2007-2014) and Deputy Anti-Money Laundering Officer (2007-2012) of FMR LLC.
Marc R. Bryant (1966)
Year of Election or Appointment: 2013
Secretary and Chief Legal Officer (CLO)
Mr. Bryant also serves as Secretary and CLO of other funds. Mr. Bryant serves as CLO, Secretary, and Senior Vice President of Fidelity Management & Research Company (investment adviser firm, 2015-present) and FMR Co., Inc. (investment adviser firm, 2015-present); Secretary of Fidelity SelectCo, LLC (investment adviser firm, 2015-present) and Fidelity Investments Money Management, Inc. (investment adviser firm, 2015-present); and CLO of Fidelity Management & Research (Hong Kong) Limited and FMR Investment Management (UK) Limited (investment adviser firms, 2015-present) and Fidelity Management & Research (Japan) Limited (investment adviser firm, 2016-present). He is Senior Vice President and Deputy General Counsel of FMR LLC (diversified financial services company). Previously, Mr. Bryant served as Secretary and CLO of Fidelity Rutland Square Trust II (2010-2014) and Assistant Secretary of Fidelity's Fixed Income and Asset Allocation Funds (2013-2015). Prior to joining Fidelity Investments, Mr. Bryant served as a Senior Vice President and the Head of Global Retail Legal for AllianceBernstein L.P. (2006-2010), and as the General Counsel for ProFund Advisors LLC (2001-2006).
William C. Coffey (1969)
Year of Election or Appointment: 2009
Assistant Secretary
Mr. Coffey also serves as Assistant Secretary of other funds. He is Senior Vice President and Deputy General Counsel of FMR LLC (diversified financial services company, 2010-present), and is an employee of Fidelity Investments. Previously, Mr. Coffey served as Vice President and Associate General Counsel of FMR LLC (2005-2009).
Jonathan Davis (1968)
Year of Election or Appointment: 2010
Assistant Treasurer
Mr. Davis also serves as Assistant Treasurer of other funds. Mr. Davis serves as Assistant Treasurer of FMR Capital, Inc. (2017-present) and is an employee of Fidelity Investments. Previously, Mr. Davis served as Vice President and Associate General Counsel of FMR LLC (diversified financial services company, 2003-2010).
Adrien E. Deberghes (1967)
Year of Election or Appointment: 2013
President and Treasurer
Mr. Deberghes also serves as an officer of other funds. He serves as Assistant Treasurer of FMR Capital, Inc. (2017-present), Executive Vice President of Fidelity Investments Money Management, Inc. (FIMM) (investment adviser firm, 2016-present), and is an employee of Fidelity Investments (2008-present). Prior to joining Fidelity Investments, Mr. Deberghes was Senior Vice President of Mutual Fund Administration at State Street Corporation (2007-2008), Senior Director of Mutual Fund Administration at Investors Bank & Trust (2005-2007), and Director of Finance for Dunkin' Brands (2000-2005). Previously, Mr. Deberghes served in other fund officer roles.
Joseph DeSantis (1959)
Year of Election or Appointment: 2015
Vice President
Mr. DeSantis also serves as Vice President of other funds. Mr. DeSantis serves as a Director of Fidelity Management & Research (Japan) Limited (investment adviser firm, 2016-present), Chief Investment Officer, Equities (2010-present) and is an employee of Fidelity Investments.
Stephanie J. Dorsey (1969)
Year of Election or Appointment: 2010
Assistant Treasurer
Ms. Dorsey also serves as an officer of other funds. Ms. Dorsey serves as Assistant Treasurer of FMR Capital, Inc. (2017-present), is an employee of Fidelity Investments (2008-present), and has served in other fund officer roles. Prior to joining Fidelity Investments, Ms. Dorsey served as Treasurer (2004-2008) of the JPMorgan Mutual Funds and Vice President (2004-2008) of JPMorgan Chase Bank.
Howard J. Galligan III (1966)
Year of Election or Appointment: 2014
Chief Financial Officer
Mr. Galligan also serves as Chief Financial Officer of other funds. Mr. Galligan serves as President of Fidelity Pricing and Cash Management Services (FPCMS) (2014-present) and as a Director of Strategic Advisers, Inc. (investment adviser firm, 2008-present). Previously, Mr. Galligan served as Chief Administrative Officer of Asset Management (2011-2014) and Chief Operating Officer and Senior Vice President of Investment Support for Strategic Advisers, Inc. (2003-2011).
James D. Gryglewicz (1972)
Year of Election or Appointment: 2014
Chief Compliance Officer
Mr. Gryglewicz also serves as Chief Compliance Officer of other funds. Mr. Gryglewicz serves as Compliance Officer of Strategic Advisers, Inc. (investment adviser firm, 2015-present) and Fidelity SelectCo, LLC (investment adviser firm, 2014-present), Senior Vice President of Asset Management Compliance (2009-present), and is an employee of Fidelity Investments (2004-present).
Brian B. Hogan (1964)
Year of Election or Appointment: 2009
Vice President
Mr. Hogan also serves as Trustee or Vice President of other funds. Mr. Hogan serves as a Director of FMR Investment Management (UK) Limited (investment adviser firm, 2015-present) and Fidelity SelectCo, LLC (investment adviser firm, 2014-present) and President of the Equity Division of FMR (investment adviser firm, 2009-present). Previously, Mr. Hogan served as Senior Vice President, Equity Research of FMR (2006-2009) and as a portfolio manager. Mr. Brian B. Hogan is not related to Mr. Colm A. Hogan.
Colm A. Hogan (1973)
Year of Election or Appointment: 2016
Assistant Treasurer
Mr. Hogan also serves as an officer of other funds. Mr. Hogan serves as Assistant Treasurer of FMR Capital, Inc. (2017-present) and is an employee of Fidelity Investments (2005-present). Mr. Colm A. Hogan is not related to Mr. Brian B. Hogan.
Chris Maher (1972)
Year of Election or Appointment: 2013
Assistant Treasurer
Mr. Maher serves as Assistant Treasurer of other funds. Mr. Maher is Vice President of Valuation Oversight, serves as Assistant Treasurer of FMR Capital, Inc. (2017-present), and is an employee of Fidelity Investments. Previously, Mr. Maher served as Vice President of Asset Management Compliance (2013), Vice President of the Program Management Group of FMR (investment adviser firm, 2010-2013), and Vice President of Valuation Oversight (2008-2010).
Rieco E. Mello (1969)
Year of Election or Appointment: 2017
Assistant Treasurer
Mr. Mello also serves as Assistant Treasurer of other funds. Mr. Mello serves as Assistant Treasurer of FMR Capital, Inc. (2017-present) and is an employee of Fidelity Investments (1995-present).
Anthony R. Rochte (1968)
Year of Election or Appointment: 2013
Vice President
Mr. Rochte also serves as Vice President of other funds. Mr. Rochte serves as President of Fidelity SelectCo, LLC (investment adviser firm, 2012-present) and is an employee of Fidelity Investments (2012-present). Prior to joining Fidelity Investments, Mr. Rochte served as Senior Managing Director and head of State Street Global Advisors' North American Intermediary Business Group (2006-2012).
Stacie M. Smith (1974)
Year of Election or Appointment: 2013
Assistant Treasurer
Ms. Smith also serves as an officer of other funds. Ms. Smith serves as Assistant Treasurer of FMR Capital, Inc. (2017-present), is an employee of Fidelity Investments (2009-present), and has served in other fund officer roles. Prior to joining Fidelity Investments, Ms. Smith served as Senior Audit Manager of Ernst & Young LLP (accounting firm, 1996-2009). Previously, Ms. Smith served as Deputy Treasurer of certain Fidelity® funds (2013-2016).
Marc L. Spector (1972)
Year of Election or Appointment: 2017
Assistant Treasurer
Mr. Spector also serves as an officer of other funds. Mr. Spector serves as Assistant Treasurer of FMR Capital, Inc. (2017-present) and is an employee of Fidelity Investments (2016-present). Prior to joining Fidelity Investments, Mr. Spector served as Director at the Siegfried Group (accounting firm, 2013-2016), and prior to Siegfried Group as audit senior manager at Deloitte & Touche (accounting firm, 2005-2013).
Renee Stagnone (1975)
Year of Election or Appointment: 2016
Assistant Treasurer
Ms. Stagnone also serves as an officer of other funds. Ms. Stagnone serves as Assistant Treasurer of FMR Capital, Inc. (2017-present) and is an employee of Fidelity Investments (1997-present). Previously, Ms. Stagnone served as Deputy Treasurer of certain Fidelity® funds (2013-2016).
Shareholder Expense Example
As a shareholder of the Fund, you incur two types of costs: (1) transaction costs, including redemption fees and (2) ongoing costs, including management fees and other Fund expenses. This Example is intended to help you understand your ongoing costs (in dollars) of investing in the Fund and to compare these costs with the ongoing costs of investing in other mutual funds.
The Example is based on an investment of $1,000 invested at the beginning of the period and held for the entire period (July 1, 2017 to December 31, 2017).
Actual Expenses
The first line of the accompanying table for each class of the Fund provides information about actual account values and actual expenses. You may use the information in this line, together with the amount you invested, to estimate the expenses that you paid over the period. Simply divide your account value by $1,000.00 (for example, an $8,600 account value divided by $1,000.00 = 8.6), then multiply the result by the number in the first line for a class of the Fund under the heading entitled "Expenses Paid During Period" to estimate the expenses you paid on your account during this period. The estimate of expenses does not include any fees or other expenses of any variable annuity or variable life insurance product. If they were, the estimate of expenses you paid during the period would be higher, and your ending account value would be lower. In addition, the Fund, as a shareholder in the underlying Fidelity Central Funds, will indirectly bear its pro-rata share of the fees and expenses incurred by the underlying Fidelity Central Funds. These fees and expenses are not included in the Fund's annualized expense ratio used to calculate the expense estimate in the table below.
Hypothetical Example for Comparison Purposes
The second line of the accompanying table for each class of the Fund provides information about hypothetical account values and hypothetical expenses based on a Class' actual expense ratio and an assumed rate of return of 5% per year before expenses, which is not the Class' actual return. The hypothetical account values and expenses may not be used to estimate the actual ending account balance or expenses you paid for the period. You may use this information to compare the ongoing costs of investing in the Fund and other funds. To do so, compare this 5% hypothetical example with the 5% hypothetical examples that appear in the shareholder reports of the other funds. The estimate of expenses does not include any fees or other expenses of any variable annuity or variable life insurance product. If they were, the estimate of expenses you paid during the period would be higher, and your ending account value would be lower. In addition, the Fund, as a shareholder in the underlying Fidelity Central Funds, will indirectly bear its pro-rata share of the fees and expenses incurred by the underlying Fidelity Central Funds. These fees and expenses are not included in the Fund's annualized expense ratio used to calculate the expense estimate in the table below.
Please note that the expenses shown in the table are meant to highlight your ongoing costs only and do not reflect any transaction costs. Therefore, the second line of the table is useful in comparing ongoing costs only, and will not help you determine the relative total costs of owning different funds. In addition, if these transactional costs were included, your costs would have been higher.
| | Annualized Expense Ratio-A | Beginning
Account Value
July 1, 2017 | Ending
Account Value
December 31, 2017 | Expenses Paid
During Period-B
July 1, 2017
to December 31, 2017 |
| Initial Class | .67% | | | |
| Actual | | $1,000.00 | $1,027.00 | $3.42 |
| Hypothetical-C | | $1,000.00 | $1,021.83 | $3.41 |
| Investor Class | .75% | | | |
| Actual | | $1,000.00 | $1,026.50 | $3.83 |
| Hypothetical-C | | $1,000.00 | $1,021.42 | $3.82 |
A Annualized expense ratio reflects expenses net of applicable fee waivers.
B Expenses are equal to each Class' annualized expense ratio, multiplied by the average account value over the period, multiplied by 184/365 (to reflect the one-half year period).
C 5% return per year before expenses
Distributions (Unaudited)
The Board of Trustees of VIP Health Care Portfolio voted to pay to shareholders of record at the opening of business on record date, the following distributions per share derived from capital gains realized from sales of portfolio securities, and dividends derived from net investment income:
| | Pay Date | Record Date | Dividends | Capital Gains |
| VIP Health Care Portfolio | | | | |
| Initial Class | 02/09/18 | 02/09/18 | $0.016 | $0.437 |
| Investor Class | 02/09/18 | 02/09/18 | $0.013 | $0.437 |
|
The fund hereby designates as a capital gain dividend with respect to the taxable year ended December 31, 2017, $11,396,099, or, if subsequently determined to be different, the net capital gain of such year.
Initial Class and Investor Class designate 100% of the dividends distributed in February and December during the fiscal year as qualifying for the dividends–received deduction for corporate shareholders.
Proxy Voting Results
A special meeting of shareholders was held on December 8, 2017. The results of votes taken among shareholders on the proposals before them are reported below. Each vote reported represents one dollar of net asset value held on the record date for the meeting.
PROPOSAL 1
To elect a Board of Trustees.
| | # of
Votes | % of
Votes |
| James C. Curvey |
| Affirmative | 3,005,845,657.89 | 94.803 |
| Withheld | 164,788,708.80 | 5.197 |
| TOTAL | 3,170,634,366.69 | 100.000 |
| Dennis J. Dirks |
| Affirmative | 3,025,050,303.47 | 95.409 |
| Withheld | 145,584,063.22 | 4.591 |
| TOTAL | 3,170,634,366.69 | 100.000 |
| Donald F. Donahue |
| Affirmative | 3,024,923,660.98 | 95.405 |
| Withheld | 145,710,705.71 | 4.595 |
| TOTAL | 3,170,634,366.69 | 100.000 |
| Alan J. Lacy |
| Affirmative | 3,024,272,946.71 | 95.384 |
| Withheld | 146,361,419.98 | 4.616 |
| TOTAL | 3,170,634,366.69 | 100.00 |
| Ned C. Lautenbach |
| Affirmative | 3,011,847,006.14 | 94.992 |
| Withheld | 158,787,360.55 | 5.008 |
| TOTAL | 3,170,634,366.69 | 100.000 |
| Joseph Mauriello |
| Affirmative | 3,021,074,746.00 | 95.283 |
| Withheld | 149,559,620.69 | 4.717 |
| TOTAL | 3,170,634,366.69 | 100.000 |
| Charles S. Morrison |
| Affirmative | 3,025,083,795.43 | 95.410 |
| Withheld | 145,550,571.26 | 4.590 |
| TOTAL | 3,170,634,366.69 | 100.000 |
| Cornelia M. Small |
| Affirmative | 3,016,566,905.34 | 95.141 |
| Withheld | 154,067,461.35 | 4.859 |
| TOTAL | 3,170,634,366.69 | 100.000 |
| Garnett A. Smith |
| Affirmative | 3,014,927,605.85 | 95.090 |
| Withheld | 155,706,760.84 | 4.910 |
| TOTAL | 3,170,634,366.69 | 100.000 |
| David M. Thomas |
| Affirmative | 3,025,900,428.75 | 95.436 |
| Withheld | 144,733,937.94 | 4.564 |
| TOTAL | 3,170,634,366.69 | 100.000 |
| Michael E. Wiley |
| Affirmative | 3,023,436,110.39 | 95.358 |
| Withheld | 147,198,256.30 | 4.642 |
| TOTAL | 3,170,634,366.69 | 100.000 |
PROPOSAL 2
To eliminate a fundamental investment policy.
| | # of
Votes | % of
Votes |
| Affirmative | 630,223,469.39 | 81.850 |
| Against | 79,049,980.89 | 10.267 |
| Abstain | 60,703,358.90 | 7.883 |
| TOTAL | 769,976,809.18 | 100.000 |
PROPOSAL 3
To modify the fund's fundamental concentration policy.
| | # of
Votes | % of
Votes |
| Affirmative | 651,023,450.27 | 84.552 |
| Against | 59,374,105.34 | 7.711 |
| Abstain | 59,579,253.57 | 7.737 |
| TOTAL | 769,976,809.18 | 100.000 |
|
| Proposal 1 reflects trust wide proposal and voting results. |
VHCIC-ANN-0218
1.817373.112
Fidelity® Variable Insurance Products: Utilities Portfolio
Annual Report December 31, 2017 |
|
Contents
To view a fund's proxy voting guidelines and proxy voting record for the 12-month period ended June 30, visit http://www.fidelity.com/proxyvotingresults or visit the Securities and Exchange Commission's (SEC) web site at http://www.sec.gov.
You may also call 1-877-208-0098 to request a free copy of the proxy voting guidelines.
Fidelity® Variable Insurance Products are separate account options which are purchased through a variable insurance contract.
Standard & Poor's, S&P and S&P 500 are registered service marks of The McGraw-Hill Companies, Inc. and have been licensed for use by Fidelity Distributors Corporation.
Other third-party marks appearing herein are the property of their respective owners.
All other marks appearing herein are registered or unregistered trademarks or service marks of FMR LLC or an affiliated company. © 2018 FMR LLC. All rights reserved.
This report and the financial statements contained herein are submitted for the general information of the shareholders of the Fund. This report is not authorized for distribution to prospective investors in the Fund unless preceded or accompanied by an effective prospectus.
A fund files its complete schedule of portfolio holdings with the SEC for the first and third quarters of each fiscal year on Form N-Q. Forms N-Q are available on the SEC’s web site at http://www.sec.gov. A fund's Forms N-Q may be reviewed and copied at the SEC’s Public Reference Room in Washington, DC. Information regarding the operation of the SEC's Public Reference Room may be obtained by calling 1-800-SEC-0330.
For a complete list of a fund's portfolio holdings, view the most recent holdings listing, semiannual report, or annual report on Fidelity's web site at http://www.fidelity.com, http://www.institutional.fidelity.com, or http://www.401k.com, as applicable.
NOT FDIC INSURED •MAY LOSE VALUE •NO BANK GUARANTEE
Neither the Fund nor Fidelity Distributors Corporation is a bank.
Performance: The Bottom Line
Average annual total return reflects the change in the value of an investment, assuming reinvestment of distributions from dividend income and capital gains (the profits earned upon the sale of securities that have grown in value, if any) and assuming a constant rate of performance each year. During periods of reimbursement by Fidelity, a fund’s total return will be greater than it would be had the reimbursement not occurred. Performance numbers are net of all underlying fund operating expenses, but do not include any insurance charges imposed by your insurance company’s separate account. If performance information included the effect of these additional charges, the total returns would have been lower. How a fund did yesterday is no guarantee of how it will do tomorrow.
Average Annual Total Returns
| For the periods ended December 31, 2017 | Past 1 year | Past 5 years | Past 10 years |
| Initial Class | 17.88% | 12.09% | 5.92% |
| Investor Class | 17.83% | 12.01% | 5.83% |
$10,000 Over 10 Years
Let's say hypothetically that $10,000 was invested in VIP Utilities Portfolio - Initial Class on December 31, 2007.
The chart shows how the value of your investment would have changed, and also shows how the S&P 500® Index performed over the same period.
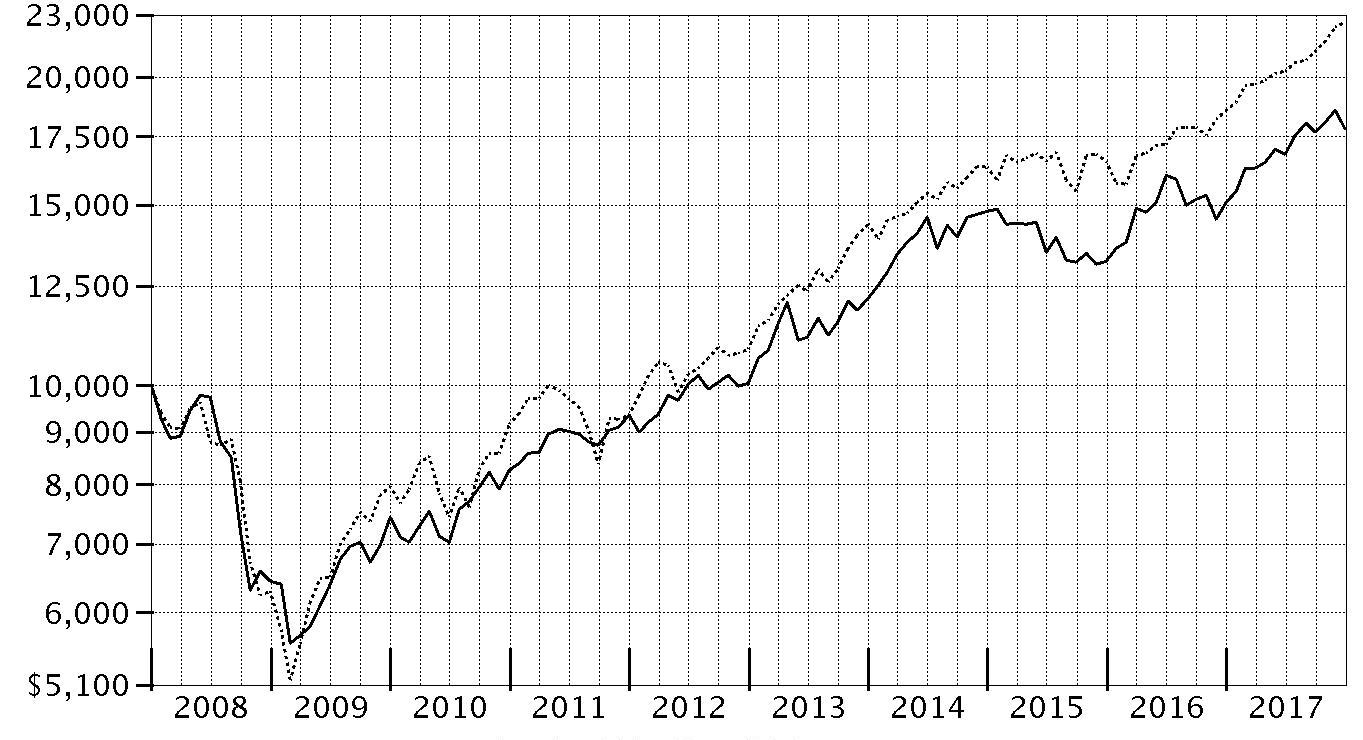
| Period Ending Values |
| $17,782 | VIP Utilities Portfolio - Initial Class |
| $22,603 | S&P 500® Index |
Management's Discussion of Fund Performance
Market Recap: U.S. equities gained 21.83% in 2017, as the S&P 500
® index rose steadily and closed the year just shy of an all-time high after a particularly strong three-month finish. Early on, equities rallied on optimism for President Trump’s pro-business agenda but leveled off in March amid fading optimism and stalled efforts by Congress to repeal and replace the Affordable Care Act. Upward momentum soon returned and continued through year-end with consumer sentiment and other market indicators staying positive. The lone exception was a brief cooldown in August, when geopolitical tension escalated and uncertainty grew regarding the future of health care, tax reform and the debt ceiling. Sector-wise, information technology fared best by a wide margin, rising 39% amid strong earnings growth from several major index constituents. A 24% gain in materials was spurred by increased demand, especially from China. Consumer discretionary gained 23%, despite many brick-and-mortar retailers suffering from online competition, and financials edged the broader market on an uptick in bond yields. Conversely, the defensive energy and telecom services sectors returned about -1% each. Rising interest rates held back real estate (+11%), while consumer staples (+13%) and utilities (+12%) struggled due to investors’ general preference for risk assets.
Comments from Portfolio Manager Douglas Simmons: For the year ending December 31, 2017, the fund's share classes gained roughly 18%, well ahead of the 12.58% return of the sector benchmark, the MSCI IMI U.S. Utilities 25/50 Index, but trailing the broadly based S&P 500
®. In a rising interest rate environment, utilities historically have tended to underperform the broader market. While this scenario played out during 2017, utilities still posted gains, bolstered by strong fundamentals including rising power demand and prices. The fund’s emphasis on companies with above-average dividend growth contributed to its outperformance versus our MSCI benchmark for the year. Successful stock picking was the main driver of relative performance, led by choices in electric utilities. Here, the fund’s large overweighting in Florida-based NextEra Energy proved our biggest individual contributor. In general, the company’s solid, regulated business is complemented by its significant renewable-energy investments, helping make NextEra the largest renewable-energy supplier in the United States. The company executed well this period – posting solid earnings – and also received a boost from the tax-reform legislation passed in December. Stock selection and an overweighting in the independent power producers & energy traders segment also contributed, led by our position in NRG Energy, which more than doubled in value for the year. Conversely, stock picking in multi-utilities detracted. Here, our stake in South Carolina regulated electric and natural gas utility SCANA proved detrimental, as the company encountered numerous obstacles to completing its nuclear projects. Our zero-weighting in water utilities also hurt, as did – even more modestly – the fund's small cash stake in a rising market.
The views expressed above reflect those of the portfolio manager(s) only through the end of the period as stated on the cover of this report and do not necessarily represent the views of Fidelity or any other person in the Fidelity organization. Any such views are subject to change at any time based upon market or other conditions and Fidelity disclaims any responsibility to update such views. These views may not be relied on as investment advice and, because investment decisions for a Fidelity fund are based on numerous factors, may not be relied on as an indication of trading intent on behalf of any Fidelity fund.
Note to Shareholders: On December 8, 2017, shareholders approved proposals from the Board of Trustees to eliminate each sector/industry fund's fundamental “invests primarily” policy and to modify the fundamental concentration policy for certain funds. The changes took effect on January 1, 2018, and do not impact how the funds are managed.
Investment Summary (Unaudited)
Top Ten Stocks as of December 31, 2017
| | % of fund's net assets |
| NextEra Energy, Inc. | 18.2 |
| Exelon Corp. | 11.0 |
| Sempra Energy | 9.8 |
| NRG Energy, Inc. | 6.4 |
| Comcast Corp. Class A | 4.9 |
| Great Plains Energy, Inc. | 4.8 |
| The AES Corp. | 4.8 |
| Avangrid, Inc. | 4.4 |
| PG&E Corp. | 4.2 |
| Public Service Enterprise Group, Inc. | 3.8 |
| | 72.3 |
Top Industries (% of fund's net assets)
| As of December 31, 2017 |
| | Electric Utilities | 49.5% |
| | Multi-Utilities | 27.0% |
| | Independent Power and Renewable Electricity Producers | 15.1% |
| | Media | 4.9% |
| | Oil, Gas & Consumable Fuels | 2.9% |
| | All Others* | 0.6% |

* Includes short-term investments and net other assets (liabilities).
Investments December 31, 2017
Showing Percentage of Net Assets
| Common Stocks - 99.6% | | | |
| | | Shares | Value |
| Electric Utilities - 49.5% | | | |
| Electric Utilities - 49.5% | | | |
| Exelon Corp. | | 369,371 | $14,556,911 |
| FirstEnergy Corp. | | 159,623 | 4,887,656 |
| Great Plains Energy, Inc. | | 198,806 | 6,409,505 |
| NextEra Energy, Inc. | | 154,731 | 24,167,434 |
| OGE Energy Corp. | | 54,826 | 1,804,324 |
| PG&E Corp. | | 125,847 | 5,641,721 |
| Vistra Energy Corp. (a) | | 229,155 | 4,198,120 |
| Westar Energy, Inc. | | 74,300 | 3,923,040 |
| | | | 65,588,711 |
| Equity Real Estate Investment Trusts (REITs) - 0.2% | | | |
| Specialized REITs - 0.2% | | | |
| InfraReit, Inc. | | 12,419 | 230,745 |
| Independent Power and Renewable Electricity Producers - 15.1% | | | |
| Independent Power Producers & Energy Traders - 11.7% | | | |
| NRG Energy, Inc. | | 299,899 | 8,541,124 |
| NRG Yield, Inc. Class C | | 34,574 | 653,449 |
| The AES Corp. | | 587,095 | 6,358,239 |
| | | | 15,552,812 |
| Renewable Electricity - 3.4% | | | |
| NextEra Energy Partners LP | | 104,196 | 4,491,890 |
|
| TOTAL INDEPENDENT POWER AND RENEWABLE ELECTRICITY PRODUCERS | | | 20,044,702 |
|
| Media - 4.9% | | | |
| Cable & Satellite - 4.9% | | | |
| Comcast Corp. Class A | | 160,900 | 6,444,045 |
| Multi-Utilities - 27.0% | | | |
| Multi-Utilities - 27.0% | | | |
| Avangrid, Inc. (a) | | 114,697 | 5,801,374 |
| CenterPoint Energy, Inc. | | 148,668 | 4,216,224 |
| Dominion Resources, Inc. | | 62,035 | 5,028,557 |
| E.ON AG | | 63,611 | 689,300 |
| Public Service Enterprise Group, Inc. | | 98,000 | 5,047,000 |
| SCANA Corp. | | 48,345 | 1,923,164 |
| Sempra Energy | | 121,781 | 13,020,825 |
| | | | 35,726,444 |
| Oil, Gas & Consumable Fuels - 2.9% | | | |
| Oil & Gas Storage & Transport - 2.9% | | | |
| Cheniere Energy Partners LP Holdings LLC | | 59,924 | 1,659,296 |
| Cheniere Energy, Inc. (b) | | 39,900 | 2,148,216 |
| | | | 3,807,512 |
| TOTAL COMMON STOCKS | | | |
| (Cost $106,229,485) | | | 131,842,159 |
|
| Money Market Funds - 5.8% | | | |
| Fidelity Cash Central Fund, 1.36% (c) | | 678,097 | 678,232 |
| Fidelity Securities Lending Cash Central Fund 1.36% (c)(d) | | 7,013,246 | 7,014,648 |
| TOTAL MONEY MARKET FUNDS | | | |
| (Cost $7,692,185) | | | 7,692,880 |
| TOTAL INVESTMENT IN SECURITIES - 105.4% | | | |
| (Cost $113,921,670) | | | 139,535,039 |
| NET OTHER ASSETS (LIABILITIES) - (5.4)% | | | (7,118,667) |
| NET ASSETS - 100% | | | $132,416,372 |
Legend
(a) Security or a portion of the security is on loan at period end.
(b) Non-income producing
(c) Affiliated fund that is generally available only to investment companies and other accounts managed by Fidelity Investments. The rate quoted is the annualized seven-day yield of the fund at period end. A complete unaudited listing of the fund's holdings as of its most recent quarter end is available upon request. In addition, each Fidelity Central Fund's financial statements, which are not covered by the Fund's Report of Independent Registered Public Accounting Firm, are available on the SEC's website or upon request.
(d) Investment made with cash collateral received from securities on loan.
Affiliated Central Funds
Information regarding fiscal year to date income earned by the Fund from investments in Fidelity Central Funds is as follows:
| Fund | Income earned |
| Fidelity Cash Central Fund | $16,645 |
| Fidelity Securities Lending Cash Central Fund | 4,382 |
| Total | $21,027 |
Amounts in the income column in the above table include any capital gain distributions from underlying funds, which are presented in the corresponding line-item in the Statement of Operations if applicable.
Investment Valuation
The following is a summary of the inputs used, as of December 31, 2017, involving the Fund's assets and liabilities carried at fair value. The inputs or methodology used for valuing securities may not be an indication of the risk associated with investing in those securities. For more information on valuation inputs, and their aggregation into the levels used below, please refer to the Investment Valuation section in the accompanying Notes to Financial Statements.
| | Valuation Inputs at Reporting Date: |
| Description | Total | Level 1 | Level 2 | Level 3 |
| Investments in Securities: | | | | |
| Common Stocks | $131,842,159 | $131,152,859 | $689,300 | $-- |
| Money Market Funds | 7,692,880 | 7,692,880 | -- | -- |
| Total Investments in Securities: | $139,535,039 | $138,845,739 | $689,300 | $-- |
See accompanying notes which are an integral part of the financial statements.
Financial Statements
Statement of Assets and Liabilities
| | | December 31, 2017 |
| Assets | | |
Investment in securities, at value (including securities loaned of $6,884,754) — See accompanying schedule:
Unaffiliated issuers (cost $106,229,485) | $131,842,159 | |
| Fidelity Central Funds (cost $7,692,185) | 7,692,880 | |
| Total Investment in Securities (cost $113,921,670) | | $139,535,039 |
| Receivable for fund shares sold | | 21,141 |
| Dividends receivable | | 217,170 |
| Distributions receivable from Fidelity Central Funds | | 2,274 |
| Prepaid expenses | | 627 |
| Other receivables | | 3,379 |
| Total assets | | 139,779,630 |
| Liabilities | | |
| Payable for fund shares redeemed | $227,274 | |
| Accrued management fee | 61,548 | |
| Other affiliated payables | 19,385 | |
| Other payables and accrued expenses | 40,901 | |
| Collateral on securities loaned | 7,014,150 | |
| Total liabilities | | 7,363,258 |
| Net Assets | | $132,416,372 |
| Net Assets consist of: | | |
| Paid in capital | | $101,034,518 |
| Undistributed net investment income | | 582,016 |
| Accumulated undistributed net realized gain (loss) on investments and foreign currency transactions | | 5,186,358 |
| Net unrealized appreciation (depreciation) on investments and assets and liabilities in foreign currencies | | 25,613,480 |
| Net Assets | | $132,416,372 |
| Initial Class: | | |
| Net Asset Value, offering price and redemption price per share ($26,376,623 ÷ 1,576,570 shares) | | $16.73 |
| Investor Class: | | |
| Net Asset Value, offering price and redemption price per share ($106,039,749 ÷ 6,374,368 shares) | | $16.64 |
See accompanying notes which are an integral part of the financial statements.
Statement of Operations
| | | Year ended December 31, 2017 |
| Investment Income | | |
| Dividends | | $3,624,822 |
| Income from Fidelity Central Funds | | 21,027 |
| Total income | | 3,645,849 |
| Expenses | | |
| Management fee | $723,059 | |
| Transfer agent fees | 173,469 | |
| Accounting and security lending fees | 51,935 | |
| Custodian fees and expenses | 5,079 | |
| Independent trustees' fees and expenses | 3,000 | |
| Audit | 39,872 | |
| Legal | 3,314 | |
| Miscellaneous | 8,540 | |
| Total expenses before reductions | 1,008,268 | |
| Expense reductions | (15,448) | 992,820 |
| Net investment income (loss) | | 2,653,029 |
| Realized and Unrealized Gain (Loss) | | |
| Net realized gain (loss) on: | | |
| Investment securities: | | |
| Unaffiliated issuers | 7,404,637 | |
| Fidelity Central Funds | (337) | |
| Foreign currency transactions | 449 | |
| Total net realized gain (loss) | | 7,404,749 |
| Change in net unrealized appreciation (depreciation) on: | | |
| Investment securities: | | |
| Unaffiliated issuers | 11,097,183 | |
| Fidelity Central Funds | 695 | |
| Assets and liabilities in foreign currencies | 277 | |
| Total change in net unrealized appreciation (depreciation) | | 11,098,155 |
| Net gain (loss) | | 18,502,904 |
| Net increase (decrease) in net assets resulting from operations | | $21,155,933 |
See accompanying notes which are an integral part of the financial statements.
Statement of Changes in Net Assets
| | Year ended December 31, 2017 | Year ended December 31, 2016 |
| Increase (Decrease) in Net Assets | | |
| Operations | | |
| Net investment income (loss) | $2,653,029 | $2,876,654 |
| Net realized gain (loss) | 7,404,749 | (1,377,168) |
| Change in net unrealized appreciation (depreciation) | 11,098,155 | 10,056,594 |
| Net increase (decrease) in net assets resulting from operations | 21,155,933 | 11,556,080 |
| Distributions to shareholders from net investment income | (2,747,634) | (2,188,643) |
| Distributions to shareholders from net realized gain | – | (1,735,380) |
| Total distributions | (2,747,634) | (3,924,023) |
| Share transactions - net increase (decrease) | (10,559,513) | 37,214,122 |
| Redemption fees | 13,440 | 103,806 |
| Total increase (decrease) in net assets | 7,862,226 | 44,949,985 |
| Net Assets | | |
| Beginning of period | 124,554,146 | 79,604,161 |
| End of period | $132,416,372 | $124,554,146 |
| Other Information | | |
| Undistributed net investment income end of period | $582,016 | $676,171 |
See accompanying notes which are an integral part of the financial statements.
Financial Highlights
VIP Utilities Portfolio Initial Class
| Years ended December 31, | 2017 | 2016 | 2015 | 2014 | 2013 |
| Selected Per–Share Data | | | | | |
| Net asset value, beginning of period | $14.49 | $13.17 | $15.62 | $13.45 | $11.41 |
| Income from Investment Operations | | | | | |
| Net investment income (loss)A | .33 | .34 | .31 | .31 | .32 |
| Net realized and unrealized gain (loss) | 2.26 | 1.49 | (1.98) | 2.63 | 2.06 |
| Total from investment operations | 2.59 | 1.83 | (1.67) | 2.94 | 2.38 |
| Distributions from net investment income | (.35) | (.26) | (.33)B | (.27) | (.35) |
| Distributions from net realized gain | – | (.25) | (.45)B | (.51) | – |
| Total distributions | (.35) | (.52)C | (.78) | (.77)D | (.35) |
| Redemption fees added to paid in capitalA | –E | .01 | –E | –E | .01 |
| Net asset value, end of period | $16.73 | $14.49 | $13.17 | $15.62 | $13.45 |
| Total ReturnF,G | 17.88% | 14.17% | (10.78)% | 21.77% | 21.02% |
| Ratios to Average Net AssetsH,I | | | | | |
| Expenses before reductions | .69% | .70% | .71% | .70% | .74% |
| Expenses net of fee waivers, if any | .69% | .70% | .71% | .70% | .73% |
| Expenses net of all reductions | .68% | .69% | .70% | .69% | .71% |
| Net investment income (loss) | 2.06% | 2.30% | 2.17% | 2.01% | 2.44% |
| Supplemental Data | | | | | |
| Net assets, end of period (000 omitted) | $26,377 | $26,194 | $21,960 | $36,599 | $25,824 |
| Portfolio turnover rateJ | 52% | 83% | 88% | 113% | 156% |
A Calculated based on average shares outstanding during the period.
B The amounts shown reflect certain reclassifications related to book to tax differences that were made in the year shown.
C Total distributions of $.52 per share is comprised of distributions from net investment income of $.263 and distributions from net realized gain of $.253 per share.
D Total distributions of $.77 per share is comprised of distributions from net investment income of $.267 and distributions from net realized gain of $.506 per share.
E Amount represents less than $.005 per share.
F Total returns do not reflect charges attributable to your insurance company's separate account. Inclusion of these charges would reduce the total returns shown.
G Total returns would have been lower if certain expenses had not been reduced during the applicable periods shown.
H Fees and expenses of any underlying Fidelity Central Funds are not included in the Fund's expense ratio. The Fund indirectly bears its proportionate share of the expenses of any underlying Fidelity Central Funds.
I Expense ratios reflect operating expenses of the class. Expenses before reductions do not reflect amounts reimbursed by the investment adviser or reductions from brokerage service arrangements or reductions from other expense offset arrangements and do not represent the amount paid by the class during periods when reimbursements or reductions occur. Expenses net of fee waivers reflect expenses after reimbursement by the investment adviser but prior to reductions from brokerage service arrangements or other expense offset arrangements. Expenses net of all reductions represent the net expenses paid by the class.
J Amount does not include the portfolio activity of any underlying Fidelity Central Funds.
See accompanying notes which are an integral part of the financial statements.
VIP Utilities Portfolio Investor Class
| Years ended December 31, | 2017 | 2016 | 2015 | 2014 | 2013 |
| Selected Per–Share Data | | | | | |
| Net asset value, beginning of period | $14.41 | $13.11 | $15.54 | $13.39 | $11.36 |
| Income from Investment Operations | | | | | |
| Net investment income (loss)A | .32 | .32 | .30 | .29 | .30 |
| Net realized and unrealized gain (loss) | 2.25 | 1.48 | (1.96) | 2.62 | 2.06 |
| Total from investment operations | 2.57 | 1.80 | (1.66) | 2.91 | 2.36 |
| Distributions from net investment income | (.34) | (.26) | (.31)B | (.26) | (.34) |
| Distributions from net realized gain | – | (.25) | (.45)B | (.51) | – |
| Total distributions | (.34) | (.51) | (.77)C | (.76)D | (.34) |
| Redemption fees added to paid in capitalA | –E | .01 | –E | –E | .01 |
| Net asset value, end of period | $16.64 | $14.41 | $13.11 | $15.54 | $13.39 |
| Total ReturnF,G | 17.83% | 14.03% | (10.80)% | 21.64% | 20.92% |
| Ratios to Average Net AssetsH,I | | | | | |
| Expenses before reductions | .77% | .78% | .79% | .78% | .82% |
| Expenses net of fee waivers, if any | .77% | .78% | .79% | .78% | .81% |
| Expenses net of all reductions | .76% | .77% | .78% | .77% | .79% |
| Net investment income (loss) | 1.98% | 2.22% | 2.09% | 1.93% | 2.36% |
| Supplemental Data | | | | | |
| Net assets, end of period (000 omitted) | $106,040 | $98,360 | $57,645 | $96,217 | $51,308 |
| Portfolio turnover rateJ | 52% | 83% | 88% | 113% | 156% |
A Calculated based on average shares outstanding during the period.
B The amounts shown reflect certain reclassifications related to book to tax differences that were made in the year shown.
C Total distributions of $.77 per share is comprised of distributions from net investment income of $.314 and distributions from net realized gain of $.454 per share.
D Total distributions of $.76 per share is comprised of distributions from net investment income of $.257 and distributions from net realized gain of $.506 per share.
E Amount represents less than $.005 per share.
F Total returns do not reflect charges attributable to your insurance company's separate account. Inclusion of these charges would reduce the total returns shown.
G Total returns would have been lower if certain expenses had not been reduced during the applicable periods shown.
H Fees and expenses of any underlying Fidelity Central Funds are not included in the Fund's expense ratio. The Fund indirectly bears its proportionate share of the expenses of any underlying Fidelity Central Funds.
I Expense ratios reflect operating expenses of the class. Expenses before reductions do not reflect amounts reimbursed by the investment adviser or reductions from brokerage service arrangements or reductions from other expense offset arrangements and do not represent the amount paid by the class during periods when reimbursements or reductions occur. Expenses net of fee waivers reflect expenses after reimbursement by the investment adviser but prior to reductions from brokerage service arrangements or other expense offset arrangements. Expenses net of all reductions represent the net expenses paid by the class.
J Amount does not include the portfolio activity of any underlying Fidelity Central Funds.
See accompanying notes which are an integral part of the financial statements.
Notes to Financial Statements
For the period ended December 31, 2017
1. Organization.
VIP Utilities Portfolio (the Fund) is a non-diversified fund of Variable Insurance Products Fund IV (the Trust) and is authorized to issue an unlimited number of shares. The Trust is registered under the Investment Company Act of 1940, as amended (the 1940 Act), as an open-end management investment company organized as a Massachusetts business trust. Shares of the Fund may only be purchased by insurance companies for the purpose of funding variable annuity or variable life insurance contracts. The Fund offers the following classes of shares: Initial Class shares and Investor Class shares. All classes have equal rights and voting privileges, except for matters affecting a single class.
2. Investments in Fidelity Central Funds.
The Fund invests in Fidelity Central Funds, which are open-end investment companies generally available only to other investment companies and accounts managed by the investment adviser and its affiliates. The Fund's Schedule of Investments lists each of the Fidelity Central Funds held as of period end, if any, as an investment of the Fund, but does not include the underlying holdings of each Fidelity Central Fund. As an Investing Fund, the Fund indirectly bears its proportionate share of the expenses of the underlying Fidelity Central Funds.
The Money Market Central Funds seek preservation of capital and current income and are managed by Fidelity Investments Money Management, Inc. (FIMM), an affiliate of the investment adviser. Annualized expenses of the Money Market Central Funds as of their most recent shareholder report date are less than .005%.
A complete unaudited list of holdings for each Fidelity Central Fund is available upon request or at the Securities and Exchange Commission (the SEC) website at www.sec.gov. In addition, the financial statements of the Fidelity Central Funds, which are not covered by the Fund's Report of Independent Registered Public Accounting Firm, are available on the SEC website or upon request.
3. Significant Accounting Policies.
The Fund is an investment company and applies the accounting and reporting guidance of the Financial Accounting Standards Board (FASB) Accounting Standards Codification Topic 946 Financial Services – Investments Companies. The financial statements have been prepared in conformity with accounting principles generally accepted in the United States of America (GAAP), which require management to make certain estimates and assumptions at the date of the financial statements. Actual results could differ from those estimates. Subsequent events, if any, through the date that the financial statements were issued have been evaluated in the preparation of the financial statements. The following summarizes the significant accounting policies of the Fund:
Investment Valuation. Investments are valued as of 4:00 p.m. Eastern time on the last calendar day of the period. The Board of Trustees (the Board) has delegated the day to day responsibility for the valuation of the Fund's investments to the Fair Value Committee (the Committee) established by the Fund's investment adviser. In accordance with valuation policies and procedures approved by the Board, the Fund attempts to obtain prices from one or more third party pricing vendors or brokers to value its investments. When current market prices, quotations or currency exchange rates are not readily available or reliable, investments will be fair valued in good faith by the Committee, in accordance with procedures adopted by the Board. Factors used in determining fair value vary by investment type and may include market or investment specific events. The frequency with which these procedures are used cannot be predicted and they may be utilized to a significant extent. The Committee oversees the Fund's valuation policies and procedures and reports to the Board on the Committee's activities and fair value determinations. The Board monitors the appropriateness of the procedures used in valuing the Fund's investments and ratifies the fair value determinations of the Committee.
The Fund categorizes the inputs to valuation techniques used to value its investments into a disclosure hierarchy consisting of three levels as shown below:
- Level 1 – quoted prices in active markets for identical investments
- Level 2 – other significant observable inputs (including quoted prices for similar investments, interest rates, prepayment speeds, etc.)
- Level 3 – unobservable inputs (including the Fund's own assumptions based on the best information available)
Valuation techniques used to value the Fund's investments by major category are as follows:
Equity securities, including restricted securities, for which market quotations are readily available, are valued at the last reported sale price or official closing price as reported by a third party pricing vendor on the primary market or exchange on which they are traded and are categorized as Level 1 in the hierarchy. In the event there were no sales during the day or closing prices are not available, securities are valued at the last quoted bid price or may be valued using the last available price and are generally categorized as Level 2 in the hierarchy. For foreign equity securities, when market or security specific events arise, comparisons to the valuation of American Depositary Receipts (ADRs), futures contracts, Exchange-Traded Funds (ETFs) and certain indexes as well as quoted prices for similar securities may be used and would be categorized as Level 2 in the hierarchy. Utilizing these techniques may result in transfers between Level 1 and Level 2. For equity securities, including restricted securities, where observable inputs are limited, assumptions about market activity and risk are used and these securities may be categorized as Level 3 in the hierarchy.
Investments in open-end mutual funds, including the Fidelity Central Funds, are valued at their closing net asset value (NAV) each business day and are categorized as Level 1 in the hierarchy
Changes in valuation techniques may result in transfers in or out of an assigned level within the disclosure hierarchy. The aggregate value of investments by input level as of December 31, 2017 is included at the end of the Fund's Schedule of Investments.
Foreign Currency. The Fund may use foreign currency contracts to facilitate transactions in foreign-denominated securities. Gains and losses from these transactions may arise from changes in the value of the foreign currency or if the counterparties do not perform under the contracts' terms.
Foreign-denominated assets, including investment securities, and liabilities are translated into U.S. dollars at the exchange rates at period end. Purchases and sales of investment securities, income and dividends received and expenses denominated in foreign currencies are translated into U.S. dollars at the exchange rate in effect on the transaction date.
The effects of exchange rate fluctuations on investments are included with the net realized and unrealized gain (loss) on investment securities. Other foreign currency transactions resulting in realized and unrealized gain (loss) are disclosed separately.
Investment Transactions and Income. For financial reporting purposes, the Fund's investment holdings and NAV include trades executed through the end of the last business day of the period. The NAV per share for processing shareholder transactions is calculated as of the close of business of the New York Stock Exchange (NYSE), normally 4:00 p.m. Eastern time and includes trades executed through the end of the prior business day. Gains and losses on securities sold are determined on the basis of identified cost and includes proceeds received from litigation. Dividend income is recorded on the ex-dividend date, except for certain dividends from foreign securities where the ex-dividend date may have passed, which are recorded as soon as the Fund is informed of the ex-dividend date. Non-cash dividends included in dividend income, if any, are recorded at the fair market value of the securities received. Income and capital gain distributions from Fidelity Central Funds, if any, are recorded on the ex-dividend date. Certain distributions received by the Fund represent a return of capital or capital gain. The Fund determines the components of these distributions subsequent to the ex-dividend date, based upon receipt of tax filings or other correspondence relating to the underlying investment. These distributions are recorded as a reduction of cost of investments and/or as a realized gain. Investment income is recorded net of foreign taxes withheld where recovery of such taxes is uncertain.
Class Allocations and Expenses. Investment income, realized and unrealized capital gains and losses, common expenses of the Fund, and certain fund-level expense reductions, if any, are allocated daily on a pro-rata basis to each class based on the relative net assets of each class to the total net assets of the Fund. Each class differs with respect to transfer agent fees incurred. Certain expense reductions may also differ by class. For the reporting period, the allocated portion of income and expenses to each class as a percent of its average net assets may vary due to the timing of recording these transactions in relation to fluctuating net assets of the classes. Expenses directly attributable to a fund are charged to that fund. Expenses attributable to more than one fund are allocated among the respective funds on the basis of relative net assets or other appropriate methods. Expense estimates are accrued in the period to which they relate and adjustments are made when actual amounts are known.
Income Tax Information and Distributions to Shareholders. Each year, the Fund intends to qualify as a regulated investment company under Subchapter M of the Internal Revenue Code, including distributing substantially all of its taxable income and realized gains. As a result, no provision for U.S. Federal income taxes is required. As of December 31, 2017, the Fund did not have any unrecognized tax benefits in the financial statements; nor is the Fund aware of any tax positions for which it is reasonably possible that the total amounts of unrecognized tax benefits will significantly change in the next twelve months. The Fund files a U.S. federal tax return, in addition to state and local tax returns as required. The Fund's federal income tax returns are subject to examination by the Internal Revenue Service (IRS) for a period of three fiscal years after they are filed. State and local tax returns may be subject to examination for an additional fiscal year depending on the jurisdiction. Foreign taxes are provided for based on the Fund's understanding of the tax rules and rates that exist in the foreign markets in which it invests.
Distributions are declared and recorded on the ex-dividend date. Income dividends and capital gain distributions are declared separately for each class. Income and capital gain distributions are determined in accordance with income tax regulations, which may differ from GAAP.
Capital accounts within the financial statements are adjusted for permanent book-tax differences. These adjustments have no impact on net assets or the results of operations. Capital accounts are not adjusted for temporary book-tax differences which will reverse in a subsequent period.
Book-tax differences are primarily due to foreign currency transactions, capital loss carryforwards and losses deferred due to wash sales.
As of period end, the cost and unrealized appreciation (depreciation) in securities, and derivatives if applicable, for federal income tax purposes were as follows:
| Gross unrealized appreciation | $28,317,764 |
| Gross unrealized depreciation | (2,873,285) |
| Net unrealized appreciation (depreciation) | $25,444,479 |
| Tax Cost | $114,090,560 |
The tax-based components of distributable earnings as of period end were as follows:
| Undistributed ordinary income | $582,016 |
| Undistributed long-term capital gain | $5,355,248 |
| Net unrealized appreciation (depreciation) on securities and other investments | $25,444,590 |
The tax character of distributions paid was as follows:
| | December 31, 2017 | December 31,2016 |
| Ordinary Income | $2,747,634 | $ 2,188,643 |
| Long-term Capital Gains | - | 1,735,380 |
| Total | $2,747,634 | $ 3,924,023 |
Trading (Redemption) Fees. Shares held by investors less than 60 days may be subject to a redemption fee equal to 1% of the NAV of shares redeemed. All redemption fees, which reduce the proceeds of the shareholder redemption, are retained by the Fund and accounted for as an addition to paid in capital. In November 2017, the Board of Trustees approved the elimination of these redemption fees effective December 18, 2017.
4. Purchases and Sales of Investments.
Purchases and sales of securities, other than short-term securities, aggregated $68,176,049 and $76,554,985, respectively.
5. Fees and Other Transactions with Affiliates.
Management Fee. Fidelity SelectCo, LLC (the investment adviser) and its affiliates provide the Fund with investment management related services for which the Fund pays a monthly management fee. The management fee is the sum of an individual fund fee rate that is based on an annual rate of .30% of the Fund's average net assets and an annualized group fee rate that averaged .24% during the period. The group fee rate is based upon the average net assets of all the mutual funds advised by Fidelity Management & Research Company (FMR) and the investment adviser. The group fee rate decreases as assets under management increase and increases as assets under management decrease. For the reporting period, the total annual management fee rate was .54% of the Fund's average net assets.
Transfer Agent Fees. Fidelity Investments Institutional Operations Company, Inc. (FIIOC), an affiliate of the investment adviser, is the Fund's transfer, dividend disbursing, and shareholder servicing agent. FIIOC receives an asset-based fee with respect to each class. Each class pays a fee for transfer agent services, typesetting and printing and mailing of shareholder reports, excluding mailing of proxy statements, equal to an annual rate of class-level average net assets. The annual rate for Investor Class is .15% and the annual rate for all other classes is .07%. For the period, transfer agent fees for each class were as follows:
| Initial Class | $17,649 |
| Investor Class | 155,820 |
| | $173,469 |
Accounting and Security Lending Fees. Fidelity Service Company, Inc. (FSC), an affiliate of the investment adviser, maintains the Fund's accounting records. The accounting fee is based on the level of average net assets for each month. Under a separate contract, FSC administers the security lending program. The security lending fee is based on the number and duration of lending transactions.
Brokerage Commissions. The Fund placed a portion of its portfolio transactions with brokerage firms which are affiliates of the investment adviser. Brokerage commissions are included in net realized gain (loss) and change in net unrealized appreciation (depreciation) in the Statement of Operations. The commissions paid to these affiliated firms were $1,981 for the period.
Interfund Trades. The Fund may purchase from or sell securities to other Fidelity Funds under procedures adopted by the Board. The procedures have been designed to ensure these interfund trades are executed in accordance with Rule 17a-7 of the 1940 Act. Interfund trades are included within the respective purchases and sales amounts shown in the Purchases and Sales of Investments note.
6. Committed Line of Credit.
The Fund participates with other funds managed by the investment adviser or an affiliate in a $4.25 billion credit facility (the "line of credit") to be utilized for temporary or emergency purposes to fund shareholder redemptions or for other short-term liquidity purposes. The Fund has agreed to pay commitment fees on its pro-rata portion of the line of credit, which amounted to $418 and is reflected in Miscellaneous expenses on the Statement of Operations. During the period, the Fund did not borrow on this line of credit.
7. Security Lending.
The Fund lends portfolio securities through a lending agent from time to time in order to earn additional income. On the settlement date of the loan, the Fund receives collateral (in the form of U.S. Treasury obligations, letters of credit and/or cash) against the loaned securities and maintains collateral in an amount not less than 100% of the market value of the loaned securities during the period of the loan. The market value of the loaned securities is determined at the close of business of the Fund and any additional required collateral is delivered to the Fund on the next business day. The Fund or borrower may terminate the loan at any time, and if the borrower defaults on its obligation to return the securities loaned because of insolvency or other reasons, the Fund may apply collateral received from the borrower against the obligation. The Fund may experience delays and costs in recovering the securities loaned. Any cash collateral received is invested in the Fidelity Securities Lending Cash Central Fund. The value of loaned securities and cash collateral at period end are disclosed on the Fund's Statement of Assets and Liabilities. Security lending income represents the income earned on investing cash collateral, less rebates paid to borrowers and any lending agent fees associated with the loan, plus any premium payments received for lending certain types of securities. Security lending income is presented in the Statement of Operations as a component of income from Fidelity Central Funds. Total security lending income during the period amounted to $4,382.
8. Expense Reductions.
Commissions paid to certain brokers with whom the investment adviser, or its affiliates, places trades on behalf of the Fund include an amount in addition to trade execution, which may be rebated back to the Fund to offset certain expenses. This amount totaled $14,206 for the period.
In addition, during the period the investment adviser reimbursed and/or waived a portion of fund-level operating expenses in the amount of $1,242.
9. Distributions to Shareholders.
Distributions to shareholders of each class were as follows:
| | Year ended
December 31, 2017 | Year ended
December 31, 2016 |
| From net investment income | | |
| Initial Class | $563,202 | $473,942 |
| Investor Class | 2,184,432 | 1,714,701 |
| Total | $2,747,634 | $2,188,643 |
| From net realized gain | | |
| Initial Class | $– | $470,790 |
| Investor Class | – | 1,264,590 |
| Total | $– | $1,735,380 |
10. Share Transactions.
Transactions for each class of shares were as follows:
| | Shares | Shares | Dollars | Dollars |
| | Year ended December 31, 2017 | Year ended December 31, 2016 | Year ended December 31, 2017 | Year ended December 31, 2016 |
| Initial Class | | | | |
| Shares sold | 112,872 | 1,560,739 | $1,838,537 | $22,897,589 |
| Reinvestment of distributions | 33,747 | 68,510 | 563,202 | 944,732 |
| Shares redeemed | (377,929) | (1,488,181) | (6,004,954) | (21,844,831) |
| Net increase (decrease) | (231,310) | 141,068 | $(3,603,215) | $1,997,490 |
| Investor Class | | | | |
| Shares sold | 860,996 | 4,383,728 | $13,865,966 | $63,843,246 |
| Reinvestment of distributions | 131,493 | 215,675 | 2,184,432 | 2,979,291 |
| Shares redeemed | (1,444,025) | (2,170,596) | (23,006,696) | (31,605,905) |
| Net increase (decrease) | (451,536) | 2,428,807 | $(6,956,298) | $35,216,632 |
11. Other.
The Fund's organizational documents provide former and current trustees and officers with a limited indemnification against liabilities arising in connection with the performance of their duties to the Fund. In the normal course of business, the Fund may also enter into contracts that provide general indemnifications. The Fund's maximum exposure under these arrangements is unknown as this would be dependent on future claims that may be made against the Fund. The risk of material loss from such claims is considered remote.
At the end of the period, the investment adviser or its affiliates were the owners of record of 100% of the total outstanding shares of the fund.
Report of Independent Registered Public Accounting Firm
To the Board of Trustees of Variable Insurance Products Fund IV and Shareholders of VIP Utilities Portfolio:
Opinion on the Financial Statements
We have audited the accompanying statement of assets and liabilities, including the schedule of investments, of VIP Utilities Portfolio (one of the funds constituting Variable Insurance Products Fund IV, referred to hereafter as the “Fund”) as of December 31, 2017, the related statements of operations for the year ended December 31, 2017, the statement of changes in net assets for each of the two years in the period ended December 31, 2017,including the related notes, and the financial highlights for each of the five years in the period ended December 31, 2017 (collectively referred to as the “financial statements”). In our opinion, the financial statements present fairly, in all material respects, the financial position of the Fund as of December 31, 2017, the results of its operations for the year then ended, the changes in its net assets for each of the two years in the period ended December 31, 2017 and the financial highlights for each of the five years in the period ended December 31, 2017 in conformity with accounting principles generally accepted in the United States of America.
Basis for Opinion
These financial statements are the responsibility of the Fund’s management. Our responsibility is to express an opinion on the Fund’s financial statements based on our audits. We are a public accounting firm registered with the Public Company Accounting Oversight Board (United States) (“PCAOB”) and are required to be independent with respect to the Fund in accordance with the U.S. federal securities laws and the applicable rules and regulations of the Securities and Exchange Commission and the PCAOB.
We conducted our audits of these financial statements in accordance with the standards of the PCAOB. Those standards require that we plan and perform the audit to obtain reasonable assurance about whether the financial statements are free of material misstatement, whether due to error or fraud.
Our audits included performing procedures to assess the risks of material misstatement of the financial statements, whether due to error or fraud, and performing procedures that respond to those risks. Such procedures included examining, on a test basis, evidence regarding the amounts and disclosures in the financial statements. Our audits also included evaluating the accounting principles used and significant estimates made by management, as well as evaluating the overall presentation of the financial statements. Our procedures included confirmation of securities owned as of December 31, 2017 by correspondence with the custodian. We believe that our audits provide a reasonable basis for our opinion.
PricewaterhouseCoopers LLP
Boston, Massachusetts
February 15, 2018
We have served as the auditor of one or more investment companies in the Fidelity group of funds since 1932.
Trustees and Officers
The Trustees, Members of the Advisory Board (if any), and officers of the [trust and fund, as applicable, are listed below. The Board of Trustees governs the fund and is responsible for protecting the interests of shareholders. The Trustees are experienced executives who meet periodically throughout the year to oversee the fund's activities, review contractual arrangements with companies that provide services to the fund, oversee management of the risks associated with such activities and contractual arrangements, and review the fund's performance. Each of the Trustees oversees 91 funds.
The Trustees hold office without limit in time except that (a) any Trustee may resign; (b) any Trustee may be removed by written instrument, signed by at least two-thirds of the number of Trustees prior to such removal; (c) any Trustee who requests to be retired or who has become incapacitated by illness or injury may be retired by written instrument signed by a majority of the other Trustees; and (d) any Trustee may be removed at any special meeting of shareholders by a two-thirds vote of the outstanding voting securities of the trust. Each Trustee who is not an interested person (as defined in the 1940 Act) of the trust and the fund is referred to herein as an Independent Trustee. Each Independent Trustee shall retire not later than the last day of the calendar year in which his or her 75th birthday occurs. The Independent Trustees may waive this mandatory retirement age policy with respect to individual Trustees. Officers and Advisory Board Members hold office without limit in time, except that any officer or Advisory Board Member may resign or may be removed by a vote of a majority of the Trustees at any regular meeting or any special meeting of the Trustees. Except as indicated, each individual has held the office shown or other offices in the same company for the past five years.
The fund’s Statement of Additional Information (SAI) includes more information about the Trustees. To request a free copy, call Fidelity at 1-877-208-0098.
Experience, Skills, Attributes, and Qualifications of the Trustees. The Governance and Nominating Committee has adopted a statement of policy that describes the experience, qualifications, attributes, and skills that are necessary and desirable for potential Independent Trustee candidates (Statement of Policy). The Board believes that each Trustee satisfied at the time he or she was initially elected or appointed a Trustee, and continues to satisfy, the standards contemplated by the Statement of Policy. The Governance and Nominating Committee also engages professional search firms to help identify potential Independent Trustee candidates who have the experience, qualifications, attributes, and skills consistent with the Statement of Policy. From time to time, additional criteria based on the composition and skills of the current Independent Trustees, as well as experience or skills that may be appropriate in light of future changes to board composition, business conditions, and regulatory or other developments, have also been considered by the professional search firms and the Governance and Nominating Committee. In addition, the Board takes into account the Trustees' commitment and participation in Board and committee meetings, as well as their leadership of standing and ad hoc committees throughout their tenure.
In determining that a particular Trustee was and continues to be qualified to serve as a Trustee, the Board has considered a variety of criteria, none of which, in isolation, was controlling. The Board believes that, collectively, the Trustees have balanced and diverse experience, qualifications, attributes, and skills, which allow the Board to operate effectively in governing the fund and protecting the interests of shareholders. Information about the specific experience, skills, attributes, and qualifications of each Trustee, which in each case led to the Board's conclusion that the Trustee should serve (or continue to serve) as a trustee of the fund, is provided below.
Board Structure and Oversight Function. Brian B. Hogan is an interested person and currently serves as Chairman. The Trustees have determined that an interested Chairman is appropriate and benefits shareholders because an interested Chairman has a personal and professional stake in the quality and continuity of services provided to the fund. Independent Trustees exercise their informed business judgment to appoint an individual of their choosing to serve as Chairman, regardless of whether the Trustee happens to be independent or a member of management. The Independent Trustees have determined that they can act independently and effectively without having an Independent Trustee serve as Chairman and that a key structural component for assuring that they are in a position to do so is for the Independent Trustees to constitute a substantial majority for the Board. The Independent Trustees also regularly meet in executive session. Michael E. Wiley serves as Chairman of the Independent Trustees and as such (i) acts as a liaison between the Independent Trustees and management with respect to matters important to the Independent Trustees and (ii) with management prepares agendas for Board meetings.
Fidelity® funds are overseen by different Boards of Trustees. The fund's Board oversees Fidelity's sector portfolios. Other Boards oversee Fidelity's equity and high income funds, and Fidelity's investment grade bond, money market, and asset allocation funds. The use of separate Boards, each with its own committee structure, allows the Trustees of each group of Fidelity® funds to focus on the unique issues of the funds they oversee, including common research, investment, and operational issues. On occasion, the separate Boards establish joint committees to address issues of overlapping consequences for the Fidelity® funds overseen by each Board.
The Trustees operate using a system of committees to facilitate the timely and efficient consideration of all matters of importance to the Trustees, the fund, and fund shareholders and to facilitate compliance with legal and regulatory requirements and oversight of the fund's activities and associated risks. The Board, acting through its committees, has charged SelectCo and its affiliates with (i) identifying events or circumstances the occurrence of which could have demonstrably adverse effects on the fund's business and/or reputation; (ii) implementing processes and controls to lessen the possibility that such events or circumstances occur or to mitigate the effects of such events or circumstances if they do occur; and (iii) creating and maintaining a system designed to evaluate continuously business and market conditions in order to facilitate the identification and implementation processes described in (i) and (ii) above. Because the day-to-day operations and activities of the fund are carried out by or through SelectCo, its affiliates, and other service providers, the fund's exposure to risks is mitigated but not eliminated by the processes overseen by the Trustees. While each of the Board's committees has responsibility for overseeing different aspects of the fund's activities, oversight is exercised primarily through the Operations and Audit Committees. Appropriate personnel, including but not limited to the fund's Chief Compliance Officer (CCO), SelectCo's internal auditor, the independent accountants, the fund's Treasurer and portfolio management personnel, make periodic reports to the Board's committees, as appropriate. The responsibilities of each standing committee, including their oversight responsibilities, are described further under "Standing Committees of the Trustees."
Interested Trustees*:
Correspondence intended for a Trustee who is an interested person may be sent to Fidelity Investments, 245 Summer Street, Boston, Massachusetts 02210.
Name, Year of Birth; Principal Occupations and Other Relevant Experience+
Brian B. Hogan (1964)
Year of Election or Appointment: 2014
Trustee
Chairman of the Board of Trustees
Mr. Hogan also serves as Trustee or Vice President of other funds. Mr. Hogan serves as a Director of FMR Investment Management (UK) Limited (investment adviser firm, 2015-present) and Fidelity SelectCo, LLC (investment adviser firm, 2014-present) and President of the Equity Division of FMR (investment adviser firm, 2009-present). Previously, Mr. Hogan served as Senior Vice President, Equity Research of FMR (2006-2009) and as a portfolio manager. Mr. Brian B. Hogan is not related to Mr. Colm A. Hogan.
* Determined to be an "Interested Trustee" by virtue of, among other things, his or her affiliation with the trust[s] or various entities under common control with SelectCo.
+ The information includes the Trustee's principal occupation during the last five years and other information relating to the experience, attributes, and skills relevant to the Trustee's qualifications to serve as a Trustee, which led to the conclusion that the Trustee should serve as a Trustee for the fund.
Independent Trustees:
Correspondence intended for an Independent Trustee may be sent to Fidelity Investments, P.O. Box 55235, Boston, Massachusetts 02205-5235.
Name, Year of Birth; Principal Occupations and Other Relevant Experience+
David A. Rosow (1942)
Year of Election or Appointment: 2013
Trustee
Mr. Rosow also serves as Trustee of other Fidelity® funds. Prior to his retirement in 2006, Mr. Rosow was the Chief Executive Officer, owner and operator of a number of private companies, which encompassed the oil refining, drilling and marketing of petroleum products (including specialty petroleum products), recreation industry, and real estate development. Mr. Rosow currently serves as a Director of Oxbow Carbon LLC (upgraders, marketers, and distributors of petroleum byproducts of the oil refining process, 2015-present) and Oxbridge Academy of the Palm Beaches (2015-present) and serves as its President and CEO. Previously, Mr. Rosow served on the Fairfield Country Day School Board for 27 years, including as its President for 3 years, stepping down in 2006. Mr. Rosow served as Lead Director and Chairman of the Audit Committee of Hudson United Bancorp (1996-2006), Chairman of the Board of Westport Bank and Trust (1992-1996), and as a Director of TD Banknorth (2006-2007). In addition, Mr. Rosow served as a member (2008-2014) and President (2009-2014) of the Town Council of Palm Beach, Florida. Mr. Rosow also served as a Member of the Advisory Board of certain Fidelity® funds (2012-2013).
Garnett A. Smith (1947)
Year of Election or Appointment: 2013
Trustee
Mr. Smith also serves as Trustee of other Fidelity® funds. Prior to Mr. Smith's retirement, he served as Chairman and Chief Executive Officer of Inbrand Corp. (manufacturer of personal absorbent products, 1990-1997). He also served as President (1986-1990) of Inbrand Corp. Prior to his employment with Inbrand Corp., he was employed by a retail fabric chain and North Carolina National Bank. In addition, Mr. Smith served as a Member of the Advisory Board of certain Fidelity® funds (2012-2013) and as a board member of the Jackson Hole Land Trust (2009-2012).
Michael E. Wiley (1950)
Year of Election or Appointment: 2008
Trustee
Chairman of the Independent Trustees
Mr. Wiley also serves as Trustee of other Fidelity® funds. Mr. Wiley serves as a Director of Andeavor Corporation (independent oil refiner and marketer, 2005-present), a Director of Andeavor Logistics LP (natural resources logistics, 2015-present), and a Director of Bill Barrett Corporation (exploration and production, 2005-present). In addition, Mr. Wiley also serves as a Director of Post Oak Bank (privately-held bank, 2004-present). Previously, Mr. Wiley served as a Trustee of other Fidelity® funds (2008-2013), as a Director of Asia Pacific Exploration Consolidated (international oil and gas exploration and production, 2008-2013), as a member of the Board of Trustees of the University of Tulsa (2000-2006; 2007-2010), as a Senior Energy Advisor of Katzenbach Partners, LLC (consulting, 2006-2007), as an Advisory Director of Riverstone Holdings (private investment), Chairman, President, and CEO of Baker Hughes, Inc. (oilfield services, 2000-2004), and as Director of Spinnaker Exploration Company (exploration and production, 2001-2005).
+ The information includes the Trustee's principal occupation during the last five years and other information relating to the experience, attributes, and skills relevant to the Trustee's qualifications to serve as a Trustee, which led to the conclusion that the Trustee should serve as a Trustee for the fund.
Advisory Board Members and Officers:
Correspondence intended for a Member of the Advisory Board (if any) may be sent to Fidelity Investments, P.O. Box 55235, Boston, Massachusetts 02205-5235. Except for Anthony R. Rochte, correspondence intended for an officer may be sent to Fidelity Investments, 245 Summer Street, Boston, Massachusetts 02210. Correspondence intended for Mr. Rochte may be sent to Fidelity SelectCo, LLC (SelectCo), 1225 17th Street, Denver, Colorado 80202-5541. Officers appear below in alphabetical order.
Name, Year of Birth; Principal Occupation
Donald F. Donahue (1950)
Year of Election or Appointment: 2015
Member of the Advisory Board
Mr. Donahue also serves as a Trustee or Member of the Advisory Board of other Fidelity® funds. Mr. Donahue is President and Chief Executive Officer of Miranda Partners, LLC (risk consulting for the financial services industry, 2012-present). Previously, Mr. Donahue served as Chief Executive Officer (2006-2012), Chief Operating Officer (2003-2006), and Managing Director, Customer Marketing and Development (1999-2003) of The Depository Trust & Clearing Corporation (financial markets infrastructure). Mr. Donahue serves as a Member (2007-present) and Co-Chairman (2016-present) of the Board of Directors of United Way of New York, Member of the Board of Directors of NYC Leadership Academy (2012-present) and Member of the Board of Advisors of Ripple Labs, Inc. (financial services, 2015-present). He also served as Chairman (2010-2012) and Member of the Board of Directors (2012-2013) of Omgeo, LLC (financial services), Treasurer of United Way of New York (2012-2016), and Member of the Board of Directors of XBRL US (financial services non-profit, 2009-2012) and the International Securities Services Association (2009-2012).
Carol B. Tomé (1957)
Year of Election or Appointment: 2017
Member of the Advisory Board
Ms. Tomé also serves as Member of the Advisory Board of other Fidelity® funds. Ms. Tomé is Chief Financial Officer (2001-present) and Executive Vice President of Corporate Services (2007-present) of The Home Depot, Inc. (home improvement retailer) and a Director (2003-present) and Chair of the Audit Committee (2004-present) of United Parcel Service, Inc. (package delivery and supply chain management). Previously, Ms. Tomé served as Trustee of certain Fidelity® funds (2017), Senior Vice President of Finance and Accounting/Treasurer (2000-2007) and Vice President and Treasurer (1995-2000) of The Home Depot, Inc. and Chair of the Board (2010-2012), Vice Chair of the Board (2009 and 2013), and a Director (2008-2013) of the Federal Reserve Bank of Atlanta. Ms. Tomé is also a director or trustee of many community and professional organizations.
Elizabeth Paige Baumann (1968)
Year of Election or Appointment: 2017
Anti-Money Laundering (AML) Officer
Ms. Baumann also serves as AML Officer of other funds. She is Chief AML Officer (2012-present) and Senior Vice President (2014-present) of FMR LLC (diversified financial services company) and is an employee of Fidelity Investments. Previously, Ms. Baumann served as AML Officer of the funds (2012-2016), and Vice President (2007-2014) and Deputy Anti-Money Laundering Officer (2007-2012) of FMR LLC.
Marc R. Bryant (1966)
Year of Election or Appointment: 2013
Secretary and Chief Legal Officer (CLO)
Mr. Bryant also serves as Secretary and CLO of other funds. Mr. Bryant serves as CLO, Secretary, and Senior Vice President of Fidelity Management & Research Company (investment adviser firm, 2015-present) and FMR Co., Inc. (investment adviser firm, 2015-present); Secretary of Fidelity SelectCo, LLC (investment adviser firm, 2015-present) and Fidelity Investments Money Management, Inc. (investment adviser firm, 2015-present); and CLO of Fidelity Management & Research (Hong Kong) Limited and FMR Investment Management (UK) Limited (investment adviser firms, 2015-present) and Fidelity Management & Research (Japan) Limited (investment adviser firm, 2016-present). He is Senior Vice President and Deputy General Counsel of FMR LLC (diversified financial services company). Previously, Mr. Bryant served as Secretary and CLO of Fidelity Rutland Square Trust II (2010-2014) and Assistant Secretary of Fidelity's Fixed Income and Asset Allocation Funds (2013-2015). Prior to joining Fidelity Investments, Mr. Bryant served as a Senior Vice President and the Head of Global Retail Legal for AllianceBernstein L.P. (2006-2010), and as the General Counsel for ProFund Advisors LLC (2001-2006).
William C. Coffey (1969)
Year of Election or Appointment: 2009
Assistant Secretary
Mr. Coffey also serves as Assistant Secretary of other funds. He is Senior Vice President and Deputy General Counsel of FMR LLC (diversified financial services company, 2010-present), and is an employee of Fidelity Investments. Previously, Mr. Coffey served as Vice President and Associate General Counsel of FMR LLC (2005-2009).
Jonathan Davis (1968)
Year of Election or Appointment: 2010
Assistant Treasurer
Mr. Davis also serves as Assistant Treasurer of other funds. Mr. Davis serves as Assistant Treasurer of FMR Capital, Inc. (2017-present) and is an employee of Fidelity Investments. Previously, Mr. Davis served as Vice President and Associate General Counsel of FMR LLC (diversified financial services company, 2003-2010).
Adrien E. Deberghes (1967)
Year of Election or Appointment: 2013
President and Treasurer
Mr. Deberghes also serves as an officer of other funds. He serves as Assistant Treasurer of FMR Capital, Inc. (2017-present), Executive Vice President of Fidelity Investments Money Management, Inc. (FIMM) (investment adviser firm, 2016-present), and is an employee of Fidelity Investments (2008-present). Prior to joining Fidelity Investments, Mr. Deberghes was Senior Vice President of Mutual Fund Administration at State Street Corporation (2007-2008), Senior Director of Mutual Fund Administration at Investors Bank & Trust (2005-2007), and Director of Finance for Dunkin' Brands (2000-2005). Previously, Mr. Deberghes served in other fund officer roles.
Joseph DeSantis (1959)
Year of Election or Appointment: 2015
Vice President
Mr. DeSantis also serves as Vice President of other funds. Mr. DeSantis serves as a Director of Fidelity Management & Research (Japan) Limited (investment adviser firm, 2016-present), Chief Investment Officer, Equities (2010-present) and is an employee of Fidelity Investments.
Stephanie J. Dorsey (1969)
Year of Election or Appointment: 2010
Assistant Treasurer
Ms. Dorsey also serves as an officer of other funds. Ms. Dorsey serves as Assistant Treasurer of FMR Capital, Inc. (2017-present), is an employee of Fidelity Investments (2008-present), and has served in other fund officer roles. Prior to joining Fidelity Investments, Ms. Dorsey served as Treasurer (2004-2008) of the JPMorgan Mutual Funds and Vice President (2004-2008) of JPMorgan Chase Bank.
Howard J. Galligan III (1966)
Year of Election or Appointment: 2014
Chief Financial Officer
Mr. Galligan also serves as Chief Financial Officer of other funds. Mr. Galligan serves as President of Fidelity Pricing and Cash Management Services (FPCMS) (2014-present) and as a Director of Strategic Advisers, Inc. (investment adviser firm, 2008-present). Previously, Mr. Galligan served as Chief Administrative Officer of Asset Management (2011-2014) and Chief Operating Officer and Senior Vice President of Investment Support for Strategic Advisers, Inc. (2003-2011).
James D. Gryglewicz (1972)
Year of Election or Appointment: 2014
Chief Compliance Officer
Mr. Gryglewicz also serves as Chief Compliance Officer of other funds. Mr. Gryglewicz serves as Compliance Officer of Strategic Advisers, Inc. (investment adviser firm, 2015-present) and Fidelity SelectCo, LLC (investment adviser firm, 2014-present), Senior Vice President of Asset Management Compliance (2009-present), and is an employee of Fidelity Investments (2004-present).
Brian B. Hogan (1964)
Year of Election or Appointment: 2009
Vice President
Mr. Hogan also serves as Trustee or Vice President of other funds. Mr. Hogan serves as a Director of FMR Investment Management (UK) Limited (investment adviser firm, 2015-present) and Fidelity SelectCo, LLC (investment adviser firm, 2014-present) and President of the Equity Division of FMR (investment adviser firm, 2009-present). Previously, Mr. Hogan served as Senior Vice President, Equity Research of FMR (2006-2009) and as a portfolio manager. Mr. Brian B. Hogan is not related to Mr. Colm A. Hogan.
Colm A. Hogan (1973)
Year of Election or Appointment: 2016
Assistant Treasurer
Mr. Hogan also serves as an officer of other funds. Mr. Hogan serves as Assistant Treasurer of FMR Capital, Inc. (2017-present) and is an employee of Fidelity Investments (2005-present). Mr. Colm A. Hogan is not related to Mr. Brian B. Hogan.
Chris Maher (1972)
Year of Election or Appointment: 2013
Assistant Treasurer
Mr. Maher serves as Assistant Treasurer of other funds. Mr. Maher is Vice President of Valuation Oversight, serves as Assistant Treasurer of FMR Capital, Inc. (2017-present), and is an employee of Fidelity Investments. Previously, Mr. Maher served as Vice President of Asset Management Compliance (2013), Vice President of the Program Management Group of FMR (investment adviser firm, 2010-2013), and Vice President of Valuation Oversight (2008-2010).
Rieco E. Mello (1969)
Year of Election or Appointment: 2017
Assistant Treasurer
Mr. Mello also serves as Assistant Treasurer of other funds. Mr. Mello serves as Assistant Treasurer of FMR Capital, Inc. (2017-present) and is an employee of Fidelity Investments (1995-present).
Anthony R. Rochte (1968)
Year of Election or Appointment: 2013
Vice President
Mr. Rochte also serves as Vice President of other funds. Mr. Rochte serves as President of Fidelity SelectCo, LLC (investment adviser firm, 2012-present) and is an employee of Fidelity Investments (2012-present). Prior to joining Fidelity Investments, Mr. Rochte served as Senior Managing Director and head of State Street Global Advisors' North American Intermediary Business Group (2006-2012).
Stacie M. Smith (1974)
Year of Election or Appointment: 2013
Assistant Treasurer
Ms. Smith also serves as an officer of other funds. Ms. Smith serves as Assistant Treasurer of FMR Capital, Inc. (2017-present), is an employee of Fidelity Investments (2009-present), and has served in other fund officer roles. Prior to joining Fidelity Investments, Ms. Smith served as Senior Audit Manager of Ernst & Young LLP (accounting firm, 1996-2009). Previously, Ms. Smith served as Deputy Treasurer of certain Fidelity® funds (2013-2016).
Marc L. Spector (1972)
Year of Election or Appointment: 2017
Assistant Treasurer
Mr. Spector also serves as an officer of other funds. Mr. Spector serves as Assistant Treasurer of FMR Capital, Inc. (2017-present) and is an employee of Fidelity Investments (2016-present). Prior to joining Fidelity Investments, Mr. Spector served as Director at the Siegfried Group (accounting firm, 2013-2016), and prior to Siegfried Group as audit senior manager at Deloitte & Touche (accounting firm, 2005-2013).
Renee Stagnone (1975)
Year of Election or Appointment: 2016
Assistant Treasurer
Ms. Stagnone also serves as an officer of other funds. Ms. Stagnone serves as Assistant Treasurer of FMR Capital, Inc. (2017-present) and is an employee of Fidelity Investments (1997-present). Previously, Ms. Stagnone served as Deputy Treasurer of certain Fidelity® funds (2013-2016).
Shareholder Expense Example
As a shareholder of the Fund, you incur two types of costs: (1) transaction costs, including redemption fees and (2) ongoing costs, including management fees and other Fund expenses. This Example is intended to help you understand your ongoing costs (in dollars) of investing in the Fund and to compare these costs with the ongoing costs of investing in other mutual funds.
The Example is based on an investment of $1,000 invested at the beginning of the period and held for the entire period (July 1, 2017 to December 31, 2017).
Actual Expenses
The first line of the accompanying table for each class of the Fund provides information about actual account values and actual expenses. You may use the information in this line, together with the amount you invested, to estimate the expenses that you paid over the period. Simply divide your account value by $1,000.00 (for example, an $8,600 account value divided by $1,000.00 = 8.6), then multiply the result by the number in the first line for a class of the Fund under the heading entitled "Expenses Paid During Period" to estimate the expenses you paid on your account during this period. The estimate of expenses does not include any fees or other expenses of any variable annuity or variable life insurance product. If they were, the estimate of expenses you paid during the period would be higher, and your ending account value would be lower. In addition, the Fund, as a shareholder in the underlying Fidelity Central Funds, will indirectly bear its pro-rata share of the fees and expenses incurred by the underlying Fidelity Central Funds. These fees and expenses are not included in the Fund's annualized expense ratio used to calculate the expense estimate in the table below.
Hypothetical Example for Comparison Purposes
The second line of the accompanying table for each class of the Fund provides information about hypothetical account values and hypothetical expenses based on a Class' actual expense ratio and an assumed rate of return of 5% per year before expenses, which is not the Class' actual return. The hypothetical account values and expenses may not be used to estimate the actual ending account balance or expenses you paid for the period. You may use this information to compare the ongoing costs of investing in the Fund and other funds. To do so, compare this 5% hypothetical example with the 5% hypothetical examples that appear in the shareholder reports of the other funds. The estimate of expenses does not include any fees or other expenses of any variable annuity or variable life insurance product. If they were, the estimate of expenses you paid during the period would be higher, and your ending account value would be lower. In addition, the Fund, as a shareholder in the underlying Fidelity Central Funds, will indirectly bear its pro-rata share of the fees and expenses incurred by the underlying Fidelity Central Funds. These fees and expenses are not included in the Fund's annualized expense ratio used to calculate the expense estimate in the table below.
Please note that the expenses shown in the table are meant to highlight your ongoing costs only and do not reflect any transaction costs. Therefore, the second line of the table is useful in comparing ongoing costs only, and will not help you determine the relative total costs of owning different funds. In addition, if these transactional costs were included, your costs would have been higher.
| | Annualized Expense Ratio-A | Beginning
Account Value
July 1, 2017 | Ending
Account Value
December 31, 2017 | Expenses Paid
During Period-B
July 1, 2017
to December 31, 2017 |
| Initial Class | .69% | | | |
| Actual | | $1,000.00 | $1,056.90 | $3.58 |
| Hypothetical-C | | $1,000.00 | $1,021.73 | $3.52 |
| Investor Class | .77% | | | |
| Actual | | $1,000.00 | $1,056.60 | $3.99 |
| Hypothetical-C | | $1,000.00 | $1,021.32 | $3.92 |
A Annualized expense ratio reflects expenses net of applicable fee waivers.
B Expenses are equal to each Class' annualized expense ratio, multiplied by the average account value over the period, multiplied by 184/365 (to reflect the one-half year period).
C 5% return per year before expenses
Distributions (Unaudited)
The Board of Trustees of VIP Utilities Portfolio Fund voted to pay to shareholders of record at the opening of business on record date, the following distributions per share derived from capital gains realized from sales of portfolio securities and dividends derived from net investment income:
| | Pay Date | Record Date | Dividends | Capital Gains |
| VIP Utilities Portfolio | | | | |
| Initial Class | 02/09/18 | 02/09/18 | $0.081 | $0.712 |
| Investor Class | 02/09/18 | 02/09/18 | $0.079 | $0.712 |
|
The fund hereby designates as a capital gain dividend with respect to the taxable year ended December 31, 2017, $5,355,248, or, if subsequently determined to be different, the net capital gain of such year.
Initial Class and Investor Class designate 100% of the dividends distributed during the fiscal year as qualifying for the dividends–received deduction for corporate shareholders.
Proxy Voting Results
A special meeting of shareholders was held on December 8, 2017. The results of votes taken among shareholders on the proposals before them are reported below. Each vote reported represents one dollar of net asset value held on the record date for the meeting.
PROPOSAL 1
To elect a Board of Trustees.
| | # of
Votes | % of
Votes |
| James C. Curvey |
| Affirmative | 3,005,845,657.89 | 94.803 |
| Withheld | 164,788,708.80 | 5.197 |
| TOTAL | 3,170,634,366.69 | 100.000 |
| Dennis J. Dirks |
| Affirmative | 3,025,050,303.47 | 95.409 |
| Withheld | 145,584,063.22 | 4.591 |
| TOTAL | 3,170,634,366.69 | 100.000 |
| Donald F. Donahue |
| Affirmative | 3,024,923,660.98 | 95.405 |
| Withheld | 145,710,705.71 | 4.595 |
| TOTAL | 3,170,634,366.69 | 100.000 |
| Alan J. Lacy |
| Affirmative | 3,024,272,946.71 | 95.384 |
| Withheld | 146,361,419.98 | 4.616 |
| TOTAL | 3,170,634,366.69 | 100.00 |
| Ned C. Lautenbach |
| Affirmative | 3,011,847,006.14 | 94.992 |
| Withheld | 158,787,360.55 | 5.008 |
| TOTAL | 3,170,634,366.69 | 100.000 |
| Joseph Mauriello |
| Affirmative | 3,021,074,746.00 | 95.283 |
| Withheld | 149,559,620.69 | 4.717 |
| TOTAL | 3,170,634,366.69 | 100.000 |
| Charles S. Morrison |
| Affirmative | 3,025,083,795.43 | 95.410 |
| Withheld | 145,550,571.26 | 4.590 |
| TOTAL | 3,170,634,366.69 | 100.000 |
| Cornelia M. Small |
| Affirmative | 3,016,566,905.34 | 95.141 |
| Withheld | 154,067,461.35 | 4.859 |
| TOTAL | 3,170,634,366.69 | 100.000 |
| Garnett A. Smith |
| Affirmative | 3,014,927,605.85 | 95.090 |
| Withheld | 155,706,760.84 | 4.910 |
| TOTAL | 3,170,634,366.69 | 100.000 |
| David M. Thomas |
| Affirmative | 3,025,900,428.75 | 95.436 |
| Withheld | 144,733,937.94 | 4.564 |
| TOTAL | 3,170,634,366.69 | 100.000 |
| Michael E. Wiley |
| Affirmative | 3,023,436,110.39 | 95.358 |
| Withheld | 147,198,256.30 | 4.642 |
| TOTAL | 3,170,634,366.69 | 100.000 |
PROPOSAL 2
To eliminate a fundamental investment policy.
| | # of
Votes | % of
Votes |
| Affirmative | 105,682,164.70 | 76.916 |
| Against | 18,311,731.65 | 13.327 |
| Abstain | 13,406,419.66 | 9.757 |
| TOTAL | 137,400,316.01 | 100.000 |
|
| Proposal 1 reflects trust wide proposal and voting results. |
VTELIC-ANN-0218
1.817391.112
Fidelity® Variable Insurance Products: Financial Services Portfolio
Annual Report December 31, 2017 |
|
Contents
To view a fund's proxy voting guidelines and proxy voting record for the 12-month period ended June 30, visit http://www.fidelity.com/proxyvotingresults or visit the Securities and Exchange Commission's (SEC) web site at http://www.sec.gov.
You may also call 1-877-208-0098 to request a free copy of the proxy voting guidelines.
Fidelity® Variable Insurance Products are separate account options which are purchased through a variable insurance contract.
Standard & Poor's, S&P and S&P 500 are registered service marks of The McGraw-Hill Companies, Inc. and have been licensed for use by Fidelity Distributors Corporation.
Other third-party marks appearing herein are the property of their respective owners.
All other marks appearing herein are registered or unregistered trademarks or service marks of FMR LLC or an affiliated company. © 2018 FMR LLC. All rights reserved.
This report and the financial statements contained herein are submitted for the general information of the shareholders of the Fund. This report is not authorized for distribution to prospective investors in the Fund unless preceded or accompanied by an effective prospectus.
A fund files its complete schedule of portfolio holdings with the SEC for the first and third quarters of each fiscal year on Form N-Q. Forms N-Q are available on the SEC’s web site at http://www.sec.gov. A fund's Forms N-Q may be reviewed and copied at the SEC’s Public Reference Room in Washington, DC. Information regarding the operation of the SEC's Public Reference Room may be obtained by calling 1-800-SEC-0330.
For a complete list of a fund's portfolio holdings, view the most recent holdings listing, semiannual report, or annual report on Fidelity's web site at http://www.fidelity.com, http://www.institutional.fidelity.com, or http://www.401k.com, as applicable.
NOT FDIC INSURED •MAY LOSE VALUE •NO BANK GUARANTEE
Neither the Fund nor Fidelity Distributors Corporation is a bank.
Performance: The Bottom Line
Average annual total return reflects the change in the value of an investment, assuming reinvestment of distributions from dividend income and capital gains (the profits earned upon the sale of securities that have grown in value, if any) and assuming a constant rate of performance each year. During periods of reimbursement by Fidelity, a fund’s total return will be greater than it would be had the reimbursement not occurred. Performance numbers are net of all underlying fund operating expenses, but do not include any insurance charges imposed by your insurance company’s separate account. If performance information included the effect of these additional charges, the total returns would have been lower. How a fund did yesterday is no guarantee of how it will do tomorrow.
Average Annual Total Returns
| For the periods ended December 31, 2017 | Past 1 year | Past 5 years | Past 10 years |
| Initial Class | 21.25% | 15.52% | 3.67% |
| Investor Class | 21.18% | 15.42% | 3.59% |
$10,000 Over 10 Years
Let's say hypothetically that $10,000 was invested in VIP Financial Services Portfolio - Initial Class on December 31, 2007.
The chart shows how the value of your investment would have changed, and also shows how the S&P 500® Index performed over the same period.

| Period Ending Values |
| $14,342 | VIP Financial Services Portfolio - Initial Class |
| $22,603 | S&P 500® Index |
Management's Discussion of Fund Performance
Market Recap: U.S. equities gained 21.83% in 2017, as the S&P 500
® index rose steadily and closed the year just shy of an all-time high after a particularly strong three-month finish. Early on, equities rallied on optimism for President Trump’s pro-business agenda but leveled off in March amid fading optimism and stalled efforts by Congress to repeal and replace the Affordable Care Act. Upward momentum soon returned and continued through year-end with consumer sentiment and other market indicators staying positive. The lone exception was a brief cooldown in August, when geopolitical tension escalated and uncertainty grew regarding the future of health care, tax reform and the debt ceiling. Sector-wise, information technology fared best by a wide margin, rising 39% amid strong earnings growth from several major index constituents. A 24% gain in materials was spurred by increased demand, especially from China. Consumer discretionary gained 23%, despite many brick-and-mortar retailers suffering from online competition, and financials edged the broader market on an uptick in bond yields. Conversely, the defensive energy and telecom services sectors returned about -1% each. Rising interest rates held back real estate (+11%), while consumer staples (+13%) and utilities (+12%) struggled due to investors’ general preference for risk assets.
Comments from Portfolio Manager Christopher Lee: For the year, the fund’s share classes gained about 21%, ahead of the 18.81% advance of the MSCI U.S. IMI Financials 5% Capped Linked Index and slightly behind the broad-market S&P 500
® index. The financials sector slowed in the first half of 2017 as optimism for regulatory easing and lower tax rates began to fade, then brightened due to favorable stress-test results for big banks, a major tax overhaul and higher short-term interest rates. The fund's outperformance of the MSCI sector index was driven by favorable stock picking in several industries, led by regional banks and property & casualty insurance. Top individual relative contributors included financial exchange Cboe Global Markets, which benefited from increased hedging activity and a recent acquisition. Shares of online broker E*TRADE Financial gained from the equity-market rally and turnaround initiatives. Mortgage-title insurer FNF Group was helped by the firm's improved profitability. Conversely, picks in consumer finance notably detracted from relative performance. The biggest individual disappointment,was regional bank Popular in Puerto Rico, which was hurt by the economic downturn there following Hurricane Maria. Not owning shares of credit-rating company and index component S&P Global also hampered relative results, as the stock market rally and increased bond issuance drove the stock’s strong gain.
The views expressed above reflect those of the portfolio manager(s) only through the end of the period as stated on the cover of this report and do not necessarily represent the views of Fidelity or any other person in the Fidelity organization. Any such views are subject to change at any time based upon market or other conditions and Fidelity disclaims any responsibility to update such views. These views may not be relied on as investment advice and, because investment decisions for a Fidelity fund are based on numerous factors, may not be relied on as an indication of trading intent on behalf of any Fidelity fund.
Note to shareholders: On December 8, 2017, shareholders agreed to proposals from the Board of Trustees to eliminate each sector/industry fund's fundamental “invests primarily” policy and to modify the fundamental concentration policy for certain funds. Additionally, shareholders approved a proposal to reclassify VIP Financial Services Portfolio as a non-diversified fund, which would allow it to focus its investments more heavily in securities of fewer issuers. These changes took effect on January 1, 2018.
Investment Summary (Unaudited)
Top Ten Stocks as of December 31, 2017
| | % of fund's net assets |
| Capital One Financial Corp. | 5.1 |
| Berkshire Hathaway, Inc. Class B | 5.0 |
| Citigroup, Inc. | 5.0 |
| Huntington Bancshares, Inc. | 4.9 |
| Bank of America Corp. | 4.9 |
| TD Ameritrade Holding Corp. | 4.3 |
| E*TRADE Financial Corp. | 4.0 |
| The Travelers Companies, Inc. | 3.8 |
| Wells Fargo & Co. | 3.8 |
| PNC Financial Services Group, Inc. | 3.5 |
| | 44.3 |
Top Industries (% of fund's net assets)
| As of December 31, 2017 |
| | Banks | 34.0% |
| | Capital Markets | 24.8% |
| | Insurance | 20.2% |
| | Consumer Finance | 9.5% |
| | Diversified Financial Services | 5.0% |
| | All Others* | 6.5% |

* Includes short-term investments and net other assets (liabilities).
Investments December 31, 2017
Showing Percentage of Net Assets
| Common Stocks - 97.4% | | | |
| | | Shares | Value |
| Banks - 34.0% | | | |
| Diversified Banks - 17.1% | | | |
| Bank of America Corp. | | 390,396 | $11,524,490 |
| Citigroup, Inc. | | 157,039 | 11,685,272 |
| HDFC Bank Ltd. sponsored ADR | | 2,500 | 254,175 |
| JPMorgan Chase & Co. | | 73,354 | 7,844,477 |
| Wells Fargo & Co. | | 146,796 | 8,906,113 |
| | | | 40,214,527 |
| Regional Banks - 16.9% | | | |
| Bank of the Ozarks, Inc. | | 54,100 | 2,621,145 |
| CoBiz, Inc. | | 77,756 | 1,554,342 |
| East West Bancorp, Inc. | | 36,200 | 2,202,046 |
| First Republic Bank | | 18,300 | 1,585,512 |
| Huntington Bancshares, Inc. | | 796,770 | 11,600,971 |
| PNC Financial Services Group, Inc. | | 57,400 | 8,282,246 |
| Popular, Inc. | | 45,769 | 1,624,342 |
| Preferred Bank, Los Angeles | | 9,300 | 546,654 |
| Regions Financial Corp. | | 108,700 | 1,878,336 |
| Signature Bank (a) | | 20,700 | 2,841,282 |
| SunTrust Banks, Inc. | | 78,800 | 5,089,692 |
| | | | 39,826,568 |
|
| TOTAL BANKS | | | 80,041,095 |
|
| Capital Markets - 24.8% | | | |
| Asset Management & Custody Banks - 8.1% | | | |
| Affiliated Managers Group, Inc. | | 17,384 | 3,568,066 |
| BlackRock, Inc. Class A | | 9,700 | 4,982,987 |
| Invesco Ltd. | | 120,800 | 4,414,032 |
| Northern Trust Corp. | | 55,650 | 5,558,879 |
| State Street Corp. | | 6,577 | 641,981 |
| | | | 19,165,945 |
| Financial Exchanges & Data - 4.4% | | | |
| CBOE Holdings, Inc. | | 41,127 | 5,124,013 |
| IntercontinentalExchange, Inc. | | 73,780 | 5,205,917 |
| | | | 10,329,930 |
| Investment Banking & Brokerage - 12.3% | | | |
| E*TRADE Financial Corp. (a) | | 188,400 | 9,338,988 |
| Goldman Sachs Group, Inc. | | 28,170 | 7,176,589 |
| Hamilton Lane, Inc. Class A | | 13,400 | 474,226 |
| Investment Technology Group, Inc. | | 64,846 | 1,248,286 |
| Lazard Ltd. Class A | | 3,700 | 194,250 |
| PJT Partners, Inc. | | 9,100 | 414,960 |
| TD Ameritrade Holding Corp. | | 197,100 | 10,077,723 |
| | | | 28,925,022 |
|
| TOTAL CAPITAL MARKETS | | | 58,420,897 |
|
| Consumer Finance - 9.5% | | | |
| Consumer Finance - 9.5% | | | |
| Capital One Financial Corp. | | 120,035 | 11,953,084 |
| Discover Financial Services | | 27,600 | 2,122,992 |
| OneMain Holdings, Inc.(a) | | 37,300 | 969,427 |
| Synchrony Financial | | 186,900 | 7,216,209 |
| | | | 22,261,712 |
| Diversified Financial Services - 5.0% | | | |
| Multi-Sector Holdings - 5.0% | | | |
| Berkshire Hathaway, Inc. Class B (a) | | 59,168 | 11,728,281 |
| Insurance - 20.2% | | | |
| Life & Health Insurance - 4.6% | | | |
| MetLife, Inc. | | 118,300 | 5,981,248 |
| Torchmark Corp. | | 53,390 | 4,843,007 |
| | | | 10,824,255 |
| Multi-Line Insurance - 4.1% | | | |
| American International Group, Inc. | | 36,200 | 2,156,796 |
| Hartford Financial Services Group, Inc. | | 132,500 | 7,457,100 |
| | | | 9,613,896 |
| Property & Casualty Insurance - 9.7% | | | |
| Allstate Corp. | | 31,670 | 3,316,166 |
| Chubb Ltd. | | 51,156 | 7,475,426 |
| FNF Group | | 76,570 | 3,004,607 |
| The Travelers Companies, Inc. | | 66,112 | 8,967,432 |
| | | | 22,763,631 |
| Reinsurance - 1.8% | | | |
| Reinsurance Group of America, Inc. | | 27,900 | 4,350,447 |
|
| TOTAL INSURANCE | | | 47,552,229 |
|
| IT Services - 2.6% | | | |
| Data Processing & Outsourced Services - 2.6% | | | |
| Visa, Inc. Class A | | 19,840 | 2,262,157 |
| WEX, Inc. (a) | | 27,900 | 3,940,317 |
| | | | 6,202,474 |
| Software - 0.4% | | | |
| Application Software - 0.4% | | | |
| Black Knight, Inc. (a) | | 22,799 | 1,006,576 |
| Thrifts & Mortgage Finance - 0.9% | | | |
| Thrifts & Mortgage Finance - 0.9% | | | |
| MGIC Investment Corp. (a) | | 91,400 | 1,289,654 |
| Radian Group, Inc. | | 36,000 | 741,960 |
| | | | 2,031,614 |
| TOTAL COMMON STOCKS | | | |
| (Cost $176,646,910) | | | 229,244,878 |
|
| Money Market Funds - 1.3% | | | |
| Fidelity Cash Central Fund, 1.36% (b) | | | |
| (Cost $3,069,223) | | 3,068,609 | 3,069,223 |
| TOTAL INVESTMENT IN SECURITIES - 98.7% | | | |
| (Cost $179,716,133) | | | 232,314,101 |
| NET OTHER ASSETS (LIABILITIES) - 1.3% | | | 3,134,873 |
| NET ASSETS - 100% | | | $235,448,974 |
Legend
(a) Non-income producing
(b) Affiliated fund that is generally available only to investment companies and other accounts managed by Fidelity Investments. The rate quoted is the annualized seven-day yield of the fund at period end. A complete unaudited listing of the fund's holdings as of its most recent quarter end is available upon request. In addition, each Fidelity Central Fund's financial statements, which are not covered by the Fund's Report of Independent Registered Public Accounting Firm, are available on the SEC's website or upon request.
Affiliated Central Funds
Information regarding fiscal year to date income earned by the Fund from investments in Fidelity Central Funds is as follows:
| Fund | Income earned |
| Fidelity Cash Central Fund | $33,876 |
| Fidelity Securities Lending Cash Central Fund | 557 |
| Total | $34,433 |
Amounts in the income column in the above table include any capital gain distributions from underlying funds, which are presented in the corresponding line-item in the Statement of Operations if applicable.
Investment Valuation
All investments are categorized as Level 1 under the Fair Value Hierarchy. The inputs or methodology used for valuing securities may not be an indication of the risk associated with investing in those securities. For more information on valuation inputs please refer to the Investment Valuation section in the accompanying Notes to Financial Statements.
See accompanying notes which are an integral part of the financial statements.
Financial Statements
Statement of Assets and Liabilities
| | | December 31, 2017 |
| Assets | | |
Investment in securities, at value — See accompanying schedule:
Unaffiliated issuers (cost $176,646,910) | $229,244,878 | |
| Fidelity Central Funds (cost $3,069,223) | 3,069,223 | |
| Total Investment in Securities (cost $179,716,133) | | $232,314,101 |
| Receivable for investments sold | | 475,600 |
| Receivable for fund shares sold | | 3,848,567 |
| Dividends receivable | | 206,313 |
| Distributions receivable from Fidelity Central Funds | | 5,153 |
| Prepaid expenses | | 841 |
| Other receivables | | 1,804 |
| Total assets | | 236,852,379 |
| Liabilities | | |
| Payable for investments purchased | $1,160,762 | |
| Payable for fund shares redeemed | 64,348 | |
| Accrued management fee | 100,820 | |
| Other affiliated payables | 31,860 | |
| Other payables and accrued expenses | 45,615 | |
| Total liabilities | | 1,403,405 |
| Net Assets | | $235,448,974 |
| Net Assets consist of: | | |
| Paid in capital | | $178,168,000 |
| Undistributed net investment income | | 490,596 |
| Accumulated undistributed net realized gain (loss) on investments and foreign currency transactions | | 4,192,533 |
| Net unrealized appreciation (depreciation) on investments and assets and liabilities in foreign currencies | | 52,597,845 |
| Net Assets | | $235,448,974 |
| Initial Class: | | |
| Net Asset Value, offering price and redemption price per share ($44,248,037 ÷ 3,225,061 shares) | | $13.72 |
| Investor Class: | | |
| Net Asset Value, offering price and redemption price per share ($191,200,937 ÷ 13,995,643 shares) | | $13.66 |
See accompanying notes which are an integral part of the financial statements.
Statement of Operations
| | | Year ended December 31, 2017 |
| Investment Income | | |
| Dividends | | $2,929,557 |
| Income from Fidelity Central Funds | | 34,433 |
| Total income | | 2,963,990 |
| Expenses | | |
| Management fee | $1,009,093 | |
| Transfer agent fees | 242,760 | |
| Accounting and security lending fees | 72,206 | |
| Custodian fees and expenses | 14,304 | |
| Independent trustees' fees and expenses | 4,098 | |
| Audit | 41,863 | |
| Legal | 5,273 | |
| Interest | 405 | |
| Miscellaneous | 10,967 | |
| Total expenses before reductions | 1,400,969 | |
| Expense reductions | (9,778) | 1,391,191 |
| Net investment income (loss) | | 1,572,799 |
| Realized and Unrealized Gain (Loss) | | |
| Net realized gain (loss) on: | | |
| Investment securities: | | |
| Unaffiliated issuers | 7,177,227 | |
| Fidelity Central Funds | (27) | |
| Foreign currency transactions | 1,561 | |
| Total net realized gain (loss) | | 7,178,761 |
| Change in net unrealized appreciation (depreciation) on: | | |
| Investment securities: | | |
| Unaffiliated issuers | 26,181,535 | |
| Fidelity Central Funds | (171) | |
| Assets and liabilities in foreign currencies | 17 | |
| Total change in net unrealized appreciation (depreciation) | | 26,181,381 |
| Net gain (loss) | | 33,360,142 |
| Net increase (decrease) in net assets resulting from operations | | $34,932,941 |
See accompanying notes which are an integral part of the financial statements.
Statement of Changes in Net Assets
| | Year ended December 31, 2017 | Year ended December 31, 2016 |
| Increase (Decrease) in Net Assets | | |
| Operations | | |
| Net investment income (loss) | $1,572,799 | $1,124,101 |
| Net realized gain (loss) | 7,178,761 | 1,133,494 |
| Change in net unrealized appreciation (depreciation) | 26,181,381 | 15,393,610 |
| Net increase (decrease) in net assets resulting from operations | 34,932,941 | 17,651,205 |
| Distributions to shareholders from net investment income | (1,318,016) | (866,490) |
| Distributions to shareholders from net realized gain | (1,932,141) | – |
| Total distributions | (3,250,157) | (866,490) |
| Share transactions - net increase (decrease) | 32,415,148 | 42,992,223 |
| Redemption fees | 35,115 | 18,785 |
| Total increase (decrease) in net assets | 64,133,047 | 59,795,723 |
| Net Assets | | |
| Beginning of period | 171,315,927 | 111,520,204 |
| End of period | $235,448,974 | $171,315,927 |
| Other Information | | |
| Undistributed net investment income end of period | $490,596 | $231,292 |
See accompanying notes which are an integral part of the financial statements.
Financial Highlights
VIP Financial Services Portfolio Initial Class
| Years ended December 31, | 2017 | 2016 | 2015 | 2014 | 2013 |
| Selected Per–Share Data | | | | | |
| Net asset value, beginning of period | $11.50 | $9.74 | $10.23 | $9.33 | $7.05 |
| Income from Investment Operations | | | | | |
| Net investment income (loss)A | .11 | .12 | .10 | .12 | .11 |
| Net realized and unrealized gain (loss) | 2.33 | 1.70 | (.48) | .90 | 2.27 |
| Total from investment operations | 2.44 | 1.82 | (.38) | 1.02 | 2.38 |
| Distributions from net investment income | (.09) | (.06) | (.11) | (.12) | (.10) |
| Distributions from net realized gain | (.13) | – | – | – | – |
| Total distributions | (.22) | (.06) | (.11) | (.12) | (.10) |
| Redemption fees added to paid in capitalA,B | – | – | – | – | – |
| Net asset value, end of period | $13.72 | $11.50 | $9.74 | $10.23 | $9.33 |
| Total ReturnC,D | 21.25% | 18.72% | (3.69)% | 10.88% | 33.86% |
| Ratios to Average Net AssetsE,F | | | | | |
| Expenses before reductions | .69% | .72% | .71% | .73% | .81% |
| Expenses net of fee waivers, if any | .69% | .72% | .71% | .72% | .81% |
| Expenses net of all reductions | .69% | .71% | .71% | .72% | .79% |
| Net investment income (loss) | .91% | 1.18% | 1.02% | 1.21% | 1.29% |
| Supplemental Data | | | | | |
| Net assets, end of period (000 omitted) | $44,248 | $41,404 | $20,570 | $23,351 | $27,726 |
| Portfolio turnover rateG | 72% | 87% | 59% | 58% | 211% |
A Calculated based on average shares outstanding during the period.
B Amount represents less than $.005 per share.
C Total returns do not reflect charges attributable to your insurance company's separate account. Inclusion of these charges would reduce the total returns shown.
D Total returns would have been lower if certain expenses had not been reduced during the applicable periods shown.
E Fees and expenses of any underlying Fidelity Central Funds are not included in the Fund's expense ratio. The Fund indirectly bears its proportionate share of the expenses of any underlying Fidelity Central Funds.
F Expense ratios reflect operating expenses of the class. Expenses before reductions do not reflect amounts reimbursed by the investment adviser or reductions from brokerage service arrangements or reductions from other expense offset arrangements and do not represent the amount paid by the class during periods when reimbursements or reductions occur. Expenses net of fee waivers reflect expenses after reimbursement by the investment adviser but prior to reductions from brokerage service arrangements or other expense offset arrangements. Expenses net of all reductions represent the net expenses paid by the class.
G Amount does not include the portfolio activity of any underlying Fidelity Central Funds.
See accompanying notes which are an integral part of the financial statements.
VIP Financial Services Portfolio Investor Class
| Years ended December 31, | 2017 | 2016 | 2015 | 2014 | 2013 |
| Selected Per–Share Data | | | | | |
| Net asset value, beginning of period | $11.45 | $9.71 | $10.19 | $9.30 | $7.03 |
| Income from Investment Operations | | | | | |
| Net investment income (loss)A | .10 | .11 | .09 | .11 | .10 |
| Net realized and unrealized gain (loss) | 2.32 | 1.69 | (.47) | .89 | 2.27 |
| Total from investment operations | 2.42 | 1.80 | (.38) | 1.00 | 2.37 |
| Distributions from net investment income | (.08) | (.06) | (.10) | (.11) | (.10) |
| Distributions from net realized gain | (.13) | – | – | – | – |
| Total distributions | (.21) | (.06) | (.10) | (.11) | (.10) |
| Redemption fees added to paid in capitalA,B | – | – | – | – | – |
| Net asset value, end of period | $13.66 | $11.45 | $9.71 | $10.19 | $9.30 |
| Total ReturnC,D | 21.18% | 18.51% | (3.68)% | 10.75% | 33.74% |
| Ratios to Average Net AssetsE,F | | | | | |
| Expenses before reductions | .77% | .80% | .79% | .80% | .89% |
| Expenses net of fee waivers, if any | .77% | .80% | .79% | .80% | .89% |
| Expenses net of all reductions | .77% | .79% | .78% | .79% | .87% |
| Net investment income (loss) | .83% | 1.10% | .95% | 1.14% | 1.22% |
| Supplemental Data | | | | | |
| Net assets, end of period (000 omitted) | $191,201 | $129,912 | $90,950 | $83,817 | $60,357 |
| Portfolio turnover rateG | 72% | 87% | 59% | 58% | 211%�� |
A Calculated based on average shares outstanding during the period.
B Amount represents less than $.005 per share.
C Total returns do not reflect charges attributable to your insurance company's separate account. Inclusion of these charges would reduce the total returns shown.
D Total returns would have been lower if certain expenses had not been reduced during the applicable periods shown.
E Fees and expenses of any underlying Fidelity Central Funds are not included in the Fund's expense ratio. The Fund indirectly bears its proportionate share of the expenses of any underlying Fidelity Central Funds.
F Expense ratios reflect operating expenses of the class. Expenses before reductions do not reflect amounts reimbursed by the investment adviser or reductions from brokerage service arrangements or reductions from other expense offset arrangements and do not represent the amount paid by the class during periods when reimbursements or reductions occur. Expenses net of fee waivers reflect expenses after reimbursement by the investment adviser but prior to reductions from brokerage service arrangements or other expense offset arrangements. Expenses net of all reductions represent the net expenses paid by the class.
G Amount does not include the portfolio activity of any underlying Fidelity Central Funds.
See accompanying notes which are an integral part of the financial statements.
Notes to Financial Statements
For the period ended December 31, 2017
1. Organization.
VIP Financial Services Portfolio (the Fund) is a fund of Variable Insurance Products Fund IV (the Trust) and is authorized to issue an unlimited number of shares. The Trust is registered under the Investment Company Act of 1940, as amended (the 1940 Act), as an open-end management investment company organized as a Massachusetts business trust. Effective January 1, 2018, the shareholders of the Fund approved to change the Fund from diversified to non-diversified. Shares of the Fund may only be purchased by insurance companies for the purpose of funding variable annuity or variable life insurance contracts. The Fund offers the following classes of shares: Initial Class shares and Investor Class shares. All classes have equal rights and voting privileges, except for matters affecting a single class.
2. Investments in Fidelity Central Funds.
The Fund invests in Fidelity Central Funds, which are open-end investment companies generally available only to other investment companies and accounts managed by the investment adviser and its affiliates. The Fund's Schedule of Investments lists each of the Fidelity Central Funds held as of period end, if any, as an investment of the Fund, but does not include the underlying holdings of each Fidelity Central Fund. As an Investing Fund, the Fund indirectly bears its proportionate share of the expenses of the underlying Fidelity Central Funds.
The Money Market Central Funds seek preservation of capital and current income and are managed by Fidelity Investments Money Management, Inc. (FIMM), an affiliate of the investment adviser. Annualized expenses of the Money Market Central Funds as of their most recent shareholder report date are less than .005%.
A complete unaudited list of holdings for each Fidelity Central Fund is available upon request or at the Securities and Exchange Commission (the SEC) website at www.sec.gov. In addition, the financial statements of the Fidelity Central Funds, which are not covered by the Fund's Report of Independent Registered Public Accounting Firm, are available on the SEC website or upon request.
3. Significant Accounting Policies.
The Fund is an investment company and applies the accounting and reporting guidance of the Financial Accounting Standards Board (FASB) Accounting Standards Codification Topic 946 Financial Services – Investments Companies. The financial statements have been prepared in conformity with accounting principles generally accepted in the United States of America (GAAP), which require management to make certain estimates and assumptions at the date of the financial statements. Actual results could differ from those estimates. Subsequent events, if any, through the date that the financial statements were issued have been evaluated in the preparation of the financial statements. The following summarizes the significant accounting policies of the Fund:
Investment Valuation. Investments are valued as of 4:00 p.m. Eastern time on the last calendar day of the period. The Board of Trustees (the Board) has delegated the day to day responsibility for the valuation of the Fund's investments to the Fair Value Committee (the Committee) established by the Fund's investment adviser. In accordance with valuation policies and procedures approved by the Board, the Fund attempts to obtain prices from one or more third party pricing vendors or brokers to value its investments. When current market prices, quotations or currency exchange rates are not readily available or reliable, investments will be fair valued in good faith by the Committee, in accordance with procedures adopted by the Board. Factors used in determining fair value vary by investment type and may include market or investment specific events. The frequency with which these procedures are used cannot be predicted and they may be utilized to a significant extent. The Committee oversees the Fund's valuation policies and procedures and reports to the Board on the Committee's activities and fair value determinations. The Board monitors the appropriateness of the procedures used in valuing the Fund's investments and ratifies the fair value determinations of the Committee.
The Fund categorizes the inputs to valuation techniques used to value its investments into a disclosure hierarchy consisting of three levels as shown below:
- Level 1 – quoted prices in active markets for identical investments
- Level 2 – other significant observable inputs (including quoted prices for similar investments, interest rates, prepayment speeds, etc.)
- Level 3 – unobservable inputs (including the Fund's own assumptions based on the best information available)
Valuation techniques used to value the Fund's investments by major category are as follows:
Equity securities, including restricted securities, for which market quotations are readily available, are valued at the last reported sale price or official closing price as reported by a third party pricing vendor on the primary market or exchange on which they are traded and are categorized as Level 1 in the hierarchy. In the event there were no sales during the day or closing prices are not available, securities are valued at the last quoted bid price or may be valued using the last available price and are generally categorized as Level 2 in the hierarchy. For foreign equity securities, when market or security specific events arise, comparisons to the valuation of American Depositary Receipts (ADRs), futures contracts, Exchange-Traded Funds (ETFs) and certain indexes as well as quoted prices for similar securities may be used and would be categorized as Level 2 in the hierarchy. Utilizing these techniques may result in transfers between Level 1 and Level 2. For equity securities, including restricted securities, where observable inputs are limited, assumptions about market activity and risk are used and these securities may be categorized as Level 3 in the hierarchy.
Investments in open-end mutual funds, including the Fidelity Central Funds, are valued at their closing net asset value (NAV) each business day and are categorized as Level 1 in the hierarchy.
Changes in valuation techniques may result in transfers in or out of an assigned level within the disclosure hierarchy.
Foreign Currency. The Fund may use foreign currency contracts to facilitate transactions in foreign-denominated securities. Gains and losses from these transactions may arise from changes in the value of the foreign currency or if the counterparties do not perform under the contracts' terms.
Foreign-denominated assets, including investment securities, and liabilities are translated into U.S. dollars at the exchange rates at period end. Purchases and sales of investment securities, income and dividends received and expenses denominated in foreign currencies are translated into U.S. dollars at the exchange rate in effect on the transaction date.
The effects of exchange rate fluctuations on investments are included with the net realized and unrealized gain (loss) on investment securities. Other foreign currency transactions resulting in realized and unrealized gain (loss) are disclosed separately.
Investment Transactions and Income. For financial reporting purposes, the Fund's investment holdings and NAV include trades executed through the end of the last business day of the period. The NAV per share for processing shareholder transactions is calculated as of the close of business of the New York Stock Exchange (NYSE), normally 4:00 p.m. Eastern time and includes trades executed through the end of the prior business day. Gains and losses on securities sold are determined on the basis of identified cost and includes proceeds received from litigation. Dividend income is recorded on the ex-dividend date, except for certain dividends from foreign securities where the ex-dividend date may have passed, which are recorded as soon as the Fund is informed of the ex-dividend date. Non-cash dividends included in dividend income, if any, are recorded at the fair market value of the securities received. Income and capital gain distributions from Fidelity Central Funds, if any, are recorded on the ex-dividend date. Investment income is recorded net of foreign taxes withheld where recovery of such taxes is uncertain.
Class Allocations and Expenses. Investment income, realized and unrealized capital gains and losses, common expenses of the Fund, and certain fund-level expense reductions, if any, are allocated daily on a pro-rata basis to each class based on the relative net assets of each class to the total net assets of the Fund. Each class differs with respect to transfer agent fees incurred. Certain expense reductions may also differ by class. For the reporting period, the allocated portion of income and expenses to each class as a percent of its average net assets may vary due to the timing of recording these transactions in relation to fluctuating net assets of the classes. Expenses directly attributable to a fund are charged to that fund. Expenses attributable to more than one fund are allocated among the respective funds on the basis of relative net assets or other appropriate methods. Expense estimates are accrued in the period to which they relate and adjustments are made when actual amounts are known.
Income Tax Information and Distributions to Shareholders. Each year, the Fund intends to qualify as a regulated investment company under Subchapter M of the Internal Revenue Code, including distributing substantially all of its taxable income and realized gains. As a result, no provision for U.S. Federal income taxes is required. As of December 31, 2017, the Fund did not have any unrecognized tax benefits in the financial statements; nor is the Fund aware of any tax positions for which it is reasonably possible that the total amounts of unrecognized tax benefits will significantly change in the next twelve months. The Fund files a U.S. federal tax return, in addition to state and local tax returns as required. The Fund's federal income tax returns are subject to examination by the Internal Revenue Service (IRS) for a period of three fiscal years after they are filed. State and local tax returns may be subject to examination for an additional fiscal year depending on the jurisdiction. Foreign taxes are provided for based on the Fund's understanding of the tax rules and rates that exist in the foreign markets in which it invests.
Distributions are declared and recorded on the ex-dividend date. Income dividends and capital gain distributions are declared separately for each class. Income and capital gain distributions are determined in accordance with income tax regulations, which may differ from GAAP.
Capital accounts within the financial statements are adjusted for permanent book-tax differences. These adjustments have no impact on net assets or the results of operations. Capital accounts are not adjusted for temporary book-tax differences which will reverse in a subsequent period.
Book-tax differences are primarily due to foreign currency transactions, certain deemed distributions and losses deferred due to wash sales.
As of period end, the cost and unrealized appreciation (depreciation) in securities, and derivatives if applicable, for federal income tax purposes were as follows:
| Gross unrealized appreciation | $52,408,684 |
| Gross unrealized depreciation | (654,162) |
| Net unrealized appreciation (depreciation) | $51,754,522 |
| Tax Cost | $180,559,579 |
The tax-based components of distributable earnings as of period end were as follows:
| Undistributed ordinary income | $726,636 |
| Undistributed long-term capital gain | $4,799,939 |
| Net unrealized appreciation (depreciation) on securities and other investments | $51,754,399 |
The tax character of distributions paid was as follows:
| | December 31, 2017 | December 31, 2016 |
| Ordinary Income | $3,250,157 | $ 866,490 |
Trading (Redemption) Fees. Shares held by investors less than 60 days may be subject to a redemption fee equal to 1% of the NAV of shares redeemed. All redemption fees, which reduce the proceeds of the shareholder redemption, are retained by the Fund and accounted for as an addition to paid in capital. In November 2017, the Board of Trustees approved the elimination of these redemption fees effective December 18, 2017.
4. Purchases and Sales of Investments.
Purchases and sales of securities, other than short-term securities, aggregated $159,950,579 and $130,946,733, respectively.
5. Fees and Other Transactions with Affiliates.
Management Fee. Fidelity SelectCo, LLC (the investment adviser) and its affiliates provide the Fund with investment management related services for which the Fund pays a monthly management fee. The management fee is the sum of an individual fund fee rate that is based on an annual rate of .30% of the Fund's average net assets and an annualized group fee rate that averaged .24% during the period. The group fee rate is based upon the average net assets of all the mutual funds advised by Fidelity Management & Research Company (FMR) and the investment adviser. The group fee rate decreases as assets under management increase and increases as assets under management decrease. For the reporting period, the total annual management fee rate was .54% of the Fund's average net assets.
Transfer Agent Fees. Fidelity Investments Institutional Operations Company, Inc. (FIIOC), an affiliate of the investment adviser, is the Fund's transfer, dividend disbursing, and shareholder servicing agent. FIIOC receives an asset-based fee with respect to each class. Each class pays a fee for transfer agent services, typesetting and printing and mailing of shareholder reports, excluding mailing of proxy statements, equal to an annual rate of class-level average net assets. The annual rate for Investor Class is .15% and the annual rate for all other classes is .07%. For the period, transfer agent fees for each class were as follows:
| Initial Class | $24,107 |
| Investor Class | 218,653 |
| | $242,760 |
Accounting and Security Lending Fees. Fidelity Service Company, Inc. (FSC), an affiliate of the investment adviser, maintains the Fund's accounting records. The accounting fee is based on the level of average net assets for each month. Under a separate contract, FSC administers the security lending program. The security lending fee is based on the number and duration of lending transactions.
Brokerage Commissions. The Fund placed a portion of its portfolio transactions with brokerage firms which are affiliates of the investment adviser. Brokerage commissions are included in net realized gain (loss) and change in net unrealized appreciation (depreciation) in the Statement of Operations. The commissions paid to these affiliated firms were $2,311 for the period.
Interfund Lending Program. Pursuant to an Exemptive Order issued by the SEC, the Fund, along with other registered investment companies having management contracts with Fidelity Management & Research Company (FMR) or other affiliated entities of FMR, may participate in an interfund lending program. This program provides an alternative credit facility allowing the funds to borrow from, or lend money to, other participating affiliated funds. At period end, there were no interfund loans outstanding. The Fund's activity in this program during the period for which loans were outstanding was as follows:
| Borrower or Lender | Average Loan Balance | Weighted Average Interest Rate | Interest Expense |
| Borrower | $5,949,333 | .82% | $405 |
Interfund Trades. The Fund may purchase from or sell securities to other Fidelity Funds under procedures adopted by the Board. The procedures have been designed to ensure these interfund trades are executed in accordance with Rule 17a-7 of the 1940 Act. Interfund trades are included within the respective purchases and sales amounts shown in the Purchases and Sales of Investments note.
6. Committed Line of Credit.
The Fund participates with other funds managed by the investment adviser or an affiliate in a $4.25 billion credit facility (the "line of credit") to be utilized for temporary or emergency purposes to fund shareholder redemptions or for other short-term liquidity purposes. The Fund has agreed to pay commitment fees on its pro-rata portion of the line of credit, which amounted to $530 and is reflected in Miscellaneous expenses on the Statement of Operations. During the period, the Fund did not borrow on this line of credit.
7. Security Lending.
The Fund lends portfolio securities through a lending agent from time to time in order to earn additional income. On the settlement date of the loan, the Fund receives collateral (in the form of U.S. Treasury obligations, letters of credit and/or cash) against the loaned securities and maintains collateral in an amount not less than 100% of the market value of the loaned securities during the period of the loan. The market value of the loaned securities is determined at the close of business of the Fund and any additional required collateral is delivered to the Fund on the next business day. The Fund or borrower may terminate the loan at any time, and if the borrower defaults on its obligation to return the securities loaned because of insolvency or other reasons, the Fund may apply collateral received from the borrower against the obligation. The Fund may experience delays and costs in recovering the securities loaned. Any cash collateral received is invested in the Fidelity Securities Lending Cash Central Fund. At period end, there were no security loans outstanding. Security lending income represents the income earned on investing cash collateral, less rebates paid to borrowers and any lending agent fees associated with the loan, plus any premium payments received for lending certain types of securities. Security lending income is presented in the Statement of Operations as a component of income from Fidelity Central Funds. Total security lending income during the period amounted to $557.
8. Expense Reductions.
Commissions paid to certain brokers with whom the investment adviser, or its affiliates, places trades on behalf of the Fund include an amount in addition to trade execution, which may be rebated back to the Fund to offset certain expenses. This amount totaled $8,197 for the period.
In addition, during the period the investment adviser reimbursed and/or waived a portion of fund-level operating expenses in the amount of $1,581.
9. Distributions to Shareholders.
Distributions to shareholders of each class were as follows:
| | Year ended
December 31, 2017 | Year ended December 31, 2016 |
| From net investment income | | |
| Initial Class | $277,930 | $228,889 |
| Investor Class | 1,040,086 | 637,601 |
| Total | $1,318,016 | $866,490 |
| From net realized gain | | |
| Initial Class | $355,165 | $– |
| Investor Class | 1,576,976 | – |
| Total | $1,932,141 | $– |
10. Share Transactions.
Transactions for each class of shares were as follows:
| | Shares | Shares | Dollars | Dollars |
| | Year ended December 31, 2017 | Year ended December 31, 2016 | Year ended December 31, 2017 | Year ended December 31, 2016 |
| Initial Class | | | | |
| Shares sold | 2,128,839 | 2,053,972 | $26,596,431 | $22,916,293 |
| Reinvestment of distributions | 47,511 | 19,647 | 633,094 | 228,889 |
| Shares redeemed | (2,552,381) | (583,592) | (30,424,794) | (5,455,615) |
| Net increase (decrease) | (376,031) | 1,490,027 | $(3,195,269) | $17,689,567 |
| Investor Class | | | | |
| Shares sold | 6,400,195 | 4,529,275 | $79,447,825 | $48,842,893 |
| Reinvestment of distributions | 196,433 | 54,966 | 2,617,062 | 637,601 |
| Shares redeemed | (3,946,164) | (2,608,193) | (46,454,470) | (24,177,838) |
| Net increase (decrease) | 2,650,464 | 1,976,048 | $35,610,417 | $25,302,656 |
11. Other.
The Fund's organizational documents provide former and current trustees and officers with a limited indemnification against liabilities arising in connection with the performance of their duties to the Fund. In the normal course of business, the Fund may also enter into contracts that provide general indemnifications. The Fund's maximum exposure under these arrangements is unknown as this would be dependent on future claims that may be made against the Fund. The risk of material loss from such claims is considered remote.
At the end of the period, the investment adviser or its affiliates were the owners of record of 100% of the total outstanding shares of the Fund.
Report of Independent Registered Public Accounting Firm
To the Trustees of Variable Insurance Products Fund IV and Shareholders of VIP Financial Services Portfolio:
Opinion on the Financial Statements
We have audited the accompanying statement of assets and liabilities, including the schedule of investments, of VIP Financial Services Portfolio (one of the funds constituting Variable Insurance Products Fund IV, referred to hereafter as the “Fund”) as of December 31, 2017, the related statement of operations for the year ended December 31, 2017, the statement of changes in net assets for each of the two years in the period ended December 31, 2017, including the related notes, and the financial highlights for each of the five years in the period ended December 31, 2017 (collectively referred to as the “financial statements”). In our opinion, the financial statements present fairly, in all material respects, the financial position of the Fund as of December 31, 2017, the results of its operations for the year then ended, the changes in its net assets for each of the two years in the period ended December 31, 2017 and the financial highlights for each of the five years in the period ended December 31, 2017 in conformity with accounting principles generally accepted in the United States of America.
Basis for Opinion
These financial statements are the responsibility of the Fund’s management. Our responsibility is to express an opinion on the Fund’s financial statements based on our audits. We are a public accounting firm registered with the Public Company Accounting Oversight Board (United States) (“PCAOB”) and are required to be independent with respect to the Fund in accordance with the U.S. federal securities laws and the applicable rules and regulations of the Securities and Exchange Commission and the PCAOB.
We conducted our audits of these financial statements in accordance with the standards of the PCAOB. Those standards require that we plan and perform the audit to obtain reasonable assurance about whether the financial statements are free of material misstatement, whether due to error or fraud.
Our audits included performing procedures to assess the risks of material misstatement of the financial statements, whether due to error or fraud, and performing procedures that respond to those risks. Such procedures included examining, on a test basis, evidence regarding the amounts and disclosures in the financial statements. Our audits also included evaluating the accounting principles used and significant estimates made by management, as well as evaluating the overall presentation of the financial statements. Our procedures included confirmation of securities owned as of December 31, 2017 by correspondence with the custodian and brokers; when replies were not received from brokers, we performed other auditing procedures. We believe that our audits provide a reasonable basis for our opinion.
PricewaterhouseCoopers LLP
Boston, Massachusetts
February 15, 2018
We have served as the auditor of one or more investment companies in the Fidelity group of funds since 1932.
Trustees and Officers
The Trustees, Members of the Advisory Board (if any), and officers of the trust and fund, as applicable, are listed below. The Board of Trustees governs the fund and is responsible for protecting the interests of shareholders. The Trustees are experienced executives who meet periodically throughout the year to oversee the fund's activities, review contractual arrangements with companies that provide services to the fund, oversee management of the risks associated with such activities and contractual arrangements, and review the fund's performance. Each of the Trustees oversees 91 funds.
The Trustees hold office without limit in time except that (a) any Trustee may resign; (b) any Trustee may be removed by written instrument, signed by at least two-thirds of the number of Trustees prior to such removal; (c) any Trustee who requests to be retired or who has become incapacitated by illness or injury may be retired by written instrument signed by a majority of the other Trustees; and (d) any Trustee may be removed at any special meeting of shareholders by a two-thirds vote of the outstanding voting securities of the trust. Each Trustee who is not an interested person (as defined in the 1940 Act) of the trust and the fund is referred to herein as an Independent Trustee. Each Independent Trustee shall retire not later than the last day of the calendar year in which his or her 75th birthday occurs. The Independent Trustees may waive this mandatory retirement age policy with respect to individual Trustees. Officers and Advisory Board Members hold office without limit in time, except that any officer or Advisory Board Member may resign or may be removed by a vote of a majority of the Trustees at any regular meeting or any special meeting of the Trustees. Except as indicated, each individual has held the office shown or other offices in the same company for the past five years.
The fund’s Statement of Additional Information (SAI) includes more information about the Trustees. To request a free copy, call Fidelity at 1-877-208-0098.
Experience, Skills, Attributes, and Qualifications of the Trustees. The Governance and Nominating Committee has adopted a statement of policy that describes the experience, qualifications, attributes, and skills that are necessary and desirable for potential Independent Trustee candidates (Statement of Policy). The Board believes that each Trustee satisfied at the time he or she was initially elected or appointed a Trustee, and continues to satisfy, the standards contemplated by the Statement of Policy. The Governance and Nominating Committee also engages professional search firms to help identify potential Independent Trustee candidates who have the experience, qualifications, attributes, and skills consistent with the Statement of Policy. From time to time, additional criteria based on the composition and skills of the current Independent Trustees, as well as experience or skills that may be appropriate in light of future changes to board composition, business conditions, and regulatory or other developments, have also been considered by the professional search firms and the Governance and Nominating Committee. In addition, the Board takes into account the Trustees' commitment and participation in Board and committee meetings, as well as their leadership of standing and ad hoc committees throughout their tenure.
In determining that a particular Trustee was and continues to be qualified to serve as a Trustee, the Board has considered a variety of criteria, none of which, in isolation, was controlling. The Board believes that, collectively, the Trustees have balanced and diverse experience, qualifications, attributes, and skills, which allow the Board to operate effectively in governing the fund and protecting the interests of shareholders. Information about the specific experience, skills, attributes, and qualifications of each Trustee, which in each case led to the Board's conclusion that the Trustee should serve (or continue to serve) as a trustee of the fund, is provided below.
Board Structure and Oversight Function. Brian B. Hogan is an interested person and currently serves as Chairman. The Trustees have determined that an interested Chairman is appropriate and benefits shareholders because an interested Chairman has a personal and professional stake in the quality and continuity of services provided to the fund. Independent Trustees exercise their informed business judgment to appoint an individual of their choosing to serve as Chairman, regardless of whether the Trustee happens to be independent or a member of management. The Independent Trustees have determined that they can act independently and effectively without having an Independent Trustee serve as Chairman and that a key structural component for assuring that they are in a position to do so is for the Independent Trustees to constitute a substantial majority for the Board. The Independent Trustees also regularly meet in executive session. Michael E. Wiley serves as Chairman of the Independent Trustees and as such (i) acts as a liaison between the Independent Trustees and management with respect to matters important to the Independent Trustees and (ii) with management prepares agendas for Board meetings.
Fidelity® funds are overseen by different Boards of Trustees. The fund's Board oversees Fidelity's sector portfolios. Other Boards oversee Fidelity's equity and high income funds, and Fidelity's investment grade bond, money market, and asset allocation funds. The use of separate Boards, each with its own committee structure, allows the Trustees of each group of Fidelity® funds to focus on the unique issues of the funds they oversee, including common research, investment, and operational issues. On occasion, the separate Boards establish joint committees to address issues of overlapping consequences for the Fidelity® funds overseen by each Board.
The Trustees operate using a system of committees to facilitate the timely and efficient consideration of all matters of importance to the Trustees, the fund, and fund shareholders and to facilitate compliance with legal and regulatory requirements and oversight of the fund's activities and associated risks. The Board, acting through its committees, has charged SelectCo and its affiliates with (i) identifying events or circumstances the occurrence of which could have demonstrably adverse effects on the fund's business and/or reputation; (ii) implementing processes and controls to lessen the possibility that such events or circumstances occur or to mitigate the effects of such events or circumstances if they do occur; and (iii) creating and maintaining a system designed to evaluate continuously business and market conditions in order to facilitate the identification and implementation processes described in (i) and (ii) above. Because the day-to-day operations and activities of the fund are carried out by or through SelectCo, its affiliates, and other service providers, the fund's exposure to risks is mitigated but not eliminated by the processes overseen by the Trustees. While each of the Board's committees has responsibility for overseeing different aspects of the fund's activities, oversight is exercised primarily through the Operations and Audit Committees. Appropriate personnel, including but not limited to the fund's Chief Compliance Officer (CCO), SelectCo's internal auditor, the independent accountants, the fund's Treasurer and portfolio management personnel, make periodic reports to the Board's committees, as appropriate. The responsibilities of each standing committee, including their oversight responsibilities, are described further under "Standing Committees of the Trustees."
Interested Trustees*:
Correspondence intended for a Trustee who is an interested person may be sent to Fidelity Investments, 245 Summer Street, Boston, Massachusetts 02210.
Name, Year of Birth; Principal Occupations and Other Relevant Experience+
Brian B. Hogan (1964)
Year of Election or Appointment: 2014
Trustee
Chairman of the Board of Trustees
Mr. Hogan also serves as Trustee or Vice President of other funds. Mr. Hogan serves as a Director of FMR Investment Management (UK) Limited (investment adviser firm, 2015-present) and Fidelity SelectCo, LLC (investment adviser firm, 2014-present) and President of the Equity Division of FMR (investment adviser firm, 2009-present). Previously, Mr. Hogan served as Senior Vice President, Equity Research of FMR (2006-2009) and as a portfolio manager. Mr. Brian B. Hogan is not related to Mr. Colm A. Hogan.
* Determined to be an "Interested Trustee" by virtue of, among other things, his or her affiliation with the trust or various entities under common control with SelectCo.
+ The information includes the Trustee's principal occupation during the last five years and other information relating to the experience, attributes, and skills relevant to the Trustee's qualifications to serve as a Trustee, which led to the conclusion that the Trustee should serve as a Trustee for the fund.
Independent Trustees:
Correspondence intended for an Independent Trustee may be sent to Fidelity Investments, P.O. Box 55235, Boston, Massachusetts 02205-5235.
Name, Year of Birth; Principal Occupations and Other Relevant Experience+
David A. Rosow (1942)
Year of Election or Appointment: 2013
Trustee
Mr. Rosow also serves as Trustee of other Fidelity® funds. Prior to his retirement in 2006, Mr. Rosow was the Chief Executive Officer, owner and operator of a number of private companies, which encompassed the oil refining, drilling and marketing of petroleum products (including specialty petroleum products), recreation industry, and real estate development. Mr. Rosow currently serves as a Director of Oxbow Carbon LLC (upgraders, marketers, and distributors of petroleum byproducts of the oil refining process, 2015-present) and Oxbridge Academy of the Palm Beaches (2015-present) and serves as its President and CEO. Previously, Mr. Rosow served on the Fairfield Country Day School Board for 27 years, including as its President for 3 years, stepping down in 2006. Mr. Rosow served as Lead Director and Chairman of the Audit Committee of Hudson United Bancorp (1996-2006), Chairman of the Board of Westport Bank and Trust (1992-1996), and as a Director of TD Banknorth (2006-2007). In addition, Mr. Rosow served as a member (2008-2014) and President (2009-2014) of the Town Council of Palm Beach, Florida. Mr. Rosow also served as a Member of the Advisory Board of certain Fidelity® funds (2012-2013).
Garnett A. Smith (1947)
Year of Election or Appointment: 2013
Trustee
Mr. Smith also serves as Trustee of other Fidelity® funds. Prior to Mr. Smith's retirement, he served as Chairman and Chief Executive Officer of Inbrand Corp. (manufacturer of personal absorbent products, 1990-1997). He also served as President (1986-1990) of Inbrand Corp. Prior to his employment with Inbrand Corp., he was employed by a retail fabric chain and North Carolina National Bank. In addition, Mr. Smith served as a Member of the Advisory Board of certain Fidelity® funds (2012-2013) and as a board member of the Jackson Hole Land Trust (2009-2012).
Michael E. Wiley (1950)
Year of Election or Appointment: 2008
Trustee
Chairman of the Independent Trustees
Mr. Wiley also serves as Trustee of other Fidelity® funds. Mr. Wiley serves as a Director of Andeavor Corporation (independent oil refiner and marketer, 2005-present), a Director of Andeavor Logistics LP (natural resources logistics, 2015-present), and a Director of Bill Barrett Corporation (exploration and production, 2005-present). In addition, Mr. Wiley also serves as a Director of Post Oak Bank (privately-held bank, 2004-present). Previously, Mr. Wiley served as a Trustee of other Fidelity® funds (2008-2013), as a Director of Asia Pacific Exploration Consolidated (international oil and gas exploration and production, 2008-2013), as a member of the Board of Trustees of the University of Tulsa (2000-2006; 2007-2010), as a Senior Energy Advisor of Katzenbach Partners, LLC (consulting, 2006-2007), as an Advisory Director of Riverstone Holdings (private investment), Chairman, President, and CEO of Baker Hughes, Inc. (oilfield services, 2000-2004), and as Director of Spinnaker Exploration Company (exploration and production, 2001-2005).
+ The information includes the Trustee's principal occupation during the last five years and other information relating to the experience, attributes, and skills relevant to the Trustee's qualifications to serve as a Trustee, which led to the conclusion that the Trustee should serve as a Trustee for the fund.
Advisory Board Members and Officers:
Correspondence intended for a Member of the Advisory Board (if any) may be sent to Fidelity Investments, P.O. Box 55235, Boston, Massachusetts 02205-5235. Except for Anthony R. Rochte, correspondence intended for an officer may be sent to Fidelity Investments, 245 Summer Street, Boston, Massachusetts 02210. Correspondence intended for Mr. Rochte may be sent to Fidelity SelectCo, LLC (SelectCo), 1225 17th Street, Denver, Colorado 80202-5541. Officers appear below in alphabetical order.
Name, Year of Birth; Principal Occupation
Donald F. Donahue (1950)
Year of Election or Appointment: 2015
Member of the Advisory Board
Mr. Donahue also serves as a Trustee or Member of the Advisory Board of other Fidelity® funds. Mr. Donahue is President and Chief Executive Officer of Miranda Partners, LLC (risk consulting for the financial services industry, 2012-present). Previously, Mr. Donahue served as Chief Executive Officer (2006-2012), Chief Operating Officer (2003-2006), and Managing Director, Customer Marketing and Development (1999-2003) of The Depository Trust & Clearing Corporation (financial markets infrastructure). Mr. Donahue serves as a Member (2007-present) and Co-Chairman (2016-present) of the Board of Directors of United Way of New York, Member of the Board of Directors of NYC Leadership Academy (2012-present) and Member of the Board of Advisors of Ripple Labs, Inc. (financial services, 2015-present). He also served as Chairman (2010-2012) and Member of the Board of Directors (2012-2013) of Omgeo, LLC (financial services), Treasurer of United Way of New York (2012-2016), and Member of the Board of Directors of XBRL US (financial services non-profit, 2009-2012) and the International Securities Services Association (2009-2012).
Carol B. Tomé (1957)
Year of Election or Appointment: 2017
Member of the Advisory Board
Ms. Tomé also serves as Member of the Advisory Board of other Fidelity® funds. Ms. Tomé is Chief Financial Officer (2001-present) and Executive Vice President of Corporate Services (2007-present) of The Home Depot, Inc. (home improvement retailer) and a Director (2003-present) and Chair of the Audit Committee (2004-present) of United Parcel Service, Inc. (package delivery and supply chain management). Previously, Ms. Tomé served as Trustee of certain Fidelity® funds (2017), Senior Vice President of Finance and Accounting/Treasurer (2000-2007) and Vice President and Treasurer (1995-2000) of The Home Depot, Inc. and Chair of the Board (2010-2012), Vice Chair of the Board (2009 and 2013), and a Director (2008-2013) of the Federal Reserve Bank of Atlanta. Ms. Tomé is also a director or trustee of many community and professional organizations.
Elizabeth Paige Baumann (1968)
Year of Election or Appointment: 2017
Anti-Money Laundering (AML) Officer
Ms. Baumann also serves as AML Officer of other funds. She is Chief AML Officer (2012-present) and Senior Vice President (2014-present) of FMR LLC (diversified financial services company) and is an employee of Fidelity Investments. Previously, Ms. Baumann served as AML Officer of the funds (2012-2016), and Vice President (2007-2014) and Deputy Anti-Money Laundering Officer (2007-2012) of FMR LLC.
Marc R. Bryant (1966)
Year of Election or Appointment: 2013
Secretary and Chief Legal Officer (CLO)
Mr. Bryant also serves as Secretary and CLO of other funds. Mr. Bryant serves as CLO, Secretary, and Senior Vice President of Fidelity Management & Research Company (investment adviser firm, 2015-present) and FMR Co., Inc. (investment adviser firm, 2015-present); Secretary of Fidelity SelectCo, LLC (investment adviser firm, 2015-present) and Fidelity Investments Money Management, Inc. (investment adviser firm, 2015-present); and CLO of Fidelity Management & Research (Hong Kong) Limited and FMR Investment Management (UK) Limited (investment adviser firms, 2015-present) and Fidelity Management & Research (Japan) Limited (investment adviser firm, 2016-present). He is Senior Vice President and Deputy General Counsel of FMR LLC (diversified financial services company). Previously, Mr. Bryant served as Secretary and CLO of Fidelity Rutland Square Trust II (2010-2014) and Assistant Secretary of Fidelity's Fixed Income and Asset Allocation Funds (2013-2015). Prior to joining Fidelity Investments, Mr. Bryant served as a Senior Vice President and the Head of Global Retail Legal for AllianceBernstein L.P. (2006-2010), and as the General Counsel for ProFund Advisors LLC (2001-2006).
William C. Coffey (1969)
Year of Election or Appointment: 2009
Assistant Secretary
Mr. Coffey also serves as Assistant Secretary of other funds. He is Senior Vice President and Deputy General Counsel of FMR LLC (diversified financial services company, 2010-present), and is an employee of Fidelity Investments. Previously, Mr. Coffey served as Vice President and Associate General Counsel of FMR LLC (2005-2009).
Jonathan Davis (1968)
Year of Election or Appointment: 2010
Assistant Treasurer
Mr. Davis also serves as Assistant Treasurer of other funds. Mr. Davis serves as Assistant Treasurer of FMR Capital, Inc. (2017-present) and is an employee of Fidelity Investments. Previously, Mr. Davis served as Vice President and Associate General Counsel of FMR LLC (diversified financial services company, 2003-2010).
Adrien E. Deberghes (1967)
Year of Election or Appointment: 2013
President and Treasurer
Mr. Deberghes also serves as an officer of other funds. He serves as Assistant Treasurer of FMR Capital, Inc. (2017-present), Executive Vice President of Fidelity Investments Money Management, Inc. (FIMM) (investment adviser firm, 2016-present), and is an employee of Fidelity Investments (2008-present). Prior to joining Fidelity Investments, Mr. Deberghes was Senior Vice President of Mutual Fund Administration at State Street Corporation (2007-2008), Senior Director of Mutual Fund Administration at Investors Bank & Trust (2005-2007), and Director of Finance for Dunkin' Brands (2000-2005). Previously, Mr. Deberghes served in other fund officer roles.
Joseph DeSantis (1959)
Year of Election or Appointment: 2015
Vice President
Mr. DeSantis also serves as Vice President of other funds. Mr. DeSantis serves as a Director of Fidelity Management & Research (Japan) Limited (investment adviser firm, 2016-present), Chief Investment Officer, Equities (2010-present) and is an employee of Fidelity Investments.
Stephanie J. Dorsey (1969)
Year of Election or Appointment: 2010
Assistant Treasurer
Ms. Dorsey also serves as an officer of other funds. Ms. Dorsey serves as Assistant Treasurer of FMR Capital, Inc. (2017-present), is an employee of Fidelity Investments (2008-present), and has served in other fund officer roles. Prior to joining Fidelity Investments, Ms. Dorsey served as Treasurer (2004-2008) of the JPMorgan Mutual Funds and Vice President (2004-2008) of JPMorgan Chase Bank.
Howard J. Galligan III (1966)
Year of Election or Appointment: 2014
Chief Financial Officer
Mr. Galligan also serves as Chief Financial Officer of other funds. Mr. Galligan serves as President of Fidelity Pricing and Cash Management Services (FPCMS) (2014-present) and as a Director of Strategic Advisers, Inc. (investment adviser firm, 2008-present). Previously, Mr. Galligan served as Chief Administrative Officer of Asset Management (2011-2014) and Chief Operating Officer and Senior Vice President of Investment Support for Strategic Advisers, Inc. (2003-2011).
James D. Gryglewicz (1972)
Year of Election or Appointment: 2014
Chief Compliance Officer
Mr. Gryglewicz also serves as Chief Compliance Officer of other funds. Mr. Gryglewicz serves as Compliance Officer of Strategic Advisers, Inc. (investment adviser firm, 2015-present) and Fidelity SelectCo, LLC (investment adviser firm, 2014-present), Senior Vice President of Asset Management Compliance (2009-present), and is an employee of Fidelity Investments (2004-present).
Brian B. Hogan (1964)
Year of Election or Appointment: 2009
Vice President
Mr. Hogan also serves as Trustee or Vice President of other funds. Mr. Hogan serves as a Director of FMR Investment Management (UK) Limited (investment adviser firm, 2015-present) and Fidelity SelectCo, LLC (investment adviser firm, 2014-present) and President of the Equity Division of FMR (investment adviser firm, 2009-present). Previously, Mr. Hogan served as Senior Vice President, Equity Research of FMR (2006-2009) and as a portfolio manager. Mr. Brian B. Hogan is not related to Mr. Colm A. Hogan.
Colm A. Hogan (1973)
Year of Election or Appointment: 2016
Assistant Treasurer
Mr. Hogan also serves as an officer of other funds. Mr. Hogan serves as Assistant Treasurer of FMR Capital, Inc. (2017-present) and is an employee of Fidelity Investments (2005-present). Mr. Colm A. Hogan is not related to Mr. Brian B. Hogan.
Chris Maher (1972)
Year of Election or Appointment: 2013
Assistant Treasurer
Mr. Maher serves as Assistant Treasurer of other funds. Mr. Maher is Vice President of Valuation Oversight, serves as Assistant Treasurer of FMR Capital, Inc. (2017-present), and is an employee of Fidelity Investments. Previously, Mr. Maher served as Vice President of Asset Management Compliance (2013), Vice President of the Program Management Group of FMR (investment adviser firm, 2010-2013), and Vice President of Valuation Oversight (2008-2010).
Rieco E. Mello (1969)
Year of Election or Appointment: 2017
Assistant Treasurer
Mr. Mello also serves as Assistant Treasurer of other funds. Mr. Mello serves as Assistant Treasurer of FMR Capital, Inc. (2017-present) and is an employee of Fidelity Investments (1995-present).
Anthony R. Rochte (1968)
Year of Election or Appointment: 2013
Vice President
Mr. Rochte also serves as Vice President of other funds. Mr. Rochte serves as President of Fidelity SelectCo, LLC (investment adviser firm, 2012-present) and is an employee of Fidelity Investments (2012-present). Prior to joining Fidelity Investments, Mr. Rochte served as Senior Managing Director and head of State Street Global Advisors' North American Intermediary Business Group (2006-2012).
Stacie M. Smith (1974)
Year of Election or Appointment: 2013
Assistant Treasurer
Ms. Smith also serves as an officer of other funds. Ms. Smith serves as Assistant Treasurer of FMR Capital, Inc. (2017-present), is an employee of Fidelity Investments (2009-present), and has served in other fund officer roles. Prior to joining Fidelity Investments, Ms. Smith served as Senior Audit Manager of Ernst & Young LLP (accounting firm, 1996-2009). Previously, Ms. Smith served as Deputy Treasurer of certain Fidelity® funds (2013-2016).
Marc L. Spector (1972)
Year of Election or Appointment: 2017
Assistant Treasurer
Mr. Spector also serves as an officer of other funds. Mr. Spector serves as Assistant Treasurer of FMR Capital, Inc. (2017-present) and is an employee of Fidelity Investments (2016-present). Prior to joining Fidelity Investments, Mr. Spector served as Director at the Siegfried Group (accounting firm, 2013-2016), and prior to Siegfried Group as audit senior manager at Deloitte & Touche (accounting firm, 2005-2013).
Renee Stagnone (1975)
Year of Election or Appointment: 2016
Assistant Treasurer
Ms. Stagnone also serves as an officer of other funds. Ms. Stagnone serves as Assistant Treasurer of FMR Capital, Inc. (2017-present) and is an employee of Fidelity Investments (1997-present). Previously, Ms. Stagnone served as Deputy Treasurer of certain Fidelity® funds (2013-2016).
Shareholder Expense Example
As a shareholder of the Fund, you incur two types of costs: (1) transaction costs, including redemption fees and (2) ongoing costs, including management fees and other Fund expenses. This Example is intended to help you understand your ongoing costs (in dollars) of investing in the Fund and to compare these costs with the ongoing costs of investing in other mutual funds.
The Example is based on an investment of $1,000 invested at the beginning of the period and held for the entire period (July 1, 2017 to December 31, 2017).
Actual Expenses
The first line of the accompanying table for each class of the Fund provides information about actual account values and actual expenses. You may use the information in this line, together with the amount you invested, to estimate the expenses that you paid over the period. Simply divide your account value by $1,000.00 (for example, an $8,600 account value divided by $1,000.00 = 8.6), then multiply the result by the number in the first line for a class of the Fund under the heading entitled "Expenses Paid During Period" to estimate the expenses you paid on your account during this period. The estimate of expenses does not include any fees or other expenses of any variable annuity or variable life insurance product. If they were, the estimate of expenses you paid during the period would be higher, and your ending account value would be lower. In addition, the Fund, as a shareholder in the underlying Fidelity Central Funds, will indirectly bear its pro-rata share of the fees and expenses incurred by the underlying Fidelity Central Funds. These fees and expenses are not included in the Fund's annualized expense ratio used to calculate the expense estimate in the table below.
Hypothetical Example for Comparison Purposes
The second line of the accompanying table for each class of the Fund provides information about hypothetical account values and hypothetical expenses based on a Class' actual expense ratio and an assumed rate of return of 5% per year before expenses, which is not the Class' actual return. The hypothetical account values and expenses may not be used to estimate the actual ending account balance or expenses you paid for the period. You may use this information to compare the ongoing costs of investing in the Fund and other funds. To do so, compare this 5% hypothetical example with the 5% hypothetical examples that appear in the shareholder reports of the other funds. The estimate of expenses does not include any fees or other expenses of any variable annuity or variable life insurance product. If they were, the estimate of expenses you paid during the period would be higher, and your ending account value would be lower. In addition, the Fund, as a shareholder in the underlying Fidelity Central Funds, will indirectly bear its pro-rata share of the fees and expenses incurred by the underlying Fidelity Central Funds. These fees and expenses are not included in the Fund's annualized expense ratio used to calculate the expense estimate in the table below.
Please note that the expenses shown in the table are meant to highlight your ongoing costs only and do not reflect any transaction costs. Therefore, the second line of the table is useful in comparing ongoing costs only, and will not help you determine the relative total costs of owning different funds. In addition, if these transactional costs were included, your costs would have been higher.
| | Annualized Expense Ratio-A | Beginning
Account Value
July 1, 2017 | Ending
Account Value
December 31, 2017 | Expenses Paid
During Period-B
July 1, 2017
to December 31, 2017 |
| Initial Class | .69% | | | |
| Actual | | $1,000.00 | $1,146.90 | $3.73 |
| Hypothetical-C | | $1,000.00 | $1,021.73 | $3.52 |
| Investor Class | .77% | | | |
| Actual | | $1,000.00 | $1,146.00 | $4.17 |
| Hypothetical-C | | $1,000.00 | $1,021.32 | $3.92 |
A Annualized expense ratio reflects expenses net of applicable fee waivers.
B Expenses are equal to each Class' annualized expense ratio, multiplied by the average account value over the period, multiplied by 184/365 (to reflect the one-half year period).
C 5% return per year before expenses
Distributions (Unaudited)
The Board of Trustees of VIP Financial Services Portfolio voted to pay to shareholders of record at the opening of business on record date, the following distributions per share derived from capital gains realized from sales of portfolio securities, and dividends derived from net investment income:
| | Pay Date | Record Date | Dividends | Capital Gains |
| VIP Financial Services Portfolio | | | | |
| Initial Class | 02/09/2018 | 02/09/2018 | $0.030 | $0.294 |
| Investor Class | 02/09/2018 | 02/09/2018 | $0.028 | $0.294 |
|
The fund hereby designates as a capital gain dividend with respect to the taxable year ended December 31 2017, $4,799,939, or, if subsequently determined to be different, the net capital gain of such year.
Initial Class designates 95% and 88%, and Investor Class designates 100% and 91%; of the dividends distributed in February 2017 and December 2017, respectively during the fiscal year as qualifying for the dividends–received deduction for corporate shareholders.
Proxy Voting Results
A special meeting of shareholders was held on December 8, 2017. The results of votes taken among shareholders on the proposals before them are reported below. Each vote reported represents one dollar of net asset value held on the record date for the meeting.
PROPOSAL 1
To elect a Board of Trustees.
| | # of
Votes | % of
Votes |
| James C. Curvey |
| Affirmative | 3,005,845,657.89 | 94.803 |
| Withheld | 164,788,708.80 | 5.197 |
| TOTAL | 3,170,634,366.69 | 100.000 |
| Dennis J. Dirks |
| Affirmative | 3,025,050,303.47 | 95.409 |
| Withheld | 145,584,063.22 | 4.591 |
| TOTAL | 3,170,634,366.69 | 100.000 |
| Donald F. Donahue |
| Affirmative | 3,024,923,660.98 | 95.405 |
| Withheld | 145,710,705.71 | 4.595 |
| TOTAL | 3,170,634,366.69 | 100.000 |
| Alan J. Lacy |
| Affirmative | 3,024,272,946.71 | 95.384 |
| Withheld | 146,361,419.98 | 4.616 |
| TOTAL | 3,170,634,366.69 | 100.00 |
| Ned C. Lautenbach |
| Affirmative | 3,011,847,006.14 | 94.992 |
| Withheld | 158,787,360.55 | 5.008 |
| TOTAL | 3,170,634,366.69 | 100.000 |
| Joseph Mauriello |
| Affirmative | 3,021,074,746.00 | 95.283 |
| Withheld | 149,559,620.69 | 4.717 |
| TOTAL | 3,170,634,366.69 | 100.000 |
| Charles S. Morrison |
| Affirmative | 3,025,083,795.43 | 95.410 |
| Withheld | 145,550,571.26 | 4.590 |
| TOTAL | 3,170,634,366.69 | 100.000 |
| Cornelia M. Small |
| Affirmative | 3,016,566,905.34 | 95.141 |
| Withheld | 154,067,461.35 | 4.859 |
| TOTAL | 3,170,634,366.69 | 100.000 |
| Garnett A. Smith |
| Affirmative | 3,014,927,605.85 | 95.090 |
| Withheld | 155,706,760.84 | 4.910 |
| TOTAL | 3,170,634,366.69 | 100.000 |
| David M. Thomas |
| Affirmative | 3,025,900,428.75 | 95.436 |
| Withheld | 144,733,937.94 | 4.564 |
| TOTAL | 3,170,634,366.69 | 100.000 |
| Michael E. Wiley |
| Affirmative | 3,023,436,110.39 | 95.358 |
| Withheld | 147,198,256.30 | 4.642 |
| TOTAL | 3,170,634,366.69 | 100.000 |
PROPOSAL 2
To eliminate a fundamental investment policy.
| | # of
Votes | % of
Votes |
| Affirmative | 153,447,468.67 | 80.314 |
| Against | 24,132,596.19 | 12.631 |
| Abstain | 13,480,990.70 | 7.055 |
| TOTAL | 191,061,055.56 | 100.000 |
PROPOSAL 3
To modify the fund's fundamental concentration policy.
| | # of
Votes | % of
Votes |
| Affirmative | 159,830,326.46 | 83.655 |
| Against | 19,482,694.75 | 10.197 |
| Abstain | 11,748,034.35 | 6.148 |
| TOTAL | 191,061,055.56 | 100.000 |
PROPOSAL 4
To change the fund from a diversified fund to a non-diversified fund.
| | # of
Votes | % of
Votes |
| Affirmative | 144,927,526.66 | 75.855 |
| Against | 32,682,064.47 | 17.105 |
| Abstain | 13,451,464.43 | 7.040 |
| TOTAL | 191,061,055.56 | 100.000 |
|
| Proposal 1 reflects trust wide proposal and voting results. |
VFSIC-ANN-0218
1.817367.113
Fidelity® Variable Insurance Products: Industrials Portfolio
Annual Report December 31, 2017 |
|
Contents
To view a fund's proxy voting guidelines and proxy voting record for the 12-month period ended June 30, visit http://www.fidelity.com/proxyvotingresults or visit the Securities and Exchange Commission's (SEC) web site at http://www.sec.gov.
You may also call 1-877-208-0098 to request a free copy of the proxy voting guidelines.
Fidelity® Variable Insurance Products are separate account options which are purchased through a variable insurance contract.
Standard & Poor's, S&P and S&P 500 are registered service marks of The McGraw-Hill Companies, Inc. and have been licensed for use by Fidelity Distributors Corporation.
Other third-party marks appearing herein are the property of their respective owners.
All other marks appearing herein are registered or unregistered trademarks or service marks of FMR LLC or an affiliated company. © 2018 FMR LLC. All rights reserved.
This report and the financial statements contained herein are submitted for the general information of the shareholders of the Fund. This report is not authorized for distribution to prospective investors in the Fund unless preceded or accompanied by an effective prospectus.
A fund files its complete schedule of portfolio holdings with the SEC for the first and third quarters of each fiscal year on Form N-Q. Forms N-Q are available on the SEC’s web site at http://www.sec.gov. A fund's Forms N-Q may be reviewed and copied at the SEC’s Public Reference Room in Washington, DC. Information regarding the operation of the SEC's Public Reference Room may be obtained by calling 1-800-SEC-0330.
For a complete list of a fund's portfolio holdings, view the most recent holdings listing, semiannual report, or annual report on Fidelity's web site at http://www.fidelity.com, http://www.institutional.fidelity.com, or http://www.401k.com, as applicable.
NOT FDIC INSURED •MAY LOSE VALUE •NO BANK GUARANTEE
Neither the Fund nor Fidelity Distributors Corporation is a bank.
Performance: The Bottom Line
Average annual total return reflects the change in the value of an investment, assuming reinvestment of distributions from dividend income and capital gains (the profits earned upon the sale of securities that have grown in value, if any) and assuming a constant rate of performance each year. During periods of reimbursement by Fidelity, a fund’s total return will be greater than it would be had the reimbursement not occurred. Performance numbers are net of all underlying fund operating expenses, but do not include any insurance charges imposed by your insurance company’s separate account. If performance information included the effect of these additional charges, the total returns would have been lower. How a fund did yesterday is no guarantee of how it will do tomorrow.
Average Annual Total Returns
| For the periods ended December 31, 2017 | Past 1 year | Past 5 years | Past 10 years |
| Initial Class | 20.15% | 15.19% | 9.87% |
| Investor Class | 20.05% | 15.10% | 9.77% |
$10,000 Over 10 Years
Let's say hypothetically that $10,000 was invested in VIP Industrials Portfolio - Initial Class on December 31, 2007.
The chart shows how the value of your investment would have changed, and also shows how the S&P 500® Index performed over the same period.
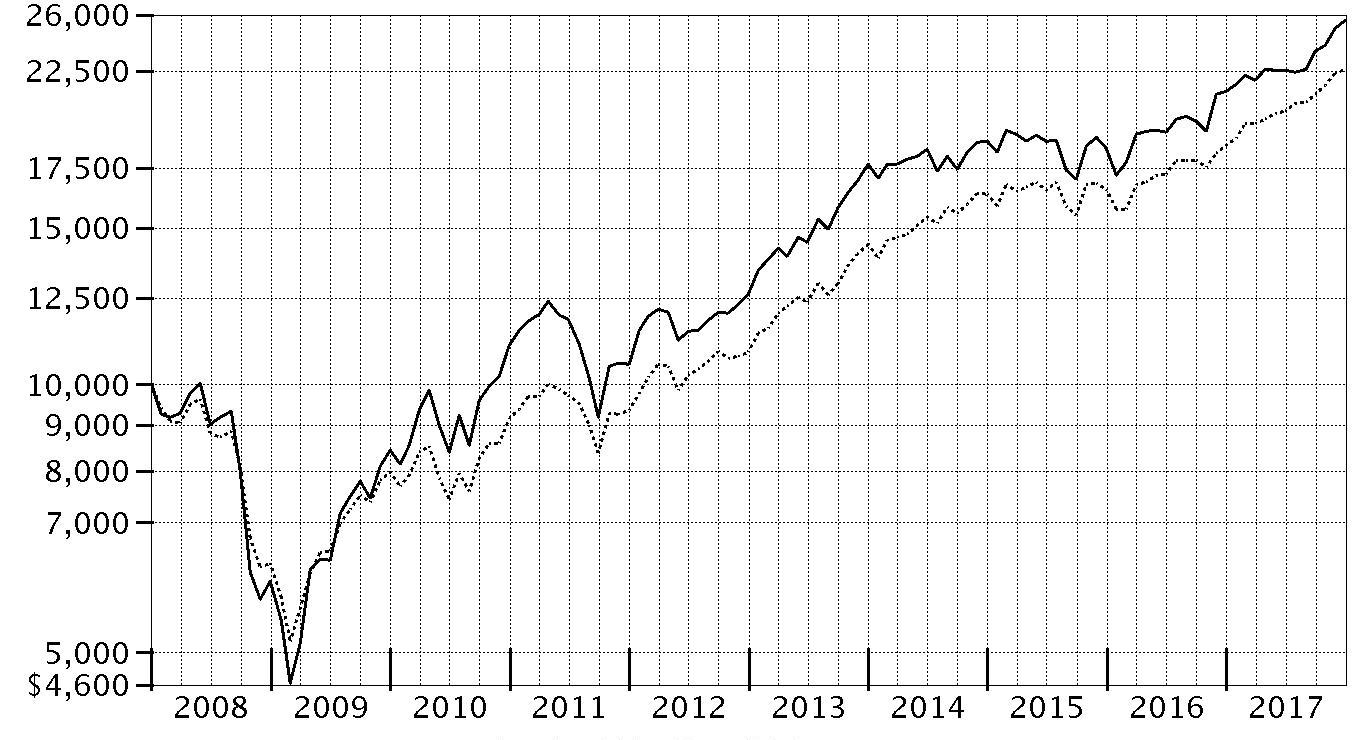
| Period Ending Values |
| $25,623 | VIP Industrials Portfolio - Initial Class |
| $22,603 | S&P 500® Index |
Management's Discussion of Fund Performance
Market Recap: U.S. equities gained 21.83% in 2017, as the S&P 500
® index rose steadily and closed the year just shy of an all-time high after a particularly strong three-month finish. Early on, equities rallied on optimism for President Trump’s pro-business agenda but leveled off in March amid fading optimism and stalled efforts by Congress to repeal and replace the Affordable Care Act. Upward momentum soon returned and continued through year-end with consumer sentiment and other market indicators staying positive. The lone exception was a brief cooldown in August, when geopolitical tension escalated and uncertainty grew regarding the future of health care, tax reform and the debt ceiling. Sector-wise, information technology fared best by a wide margin, rising 39% amid strong earnings growth from several major index constituents. A 24% gain in materials was spurred by increased demand, especially from China. Consumer discretionary gained 23%, despite many brick-and-mortar retailers suffering from online competition, and financials edged the broader market on an uptick in bond yields. Conversely, the defensive energy and telecom services sectors returned about -1% each. Rising interest rates held back real estate (+11%), while consumer staples (+13%) and utilities (+12%) struggled due to investors’ general preference for risk assets.
Comments from Portfolio Manager Tobias Welo: For the year, the fund’s share classes gained roughly 20%, trailing the 21.60% return of the MSCI U.S. IMI Industrials 25/50 Index and also lagging the broad-market S&P 500
®. Versus the MSCI sector benchmark, stock selection in aerospace & defense – especially underweighting strong-performing index constituent Boeing – hindered the fund's performance, along with positioning in trading companies & distributors and picks in industrial machinery. Commercial aircraft manufacturer Boeing, by far the fund’s largest relative detractor, returned 95%. A sizable overweighting in multinational engineering firm Aecom also detracted. In this case, our position roughly broke even for the year but considerably lagged the MSCI index. Shares of HD Supply Holdings, another large holding, also hampered fund performance, and I exited the position. Conversely, a large underweighting in the weak-performing industrial conglomerates category worked in our favor, as did overweighting construction machinery & heavy trucks. The performance lift from industrial conglomerates was largely due to an underweighting in index heavyweight General Electric, which returned -43% this period due to disappointing quarterly earnings and the company's first dividend cut since 2009. The fund also benefited from an overweighted stake in heavy-equipment manufacturer Caterpillar, which gained 75%.
The views expressed above reflect those of the portfolio manager(s) only through the end of the period as stated on the cover of this report and do not necessarily represent the views of Fidelity or any other person in the Fidelity organization. Any such views are subject to change at any time based upon market or other conditions and Fidelity disclaims any responsibility to update such views. These views may not be relied on as investment advice and, because investment decisions for a Fidelity fund are based on numerous factors, may not be relied on as an indication of trading intent on behalf of any Fidelity fund.
Note to shareholders: On December 8, 2017, shareholders approved proposals from the Board of Trustees to eliminate each sector/industry fund's fundamental “invests primarily” policy and to modify the fundamental concentration policy for certain funds. The changes took effect on January 1, 2018, and do not impact how the funds are managed.
Investment Summary (Unaudited)
Top Ten Stocks as of December 31, 2017
| | % of fund's net assets |
| United Technologies Corp. | 6.2 |
| Caterpillar, Inc. | 5.2 |
| Honeywell International, Inc. | 4.9 |
| Northrop Grumman Corp. | 4.4 |
| General Dynamics Corp. | 3.6 |
| Union Pacific Corp. | 2.9 |
| Raytheon Co. | 2.7 |
| Fortive Corp. | 2.6 |
| IHS Markit Ltd. | 2.6 |
| Norfolk Southern Corp. | 2.5 |
| | 37.6 |
Top Industries (% of fund's net assets)
| As of December 31, 2017 |
| | Aerospace & Defense | 24.7% |
| | Machinery | 24.0% |
| | Road & Rail | 9.3% |
| | Industrial Conglomerates | 8.2% |
| | Airlines | 6.1% |
| | All Others* | 27.7% |

* Includes short-term investments and net other assets (liabilities).
Investments December 31, 2017
Showing Percentage of Net Assets
| Common Stocks - 99.0% | | | |
| | | Shares | Value |
| Aerospace & Defense - 24.7% | | | |
| Aerospace & Defense - 24.7% | | | |
| Astronics Corp. (a) | | 23,900 | $991,133 |
| Astronics Corp. Class B (a) | | 1,590 | 66,224 |
| Axon Enterprise, Inc. (a)(b) | | 45,600 | 1,208,400 |
| Elbit Systems Ltd. | | 6,500 | 866,385 |
| General Dynamics Corp. | | 39,100 | 7,954,895 |
| Huntington Ingalls Industries, Inc. | | 7,700 | 1,814,890 |
| Northrop Grumman Corp. | | 31,600 | 9,698,356 |
| Raytheon Co. | | 31,700 | 5,954,845 |
| Spirit AeroSystems Holdings, Inc. Class A | | 11,700 | 1,020,825 |
| Teledyne Technologies, Inc. (a) | | 19,778 | 3,582,785 |
| The Boeing Co. | | 17,700 | 5,219,907 |
| TransDigm Group, Inc. | | 7,500 | 2,059,650 |
| United Technologies Corp. | | 105,923 | 13,512,595 |
| | | | 53,950,890 |
| Air Freight & Logistics - 1.6% | | | |
| Air Freight & Logistics - 1.6% | | | |
| XPO Logistics, Inc. (a) | | 38,900 | 3,562,851 |
| Airlines - 6.1% | | | |
| Airlines - 6.1% | | | |
| Alaska Air Group, Inc. | | 11,600 | 852,716 |
| Allegiant Travel Co. | | 7,600 | 1,176,100 |
| Delta Air Lines, Inc. | | 81,500 | 4,564,000 |
| Ryanair Holdings PLC sponsored ADR (a) | | 3,600 | 375,084 |
| Southwest Airlines Co. | | 78,800 | 5,157,460 |
| Spirit Airlines, Inc. (a) | | 27,900 | 1,251,315 |
| | | | 13,376,675 |
| Building Products - 3.9% | | | |
| Building Products - 3.9% | | | |
| A.O. Smith Corp. | | 25,984 | 1,592,300 |
| Fortune Brands Home & Security, Inc. | | 26,800 | 1,834,192 |
| Johnson Controls International PLC | | 51,400 | 1,958,854 |
| Masco Corp. | | 71,000 | 3,119,740 |
| | | | 8,505,086 |
| Commercial Services & Supplies - 3.1% | | | |
| Diversified Support Services - 2.0% | | | |
| Cintas Corp. | | 13,800 | 2,150,454 |
| KAR Auction Services, Inc. | | 42,100 | 2,126,471 |
| | | | 4,276,925 |
| Environmental & Facility Services - 1.1% | | | |
| Waste Connection, Inc. (United States) | | 34,100 | 2,419,054 |
|
| TOTAL COMMERCIAL SERVICES & SUPPLIES | | | 6,695,979 |
|
| Construction & Engineering - 4.1% | | | |
| Construction & Engineering - 4.1% | | | |
| AECOM (a) | | 54,034 | 2,007,363 |
| Dycom Industries, Inc. (a) | | 14,200 | 1,582,306 |
| Fluor Corp. | | 31,300 | 1,616,645 |
| Jacobs Engineering Group, Inc. | | 25,000 | 1,649,000 |
| KBR, Inc. | | 107,300 | 2,127,759 |
| | | | 8,983,073 |
| Electrical Equipment - 5.6% | | | |
| Electrical Components & Equipment - 5.3% | | | |
| Acuity Brands, Inc. | | 8,800 | 1,548,800 |
| AMETEK, Inc. | | 60,100 | 4,355,447 |
| Fortive Corp. | | 78,392 | 5,671,661 |
| | | | 11,575,908 |
| Heavy Electrical Equipment - 0.3% | | | |
| TPI Composites, Inc. (a) | | 29,387 | 601,258 |
|
| TOTAL ELECTRICAL EQUIPMENT | | | 12,177,166 |
|
| Household Durables - 0.3% | | | |
| Homebuilding - 0.3% | | | |
| Lennar Corp. Class A | | 9,000 | 569,160 |
| Industrial Conglomerates - 8.2% | | | |
| Industrial Conglomerates - 8.2% | | | |
| General Electric Co. | | 243,646 | 4,251,623 |
| Honeywell International, Inc. | | 70,027 | 10,739,341 |
| ITT, Inc. | | 56,600 | 3,020,742 |
| | | | 18,011,706 |
| Machinery - 24.0% | | | |
| Agricultural & Farm Machinery - 1.6% | | | |
| Deere & Co. | | 22,600 | 3,537,126 |
| Construction Machinery & Heavy Trucks - 9.7% | | | |
| Allison Transmission Holdings, Inc. | | 112,000 | 4,823,840 |
| Caterpillar, Inc. | | 71,700 | 11,298,486 |
| WABCO Holdings, Inc. (a) | | 27,800 | 3,989,300 |
| Wabtec Corp. (b) | | 13,400 | 1,091,162 |
| | | | 21,202,788 |
| Industrial Machinery - 12.7% | | | |
| Flowserve Corp. | | 48,400 | 2,039,092 |
| Gardner Denver Holdings, Inc. | | 90,200 | 3,060,486 |
| IDEX Corp. | | 21,340 | 2,816,240 |
| Ingersoll-Rand PLC | | 48,500 | 4,325,715 |
| Lincoln Electric Holdings, Inc. | | 15,500 | 1,419,490 |
| Nordson Corp. | | 8,100 | 1,185,840 |
| Parker Hannifin Corp. | | 23,000 | 4,590,340 |
| Pentair PLC | | 20,294 | 1,433,162 |
| Snap-On, Inc. | | 30,400 | 5,298,720 |
| Xylem, Inc. | | 24,000 | 1,636,800 |
| | | | 27,805,885 |
|
| TOTAL MACHINERY | | | 52,545,799 |
|
| Professional Services - 3.9% | | | |
| Human Resource & Employment Services - 0.8% | | | |
| Robert Half International, Inc. | | 29,900 | 1,660,646 |
| Research & Consulting Services - 3.1% | | | |
| Equifax, Inc. | | 10,300 | 1,214,576 |
| IHS Markit Ltd. (a) | | 125,210 | 5,653,232 |
| | | | 6,867,808 |
|
| TOTAL PROFESSIONAL SERVICES | | | 8,528,454 |
|
| Road & Rail - 9.3% | | | |
| Railroads - 7.8% | | | |
| CSX Corp. | | 69,200 | 3,806,692 |
| Genesee & Wyoming, Inc. Class A (a) | | 18,400 | 1,448,632 |
| Norfolk Southern Corp. | | 37,200 | 5,390,280 |
| Union Pacific Corp. | | 47,900 | 6,423,390 |
| | | | 17,068,994 |
| Trucking - 1.5% | | | |
| J.B. Hunt Transport Services, Inc. | | 15,246 | 1,752,985 |
| Old Dominion Freight Lines, Inc. | | 12,300 | 1,618,065 |
| | | | 3,371,050 |
|
| TOTAL ROAD & RAIL | | | 20,440,044 |
|
| Specialty Retail - 0.5% | | | |
| Home Improvement Retail - 0.5% | | | |
| Lowe's Companies, Inc. | | 11,900 | 1,105,986 |
| Trading Companies & Distributors - 3.3% | | | |
| Trading Companies & Distributors - 3.3% | | | |
| Bunzl PLC | | 38,800 | 1,085,434 |
| MSC Industrial Direct Co., Inc. Class A | | 11,200 | 1,082,592 |
| United Rentals, Inc. (a) | | 9,400 | 1,615,954 |
| Univar, Inc. (a) | | 110,400 | 3,417,984 |
| | | | 7,201,964 |
| Water Utilities - 0.4% | | | |
| Water Utilities - 0.4% | | | |
| AquaVenture Holdings Ltd. (a) | | 62,000 | 962,240 |
| TOTAL COMMON STOCKS | | | |
| (Cost $158,730,876) | | | 216,617,073 |
|
| Money Market Funds - 1.6% | | | |
| Fidelity Cash Central Fund, 1.36% (c) | | 2,593,684 | 2,594,203 |
| Fidelity Securities Lending Cash Central Fund 1.36% (c)(d) | | 881,040 | 881,217 |
| TOTAL MONEY MARKET FUNDS | | | |
| (Cost $3,475,332) | | | 3,475,420 |
| TOTAL INVESTMENT IN SECURITIES - 100.6% | | | |
| (Cost $162,206,208) | | | 220,092,493 |
| NET OTHER ASSETS (LIABILITIES) - (0.6)% | | | (1,242,256) |
| NET ASSETS - 100% | | | $218,850,237 |
Legend
(a) Non-income producing
(b) Security or a portion of the security is on loan at period end.
(c) Affiliated fund that is generally available only to investment companies and other accounts managed by Fidelity Investments. The rate quoted is the annualized seven-day yield of the fund at period end. A complete unaudited listing of the fund's holdings as of its most recent quarter end is available upon request. In addition, each Fidelity Central Fund's financial statements, which are not covered by the Fund's Report of Independent Registered Public Accounting Firm, are available on the SEC's website or upon request.
(d) Investment made with cash collateral received from securities on loan.
Affiliated Central Funds
Information regarding fiscal year to date income earned by the Fund from investments in Fidelity Central Funds is as follows:
| Fund | Income earned |
| Fidelity Cash Central Fund | $23,681 |
| Fidelity Securities Lending Cash Central Fund | 10,373 |
| Total | $34,054 |
Amounts in the income column in the above table include any capital gain distributions from underlying funds, which are presented in the corresponding line-item in the Statement of Operations if applicable.
Investment Valuation
All investments are categorized as Level 1 under the Fair Value Hierarchy. The inputs or methodology used for valuing securities may not be an indication of the risk associated with investing in those securities. For more information on valuation inputs please refer to the Investment Valuation section in the accompanying Notes to Financial Statements.
See accompanying notes which are an integral part of the financial statements.
Financial Statements
Statement of Assets and Liabilities
| | | December 31, 2017 |
| Assets | | |
Investment in securities, at value (including securities loaned of $859,491) — See accompanying schedule:
Unaffiliated issuers (cost $158,730,876) | $216,617,073 | |
| Fidelity Central Funds (cost $3,475,332) | 3,475,420 | |
| Total Investment in Securities (cost $162,206,208) | | $220,092,493 |
| Receivable for investments sold | | 510,082 |
| Receivable for fund shares sold | | 360,795 |
| Dividends receivable | | 96,694 |
| Distributions receivable from Fidelity Central Funds | | 3,330 |
| Prepaid expenses | | 935 |
| Other receivables | | 1,665 |
| Total assets | | 221,065,994 |
| Liabilities | | |
| Payable for investments purchased | $1,163,649 | |
| Payable for fund shares redeemed | 118 | |
| Accrued management fee | 96,005 | |
| Other affiliated payables | 30,167 | |
| Other payables and accrued expenses | 44,793 | |
| Collateral on securities loaned | 881,025 | |
| Total liabilities | | 2,215,757 |
| Net Assets | | $218,850,237 |
| Net Assets consist of: | | |
| Paid in capital | | $152,744,372 |
| Undistributed net investment income | | 216,694 |
| Accumulated undistributed net realized gain (loss) on investments and foreign currency transactions | | 8,002,886 |
| Net unrealized appreciation (depreciation) on investments | | 57,886,285 |
| Net Assets | | $218,850,237 |
| Initial Class: | | |
| Net Asset Value, offering price and redemption price per share ($44,205,124 ÷ 1,853,470 shares) | | $23.85 |
| Investor Class: | | |
| Net Asset Value, offering price and redemption price per share ($174,645,113 ÷ 7,371,327 shares) | | $23.69 |
See accompanying notes which are an integral part of the financial statements.
Statement of Operations
| | | Year ended December 31, 2017 |
| Investment Income | | |
| Dividends | | $2,809,240 |
| Income from Fidelity Central Funds | | 34,054 |
| Total income | | 2,843,294 |
| Expenses | | |
| Management fee | $1,104,713 | |
| Transfer agent fees | 264,055 | |
| Accounting and security lending fees | 79,787 | |
| Custodian fees and expenses | 12,204 | |
| Independent trustees' fees and expenses | 4,584 | |
| Audit | 41,069 | |
| Legal | 4,269 | |
| Miscellaneous | 11,247 | |
| Total expenses before reductions | 1,521,928 | |
| Expense reductions | (11,194) | 1,510,734 |
| Net investment income (loss) | | 1,332,560 |
| Realized and Unrealized Gain (Loss) | | |
| Net realized gain (loss) on: | | |
| Investment securities: | | |
| Unaffiliated issuers | 9,395,405 | |
| Fidelity Central Funds | 464 | |
| Foreign currency transactions | (363) | |
| Total net realized gain (loss) | | 9,395,506 |
| Change in net unrealized appreciation (depreciation) on: | | |
| Investment securities: | | |
| Unaffiliated issuers | 25,929,477 | |
| Fidelity Central Funds | (270) | |
| Total change in net unrealized appreciation (depreciation) | | 25,929,207 |
| Net gain (loss) | | 35,324,713 |
| Net increase (decrease) in net assets resulting from operations | | $36,657,273 |
See accompanying notes which are an integral part of the financial statements.
Statement of Changes in Net Assets
| | Year ended December 31, 2017 | Year ended December 31, 2016 |
| Increase (Decrease) in Net Assets | | |
| Operations | | |
| Net investment income (loss) | $1,332,560 | $1,322,093 |
| Net realized gain (loss) | 9,395,506 | 8,047,219 |
| Change in net unrealized appreciation (depreciation) | 25,929,207 | 12,638,869 |
| Net increase (decrease) in net assets resulting from operations | 36,657,273 | 22,008,181 |
| Distributions to shareholders from net investment income | (1,349,019) | (1,088,641) |
| Distributions to shareholders from net realized gain | (9,072,190) | (13,584,564) |
| Total distributions | (10,421,209) | (14,673,205) |
| Share transactions - net increase (decrease) | (1,684,948) | 40,670,901 |
| Redemption fees | 9,710 | 20,824 |
| Total increase (decrease) in net assets | 24,560,826 | 48,026,701 |
| Net Assets | | |
| Beginning of period | 194,289,411 | 146,262,710 |
| End of period | $218,850,237 | $194,289,411 |
| Other Information | | |
| Undistributed net investment income end of period | $216,694 | $233,516 |
See accompanying notes which are an integral part of the financial statements.
Financial Highlights
VIP Industrials Portfolio Initial Class
| Years ended December 31, | 2017 | 2016 | 2015 | 2014 | 2013 |
| Selected Per–Share Data | | | | | |
| Net asset value, beginning of period | $20.88 | $20.25 | $22.92 | $22.17 | $16.88 |
| Income from Investment Operations | | | | | |
| Net investment income (loss)A | .16 | .18 | .17 | .18 | .17 |
| Net realized and unrealized gain (loss) | 3.91 | 2.50 | (.55) | 1.17 | 6.48 |
| Total from investment operations | 4.07 | 2.68 | (.38) | 1.35 | 6.65 |
| Distributions from net investment income | (.16) | (.13) | (.18) | (.20) | (.16) |
| Distributions from net realized gain | (.94) | (1.92) | (2.11) | (.40) | (1.20) |
| Total distributions | (1.10) | (2.05) | (2.29) | (.60) | (1.36) |
| Redemption fees added to paid in capitalA,B | – | – | – | – | – |
| Net asset value, end of period | $23.85 | $20.88 | $20.25 | $22.92 | $22.17 |
| Total ReturnC,D | 20.15% | 15.87% | (1.89)% | 6.21% | 39.80% |
| Ratios to Average Net AssetsE,F | | | | | |
| Expenses before reductions | .69% | .70% | .69% | .69% | .72% |
| Expenses net of fee waivers, if any | .68% | .70% | .69% | .69% | .72% |
| Expenses net of all reductions | .68% | .69% | .69% | .69% | .72% |
| Net investment income (loss) | .72% | .94% | .83% | .81% | .84% |
| Supplemental Data | | | | | |
| Net assets, end of period (000 omitted) | $44,205 | $42,322 | $35,852 | $46,692 | $55,234 |
| Portfolio turnover rateG | 64% | 62% | 69% | 70% | 64% |
A Calculated based on average shares outstanding during the period.
B Amount represents less than $.005 per share.
C Total returns do not reflect charges attributable to your insurance company's separate account. Inclusion of these charges would reduce the total returns shown.
D Total returns would have been lower if certain expenses had not been reduced during the applicable periods shown.
E Fees and expenses of any underlying Fidelity Central Funds are not included in the Fund's expense ratio. The Fund indirectly bears its proportionate share of the expenses of any underlying Fidelity Central Funds.
F Expense ratios reflect operating expenses of the class. Expenses before reductions do not reflect amounts reimbursed by the investment adviser or reductions from brokerage service arrangements or reductions from other expense offset arrangements and do not represent the amount paid by the class during periods when reimbursements or reductions occur. Expenses net of fee waivers reflect expenses after reimbursement by the investment adviser but prior to reductions from brokerage service arrangements or other expense offset arrangements. Expenses net of all reductions represent the net expenses paid by the class.
G Amount does not include the portfolio activity of any underlying Fidelity Central Funds.
See accompanying notes which are an integral part of the financial statements.
VIP Industrials Portfolio Investor Class
| Years ended December 31, | 2017 | 2016 | 2015 | 2014 | 2013 |
| Selected Per–Share Data | | | | | |
| Net asset value, beginning of period | $20.75 | $20.15 | $22.82 | $22.07 | $16.81 |
| Income from Investment Operations | | | | | |
| Net investment income (loss)A | .14 | .16 | .16 | .16 | .15 |
| Net realized and unrealized gain (loss) | 3.88 | 2.48 | (.56) | 1.17 | 6.46 |
| Total from investment operations | 4.02 | 2.64 | (.40) | 1.33 | 6.61 |
| Distributions from net investment income | (.15) | (.12) | (.17) | (.18) | (.15) |
| Distributions from net realized gain | (.94) | (1.92) | (2.11) | (.40) | (1.20) |
| Total distributions | (1.08)B | (2.04) | (2.27)C | (.58) | (1.35) |
| Redemption fees added to paid in capitalA,D | – | – | – | – | – |
| Net asset value, end of period | $23.69 | $20.75 | $20.15 | $22.82 | $22.07 |
| Total ReturnE,F | 20.05% | 15.73% | (1.97)% | 6.16% | 39.72% |
| Ratios to Average Net AssetsG,H | | | | | |
| Expenses before reductions | .77% | .78% | .77% | .77% | .80% |
| Expenses net of fee waivers, if any | .77% | .78% | .77% | .77% | .80% |
| Expenses net of all reductions | .76% | .77% | .77% | .77% | .79% |
| Net investment income (loss) | .64% | .86% | .76% | .73% | .77% |
| Supplemental Data | | | | | |
| Net assets, end of period (000 omitted) | $174,645 | $151,967 | $110,411 | $126,131 | $136,117 |
| Portfolio turnover rateI | 64% | 62% | 69% | 70% | 64% |
A Calculated based on average shares outstanding during the period.
B Total distributions of $1.08 per share is comprised of distributions from net investment income of $.145 and distributions from net realized gain of $.937 per share.
C Total distributions of $2.27 per share is comprised of distributions from net investment income of $.166 and distributions from net realized gain of $2.105 per share.
D Amount represents less than $.005 per share.
E Total returns do not reflect charges attributable to your insurance company's separate account. Inclusion of these charges would reduce the total returns shown.
F Total returns would have been lower if certain expenses had not been reduced during the applicable periods shown.
G Fees and expenses of any underlying Fidelity Central Funds are not included in the Fund's expense ratio. The Fund indirectly bears its proportionate share of the expenses of any underlying Fidelity Central Funds.
H Expense ratios reflect operating expenses of the class. Expenses before reductions do not reflect amounts reimbursed by the investment adviser or reductions from brokerage service arrangements or reductions from other expense offset arrangements and do not represent the amount paid by the class during periods when reimbursements or reductions occur. Expenses net of fee waivers reflect expenses after reimbursement by the investment adviser but prior to reductions from brokerage service arrangements or other expense offset arrangements. Expenses net of all reductions represent the net expenses paid by the class.
I Amount does not include the portfolio activity of any underlying Fidelity Central Funds.
See accompanying notes which are an integral part of the financial statements.
Notes to Financial Statements
For the period ended December 31, 2017
1. Organization.
VIP Industrials Portfolio (the Fund) is a non-diversified fund of Variable Insurance Products Fund IV (the Trust) and is authorized to issue an unlimited number of shares. The Trust is registered under the Investment Company Act of 1940, as amended (the 1940 Act), as an open-end management investment company organized as a Massachusetts business trust. Shares of the Fund may only be purchased by insurance companies for the purpose of funding variable annuity or variable life insurance contracts. The Fund offers the following classes of shares: Initial Class shares and Investor Class shares. All classes have equal rights and voting privileges, except for matters affecting a single class.
2. Investments in Fidelity Central Funds.
The Fund invests in Fidelity Central Funds, which are open-end investment companies generally available only to other investment companies and accounts managed by the investment adviser and its affiliates. The Fund's Schedule of Investments lists each of the Fidelity Central Funds held as of period end, if any, as an investment of the Fund, but does not include the underlying holdings of each Fidelity Central Fund. As an Investing Fund, the Fund indirectly bears its proportionate share of the expenses of the underlying Fidelity Central Funds.
The Money Market Central Funds seek preservation of capital and current income and are managed by Fidelity Investments Money Management, Inc. (FIMM), an affiliate of the investment adviser. Annualized expenses of the Money Market Central Funds as of their most recent shareholder report date are less than .005%.
A complete unaudited list of holdings for each Fidelity Central Fund is available upon request or at the Securities and Exchange Commission (the SEC) website at www.sec.gov. In addition, the financial statements of the Fidelity Central Funds, which are not covered by the Fund's Report of Independent Registered Public Accounting Firm, are available on the SEC website or upon request.
3. Significant Accounting Policies.
The Fund is an investment company and applies the accounting and reporting guidance of the Financial Accounting Standards Board (FASB) Accounting Standards Codification Topic 946 Financial Services – Investments Companies. The financial statements have been prepared in conformity with accounting principles generally accepted in the United States of America (GAAP), which require management to make certain estimates and assumptions at the date of the financial statements. Actual results could differ from those estimates. Subsequent events, if any, through the date that the financial statements were issued have been evaluated in the preparation of the financial statements. The following summarizes the significant accounting policies of the Fund:
Investment Valuation. Investments are valued as of 4:00 p.m. Eastern time on the last calendar day of the period. The Board of Trustees (the Board) has delegated the day to day responsibility for the valuation of the Fund's investments to the Fair Value Committee (the Committee) established by the Fund's investment adviser. In accordance with valuation policies and procedures approved by the Board, the Fund attempts to obtain prices from one or more third party pricing vendors or brokers to value its investments. When current market prices, quotations or currency exchange rates are not readily available or reliable, investments will be fair valued in good faith by the Committee, in accordance with procedures adopted by the Board. Factors used in determining fair value vary by investment type and may include market or investment specific events. The frequency with which these procedures are used cannot be predicted and they may be utilized to a significant extent. The Committee oversees the Fund's valuation policies and procedures and reports to the Board on the Committee's activities and fair value determinations. The Board monitors the appropriateness of the procedures used in valuing the Fund's investments and ratifies the fair value determinations of the Committee.
The Fund categorizes the inputs to valuation techniques used to value its investments into a disclosure hierarchy consisting of three levels as shown below:
- Level 1 – quoted prices in active markets for identical investments
- Level 2 – other significant observable inputs (including quoted prices for similar investments, interest rates, prepayment speeds, etc.)
- Level 3 – unobservable inputs (including the Fund's own assumptions based on the best information available)
Valuation techniques used to value the Fund's investments by major category are as follows:
Equity securities, including restricted securities, for which market quotations are readily available, are valued at the last reported sale price or official closing price as reported by a third party pricing vendor on the primary market or exchange on which they are traded and are categorized as Level 1 in the hierarchy. In the event there were no sales during the day or closing prices are not available, securities are valued at the last quoted bid price or may be valued using the last available price and are generally categorized as Level 2 in the hierarchy. For foreign equity securities, when market or security specific events arise, comparisons to the valuation of American Depositary Receipts (ADRs), futures contracts, Exchange-Traded Funds (ETFs) and certain indexes as well as quoted prices for similar securities may be used and would be categorized as Level 2 in the hierarchy. Utilizing these techniques may result in transfers between Level 1 and Level 2. For equity securities, including restricted securities, where observable inputs are limited, assumptions about market activity and risk are used and these securities may be categorized as Level 3 in the hierarchy.
Investments in open-end mutual funds, including the Fidelity Central Funds, are valued at their closing net asset value (NAV) each business day and are categorized as Level 1 in the hierarchy.
Changes in valuation techniques may result in transfers in or out of an assigned level within the disclosure hierarchy.
Foreign Currency. The Fund may use foreign currency contracts to facilitate transactions in foreign-denominated securities. Gains and losses from these transactions may arise from changes in the value of the foreign currency or if the counterparties do not perform under the contracts' terms.
Foreign-denominated assets, including investment securities, and liabilities are translated into U.S. dollars at the exchange rates at period end. Purchases and sales of investment securities, income and dividends received and expenses denominated in foreign currencies are translated into U.S. dollars at the exchange rate in effect on the transaction date.
The effects of exchange rate fluctuations on investments are included with the net realized and unrealized gain (loss) on investment securities. Other foreign currency transactions resulting in realized and unrealized gain (loss) are disclosed separately.
Investment Transactions and Income. For financial reporting purposes, the Fund's investment holdings and NAV include trades executed through the end of the last business day of the period. The NAV per share for processing shareholder transactions is calculated as of the close of business of the New York Stock Exchange (NYSE), normally 4:00 p.m. Eastern time and includes trades executed through the end of the prior business day. Gains and losses on securities sold are determined on the basis of identified cost and includes proceeds received from litigation. Dividend income is recorded on the ex-dividend date, except for certain dividends from foreign securities where the ex-dividend date may have passed, which are recorded as soon as the Fund is informed of the ex-dividend date. Non-cash dividends included in dividend income, if any, are recorded at the fair market value of the securities received. Income and capital gain distributions from Fidelity Central Funds, if any, are recorded on the ex-dividend date. Certain distributions received by the Fund represent a return of capital or capital gain. The Fund determines the components of these distributions subsequent to the ex-dividend date, based upon receipt of tax filings or other correspondence relating to the underlying investment. These distributions are recorded as a reduction of cost of investments and/or as a realized gain. Investment income is recorded net of foreign taxes withheld where recovery of such taxes is uncertain.
Class Allocations and Expenses. Investment income, realized and unrealized capital gains and losses, common expenses of the Fund, and certain fund-level expense reductions, if any, are allocated daily on a pro-rata basis to each class based on the relative net assets of each class to the total net assets of the Fund. Each class differs with respect to transfer agent fees incurred. Certain expense reductions may also differ by class. For the reporting period, the allocated portion of income and expenses to each class as a percent of its average net assets may vary due to the timing of recording these transactions in relation to fluctuating net assets of the classes. Expenses directly attributable to a fund are charged to that fund. Expenses attributable to more than one fund are allocated among the respective funds on the basis of relative net assets or other appropriate methods. Expense estimates are accrued in the period to which they relate and adjustments are made when actual amounts are known.
Income Tax Information and Distributions to Shareholders. Each year, the Fund intends to qualify as a regulated investment company under Subchapter M of the Internal Revenue Code, including distributing substantially all of its taxable income and realized gains. As a result, no provision for U.S. Federal income taxes is required. As of December 31, 2017, the Fund did not have any unrecognized tax benefits in the financial statements; nor is the Fund aware of any tax positions for which it is reasonably possible that the total amounts of unrecognized tax benefits will significantly change in the next twelve months. The Fund files a U.S. federal tax return, in addition to state and local tax returns as required. The Fund's federal income tax returns are subject to examination by the Internal Revenue Service (IRS) for a period of three fiscal years after they are filed. State and local tax returns may be subject to examination for an additional fiscal year depending on the jurisdiction. Foreign taxes are provided for based on the Fund's understanding of the tax rules and rates that exist in the foreign markets in which it invests.
Distributions are declared and recorded on the ex-dividend date. Income dividends and capital gain distributions are declared separately for each class. Income and capital gain distributions are determined in accordance with income tax regulations, which may differ from GAAP.
Capital accounts within the financial statements are adjusted for permanent book-tax differences. These adjustments have no impact on net assets or the results of operations. Capital accounts are not adjusted for temporary book-tax differences which will reverse in a subsequent period.
Book-tax differences are primarily due to foreign currency transactions and losses deferred due to wash sales.
As of period end, the cost and unrealized appreciation (depreciation) in securities, and derivatives if applicable, for federal income tax purposes were as follows:
| Gross unrealized appreciation | $59,461,168 |
| Gross unrealized depreciation | (1,674,537) |
| Net unrealized appreciation (depreciation) | $57,786,631 |
| Tax Cost | $162,305,862 |
The tax-based components of distributable earnings as of period end were as follows:
| Undistributed ordinary income | $1,458,960 |
| Undistributed long-term capital gain | $6,860,273 |
| Net unrealized appreciation (depreciation) on securities and other investments | $57,786,631 |
The tax character of distributions paid was as follows:
| | December 31, 2017 | December 31, 2016 |
| Ordinary Income | $2,431,943 | $ 1,088,641 |
| Long-term Capital Gains | 7,989,266 | 13,584,564 |
| Total | $10,421,209 | $ 14,673,205 |
Trading (Redemption) Fees. Shares held by investors less than 60 days may be subject to a redemption fee equal to 1% of the NAV of shares redeemed. All redemption fees, which reduce the proceeds of the shareholder redemption, are retained by the Fund and accounted for as an addition to paid in capital. In November 2017, the Board of Trustees approved the elimination of these redemption fees effective December 18, 2017.
4. Purchases and Sales of Investments.
Purchases and sales of securities, other than short-term securities, aggregated $128,110,346 and $135,556,304, respectively.
5. Fees and Other Transactions with Affiliates.
Management Fee. Fidelity Management & Research Company (the investment adviser) and its affiliates provide the Fund with investment management related services for which the Fund pays a monthly management fee. The management fee is the sum of an individual fund fee rate that is based on an annual rate of .30% of the Fund's average net assets and an annualized group fee rate that averaged .24% during the period. The group fee rate is based upon the average net assets of all the mutual funds advised by Fidelity Management & Research Company (FMR) and the investment adviser. The group fee rate decreases as assets under management increase and increases as assets under management decrease. For the reporting period, the total annual management fee rate was .54% of the Fund's average net assets.
Transfer Agent Fees. Fidelity Investments Institutional Operations Company, Inc. (FIIOC), an affiliate of the investment adviser, is the Fund's transfer, dividend disbursing, and shareholder servicing agent. FIIOC receives an asset-based fee with respect to each class. Each class pays a fee for transfer agent services, typesetting and printing and mailing of shareholder reports, excluding mailing of proxy statements, equal to an annual rate of class-level average net assets. The annual rate for Investor Class is .15% and the annual rate for all other classes is .07%. For the period, transfer agent fees for each class were as follows:
| Initial Class | $27,746 |
| Investor Class | 236,309 |
| | $264,055 |
Accounting and Security Lending Fees. Fidelity Service Company, Inc. (FSC), an affiliate of the investment adviser, maintains the Fund's accounting records. The accounting fee is based on the level of average net assets for each month. Under a separate contract, FSC administers the security lending program. The security lending fee is based on the number and duration of lending transactions.
Brokerage Commissions. The Fund placed a portion of its portfolio transactions with brokerage firms which are affiliates of the investment adviser. Brokerage commissions are included in net realized gain (loss) and change in net unrealized appreciation (depreciation) in the Statement of Operations. The commissions paid to these affiliated firms were $4,425 for the period.
Interfund Trades. The Fund may purchase from or sell securities to other Fidelity Funds under procedures adopted by the Board. The procedures have been designed to ensure these interfund trades are executed in accordance with Rule 17a-7 of the 1940 Act. Interfund trades are included within the respective purchases and sales amounts shown in the Purchases and Sales of Investments note.
6. Committed Line of Credit.
The Fund participates with other funds managed by the investment adviser or an affiliate in a $4.25 billion credit facility (the "line of credit") to be utilized for temporary or emergency purposes to fund shareholder redemptions or for other short-term liquidity purposes. The Fund has agreed to pay commitment fees on its pro-rata portion of the line of credit, which amounted to $620 and is reflected in Miscellaneous expenses on the Statement of Operations. During the period, the Fund did not borrow on this line of credit.
7. Security Lending.
The Fund lends portfolio securities through a lending agent from time to time in order to earn additional income. On the settlement date of the loan, the Fund receives collateral (in the form of U.S. Treasury obligations, letters of credit and/or cash) against the loaned securities and maintains collateral in an amount not less than 100% of the market value of the loaned securities during the period of the loan. The market value of the loaned securities is determined at the close of business of the Fund and any additional required collateral is delivered to the Fund on the next business day. The Fund or borrower may terminate the loan at any time, and if the borrower defaults on its obligation to return the securities loaned because of insolvency or other reasons, the Fund may apply collateral received from the borrower against the obligation. The Fund may experience delays and costs in recovering the securities loaned. Any cash collateral received is invested in the Fidelity Securities Lending Cash Central Fund. The value of loaned securities and cash collateral at period end are disclosed on the Fund's Statement of Assets and Liabilities. Security lending income represents the income earned on investing cash collateral, less rebates paid to borrowers and any lending agent fees associated with the loan, plus any premium payments received for lending certain types of securities. Security lending income is presented in the Statement of Operations as a component of income from Fidelity Central Funds. Total security lending income during the period amounted to $10,373.
8. Expense Reductions.
Commissions paid to certain brokers with whom the investment adviser, or its affiliates, places trades on behalf of the Fund include an amount in addition to trade execution, which may be rebated back to the Fund to offset certain expenses. This amount totaled $9,309 for the period.
In addition, during the period the investment adviser reimbursed and/or waived a portion of fund-level operating expenses in the amount of $1,885.
9. Distributions to Shareholders.
Distributions to shareholders of each class were as follows:
| | Year ended December 31, 2017 | Year ended December 31, 2016 |
| From net investment income | | |
| Initial Class | 298,116 | 254,160 |
| Investor Class | 1,050,903 | 834,481 |
| Total | $1,349,019 | $1,088,641 |
| From net realized gain | | |
| Initial Class | 1,894,536 | 3,274,688 |
| Investor Class | 7,177,654 | 10,309,876 |
| Total | $9,072,190 | $13,584,564 |
10. Share Transactions.
Transactions for each class of shares were as follows:
| | Shares | Shares | Dollars | Dollars |
| | Year ended December 31, 2017 | Year ended December 31, 2016 | Year ended December 31, 2017 | Year ended December 31, 2016 |
| Initial Class | | | | |
| Shares sold | 205,198 | 366,918 | $4,489,427 | $7,447,757 |
| Reinvestment of distributions | 102,942 | 211,467 | 2,192,652 | 3,528,848 |
| Shares redeemed | (481,745) | (321,699) | (10,255,941) | (6,144,469) |
| Net increase (decrease) | (173,605) | 256,686 | $(3,573,862) | $4,832,136 |
| Investor Class | | | | |
| Shares sold | 1,534,565 | 2,019,265 | $33,316,997 | $40,663,972 |
| Reinvestment of distributions | 388,964 | 671,102 | 8,228,557 | 11,144,357 |
| Shares redeemed | (1,876,036) | (847,086) | (39,656,640) | (15,969,564) |
| Net increase (decrease) | 47,493 | 1,843,281 | $1,888,914 | $35,838,765 |
11. Other.
The Fund's organizational documents provide former and current trustees and officers with a limited indemnification against liabilities arising in connection with the performance of their duties to the Fund. In the normal course of business, the Fund may also enter into contracts that provide general indemnifications. The Fund's maximum exposure under these arrangements is unknown as this would be dependent on future claims that may be made against the Fund. The risk of material loss from such claims is considered remote.
At the end of the period, the investment adviser or its affiliates were the owners of record of 100% of the total outstanding shares of the Fund.
Report of Independent Registered Public Accounting Firm
To the Board of Trustees of Variable Insurance Products Fund IV and Shareholders of VIP Industrials Portfolio:
Opinion on the Financial Statements
We have audited the accompanying statement of assets and liabilities, including the schedule of investments, of VIP Industrials Portfolio (one of the funds constituting Variable Insurance Products Fund IV, referred to hereafter as the “Fund”) as of December 31, 2017, the related statement of operations for the year ended December 31, 2017, the statement of changes in net assets for each of the two years in the period ended December 31, 2017, including the related notes, and the financial highlights for each of the five years in the period ended December 31, 2017 (collectively referred to as the “financial statements”). In our opinion, the financial statements present fairly, in all material respects, the financial position of the Fund as of December 31, 2017, the results of its operations for the year then ended, the changes in its net assets for each of the two years in the period ended December 31, 2017 and the financial highlights for each of the five years in the period ended December 31, 2017 in conformity with accounting principles generally accepted in the United States of America.
Basis for Opinion
These financial statements are the responsibility of the Fund’s management. Our responsibility is to express an opinion on the Fund’s financial statements based on our audits. We are a public accounting firm registered with the Public Company Accounting Oversight Board (United States) (“PCAOB”) and are required to be independent with respect to the Fund in accordance with the U.S. federal securities laws and the applicable rules and regulations of the Securities and Exchange Commission and the PCAOB.
We conducted our audits of these financial statements in accordance with the standards of the PCAOB. Those standards require that we plan and perform the audit to obtain reasonable assurance about whether the financial statements are free of material misstatement, whether due to error or fraud.
Our audits included performing procedures to assess the risks of material misstatement of the financial statements, whether due to error or fraud, and performing procedures that respond to those risks. Such procedures included examining, on a test basis, evidence regarding the amounts and disclosures in the financial statements. Our audits also included evaluating the accounting principles used and significant estimates made by management, as well as evaluating the overall presentation of the financial statements. Our procedures included confirmation of securities owned as of December 31, 2017 by correspondence with the custodian and brokers; when replies were not received from brokers, we performed other auditing procedures. We believe that our audits provide a reasonable basis for our opinion.
PricewaterhouseCoopers LLP
Boston, Massachusetts
February 15, 2018
We have served as the auditor of one or more investment companies in the Fidelity group of funds since 1932.
Trustees and Officers
The Trustees, Members of the Advisory Board (if any), and officers of the trust and fund, as applicable, are listed below. The Board of Trustees governs the fund and is responsible for protecting the interests of shareholders. The Trustees are experienced executives who meet periodically throughout the year to oversee the fund's activities, review contractual arrangements with companies that provide services to the fund, oversee management of the risks associated with such activities and contractual arrangements, and review the fund's performance. Each of the Trustees oversees 91 funds.
The Trustees hold office without limit in time except that (a) any Trustee may resign; (b) any Trustee may be removed by written instrument, signed by at least two-thirds of the number of Trustees prior to such removal; (c) any Trustee who requests to be retired or who has become incapacitated by illness or injury may be retired by written instrument signed by a majority of the other Trustees; and (d) any Trustee may be removed at any special meeting of shareholders by a two-thirds vote of the outstanding voting securities of the trust. Each Trustee who is not an interested person (as defined in the 1940 Act) of the trust and the fund is referred to herein as an Independent Trustee. Each Independent Trustee shall retire not later than the last day of the calendar year in which his or her 75th birthday occurs. The Independent Trustees may waive this mandatory retirement age policy with respect to individual Trustees. Officers and Advisory Board Members hold office without limit in time, except that any officer or Advisory Board Member may resign or may be removed by a vote of a majority of the Trustees at any regular meeting or any special meeting of the Trustees. Except as indicated, each individual has held the office shown or other offices in the same company for the past five years.
The fund’s Statement of Additional Information (SAI) includes more information about the Trustees. To request a free copy, call Fidelity at 1-877-208-0098.
Experience, Skills, Attributes, and Qualifications of the Trustees. The Governance and Nominating Committee has adopted a statement of policy that describes the experience, qualifications, attributes, and skills that are necessary and desirable for potential Independent Trustee candidates (Statement of Policy). The Board believes that each Trustee satisfied at the time he or she was initially elected or appointed a Trustee, and continues to satisfy, the standards contemplated by the Statement of Policy. The Governance and Nominating Committee also engages professional search firms to help identify potential Independent Trustee candidates who have the experience, qualifications, attributes, and skills consistent with the Statement of Policy. From time to time, additional criteria based on the composition and skills of the current Independent Trustees, as well as experience or skills that may be appropriate in light of future changes to board composition, business conditions, and regulatory or other developments, have also been considered by the professional search firms and the Governance and Nominating Committee. In addition, the Board takes into account the Trustees' commitment and participation in Board and committee meetings, as well as their leadership of standing and ad hoc committees throughout their tenure.
In determining that a particular Trustee was and continues to be qualified to serve as a Trustee, the Board has considered a variety of criteria, none of which, in isolation, was controlling. The Board believes that, collectively, the Trustees have balanced and diverse experience, qualifications, attributes, and skills, which allow the Board to operate effectively in governing the fund and protecting the interests of shareholders. Information about the specific experience, skills, attributes, and qualifications of each Trustee, which in each case led to the Board's conclusion that the Trustee should serve (or continue to serve) as a trustee of the fund, is provided below.
Board Structure and Oversight Function. Brian B. Hogan is an interested person and currently serves as Chairman. The Trustees have determined that an interested Chairman is appropriate and benefits shareholders because an interested Chairman has a personal and professional stake in the quality and continuity of services provided to the fund. Independent Trustees exercise their informed business judgment to appoint an individual of their choosing to serve as Chairman, regardless of whether the Trustee happens to be independent or a member of management. The Independent Trustees have determined that they can act independently and effectively without having an Independent Trustee serve as Chairman and that a key structural component for assuring that they are in a position to do so is for the Independent Trustees to constitute a substantial majority for the Board. The Independent Trustees also regularly meet in executive session. Michael E. Wiley serves as Chairman of the Independent Trustees and as such (i) acts as a liaison between the Independent Trustees and management with respect to matters important to the Independent Trustees and (ii) with management prepares agendas for Board meetings.
Fidelity® funds are overseen by different Boards of Trustees. The fund's Board oversees Fidelity's sector portfolios. Other Boards oversee Fidelity's equity and high income funds, and Fidelity's investment grade bond, money market, and asset allocation funds. The use of separate Boards, each with its own committee structure, allows the Trustees of each group of Fidelity® funds to focus on the unique issues of the funds they oversee, including common research, investment, and operational issues. On occasion, the separate Boards establish joint committees to address issues of overlapping consequences for the Fidelity® funds overseen by each Board.
The Trustees operate using a system of committees to facilitate the timely and efficient consideration of all matters of importance to the Trustees, the fund, and fund shareholders and to facilitate compliance with legal and regulatory requirements and oversight of the fund's activities and associated risks. The Board, acting through its committees, has charged SelectCo and its affiliates with (i) identifying events or circumstances the occurrence of which could have demonstrably adverse effects on the fund's business and/or reputation; (ii) implementing processes and controls to lessen the possibility that such events or circumstances occur or to mitigate the effects of such events or circumstances if they do occur; and (iii) creating and maintaining a system designed to evaluate continuously business and market conditions in order to facilitate the identification and implementation processes described in (i) and (ii) above. Because the day-to-day operations and activities of the fund are carried out by or through SelectCo, its affiliates, and other service providers, the fund's exposure to risks is mitigated but not eliminated by the processes overseen by the Trustees. While each of the Board's committees has responsibility for overseeing different aspects of the fund's activities, oversight is exercised primarily through the Operations and Audit Committees. Appropriate personnel, including but not limited to the fund's Chief Compliance Officer (CCO), SelectCo's internal auditor, the independent accountants, the fund's Treasurer and portfolio management personnel, make periodic reports to the Board's committees, as appropriate. The responsibilities of each standing committee, including their oversight responsibilities, are described further under "Standing Committees of the Trustees."
Interested Trustees*:
Correspondence intended for a Trustee who is an interested person may be sent to Fidelity Investments, 245 Summer Street, Boston, Massachusetts 02210.
Name, Year of Birth; Principal Occupations and Other Relevant Experience+
Brian B. Hogan (1964)
Year of Election or Appointment: 2014
Trustee
Chairman of the Board of Trustees
Mr. Hogan also serves as Trustee or Vice President of other funds. Mr. Hogan serves as a Director of FMR Investment Management (UK) Limited (investment adviser firm, 2015-present) and Fidelity SelectCo, LLC (investment adviser firm, 2014-present) and President of the Equity Division of FMR (investment adviser firm, 2009-present). Previously, Mr. Hogan served as Senior Vice President, Equity Research of FMR (2006-2009) and as a portfolio manager. Mr. Brian B. Hogan is not related to Mr. Colm A. Hogan.
* Determined to be an "Interested Trustee" by virtue of, among other things, his or her affiliation with the trust or various entities under common control with SelectCo.
+ The information includes the Trustee's principal occupation during the last five years and other information relating to the experience, attributes, and skills relevant to the Trustee's qualifications to serve as a Trustee, which led to the conclusion that the Trustee should serve as a Trustee for the fund.
Independent Trustees:
Correspondence intended for an Independent Trustee may be sent to Fidelity Investments, P.O. Box 55235, Boston, Massachusetts 02205-5235.
Name, Year of Birth; Principal Occupations and Other Relevant Experience+
David A. Rosow (1942)
Year of Election or Appointment: 2013
Trustee
Mr. Rosow also serves as Trustee of other Fidelity® funds. Prior to his retirement in 2006, Mr. Rosow was the Chief Executive Officer, owner and operator of a number of private companies, which encompassed the oil refining, drilling and marketing of petroleum products (including specialty petroleum products), recreation industry, and real estate development. Mr. Rosow currently serves as a Director of Oxbow Carbon LLC (upgraders, marketers, and distributors of petroleum byproducts of the oil refining process, 2015-present) and Oxbridge Academy of the Palm Beaches (2015-present) and serves as its President and CEO. Previously, Mr. Rosow served on the Fairfield Country Day School Board for 27 years, including as its President for 3 years, stepping down in 2006. Mr. Rosow served as Lead Director and Chairman of the Audit Committee of Hudson United Bancorp (1996-2006), Chairman of the Board of Westport Bank and Trust (1992-1996), and as a Director of TD Banknorth (2006-2007). In addition, Mr. Rosow served as a member (2008-2014) and President (2009-2014) of the Town Council of Palm Beach, Florida. Mr. Rosow also served as a Member of the Advisory Board of certain Fidelity® funds (2012-2013).
Garnett A. Smith (1947)
Year of Election or Appointment: 2013
Trustee
Mr. Smith also serves as Trustee of other Fidelity® funds. Prior to Mr. Smith's retirement, he served as Chairman and Chief Executive Officer of Inbrand Corp. (manufacturer of personal absorbent products, 1990-1997). He also served as President (1986-1990) of Inbrand Corp. Prior to his employment with Inbrand Corp., he was employed by a retail fabric chain and North Carolina National Bank. In addition, Mr. Smith served as a Member of the Advisory Board of certain Fidelity® funds (2012-2013) and as a board member of the Jackson Hole Land Trust (2009-2012).
Michael E. Wiley (1950)
Year of Election or Appointment: 2008
Trustee
Chairman of the Independent Trustees
Mr. Wiley also serves as Trustee of other Fidelity® funds. Mr. Wiley serves as a Director of Andeavor Corporation (independent oil refiner and marketer, 2005-present), a Director of Andeavor Logistics LP (natural resources logistics, 2015-present), and a Director of Bill Barrett Corporation (exploration and production, 2005-present). In addition, Mr. Wiley also serves as a Director of Post Oak Bank (privately-held bank, 2004-present). Previously, Mr. Wiley served as a Trustee of other Fidelity® funds (2008-2013), as a Director of Asia Pacific Exploration Consolidated (international oil and gas exploration and production, 2008-2013), as a member of the Board of Trustees of the University of Tulsa (2000-2006; 2007-2010), as a Senior Energy Advisor of Katzenbach Partners, LLC (consulting, 2006-2007), as an Advisory Director of Riverstone Holdings (private investment), Chairman, President, and CEO of Baker Hughes, Inc. (oilfield services, 2000-2004), and as Director of Spinnaker Exploration Company (exploration and production, 2001-2005).
+ The information includes the Trustee's principal occupation during the last five years and other information relating to the experience, attributes, and skills relevant to the Trustee's qualifications to serve as a Trustee, which led to the conclusion that the Trustee should serve as a Trustee for the fund.
Advisory Board Members and Officers:
Correspondence intended for a Member of the Advisory Board (if any) may be sent to Fidelity Investments, P.O. Box 55235, Boston, Massachusetts 02205-5235. Except for Anthony R. Rochte, correspondence intended for an officer may be sent to Fidelity Investments, 245 Summer Street, Boston, Massachusetts 02210. Correspondence intended for Mr. Rochte may be sent to Fidelity SelectCo, LLC (SelectCo), 1225 17th Street, Denver, Colorado 80202-5541. Officers appear below in alphabetical order.
Name, Year of Birth; Principal Occupation
Donald F. Donahue (1950)
Year of Election or Appointment: 2015
Member of the Advisory Board
Mr. Donahue also serves as a Trustee or Member of the Advisory Board of other Fidelity® funds. Mr. Donahue is President and Chief Executive Officer of Miranda Partners, LLC (risk consulting for the financial services industry, 2012-present). Previously, Mr. Donahue served as Chief Executive Officer (2006-2012), Chief Operating Officer (2003-2006), and Managing Director, Customer Marketing and Development (1999-2003) of The Depository Trust & Clearing Corporation (financial markets infrastructure). Mr. Donahue serves as a Member (2007-present) and Co-Chairman (2016-present) of the Board of Directors of United Way of New York, Member of the Board of Directors of NYC Leadership Academy (2012-present) and Member of the Board of Advisors of Ripple Labs, Inc. (financial services, 2015-present). He also served as Chairman (2010-2012) and Member of the Board of Directors (2012-2013) of Omgeo, LLC (financial services), Treasurer of United Way of New York (2012-2016), and Member of the Board of Directors of XBRL US (financial services non-profit, 2009-2012) and the International Securities Services Association (2009-2012).
Carol B. Tomé (1957)
Year of Election or Appointment: 2017
Member of the Advisory Board
Ms. Tomé also serves as Member of the Advisory Board of other Fidelity® funds. Ms. Tomé is Chief Financial Officer (2001-present) and Executive Vice President of Corporate Services (2007-present) of The Home Depot, Inc. (home improvement retailer) and a Director (2003-present) and Chair of the Audit Committee (2004-present) of United Parcel Service, Inc. (package delivery and supply chain management). Previously, Ms. Tomé served as Trustee of certain Fidelity® funds (2017), Senior Vice President of Finance and Accounting/Treasurer (2000-2007) and Vice President and Treasurer (1995-2000) of The Home Depot, Inc. and Chair of the Board (2010-2012), Vice Chair of the Board (2009 and 2013), and a Director (2008-2013) of the Federal Reserve Bank of Atlanta. Ms. Tomé is also a director or trustee of many community and professional organizations.
Elizabeth Paige Baumann (1968)
Year of Election or Appointment: 2017
Anti-Money Laundering (AML) Officer
Ms. Baumann also serves as AML Officer of other funds. She is Chief AML Officer (2012-present) and Senior Vice President (2014-present) of FMR LLC (diversified financial services company) and is an employee of Fidelity Investments. Previously, Ms. Baumann served as AML Officer of the funds (2012-2016), and Vice President (2007-2014) and Deputy Anti-Money Laundering Officer (2007-2012) of FMR LLC.
Marc R. Bryant (1966)
Year of Election or Appointment: 2013
Secretary and Chief Legal Officer (CLO)
Mr. Bryant also serves as Secretary and CLO of other funds. Mr. Bryant serves as CLO, Secretary, and Senior Vice President of Fidelity Management & Research Company (investment adviser firm, 2015-present) and FMR Co., Inc. (investment adviser firm, 2015-present); Secretary of Fidelity SelectCo, LLC (investment adviser firm, 2015-present) and Fidelity Investments Money Management, Inc. (investment adviser firm, 2015-present); and CLO of Fidelity Management & Research (Hong Kong) Limited and FMR Investment Management (UK) Limited (investment adviser firms, 2015-present) and Fidelity Management & Research (Japan) Limited (investment adviser firm, 2016-present). He is Senior Vice President and Deputy General Counsel of FMR LLC (diversified financial services company). Previously, Mr. Bryant served as Secretary and CLO of Fidelity Rutland Square Trust II (2010-2014) and Assistant Secretary of Fidelity's Fixed Income and Asset Allocation Funds (2013-2015). Prior to joining Fidelity Investments, Mr. Bryant served as a Senior Vice President and the Head of Global Retail Legal for AllianceBernstein L.P. (2006-2010), and as the General Counsel for ProFund Advisors LLC (2001-2006).
William C. Coffey (1969)
Year of Election or Appointment: 2009
Assistant Secretary
Mr. Coffey also serves as Assistant Secretary of other funds. He is Senior Vice President and Deputy General Counsel of FMR LLC (diversified financial services company, 2010-present), and is an employee of Fidelity Investments. Previously, Mr. Coffey served as Vice President and Associate General Counsel of FMR LLC (2005-2009).
Jonathan Davis (1968)
Year of Election or Appointment: 2010
Assistant Treasurer
Mr. Davis also serves as Assistant Treasurer of other funds. Mr. Davis serves as Assistant Treasurer of FMR Capital, Inc. (2017-present) and is an employee of Fidelity Investments. Previously, Mr. Davis served as Vice President and Associate General Counsel of FMR LLC (diversified financial services company, 2003-2010).
Adrien E. Deberghes (1967)
Year of Election or Appointment: 2013
President and Treasurer
Mr. Deberghes also serves as an officer of other funds. He serves as Assistant Treasurer of FMR Capital, Inc. (2017-present), Executive Vice President of Fidelity Investments Money Management, Inc. (FIMM) (investment adviser firm, 2016-present), and is an employee of Fidelity Investments (2008-present). Prior to joining Fidelity Investments, Mr. Deberghes was Senior Vice President of Mutual Fund Administration at State Street Corporation (2007-2008), Senior Director of Mutual Fund Administration at Investors Bank & Trust (2005-2007), and Director of Finance for Dunkin' Brands (2000-2005). Previously, Mr. Deberghes served in other fund officer roles.
Joseph DeSantis (1959)
Year of Election or Appointment: 2015
Vice President
Mr. DeSantis also serves as Vice President of other funds. Mr. DeSantis serves as a Director of Fidelity Management & Research (Japan) Limited (investment adviser firm, 2016-present), Chief Investment Officer, Equities (2010-present) and is an employee of Fidelity Investments.
Stephanie J. Dorsey (1969)
Year of Election or Appointment: 2010
Assistant Treasurer
Ms. Dorsey also serves as an officer of other funds. Ms. Dorsey serves as Assistant Treasurer of FMR Capital, Inc. (2017-present), is an employee of Fidelity Investments (2008-present), and has served in other fund officer roles. Prior to joining Fidelity Investments, Ms. Dorsey served as Treasurer (2004-2008) of the JPMorgan Mutual Funds and Vice President (2004-2008) of JPMorgan Chase Bank.
Howard J. Galligan III (1966)
Year of Election or Appointment: 2014
Chief Financial Officer
Mr. Galligan also serves as Chief Financial Officer of other funds. Mr. Galligan serves as President of Fidelity Pricing and Cash Management Services (FPCMS) (2014-present) and as a Director of Strategic Advisers, Inc. (investment adviser firm, 2008-present). Previously, Mr. Galligan served as Chief Administrative Officer of Asset Management (2011-2014) and Chief Operating Officer and Senior Vice President of Investment Support for Strategic Advisers, Inc. (2003-2011).
James D. Gryglewicz (1972)
Year of Election or Appointment: 2014
Chief Compliance Officer
Mr. Gryglewicz also serves as Chief Compliance Officer of other funds. Mr. Gryglewicz serves as Compliance Officer of Strategic Advisers, Inc. (investment adviser firm, 2015-present) and Fidelity SelectCo, LLC (investment adviser firm, 2014-present), Senior Vice President of Asset Management Compliance (2009-present), and is an employee of Fidelity Investments (2004-present).
Brian B. Hogan (1964)
Year of Election or Appointment: 2009
Vice President
Mr. Hogan also serves as Trustee or Vice President of other funds. Mr. Hogan serves as a Director of FMR Investment Management (UK) Limited (investment adviser firm, 2015-present) and Fidelity SelectCo, LLC (investment adviser firm, 2014-present) and President of the Equity Division of FMR (investment adviser firm, 2009-present). Previously, Mr. Hogan served as Senior Vice President, Equity Research of FMR (2006-2009) and as a portfolio manager. Mr. Brian B. Hogan is not related to Mr. Colm A. Hogan.
Colm A. Hogan (1973)
Year of Election or Appointment: 2016
Assistant Treasurer
Mr. Hogan also serves as an officer of other funds. Mr. Hogan serves as Assistant Treasurer of FMR Capital, Inc. (2017-present) and is an employee of Fidelity Investments (2005-present). Mr. Colm A. Hogan is not related to Mr. Brian B. Hogan.
Chris Maher (1972)
Year of Election or Appointment: 2013
Assistant Treasurer
Mr. Maher serves as Assistant Treasurer of other funds. Mr. Maher is Vice President of Valuation Oversight, serves as Assistant Treasurer of FMR Capital, Inc. (2017-present), and is an employee of Fidelity Investments. Previously, Mr. Maher served as Vice President of Asset Management Compliance (2013), Vice President of the Program Management Group of FMR (investment adviser firm, 2010-2013), and Vice President of Valuation Oversight (2008-2010).
Rieco E. Mello (1969)
Year of Election or Appointment: 2017
Assistant Treasurer
Mr. Mello also serves as Assistant Treasurer of other funds. Mr. Mello serves as Assistant Treasurer of FMR Capital, Inc. (2017-present) and is an employee of Fidelity Investments (1995-present).
Anthony R. Rochte (1968)
Year of Election or Appointment: 2013
Vice President
Mr. Rochte also serves as Vice President of other funds. Mr. Rochte serves as President of Fidelity SelectCo, LLC (investment adviser firm, 2012-present) and is an employee of Fidelity Investments (2012-present). Prior to joining Fidelity Investments, Mr. Rochte served as Senior Managing Director and head of State Street Global Advisors' North American Intermediary Business Group (2006-2012).
Stacie M. Smith (1974)
Year of Election or Appointment: 2013
Assistant Treasurer
Ms. Smith also serves as an officer of other funds. Ms. Smith serves as Assistant Treasurer of FMR Capital, Inc. (2017-present), is an employee of Fidelity Investments (2009-present), and has served in other fund officer roles. Prior to joining Fidelity Investments, Ms. Smith served as Senior Audit Manager of Ernst & Young LLP (accounting firm, 1996-2009). Previously, Ms. Smith served as Deputy Treasurer of certain Fidelity® funds (2013-2016).
Marc L. Spector (1972)
Year of Election or Appointment: 2017
Assistant Treasurer
Mr. Spector also serves as an officer of other funds. Mr. Spector serves as Assistant Treasurer of FMR Capital, Inc. (2017-present) and is an employee of Fidelity Investments (2016-present). Prior to joining Fidelity Investments, Mr. Spector served as Director at the Siegfried Group (accounting firm, 2013-2016), and prior to Siegfried Group as audit senior manager at Deloitte & Touche (accounting firm, 2005-2013).
Renee Stagnone (1975)
Year of Election or Appointment: 2016
Assistant Treasurer
Ms. Stagnone also serves as an officer of other funds. Ms. Stagnone serves as Assistant Treasurer of FMR Capital, Inc. (2017-present) and is an employee of Fidelity Investments (1997-present). Previously, Ms. Stagnone served as Deputy Treasurer of certain Fidelity® funds (2013-2016).
Shareholder Expense Example
As a shareholder of the Fund, you incur two types of costs: (1) transaction costs, including redemption fees and (2) ongoing costs, including management fees and other Fund expenses. This Example is intended to help you understand your ongoing costs (in dollars) of investing in the Fund and to compare these costs with the ongoing costs of investing in other mutual funds.
The Example is based on an investment of $1,000 invested at the beginning of the period and held for the entire period (July 1, 2017 to December 31, 2017).
Actual Expenses
The first line of the accompanying table for each class of the Fund provides information about actual account values and actual expenses. You may use the information in this line, together with the amount you invested, to estimate the expenses that you paid over the period. Simply divide your account value by $1,000.00 (for example, an $8,600 account value divided by $1,000.00 = 8.6), then multiply the result by the number in the first line for a class of the Fund under the heading entitled "Expenses Paid During Period" to estimate the expenses you paid on your account during this period. The estimate of expenses does not include any fees or other expenses of any variable annuity or variable life insurance product. If they were, the estimate of expenses you paid during the period would be higher, and your ending account value would be lower. In addition, the Fund, as a shareholder in the underlying Fidelity Central Funds, will indirectly bear its pro-rata share of the fees and expenses incurred by the underlying Fidelity Central Funds. These fees and expenses are not included in the Fund's annualized expense ratio used to calculate the expense estimate in the table below.
Hypothetical Example for Comparison Purposes
The second line of the accompanying table for each class of the Fund provides information about hypothetical account values and hypothetical expenses based on a Class' actual expense ratio and an assumed rate of return of 5% per year before expenses, which is not the Class' actual return. The hypothetical account values and expenses may not be used to estimate the actual ending account balance or expenses you paid for the period. You may use this information to compare the ongoing costs of investing in the Fund and other funds. To do so, compare this 5% hypothetical example with the 5% hypothetical examples that appear in the shareholder reports of the other funds. The estimate of expenses does not include any fees or other expenses of any variable annuity or variable life insurance product. If they were, the estimate of expenses you paid during the period would be higher, and your ending account value would be lower. In addition, the Fund, as a shareholder in the underlying Fidelity Central Funds, will indirectly bear its pro-rata share of the fees and expenses incurred by the underlying Fidelity Central Funds. These fees and expenses are not included in the Fund's annualized expense ratio used to calculate the expense estimate in the table below.
Please note that the expenses shown in the table are meant to highlight your ongoing costs only and do not reflect any transaction costs. Therefore, the second line of the table is useful in comparing ongoing costs only, and will not help you determine the relative total costs of owning different funds. In addition, if these transactional costs were included, your costs would have been higher.
| | Annualized Expense Ratio-A | Beginning
Account Value
July 1, 2017 | Ending
Account Value
December 31, 2017 | Expenses Paid
During Period-B
July 1, 2017
to December 31, 2017 |
| Initial Class | .69% | | | |
| Actual | | $1,000.00 | $1,135.70 | $3.71 |
| Hypothetical-C | | $1,000.00 | $1,021.73 | $3.52 |
| Investor Class | .77% | | | |
| Actual | | $1,000.00 | $1,135.00 | $4.14 |
| Hypothetical-C | | $1,000.00 | $1,021.32 | $3.92 |
A Annualized expense ratio reflects expenses net of applicable fee waivers.
B Expenses are equal to each Class' annualized expense ratio, multiplied by the average account value over the period, multiplied by 184/365 (to reflect the one-half year period).
C 5% return per year before expenses
Distributions (Unaudited)
The Board of Trustees of VIP Industrials Portfolio voted to pay to shareholders of record at the opening of business on record date, the following distributions per share derived from capital gains realized from sales of portfolio securities, and dividends derived from net investment income:
| | Pay Date | Record Date | Dividends | Capital Gains |
| VIP Industrials Portfolio | | | | |
| Initial Class | 02/09/18 | 02/09/18 | $0.026 | $0.885 |
| Investor Class | 02/09/18 | 02/09/18 | $0.023 | $0.885 |
|
The fund hereby designates as a capital gain dividend with respect to the taxable year ended December 31, 2017, $ 6,866,829, or, if subsequently determined to be different, the net capital gain of such year.
Initial Class and Investor Class designate 100% of the dividends distributed during the fiscal year as qualifying for the dividends–received deduction for corporate shareholders.
Proxy Voting Results
A special meeting of shareholders was held on December 8, 2017. The results of votes taken among shareholders on the proposals before them are reported below. Each vote reported represents one dollar of net asset value held on the record date for the meeting.
PROPOSAL 1
To elect a Board of Trustees.
| | # of
Votes | % of
Votes |
| James C. Curvey |
| Affirmative | 3,005,845,657.89 | 94.803 |
| Withheld | 164,788,708.80 | 5.197 |
| TOTAL | 3,170,634,366.69 | 100.000 |
| Dennis J. Dirks |
| Affirmative | 3,025,050,303.47 | 95.409 |
| Withheld | 145,584,063.22 | 4.591 |
| TOTAL | 3,170,634,366.69 | 100.000 |
| Donald F. Donahue |
| Affirmative | 3,024,923,660.98 | 95.405 |
| Withheld | 145,710,705.71 | 4.595 |
| TOTAL | 3,170,634,366.69 | 100.000 |
| Alan J. Lacy |
| Affirmative | 3,024,272,946.71 | 95.384 |
| Withheld | 146,361,419.98 | 4.616 |
| TOTAL | 3,170,634,366.69 | 100.00 |
| Ned C. Lautenbach |
| Affirmative | 3,011,847,006.14 | 94.992 |
| Withheld | 158,787,360.55 | 5.008 |
| TOTAL | 3,170,634,366.69 | 100.000 |
| Joseph Mauriello |
| Affirmative | 3,021,074,746.00 | 95.283 |
| Withheld | 149,559,620.69 | 4.717 |
| TOTAL | 3,170,634,366.69 | 100.000 |
| Charles S. Morrison |
| Affirmative | 3,025,083,795.43 | 95.410 |
| Withheld | 145,550,571.26 | 4.590 |
| TOTAL | 3,170,634,366.69 | 100.000 |
| Cornelia M. Small |
| Affirmative | 3,016,566,905.34 | 95.141 |
| Withheld | 154,067,461.35 | 4.859 |
| TOTAL | 3,170,634,366.69 | 100.000 |
| Garnett A. Smith |
| Affirmative | 3,014,927,605.85 | 95.090 |
| Withheld | 155,706,760.84 | 4.910 |
| TOTAL | 3,170,634,366.69 | 100.000 |
| David M. Thomas |
| Affirmative | 3,025,900,428.75 | 95.436 |
| Withheld | 144,733,937.94 | 4.564 |
| TOTAL | 3,170,634,366.69 | 100.000 |
| Michael E. Wiley |
| Affirmative | 3,023,436,110.39 | 95.358 |
| Withheld | 147,198,256.30 | 4.642 |
| TOTAL | 3,170,634,366.69 | 100.000 |
PROPOSAL 2
To eliminate a fundamental investment policy.
| | # of
Votes | % of
Votes |
| Affirmative | 161,930,104.92 | 81.757 |
| Against | 20,493,437.74 | 10.346 |
| Abstain | 15,641,265.09 | 7.897 |
| TOTAL | 198,064,807.75 | 100.000 |
|
| Proposal 1 reflects trust wide proposal and voting results. |
VCYLIC-ANN-0218
1.817361.112
Fidelity® Variable Insurance Products: Consumer Discretionary Portfolio
Annual Report December 31, 2017 |
|
Contents
To view a fund's proxy voting guidelines and proxy voting record for the 12-month period ended June 30, visit http://www.fidelity.com/proxyvotingresults or visit the Securities and Exchange Commission's (SEC) web site at http://www.sec.gov.
You may also call 1-877-208-0098 to request a free copy of the proxy voting guidelines.
Fidelity® Variable Insurance Products are separate account options which are purchased through a variable insurance contract.
Standard & Poor's, S&P and S&P 500 are registered service marks of The McGraw-Hill Companies, Inc. and have been licensed for use by Fidelity Distributors Corporation.
Other third-party marks appearing herein are the property of their respective owners.
All other marks appearing herein are registered or unregistered trademarks or service marks of FMR LLC or an affiliated company. © 2018 FMR LLC. All rights reserved.
This report and the financial statements contained herein are submitted for the general information of the shareholders of the Fund. This report is not authorized for distribution to prospective investors in the Fund unless preceded or accompanied by an effective prospectus.
A fund files its complete schedule of portfolio holdings with the SEC for the first and third quarters of each fiscal year on Form N-Q. Forms N-Q are available on the SEC’s web site at http://www.sec.gov. A fund's Forms N-Q may be reviewed and copied at the SEC’s Public Reference Room in Washington, DC. Information regarding the operation of the SEC's Public Reference Room may be obtained by calling 1-800-SEC-0330.
For a complete list of a fund's portfolio holdings, view the most recent holdings listing, semiannual report, or annual report on Fidelity's web site at http://www.fidelity.com, http://www.institutional.fidelity.com, or http://www.401k.com, as applicable.
NOT FDIC INSURED •MAY LOSE VALUE •NO BANK GUARANTEE
Neither the Fund nor Fidelity Distributors Corporation is a bank.
Performance: The Bottom Line
Average annual total return reflects the change in the value of an investment, assuming reinvestment of distributions from dividend income and capital gains (the profits earned upon the sale of securities that have grown in value, if any) and assuming a constant rate of performance each year. During periods of reimbursement by Fidelity, a fund’s total return will be greater than it would be had the reimbursement not occurred. Performance numbers are net of all underlying fund operating expenses, but do not include any insurance charges imposed by your insurance company’s separate account. If performance information included the effect of these additional charges, the total returns would have been lower. How a fund did yesterday is no guarantee of how it will do tomorrow.
Average Annual Total Returns
| For the periods ended December 31, 2017 | Past 1 year | Past 5 years | Past 10 years |
| Initial Class | 22.16% | 15.80% | 11.53% |
| Investor Class | 22.07% | 15.73% | 11.45% |
$10,000 Over 10 Years
Let's say hypothetically that $10,000 was invested in VIP Consumer Discretionary Portfolio - Initial Class on December 31, 2007.
The chart shows how the value of your investment would have changed, and also shows how the S&P 500® Index performed over the same period.

| Period Ending Values |
| $29,792 | VIP Consumer Discretionary Portfolio - Initial Class |
| $22,603 | S&P 500® Index |
Management's Discussion of Fund Performance
Market Recap: U.S. equities gained 21.83% in 2017, as the S&P 500
® index rose steadily and closed the year just shy of an all-time high after a particularly strong three-month finish. Early on, equities rallied on optimism for President Trump’s pro-business agenda but leveled off in March amid fading optimism and stalled efforts by Congress to repeal and replace the Affordable Care Act. Upward momentum soon returned and continued through year-end with consumer sentiment and other market indicators staying positive. The lone exception was a brief cooldown in August, when geopolitical tension escalated and uncertainty grew regarding the future of health care, tax reform and the debt ceiling. Sector-wise, information technology fared best by a wide margin, rising 39% amid strong earnings growth from several major index constituents. A 24% gain in materials was spurred by increased demand, especially from China. Consumer discretionary gained 23%, despite many brick-and-mortar retailers suffering from online competition, and financials edged the broader market on an uptick in bond yields. Conversely, the defensive energy and telecom services sectors returned about -1% each. Rising interest rates held back real estate (+11%), while consumer staples (+13%) and utilities (+12%) struggled due to investors’ general preference for risk assets.
Comments from Portfolio Manager Katherine Shaw: For the year, the fund's share classes gained about 22%, roughly in line with the 22.90% result of the MSCI U.S. IMI Consumer Discretionary 25/50 Index, as well as the broad-market S&P 500
® index. Consumer discretionary stocks benefited from a surge in business and consumer sentiment, low unemployment and wage growth, and a sweeping tax reform bill that could boost consumers' discretionary spending in 2018. Versus the MSCI sector index, the biggest detractor by a considerable margin was a position in apparel maker and retailer L Brands. The firm continued to struggle this period, particularly in July, when it reported a worse-than-anticipated decline in June same-store sales. Exacerbating this weakness was the slowing foot traffic that has affected mall retailers. We substantially cut the fund’s position in L Brands in 2017, moving from a sizable overweighting to a significant underweighting at year-end. Elsewhere, underexposure to fast-food giant McDonald's for most of the period hurt, as the stock gained 45% the past 12 months on positive changes to the business, including all-day breakfast. We notably increased our allocation to McDonald's after I established a stake in August, placing it among our largest year-end positions, as well as a significant overweighting. Conversely, the fund's biggest individual contributor also was by far its largest holding this year: Amazon.com (+56%). The big news was the firm's $13.5 billion buyout of grocer Whole Foods Market, which shook the broader retailing industry and sent Amazon shares higher. The firm also found continued success with its Amazon Web Services cloud-computing division.
The views expressed above reflect those of the portfolio manager(s) only through the end of the period as stated on the cover of this report and do not necessarily represent the views of Fidelity or any other person in the Fidelity organization. Any such views are subject to change at any time based upon market or other conditions and Fidelity disclaims any responsibility to update such views. These views may not be relied on as investment advice and, because investment decisions for a Fidelity fund are based on numerous factors, may not be relied on as an indication of trading intent on behalf of any Fidelity fund.
Note to shareholders: On August 3, 2017, Katherine Shaw became Portfolio Manager of the fund, succeeding Peter Dixon. On December 8, 2017, shareholders approved proposals from the Board of Trustees to eliminate each sector/industry fund's fundamental “invests primarily” policy and to modify the fundamental concentration policy for certain funds. The changes took effect on January 1, 2018, and do not impact how the funds are managed.
Investment Summary (Unaudited)
Top Ten Stocks as of December 31, 2017
| | % of fund's net assets |
| Amazon.com, Inc. | 14.9 |
| Home Depot, Inc. | 8.4 |
| The Walt Disney Co. | 4.4 |
| McDonald's Corp. | 4.1 |
| Charter Communications, Inc. Class A | 4.0 |
| Comcast Corp. Class A | 4.0 |
| Dollar Tree, Inc. | 3.5 |
| Starbucks Corp. | 2.9 |
| Lowe's Companies, Inc. | 2.8 |
| Priceline Group, Inc. | 2.7 |
| | 51.7 |
Top Industries (% of fund's net assets)
| As of December 31, 2017 |
| | Hotels, Restaurants & Leisure | 24.9% |
| | Internet & Direct Marketing Retail | 20.7% |
| | Specialty Retail | 18.9% |
| | Media | 14.2% |
| | Textiles, Apparel & Luxury Goods | 4.7% |
| | All Others* | 16.6% |

* Includes Short-Term investments and Net Other Assets (Liabilities).
Investments December 31, 2017
Showing Percentage of Net Assets
| Common Stocks - 98.9% | | | |
| | | Shares | Value |
| Air Freight & Logistics - 0.1% | | | |
| Air Freight & Logistics - 0.1% | | | |
| XPO Logistics, Inc. (a) | | 1,600 | $146,544 |
| Auto Components - 0.2% | | | |
| Auto Parts & Equipment - 0.2% | | | |
| Aptiv PLC | | 3,500 | 296,905 |
| Tenneco, Inc. | | 200 | 11,708 |
| | | | 308,613 |
| Automobiles - 2.1% | | | |
| Automobile Manufacturers - 2.1% | | | |
| Ferrari NV | | 2,300 | 241,132 |
| General Motors Co. | | 1,600 | 65,584 |
| Tesla, Inc. (a) | | 7,900 | 2,459,665 |
| Thor Industries, Inc. | | 2,700 | 406,944 |
| | | | 3,173,325 |
| Beverages - 0.8% | | | |
| Distillers & Vintners - 0.7% | | | |
| Constellation Brands, Inc. Class A (sub. vtg.) | | 4,800 | 1,097,136 |
| Soft Drinks - 0.1% | | | |
| Monster Beverage Corp. (a) | | 2,690 | 170,250 |
|
| TOTAL BEVERAGES | | | 1,267,386 |
|
| Building Products - 0.2% | | | |
| Building Products - 0.2% | | | |
| Masco Corp. | | 5,100 | 224,094 |
| Commercial Services & Supplies - 0.2% | | | |
| Diversified Support Services - 0.2% | | | |
| Copart, Inc. (a) | | 6,300 | 272,097 |
| Distributors - 0.7% | | | |
| Distributors - 0.7% | | | |
| LKQ Corp. (a) | | 20,700 | 841,869 |
| Pool Corp. | | 2,100 | 272,265 |
| | | | 1,114,134 |
| Diversified Consumer Services - 0.6% | | | |
| Education Services - 0.4% | | | |
| Adtalem Global Education, Inc. | | 3,200 | 134,560 |
| Grand Canyon Education, Inc. (a) | | 3,400 | 304,402 |
| New Oriental Education & Technology Group, Inc. sponsored ADR | | 1,900 | 178,600 |
| | | | 617,562 |
| Specialized Consumer Services - 0.2% | | | |
| Service Corp. International | | 2,200 | 82,104 |
| ServiceMaster Global Holdings, Inc. (a) | | 4,700 | 240,969 |
| | | | 323,073 |
|
| TOTAL DIVERSIFIED CONSUMER SERVICES | | | 940,635 |
|
| Food & Staples Retailing - 1.2% | | | |
| Food Distributors - 0.9% | | | |
| Performance Food Group Co. (a) | | 39,700 | 1,314,070 |
| Hypermarkets & Super Centers - 0.3% | | | |
| Costco Wholesale Corp. | | 1,000 | 186,120 |
| Wal-Mart Stores, Inc. | | 3,400 | 335,750 |
| | | | 521,870 |
|
| TOTAL FOOD & STAPLES RETAILING | | | 1,835,940 |
|
| Health Care Providers & Services - 0.0% | | | |
| Health Care Services - 0.0% | | | |
| National Vision Holdings, Inc. | | 1,600 | 64,976 |
| Hotels, Restaurants & Leisure - 24.9% | | | |
| Casinos & Gaming - 4.1% | | | |
| Boyd Gaming Corp. | | 6,300 | 220,815 |
| Caesars Entertainment Corp. (a) | | 22,900 | 289,685 |
| Churchill Downs, Inc. | | 1,400 | 325,780 |
| Eldorado Resorts, Inc. (a) | | 18,424 | 610,756 |
| Las Vegas Sands Corp. | | 35,159 | 2,443,199 |
| Melco Crown Entertainment Ltd. sponsored ADR | | 6,891 | 200,115 |
| MGM Mirage, Inc. | | 41,200 | 1,375,668 |
| Penn National Gaming, Inc. (a) | | 13,172 | 412,679 |
| Wynn Resorts Ltd. | | 1,800 | 303,462 |
| | | | 6,182,159 |
| Hotels, Resorts & Cruise Lines - 8.3% | | | |
| Bluegreen Corp. | | 21,100 | 385,286 |
| Carnival Corp. | | 17,000 | 1,128,290 |
| Hilton Grand Vacations, Inc. | | 11,611 | 487,081 |
| Hilton Worldwide Holdings, Inc. | | 34,000 | 2,715,240 |
| ILG, Inc. | | 5,800 | 165,184 |
| Marriott International, Inc. Class A | | 18,300 | 2,483,859 |
| Marriott Vacations Worldwide Corp. | | 6,000 | 811,260 |
| Royal Caribbean Cruises Ltd. | | 20,400 | 2,433,312 |
| Wyndham Worldwide Corp. | | 16,200 | 1,877,094 |
| | | | 12,486,606 |
| Leisure Facilities - 1.1% | | | |
| Cedar Fair LP (depositary unit) | | 2,000 | 129,980 |
| Drive Shack, Inc. | | 5,400 | 29,862 |
| Vail Resorts, Inc. | | 7,080 | 1,504,288 |
| | | | 1,664,130 |
| Restaurants - 11.4% | | | |
| ARAMARK Holdings Corp. | | 12,000 | 512,880 |
| Compass Group PLC | | 3,400 | 73,448 |
| Darden Restaurants, Inc. | | 9,300 | 892,986 |
| Del Taco Restaurants, Inc. (a) | | 3,000 | 36,360 |
| Domino's Pizza, Inc. | | 3,900 | 736,944 |
| Dunkin' Brands Group, Inc. | | 7,716 | 497,451 |
| Jack in the Box, Inc. | | 4,800 | 470,928 |
| McDonald's Corp. | | 35,700 | 6,144,684 |
| Restaurant Brands International, Inc. | | 11,600 | 713,072 |
| Ruth's Hospitality Group, Inc. | | 4,200 | 90,930 |
| Shake Shack, Inc. Class A (a) | | 4,600 | 198,720 |
| Starbucks Corp. | | 74,870 | 4,299,784 |
| Texas Roadhouse, Inc. Class A | | 8,000 | 421,440 |
| U.S. Foods Holding Corp. (a) | | 33,100 | 1,056,883 |
| Wingstop, Inc. | | 11,088 | 432,210 |
| Yum! Brands, Inc. | | 5,100 | 416,211 |
| | | | 16,994,931 |
|
| TOTAL HOTELS, RESTAURANTS & LEISURE | | | 37,327,826 |
|
| Household Durables - 2.3% | | | |
| Consumer Electronics - 0.0% | | | |
| Roku, Inc. Class A | | 7 | 362 |
| Home Furnishings - 0.3% | | | |
| Mohawk Industries, Inc. (a) | | 1,500 | 413,850 |
| Homebuilding - 1.9% | | | |
| Cavco Industries, Inc. (a) | | 1,300 | 198,380 |
| D.R. Horton, Inc. | | 21,600 | 1,103,112 |
| Lennar Corp.: | | | |
| Class A | | 11,900 | 752,556 |
| Class B | | 228 | 11,783 |
| LGI Homes, Inc. (a) | | 1,300 | 97,539 |
| NVR, Inc. (a) | | 100 | 350,822 |
| TRI Pointe Homes, Inc. (a) | | 17,600 | 315,392 |
| | | | 2,829,584 |
| Household Appliances - 0.1% | | | |
| Techtronic Industries Co. Ltd. | | 34,408 | 224,385 |
|
| TOTAL HOUSEHOLD DURABLES | | | 3,468,181 |
|
| Internet & Direct Marketing Retail - 20.7% | | | |
| Internet & Direct Marketing Retail - 20.7% | | | |
| Amazon.com, Inc. (a) | | 19,138 | 22,381,317 |
| Boohoo.Com PLC (a) | | 67,500 | 171,790 |
| Liberty Interactive Corp. QVC Group Series A (a) | | 29,800 | 727,716 |
| Netflix, Inc. (a) | | 19,200 | 3,685,632 |
| Priceline Group, Inc. (a) | | 2,300 | 3,996,802 |
| Wayfair LLC Class A (a)(b) | | 400 | 32,108 |
| YOOX SpA (a)(b) | | 1,800 | 62,891 |
| | | | 31,058,256 |
| Internet Software & Services - 1.1% | | | |
| Internet Software & Services - 1.1% | | | |
| 2U, Inc. (a) | | 6,505 | 419,638 |
| Alphabet, Inc. Class A (a) | | 800 | 842,720 |
| CarGurus, Inc. Class A | | 400 | 11,992 |
| Facebook, Inc. Class A (a) | | 2,200 | 388,212 |
| | | | 1,662,562 |
| IT Services - 0.4% | | | |
| Data Processing & Outsourced Services - 0.4% | | | |
| Global Payments, Inc. | | 2,200 | 220,528 |
| PayPal Holdings, Inc. (a) | | 5,000 | 368,100 |
| | | | 588,628 |
| Leisure Products - 0.6% | | | |
| Leisure Products - 0.6% | | | |
| Mattel, Inc. (b) | | 58,100 | 893,578 |
| Media - 14.2% | | | |
| Broadcasting - 0.1% | | | |
| CBS Corp. Class B | | 3,200 | 188,800 |
| Cable & Satellite - 8.4% | | | |
| Charter Communications, Inc. Class A (a) | | 17,877 | 6,005,957 |
| Comcast Corp. Class A | | 149,180 | 5,974,659 |
| DISH Network Corp. Class A (a) | | 3,900 | 186,225 |
| Naspers Ltd. Class N | | 1,540 | 429,545 |
| | | | 12,596,386 |
| Movies & Entertainment - 5.7% | | | |
| Cinemark Holdings, Inc. | | 17,500 | 609,350 |
| Liberty Media Corp. Liberty Formula One Group Series C (a) | | 4,100 | 140,056 |
| Lions Gate Entertainment Corp. Class B | | 600 | 19,044 |
| Live Nation Entertainment, Inc. (a) | | 4,700 | 200,079 |
| The Walt Disney Co. | | 60,757 | 6,531,985 |
| Time Warner, Inc. | | 8,800 | 804,936 |
| Twenty-First Century Fox, Inc. Class A | | 4,500 | 155,385 |
| | | | 8,460,835 |
|
| TOTAL MEDIA | | | 21,246,021 |
|
| Multiline Retail - 4.2% | | | |
| Department Stores - 0.1% | | | |
| Macy's, Inc. | | 5,500 | 138,545 |
| General Merchandise Stores - 4.1% | | | |
| B&M European Value Retail S.A. | | 48,129 | 275,261 |
| Dollar General Corp. | | 5,100 | 474,351 |
| Dollar Tree, Inc. (a) | | 48,900 | 5,247,459 |
| Ollie's Bargain Outlet Holdings, Inc. (a) | | 1,500 | 79,875 |
| | | | 6,076,946 |
|
| TOTAL MULTILINE RETAIL | | | 6,215,491 |
|
| Personal Products - 0.1% | | | |
| Personal Products - 0.1% | | | |
| Estee Lauder Companies, Inc. Class A | | 600 | 76,344 |
| Real Estate Management & Development - 0.1% | | | |
| Real Estate Services - 0.1% | | | |
| Redfin Corp. (b) | | 3,400 | 106,488 |
| Software - 0.2% | | | |
| Application Software - 0.1% | | | |
| Adobe Systems, Inc. (a) | | 600 | 105,144 |
| Home Entertainment Software - 0.1% | | | |
| Activision Blizzard, Inc. | | 2,300 | 145,636 |
|
| TOTAL SOFTWARE | | | 250,780 |
|
| Specialty Retail - 18.9% | | | |
| Apparel Retail - 4.9% | | | |
| Burlington Stores, Inc. (a) | | 12,300 | 1,513,269 |
| Inditex SA | | 4,783 | 166,313 |
| L Brands, Inc. | | 700 | 42,154 |
| Ross Stores, Inc. | | 35,382 | 2,839,406 |
| The Children's Place Retail Stores, Inc. | | 1,700 | 247,095 |
| TJX Companies, Inc. | | 33,117 | 2,532,126 |
| | | | 7,340,363 |
| Automotive Retail - 2.2% | | | |
| AutoZone, Inc. (a) | | 1,900 | 1,351,603 |
| O'Reilly Automotive, Inc. (a) | | 7,773 | 1,869,717 |
| | | | 3,221,320 |
| Home Improvement Retail - 11.3% | | | |
| Floor & Decor Holdings, Inc. Class A | | 3,500 | 170,380 |
| Home Depot, Inc. | | 66,200 | 12,546,886 |
| Lowe's Companies, Inc. | | 44,600 | 4,145,124 |
| | | | 16,862,390 |
| Specialty Stores - 0.5% | | | |
| Tiffany & Co., Inc. | | 1,200 | 124,740 |
| Ulta Beauty, Inc. | | 3,000 | 670,980 |
| | | | 795,720 |
|
| TOTAL SPECIALTY RETAIL | | | 28,219,793 |
|
| Technology Hardware, Storage & Peripherals - 0.4% | | | |
| Technology Hardware, Storage & Peripherals - 0.4% | | | |
| Apple, Inc. | | 3,600 | 609,228 |
| Textiles, Apparel & Luxury Goods - 4.7% | | | |
| Apparel, Accessories & Luxury Goods - 2.2% | | | |
| adidas AG | | 1,584 | 317,679 |
| Canada Goose Holdings, Inc. | | 5,300 | 167,433 |
| Carter's, Inc. | | 4,600 | 540,454 |
| G-III Apparel Group Ltd. (a) | | 4,400 | 162,316 |
| Kering SA | | 300 | 141,462 |
| LVMH Moet Hennessy - Louis Vuitton SA | | 1,429 | 419,419 |
| PVH Corp. | | 9,500 | 1,303,495 |
| Tapestry, Inc. | | 6,100 | 269,803 |
| | | | 3,322,061 |
| Footwear - 2.5% | | | |
| NIKE, Inc. Class B | | 58,970 | 3,688,574 |
|
| TOTAL TEXTILES, APPAREL & LUXURY GOODS | | | 7,010,635 |
|
| TOTAL COMMON STOCKS | | | |
| (Cost $105,523,104) | | | 148,081,555 |
|
| Money Market Funds - 2.1% | | | |
| Fidelity Cash Central Fund, 1.36% (c) | | 2,025,165 | 2,025,570 |
| Fidelity Securities Lending Cash Central Fund 1.36% (c)(d) | | 1,053,897 | 1,054,108 |
| TOTAL MONEY MARKET FUNDS | | | |
| (Cost $3,079,573) | | | 3,079,678 |
| TOTAL INVESTMENT IN SECURITIES - 101.0% | | | |
| (Cost $108,602,677) | | | 151,161,233 |
| NET OTHER ASSETS (LIABILITIES) - (1.0)% | | | (1,453,124) |
| NET ASSETS - 100% | | | $149,708,109 |
Legend
(a) Non-income producing
(b) Security or a portion of the security is on loan at period end.
(c) Affiliated fund that is generally available only to investment companies and other accounts managed by Fidelity Investments. The rate quoted is the annualized seven-day yield of the fund at period end. A complete unaudited listing of the fund's holdings as of its most recent quarter end is available upon request. In addition, each Fidelity Central Fund's financial statements, which are not covered by the Fund's Report of Independent Registered Public Accounting Firm, are available on the SEC's website or upon request.
(d) Investment made with cash collateral received from securities on loan.
Affiliated Central Funds
Information regarding fiscal year to date income earned by the Fund from investments in Fidelity Central Funds is as follows:
| Fund | Income earned |
| Fidelity Cash Central Fund | $14,009 |
| Fidelity Securities Lending Cash Central Fund | 38,614 |
| Total | $52,623 |
Amounts in the income column in the above table include any capital gain distributions from underlying funds, which are presented in the corresponding line-item in the Statement of Operations if applicable.
Investment Valuation
The following is a summary of the inputs used, as of December 31, 2017, involving the Fund's assets and liabilities carried at fair value. The inputs or methodology used for valuing securities may not be an indication of the risk associated with investing in those securities. For more information on valuation inputs, and their aggregation into the levels used below, please refer to the Investment Valuation section in the accompanying Notes to Financial Statements.
| | Valuation Inputs at Reporting Date: |
| Description | Total | Level 1 | Level 2 | Level 3 |
| Investments in Securities: | | | | |
| Common Stocks | $148,081,555 | $147,495,823 | $585,732 | $-- |
| Money Market Funds | 3,079,678 | 3,079,678 | -- | -- |
| Total Investments in Securities: | $151,161,233 | $150,575,501 | $585,732 | $-- |
The following is a summary of transfers between Level 1 and Level 2 for the period ended December 31, 2017. Transfers are assumed to have occurred at the beginning of the period, and are primarily attributable to the valuation techniques used for foreign equity securities, as discussed in the accompanying Notes to Financial Statements:
| Transfers | Total |
| Level 1 to Level 2 | $0 |
| Level 2 to Level 1 | $2,682,731 |
See accompanying notes which are an integral part of the financial statements.
Financial Statements
Statement of Assets and Liabilities
| | | December 31, 2017 |
| Assets | | |
Investment in securities, at value (including securities loaned of $1,032,781) — See accompanying schedule:
Unaffiliated issuers (cost $105,523,104) | $148,081,555 | |
| Fidelity Central Funds (cost $3,079,573) | 3,079,678 | |
| Total Investment in Securities (cost $108,602,677) | | $151,161,233 |
| Receivable for fund shares sold | | 201,168 |
| Dividends receivable | | 98,668 |
| Distributions receivable from Fidelity Central Funds | | 3,953 |
| Prepaid expenses | | 676 |
| Other receivables | | 5,505 |
| Total assets | | 151,471,203 |
| Liabilities | | |
| Payable for investments purchased | $579,507 | |
| Payable for fund shares redeemed | 186 | |
| Accrued management fee | 65,796 | |
| Other affiliated payables | 21,219 | |
| Other payables and accrued expenses | 42,926 | |
| Collateral on securities loaned | 1,053,460 | |
| Total liabilities | | 1,763,094 |
| Net Assets | | $149,708,109 |
| Net Assets consist of: | | |
| Paid in capital | | $100,854,105 |
| Undistributed net investment income | | 156,092 |
| Accumulated undistributed net realized gain (loss) on investments and foreign currency transactions | | 6,139,221 |
| Net unrealized appreciation (depreciation) on investments and assets and liabilities in foreign currencies | | 42,558,691 |
| Net Assets | | $149,708,109 |
| Initial Class: | | |
| Net Asset Value, offering price and redemption price per share ($22,057,161 ÷ 990,365 shares) | | $22.27 |
| Investor Class: | | |
| Net Asset Value, offering price and redemption price per share ($127,650,948 ÷ 5,747,081 shares) | | $22.21 |
See accompanying notes which are an integral part of the financial statements.
Statement of Operations
| | | Year ended December 31, 2017 |
| Investment Income | | |
| Dividends | | $1,790,926 |
| Interest | | 8,517 |
| Income from Fidelity Central Funds | | 52,623 |
| Total income | | 1,852,066 |
| Expenses | | |
| Management fee | $785,088 | |
| Transfer agent fees | 194,198 | |
| Accounting and security lending fees | 56,732 | |
| Custodian fees and expenses | 14,351 | |
| Independent trustees' fees and expenses | 3,312 | |
| Audit | 53,227 | |
| Legal | 2,982 | |
| Miscellaneous | 8,159 | |
| Total expenses before reductions | 1,118,049 | |
| Expense reductions | (10,530) | 1,107,519 |
| Net investment income (loss) | | 744,547 |
| Realized and Unrealized Gain (Loss) | | |
| Net realized gain (loss) on: | | |
| Investment securities: | | |
| Unaffiliated issuers | 8,901,632 | |
| Fidelity Central Funds | 411 | |
| Foreign currency transactions | 4,711 | |
| Total net realized gain (loss) | | 8,906,754 |
| Change in net unrealized appreciation (depreciation) on: | | |
| Investment securities: | | |
| Unaffiliated issuers | 18,884,041 | |
| Fidelity Central Funds | (195) | |
| Assets and liabilities in foreign currencies | 1,349 | |
| Total change in net unrealized appreciation (depreciation) | | 18,885,195 |
| Net gain (loss) | | 27,791,949 |
| Net increase (decrease) in net assets resulting from operations | | $28,536,496 |
See accompanying notes which are an integral part of the financial statements.
Statement of Changes in Net Assets
| | Year ended December 31, 2017 | Year ended December 31, 2016 |
| Increase (Decrease) in Net Assets | | |
| Operations | | |
| Net investment income (loss) | $744,547 | $1,305,034 |
| Net realized gain (loss) | 8,906,754 | (1,793,020) |
| Change in net unrealized appreciation (depreciation) | 18,885,195 | 6,462,693 |
| Net increase (decrease) in net assets resulting from operations | 28,536,496 | 5,974,707 |
| Distributions to shareholders from net investment income | (694,426) | (1,035,303) |
| Distributions to shareholders from net realized gain | – | (3,068,756) |
| Total distributions | (694,426) | (4,104,059) |
| Share transactions - net increase (decrease) | (26,089,645) | (61,945,625) |
| Redemption fees | 6,759 | 48,581 |
| Total increase (decrease) in net assets | 1,759,184 | (60,026,396) |
| Net Assets | | |
| Beginning of period | 147,948,925 | 207,975,321 |
| End of period | $149,708,109 | $147,948,925 |
| Other Information | | |
| Undistributed net investment income end of period | $156,092 | $244,854 |
See accompanying notes which are an integral part of the financial statements.
Financial Highlights
VIP Consumer Discretionary Portfolio Initial Class
| Years ended December 31, | 2017 | 2016 | 2015 | 2014 | 2013 |
| Selected Per–Share Data | | | | | |
| Net asset value, beginning of period | $18.33 | $17.88 | $19.01 | $18.54 | $14.24 |
| Income from Investment Operations | | | | | |
| Net investment income (loss)A | .12 | .15 | .13 | .08 | .03 |
| Net realized and unrealized gain (loss) | 3.93 | .73 | .73 | 1.59 | 5.58 |
| Total from investment operations | 4.05 | .88 | .86 | 1.67 | 5.61 |
| Distributions from net investment income | (.11) | (.14) | (.09) | (.10) | (.02) |
| Distributions from net realized gain | – | (.30) | (1.91) | (1.11) | (1.30) |
| Total distributions | (.11) | (.44) | (2.00) | (1.20)B | (1.32) |
| Redemption fees added to paid in capitalA | –C | .01 | .01 | –C | .01 |
| Net asset value, end of period | $22.27 | $18.33 | $17.88 | $19.01 | $18.54 |
| Total ReturnD,E | 22.16% | 5.24% | 4.71% | 9.64% | 41.10% |
| Ratios to Average Net AssetsF,G | | | | | |
| Expenses before reductions | .71% | .70% | .70% | .72% | .76% |
| Expenses net of fee waivers, if any | .71% | .70% | .70% | .72% | .75% |
| Expenses net of all reductions | .70% | .70% | .69% | .71% | .75% |
| Net investment income (loss) | .58% | .86% | .69% | .45% | .16% |
| Supplemental Data | | | | | |
| Net assets, end of period (000 omitted) | $22,057 | $23,677 | $42,048 | $21,446 | $32,004 |
| Portfolio turnover rateH | 81% | 43% | 46% | 129% | 122% |
A Calculated based on average shares outstanding during the period.
B Total distributions of $1.20 per share is comprised of distributions from net investment income of $0.097 and distributions from net realized gain of $1.106 per share.
C Amount represents less than $.005 per share.
D Total returns do not reflect charges attributable to your insurance company's separate account. Inclusion of these charges would reduce the total returns shown.
E Total returns would have been lower if certain expenses had not been reduced during the applicable periods shown.
F Fees and expenses of any underlying Fidelity Central Funds are not included in the Fund's expense ratio. The Fund indirectly bears its proportionate share of the expenses of any underlying Fidelity Central Funds.
G Expense ratios reflect operating expenses of the class. Expenses before reductions do not reflect amounts reimbursed by the investment adviser or reductions from brokerage service arrangements or reductions from other expense offset arrangements and do not represent the amount paid by the class during periods when reimbursements or reductions occur. Expenses net of fee waivers reflect expenses after reimbursement by the investment adviser but prior to reductions from brokerage service arrangements or other expense offset arrangements. Expenses net of all reductions represent the net expenses paid by the class.
H Amount does not include the portfolio activity of any underlying Fidelity Central Funds.
See accompanying notes which are an integral part of the financial statements.
VIP Consumer Discretionary Portfolio Investor Class
| Years ended December 31, | 2017 | 2016 | 2015 | 2014 | 2013 |
| Selected Per–Share Data | | | | | |
| Net asset value, beginning of period | $18.28 | $17.84 | $18.97 | $18.50 | $14.21 |
| Income from Investment Operations | | | | | |
| Net investment income (loss)A | .10 | .14 | .11 | .07 | .01 |
| Net realized and unrealized gain (loss) | 3.93 | .71 | .74 | 1.59 | 5.58 |
| Total from investment operations | 4.03 | .85 | .85 | 1.66 | 5.59 |
| Distributions from net investment income | (.10) | (.13) | (.08) | (.08) | (.01) |
| Distributions from net realized gain | – | (.30) | (1.91) | (1.11) | (1.30) |
| Total distributions | (.10) | (.42)B | (1.99) | (1.19) | (1.31) |
| Redemption fees added to paid in capitalA | –C | .01 | .01 | –C | .01 |
| Net asset value, end of period | $22.21 | $18.28 | $17.84 | $18.97 | $18.50 |
| Total ReturnD,E | 22.07% | 5.12% | 4.66% | 9.58% | 41.05% |
| Ratios to Average Net AssetsF,G | | | | | |
| Expenses before reductions | .79% | .78% | .78% | .80% | .83% |
| Expenses net of fee waivers, if any | .79% | .78% | .77% | .79% | .83% |
| Expenses net of all reductions | .78% | .78% | .77% | .78% | .83% |
| Net investment income (loss) | .50% | .78% | .61% | .38% | .08% |
| Supplemental Data | | | | | |
| Net assets, end of period (000 omitted) | $127,651 | $124,272 | $165,927 | $86,882 | $109,697 |
| Portfolio turnover rateH | 81% | 43% | 46% | 129% | 122% |
A Calculated based on average shares outstanding during the period.
B Total distributions of $.42 per share is comprised of distributions from net investment income of $.125 and distributions from net realized gain of $.298 per share.
C Amount represents less than $.005 per share.
D Total returns do not reflect charges attributable to your insurance company's separate account. Inclusion of these charges would reduce the total returns shown.
E Total returns would have been lower if certain expenses had not been reduced during the applicable periods shown.
F Fees and expenses of any underlying Fidelity Central Funds are not included in the Fund's expense ratio. The Fund indirectly bears its proportionate share of the expenses of any underlying Fidelity Central Funds.
G Expense ratios reflect operating expenses of the class. Expenses before reductions do not reflect amounts reimbursed by the investment adviser or reductions from brokerage service arrangements or reductions from other expense offset arrangements and do not represent the amount paid by the class during periods when reimbursements or reductions occur. Expenses net of fee waivers reflect expenses after reimbursement by the investment adviser but prior to reductions from brokerage service arrangements or other expense offset arrangements. Expenses net of all reductions represent the net expenses paid by the class.
H Amount does not include the portfolio activity of any underlying Fidelity Central Funds.
See accompanying notes which are an integral part of the financial statements.
Notes to Financial Statements
For the period ended December 31, 2017
1. Organization.
VIP Consumer Discretionary Portfolio (the Fund) is a non-diversified fund of Variable Insurance Products Fund IV (the Trust) and is authorized to issue an unlimited number of shares. The Trust is registered under the Investment Company Act of 1940, as amended (the 1940 Act), as an open-end management investment company organized as a Massachusetts business trust. Shares of the Fund may only be purchased by insurance companies for the purpose of funding variable annuity or variable life insurance contracts. The Fund offers the following classes of shares: Initial Class shares and Investor Class shares. All classes have equal rights and voting privileges, except for matters affecting a single class.
2. Investments in Fidelity Central Funds.
The Fund invests in Fidelity Central Funds, which are open-end investment companies generally available only to other investment companies and accounts managed by the investment adviser and its affiliates. The Fund's Schedule of Investments lists each of the Fidelity Central Funds held as of period end, if any, as an investment of the Fund, but does not include the underlying holdings of each Fidelity Central Fund. As an Investing Fund, the Fund indirectly bears its proportionate share of the expenses of the underlying Fidelity Central Funds.
The Money Market Central Funds seek preservation of capital and current income and are managed by Fidelity Investments Money Management, Inc. (FIMM), an affiliate of the investment adviser. Annualized expenses of the Money Market Central Funds as of their most recent shareholder report date are less than .005%.
A complete unaudited list of holdings for each Fidelity Central Fund is available upon request or at the Securities and Exchange Commission (the SEC) website at www.sec.gov. In addition, the financial statements of the Fidelity Central Funds, which are not covered by the Fund's Report of Independent Registered Public Accounting Firm, are available on the SEC website or upon request.
3. Significant Accounting Policies.
The Fund is an investment company and applies the accounting and reporting guidance of the Financial Accounting Standards Board (FASB) Accounting Standards Codification Topic 946 Financial Services – Investments Companies. The financial statements have been prepared in conformity with accounting principles generally accepted in the United States of America (GAAP), which require management to make certain estimates and assumptions at the date of the financial statements. Actual results could differ from those estimates. Subsequent events, if any, through the date that the financial statements were issued have been evaluated in the preparation of the financial statements. The following summarizes the significant accounting policies of the Fund:
Investment Valuation. Investments are valued as of 4:00 p.m. Eastern time on the last calendar day of the period. The Board of Trustees (the Board) has delegated the day to day responsibility for the valuation of the Fund's investments to the Fair Value Committee (the Committee) established by the Fund's investment adviser. In accordance with valuation policies and procedures approved by the Board, the Fund attempts to obtain prices from one or more third party pricing vendors or brokers to value its investments. When current market prices, quotations or currency exchange rates are not readily available or reliable, investments will be fair valued in good faith by the Committee, in accordance with procedures adopted by the Board. Factors used in determining fair value vary by investment type and may include market or investment specific events, changes in interest rates and credit quality. The frequency with which these procedures are used cannot be predicted and they may be utilized to a significant extent. The Committee oversees the Fund's valuation policies and procedures and reports to the Board on the Committee's activities and fair value determinations. The Board monitors the appropriateness of the procedures used in valuing the Fund's investments and ratifies the fair value determinations of the Committee.
The Fund categorizes the inputs to valuation techniques used to value its investments into a disclosure hierarchy consisting of three levels as shown below:
- Level 1 – quoted prices in active markets for identical investments
- Level 2 – other significant observable inputs (including quoted prices for similar investments, interest rates, prepayment speeds, etc.)
- Level 3 – unobservable inputs (including the Fund's own assumptions based on the best information available)
Valuation techniques used to value the Fund's investments by major category are as follows:
Equity securities, including restricted securities, for which market quotations are readily available, are valued at the last reported sale price or official closing price as reported by a third party pricing vendor on the primary market or exchange on which they are traded and are categorized as Level 1 in the hierarchy. In the event there were no sales during the day or closing prices are not available, securities are valued at the last quoted bid price or may be valued using the last available price and are generally categorized as Level 2 in the hierarchy. For foreign equity securities, when market or security specific events arise, comparisons to the valuation of American Depositary Receipts (ADRs), futures contracts, Exchange-Traded Funds (ETFs) and certain indexes as well as quoted prices for similar securities may be used and would be categorized as Level 2 in the hierarchy. Utilizing these techniques may result in transfers between Level 1 and Level 2. For equity securities, including restricted securities, where observable inputs are limited, assumptions about market activity and risk are used and these securities may be categorized as Level 3 in the hierarchy.
Investments in open-end mutual funds, including the Fidelity Central Funds, are valued at their closing net asset value (NAV) each business day and are categorized as Level 1 in the hierarchy.
Changes in valuation techniques may result in transfers in or out of an assigned level within the disclosure hierarchy. The aggregate value of investments by input level as of December 31, 2017, including information on transfers between Levels 1 and 2 is included at the end of the Fund's Schedule of Investments.
Foreign Currency. The Fund may use foreign currency contracts to facilitate transactions in foreign-denominated securities. Gains and losses from these transactions may arise from changes in the value of the foreign currency or if the counterparties do not perform under the contracts' terms.
Foreign-denominated assets, including investment securities, and liabilities are translated into U.S. dollars at the exchange rates at period end. Purchases and sales of investment securities, income and dividends received and expenses denominated in foreign currencies are translated into U.S. dollars at the exchange rate in effect on the transaction date.
The effects of exchange rate fluctuations on investments are included with the net realized and unrealized gain (loss) on investment securities. Other foreign currency transactions resulting in realized and unrealized gain (loss) are disclosed separately.
Investment Transactions and Income. For financial reporting purposes, the Fund's investment holdings and NAV include trades executed through the end of the last business day of the period. The NAV per share for processing shareholder transactions is calculated as of the close of business of the New York Stock Exchange (NYSE), normally 4:00 p.m. Eastern time and includes trades executed through the end of the prior business day. Gains and losses on securities sold are determined on the basis of identified cost and includes proceeds received from litigation. Dividend income is recorded on the ex-dividend date, except for certain dividends from foreign securities where the ex-dividend date may have passed, which are recorded as soon as the Fund is informed of the ex-dividend date. Non-cash dividends included in dividend income, if any, are recorded at the fair market value of the securities received. Income and capital gain distributions from Fidelity Central Funds, if any, are recorded on the ex-dividend date. Certain distributions received by the Fund represent a return of capital or capital gain. The Fund determines the components of these distributions subsequent to the ex-dividend date, based upon receipt of tax filings or other correspondence relating to the underlying investment. These distributions are recorded as a reduction of cost of investments and/or as a realized gain. Interest income is accrued as earned and includes coupon interest and amortization of premium and accretion of discount on debt securities as applicable. Investment income is recorded net of foreign taxes withheld where recovery of such taxes is uncertain.
Class Allocations and Expenses. Investment income, realized and unrealized capital gains and losses, common expenses of the Fund, and certain fund-level expense reductions, if any, are allocated daily on a pro-rata basis to each class based on the relative net assets of each class to the total net assets of the Fund. Each class differs with respect to transfer agent fees incurred. Certain expense reductions may also differ by class. For the reporting period, the allocated portion of income and expenses to each class as a percent of its average net assets may vary due to the timing of recording these transactions in relation to fluctuating net assets of the classes. Expenses directly attributable to a fund are charged to that fund. Expenses attributable to more than one fund are allocated among the respective funds on the basis of relative net assets or other appropriate methods. Expense estimates are accrued in the period to which they relate and adjustments are made when actual amounts are known.
Income Tax Information and Distributions to Shareholders. Each year, the Fund intends to qualify as a regulated investment company under Subchapter M of the Internal Revenue Code, including distributing substantially all of its taxable income and realized gains. As a result, no provision for U.S. Federal income taxes is required. As of December 31, 2017, the Fund did not have any unrecognized tax benefits in the financial statements; nor is the Fund aware of any tax positions for which it is reasonably possible that the total amounts of unrecognized tax benefits will significantly change in the next twelve months. The Fund files a U.S. federal tax return, in addition to state and local tax returns as required. The Fund's federal income tax returns are subject to examination by the Internal Revenue Service (IRS) for a period of three fiscal years after they are filed. State and local tax returns may be subject to examination for an additional fiscal year depending on the jurisdiction. Foreign taxes are provided for based on the Fund's understanding of the tax rules and rates that exist in the foreign markets in which it invests.
Distributions are declared and recorded on the ex-dividend date. Income dividends and capital gain distributions are declared separately for each class. Income and capital gain distributions are determined in accordance with income tax regulations, which may differ from GAAP.
Capital accounts within the financial statements are adjusted for permanent book-tax differences. These adjustments have no impact on net assets or the results of operations. Capital accounts are not adjusted for temporary book-tax differences which will reverse in a subsequent period.
Book-tax differences are primarily due to foreign currency transactions, partnerships, capital loss carryforwards, and losses deferred due to wash sales.
As of period end, the cost and unrealized appreciation (depreciation) in securities, and derivatives if applicable, for federal income tax purposes were as follows:
| Gross unrealized appreciation | $44,248,824 |
| Gross unrealized depreciation | (1,863,893) |
| Net unrealized appreciation (depreciation) | $42,384,931 |
| Tax Cost | $108,776,302 |
The tax-based components of distributable earnings as of period end were as follows:
| Undistributed ordinary income | $156,092 |
| Undistributed long-term capital gain | $6,312,845 |
| Net unrealized appreciation (depreciation) on securities and other investments | $42,385,066 |
The tax character of distributions paid was as follows:
| | December 31, 2017 | December 31, 2016 |
| Ordinary Income | $694,426 | $ 1,035,303 |
| Long-term Capital Gains | – | 3,068,756 |
| Total | $694,426 | $ 4,104,059 |
Trading (Redemption) Fees. Shares held by investors less than 60 days may be subject to a redemption fee equal to 1% of the NAV of shares redeemed. All redemption fees, which reduce the proceeds of the shareholder redemption, are retained by the Fund and accounted for as an addition to paid in capital. In November 2017, the Board of Trustees approved the elimination of these redemption fees effective December 18, 2017.
4. Purchases and Sales of Investments.
Purchases and sales of securities, other than short-term securities, aggregated $115,920,107 and $142,596,022, respectively.
5. Fees and Other Transactions with Affiliates.
Management Fee. Fidelity SelectCo, LLC (the investment adviser) and its affiliates provide the Fund with investment management related services for which the Fund pays a monthly management fee. The management fee is the sum of an individual fund fee rate that is based on an annual rate of .30% of the Fund's average net assets and an annualized group fee rate that averaged .24% during the period. The group fee rate is based upon the average net assets of all the mutual funds advised by Fidelity Management & Research Company (FMR) and the investment adviser. The group fee rate decreases as assets under management increase and increases as assets under management decrease. For the reporting period, the total annual management fee rate was .54% of the Fund's average net assets.
Transfer Agent Fees. Fidelity Investments Institutional Operations Company, Inc. (FIIOC), an affiliate of the investment adviser, is the Fund's transfer, dividend disbursing, and shareholder servicing agent. FIIOC receives an asset-based fee with respect to each class. Each class pays a fee for transfer agent services, typesetting and printing and mailing of shareholder reports, excluding mailing of proxy statements, equal to an annual rate of class-level average net assets. The annual rate for Investor Class is .15% and the annual rate for all other classes is .07%. For the period, transfer agent fees for each class were as follows:
| Initial Class | $14,375 |
| Investor Class | 179,823 |
| | $194,198 |
Accounting and Security Lending Fees. Fidelity Service Company, Inc. (FSC), an affiliate of the investment adviser, maintains the Fund's accounting records. The accounting fee is based on the level of average net assets for each month. Under a separate contract, FSC administers the security lending program. The security lending fee is based on the number and duration of lending transactions.
Brokerage Commissions. The Fund placed a portion of its portfolio transactions with brokerage firms which are affiliates of the investment adviser. Brokerage commissions are included in net realized gain (loss) and change in net unrealized appreciation (depreciation) in the Statement of Operations. The commissions paid to these affiliated firms were $2,356 for the period.
Interfund Trades. The Fund may purchase from or sell securities to other Fidelity Funds under procedures adopted by the Board. The procedures have been designed to ensure these interfund trades are executed in accordance with Rule 17a-7 of the 1940 Act. Interfund trades are included within the respective purchases and sales amounts shown in the Purchases and Sales of Investments note.
6. Committed Line of Credit.
The Fund participates with other funds managed by the investment adviser or an affiliate in a $4.25 billion credit facility (the "line of credit") to be utilized for temporary or emergency purposes to fund shareholder redemptions or for other short-term liquidity purposes. The Fund has agreed to pay commitment fees on its pro-rata portion of the line of credit, which amounted to $475 and is reflected in Miscellaneous expenses on the Statement of Operations. During the period, the Fund did not borrow on this line of credit.
7. Security Lending.
The Fund lends portfolio securities through a lending agent from time to time in order to earn additional income. On the settlement date of the loan, the Fund receives collateral (in the form of U.S. Treasury obligations, letters of credit and/or cash) against the loaned securities and maintains collateral in an amount not less than 100% of the market value of the loaned securities during the period of the loan. The market value of the loaned securities is determined at the close of business of the Fund and any additional required collateral is delivered to the Fund on the next business day. The Fund or borrower may terminate the loan at any time, and if the borrower defaults on its obligation to return the securities loaned because of insolvency or other reasons, the Fund may apply collateral received from the borrower against the obligation. The Fund may experience delays and costs in recovering the securities loaned. Any cash collateral received is invested in the Fidelity Securities Lending Cash Central Fund. The value of loaned securities and cash collateral at period end are disclosed on the Fund's Statement of Assets and Liabilities. Security lending income represents the income earned on investing cash collateral, less rebates paid to borrowers and any lending agent fees associated with the loan, plus any premium payments received for lending certain types of securities. Security lending income is presented in the Statement of Operations as a component of income from Fidelity Central Funds. Total security lending income during the period amounted to $38,614.
8. Expense Reductions.
Commissions paid to certain brokers with whom the investment adviser, or its affiliates, places trades on behalf of the Fund include an amount in addition to trade execution, which may be rebated back to the Fund to offset certain expenses. This amount totaled $9,007 for the period.
In addition, during the period the investment adviser reimbursed and/or waived a portion of fund-level operating expenses in the amount of $1,523.
9. Distributions to Shareholders.
Distributions to shareholders of each class were as follows:
| | Year ended
December 31, 2017 | Year ended December 31, 2016 |
| From net investment income | | |
| Initial Class | $117,886 | $177,534 |
| Investor Class | 576,540 | 857,769 |
| Total | $694,426 | $1,035,303 |
| From net realized gain | | |
| Initial Class | $– | $586,354 |
| Investor Class | – | 2,482,402 |
| Total | $– | $3,068,756 |
10. Share Transactions.
Transactions for each class of shares were as follows:
| | Shares | Shares | Dollars | Dollars |
| | Year ended December 31, 2017 | Year ended December 31, 2016 | Year ended December 31, 2017 | Year ended December 31, 2016 |
| Initial Class | | | | |
| Shares sold | 115,416 | 122,020 | $2,361,729 | $2,169,098 |
| Reinvestment of distributions | 5,687 | 46,901 | 117,886 | 763,888 |
| Shares redeemed | (422,794) | (1,228,235) | (8,310,561) | (21,325,956) |
| Net increase (decrease) | (301,691) | (1,059,314) | $(5,830,946) | $(18,392,970) |
| Investor Class | | | | |
| Shares sold | 598,518 | 609,221 | $12,226,919 | $10,778,576 |
| Reinvestment of distributions | 27,972 | 204,746 | 576,540 | 3,340,171 |
| Shares redeemed | (1,679,200) | (3,316,240) | (33,062,158) | (57,671,402) |
| Net increase (decrease) | (1,052,710) | (2,502,273) | $(20,258,699) | $(43,552,655) |
11. Other.
The Fund's organizational documents provide former and current trustees and officers with a limited indemnification against liabilities arising in connection with the performance of their duties to the Fund. In the normal course of business, the Fund may also enter into contracts that provide general indemnifications. The Fund's maximum exposure under these arrangements is unknown as this would be dependent on future claims that may be made against the Fund. The risk of material loss from such claims is considered remote.
At the end of the period, the investment adviser or its affiliates were the owners of record of 100% of the total outstanding shares of the Fund.
Report of Independent Registered Public Accounting Firm
To the Board of Trustees of Variable Insurance Products Fund IV and Shareholders of VIP Consumer Discretionary Portfolio:
Opinion on the Financial Statements
We have audited the accompanying statement of assets and liabilities, including the schedule of investments, of VIP Consumer Discretionary Portfolio (one of the funds constituting Variable Insurance Products Fund IV, referred to hereafter as the “Fund”) as of December 31, 2017, the related statements of operations for the year ended December 31, 2017, the statement of changes in net assets for each of the two years in the period ended December 31, 2017, including the related notes, and the financial highlights for each of the five years in the period ended December 31, 2017 (collectively referred to as the “financial statements”). In our opinion, the financial statements present fairly, in all material respects, the financial position of the Fund as of December 31, 2017, the results of its operations for the year then ended, the changes in its net assets for each of the two years in the period ended December 31, 2017 and the financial highlights for each of the five years in the period ended December 31, 2017 in conformity with accounting principles generally accepted in the United States of America.
Basis for Opinion
These financial statements are the responsibility of the Fund’s management. Our responsibility is to express an opinion on the Fund’s financial statements based on our audits. We are a public accounting firm registered with the Public Company Accounting Oversight Board (United States) (“PCAOB”) and are required to be independent with respect to the Fund in accordance with the U.S. federal securities laws and the applicable rules and regulations of the Securities and Exchange Commission and the PCAOB.
We conducted our audits of these financial statements in accordance with the standards of the PCAOB. Those standards require that we plan and perform the audit to obtain reasonable assurance about whether the financial statements are free of material misstatement, whether due to error or fraud.
Our audits included performing procedures to assess the risks of material misstatement of the financial statements, whether due to error or fraud, and performing procedures that respond to those risks. Such procedures included examining, on a test basis, evidence regarding the amounts and disclosures in the financial statements. Our audits also included evaluating the accounting principles used and significant estimates made by management, as well as evaluating the overall presentation of the financial statements. Our procedures included confirmation of securities owned as of December 31, 2017 by correspondence with the custodian and brokers; when replies were not received from brokers, we performed other auditing procedures. We believe that our audits provide a reasonable basis for our opinion.
PricewaterhouseCoopers LLP
Boston, Massachusetts
February 15, 2018
We have served as the auditor of one or more investment companies in the Fidelity group of funds since 1932.
Trustees and Officers
The Trustees, Members of the Advisory Board (if any), and officers of the trust and fund, as applicable, are listed below. The Board of Trustees governs the fund and is responsible for protecting the interests of shareholders. The Trustees are experienced executives who meet periodically throughout the year to oversee the fund's activities, review contractual arrangements with companies that provide services to the fund, oversee management of the risks associated with such activities and contractual arrangements, and review the fund's performance. Each of the Trustees oversees 91 funds.
The Trustees hold office without limit in time except that (a) any Trustee may resign; (b) any Trustee may be removed by written instrument, signed by at least two-thirds of the number of Trustees prior to such removal; (c) any Trustee who requests to be retired or who has become incapacitated by illness or injury may be retired by written instrument signed by a majority of the other Trustees; and (d) any Trustee may be removed at any special meeting of shareholders by a two-thirds vote of the outstanding voting securities of the trust. Each Trustee who is not an interested person (as defined in the 1940 Act) of the trust and the fund is referred to herein as an Independent Trustee. Each Independent Trustee shall retire not later than the last day of the calendar year in which his or her 75th birthday occurs. The Independent Trustees may waive this mandatory retirement age policy with respect to individual Trustees. Officers and Advisory Board Members hold office without limit in time, except that any officer or Advisory Board Member may resign or may be removed by a vote of a majority of the Trustees at any regular meeting or any special meeting of the Trustees. Except as indicated, each individual has held the office shown or other offices in the same company for the past five years.
The fund’s Statement of Additional Information (SAI) includes more information about the Trustees. To request a free copy, call Fidelity at 1-877-208-0098.
Experience, Skills, Attributes, and Qualifications of the Trustees. The Governance and Nominating Committee has adopted a statement of policy that describes the experience, qualifications, attributes, and skills that are necessary and desirable for potential Independent Trustee candidates (Statement of Policy). The Board believes that each Trustee satisfied at the time he or she was initially elected or appointed a Trustee, and continues to satisfy, the standards contemplated by the Statement of Policy. The Governance and Nominating Committee also engages professional search firms to help identify potential Independent Trustee candidates who have the experience, qualifications, attributes, and skills consistent with the Statement of Policy. From time to time, additional criteria based on the composition and skills of the current Independent Trustees, as well as experience or skills that may be appropriate in light of future changes to board composition, business conditions, and regulatory or other developments, have also been considered by the professional search firms and the Governance and Nominating Committee. In addition, the Board takes into account the Trustees' commitment and participation in Board and committee meetings, as well as their leadership of standing and ad hoc committees throughout their tenure.
In determining that a particular Trustee was and continues to be qualified to serve as a Trustee, the Board has considered a variety of criteria, none of which, in isolation, was controlling. The Board believes that, collectively, the Trustees have balanced and diverse experience, qualifications, attributes, and skills, which allow the Board to operate effectively in governing the fund and protecting the interests of shareholders. Information about the specific experience, skills, attributes, and qualifications of each Trustee, which in each case led to the Board's conclusion that the Trustee should serve (or continue to serve) as a trustee of the fund, is provided below.
Board Structure and Oversight Function. Brian B. Hogan is an interested person and currently serves as Chairman. The Trustees have determined that an interested Chairman is appropriate and benefits shareholders because an interested Chairman has a personal and professional stake in the quality and continuity of services provided to the fund. Independent Trustees exercise their informed business judgment to appoint an individual of their choosing to serve as Chairman, regardless of whether the Trustee happens to be independent or a member of management. The Independent Trustees have determined that they can act independently and effectively without having an Independent Trustee serve as Chairman and that a key structural component for assuring that they are in a position to do so is for the Independent Trustees to constitute a substantial majority for the Board. The Independent Trustees also regularly meet in executive session. Michael E. Wiley serves as Chairman of the Independent Trustees and as such (i) acts as a liaison between the Independent Trustees and management with respect to matters important to the Independent Trustees and (ii) with management prepares agendas for Board meetings.
Fidelity® funds are overseen by different Boards of Trustees. The fund's Board oversees Fidelity's sector portfolios. Other Boards oversee Fidelity's equity and high income funds, and Fidelity's investment grade bond, money market, and asset allocation funds. The use of separate Boards, each with its own committee structure, allows the Trustees of each group of Fidelity® funds to focus on the unique issues of the funds they oversee, including common research, investment, and operational issues. On occasion, the separate Boards establish joint committees to address issues of overlapping consequences for the Fidelity® funds overseen by each Board.
The Trustees operate using a system of committees to facilitate the timely and efficient consideration of all matters of importance to the Trustees, the fund, and fund shareholders and to facilitate compliance with legal and regulatory requirements and oversight of the fund's activities and associated risks. The Board, acting through its committees, has charged SelectCo and its affiliates with (i) identifying events or circumstances the occurrence of which could have demonstrably adverse effects on the fund's business and/or reputation; (ii) implementing processes and controls to lessen the possibility that such events or circumstances occur or to mitigate the effects of such events or circumstances if they do occur; and (iii) creating and maintaining a system designed to evaluate continuously business and market conditions in order to facilitate the identification and implementation processes described in (i) and (ii) above. Because the day-to-day operations and activities of the fund are carried out by or through SelectCo, its affiliates, and other service providers, the fund's exposure to risks is mitigated but not eliminated by the processes overseen by the Trustees. While each of the Board's committees has responsibility for overseeing different aspects of the fund's activities, oversight is exercised primarily through the Operations and Audit Committees. Appropriate personnel, including but not limited to the fund's Chief Compliance Officer (CCO), SelectCo's internal auditor, the independent accountants, the fund's Treasurer and portfolio management personnel, make periodic reports to the Board's committees, as appropriate. The responsibilities of each standing committee, including their oversight responsibilities, are described further under "Standing Committees of the Trustees."
Interested Trustees*:
Correspondence intended for a Trustee who is an interested person may be sent to Fidelity Investments, 245 Summer Street, Boston, Massachusetts 02210.
Name, Year of Birth; Principal Occupations and Other Relevant Experience+
Brian B. Hogan (1964)
Year of Election or Appointment: 2014
Trustee
Chairman of the Board of Trustees
Mr. Hogan also serves as Trustee or Vice President of other funds. Mr. Hogan serves as a Director of FMR Investment Management (UK) Limited (investment adviser firm, 2015-present) and Fidelity SelectCo, LLC (investment adviser firm, 2014-present) and President of the Equity Division of FMR (investment adviser firm, 2009-present). Previously, Mr. Hogan served as Senior Vice President, Equity Research of FMR (2006-2009) and as a portfolio manager. Mr. Brian B. Hogan is not related to Mr. Colm A. Hogan.
* Determined to be an "Interested Trustee" by virtue of, among other things, his or her affiliation with the trust or various entities under common control with SelectCo.
+ The information includes the Trustee's principal occupation during the last five years and other information relating to the experience, attributes, and skills relevant to the Trustee's qualifications to serve as a Trustee, which led to the conclusion that the Trustee should serve as a Trustee for the fund.
Independent Trustees:
Correspondence intended for an Independent Trustee may be sent to Fidelity Investments, P.O. Box 55235, Boston, Massachusetts 02205-5235.
Name, Year of Birth; Principal Occupations and Other Relevant Experience+
David A. Rosow (1942)
Year of Election or Appointment: 2013
Trustee
Mr. Rosow also serves as Trustee of other Fidelity® funds. Prior to his retirement in 2006, Mr. Rosow was the Chief Executive Officer, owner and operator of a number of private companies, which encompassed the oil refining, drilling and marketing of petroleum products (including specialty petroleum products), recreation industry, and real estate development. Mr. Rosow currently serves as a Director of Oxbow Carbon LLC (upgraders, marketers, and distributors of petroleum byproducts of the oil refining process, 2015-present) and Oxbridge Academy of the Palm Beaches (2015-present) and serves as its President and CEO. Previously, Mr. Rosow served on the Fairfield Country Day School Board for 27 years, including as its President for 3 years, stepping down in 2006. Mr. Rosow served as Lead Director and Chairman of the Audit Committee of Hudson United Bancorp (1996-2006), Chairman of the Board of Westport Bank and Trust (1992-1996), and as a Director of TD Banknorth (2006-2007). In addition, Mr. Rosow served as a member (2008-2014) and President (2009-2014) of the Town Council of Palm Beach, Florida. Mr. Rosow also served as a Member of the Advisory Board of certain Fidelity® funds (2012-2013).
Garnett A. Smith (1947)
Year of Election or Appointment: 2013
Trustee
Mr. Smith also serves as Trustee of other Fidelity® funds. Prior to Mr. Smith's retirement, he served as Chairman and Chief Executive Officer of Inbrand Corp. (manufacturer of personal absorbent products, 1990-1997). He also served as President (1986-1990) of Inbrand Corp. Prior to his employment with Inbrand Corp., he was employed by a retail fabric chain and North Carolina National Bank. In addition, Mr. Smith served as a Member of the Advisory Board of certain Fidelity® funds (2012-2013) and as a board member of the Jackson Hole Land Trust (2009-2012).
Michael E. Wiley (1950)
Year of Election or Appointment: 2008
Trustee
Chairman of the Independent Trustees
Mr. Wiley also serves as Trustee of other Fidelity® funds. Mr. Wiley serves as a Director of Andeavor Corporation (independent oil refiner and marketer, 2005-present), a Director of Andeavor Logistics LP (natural resources logistics, 2015-present), and a Director of Bill Barrett Corporation (exploration and production, 2005-present). In addition, Mr. Wiley also serves as a Director of Post Oak Bank (privately-held bank, 2004-present). Previously, Mr. Wiley served as a Trustee of other Fidelity® funds (2008-2013), as a Director of Asia Pacific Exploration Consolidated (international oil and gas exploration and production, 2008-2013), as a member of the Board of Trustees of the University of Tulsa (2000-2006; 2007-2010), as a Senior Energy Advisor of Katzenbach Partners, LLC (consulting, 2006-2007), as an Advisory Director of Riverstone Holdings (private investment), Chairman, President, and CEO of Baker Hughes, Inc. (oilfield services, 2000-2004), and as Director of Spinnaker Exploration Company (exploration and production, 2001-2005).
+ The information includes the Trustee's principal occupation during the last five years and other information relating to the experience, attributes, and skills relevant to the Trustee's qualifications to serve as a Trustee, which led to the conclusion that the Trustee should serve as a Trustee for the fund.
Advisory Board Members and Officers:
Correspondence intended for a Member of the Advisory Board (if any) may be sent to Fidelity Investments, P.O. Box 55235, Boston, Massachusetts 02205-5235. Except for Anthony R. Rochte, correspondence intended for an officer may be sent to Fidelity Investments, 245 Summer Street, Boston, Massachusetts 02210. Correspondence intended for Mr. Rochte may be sent to Fidelity SelectCo, LLC (SelectCo), 1225 17th Street, Denver, Colorado 80202-5541. Officers appear below in alphabetical order.
Name, Year of Birth; Principal Occupation
Donald F. Donahue (1950)
Year of Election or Appointment: 2015
Member of the Advisory Board
Mr. Donahue also serves as a Trustee or Member of the Advisory Board of other Fidelity® funds. Mr. Donahue is President and Chief Executive Officer of Miranda Partners, LLC (risk consulting for the financial services industry, 2012-present). Previously, Mr. Donahue served as Chief Executive Officer (2006-2012), Chief Operating Officer (2003-2006), and Managing Director, Customer Marketing and Development (1999-2003) of The Depository Trust & Clearing Corporation (financial markets infrastructure). Mr. Donahue serves as a Member (2007-present) and Co-Chairman (2016-present) of the Board of Directors of United Way of New York, Member of the Board of Directors of NYC Leadership Academy (2012-present) and Member of the Board of Advisors of Ripple Labs, Inc. (financial services, 2015-present). He also served as Chairman (2010-2012) and Member of the Board of Directors (2012-2013) of Omgeo, LLC (financial services), Treasurer of United Way of New York (2012-2016), and Member of the Board of Directors of XBRL US (financial services non-profit, 2009-2012) and the International Securities Services Association (2009-2012).
Carol B. Tomé (1957)
Year of Election or Appointment: 2017
Member of the Advisory Board
Ms. Tomé also serves as Member of the Advisory Board of other Fidelity® funds. Ms. Tomé is Chief Financial Officer (2001-present) and Executive Vice President of Corporate Services (2007-present) of The Home Depot, Inc. (home improvement retailer) and a Director (2003-present) and Chair of the Audit Committee (2004-present) of United Parcel Service, Inc. (package delivery and supply chain management). Previously, Ms. Tomé served as Trustee of certain Fidelity® funds (2017), Senior Vice President of Finance and Accounting/Treasurer (2000-2007) and Vice President and Treasurer (1995-2000) of The Home Depot, Inc. and Chair of the Board (2010-2012), Vice Chair of the Board (2009 and 2013), and a Director (2008-2013) of the Federal Reserve Bank of Atlanta. Ms. Tomé is also a director or trustee of many community and professional organizations.
Elizabeth Paige Baumann (1968)
Year of Election or Appointment: 2017
Anti-Money Laundering (AML) Officer
Ms. Baumann also serves as AML Officer of other funds. She is Chief AML Officer (2012-present) and Senior Vice President (2014-present) of FMR LLC (diversified financial services company) and is an employee of Fidelity Investments. Previously, Ms. Baumann served as AML Officer of the funds (2012-2016), and Vice President (2007-2014) and Deputy Anti-Money Laundering Officer (2007-2012) of FMR LLC.
Marc R. Bryant (1966)
Year of Election or Appointment: 2013
Secretary and Chief Legal Officer (CLO)
Mr. Bryant also serves as Secretary and CLO of other funds. Mr. Bryant serves as CLO, Secretary, and Senior Vice President of Fidelity Management & Research Company (investment adviser firm, 2015-present) and FMR Co., Inc. (investment adviser firm, 2015-present); Secretary of Fidelity SelectCo, LLC (investment adviser firm, 2015-present) and Fidelity Investments Money Management, Inc. (investment adviser firm, 2015-present); and CLO of Fidelity Management & Research (Hong Kong) Limited and FMR Investment Management (UK) Limited (investment adviser firms, 2015-present) and Fidelity Management & Research (Japan) Limited (investment adviser firm, 2016-present). He is Senior Vice President and Deputy General Counsel of FMR LLC (diversified financial services company). Previously, Mr. Bryant served as Secretary and CLO of Fidelity Rutland Square Trust II (2010-2014) and Assistant Secretary of Fidelity's Fixed Income and Asset Allocation Funds (2013-2015). Prior to joining Fidelity Investments, Mr. Bryant served as a Senior Vice President and the Head of Global Retail Legal for AllianceBernstein L.P. (2006-2010), and as the General Counsel for ProFund Advisors LLC (2001-2006).
William C. Coffey (1969)
Year of Election or Appointment: 2009
Assistant Secretary
Mr. Coffey also serves as Assistant Secretary of other funds. He is Senior Vice President and Deputy General Counsel of FMR LLC (diversified financial services company, 2010-present), and is an employee of Fidelity Investments. Previously, Mr. Coffey served as Vice President and Associate General Counsel of FMR LLC (2005-2009).
Jonathan Davis (1968)
Year of Election or Appointment: 2010
Assistant Treasurer
Mr. Davis also serves as Assistant Treasurer of other funds. Mr. Davis serves as Assistant Treasurer of FMR Capital, Inc. (2017-present) and is an employee of Fidelity Investments. Previously, Mr. Davis served as Vice President and Associate General Counsel of FMR LLC (diversified financial services company, 2003-2010).
Adrien E. Deberghes (1967)
Year of Election or Appointment: 2013
President and Treasurer
Mr. Deberghes also serves as an officer of other funds. He serves as Assistant Treasurer of FMR Capital, Inc. (2017-present), Executive Vice President of Fidelity Investments Money Management, Inc. (FIMM) (investment adviser firm, 2016-present), and is an employee of Fidelity Investments (2008-present). Prior to joining Fidelity Investments, Mr. Deberghes was Senior Vice President of Mutual Fund Administration at State Street Corporation (2007-2008), Senior Director of Mutual Fund Administration at Investors Bank & Trust (2005-2007), and Director of Finance for Dunkin' Brands (2000-2005). Previously, Mr. Deberghes served in other fund officer roles.
Joseph DeSantis (1959)
Year of Election or Appointment: 2015
Vice President
Mr. DeSantis also serves as Vice President of other funds. Mr. DeSantis serves as a Director of Fidelity Management & Research (Japan) Limited (investment adviser firm, 2016-present), Chief Investment Officer, Equities (2010-present) and is an employee of Fidelity Investments.
Stephanie J. Dorsey (1969)
Year of Election or Appointment: 2010
Assistant Treasurer
Ms. Dorsey also serves as an officer of other funds. Ms. Dorsey serves as Assistant Treasurer of FMR Capital, Inc. (2017-present), is an employee of Fidelity Investments (2008-present), and has served in other fund officer roles. Prior to joining Fidelity Investments, Ms. Dorsey served as Treasurer (2004-2008) of the JPMorgan Mutual Funds and Vice President (2004-2008) of JPMorgan Chase Bank.
Howard J. Galligan III (1966)
Year of Election or Appointment: 2014
Chief Financial Officer
Mr. Galligan also serves as Chief Financial Officer of other funds. Mr. Galligan serves as President of Fidelity Pricing and Cash Management Services (FPCMS) (2014-present) and as a Director of Strategic Advisers, Inc. (investment adviser firm, 2008-present). Previously, Mr. Galligan served as Chief Administrative Officer of Asset Management (2011-2014) and Chief Operating Officer and Senior Vice President of Investment Support for Strategic Advisers, Inc. (2003-2011).
James D. Gryglewicz (1972)
Year of Election or Appointment: 2014
Chief Compliance Officer
Mr. Gryglewicz also serves as Chief Compliance Officer of other funds. Mr. Gryglewicz serves as Compliance Officer of Strategic Advisers, Inc. (investment adviser firm, 2015-present) and Fidelity SelectCo, LLC (investment adviser firm, 2014-present), Senior Vice President of Asset Management Compliance (2009-present), and is an employee of Fidelity Investments (2004-present).
Brian B. Hogan (1964)
Year of Election or Appointment: 2009
Vice President
Mr. Hogan also serves as Trustee or Vice President of other funds. Mr. Hogan serves as a Director of FMR Investment Management (UK) Limited (investment adviser firm, 2015-present) and Fidelity SelectCo, LLC (investment adviser firm, 2014-present) and President of the Equity Division of FMR (investment adviser firm, 2009-present). Previously, Mr. Hogan served as Senior Vice President, Equity Research of FMR (2006-2009) and as a portfolio manager. Mr. Brian B. Hogan is not related to Mr. Colm A. Hogan.
Colm A. Hogan (1973)
Year of Election or Appointment: 2016
Assistant Treasurer
Mr. Hogan also serves as an officer of other funds. Mr. Hogan serves as Assistant Treasurer of FMR Capital, Inc. (2017-present) and is an employee of Fidelity Investments (2005-present). Mr. Colm A. Hogan is not related to Mr. Brian B. Hogan.
Chris Maher (1972)
Year of Election or Appointment: 2013
Assistant Treasurer
Mr. Maher serves as Assistant Treasurer of other funds. Mr. Maher is Vice President of Valuation Oversight, serves as Assistant Treasurer of FMR Capital, Inc. (2017-present), and is an employee of Fidelity Investments. Previously, Mr. Maher served as Vice President of Asset Management Compliance (2013), Vice President of the Program Management Group of FMR (investment adviser firm, 2010-2013), and Vice President of Valuation Oversight (2008-2010).
Rieco E. Mello (1969)
Year of Election or Appointment: 2017
Assistant Treasurer
Mr. Mello also serves as Assistant Treasurer of other funds. Mr. Mello serves as Assistant Treasurer of FMR Capital, Inc. (2017-present) and is an employee of Fidelity Investments (1995-present).
Anthony R. Rochte (1968)
Year of Election or Appointment: 2013
Vice President
Mr. Rochte also serves as Vice President of other funds. Mr. Rochte serves as President of Fidelity SelectCo, LLC (investment adviser firm, 2012-present) and is an employee of Fidelity Investments (2012-present). Prior to joining Fidelity Investments, Mr. Rochte served as Senior Managing Director and head of State Street Global Advisors' North American Intermediary Business Group (2006-2012).
Stacie M. Smith (1974)
Year of Election or Appointment: 2013
Assistant Treasurer
Ms. Smith also serves as an officer of other funds. Ms. Smith serves as Assistant Treasurer of FMR Capital, Inc. (2017-present), is an employee of Fidelity Investments (2009-present), and has served in other fund officer roles. Prior to joining Fidelity Investments, Ms. Smith served as Senior Audit Manager of Ernst & Young LLP (accounting firm, 1996-2009). Previously, Ms. Smith served as Deputy Treasurer of certain Fidelity® funds (2013-2016).
Marc L. Spector (1972)
Year of Election or Appointment: 2017
Assistant Treasurer
Mr. Spector also serves as an officer of other funds. Mr. Spector serves as Assistant Treasurer of FMR Capital, Inc. (2017-present) and is an employee of Fidelity Investments (2016-present). Prior to joining Fidelity Investments, Mr. Spector served as Director at the Siegfried Group (accounting firm, 2013-2016), and prior to Siegfried Group as audit senior manager at Deloitte & Touche (accounting firm, 2005-2013).
Renee Stagnone (1975)
Year of Election or Appointment: 2016
Assistant Treasurer
Ms. Stagnone also serves as an officer of other funds. Ms. Stagnone serves as Assistant Treasurer of FMR Capital, Inc. (2017-present) and is an employee of Fidelity Investments (1997-present). Previously, Ms. Stagnone served as Deputy Treasurer of certain Fidelity® funds (2013-2016).
Shareholder Expense Example
As a shareholder of the Fund, you incur two types of costs: (1) transaction costs, including redemption fees and (2) ongoing costs, including management fees and other Fund expenses. This Example is intended to help you understand your ongoing costs (in dollars) of investing in the Fund and to compare these costs with the ongoing costs of investing in other mutual funds.
The Example is based on an investment of $1,000 invested at the beginning of the period and held for the entire period (July 1, 2017 to December 31, 2017).
Actual Expenses
The first line of the accompanying table for each class of the Fund provides information about actual account values and actual expenses. You may use the information in this line, together with the amount you invested, to estimate the expenses that you paid over the period. Simply divide your account value by $1,000.00 (for example, an $8,600 account value divided by $1,000.00 = 8.6), then multiply the result by the number in the first line for a class of the Fund under the heading entitled "Expenses Paid During Period" to estimate the expenses you paid on your account during this period. The estimate of expenses does not include any fees or other expenses of any variable annuity or variable life insurance product. If they were, the estimate of expenses you paid during the period would be higher, and your ending account value would be lower. In addition, the Fund, as a shareholder in the underlying Fidelity Central Funds, will indirectly bear its pro-rata share of the fees and expenses incurred by the underlying Fidelity Central Funds. These fees and expenses are not included in the Fund's annualized expense ratio used to calculate the expense estimate in the table below.
Hypothetical Example for Comparison Purposes
The second line of the accompanying table for each class of the Fund provides information about hypothetical account values and hypothetical expenses based on a Class' actual expense ratio and an assumed rate of return of 5% per year before expenses, which is not the Class' actual return. The hypothetical account values and expenses may not be used to estimate the actual ending account balance or expenses you paid for the period. You may use this information to compare the ongoing costs of investing in the Fund and other funds. To do so, compare this 5% hypothetical example with the 5% hypothetical examples that appear in the shareholder reports of the other funds. The estimate of expenses does not include any fees or other expenses of any variable annuity or variable life insurance product. If they were, the estimate of expenses you paid during the period would be higher, and your ending account value would be lower. In addition, the Fund, as a shareholder in the underlying Fidelity Central Funds, will indirectly bear its pro-rata share of the fees and expenses incurred by the underlying Fidelity Central Funds. These fees and expenses are not included in the Fund's annualized expense ratio used to calculate the expense estimate in the table below.
Please note that the expenses shown in the table are meant to highlight your ongoing costs only and do not reflect any transaction costs. Therefore, the second line of the table is useful in comparing ongoing costs only, and will not help you determine the relative total costs of owning different funds. In addition, if these transactional costs were included, your costs would have been higher.
| | Annualized Expense Ratio-A | Beginning
Account Value
July 1, 2017 | Ending
Account Value
December 31, 2017 | Expenses Paid
During Period-B
July 1, 2017
to December 31, 2017 |
| Initial Class | .70% | | | |
| Actual | | $1,000.00 | $1,119.20 | $3.74 |
| Hypothetical-C | | $1,000.00 | $1,021.68 | $3.57 |
| Investor Class | .78% | | | |
| Actual | | $1,000.00 | $1,118.80 | $4.17 |
| Hypothetical-C | | $1,000.00 | $1,021.27 | $3.97 |
A Annualized expense ratio reflects expenses net of applicable fee waivers.
B Expenses are equal to each Class' annualized expense ratio, multiplied by the average account value over the period, multiplied by 184/365 (to reflect the one-half year period).
C 5% return per year before expenses
Distributions (Unaudited)
The Board of Trustees of VIP Consumer Discretionary Portfolio voted to pay to shareholders of record at the opening of business on record date, the following distributions per share derived from capital gains realized from sales of portfolio securities, and dividends derived from net investment income:
| | Pay Date | Record Date | Dividends | Capital Gains |
| VIP Consumer Discretionary Portfolio | | | | |
| Initial Class | 02/09/18 | 02/09/18 | $0.026 | $0.889 |
| Investor Class | 02/09/18 | 02/09/18 | $0.023 | $0.889 |
|
The fund hereby designates as a capital gain dividend with respect to the taxable year ended December 31 2017, $6,312,845, or, if subsequently determined to be different, the net capital gain of such year.
Initial Class and Investor Class designate 100% of the dividends distributed during the fiscal year as qualifying for the dividends–received deduction for corporate shareholders.
Proxy Voting Results
A special meeting of shareholders was held on December 8, 2017. The results of votes taken among shareholders on the proposals before them are reported below. Each vote reported represents one dollar of net asset value held on the record date for the meeting.
PROPOSAL 1
To elect a Board of Trustees.
| | # of
Votes | % of
Votes |
| James C. Curvey |
| Affirmative | 3,005,845,657.89 | 94.803 |
| Withheld | 164,788,708.80 | 5.197 |
| TOTAL | 3,170,634,366.69 | 100.000 |
| Dennis J. Dirks |
| Affirmative | 3,025,050,303.47 | 95.409 |
| Withheld | 145,584,063.22 | 4.591 |
| TOTAL | 3,170,634,366.69 | 100.000 |
| Donald F. Donahue |
| Affirmative | 3,024,923,660.98 | 95.405 |
| Withheld | 145,710,705.71 | 4.595 |
| TOTAL | 3,170,634,366.69 | 100.000 |
| Alan J. Lacy |
| Affirmative | 3,024,272,946.71 | 95.384 |
| Withheld | 146,361,419.98 | 4.616 |
| TOTAL | 3,170,634,366.69 | 100.00 |
| Ned C. Lautenbach |
| Affirmative | 3,011,847,006.14 | 94.992 |
| Withheld | 158,787,360.55 | 5.008 |
| TOTAL | 3,170,634,366.69 | 100.000 |
| Joseph Mauriello |
| Affirmative | 3,021,074,746.00 | 95.283 |
| Withheld | 149,559,620.69 | 4.717 |
| TOTAL | 3,170,634,366.69 | 100.000 |
| Charles S. Morrison |
| Affirmative | 3,025,083,795.43 | 95.410 |
| Withheld | 145,550,571.26 | 4.590 |
| TOTAL | 3,170,634,366.69 | 100.000 |
| Cornelia M. Small |
| Affirmative | 3,016,566,905.34 | 95.141 |
| Withheld | 154,067,461.35 | 4.859 |
| TOTAL | 3,170,634,366.69 | 100.000 |
| Garnett A. Smith |
| Affirmative | 3,014,927,605.85 | 95.090 |
| Withheld | 155,706,760.84 | 4.910 |
| TOTAL | 3,170,634,366.69 | 100.000 |
| David M. Thomas |
| Affirmative | 3,025,900,428.75 | 95.436 |
| Withheld | 144,733,937.94 | 4.564 |
| TOTAL | 3,170,634,366.69 | 100.000 |
| Michael E. Wiley |
| Affirmative | 3,023,436,110.39 | 95.358 |
| Withheld | 147,198,256.30 | 4.642 |
| TOTAL | 3,170,634,366.69 | 100.000 |
PROPOSAL 2
To eliminate a fundamental investment policy.
| | # of
Votes | % of
Votes |
| Affirmative | 111,324,207.36 | 82.534 |
| Against | 12,477,562.16 | 9.251 |
| Abstain | 11,081,305.73 | 8.215 |
| TOTAL | 134,883,075.25 | 100.000 |
|
| Proposal 1 reflects trust wide proposal and voting results. |
VCONIC-ANN-0218
1.817355.112
Fidelity® Variable Insurance Products: Real Estate Portfolio
Annual Report December 31, 2017 |
|
Contents
To view a fund's proxy voting guidelines and proxy voting record for the 12-month period ended June 30, visit http://www.fidelity.com/proxyvotingresults or visit the Securities and Exchange Commission's (SEC) web site at http://www.sec.gov.
You may also call 1-877-208-0098 to request a free copy of the proxy voting guidelines.
Fidelity® Variable Insurance Products are separate account options which are purchased through a variable insurance contract.
Standard & Poor's, S&P and S&P 500 are registered service marks of The McGraw-Hill Companies, Inc. and have been licensed for use by Fidelity Distributors Corporation.
Other third-party marks appearing herein are the property of their respective owners.
All other marks appearing herein are registered or unregistered trademarks or service marks of FMR LLC or an affiliated company. © 2018 FMR LLC. All rights reserved.
This report and the financial statements contained herein are submitted for the general information of the shareholders of the Fund. This report is not authorized for distribution to prospective investors in the Fund unless preceded or accompanied by an effective prospectus.
A fund files its complete schedule of portfolio holdings with the SEC for the first and third quarters of each fiscal year on Form N-Q. Forms N-Q are available on the SEC’s web site at http://www.sec.gov. A fund's Forms N-Q may be reviewed and copied at the SEC’s Public Reference Room in Washington, DC. Information regarding the operation of the SEC's Public Reference Room may be obtained by calling 1-800-SEC-0330.
For a complete list of a fund's portfolio holdings, view the most recent holdings listing, semiannual report, or annual report on Fidelity's web site at http://www.fidelity.com, http://www.institutional.fidelity.com, or http://www.401k.com, as applicable.
NOT FDIC INSURED •MAY LOSE VALUE •NO BANK GUARANTEE
Neither the Fund nor Fidelity Distributors Corporation is a bank.
Performance: The Bottom Line
Average annual total return reflects the change in the value of an investment, assuming reinvestment of distributions from dividend income and capital gains (the profits earned upon the sale of securities that have grown in value, if any) and assuming a constant rate of performance each year. During periods of reimbursement by Fidelity, a fund’s total return will be greater than it would be had the reimbursement not occurred. Performance numbers are net of all underlying fund operating expenses, but do not include any insurance charges imposed by your insurance company’s separate account. If performance information included the effect of these additional charges, the total returns would have been lower. How a fund did yesterday is no guarantee of how it will do tomorrow.
Average Annual Total Returns
| For the periods ended December 31, 2017 | Past 1 year | Past 5 years | Past 10 years |
| Initial Class | 4.07% | 8.63% | 7.67% |
| Service Class | 3.98% | 8.52% | 7.56% |
| Service Class 2 | 3.77% | 8.36% | 7.39% |
| Investor Class | 3.99% | 8.55% | 7.58% |
$10,000 Over 10 Years
Let's say hypothetically that $10,000 was invested in VIP Real Estate Portfolio - Initial Class on December 31, 2007.
The chart shows how the value of your investment would have changed, and also shows how the S&P 500® Index performed over the same period.

| Period Ending Values |
| $20,938 | VIP Real Estate Portfolio - Initial Class |
| $22,603 | S&P 500® Index |
Management's Discussion of Fund Performance
Market Recap: U.S. equities gained 21.83% in 2017, as the S&P 500
® index rose steadily and closed the year just shy of an all-time high after a particularly strong three-month finish. Early on, equities rallied on optimism for President Trump’s pro-business agenda but leveled off in March amid fading optimism and stalled efforts by Congress to repeal and replace the Affordable Care Act. Upward momentum soon returned and continued through year-end with consumer sentiment and other market indicators staying positive. The lone exception was a brief cooldown in August, when geopolitical tension escalated and uncertainty grew regarding the future of health care, tax reform and the debt ceiling. Sector-wise, information technology fared best by a wide margin, rising 39% amid strong earnings growth from several major index constituents. A 24% gain in materials was spurred by increased demand, especially from China. Consumer discretionary gained 23%, despite many brick-and-mortar retailers suffering from online competition, and financials edged the broader market on an uptick in bond yields. Conversely, the defensive energy and telecom services sectors returned about -1% each. Rising interest rates held back real estate (+11%), while consumer staples (+13%) and utilities (+12%) struggled due to investors’ general preference for risk assets.
Comments from Portfolio Manager Samuel Wald: For the year, the fund’s share classes gained roughly 4%, slightly outperforming the benchmark Dow Jones U.S. Select Real Estate Securities Index℠. Against a fundamentally solid market backdrop, the fund’s results were helped by a combination of favorable security selection and sector positioning derived mostly from bottom-up stock picking. On an individual stock basis, data-center real estate investment trusts (REITs) Coresite Realty and Equinix were among the fund’s top relative contributors. These and competing companies have benefited from strong demand for their specialized facilities to store and process data. I found Coresite – which I later sold during the period after its valuation increased – and Equinix more attractively valued than the industry leader, Digital Realty Trust, a strong performer and significant relative detractor that I opted to underweight. This, along with a lack of a position in benchmark component DuPont Fabros Technology, partly offset our relative performance gains with Coresite and Equinix. In June, DuPont Fabros Technology shares rose sharply, after the company agreed to be acquired by Digital Realty. Another contributor was Marriott International, a non-REIT hotel operator whose shares gained 58%. Elsewhere, industrial REITs benefited from the global growth in e-commerce, which in turn has heightened demand for warehouse and distribution facilities. Accordingly, a significant overweight in DCT Industrial Trust boosted results, although that impact was offset by an underweight in another strong-performing industrial REIT, Prologis, the fund's biggest relative detractor.
The views expressed above reflect those of the portfolio manager(s) only through the end of the period as stated on the cover of this report and do not necessarily represent the views of Fidelity or any other person in the Fidelity organization. Any such views are subject to change at any time based upon market or other conditions and Fidelity disclaims any responsibility to update such views. These views may not be relied on as investment advice and, because investment decisions for a Fidelity fund are based on numerous factors, may not be relied on as an indication of trading intent on behalf of any Fidelity fund.
Investment Summary (Unaudited)
Top Ten Stocks as of December 31, 2017
| | % of fund's net assets |
| Simon Property Group, Inc. | 6.9 |
| AvalonBay Communities, Inc. | 5.7 |
| Boston Properties, Inc. | 4.9 |
| Ventas, Inc. | 4.6 |
| Extra Space Storage, Inc. | 4.0 |
| Essex Property Trust, Inc. | 4.0 |
| Public Storage | 3.9 |
| Prologis, Inc. | 3.3 |
| DCT Industrial Trust, Inc. | 3.2 |
| Mid-America Apartment Communities, Inc. | 3.1 |
| | 43.6 |
Top Five REIT Sectors as of December 31, 2017
| | % of fund's net assets |
| REITs - Apartments | 19.0 |
| REITs - Office Property | 17.2 |
| REITs - Regional Malls | 11.2 |
| REITs - Health Care | 9.5 |
| REITs - Diversified | 8.9 |
Asset Allocation (% of fund's net assets)
| As of December 31, 2017* |
| | Stocks | 98.6% |
| | Short-Term Investments and Net Other Assets (Liabilities) | 1.4% |

* Foreign investments - 0.6%
Investments December 31, 2017
Showing Percentage of Net Assets
| Common Stocks - 98.6% | | | |
| | | Shares | Value |
| Equity Real Estate Investment Trusts (REITs) - 97.5% | | | |
| REITs - Apartments - 19.0% | | | |
| American Homes 4 Rent Class A | | 423,900 | $9,257,976 |
| AvalonBay Communities, Inc. | | 136,142 | 24,289,094 |
| Education Realty Trust, Inc. | | 168,000 | 5,866,560 |
| Equity Residential (SBI) | | 144,670 | 9,225,606 |
| Essex Property Trust, Inc. | | 69,248 | 16,714,390 |
| Mid-America Apartment Communities, Inc. | | 128,217 | 12,893,502 |
| UDR, Inc. | | 45,800 | 1,764,216 |
| | | | 80,011,344 |
| REITs - Diversified - 8.9% | | | |
| Corrections Corp. of America | | 60,300 | 1,356,750 |
| Digital Realty Trust, Inc. | | 53,100 | 6,048,090 |
| Duke Realty Corp. | | 403,300 | 10,973,793 |
| Equinix, Inc. | | 22,200 | 10,061,484 |
| Washington REIT (SBI) | | 295,600 | 9,199,072 |
| | | | 37,639,189 |
| REITs - Health Care - 9.5% | | | |
| Healthcare Realty Trust, Inc. | | 267,100 | 8,579,252 |
| Sabra Health Care REIT, Inc. | | 64,814 | 1,216,559 |
| Ventas, Inc. | | 324,910 | 19,497,849 |
| Welltower, Inc. | | 167,128 | 10,657,753 |
| | | | 39,951,413 |
| REITs - Hotels - 6.9% | | | |
| DiamondRock Hospitality Co. | | 772,600 | 8,722,654 |
| Host Hotels & Resorts, Inc. | | 544,778 | 10,813,843 |
| Sunstone Hotel Investors, Inc. | | 571,300 | 9,443,589 |
| | | | 28,980,086 |
| REITs - Management/Investment - 1.1% | | | |
| American Assets Trust, Inc. | | 96,101 | 3,674,902 |
| American Tower Corp. | | 8,200 | 1,169,894 |
| | | | 4,844,796 |
| REITs - Manufactured Homes - 2.7% | | | |
| Equity Lifestyle Properties, Inc. | | 129,910 | 11,564,588 |
| REITs - Office Property - 17.2% | | | |
| Boston Properties, Inc. | | 158,177 | 20,567,755 |
| Corporate Office Properties Trust (SBI) | | 200,500 | 5,854,600 |
| Douglas Emmett, Inc. | | 300,500 | 12,338,530 |
| Highwoods Properties, Inc. (SBI) | | 213,200 | 10,854,012 |
| Hudson Pacific Properties, Inc. | | 303,275 | 10,387,169 |
| SL Green Realty Corp. | | 127,100 | 12,828,203 |
| | | | 72,830,269 |
| REITs - Regional Malls - 11.2% | | | |
| General Growth Properties, Inc. | | 287,953 | 6,735,221 |
| Simon Property Group, Inc. | | 169,599 | 29,126,932 |
| Taubman Centers, Inc. (a) | | 75,300 | 4,926,879 |
| The Macerich Co. | | 96,300 | 6,324,984 |
| | | | 47,114,016 |
| REITs - Shopping Centers - 5.6% | | | |
| Acadia Realty Trust (SBI) | | 141,400 | 3,868,704 |
| Cedar Realty Trust, Inc. | | 562,891 | 3,422,377 |
| DDR Corp. | | 502,200 | 4,499,712 |
| Urban Edge Properties | | 464,405 | 11,837,683 |
| | | | 23,628,476 |
| REITs - Storage - 7.9% | | | |
| Extra Space Storage, Inc. | | 191,500 | 16,746,675 |
| Public Storage | | 79,255 | 16,564,295 |
| | | | 33,310,970 |
| REITs - Warehouse/Industrial - 7.4% | | | |
| DCT Industrial Trust, Inc. | | 231,550 | 13,610,509 |
| Prologis, Inc. | | 213,737 | 13,788,174 |
| Rexford Industrial Realty, Inc. | | 90,700 | 2,644,812 |
| Terreno Realty Corp. | | 28,881 | 1,012,568 |
| | | | 31,056,063 |
| Specialized REITs - 0.1% | | | |
| Safety Income and Growth, Inc. | | 34,700 | 610,720 |
|
| TOTAL EQUITY REAL ESTATE INVESTMENT TRUSTS (REITS) | | | 411,541,930 |
|
| Hotels, Restaurants & Leisure - 0.5% | | | |
| Hotels, Resorts & Cruise Lines - 0.5% | | | |
| Marriott International, Inc. Class A | | 16,100 | 2,185,253 |
| Real Estate Management & Development - 0.6% | | | |
| Real Estate Operating Companies - 0.6% | | | |
| Vonovia SE | | 49,700 | 2,468,191 |
| TOTAL COMMON STOCKS | | | |
| (Cost $325,581,310) | | | 416,195,374 |
|
| Money Market Funds - 1.9% | | | |
| Fidelity Cash Central Fund, 1.36% (b) | | 3,094,132 | 3,094,751 |
| Fidelity Securities Lending Cash Central Fund 1.36% (b)(c) | | 5,024,074 | 5,025,079 |
| TOTAL MONEY MARKET FUNDS | | | |
| (Cost $8,119,813) | | | 8,119,830 |
| TOTAL INVESTMENT IN SECURITIES - 100.5% | | | |
| (Cost $333,701,123) | | | 424,315,204 |
| NET OTHER ASSETS (LIABILITIES) - (0.5)% | | | (2,231,903) |
| NET ASSETS - 100% | | | $422,083,301 |
Legend
(a) Security or a portion of the security is on loan at period end.
(b) Affiliated fund that is generally available only to investment companies and other accounts managed by Fidelity Investments. The rate quoted is the annualized seven-day yield of the fund at period end. A complete unaudited listing of the fund's holdings as of its most recent quarter end is available upon request. In addition, each Fidelity Central Fund's financial statements, which are not covered by the Fund's Report of Independent Registered Public Accounting Firm, are available on the SEC's website or upon request.
(c) Investment made with cash collateral received from securities on loan.
Affiliated Central Funds
Information regarding fiscal year to date income earned by the Fund from investments in Fidelity Central Funds is as follows:
| Fund | Income earned |
| Fidelity Cash Central Fund | $56,918 |
| Fidelity Securities Lending Cash Central Fund | 740 |
| Total | $57,658 |
Amounts in the income column in the above table include any capital gain distributions from underlying funds, which are presented in the corresponding line-item in the Statement of Operations if applicable.
Investment Valuation
All investments are categorized as Level 1 under the Fair Value Hierarchy. The inputs or methodology used for valuing securities may not be an indication of the risk associated with investing in those securities. For more information on valuation inputs please refer to the Investment Valuation section in the accompanying Notes to Financial Statements.
See accompanying notes which are an integral part of the financial statements.
Financial Statements
Statement of Assets and Liabilities
| | | December 31, 2017 |
| Assets | | |
Investment in securities, at value (including securities loaned of $4,907,250) — See accompanying schedule:
Unaffiliated issuers (cost $325,581,310) | $416,195,374 | |
| Fidelity Central Funds (cost $8,119,813) | 8,119,830 | |
| Total Investment in Securities (cost $333,701,123) | | $424,315,204 |
| Receivable for investments sold | | 1,177,864 |
| Receivable for fund shares sold | | 276,356 |
| Dividends receivable | | 2,112,848 |
| Distributions receivable from Fidelity Central Funds | | 5,433 |
| Prepaid expenses | | 2,032 |
| Other receivables | | 6,927 |
| Total assets | | 427,896,664 |
| Liabilities | | |
| Payable for investments purchased | $293,940 | |
| Payable for fund shares redeemed | 161,396 | |
| Accrued management fee | 190,778 | |
| Distribution and service plan fees payable | 25,541 | |
| Other affiliated payables | 49,801 | |
| Other payables and accrued expenses | 66,907 | |
| Collateral on securities loaned | 5,025,000 | |
| Total liabilities | | 5,813,363 |
| Net Assets | | $422,083,301 |
| Net Assets consist of: | | |
| Paid in capital | | $309,321,837 |
| Undistributed net investment income | | 1,947,274 |
| Accumulated undistributed net realized gain (loss) on investments and foreign currency transactions | | 20,200,109 |
| Net unrealized appreciation (depreciation) on investments | | 90,614,081 |
| Net Assets | | $422,083,301 |
| Initial Class: | | |
| Net Asset Value, offering price and redemption price per share ($107,037,763 ÷ 5,506,838 shares) | | $19.44 |
| Service Class: | | |
| Net Asset Value, offering price and redemption price per share ($7,877,195 ÷ 406,674 shares) | | $19.37 |
| Service Class 2: | | |
| Net Asset Value, offering price and redemption price per share ($119,797,789 ÷ 6,258,118 shares) | | $19.14 |
| Investor Class: | | |
| Net Asset Value, offering price and redemption price per share ($187,370,554 ÷ 9,690,576 shares) | | $19.34 |
See accompanying notes which are an integral part of the financial statements.
Statement of Operations
| | | Year ended December 31, 2017 |
| Investment Income | | |
| Dividends | | $11,409,362 |
| Income from Fidelity Central Funds | | 57,658 |
| Total income | | 11,467,020 |
| Expenses | | |
| Management fee | $2,491,880 | |
| Transfer agent fees | 468,450 | |
| Distribution and service plan fees | 356,497 | |
| Accounting and security lending fees | 177,108 | |
| Custodian fees and expenses | 30,412 | |
| Independent trustees' fees and expenses | 10,766 | |
| Audit | 49,681 | |
| Legal | 6,867 | |
| Miscellaneous | 27,208 | |
| Total expenses before reductions | 3,618,869 | |
| Expense reductions | (46,223) | 3,572,646 |
| Net investment income (loss) | | 7,894,374 |
| Realized and Unrealized Gain (Loss) | | |
| Net realized gain (loss) on: | | |
| Investment securities: | | |
| Unaffiliated issuers | 25,450,539 | |
| Fidelity Central Funds | (190) | |
| Foreign currency transactions | 1,337 | |
| Total net realized gain (loss) | | 25,451,686 |
| Change in net unrealized appreciation (depreciation) on: | | |
| Investment securities: | | |
| Unaffiliated issuers | (17,612,238) | |
| Fidelity Central Funds | 17 | |
| Total change in net unrealized appreciation (depreciation) | | (17,612,221) |
| Net gain (loss) | | 7,839,465 |
| Net increase (decrease) in net assets resulting from operations | | $15,733,839 |
See accompanying notes which are an integral part of the financial statements.
Statement of Changes in Net Assets
| | Year ended December 31, 2017 | Year ended December 31, 2016 |
| Increase (Decrease) in Net Assets | | |
| Operations | | |
| Net investment income (loss) | $7,894,374 | $9,159,703 |
| Net realized gain (loss) | 25,451,686 | 31,868,209 |
| Change in net unrealized appreciation (depreciation) | (17,612,221) | (16,580,487) |
| Net increase (decrease) in net assets resulting from operations | 15,733,839 | 24,447,425 |
| Distributions to shareholders from net investment income | (7,708,495) | (7,510,703) |
| Distributions to shareholders from net realized gain | (32,575,424) | (5,482,348) |
| Total distributions | (40,283,919) | (12,993,051) |
| Share transactions - net increase (decrease) | (109,317,815) | 23,397,951 |
| Total increase (decrease) in net assets | (133,867,895) | 34,852,325 |
| Net Assets | | |
| Beginning of period | 555,951,196 | 521,098,871 |
| End of period | $422,083,301 | $555,951,196 |
| Other Information | | |
| Undistributed net investment income end of period | $1,947,274 | $1,726,474 |
See accompanying notes which are an integral part of the financial statements.
Financial Highlights
VIP Real Estate Portfolio Initial Class
| Years ended December 31, | 2017 | 2016 | 2015 | 2014 | 2013 |
| Selected Per–Share Data | | | | | |
| Net asset value, beginning of period | $20.21 | $19.61 | $19.73 | $16.35 | $17.22 |
| Income from Investment Operations | | | | | |
| Net investment income (loss)A | .36 | .36B | .38 | .35 | .29 |
| Net realized and unrealized gain (loss) | .42 | .74 | .33 | 4.53 | –C |
| Total from investment operations | .78 | 1.10 | .71 | 4.88 | .29 |
| Distributions from net investment income | (.36) | (.30) | (.39) | (.31)D | (.33) |
| Distributions from net realized gain | (1.19) | (.20) | (.44) | (1.19)D | (.83) |
| Total distributions | (1.55) | (.50) | (.83) | (1.50) | (1.16) |
| Net asset value, end of period | $19.44 | $20.21 | $19.61 | $19.73 | $16.35 |
| Total ReturnE,F | 4.07% | 5.75% | 3.71% | 30.18% | 1.82% |
| Ratios to Average Net AssetsG,H | | | | | |
| Expenses before reductions | .68% | .67% | .67% | .68% | .69% |
| Expenses net of fee waivers, if any | .68% | .67% | .67% | .68% | .68% |
| Expenses net of all reductions | .67% | .66% | .67% | .67% | .68% |
| Net investment income (loss) | 1.84% | 1.79%B | 1.92% | 1.84% | 1.61% |
| Supplemental Data | | | | | |
| Net assets, end of period (000 omitted) | $107,038 | $102,666 | $99,804 | $91,749 | $57,396 |
| Portfolio turnover rateI | 52% | 65% | 72% | 65% | 59% |
A Calculated based on average shares outstanding during the period.
B Net Investment income per share reflects a large, non-recurring dividend which amounted to $.06 per share. Excluding this non-recurring dividend, the ratio of net investment income (loss) to average net assets would have been 1.47%.
C Amount represents less than $.005 per share.
D The amounts shown reflect certain reclassifications related to book to tax differences that were made in the year shown.
E Total returns do not reflect charges attributable to your insurance company's separate account. Inclusion of these charges would reduce the total returns shown.
F Total returns would have been lower if certain expenses had not been reduced during the applicable periods shown.
G Fees and expenses of any underlying Fidelity Central Funds are not included in the Fund's expense ratio. The Fund indirectly bears its proportionate share of the expenses of any underlying Fidelity Central Funds.
H Expense ratios reflect operating expenses of the class. Expenses before reductions do not reflect amounts reimbursed by the investment adviser or reductions from brokerage service arrangements or reductions from other expense offset arrangements and do not represent the amount paid by the class during periods when reimbursements or reductions occur. Expenses net of fee waivers reflect expenses after reimbursement by the investment adviser but prior to reductions from brokerage service arrangements or other expense offset arrangements. Expenses net of all reductions represent the net expenses paid by the class.
I Amount does not include the portfolio activity of any underlying Fidelity Central Funds.
See accompanying notes which are an integral part of the financial statements.
VIP Real Estate Portfolio Service Class
| Years ended December 31, | 2017 | 2016 | 2015 | 2014 | 2013 |
| Selected Per–Share Data | | | | | |
| Net asset value, beginning of period | $20.14 | $19.56 | $19.68 | $16.32 | $17.20 |
| Income from Investment Operations | | | | | |
| Net investment income (loss)A | .34 | .34B | .36 | .33 | .27 |
| Net realized and unrealized gain (loss) | .42 | .74 | .33 | 4.51 | .01C |
| Total from investment operations | .76 | 1.08 | .69 | 4.84 | .28 |
| Distributions from net investment income | (.34) | (.29) | (.37) | (.29)D | (.32) |
| Distributions from net realized gain | (1.19) | (.20) | (.44) | (1.19)D | (.83) |
| Total distributions | (1.53) | (.50)E | (.81) | (1.48) | (1.16)F |
| Net asset value, end of period | $19.37 | $20.14 | $19.56 | $19.68 | $16.32 |
| Total ReturnG,H | 3.98% | 5.63% | 3.61% | 29.98% | 1.73% |
| Ratios to Average Net AssetsI,J | | | | | |
| Expenses before reductions | .78% | .77% | .77% | .78% | .78% |
| Expenses net of fee waivers, if any | .78% | .77% | .77% | .78% | .78% |
| Expenses net of all reductions | .77% | .76% | .76% | .77% | .78% |
| Net investment income (loss) | 1.74% | 1.69%B | 1.82% | 1.75% | 1.52% |
| Supplemental Data | | | | | |
| Net assets, end of period (000 omitted) | $7,877 | $8,781 | $4,060 | $4,056 | $3,255 |
| Portfolio turnover rateK | 52% | 65% | 72% | 65% | 59% |
A Calculated based on average shares outstanding during the period.
B Net Investment income per share reflects a large, non-recurring dividend which amounted to $.06 per share. Excluding this non-recurring dividend, the ratio of net investment income (loss) to average net assets would have been 1.38%.
C The amount shown for a share outstanding does not correspond with the aggregate net gain (loss) on investments for the period due to the timing of sales and repurchases of shares in relation to fluctuating market values of the investments of the Fund.
D The amounts shown reflect certain reclassifications related to book to tax differences that were made in the year shown.
E Total distributions of $.50 per share is comprised of distributions from net investment income of $.292 and distributions from net realized gain of $.204 per share.
F Total distributions of $1.16 per share is comprised of distributions from net investment income of $.324 and distributions from net realized gain of $.833 per share.
G Total returns do not reflect charges attributable to your insurance company's separate account. Inclusion of these charges would reduce the total returns shown.
H Total returns would have been lower if certain expenses had not been reduced during the applicable periods shown.
I Fees and expenses of any underlying Fidelity Central Funds are not included in the Fund's expense ratio. The Fund indirectly bears its proportionate share of the expenses of any underlying Fidelity Central Funds.
J Expense ratios reflect operating expenses of the class. Expenses before reductions do not reflect amounts reimbursed by the investment adviser or reductions from brokerage service arrangements or reductions from other expense offset arrangements and do not represent the amount paid by the class during periods when reimbursements or reductions occur. Expenses net of fee waivers reflect expenses after reimbursement by the investment adviser but prior to reductions from brokerage service arrangements or other expense offset arrangements. Expenses net of all reductions represent the net expenses paid by the class.
K Amount does not include the portfolio activity of any underlying Fidelity Central Funds.
See accompanying notes which are an integral part of the financial statements.
VIP Real Estate Portfolio Service Class 2
| Years ended December 31, | 2017 | 2016 | 2015 | 2014 | 2013 |
| Selected Per–Share Data | | | | | |
| Net asset value, beginning of period | $19.92 | $19.35 | $19.47 | $16.16 | $17.03 |
| Income from Investment Operations | | | | | |
| Net investment income (loss)A | .31 | .31B | .33 | .30 | .24 |
| Net realized and unrealized gain (loss) | .41 | .72 | .33 | 4.46 | .01C |
| Total from investment operations | .72 | 1.03 | .66 | 4.76 | .25 |
| Distributions from net investment income | (.31) | (.26) | (.34) | (.26)D | (.29) |
| Distributions from net realized gain | (1.19) | (.20) | (.44) | (1.19)D | (.83) |
| Total distributions | (1.50) | (.46) | (.78) | (1.45) | (1.12) |
| Net asset value, end of period | $19.14 | $19.92 | $19.35 | $19.47 | $16.16 |
| Total ReturnE,F | 3.77% | 5.46% | 3.49% | 29.80% | 1.61% |
| Ratios to Average Net AssetsG,H | | | | | |
| Expenses before reductions | .93% | .92% | .92% | .93% | .94% |
| Expenses net of fee waivers, if any | .93% | .92% | .92% | .93% | .93% |
| Expenses net of all reductions | .92% | .91% | .91% | .92% | .93% |
| Net investment income (loss) | 1.59% | 1.54%B | 1.67% | 1.60% | 1.37% |
| Supplemental Data | | | | | |
| Net assets, end of period (000 omitted) | $119,798 | $213,984 | $194,640 | $200,481 | $165,134 |
| Portfolio turnover rateI | 52% | 65% | 72% | 65% | 59% |
A Calculated based on average shares outstanding during the period.
B Net Investment income per share reflects a large, non-recurring dividend which amounted to $.06 per share. Excluding this non-recurring dividend, the ratio of net investment income (loss) to average net assets would have been 1.23%.
C The amount shown for a share outstanding does not correspond with the aggregate net gain (loss) on investments for the period due to the timing of sales and repurchases of shares in relation to fluctuating market values of the investments of the Fund.
D The amounts shown reflect certain reclassifications related to book to tax differences that were made in the year shown.
E Total returns do not reflect charges attributable to your insurance company's separate account. Inclusion of these charges would reduce the total returns shown.
F Total returns would have been lower if certain expenses had not been reduced during the applicable periods shown.
G Fees and expenses of any underlying Fidelity Central Funds are not included in the Fund's expense ratio. The Fund indirectly bears its proportionate share of the expenses of any underlying Fidelity Central Funds.
H Expense ratios reflect operating expenses of the class. Expenses before reductions do not reflect amounts reimbursed by the investment adviser or reductions from brokerage service arrangements or reductions from other expense offset arrangements and do not represent the amount paid by the class during periods when reimbursements or reductions occur. Expenses net of fee waivers reflect expenses after reimbursement by the investment adviser but prior to reductions from brokerage service arrangements or other expense offset arrangements. Expenses net of all reductions represent the net expenses paid by the class.
I Amount does not include the portfolio activity of any underlying Fidelity Central Funds.
See accompanying notes which are an integral part of the financial statements.
VIP Real Estate Portfolio Investor Class
| Years ended December 31, | 2017 | 2016 | 2015 | 2014 | 2013 |
| Selected Per–Share Data | | | | | |
| Net asset value, beginning of period | $20.11 | $19.52 | $19.64 | $16.29 | $17.15 |
| Income from Investment Operations | | | | | |
| Net investment income (loss)A | .34 | .35B | .36 | .33 | .28 |
| Net realized and unrealized gain (loss) | .42 | .73 | .33 | 4.50 | .01C |
| Total from investment operations | .76 | 1.08 | .69 | 4.83 | .29 |
| Distributions from net investment income | (.35) | (.28) | (.37) | (.30)D | (.32) |
| Distributions from net realized gain | (1.19) | (.20) | (.44) | (1.19)D | (.83) |
| Total distributions | (1.53)E | (.49)F | (.81) | (1.48)G | (1.15) |
| Net asset value, end of period | $19.34 | $20.11 | $19.52 | $19.64 | $16.29 |
| Total ReturnH,I | 3.99% | 5.65% | 3.64% | 30.02% | 1.81% |
| Ratios to Average Net AssetsJ,K | | | | | |
| Expenses before reductions | .76% | .75% | .75% | .76% | .77% |
| Expenses net of fee waivers, if any | .76% | .75% | .75% | .76% | .76% |
| Expenses net of all reductions | .75% | .74% | .74% | .75% | .76% |
| Net investment income (loss) | 1.76% | 1.71%B | 1.84% | 1.76% | 1.53% |
| Supplemental Data | | | | | |
| Net assets, end of period (000 omitted) | $187,371 | $230,521 | $222,596 | $219,550 | $138,855 |
| Portfolio turnover rateL | 52% | 65% | 72% | 65% | 59% |
A Calculated based on average shares outstanding during the period.
B Net Investment income per share reflects a large, non-recurring dividend which amounted to $.06 per share. Excluding this non-recurring dividend, the ratio of net investment income (loss) to average net assets would have been 1.39%.
C The amount shown for a share outstanding does not correspond with the aggregate net gain (loss) on investments for the period due to the timing of sales and repurchases of shares in relation to fluctuating market values of the investments of the Fund.
D The amounts shown reflect certain reclassifications related to book to tax differences that were made in the year shown.
E Total distributions of $1.53 per share is comprised of distributions from net investment income of $.345 and distributions from net realized gain of $1.189 per share.
F Total distributions of $.49 per share is comprised of distributions from net investment income of $.282 and distributions from net realized gain of $.204 per share.
G Total distributions of $1.48 per share is comprised of distributions from net investment income of $.296 and distributions from net realized gain of $1.188 per share.
H Total returns do not reflect charges attributable to your insurance company's separate account. Inclusion of these charges would reduce the total returns shown.
I Total returns would have been lower if certain expenses had not been reduced during the applicable periods shown.
J Fees and expenses of any underlying Fidelity Central Funds are not included in the Fund's expense ratio. The Fund indirectly bears its proportionate share of the expenses of any underlying Fidelity Central Funds.
K Expense ratios reflect operating expenses of the class. Expenses before reductions do not reflect amounts reimbursed by the investment adviser or reductions from brokerage service arrangements or reductions from other expense offset arrangements and do not represent the amount paid by the class during periods when reimbursements or reductions occur. Expenses net of fee waivers reflect expenses after reimbursement by the investment adviser but prior to reductions from brokerage service arrangements or other expense offset arrangements. Expenses net of all reductions represent the net expenses paid by the class.
L Amount does not include the portfolio activity of any underlying Fidelity Central Funds.
See accompanying notes which are an integral part of the financial statements.
Notes to Financial Statements
For the period ended December 31, 2017
1. Organization.
VIP Real Estate Portfolio (the Fund) is a non-diversified fund of Variable Insurance Products Fund IV (the Trust) and is authorized to issue an unlimited number of shares. The Trust is registered under the Investment Company Act of 1940, as amended (the 1940 Act), as an open-end management investment company organized as a Massachusetts business trust. Shares of the Fund may only be purchased by insurance companies for the purpose of funding variable annuity or variable life insurance contracts. The Fund offers the following classes of shares: Initial Class shares, Service Class shares, Service Class 2 shares and Investor Class shares. All classes have equal rights and voting privileges, except for matters affecting a single class.
2. Investments in Fidelity Central Funds.
The Fund invests in Fidelity Central Funds, which are open-end investment companies generally available only to other investment companies and accounts managed by the investment adviser and its affiliates. The Fund's Schedule of Investments lists each of the Fidelity Central Funds held as of period end, if any, as an investment of the Fund, but does not include the underlying holdings of each Fidelity Central Fund. As an Investing Fund, the Fund indirectly bears its proportionate share of the expenses of the underlying Fidelity Central Funds.
The Money Market Central Funds seek preservation of capital and current income and are managed by Fidelity Investments Money Management, Inc. (FIMM), an affiliate of the investment adviser. Annualized expenses of the Money Market Central Funds as of their most recent shareholder report date are less than .005%.
A complete unaudited list of holdings for each Fidelity Central Fund is available upon request or at the Securities and Exchange Commission (the SEC) website at www.sec.gov. In addition, the financial statements of the Fidelity Central Funds, which are not covered by the Fund's Report of Independent Registered Public Accounting Firm, are available on the SEC website or upon request.
3. Significant Accounting Policies.
The Fund is an investment company and applies the accounting and reporting guidance of the Financial Accounting Standards Board (FASB) Accounting Standards Codification Topic 946 Financial Services – Investments Companies. The financial statements have been prepared in conformity with accounting principles generally accepted in the United States of America (GAAP), which require management to make certain estimates and assumptions at the date of the financial statements. Actual results could differ from those estimates. Subsequent events, if any, through the date that the financial statements were issued have been evaluated in the preparation of the financial statements. The following summarizes the significant accounting policies of the Fund:
Investment Valuation. Investments are valued as of 4:00 p.m. Eastern time on the last calendar day of the period. The Board of Trustees (the Board) has delegated the day to day responsibility for the valuation of the Fund's investments to the Fair Value Committee (the Committee) established by the Fund's investment adviser. In accordance with valuation policies and procedures approved by the Board, the Fund attempts to obtain prices from one or more third party pricing vendors or brokers to value its investments. When current market prices, quotations or currency exchange rates are not readily available or reliable, investments will be fair valued in good faith by the Committee, in accordance with procedures adopted by the Board. Factors used in determining fair value vary by investment type and may include market or investment specific events. The frequency with which these procedures are used cannot be predicted and they may be utilized to a significant extent. The Committee oversees the Fund's valuation policies and procedures and reports to the Board on the Committee's activities and fair value determinations. The Board monitors the appropriateness of the procedures used in valuing the Fund's investments and ratifies the fair value determinations of the Committee.
The Fund categorizes the inputs to valuation techniques used to value its investments into a disclosure hierarchy consisting of three levels as shown below:
- Level 1 – quoted prices in active markets for identical investments
- Level 2 – other significant observable inputs (including quoted prices for similar investments, interest rates, prepayment speeds, etc.)
- Level 3 – unobservable inputs (including the Fund's own assumptions based on the best information available)
Valuation techniques used to value the Fund's investments by major category are as follows:
Equity securities, including restricted securities, for which market quotations are readily available, are valued at the last reported sale price or official closing price as reported by a third party pricing vendor on the primary market or exchange on which they are traded and are categorized as Level 1 in the hierarchy. In the event there were no sales during the day or closing prices are not available, securities are valued at the last quoted bid price or may be valued using the last available price and are generally categorized as Level 2 in the hierarchy. For foreign equity securities, when market or security specific events arise, comparisons to the valuation of American Depositary Receipts (ADRs), futures contracts, Exchange-Traded Funds (ETFs) and certain indexes as well as quoted prices for similar securities may be used and would be categorized as Level 2 in the hierarchy. Utilizing these techniques may result in transfers between Level 1 and Level 2. For equity securities, including restricted securities, where observable inputs are limited, assumptions about market activity and risk are used and these securities may be categorized as Level 3 in the hierarchy.
Investments in open-end mutual funds, including the Fidelity Central Funds, are valued at their closing net asset value (NAV) each business day and are categorized as Level 1 in the hierarchy
Changes in valuation techniques may result in transfers in or out of an assigned level within the disclosure hierarchy.
Foreign Currency. The Fund may use foreign currency contracts to facilitate transactions in foreign-denominated securities. Gains and losses from these transactions may arise from changes in the value of the foreign currency or if the counterparties do not perform under the contracts' terms.
Foreign-denominated assets, including investment securities, and liabilities are translated into U.S. dollars at the exchange rates at period end. Purchases and sales of investment securities, income and dividends received and expenses denominated in foreign currencies are translated into U.S. dollars at the exchange rate in effect on the transaction date.
The effects of exchange rate fluctuations on investments are included with the net realized and unrealized gain (loss) on investment securities. Other foreign currency transactions resulting in realized and unrealized gain (loss) are disclosed separately.
Investment Transactions and Income. For financial reporting purposes, the Fund's investment holdings and NAV include trades executed through the end of the last business day of the period. The NAV per share for processing shareholder transactions is calculated as of the close of business of the New York Stock Exchange (NYSE), normally 4:00 p.m. Eastern time and includes trades executed through the end of the prior business day. Gains and losses on securities sold are determined on the basis of identified cost and includes proceeds received from litigation. Dividend income is recorded on the ex-dividend date, except for certain dividends from foreign securities where the ex-dividend date may have passed, which are recorded as soon as the Fund is informed of the ex-dividend date. Non-cash dividends included in dividend income, if any, are recorded at the fair market value of the securities received. Income and capital gain distributions from Fidelity Central Funds, if any, are recorded on the ex-dividend date. Certain distributions received by the Fund represent a return of capital or capital gain. The Fund determines the components of these distributions subsequent to the ex-dividend date, based upon receipt of tax filings or other correspondence relating to the underlying investment. These distributions are recorded as a reduction of cost of investments and/or as a realized gain. Investment income is recorded net of foreign taxes withheld where recovery of such taxes is uncertain.
Class Allocations and Expenses. Investment income, realized and unrealized capital gains and losses, common expenses of the Fund, and certain fund-level expense reductions, if any, are allocated daily on a pro-rata basis to each class based on the relative net assets of each class to the total net assets of the Fund. Each class differs with respect to transfer agent and distribution and service plan fees incurred. Certain expense reductions may also differ by class. For the reporting period, the allocated portion of income and expenses to each class as a percent of its average net assets may vary due to the timing of recording these transactions in relation to fluctuating net assets of the classes. Expenses directly attributable to a fund are charged to that fund. Expenses attributable to more than one fund are allocated among the respective funds on the basis of relative net assets or other appropriate methods. Expense estimates are accrued in the period to which they relate and adjustments are made when actual amounts are known.
Income Tax Information and Distributions to Shareholders. Each year, the Fund intends to qualify as a regulated investment company under Subchapter M of the Internal Revenue Code, including distributing substantially all of its taxable income and realized gains. As a result, no provision for U.S. Federal income taxes is required. As of December 31, 2017, the Fund did not have any unrecognized tax benefits in the financial statements; nor is the Fund aware of any tax positions for which it is reasonably possible that the total amounts of unrecognized tax benefits will significantly change in the next twelve months. The Fund files a U.S. federal tax return, in addition to state and local tax returns as required. The Fund's federal income tax returns are subject to examination by the Internal Revenue Service (IRS) for a period of three fiscal years after they are filed. State and local tax returns may be subject to examination for an additional fiscal year depending on the jurisdiction. Foreign taxes are provided for based on the Fund's understanding of the tax rules and rates that exist in the foreign markets in which it invests.
Distributions are declared and recorded on the ex-dividend date. Income dividends and capital gain distributions are declared separately for each class. Income and capital gain distributions are determined in accordance with income tax regulations, which may differ from GAAP.
Capital accounts within the financial statements are adjusted for permanent book-tax differences. These adjustments have no impact on net assets or the results of operations. Capital accounts are not adjusted for temporary book-tax differences which will reverse in a subsequent period.
Book-tax differences are primarily due to short-term capital gains, foreign currency transactions, and losses deferred due to wash sales and excise tax regulations.
As of period end, the cost and unrealized appreciation (depreciation) in securities, and derivatives if applicable, for federal income tax purposes were as follows:
| Gross unrealized appreciation | $97,177,369 |
| Gross unrealized depreciation | (7,655,109) |
| Net unrealized appreciation (depreciation) | $89,522,260 |
| Tax Cost | $334,792,944 |
The tax-based components of distributable earnings as of period end were as follows:
| Undistributed ordinary income | $1,947,275 |
| Undistributed long-term capital gain | $21,291,930 |
| Net unrealized appreciation (depreciation) on securities and other investments | $89,522,260 |
The tax character of distributions paid was as follows:
| | December 31, 2017 | December 31, 2016 |
| Ordinary Income | $7,708,495 | $ 10,428,962 |
| Long-term Capital Gains | 32,575,424 | 2,564,089 |
| Total | $40,283,919 | $ 12,993,051 |
4. Purchases and Sales of Investments.
Purchases and sales of securities, other than short-term securities, aggregated $234,515,594 and $369,914,074, respectively.
5. Fees and Other Transactions with Affiliates.
Management Fee. Fidelity SelectCo, LLC (the investment adviser) and its affiliates provide the Fund with investment management related services for which the Fund pays a monthly management fee. The management fee is the sum of an individual fund fee rate that is based on an annual rate of .30% of the Fund's average net assets and an annualized group fee rate that averaged .24% during the period. The group fee rate is based upon the average net assets of all the mutual funds advised by Fidelity Management & Research Company (FMR) and the investment adviser. The group fee rate decreases as assets under management increase and increases as assets under management decrease. For the reporting period, the total annual management fee rate was .55% of the Fund's average net assets.
Distribution and Service Plan Fees. In accordance with Rule 12b-1 of the 1940 Act, the Fund has adopted separate 12b-1 Plans for each Service Class of shares. Each Service Class pays Fidelity Distributors Corporation (FDC), an affiliate of the investment adviser, a service fee. For the period, the service fee is based on an annual rate of .10% of Service Class' average net assets and .25% of Service Class 2's average net assets.
For the period, total fees, all of which were re-allowed to insurance companies for the distribution of shares and providing shareholder support services, were as follows:
| Service Class | $7,646 |
| Service Class 2 | 348,851 |
| | $356,497 |
Transfer Agent Fees. Fidelity Investments Institutional Operations Company, Inc. (FIIOC), an affiliate of the investment adviser, is the Fund's transfer, dividend disbursing, and shareholder servicing agent. FIIOC receives an asset-based fee with respect to each class. Each class pays a fee for transfer agent services, typesetting and printing and mailing of shareholder reports, excluding mailing of proxy statements, equal to an annual rate of class-level average net assets. The annual rate for Investor Class is .15% and the annual rate for all other classes is .07%. For the period, transfer agent fees for each class were as follows:
| Initial Class | $69,051 |
| Service Class | 5,040 |
| Service Class 2 | 92,004 |
| Investor Class | 302,355 |
| | $468,450 |
Accounting and Security Lending Fees. Fidelity Service Company, Inc. (FSC), an affiliate of the investment adviser, maintains the Fund's accounting records. The accounting fee is based on the level of average net assets for each month. Under a separate contract, FSC administers the security lending program. The security lending fee is based on the number and duration of lending transactions.
Brokerage Commissions. The Fund placed a portion of its portfolio transactions with brokerage firms which are affiliates of the investment adviser. Brokerage commissions are included in net realized gain (loss) and change in net unrealized appreciation (depreciation) in the Statement of Operations. The commissions paid to these affiliated firms were $4,323 for the period.
Interfund Trades. The Fund may purchase from or sell securities to other Fidelity Funds under procedures adopted by the Board. The procedures have been designed to ensure these interfund trades are executed in accordance with Rule 17a-7 of the 1940 Act. Interfund trades are included within the respective purchases and sales amounts shown in the Purchases and Sales of Investments note.
6. Committed Line of Credit.
The Fund participates with other funds managed by the investment adviser or an affiliate in a $4.25 billion credit facility (the "line of credit") to be utilized for temporary or emergency purposes to fund shareholder redemptions or for other short-term liquidity purposes. The Fund has agreed to pay commitment fees on its pro-rata portion of the line of credit, which amounted to $1,602 and is reflected in Miscellaneous expenses on the Statement of Operations. During the period, the Fund did not borrow on this line of credit.
7. Security Lending.
The Fund lends portfolio securities through a lending agent from time to time in order to earn additional income. On the settlement date of the loan, the Fund receives collateral (in the form of U.S. Treasury obligations, letters of credit and/or cash) against the loaned securities and maintains collateral in an amount not less than 100% of the market value of the loaned securities during the period of the loan. The market value of the loaned securities is determined at the close of business of the Fund and any additional required collateral is delivered to the Fund on the next business day. The Fund or borrower may terminate the loan at any time, and if the borrower defaults on its obligation to return the securities loaned because of insolvency or other reasons, the Fund may apply collateral received from the borrower against the obligation. The Fund may experience delays and costs in recovering the securities loaned. Any cash collateral received is invested in the Fidelity Securities Lending Cash Central Fund. The value of loaned securities and cash collateral at period end are disclosed on the Fund's Statement of Assets and Liabilities. Security lending income represents the income earned on investing cash collateral, less rebates paid to borrowers and any lending agent fees associated with the loan, plus any premium payments received for lending certain types of securities. Security lending income is presented in the Statement of Operations as a component of income from Fidelity Central Funds. Total security lending income during the period amounted to $740.
8. Expense Reductions.
Commissions paid to certain brokers with whom the investment adviser, or its affiliates, places trades on behalf of the Fund include an amount in addition to trade execution, which may be rebated back to the Fund to offset certain expenses. This amount totaled $40,551 for the period. In addition, through arrangements with the Fund's custodian, credits realized as a result of certain uninvested cash balances were used to reduce the Fund's expenses. During the period, these credits reduced the Fund's custody expenses by $175.
In addition, during the period the investment adviser reimbursed and/or waived a portion of fund-level operating expenses in the amount of $5,497.
9. Distributions to Shareholders.
Distributions to shareholders of each class were as follows:
| | Year ended
December 31, 2017 | Year ended December 31, 2016 |
| From net investment income | | |
| Initial Class | $1,944,865 | $1,479,452 |
| Service Class | 137,817 | 122,867 |
| Service Class 2 | 2,176,827 | 2,720,253 |
| Investor Class | 3,448,986 | 3,188,131 |
| Total | $7,708,495 | $7,510,703 |
| From net realized gain | | |
| Initial Class | $5,887,635 | $1,022,548 |
| Service Class | 517,241 | 65,959 |
| Service Class 2 | 12,818,755 | 2,089,069 |
| Investor Class | 13,351,793 | 2,304,772 |
| Total | $32,575,424 | $5,482,348 |
10. Share Transactions.
Transactions for each class of shares were as follows:
| | Shares | Shares | Dollars | Dollars |
| | Year ended
December 31, 2017 | Year ended December 31, 2016 | Year ended
December 31, 2017 | Year ended December 31, 2016 |
| Initial Class | | | | |
| Shares sold | 1,328,932 | 912,880 | $25,892,801 | $18,825,356 |
| Reinvestment of distributions | 408,095 | 129,764 | 7,832,500 | 2,502,000 |
| Shares redeemed | (1,310,835) | (1,051,234) | (25,436,492) | (21,038,349) |
| Net increase (decrease) | 426,192 | (8,590) | $8,288,809 | $289,007 |
| Service Class | | | | |
| Shares sold | 106,242 | 378,336 | $2,065,928 | $7,872,935 |
| Reinvestment of distributions | 34,280 | 9,704 | 655,058 | 188,826 |
| Shares redeemed | (169,763) | (159,632) | (3,268,034) | (3,149,906) |
| Net increase (decrease) | (29,241) | 228,408 | $(547,048) | $4,911,855 |
| Service Class 2 | | | | |
| Shares sold | 1,470,560 | 3,592,079 | $28,220,688 | $73,409,037 |
| Reinvestment of distributions | 794,853 | 253,108 | 14,995,582 | 4,809,322 |
| Shares redeemed | (6,751,913) | (3,162,022) | (126,077,833) | (63,089,300) |
| Net increase (decrease) | (4,486,500) | 683,165 | $(82,861,563) | $15,129,059 |
| Investor Class | | | | |
| Shares sold | 171,163 | 1,914,454 | $3,348,089 | $40,035,719 |
| Reinvestment of distributions | 880,677 | 286,439 | 16,800,778 | 5,492,903 |
| Shares redeemed | (2,825,724) | (2,141,295) | (54,346,880) | (42,460,592) |
| Net increase (decrease) | (1,773,884) | 59,598 | $(34,198,013) | $3,068,030 |
11. Other.
The Fund's organizational documents provide former and current trustees and officers with a limited indemnification against liabilities arising in connection with the performance of their duties to the Fund. In the normal course of business, the Fund may also enter into contracts that provide general indemnifications. The Fund's maximum exposure under these arrangements is unknown as this would be dependent on future claims that may be made against the Fund. The risk of material loss from such claims is considered remote.
At the end of the period, the investment adviser or its affiliates were the owners of record of 54% of the total outstanding shares of the Fund and one otherwise unaffiliated shareholder was the owner of record of 14% of the total outstanding shares of the Fund.
Report of Independent Registered Public Accounting Firm
To the Board of Trustees of Variable Insurance Products Fund IV and Shareholders of VIP Real Estate Portfolio:
Opinion on the Financial Statements
We have audited the accompanying statement of assets and liabilities, including the schedule of investments, of VIP Real Estate Portfolio (one of the funds constituting Variable Insurance Products Fund IV, referred to hereafter as the “Fund”) as of December 31, 2017, the related statement of operations for the year ended December 31, 2017, the statement of changes in net assets for each of the two years in the period ended December 31, 2017, including the related notes, and the financial highlights for each of the five years in the period ended December 31, 2017 (collectively referred to as the “financial statements”). In our opinion, the financial statements present fairly, in all material respects, the financial position of the Fund as of December 31, 2017, the results of its operations for the year then ended, the changes in its net assets for each of the two years in the period ended December 31, 2017 and the financial highlights for each of the five years in the period ended December 31, 2017 in conformity with accounting principles generally accepted in the United States of America.
Basis for Opinion
These financial statements are the responsibility of the Fund’s management. Our responsibility is to express an opinion on the Fund’s financial statements based on our audits. We are a public accounting firm registered with the Public Company Accounting Oversight Board (United States) (“PCAOB”) and are required to be independent with respect to the Fund in accordance with the U.S. federal securities laws and the applicable rules and regulations of the Securities and Exchange Commission and the PCAOB.
We conducted our audits of these financial statements in accordance with the standards of the PCAOB. Those standards require that we plan and perform the audit to obtain reasonable assurance about whether the financial statements are free of material misstatement, whether due to error or fraud.
Our audits included performing procedures to assess the risks of material misstatement of the financial statements, whether due to error or fraud, and performing procedures that respond to those risks. Such procedures included examining, on a test basis, evidence regarding the amounts and disclosures in the financial statements. Our audits also included evaluating the accounting principles used and significant estimates made by management, as well as evaluating the overall presentation of the financial statements. Our procedures included confirmation of securities owned as of December 31, 2017 by correspondence with the custodian and brokers; when replies were not received from brokers, we performed other auditing procedures. We believe that our audits provide a reasonable basis for our opinion.
PricewaterhouseCoopers LLP
Boston, Massachusetts
February 15, 2018
We have served as the auditor of one or more investment companies in the Fidelity group of funds since 1932.
Trustees and Officers
The Trustees, Members of the Advisory Board (if any), and officers of the trust and fund, as applicable, are listed below. The Board of Trustees governs the fund and is responsible for protecting the interests of shareholders. The Trustees are experienced executives who meet periodically throughout the year to oversee the fund's activities, review contractual arrangements with companies that provide services to the fund, oversee management of the risks associated with such activities and contractual arrangements, and review the fund's performance. Each of the Trustees oversees 91 funds.
The Trustees hold office without limit in time except that (a) any Trustee may resign; (b) any Trustee may be removed by written instrument, signed by at least two-thirds of the number of Trustees prior to such removal; (c) any Trustee who requests to be retired or who has become incapacitated by illness or injury may be retired by written instrument signed by a majority of the other Trustees; and (d) any Trustee may be removed at any special meeting of shareholders by a two-thirds vote of the outstanding voting securities of the trust. Each Trustee who is not an interested person (as defined in the 1940 Act) of the trust and the fund is referred to herein as an Independent Trustee. Each Independent Trustee shall retire not later than the last day of the calendar year in which his or her 75th birthday occurs. The Independent Trustees may waive this mandatory retirement age policy with respect to individual Trustees. Officers and Advisory Board Members hold office without limit in time, except that any officer or Advisory Board Member may resign or may be removed by a vote of a majority of the Trustees at any regular meeting or any special meeting of the Trustees. Except as indicated, each individual has held the office shown or other offices in the same company for the past five years.
The fund’s Statement of Additional Information (SAI) includes more information about the Trustees. To request a free copy, call Fidelity at 1-877-208-0098.
Experience, Skills, Attributes, and Qualifications of the Trustees. The Governance and Nominating Committee has adopted a statement of policy that describes the experience, qualifications, attributes, and skills that are necessary and desirable for potential Independent Trustee candidates (Statement of Policy). The Board believes that each Trustee satisfied at the time he or she was initially elected or appointed a Trustee, and continues to satisfy, the standards contemplated by the Statement of Policy. The Governance and Nominating Committee also engages professional search firms to help identify potential Independent Trustee candidates who have the experience, qualifications, attributes, and skills consistent with the Statement of Policy. From time to time, additional criteria based on the composition and skills of the current Independent Trustees, as well as experience or skills that may be appropriate in light of future changes to board composition, business conditions, and regulatory or other developments, have also been considered by the professional search firms and the Governance and Nominating Committee. In addition, the Board takes into account the Trustees' commitment and participation in Board and committee meetings, as well as their leadership of standing and ad hoc committees throughout their tenure.
In determining that a particular Trustee was and continues to be qualified to serve as a Trustee, the Board has considered a variety of criteria, none of which, in isolation, was controlling. The Board believes that, collectively, the Trustees have balanced and diverse experience, qualifications, attributes, and skills, which allow the Board to operate effectively in governing the fund and protecting the interests of shareholders. Information about the specific experience, skills, attributes, and qualifications of each Trustee, which in each case led to the Board's conclusion that the Trustee should serve (or continue to serve) as a trustee of the fund, is provided below.
Board Structure and Oversight Function. Brian B. Hogan is an interested person and currently serves as Chairman. The Trustees have determined that an interested Chairman is appropriate and benefits shareholders because an interested Chairman has a personal and professional stake in the quality and continuity of services provided to the fund. Independent Trustees exercise their informed business judgment to appoint an individual of their choosing to serve as Chairman, regardless of whether the Trustee happens to be independent or a member of management. The Independent Trustees have determined that they can act independently and effectively without having an Independent Trustee serve as Chairman and that a key structural component for assuring that they are in a position to do so is for the Independent Trustees to constitute a substantial majority for the Board. The Independent Trustees also regularly meet in executive session. Michael E. Wiley serves as Chairman of the Independent Trustees and as such (i) acts as a liaison between the Independent Trustees and management with respect to matters important to the Independent Trustees and (ii) with management prepares agendas for Board meetings.
Fidelity® funds are overseen by different Boards of Trustees. The fund's Board oversees Fidelity's sector portfolios. Other Boards oversee Fidelity's equity and high income funds, and Fidelity's investment grade bond, money market, and asset allocation funds. The use of separate Boards, each with its own committee structure, allows the Trustees of each group of Fidelity® funds to focus on the unique issues of the funds they oversee, including common research, investment, and operational issues. On occasion, the separate Boards establish joint committees to address issues of overlapping consequences for the Fidelity® funds overseen by each Board.
The Trustees operate using a system of committees to facilitate the timely and efficient consideration of all matters of importance to the Trustees, the fund, and fund shareholders and to facilitate compliance with legal and regulatory requirements and oversight of the fund's activities and associated risks. The Board, acting through its committees, has charged SelectCo and its affiliates with (i) identifying events or circumstances the occurrence of which could have demonstrably adverse effects on the fund's business and/or reputation; (ii) implementing processes and controls to lessen the possibility that such events or circumstances occur or to mitigate the effects of such events or circumstances if they do occur; and (iii) creating and maintaining a system designed to evaluate continuously business and market conditions in order to facilitate the identification and implementation processes described in (i) and (ii) above. Because the day-to-day operations and activities of the fund are carried out by or through SelectCo, its affiliates, and other service providers, the fund's exposure to risks is mitigated but not eliminated by the processes overseen by the Trustees. While each of the Board's committees has responsibility for overseeing different aspects of the fund's activities, oversight is exercised primarily through the Operations and Audit Committees. Appropriate personnel, including but not limited to the fund's Chief Compliance Officer (CCO), SelectCo's internal auditor, the independent accountants, the fund's Treasurer and portfolio management personnel, make periodic reports to the Board's committees, as appropriate. The responsibilities of each standing committee, including their oversight responsibilities, are described further under "Standing Committees of the Trustees."
Interested Trustees*:
Correspondence intended for a Trustee who is an interested person may be sent to Fidelity Investments, 245 Summer Street, Boston, Massachusetts 02210.
Name, Year of Birth; Principal Occupations and Other Relevant Experience+
Brian B. Hogan (1964)
Year of Election or Appointment: 2014
Trustee
Chairman of the Board of Trustees
Mr. Hogan also serves as Trustee or Vice President of other funds. Mr. Hogan serves as a Director of FMR Investment Management (UK) Limited (investment adviser firm, 2015-present) and Fidelity SelectCo, LLC (investment adviser firm, 2014-present) and President of the Equity Division of FMR (investment adviser firm, 2009-present). Previously, Mr. Hogan served as Senior Vice President, Equity Research of FMR (2006-2009) and as a portfolio manager. Mr. Brian B. Hogan is not related to Mr. Colm A. Hogan.
* Determined to be an "Interested Trustee" by virtue of, among other things, his or her affiliation with the trust or various entities under common control with SelectCo.
+ The information includes the Trustee's principal occupation during the last five years and other information relating to the experience, attributes, and skills relevant to the Trustee's qualifications to serve as a Trustee, which led to the conclusion that the Trustee should serve as a Trustee for the fund.
Independent Trustees:
Correspondence intended for an Independent Trustee may be sent to Fidelity Investments, P.O. Box 55235, Boston, Massachusetts 02205-5235.
Name, Year of Birth; Principal Occupations and Other Relevant Experience+
David A. Rosow (1942)
Year of Election or Appointment: 2013
Trustee
Mr. Rosow also serves as Trustee of other Fidelity® funds. Prior to his retirement in 2006, Mr. Rosow was the Chief Executive Officer, owner and operator of a number of private companies, which encompassed the oil refining, drilling and marketing of petroleum products (including specialty petroleum products), recreation industry, and real estate development. Mr. Rosow currently serves as a Director of Oxbow Carbon LLC (upgraders, marketers, and distributors of petroleum byproducts of the oil refining process, 2015-present) and Oxbridge Academy of the Palm Beaches (2015-present) and serves as its President and CEO. Previously, Mr. Rosow served on the Fairfield Country Day School Board for 27 years, including as its President for 3 years, stepping down in 2006. Mr. Rosow served as Lead Director and Chairman of the Audit Committee of Hudson United Bancorp (1996-2006), Chairman of the Board of Westport Bank and Trust (1992-1996), and as a Director of TD Banknorth (2006-2007). In addition, Mr. Rosow served as a member (2008-2014) and President (2009-2014) of the Town Council of Palm Beach, Florida. Mr. Rosow also served as a Member of the Advisory Board of certain Fidelity® funds (2012-2013).
Garnett A. Smith (1947)
Year of Election or Appointment: 2013
Trustee
Mr. Smith also serves as Trustee of other Fidelity® funds. Prior to Mr. Smith's retirement, he served as Chairman and Chief Executive Officer of Inbrand Corp. (manufacturer of personal absorbent products, 1990-1997). He also served as President (1986-1990) of Inbrand Corp. Prior to his employment with Inbrand Corp., he was employed by a retail fabric chain and North Carolina National Bank. In addition, Mr. Smith served as a Member of the Advisory Board of certain Fidelity® funds (2012-2013) and as a board member of the Jackson Hole Land Trust (2009-2012).
Michael E. Wiley (1950)
Year of Election or Appointment: 2008
Trustee
Chairman of the Independent Trustees
Mr. Wiley also serves as Trustee of other Fidelity® funds. Mr. Wiley serves as a Director of Andeavor Corporation (independent oil refiner and marketer, 2005-present), a Director of Andeavor Logistics LP (natural resources logistics, 2015-present), and a Director of Bill Barrett Corporation (exploration and production, 2005-present). In addition, Mr. Wiley also serves as a Director of Post Oak Bank (privately-held bank, 2004-present). Previously, Mr. Wiley served as a Trustee of other Fidelity® funds (2008-2013), as a Director of Asia Pacific Exploration Consolidated (international oil and gas exploration and production, 2008-2013), as a member of the Board of Trustees of the University of Tulsa (2000-2006; 2007-2010), as a Senior Energy Advisor of Katzenbach Partners, LLC (consulting, 2006-2007), as an Advisory Director of Riverstone Holdings (private investment), Chairman, President, and CEO of Baker Hughes, Inc. (oilfield services, 2000-2004), and as Director of Spinnaker Exploration Company (exploration and production, 2001-2005).
+ The information includes the Trustee's principal occupation during the last five years and other information relating to the experience, attributes, and skills relevant to the Trustee's qualifications to serve as a Trustee, which led to the conclusion that the Trustee should serve as a Trustee for the fund.
Advisory Board Members and Officers:
Correspondence intended for a Member of the Advisory Board (if any) may be sent to Fidelity Investments, P.O. Box 55235, Boston, Massachusetts 02205-5235. Except for Anthony R. Rochte, correspondence intended for an officer may be sent to Fidelity Investments, 245 Summer Street, Boston, Massachusetts 02210. Correspondence intended for Mr. Rochte may be sent to Fidelity SelectCo, LLC (SelectCo), 1225 17th Street, Denver, Colorado 80202-5541. Officers appear below in alphabetical order.
Name, Year of Birth; Principal Occupation
Donald F. Donahue (1950)
Year of Election or Appointment: 2015
Member of the Advisory Board
Mr. Donahue also serves as a Trustee or Member of the Advisory Board of other Fidelity® funds. Mr. Donahue is President and Chief Executive Officer of Miranda Partners, LLC (risk consulting for the financial services industry, 2012-present). Previously, Mr. Donahue served as Chief Executive Officer (2006-2012), Chief Operating Officer (2003-2006), and Managing Director, Customer Marketing and Development (1999-2003) of The Depository Trust & Clearing Corporation (financial markets infrastructure). Mr. Donahue serves as a Member (2007-present) and Co-Chairman (2016-present) of the Board of Directors of United Way of New York, Member of the Board of Directors of NYC Leadership Academy (2012-present) and Member of the Board of Advisors of Ripple Labs, Inc. (financial services, 2015-present). He also served as Chairman (2010-2012) and Member of the Board of Directors (2012-2013) of Omgeo, LLC (financial services), Treasurer of United Way of New York (2012-2016), and Member of the Board of Directors of XBRL US (financial services non-profit, 2009-2012) and the International Securities Services Association (2009-2012).
Carol B. Tomé (1957)
Year of Election or Appointment: 2017
Member of the Advisory Board
Ms. Tomé also serves as Member of the Advisory Board of other Fidelity® funds. Ms. Tomé is Chief Financial Officer (2001-present) and Executive Vice President of Corporate Services (2007-present) of The Home Depot, Inc. (home improvement retailer) and a Director (2003-present) and Chair of the Audit Committee (2004-present) of United Parcel Service, Inc. (package delivery and supply chain management). Previously, Ms. Tomé served as Trustee of certain Fidelity® funds (2017), Senior Vice President of Finance and Accounting/Treasurer (2000-2007) and Vice President and Treasurer (1995-2000) of The Home Depot, Inc. and Chair of the Board (2010-2012), Vice Chair of the Board (2009 and 2013), and a Director (2008-2013) of the Federal Reserve Bank of Atlanta. Ms. Tomé is also a director or trustee of many community and professional organizations.
Elizabeth Paige Baumann (1968)
Year of Election or Appointment: 2017
Anti-Money Laundering (AML) Officer
Ms. Baumann also serves as AML Officer of other funds. She is Chief AML Officer (2012-present) and Senior Vice President (2014-present) of FMR LLC (diversified financial services company) and is an employee of Fidelity Investments. Previously, Ms. Baumann served as AML Officer of the funds (2012-2016), and Vice President (2007-2014) and Deputy Anti-Money Laundering Officer (2007-2012) of FMR LLC.
Marc R. Bryant (1966)
Year of Election or Appointment: 2013
Secretary and Chief Legal Officer (CLO)
Mr. Bryant also serves as Secretary and CLO of other funds. Mr. Bryant serves as CLO, Secretary, and Senior Vice President of Fidelity Management & Research Company (investment adviser firm, 2015-present) and FMR Co., Inc. (investment adviser firm, 2015-present); Secretary of Fidelity SelectCo, LLC (investment adviser firm, 2015-present) and Fidelity Investments Money Management, Inc. (investment adviser firm, 2015-present); and CLO of Fidelity Management & Research (Hong Kong) Limited and FMR Investment Management (UK) Limited (investment adviser firms, 2015-present) and Fidelity Management & Research (Japan) Limited (investment adviser firm, 2016-present). He is Senior Vice President and Deputy General Counsel of FMR LLC (diversified financial services company). Previously, Mr. Bryant served as Secretary and CLO of Fidelity Rutland Square Trust II (2010-2014) and Assistant Secretary of Fidelity's Fixed Income and Asset Allocation Funds (2013-2015). Prior to joining Fidelity Investments, Mr. Bryant served as a Senior Vice President and the Head of Global Retail Legal for AllianceBernstein L.P. (2006-2010), and as the General Counsel for ProFund Advisors LLC (2001-2006).
William C. Coffey (1969)
Year of Election or Appointment: 2009
Assistant Secretary
Mr. Coffey also serves as Assistant Secretary of other funds. He is Senior Vice President and Deputy General Counsel of FMR LLC (diversified financial services company, 2010-present), and is an employee of Fidelity Investments. Previously, Mr. Coffey served as Vice President and Associate General Counsel of FMR LLC (2005-2009).
Jonathan Davis (1968)
Year of Election or Appointment: 2010
Assistant Treasurer
Mr. Davis also serves as Assistant Treasurer of other funds. Mr. Davis serves as Assistant Treasurer of FMR Capital, Inc. (2017-present) and is an employee of Fidelity Investments. Previously, Mr. Davis served as Vice President and Associate General Counsel of FMR LLC (diversified financial services company, 2003-2010).
Adrien E. Deberghes (1967)
Year of Election or Appointment: 2013
President and Treasurer
Mr. Deberghes also serves as an officer of other funds. He serves as Assistant Treasurer of FMR Capital, Inc. (2017-present), Executive Vice President of Fidelity Investments Money Management, Inc. (FIMM) (investment adviser firm, 2016-present), and is an employee of Fidelity Investments (2008-present). Prior to joining Fidelity Investments, Mr. Deberghes was Senior Vice President of Mutual Fund Administration at State Street Corporation (2007-2008), Senior Director of Mutual Fund Administration at Investors Bank & Trust (2005-2007), and Director of Finance for Dunkin' Brands (2000-2005). Previously, Mr. Deberghes served in other fund officer roles.
Joseph DeSantis (1959)
Year of Election or Appointment: 2015
Vice President
Mr. DeSantis also serves as Vice President of other funds. Mr. DeSantis serves as a Director of Fidelity Management & Research (Japan) Limited (investment adviser firm, 2016-present), Chief Investment Officer, Equities (2010-present) and is an employee of Fidelity Investments.
Stephanie J. Dorsey (1969)
Year of Election or Appointment: 2010
Assistant Treasurer
Ms. Dorsey also serves as an officer of other funds. Ms. Dorsey serves as Assistant Treasurer of FMR Capital, Inc. (2017-present), is an employee of Fidelity Investments (2008-present), and has served in other fund officer roles. Prior to joining Fidelity Investments, Ms. Dorsey served as Treasurer (2004-2008) of the JPMorgan Mutual Funds and Vice President (2004-2008) of JPMorgan Chase Bank.
Howard J. Galligan III (1966)
Year of Election or Appointment: 2014
Chief Financial Officer
Mr. Galligan also serves as Chief Financial Officer of other funds. Mr. Galligan serves as President of Fidelity Pricing and Cash Management Services (FPCMS) (2014-present) and as a Director of Strategic Advisers, Inc. (investment adviser firm, 2008-present). Previously, Mr. Galligan served as Chief Administrative Officer of Asset Management (2011-2014) and Chief Operating Officer and Senior Vice President of Investment Support for Strategic Advisers, Inc. (2003-2011).
James D. Gryglewicz (1972)
Year of Election or Appointment: 2014
Chief Compliance Officer
Mr. Gryglewicz also serves as Chief Compliance Officer of other funds. Mr. Gryglewicz serves as Compliance Officer of Strategic Advisers, Inc. (investment adviser firm, 2015-present) and Fidelity SelectCo, LLC (investment adviser firm, 2014-present), Senior Vice President of Asset Management Compliance (2009-present), and is an employee of Fidelity Investments (2004-present).
Brian B. Hogan (1964)
Year of Election or Appointment: 2009
Vice President
Mr. Hogan also serves as Trustee or Vice President of other funds. Mr. Hogan serves as a Director of FMR Investment Management (UK) Limited (investment adviser firm, 2015-present) and Fidelity SelectCo, LLC (investment adviser firm, 2014-present) and President of the Equity Division of FMR (investment adviser firm, 2009-present). Previously, Mr. Hogan served as Senior Vice President, Equity Research of FMR (2006-2009) and as a portfolio manager. Mr. Brian B. Hogan is not related to Mr. Colm A. Hogan.
Colm A. Hogan (1973)
Year of Election or Appointment: 2016
Assistant Treasurer
Mr. Hogan also serves as an officer of other funds. Mr. Hogan serves as Assistant Treasurer of FMR Capital, Inc. (2017-present) and is an employee of Fidelity Investments (2005-present). Mr. Colm A. Hogan is not related to Mr. Brian B. Hogan.
Chris Maher (1972)
Year of Election or Appointment: 2013
Assistant Treasurer
Mr. Maher serves as Assistant Treasurer of other funds. Mr. Maher is Vice President of Valuation Oversight, serves as Assistant Treasurer of FMR Capital, Inc. (2017-present), and is an employee of Fidelity Investments. Previously, Mr. Maher served as Vice President of Asset Management Compliance (2013), Vice President of the Program Management Group of FMR (investment adviser firm, 2010-2013), and Vice President of Valuation Oversight (2008-2010).
Rieco E. Mello (1969)
Year of Election or Appointment: 2017
Assistant Treasurer
Mr. Mello also serves as Assistant Treasurer of other funds. Mr. Mello serves as Assistant Treasurer of FMR Capital, Inc. (2017-present) and is an employee of Fidelity Investments (1995-present).
Anthony R. Rochte (1968)
Year of Election or Appointment: 2013
Vice President
Mr. Rochte also serves as Vice President of other funds. Mr. Rochte serves as President of Fidelity SelectCo, LLC (investment adviser firm, 2012-present) and is an employee of Fidelity Investments (2012-present). Prior to joining Fidelity Investments, Mr. Rochte served as Senior Managing Director and head of State Street Global Advisors' North American Intermediary Business Group (2006-2012).
Stacie M. Smith (1974)
Year of Election or Appointment: 2013
Assistant Treasurer
Ms. Smith also serves as an officer of other funds. Ms. Smith serves as Assistant Treasurer of FMR Capital, Inc. (2017-present), is an employee of Fidelity Investments (2009-present), and has served in other fund officer roles. Prior to joining Fidelity Investments, Ms. Smith served as Senior Audit Manager of Ernst & Young LLP (accounting firm, 1996-2009). Previously, Ms. Smith served as Deputy Treasurer of certain Fidelity® funds (2013-2016).
Marc L. Spector (1972)
Year of Election or Appointment: 2017
Assistant Treasurer
Mr. Spector also serves as an officer of other funds. Mr. Spector serves as Assistant Treasurer of FMR Capital, Inc. (2017-present) and is an employee of Fidelity Investments (2016-present). Prior to joining Fidelity Investments, Mr. Spector served as Director at the Siegfried Group (accounting firm, 2013-2016), and prior to Siegfried Group as audit senior manager at Deloitte & Touche (accounting firm, 2005-2013).
Renee Stagnone (1975)
Year of Election or Appointment: 2016
Assistant Treasurer
Ms. Stagnone also serves as an officer of other funds. Ms. Stagnone serves as Assistant Treasurer of FMR Capital, Inc. (2017-present) and is an employee of Fidelity Investments (1997-present). Previously, Ms. Stagnone served as Deputy Treasurer of certain Fidelity® funds (2013-2016).
Shareholder Expense Example
As a shareholder of the Fund, you incur two types of costs: (1) transaction costs, and (2) ongoing costs, including management fees, distribution and/or service (12b-1) fees and other Fund expenses. This Example is intended to help you understand your ongoing costs (in dollars) of investing in the Fund and to compare these costs with the ongoing costs of investing in other mutual funds.
The Example is based on an investment of $1,000 invested at the beginning of the period and held for the entire period (July 1, 2017 to December 31, 2017).
Actual Expenses
The first line of the accompanying table for each class of the Fund provides information about actual account values and actual expenses. You may use the information in this line, together with the amount you invested, to estimate the expenses that you paid over the period. Simply divide your account value by $1,000.00 (for example, an $8,600 account value divided by $1,000.00 = 8.6), then multiply the result by the number in the first line for a class of the Fund under the heading entitled "Expenses Paid During Period" to estimate the expenses you paid on your account during this period. The estimate of expenses does not include any fees or other expenses of any variable annuity or variable life insurance product. If they were, the estimate of expenses you paid during the period would be higher, and your ending account value would be lower. In addition, the Fund, as a shareholder in the underlying Fidelity Central Funds, will indirectly bear its pro-rata share of the fees and expenses incurred by the underlying Fidelity Central Funds. These fees and expenses are not included in the Fund's annualized expense ratio used to calculate the expense estimate in the table below.
Hypothetical Example for Comparison Purposes
The second line of the accompanying table for each class of the Fund provides information about hypothetical account values and hypothetical expenses based on a Class' actual expense ratio and an assumed rate of return of 5% per year before expenses, which is not the Class' actual return. The hypothetical account values and expenses may not be used to estimate the actual ending account balance or expenses you paid for the period. You may use this information to compare the ongoing costs of investing in the Fund and other funds. To do so, compare this 5% hypothetical example with the 5% hypothetical examples that appear in the shareholder reports of the other funds. The estimate of expenses does not include any fees or other expenses of any variable annuity or variable life insurance product. If they were, the estimate of expenses you paid during the period would be higher, and your ending account value would be lower. In addition, the Fund, as a shareholder in the underlying Fidelity Central Funds, will indirectly bear its pro-rata share of the fees and expenses incurred by the underlying Fidelity Central Funds. These fees and expenses are not included in the Fund's annualized expense ratio used to calculate the expense estimate in the table below.
Please note that the expenses shown in the table are meant to highlight your ongoing costs only and do not reflect any transaction costs. Therefore, the second line of the table is useful in comparing ongoing costs only, and will not help you determine the relative total costs of owning different funds.
| | Annualized Expense Ratio-A | Beginning
Account Value
July 1, 2017 | Ending
Account Value
December 31, 2017 | Expenses Paid
During Period-B
July 1, 2017
to December 31, 2017 |
| Initial Class | .68% | | | |
| Actual | | $1,000.00 | $1,018.30 | $3.46 |
| Hypothetical-C | | $1,000.00 | $1,021.78 | $3.47 |
| Service Class | .78% | | | |
| Actual | | $1,000.00 | $1,017.50 | $3.97 |
| Hypothetical-C | | $1,000.00 | $1,021.27 | $3.97 |
| Service Class 2 | .93% | | | |
| Actual | | $1,000.00 | $1,016.50 | $4.73 |
| Hypothetical-C | | $1,000.00 | $1,020.52 | $4.74 |
| Investor Class | .76% | | | |
| Actual | | $1,000.00 | $1,018.10 | $3.87 |
| Hypothetical-C | | $1,000.00 | $1,021.37 | $3.87 |
A Annualized expense ratio reflects expenses net of applicable fee waivers.
B Expenses are equal to each Class' annualized expense ratio, multiplied by the average account value over the period, multiplied by 184/365 (to reflect the one-half year period).
C 5% return per year before expenses
Distributions (Unaudited)
The Board of Trustees of VIP Real Estate Portfolio voted to pay to shareholders of record at the opening of business on record date, the following distributions per share derived from capital gains realized from sales of portfolio securities, and dividends derived from net investment income:
| | Pay Date | Record Date | Dividends | Capital Gains |
| VIP Real Estate Portfolio | | | | |
| Initial Class | 02/09/18 | 02/09/18 | $0.097 | $1.004 |
| Service Class | 02/09/18 | 02/09/18 | $0.094 | $1.004 |
| Service Class 2 | 02/09/18 | 02/09/18 | $0.089 | $1.004 |
| Investor Class | 02/09/18 | 02/09/18 | $0.094 | $1.004 |
|
The fund hereby designates as a capital gain dividend with respect to the taxable year ended December 31, 2017, $21,291,930, or, if subsequently determined to be different, the net capital gain of such year.
VIPRE-ANN-0218
1.781992.115
Fidelity® Variable Insurance Products: Consumer Staples Portfolio
Annual Report December 31, 2017 |
|
Contents
To view a fund's proxy voting guidelines and proxy voting record for the 12-month period ended June 30, visit http://www.fidelity.com/proxyvotingresults or visit the Securities and Exchange Commission's (SEC) web site at http://www.sec.gov.
You may also call 1-877-208-0098 to request a free copy of the proxy voting guidelines.
Fidelity® Variable Insurance Products are separate account options which are purchased through a variable insurance contract.
Standard & Poor's, S&P and S&P 500 are registered service marks of The McGraw-Hill Companies, Inc. and have been licensed for use by Fidelity Distributors Corporation.
Other third-party marks appearing herein are the property of their respective owners.
All other marks appearing herein are registered or unregistered trademarks or service marks of FMR LLC or an affiliated company. © 2018 FMR LLC. All rights reserved.
This report and the financial statements contained herein are submitted for the general information of the shareholders of the Fund. This report is not authorized for distribution to prospective investors in the Fund unless preceded or accompanied by an effective prospectus.
A fund files its complete schedule of portfolio holdings with the SEC for the first and third quarters of each fiscal year on Form N-Q. Forms N-Q are available on the SEC’s web site at http://www.sec.gov. A fund's Forms N-Q may be reviewed and copied at the SEC’s Public Reference Room in Washington, DC. Information regarding the operation of the SEC's Public Reference Room may be obtained by calling 1-800-SEC-0330.
For a complete list of a fund's portfolio holdings, view the most recent holdings listing, semiannual report, or annual report on Fidelity's web site at http://www.fidelity.com, http://www.institutional.fidelity.com, or http://www.401k.com, as applicable.
NOT FDIC INSURED •MAY LOSE VALUE •NO BANK GUARANTEE
Neither the Fund nor Fidelity Distributors Corporation is a bank.
Performance: The Bottom Line
Average annual total return reflects the change in the value of an investment, assuming reinvestment of distributions from dividend income and capital gains (the profits earned upon the sale of securities that have grown in value, if any) and assuming a constant rate of performance each year. During periods of reimbursement by Fidelity, a fund’s total return will be greater than it would be had the reimbursement not occurred. Performance numbers are net of all underlying fund operating expenses, but do not include any insurance charges imposed by your insurance company’s separate account. If performance information included the effect of these additional charges, the total returns would have been lower. How a fund did yesterday is no guarantee of how it will do tomorrow.
Average Annual Total Returns
| For the periods ended December 31, 2017 | Past 1 year | Past 5 years | Past 10 years |
| Initial Class | 14.66% | 12.90% | 9.62% |
| Investor Class | 14.52% | 12.82% | 9.53% |
$10,000 Over 10 Years
Let's say hypothetically that $10,000 was invested in VIP Consumer Staples Portfolio - Initial Class on December 31, 2007.
The chart shows how the value of your investment would have changed, and also shows how the S&P 500® Index performed over the same period.
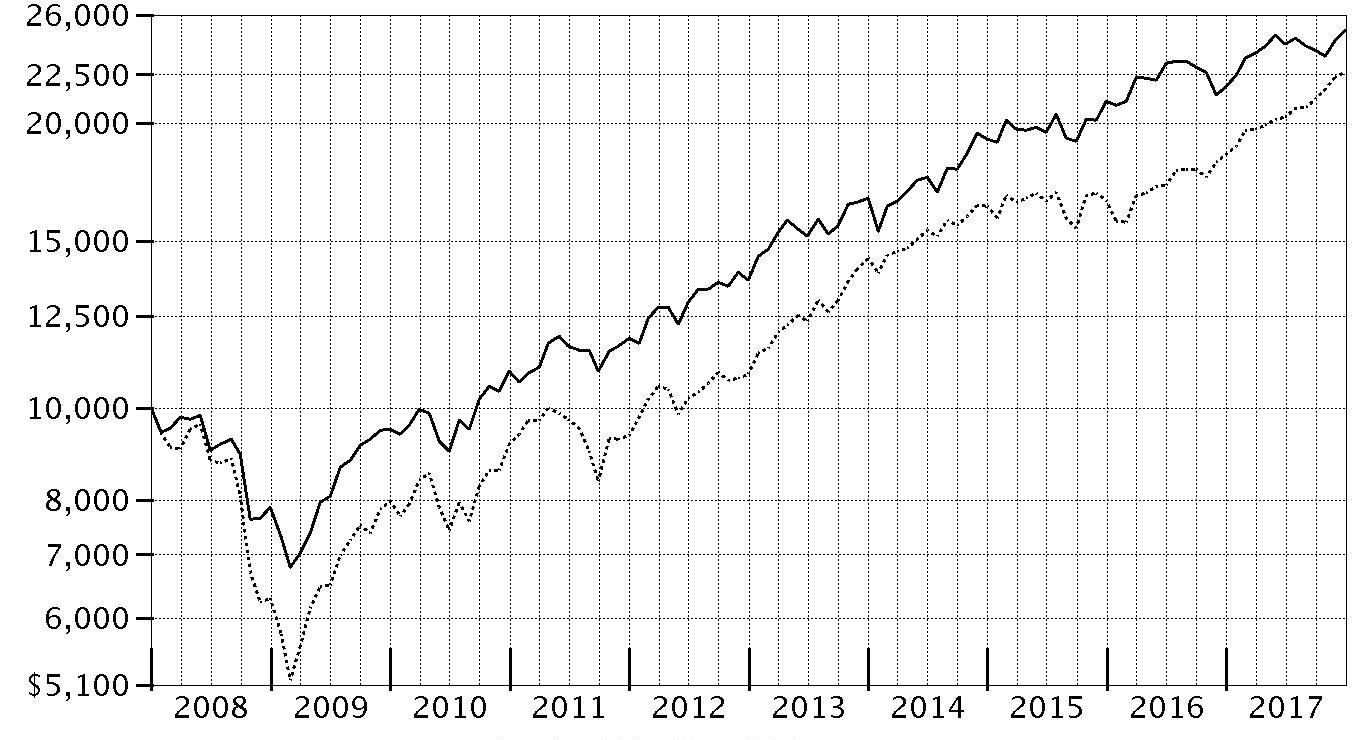
| Period Ending Values |
| $25,050 | VIP Consumer Staples Portfolio - Initial Class |
| $22,603 | S&P 500® Index |
Management's Discussion of Fund Performance
Market Recap: U.S. equities gained 21.83% in 2017, as the S&P 500
® index rose steadily and closed the year just shy of an all-time high after a particularly strong three-month finish. Early on, equities rallied on optimism for President Trump’s pro-business agenda but leveled off in March amid fading optimism and stalled efforts by Congress to repeal and replace the Affordable Care Act. Upward momentum soon returned and continued through year-end with consumer sentiment and other market indicators staying positive. The lone exception was a brief cooldown in August, when geopolitical tension escalated and uncertainty grew regarding the future of health care, tax reform and the debt ceiling. Sector-wise, information technology fared best by a wide margin, rising 39% amid strong earnings growth from several major index constituents. A 24% gain in materials was spurred by increased demand, especially from China. Consumer discretionary gained 23%, despite many brick-and-mortar retailers suffering from online competition, and financials edged the broader market on an uptick in bond yields. Conversely, the defensive energy and telecom services sectors returned about -1% each. Rising interest rates held back real estate (+11%), while consumer staples (+13%) and utilities (+12%) struggled due to investors’ general preference for risk assets.
Comments from Portfolio Manager James McElligott: For the year, the fund’s share classes gained about 15%, topping the 11.91% advance of the MSCI U.S. IMI Consumer Staples 25/50 Index but underperforming the broad-market S&P 500
® index. The consumer staples sector benefited from improved profitability, easing currency headwinds and better global economic growth, but lagged more economically sensitive groups. Versus the MSCI sector index, the biggest contributors were stock picks in the soft drinks and packaged foods & meats industries. The fund's top individual contributor by a wide margin was timely ownership of infant-formula company Mead Johnson Nutrition, which benefited from a generous buyout offer in February 2017. We subsequently eliminated our position. An overweighting in energy-drink company Monster Beverage also helped, as the company’s access to Coca-Cola’s huge distribution network led to market-share gains. Coca-Cola has a 17% ownership stake in Monster. Elsewhere, a non-index stake in Sweden's Svenska Cellulosa rose when the forest and paper products company split into two separate entities. I should also note that the fund had more exposure to international markets than the sector index, which helped performance amid improved economic growth and a broadly weaker U.S. dollar. Conversely, stock picks in the personal products category and underexposure to the hypermarkets & super centers segment hampered relative performance most. Notable individual detractors versus the MSCI index included a sizable underweighting in Wal-Mart Stores, which gained from better-than-expected earnings, and an overweighting in London-based Avon Products, which lost ground due to bad debt expenses, disappointing turnaround execution and an earnings shortfall.
The views expressed above reflect those of the portfolio manager(s) only through the end of the period as stated on the cover of this report and do not necessarily represent the views of Fidelity or any other person in the Fidelity organization. Any such views are subject to change at any time based upon market or other conditions and Fidelity disclaims any responsibility to update such views. These views may not be relied on as investment advice and, because investment decisions for a Fidelity fund are based on numerous factors, may not be relied on as an indication of trading intent on behalf of any Fidelity fund.
Note to shareholders: On December 8, 2017, shareholders approved proposals from the Board of Trustees to eliminate each sector/industry fund's fundamental “invests primarily” policy and to modify the fundamental concentration policy for certain funds. The changes took effect on January 1, 2018, and do not impact how the funds are managed.
Investment Summary (Unaudited)
Top Ten Stocks as of December 31, 2017
| | % of fund's net assets |
| Procter & Gamble Co. | 9.4 |
| The Coca-Cola Co. | 9.1 |
| Philip Morris International, Inc. | 7.8 |
| PepsiCo, Inc. | 7.7 |
| Altria Group, Inc. | 4.1 |
| CVS Health Corp. | 4.1 |
| Mondelez International, Inc. | 3.7 |
| Monster Beverage Corp. | 3.6 |
| Costco Wholesale Corp. | 3.2 |
| Coty, Inc. Class A | 3.1 |
| | 55.8 |
Top Industries (% of fund's net assets)
| As of December 31, 2017 |
| | Beverages | 25.7% |
| | Food Products | 18.9% |
| | Household Products | 15.0% |
| | Tobacco | 14.3% |
| | Food & Staples Retailing | 13.3% |
| | All Others* | 12.8% |

* Includes short-term investments and net other assets (liabilities).
Investments December 31, 2017
Showing Percentage of Net Assets
| Common Stocks - 98.9% | | | |
| | | Shares | Value |
| Beverages - 25.7% | | | |
| Brewers - 0.5% | | | |
| China Resources Beer Holdings Co. Ltd. | | 18,666 | $67,015 |
| Molson Coors Brewing Co. Class B | | 15,900 | 1,304,913 |
| | | | 1,371,928 |
| Distillers & Vintners - 1.9% | | | |
| Constellation Brands, Inc. Class A (sub. vtg.) | | 23,400 | 5,348,538 |
| Kweichow Moutai Co. Ltd. (A Shares) | | 1,550 | 166,155 |
| | | | 5,514,693 |
| Soft Drinks - 23.3% | | | |
| Britvic PLC | | 58,800 | 647,019 |
| Coca-Cola Bottling Co. Consolidated | | 11,730 | 2,525,000 |
| Coca-Cola European Partners PLC | | 99,100 | 3,949,135 |
| Coca-Cola HBC AG | | 6,720 | 219,567 |
| Coca-Cola West Co. Ltd. | | 11,550 | 421,817 |
| Fever-Tree Drinks PLC | | 14,694 | 451,736 |
| Monster Beverage Corp. (a) | | 164,500 | 10,411,205 |
| PepsiCo, Inc. | | 185,606 | 22,257,872 |
| The Coca-Cola Co. | | 569,438 | 26,125,815 |
| | | | 67,009,166 |
|
| TOTAL BEVERAGES | | | 73,895,787 |
|
| Capital Markets - 0.6% | | | |
| Diversified Capital Markets - 0.6% | | | |
| Beijing Yanjing Brewery Co. Ltd. ELS (UBS Warrant Programme) warrants 9/24/18 (a)(b) | | 1,724,279 | 1,786,117 |
| Chemicals - 0.3% | | | |
| Specialty Chemicals - 0.3% | | | |
| Frutarom Industries Ltd. | | 8,100 | 760,033 |
| Food & Staples Retailing - 13.3% | | | |
| Drug Retail - 6.5% | | | |
| CVS Health Corp. | | 159,839 | 11,588,328 |
| Rite Aid Corp. (a)(c) | | 181,900 | 358,343 |
| Walgreens Boots Alliance, Inc. | | 91,400 | 6,637,468 |
| | | | 18,584,139 |
| Food Distributors - 1.4% | | | |
| Sysco Corp. | | 55,100 | 3,346,223 |
| United Natural Foods, Inc. (a) | | 12,200 | 601,094 |
| | | | 3,947,317 |
| Food Retail - 1.3% | | | |
| Kroger Co. | | 98,852 | 2,713,487 |
| Sprouts Farmers Market LLC (a) | | 41,100 | 1,000,785 |
| | | | 3,714,272 |
| Hypermarkets & Super Centers - 4.1% | | | |
| Costco Wholesale Corp. | | 49,300 | 9,175,716 |
| Wal-Mart Stores, Inc. | | 27,204 | 2,686,395 |
| | | | 11,862,111 |
|
| TOTAL FOOD & STAPLES RETAILING | | | 38,107,839 |
|
| Food Products - 18.9% | | | |
| Agricultural Products - 1.4% | | | |
| Bunge Ltd. | | 25,700 | 1,723,956 |
| Darling International, Inc. (a) | | 80,600 | 1,461,278 |
| Ingredion, Inc. | | 5,900 | 824,820 |
| | | | 4,010,054 |
| Packaged Foods & Meats - 17.5% | | | |
| Blue Buffalo Pet Products, Inc. (a)(c) | | 30,900 | 1,013,211 |
| ConAgra Foods, Inc. | | 99,300 | 3,740,631 |
| Danone SA | | 20,759 | 1,739,416 |
| Hostess Brands, Inc. Class A (a) | | 9,400 | 139,214 |
| JBS SA | | 571,500 | 1,690,156 |
| Kellogg Co. | | 59,100 | 4,017,618 |
| Mondelez International, Inc. | | 248,900 | 10,652,920 |
| Post Holdings, Inc. (a) | | 21,400 | 1,695,522 |
| The Hain Celestial Group, Inc. (a) | | 81,880 | 3,470,893 |
| The Hershey Co. | | 11,300 | 1,282,663 |
| The J.M. Smucker Co. | | 43,600 | 5,416,864 |
| The Kraft Heinz Co. | | 94,500 | 7,348,320 |
| The Simply Good Foods Co. | | 296,600 | 4,229,516 |
| TreeHouse Foods, Inc. (a) | | 79,600 | 3,937,016 |
| | | | 50,373,960 |
|
| TOTAL FOOD PRODUCTS | | | 54,384,014 |
|
| Hotels, Restaurants & Leisure - 1.0% | | | |
| Restaurants - 1.0% | | | |
| U.S. Foods Holding Corp. (a) | | 90,800 | 2,899,244 |
| Household Durables - 0.1% | | | |
| Housewares & Specialties - 0.1% | | | |
| Newell Brands, Inc. | | 5,772 | 178,355 |
| Household Products - 15.0% | | | |
| Household Products - 15.0% | | | |
| Colgate-Palmolive Co. | | 67,190 | 5,069,486 |
| Essity AB Class B | | 129,300 | 3,672,624 |
| Procter & Gamble Co. | | 292,907 | 26,912,295 |
| Reckitt Benckiser Group PLC | | 7,976 | 744,109 |
| Spectrum Brands Holdings, Inc. (c) | | 60,300 | 6,777,720 |
| | | | 43,176,234 |
| Internet & Direct Marketing Retail - 0.5% | | | |
| Internet & Direct Marketing Retail - 0.5% | | | |
| Amazon.com, Inc. (a) | | 1,200 | 1,403,364 |
| Paper & Forest Products - 0.2% | | | |
| Forest Products - 0.2% | | | |
| Svenska Cellulosa AB (SCA) (B Shares) | | 60,100 | 619,455 |
| Personal Products - 9.0% | | | |
| Personal Products - 9.0% | | | |
| Avon Products, Inc. (a) | | 1,439,000 | 3,093,850 |
| Coty, Inc. Class A | | 454,948 | 9,048,916 |
| Estee Lauder Companies, Inc. Class A | | 26,800 | 3,410,032 |
| Herbalife Ltd. (a) | | 34,800 | 2,356,656 |
| Ontex Group NV | | 23,100 | 764,283 |
| Unilever NV (Certificaten Van Aandelen) (Bearer) | | 126,286 | 7,110,281 |
| | | | 25,784,018 |
| Tobacco - 14.3% | | | |
| Tobacco - 14.3% | | | |
| Altria Group, Inc. | | 167,296 | 11,946,607 |
| British American Tobacco PLC sponsored ADR | | 97,396 | 6,524,558 |
| Imperial Tobacco Group PLC | | 172 | 7,352 |
| Japan Tobacco, Inc. | | 8,900 | 286,806 |
| Philip Morris International, Inc. | | 212,134 | 22,411,957 |
| | | | 41,177,280 |
| TOTAL COMMON STOCKS | | | |
| (Cost $226,612,573) | | | 284,171,740 |
|
| Convertible Preferred Stocks - 0.7% | | | |
| Internet & Direct Marketing Retail - 0.7% | | | |
| Internet & Direct Marketing Retail - 0.7% | | | |
| The Honest Co., Inc.: | | | |
| Series D (a)(d)(e) | | 32,783 | 1,105,879 |
| Series E (d)(e) | | 51,008 | 1,000,002 |
| TOTAL CONVERTIBLE PREFERRED STOCKS | | | |
| (Cost $2,499,988) | | | 2,105,881 |
|
| Money Market Funds - 1.7% | | | |
| Fidelity Cash Central Fund, 1.36% (f) | | 757,988 | 758,139 |
| Fidelity Securities Lending Cash Central Fund 1.36% (f)(g) | | 4,141,688 | 4,142,516 |
| TOTAL MONEY MARKET FUNDS | | | |
| (Cost $4,900,403) | | | 4,900,655 |
| TOTAL INVESTMENT IN SECURITIES - 101.3% | | | |
| (Cost $234,012,964) | | | 291,178,276 |
| NET OTHER ASSETS (LIABILITIES) - (1.3)% | | | (3,699,090) |
| NET ASSETS - 100% | | | $287,479,186 |
Security Type Abbreviations
ELS – Equity-Linked Security
Legend
(a) Non-income producing
(b) Security exempt from registration under Rule 144A of the Securities Act of 1933. These securities may be resold in transactions exempt from registration, normally to qualified institutional buyers. At the end of the period, the value of these securities amounted to $1,786,117 or 0.6% of net assets.
(c) Security or a portion of the security is on loan at period end.
(d) Restricted securities - Investment in securities not registered under the Securities Act of 1933 (excluding 144A issues). At the end of the period, the value of restricted securities (excluding 144A issues) amounted to $2,105,881 or 0.7% of net assets.
(e) Level 3 security
(f) Affiliated fund that is generally available only to investment companies and other accounts managed by Fidelity Investments. The rate quoted is the annualized seven-day yield of the fund at period end. A complete unaudited listing of the fund's holdings as of its most recent quarter end is available upon request. In addition, each Fidelity Central Fund's financial statements, which are not covered by the Fund's Report of Independent Registered Public Accounting Firm, are available on the SEC's website or upon request.
(g) Investment made with cash collateral received from securities on loan.
Additional information on each restricted holding is as follows:
| Security | Acquisition Date | Acquisition Cost |
| The Honest Co., Inc. Series D | 8/3/15 | $1,499,986 |
| The Honest Co., Inc. Series E | 9/28/17 | $1,000,002 |
Affiliated Central Funds
Information regarding fiscal year to date income earned by the Fund from investments in Fidelity Central Funds is as follows:
| Fund | Income earned |
| Fidelity Cash Central Fund | $6,180 |
| Fidelity Securities Lending Cash Central Fund | 254,205 |
| Total | $260,385 |
Amounts in the income column in the above table include any capital gain distributions from underlying funds, which are presented in the corresponding line-item in the Statement of Operations if applicable.
Investment Valuation
The following is a summary of the inputs used, as of December 31, 2017, involving the Fund's assets and liabilities carried at fair value. The inputs or methodology used for valuing securities may not be an indication of the risk associated with investing in those securities. For more information on valuation inputs, and their aggregation into the levels used below, please refer to the Investment Valuation section in the accompanying Notes to Financial Statements.
| | Valuation Inputs at Reporting Date: |
| Description | Total | Level 1 | Level 2 | Level 3 |
| Investments in Securities: | | | | |
| Common Stocks | $284,171,740 | $272,791,817 | $11,379,923 | $-- |
| Convertible Preferred Stocks | 2,105,881 | -- | -- | 2,105,881 |
| Money Market Funds | 4,900,655 | 4,900,655 | -- | -- |
| Total Investments in Securities: | $291,178,276 | $277,692,472 | $11,379,923 | $2,105,881 |
Other Information
Distribution of investments by country or territory of incorporation, as a percentage of Total Net Assets, is as follows (Unaudited):
| United States of America | 89.9% |
| United Kingdom | 2.6% |
| Netherlands | 2.5% |
| Sweden | 1.5% |
| Others (Individually Less Than 1%) | 3.5% |
| | 100.0% |
See accompanying notes which are an integral part of the financial statements.
Financial Statements
Statement of Assets and Liabilities
| | | December 31, 2017 |
| Assets | | |
Investment in securities, at value (including securities loaned of $4,031,812) — See accompanying schedule:
Unaffiliated issuers (cost $229,112,561) | $286,277,621 | |
| Fidelity Central Funds (cost $4,900,403) | 4,900,655 | |
| Total Investment in Securities (cost $234,012,964) | | $291,178,276 |
| Receivable for investments sold | | 52,775 |
| Receivable for fund shares sold | | 11,338 |
| Dividends receivable | | 654,044 |
| Distributions receivable from Fidelity Central Funds | | 3,079 |
| Prepaid expenses | | 1,495 |
| Other receivables | | 1,699 |
| Total assets | | 291,902,706 |
| Liabilities | | |
| Payable to custodian bank | $22,803 | |
| Payable for fund shares redeemed | 36,954 | |
| Accrued management fee | 128,985 | |
| Other affiliated payables | 42,501 | |
| Other payables and accrued expenses | 50,941 | |
| Collateral on securities loaned | 4,141,336 | |
| Total liabilities | | 4,423,520 |
| Net Assets | | $287,479,186 |
| Net Assets consist of: | | |
| Paid in capital | | $214,308,323 |
| Undistributed net investment income | | 952,935 |
| Accumulated undistributed net realized gain (loss) on investments and foreign currency transactions | | 15,052,734 |
| Net unrealized appreciation (depreciation) on investments and assets and liabilities in foreign currencies | | 57,165,194 |
| Net Assets | | $287,479,186 |
| Initial Class: | | |
| Net Asset Value, offering price and redemption price per share ($29,387,625 ÷ 1,490,502 shares) | | $19.72 |
| Investor Class: | | |
| Net Asset Value, offering price and redemption price per share ($258,091,561 ÷ 13,141,585 shares) | | $19.64 |
See accompanying notes which are an integral part of the financial statements.
Statement of Operations
| | | Year ended December 31, 2017 |
| Investment Income | | |
| Dividends | | $7,102,636 |
| Income from Fidelity Central Funds | | 260,385 |
| Total income | | 7,363,021 |
| Expenses | | |
| Management fee | $1,687,969 | |
| Transfer agent fees | 428,177 | |
| Accounting and security lending fees | 123,525 | |
| Custodian fees and expenses | 23,318 | |
| Independent trustees' fees and expenses | 7,159 | |
| Audit | 50,880 | |
| Legal | 4,968 | |
| Miscellaneous | 18,229 | |
| Total expenses before reductions | 2,344,225 | |
| Expense reductions | (9,797) | 2,334,428 |
| Net investment income (loss) | | 5,028,593 |
| Realized and Unrealized Gain (Loss) | | |
| Net realized gain (loss) on: | | |
| Investment securities: | | |
| Unaffiliated issuers | 16,423,603 | |
| Fidelity Central Funds | (650) | |
| Foreign currency transactions | (6,176) | |
| Total net realized gain (loss) | | 16,416,777 |
| Change in net unrealized appreciation (depreciation) on: | | |
| Investment securities: | | |
| Unaffiliated issuers | 19,912,489 | |
| Fidelity Central Funds | 211 | |
| Assets and liabilities in foreign currencies | 1,419 | |
| Total change in net unrealized appreciation (depreciation) | | 19,914,119 |
| Net gain (loss) | | 36,330,896 |
| Net increase (decrease) in net assets resulting from operations | | $41,359,489 |
See accompanying notes which are an integral part of the financial statements.
Statement of Changes in Net Assets
| | Year ended December 31, 2017 | Year ended December 31, 2016 |
| Increase (Decrease) in Net Assets | | |
| Operations | | |
| Net investment income (loss) | $5,028,593 | $5,694,084 |
| Net realized gain (loss) | 16,416,777 | 6,782,504 |
| Change in net unrealized appreciation (depreciation) | 19,914,119 | (4,727,690) |
| Net increase (decrease) in net assets resulting from operations | 41,359,489 | 7,748,898 |
| Distributions to shareholders from net investment income | (4,398,396) | (5,680,637) |
| Distributions to shareholders from net realized gain | – | (16,432,186) |
| Total distributions | (4,398,396) | (22,112,823) |
| Share transactions - net increase (decrease) | (66,674,321) | 89,838,556 |
| Redemption fees | 8,394 | 57,248 |
| Total increase (decrease) in net assets | (29,704,834) | 75,531,879 |
| Net Assets | | |
| Beginning of period | 317,184,020 | 241,652,141 |
| End of period | $287,479,186 | $317,184,020 |
| Other Information | | |
| Undistributed net investment income end of period | $952,935 | $– |
See accompanying notes which are an integral part of the financial statements.
Financial Highlights
VIP Consumer Staples Portfolio Initial Class
| Years ended December 31, | 2017 | 2016 | 2015 | 2014 | 2013 |
| Selected Per–Share Data | | | | | |
| Net asset value, beginning of period | $17.48 | $18.25 | $18.08 | $16.44 | $14.03 |
| Income from Investment Operations | | | | | |
| Net investment income (loss)A | .32 | .33 | .28 | .28 | .31 |
| Net realized and unrealized gain (loss) | 2.24 | .30 | 1.34 | 2.21 | 2.73 |
| Total from investment operations | 2.56 | .63 | 1.62 | 2.49 | 3.04 |
| Distributions from net investment income | (.32) | (.33)B | (.27) | (.24) | (.31) |
| Distributions from net realized gain | – | (1.07)B | (1.18) | (.61) | (.32) |
| Total distributions | (.32) | (1.40) | (1.45) | (.85) | (.63) |
| Redemption fees added to paid in capitalA,C | – | – | – | – | – |
| Net asset value, end of period | $19.72 | $17.48 | $18.25 | $18.08 | $16.44 |
| Total ReturnD,E | 14.66% | 3.72% | 9.46% | 15.66% | 21.80% |
| Ratios to Average Net AssetsF,G | | | | | |
| Expenses before reductions | .68% | .68% | .69% | .71% | .73% |
| Expenses net of fee waivers, if any | .68% | .68% | .69% | .70% | .72% |
| Expenses net of all reductions | .68% | .67% | .68% | .70% | .72% |
| Net investment income (loss) | 1.69% | 1.79% | 1.61% | 1.66% | 1.94% |
| Supplemental Data | | | | | |
| Net assets, end of period (000 omitted) | $29,388 | $38,192 | $28,077 | $22,943 | $25,736 |
| Portfolio turnover rateH | 41% | 45% | 38% | 78% | 36% |
A Calculated based on average shares outstanding during the period.
B The amounts shown reflect certain reclassifications related to book to tax differences that were made in the year shown.
C Amount represents less than $.005 per share.
D Total returns do not reflect charges attributable to your insurance company's separate account. Inclusion of these charges would reduce the total returns shown.
E Total returns would have been lower if certain expenses had not been reduced during the applicable periods shown.
F Fees and expenses of any underlying Fidelity Central Funds are not included in the Fund's expense ratio. The Fund indirectly bears its proportionate share of the expenses of any underlying Fidelity Central Funds.
G Expense ratios reflect operating expenses of the class. Expenses before reductions do not reflect amounts reimbursed by the investment adviser or reductions from brokerage service arrangements or reductions from other expense offset arrangements and do not represent the amount paid by the class during periods when reimbursements or reductions occur. Expenses net of fee waivers reflect expenses after reimbursement by the investment adviser but prior to reductions from brokerage service arrangements or other expense offset arrangements. Expenses net of all reductions represent the net expenses paid by the class.
H Amount does not include the portfolio activity of any underlying Fidelity Central Funds.
See accompanying notes which are an integral part of the financial statements.
VIP Consumer Staples Portfolio Investor Class
| Years ended December 31, | 2017 | 2016 | 2015 | 2014 | 2013 |
| Selected Per–Share Data | | | | | |
| Net asset value, beginning of period | $17.42 | $18.19 | $18.02 | $16.40 | $13.99 |
| Income from Investment Operations | | | | | |
| Net investment income (loss)A | .31 | .32 | .27 | .26 | .30 |
| Net realized and unrealized gain (loss) | 2.21 | .30 | 1.34 | 2.20 | 2.73 |
| Total from investment operations | 2.52 | .62 | 1.61 | 2.46 | 3.03 |
| Distributions from net investment income | (.30) | (.32)B | (.26) | (.23) | (.30) |
| Distributions from net realized gain | – | (1.07)B | (1.18) | (.61) | (.32) |
| Total distributions | (.30) | (1.39) | (1.44) | (.84) | (.62) |
| Redemption fees added to paid in capitalA,C | – | – | – | – | – |
| Net asset value, end of period | $19.64 | $17.42 | $18.19 | $18.02 | $16.40 |
| Total ReturnD,E | 14.52% | 3.67% | 9.41% | 15.52% | 21.79% |
| Ratios to Average Net AssetsF,G | | | | | |
| Expenses before reductions | .76% | .76% | .77% | .78% | .80% |
| Expenses net of fee waivers, if any | .76% | .76% | .76% | .78% | .80% |
| Expenses net of all reductions | .76% | .75% | .76% | .77% | .80% |
| Net investment income (loss) | 1.61% | 1.71% | 1.53% | 1.59% | 1.86% |
| Supplemental Data | | | | | |
| Net assets, end of period (000 omitted) | $258,092 | $278,992 | $213,575 | $160,591 | $140,485 |
| Portfolio turnover rateH | 41% | 45% | 38% | 78% | 36% |
A Calculated based on average shares outstanding during the period.
B The amounts shown reflect certain reclassifications related to book to tax differences that were made in the year shown.
C Amount represents less than $.005 per share.
D Total returns do not reflect charges attributable to your insurance company's separate account. Inclusion of these charges would reduce the total returns shown.
E Total returns would have been lower if certain expenses had not been reduced during the applicable periods shown.
F Fees and expenses of any underlying Fidelity Central Funds are not included in the Fund's expense ratio. The Fund indirectly bears its proportionate share of the expenses of any underlying Fidelity Central Funds.
G Expense ratios reflect operating expenses of the class. Expenses before reductions do not reflect amounts reimbursed by the investment adviser or reductions from brokerage service arrangements or reductions from other expense offset arrangements and do not represent the amount paid by the class during periods when reimbursements or reductions occur. Expenses net of fee waivers reflect expenses after reimbursement by the investment adviser but prior to reductions from brokerage service arrangements or other expense offset arrangements. Expenses net of all reductions represent the net expenses paid by the class.
H Amount does not include the portfolio activity of any underlying Fidelity Central Funds.
See accompanying notes which are an integral part of the financial statements.
Notes to Financial Statements
For the period ended December 31, 2017
1. Organization.
VIP Consumer Staples Portfolio (the Fund) is a non-diversified fund of Variable Insurance Products Fund IV (the Trust) and is authorized to issue an unlimited number of shares. The Trust is registered under the Investment Company Act of 1940, as amended (the 1940 Act), as an open-end management investment company organized as a Massachusetts business trust. Shares of the Fund may only be purchased by insurance companies for the purpose of funding variable annuity or variable life insurance contracts. The Fund offers the following classes of shares: Initial Class shares and Investor Class shares. All classes have equal rights and voting privileges, except for matters affecting a single class.
2. Investments in Fidelity Central Funds.
The Fund invests in Fidelity Central Funds, which are open-end investment companies generally available only to other investment companies and accounts managed by the investment adviser and its affiliates. The Fund's Schedule of Investments lists each of the Fidelity Central Funds held as of period end, if any, as an investment of the Fund, but does not include the underlying holdings of each Fidelity Central Fund. As an Investing Fund, the Fund indirectly bears its proportionate share of the expenses of the underlying Fidelity Central Funds.
The Money Market Central Funds seek preservation of capital and current income and are managed by Fidelity Investments Money Management, Inc. (FIMM), an affiliate of the investment adviser. Annualized expenses of the Money Market Central Funds as of their most recent shareholder report date are less than .005%.
A complete unaudited list of holdings for each Fidelity Central Fund is available upon request or at the Securities and Exchange Commission (the SEC) website at www.sec.gov. In addition, the financial statements of the Fidelity Central Funds, which are not covered by the Fund's Report of Independent Registered Public Accounting Firm, are available on the SEC website or upon request.
3. Significant Accounting Policies.
The Fund is an investment company and applies the accounting and reporting guidance of the Financial Accounting Standards Board (FASB) Accounting Standards Codification Topic 946 Financial Services – Investments Companies. The financial statements have been prepared in conformity with accounting principles generally accepted in the United States of America (GAAP), which require management to make certain estimates and assumptions at the date of the financial statements. Actual results could differ from those estimates. Subsequent events, if any, through the date that the financial statements were issued have been evaluated in the preparation of the financial statements. The following summarizes the significant accounting policies of the Fund:
Investment Valuation. Investments are valued as of 4:00 p.m. Eastern time on the last calendar day of the period. The Board of Trustees (the Board) has delegated the day to day responsibility for the valuation of the Fund's investments to the Fair Value Committee (the Committee) established by the Fund's investment adviser. In accordance with valuation policies and procedures approved by the Board, the Fund attempts to obtain prices from one or more third party pricing vendors or brokers to value its investments. When current market prices, quotations or currency exchange rates are not readily available or reliable, investments will be fair valued in good faith by the Committee, in accordance with procedures adopted by the Board. Factors used in determining fair value vary by investment type and may include market or investment specific events. The frequency with which these procedures are used cannot be predicted and they may be utilized to a significant extent. The Committee oversees the Fund's valuation policies and procedures and reports to the Board on the Committee's activities and fair value determinations. The Board monitors the appropriateness of the procedures used in valuing the Fund's investments and ratifies the fair value determinations of the Committee.
The Fund categorizes the inputs to valuation techniques used to value its investments into a disclosure hierarchy consisting of three levels as shown below:
- Level 1 – quoted prices in active markets for identical investments
- Level 2 – other significant observable inputs (including quoted prices for similar investments, interest rates, prepayment speeds, etc.)
- Level 3 – unobservable inputs (including the Fund's own assumptions based on the best information available)
Valuation techniques used to value the Fund's investments by major category are as follows:
Equity securities, including restricted securities, for which market quotations are readily available, are valued at the last reported sale price or official closing price as reported by a third party pricing vendor on the primary market or exchange on which they are traded and are categorized as Level 1 in the hierarchy. In the event there were no sales during the day or closing prices are not available, securities are valued at the last quoted bid price or may be valued using the last available price and are generally categorized as Level 2 in the hierarchy. For foreign equity securities, when market or security specific events arise, comparisons to the valuation of American Depositary Receipts (ADRs), futures contracts, Exchange-Traded Funds (ETFs) and certain indexes as well as quoted prices for similar securities may be used and would be categorized as Level 2 in the hierarchy. Utilizing these techniques may result in transfers between Level 1 and Level 2. For equity securities, including restricted securities, where observable inputs are limited, assumptions about market activity and risk are used and these securities may be categorized as Level 3 in the hierarchy.
Investments in open-end mutual funds, including the Fidelity Central Funds, are valued at their closing net asset value (NAV) each business day and are categorized as Level 1 in the hierarchy.
Changes in valuation techniques may result in transfers in or out of an assigned level within the disclosure hierarchy. The aggregate value of investments by input level as of December 31, 2017 is included at the end of the Fund's Schedule of Investments.
Foreign Currency. The Fund may use foreign currency contracts to facilitate transactions in foreign-denominated securities. Gains and losses from these transactions may arise from changes in the value of the foreign currency or if the counterparties do not perform under the contracts' terms.
Foreign-denominated assets, including investment securities, and liabilities are translated into U.S. dollars at the exchange rates at period end. Purchases and sales of investment securities, income and dividends received and expenses denominated in foreign currencies are translated into U.S. dollars at the exchange rate in effect on the transaction date.
The effects of exchange rate fluctuations on investments are included with the net realized and unrealized gain (loss) on investment securities. Other foreign currency transactions resulting in realized and unrealized gain (loss) are disclosed separately.
Investment Transactions and Income. For financial reporting purposes, the Fund's investment holdings and NAV include trades executed through the end of the last business day of the period. The NAV per share for processing shareholder transactions is calculated as of the close of business of the New York Stock Exchange (NYSE), normally 4:00 p.m. Eastern time and includes trades executed through the end of the prior business day. Gains and losses on securities sold are determined on the basis of identified cost and includes proceeds received from litigation. Dividend income is recorded on the ex-dividend date, except for certain dividends from foreign securities where the ex-dividend date may have passed, which are recorded as soon as the Fund is informed of the ex-dividend date. Non-cash dividends included in dividend income, if any, are recorded at the fair market value of the securities received. Income and capital gain distributions from Fidelity Central Funds, if any, are recorded on the ex-dividend date. Certain distributions received by the Fund represent a return of capital or capital gain. The Fund determines the components of these distributions subsequent to the ex-dividend date, based upon receipt of tax filings or other correspondence relating to the underlying investment. These distributions are recorded as a reduction of cost of investments and/or as a realized gain. Investment income is recorded net of foreign taxes withheld where recovery of such taxes is uncertain.
Class Allocations and Expenses. Investment income, realized and unrealized capital gains and losses, common expenses of the Fund, and certain fund-level expense reductions, if any, are allocated daily on a pro-rata basis to each class based on the relative net assets of each class to the total net assets of the Fund. Each class differs with respect to transfer agent fees incurred. Certain expense reductions may also differ by class. For the reporting period, the allocated portion of income and expenses to each class as a percent of its average net assets may vary due to the timing of recording these transactions in relation to fluctuating net assets of the classes. Expenses directly attributable to a fund are charged to that fund. Expenses attributable to more than one fund are allocated among the respective funds on the basis of relative net assets or other appropriate methods. Expense estimates are accrued in the period to which they relate and adjustments are made when actual amounts are known.
Income Tax Information and Distributions to Shareholders. Each year, the Fund intends to qualify as a regulated investment company under Subchapter M of the Internal Revenue Code, including distributing substantially all of its taxable income and realized gains. As a result, no provision for U.S. Federal income taxes is required. As of December 31, 2017, the Fund did not have any unrecognized tax benefits in the financial statements; nor is the Fund aware of any tax positions for which it is reasonably possible that the total amounts of unrecognized tax benefits will significantly change in the next twelve months. The Fund files a U.S. federal tax return, in addition to state and local tax returns as required. The Fund's federal income tax returns are subject to examination by the Internal Revenue Service (IRS) for a period of three fiscal years after they are filed. State and local tax returns may be subject to examination for an additional fiscal year depending on the jurisdiction. Foreign taxes are provided for based on the Fund's understanding of the tax rules and rates that exist in the foreign markets in which it invests.
Distributions are declared and recorded on the ex-dividend date. Income dividends and capital gain distributions are declared separately for each class. Income and capital gain distributions are determined in accordance with income tax regulations, which may differ from GAAP.
Capital accounts within the financial statements are adjusted for permanent book-tax differences. These adjustments have no impact on net assets or the results of operations. Capital accounts are not adjusted for temporary book-tax differences which will reverse in a subsequent period.
Book-tax differences are primarily due to foreign currency transactions, passive foreign investment companies (PFIC) and losses deferred due to wash sales and excise tax regulations.
As of period end, the cost and unrealized appreciation (depreciation) in securities, and derivatives if applicable, for federal income tax purposes were as follows:
| Gross unrealized appreciation | $62,414,138 |
| Gross unrealized depreciation | (6,382,250) |
| Net unrealized appreciation (depreciation) | $56,031,888 |
| Tax Cost | $235,146,388 |
The tax-based components of distributable earnings as of period end were as follows:
| Undistributed ordinary income | $1,272,094 |
| Undistributed long-term capital gain | $15,866,999 |
| Net unrealized appreciation (depreciation) on securities and other investments | $56,031,770 |
The tax character of distributions paid was as follows:
| | December 31, 2017 | December 31, 2016 |
| Ordinary Income | $4,398,396 | $ 11,855,056 |
| Long-term Capital Gains | – | 10,257,767 |
| Total | $4,398,396 | $ 22,112,823 |
Trading (Redemption) Fees. Shares held by investors less than 60 days may be subject to a redemption fee equal to 1% of the NAV of shares redeemed. All redemption fees, which reduce the proceeds of the shareholder redemption, are retained by the Fund and accounted for as an addition to paid in capital. In November 2017, the Board of Trustees approved the elimination of these redemption fees effective December 18, 2017.
Restricted Securities. The Fund may invest in securities that are subject to legal or contractual restrictions on resale. These securities generally may be resold in transactions exempt from registration or to the public if the securities are registered. Disposal of these securities may involve time-consuming negotiations and expense, and prompt sale at an acceptable price may be difficult. Information regarding restricted securities is included at the end of the Fund's Schedule of Investments.
4. Purchases and Sales of Investments.
Purchases and sales of securities, other than short-term securities, aggregated $124,923,217 and $193,170,985, respectively.
5. Fees and Other Transactions with Affiliates.
Management Fee. Fidelity SelectCo, LLC (the investment adviser) and its affiliates provide the Fund with investment management related services for which the Fund pays a monthly management fee. The management fee is the sum of an individual fund fee rate that is based on an annual rate of .30% of the Fund's average net assets and an annualized group fee rate that averaged .24% during the period. The group fee rate is based upon the average net assets of all the mutual funds advised by Fidelity Management & Research Company (FMR) and the investment adviser. The group fee rate decreases as assets under management increase and increases as assets under management decrease. For the reporting period, the total annual management fee rate was .54% of the Fund's average net assets.
Transfer Agent Fees. Fidelity Investments Institutional Operations Company, Inc. (FIIOC), an affiliate of the investment adviser, is the Fund's transfer, dividend disbursing, and shareholder servicing agent. FIIOC receives an asset-based fee with respect to each class. Each class pays a fee for transfer agent services, typesetting and printing and mailing of shareholder reports, excluding mailing of proxy statements, equal to an annual rate of class-level average net assets. The annual rate for Investor Class is .15% and the annual rate for all other classes is .07%. For the period, transfer agent fees for each class were as follows:
| Initial Class | $22,229 |
| Investor Class | 405,948 |
| | $428,177 |
Accounting and Security Lending Fees. Fidelity Service Company, Inc. (FSC), an affiliate of the investment adviser, maintains the Fund's accounting records. The accounting fee is based on the level of average net assets for each month. Under a separate contract, FSC administers the security lending program. The security lending fee is based on the number and duration of lending transactions.
Brokerage Commissions. The Fund placed a portion of its portfolio transactions with brokerage firms which are affiliates of the investment adviser. Brokerage commissions are included in net realized gain (loss) and change in net unrealized appreciation (depreciation) in the Statement of Operations. The commissions paid to these affiliated firms were $5,318 for the period.
Interfund Trades. The Fund may purchase from or sell securities to other Fidelity Funds under procedures adopted by the Board. The procedures have been designed to ensure these interfund trades are executed in accordance with Rule 17a-7 of the 1940 Act. Interfund trades are included within the respective purchases and sales amounts shown in the Purchases and Sales of Investments note.
6. Committed Line of Credit.
The Fund participates with other funds managed by the investment adviser or an affiliate in a $4.25 billion credit facility (the "line of credit") to be utilized for temporary or emergency purposes to fund shareholder redemptions or for other short-term liquidity purposes. The Fund has agreed to pay commitment fees on its pro-rata portion of the line of credit, which amounted to $1,044 and is reflected in Miscellaneous expenses on the Statement of Operations. During the period, the Fund did not borrow on this line of credit.
7. Security Lending.
The Fund lends portfolio securities through a lending agent from time to time in order to earn additional income. On the settlement date of the loan, the Fund receives collateral (in the form of U.S. Treasury obligations, letters of credit and/or cash) against the loaned securities and maintains collateral in an amount not less than 100% of the market value of the loaned securities during the period of the loan. The market value of the loaned securities is determined at the close of business of the Fund and any additional required collateral is delivered to the Fund on the next business day. The Fund or borrower may terminate the loan at any time, and if the borrower defaults on its obligation to return the securities loaned because of insolvency or other reasons, the Fund may apply collateral received from the borrower against the obligation. The Fund may experience delays and costs in recovering the securities loaned. Any cash collateral received is invested in the Fidelity Securities Lending Cash Central Fund. The value of loaned securities and cash collateral at period end are disclosed on the Fund's Statement of Assets and Liabilities. Security lending income represents the income earned on investing cash collateral, less rebates paid to borrowers and any lending agent fees associated with the loan, plus any premium payments received for lending certain types of securities. Security lending income is presented in the Statement of Operations as a component of income from Fidelity Central Funds. Total security lending income during the period amounted to $254,205.
8. Expense Reductions.
Commissions paid to certain brokers with whom the investment adviser, or its affiliates, places trades on behalf of the Fund include an amount in addition to trade execution, which may be rebated back to the Fund to offset certain expenses. This amount totaled $6,582 for the period.
In addition, during the period the investment adviser reimbursed and/or waived a portion of fund-level operating expenses in the amount of $3,215.
9. Distributions to Shareholders.
Distributions to shareholders of each class were as follows:
| | Year ended
December 31, 2017 | Year ended
December 31, 2016 |
| From net investment income | | |
| Initial Class | $462,346 | $706,116 |
| Investor Class | 3,936,050 | 4,974,521 |
| Total | $4,398,396 | $5,680,637 |
| From net realized gain | | |
| Initial Class | $– | $1,949,556 |
| Investor Class | – | 14,482,630 |
| Total | $– | $16,432,186 |
10. Share Transactions.
Transactions for each class of shares were as follows:
| | Shares | Shares | Dollars | Dollars |
| | Year ended December 31, 2017 | Year ended December 31, 2016 | Year ended December 31, 2017 | Year ended December 31, 2016 |
| Initial Class | | | | |
| Shares sold | 107,109 | 1,382,930 | $2,071,040 | $25,523,374 |
| Reinvestment of distributions | 23,968 | 153,384 | 462,346 | 2,655,672 |
| Shares redeemed | (825,192) | (890,562) | (15,503,391) | (16,436,352) |
| Net increase (decrease) | (694,115) | 645,752 | $(12,970,005) | $11,742,694 |
| Investor Class | | | | |
| Shares sold | 570,245 | 5,846,766 | $10,950,378 | $107,736,321 |
| Reinvestment of distributions | 204,789 | 1,128,506 | 3,936,050 | 19,457,151 |
| Shares redeemed | (3,651,453) | (2,701,599) | (68,590,744) | (49,097,610) |
| Net increase (decrease) | (2,876,419) | 4,273,673 | $(53,704,316) | $78,095,862 |
11. Other.
The Fund's organizational documents provide former and current trustees and officers with a limited indemnification against liabilities arising in connection with the performance of their duties to the Fund. In the normal course of business, the Fund may also enter into contracts that provide general indemnifications. The Fund's maximum exposure under these arrangements is unknown as this would be dependent on future claims that may be made against the Fund. The risk of material loss from such claims is considered remote.
At the end of the period, the investment adviser or its affiliates were the owners of record of 100% of the total outstanding shares of the Fund.
Report of Independent Registered Public Accounting Firm
To the Board of Trustees of Variable Insurance Products Fund IV and Shareholders of VIP Consumer Staples Portfolio:
Opinion on the Financial Statements
We have audited the accompanying statement of assets and liabilities, including the schedule of investments, of VIP Consumer Staples Portfolio (one of the funds constituting Variable Insurance Products Fund IV, referred to hereafter as the “Fund”) as of December 31, 2017, the related statements of operations for the year ended December 31, 2017, the statement of changes in net assets for each of the two years in the period ended December 31, 2017, including the related notes, and the financial highlights for each of the five years in the period ended December 31, 2017 (collectively referred to as the “financial statements”). In our opinion, the financial statements present fairly, in all material respects, the financial position of the Fund as of December 31, 2017, the results of its operations for the year then ended, the changes in its net assets for each of the two years in the period ended December 31, 2017 and the financial highlights for each of the five years in the period ended December 31, 2017 in conformity with accounting principles generally accepted in the United States of America.
Basis for Opinion
These financial statements are the responsibility of the Fund’s management. Our responsibility is to express an opinion on the Fund’s financial statements based on our audits. We are a public accounting firm registered with the Public Company Accounting Oversight Board (United States) (“PCAOB”) and are required to be independent with respect to the Fund in accordance with the U.S. federal securities laws and the applicable rules and regulations of the Securities and Exchange Commission and the PCAOB.
We conducted our audits of these financial statements in accordance with the standards of the PCAOB. Those standards require that we plan and perform the audit to obtain reasonable assurance about whether the financial statements are free of material misstatement, whether due to error or fraud.
Our audits included performing procedures to assess the risks of material misstatement of the financial statements, whether due to error or fraud, and performing procedures that respond to those risks. Such procedures included examining, on a test basis, evidence regarding the amounts and disclosures in the financial statements. Our audits also included evaluating the accounting principles used and significant estimates made by management, as well as evaluating the overall presentation of the financial statements. Our procedures included confirmation of securities owned as of December 31, 2017 by correspondence with the custodian. We believe that our audits provide a reasonable basis for our opinion.
PricewaterhouseCoopers LLP
Boston, Massachusetts
February 15, 2018
We have served as the auditor of one or more investment companies in the Fidelity group of funds since 1932.
Trustees and Officers
The Trustees, Members of the Advisory Board (if any), and officers of the trust and fund, as applicable, are listed below. The Board of Trustees governs the fund and is responsible for protecting the interests of shareholders. The Trustees are experienced executives who meet periodically throughout the year to oversee the fund's activities, review contractual arrangements with companies that provide services to the fund, oversee management of the risks associated with such activities and contractual arrangements, and review the fund's performance. Each of the Trustees oversees 91 funds.
The Trustees hold office without limit in time except that (a) any Trustee may resign; (b) any Trustee may be removed by written instrument, signed by at least two-thirds of the number of Trustees prior to such removal; (c) any Trustee who requests to be retired or who has become incapacitated by illness or injury may be retired by written instrument signed by a majority of the other Trustees; and (d) any Trustee may be removed at any special meeting of shareholders by a two-thirds vote of the outstanding voting securities of the trust. Each Trustee who is not an interested person (as defined in the 1940 Act) of the trust and the fund is referred to herein as an Independent Trustee. Each Independent Trustee shall retire not later than the last day of the calendar year in which his or her 75th birthday occurs. The Independent Trustees may waive this mandatory retirement age policy with respect to individual Trustees. Officers and Advisory Board Members hold office without limit in time, except that any officer or Advisory Board Member may resign or may be removed by a vote of a majority of the Trustees at any regular meeting or any special meeting of the Trustees. Except as indicated, each individual has held the office shown or other offices in the same company for the past five years.
The fund’s Statement of Additional Information (SAI) includes more information about the Trustees. To request a free copy, call Fidelity at 1-877-208-0098.
Experience, Skills, Attributes, and Qualifications of the Trustees. The Governance and Nominating Committee has adopted a statement of policy that describes the experience, qualifications, attributes, and skills that are necessary and desirable for potential Independent Trustee candidates (Statement of Policy). The Board believes that each Trustee satisfied at the time he or she was initially elected or appointed a Trustee, and continues to satisfy, the standards contemplated by the Statement of Policy. The Governance and Nominating Committee also engages professional search firms to help identify potential Independent Trustee candidates who have the experience, qualifications, attributes, and skills consistent with the Statement of Policy. From time to time, additional criteria based on the composition and skills of the current Independent Trustees, as well as experience or skills that may be appropriate in light of future changes to board composition, business conditions, and regulatory or other developments, have also been considered by the professional search firms and the Governance and Nominating Committee. In addition, the Board takes into account the Trustees' commitment and participation in Board and committee meetings, as well as their leadership of standing and ad hoc committees throughout their tenure.
In determining that a particular Trustee was and continues to be qualified to serve as a Trustee, the Board has considered a variety of criteria, none of which, in isolation, was controlling. The Board believes that, collectively, the Trustees have balanced and diverse experience, qualifications, attributes, and skills, which allow the Board to operate effectively in governing the fund and protecting the interests of shareholders. Information about the specific experience, skills, attributes, and qualifications of each Trustee, which in each case led to the Board's conclusion that the Trustee should serve (or continue to serve) as a trustee of the fund, is provided below.
Board Structure and Oversight Function. Brian B. Hogan is an interested person and currently serves as Chairman. The Trustees have determined that an interested Chairman is appropriate and benefits shareholders because an interested Chairman has a personal and professional stake in the quality and continuity of services provided to the fund. Independent Trustees exercise their informed business judgment to appoint an individual of their choosing to serve as Chairman, regardless of whether the Trustee happens to be independent or a member of management. The Independent Trustees have determined that they can act independently and effectively without having an Independent Trustee serve as Chairman and that a key structural component for assuring that they are in a position to do so is for the Independent Trustees to constitute a substantial majority for the Board. The Independent Trustees also regularly meet in executive session. Michael E. Wiley serves as Chairman of the Independent Trustees and as such (i) acts as a liaison between the Independent Trustees and management with respect to matters important to the Independent Trustees and (ii) with management prepares agendas for Board meetings.
Fidelity® funds are overseen by different Boards of Trustees. The fund's Board oversees Fidelity's sector portfolios. Other Boards oversee Fidelity's equity and high income funds, and Fidelity's investment grade bond, money market, and asset allocation funds. The use of separate Boards, each with its own committee structure, allows the Trustees of each group of Fidelity® funds to focus on the unique issues of the funds they oversee, including common research, investment, and operational issues. On occasion, the separate Boards establish joint committees to address issues of overlapping consequences for the Fidelity® funds overseen by each Board.
The Trustees operate using a system of committees to facilitate the timely and efficient consideration of all matters of importance to the Trustees, the fund, and fund shareholders and to facilitate compliance with legal and regulatory requirements and oversight of the fund's activities and associated risks. The Board, acting through its committees, has charged SelectCo and its affiliates with (i) identifying events or circumstances the occurrence of which could have demonstrably adverse effects on the fund's business and/or reputation; (ii) implementing processes and controls to lessen the possibility that such events or circumstances occur or to mitigate the effects of such events or circumstances if they do occur; and (iii) creating and maintaining a system designed to evaluate continuously business and market conditions in order to facilitate the identification and implementation processes described in (i) and (ii) above. Because the day-to-day operations and activities of the fund are carried out by or through SelectCo, its affiliates, and other service providers, the fund's exposure to risks is mitigated but not eliminated by the processes overseen by the Trustees. While each of the Board's committees has responsibility for overseeing different aspects of the fund's activities, oversight is exercised primarily through the Operations and Audit Committees. Appropriate personnel, including but not limited to the fund's Chief Compliance Officer (CCO), SelectCo's internal auditor, the independent accountants, the fund's Treasurer and portfolio management personnel, make periodic reports to the Board's committees, as appropriate. The responsibilities of each standing committee, including their oversight responsibilities, are described further under "Standing Committees of the Trustees."
Interested Trustees*:
Correspondence intended for a Trustee who is an interested person may be sent to Fidelity Investments, 245 Summer Street, Boston, Massachusetts 02210.
Name, Year of Birth; Principal Occupations and Other Relevant Experience+
Brian B. Hogan (1964)
Year of Election or Appointment: 2014
Trustee
Chairman of the Board of Trustees
Mr. Hogan also serves as Trustee or Vice President of other funds. Mr. Hogan serves as a Director of FMR Investment Management (UK) Limited (investment adviser firm, 2015-present) and Fidelity SelectCo, LLC (investment adviser firm, 2014-present) and President of the Equity Division of FMR (investment adviser firm, 2009-present). Previously, Mr. Hogan served as Senior Vice President, Equity Research of FMR (2006-2009) and as a portfolio manager. Mr. Brian B. Hogan is not related to Mr. Colm A. Hogan.
* Determined to be an "Interested Trustee" by virtue of, among other things, his or her affiliation with the trust or various entities under common control with SelectCo.
+ The information includes the Trustee's principal occupation during the last five years and other information relating to the experience, attributes, and skills relevant to the Trustee's qualifications to serve as a Trustee, which led to the conclusion that the Trustee should serve as a Trustee for the fund.
Independent Trustees:
Correspondence intended for an Independent Trustee may be sent to Fidelity Investments, P.O. Box 55235, Boston, Massachusetts 02205-5235.
Name, Year of Birth; Principal Occupations and Other Relevant Experience+
David A. Rosow (1942)
Year of Election or Appointment: 2013
Trustee
Mr. Rosow also serves as Trustee of other Fidelity® funds. Prior to his retirement in 2006, Mr. Rosow was the Chief Executive Officer, owner and operator of a number of private companies, which encompassed the oil refining, drilling and marketing of petroleum products (including specialty petroleum products), recreation industry, and real estate development. Mr. Rosow currently serves as a Director of Oxbow Carbon LLC (upgraders, marketers, and distributors of petroleum byproducts of the oil refining process, 2015-present) and Oxbridge Academy of the Palm Beaches (2015-present) and serves as its President and CEO. Previously, Mr. Rosow served on the Fairfield Country Day School Board for 27 years, including as its President for 3 years, stepping down in 2006. Mr. Rosow served as Lead Director and Chairman of the Audit Committee of Hudson United Bancorp (1996-2006), Chairman of the Board of Westport Bank and Trust (1992-1996), and as a Director of TD Banknorth (2006-2007). In addition, Mr. Rosow served as a member (2008-2014) and President (2009-2014) of the Town Council of Palm Beach, Florida. Mr. Rosow also served as a Member of the Advisory Board of certain Fidelity® funds (2012-2013).
Garnett A. Smith (1947)
Year of Election or Appointment: 2013
Trustee
Mr. Smith also serves as Trustee of other Fidelity® funds. Prior to Mr. Smith's retirement, he served as Chairman and Chief Executive Officer of Inbrand Corp. (manufacturer of personal absorbent products, 1990-1997). He also served as President (1986-1990) of Inbrand Corp. Prior to his employment with Inbrand Corp., he was employed by a retail fabric chain and North Carolina National Bank. In addition, Mr. Smith served as a Member of the Advisory Board of certain Fidelity® funds (2012-2013) and as a board member of the Jackson Hole Land Trust (2009-2012).
Michael E. Wiley (1950)
Year of Election or Appointment: 2008
Trustee
Chairman of the Independent Trustees
Mr. Wiley also serves as Trustee of other Fidelity® funds. Mr. Wiley serves as a Director of Andeavor Corporation (independent oil refiner and marketer, 2005-present), a Director of Andeavor Logistics LP (natural resources logistics, 2015-present), and a Director of Bill Barrett Corporation (exploration and production, 2005-present). In addition, Mr. Wiley also serves as a Director of Post Oak Bank (privately-held bank, 2004-present). Previously, Mr. Wiley served as a Trustee of other Fidelity® funds (2008-2013), as a Director of Asia Pacific Exploration Consolidated (international oil and gas exploration and production, 2008-2013), as a member of the Board of Trustees of the University of Tulsa (2000-2006; 2007-2010), as a Senior Energy Advisor of Katzenbach Partners, LLC (consulting, 2006-2007), as an Advisory Director of Riverstone Holdings (private investment), Chairman, President, and CEO of Baker Hughes, Inc. (oilfield services, 2000-2004), and as Director of Spinnaker Exploration Company (exploration and production, 2001-2005).
+ The information includes the Trustee's principal occupation during the last five years and other information relating to the experience, attributes, and skills relevant to the Trustee's qualifications to serve as a Trustee, which led to the conclusion that the Trustee should serve as a Trustee for the fund.
Advisory Board Members and Officers:
Correspondence intended for a Member of the Advisory Board (if any) may be sent to Fidelity Investments, P.O. Box 55235, Boston, Massachusetts 02205-5235. Except for Anthony R. Rochte, correspondence intended for an officer may be sent to Fidelity Investments, 245 Summer Street, Boston, Massachusetts 02210. Correspondence intended for Mr. Rochte may be sent to Fidelity SelectCo, LLC (SelectCo), 1225 17th Street, Denver, Colorado 80202-5541. Officers appear below in alphabetical order.
Name, Year of Birth; Principal Occupation
Donald F. Donahue (1950)
Year of Election or Appointment: 2015
Member of the Advisory Board
Mr. Donahue also serves as a Trustee or Member of the Advisory Board of other Fidelity® funds. Mr. Donahue is President and Chief Executive Officer of Miranda Partners, LLC (risk consulting for the financial services industry, 2012-present). Previously, Mr. Donahue served as Chief Executive Officer (2006-2012), Chief Operating Officer (2003-2006), and Managing Director, Customer Marketing and Development (1999-2003) of The Depository Trust & Clearing Corporation (financial markets infrastructure). Mr. Donahue serves as a Member (2007-present) and Co-Chairman (2016-present) of the Board of Directors of United Way of New York, Member of the Board of Directors of NYC Leadership Academy (2012-present) and Member of the Board of Advisors of Ripple Labs, Inc. (financial services, 2015-present). He also served as Chairman (2010-2012) and Member of the Board of Directors (2012-2013) of Omgeo, LLC (financial services), Treasurer of United Way of New York (2012-2016), and Member of the Board of Directors of XBRL US (financial services non-profit, 2009-2012) and the International Securities Services Association (2009-2012).
Carol B. Tomé (1957)
Year of Election or Appointment: 2017
Member of the Advisory Board
Ms. Tomé also serves as Member of the Advisory Board of other Fidelity® funds. Ms. Tomé is Chief Financial Officer (2001-present) and Executive Vice President of Corporate Services (2007-present) of The Home Depot, Inc. (home improvement retailer) and a Director (2003-present) and Chair of the Audit Committee (2004-present) of United Parcel Service, Inc. (package delivery and supply chain management). Previously, Ms. Tomé served as Trustee of certain Fidelity® funds (2017), Senior Vice President of Finance and Accounting/Treasurer (2000-2007) and Vice President and Treasurer (1995-2000) of The Home Depot, Inc. and Chair of the Board (2010-2012), Vice Chair of the Board (2009 and 2013), and a Director (2008-2013) of the Federal Reserve Bank of Atlanta. Ms. Tomé is also a director or trustee of many community and professional organizations.
Elizabeth Paige Baumann (1968)
Year of Election or Appointment: 2017
Anti-Money Laundering (AML) Officer
Ms. Baumann also serves as AML Officer of other funds. She is Chief AML Officer (2012-present) and Senior Vice President (2014-present) of FMR LLC (diversified financial services company) and is an employee of Fidelity Investments. Previously, Ms. Baumann served as AML Officer of the funds (2012-2016), and Vice President (2007-2014) and Deputy Anti-Money Laundering Officer (2007-2012) of FMR LLC.
Marc R. Bryant (1966)
Year of Election or Appointment: 2013
Secretary and Chief Legal Officer (CLO)
Mr. Bryant also serves as Secretary and CLO of other funds. Mr. Bryant serves as CLO, Secretary, and Senior Vice President of Fidelity Management & Research Company (investment adviser firm, 2015-present) and FMR Co., Inc. (investment adviser firm, 2015-present); Secretary of Fidelity SelectCo, LLC (investment adviser firm, 2015-present) and Fidelity Investments Money Management, Inc. (investment adviser firm, 2015-present); and CLO of Fidelity Management & Research (Hong Kong) Limited and FMR Investment Management (UK) Limited (investment adviser firms, 2015-present) and Fidelity Management & Research (Japan) Limited (investment adviser firm, 2016-present). He is Senior Vice President and Deputy General Counsel of FMR LLC (diversified financial services company). Previously, Mr. Bryant served as Secretary and CLO of Fidelity Rutland Square Trust II (2010-2014) and Assistant Secretary of Fidelity's Fixed Income and Asset Allocation Funds (2013-2015). Prior to joining Fidelity Investments, Mr. Bryant served as a Senior Vice President and the Head of Global Retail Legal for AllianceBernstein L.P. (2006-2010), and as the General Counsel for ProFund Advisors LLC (2001-2006).
William C. Coffey (1969)
Year of Election or Appointment: 2009
Assistant Secretary
Mr. Coffey also serves as Assistant Secretary of other funds. He is Senior Vice President and Deputy General Counsel of FMR LLC (diversified financial services company, 2010-present), and is an employee of Fidelity Investments. Previously, Mr. Coffey served as Vice President and Associate General Counsel of FMR LLC (2005-2009).
Jonathan Davis (1968)
Year of Election or Appointment: 2010
Assistant Treasurer
Mr. Davis also serves as Assistant Treasurer of other funds. Mr. Davis serves as Assistant Treasurer of FMR Capital, Inc. (2017-present) and is an employee of Fidelity Investments. Previously, Mr. Davis served as Vice President and Associate General Counsel of FMR LLC (diversified financial services company, 2003-2010).
Adrien E. Deberghes (1967)
Year of Election or Appointment: 2013
President and Treasurer
Mr. Deberghes also serves as an officer of other funds. He serves as Assistant Treasurer of FMR Capital, Inc. (2017-present), Executive Vice President of Fidelity Investments Money Management, Inc. (FIMM) (investment adviser firm, 2016-present), and is an employee of Fidelity Investments (2008-present). Prior to joining Fidelity Investments, Mr. Deberghes was Senior Vice President of Mutual Fund Administration at State Street Corporation (2007-2008), Senior Director of Mutual Fund Administration at Investors Bank & Trust (2005-2007), and Director of Finance for Dunkin' Brands (2000-2005). Previously, Mr. Deberghes served in other fund officer roles.
Joseph DeSantis (1959)
Year of Election or Appointment: 2015
Vice President
Mr. DeSantis also serves as Vice President of other funds. Mr. DeSantis serves as a Director of Fidelity Management & Research (Japan) Limited (investment adviser firm, 2016-present), Chief Investment Officer, Equities (2010-present) and is an employee of Fidelity Investments.
Stephanie J. Dorsey (1969)
Year of Election or Appointment: 2010
Assistant Treasurer
Ms. Dorsey also serves as an officer of other funds. Ms. Dorsey serves as Assistant Treasurer of FMR Capital, Inc. (2017-present), is an employee of Fidelity Investments (2008-present), and has served in other fund officer roles. Prior to joining Fidelity Investments, Ms. Dorsey served as Treasurer (2004-2008) of the JPMorgan Mutual Funds and Vice President (2004-2008) of JPMorgan Chase Bank.
Howard J. Galligan III (1966)
Year of Election or Appointment: 2014
Chief Financial Officer
Mr. Galligan also serves as Chief Financial Officer of other funds. Mr. Galligan serves as President of Fidelity Pricing and Cash Management Services (FPCMS) (2014-present) and as a Director of Strategic Advisers, Inc. (investment adviser firm, 2008-present). Previously, Mr. Galligan served as Chief Administrative Officer of Asset Management (2011-2014) and Chief Operating Officer and Senior Vice President of Investment Support for Strategic Advisers, Inc. (2003-2011).
James D. Gryglewicz (1972)
Year of Election or Appointment: 2014
Chief Compliance Officer
Mr. Gryglewicz also serves as Chief Compliance Officer of other funds. Mr. Gryglewicz serves as Compliance Officer of Strategic Advisers, Inc. (investment adviser firm, 2015-present) and Fidelity SelectCo, LLC (investment adviser firm, 2014-present), Senior Vice President of Asset Management Compliance (2009-present), and is an employee of Fidelity Investments (2004-present).
Brian B. Hogan (1964)
Year of Election or Appointment: 2009
Vice President
Mr. Hogan also serves as Trustee or Vice President of other funds. Mr. Hogan serves as a Director of FMR Investment Management (UK) Limited (investment adviser firm, 2015-present) and Fidelity SelectCo, LLC (investment adviser firm, 2014-present) and President of the Equity Division of FMR (investment adviser firm, 2009-present). Previously, Mr. Hogan served as Senior Vice President, Equity Research of FMR (2006-2009) and as a portfolio manager. Mr. Brian B. Hogan is not related to Mr. Colm A. Hogan.
Colm A. Hogan (1973)
Year of Election or Appointment: 2016
Assistant Treasurer
Mr. Hogan also serves as an officer of other funds. Mr. Hogan serves as Assistant Treasurer of FMR Capital, Inc. (2017-present) and is an employee of Fidelity Investments (2005-present). Mr. Colm A. Hogan is not related to Mr. Brian B. Hogan.
Chris Maher (1972)
Year of Election or Appointment: 2013
Assistant Treasurer
Mr. Maher serves as Assistant Treasurer of other funds. Mr. Maher is Vice President of Valuation Oversight, serves as Assistant Treasurer of FMR Capital, Inc. (2017-present), and is an employee of Fidelity Investments. Previously, Mr. Maher served as Vice President of Asset Management Compliance (2013), Vice President of the Program Management Group of FMR (investment adviser firm, 2010-2013), and Vice President of Valuation Oversight (2008-2010).
Rieco E. Mello (1969)
Year of Election or Appointment: 2017
Assistant Treasurer
Mr. Mello also serves as Assistant Treasurer of other funds. Mr. Mello serves as Assistant Treasurer of FMR Capital, Inc. (2017-present) and is an employee of Fidelity Investments (1995-present).
Anthony R. Rochte (1968)
Year of Election or Appointment: 2013
Vice President
Mr. Rochte also serves as Vice President of other funds. Mr. Rochte serves as President of Fidelity SelectCo, LLC (investment adviser firm, 2012-present) and is an employee of Fidelity Investments (2012-present). Prior to joining Fidelity Investments, Mr. Rochte served as Senior Managing Director and head of State Street Global Advisors' North American Intermediary Business Group (2006-2012).
Stacie M. Smith (1974)
Year of Election or Appointment: 2013
Assistant Treasurer
Ms. Smith also serves as an officer of other funds. Ms. Smith serves as Assistant Treasurer of FMR Capital, Inc. (2017-present), is an employee of Fidelity Investments (2009-present), and has served in other fund officer roles. Prior to joining Fidelity Investments, Ms. Smith served as Senior Audit Manager of Ernst & Young LLP (accounting firm, 1996-2009). Previously, Ms. Smith served as Deputy Treasurer of certain Fidelity® funds (2013-2016).
Marc L. Spector (1972)
Year of Election or Appointment: 2017
Assistant Treasurer
Mr. Spector also serves as an officer of other funds. Mr. Spector serves as Assistant Treasurer of FMR Capital, Inc. (2017-present) and is an employee of Fidelity Investments (2016-present). Prior to joining Fidelity Investments, Mr. Spector served as Director at the Siegfried Group (accounting firm, 2013-2016), and prior to Siegfried Group as audit senior manager at Deloitte & Touche (accounting firm, 2005-2013).
Renee Stagnone (1975)
Year of Election or Appointment: 2016
Assistant Treasurer
Ms. Stagnone also serves as an officer of other funds. Ms. Stagnone serves as Assistant Treasurer of FMR Capital, Inc. (2017-present) and is an employee of Fidelity Investments (1997-present). Previously, Ms. Stagnone served as Deputy Treasurer of certain Fidelity® funds (2013-2016).
Shareholder Expense Example
As a shareholder of the Fund, you incur two types of costs: (1) transaction costs and (2) ongoing costs, including management fees and other Fund expenses. This Example is intended to help you understand your ongoing costs (in dollars) of investing in the Fund and to compare these costs with the ongoing costs of investing in other mutual funds.
The Example is based on an investment of $1,000 invested at the beginning of the period and held for the entire period (July 1, 2017 to December 31, 2017).
Actual Expenses
The first line of the accompanying table for each class of the Fund provides information about actual account values and actual expenses. You may use the information in this line, together with the amount you invested, to estimate the expenses that you paid over the period. Simply divide your account value by $1,000.00 (for example, an $8,600 account value divided by $1,000.00 = 8.6), then multiply the result by the number in the first line for a class of the Fund under the heading entitled "Expenses Paid During Period" to estimate the expenses you paid on your account during this period. The estimate of expenses does not include any fees or other expenses of any variable annuity or variable life insurance product. If they were, the estimate of expenses you paid during the period would be higher, and your ending account value would be lower. In addition, the Fund, as a shareholder in the underlying Fidelity Central Funds, will indirectly bear its pro-rata share of the fees and expenses incurred by the underlying Fidelity Central Funds. These fees and expenses are not included in the Fund's annualized expense ratio used to calculate the expense estimate in the table below.
Hypothetical Example for Comparison Purposes
The second line of the accompanying table for each class of the Fund provides information about hypothetical account values and hypothetical expenses based on a Class' actual expense ratio and an assumed rate of return of 5% per year before expenses, which is not the Class' actual return. The hypothetical account values and expenses may not be used to estimate the actual ending account balance or expenses you paid for the period. You may use this information to compare the ongoing costs of investing in the Fund and other funds. To do so, compare this 5% hypothetical example with the 5% hypothetical examples that appear in the shareholder reports of the other funds. The estimate of expenses does not include any fees or other expenses of any variable annuity or variable life insurance product. If they were, the estimate of expenses you paid during the period would be higher, and your ending account value would be lower. In addition, the Fund, as a shareholder in the underlying Fidelity Central Funds, will indirectly bear its pro-rata share of the fees and expenses incurred by the underlying Fidelity Central Funds. These fees and expenses are not included in the Fund's annualized expense ratio used to calculate the expense estimate in the table below.
Please note that the expenses shown in the table are meant to highlight your ongoing costs only and do not reflect any transaction costs. Therefore, the second line of the table is useful in comparing ongoing costs only, and will not help you determine the relative total costs of owning different funds. In addition, if these transactional costs were included, your costs would have been higher.
| | Annualized Expense Ratio-A | Beginning
Account Value
July 1, 2017 | Ending
Account Value
December 31, 2017 | Expenses Paid
During Period-B
July 1, 2017
to December 31, 2017 |
| Initial Class | .68% | | | |
| Actual | | $1,000.00 | $1,034.70 | $3.49 |
| Hypothetical-C | | $1,000.00 | $1,021.78 | $3.47 |
| Investor Class | .77% | | | |
| Actual | | $1,000.00 | $1,034.20 | $3.95 |
| Hypothetical-C | | $1,000.00 | $1,021.32 | $3.92 |
A Annualized expense ratio reflects expenses net of applicable fee waivers.
B Expenses are equal to each Class' annualized expense ratio, multiplied by the average account value over the period, multiplied by 184/365 (to reflect the one-half year period).
C 5% return per year before expenses
Distributions (Unaudited)
The Board of Trustees of VIP Consumer Staples Portfolio Fund voted to pay to shareholders of record at the opening of business on record date, the following distributions per share derived from capital gains realized from sales of portfolio securities and dividends derived from net investment income:
| | Pay Date | Record Date | Dividends | Capital Gains |
| VIP Consumer Staples Portfolio | | | | |
| Initial Class | 02/09/18 | 02/09/18 | $0.071 | $1.167 |
| Investor Class | 02/09/18 | 02/09/18 | $0.068 | $1.167 |
|
The fund hereby designates as a capital gain dividend with respect to the taxable year ended December 31, 2017, $15,866,999, or, if subsequently determined to be different, the net capital gain of such year.
Initial Class and Investor Class designate 100% of the dividends distributed during the fiscal year as qualifying for the dividends–received deduction for corporate shareholders.
Proxy Voting Results
A special meeting of shareholders was held on December 8, 2017. The results of votes taken among shareholders on the proposals before them are reported below. Each vote reported represents one dollar of net asset value held on the record date for the meeting.
PROPOSAL 1
To elect a Board of Trustees.
| | # of
Votes | % of
Votes |
| James C. Curvey |
| Affirmative | 3,005,845,657.89 | 94.803 |
| Withheld | 164,788,708.80 | 5.197 |
| TOTAL | 3,170,634,366.69 | 100.000 |
| Dennis J. Dirks |
| Affirmative | 3,025,050,303.47 | 95.409 |
| Withheld | 145,584,063.22 | 4.591 |
| TOTAL | 3,170,634,366.69 | 100.000 |
| Donald F. Donahue |
| Affirmative | 3,024,923,660.98 | 95.405 |
| Withheld | 145,710,705.71 | 4.595 |
| TOTAL | 3,170,634,366.69 | 100.000 |
| Alan J. Lacy |
| Affirmative | 3,024,272,946.71 | 95.384 |
| Withheld | 146,361,419.98 | 4.616 |
| TOTAL | 3,170,634,366.69 | 100.00 |
| Ned C. Lautenbach |
| Affirmative | 3,011,847,006.14 | 94.992 |
| Withheld | 158,787,360.55 | 5.008 |
| TOTAL | 3,170,634,366.69 | 100.000 |
| Joseph Mauriello |
| Affirmative | 3,021,074,746.00 | 95.283 |
| Withheld | 149,559,620.69 | 4.717 |
| TOTAL | 3,170,634,366.69 | 100.000 |
| Charles S. Morrison |
| Affirmative | 3,025,083,795.43 | 95.410 |
| Withheld | 145,550,571.26 | 4.590 |
| TOTAL | 3,170,634,366.69 | 100.000 |
| Cornelia M. Small |
| Affirmative | 3,016,566,905.34 | 95.141 |
| Withheld | 154,067,461.35 | 4.859 |
| TOTAL | 3,170,634,366.69 | 100.000 |
| Garnett A. Smith |
| Affirmative | 3,014,927,605.85 | 95.090 |
| Withheld | 155,706,760.84 | 4.910 |
| TOTAL | 3,170,634,366.69 | 100.000 |
| David M. Thomas |
| Affirmative | 3,025,900,428.75 | 95.436 |
| Withheld | 144,733,937.94 | 4.564 |
| TOTAL | 3,170,634,366.69 | 100.000 |
| Michael E. Wiley |
| Affirmative | 3,023,436,110.39 | 95.358 |
| Withheld | 147,198,256.30 | 4.642 |
| TOTAL | 3,170,634,366.69 | 100.000 |
PROPOSAL 2
To eliminate a fundamental investment policy.
| | # of
Votes | % of
Votes |
| Affirmative | 226,010,271.06 | 75.931 |
| Against | 43,627,547.84 | 14.657 |
| Abstain | 28,015,366.40 | 9.412 |
| TOTAL | 297,653,185.30 | 100.000 |
|
| Proposal 1 reflects trust wide proposal and voting results. |
VCSP-ANN-0218
1.850994.110
Fidelity® Variable Insurance Products: Materials Portfolio
Annual Report December 31, 2017 |
|
Contents
To view a fund's proxy voting guidelines and proxy voting record for the 12-month period ended June 30, visit http://www.fidelity.com/proxyvotingresults or visit the Securities and Exchange Commission's (SEC) web site at http://www.sec.gov.
You may also call 1-877-208-0098 to request a free copy of the proxy voting guidelines.
Fidelity® Variable Insurance Products are separate account options which are purchased through a variable insurance contract.
Standard & Poor's, S&P and S&P 500 are registered service marks of The McGraw-Hill Companies, Inc. and have been licensed for use by Fidelity Distributors Corporation.
Other third-party marks appearing herein are the property of their respective owners.
All other marks appearing herein are registered or unregistered trademarks or service marks of FMR LLC or an affiliated company. © 2018 FMR LLC. All rights reserved.
This report and the financial statements contained herein are submitted for the general information of the shareholders of the Fund. This report is not authorized for distribution to prospective investors in the Fund unless preceded or accompanied by an effective prospectus.
A fund files its complete schedule of portfolio holdings with the SEC for the first and third quarters of each fiscal year on Form N-Q. Forms N-Q are available on the SEC’s web site at http://www.sec.gov. A fund's Forms N-Q may be reviewed and copied at the SEC’s Public Reference Room in Washington, DC. Information regarding the operation of the SEC's Public Reference Room may be obtained by calling 1-800-SEC-0330.
For a complete list of a fund's portfolio holdings, view the most recent holdings listing, semiannual report, or annual report on Fidelity's web site at http://www.fidelity.com, http://www.institutional.fidelity.com, or http://www.401k.com, as applicable.
NOT FDIC INSURED •MAY LOSE VALUE •NO BANK GUARANTEE
Neither the Fund nor Fidelity Distributors Corporation is a bank.
Performance: The Bottom Line
Average annual total return reflects the change in the value of an investment, assuming reinvestment of distributions from dividend income and capital gains (the profits earned upon the sale of securities that have grown in value, if any) and assuming a constant rate of performance each year. During periods of reimbursement by Fidelity, a fund’s total return will be greater than it would be had the reimbursement not occurred. Performance numbers are net of all underlying fund operating expenses, but do not include any insurance charges imposed by your insurance company’s separate account. If performance information included the effect of these additional charges, the total returns would have been lower. How a fund did yesterday is no guarantee of how it will do tomorrow.
Average Annual Total Returns
| For the periods ended December 31, 2017 | Past 1 year | Past 5 years | Past 10 years |
| Initial Class | 26.08% | 9.55% | 7.79% |
| Investor Class | 26.02% | 9.47% | 7.70% |
$10,000 Over Life of Fund
Let's say hypothetically that $10,000 was invested in VIP Materials Portfolio - Initial Class on December 31, 2007.
The chart shows how the value of your investment would have changed, and also shows how the S&P 500® Index performed over the same period.

| Period Ending Values |
| $21,164 | VIP Materials Portfolio - Initial Class |
| $22,603 | S&P 500® Index |
Management's Discussion of Fund Performance
Market Recap: U.S. equities gained 21.83% in 2017, as the S&P 500
® index rose steadily and closed the year just shy of an all-time high after a particularly strong three-month finish. Early on, equities rallied on optimism for President Trump’s pro-business agenda but leveled off in March amid fading optimism and stalled efforts by Congress to repeal and replace the Affordable Care Act. Upward momentum soon returned and continued through year-end with consumer sentiment and other market indicators staying positive. The lone exception was a brief cooldown in August, when geopolitical tension escalated and uncertainty grew regarding the future of health care, tax reform and the debt ceiling. Sector-wise, information technology fared best by a wide margin, rising 39% amid strong earnings growth from several major index constituents. A 24% gain in materials was spurred by increased demand, especially from China. Consumer discretionary gained 23%, despite many brick-and-mortar retailers suffering from online competition, and financials edged the broader market on an uptick in bond yields. Conversely, the defensive energy and telecom services sectors returned about -1% each. Rising interest rates held back real estate (+11%), while consumer staples (+13%) and utilities (+12%) struggled due to investors’ general preference for risk assets.
Comments from Portfolio Manager Richard Malnight: For the year, the fund’s share classes gained roughly 26%, handily outpacing the 23.59% return of the MSCI U.S. IMI Materials 25/50 Index and also topping the broad-market S&P 500
®. Versus the MSCI sector benchmark, stock selection in diversified chemicals, a sizable underweighting in steel and positioning in commodity chemicals all made noteworthy contributions to the fund’s performance. A sizable overweighting in Chemours was the fund’s top relative contributor. The company manufactures titanium dioxide (TiO2), a pigment used in paint and toothpaste, among other products. Our position here received a boost in February after the company settled a multimillion dollar lawsuit over drinking-water contamination in Ohio and West Virginia. Overweighting Westlake Chemical also proved to be a good decision. Ethylene manufacturer LyondellBasell Industries, the fund’s second-largest holding, was another strong contributor. Conversely, positioning in industrial gases and metal & glass containers dampened the fund’s relative performance. Among individual holdings, the top relative detractor was Ball Corp., a maker of metal containers. Not owning MSCI index stalwart Praxair, a producer and distributor of industrial gases, also dampened relative results, as the stock returned 35% this period.
The views expressed above reflect those of the portfolio manager(s) only through the end of the period as stated on the cover of this report and do not necessarily represent the views of Fidelity or any other person in the Fidelity organization. Any such views are subject to change at any time based upon market or other conditions and Fidelity disclaims any responsibility to update such views. These views may not be relied on as investment advice and, because investment decisions for a Fidelity fund are based on numerous factors, may not be relied on as an indication of trading intent on behalf of any Fidelity fund.
Notes to shareholders: On November 17, 2017, Richard Malnight succeeded Tobias Welo as Portfolio Manager of the fund.
On December 8, 2017, shareholders approved proposals from the Board of Trustees to eliminate each sector/industry fund's fundamental “invests primarily” policy and to modify the fundamental concentration policy for certain funds. The changes took effect on January 1, 2018, and do not impact how the funds are managed.
Investment Summary (Unaudited)
Top Ten Stocks as of December 31, 2017
| | % of fund's net assets |
| DowDuPont, Inc. | 21.5 |
| LyondellBasell Industries NV Class A | 9.1 |
| Linde AG | 4.4 |
| Sherwin-Williams Co. | 3.7 |
| WestRock Co. | 3.6 |
| The Chemours Co. LLC | 3.4 |
| Ball Corp. | 3.2 |
| Westlake Chemical Corp. | 3.0 |
| Freeport-McMoRan, Inc. | 2.9 |
| Steel Dynamics, Inc. | 2.7 |
| | 57.5 |
Top Industries (% of fund's net assets)
| As of December 31, 2017 |
| | Chemicals | 66.1% |
| | Containers & Packaging | 12.9% |
| | Metals & Mining | 12.0% |
| | Construction Materials | 4.5% |
| | Trading Companies & Distributors | 1.8% |
| | All Others* | 2.7% |

* Includes short-term investments and net other assets (liabilities).
Investments December 31, 2017
Showing Percentage of Net Assets
| Common Stocks - 97.2% | | | |
| | | Shares | Value |
| Building Products - 0.2% | | | |
| Building Products - 0.2% | | | |
| GCP Applied Technologies, Inc. (a) | | 7,300 | $232,870 |
| Chemicals - 65.8% | | | |
| Commodity Chemicals - 15.8% | | | |
| Alpek SA de CV | | 162,400 | 193,682 |
| Ciner Resources LP | | 7,200 | 181,584 |
| LG Chemical Ltd. | | 1,665 | 631,760 |
| LyondellBasell Industries NV Class A | | 80,216 | 8,849,429 |
| Olin Corp. | | 17,800 | 633,324 |
| Orion Engineered Carbons SA | | 21,900 | 560,640 |
| Tronox Ltd. Class A | | 68,532 | 1,405,591 |
| Westlake Chemical Corp. | | 27,300 | 2,908,269 |
| | | | 15,364,279 |
| Diversified Chemicals - 27.9% | | | |
| Ashland Global Holdings, Inc. | | 12,700 | 904,240 |
| DowDuPont, Inc. | | 294,597 | 20,981,200 |
| Eastman Chemical Co. | | 14,535 | 1,346,522 |
| Huntsman Corp. | | 20,100 | 669,129 |
| The Chemours Co. LLC | | 66,200 | 3,313,972 |
| | | | 27,215,063 |
| Fertilizers & Agricultural Chemicals - 7.1% | | | |
| Agrium, Inc. | | 8,100 | 931,661 |
| CF Industries Holdings, Inc. | | 29,300 | 1,246,422 |
| FMC Corp. | | 21,800 | 2,063,588 |
| Monsanto Co. | | 20,927 | 2,443,855 |
| The Scotts Miracle-Gro Co. Class A | | 1,900 | 203,281 |
| | | | 6,888,807 |
| Industrial Gases - 4.6% | | | |
| Air Products & Chemicals, Inc. | | 1,500 | 246,120 |
| Linde AG (a) | | 18,200 | 4,250,625 |
| | | | 4,496,745 |
| Specialty Chemicals - 10.4% | | | |
| Axalta Coating Systems Ltd. (a) | | 27,900 | 902,844 |
| Celanese Corp. Class A | | 15,500 | 1,659,740 |
| Frutarom Industries Ltd. | | 5,400 | 506,689 |
| Kraton Performance Polymers, Inc. (a) | | 3,100 | 149,327 |
| Platform Specialty Products Corp. (a) | | 95,400 | 946,368 |
| PolyOne Corp. | | 8,200 | 356,700 |
| PPG Industries, Inc. | | 6,500 | 759,330 |
| PQ Group Holdings, Inc. | | 17,700 | 291,165 |
| Sensient Technologies Corp. | | 4,300 | 314,545 |
| Sherwin-Williams Co. | | 8,900 | 3,649,356 |
| W.R. Grace & Co. | | 8,146 | 571,279 |
| | | | 10,107,343 |
|
| TOTAL CHEMICALS | | | 64,072,237 |
|
| Construction Materials - 4.5% | | | |
| Construction Materials - 4.5% | | | |
| CRH PLC sponsored ADR | | 11,200 | 404,208 |
| Eagle Materials, Inc. | | 18,988 | 2,151,340 |
| Summit Materials, Inc. | | 56,451 | 1,774,819 |
| | | | 4,330,367 |
| Containers & Packaging - 12.9% | | | |
| Metal & Glass Containers - 4.8% | | | |
| Aptargroup, Inc. | | 9,500 | 819,660 |
| Ball Corp. | | 82,000 | 3,103,700 |
| Berry Global Group, Inc. (a) | | 13,500 | 792,045 |
| | | | 4,715,405 |
| Paper Packaging - 8.1% | | | |
| Avery Dennison Corp. | | 8,800 | 1,010,768 |
| Graphic Packaging Holding Co. | | 141,900 | 2,192,355 |
| Packaging Corp. of America | | 9,400 | 1,133,170 |
| WestRock Co. | | 55,698 | 3,520,671 |
| | | | 7,856,964 |
|
| TOTAL CONTAINERS & PACKAGING | | | 12,572,369 |
|
| Metals & Mining - 12.0% | | | |
| Copper - 2.9% | | | |
| Freeport-McMoRan, Inc. (a) | | 147,800 | 2,802,288 |
| Diversified Metals & Mining - 2.3% | | | |
| Alcoa Corp. (a) | | 20,600 | 1,109,722 |
| Glencore Xstrata PLC | | 168,393 | 886,688 |
| Ivanhoe Mines Ltd. (a) | | 62,800 | 211,831 |
| | | | 2,208,241 |
| Gold - 2.5% | | | |
| Newmont Mining Corp. | | 45,800 | 1,718,416 |
| Randgold Resources Ltd. sponsored ADR | | 7,900 | 781,231 |
| | | | 2,499,647 |
| Steel - 4.3% | | | |
| Allegheny Technologies, Inc. (a)(b) | | 12,800 | 308,992 |
| Reliance Steel & Aluminum Co. | | 10,200 | 875,058 |
| Ryerson Holding Corp. (a) | | 26,600 | 276,640 |
| Steel Dynamics, Inc. | | 59,700 | 2,574,861 |
| United States Steel Corp. | | 3,500 | 123,165 |
| | | | 4,158,716 |
|
| TOTAL METALS & MINING | | | 11,668,892 |
|
| Trading Companies & Distributors - 1.8% | | | |
| Trading Companies & Distributors - 1.8% | | | |
| Univar, Inc. (a) | | 55,300 | 1,712,088 |
| TOTAL COMMON STOCKS | | | |
| (Cost $72,729,263) | | | 94,588,823 |
|
| Nonconvertible Preferred Stocks - 0.3% | | | |
| Chemicals - 0.3% | | | |
| Commodity Chemicals - 0.3% | | | |
| Braskem SA (PN-A) | | | |
| (Cost $407,609) | | 27,700 | 357,993 |
|
| Money Market Funds - 2.0% | | | |
| Fidelity Cash Central Fund, 1.36% (c) | | 1,791,183 | 1,791,541 |
| Fidelity Securities Lending Cash Central Fund 1.36% (c)(d) | | 156,535 | 156,566 |
| TOTAL MONEY MARKET FUNDS | | | |
| (Cost $1,948,091) | | | 1,948,107 |
| TOTAL INVESTMENT IN SECURITIES - 99.5% | | | |
| (Cost $75,084,963) | | | 96,894,923 |
| NET OTHER ASSETS (LIABILITIES) - 0.5% | | | 443,044 |
| NET ASSETS - 100% | | | $97,337,967 |
Legend
(a) Non-income producing
(b) Security or a portion of the security is on loan at period end.
(c) Affiliated fund that is generally available only to investment companies and other accounts managed by Fidelity Investments. The rate quoted is the annualized seven-day yield of the fund at period end. A complete unaudited listing of the fund's holdings as of its most recent quarter end is available upon request. In addition, each Fidelity Central Fund's financial statements, which are not covered by the Fund's Report of Independent Registered Public Accounting Firm, are available on the SEC's website or upon request.
(d) Investment made with cash collateral received from securities on loan.
Affiliated Central Funds
Information regarding fiscal year to date income earned by the Fund from investments in Fidelity Central Funds is as follows:
| Fund | Income earned |
| Fidelity Cash Central Fund | $15,729 |
| Fidelity Securities Lending Cash Central Fund | 1,820 |
| Total | $17,549 |
Amounts in the income column in the above table include any capital gain distributions from underlying funds, which are presented in the corresponding line-item in the Statement of Operations if applicable.
Investment Valuation
All investments are categorized as Level 1 under the Fair Value Hierarchy. The inputs or methodology used for valuing securities may not be an indication of the risk associated with investing in those securities. For more information on valuation inputs please refer to the Investment Valuation section in the accompanying Notes to Financial Statements.
Other Information
Distribution of investments by country or territory of incorporation, as a percentage of Total Net Assets, is as follows (Unaudited):
| United States of America | 78.7% |
| Netherlands | 9.1% |
| Germany | 4.4% |
| Bailiwick of Jersey | 1.7% |
| Australia | 1.4% |
| Canada | 1.2% |
| Others (Individually Less Than 1%) | 3.5% |
| | 100.0% |
See accompanying notes which are an integral part of the financial statements.
Financial Statements
Statement of Assets and Liabilities
| | | December 31, 2017 |
| Assets | | |
Investment in securities, at value (including securities loaned of $149,668) — See accompanying schedule:
Unaffiliated issuers (cost $73,136,872) | $94,946,816 | |
| Fidelity Central Funds (cost $1,948,091) | 1,948,107 | |
| Total Investment in Securities (cost $75,084,963) | | $96,894,923 |
| Receivable for investments sold | | 73,040 |
| Receivable for fund shares sold | | 666,461 |
| Dividends receivable | | 54,904 |
| Distributions receivable from Fidelity Central Funds | | 2,562 |
| Prepaid expenses | | 351 |
| Other receivables | | 464 |
| Total assets | | 97,692,705 |
| Liabilities | | |
| Payable for investments purchased | $99,133 | |
| Payable for fund shares redeemed | 2,129 | |
| Accrued management fee | 42,349 | |
| Other affiliated payables | 13,330 | |
| Other payables and accrued expenses | 41,247 | |
| Collateral on securities loaned | 156,550 | |
| Total liabilities | | 354,738 |
| Net Assets | | $97,337,967 |
| Net Assets consist of: | | |
| Paid in capital | | $70,120,065 |
| Undistributed net investment income | | 237,872 |
| Accumulated undistributed net realized gain (loss) on investments and foreign currency transactions | | 5,170,018 |
| Net unrealized appreciation (depreciation) on investments and assets and liabilities in foreign currencies | | 21,810,012 |
| Net Assets | | $97,337,967 |
| Initial Class: | | |
| Net Asset Value, offering price and redemption price per share ($19,126,195 ÷ 1,182,135 shares) | | $16.18 |
| Investor Class: | | |
| Net Asset Value, offering price and redemption price per share ($78,211,772 ÷ 4,837,732 shares) | | $16.17 |
See accompanying notes which are an integral part of the financial statements.
Statement of Operations
| | | Year ended December 31, 2017 |
| Investment Income | | |
| Dividends | | $1,400,055 |
| Income from Fidelity Central Funds | | 17,549 |
| Total income | | 1,417,604 |
| Expenses | | |
| Management fee | $433,756 | |
| Transfer agent fees | 104,064 | |
| Accounting and security lending fees | 31,114 | |
| Custodian fees and expenses | 12,823 | |
| Independent trustees' fees and expenses | 1,754 | |
| Audit | 43,510 | |
| Legal | 1,029 | |
| Miscellaneous | 4,904 | |
| Total expenses before reductions | 632,954 | |
| Expense reductions | (4,540) | 628,414 |
| Net investment income (loss) | | 789,190 |
| Realized and Unrealized Gain (Loss) | | |
| Net realized gain (loss) on: | | |
| Investment securities: | | |
| Unaffiliated issuers | 6,232,332 | |
| Fidelity Central Funds | (42) | |
| Foreign currency transactions | 138 | |
| Total net realized gain (loss) | | 6,232,428 |
| Change in net unrealized appreciation (depreciation) on: | | |
| Investment securities: | | |
| Unaffiliated issuers | 10,999,045 | |
| Fidelity Central Funds | (29) | |
| Assets and liabilities in foreign currencies | 60 | |
| Total change in net unrealized appreciation (depreciation) | | 10,999,076 |
| Net gain (loss) | | 17,231,504 |
| Net increase (decrease) in net assets resulting from operations | | $18,020,694 |
See accompanying notes which are an integral part of the financial statements.
Statement of Changes in Net Assets
| | Year ended December 31, 2017 | Year ended December 31, 2016 |
| Increase (Decrease) in Net Assets | | |
| Operations | | |
| Net investment income (loss) | $789,190 | $697,744 |
| Net realized gain (loss) | 6,232,428 | 779,643 |
| Change in net unrealized appreciation (depreciation) | 10,999,076 | 4,464,552 |
| Net increase (decrease) in net assets resulting from operations | 18,020,694 | 5,941,939 |
| Distributions to shareholders from net investment income | (708,148) | (539,128) |
| Distributions to shareholders from net realized gain | (1,380,860) | (1,246,661) |
| Total distributions | (2,089,008) | (1,785,789) |
| Share transactions - net increase (decrease) | 15,883,386 | 10,103,624 |
| Redemption fees | 11,397 | 12,221 |
| Total increase (decrease) in net assets | 31,826,469 | 14,271,995 |
| Net Assets | | |
| Beginning of period | 65,511,498 | 51,239,503 |
| End of period | $97,337,967 | $65,511,498 |
| Other Information | | |
| Undistributed net investment income end of period | $237,872 | $156,830 |
See accompanying notes which are an integral part of the financial statements.
Financial Highlights
VIP Materials Portfolio Initial Class
| Years ended December 31, | 2017 | 2016 | 2015 | 2014 | 2013 |
| Selected Per–Share Data | | | | | |
| Net asset value, beginning of period | $13.16 | $12.18 | $14.84 | $15.53 | $13.27 |
| Income from Investment Operations | | | | | |
| Net investment income (loss)A | .15 | .17 | .17 | .15 | .11 |
| Net realized and unrealized gain (loss) | 3.25 | 1.23 | (1.33) | (.09) | 2.77 |
| Total from investment operations | 3.40 | 1.40 | (1.16) | .06 | 2.88 |
| Distributions from net investment income | (.13) | (.11) | (.19) | (.15) | (.17) |
| Distributions from net realized gain | (.25) | (.31) | (1.32) | (.60) | (.45) |
| Total distributions | (.38) | (.42) | (1.50)B | (.75) | (.62) |
| Redemption fees added to paid in capitalA,C | – | – | – | – | – |
| Net asset value, end of period | $16.18 | $13.16 | $12.18 | $14.84 | $15.53 |
| Total ReturnD,E | 26.08% | 12.20% | (9.01)% | .37% | 22.15% |
| Ratios to Average Net AssetsF,G | | | | | |
| Expenses before reductions | .73% | .77% | .75% | .75% | .76% |
| Expenses net of fee waivers, if any | .73% | .77% | .75% | .74% | .76% |
| Expenses net of all reductions | .72% | .76% | .75% | .73% | .75% |
| Net investment income (loss) | 1.05% | 1.37% | 1.23% | 1.00% | .77% |
| Supplemental Data | | | | | |
| Net assets, end of period (000 omitted) | $19,126 | $12,726 | $11,432 | $17,469 | $21,067 |
| Portfolio turnover rateH | 64% | 56% | 68% | 78% | 68% |
A Calculated based on average shares outstanding during the period.
B Total distributions of $1.50 per share is comprised of distributions from net investment income of $.185 and distributions from net realized gain of $1.319 per share.
C Amount represents less than $.005 per share.
D Total returns do not reflect charges attributable to your insurance company's separate account. Inclusion of these charges would reduce the total returns shown.
E Total returns would have been lower if certain expenses had not been reduced during the applicable periods shown.
F Fees and expenses of any underlying Fidelity Central Funds are not included in the Fund's expense ratio. The Fund indirectly bears its proportionate share of the expenses of any underlying Fidelity Central Funds.
G Expense ratios reflect operating expenses of the class. Expenses before reductions do not reflect amounts reimbursed by the investment adviser or reductions from brokerage service arrangements or reductions from other expense offset arrangements and do not represent the amount paid by the class during periods when reimbursements or reductions occur. Expenses net of fee waivers reflect expenses after reimbursement by the investment adviser but prior to reductions from brokerage service arrangements or other expense offset arrangements. Expenses net of all reductions represent the net expenses paid by the class.
H Amount does not include the portfolio activity of any underlying Fidelity Central Funds.
See accompanying notes which are an integral part of the financial statements.
VIP Materials Portfolio Investor Class
| Years ended December 31, | 2017 | 2016 | 2015 | 2014 | 2013 |
| Selected Per–Share Data | | | | | |
| Net asset value, beginning of period | $13.15 | $12.18 | $14.84 | $15.53 | $13.27 |
| Income from Investment Operations | | | | | |
| Net investment income (loss)A | .14 | .16 | .16 | .14 | .10 |
| Net realized and unrealized gain (loss) | 3.25 | 1.23 | (1.33) | (.09) | 2.77 |
| Total from investment operations | 3.39 | 1.39 | (1.17) | .05 | 2.87 |
| Distributions from net investment income | (.12) | (.11) | (.17) | (.14) | (.16) |
| Distributions from net realized gain | (.25) | (.31) | (1.32) | (.60) | (.45) |
| Total distributions | (.37) | (.42) | (1.49) | (.74) | (.61) |
| Redemption fees added to paid in capitalA,B | – | – | – | – | – |
| Net asset value, end of period | $16.17 | $13.15 | $12.18 | $14.84 | $15.53 |
| Total ReturnC,D | 26.02% | 12.06% | (9.09)% | .32% | 22.07% |
| Ratios to Average Net AssetsE,F | | | | | |
| Expenses before reductions | .81% | .85% | .83% | .82% | .83% |
| Expenses net of fee waivers, if any | .81% | .85% | .83% | .81% | .83% |
| Expenses net of all reductions | .80% | .85% | .82% | .81% | .83% |
| Net investment income (loss) | .97% | 1.29% | 1.16% | .93% | .69% |
| Supplemental Data | | | | | |
| Net assets, end of period (000 omitted) | $78,212 | $52,786 | $39,807 | $54,837 | $54,561 |
| Portfolio turnover rateG | 64% | 56% | 68% | 78% | 68% |
A Calculated based on average shares outstanding during the period.
B Amount represents less than $.005 per share.
C Total returns do not reflect charges attributable to your insurance company's separate account. Inclusion of these charges would reduce the total returns shown.
D Total returns would have been lower if certain expenses had not been reduced during the applicable periods shown.
E Fees and expenses of any underlying Fidelity Central Funds are not included in the Fund's expense ratio. The Fund indirectly bears its proportionate share of the expenses of any underlying Fidelity Central Funds.
F Expense ratios reflect operating expenses of the class. Expenses before reductions do not reflect amounts reimbursed by the investment adviser or reductions from brokerage service arrangements or reductions from other expense offset arrangements and do not represent the amount paid by the class during periods when reimbursements or reductions occur. Expenses net of fee waivers reflect expenses after reimbursement by the investment adviser but prior to reductions from brokerage service arrangements or other expense offset arrangements. Expenses net of all reductions represent the net expenses paid by the class.
G Amount does not include the portfolio activity of any underlying Fidelity Central Funds.
See accompanying notes which are an integral part of the financial statements.
Notes to Financial Statements
For the period ended December 31, 2017
1. Organization.
VIP Materials Portfolio (the Fund) is a non-diversified fund of Variable Insurance Products Fund IV (the Trust) and is authorized to issue an unlimited number of shares. The Trust is registered under the Investment Company Act of 1940, as amended (the 1940 Act), as an open-end management investment company organized as a Massachusetts business trust. Shares of the Fund may only be purchased by insurance companies for the purpose of funding variable annuity or variable life insurance contracts. The Fund offers the following classes of shares: Initial Class shares, and Investor Class shares. All classes have equal rights and voting privileges, except for matters affecting a single class.
2. Investments in Fidelity Central Funds.
The Fund invests in Fidelity Central Funds, which are open-end investment companies generally available only to other investment companies and accounts managed by the investment adviser and its affiliates. The Fund's Schedule of Investments lists each of the Fidelity Central Funds held as of period end, if any, as an investment of the Fund, but does not include the underlying holdings of each Fidelity Central Fund. As an Investing Fund, the Fund indirectly bears its proportionate share of the expenses of the underlying Fidelity Central Funds.
The Money Market Central Funds seek preservation of capital and current income and are managed by Fidelity Investments Money Management, Inc. (FIMM), an affiliate of the investment adviser. Annualized expenses of the Money Market Central Funds as of their most recent shareholder report date are less than .005%.
A complete unaudited list of holdings for each Fidelity Central Fund is available upon request or at the Securities and Exchange Commission (the SEC) website at www.sec.gov. In addition, the financial statements of the Fidelity Central Funds, which are not covered by the Fund's Report of Independent Registered Public Accounting Firm, are available on the SEC website or upon request.
3. Significant Accounting Policies.
The Fund is an investment company and applies the accounting and reporting guidance of the Financial Accounting Standards Board (FASB) Accounting Standards Codification Topic 946 Financial Services – Investments Companies. The financial statements have been prepared in conformity with accounting principles generally accepted in the United States of America (GAAP), which require management to make certain estimates and assumptions at the date of the financial statements. Actual results could differ from those estimates. Subsequent events, if any, through the date that the financial statements were issued have been evaluated in the preparation of the financial statements. The following summarizes the significant accounting policies of the Fund:
Investment Valuation. Investments are valued as of 4:00 p.m. Eastern time on the last calendar day of the period. The Board of Trustees (the Board) has delegated the day to day responsibility for the valuation of the Fund's investments to the Fair Value Committee (the Committee) established by the Fund's investment adviser. In accordance with valuation policies and procedures approved by the Board, the Fund attempts to obtain prices from one or more third party pricing vendors or brokers to value its investments. When current market prices, quotations or currency exchange rates are not readily available or reliable, investments will be fair valued in good faith by the Committee, in accordance with procedures adopted by the Board. Factors used in determining fair value vary by investment type and may include market or investment specific events. The frequency with which these procedures are used cannot be predicted and they may be utilized to a significant extent. The Committee oversees the Fund's valuation policies and procedures and reports to the Board on the Committee's activities and fair value determinations. The Board monitors the appropriateness of the procedures used in valuing the Fund's investments and ratifies the fair value determinations of the Committee.
The Fund categorizes the inputs to valuation techniques used to value its investments into a disclosure hierarchy consisting of three levels as shown below:
- Level 1 – quoted prices in active markets for identical investments
- Level 2 – other significant observable inputs (including quoted prices for similar investments, interest rates, prepayment speeds, etc.)
- Level 3 – unobservable inputs (including the Fund's own assumptions based on the best information available)
Valuation techniques used to value the Fund's investments by major category are as follows:
Equity securities, including restricted securities, for which market quotations are readily available, are valued at the last reported sale price or official closing price as reported by a third party pricing vendor on the primary market or exchange on which they are traded and are categorized as Level 1 in the hierarchy. In the event there were no sales during the day or closing prices are not available, securities are valued at the last quoted bid price or may be valued using the last available price and are generally categorized as Level 2 in the hierarchy. For foreign equity securities, when market or security specific events arise, comparisons to the valuation of American Depositary Receipts (ADRs), futures contracts, Exchange-Traded Funds (ETFs) and certain indexes as well as quoted prices for similar securities may be used and would be categorized as Level 2 in the hierarchy. Utilizing these techniques may result in transfers between Level 1 and Level 2. For equity securities, including restricted securities, where observable inputs are limited, assumptions about market activity and risk are used and these securities may be categorized as Level 3 in the hierarchy.
Investments in open-end mutual funds, including Fidelity Central Funds, are valued at their closing net asset value (NAV) each business day and are categorized as Level 1 in the hierarchy.
Changes in valuation techniques may result in transfers in or out of an assigned level within the disclosure hierarchy.
Foreign Currency. The Fund may use foreign currency contracts to facilitate transactions in foreign-denominated securities. Gains and losses from these transactions may arise from changes in the value of the foreign currency or if the counterparties do not perform under the contracts' terms.
Foreign-denominated assets, including investment securities, and liabilities are translated into U.S. dollars at the exchange rates at period end. Purchases and sales of investment securities, income and dividends received and expenses denominated in foreign currencies are translated into U.S. dollars at the exchange rate in effect on the transaction date.
The effects of exchange rate fluctuations on investments are included with the net realized and unrealized gain (loss) on investment securities. Other foreign currency transactions resulting in realized and unrealized gain (loss) are disclosed separately.
Investment Transactions and Income. For financial reporting purposes, the Fund's investment holdings and NAV include trades executed through the end of the last business day of the period. The NAV per share for processing shareholder transactions is calculated as of the close of business of the New York Stock Exchange (NYSE), normally 4:00 p.m. Eastern time and includes trades executed through the end of the prior business day. Gains and losses on securities sold are determined on the basis of identified cost and includes proceeds received from litigation. Dividend income is recorded on the ex-dividend date, except for certain dividends from foreign securities where the ex-dividend date may have passed, which are recorded as soon as the Fund is informed of the ex-dividend date. Non-cash dividends included in dividend income, if any, are recorded at the fair market value of the securities received. Income and capital gain distributions from Fidelity Central Funds, if any, are recorded on the ex-dividend date. Certain distributions received by the Fund represent a return of capital or capital gain. The Fund determines the components of these distributions subsequent to the ex-dividend date, based upon receipt of tax filings or other correspondence relating to the underlying investment. These distributions are recorded as a reduction of cost of investments and/or as a realized gain. Investment income is recorded net of foreign taxes withheld where recovery of such taxes is uncertain.
Class Allocations and Expenses. Investment income, realized and unrealized capital gains and losses, common expenses of the Fund, and certain fund-level expense reductions, if any, are allocated daily on a pro-rata basis to each class based on the relative net assets of each class to the total net assets of the Fund. Each class differs with respect to transfer agent fees incurred. Certain expense reductions may also differ by class. For the reporting period, the allocated portion of income and expenses to each class as a percent of its average net assets may vary due to the timing of recording these transactions in relation to fluctuating net assets of the classes. Expenses directly attributable to a fund are charged to that fund. Expenses attributable to more than one fund are allocated among the respective funds on the basis of relative net assets or other appropriate methods. Expense estimates are accrued in the period to which they relate and adjustments are made when actual amounts are known.
Income Tax Information and Distributions to Shareholders. Each year, the Fund intends to qualify as a regulated investment company under Subchapter M of the Internal Revenue Code, including distributing substantially all of its taxable income and realized gains. As a result, no provision for U.S. Federal income taxes is required. As of December 31, 2017, the Fund did not have any unrecognized tax benefits in the financial statements; nor is the Fund aware of any tax positions for which it is reasonably possible that the total amounts of unrecognized tax benefits will significantly change in the next twelve months. The Fund files a U.S. federal tax return, in addition to state and local tax returns as required. The Fund's federal income tax returns are subject to examination by the Internal Revenue Service (IRS) for a period of three fiscal years after they are filed. State and local tax returns may be subject to examination for an additional fiscal year depending on the jurisdiction. Foreign taxes are provided for based on the Fund's understanding of the tax rules and rates that exist in the foreign markets in which it invests.
Distributions are declared and recorded on the ex-dividend date. Income dividends and capital gain distributions are declared separately for each class. Income and capital gain distributions are determined in accordance with income tax regulations, which may differ from GAAP.
Capital accounts within the financial statements are adjusted for permanent book-tax differences. These adjustments have no impact on net assets or the results of operations. Capital accounts are not adjusted for temporary book-tax differences which will reverse in a subsequent period.
Book-tax differences are primarily due to foreign currency transactions, passive foreign investment companies (PFIC) and losses deferred due to wash sales.
As of period end, the cost and unrealized appreciation (depreciation) in securities, and derivatives if applicable, for federal income tax purposes were as follows:
| Gross unrealized appreciation | $22,243,110 |
| Gross unrealized depreciation | (550,933) |
| Net unrealized appreciation (depreciation) | $21,692,177 |
| Tax Cost | $75,202,746 |
The tax-based components of distributable earnings as of period end were as follows:
| Undistributed ordinary income | $467,464 |
| Undistributed long-term capital gain | $5,058,209 |
| Net unrealized appreciation (depreciation) on securities and other investments | $21,692,229 |
The tax character of distributions paid was as follows:
| | December 31, 2017 | December 31, 2016 |
| Ordinary Income | $1,465,198 | $ 547,250 |
| Long-term Capital Gains | 623,810 | 1,238,539 |
| Total | $2,089,008 | $ 1,785,789 |
Trading (Redemption) Fees. Shares held by investors less than 60 days may be subject to a redemption fee equal to 1% of the NAV of shares redeemed. All redemption fees, which reduce the proceeds of the shareholder redemption, are retained by the Fund and accounted for as an addition to paid in capital. In November 2017, the Board of Trustees approved the elimination of these redemption fees effective December 18, 2017.
4. Purchases and Sales of Investments.
Purchases and sales of securities, other than short-term securities, aggregated $63,470,296 and $50,081,339, respectively.
5. Fees and Other Transactions with Affiliates.
Management Fee. Fidelity SelectCo, LLC (the investment adviser) and its affiliates provide the Fund with investment management related services for which the Fund pays a monthly management fee. The management fee is the sum of an individual fund fee rate that is based on an annual rate of .30% of the Fund's average net assets and an annualized group fee rate that averaged .24% during the period. The group fee rate is based upon the average net assets of all the mutual funds advised by Fidelity Management & Research Company (FMR) and the investment adviser. The group fee rate decreases as assets under management increase and increases as assets under management decrease. For the reporting period, the total annual management fee rate was .54% of the Fund's average net assets.
Transfer Agent Fees. Fidelity Investments Institutional Operations Company, Inc. (FIIOC), an affiliate of the investment adviser, is the Fund's transfer, dividend disbursing, and shareholder servicing agent. FIIOC receives an asset-based fee with respect to each class. Each class pays a fee for transfer agent services, typesetting and printing and mailing of shareholder reports, excluding mailing of proxy statements, equal to an annual rate of class-level average net assets. The annual rate for Investor Class is .15% and the annual rate for Initial Class is .07%. For the period, transfer agent fees for each class were as follows:
| Initial Class | $10,596 |
| Investor Class | 93,468 |
| | $104,064 |
Accounting and Security Lending Fees. Fidelity Service Company, Inc. (FSC), an affiliate of the investment adviser, maintains the Fund's accounting records. The accounting fee is based on the level of average net assets for each month. Under a separate contract, FSC administers the security lending program. The security lending fee is based on the number and duration of lending transactions.
Brokerage Commissions. The Fund placed a portion of its portfolio transactions with brokerage firms which are affiliates of the investment adviser. Brokerage commissions are included in net realized gain (loss) and change in net unrealized appreciation (depreciation) in the Statement of Operations. The commissions paid to these affiliated firms were $1,464 for the period.
Interfund Trades. The Funds may purchase from or sell securities to other Fidelity Funds under procedures adopted by the Board. The procedures have been designed to ensure these interfund trades are executed in accordance with Rule 17a-7 of the 1940 Act. Interfund trades are included within the respective purchases and sales amounts shown in the Purchases and Sales of Investments note.
6. Committed Line of Credit.
The Fund participates with other funds managed by the investment adviser or an affiliate in a $4.25 billion credit facility (the "line of credit") to be utilized for temporary or emergency purposes to fund shareholder redemptions or for other short-term liquidity purposes. The Fund has agreed to pay commitment fees on its pro-rata portion of the line of credit, which amounted to $227 and is reflected in Miscellaneous expenses on the Statement of Operations. During the period, the Fund did not borrow on this line of credit.
7. Security Lending.
The Fund lends portfolio securities through a lending agent from time to time in order to earn additional income. On the settlement date of the loan, the Fund receives collateral (in the form of U.S. Treasury obligations, letters of credit and/or cash) against the loaned securities and maintains collateral in an amount not less than 100% of the market value of the loaned securities during the period of the loan. The market value of the loaned securities is determined at the close of business of the Fund and any additional required collateral is delivered to the Fund on the next business day. The Fund or borrower may terminate the loan at any time, and if the borrower defaults on its obligation to return the securities loaned because of insolvency or other reasons, the Fund may apply collateral received from the borrower against the obligation. The Fund may experience delays and costs in recovering the securities loaned. Any cash collateral received is invested in the Fidelity Securities Lending Cash Central Fund. The value of loaned securities and cash collateral at period end are disclosed on the Fund's Statement of Assets and Liabilities. Security lending income represents the income earned on investing cash collateral, less rebates paid to borrowers and any lending agent fees associated with the loan, plus any premium payments received for lending certain types of securities. Security lending income is presented in the Statement of Operations as a component of income from Fidelity Central Funds. Total security lending income during the period amounted to $1,820.
8. Expense Reductions.
Commissions paid to certain brokers with whom the investment adviser, or its affiliates, places trades on behalf of the Fund include an amount in addition to trade execution, which may be rebated back to the Fund to offset certain expenses. This amount totaled $3,889 for the period.
In addition, during the period the investment adviser reimbursed and/or waived a portion of fund-level operating expenses in the amount of $651.
9. Distributions to Shareholders.
Distributions to shareholders of each class were as follows:
| | Year ended
December 31, 2017 | Year ended December 31, 2016 |
| From net investment income | | |
| Initial Class | $150,503 | $109,829 |
| Investor Class | 557,645 | 429,299 |
| Total | $708,148 | $539,128 |
| From net realized gain | | |
| Initial Class | $276,391 | $277,716 |
| Investor Class | 1,104,469 | 968,945 |
| Total | $1,380,860 | $1,246,661 |
10. Share Transactions.
Transactions for each class of shares were as follows:
| | Shares | Shares | Dollars | Dollars |
| | Year ended December 31, 2017 | Year ended December 31, 2016 | Year ended December 31, 2017 | Year ended December 31, 2016 |
| Initial Class | | | | |
| Shares sold | 501,204 | 231,288 | $7,305,805 | $2,906,388 |
| Reinvestment of distributions | 28,510 | 35,033 | 426,894 | 387,545 |
| Shares redeemed | (314,876) | (237,474) | (4,507,729) | (2,850,671) |
| Net increase (decrease) | 214,838 | 28,847 | $3,224,970 | $443,262 |
| Investor Class | | | | |
| Shares sold | 1,981,885 | 1,455,195 | $29,318,309 | $18,450,449 |
| Reinvestment of distributions | 111,128 | 125,686 | 1,662,114 | 1,398,244 |
| Shares redeemed | (1,269,883) | (834,774) | (18,322,007) | (10,188,331) |
| Net increase (decrease) | 823,130 | 746,107 | $12,658,416 | $9,660,362 |
11. Other.
The Fund's organizational documents provide former and current trustees and officers with a limited indemnification against liabilities arising in connection with the performance of their duties to the Fund. In the normal course of business, the Fund may also enter into contracts that provide general indemnifications. The Fund's maximum exposure under these arrangements is unknown as this would be dependent on future claims that may be made against the Fund. The risk of material loss from such claims is considered remote.
At the end of the period, the investment adviser or its affiliates were the owners of record of 100% of the total outstanding shares of the Fund.
Report of Independent Registered Public Accounting Firm
To the Trustees of Variable Insurance Products Fund IV and Shareholders of VIP Materials Portfolio:
Opinion on the Financial Statements
We have audited the accompanying statement of assets and liabilities, including the schedule of investments, of VIP Materials Portfolio (one of the funds constituting Variable Insurance Products Fund IV, referred to hereafter as the “Fund”) as of December 31, 2017, the related statement of operations for the year ended December 31, 2017, the statement of changes in net assets for each of the two years in the period ended December 31, 2017, including the related notes, and the financial highlights for each of the five years in the period ended December 31, 2017 (collectively referred to as the “financial statements”). In our opinion, the financial statements present fairly, in all material respects, the financial position of the Fund as of December 31, 2017, the results of its operations for the year then ended, the changes in its net assets for each of the two years in the period ended December 31, 2017 and the financial highlights for each of the five years in the period ended December 31, 2017 in conformity with accounting principles generally accepted in the United States of America.
Basis for Opinion
These financial statements are the responsibility of the Fund’s management. Our responsibility is to express an opinion on the Fund’s financial statements based on our audits. We are a public accounting firm registered with the Public Company Accounting Oversight Board (United States) (“PCAOB”) and are required to be independent with respect to the Fund in accordance with the U.S. federal securities laws and the applicable rules and regulations of the Securities and Exchange Commission and the PCAOB.
We conducted our audits of these financial statements in accordance with the standards of the PCAOB. Those standards require that we plan and perform the audit to obtain reasonable assurance about whether the financial statements are free of material misstatement, whether due to error or fraud.
Our audits included performing procedures to assess the risks of material misstatement of the financial statements, whether due to error or fraud, and performing procedures that respond to those risks. Such procedures included examining, on a test basis, evidence regarding the amounts and disclosures in the financial statements. Our audits also included evaluating the accounting principles used and significant estimates made by management, as well as evaluating the overall presentation of the financial statements. Our procedures included confirmation of securities owned as of December 31, 2017 by correspondence with the custodian and brokers; when replies were not received from brokers, we performed other auditing procedures. We believe that our audits provide a reasonable basis for our opinion.
PricewaterhouseCoopers LLP
Boston, Massachusetts
February 15, 2018
We have served as the auditor of one or more investment companies in the Fidelity group of funds since 1932.
Trustees and Officers
The Trustees, Members of the Advisory Board (if any), and officers of the trusts and fund, as applicable, are listed below. The Board of Trustees governs the fund and is responsible for protecting the interests of shareholders. The Trustees are experienced executives who meet periodically throughout the year to oversee the fund's activities, review contractual arrangements with companies that provide services to the fund, oversee management of the risks associated with such activities and contractual arrangements, and review the fund's performance. Each of the Trustees oversees 91 funds.
The Trustees hold office without limit in time except that (a) any Trustee may resign; (b) any Trustee may be removed by written instrument, signed by at least two-thirds of the number of Trustees prior to such removal; (c) any Trustee who requests to be retired or who has become incapacitated by illness or injury may be retired by written instrument signed by a majority of the other Trustees; and (d) any Trustee may be removed at any special meeting of shareholders by a two-thirds vote of the outstanding voting securities of the trust. Each Trustee who is not an interested person (as defined in the 1940 Act) of the trust and the fund is referred to herein as an Independent Trustee. Each Independent Trustee shall retire not later than the last day of the calendar year in which his or her 75th birthday occurs. The Independent Trustees may waive this mandatory retirement age policy with respect to individual Trustees. Officers and Advisory Board Members hold office without limit in time, except that any officer or Advisory Board Member may resign or may be removed by a vote of a majority of the Trustees at any regular meeting or any special meeting of the Trustees. Except as indicated, each individual has held the office shown or other offices in the same company for the past five years.
The fund’s Statement of Additional Information (SAI) includes more information about the Trustees. To request a free copy, call Fidelity at 1-877-208-0098.
Experience, Skills, Attributes, and Qualifications of the Trustees. The Governance and Nominating Committee has adopted a statement of policy that describes the experience, qualifications, attributes, and skills that are necessary and desirable for potential Independent Trustee candidates (Statement of Policy). The Board believes that each Trustee satisfied at the time he or she was initially elected or appointed a Trustee, and continues to satisfy, the standards contemplated by the Statement of Policy. The Governance and Nominating Committee also engages professional search firms to help identify potential Independent Trustee candidates who have the experience, qualifications, attributes, and skills consistent with the Statement of Policy. From time to time, additional criteria based on the composition and skills of the current Independent Trustees, as well as experience or skills that may be appropriate in light of future changes to board composition, business conditions, and regulatory or other developments, have also been considered by the professional search firms and the Governance and Nominating Committee. In addition, the Board takes into account the Trustees' commitment and participation in Board and committee meetings, as well as their leadership of standing and ad hoc committees throughout their tenure.
In determining that a particular Trustee was and continues to be qualified to serve as a Trustee, the Board has considered a variety of criteria, none of which, in isolation, was controlling. The Board believes that, collectively, the Trustees have balanced and diverse experience, qualifications, attributes, and skills, which allow the Board to operate effectively in governing the fund and protecting the interests of shareholders. Information about the specific experience, skills, attributes, and qualifications of each Trustee, which in each case led to the Board's conclusion that the Trustee should serve (or continue to serve) as a trustee of the fund, is provided below.
Board Structure and Oversight Function. Brian B. Hogan is an interested person and currently serves as Chairman. The Trustees have determined that an interested Chairman is appropriate and benefits shareholders because an interested Chairman has a personal and professional stake in the quality and continuity of services provided to the fund. Independent Trustees exercise their informed business judgment to appoint an individual of their choosing to serve as Chairman, regardless of whether the Trustee happens to be independent or a member of management. The Independent Trustees have determined that they can act independently and effectively without having an Independent Trustee serve as Chairman and that a key structural component for assuring that they are in a position to do so is for the Independent Trustees to constitute a substantial majority for the Board. The Independent Trustees also regularly meet in executive session. Michael E. Wiley serves as Chairman of the Independent Trustees and as such (i) acts as a liaison between the Independent Trustees and management with respect to matters important to the Independent Trustees and (ii) with management prepares agendas for Board meetings.
Fidelity® funds are overseen by different Boards of Trustees. The fund's Board oversees Fidelity's sector portfolios. Other Boards oversee Fidelity's equity and high income funds, and Fidelity's investment grade bond, money market, and asset allocation funds. The use of separate Boards, each with its own committee structure, allows the Trustees of each group of Fidelity® funds to focus on the unique issues of the funds they oversee, including common research, investment, and operational issues. On occasion, the separate Boards establish joint committees to address issues of overlapping consequences for the Fidelity® funds overseen by each Board.
The Trustees operate using a system of committees to facilitate the timely and efficient consideration of all matters of importance to the Trustees, the fund, and fund shareholders and to facilitate compliance with legal and regulatory requirements and oversight of the fund's activities and associated risks. The Board, acting through its committees, has charged SelectCo and its affiliates with (i) identifying events or circumstances the occurrence of which could have demonstrably adverse effects on the fund's business and/or reputation; (ii) implementing processes and controls to lessen the possibility that such events or circumstances occur or to mitigate the effects of such events or circumstances if they do occur; and (iii) creating and maintaining a system designed to evaluate continuously business and market conditions in order to facilitate the identification and implementation processes described in (i) and (ii) above. Because the day-to-day operations and activities of the fund are carried out by or through SelectCo, its affiliates, and other service providers, the fund's exposure to risks is mitigated but not eliminated by the processes overseen by the Trustees. While each of the Board's committees has responsibility for overseeing different aspects of the fund's activities, oversight is exercised primarily through the Operations and Audit Committees. Appropriate personnel, including but not limited to the fund's Chief Compliance Officer (CCO), SelectCo's internal auditor, the independent accountants, the fund's Treasurer and portfolio management personnel, make periodic reports to the Board's committees, as appropriate. The responsibilities of each standing committee, including their oversight responsibilities, are described further under "Standing Committees of the Trustees."
Interested Trustees*:
Correspondence intended for a Trustee who is an interested person may be sent to Fidelity Investments, 245 Summer Street, Boston, Massachusetts 02210.
Name, Year of Birth; Principal Occupations and Other Relevant Experience+
Brian B. Hogan (1964)
Year of Election or Appointment: 2014
Trustee
Chairman of the Board of Trustees
Mr. Hogan also serves as Trustee or Vice President of other funds. Mr. Hogan serves as a Director of FMR Investment Management (UK) Limited (investment adviser firm, 2015-present) and Fidelity SelectCo, LLC (investment adviser firm, 2014-present) and President of the Equity Division of FMR (investment adviser firm, 2009-present). Previously, Mr. Hogan served as Senior Vice President, Equity Research of FMR (2006-2009) and as a portfolio manager. Mr. Brian B. Hogan is not related to Mr. Colm A. Hogan.
* Determined to be an "Interested Trustee" by virtue of, among other things, his or her affiliation with the trust or various entities under common control with SelectCo.
+ The information includes the Trustee's principal occupation during the last five years and other information relating to the experience, attributes, and skills relevant to the Trustee's qualifications to serve as a Trustee, which led to the conclusion that the Trustee should serve as a Trustee for the fund.
Independent Trustees:
Correspondence intended for an Independent Trustee may be sent to Fidelity Investments, P.O. Box 55235, Boston, Massachusetts 02205-5235.
Name, Year of Birth; Principal Occupations and Other Relevant Experience+
David A. Rosow (1942)
Year of Election or Appointment: 2013
Trustee
Mr. Rosow also serves as Trustee of other Fidelity® funds. Prior to his retirement in 2006, Mr. Rosow was the Chief Executive Officer, owner and operator of a number of private companies, which encompassed the oil refining, drilling and marketing of petroleum products (including specialty petroleum products), recreation industry, and real estate development. Mr. Rosow currently serves as a Director of Oxbow Carbon LLC (upgraders, marketers, and distributors of petroleum byproducts of the oil refining process, 2015-present) and Oxbridge Academy of the Palm Beaches (2015-present) and serves as its President and CEO. Previously, Mr. Rosow served on the Fairfield Country Day School Board for 27 years, including as its President for 3 years, stepping down in 2006. Mr. Rosow served as Lead Director and Chairman of the Audit Committee of Hudson United Bancorp (1996-2006), Chairman of the Board of Westport Bank and Trust (1992-1996), and as a Director of TD Banknorth (2006-2007). In addition, Mr. Rosow served as a member (2008-2014) and President (2009-2014) of the Town Council of Palm Beach, Florida. Mr. Rosow also served as a Member of the Advisory Board of certain Fidelity® funds (2012-2013).
Garnett A. Smith (1947)
Year of Election or Appointment: 2013
Trustee
Mr. Smith also serves as Trustee of other Fidelity® funds. Prior to Mr. Smith's retirement, he served as Chairman and Chief Executive Officer of Inbrand Corp. (manufacturer of personal absorbent products, 1990-1997). He also served as President (1986-1990) of Inbrand Corp. Prior to his employment with Inbrand Corp., he was employed by a retail fabric chain and North Carolina National Bank. In addition, Mr. Smith served as a Member of the Advisory Board of certain Fidelity® funds (2012-2013) and as a board member of the Jackson Hole Land Trust (2009-2012).
Michael E. Wiley (1950)
Year of Election or Appointment: 2008
Trustee
Chairman of the Independent Trustees
Mr. Wiley also serves as Trustee of other Fidelity® funds. Mr. Wiley serves as a Director of Andeavor Corporation (independent oil refiner and marketer, 2005-present), a Director of Andeavor Logistics LP (natural resources logistics, 2015-present), and a Director of Bill Barrett Corporation (exploration and production, 2005-present). In addition, Mr. Wiley also serves as a Director of Post Oak Bank (privately-held bank, 2004-present). Previously, Mr. Wiley served as a Trustee of other Fidelity® funds (2008-2013), as a Director of Asia Pacific Exploration Consolidated (international oil and gas exploration and production, 2008-2013), as a member of the Board of Trustees of the University of Tulsa (2000-2006; 2007-2010), as a Senior Energy Advisor of Katzenbach Partners, LLC (consulting, 2006-2007), as an Advisory Director of Riverstone Holdings (private investment), Chairman, President, and CEO of Baker Hughes, Inc. (oilfield services, 2000-2004), and as Director of Spinnaker Exploration Company (exploration and production, 2001-2005).
+ The information includes the Trustee's principal occupation during the last five years and other information relating to the experience, attributes, and skills relevant to the Trustee's qualifications to serve as a Trustee, which led to the conclusion that the Trustee should serve as a Trustee for the fund.
Advisory Board Members and Officers:
Correspondence intended for a Member of the Advisory Board (if any) may be sent to Fidelity Investments, P.O. Box 55235, Boston, Massachusetts 02205-5235. Except for Anthony R. Rochte, correspondence intended for an officer may be sent to Fidelity Investments, 245 Summer Street, Boston, Massachusetts 02210. Correspondence intended for Mr. Rochte may be sent to Fidelity SelectCo, LLC (SelectCo), 1225 17th Street, Denver, Colorado 80202-5541. Officers appear below in alphabetical order.
Name, Year of Birth; Principal Occupation
Donald F. Donahue (1950)
Year of Election or Appointment: 2015
Member of the Advisory Board
Mr. Donahue also serves as a Trustee or Member of the Advisory Board of other Fidelity® funds. Mr. Donahue is President and Chief Executive Officer of Miranda Partners, LLC (risk consulting for the financial services industry, 2012-present). Previously, Mr. Donahue served as Chief Executive Officer (2006-2012), Chief Operating Officer (2003-2006), and Managing Director, Customer Marketing and Development (1999-2003) of The Depository Trust & Clearing Corporation (financial markets infrastructure). Mr. Donahue serves as a Member (2007-present) and Co-Chairman (2016-present) of the Board of Directors of United Way of New York, Member of the Board of Directors of NYC Leadership Academy (2012-present) and Member of the Board of Advisors of Ripple Labs, Inc. (financial services, 2015-present). He also served as Chairman (2010-2012) and Member of the Board of Directors (2012-2013) of Omgeo, LLC (financial services), Treasurer of United Way of New York (2012-2016), and Member of the Board of Directors of XBRL US (financial services non-profit, 2009-2012) and the International Securities Services Association (2009-2012).
Carol B. Tomé (1957)
Year of Election or Appointment: 2017
Member of the Advisory Board
Ms. Tomé also serves as Member of the Advisory Board of other Fidelity® funds. Ms. Tomé is Chief Financial Officer (2001-present) and Executive Vice President of Corporate Services (2007-present) of The Home Depot, Inc. (home improvement retailer) and a Director (2003-present) and Chair of the Audit Committee (2004-present) of United Parcel Service, Inc. (package delivery and supply chain management). Previously, Ms. Tomé served as Trustee of certain Fidelity® funds (2017), Senior Vice President of Finance and Accounting/Treasurer (2000-2007) and Vice President and Treasurer (1995-2000) of The Home Depot, Inc. and Chair of the Board (2010-2012), Vice Chair of the Board (2009 and 2013), and a Director (2008-2013) of the Federal Reserve Bank of Atlanta. Ms. Tomé is also a director or trustee of many community and professional organizations.
Elizabeth Paige Baumann (1968)
Year of Election or Appointment: 2017
Anti-Money Laundering (AML) Officer
Ms. Baumann also serves as AML Officer of other funds. She is Chief AML Officer (2012-present) and Senior Vice President (2014-present) of FMR LLC (diversified financial services company) and is an employee of Fidelity Investments. Previously, Ms. Baumann served as AML Officer of the funds (2012-2016), and Vice President (2007-2014) and Deputy Anti-Money Laundering Officer (2007-2012) of FMR LLC.
Marc R. Bryant (1966)
Year of Election or Appointment: 2013
Secretary and Chief Legal Officer (CLO)
Mr. Bryant also serves as Secretary and CLO of other funds. Mr. Bryant serves as CLO, Secretary, and Senior Vice President of Fidelity Management & Research Company (investment adviser firm, 2015-present) and FMR Co., Inc. (investment adviser firm, 2015-present); Secretary of Fidelity SelectCo, LLC (investment adviser firm, 2015-present) and Fidelity Investments Money Management, Inc. (investment adviser firm, 2015-present); and CLO of Fidelity Management & Research (Hong Kong) Limited and FMR Investment Management (UK) Limited (investment adviser firms, 2015-present) and Fidelity Management & Research (Japan) Limited (investment adviser firm, 2016-present). He is Senior Vice President and Deputy General Counsel of FMR LLC (diversified financial services company). Previously, Mr. Bryant served as Secretary and CLO of Fidelity Rutland Square Trust II (2010-2014) and Assistant Secretary of Fidelity's Fixed Income and Asset Allocation Funds (2013-2015). Prior to joining Fidelity Investments, Mr. Bryant served as a Senior Vice President and the Head of Global Retail Legal for AllianceBernstein L.P. (2006-2010), and as the General Counsel for ProFund Advisors LLC (2001-2006).
William C. Coffey (1969)
Year of Election or Appointment: 2009
Assistant Secretary
Mr. Coffey also serves as Assistant Secretary of other funds. He is Senior Vice President and Deputy General Counsel of FMR LLC (diversified financial services company, 2010-present), and is an employee of Fidelity Investments. Previously, Mr. Coffey served as Vice President and Associate General Counsel of FMR LLC (2005-2009).
Jonathan Davis (1968)
Year of Election or Appointment: 2010
Assistant Treasurer
Mr. Davis also serves as Assistant Treasurer of other funds. Mr. Davis serves as Assistant Treasurer of FMR Capital, Inc. (2017-present) and is an employee of Fidelity Investments. Previously, Mr. Davis served as Vice President and Associate General Counsel of FMR LLC (diversified financial services company, 2003-2010).
Adrien E. Deberghes (1967)
Year of Election or Appointment: 2013
President and Treasurer
Mr. Deberghes also serves as an officer of other funds. He serves as Assistant Treasurer of FMR Capital, Inc. (2017-present), Executive Vice President of Fidelity Investments Money Management, Inc. (FIMM) (investment adviser firm, 2016-present), and is an employee of Fidelity Investments (2008-present). Prior to joining Fidelity Investments, Mr. Deberghes was Senior Vice President of Mutual Fund Administration at State Street Corporation (2007-2008), Senior Director of Mutual Fund Administration at Investors Bank & Trust (2005-2007), and Director of Finance for Dunkin' Brands (2000-2005). Previously, Mr. Deberghes served in other fund officer roles.
Joseph DeSantis (1959)
Year of Election or Appointment: 2015
Vice President
Mr. DeSantis also serves as Vice President of other funds. Mr. DeSantis serves as a Director of Fidelity Management & Research (Japan) Limited (investment adviser firm, 2016-present), Chief Investment Officer, Equities (2010-present) and is an employee of Fidelity Investments.
Stephanie J. Dorsey (1969)
Year of Election or Appointment: 2010
Assistant Treasurer
Ms. Dorsey also serves as an officer of other funds. Ms. Dorsey serves as Assistant Treasurer of FMR Capital, Inc. (2017-present), is an employee of Fidelity Investments (2008-present), and has served in other fund officer roles. Prior to joining Fidelity Investments, Ms. Dorsey served as Treasurer (2004-2008) of the JPMorgan Mutual Funds and Vice President (2004-2008) of JPMorgan Chase Bank.
Howard J. Galligan III (1966)
Year of Election or Appointment: 2014
Chief Financial Officer
Mr. Galligan also serves as Chief Financial Officer of other funds. Mr. Galligan serves as President of Fidelity Pricing and Cash Management Services (FPCMS) (2014-present) and as a Director of Strategic Advisers, Inc. (investment adviser firm, 2008-present). Previously, Mr. Galligan served as Chief Administrative Officer of Asset Management (2011-2014) and Chief Operating Officer and Senior Vice President of Investment Support for Strategic Advisers, Inc. (2003-2011).
James D. Gryglewicz (1972)
Year of Election or Appointment: 2014
Chief Compliance Officer
Mr. Gryglewicz also serves as Chief Compliance Officer of other funds. Mr. Gryglewicz serves as Compliance Officer of Strategic Advisers, Inc. (investment adviser firm, 2015-present) and Fidelity SelectCo, LLC (investment adviser firm, 2014-present), Senior Vice President of Asset Management Compliance (2009-present), and is an employee of Fidelity Investments (2004-present).
Brian B. Hogan (1964)
Year of Election or Appointment: 2009
Vice President
Mr. Hogan also serves as Trustee or Vice President of other funds. Mr. Hogan serves as a Director of FMR Investment Management (UK) Limited (investment adviser firm, 2015-present) and Fidelity SelectCo, LLC (investment adviser firm, 2014-present) and President of the Equity Division of FMR (investment adviser firm, 2009-present). Previously, Mr. Hogan served as Senior Vice President, Equity Research of FMR (2006-2009) and as a portfolio manager. Mr. Brian B. Hogan is not related to Mr. Colm A. Hogan.
Colm A. Hogan (1973)
Year of Election or Appointment: 2016
Assistant Treasurer
Mr. Hogan also serves as an officer of other funds. Mr. Hogan serves as Assistant Treasurer of FMR Capital, Inc. (2017-present) and is an employee of Fidelity Investments (2005-present). Mr. Colm A. Hogan is not related to Mr. Brian B. Hogan.
Chris Maher (1972)
Year of Election or Appointment: 2013
Assistant Treasurer
Mr. Maher serves as Assistant Treasurer of other funds. Mr. Maher is Vice President of Valuation Oversight, serves as Assistant Treasurer of FMR Capital, Inc. (2017-present), and is an employee of Fidelity Investments. Previously, Mr. Maher served as Vice President of Asset Management Compliance (2013), Vice President of the Program Management Group of FMR (investment adviser firm, 2010-2013), and Vice President of Valuation Oversight (2008-2010).
Rieco E. Mello (1969)
Year of Election or Appointment: 2017
Assistant Treasurer
Mr. Mello also serves as Assistant Treasurer of other funds. Mr. Mello serves as Assistant Treasurer of FMR Capital, Inc. (2017-present) and is an employee of Fidelity Investments (1995-present).
Anthony R. Rochte (1968)
Year of Election or Appointment: 2013
Vice President
Mr. Rochte also serves as Vice President of other funds. Mr. Rochte serves as President of Fidelity SelectCo, LLC (investment adviser firm, 2012-present) and is an employee of Fidelity Investments (2012-present). Prior to joining Fidelity Investments, Mr. Rochte served as Senior Managing Director and head of State Street Global Advisors' North American Intermediary Business Group (2006-2012).
Stacie M. Smith (1974)
Year of Election or Appointment: 2013
Assistant Treasurer
Ms. Smith also serves as an officer of other funds. Ms. Smith serves as Assistant Treasurer of FMR Capital, Inc. (2017-present), is an employee of Fidelity Investments (2009-present), and has served in other fund officer roles. Prior to joining Fidelity Investments, Ms. Smith served as Senior Audit Manager of Ernst & Young LLP (accounting firm, 1996-2009). Previously, Ms. Smith served as Deputy Treasurer of certain Fidelity® funds (2013-2016).
Marc L. Spector (1972)
Year of Election or Appointment: 2017
Assistant Treasurer
Mr. Spector also serves as an officer of other funds. Mr. Spector serves as Assistant Treasurer of FMR Capital, Inc. (2017-present) and is an employee of Fidelity Investments (2016-present). Prior to joining Fidelity Investments, Mr. Spector served as Director at the Siegfried Group (accounting firm, 2013-2016), and prior to Siegfried Group as audit senior manager at Deloitte & Touche (accounting firm, 2005-2013).
Renee Stagnone (1975)
Year of Election or Appointment: 2016
Assistant Treasurer
Ms. Stagnone also serves as an officer of other funds. Ms. Stagnone serves as Assistant Treasurer of FMR Capital, Inc. (2017-present) and is an employee of Fidelity Investments (1997-present). Previously, Ms. Stagnone served as Deputy Treasurer of certain Fidelity® funds (2013-2016).
Shareholder Expense Example
As a shareholder of a Fund, you incur two types of costs: (1) transaction costs, including redemption fees and (2) ongoing costs, including management fees and other Fund expenses. This Example is intended to help you understand your ongoing costs (in dollars) of investing in the Funds and to compare these costs with the ongoing costs of investing in other mutual funds.
The Example is based on an investment of $1,000 invested at the beginning of the period and held for the entire period (July 1, 2017 to December 31, 2017).
Actual Expenses
The first line of the accompanying table for each class of the Fund provides information about actual account values and actual expenses. You may use the information in this line, together with the amount you invested, to estimate the expenses that you paid over the period. Simply divide your account value by $1,000.00 (for example, an $8,600 account value divided by $1,000.00 = 8.6), then multiply the result by the number in the first line for a class of the Fund under the heading entitled "Expenses Paid During Period" to estimate the expenses you paid on your account during this period. The estimate of expenses does not include any fees or other expenses of any variable annuity or variable life insurance product. If they were, the estimate of expenses you paid during the period would be higher, and your ending account value would be lower. In addition, the Fund, as a shareholder in the underlying Fidelity Central Funds, will indirectly bear its pro-rata share of the fees and expenses incurred by the underlying Fidelity Central Funds. These fees and expenses are not included in the Fund's annualized expense ratio used to calculate the expense estimate in the table below.
Hypothetical Example for Comparison Purposes
The second line of the accompanying table for each class of the Fund provides information about hypothetical account values and hypothetical expenses based on a Class' actual expense ratio and an assumed rate of return of 5% per year before expenses, which is not the Class' actual return. The hypothetical account values and expenses may not be used to estimate the actual ending account balance or expenses you paid for the period. You may use this information to compare the ongoing costs of investing in the Fund and other funds. To do so, compare this 5% hypothetical example with the 5% hypothetical examples that appear in the shareholder reports of the other funds. The estimate of expenses does not include any fees or other expenses of any variable annuity or variable life insurance product. If they were, the estimate of expenses you paid during the period would be higher, and your ending account value would be lower. In addition, the Fund, as a shareholder in the underlying Fidelity Central Funds, will indirectly bear its pro-rata share of the fees and expenses incurred by the underlying Fidelity Central Funds. These fees and expenses are not included in the Fund's annualized expense ratio used to calculate the expense estimate in the table below.
Please note that the expenses shown in the table are meant to highlight your ongoing costs only and do not reflect any transaction costs. Therefore, the second line of the table is useful in comparing ongoing costs only, and will not help you determine the relative total costs of owning different funds. In addition, if these transactional costs were included, your costs would have been higher.
| | Annualized Expense Ratio-A | Beginning
Account Value
July 1, 2017 | Ending
Account Value
December 31, 2017 | Expenses Paid
During Period-B
July 1, 2017
to December 31, 2017 |
| Initial Class | .73% | | | |
| Actual | | $1,000.00 | $1,145.60 | $3.95 |
| Hypothetical-C | | $1,000.00 | $1,021.53 | $3.72 |
| Investor Class | .81% | | | |
| Actual | | $1,000.00 | $1,145.10 | $4.38 |
| Hypothetical-C | | $1,000.00 | $1,021.12 | $4.13 |
A Annualized expense ratio reflects expenses net of applicable fee waivers.
B Expenses are equal to each Class' annualized expense ratio, multiplied by the average account value over the period, multiplied by 184/365 (to reflect the one-half year period).
C 5% return per year before expenses
Distributions (Unaudited)
The Board of Trustees of VIP Materials Portfolio voted to pay to shareholders of record at the opening of business on record date, the following distributions per share derived from capital gains realized from sales of portfolio securities, and dividends derived from net investment income:
| | Pay Date | Record Date | Dividends | Capital Gains |
| VIP Materials Portfolio | | | | |
| Initial Class | 02/09/2018 | 02/09/2018 | $0.040 | $0.860 |
| Investor Class | 02/09/2018 | 02/09/2018 | $0.038 | $0.860 |
|
The fund hereby designates as a capital gain dividend with respect to the taxable year ended December 31, 2017, $5,059,146, or, if subsequently determined to be different, the net capital gain of such year.
Initial Class designates 96% and 78% and Investor Class designates 99% and 82% of the dividends distributed in February and December, respectively during the fiscal year as qualifying for the dividends–received deduction for corporate shareholders.
Proxy Voting Results
A special meeting of shareholders was held on December 8, 2017. The results of votes taken among shareholders on the proposals before them are reported below. Each vote reported represents one dollar of net asset value held on the record date for the meeting.
PROPOSAL 1
To elect a Board of Trustees.
| | # of
Votes | % of
Votes |
| James C. Curvey |
| Affirmative | 3,005,845,657.89 | 94.803 |
| Withheld | 164,788,708.80 | 5.197 |
| TOTAL | 3,170,634,366.69 | 100.000 |
| Dennis J. Dirks |
| Affirmative | 3,025,050,303.47 | 95.409 |
| Withheld | 145,584,063.22 | 4.591 |
| TOTAL | 3,170,634,366.69 | 100.000 |
| Donald F. Donahue |
| Affirmative | 3,024,923,660.98 | 95.405 |
| Withheld | 145,710,705.71 | 4.595 |
| TOTAL | 3,170,634,366.69 | 100.000 |
| Alan J. Lacy |
| Affirmative | 3,024,272,946.71 | 95.384 |
| Withheld | 146,361,419.98 | 4.616 |
| TOTAL | 3,170,634,366.69 | 100.00 |
| Ned C. Lautenbach |
| Affirmative | 3,011,847,006.14 | 94.992 |
| Withheld | 158,787,360.55 | 5.008 |
| TOTAL | 3,170,634,366.69 | 100.000 |
| Joseph Mauriello |
| Affirmative | 3,021,074,746.00 | 95.283 |
| Withheld | 149,559,620.69 | 4.717 |
| TOTAL | 3,170,634,366.69 | 100.000 |
| Charles S. Morrison |
| Affirmative | 3,025,083,795.43 | 95.410 |
| Withheld | 145,550,571.26 | 4.590 |
| TOTAL | 3,170,634,366.69 | 100.000 |
| Cornelia M. Small |
| Affirmative | 3,016,566,905.34 | 95.141 |
| Withheld | 154,067,461.35 | 4.859 |
| TOTAL | 3,170,634,366.69 | 100.000 |
| Garnett A. Smith |
| Affirmative | 3,014,927,605.85 | 95.090 |
| Withheld | 155,706,760.84 | 4.910 |
| TOTAL | 3,170,634,366.69 | 100.000 |
| David M. Thomas |
| Affirmative | 3,025,900,428.75 | 95.436 |
| Withheld | 144,733,937.94 | 4.564 |
| TOTAL | 3,170,634,366.69 | 100.000 |
| Michael E. Wiley |
| Affirmative | 3,023,436,110.39 | 95.358 |
| Withheld | 147,198,256.30 | 4.642 |
| TOTAL | 3,170,634,366.69 | 100.000 |
PROPOSAL 2
To eliminate a fundamental investment policy.
| | # of
Votes | % of
Votes |
| Affirmative | 75,253,572.65 | 86.323 |
| Against | 6,582,893.79 | 7.552 |
| Abstain | 5,340,305.58 | 6.125 |
| TOTAL | 87,176,772.02 | 100.000 |
|
| Proposal 1 reflects trust wide proposal and voting results. |
VMATP-ANN-0218
1.850999.110
Fidelity® Variable Insurance Products: Telecommunications Portfolio
Annual Report December 31, 2017 |
|
Contents
To view a fund's proxy voting guidelines and proxy voting record for the 12-month period ended June 30, visit http://www.fidelity.com/proxyvotingresults or visit the Securities and Exchange Commission's (SEC) web site at http://www.sec.gov.
You may also call 1-877-208-0098 to request a free copy of the proxy voting guidelines.
Fidelity® Variable Insurance Products are separate account options which are purchased through a variable insurance contract.
Standard & Poor's, S&P and S&P 500 are registered service marks of The McGraw-Hill Companies, Inc. and have been licensed for use by Fidelity Distributors Corporation.
Other third-party marks appearing herein are the property of their respective owners.
All other marks appearing herein are registered or unregistered trademarks or service marks of FMR LLC or an affiliated company. © 2018 FMR LLC. All rights reserved.
This report and the financial statements contained herein are submitted for the general information of the shareholders of the Fund. This report is not authorized for distribution to prospective investors in the Fund unless preceded or accompanied by an effective prospectus.
A fund files its complete schedule of portfolio holdings with the SEC for the first and third quarters of each fiscal year on Form N-Q. Forms N-Q are available on the SEC’s web site at http://www.sec.gov. A fund's Forms N-Q may be reviewed and copied at the SEC’s Public Reference Room in Washington, DC. Information regarding the operation of the SEC's Public Reference Room may be obtained by calling 1-800-SEC-0330.
For a complete list of a fund's portfolio holdings, view the most recent holdings listing, semiannual report, or annual report on Fidelity's web site at http://www.fidelity.com, http://www.institutional.fidelity.com, or http://www.401k.com, as applicable.
NOT FDIC INSURED •MAY LOSE VALUE •NO BANK GUARANTEE
Neither the Fund nor Fidelity Distributors Corporation is a bank.
Performance: The Bottom Line
Average annual total return reflects the change in the value of an investment, assuming reinvestment of distributions from dividend income and capital gains (the profits earned upon the sale of securities that have grown in value, if any) and assuming a constant rate of performance each year. During periods of reimbursement by Fidelity, a fund’s total return will be greater than it would be had the reimbursement not occurred. Performance numbers are net of all underlying fund operating expenses, but do not include any insurance charges imposed by your insurance company’s separate account. If performance information included the effect of these additional charges, the total returns would have been lower. How a fund did yesterday is no guarantee of how it will do tomorrow.
Average Annual Total Returns
| For the periods ended December 31, 2017 | Past 1 year | Past 5 years | Past 10 years |
| Initial Class | 2.05% | 10.01% | 5.68% |
| Investor Class | 1.89% | 9.94% | 5.59% |
$10,000 Over 10 Years
Let's say hypothetically that $10,000 was invested in VIP Telecommunications Portfolio - Initial Class on December 31, 2007.
The chart shows how the value of your investment would have changed, and also shows how the S&P 500® Index performed over the same period.
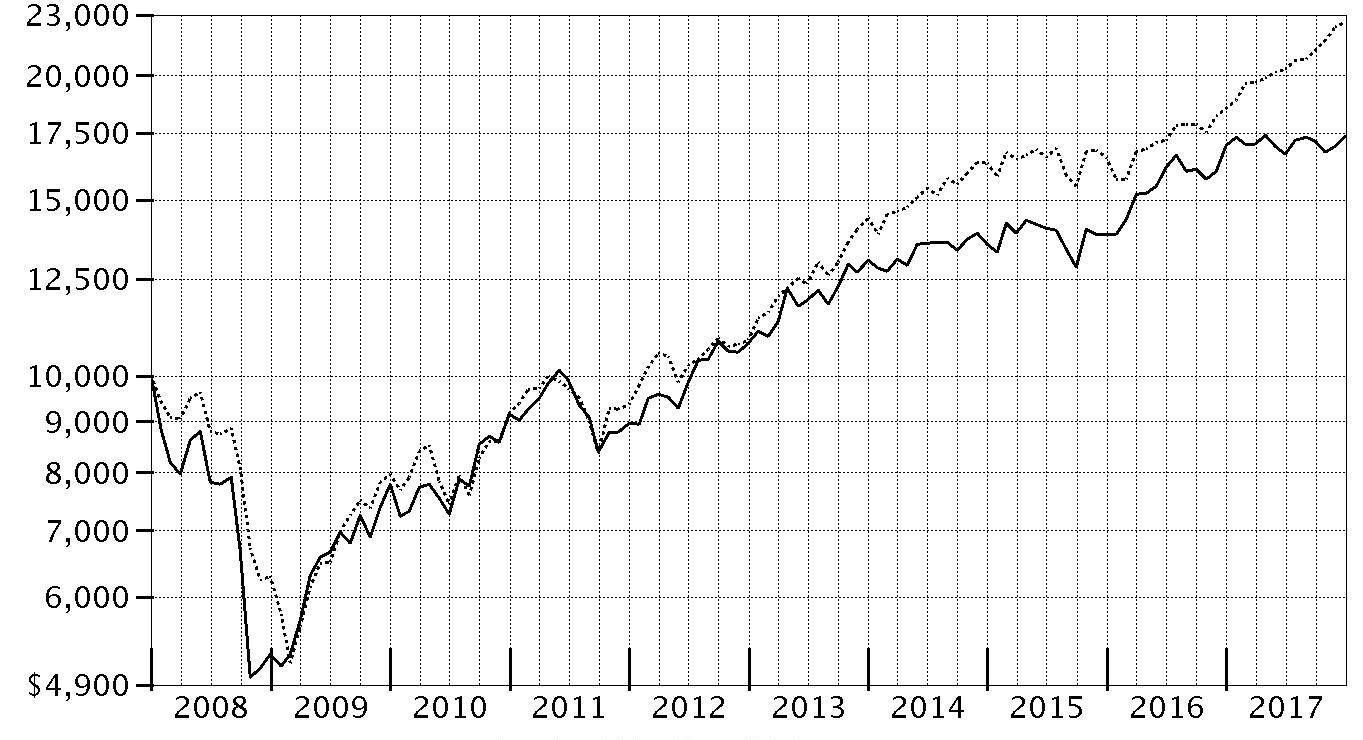
| Period Ending Values |
| $17,370 | VIP Telecommunications Portfolio - Initial Class |
| $22,603 | S&P 500® Index |
Management's Discussion of Fund Performance
Market Recap: U.S. equities gained 21.83% in 2017, as the S&P 500
® index rose steadily and closed the year just shy of an all-time high after a particularly strong three-month finish. Early on, equities rallied on optimism for President Trump’s pro-business agenda but leveled off in March amid fading optimism and stalled efforts by Congress to repeal and replace the Affordable Care Act. Upward momentum soon returned and continued through year-end with consumer sentiment and other market indicators staying positive. The lone exception was a brief cooldown in August, when geopolitical tension escalated and uncertainty grew regarding the future of health care, tax reform and the debt ceiling. Sector-wise, information technology fared best by a wide margin, rising 39% amid strong earnings growth from several major index constituents. A 24% gain in materials was spurred by increased demand, especially from China. Consumer discretionary gained 23%, despite many brick-and-mortar retailers suffering from online competition, and financials edged the broader market on an uptick in bond yields. Conversely, the defensive energy and telecom services sectors returned about -1% each. Rising interest rates held back real estate (+11%), while consumer staples (+13%) and utilities (+12%) struggled due to investors’ general preference for risk assets.
Comments from Portfolio Manager Matthew Drukker: For calendar 2017, the fund share classes gained roughly 2%, strongly outpacing the -5.71% return of the sector benchmark, the MSCI U.S. IMI Telecommunication Services 25/50 Index. However, results trailed the broad-market S&P 500
®. Investors generally shunned telecommunication services stocks for most of the reporting period, instead favoring growth stocks. Equity selection largely drove the fund’s outperformance versus the MSCI benchmark. Choices in integrated telecommunication services and wireless telecommunication services added value, as did underweighting two poor-performing index components: Windstream Holdings and NII Holdings. Conversely, stock picking in application software detracted, as did positioning among alternative carriers – especially, avoiding strong-performing PDVWireless. At period end, Portfolio Manager Matthew Drukker says he plans to continue emphasizing companies that can benefit from the growth of broadband consumption.
The views expressed above reflect those of the portfolio manager(s) only through the end of the period as stated on the cover of this report and do not necessarily represent the views of Fidelity or any other person in the Fidelity organization. Any such views are subject to change at any time based upon market or other conditions and Fidelity disclaims any responsibility to update such views. These views may not be relied on as investment advice and, because investment decisions for a Fidelity fund are based on numerous factors, may not be relied on as an indication of trading intent on behalf of any Fidelity fund.
Note to Shareholders: On December 8, 2017, shareholders approved proposals from the Board of Trustees to eliminate each sector/industry fund's fundamental “invests primarily” policy and to modify the fundamental concentration policy for certain funds. The changes took effect on January 1, 2018, and do not impact how the funds are managed.
Investment Summary (Unaudited)
Top Ten Stocks as of December 31, 2017
| | % of fund's net assets |
| Verizon Communications, Inc. | 22.0 |
| AT&T, Inc. | 10.4 |
| T-Mobile U.S., Inc. | 7.0 |
| CenturyLink, Inc. | 4.9 |
| Liberty Global PLC Class C | 4.3 |
| Time Warner, Inc. | 4.2 |
| Zayo Group Holdings, Inc. | 3.8 |
| General Communications, Inc. Class A | 3.5 |
| Vonage Holdings Corp. | 3.3 |
| Cogent Communications Group, Inc. | 3.3 |
| | 66.7 |
Top Industries (% of fund's net assets)
| As of December 31, 2017 |
| | Diversified Telecommunication Services | 62.7% |
| | Wireless Telecommunication Services | 15.5% |
| | Media | 15.3% |
| | Equity Real Estate Investment Trusts (Reits) | 2.5% |
| | Internet Software & Services | 2.2% |
| | All Others* | 1.8% |

* Includes short-term investments and net other assets (liabilities).
Investments December 31, 2017
Showing Percentage of Net Assets
| Common Stocks - 99.4% | | | |
| | | Shares | Value |
| Construction & Engineering - 0.3% | | | |
| Construction & Engineering - 0.3% | | | |
| Dycom Industries, Inc. (a) | | 1,000 | $111,430 |
| Diversified Financial Services - 0.7% | | | |
| Other Diversified Financial Services - 0.7% | | | |
| Quantenna Communications, Inc. (a) | | 24,700 | 301,340 |
| Diversified Telecommunication Services - 62.7% | | | |
| Alternative Carriers - 19.9% | | | |
| CenturyLink, Inc. | | 125,505 | 2,093,423 |
| Cogent Communications Group, Inc. | | 30,963 | 1,402,624 |
| Globalstar, Inc. (a)(b) | | 265,000 | 347,150 |
| Iliad SA | | 581 | 139,248 |
| Iridium Communications, Inc. (a)(b) | | 101,563 | 1,198,443 |
| ORBCOMM, Inc. (a) | | 26,331 | 268,050 |
| Vonage Holdings Corp. (a) | | 138,900 | 1,412,613 |
| Zayo Group Holdings, Inc. (a) | | 44,300 | 1,630,240 |
| | | | 8,491,791 |
| Integrated Telecommunication Services - 42.8% | | | |
| Altice U.S.A., Inc. Class A (b) | | 17,800 | 377,894 |
| AT&T, Inc. | | 114,318 | 4,444,684 |
| Atlantic Tele-Network, Inc. | | 10,200 | 563,652 |
| Cincinnati Bell, Inc. (a) | | 61,307 | 1,278,251 |
| Consolidated Communications Holdings, Inc. (b) | | 27,547 | 335,798 |
| Frontier Communications Corp. (b) | | 27,653 | 186,934 |
| General Communications, Inc. Class A (a) | | 38,440 | 1,499,929 |
| Verizon Communications, Inc. | | 177,871 | 9,414,712 |
| Windstream Holdings, Inc. | | 125,983 | 233,069 |
| | | | 18,334,923 |
|
| TOTAL DIVERSIFIED TELECOMMUNICATION SERVICES | | | 26,826,714 |
|
| Electronic Equipment & Components - 0.2% | | | |
| Electronic Components - 0.2% | | | |
| Casa Systems, Inc. (a) | | 5,700 | 101,232 |
| Equity Real Estate Investment Trusts (REITs) - 2.5% | | | |
| Specialized REITs - 2.5% | | | |
| American Tower Corp. | | 5,882 | 839,185 |
| SBA Communications Corp. Class A (a) | | 1,536 | 250,921 |
| | | | 1,090,106 |
| Internet Software & Services - 2.2% | | | |
| Internet Software & Services - 2.2% | | | |
| Akamai Technologies, Inc. (a) | | 8,400 | 546,336 |
| Gogo, Inc. (a)(b) | | 35,700 | 402,696 |
| | | | 949,032 |
| Media - 15.3% | | | |
| Cable & Satellite - 11.0% | | | |
| Comcast Corp. Class A | | 33,000 | 1,321,650 |
| DISH Network Corp. Class A (a) | | 4,600 | 219,650 |
| Liberty Broadband Corp. Class A (a) | | 10,800 | 918,540 |
| Liberty Global PLC: | | | |
| Class A (a) | | 1,200 | 43,008 |
| Class C (a) | | 55,100 | 1,864,584 |
| LiLAC Class C (a) | | 10,036 | 199,616 |
| Megacable Holdings S.A.B. de CV unit | | 41,200 | 167,650 |
| | | | 4,734,698 |
| Movies & Entertainment - 4.3% | | | |
| Lions Gate Entertainment Corp. Class B | | 1,300 | 41,262 |
| Time Warner, Inc. | | 19,500 | 1,783,665 |
| | | | 1,824,927 |
|
| TOTAL MEDIA | | | 6,559,625 |
|
| Wireless Telecommunication Services - 15.5% | | | |
| Wireless Telecommunication Services - 15.5% | | | |
| Millicom International Cellular SA | | 2,800 | 188,748 |
| Shenandoah Telecommunications Co. | | 21,374 | 722,441 |
| Sprint Corp. (a)(b) | | 152,416 | 897,730 |
| T-Mobile U.S., Inc. (a) | | 47,428 | 3,012,152 |
| Telephone & Data Systems, Inc. | | 43,525 | 1,209,995 |
| U.S. Cellular Corp. (a) | | 15,600 | 587,028 |
| | | | 6,618,094 |
| TOTAL COMMON STOCKS | | | |
| (Cost $36,408,952) | | | 42,557,573 |
|
| Money Market Funds - 7.7% | | | |
| Fidelity Cash Central Fund, 1.36% (c) | | 713,778 | 713,920 |
| Fidelity Securities Lending Cash Central Fund 1.36% (c)(d) | | 2,564,560 | 2,565,073 |
| TOTAL MONEY MARKET FUNDS | | | |
| (Cost $3,278,549) | | | 3,278,993 |
| TOTAL INVESTMENT IN SECURITIES - 107.1% | | | |
| (Cost $39,687,501) | | | 45,836,566 |
| NET OTHER ASSETS (LIABILITIES) - (7.1)% | | | (3,025,206) |
| NET ASSETS - 100% | | | $42,811,360 |
Legend
(a) Non-income producing
(b) Security or a portion of the security is on loan at period end.
(c) Affiliated fund that is generally available only to investment companies and other accounts managed by Fidelity Investments. The rate quoted is the annualized seven-day yield of the fund at period end. A complete unaudited listing of the fund's holdings as of its most recent quarter end is available upon request. In addition, each Fidelity Central Fund's financial statements, which are not covered by the Fund's Report of Independent Registered Public Accounting Firm, are available on the SEC's website or upon request.
(d) Investment made with cash collateral received from securities on loan.
Affiliated Central Funds
Information regarding fiscal year to date income earned by the Fund from investments in Fidelity Central Funds is as follows:
| Fund | Income earned |
| Fidelity Cash Central Fund | $2,082 |
| Fidelity Securities Lending Cash Central Fund | 138,417 |
| Total | $140,499 |
Amounts in the income column in the above table include any capital gain distributions from underlying funds, which are presented in the corresponding line-item in the Statement of Operations if applicable.
Investment Valuation
All investments are categorized as Level 1 under the Fair Value Hierarchy. The inputs or methodology used for valuing securities may not be an indication of the risk associated with investing in those securities. For more information on valuation inputs please refer to the Investment Valuation section in the accompanying Notes to Financial Statements.
See accompanying notes which are an integral part of the financial statements.
Financial Statements
Statement of Assets and Liabilities
| | | December 31, 2017 |
| Assets | | |
Investment in securities, at value (including securities loaned of $2,434,056) — See accompanying schedule:
Unaffiliated issuers (cost $36,408,952) | $42,557,573 | |
| Fidelity Central Funds (cost $3,278,549) | 3,278,993 | |
| Total Investment in Securities (cost $39,687,501) | | $45,836,566 |
| Receivable for fund shares sold | | 4,925 |
| Dividends receivable | | 5,800 |
| Distributions receivable from Fidelity Central Funds | | 7,398 |
| Prepaid expenses | | 277 |
| Other receivables | | 2,402 |
| Total assets | | 45,857,368 |
| Liabilities | | |
| Payable for investments purchased | $360,107 | |
| Payable for fund shares redeemed | 58,290 | |
| Accrued management fee | 19,055 | |
| Other affiliated payables | 6,156 | |
| Other payables and accrued expenses | 38,593 | |
| Collateral on securities loaned | 2,563,807 | |
| Total liabilities | | 3,046,008 |
| Net Assets | | $42,811,360 |
| Net Assets consist of: | | |
| Paid in capital | | $33,004,464 |
| Undistributed net investment income | | 74,723 |
| Accumulated undistributed net realized gain (loss) on investments and foreign currency transactions | | 3,583,534 |
| Net unrealized appreciation (depreciation) on investments and assets and liabilities in foreign currencies | | 6,148,639 |
| Net Assets | | $42,811,360 |
| Initial Class: | | |
| Net Asset Value, offering price and redemption price per share ($6,067,030 ÷ 476,365 shares) | | $12.74 |
| Investor Class: | | |
| Net Asset Value, offering price and redemption price per share ($36,744,330 ÷ 2,903,989 shares) | | $12.65 |
See accompanying notes which are an integral part of the financial statements.
Statement of Operations
| | | Year ended December 31, 2017 |
| Investment Income | | |
| Dividends | | $1,690,468 |
| Interest | | 2,353 |
| Income from Fidelity Central Funds (including $138,417 from security lending) | | 140,499 |
| Total income | | 1,833,320 |
| Expenses | | |
| Management fee | $362,007 | |
| Transfer agent fees | 88,141 | |
| Accounting and security lending fees | 27,565 | |
| Custodian fees and expenses | 21,559 | |
| Independent trustees' fees and expenses | 1,628 | |
| Audit | 44,039 | |
| Legal | 1,071 | |
| Miscellaneous | 3,520 | |
| Total expenses before reductions | 549,530 | |
| Expense reductions | (12,213) | 537,317 |
| Net investment income (loss) | | 1,296,003 |
| Realized and Unrealized Gain (Loss) | | |
| Net realized gain (loss) on: | | |
| Investment securities: | | |
| Unaffiliated issuers | 5,312,103 | |
| Fidelity Central Funds | 178 | |
| Foreign currency transactions | (3,763) | |
| Total net realized gain (loss) | | 5,308,518 |
| Change in net unrealized appreciation (depreciation) on: | | |
| Investment securities: | | |
| Unaffiliated issuers | (6,314,127) | |
| Fidelity Central Funds | (140) | |
| Assets and liabilities in foreign currencies | 287 | |
| Total change in net unrealized appreciation (depreciation) | | (6,313,980) |
| Net gain (loss) | | (1,005,462) |
| Net increase (decrease) in net assets resulting from operations | | $290,541 |
See accompanying notes which are an integral part of the financial statements.
Statement of Changes in Net Assets
| | Year ended December 31, 2017 | Year ended December 31, 2016 |
| Increase (Decrease) in Net Assets | | |
| Operations | | |
| Net investment income (loss) | $1,296,003 | $972,296 |
| Net realized gain (loss) | 5,308,518 | 61,117 |
| Change in net unrealized appreciation (depreciation) | (6,313,980) | 10,317,538 |
| Net increase (decrease) in net assets resulting from operations | 290,541 | 11,350,951 |
| Distributions to shareholders from net investment income | (1,221,677) | (941,662) |
| Distributions to shareholders from net realized gain | (1,074,140) | (495,524) |
| Total distributions | (2,295,817) | (1,437,186) |
| Share transactions - net increase (decrease) | (45,062,427) | 51,997,297 |
| Redemption fees | 23,031 | 26,145 |
| Total increase (decrease) in net assets | (47,044,672) | 61,937,207 |
| Net Assets | | |
| Beginning of period | 89,856,032 | 27,918,825 |
| End of period | $42,811,360 | $89,856,032 |
| Other Information | | |
| Undistributed net investment income end of period | $74,723 | $6,594 |
See accompanying notes which are an integral part of the financial statements.
Financial Highlights
VIP Telecommunications Portfolio Initial Class
| Years ended December 31, | 2017 | 2016 | 2015 | 2014 | 2013 |
| Selected Per–Share Data | | | | | |
| Net asset value, beginning of period | $13.10 | $10.85 | $10.74 | $10.77 | $9.27 |
| Income from Investment Operations | | | | | |
| Net investment income (loss)A | .26 | .19 | .15 | .36B | .17 |
| Net realized and unrealized gain (loss) | –C | 2.28 | .10D | .03 | 1.77 |
| Total from investment operations | .26 | 2.47 | .25 | .39 | 1.94 |
| Distributions from net investment income | (.39) | (.15) | (.13)E | (.40) | (.15) |
| Distributions from net realized gain | (.23) | (.08) | (.01)E | (.02) | (.30) |
| Total distributions | (.62) | (.22)F | (.14) | (.42) | (.45) |
| Redemption fees added to paid in capitalA | –C | –C | –C | –C | .01 |
| Net asset value, end of period | $12.74 | $13.10 | $10.85 | $10.74 | $10.77 |
| Total ReturnG,H | 2.05% | 22.81% | 2.34% | 3.59% | 21.28% |
| Ratios to Average Net AssetsI,J | | | | | |
| Expenses before reductions | .76% | .78% | .88% | .96% | 1.02% |
| Expenses net of fee waivers, if any | .76% | .78% | .88% | .95% | 1.00% |
| Expenses net of all reductions | .74% | .77% | .87% | .93% | .99% |
| Net investment income (loss) | 2.02% | 1.52% | 1.36% | 3.31%B | 1.64% |
| Supplemental Data | | | | | |
| Net assets, end of period (000 omitted) | $6,067 | $15,797 | $4,839 | $3,723 | $4,535 |
| Portfolio turnover rateK | 74% | 100% | 64% | 99% | 136% |
A Calculated based on average shares outstanding during the period.
B Net Investment income per share reflects a large, non-recurring dividend which amounted to $.21 per share. Excluding this non-recurring dividend, the ratio of net investment income (loss) to average net assets would have been 1.41%.
C Amount represents less than $.005 per share.
D The amount shown for a share outstanding does not correspond with the aggregate net gain (loss) on investments for the period due to the timing of sales and repurchases of shares in relation to fluctuating market values of the investments of the Fund.
E The amounts shown reflect certain reclassifications related to book to tax differences that were made in the year shown.
F Total distributions of $.22 per share is comprised of distributions from net investment income of $.147 and distributions from net realized gain of $.077 per share.
G Total returns do not reflect charges attributable to your insurance company's separate account. Inclusion of these charges would reduce the total returns shown.
H Total returns would have been lower if certain expenses had not been reduced during the applicable periods shown.
I Fees and expenses of any underlying Fidelity Central Funds are not included in the Fund's expense ratio. The Fund indirectly bears its proportionate share of the expenses of any underlying Fidelity Central Funds.
J Expense ratios reflect operating expenses of the class. Expenses before reductions do not reflect amounts reimbursed by the investment adviser or reductions from brokerage service arrangements or reductions from other expense offset arrangements and do not represent the amount paid by the class during periods when reimbursements or reductions occur. Expenses net of fee waivers reflect expenses after reimbursement by the investment adviser but prior to reductions from brokerage service arrangements or other expense offset arrangements. Expenses net of all reductions represent the net expenses paid by the class.
K Amount does not include the portfolio activity of any underlying Fidelity Central Funds.
See accompanying notes which are an integral part of the financial statements.
VIP Telecommunications Portfolio Investor Class
| Years ended December 31, | 2017 | 2016 | 2015 | 2014 | 2013 |
| Selected Per–Share Data | | | | | |
| Net asset value, beginning of period | $13.02 | $10.79 | $10.67 | $10.71 | $9.22 |
| Income from Investment Operations | | | | | |
| Net investment income (loss)A | .25 | .18 | .14 | .35B | .16 |
| Net realized and unrealized gain (loss) | (.01) | 2.27 | .11C | .03 | 1.77 |
| Total from investment operations | .24 | 2.45 | .25 | .38 | 1.93 |
| Distributions from net investment income | (.37) | (.14) | (.12)D | (.40) | (.15) |
| Distributions from net realized gain | (.23) | (.08) | (.01)D | (.02) | (.30) |
| Total distributions | (.61)E | (.22) | (.13) | (.42) | (.45) |
| Redemption fees added to paid in capitalA | –F | –F | –F | –F | .01 |
| Net asset value, end of period | $12.65 | $13.02 | $10.79 | $10.67 | $10.71 |
| Total ReturnG,H | 1.89% | 22.69% | 2.38% | 3.48% | 21.27% |
| Ratios to Average Net AssetsI,J | | | | | |
| Expenses before reductions | .84% | .86% | .95% | 1.01% | 1.07% |
| Expenses net of fee waivers, if any | .84% | .86% | .95% | .99% | 1.07% |
| Expenses net of all reductions | .83% | .85% | .94% | .97% | 1.06% |
| Net investment income (loss) | 1.94% | 1.44% | 1.29% | 3.27%B | 1.57% |
| Supplemental Data | | | | | |
| Net assets, end of period (000 omitted) | $36,744 | $74,059 | $23,080 | $16,159 | $17,112 |
| Portfolio turnover rateK | 74% | 100% | 64% | 99% | 136% |
A Calculated based on average shares outstanding during the period.
B Net Investment income per share reflects a large, non-recurring dividend which amounted to $.21 per share. Excluding this non-recurring dividend, the ratio of net investment income (loss) to average net assets would have been 1.37%.
C The amount shown for a share outstanding does not correspond with the aggregate net gain (loss) on investments for the period due to the timing of sales and repurchases of shares in relation to fluctuating market values of the investments of the Fund.
D The amounts shown reflect certain reclassifications related to book to tax differences that were made in the year shown.
E Total distributions of $.61 per share is comprised of distributions from net investment income of $.373 and distributions from net realized gain of $.232 per share.
F Amount represents less than $.005 per share.
G Total returns do not reflect charges attributable to your insurance company's separate account. Inclusion of these charges would reduce the total returns shown.
H Total returns would have been lower if certain expenses had not been reduced during the applicable periods shown.
I Fees and expenses of any underlying Fidelity Central Funds are not included in the Fund's expense ratio. The Fund indirectly bears its proportionate share of the expenses of any underlying Fidelity Central Funds.
J Expense ratios reflect operating expenses of the class. Expenses before reductions do not reflect amounts reimbursed by the investment adviser or reductions from brokerage service arrangements or reductions from other expense offset arrangements and do not represent the amount paid by the class during periods when reimbursements or reductions occur. Expenses net of fee waivers reflect expenses after reimbursement by the investment adviser but prior to reductions from brokerage service arrangements or other expense offset arrangements. Expenses net of all reductions represent the net expenses paid by the class.
K Amount does not include the portfolio activity of any underlying Fidelity Central Funds.
See accompanying notes which are an integral part of the financial statements.
Notes to Financial Statements
For the period ended December 31, 2017
1. Organization.
VIP Telecommunications Portfolio (the Fund) is a non-diversified fund of Variable Insurance Products Fund IV (the Trust) and is authorized to issue an unlimited number of shares. The Trust is registered under the Investment Company Act of 1940, as amended (the 1940 Act), as an open-end management investment company organized as a Massachusetts business trust. Shares of the Fund may only be purchased by insurance companies for the purpose of funding variable annuity or variable life insurance contracts. The Fund offers the following classes of shares: Initial Class and Investor Class shares. All classes have equal rights and voting privileges, except for matters affecting a single class.
2. Investments in Fidelity Central Funds.
The Fund invests in Fidelity Central Funds, which are open-end investment companies generally available only to other investment companies and accounts managed by the investment adviser and its affiliates. The Fund's Schedule of Investments lists each of the Fidelity Central Funds held as of period end, if any, as an investment of the Fund, but does not include the underlying holdings of each Fidelity Central Fund. As an Investing Fund, the Fund indirectly bears its proportionate share of the expenses of the underlying Fidelity Central Funds.
The Money Market Central Funds seek preservation of capital and current income and are managed by Fidelity Investments Money Management, Inc. (FIMM), an affiliate of the investment adviser. Annualized expenses of the Money Market Central Funds as of their most recent shareholder report date are less than .005%.
A complete unaudited list of holdings for each Fidelity Central Fund is available upon request or at the Securities and Exchange Commission (the SEC) website at www.sec.gov. In addition, the financial statements of the Fidelity Central Funds, which are not covered by the Fund's Report of Independent Registered Public Accounting Firm, are available on the SEC website or upon request.
3. Significant Accounting Policies.
The Fund is an investment company and applies the accounting and reporting guidance of the Financial Accounting Standards Board (FASB) Accounting Standards Codification Topic 946 Financial Services – Investments Companies. The financial statements have been prepared in conformity with accounting principles generally accepted in the United States of America (GAAP), which require management to make certain estimates and assumptions at the date of the financial statements. Actual results could differ from those estimates. Subsequent events, if any, through the date that the financial statements were issued have been evaluated in the preparation of the financial statements. The following summarizes the significant accounting policies of the Fund:
Investment Valuation. Investments are valued as of 4:00 p.m. Eastern time on the last calendar day of the period. The Board of Trustees (the Board) has delegated the day to day responsibility for the valuation of the Fund's investments to the Fair Value Committee (the Committee) established by the Fund's investment adviser. In accordance with valuation policies and procedures approved by the Board, the Fund attempts to obtain prices from one or more third party pricing vendors or brokers to value its investments. When current market prices, quotations or currency exchange rates are not readily available or reliable, investments will be fair valued in good faith by the Committee, in accordance with procedures adopted by the Board. Factors used in determining fair value vary by investment type and may include market or investment specific events. The frequency with which these procedures are used cannot be predicted and they may be utilized to a significant extent. The Committee oversees the Fund's valuation policies and procedures and reports to the Board on the Committee's activities and fair value determinations. The Board monitors the appropriateness of the procedures used in valuing the Fund's investments and ratifies the fair value determinations of the Committee.
The Fund categorizes the inputs to valuation techniques used to value its investments into a disclosure hierarchy consisting of three levels as shown below:
- Level 1 – quoted prices in active markets for identical investments
- Level 2 – other significant observable inputs (including quoted prices for similar investments, interest rates, prepayment speeds, etc.)
- Level 3 – unobservable inputs (including the Fund's own assumptions based on the best information available)
Valuation techniques used to value the Fund's investments by major category are as follows:
Equity securities, including restricted securities, for which market quotations are readily available, are valued at the last reported sale price or official closing price as reported by a third party pricing vendor on the primary market or exchange on which they are traded and are categorized as Level 1 in the hierarchy. In the event there were no sales during the day or closing prices are not available, securities are valued at the last quoted bid price or may be valued using the last available price and are generally categorized as Level 2 in the hierarchy. For foreign equity securities, when market or security specific events arise, comparisons to the valuation of American Depositary Receipts (ADRs), futures contracts, Exchange-Traded Funds (ETFs) and certain indexes as well as quoted prices for similar securities may be used and would be categorized as Level 2 in the hierarchy. Utilizing these techniques may result in transfers between Level 1 and Level 2. For equity securities, including restricted securities, where observable inputs are limited, assumptions about market activity and risk are used and these securities may be categorized as Level 3 in the hierarchy.
Investments in open-end mutual funds, including the Fidelity Central Funds, are valued at their closing net asset value (NAV) each business day and are categorized as Level 1 in the hierarchy.
Changes in valuation techniques may result in transfers in or out of an assigned level within the disclosure hierarchy. The aggregate value of investments by input level as of December 31, 2017 is included at the end of the Fund's Schedule of Investments.
Foreign Currency. The Fund may use foreign currency contracts to facilitate transactions in foreign-denominated securities. Gains and losses from these transactions may arise from changes in the value of the foreign currency or if the counterparties do not perform under the contracts' terms.
Foreign-denominated assets, including investment securities, and liabilities are translated into U.S. dollars at the exchange rates at period end. Purchases and sales of investment securities, income and dividends received and expenses denominated in foreign currencies are translated into U.S. dollars at the exchange rate in effect on the transaction date.
The effects of exchange rate fluctuations on investments are included with the net realized and unrealized gain (loss) on investment securities. Other foreign currency transactions resulting in realized and unrealized gain (loss) are disclosed separately.
Investment Transactions and Income. For financial reporting purposes, the Fund's investment holdings and NAV include trades executed through the end of the last business day of the period. The NAV per share for processing shareholder transactions is calculated as of the close of business of the New York Stock Exchange (NYSE), normally 4:00 p.m. Eastern time and includes trades executed through the end of the prior business day. Gains and losses on securities sold are determined on the basis of identified cost and includes proceeds received from litigation. Dividend income is recorded on the ex-dividend date, except for certain dividends from foreign securities where the ex-dividend date may have passed, which are recorded as soon as the Fund is informed of the ex-dividend date. Non-cash dividends included in dividend income, if any, are recorded at the fair market value of the securities received. Income and capital gain distributions from Fidelity Central Funds, if any, are recorded on the ex-dividend date. Certain distributions received by the Fund represent a return of capital or capital gain. The Fund determines the components of these distributions subsequent to the ex-dividend date, based upon receipt of tax filings or other correspondence relating to the underlying investment. These distributions are recorded as a reduction of cost of investments and/or as a realized gain. Interest income is accrued as earned and includes coupon interest and amortization of premium and accretion of discount on debt securities as applicable. Investment income is recorded net of foreign taxes withheld where recovery of such taxes is uncertain.
Class Allocations and Expenses. Investment income, realized and unrealized capital gains and losses, common expenses of the Fund, and certain fund-level expense reductions, if any, are allocated daily on a pro-rata basis to each class based on the relative net assets of each class to the total net assets of the Fund. Each class differs with respect to transfer agent fees incurred. Certain expense reductions may also differ by class. For the reporting period, the allocated portion of income and expenses to each class as a percent of its average net assets may vary due to the timing of recording these transactions in relation to fluctuating net assets of the classes. Expenses directly attributable to a fund are charged to that fund. Expenses attributable to more than one fund are allocated among the respective funds on the basis of relative net assets or other appropriate methods. Expense estimates are accrued in the period to which they relate and adjustments are made when actual amounts are known.
Income Tax Information and Distributions to Shareholders. Each year, the Fund intends to qualify as a regulated investment company under Subchapter M of the Internal Revenue Code, including distributing substantially all of its taxable income and realized gains. As a result, no provision for U.S. Federal income taxes is required. As of December 31, 2017, the Fund did not have any unrecognized tax benefits in the financial statements; nor is the Fund aware of any tax positions for which it is reasonably possible that the total amounts of unrecognized tax benefits will significantly change in the next twelve months. The Fund files a U.S. federal tax return, in addition to state and local tax returns as required. The Fund's federal income tax returns are subject to examination by the Internal Revenue Service (IRS) for a period of three fiscal years after they are filed. State and local tax returns may be subject to examination for an additional fiscal year depending on the jurisdiction. Foreign taxes are provided for based on the Fund's understanding of the tax rules and rates that exist in the foreign markets in which it invests.
Distributions are declared and recorded on the ex-dividend date. Income dividends and capital gain distributions are declared separately for each class. Income and capital gain distributions are determined in accordance with income tax regulations, which may differ from GAAP.
Capital accounts within the financial statements are adjusted for permanent book-tax differences. These adjustments have no impact on net assets or the results of operations. Capital accounts are not adjusted for temporary book-tax differences which will reverse in a subsequent period.
Book-tax differences are primarily due to foreign currency transactions, certain deemed distributions and losses deferred due to wash sales.
As of period end, the cost and unrealized appreciation (depreciation) in securities, and derivatives if applicable, for federal income tax purposes were as follows:
| Gross unrealized appreciation | $8,893,248 |
| Gross unrealized depreciation | (3,282,733) |
| Net unrealized appreciation (depreciation) | $5,610,515 |
| Tax Cost | $40,226,051 |
The tax-based components of distributable earnings as of period end were as follows:
| Undistributed ordinary income | $74,724 |
| Undistributed long-term capital gain | $4,122,083 |
| Net unrealized appreciation (depreciation) on securities and other investments | $5,610,089 |
The tax character of distributions paid was as follows:
| | December 31, 2017 | December 31, 2016 |
| Ordinary Income | $1,736,926 | $ 1,425,624 |
| Long-term Capital Gains | 558,891 | 11,562 |
| Total | $2,295,817 | $ 1,437,186 |
Trading (Redemption) Fees. Shares held by investors less than 60 days may be subject to a redemption fee equal to 1% of the NAV of shares redeemed. All redemption fees, which reduce the proceeds of the shareholder redemption, are retained by the Fund and accounted for as an addition to paid in capital. In November 2017, the Board of Trustees approved the elimination of these redemption fees effective December 18, 2017.
4. Purchases and Sales of Investments.
Purchases and sales of securities, other than short-term securities, aggregated $48,947,537 and $94,384,566, respectively.
5. Fees and Other Transactions with Affiliates.
Management Fee. Fidelity SelectCo, LLC (the investment adviser) and its affiliates provide the Fund with investment management related services for which the Fund pays a monthly management fee. The management fee is the sum of an individual fund fee rate that is based on an annual rate of .30% of the Fund's average net assets and an annualized group fee rate that averaged .24% during the period. The group fee rate is based upon the average net assets of all the mutual funds advised by Fidelity Management & Research Company (FMR) and the investment adviser. The group fee rate decreases as assets under management increase and increases as assets under management decrease. For the reporting period, the total annual management fee rate was .55% of the Fund's average net assets.
Transfer Agent Fees. Fidelity Investments Institutional Operations Company, Inc. (FIIOC), an affiliate of the investment adviser, is the Fund's transfer, dividend disbursing, and shareholder servicing agent. FIIOC receives an asset-based fee with respect to each class. Each class pays a fee for transfer agent services, typesetting and printing and mailing of shareholder reports, excluding mailing of proxy statements, equal to an annual rate of class-level average net assets. The annual rate for Investor Class is .15% and the annual rate for all other classes is .07%. For the period, transfer agent fees for each class were as follows:
| Initial Class | $7,724 |
| Investor Class | 80,417 |
| | $88,141 |
Accounting and Security Lending Fees. Fidelity Service Company, Inc. (FSC), an affiliate of the investment adviser, maintains the Fund's accounting records. The accounting fee is based on the level of average net assets for each month. Under a separate contract, FSC administers the security lending program. The security lending fee is based on the number and duration of lending transactions.
Brokerage Commissions. The Fund placed a portion of its portfolio transactions with brokerage firms which are affiliates of the investment adviser. Brokerage commissions are included in net realized gain (loss) and change in net unrealized appreciation (depreciation) in the Statement of Operations. The commissions paid to these affiliated firms were $3,619 for the period.
Interfund Trades. The Fund may purchase from or sell securities to other Fidelity Funds under procedures adopted by the Board. The procedures have been designed to ensure these interfund trades are executed in accordance with Rule 17a-7 of the 1940 Act. Interfund trades are included within the respective purchases and sales amounts shown in the Purchases and Sales of Investments note.
6. Committed Line of Credit.
The Fund participates with other funds managed by the investment adviser or an affiliate in a $4.25 billion credit facility (the "line of credit") to be utilized for temporary or emergency purposes to fund shareholder redemptions or for other short-term liquidity purposes. The Fund has agreed to pay commitment fees on its pro-rata portion of the line of credit, which amounted to $249 and is reflected in Miscellaneous expenses on the Statement of Operations. During the period, the Fund did not borrow on this line of credit.
7. Security Lending.
The Fund lends portfolio securities through a lending agent from time to time in order to earn additional income. On the settlement date of the loan, the Fund receives collateral (in the form of U.S. Treasury obligations, letters of credit and/or cash) against the loaned securities and maintains collateral in an amount not less than 100% of the market value of the loaned securities during the period of the loan. The market value of the loaned securities is determined at the close of business of the Fund and any additional required collateral is delivered to the Fund on the next business day. The Fund or borrower may terminate the loan at any time, and if the borrower defaults on its obligation to return the securities loaned because of insolvency or other reasons, the Fund may apply collateral received from the borrower against the obligation. The Fund may experience delays and costs in recovering the securities loaned. Any cash collateral received is invested in the Fidelity Securities Lending Cash Central Fund. The value of loaned securities and cash collateral at period end are disclosed on the Fund's Statement of Assets and Liabilities. Security lending income represents the income earned on investing cash collateral, less rebates paid to borrowers and any lending agent fees associated with the loan, plus any premium payments received for lending certain types of securities. Security lending income is presented in the Statement of Operations as a component of income from Fidelity Central Funds.
8. Expense Reductions.
Commissions paid to certain brokers with whom the investment adviser, or its affiliates, places trades on behalf of the Fund include an amount in addition to trade execution, which may be rebated back to the Fund to offset certain expenses. This amount totaled $11,355 for the period
In addition, during the period the investment adviser reimbursed and/or waived a portion of fund-level operating expenses in the amount of $858.
9. Distributions to Shareholders.
Distributions to shareholders of each class were as follows:
| | Year ended
December 31, 2017 | Year ended December 31, 2016 |
| From net investment income | | |
| Initial Class | $186,059 | $168,720 |
| Investor Class | 1,035,618 | 772,942 |
| Total | $1,221,677 | $941,662 |
| From net realized gain | | |
| Initial Class | $188,175 | $85,642 |
| Investor Class | 885,965 | 409,882 |
| Total | $1,074,140 | $495,524 |
10. Share Transactions.
Transactions for each class of shares were as follows:
| | Shares | Shares | Dollars | Dollars |
| | Year ended December 31, 2017 | Year ended December 31, 2016 | Year ended December 31, 2017 | Year ended December 31, 2016 |
| Initial Class | | | | |
| Shares sold | 316,832 | 1,468,085 | $4,207,080 | $17,998,963 |
| Reinvestment of distributions | 29,505 | 19,392 | 374,234 | 254,362 |
| Shares redeemed | (1,075,454) | (727,804) | (13,955,988) | (9,092,693) |
| Net increase (decrease) | (729,117) | 759,673 | $(9,374,674) | $9,160,632 |
| Investor Class | | | | |
| Shares sold | 632,227 | 5,023,638 | $8,267,802 | $60,915,905 |
| Reinvestment of distributions | 152,997 | 90,815 | 1,921,583 | 1,182,824 |
| Shares redeemed | (3,568,494) | (1,566,095) | (45,877,138) | (19,262,064) |
| Net increase (decrease) | (2,783,270) | 3,548,358 | $(35,687,753) | $42,836,665 |
11. Other.
The Fund's organizational documents provide former and current trustees and officers with a limited indemnification against liabilities arising in connection with the performance of their duties to the Fund. In the normal course of business, the Fund may also enter into contracts that provide general indemnifications. The Fund's maximum exposure under these arrangements is unknown as this would be dependent on future claims that may be made against the Fund. The risk of material loss from such claims is considered remote.
At the end of the period, the investment adviser or its affiliates were the owners of record of 100% of the total outstanding shares of the Fund.
Report of Independent Registered Public Accounting Firm
To the Trustees of Variable Insurance Products Fund IV and Shareholders of VIP Telecommunications Portfolio:
Opinion on the Financial Statements
We have audited the accompanying statement of assets and liabilities, including the schedule of investments, of VIP Telecommunications Portfolio (one of the funds constituting Variable Insurance Products Fund IV, referred to hereafter as the “Fund”) as of December 31, 2017, the related statements of operations for the year ended December 31, 2017, the statement of changes in net assets for each of the two years in the period ended December 31, 2017, including the related notes, and the financial highlights for each of the five years in the period ended December 31, 2017 (collectively referred to as the “financial statements”). In our opinion, the financial statements present fairly, in all material respects, the financial position of the Fund as of December 31, 2017, the results of its operations for the year then ended, the changes in its net assets for each of the two years in the period ended December 31, 2017 and the financial highlights for each of the five years in the period ended December 31, 2017 in conformity with accounting principles generally accepted in the United States of America.
Basis for Opinion
These financial statements are the responsibility of the Fund’s management. Our responsibility is to express an opinion on the Fund’s financial statements based on our audits. We are a public accounting firm registered with the Public Company Accounting Oversight Board (United States) (“PCAOB”) and are required to be independent with respect to the Fund in accordance with the U.S. federal securities laws and the applicable rules and regulations of the Securities and Exchange Commission and the PCAOB.
We conducted our audits of these financial statements in accordance with the standards of the PCAOB. Those standards require that we plan and perform the audit to obtain reasonable assurance about whether the financial statements are free of material misstatement, whether due to error or fraud.
Our audits included performing procedures to assess the risks of material misstatement of the financial statements, whether due to error or fraud, and performing procedures that respond to those risks. Such procedures included examining, on a test basis, evidence regarding the amounts and disclosures in the financial statements. Our audits also included evaluating the accounting principles used and significant estimates made by management, as well as evaluating the overall presentation of the financial statements. Our procedures included confirmation of securities owned as of December 31, 2017 by correspondence with the custodian and brokers; when replies were not received from brokers, we performed other auditing procedures. We believe that our audits provide a reasonable basis for our opinion.
PricewaterhouseCoopers LLP
Boston, Massachusetts
February 15, 2018
We have served as the auditor of one or more investment companies in the Fidelity group of funds since 1932.
Trustees and Officers
The Trustees, Members of the Advisory Board (if any), and officers of the trust and fund, as applicable, are listed below. The Board of Trustees governs the fund and is responsible for protecting the interests of shareholders. The Trustees are experienced executives who meet periodically throughout the year to oversee the fund's activities, review contractual arrangements with companies that provide services to the fund, oversee management of the risks associated with such activities and contractual arrangements, and review the fund's performance. Each of the Trustees oversees 91 funds.
The Trustees hold office without limit in time except that (a) any Trustee may resign; (b) any Trustee may be removed by written instrument, signed by at least two-thirds of the number of Trustees prior to such removal; (c) any Trustee who requests to be retired or who has become incapacitated by illness or injury may be retired by written instrument signed by a majority of the other Trustees; and (d) any Trustee may be removed at any special meeting of shareholders by a two-thirds vote of the outstanding voting securities of the trust. Each Trustee who is not an interested person (as defined in the 1940 Act) of the trust and the fund is referred to herein as an Independent Trustee. Each Independent Trustee shall retire not later than the last day of the calendar year in which his or her 75th birthday occurs. The Independent Trustees may waive this mandatory retirement age policy with respect to individual Trustees. Officers and Advisory Board Members hold office without limit in time, except that any officer or Advisory Board Member may resign or may be removed by a vote of a majority of the Trustees at any regular meeting or any special meeting of the Trustees. Except as indicated, each individual has held the office shown or other offices in the same company for the past five years.
The fund’s Statement of Additional Information (SAI) includes more information about the Trustees. To request a free copy, call Fidelity at 1-877-208-0098.
Experience, Skills, Attributes, and Qualifications of the Trustees. The Governance and Nominating Committee has adopted a statement of policy that describes the experience, qualifications, attributes, and skills that are necessary and desirable for potential Independent Trustee candidates (Statement of Policy). The Board believes that each Trustee satisfied at the time he or she was initially elected or appointed a Trustee, and continues to satisfy, the standards contemplated by the Statement of Policy. The Governance and Nominating Committee also engages professional search firms to help identify potential Independent Trustee candidates who have the experience, qualifications, attributes, and skills consistent with the Statement of Policy. From time to time, additional criteria based on the composition and skills of the current Independent Trustees, as well as experience or skills that may be appropriate in light of future changes to board composition, business conditions, and regulatory or other developments, have also been considered by the professional search firms and the Governance and Nominating Committee. In addition, the Board takes into account the Trustees' commitment and participation in Board and committee meetings, as well as their leadership of standing and ad hoc committees throughout their tenure.
In determining that a particular Trustee was and continues to be qualified to serve as a Trustee, the Board has considered a variety of criteria, none of which, in isolation, was controlling. The Board believes that, collectively, the Trustees have balanced and diverse experience, qualifications, attributes, and skills, which allow the Board to operate effectively in governing the fund and protecting the interests of shareholders. Information about the specific experience, skills, attributes, and qualifications of each Trustee, which in each case led to the Board's conclusion that the Trustee should serve (or continue to serve) as a trustee of the fund, is provided below.
Board Structure and Oversight Function. Brian B. Hogan is an interested person and currently serves as Chairman. The Trustees have determined that an interested Chairman is appropriate and benefits shareholders because an interested Chairman has a personal and professional stake in the quality and continuity of services provided to the fund. Independent Trustees exercise their informed business judgment to appoint an individual of their choosing to serve as Chairman, regardless of whether the Trustee happens to be independent or a member of management. The Independent Trustees have determined that they can act independently and effectively without having an Independent Trustee serve as Chairman and that a key structural component for assuring that they are in a position to do so is for the Independent Trustees to constitute a substantial majority for the Board. The Independent Trustees also regularly meet in executive session. Michael E. Wiley serves as Chairman of the Independent Trustees and as such (i) acts as a liaison between the Independent Trustees and management with respect to matters important to the Independent Trustees and (ii) with management prepares agendas for Board meetings.
Fidelity® funds are overseen by different Boards of Trustees. The fund's Board oversees Fidelity's sector portfolios. Other Boards oversee Fidelity's equity and high income funds, and Fidelity's investment grade bond, money market, and asset allocation funds. The use of separate Boards, each with its own committee structure, allows the Trustees of each group of Fidelity® funds to focus on the unique issues of the funds they oversee, including common research, investment, and operational issues. On occasion, the separate Boards establish joint committees to address issues of overlapping consequences for the Fidelity® funds overseen by each Board.
The Trustees operate using a system of committees to facilitate the timely and efficient consideration of all matters of importance to the Trustees, the fund, and fund shareholders and to facilitate compliance with legal and regulatory requirements and oversight of the fund's activities and associated risks. The Board, acting through its committees, has charged SelectCo and its affiliates with (i) identifying events or circumstances the occurrence of which could have demonstrably adverse effects on the fund's business and/or reputation; (ii) implementing processes and controls to lessen the possibility that such events or circumstances occur or to mitigate the effects of such events or circumstances if they do occur; and (iii) creating and maintaining a system designed to evaluate continuously business and market conditions in order to facilitate the identification and implementation processes described in (i) and (ii) above. Because the day-to-day operations and activities of the fund are carried out by or through SelectCo, its affiliates, and other service providers, the fund's exposure to risks is mitigated but not eliminated by the processes overseen by the Trustees. While each of the Board's committees has responsibility for overseeing different aspects of the fund's activities, oversight is exercised primarily through the Operations and Audit Committees. Appropriate personnel, including but not limited to the fund's Chief Compliance Officer (CCO), SelectCo's internal auditor, the independent accountants, the fund's Treasurer and portfolio management personnel, make periodic reports to the Board's committees, as appropriate. The responsibilities of each standing committee, including their oversight responsibilities, are described further under "Standing Committees of the Trustees."
Interested Trustees*:
Correspondence intended for a Trustee who is an interested person may be sent to Fidelity Investments, 245 Summer Street, Boston, Massachusetts 02210.
Name, Year of Birth; Principal Occupations and Other Relevant Experience+
Brian B. Hogan (1964)
Year of Election or Appointment: 2014
Trustee
Chairman of the Board of Trustees
Mr. Hogan also serves as Trustee or Vice President of other funds. Mr. Hogan serves as a Director of FMR Investment Management (UK) Limited (investment adviser firm, 2015-present) and Fidelity SelectCo, LLC (investment adviser firm, 2014-present) and President of the Equity Division of FMR (investment adviser firm, 2009-present). Previously, Mr. Hogan served as Senior Vice President, Equity Research of FMR (2006-2009) and as a portfolio manager. Mr. Brian B. Hogan is not related to Mr. Colm A. Hogan.
* Determined to be an "Interested Trustee" by virtue of, among other things, his or her affiliation with the trust or various entities under common control with SelectCo.
+ The information includes the Trustee's principal occupation during the last five years and other information relating to the experience, attributes, and skills relevant to the Trustee's qualifications to serve as a Trustee, which led to the conclusion that the Trustee should serve as a Trustee for the fund.
Independent Trustees:
Correspondence intended for an Independent Trustee may be sent to Fidelity Investments, P.O. Box 55235, Boston, Massachusetts 02205-5235.
Name, Year of Birth; Principal Occupations and Other Relevant Experience+
David A. Rosow (1942)
Year of Election or Appointment: 2013
Trustee
Mr. Rosow also serves as Trustee of other Fidelity® funds. Prior to his retirement in 2006, Mr. Rosow was the Chief Executive Officer, owner and operator of a number of private companies, which encompassed the oil refining, drilling and marketing of petroleum products (including specialty petroleum products), recreation industry, and real estate development. Mr. Rosow currently serves as a Director of Oxbow Carbon LLC (upgraders, marketers, and distributors of petroleum byproducts of the oil refining process, 2015-present) and Oxbridge Academy of the Palm Beaches (2015-present) and serves as its President and CEO. Previously, Mr. Rosow served on the Fairfield Country Day School Board for 27 years, including as its President for 3 years, stepping down in 2006. Mr. Rosow served as Lead Director and Chairman of the Audit Committee of Hudson United Bancorp (1996-2006), Chairman of the Board of Westport Bank and Trust (1992-1996), and as a Director of TD Banknorth (2006-2007). In addition, Mr. Rosow served as a member (2008-2014) and President (2009-2014) of the Town Council of Palm Beach, Florida. Mr. Rosow also served as a Member of the Advisory Board of certain Fidelity® funds (2012-2013).
Garnett A. Smith (1947)
Year of Election or Appointment: 2013
Trustee
Mr. Smith also serves as Trustee of other Fidelity® funds. Prior to Mr. Smith's retirement, he served as Chairman and Chief Executive Officer of Inbrand Corp. (manufacturer of personal absorbent products, 1990-1997). He also served as President (1986-1990) of Inbrand Corp. Prior to his employment with Inbrand Corp., he was employed by a retail fabric chain and North Carolina National Bank. In addition, Mr. Smith served as a Member of the Advisory Board of certain Fidelity® funds (2012-2013) and as a board member of the Jackson Hole Land Trust (2009-2012).
Michael E. Wiley (1950)
Year of Election or Appointment: 2008
Trustee
Chairman of the Independent Trustees
Mr. Wiley also serves as Trustee of other Fidelity® funds. Mr. Wiley serves as a Director of Andeavor Corporation (independent oil refiner and marketer, 2005-present), a Director of Andeavor Logistics LP (natural resources logistics, 2015-present), and a Director of Bill Barrett Corporation (exploration and production, 2005-present). In addition, Mr. Wiley also serves as a Director of Post Oak Bank (privately-held bank, 2004-present). Previously, Mr. Wiley served as a Trustee of other Fidelity® funds (2008-2013), as a Director of Asia Pacific Exploration Consolidated (international oil and gas exploration and production, 2008-2013), as a member of the Board of Trustees of the University of Tulsa (2000-2006; 2007-2010), as a Senior Energy Advisor of Katzenbach Partners, LLC (consulting, 2006-2007), as an Advisory Director of Riverstone Holdings (private investment), Chairman, President, and CEO of Baker Hughes, Inc. (oilfield services, 2000-2004), and as Director of Spinnaker Exploration Company (exploration and production, 2001-2005).
+ The information includes the Trustee's principal occupation during the last five years and other information relating to the experience, attributes, and skills relevant to the Trustee's qualifications to serve as a Trustee, which led to the conclusion that the Trustee should serve as a Trustee for the fund.
Advisory Board Members and Officers:
Correspondence intended for a Member of the Advisory Board (if any) may be sent to Fidelity Investments, P.O. Box 55235, Boston, Massachusetts 02205-5235. Except for Anthony R. Rochte, correspondence intended for an officer may be sent to Fidelity Investments, 245 Summer Street, Boston, Massachusetts 02210. Correspondence intended for Mr. Rochte may be sent to Fidelity SelectCo, LLC (SelectCo), 1225 17th Street, Denver, Colorado 80202-5541. Officers appear below in alphabetical order.
Name, Year of Birth; Principal Occupation
Donald F. Donahue (1950)
Year of Election or Appointment: 2015
Member of the Advisory Board
Mr. Donahue also serves as a Trustee or Member of the Advisory Board of other Fidelity® funds. Mr. Donahue is President and Chief Executive Officer of Miranda Partners, LLC (risk consulting for the financial services industry, 2012-present). Previously, Mr. Donahue served as Chief Executive Officer (2006-2012), Chief Operating Officer (2003-2006), and Managing Director, Customer Marketing and Development (1999-2003) of The Depository Trust & Clearing Corporation (financial markets infrastructure). Mr. Donahue serves as a Member (2007-present) and Co-Chairman (2016-present) of the Board of Directors of United Way of New York, Member of the Board of Directors of NYC Leadership Academy (2012-present) and Member of the Board of Advisors of Ripple Labs, Inc. (financial services, 2015-present). He also served as Chairman (2010-2012) and Member of the Board of Directors (2012-2013) of Omgeo, LLC (financial services), Treasurer of United Way of New York (2012-2016), and Member of the Board of Directors of XBRL US (financial services non-profit, 2009-2012) and the International Securities Services Association (2009-2012).
Carol B. Tomé (1957)
Year of Election or Appointment: 2017
Member of the Advisory Board
Ms. Tomé also serves as Member of the Advisory Board of other Fidelity® funds. Ms. Tomé is Chief Financial Officer (2001-present) and Executive Vice President of Corporate Services (2007-present) of The Home Depot, Inc. (home improvement retailer) and a Director (2003-present) and Chair of the Audit Committee (2004-present) of United Parcel Service, Inc. (package delivery and supply chain management). Previously, Ms. Tomé served as Trustee of certain Fidelity® funds (2017), Senior Vice President of Finance and Accounting/Treasurer (2000-2007) and Vice President and Treasurer (1995-2000) of The Home Depot, Inc. and Chair of the Board (2010-2012), Vice Chair of the Board (2009 and 2013), and a Director (2008-2013) of the Federal Reserve Bank of Atlanta. Ms. Tomé is also a director or trustee of many community and professional organizations.
Elizabeth Paige Baumann (1968)
Year of Election or Appointment: 2017
Anti-Money Laundering (AML) Officer
Ms. Baumann also serves as AML Officer of other funds. She is Chief AML Officer (2012-present) and Senior Vice President (2014-present) of FMR LLC (diversified financial services company) and is an employee of Fidelity Investments. Previously, Ms. Baumann served as AML Officer of the funds (2012-2016), and Vice President (2007-2014) and Deputy Anti-Money Laundering Officer (2007-2012) of FMR LLC.
Marc R. Bryant (1966)
Year of Election or Appointment: 2013
Secretary and Chief Legal Officer (CLO)
Mr. Bryant also serves as Secretary and CLO of other funds. Mr. Bryant serves as CLO, Secretary, and Senior Vice President of Fidelity Management & Research Company (investment adviser firm, 2015-present) and FMR Co., Inc. (investment adviser firm, 2015-present); Secretary of Fidelity SelectCo, LLC (investment adviser firm, 2015-present) and Fidelity Investments Money Management, Inc. (investment adviser firm, 2015-present); and CLO of Fidelity Management & Research (Hong Kong) Limited and FMR Investment Management (UK) Limited (investment adviser firms, 2015-present) and Fidelity Management & Research (Japan) Limited (investment adviser firm, 2016-present). He is Senior Vice President and Deputy General Counsel of FMR LLC (diversified financial services company). Previously, Mr. Bryant served as Secretary and CLO of Fidelity Rutland Square Trust II (2010-2014) and Assistant Secretary of Fidelity's Fixed Income and Asset Allocation Funds (2013-2015). Prior to joining Fidelity Investments, Mr. Bryant served as a Senior Vice President and the Head of Global Retail Legal for AllianceBernstein L.P. (2006-2010), and as the General Counsel for ProFund Advisors LLC (2001-2006).
William C. Coffey (1969)
Year of Election or Appointment: 2009
Assistant Secretary
Mr. Coffey also serves as Assistant Secretary of other funds. He is Senior Vice President and Deputy General Counsel of FMR LLC (diversified financial services company, 2010-present), and is an employee of Fidelity Investments. Previously, Mr. Coffey served as Vice President and Associate General Counsel of FMR LLC (2005-2009).
Jonathan Davis (1968)
Year of Election or Appointment: 2010
Assistant Treasurer
Mr. Davis also serves as Assistant Treasurer of other funds. Mr. Davis serves as Assistant Treasurer of FMR Capital, Inc. (2017-present) and is an employee of Fidelity Investments. Previously, Mr. Davis served as Vice President and Associate General Counsel of FMR LLC (diversified financial services company, 2003-2010).
Adrien E. Deberghes (1967)
Year of Election or Appointment: 2013
President and Treasurer
Mr. Deberghes also serves as an officer of other funds. He serves as Assistant Treasurer of FMR Capital, Inc. (2017-present), Executive Vice President of Fidelity Investments Money Management, Inc. (FIMM) (investment adviser firm, 2016-present), and is an employee of Fidelity Investments (2008-present). Prior to joining Fidelity Investments, Mr. Deberghes was Senior Vice President of Mutual Fund Administration at State Street Corporation (2007-2008), Senior Director of Mutual Fund Administration at Investors Bank & Trust (2005-2007), and Director of Finance for Dunkin' Brands (2000-2005). Previously, Mr. Deberghes served in other fund officer roles.
Joseph DeSantis (1959)
Year of Election or Appointment: 2015
Vice President
Mr. DeSantis also serves as Vice President of other funds. Mr. DeSantis serves as a Director of Fidelity Management & Research (Japan) Limited (investment adviser firm, 2016-present), Chief Investment Officer, Equities (2010-present) and is an employee of Fidelity Investments.
Stephanie J. Dorsey (1969)
Year of Election or Appointment: 2010
Assistant Treasurer
Ms. Dorsey also serves as an officer of other funds. Ms. Dorsey serves as Assistant Treasurer of FMR Capital, Inc. (2017-present), is an employee of Fidelity Investments (2008-present), and has served in other fund officer roles. Prior to joining Fidelity Investments, Ms. Dorsey served as Treasurer (2004-2008) of the JPMorgan Mutual Funds and Vice President (2004-2008) of JPMorgan Chase Bank.
Howard J. Galligan III (1966)
Year of Election or Appointment: 2014
Chief Financial Officer
Mr. Galligan also serves as Chief Financial Officer of other funds. Mr. Galligan serves as President of Fidelity Pricing and Cash Management Services (FPCMS) (2014-present) and as a Director of Strategic Advisers, Inc. (investment adviser firm, 2008-present). Previously, Mr. Galligan served as Chief Administrative Officer of Asset Management (2011-2014) and Chief Operating Officer and Senior Vice President of Investment Support for Strategic Advisers, Inc. (2003-2011).
James D. Gryglewicz (1972)
Year of Election or Appointment: 2014
Chief Compliance Officer
Mr. Gryglewicz also serves as Chief Compliance Officer of other funds. Mr. Gryglewicz serves as Compliance Officer of Strategic Advisers, Inc. (investment adviser firm, 2015-present) and Fidelity SelectCo, LLC (investment adviser firm, 2014-present), Senior Vice President of Asset Management Compliance (2009-present), and is an employee of Fidelity Investments (2004-present).
Brian B. Hogan (1964)
Year of Election or Appointment: 2009
Vice President
Mr. Hogan also serves as Trustee or Vice President of other funds. Mr. Hogan serves as a Director of FMR Investment Management (UK) Limited (investment adviser firm, 2015-present) and Fidelity SelectCo, LLC (investment adviser firm, 2014-present) and President of the Equity Division of FMR (investment adviser firm, 2009-present). Previously, Mr. Hogan served as Senior Vice President, Equity Research of FMR (2006-2009) and as a portfolio manager. Mr. Brian B. Hogan is not related to Mr. Colm A. Hogan.
Colm A. Hogan (1973)
Year of Election or Appointment: 2016
Assistant Treasurer
Mr. Hogan also serves as an officer of other funds. Mr. Hogan serves as Assistant Treasurer of FMR Capital, Inc. (2017-present) and is an employee of Fidelity Investments (2005-present). Mr. Colm A. Hogan is not related to Mr. Brian B. Hogan.
Chris Maher (1972)
Year of Election or Appointment: 2013
Assistant Treasurer
Mr. Maher serves as Assistant Treasurer of other funds. Mr. Maher is Vice President of Valuation Oversight, serves as Assistant Treasurer of FMR Capital, Inc. (2017-present), and is an employee of Fidelity Investments. Previously, Mr. Maher served as Vice President of Asset Management Compliance (2013), Vice President of the Program Management Group of FMR (investment adviser firm, 2010-2013), and Vice President of Valuation Oversight (2008-2010).
Rieco E. Mello (1969)
Year of Election or Appointment: 2017
Assistant Treasurer
Mr. Mello also serves as Assistant Treasurer of other funds. Mr. Mello serves as Assistant Treasurer of FMR Capital, Inc. (2017-present) and is an employee of Fidelity Investments (1995-present).
Anthony R. Rochte (1968)
Year of Election or Appointment: 2013
Vice President
Mr. Rochte also serves as Vice President of other funds. Mr. Rochte serves as President of Fidelity SelectCo, LLC (investment adviser firm, 2012-present) and is an employee of Fidelity Investments (2012-present). Prior to joining Fidelity Investments, Mr. Rochte served as Senior Managing Director and head of State Street Global Advisors' North American Intermediary Business Group (2006-2012).
Stacie M. Smith (1974)
Year of Election or Appointment: 2013
Assistant Treasurer
Ms. Smith also serves as an officer of other funds. Ms. Smith serves as Assistant Treasurer of FMR Capital, Inc. (2017-present), is an employee of Fidelity Investments (2009-present), and has served in other fund officer roles. Prior to joining Fidelity Investments, Ms. Smith served as Senior Audit Manager of Ernst & Young LLP (accounting firm, 1996-2009). Previously, Ms. Smith served as Deputy Treasurer of certain Fidelity® funds (2013-2016).
Marc L. Spector (1972)
Year of Election or Appointment: 2017
Assistant Treasurer
Mr. Spector also serves as an officer of other funds. Mr. Spector serves as Assistant Treasurer of FMR Capital, Inc. (2017-present) and is an employee of Fidelity Investments (2016-present). Prior to joining Fidelity Investments, Mr. Spector served as Director at the Siegfried Group (accounting firm, 2013-2016), and prior to Siegfried Group as audit senior manager at Deloitte & Touche (accounting firm, 2005-2013).
Renee Stagnone (1975)
Year of Election or Appointment: 2016
Assistant Treasurer
Ms. Stagnone also serves as an officer of other funds. Ms. Stagnone serves as Assistant Treasurer of FMR Capital, Inc. (2017-present) and is an employee of Fidelity Investments (1997-present). Previously, Ms. Stagnone served as Deputy Treasurer of certain Fidelity® funds (2013-2016).
Shareholder Expense Example
As a shareholder of the Fund, you incur two types of costs: (1) transaction costs, including redemption fees and (2) ongoing costs, including management fees and other Fund expenses. This Example is intended to help you understand your ongoing costs (in dollars) of investing in the Fund and to compare these costs with the ongoing costs of investing in other mutual funds.
The Example is based on an investment of $1,000 invested at the beginning of the period and held for the entire period (July 1, 2017 to December 31, 2017).
Actual Expenses
The first line of the accompanying table for each class of the Fund provides information about actual account values and actual expenses. You may use the information in this line, together with the amount you invested, to estimate the expenses that you paid over the period. Simply divide your account value by $1,000.00 (for example, an $8,600 account value divided by $1,000.00 = 8.6), then multiply the result by the number in the first line for a class of the Fund under the heading entitled "Expenses Paid During Period" to estimate the expenses you paid on your account during this period. The estimate of expenses does not include any fees or other expenses of any variable annuity or variable life insurance product. If they were, the estimate of expenses you paid during the period would be higher, and your ending account value would be lower. In addition, the Fund, as a shareholder in the underlying Fidelity Central Funds, will indirectly bear its pro-rata share of the fees and expenses incurred by the underlying Fidelity Central Funds. These fees and expenses are not included in the Fund's annualized expense ratio used to calculate the expense estimate in the table below.
Hypothetical Example for Comparison Purposes
The second line of the accompanying table for each class of the Fund provides information about hypothetical account values and hypothetical expenses based on a Class' actual expense ratio and an assumed rate of return of 5% per year before expenses, which is not the Class' actual return. The hypothetical account values and expenses may not be used to estimate the actual ending account balance or expenses you paid for the period. You may use this information to compare the ongoing costs of investing in the Fund and other funds. To do so, compare this 5% hypothetical example with the 5% hypothetical examples that appear in the shareholder reports of the other funds. The estimate of expenses does not include any fees or other expenses of any variable annuity or variable life insurance product. If they were, the estimate of expenses you paid during the period would be higher, and your ending account value would be lower. In addition, the Fund, as a shareholder in the underlying Fidelity Central Funds, will indirectly bear its pro-rata share of the fees and expenses incurred by the underlying Fidelity Central Funds. These fees and expenses are not included in the Fund's annualized expense ratio used to calculate the expense estimate in the table below.
Please note that the expenses shown in the table are meant to highlight your ongoing costs only and do not reflect any transaction costs. Therefore, the second line of the table is useful in comparing ongoing costs only, and will not help you determine the relative total costs of owning different funds. In addition, if these transactional costs were included, your costs would have been higher.
| | Annualized Expense Ratio-A | Beginning
Account Value
July 1, 2017 | Ending
Account Value
December 31, 2017 | Expenses Paid
During Period-B
July 1, 2017
to December 31, 2017 |
| Initial Class | .80% | | | |
| Actual | | $1,000.00 | $1,040.40 | $4.11 |
| Hypothetical-C | | $1,000.00 | $1,021.17 | $4.08 |
| Investor Class | .88% | | | |
| Actual | | $1,000.00 | $1,039.70 | $4.52 |
| Hypothetical-C | | $1,000.00 | $1,020.77 | $4.48 |
A Annualized expense ratio reflects expenses net of applicable fee waivers.
B Expenses are equal to each Class' annualized expense ratio, multiplied by the average account value over the period, multiplied by 184/365 (to reflect the one-half year period).
C 5% return per year before expenses
Distributions (Unaudited)
The Board of Trustees of VIP Telecommunications Portfolio voted to pay to shareholders of record at the opening of business on record date, the following distributions per share derived from capital gains realized from sales of portfolio securities, and dividends derived from net investment income:
| | Pay Date | Record Date | Dividends | Capital Gains |
| VIP Telecommunications Portfolio | | | | |
| Initial Class | 02/09/18 | 02/09/18 | $0.026 | $1.286 |
| Investor Class | 02/09/18 | 02/09/18 | $0.025 | $1.286 |
|
The fund hereby designates as a capital gain dividend with respect to the taxable year ended December 31, 2017, $4,128,081, or, if subsequently determined to be different, the net capital gain of such year.
Initial Class and Investor Class designate 100% of the dividends distributed during the fiscal year as qualifying for the dividends–received deduction for corporate shareholders.
Proxy Voting Results
A special meeting of shareholders was held on December 8, 2017. The results of votes taken among shareholders on the proposals before them are reported below. Each vote reported represents one dollar of net asset value held on the record date for the meeting.
PROPOSAL 1
To elect a Board of Trustees.
| | # of
Votes | % of
Votes |
| James C. Curvey |
| Affirmative | 3,005,845,657.89 | 94.803 |
| Withheld | 164,788,708.80 | 5.197 |
| TOTAL | 3,170,634,366.69 | 100.000 |
| Dennis J. Dirks |
| Affirmative | 3,025,050,303.47 | 95.409 |
| Withheld | 145,584,063.22 | 4.591 |
| TOTAL | 3,170,634,366.69 | 100.000 |
| Donald F. Donahue |
| Affirmative | 3,024,923,660.98 | 95.405 |
| Withheld | 145,710,705.71 | 4.595 |
| TOTAL | 3,170,634,366.69 | 100.000 |
| Alan J. Lacy |
| Affirmative | 3,024,272,946.71 | 95.384 |
| Withheld | 146,361,419.98 | 4.616 |
| TOTAL | 3,170,634,366.69 | 100.00 |
| Ned C. Lautenbach |
| Affirmative | 3,011,847,006.14 | 94.992 |
| Withheld | 158,787,360.55 | 5.008 |
| TOTAL | 3,170,634,366.69 | 100.000 |
| Joseph Mauriello |
| Affirmative | 3,021,074,746.00 | 95.283 |
| Withheld | 149,559,620.69 | 4.717 |
| TOTAL | 3,170,634,366.69 | 100.000 |
| Charles S. Morrison |
| Affirmative | 3,025,083,795.43 | 95.410 |
| Withheld | 145,550,571.26 | 4.590 |
| TOTAL | 3,170,634,366.69 | 100.000 |
| Cornelia M. Small |
| Affirmative | 3,016,566,905.34 | 95.141 |
| Withheld | 154,067,461.35 | 4.859 |
| TOTAL | 3,170,634,366.69 | 100.000 |
| Garnett A. Smith |
| Affirmative | 3,014,927,605.85 | 95.090 |
| Withheld | 155,706,760.84 | 4.910 |
| TOTAL | 3,170,634,366.69 | 100.000 |
| David M. Thomas |
| Affirmative | 3,025,900,428.75 | 95.436 |
| Withheld | 144,733,937.94 | 4.564 |
| TOTAL | 3,170,634,366.69 | 100.000 |
| Michael E. Wiley |
| Affirmative | 3,023,436,110.39 | 95.358 |
| Withheld | 147,198,256.30 | 4.642 |
| TOTAL | 3,170,634,366.69 | 100.000 |
PROPOSAL 2
To eliminate a fundamental investment policy.
| | # of
Votes | % of
Votes |
| Affirmative | 39,014,439.21 | 77.363 |
| Against | 6,453,577.49 | 12.797 |
| Abstain | 4,962,819.02 | 9.840 |
| TOTAL | 50,430,835.72 | 100.000 |
|
| Proposal 1 reflects trust wide proposal and voting results. |
VTELP-ANN-0218
1.851004.110
Item 2.
Code of Ethics
As of the end of the period, December 31, 2017, Variable Insurance Products Fund IV (the trust) has adopted a code of ethics, as defined in Item 2 of Form N-CSR, that applies to its President and Treasurer and its Chief Financial Officer. A copy of the code of ethics is filed as an exhibit to this Form N-CSR.
Item 3.
Audit Committee Financial Expert
The Board of Trustees of the trust has determined that David A. Rosow is an audit committee financial expert, as defined in Item 3 of Form N-CSR. Mr. Rosow is independent for purposes of Item 3 of Form N-CSR.
Item 4.
Principal Accountant Fees and Services
Fees and Services
The following table presents fees billed by PricewaterhouseCoopers LLP (“PwC”) in each of the last two fiscal years for services rendered to VIP Consumer Discretionary Portfolio, VIP Consumer Staples Portfolio, VIP Energy Portfolio, VIP Financial Services Portfolio, VIP Health Care Portfolio, VIP Industrials Portfolio, VIP Materials Portfolio, VIP Real Estate Portfolio, VIP Technology Portfolio, VIP Telecommunications Portfolio, and VIP Utilities Portfolio (the “Funds”):
Services Billed by PwC
December 31, 2017 FeesA
| | | | |
| Audit Fees | Audit-Related Fees | Tax Fees | All Other Fees |
VIP Consumer Discretionary Portfolio | $37,000 | $3,400 | $2,600 | $1,400 |
VIP Consumer Staples Portfolio | $37,000 | $3,400 | $2,600 | $1,400 |
VIP Energy Portfolio | $36,000 | $3,300 | $2,800 | $1,400 |
VIP Financial Services Portfolio | $37,000 | $3,400 | $2,800 | $1,400 |
VIP Health Care Portfolio | $39,000 | $3,600 | $2,600 | $1,500 |
VIP Industrials Portfolio | $37,000 | $3,400 | $2,600 | $1,400 |
VIP Materials Portfolio | $37,000 | $3,400 | $2,600 | $1,400 |
VIP Real Estate Portfolio | $44,000 | $4,100 | $3,700 | $1,700 |
VIP Technology Portfolio | $41,000 | $3,700 | $2,600 | $1,500 |
VIP Telecommunications Portfolio | $37,000 | $3,400 | $2,600 | $1,400 |
VIP Utilities Portfolio | $36,000 | $3,300 | $2,600 | $1,300 |
December 31, 2016 FeesA,B
| | | | |
| Audit Fees | Audit-Related Fees | Tax Fees | All Other Fees |
VIP Consumer Discretionary Portfolio | $37,000 | $3,900 | $2,600 | $1,400 |
VIP Consumer Staples Portfolio | $37,000 | $3,900 | $2,600 | $1,400 |
VIP Energy Portfolio | $36,000 | $3,800 | $3,400 | $1,400 |
VIP Financial Services Portfolio | $37,000 | $3,900 | $2,800 | $1,400 |
VIP Health Care Portfolio | $39,000 | $4,100 | $2,800 | $1,500 |
VIP Industrials Portfolio | $37,000 | $3,900 | $2,600 | $1,400 |
VIP Materials Portfolio | $37,000 | $3,900 | $2,600 | $1,400 |
VIP Real Estate Portfolio | $44,000 | $4,700 | $3,700 | $1,700 |
VIP Technology Portfolio | $41,000 | $4,300 | $2,600 | $1,500 |
VIP Telecommunications Portfolio | $37,000 | $3,900 | $2,600 | $1,400 |
VIP Utilities Portfolio | $35,000 | $3,800 | $3,400 | $1,300 |
A Amounts may reflect rounding.
B Certain amounts have been reclassified to align with current period presentation.
The following table presents fees billed by PwC that were required to be approved by the Audit Committee for services that relate directly to the operations and financial reporting of the Funds and that are rendered on behalf of Fidelity SelectCo, LLC (“SelectCo”) and entities controlling, controlled by, or under common control with SelectCo (not including any sub-adviser whose role is primarily portfolio management and is subcontracted with or overseen by another investment adviser) that provide ongoing services to the Funds (“Fund Service Providers”):
Services Billed by PwC
| | |
| December 31, 2017A | December 31, 2016A |
Audit-Related Fees | $8,470,000 | $6,240,000 |
Tax Fees | $160,000 | $10,000 |
All Other Fees | $- | $- |
A Amounts may reflect rounding.
“Audit-Related Fees” represent fees billed for assurance and related services that are reasonably related to the performance of the fund audit or the review of the fund's financial statements and that are not reported under Audit Fees.
“Tax Fees” represent fees billed for tax compliance, tax advice or tax planning that relate directly to the operations and financial reporting of the fund.
“All Other Fees” represent fees billed for services provided to the fund or Fund Service Provider, a significant portion of which are assurance related, that relate directly to the operations and financial reporting of the fund, excluding those services that are reported under Audit Fees, Audit-Related Fees or Tax Fees.
Assurance services must be performed by an independent public accountant.
* * *
The aggregate non-audit fees billed by PwC for services rendered to the Funds, SelectCo (not including any sub-adviser whose role is primarily portfolio management and is subcontracted with or overseen by another investment adviser), and any Fund Service Provider for each of the last two fiscal years of the Funds are as follows:
| | |
Billed By | December 31, 2017A | December 31, 2016A,B |
PwC | $10,800,000 | $7,725,000 |
| | |
A Amounts may reflect rounding.
B Certain amounts have been reclassified to align with current period presentation.
The trust's Audit Committee has considered non-audit services that were not pre-approved that were provided by PwC to Fund Service Providers to be compatible with maintaining the independence of PwC in its audit of the Funds, taking into account representations from PwC, in accordance with Public Company Accounting Oversight Board rules, regarding its independence from the Funds and their related entities and SelectCo’s review of the appropriateness and permissibility under applicable law of such non-audit services prior to their provision to the Fund Service Providers.
Audit Committee Pre-Approval Policies and Procedures
The trust’s Audit Committee must pre-approve all audit and non-audit services provided by a fund’s independent registered public accounting firm relating to the operations or financial reporting of the fund. Prior to the commencement of any audit or non-audit services to a fund, the Audit Committee reviews the services to determine whether they are appropriate and permissible under applicable law.
The Audit Committee has adopted policies and procedures to, among other purposes, provide a framework for the Committee’s consideration of non-audit services by the audit firms that audit the Fidelity funds. The policies and procedures require that any non-audit service provided by a fund audit firm to a Fidelity fund and any non-audit service provided by a fund auditor to a Fund Service Provider that relates directly to the operations and financial reporting of a Fidelity fund (“Covered Service”) are subject to approval by the Audit Committee before such service is provided.
All Covered Services must be approved in advance of provision of the service either: (i) by formal resolution of the Audit Committee, or (ii) by oral or written approval of the service by the Chair of the Audit Committee (or if the Chair is unavailable, such other member of the Audit Committee as may be designated by the Chair to act in the Chair’s absence). The approval contemplated by (ii) above is permitted where the Treasurer determines that action on such an engagement is necessary before the next meeting of the Audit Committee.
Non-audit services provided by a fund audit firm to a Fund Service Provider that do not relate directly to the operations and financial reporting of a Fidelity fund are reported to the Audit Committee on a periodic basis.
Non-Audit Services Approved Pursuant to Rule 2-01(c)(7)(i)(C) and (ii) of Regulation S-X (“De Minimis Exception”)
There were no non-audit services approved or required to be approved by the Audit Committee pursuant to the De Minimis Exception during the Funds’ last two fiscal years relating to services provided to (i) the Funds or (ii) any Fund Service Provider that relate directly to the operations and financial reporting of the Funds.
Item 5.
Audit Committee of Listed Registrants
Not applicable.
Item 6.
Investments
(a)
Not applicable.
(b)
Not applicable
Item 7.
Disclosure of Proxy Voting Policies and Procedures for Closed-End Management Investment Companies
Not applicable.
Item 8.
Portfolio Managers of Closed-End Management Investment Companies
Not applicable.
Item 9.
Purchase of Equity Securities by Closed-End Management Investment Company and Affiliated Purchasers
Not applicable.
Item 10.
Submission of Matters to a Vote of Security Holders
There were no material changes to the procedures by which shareholders may recommend nominees to the trust’s Board of Trustees.
Item 11.
Controls and Procedures
(a)(i) The President and Treasurer and the Chief Financial Officer have concluded that the trust’s disclosure controls and procedures (as defined in Rule 30a-3(c) under the Investment Company Act) provide reasonable assurances that material information relating to the trust is made known to them by the appropriate persons, based on their evaluation of these controls and procedures as of a date within 90 days of the filing date of this report.
(a)(ii) There was no change in the trust’s internal control over financial reporting (as defined in Rule 30a-3(d) under the Investment Company Act) that occurred during the second fiscal quarter of the period covered by this report that has materially affected, or is reasonably likely to materially affect, the trust’s internal control over financial reporting.
Item 12.
Exhibits
| | |
(a) | (1) | Code of Ethics pursuant to Item 2 of Form N-CSR is filed and attached hereto as EX-99.CODE ETH. |
(a) | (2) | Certification pursuant to Rule 30a-2(a) under the Investment Company Act of 1940 (17 CFR 270.30a-2(a)) is filed and attached hereto as Exhibit 99.CERT. |
(a) | (3) | Not applicable. |
(b) | | Certification pursuant to Rule 30a-2(b) under the Investment Company Act of 1940 (17 CFR 270.30a-2(b)) is furnished and attached hereto as Exhibit 99.906CERT. |
SIGNATURES
Pursuant to the requirements of the Securities Exchange Act of 1934 and the Investment Company Act of 1940, the registrant has duly caused this report to be signed on its behalf by the undersigned, thereunto duly authorized.
Variable Insurance Products Fund IV
| |
By: | /s/ Adrien E. Deberghes |
| Adrien E. Deberghes |
| President and Treasurer |
| |
Date: | February 22, 2018 |
Pursuant to the requirements of the Securities Exchange Act of 1934 and the Investment Company Act of 1940, this report has been signed below by the following persons on behalf of the registrant and in the capacities and on the dates indicated.
| |
By: | /s/Adrien E. Deberghes |
| Adrien E. Deberghes |
| President and Treasurer |
| |
Date: | February 22, 2018 |
| |
By: | /s/Howard J. Galligan III |
| Howard J. Galligan III |
| Chief Financial Officer |
| |
Date: | February 22, 2018 |