UNITED STATES
SECURITIES AND EXCHANGE COMMISSION
Washington, D.C. 20549
FORM N-CSR
CERTIFIED SHAREHOLDER REPORT OF REGISTERED
MANAGEMENT INVESTMENT COMPANIES
Investment Company Act file number 811-3759
Variable Insurance Products Fund IV
(Exact name of registrant as specified in charter)
82 Devonshire St., Boston, Massachusetts 02109
(Address of principal executive offices) (Zip code)
Scott C. Goebel, Secretary
82 Devonshire St.
Boston, Massachusetts 02109
(Name and address of agent for service)
Registrant's telephone number, including area code: 617-563-7000
Date of fiscal year end: | December 31 |
| |
Date of reporting period: | December 31, 2011 |
Item 1. Reports to Stockholders
Fidelity® Variable Insurance Products:
Consumer Discretionary Portfolio
Annual Report
December 31, 2011
Contents
Performance | (Click Here) | How the fund has done over time. |
Management's Discussion of Fund Performance | (Click Here) | The Portfolio Manager's review of fundperformance and strategy. |
Shareholder Expense Example | (Click Here) | An example of shareholder expenses. |
Investment Changes | (Click Here) | A summary of major shifts in the fund's investments over the past six months. |
Investments | (Click Here) | A complete list of the fund's investments with their
market values. |
Financial Statements | (Click Here) | Statements of assets and liabilities, operations, and
changes in net assets, as well as financial highlights. |
Notes | (Click Here) | Notes to the financial statements. |
Report of Independent Registered Public Accounting Firm | (Click Here) | |
Trustees and Officers | (Click Here) | |
Distributions | (Click Here) | |
Board Approval of Investment Advisory Contracts and Management Fees | (Click Here) | |
To view a fund's proxy voting guidelines and proxy voting record for the 12-month period ended June 30, visit http://www.fidelity.com/proxyvotingresults or visit the Securities and Exchange Commission's (SEC) web site at http://www.sec.gov. You may also call 1-877-208-0098 to request a free copy of the proxy voting guidelines.
Fidelity Variable Insurance Products are separate account options which are purchased through a variable insurance contract.
Standard & Poor's, S&P and S&P 500 are registered service marks of The McGraw-Hill Companies, Inc. and have been licensed for use by Fidelity Distributors Corporation.
Other third party marks appearing herein are the property of their respective owners.
All other marks appearing herein are registered or unregistered trademarks or service marks of FMR LLC or an affiliated company.
This report and the financial statements contained herein are submitted for the general information of the shareholders of the fund. This report is not authorized for distribution to prospective investors in the fund unless preceded or accompanied by an effective prospectus.
A fund files its complete schedule of portfolio holdings with the SEC for the first and third quarters of each fiscal year on Form N-Q. Forms N-Q are available on the SEC's web site at http://www.sec.gov. A fund's Forms N-Q may be reviewed and copied at the SEC's Public Reference Room in Washington, DC. Information regarding the operation of the SEC's Public Reference Room may be obtained by calling 1-800-SEC-0330. For a complete list of a fund's portfolio holdings, view the most recent holdings listings, semiannual report, or annual report on Fidelity's web site at http://www.fidelity.com, http://www.advisor.fidelity.com, or http://www.401k.com, as applicable.
NOT FDIC INSURED • MAY LOSE VALUE • NO BANK GUARANTEE
Neither the fund nor Fidelity Distributors Corporation is a bank.
Annual Report
Average annual total return reflects the change in the value of an investment, assuming reinvestment of the class' distributions from dividend income and capital gains (the profits earned upon the sale of securities that have grown in value, if any) and assuming a constant rate of performance each year. During periods of reimbursement by Fidelity, a fund's total return will be greater than it would be had the reimbursement not occurred. Performance numbers are net of all underlying fund operating expenses, but do not include any insurance charges imposed by your insurance company's separate account. If performance information included the effect of these additional charges, the total returns would have been lower. How a fund did yesterday is no guarantee of how it will do tomorrow.
Average Annual Total Returns
Periods ended December 31, 2011 | Past 1
year | Past 5
years | Past 10
years |
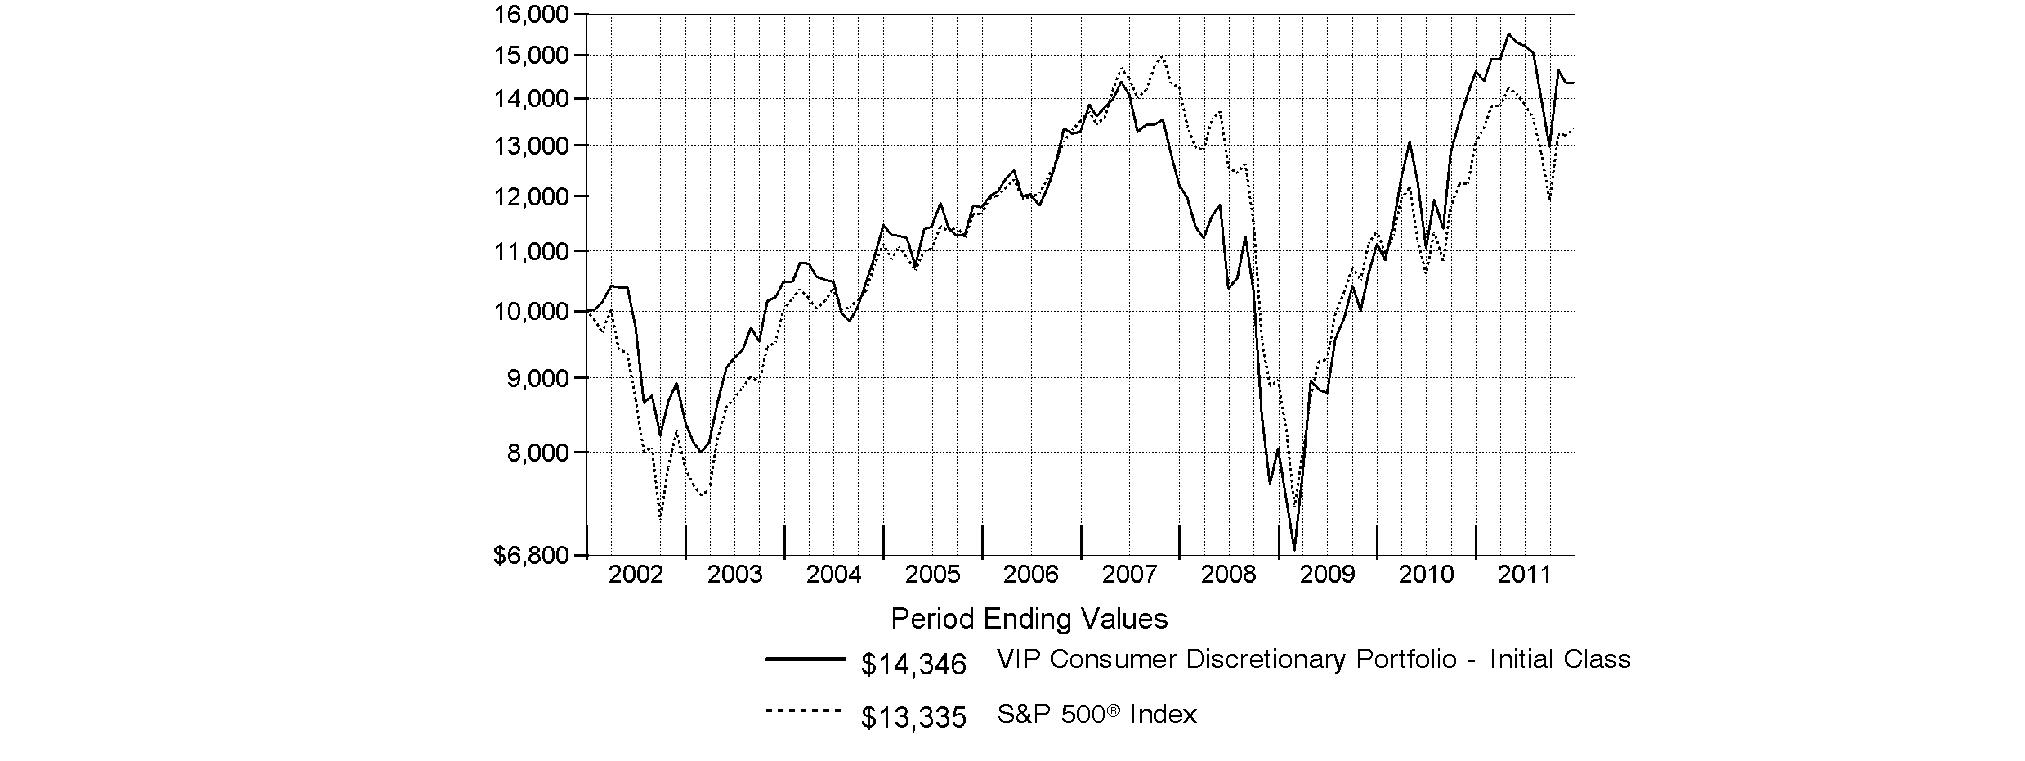
VIP Consumer Discretionary Portfolio - Initial Class B | -1.75% | 1.55% | 3.67% |
VIP Consumer Discretionary Portfolio - Investor Class A,B | -1.76% | 1.48% | 3.63% |
A The initial offering of Investor Class shares took place on July 21, 2005. Returns prior to July 21, 2005 are those of Initial Class. Had Investor Class's transfer agent fee been reflected, returns prior to July 21, 2005 would have been lower.
B Prior to October 1, 2006, VIP Consumer Discretionary Portfolio operated under certain different investment policies. The historical performance for the fund may not represent its current investment policies.
$10,000 Over 10 Years
Let's say hypothetically that $10,000 was invested in VIP Consumer Discretionary Portfolio - Initial Class on December 31, 2001. The chart shows how the value of your investment would have changed, and also shows how the S&P 500® Index performed over the same period.
Annual Report
Market Recap: Extreme market volatility took center stage during the 12 months ending December 31, 2011, stealing the spotlight from signs of progress in the global economy. Early in the year, aggressive monetary stimulus by the U.S. federal government, improving credit-market conditions and solid corporate earnings buoyed most major asset classes. As the period progressed, however, fresh worries about sovereign debt in Europe, inflation in China, gridlock over raising the debt ceiling in the U.S. - along with Standard & Poor's early-August downgrade of the nation's long-term sovereign credit rating - and a dimmed outlook for global growth punctured investor confidence and ignited market instability. Domestic equities, as measured by the broad-based S&P 500® Index, gained 2.11%, easily outpacing the 13.61% decline of MSCI® ACWI® (All Country World Index) ex USA Index, a proxy for foreign stocks. Within the MSCI index, emerging markets declined the most (-18%), with investments here generally held back by a stronger U.S. dollar. The U.K. (-3%) fared better than the rest of Europe (-15%), which was the second-worst-performing index component. Bolstered by periodic flights to quality, U.S. investment-grade bonds posted a 7.84% advance, as reflected by the Barclays Capital® U.S. Aggregate Bond Index, outperforming the 4.37% gain of high-yield securities, as represented by The BofA Merrill LynchSM US High Yield Constrained Index. Hampered by financial woes in Europe, the sovereign debt of major developed markets outside the U.S. rose 4.86%, according to the Citigroup® Non-USD Group-of-Seven (G7) Equal Weighted Index, while the JPMorgan Emerging Markets Bond Index Global (EMBI Global) advanced 8.46%, despite the currency head wind.
Comments from John Harris, Portfolio Manager of VIP Consumer Discretionary Portfolio: For the year ending December 31, 2011, the fund's share classes underperformed the 3.83% advance of the MSCI® U.S. IM Consumer Discretionary 25/50 Index and the S&P 500®. (For specific portfolio results, please refer to the performance section of this report.) A large part of the fund's underperformance was due to weak stock picking in restaurants, unfavorable positioning in specialized consumer services and poor choices in home improvement retail. Within restaurants, underweighting major index constituent and fast-food industry giant McDonald's and not owning Yum! Brands - which operates KFC, Pizza Hut and Taco Bell - and Chipotle Mexican Grill was costly. In specialized consumer services, we had disappointing results from holdings in Weight Watchers International and auction house Sotheby's. Weight Watchers' shares slumped later in the period on concerns about the costs associated with its plans for driving future growth, while Sotheby's fell on global economic concerns. Home improvement retail, including a stake in Lowe's Companies - one of the fund's largest positions, on average - dragged on relative performance as demand for new home construction and home improvement products remained muted. Elsewhere, office supply retailer OfficeMax was the fund's biggest individual relative detractor, with its stock price falling on failed turnaround initiatives. An overweighting in urban-oriented off-price retailer Citi Trends and a stake in slot machine manufacturer WMS Industries also hurt. The fund also had weak results in the hotels/resorts/cruise lines, movies/entertainment, distributors and cable/satellite areas. On the positive side, favorable positioning in automobile manufacturers boosted relative performance, including underweightings in benchmark heavyweights Ford Motor and General Motors, which underperformed along with the auto industry overall. Within specialty stores, overweighting Tractor Supply and underweighting office supply superstore operator Staples buoyed performance. The fund also benefited from an overweighting in off-price apparel retailer TJX, a leader in its category. Lastly, the fund had nice results from a favorable underweighting in auto parts/equipment, a small cash position and good stock picking in Internet software/services, an out-of-index industry, and home furnishings. I sold a number of the stocks I've discussed here prior to period end.
The views expressed above reflect those of the portfolio manager(s) only through the end of the period as stated on the cover of this report and do not necessarily represent the views of Fidelity or any other person in the Fidelity organization. Any such views are subject to change at any time based upon market or other conditions and Fidelity disclaims any responsibility to update such views. These views may not be relied on as investment advice and, because investment decisions for a Fidelity fund are based on numerous factors, may not be relied on as an indication of trading intent on behalf of any Fidelity fund.
Annual Report
As a shareholder of the Fund, you incur two types of costs: (1) transaction costs, including redemption fees, and (2) ongoing costs, including management fees and other Fund expenses. This Example is intended to help you understand your ongoing costs (in dollars) of investing in the Fund and to compare these costs with the ongoing costs of investing in other mutual funds.
The Example is based on an investment of $1,000 invested at the beginning of the period and held for the entire period (July 1, 2011 to December 31, 2011).
Actual Expenses
The first line of the accompanying table for each class of the Fund provides information about actual account values and actual expenses. You may use the information in this line, together with the amount you invested, to estimate the expenses that you paid over the period. Simply divide your account value by $1,000.00 (for example, an $8,600 account value divided by $1,000.00 = 8.6), then multiply the result by the number in the first line for a class of the Fund under the heading entitled "Expenses Paid During Period" to estimate the expenses you paid on your account during this period. The estimate of expenses does not include any fees or other expenses of any variable annuity or variable life insurance product. If they were, the estimate of expenses you paid during the period would be higher, and your ending account value would be lower. In addition, the Fund, as a shareholder in the underlying Fidelity Central Funds, will indirectly bear its pro-rata share of the fees and expenses incurred by the underlying Fidelity Central Funds. These fees and expenses are not included in the Fund's annualized expense ratio used to calculate the expense estimate in the table below.
Hypothetical Example for Comparison Purposes
The second line of the accompanying table for each class of the Fund provides information about hypothetical account values and hypothetical expenses based on a Class' actual expense ratio and an assumed rate of return of 5% per year before expenses, which is not the Class' actual return. The hypothetical account values and expenses may not be used to estimate the actual ending account balance or expenses you paid for the period. You may use this information to compare the ongoing costs of investing in the Fund and other funds. To do so, compare this 5% hypothetical example with the 5% hypothetical examples that appear in the shareholder reports of the other funds. The estimate of expenses does not include any fees or other expenses of any variable annuity or variable life insurance product. If they were, the estimate of expenses you paid during the period would be higher, and your ending account value would be lower. In addition, the Fund, as a shareholder in the underlying Fidelity Central Funds, will indirectly bear its pro-rata share of the fees and expenses incurred by the underlying Fidelity Central Funds. These fees and expenses are not included in the Fund's annualized expense ratio used to calculate the expense estimate in the table below.
Please note that the expenses shown in the table are meant to highlight your ongoing costs only and do not reflect any transaction costs. Therefore, the second line of the table is useful in comparing ongoing costs only, and will not help you determine the relative total costs of owning different funds. In addition, if these transactional costs were included, your costs would have been higher.
| Annualized Expense Ratio | Beginning
Account Value
July 1, 2011 | Ending
Account Value
December 31, 2011 | Expenses Paid
During Period*
July 1, 2011 to
December 31, 2011 |
Initial Class | 1.00% | | | |
Actual | | $ 1,000.00 | $ 943.50 | $ 4.90 |
HypotheticalA | | $ 1,000.00 | $ 1,020.16 | $ 5.09 |
Investor Class | 1.07% | | | |
Actual | | $ 1,000.00 | $ 943.30 | $ 5.24 |
HypotheticalA | | $ 1,000.00 | $ 1,019.81 | $ 5.45 |
A 5% return per year before expenses
* Expenses are equal to each Class' annualized expense ratio, multiplied by the average account value over the period, multiplied by 184/365 (to reflect the one-half year period).
Annual Report
Investment Changes (Unaudited)
Top Ten Stocks as of December 31, 2011 |
| % of fund's
net assets | % of fund's net assets
6 months ago |
McDonald's Corp. | 6.7 | 4.8 |
The Walt Disney Co. | 6.3 | 3.8 |
Amazon.com, Inc. | 5.4 | 5.2 |
Time Warner, Inc. | 4.3 | 3.3 |
Home Depot, Inc. | 4.3 | 0.0 |
Comcast Corp. Class A | 4.0 | 0.0 |
Lowe's Companies, Inc. | 3.8 | 5.6 |
Starbucks Corp. | 3.7 | 2.5 |
Target Corp. | 3.5 | 3.8 |
Bed Bath & Beyond, Inc. | 3.2 | 2.6 |
| 45.2 | |
Top Industries (% of fund's net assets) |
As of December 31, 2011 |
 | Specialty Retail | 25.9% | |
 | Media | 22.4% | |
 | Hotels, Restaurants & Leisure | 19.8% | |
 | Textiles, Apparel & Luxury Goods | 7.5% | |
 | Internet & Catalog Retail | 6.1% | |
 | All Others* | 18.3% | |

As of June 30, 2011 |
 | Specialty Retail | 22.7% | |
 | Media | 22.7% | |
 | Hotels, Restaurants & Leisure | 21.1% | |
 | Internet & Catalog Retail | 8.2% | |
 | Multiline Retail | 5.2% | |
 | All Others* | 20.1% | |

* Includes short-term investments and net other assets. |
Annual Report
Investments December 31, 2011
Showing Percentage of Net Assets
Common Stocks - 99.6% |
| Shares | | Value |
AUTO COMPONENTS - 1.5% |
Auto Parts & Equipment - 1.5% |
Gentex Corp. | 11,200 | | $ 331,408 |
AUTOMOBILES - 3.8% |
Automobile Manufacturers - 3.8% |
Bayerische Motoren Werke AG (BMW) | 3,278 | | 219,620 |
Ford Motor Co. | 57,840 | | 622,358 |
| | 841,978 |
DIVERSIFIED CONSUMER SERVICES - 3.0% |
Education Services - 1.0% |
Apollo Group, Inc. Class A (non-vtg.) (a) | 4,101 | | 220,921 |
Specialized Consumer Services - 2.0% |
Sotheby's Class A (Ltd. vtg.) | 6,180 | | 176,315 |
Steiner Leisure Ltd. (a) | 1,021 | | 46,343 |
Weight Watchers International, Inc. | 3,995 | | 219,765 |
| | 442,423 |
TOTAL DIVERSIFIED CONSUMER SERVICES | | 663,344 |
HOTELS, RESTAURANTS & LEISURE - 19.8% |
Casinos & Gaming - 3.2% |
Las Vegas Sands Corp. (a) | 11,350 | | 484,986 |
Las Vegas Sands Corp. warrants 11/16/13 (a) | 373 | | 228,897 |
| | 713,883 |
Hotels, Resorts & Cruise Lines - 0.7% |
Royal Caribbean Cruises Ltd. | 5,700 | | 141,189 |
Restaurants - 15.9% |
Arcos Dorados Holdings, Inc. | 3,400 | | 69,802 |
BJ's Restaurants, Inc. (a) | 3,716 | | 168,409 |
Bravo Brio Restaurant Group, Inc. (a) | 3,800 | | 65,170 |
Darden Restaurants, Inc. | 5,627 | | 256,479 |
Dunkin' Brands Group, Inc. (a) | 4,500 | | 112,410 |
McDonald's Corp. | 14,747 | | 1,479,563 |
Ruth's Hospitality Group, Inc. (a) | 35,463 | | 176,251 |
Starbucks Corp. | 17,612 | | 810,328 |
Texas Roadhouse, Inc. Class A | 25,595 | | 381,366 |
| | 3,519,778 |
TOTAL HOTELS, RESTAURANTS & LEISURE | | 4,374,850 |
HOUSEHOLD DURABLES - 1.9% |
Home Furnishings - 0.9% |
Tempur-Pedic International, Inc. (a) | 4,000 | | 210,120 |
Homebuilding - 1.0% |
Lennar Corp. Class A (d) | 11,000 | | 216,150 |
TOTAL HOUSEHOLD DURABLES | | 426,270 |
|
| Shares | | Value |
INTERNET & CATALOG RETAIL - 6.1% |
Internet Retail - 6.1% |
Amazon.com, Inc. (a) | 6,936 | | $ 1,200,622 |
Groupon, Inc. Class A (a)(d) | 7,100 | | 146,473 |
| | 1,347,095 |
INTERNET SOFTWARE & SERVICES - 1.3% |
Internet Software & Services - 1.3% |
Bankrate, Inc. | 2,500 | | 53,750 |
Google, Inc. Class A (a) | 356 | | 229,940 |
| | 283,690 |
LEISURE EQUIPMENT & PRODUCTS - 0.8% |
Leisure Products - 0.8% |
Hasbro, Inc. | 5,685 | | 181,295 |
MEDIA - 22.4% |
Broadcasting - 4.1% |
CBS Corp. Class B | 18,700 | | 507,518 |
Discovery Communications, Inc. (a) | 4,300 | | 176,171 |
Liberty Media Corp. Capital Series A (a) | 2,938 | | 229,311 |
| | 913,000 |
Cable & Satellite - 7.7% |
Comcast Corp. Class A | 37,436 | | 887,608 |
DIRECTV (a) | 7,627 | | 326,131 |
Sirius XM Radio, Inc. (a)(d) | 174,916 | | 318,347 |
Time Warner Cable, Inc. | 2,542 | | 161,595 |
| | 1,693,681 |
Movies & Entertainment - 10.6% |
The Walt Disney Co. | 36,871 | | 1,382,663 |
Time Warner, Inc. | 26,605 | | 961,505 |
| | 2,344,168 |
TOTAL MEDIA | | 4,950,849 |
MULTILINE RETAIL - 5.2% |
General Merchandise Stores - 5.2% |
Dollar Tree, Inc. (a) | 4,543 | | 377,569 |
Target Corp. | 15,025 | | 769,581 |
| | 1,147,150 |
SOFTWARE - 0.4% |
Home Entertainment Software - 0.4% |
Take-Two Interactive Software, Inc. (a) | 3,600 | | 48,780 |
Zynga, Inc. | 4,600 | | 43,286 |
| | 92,066 |
SPECIALTY RETAIL - 25.9% |
Apparel Retail - 6.4% |
Body Central Corp. (a) | 2,500 | | 62,400 |
Express, Inc. | 6,200 | | 123,628 |
Foot Locker, Inc. | 6,500 | | 154,960 |
Inditex SA | 600 | | 49,146 |
Common Stocks - continued |
| Shares | | Value |
SPECIALTY RETAIL - CONTINUED |
Apparel Retail - continued |
Limited Brands, Inc. | 10,433 | | $ 420,972 |
TJX Companies, Inc. | 9,508 | | 613,741 |
| | 1,424,847 |
Automotive Retail - 3.6% |
Advance Auto Parts, Inc. | 8,170 | | 568,877 |
AutoZone, Inc. (a) | 680 | | 220,980 |
| | 789,857 |
Computer & Electronics Retail - 1.1% |
Best Buy Co., Inc. | 10,240 | | 239,309 |
Home Improvement Retail - 8.7% |
Home Depot, Inc. | 22,400 | | 941,696 |
Lowe's Companies, Inc. | 33,309 | | 845,382 |
Lumber Liquidators Holdings, Inc. (a)(d) | 7,700 | | 135,982 |
| | 1,923,060 |
Homefurnishing Retail - 3.5% |
Bed Bath & Beyond, Inc. (a) | 12,400 | | 718,828 |
Mattress Firm Holding Corp. | 2,700 | | 62,613 |
| | 781,441 |
Specialty Stores - 2.6% |
Tiffany & Co., Inc. | 3,325 | | 220,315 |
Tractor Supply Co. | 3,058 | | 214,519 |
Ulta Salon, Cosmetics & Fragrance, Inc. (a) | 2,300 | | 149,316 |
| | 584,150 |
TOTAL SPECIALTY RETAIL | | 5,742,664 |
TEXTILES, APPAREL & LUXURY GOODS - 7.5% |
Apparel, Accessories & Luxury Goods - 4.4% |
Michael Kors Holdings Ltd. | 1,800 | | 49,050 |
PVH Corp. | 3,783 | | 266,664 |
Ralph Lauren Corp. | 1,600 | | 220,928 |
|
| Shares | | Value |
Vera Bradley, Inc. (a)(d) | 4,100 | | $ 132,225 |
VF Corp. | 2,460 | | 312,395 |
| | 981,262 |
Footwear - 3.1% |
NIKE, Inc. Class B | 7,004 | | 674,975 |
TOTAL TEXTILES, APPAREL & LUXURY GOODS | | 1,656,237 |
TOTAL COMMON STOCKS (Cost $19,969,500) | 22,038,896 |
Money Market Funds - 11.3% |
| | | |
Fidelity Cash Central Fund, 0.11% (b) | 1,928,825 | | 1,928,825 |
Fidelity Securities Lending Cash Central Fund, 0.13% (b)(c) | 566,926 | | 566,926 |
TOTAL MONEY MARKET FUNDS (Cost $2,495,751) | 2,495,751 |
TOTAL INVESTMENT PORTFOLIO - 110.9% (Cost $22,465,251) | 24,534,647 |
NET OTHER ASSETS (LIABILITIES) - (10.9)% | (2,418,635) |
NET ASSETS - 100% | $ 22,116,012 |
Legend |
(a) Non-income producing |
(b) Affiliated fund that is available only to investment companies and other accounts managed by Fidelity Investments. The rate quoted is the annualized seven-day yield of the fund at period end. A complete unaudited listing of the fund's holdings as of its most recent quarter end is available upon request. In addition, each Fidelity Central Fund's financial statements, which are not covered by the Fund's Report of Independent Registered Public Accounting Firm, are available on the SEC's website or upon request. |
(c) Investment made with cash collateral received from securities on loan. |
(d) Security or a portion of the security is on loan at period end. |
Affiliated Central Funds |
Information regarding fiscal year to date income earned by the Fund from investments in Fidelity Central Funds is as follows: |
Fund | Income earned |
Fidelity Cash Central Fund | $ 235 |
Fidelity Securities Lending Cash Central Fund | 8,852 |
Total | $ 9,087 |
Other Information |
The following is a summary of the inputs used, as of December 31, 2011, involving the Fund's assets and liabilities carried at fair value. The inputs or methodology used for valuing securities may not be an indication of the risk associated with investing in those securities. For more information on valuation inputs, and their aggregation into the levels used in the table below, please refer to the Security Valuation section in the accompanying Notes to Financial Statements. |
Valuation Inputs at Reporting Date: |
Description | Total | Level 1 | Level 2 | Level 3 |
Investments in Securities: | | | | |
Common Stocks | $ 22,038,896 | $ 21,809,999 | $ 228,897 | $ - |
Money Market Funds | 2,495,751 | 2,495,751 | - | - |
Total Investments in Securities: | $ 24,534,647 | $ 24,305,750 | $ 228,897 | $ - |
See accompanying notes which are an integral part of the financial statements.
Annual Report
Statement of Assets and Liabilities
| December 31, 2011 |
| | |
Assets | | |
Investment in securities, at value (including securities loaned of $542,737) - See accompanying schedule: Unaffiliated issuers (cost $19,969,500) | $ 22,038,896 | |
Fidelity Central Funds (cost $2,495,751) | 2,495,751 | |
Total Investments (cost $22,465,251) | | $ 24,534,647 |
Foreign currency held at value (cost $21,553) | | 21,553 |
Receivable for investments sold | | 119,608 |
Receivable for fund shares sold | | 23,299 |
Dividends receivable | | 34,945 |
Distributions receivable from Fidelity Central Funds | | 5,420 |
Prepaid expenses | | 79 |
Other receivables | | 418 |
Total assets | | 24,739,969 |
| | |
Liabilities | | |
Payable for investments purchased | $ 1,687,995 | |
Payable for fund shares redeemed | 321,890 | |
Accrued management fee | 10,153 | |
Other affiliated payables | 2,879 | |
Other payables and accrued expenses | 34,114 | |
Collateral on securities loaned, at value | 566,926 | |
Total liabilities | | 2,623,957 |
| | |
Net Assets | | $ 22,116,012 |
Net Assets consist of: | | |
Paid in capital | | $ 20,064,147 |
Accumulated undistributed net realized gain (loss) on investments and foreign currency transactions | | (17,442) |
Net unrealized appreciation (depreciation) on investments and assets and liabilities in foreign currencies | | 2,069,307 |
Net Assets | | $ 22,116,012 |
Statement of Assets and Liabilities - continued
| December 31, 2011 |
Initial Class:
Net Asset Value, offering price and redemption price per share ($7,461,681 ÷ 608,447 shares) | | $ 12.26 |
| | |
Investor Class:
Net Asset Value, offering price and redemption price per share ($14,654,331 ÷ 1,196,502 shares) | | $ 12.25 |
See accompanying notes which are an integral part of the financial statements.
Annual Report
Statement of Operations
| Year ended December 31, 2011 |
Investment Income | | |
Dividends | | $ 394,342 |
Income from Fidelity Central Funds | | 9,087 |
Total income | | 403,429 |
| | |
Expenses | | |
Management fee | $ 155,970 | |
Transfer agent fees | 40,606 | |
Accounting and security lending fees | 10,971 | |
Custodian fees and expenses | 23,765 | |
Independent trustees' compensation | 162 | |
Audit | 51,083 | |
Legal | 105 | |
Miscellaneous | 223 | |
Total expenses before reductions | 282,885 | |
Expense reductions | (4,270) | 278,615 |
Net investment income (loss) | | 124,814 |
Realized and Unrealized Gain (Loss) Net realized gain (loss) on: | | |
Investment securities: | | |
Unaffiliated issuers (net of foreign taxes of $5,044) | 1,414,828 | |
Foreign currency transactions | (7,237) | |
Total net realized gain (loss) | | 1,407,591 |
Change in net unrealized appreciation (depreciation) on: Investment securities (net of decrease in deferred foreign taxes of $2,466) | (1,983,674) | |
Assets and liabilities in foreign currencies | (220) | |
Total change in net unrealized appreciation (depreciation) | | (1,983,894) |
Net gain (loss) | | (576,303) |
Net increase (decrease) in net assets resulting from operations | | $ (451,489) |
Statement of Changes in Net Assets
| Year ended December 31, 2011 | Year ended December 31, 2010 |
Increase (Decrease) in Net Assets | | |
Operations | | |
Net investment income (loss) | $ 124,814 | $ 34,434 |
Net realized gain (loss) | 1,407,591 | 809,414 |
Change in net unrealized appreciation (depreciation) | (1,983,894) | 3,250,944 |
Net increase (decrease) in net assets resulting
from operations | (451,489) | 4,094,792 |
Distributions to shareholders from net investment income | (124,634) | (46,369) |
Share transactions - net increase (decrease) | (19,724,346) | 29,996,122 |
Redemption fees | 22,370 | 27,571 |
Total increase (decrease) in net assets | (20,278,099) | 34,072,116 |
| | |
Net Assets | | |
Beginning of period | 42,394,111 | 8,321,995 |
End of period | $ 22,116,012 | $ 42,394,111 |
See accompanying notes which are an integral part of the financial statements.
Annual Report
Financial Highlights - Initial Class
Years ended December 31, | 2011 | 2010 | 2009 | 2008 | 2007 |
Selected Per-Share Data | | | | | |
Net asset value, beginning of period | $ 12.56 | $ 9.58 | $ 6.96 | $ 10.72 | $ 12.84 |
Income from Investment Operations | | | | | |
Net investment income (loss) C | .06 | .02 | .04 | .04 | (.01) |
Net realized and unrealized gain (loss) | (.29) | 2.96 | 2.62 | (3.68) | (1.02) |
Total from investment operations | (.23) | 2.98 | 2.66 | (3.64) | (1.03) |
Distributions from net investment income | (.08) | (.02) | (.05) | (.05) | (.02) |
Distributions from net realized gain | - | - | - | (.09) | (1.08) |
Total distributions | (.08) | (.02) | (.05) | (.13) G | (1.10) |
Redemption fees added to paid in capital C | .01 | .02 | .01 | .01 | .01 |
Net asset value, end of period | $ 12.26 | $ 12.56 | $ 9.58 | $ 6.96 | $ 10.72 |
Total Return A,B | (1.75)% | 31.29% | 38.32% | (34.10)% | (8.14)% |
Ratios to Average Net Assets D,F | | | | | |
Expenses before reductions | .97% | 1.08% | 1.43% | 1.40% | 1.10% |
Expenses net of fee waivers, if any | .97% | 1.00% | 1.00% | 1.00% | 1.01% |
Expenses net of all reductions | .96% | .98% | .99% | 1.00% | 1.01% |
Net investment income (loss) | .49% | .23% | .57% | .48% | (.07)% |
Supplemental Data | | | | | |
Net assets, end of period (000 omitted) | $ 7,462 | $ 18,113 | $ 4,098 | $ 3,212 | $ 6,989 |
Portfolio turnover rate E | 182% | 191% | 166% | 81% | 114% |
A Total returns do not reflect charges attributable to your insurance company's separate account. Inclusion of these charges would reduce the total returns shown.
B Total returns would have been lower if certain expenses had not been reduced during the applicable periods shown.
C Calculated based on average shares outstanding during the period.
D Fees and expenses of any underlying Fidelity Central Funds are not included in the Fund's expense ratio. The Fund indirectly bears its proportionate share of the expenses of any underlying Fidelity Central Funds.
E Amount does not include the portfolio activity of any underlying Fidelity Central Funds.
F Expense ratios reflect operating expenses of the class. Expenses before reductions do not reflect amounts reimbursed by the investment adviser or reductions from brokerage service arrangements or reductions from other expense offset arrangements and do not represent the amount paid by the class during periods when reimbursements or reductions occur. Expenses net of fee waivers reflect expenses after reimbursement by the investment adviser but prior to reductions from brokerage service arrangements or other expense offset arrangements. Expenses net of all reductions represent the net expenses paid by the class.
G Total distributions of $.13 per share is comprised of distributions from net investment income of $.046 and distributions from net realized gain of $.085 per share.
Financial Highlights - Investor Class
Years ended December 31, | 2011 | 2010 | 2009 | 2008 | 2007 |
Selected Per-Share Data | | | | | |
Net asset value, beginning of period | $ 12.54 | $ 9.57 | $ 6.96 | $ 10.72 | $ 12.83 |
Income from Investment Operations | | | | | |
Net investment income (loss) C | .05 | .02 | .04 | .04 | (.03) |
Net realized and unrealized gain (loss) | (.28) | 2.94 | 2.61 | (3.68) | (1.02) |
Total from investment operations | (.23) | 2.96 | 2.65 | (3.64) | (1.05) |
Distributions from net investment income | (.07) | (.01) | (.05) | (.05) | (.02) |
Distributions from net realized gain | - | - | - | (.09) | (1.05) |
Total distributions | (.07) | (.01) | (.05) | (.13) G | (1.07) |
Redemption fees added to paid in capital C | .01 | .02 | .01 | .01 | .01 |
Net asset value, end of period | $ 12.25 | $ 12.54 | $ 9.57 | $ 6.96 | $ 10.72 |
Total Return A,B | (1.76)% | 31.16% | 38.17% | (34.10)% | (8.29)% |
Ratios to Average Net Assets D,F | | | | | |
Expenses before reductions | 1.04% | 1.14% | 1.51% | 1.54% | 1.24% |
Expenses net of fee waivers, if any | 1.04% | 1.08% | 1.08% | 1.09% | 1.15% |
Expenses net of all reductions | 1.03% | 1.06% | 1.08% | 1.09% | 1.15% |
Net investment income (loss) | .42% | .15% | .48% | .39% | (.21)% |
Supplemental Data | | | | | |
Net assets, end of period (000 omitted) | $ 14,654 | $ 24,281 | $ 4,224 | $ 1,313 | $ 2,352 |
Portfolio turnover rate E | 182% | 191% | 166% | 81% | 114% |
A Total returns do not reflect charges attributable to your insurance company's separate account. Inclusion of these charges would reduce the total returns shown.
B Total returns would have been lower if certain expenses had not been reduced during the applicable periods shown.
C Calculated based on average shares outstanding during the period.
D Fees and expenses of any underlying Fidelity Central Funds are not included in the Fund's expense ratio. The Fund indirectly bears its proportionate share of the expenses of any underlying Fidelity Central Funds.
E Amount does not include the portfolio activity of any underlying Fidelity Central Funds.
F Expense ratios reflect operating expenses of the class. Expenses before reductions do not reflect amounts reimbursed by the investment adviser or reductions from brokerage service arrangements or reductions from other expense offset arrangements and do not represent the amount paid by the class during periods when reimbursements or reductions occur. Expense ratios before reductions for start-up periods may not be representative of longer-term operating periods. Expenses net of fee waivers reflect expenses after reimbursement by the investment adviser but prior to reductions from brokerage service arrangements or other expense offset arrangements. Expenses net of all reductions represent the net expenses paid by the class.
G Total distributions of $.13 per share is comprised of distributions from net investment income of $.046 and distributions from net realized gain of $.085 per share.
See accompanying notes which are an integral part of the financial statements.
Annual Report
Notes to Financial Statements
For the period ended December 31, 2011
1. Organization.
VIP Consumer Discretionary Portfolio (the Fund) is a non-diversified fund of Variable Insurance Products Fund IV (the Trust) and is authorized to issue an unlimited number of shares. The Trust is registered under the Investment Company Act of 1940, as amended (the 1940 Act), as an open-end management investment company organized as a Massachusetts business trust. Shares of the Fund may only be purchased by insurance companies for the purpose of funding variable annuity or variable life insurance contracts. The Fund offers the following classes of shares: Initial Class shares and Investor Class shares. All classes have equal rights and voting privileges, except for matters affecting a single class. Investment income, realized and unrealized capital gains and losses, the common expenses of the Fund, and certain fund-level expense reductions, if any, are allocated on a pro-rata basis to each class based on the relative net assets of each class to the total net assets of the Fund. Each class differs with respect to transfer agent fees incurred. Certain expense reductions may also differ by class.
2. Investments in Fidelity Central Funds.
The Fund invests in Fidelity Central Funds, which are open-end investment companies available only to other investment companies and accounts managed by Fidelity Management & Research Company (FMR) and its affiliates. The Fund's Schedule of Investments lists each of the Fidelity Central Funds held as of period end, if any, as an investment of the Fund, but do not include the underlying holdings of each Fidelity Central Fund. As an Investing Fund, the Fund indirectly bears its proportionate share of the expenses of the underlying Fidelity Central Funds.
The Money Market Central Funds seek preservation of capital and current income and are managed by Fidelity Investments Money Management, Inc. (FIMM), an affiliate of FMR.
A complete unaudited list of holdings for each Fidelity Central Fund is available upon request or at the Securities and Exchange Commission (the SEC) web site at www.sec.gov. In addition, the financial statements of the Fidelity Central Funds, which are not covered by the Fund's Report of Independent Registered Public Accounting Firm are available on the SEC web site or upon request.
3. Significant Accounting Policies.
The financial statements have been prepared in conformity with accounting principles generally accepted in the United States of America (GAAP), which require management to make certain estimates and assumptions at the date of the financial statements. Actual results could differ from those estimates. Subsequent events, if any, through the date that the financial statements were issued have been evaluated in the preparation of the financial statements. The following summarizes the significant accounting policies of the Fund:
Security Valuation. Investments are valued as of 4:00 p.m. Eastern time on the last calendar day of the period. The Fund uses independent pricing services approved by the Board of Trustees to value its investments. When current market prices or quotations are not readily available or reliable, valuations may be determined in good faith in accordance with procedures adopted by the Board of Trustees. Factors used in determining value may include market or security specific events. The frequency with which these procedures are used cannot be predicted and they may be utilized to a significant extent. The value used for net asset value (NAV) calculation under these procedures may differ from published prices for the same securities.
The Fund categorizes the inputs to valuation techniques used to value its investments into a disclosure hierarchy consisting of three levels as shown below:
Level 1 - quoted prices in active markets for identical investments
Level 2 - other significant observable inputs (including quoted prices for similar investments, interest rates, prepayment speeds, etc.)
Level 3 - unobservable inputs (including the Fund's own assumptions based on the best information available)
Changes in valuation techniques may result in transfers in or out of an assigned level within the disclosure hierarchy. The aggregate value of investments by input level, as of December 31, 2011, is included at the end of the Fund's Schedule of Investments. Valuation techniques used to value the Fund's investments by major category are as follows:
Equity securities, including restricted securities, for which market quotations are readily available, are valued at the last reported sale price or official closing price as reported by an independent pricing service on the primary market or exchange on which they are traded and are categorized as Level 1 in the hierarchy. In the event there were no sales during the day or closing prices are not available, securities are valued at the last quoted bid price or may be valued using the last available price and are generally categorized as Level 2 in the hierarchy. For foreign equity securities, when significant market or security specific events arise, comparisons to the valuation of American Depositary Receipts (ADRs), futures contracts, Exchange-traded funds (ETFs) and certain indexes as well as quoted prices for similar securities are used and are categorized as Level 2 in the hierarchy in these circumstances. Utilizing these techniques may result in transfers between Level 1 and Level 2. For restricted equity securities and private placements where observable inputs are limited, assumptions about market activity and risk are used and are categorized as Level 3 in the hierarchy.
Investments in open-end mutual funds, including the Fidelity Central Funds, are valued at their closing net asset value each business day and are categorized as Level 1 in the hierarchy.
Annual Report
Notes to Financial Statements - continued
3. Significant Accounting Policies - continued
New Accounting Pronouncements. In May 2011, the Financial Accounting Standards Board issued Accounting Standard Update No. 2011-04, Fair Value Measurement (Topic 820) - Amendments to Achieve Common Fair Value Measurement and Disclosure Requirements in U.S. GAAP and IFRSs. The update is effective during interim and annual periods beginning after December 15, 2011 and will result in additional disclosure for transfers between levels as well as expanded disclosure for securities categorized as Level 3 under the fair value hierarchy.
In December 2011, the Financial Accounting Standards Board issued Accounting Standard Update No. 2011-11, Disclosures about Offsetting Assets and Liabilities. The update creates new disclosure requirements requiring entities to disclose both gross and net information for derivatives and other financial instruments that are either offset in the Statement of Assets and Liabilities or subject to an enforceable master netting arrangement or similar agreement. The disclosure requirements are effective for annual reporting periods beginning on or after January 1, 2013. Management is currently evaluating the impact of the update's adoption on the Fund's financial statement disclosures.
Foreign Currency. The Fund may use foreign currency contracts to facilitate transactions in foreign-denominated securities. Gains and losses from these transactions may arise from changes in the value of the foreign currency or if the counterparties do not perform under the contracts' terms.
Foreign-denominated assets, including investment securities, and liabilities are translated into U.S. dollars at the exchange rate at period end. Purchases and sales of investment securities, income and dividends received and expenses denominated in foreign currencies are translated into U.S. dollars at the exchange rate in effect on the transaction date.
The effects of exchange rate fluctuations on investments are included with the net realized and unrealized gain (loss) on investment securities. Other foreign currency transactions resulting in realized and unrealized gain (loss) are disclosed separately.
Investment Transactions and Income. For financial reporting purposes, the Fund's investment holdings and NAV include trades executed through the end of the last business day of the period. The NAV per share for processing shareholder transactions is calculated as of the close of business of the New York Stock Exchange (NYSE), normally 4:00 p.m. Eastern time and includes trades executed through the end of the prior business day. Gains and losses on securities sold are determined on the basis of identified cost and may include proceeds received from litigation. Dividend income is recorded on the ex-dividend date, except for certain dividends from foreign securities where the ex-dividend date may have passed, which are recorded as soon as the Fund is informed of the ex-dividend date. Non-cash dividends included in dividend income, if any, are recorded at the fair market value of the securities received. Distributions received on securities that represent a return of capital or capital gain are recorded as a reduction of cost of investments and/or as a realized gain. The Fund estimates the components of distributions received that may be considered return of capital distributions or capital gain distributions. Interest income and distributions from the Fidelity Central Funds are accrued as earned. Interest income includes coupon interest and amortization of premium and accretion of discount on debt securities. Investment income is recorded net of foreign taxes withheld where recovery of such taxes is uncertain.
Expenses. Expenses directly attributable to a fund are charged to that fund. Expenses attributable to more than one fund are allocated among the respective funds on the basis of relative net assets or other appropriate methods. Expense estimates are accrued in the period to which they relate and adjustments are made when actual amounts are known.
Income Tax Information and Distributions to Shareholders. Each year, the Fund intends to qualify as a regulated investment company, including distributing substantially all of its taxable income and realized gains under Subchapter M of the Internal Revenue Code. As a result, no provision for income taxes is required. As of December 31, 2011, the Fund did not have any unrecognized tax benefits in the financial statements; nor is the Fund aware of any tax positions for which it is reasonably possible that the total amounts of unrecognized tax benefits will significantly change in the next twelve months. The Fund files a U.S. federal tax return, in addition to state and local tax returns as required. A fund's tax returns are subject to examination by the Internal Revenue Service (IRS) for a period of three fiscal years. State and local tax returns may be subject to examination for an additional fiscal year depending on the jurisdiction. Foreign taxes are provided for based on the Fund's understanding of the tax rules and rates that exist in the foreign markets in which it invests.
Distributions are declared and recorded on the ex-dividend date. Income dividends and capital gain distributions are declared separately for each class. Income and capital gain distributions are determined in accordance with income tax regulations, which may differ from GAAP.
Capital accounts within the financial statements are adjusted for permanent book-tax differences. These adjustments have no impact on net assets or the results of operations. Temporary book-tax differences will reverse in a subsequent period.
Book-tax differences are primarily due to foreign currency transactions, certain foreign taxes, capital loss carryforwards, and losses deferred due to wash sales.
Annual Report
3. Significant Accounting Policies - continued
Income Tax Information and Distributions to Shareholders - continued
The federal tax cost of investment securities and unrealized appreciation (depreciation) as of period end were as follows:
Gross unrealized appreciation | $ 2,837,778 |
Gross unrealized depreciation | (1,095,624) |
Net unrealized appreciation (depreciation) on securities and other investments | $ 1,742,154 |
| |
Tax Cost | $ 22,792,493 |
The tax-based components of distributable earnings as of period end were as follows:
Undistributed long-term capital gain | $ 309,800 |
Net unrealized appreciation (depreciation) | $ 1,742,065 |
The tax character of distributions paid was as follows:
| December 31, 2011 | December 31, 2010 |
Ordinary Income | $ 124,634 | $ 46,369 |
Trading (Redemption) Fees. Initial Class shares and Investor Class shares held by investors less than 60 days are subject to a redemption fee equal to 1% of the net asset value of shares redeemed. All redemption fees, which reduce the proceeds of the shareholder redemption, are retained by the Fund and accounted for as an addition to paid in capital.
4. Purchases and Sales of Investments.
Purchases and sales of securities, other than short-term securities, aggregated $51,400,365 and $70,932,582, respectively.
5. Fees and Other Transactions with Affiliates.
Management Fee. FMR and its affiliates provide the Fund with investment management related services for which the Fund pays a monthly management fee. The management fee is the sum of an individual fund fee rate that is based on an annual rate of .30% of the Fund's average net assets and an annualized group fee rate that averaged .26% during the period. The group fee rate is based upon the average net assets of all the mutual funds advised by FMR. The group fee rate decreases as assets under management increase and increases as assets under management decrease. For the period, the total annual management fee rate was .56% of the Fund's average net assets.
Transfer Agent Fees. Fidelity Investments Institutional Operations Company, Inc. (FIIOC), an affiliate of FMR, is the Fund's transfer, dividend disbursing, and shareholder servicing agent. FIIOC receives an asset-based fee with respect to each class. Each class (with the exception of Investor Class) pays a transfer agent fee, excluding out of pocket expenses, equal to an annual rate of .07% of average net assets. Investor Class pays a monthly asset-based transfer agent fee of .15% of average net assets. In addition, FIIOC receives an asset-based fee of .0045% of average net assets for typesetting, printing and mailing of shareholder reports, except proxy statements. FIIOC voluntarily agreed to waive this fee for the period August 1, 2011 through December 31, 2011 (see Expense Reductions note). For the period, transfer agent fees for each class, including printing and out of pocket expenses, were as follows:
Initial Class | $ 10,517 |
Investor Class | 30,089 |
| $ 40,606 |
Accounting and Security Lending Fees. Fidelity Service Company, Inc. (FSC), an affiliate of FMR, maintains the Fund's accounting records. The accounting fee is based on the level of average net assets for the month. Under a separate contract, FSC administers the security lending program. The security lending fee is based on the number and duration of lending transactions.
Brokerage Commissions. The Fund placed a portion of its portfolio transactions with brokerage firms which are affiliates of the investment adviser. The commissions paid to these affiliated firms were $4,191 for the period.
Annual Report
Notes to Financial Statements - continued
6. Committed Line of Credit.
The Fund participates with other funds managed by FMR or an affiliate in a $4.0 billion credit facility (the "line of credit") to be utilized for temporary or emergency purposes to fund shareholder redemptions or for other short-term liquidity purposes. The Fund has agreed to pay commitment fees on its pro-rata portion of the line of credit, which amounted to $92 and is reflected in Miscellaneous expenses on the Statement of Operations. During the period, there were no borrowings on this line of credit.
7. Security Lending.
The Fund lends portfolio securities through a lending agent from time to time in order to earn additional income. For equity securities, a lending agent is used and may loan securities to certain qualified borrowers, including Fidelity Capital Markets (FCM), a broker-dealer affiliated with the Fund. On the settlement date of the loan, the Fund receives collateral (in the form of U.S. Treasury obligations, letters of credit and/or cash) against the loaned securities and maintains collateral in an amount not less than 100% of the market value of the loaned securities during the period of the loan. The market value of the loaned securities is determined at the close of business of the Fund and any additional required collateral is delivered to the Fund on the next business day. If the borrower defaults on its obligation to return the securities loaned because of insolvency or other reasons, a fund could experience delays and costs in recovering the securities loaned or in gaining access to the collateral. Any cash collateral received is invested in the Fidelity Securities Lending Cash Central Fund. The value of loaned securities and cash collateral at period end are disclosed on the Fund's Statement of Assets and Liabilities. Security lending income represents the income earned on investing cash collateral, less rebates paid to borrowers and any lending agent fees associated with the loan, plus any premium payments received for lending certain types of securities. Security lending income is presented in the Statement of Operations as a component of income from Fidelity Central Funds. Total security lending income during the period amounted to $8,852. During the period, there were no securities loaned to FCM.
8. Expense Reductions.
FMR or its affiliates agreed to waive certain fees during the period as noted in the table below.
Initial Class | $ 157 |
Investor Class | 265 |
| $ 422 |
Many of the brokers with whom FMR places trades on behalf of the Fund provided services to the Fund in addition to trade execution. These services included payments of certain expenses on behalf of the Fund totaling $3,848 for the period.
9. Distributions to Shareholders.
Distributions to shareholders of each class were as follows:
Years ended December 31, | 2011 | 2010 |
From net investment income | | |
Initial Class | $ 49,695 | $ 24,605 |
Investor Class | 74,939 | 21,764 |
Total | $ 124,634 | $ 46,369 |
10. Share Transactions.
Transactions for each class of shares were as follows:
| Shares | Dollars |
Years ended December 31, | 2011 | 2010 | 2011 | 2010 |
Initial Class | | | | |
Shares sold | 245,431 | 1,403,892 | $ 3,085,153 | $ 16,356,186 |
Reinvestment of distributions | 4,131 | 1,962 | 49,695 | 24,605 |
Shares redeemed | (1,083,411) | (391,168) | (13,655,329) | (4,016,992) |
Net increase (decrease) | (833,849) | 1,014,686 | $ (10,520,481) | $ 12,363,799 |
Investor Class | | | | |
Shares sold | 693,896 | 1,964,116 | $ 8,655,217 | $ 22,469,975 |
Reinvestment of distributions | 6,240 | 1,738 | 74,939 | 21,764 |
Shares redeemed | (1,440,049) | (470,793) | (17,934,021) | (4,859,416) |
Net increase (decrease) | (739,913) | 1,495,061 | $ (9,203,865) | $ 17,632,323 |
Annual Report
11. Other.
The Fund's organizational documents provide former and current trustees and officers with a limited indemnification against liabilities arising in connection with the performance of their duties to the Fund. In the normal course of business, the Fund may also enter into contracts that provide general indemnifications. The Fund's maximum exposure under these arrangements is unknown as this would be dependent on future claims that may be made against the Fund. The risk of material loss from such claims is considered remote.
At the end of the period, FMR or its affiliates were the owners of record of 100% of the total outstanding shares of the Fund.
Annual Report
Report of Independent Registered Public Accounting Firm
To the Trustees of Variable Insurance Products Fund IV and the Shareholders of VIP Consumer Discretionary Portfolio:
In our opinion, the accompanying statement of assets and liabilities, including the schedule of investments, and the related statements of operations and of changes in net assets and the financial highlights present fairly, in all material respects, the financial position of VIP Consumer Discretionary Portfolio (a fund of Variable Insurance Products Fund IV) at December 31, 2011, the results of its operations for the year then ended, the changes in its net assets for each of the two years in the period then ended and the financial highlights for each of the five years in the period then ended, in conformity with accounting principles generally accepted in the United States of America. These financial statements and financial highlights (hereafter referred to as "financial statements") are the responsibility of the VIP Consumer Discretionary Portfolio's management. Our responsibility is to express an opinion on these financial statements based on our audits. We conducted our audits of these financial statements in accordance with the standards of the Public Company Accounting Oversight Board (United States). Those standards require that we plan and perform the audit to obtain reasonable assurance about whether the financial statements are free of material misstatement. An audit includes examining, on a test basis, evidence supporting the amounts and disclosures in the financial statements, assessing the accounting principles used and significant estimates made by management, and evaluating the overall financial statement presentation. We believe that our audits, which included confirmation of securities at December 31, 2011 by correspondence with the custodian and brokers, provide a reasonable basis for our opinion.
/s/ PricewaterhouseCoopers LLP
PricewaterhouseCoopers LLP
Boston, Massachusetts
February 14, 2012
Annual Report
The Trustees, Members of the Advisory Board, and executive officers of the trust and fund, as applicable, are listed below. The Board of Trustees governs the fund and is responsible for protecting the interests of shareholders. The Trustees are experienced executives who meet periodically throughout the year to oversee the fund's activities, review contractual arrangements with companies that provide services to the fund, oversee management of the risks associated with such activities and contractual arrangements, and review the fund's performance. Except for James C. Curvey, each of the Trustees oversees 226 funds advised by FMR or an affiliate. Mr. Curvey oversees 429 funds advised by FMR or an affiliate.
The Trustees hold office without limit in time except that (a) any Trustee may resign; (b) any Trustee may be removed by written instrument, signed by at least two-thirds of the number of Trustees prior to such removal; (c) any Trustee who requests to be retired or who has become incapacitated by illness or injury may be retired by written instrument signed by a majority of the other Trustees; and (d) any Trustee may be removed at any special meeting of shareholders by a two-thirds vote of the outstanding voting securities of the trust. Each Trustee who is not an interested person (as defined in the 1940 Act) (Independent Trustee), shall retire not later than the last day of the calendar year in which his or her 75th birthday occurs. The Independent Trustees may waive this mandatory retirement age policy with respect to individual Trustees. The executive officers and Advisory Board Members hold office without limit in time, except that any officer and Advisory Board Member may resign or may be removed by a vote of a majority of the Trustees at any regular meeting or any special meeting of the Trustees. Except as indicated, each individual has held the office shown or other offices in the same company for the past five years.
Experience, Skills, Attributes, and Qualifications of the Fund's Trustees. The Governance and Nominating Committee has adopted a statement of policy that describes the experience, qualifications, attributes, and skills that are necessary and desirable for potential Independent Trustee candidates (Statement of Policy). The Board believes that each Trustee satisfied at the time he or she was initially elected or appointed a Trustee, and continues to satisfy, the standards contemplated by the Statement of Policy. The Governance and Nominating Committee also engages professional search firms to help identify potential Independent Trustee candidates who have the experience, qualifications, attributes, and skills consistent with the Statement of Policy. From time to time, additional criteria based on the composition and skills of the current Independent Trustees, as well as experience or skills that may be appropriate in light of future changes to board composition, business conditions, and regulatory or other developments, have also been considered by the professional search firms and the Governance and Nominating Committee. In addition, the Board takes into account the Trustees' commitment and participation in Board and committee meetings, as well as their leadership of standing and ad hoc committees throughout their tenure.
In determining that a particular Trustee was and continues to be qualified to serve as a Trustee, the Board has considered a variety of criteria, none of which, in isolation, was controlling. The Board believes that, collectively, the Trustees have balanced and diverse experience, qualifications, attributes, and skills, which allow the Board to operate effectively in governing the fund and protecting the interests of shareholders. Information about the specific experience, skills, attributes, and qualifications of each Trustee, which in each case led to the Board's conclusion that the Trustee should serve (or continue to serve) as a trustee of the fund, is provided below.
Board Structure and Oversight Function. James C. Curvey is an interested person (as defined in the 1940 Act) and currently serves as Acting Chairman. The Trustees have determined that an interested Chairman is appropriate and benefits shareholders because an interested Chairman has a personal and professional stake in the quality and continuity of services provided to the fund. Independent Trustees exercise their informed business judgment to appoint an individual of their choosing to serve as Chairman, regardless of whether the Trustee happens to be independent or a member of management. The Independent Trustees have determined that they can act independently and effectively without having an Independent Trustee serve as Chairman and that a key structural component for assuring that they are in a position to do so is for the Independent Trustees to constitute a substantial majority for the Board. The Independent Trustees also regularly meet in executive session. Ned C. Lautenbach serves as Chairman of the Independent Trustees and as such (i) acts as a liaison between the Independent Trustees and management with respect to matters important to the Independent Trustees and (ii) with management prepares agendas for Board meetings.
Fidelity funds are overseen by different Boards of Trustees. The fund's Board oversees Fidelity's equity and high income funds and another Board oversees Fidelity's investment-grade bond, money market, and asset allocation funds. The asset allocation funds may invest in Fidelity funds overseen by the fund's Board. The use of separate Boards, each with its own committee structure, allows the Trustees of each group of Fidelity funds to focus on the unique issues of the funds they oversee, including common research, investment, and operational issues. On occasion, the separate Boards establish joint committees to address issues of overlapping consequences for the Fidelity funds overseen by each Board.
The Trustees operate using a system of committees to facilitate the timely and efficient consideration of all matters of importance to the Trustees, the fund, and fund shareholders and to facilitate compliance with legal and regulatory requirements and oversight of the fund's activities and associated risks. The Board, acting through its committees, has charged FMR and its affiliates with (i) identifying events or circumstances the occurrence of which could have demonstrably adverse effects on the fund's business and/or reputation; (ii) implementing processes and controls to lessen the possibility that such events or circumstances occur or to mitigate the effects of such events or circumstances if they do occur; and (iii) creating and maintaining a system designed to evaluate continuously business and market conditions in order to facilitate the identification and implementation processes described in (i) and (ii) above. Because the day-to-day operations and activities of the fund are carried out by or through FMR, its affiliates and other service providers, the fund's exposure to risks is mitigated but not eliminated by the processes overseen by the Trustees. While each of the Board's committees has responsibility for overseeing different aspects of the fund's activities, oversight is exercised primarily through the Operations, Audit, and Compliance Committees. In addition, the Independent Trustees have worked with FMR to enhance the Board's oversight of investment and financial risks, legal and regulatory risks, technology risks, and operational risks, including the development of additional risk reporting to the Board. For example, a working group comprised of Independent Trustees and FMR has worked and continues to work to review the Fidelity funds' valuation-related activities, reporting and risk management. Appropriate personnel, including but not limited to the fund's Chief Compliance Officer (CCO), FMR's internal auditor, the independent accountants, the fund's Treasurer and portfolio management personnel, make periodic reports to the Board's committees, as appropriate, including an annual review of FMR's risk management program for the Fidelity funds. The responsibilities of each standing committee, including their oversight responsibilities, are described further under "Standing Committees of the Fund's Trustees."
Annual Report
The fund's Statement of Additional Information (SAI) includes more information about the Trustees. To request a free copy, call Fidelity at 1-877-208-0098.
Interested Trustees*:
Correspondence intended for each Trustee who is an interested person may be sent to Fidelity Investments, 82 Devonshire Street, Boston, Massachusetts 02109.
Name, Age; Principal Occupations and Other Relevant Experience+ |
James C. Curvey (76) |
| Year of Election or Appointment: 2007 Mr. Curvey is Trustee and Acting Chairman of the Board of Trustees of certain Trusts. Mr. Curvey also serves as Trustee (2007-present) of other investment companies advised by FMR. Mr. Curvey is a Director of Fidelity Investments Money Management, Inc. (2009-present), Director of Fidelity Research & Analysis Co. (2009-present) and Director of FMR and FMR Co., Inc. (2007-present). Mr. Curvey is also Vice Chairman (2007-present) and Director of FMR LLC. In addition, Mr. Curvey serves as an Overseer for the Boston Symphony Orchestra and a member of the Trustees of Villanova University. Previously, Mr. Curvey was the Vice Chairman (2006-2007) and Director (2000-2007) of FMR Corp. |
Ronald P. O'Hanley (54) |
| Year of Election or Appointment: 2011 Mr. O'Hanley is Director of FMR Co., Inc. (2010-present), Director of Fidelity Investments Money Management, Inc. (2010-present), Director of Fidelity Research & Analysis Company (2010-present), President of Fidelity Asset Management and Corporate Services and a member of Fidelity's Executive Committee (2010-present). Previously, Mr. O'Hanley served as President and Chief Executive Officer of BNY Mellon Asset Management (2007-2010). Mr. O'Hanley also served as Vice Chairman of Bank New York Mellon Corp. and a member of that firm's Executive Committee. Prior to the 2007 merger of The Bank of New York and Mellon Financial Corporation, he was Vice Chairman of Mellon Financial Corporation and President and Chief Executive Officer of Mellon Asset Management. He joined Mellon in February 1997. Mr. O'Hanley currently serves as Chairman of the Boston Public Library Foundation Board of Directors and sits on the Board of Directors of Beth Israel Deaconess Medical Center, the Board of Trustees of the Marine Biological Laboratory and the Advisory Board of the Maxwell School of Citizenship and Public Administration at Syracuse University. Mr. O'Hanley also chairs the Council on Asset Management for the Financial Services Roundtable and is a member of the Board of Directors of Institutional Investor's U.S. Institute. |
* Trustees have been determined to be "Interested Trustees" by virtue of, among other things, their affiliation with the trust or various entities under common control with FMR.
+ The information above includes each Trustee's principal occupation during the last five years and other information relating to the experience, attributes, and skills relevant to each Trustee's qualifications to serve as a Trustee, which led to the conclusion that each Trustee should serve as a Trustee for the fund.
Independent Trustees:
Correspondence intended for each Independent Trustee (that is, the Trustees other than the Interested Trustees) may be sent to Fidelity Investments, P.O. Box 55235, Boston, Massachusetts 02205-5235.
Name, Age; Principal Occupations and Other Relevant Experience+ |
Dennis J. Dirks (63) |
| Year of Election or Appointment: 2005 Prior to his retirement in May 2003, Mr. Dirks was Chief Operating Officer and a member of the Board of The Depository Trust & Clearing Corporation (DTCC). He also served as President, Chief Operating Officer, and Board member of The Depository Trust Company (DTC) and President and Board member of the National Securities Clearing Corporation (NSCC). In addition, Mr. Dirks served as Chief Executive Officer and Board member of the Government Securities Clearing Corporation, Chief Executive Officer and Board member of the Mortgage-Backed Securities Clearing Corporation, as a Trustee and a member of the Finance Committee of Manhattan College (2005-2008), and as a Trustee and a member of the Finance Committee of AHRC of Nassau County (2006-2008). Mr. Dirks is a member of the Independent Directors Council (IDC) Governing Council (2010-present) and Board of Directors for The Brookville Center for Children's Services, Inc. (2009-present). |
Alan J. Lacy (58) |
| Year of Election or Appointment: 2008 Mr. Lacy serves as Senior Adviser (2007-present) of Oak Hill Capital Partners, L.P. (private equity). Mr. Lacy also served as Chief Executive Officer (2000-2005) and Vice Chairman (2005-2006) of Sears Holdings Corporation and Sears, Roebuck and Co. (retail). In addition, Mr. Lacy serves as a member of the Board of Directors of Dave & Buster's, Inc. (restaurant and entertainment complexes, 2010-present), The Hillman Companies, Inc. (hardware wholesalers, 2010-present), and Bristol-Myers Squibb Company (global pharmaceuticals, 2007-present). Mr. Lacy is a member of the Board of Trustees of The National Parks Conservation Association (2006-present). Previously, Mr. Lacy served as Chairman of the Board of Trustees of the National Parks Conservation Association (2008-2011) and as a member of the Board of Directors for the Western Union Company (global money transfer, 2006-2011). |
Ned C. Lautenbach (67) |
| Year of Election or Appointment: 2000 Mr. Lautenbach is Chairman of the Independent Trustees of the Equity and High Income Funds (2006-present). Mr. Lautenbach currently serves as the Lead Director of the Eaton Corporation Board of Directors (diversified industrial, 1997-present). Mr. Lautenbach is also a member of the Board of Directors of the Philharmonic Center for the Arts in Naples, Florida (1999-present); a member of the Board of Trustees of Fairfield University (2005-present); and a member of the Council on Foreign Relations (1994-present). Previously, Mr. Lautenbach was a Partner/Advisory Partner at Clayton, Dubilier & Rice, LLC (private equity investment, 1998-2010), as well as a Director of Sony Corporation (2006-2007). |
Joseph Mauriello (67) |
| Year of Election or Appointment: 2008 Prior to his retirement in January 2006, Mr. Mauriello served in numerous senior management positions including Deputy Chairman and Chief Operating Officer (2004-2005), and Vice Chairman of Financial Services (2002-2004) of KPMG LLP US (professional services, 1965-2005). Mr. Mauriello currently serves as a member of the Board of Directors of XL Group plc. (global insurance and re-insurance, 2006-present) and of Arcadia Resources Inc. (health care services and products, 2007-present). Previously, Mr. Mauriello served as a Director of the Hamilton Funds of the Bank of New York (2006-2007). |
Robert W. Selander (61) |
| Year of Election or Appointment: 2011 Previously, Mr. Selander served as a Member of the Advisory Board of Fidelity's Equity and High Income Funds (2011), Executive Vice Chairman (2010), Chief Executive Officer (2009-2010), and President and Chief Executive Officer (1997-2009) of Mastercard, Inc. |
Cornelia M. Small (67) |
| Year of Election or Appointment: 2005 Ms. Small is a member of the Board of Directors of the Teagle Foundation (2009-present). Ms. Small is also a member of the Investment Committee, and Chair (2008-present) and a member of the Board of Trustees of Smith College. In addition, Ms. Small serves on the Investment Committee of the Berkshire Taconic Community Foundation (2008-present). Previously, Ms. Small served as Chairperson of the Investment Committee (2002-2008) of Smith College. In addition, Ms. Small served as Chief Investment Officer, Director of Global Equity Investments, and a member of the Board of Directors of Scudder, Stevens & Clark and Scudder Kemper Investments. |
William S. Stavropoulos (72) |
| Year of Election or Appointment: 2001 Mr. Stavropoulos is Vice Chairman of the Independent Trustees of the Equity and High Income Funds (2006-present). Mr. Stavropoulos serves as President and Founder of the Michigan Baseball Foundation, the Great Lakes Loons (2007-present). Mr. Stavropoulos is Chairman Emeritus of the Board of Directors of The Dow Chemical Company, where he previously served in numerous senior management positions, including President, CEO (1995-2000; 2002-2004), Chairman of the Executive Committee (2000-2006), and as a member of the Board of Directors (1990-2006). Currently, Mr. Stavropoulos is Chairman of Univar (global distributor of commodity and specialty chemicals, 2010-present), a Director of Teradata Corporation (data warehousing and technology solutions, 2008-present), Chemical Financial Corporation, Maersk Inc. (industrial conglomerate), Tyco International, Inc. (multinational manufacturing and services, 2007-present), and a member of the Advisory Board for Metalmark Capital (private equity investment, 2005-present). Mr. Stavropoulos is a special advisor to Clayton, Dubilier & Rice, LLC (private equity investment). In addition, Mr. Stavropoulos is a member of the University of Notre Dame Advisory Council for the College of Science. |
David M. Thomas (62) |
| Year of Election or Appointment: 2008 Previously, Mr. Thomas served as Executive Chairman (2005-2006) and Chairman and Chief Executive Officer (2000-2005) of IMS Health, Inc. (pharmaceutical and healthcare information solutions). In addition, Mr. Thomas serves as a member of the Board of Directors of Fortune Brands, Inc. (consumer products), and Interpublic Group of Companies, Inc. (marketing communication, 2004-present). |
Michael E. Wiley (61) |
| Year of Election or Appointment: 2008 Mr. Wiley also serves as a Director of Asia Pacific Exploration Consolidated (international oil and gas exploration and production, 2008-present). Mr. Wiley serves as a Director of Tesoro Corporation (independent oil refiner and marketer, 2005-present), and a Director of Bill Barrett Corporation (exploration and production, 2005-present). In addition, Mr. Wiley also serves as a Director of Post Oak Bank (privately-held bank, 2004-present). Previously, Mr. Wiley served as a member of the Board of Trustees of the University of Tulsa (2000-2006; 2007-2010), as a Senior Energy Advisor of Katzenbach Partners, LLC (consulting, 2006-2007), as an Advisory Director of Riverstone Holdings (private investment), Chairman, President, and CEO of Baker Hughes, Inc. (oilfield services, 2000-2004), and as Director of Spinnaker Exploration Company (exploration and production, 2001-2005). |
+ The information above includes each Trustee's principal occupation during the last five years and other information relating to the experience, attributes, and skills relevant to each Trustee's qualifications to serve as a Trustee, which led to the conclusion that each Trustee should serve as a Trustee for the fund.
Advisory Board Members and Executive Officers:
Correspondence intended for each executive officer, Edward C. Johnson 3d, and Peter S. Lynch may be sent to Fidelity Investments, 82 Devonshire Street, Boston, Massachusetts 02109.
Name, Age; Principal Occupation |
Edward C. Johnson 3d (81) |
| Year of Election or Appointment: 2011 Member of the Advisory Board of Fidelity's Equity and High Income Funds. Mr. Johnson serves as Chief Executive Officer, Chairman, and a Director of FMR LLC, and also serves as Chairman and Director of FIL Limited. Previously, Mr. Johnson served as a Trustee and Chairman of the Board of certain Fidelity Trusts, Chairman and a Director of FMR, Chairman and a Director of FMR Co., Inc., and President of FMR LLC (2006-2007). |
Peter S. Lynch (67) |
| Year of Election or Appointment: 2003 Member of the Advisory Board of Fidelity's Equity and High Income Funds. Mr. Lynch is Vice Chairman and a Director of FMR and FMR Co., Inc. In addition, Mr. Lynch serves as a Trustee of Boston College and as the Chairman of the Inner-City Scholarship Fund. Previously, Mr. Lynch served on the Special Olympics International Board of Directors (1997-2006). |
Kenneth B. Robins (42) |
| Year of Election or Appointment: 2008 President and Treasurer of Fidelity's Equity and High Income Funds. Mr. Robins also serves as President and Treasurer (2010-present) and Assistant Treasurer (2009-present) of other Fidelity funds and is an employee of Fidelity Investments (2004-present). Previously, Mr. Robins served as Deputy Treasurer of the Fidelity funds (2005-2008) and Treasurer and Chief Financial Officer of The North Carolina Capital Management Trust: Cash and Term Portfolios (2006-2008). |
Brian B. Hogan (47) |
| Year of Election or Appointment: 2009 Vice President of Equity and High Income Funds. Mr. Hogan also serves as President of FMR's Equity Division (2009-present). Previously, Mr. Hogan served as Senior Vice President, Equity Research of FMR (2006-2009) and as a portfolio manager. |
Christopher S. Bartel (40) |
| Year of Election or Appointment: 2009 Vice President of Fidelity's Sector and Real Estate Equity Funds. Mr. Bartel also serves as Senior Vice President of Equity Research (2009-present). Previously, Mr. Bartel served as Managing Director of Research (2006-2009) and an analyst and portfolio manager (2000-2006). |
Scott C. Goebel (43) |
| Year of Election or Appointment: 2008 Secretary and Chief Legal Officer (CLO) of the Fidelity funds. Mr. Goebel also serves as Secretary of Fidelity Investments Money Management, Inc. (FIMM) (2010-present) and Fidelity Research and Analysis Company (FRAC) (2010-present); Secretary and CLO of The North Carolina Capital Management Trust: Cash and Term Portfolios (2008-present); General Counsel, Secretary, and Senior Vice President of FMR (2008-present) and FMR Co., Inc. (2008-present); employed by FMR LLC or an affiliate (2001-present); Chief Legal Officer of Fidelity Management & Research (Hong Kong) Limited (2008-present) and Assistant Secretary of Fidelity Management & Research (Japan) Inc. (2008-present), and Fidelity Management & Research (U.K.) Inc. (2008-present). Previously, Mr. Goebel served as Assistant Secretary of FIMM (2008-2010), FRAC (2008-2010), and the Funds (2007-2008) and as Vice President and Secretary of Fidelity Distributors Corporation (FDC) (2005-2007). |
William C. Coffey (42) |
| Year of Election or Appointment: 2009 Assistant Secretary of Fidelity's Equity and High Income Funds. Mr. Coffey also serves as Senior Vice President and Deputy General Counsel of FMR LLC (2010-present), and is an employee of Fidelity Investments. Previously, Mr. Coffey served as Vice President and Associate General Counsel of FMR LLC (2005-2009). |
Holly C. Laurent (57) |
| Year of Election or Appointment: 2008 Anti-Money Laundering (AML) Officer of the Fidelity funds. Ms. Laurent also serves as AML Officer of The North Carolina Capital Management Trust: Cash and Term Portfolios (2008-present) and is an employee of Fidelity Investments. Previously, Ms. Laurent was Senior Vice President and Head of Legal for Fidelity Business Services India Pvt. Ltd. (2006-2008), and Senior Vice President, Deputy General Counsel and Group Head for FMR LLC (2005-2006). |
Christine Reynolds (53) |
| Year of Election or Appointment: 2008 Chief Financial Officer of the Fidelity funds. Ms. Reynolds became President of Fidelity Pricing and Cash Management Services (FPCMS) in August 2008. Ms. Reynolds served as Chief Operating Officer of FPCMS (2007-2008). Previously, Ms. Reynolds served as President, Treasurer, and Anti-Money Laundering officer of the Fidelity funds (2004-2007). |
Kenneth A. Rathgeber (64) |
| Year of Election or Appointment: 2004 Chief Compliance Officer of Fidelity's Equity and High Income Funds. Mr. Rathgeber is Chief Compliance Officer of Fidelity Management & Research (Hong Kong) Limited (2008-present), Fidelity Management & Research (Japan) Inc. (2008-present), FMR (2005-present), FMR Co., Inc. (2005-present), Fidelity Management & Research (U.K.) Inc. (2005-present), Fidelity Research & Analysis Company (2005-present), Fidelity Investments Money Management, Inc. (2005-present), Pyramis Global Advisors, LLC (2005-present), and Strategic Advisers, Inc. (2005-present). |
Jeffrey S. Christian (50) |
| Year of Election or Appointment: 2009 Deputy Treasurer of the Fidelity funds. Mr. Christian is an employee of Fidelity Investments. Previously, Mr. Christian served as Chief Financial Officer (2008-2009) of certain Fidelity funds and Senior Vice President of Fidelity Pricing and Cash Management Services (FPCMS) (2004-2009). |
Joseph F. Zambello (54) |
| Year of Election or Appointment: 2011 Deputy Treasurer of the Fidelity funds. Mr. Zambello is an employee of Fidelity Investments. Previously, Mr. Zambello served as Vice President of FMR's Program Management Group (2009-2011) and Vice President of the Transfer Agent Oversight Group (2005-2009). |
Adrien E. Deberghes (44) |
| Year of Election or Appointment: 2008 Deputy Treasurer of Fidelity's Equity and High Income Funds. Mr. Deberghes also serves as Vice President and Assistant Treasurer of Fidelity Rutland Square Trust II and Fidelity Commonwealth Trust II (2011-present), Assistant Treasurer of other Fidelity funds (2010-present), and is an employee of Fidelity Investments (2008-present). Previously, Mr. Deberghes served as Senior Vice President of Mutual Fund Administration at State Street Corporation (2007-2008), Senior Director of Mutual Fund Administration at Investors Bank & Trust (2005-2007), and Director of Finance for Dunkin' Brands (2000-2005). |
Stephanie J. Dorsey (42) |
| Year of Election or Appointment: 2010 Assistant Treasurer of Fidelity's Equity and High Income Funds. Ms. Dorsey also serves as Deputy Treasurer of other Fidelity funds (2008-present) and is an employee of Fidelity Investments (2008-present). Previously, Ms. Dorsey served as Treasurer (2004-2008) of the JPMorgan Mutual Funds and Vice President (2004-2008) of JPMorgan Chase Bank. |
John R. Hebble (53) |
| Year of Election or Appointment: 2009 Assistant Treasurer of Fidelity's Equity and High Income Funds. Mr. Hebble also serves as President (2011-present), Treasurer, and Chief Financial Officer of The North Carolina Capital Management Trust: Cash and Term Portfolios (2008-present), President and Treasurer of other Fidelity funds (2008-present) and is an employee of Fidelity Investments. |
Gary W. Ryan (53) |
| Year of Election or Appointment: 2005 Assistant Treasurer of the Fidelity funds. Mr. Ryan is an employee of Fidelity Investments. Previously, Mr. Ryan served as Vice President of Fund Reporting in Fidelity Pricing and Cash Management Services (FPCMS) (1999-2005). |
Jonathan Davis (43) |
| Year of Election or Appointment: 2010 Assistant Treasurer of the Fidelity funds. Mr. Davis is also Assistant Treasurer of Fidelity Rutland Square Trust II and Fidelity Commonwealth Trust II. Mr. Davis is an employee of Fidelity Investments. Previously, Mr. Davis served as Vice President and Associate General Counsel of FMR LLC (2003-2010). |
Annual Report
The Board of Trustees of VIP Consumer Discretionary Portfolio voted to pay to shareholders of record at the opening of business on record date, the following distributions per share derived from capital gains realized from sales of portfolio securities:
| Pay Date | Record Date | Capital Gains |
Initial Class | 02/03/12 | 02/03/12 | $0.168 |
Investor Class | 02/03/12 | 02/03/12 | $0.168 |
The fund hereby designates as a capital gain dividend with respect to the taxable year ended December 31, 2011, $317,359, or, if subsequently determined to be different, the net capital gain of such year.
Initial Class and Investor Class designate 100% of the dividends distributed during the fiscal year as qualifying for the dividends-received deduction for corporate shareholders.
Annual Report
Board Approval of Investment Advisory Contracts and Management Fees
VIP Consumer Discretionary Portfolio
Each year, the Board of Trustees, including the Independent Trustees (together, the Board), votes on the renewal of the management contract and sub-advisory agreements (together, the Advisory Contracts) for the fund. The Board, assisted by the advice of fund counsel and Independent Trustees' counsel, requests and considers a broad range of information relevant to the renewal of the Advisory Contracts throughout the year.
The Board meets regularly and considers at each of its meetings factors that are relevant to its annual consideration of the renewal of the fund's Advisory Contracts, including the services and support provided to the fund and its shareholders. The Board has established various standing committees, each composed of Independent Trustees with varying backgrounds, to which the Board has assigned specific subject matter responsibilities in order to enhance effective decision-making by the Board. The Board, acting directly and through its Committees, requests and receives information concerning the annual consideration of the renewal of the fund's Advisory Contracts. The Board also meets as needed to consider matters specifically related to the Board's annual consideration of the renewal of Advisory Contracts. Members of the Board may also meet with trustees of other Fidelity funds through ad hoc joint committees to discuss certain matters relevant to the Fidelity funds.
At its July 2011 meeting, the Board of Trustees, including the Independent Trustees, unanimously determined to renew the fund's Advisory Contracts. In reaching its determination, the Board considered all factors it believed relevant, including (i) the nature, extent, and quality of the services to be provided to the fund and its shareholders (including the investment performance of the fund); (ii) the competitiveness of the fund's management fee and total expense ratio; (iii) the total costs of the services to be provided by and the profits to be realized by Fidelity from its relationship with the fund; (iv) the extent to which economies of scale would be realized as the fund grows; and (v) whether fee levels reflect these economies of scale, if any, for the benefit of fund shareholders.
In considering whether to renew the Advisory Contracts for the fund, the Board reached a determination, with the assistance of fund counsel and Independent Trustees' counsel and through the exercise of its business judgment, that the renewal of the Advisory Contracts is in the best interests of the fund and its shareholders and that the compensation payable under the Advisory Contracts is fair and reasonable. The Board's decision to renew the Advisory Contracts was not based on any single factor, but rather was based on a comprehensive consideration of all the information provided to the Board at its meetings throughout the year. The Board, in reaching its determination to renew the Advisory Contracts, is aware that shareholders in the fund have a broad range of investment choices available to them, including a wide choice among mutual funds offered by Fidelity's competitors, and that the fund's shareholders, who have the opportunity to review and weigh the disclosure provided by the fund in its prospectus and other public disclosures, have chosen to invest in this fund, managed by Fidelity.
Nature, Extent, and Quality of Services Provided. The Board considered the staffing within the investment adviser, FMR, and the sub-advisers (together, the Investment Advisers), including the backgrounds of the fund's investment personnel and the fund's investment objective and discipline. The Independent Trustees also had discussions with senior management of Fidelity's investment operations and investment groups. The Board considered the structure of the portfolio manager compensation program and whether this structure provides appropriate incentives to act in the best interests of the fund.
Resources Dedicated to Investment Management and Support Services. The Board and the Fund Oversight and Research Committees reviewed the general qualifications and capabilities of the Investment Advisers' investment staff, including its size, education, experience, and resources, as well as the Investment Advisers' approach to recruiting, training, managing, and compensating investment personnel. The Board also noted that FMR has devoted increased resources to non-U.S. offices. The Board noted that Fidelity's analysts have extensive resources, tools and capabilities which allow them to conduct sophisticated quantitative and fundamental analysis, as well as credit analysis of issuers, counterparties and enhancers. The Board also believes that Fidelity's investment professionals have sufficient access to global information and data so as to provide competitive investment results over time, and that those professionals also have access to sophisticated tools which permit them to assess portfolio construction and risk and performance attribution characteristics continuously, as well as to transmit new information and research conclusions rapidly around the world. Additionally, in their deliberations, the Board considered the Investment Advisers' trading capabilities and resources which are an integral part of the investment management process.
Shareholder and Administrative Services. The Board considered (i) the nature, extent, quality, and cost of advisory, administrative, and shareholder services performed by the Investment Advisers and their affiliates under the Advisory Contracts and under separate agreements covering transfer agency, pricing and bookkeeping, and securities lending services for the fund; (ii) the nature and extent of the investment adviser's supervision of third party service providers, principally custodians and subcustodians; and (iii) the resources devoted to, and the record of compliance with, the fund's compliance policies and procedures. The Board also reviewed the allocation of fund brokerage, including allocations to brokers affiliated with the Investment Advisers, the use of brokerage commissions to pay fund expenses, and the use of "soft" commission dollars to pay for research services.
The Board noted that the growth of fund assets over time across the complex allows Fidelity to reinvest in the development of services designed to enhance the value or convenience of the Fidelity funds as investment vehicles. These services include 24-hour access to account information and market information through telephone representatives and over the Internet, investor education materials and asset allocation tools, and the expanded availability of Fidelity Investor Centers, with 35 new branches opening since 2010.
Annual Report
Board Approval of Investment Advisory Contracts and Management Fees - continued
Investment in a Large Fund Family. The Board considered the benefits to shareholders of investing in a Fidelity fund, including the benefits of investing in a fund that is part of a large family of funds offering a variety of investment disciplines and providing a large variety of mutual fund investor services. The Board noted that Fidelity had taken, or had made recommendations that resulted in the Fidelity funds taking, a number of actions over the previous year that benefited particular funds, including (i) continuing to dedicate additional resources to investment research and support of the senior management team that oversees asset management; (ii) rationalizing product lines through the mergers of six funds into other funds; (iii) continuing to migrate the Freedom Funds to dedicated lower cost underlying funds; (iv) obtaining shareholder approval to broaden the investment strategies for Fidelity Consumer Finance Portfolio, Fidelity Emerging Asia Fund, and Fidelity Environment and Alternative Energy Portfolio; (v) contractually agreeing to reduce the management fees and impose other expense limitations on Spartan 500 Index Fund and U.S. Bond Index Fund in connection with launching new institutional classes of these funds; (vi) changing the name, primary and supplemental benchmarks, and investment policies of Fidelity Global Strategies Fund to support the fund's flexible investment mandate and global orientation; and (vii) reducing the transfer agency account fee rates on certain accounts.
Investment Performance. The Board considered whether the fund has operated in accordance with its investment objective, as well as its record of compliance with its investment restrictions. It also reviewed the fund's absolute investment performance for each class, as well as the fund's relative investment performance for each class measured over multiple periods against a third-party-sponsored index that reflects the market sector in which the fund invests. The Board noted that FMR does not believe that a meaningful peer group exists against which to compare the fund's performance. The following charts considered by the Board show, over the one-, three-, and five-year periods ended December 31, 2010, the cumulative total returns of Initial Class and Investor Class of the fund and the cumulative total returns of a third-party-sponsored index ("benchmark").
VIP Consumer Discretionary Portfolio

The Board noted that the investment performance of Initial Class of the fund compared favorably to its benchmark for the one- and three-year periods, although the fund's five-year cumulative total return was lower than its benchmark. The Board considered that the variations in performance between the fund's classes reflect the variations in class expenses, which result in lower performance for the higher expense class. The Board also reviewed the fund's performance since inception as well as performance in the current year.
Based on its review, the Board concluded that the nature, extent, and quality of services provided to the fund under the Advisory Contracts should benefit the fund's shareholders.
Competitiveness of Management Fee and Total Expense Ratio. The Board considered the fund's management fee and total expense ratio compared to "mapped groups" of competitive funds and classes. Fidelity creates "mapped groups" by combining similar Lipper investment objective categories that have comparable management fee characteristics. Combining Lipper investment objective categories aids the Board's management fee and total expense ratio comparisons by broadening the competitive group used for comparison and by reducing the number of universes to which various Fidelity funds are compared.
Management Fee. The Board considered two proprietary management fee comparisons for the 12-month periods shown in the chart below. The group of Lipper funds used by the Board for management fee comparisons is referred to below as the "Total Mapped Group." The Total Mapped Group comparison focuses on a fund's standing relative to the total universe of comparable funds available to investors in terms of gross management fees before expense reimbursements or caps. "TMG %" represents the percentage of funds in the Total Mapped Group that had management fees that were lower than the fund's. For example, a TMG % of 2% means that 98% of the funds in the Total Mapped Group had higher management fees than the fund. The "Asset-Size Peer Group" (ASPG) comparison focuses on a fund's standing relative to non-Fidelity funds similar in size to the fund within the Total Mapped Group. The ASPG represents at least 15% of the funds in the Total Mapped Group with comparable asset size and management fee characteristics, subject to a minimum of 50 funds (or all funds in the Total Mapped Group if fewer than 50). Additional information, such as the ASPG quartile in which the fund's management fee ranked, is also included in the chart and considered by the Board.
Annual Report
VIP Consumer Discretionary Portfolio
The Board noted that the fund's management fee ranked below the median of its Total Mapped Group and below the median of its ASPG for 2010.
Based on its review, the Board concluded that the fund's management fee is fair and reasonable in light of the services that the fund receives and the other factors considered.
Total Expense Ratio. In its review of each class's total expense ratio, the Board considered the fund's management fee as well as other fund or class expenses, as applicable, such as transfer agent fees, pricing and bookkeeping fees, and custodial, legal, and audit fees. The Board also noted the effects of any waivers and reimbursements on fees and expenses. As part of its review, the Board also considered the current and historical total expense ratios of each class of the fund compared to competitive fund median expenses. Each class of the fund is compared to those funds and classes in the Total Mapped Group (used by the Board for management fee comparisons) that have a similar sales load structure.
The Board noted that the total expense ratio of each class ranked below its competitive median for 2010. The Board considered that various factors, including 12b-1 fees, positive or negative performance adjustments, and relatively higher other expenses in the case of small fund size, can affect total expense ratios. The Board also noted that Investor Class has higher transfer agent fees than traditional variable annuity classes because it is designed for lower cost annuity products, where the majority of servicing costs are incorporated into the funds' total expense ratios rather than being paid at the annuity level.
Fees Charged to Other Fidelity Clients. The Board also considered Fidelity fee structures and other information with respect to clients of FMR and its affiliates, such as other mutual funds advised or subadvised by FMR or its affiliates, pension plan clients, and other institutional clients. In March 2010, the Board created an ad hoc joint committee with the board of other Fidelity funds (the Committee) to review and compare Fidelity's institutional investment advisory business with its business of providing services to the Fidelity funds, including the differences in services provided, fees charged, and costs incurred, as well as competition in their respective marketplaces.
Based on its review of total expense ratios and fees charged to other Fidelity clients, the Board concluded that the total expense ratio of each class of the fund was reasonable in light of the services that the fund and its shareholders receive and the other factors considered, including the findings of the Committee.
Costs of the Services and Profitability. The Board considered the revenues earned and the expenses incurred by Fidelity in conducting the business of developing, marketing, distributing, managing, administering and servicing the fund and its shareholders. The Board also considered the level of Fidelity's profits in respect of all the Fidelity funds.
On an annual basis, FMR presents to the Board Fidelity's profitability for the fund. Fidelity calculates the profitability for each fund, as well as aggregate profitability for groups of Fidelity funds and all Fidelity funds, using a series of detailed revenue and cost allocation methodologies which originate with the books and records of Fidelity on which Fidelity's audited financial statements are based. The Audit Committee of the Board reviews any significant changes from the prior year's methodologies.
Annual Report
Board Approval of Investment Advisory Contracts and Management Fees - continued
PricewaterhouseCoopers LLP (PwC), independent registered public accounting firm and auditor to Fidelity and certain Fidelity funds, has been engaged annually by the Board as part of the Board's assessment of Fidelity's profitability analysis. PwC's engagement includes the review and assessment of Fidelity's methodologies used in determining the revenues and expenses attributable to Fidelity's mutual fund business, and completion of agreed-upon procedures surrounding the mathematical accuracy of fund profitability and its conformity to allocation methodologies. After considering PwC's reports issued under the engagement and information provided by Fidelity, the Board concluded that while other allocation methods may also be reasonable, Fidelity's profitability methodologies are reasonable in all material respects.
The Board also reviewed Fidelity's non-fund businesses and fall-out benefits related to the mutual fund business as well as cases where Fidelity's affiliates may benefit from or be related to the fund's business.
The Board considered the costs of the services provided by and the profits realized by Fidelity in connection with the operation of the fund and was satisfied that the profitability was not excessive in the circumstances.
Economies of Scale. The Board considered whether there have been economies of scale in respect of the management of the Fidelity funds, whether the Fidelity funds (including the fund) have appropriately benefited from any such economies of scale, and whether there is potential for realization of any further economies of scale. The Board considered the extent to which the fund will benefit from economies of scale through increased services to the fund, through waivers or reimbursements, or through fee or expense reductions. The Board also noted that in 2009, it and the board of other Fidelity funds created an ad hoc committee (the Economies of Scale Committee) to analyze whether FMR attains economies of scale in respect of the management and servicing of the Fidelity funds, whether the Fidelity funds have appropriately benefited from such economies of scale, and whether there is potential for realization of any further economies of scale.
The Board recognized that the fund's management contract incorporates a "group fee" structure, which provides for lower group fee rates as total fund assets under FMR's management increase, and for higher group fee rates as total fund assets under FMR's management decrease. FMR calculates the group fee rates based on a tiered asset "breakpoint" schedule that varies based on asset class. The Board considered that the group fee is designed to deliver the benefits of economies of scale to fund shareholders when total Fidelity fund assets increase, even if assets of any particular fund are unchanged or have declined, because some portion of Fidelity's costs are attributable to services provided to all Fidelity funds, and all funds benefit if those costs can be allocated among more assets. The Board concluded that, given the group fee structure, fund shareholders will benefit from lower management fees as assets under FMR's management increase at the fund complex level, regardless of whether Fidelity achieves any such economies of scale.
The Board concluded, taking into account the analysis of the Economies of Scale Committee, that any potential economies of scale are being appropriately shared between fund shareholders and Fidelity.
Additional Information Requested by the Board. In order to develop fully the factual basis for consideration of the Fidelity funds' Advisory Contracts, the Board requested and received additional information on certain topics, including (i) fund performance trends, actions to be taken by FMR to improve certain funds' overall performance, and Fidelity's long-term strategies for certain funds; (ii) portfolio manager changes that have occurred during the past year and length of portfolio manager tenure for different categories of funds over time; (iii) Fidelity's compensation structure for portfolio managers and other key personnel and strategies for attracting and retaining non-investment personnel; (iv) the amount of the investment that each portfolio manager has made in the Fidelity fund(s) that he or she manages; (v) historical trends in Fidelity's realization of fall-out benefits; (vi) Fidelity's group fee structures and the rationale for the individual fee rates of certain funds; (vii) fund profitability methodology and the impact of certain factors on fund profitability results; (viii) trends regarding industry use of performance fee structures and Fidelity's compliance practices with respect to performance adjustment calculations; (ix) the fee structures in place for certain other Fidelity clients; and (x) explanations regarding the relative total expense ratios of certain funds and classes, total expense competitive trends, and actions that might be taken by FMR to reduce total expense ratios for certain funds and classes.
Based on its evaluation of all of the conclusions noted above, and after considering all factors it believed relevant, the Board ultimately concluded that the advisory fee structures are fair and reasonable, and that the fund's Advisory Contracts should be renewed.
Annual Report
Investment Adviser
Fidelity Management & Research Company
Boston, MA
Investment Sub-Advisers
FMR Co., Inc.
Fidelity Management & Research (U.K.) Inc.
Fidelity Management & Research (Hong Kong) Limited
Fidelity Management & Research (Japan) Inc.
General Distributor
Fidelity Distributors Corporation
Boston, MA
Transfer and Service Agents
Fidelity Investments Institutional Operations Company, Inc.
Boston, MA
Fidelity Service Company, Inc.
Boston, MA
Custodian
JPMorgan Chase Bank
New York, NY
VCONIC-ANN-0212
1.817355.106
Fidelity® Variable Insurance Products:
Consumer Staples Portfolio
Annual Report
December 31, 2011
Contents
Performance | (Click Here) | How the fund has done over time. |
Management's Discussion of Fund Performance | (Click Here) | The Portfolio Manager's review of fundperformance and strategy. |
Shareholder Expense Example | (Click Here) | An example of shareholder expenses. |
Investment Changes | (Click Here) | A summary of major shifts in the fund's investments over the past six months. |
Investments | (Click Here) | A complete list of the fund's investments with their
market values. |
Financial Statements | (Click Here) | Statements of assets and liabilities, operations, and
changes in net assets, as well as financial highlights. |
Notes | (Click Here) | Notes to the financial statements. |
Report of Independent Registered Public Accounting Firm | (Click Here) | |
Trustees and Officers | (Click Here) | |
Distributions | (Click Here) | |
Board Approval of Investment Advisory Contracts and Management Fees | (Click Here) | |
To view a fund's proxy voting guidelines and proxy voting record for the 12-month period ended June 30, visit http://www.fidelity.com/proxyvotingresults or visit the Securities and Exchange Commission's (SEC) web site at http://www.sec.gov. You may also call 1-877-208-0098 to request a free copy of the proxy voting guidelines.
Fidelity Variable Insurance Products are separate account options which are purchased through a variable insurance contract.
Standard & Poor's, S&P and S&P 500 are registered service marks of The McGraw-Hill Companies, Inc. and have been licensed for use by Fidelity Distributors Corporation.
Other third party marks appearing herein are the property of their respective owners.
All other marks appearing herein are registered or unregistered trademarks or service marks of FMR LLC or an affiliated company.
This report and the financial statements contained herein are submitted for the general information of the shareholders of the fund. This report is not authorized for distribution to prospective investors in the fund unless preceded or accompanied by an effective prospectus.
A fund files its complete schedule of portfolio holdings with the SEC for the first and third quarters of each fiscal year on Form N-Q. Forms N-Q are available on the SEC's web site at http://www.sec.gov. A fund's Forms N-Q may be reviewed and copied at the SEC's Public Reference Room in Washington, DC. Information regarding the operation of the SEC's Public Reference Room may be obtained by calling 1-800-SEC-0330. For a complete list of a fund's portfolio holdings, view the most recent holdings listing, semiannual report, or annual report on Fidelity's web site at http://www.fidelity.com, http://www.advisor.fidelity.com, or http://www.401k.com, as applicable.
NOT FDIC INSURED • MAY LOSE VALUE • NO BANK GUARANTEE
Neither the fund nor Fidelity Distributors Corporation is a bank.
Annual Report
Average annual total return reflects the change in the value of an investment, assuming reinvestment of the class' distributions from dividend income and capital gains (the profits earned upon the sale of securities that have grown in value, if any) and assuming a constant rate of performance each year. During periods of reimbursement by Fidelity, a fund's total return will be greater than it would be had the reimbursement not occurred. Performance numbers are net of all underlying fund operating expenses, but do not include any insurance charges imposed by your insurance company's separate account. If performance information included the effect of these additional charges, the total returns would have been lower. How a fund did yesterday is no guarantee of how it will do tomorrow.
Average Annual Total Returns
Periods ended December 31, 2011 | Past 1
year | Life of
fundA |
VIP Consumer Staples Portfolio - Initial Class | 8.18% | 6.18% |
VIP Consumer Staples Portfolio - Investor Class | 8.07% | 6.08% |
A From April 24, 2007.
$10,000 Over Life of Fund
Let's say hypothetically that $10,000 was invested in VIP Consumer Staples Portfolio - Initial Class on April 24, 2007, when the fund started. The chart shows how the value of your investment would have changed, and also shows how the S&P 500® Index performed over the same period.
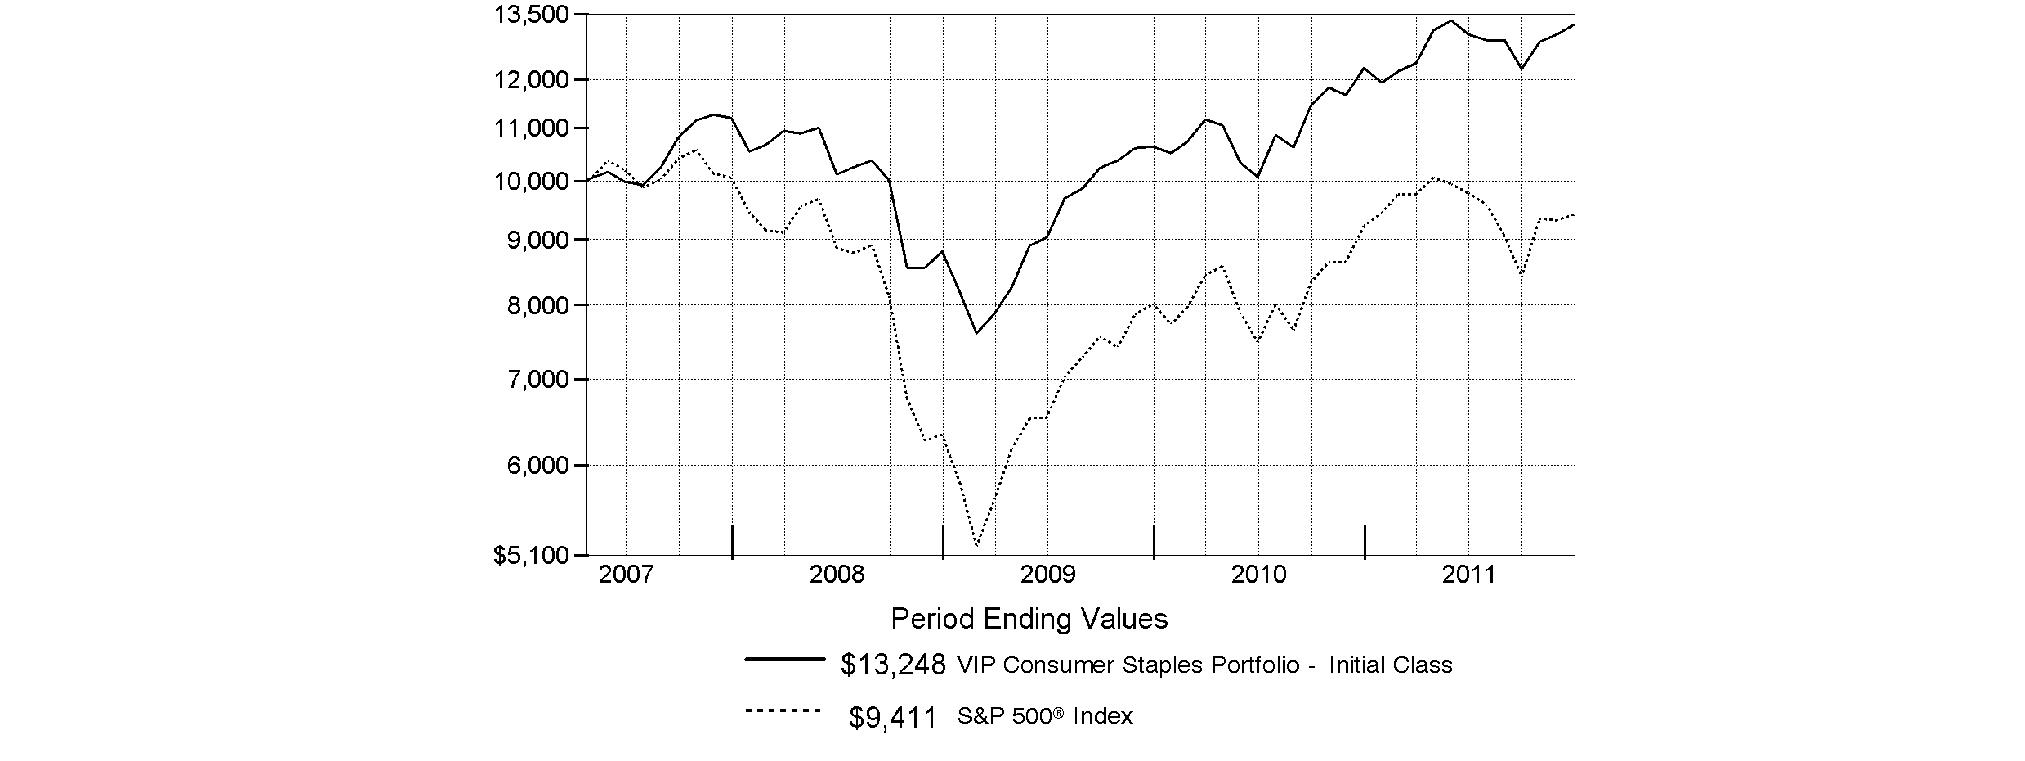
Annual Report
Market Recap: Extreme market volatility took center stage during the 12 months ending December 31, 2011, stealing the spotlight from signs of progress in the global economy. Early in the year, aggressive monetary stimulus by the U.S. federal government, improving credit-market conditions and solid corporate earnings buoyed most major asset classes. As the period progressed, however, fresh worries about sovereign debt in Europe, inflation in China, gridlock over raising the debt ceiling in the U.S. - along with Standard & Poor's early-August downgrade of the nation's long-term sovereign credit rating - and a dimmed outlook for global growth punctured investor confidence and ignited market instability. Domestic equities, as measured by the broad-based S&P 500® Index, gained 2.11%, easily outpacing the 13.61% decline of MSCI® ACWI® (All Country World Index) ex USA Index, a proxy for foreign stocks. Within the MSCI index, emerging markets declined the most (-18%), with investments here generally held back by a stronger U.S. dollar. The U.K. (-3%) fared better than the rest of Europe (-15%), which was the second-worst-performing index component. Bolstered by periodic flights to quality, U.S. investment-grade bonds posted a 7.84% advance, as reflected by the Barclays Capital® U.S. Aggregate Bond Index, outperforming the 4.37% gain of high-yield securities, as represented by The BofA Merrill LynchSM US High Yield Constrained Index. Hampered by financial woes in Europe, the sovereign debt of major developed markets outside the U.S. rose 4.86%, according to the Citigroup® Non-USD Group-of-Seven (G7) Equal Weighted Index, while the JPMorgan Emerging Markets Bond Index Global (EMBI Global) advanced 8.46%, despite the currency head wind.
Comments from Robert Lee, Portfolio Manager of VIP Consumer Staples Portfolio: For the 12 months ending December 31, 2011, the fund's share classes significantly underperformed the 13.82% gain of the MSCI® U.S. IM Consumer Staples 25/50 Index but decisively outperformed the 2.11% return of the S&P 500®. (For specific portfolio results, please refer to the performance section of this report.) The biggest drag on relative performance was weak stock picking in the personal products area, including stakes in cosmetics manufacturers L'Oreal, an out-of-index holding based in France, and Avon Products. L'Oreal suffered because investors viewed cosmetics as more economically sensitive than other staples, while Avon struggled with problems at a new distribution center. In the same group, not owning the strong-performing shares of major index-constituent Estee Lauder hurt when investors favored earnings stability over growth during much of the period. Large overweightings in brewers and distillers/vintners were costly, including positions in Molson Coors Brewing and global wine and spirits distributor Constellation Brands. Poor positioning in packaged foods/meats, including underweightings in Kraft Foods (since sold from the fund) and Green Mountain Coffee Roasters hurt, as did weak stock picking in tobacco, where a significant underweighting in Philip Morris International was the fund's biggest individual relative detractor. Philip Morris, which sells its tobacco products overseas, benefited from its earnings stability as well as from a temporary market share boost in Japan following that nation's natural disaster in March. In addition, many companies in the consumer staples sector do business globally and, as such, generate income in currencies around the world. The relative strength of the U.S. dollar during the past year had a negative impact on the dollar value of those earnings. On the positive side, favorable positioning in food distributors and a healthy underweighting in food retail boosted returns, including a lighter-than-index stake in grocery store operator Safeway, which the fund did not hold at period end. In tobacco, where we had poor results overall, a large out-of-index stake in British American Tobacco, the fund's top individual contributor, helped to offset those losses. Underweighting PepsiCo, a large index component, paid off, as did an out-of-index stake in British-based spirits distributor Diageo.
The views expressed above reflect those of the portfolio manager(s) only through the end of the period as stated on the cover of this report and do not necessarily represent the views of Fidelity or any other person in the Fidelity organization. Any such views are subject to change at any time based upon market or other conditions and Fidelity disclaims any responsibility to update such views. These views may not be relied on as investment advice and, because investment decisions for a Fidelity fund are based on numerous factors, may not be relied on as an indication of trading intent on behalf of any Fidelity fund.
Annual Report
As a shareholder of the Fund, you incur two types of costs: (1) transaction costs, including redemption fees, and (2) ongoing costs, including management fees and other Fund expenses. This Example is intended to help you understand your ongoing costs (in dollars) of investing in the Fund and to compare these costs with the ongoing costs of investing in other mutual funds.
The Example is based on an investment of $1,000 invested at the beginning of the period and held for the entire period (July 1, 2011 to December 31, 2011).
Actual Expenses
The first line of the accompanying table for each class of the Fund provides information about actual account values and actual expenses. You may use the information in this line, together with the amount you invested, to estimate the expenses that you paid over the period. Simply divide your account value by $1,000.00 (for example, an $8,600 account value divided by $1,000.00 = 8.6), then multiply the result by the number in the first line for a class of the Fund under the heading entitled "Expenses Paid During Period" to estimate the expenses you paid on your account during this period. The estimate of expenses does not include any fees or other expenses of any variable annuity or variable life insurance product. If they were, the estimate of expenses you paid during the period would be higher, and your ending account value would be lower. In addition, the Fund, as a shareholder in the underlying Fidelity Central Funds, will indirectly bear its pro-rata share of the fees and expenses incurred by the underlying Fidelity Central Funds. These fees and expenses are not included in the Fund's annualized expense ratio used to calculate the expense estimate in the table below.
Hypothetical Example for Comparison Purposes
The second line of the accompanying table for each class of the Fund provides information about hypothetical account values and hypothetical expenses based on a Class' actual expense ratio and an assumed rate of return of 5% per year before expenses, which is not the Class' actual return. The hypothetical account values and expenses may not be used to estimate the actual ending account balance or expenses you paid for the period. You may use this information to compare the ongoing costs of investing in the Fund and other funds. To do so, compare this 5% hypothetical example with the 5% hypothetical examples that appear in the shareholder reports of the other funds. The estimate of expenses does not include any fees or other expenses of any variable annuity or variable life insurance product. If they were, the estimate of expenses you paid during the period would be higher, and your ending account value would be lower. In addition, the Fund, as a shareholder in the underlying Fidelity Central Funds, will indirectly bear its pro-rata share of the fees and expenses incurred by the underlying Fidelity Central Funds. These fees and expenses are not included in the Fund's annualized expense ratio used to calculate the expense estimate in the table below.
Please note that the expenses shown in the table are meant to highlight your ongoing costs only and do not reflect any transaction costs. Therefore, the second line of the table is useful in comparing ongoing costs only, and will not help you determine the relative total costs of owning different funds. In addition, if these transactional costs were included, your costs would have been higher.
| Annualized Expense Ratio | Beginning
Account Value
July 1, 2011 | Ending
Account Value
December 31, 2011 | Expenses Paid
During Period*
July 1, 2011 to
December 31, 2011 |
Initial Class | .84% | | | |
Actual | | $ 1,000.00 | $ 1,017.80 | $ 4.27 |
Hypothetical A | | $ 1,000.00 | $ 1,020.97 | $ 4.28 |
Investor Class | .91% | | | |
Actual | | $ 1,000.00 | $ 1,016.70 | $ 4.63 |
Hypothetical A | | $ 1,000.00 | $ 1,020.62 | $ 4.63 |
A 5% return per year before expenses
* Expenses are equal to each Class' annualized expense ratio, multiplied by the average account value over the period, multiplied by 184/365 (to reflect the one-half year period).
Annual Report
Investment Changes (Unaudited)
Top Ten Stocks as of December 31, 2011 |
| % of fund's
net assets | % of fund's net assets
6 months ago |
Procter & Gamble Co. | 14.9 | 15.3 |
British American Tobacco PLC sponsored ADR | 10.8 | 7.6 |
The Coca-Cola Co. | 10.1 | 10.9 |
CVS Caremark Corp. | 5.3 | 7.2 |
Altria Group, Inc. | 4.7 | 4.9 |
PepsiCo, Inc. | 3.7 | 4.0 |
Walgreen Co. | 3.5 | 2.4 |
Philip Morris International, Inc. | 2.7 | 2.6 |
Molson Coors Brewing Co. Class B | 2.6 | 2.8 |
Constellation Brands, Inc. Class A (sub. vtg.) | 2.6 | 2.8 |
| 60.9 | |
Top Industries (% of fund's net assets) |
As of December 31, 2011 |
 | Beverages | 29.8% | |
 | Tobacco | 19.2% | |
 | Household Products | 17.8% | |
 | Food & Staples Retailing | 9.8% | |
 | Food Products | 9.1% | |
 | All Others* | 14.3% | |

As of June 30, 2011 |
| Beverages | 30.8% | |
| Household Products | 18.5% | |
| Tobacco | 15.9% | |
| Food & Staples Retailing | 11.5% | |
| Food Products | 9.7% | |
| All Others* | 13.6% | |

* Includes short-term investments and net other assets. |
Annual Report
Investments December 31, 2011
Showing Percentage of Net Assets
Common Stocks - 91.2% |
| Shares | | Value |
BEVERAGES - 29.8% |
Brewers - 5.9% |
Anheuser-Busch InBev SA NV | 25,098 | | $ 1,531,990 |
Carlsberg A/S Series B | 1,300 | | 91,682 |
Companhia de Bebidas das Americas (AmBev) (PN) sponsored ADR | 8,000 | | 288,720 |
Molson Coors Brewing Co. Class B | 36,113 | | 1,572,360 |
| | 3,484,752 |
Distillers & Vintners - 8.3% |
Constellation Brands, Inc. Class A (sub. vtg.) (a) | 75,892 | | 1,568,688 |
Diageo PLC sponsored ADR | 16,187 | | 1,415,068 |
Pernod Ricard SA | 9,955 | | 923,393 |
Remy Cointreau SA | 12,483 | | 1,003,250 |
Treasury Wine Estates Ltd. | 9,021 | | 33,949 |
| | 4,944,348 |
Soft Drinks - 15.6% |
Coca-Cola Bottling Co. CONSOLIDATED | 2,793 | | 163,530 |
Coca-Cola FEMSA SAB de CV sponsored ADR | 2,970 | | 282,774 |
Coca-Cola Hellenic Bottling Co. SA sponsored ADR | 4,400 | | 73,216 |
Coca-Cola Icecek A/S | 11,173 | | 133,957 |
Embotelladora Andina SA sponsored ADR | 11,183 | | 291,093 |
Fomento Economico Mexicano SAB de CV sponsored ADR | 685 | | 47,751 |
Hansen Natural Corp. (a) | 1,000 | | 92,140 |
PepsiCo, Inc. | 33,035 | | 2,191,872 |
The Coca-Cola Co. | 85,310 | | 5,969,141 |
| | 9,245,474 |
TOTAL BEVERAGES | | 17,674,574 |
FOOD & STAPLES RETAILING - 9.8% |
Drug Retail - 9.0% |
CVS Caremark Corp. | 76,942 | | 3,137,695 |
Drogasil SA | 20,984 | | 146,073 |
Walgreen Co. | 62,545 | | 2,067,738 |
| | 5,351,506 |
Food Distributors - 0.2% |
Chefs' Warehouse Holdings (a) | 500 | | 8,930 |
Sysco Corp. | 3,000 | | 87,990 |
United Natural Foods, Inc. (a) | 1,400 | | 56,014 |
| | 152,934 |
Food Retail - 0.4% |
Fresh Market, Inc. (a) | 200 | | 7,980 |
SUPERVALU, Inc. | 5,400 | | 43,848 |
Susser Holdings Corp. (a) | 349 | | 7,894 |
The Pantry, Inc. (a) | 14,338 | | 171,626 |
| | 231,348 |
|
| Shares | | Value |
Hypermarkets & Super Centers - 0.2% |
Carrefour SA | 4,566 | | $ 104,109 |
TOTAL FOOD & STAPLES RETAILING | | 5,839,897 |
FOOD PRODUCTS - 9.1% |
Agricultural Products - 3.0% |
Archer Daniels Midland Co. | 10,986 | | 314,200 |
Bunge Ltd. | 21,122 | | 1,208,178 |
Cosan Ltd. Class A | 1,500 | | 16,440 |
Cresud S.A.C.I.F. y A. sponsored ADR | 1,319 | | 15,023 |
Origin Agritech Ltd. (a) | 1,500 | | 3,540 |
SLC Agricola SA | 11,200 | | 93,173 |
Viterra, Inc. | 14,000 | | 147,643 |
| | 1,798,197 |
Packaged Foods & Meats - 6.1% |
Brasil Foods SA | 200 | | 3,909 |
Calavo Growers, Inc. | 6,129 | | 157,393 |
Cermaq ASA | 1,806 | | 21,201 |
Danone | 154 | | 9,682 |
Dean Foods Co. (a) | 14,900 | | 166,880 |
Diamond Foods, Inc. | 2,000 | | 64,540 |
Green Mountain Coffee Roasters, Inc. (a) | 8,694 | | 389,926 |
Mead Johnson Nutrition Co. Class A | 11,984 | | 823,660 |
Nestle SA | 12,120 | | 696,885 |
Unilever NV (NY Reg.) (d) | 34,309 | | 1,179,200 |
Want Want China Holdings Ltd. | 71,000 | | 70,848 |
| | 3,584,124 |
TOTAL FOOD PRODUCTS | | 5,382,321 |
HOUSEHOLD DURABLES - 0.0% |
Household Appliances - 0.0% |
SodaStream International Ltd. (a) | 200 | | 6,538 |
HOUSEHOLD PRODUCTS - 17.8% |
Household Products - 17.8% |
Colgate-Palmolive Co. | 15,657 | | 1,446,550 |
Procter & Gamble Co. | 132,622 | | 8,847,214 |
Spectrum Brands Holdings, Inc. (a) | 9,273 | | 254,080 |
| | 10,547,844 |
PERSONAL PRODUCTS - 3.0% |
Personal Products - 3.0% |
Avon Products, Inc. | 21,344 | | 372,880 |
Hypermarcas SA | 10,600 | | 48,358 |
L'Oreal SA | 9,400 | | 981,906 |
Natura Cosmeticos SA | 3,600 | | 70,060 |
Nu Skin Enterprises, Inc. Class A | 6,200 | | 301,134 |
| | 1,774,338 |
PHARMACEUTICALS - 2.5% |
Pharmaceuticals - 2.5% |
Johnson & Johnson | 22,484 | | 1,474,501 |
Common Stocks - continued |
| Shares | | Value |
TOBACCO - 19.2% |
Tobacco - 19.2% |
Altria Group, Inc. | 94,676 | | $ 2,807,143 |
British American Tobacco PLC sponsored ADR (d) | 67,409 | | 6,395,766 |
KT&G Corp. | 1,437 | | 100,660 |
Lorillard, Inc. | 2,600 | | 296,400 |
Philip Morris International, Inc. | 20,563 | | 1,613,784 |
Souza Cruz Industria Comerico | 12,000 | | 147,553 |
| | 11,361,306 |
TOTAL COMMON STOCKS (Cost $50,170,437) |
54,061,319
|
Money Market Funds - 9.5% |
| | | |
Fidelity Cash Central Fund, 0.11% (b) | 4,688,645 | | 4,688,645 |
Fidelity Securities Lending Cash Central Fund, 0.13% (b)(c) | 921,000 | | 921,000 |
TOTAL MONEY MARKET FUNDS (Cost $5,609,645) |
5,609,645
|
TOTAL INVESTMENT PORTFOLIO - 100.7% (Cost $55,780,082) | | 59,670,964 |
NET OTHER ASSETS (LIABILITIES) - (0.7)% | | (398,769) |
NET ASSETS - 100% | $ 59,272,195 |
Legend |
(a) Non-income producing |
(b) Affiliated fund that is available only to investment companies and other accounts managed by Fidelity Investments. The rate quoted is the annualized seven-day yield of the fund at period end. A complete unaudited listing of the fund's holdings as of its most recent quarter end is available upon request. In addition, each Fidelity Central Fund's financial statements, which are not covered by the Fund's Report of Independent Registered Public Accounting Firm, are available on the SEC's website or upon request. |
(c) Investment made with cash collateral received from securities on loan. |
(d) Security or a portion of the security is on loan at period end. |
Affiliated Central Funds |
Information regarding fiscal year to date income earned by the Fund from investments in Fidelity Central Funds is as follows: |
Fund | Income earned |
Fidelity Cash Central Fund | $ 2,978 |
Fidelity Securities Lending Cash Central Fund | 3,225 |
Total | $ 6,203 |
Other Information |
The following is a summary of the inputs used, as of December 31, 2011, involving the Fund's assets and liabilities carried at fair value. The inputs or methodology used for valuing securities may not be an indication of the risk associated with investing in those securities. For more information on valuation inputs, and their aggregation into the levels used in the table below, please refer to the Security Valuation section in the accompanying Notes to Financial Statements. |
Valuation Inputs at Reporting Date: |
Description | Total | Level 1 | Level 2 | Level 3 |
Investments in Securities: | | | | |
Common Stocks | $ 54,061,319 | $ 52,529,329 | $ 1,531,990 | $ - |
Money Market Funds | 5,609,645 | 5,609,645 | - | - |
Total Investments in Securities: | $ 59,670,964 | $ 58,138,974 | $ 1,531,990 | $ - |
Distribution of investments by country of issue, as a percentage of total net assets, is as follows: (Unaudited) |
United States of America | 70.2% |
United Kingdom | 13.2% |
France | 5.2% |
Belgium | 2.6% |
Bermuda | 2.0% |
Netherlands | 2.0% |
Brazil | 1.4% |
Switzerland | 1.2% |
Others (Individually Less Than 1%) | 2.2% |
| 100.0% |
See accompanying notes which are an integral part of the financial statements.
Annual Report
Statement of Assets and Liabilities
| December 31, 2011 |
| | |
Assets | | |
Investment in securities, at value (including securities loaned of $900,298) - See accompanying schedule: Unaffiliated issuers (cost $50,170,437) | $ 54,061,319 | |
Fidelity Central Funds (cost $5,609,645) | 5,609,645 | |
Total Investments (cost $55,780,082) | | $ 59,670,964 |
Receivable for investments sold | | 8,136 |
Receivable for fund shares sold | | 515,711 |
Dividends receivable | | 79,008 |
Distributions receivable from Fidelity Central Funds | | 552 |
Prepaid expenses | | 109 |
Other receivables | | 239 |
Total assets | | 60,274,719 |
| | |
Liabilities | | |
Payable for investments purchased | $ 13,531 | |
Payable for fund shares redeemed | 2 | |
Accrued management fee | 25,403 | |
Other affiliated payables | 7,662 | |
Other payables and accrued expenses | 34,926 | |
Collateral on securities loaned, at value | 921,000 | |
Total liabilities | | 1,002,524 |
| | |
Net Assets | | $ 59,272,195 |
Net Assets consist of: | | |
Paid in capital | | $ 55,895,877 |
Accumulated undistributed net realized gain (loss) on investments and foreign currency transactions | | (513,925) |
Net unrealized appreciation (depreciation) on investments and assets and liabilities in foreign currencies | | 3,890,243 |
Net Assets | | $ 59,272,195 |
Statement of Assets and Liabilities - continued
| December 31, 2011 |
Initial Class:
Net Asset Value, offering price and redemption price per share ($13,964,921 ÷ 1,124,793 shares) | | $ 12.42 |
| | |
Investor Class:
Net Asset Value, offering price and redemption price per share ($45,307,274 ÷ 3,656,517 shares) | | $ 12.39 |
See accompanying notes which are an integral part of the financial statements.
Annual Report
Statement of Operations
| Year ended December 31, 2011 |
| | |
Investment Income | | |
Dividends | | $ 907,425 |
Interest | | 1 |
Income from Fidelity Central Funds | | 6,203 |
Total income | | 913,629 |
| | |
Expenses | | |
Management fee | $ 193,717 | |
Transfer agent fees | 51,298 | |
Accounting and security lending fees | 13,596 | |
Custodian fees and expenses | 19,210 | |
Independent trustees' compensation | 186 | |
Audit | 41,586 | |
Legal | 98 | |
Miscellaneous | 235 | |
Total expenses before reductions | 319,926 | |
Expense reductions | (1,506) | 318,420 |
Net investment income (loss) | | 595,209 |
Realized and Unrealized Gain (Loss) Net realized gain (loss) on: | | |
Investment securities: | | |
Unaffiliated issuers | 127,357 | |
Foreign currency transactions | (11,128) | |
Total net realized gain (loss) | | 116,229 |
Change in net unrealized appreciation (depreciation) on: Investment securities | 2,380,620 | |
Assets and liabilities in foreign currencies | (398) | |
Total change in net unrealized appreciation (depreciation) | | 2,380,222 |
Net gain (loss) | | 2,496,451 |
Net increase (decrease) in net assets resulting from operations | | $ 3,091,660 |
Statement of Changes in Net Assets
| Year ended December 31, 2011 | Year ended December 31, 2010 |
Increase (Decrease) in Net Assets | | |
Operations | | |
Net investment income (loss) | $ 595,209 | $ 312,808 |
Net realized gain (loss) | 116,229 | 656,019 |
Change in net unrealized appreciation (depreciation) | 2,380,222 | 1,857,779 |
Net increase (decrease) in net assets resulting
from operations | 3,091,660 | 2,826,606 |
Distributions to shareholders from net investment income | (586,584) | (318,633) |
Share transactions - net increase (decrease) | 33,105,447 | 2,147,026 |
Redemption fees | 20,554 | 8,532 |
Total increase (decrease) in net assets | 35,631,077 | 4,663,531 |
| | |
Net Assets | | |
Beginning of period | 23,641,118 | 18,977,587 |
End of period (including undistributed net investment income of $0 and distributions in excess of net investment
income of $887, respectively) | $ 59,272,195 | $ 23,641,118 |
See accompanying notes which are an integral part of the financial statements.
Annual Report
Financial Highlights - Initial Class
Years ended December 31, | 2011 | 2010 | 2009 | 2008 | 2007 H |
Selected Per-Share Data | | | | | |
Net asset value, beginning of period | $ 11.61 | $ 10.22 | $ 8.60 | $ 11.08 | $ 10.00 |
Income from Investment Operations | | | | | |
Net investment income (loss) E | .21 | .17 | .15 | .15 | .08 |
Net realized and unrealized gain (loss) | .73 | 1.39 | 1.63 | (2.53) | 1.11 |
Total from investment operations | .94 | 1.56 | 1.78 | (2.38) | 1.19 |
Distributions from net investment income | (.14) | (.17) | (.16) | (.11) | (.04) |
Distributions from net realized gain | - | - | - | - | (.07) |
Total distributions | (.14) | (.17) | (.16) | (.11) | (.11) |
Redemption fees added to paid in capital E | .01 | - J | - J | .01 | - J |
Net asset value, end of period | $ 12.42 | $ 11.61 | $ 10.22 | $ 8.60 | $ 11.08 |
Total Return B, C, D | 8.18% | 15.23% | 20.73% | (21.35)% | 11.92% |
Ratios to Average Net Assets F, I | | | | | |
Expenses before reductions | .87% | 1.03% | 1.12% | 1.12% | 1.66% A |
Expenses net of fee waivers, if any | .87% | 1.00% | 1.00% | 1.00% | 1.00% A |
Expenses net of all reductions | .87% | .99% | 1.00% | 1.00% | 1.00% A |
Net investment income (loss) | 1.76% | 1.61% | 1.68% | 1.47% | 1.05% A |
Supplemental Data | | | | | |
Net assets, end of period (000 omitted) | $ 13,965 | $ 8,106 | $ 8,532 | $ 9,706 | $ 7,964 |
Portfolio turnover rate G | 18% | 60% | 71% | 91% | 35% A |
A Annualized B Total returns for periods of less than one year are not annualized. C Total returns do not reflect charges attributable to your insurance company's separate account. Inclusion of these charges would reduce the total returns shown. D Total returns would have been lower if certain expenses had not been reduced during the applicable periods shown. E Calculated based on average shares outstanding during the period. F Fees and expenses of any underlying Fidelity Central Funds are not included in the Fund's expense ratio. The Fund indirectly bears its proportionate share of the expenses of any underlying Fidelity Central Funds. G Amount does not include the portfolio activity of any underlying Fidelity Central Funds. H For the period April 24, 2007 (commencement of operations) to December 31, 2007. I Expense ratios reflect operating expenses of the class. Expenses before reductions do not reflect amounts reimbursed by the investment adviser or reductions from brokerage service arrangements or reductions from other expense offset arrangements and do not represent the amount paid by the class during periods when reimbursements or reductions occur. Expense ratios before reductions for start-up periods may not be representative of longer-term operating periods. Expenses net of fee waivers reflect expenses after reimbursement by the investment adviser but prior to reductions from brokerage service arrangements or other expense offset arrangements. Expenses net of all reductions represent the net expenses paid by the class. J Amount represents less than $.01 per share. |
Financial Highlights - Investor Class
Years ended December 31, | 2011 | 2010 | 2009 | 2008 | 2007 H |
Selected Per-Share Data | | | | | |
Net asset value, beginning of period | $ 11.59 | $ 10.21 | $ 8.59 | $ 11.07 | $ 10.00 |
Income from Investment Operations | | | | | |
Net investment income (loss) E | .20 | .16 | .14 | .14 | .07 |
Net realized and unrealized gain (loss) | .72 | 1.38 | 1.63 | (2.52) | 1.11 |
Total from investment operations | .92 | 1.54 | 1.77 | (2.38) | 1.18 |
Distributions from net investment income | (.13) | (.16) | (.15) | (.11) | (.04) |
Distributions from net realized gain | - | - | - | - | (.07) |
Total distributions | (.13) | (.16) | (.15) | (.11) | (.11) |
Redemption fees added to paid in capital E | .01 | - J | - J | .01 | - J |
Net asset value, end of period | $ 12.39 | $ 11.59 | $ 10.21 | $ 8.59 | $ 11.07 |
Total Return B, C, D | 8.07% | 15.09% | 20.68% | (21.41)% | 11.82% |
Ratios to Average Net Assets F, I | | | | | |
Expenses before reductions | .94% | 1.10% | 1.22% | 1.22% | 1.79% A |
Expenses net of fee waivers, if any | .94% | 1.08% | 1.08% | 1.08% | 1.15% A |
Expenses net of all reductions | .93% | 1.07% | 1.08% | 1.08% | 1.15% A |
Net investment income (loss) | 1.69% | 1.53% | 1.60% | 1.39% | .90% A |
Supplemental Data | | | | | |
Net assets, end of period (000 omitted) | $ 45,307 | $ 15,536 | $ 10,446 | $ 13,518 | $ 7,018 |
Portfolio turnover rate G | 18% | 60% | 71% | 91% | 35% A |
A Annualized B Total returns for periods of less than one year are not annualized. C Total returns do not reflect charges attributable to your insurance company's separate account. Inclusion of these charges would reduce the total returns shown. D Total returns would have been lower if certain expenses had not been reduced during the applicable periods shown. E Calculated based on average shares outstanding during the period. F Fees and expenses of any underlying Fidelity Central Funds are not included in the Fund's expense ratio. The Fund indirectly bears its proportionate share of the expenses of any underlying Fidelity Central Funds. G Amount does not include the portfolio activity of any underlying Fidelity Central Funds. H For the period April 24, 2007 (commencement of operations) to December 31, 2007. I Expense ratios reflect operating expenses of the class. Expenses before reductions do not reflect amounts reimbursed by the investment adviser or reductions from brokerage service arrangements or reductions from other expense offset arrangements and do not represent the amount paid by the class during periods when reimbursements or reductions occur. Expense ratios before reductions for start-up periods may not be representative of longer-term operating periods. Expenses net of fee waivers reflect expenses after reimbursement by the investment adviser but prior to reductions from brokerage service arrangements or other expense offset arrangements. Expenses net of all reductions represent the net expenses paid by the class. J Amount represents less than $.01 per share. |
See accompanying notes which are an integral part of the financial statements.
Annual Report
Notes to Financial Statements
For the period ended December 31, 2011
1. Organization.
VIP Consumer Staples Portfolio (the Fund) is a non-diversified fund of Variable Insurance Products Fund IV (the Trust) and is authorized to issue an unlimited number of shares. The Trust is registered under the Investment Company Act of 1940, as amended (the 1940 Act), as an open-end management investment company organized as a Massachusetts business trust. Shares of the Fund may only be purchased by insurance companies for the purpose of funding variable annuity or variable life insurance contracts. The Fund offers the following classes of shares: Initial Class shares and Investor Class shares. All classes have equal rights and voting privileges, except for matters affecting a single class. Investment income, realized and unrealized capital gains and losses, the common expenses of the Fund, and certain fund-level expense reductions, if any, are allocated on a pro-rata basis to each class based on the relative net assets of each class to the total net assets of the Fund. Each class differs with respect to transfer agent fees incurred. Certain expense reductions may also differ by class.
2. Investments in Fidelity Central Funds.
The Fund invests in Fidelity Central Funds, which are open-end investment companies available only to other investment companies and accounts managed by Fidelity Management & Research Company (FMR) and its affiliates. The Fund's Schedule of Investments lists each of the Fidelity Central Funds held as of period end, if any, as an investment of the Fund, but do not include the underlying holdings of each Fidelity Central Fund. As an Investing Fund, the Fund indirectly bears its proportionate share of the expenses of the underlying Fidelity Central Funds.
The Money Market Central Funds seek preservation of capital and current income and are managed by Fidelity Investments Money Management, Inc. (FIMM), an affiliate of FMR.
A complete unaudited list of holdings for each Fidelity Central Fund is available upon request or at the Securities and Exchange Commission (the SEC) web site at www.sec.gov. In addition, the financial statements of the Fidelity Central Funds, which are not covered by the Fund's Report of Independent Registered Public Accounting Firm, are available on the SEC web site or upon request.
3. Significant Accounting Policies.
The financial statements have been prepared in conformity with accounting principles generally accepted in the United States of America (GAAP), which require management to make certain estimates and assumptions at the date of the financial statements. Actual results could differ from those estimates. Subsequent events, if any, through the date that the financial statements were issued have been evaluated in the preparation of the financial statements. The following summarizes the significant accounting policies of the Fund:
Security Valuation. Investments are valued as of 4:00 p.m. Eastern time on the last calendar day of the period. The Fund uses independent pricing services approved by the Board of Trustees to value its investments. When current market prices or quotations are not readily available or reliable, valuations may be determined in good faith in accordance with procedures adopted by the Board of Trustees. Factors used in determining value may include market or security specific events. The frequency with which these procedures are used cannot be predicted and they may be utilized to a significant extent. The value used for net asset value (NAV) calculation under these procedures may differ from published prices for the same securities.
The Fund categorizes the inputs to valuation techniques used to value its investments into a disclosure hierarchy consisting of three levels as shown below:
Level 1 - quoted prices in active markets for identical investments
Level 2 - other significant observable inputs (including quoted prices for similar investments, interest rates, prepayment speeds, etc.)
Level 3 - unobservable inputs (including the Fund's own assumptions based on the best information available)
Changes in valuation techniques may result in transfers in or out of an assigned level within the disclosure hierarchy. The aggregate value of investments by input level, as of December 31, 2011, is included at the end of the Fund's Schedule of Investments. Valuation techniques used to value the Fund's investments by major category are as follows:
Equity securities, including restricted securities, for which market quotations are readily available, are valued at the last reported sale price or official closing price as reported by an independent pricing service on the primary market or exchange on which they are traded and are categorized as Level 1 in the hierarchy. In the event there were no sales during the day or closing prices are not available, securities are valued at the last quoted bid price or may be valued using the last available price and are generally categorized as Level 2 in the hierarchy. For foreign equity securities, when significant market or security specific events arise, comparisons to the valuation of American Depositary Receipts (ADRs), futures contracts, Exchange-traded funds (ETFs) and certain indexes as well as quoted prices for similar securities are used and are categorized as Level 2 in the hierarchy in these circumstances. Utilizing these techniques may result in transfers between Level 1 and Level 2. For restricted equity securities and private placements where observable inputs are limited, assumptions about market activity and risk are used and are categorized as Level 3 in the hierarchy.
Investments in open-end mutual funds,including the Fidelity Central Funds, are valued at their closing net asset value each business day and are categorized as Level 1 in the hierarchy.
Annual Report
Notes to Financial Statements - continued
3. Significant Accounting Policies - continued
New Accounting Pronouncements. In May 2011, the Financial Accounting Standards Board issued Accounting Standard Update No. 2011-04, Fair Value Measurement (Topic 820) - Amendments to Achieve Common Fair Value Measurement and Disclosure Requirements in U.S. GAAP and IFRSs. The update is effective during interim and annual periods beginning after December 15, 2011 and will result in additional disclosure for transfers between levels as well as expanded disclosure for securities categorized as Level 3 under the fair value hierarchy.
In December 2011, the Financial Accounting Standards Board issued Accounting Standard Update No. 2011-11, Disclosures about Offsetting Assets and Liabilities. The update creates new disclosure requirements requiring entities to disclose both gross and net information for derivatives and other financial instruments that are either offset in the Statement of Assets and Liabilities or subject to an enforceable master netting arrangement or similar agreement. The disclosure requirements are effective for annual reporting periods beginning on or after January 1, 2013. Management is currently evaluating the impact of the update's adoption on the Fund's financial statement disclosures.
Foreign Currency. The Fund may use foreign currency contracts to facilitate transactions in foreign-denominated securities. Gains and losses from these transactions may arise from changes in the value of the foreign currency or if the counterparties do not perform under the contracts' terms.
Foreign-denominated assets, including investment securities, and liabilities are translated into U.S. dollars at the exchange rate at period end. Purchases and sales of investment securities, income and dividends received and expenses denominated in foreign currencies are translated into U.S. dollars at the exchange rate in effect on the transaction date.
The effects of exchange rate fluctuations on investments are included with the net realized and unrealized gain (loss) on investment securities. Other foreign currency transactions resulting in realized and unrealized gain (loss) are disclosed separately.
Investment Transactions and Income. For financial reporting purposes, the Fund's investment holdings and NAV include trades executed through the end of the last business day of the period. The NAV per share for processing shareholder transactions is calculated as of the close of business of the New York Stock Exchange (NYSE), normally 4:00 p.m. Eastern time and includes trades executed through the end of the prior business day. Gains and losses on securities sold are determined on the basis of identified cost. Dividend income is recorded on the ex-dividend date, except for certain dividends from foreign securities where the ex-dividend date may have passed, which are recorded as soon as the Fund is informed of the ex-dividend date. Non-cash dividends included in dividend income, if any, are recorded at the fair market value of the securities received. Interest income and distributions from the Fidelity Central Funds are accrued as earned. Interest income includes coupon interest and amortization of premium and accretion of discount on debt securities. Investment income is recorded net of foreign taxes withheld where recovery of such taxes is uncertain.
Expenses. Expenses directly attributable to a fund are charged to that fund. Expenses attributable to more than one fund are allocated among the respective funds on the basis of relative net assets or other appropriate methods. Expense estimates are accrued in the period to which they relate and adjustments are made when actual amounts are known.
Income Tax Information and Distributions to Shareholders. Each year, the Fund intends to qualify as a regulated investment company, including distributing substantially all of its taxable income and realized gains under Subchapter M of the Internal Revenue Code. As a result, no provision for income taxes is required. As of December 31, 2011, the Fund did not have any unrecognized tax benefits in the financial statements; nor is the Fund aware of any tax positions for which it is reasonably possible that the total amounts of unrecognized tax benefits will significantly change in the next twelve months. The Fund files a U.S. federal tax return, in addition to state and local tax returns as required. A fund's tax returns are subject to examination by the Internal Revenue Service (IRS) for a period of three fiscal years. State and local tax returns may be subject to examination for an additional fiscal year depending on the jurisdiction. Foreign taxes are provided for based on the Fund's understanding of the tax rules and rates that exist in the foreign markets in which it invests.
Distributions are declared and recorded on the ex-dividend date. Income dividends and capital gain distributions are declared separately for each class. Income and capital gain distributions are determined in accordance with income tax regulations, which may differ from GAAP.
Capital accounts within the financial statements are adjusted for permanent book-tax differences. These adjustments have no impact on net assets or the results of operations. Temporary book-tax differences will reverse in a subsequent period.
Book-tax differences are primarily due to foreign currency transactions, capital loss carryforwards and losses deferred due to wash sales and excise tax regulations.
Annual Report
3. Significant Accounting Policies - continued
New Accounting Pronouncements - continued
The federal tax cost of investment securities and unrealized appreciation (depreciation) as of period end were as follows:
Gross unrealized appreciation | $ 5,287,917 |
Gross unrealized depreciation | (1,546,495) |
Net unrealized appreciation (depreciation) on securities and other investments | $ 3,741,422 |
| |
Tax Cost | $ 55,929,542 |
The tax-based components of distributable earnings as of period end were as follows:
Capital loss carryforward | $ (364,465) |
Net unrealized appreciation (depreciation) | $ 3,740,783 |
Capital loss carryforwards are only available to offset future capital gains of the Fund to the extent provided by regulations and may be limited. Under the Regulated Investment Company Modernization Act of 2010 (the Act), the Fund is permitted to carry forward capital losses incurred in taxable years beginning after December 22, 2010 for an unlimited period and such capital losses are required to be used prior to any losses that expire. Capital loss carryforwards were as follows:
Fiscal year of expiration | |
2017 | $ (364,465) |
The tax character of distributions paid was as follows:
| December 31, 2011 | December 31, 2010 |
Ordinary Income | $ 586,584 | $ 318,633 |
Trading (Redemption) Fees. Shares held by investors less than 60 days are subject to a redemption fee equal to 1% of the net asset value of shares redeemed. All redemption fees, which reduce the proceeds of the shareholder redemption, are retained by the Fund and accounted for as an addition to paid in capital.
4. Purchases and Sales of Investments.
Purchases and sales of securities, other than short-term securities, aggregated $34,827,952 and $6,035,239, respectively.
5. Fees and Other Transactions with Affiliates.
Management Fee. FMR and its affiliates provide the Fund with investment management related services for which the Fund pays a monthly management fee. The management fee is the sum of an individual fund fee rate that is based on an annual rate of .30% of the Fund's average net assets and an annualized group fee rate that averaged .26% during the period. The group fee rate is based upon the average net assets of all the mutual funds advised by FMR. The group fee rate decreases as assets under management increase and increases as assets under management decrease. For the period, the total annual management fee rate was .56% of the Fund's average net assets.
Transfer Agent Fees. Fidelity Investments Institutional Operations Company, Inc. (FIIOC), an affiliate of FMR, is the Fund's transfer, dividend disbursing, and shareholder servicing agent. FIIOC receives an asset-based fee with respect to each class. Each class (with the exception of Investor Class) pays a transfer agent fee, excluding out of pocket expenses, equal to an annual rate of .07% of average net assets. Investor Class pays a monthly asset-based transfer agent fee of .15% of average net assets. In addition, FIIOC receives an asset-based fee of .0045% of average net assets for typesetting, printing and mailing of shareholder reports, except proxy statements. FIIOC voluntarily agreed to waive this fee for the period August 1, 2011 through December 31, 2011 (see Expense Reductions note). For the period, transfer agent fees for each class, including printing and out of pocket expenses, were as follows:
Initial Class | $ 9,803 |
Investor Class | 41,495 |
| $ 51,298 |
Annual Report
Notes to Financial Statements - continued
5. Fees and Other Transactions with Affiliates - continued
Accounting and Security Lending Fees. Fidelity Service Company, Inc. (FSC), an affiliate of FMR, maintains the Fund's accounting records. The accounting fee is based on the level of average net assets for the month. Under a separate contract, FSC administers the security lending program. The security lending fee is based on the number and duration of lending transactions.
Brokerage Commissions. The Fund placed a portion of its portfolio transactions with brokerage firms which are affiliates of the investment adviser. The commissions paid to these affiliated firms were $561 for the period.
6. Committed Line of Credit.
The Fund participates with other funds managed by FMR or an affiliate in a $4.0 billion credit facility (the "line of credit") to be utilized for temporary or emergency purposes to fund shareholder redemptions or for other short-term liquidity purposes. The Fund has agreed to pay commitment fees on its pro-rata portion of the line of credit, which amounted to $83 and is reflected in Miscellaneous expenses on the Statement of Operations. During the period, there were no borrowings on this line of credit.
7. Security Lending.
The Fund lends portfolio securities through a lending agent from time to time in order to earn additional income. For equity securities, a lending agent is used and may loan securities to certain qualified borrowers, including Fidelity Capital Markets (FCM), a broker-dealer affiliated with the Fund. On the settlement date of the loan, the Fund receives collateral (in the form of U.S. Treasury obligations, letters of credit and/or cash) against the loaned securities and maintains collateral in an amount not less than 100% of the market value of the loaned securities during the period of the loan. The market value of the loaned securities is determined at the close of business of the Fund and any additional required collateral is delivered to the Fund on the next business day. If the borrower defaults on its obligation to return the securities loaned because of insolvency or other reasons, a fund could experience delays and costs in recovering the securities loaned or in gaining access to the collateral. Any cash collateral received is invested in the Fidelity Securities Lending Cash Central Fund. The value of loaned securities and cash collateral at period end are disclosed on the Fund's Statement of Assets and Liabilities. Security lending income represents the income earned on investing cash collateral, less rebates paid to borrowers and any lending agent fees associated with the loan, plus any premium payments received for lending certain types of securities. Security lending income is presented in the Statement of Operations as a component of income from Fidelity Central Funds. Total security lending income during the period amounted to $3,225. During the period, there were no securities loaned to FCM.
8. Expense Reductions.
FMR or its affiliates agreed to waive certain fees during the period as noted in the table below.
Initial Class | $ 235 |
Investor Class | 600 |
| $ 835 |
Many of the brokers with whom FMR places trades on behalf of the Fund provided services to the Fund in addition to trade execution. These services included payments of certain expenses on behalf of the Fund totaling $669 for the period. In addition, through arrangements with the Fund's custodian, credits realized as a result of uninvested cash balances were used to reduce the Fund's expenses. During the period, these credits reduced the Fund's custody expenses by $2.
9. Distributions to Shareholders.
Distributions to shareholders of each class were as follows:
Years ended December 31, | 2011 | 2010 |
From net investment income | | |
Initial Class | $ 146,052 | $ 114,030 |
Investor Class | 440,532 | 204,603 |
Total | $ 586,584 | $ 318,633 |
Annual Report
10. Share Transactions.
Transactions for each class of shares were as follows:
| Shares | Dollars |
Years ended December 31, | 2011 | 2010 | 2011 | 2010 |
Initial Class | | | | |
Shares sold | 718,569 | 208,392 | $ 8,696,006 | $ 2,240,019 |
Reinvestment of distributions | 12,110 | 9,881 | 146,052 | 114,030 |
Shares redeemed | (304,208) | (354,465) | (3,627,791) | (3,773,876) |
Net increase (decrease) | 426,471 | (136,192) | $ 5,214,267 | $ (1,419,827) |
Investor Class | | | | |
Shares sold | 2,693,054 | 656,909 | $ 32,352,847 | $ 7,132,294 |
Reinvestment of distributions | 36,589 | 17,761 | 440,532 | 204,603 |
Shares redeemed | (413,765) | (357,080) | (4,902,199) | (3,770,044) |
Net increase (decrease) | 2,315,878 | 317,590 | $ 27,891,180 | $ 3,566,853 |
11. Other.
The Fund's organizational documents provide former and current trustees and officers with a limited indemnification against liabilities arising in connection with the performance of their duties to the Fund. In the normal course of business, the Fund may also enter into contracts that provide general indemnifications. The Fund's maximum exposure under these arrangements is unknown as this would be dependent on future claims that may be made against the Fund. The risk of material loss from such claims is considered remote.
At the end of the period, FMR or its affiliates were the owners of record 100% of the total outstanding shares of the Fund.
Annual Report
Report of Independent Registered Public Accounting Firm
To the Trustees of Variable Insurance Products Fund IV and the Shareholders of VIP Consumer Staples Portfolio:
In our opinion, the accompanying statement of assets and liabilities, including the schedule of investments, and the related statements of operations and of changes in net assets and the financial highlights present fairly, in all material respects, the financial position of VIP Consumer Staples Portfolio (a fund of Variable Insurance Products Fund IV) at December 31, 2011, the results of its operations for the year then ended, the changes in its net assets for each of the two years in the period then ended and the financial highlights for each of the periods indicated, in conformity with accounting principles generally accepted in the United States of America. These financial statements and financial highlights (hereafter referred to as "financial statements") are the responsibility of the VIP Consumer Staples Portfolio's management. Our responsibility is to express an opinion on these financial statements based on our audits. We conducted our audits of these financial statements in accordance with the standards of the Public Company Accounting Oversight Board (United States). Those standards require that we plan and perform the audit to obtain reasonable assurance about whether the financial statements are free of material misstatement. An audit includes examining, on a test basis, evidence supporting the amounts and disclosures in the financial statements, assessing the accounting principles used and significant estimates made by management, and evaluating the overall financial statement presentation. We believe that our audits, which included confirmation of securities at December 31, 2011 by correspondence with the custodian and brokers, provide a reasonable basis for our opinion.
/s/ PricewaterhouseCoopers LLP
PricewaterhouseCoopers LLP
Boston, Massachusetts
February 14, 2012
Annual Report
The Trustees, Members of the Advisory Board, and executive officers of the trust and fund, as applicable, are listed below. The Board of Trustees governs the fund and is responsible for protecting the interests of shareholders. The Trustees are experienced executives who meet periodically throughout the year to oversee the fund's activities, review contractual arrangements with companies that provide services to the fund, oversee management of the risks associated with such activities and contractual arrangements, and review the fund's performance. Except for James C. Curvey, each of the Trustees oversees 226 funds advised by FMR or an affiliate. Mr. Curvey oversees 429 funds advised by FMR or an affiliate.
The Trustees hold office without limit in time except that (a) any Trustee may resign; (b) any Trustee may be removed by written instrument, signed by at least two-thirds of the number of Trustees prior to such removal; (c) any Trustee who requests to be retired or who has become incapacitated by illness or injury may be retired by written instrument signed by a majority of the other Trustees; and (d) any Trustee may be removed at any special meeting of shareholders by a two-thirds vote of the outstanding voting securities of the trust. Each Trustee who is not an interested person (as defined in the 1940 Act) (Independent Trustee), shall retire not later than the last day of the calendar year in which his or her 75th birthday occurs. The Independent Trustees may waive this mandatory retirement age policy with respect to individual Trustees. The executive officers and Advisory Board Members hold office without limit in time, except that any officer and Advisory Board Member may resign or may be removed by a vote of a majority of the Trustees at any regular meeting or any special meeting of the Trustees. Except as indicated, each individual has held the office shown or other offices in the same company for the past five years.
Experience, Skills, Attributes, and Qualifications of the Fund's Trustees. The Governance and Nominating Committee has adopted a statement of policy that describes the experience, qualifications, attributes, and skills that are necessary and desirable for potential Independent Trustee candidates (Statement of Policy). The Board believes that each Trustee satisfied at the time he or she was initially elected or appointed a Trustee, and continues to satisfy, the standards contemplated by the Statement of Policy. The Governance and Nominating Committee also engages professional search firms to help identify potential Independent Trustee candidates who have the experience, qualifications, attributes, and skills consistent with the Statement of Policy. From time to time, additional criteria based on the composition and skills of the current Independent Trustees, as well as experience or skills that may be appropriate in light of future changes to board composition, business conditions, and regulatory or other developments, have also been considered by the professional search firms and the Governance and Nominating Committee. In addition, the Board takes into account the Trustees' commitment and participation in Board and committee meetings, as well as their leadership of standing and ad hoc committees throughout their tenure.
In determining that a particular Trustee was and continues to be qualified to serve as a Trustee, the Board has considered a variety of criteria, none of which, in isolation, was controlling. The Board believes that, collectively, the Trustees have balanced and diverse experience, qualifications, attributes, and skills, which allow the Board to operate effectively in governing the fund and protecting the interests of shareholders. Information about the specific experience, skills, attributes, and qualifications of each Trustee, which in each case led to the Board's conclusion that the Trustee should serve (or continue to serve) as a trustee of the fund, is provided below.
Board Structure and Oversight Function. James C. Curvey is an interested person (as defined in the 1940 Act) and currently serves as Acting Chairman. The Trustees have determined that an interested Chairman is appropriate and benefits shareholders because an interested Chairman has a personal and professional stake in the quality and continuity of services provided to the fund. Independent Trustees exercise their informed business judgment to appoint an individual of their choosing to serve as Chairman, regardless of whether the Trustee happens to be independent or a member of management. The Independent Trustees have determined that they can act independently and effectively without having an Independent Trustee serve as Chairman and that a key structural component for assuring that they are in a position to do so is for the Independent Trustees to constitute a substantial majority for the Board. The Independent Trustees also regularly meet in executive session. Ned C. Lautenbach serves as Chairman of the Independent Trustees and as such (i) acts as a liaison between the Independent Trustees and management with respect to matters important to the Independent Trustees and (ii) with management prepares agendas for Board meetings.
Fidelity funds are overseen by different Boards of Trustees. The fund's Board oversees Fidelity's equity and high income funds and another Board oversees Fidelity's investment-grade bond, money market, and asset allocation funds. The asset allocation funds may invest in Fidelity funds overseen by the fund's Board. The use of separate Boards, each with its own committee structure, allows the Trustees of each group of Fidelity funds to focus on the unique issues of the funds they oversee, including common research, investment, and operational issues. On occasion, the separate Boards establish joint committees to address issues of overlapping consequences for the Fidelity funds overseen by each Board.
The Trustees operate using a system of committees to facilitate the timely and efficient consideration of all matters of importance to the Trustees, the fund, and fund shareholders and to facilitate compliance with legal and regulatory requirements and oversight of the fund's activities and associated risks. The Board, acting through its committees, has charged FMR and its affiliates with (i) identifying events or circumstances the occurrence of which could have demonstrably adverse effects on the fund's business and/or reputation; (ii) implementing processes and controls to lessen the possibility that such events or circumstances occur or to mitigate the effects of such events or circumstances if they do occur; and (iii) creating and maintaining a system designed to evaluate continuously business and market conditions in order to facilitate the identification and implementation processes described in (i) and (ii) above. Because the day-to-day operations and activities of the fund are carried out by or through FMR, its affiliates and other service providers, the fund's exposure to risks is mitigated but not eliminated by the processes overseen by the Trustees. While each of the Board's committees has responsibility for overseeing different aspects of the fund's activities, oversight is exercised primarily through the Operations, Audit, and Compliance Committees. In addition, the Independent Trustees have worked with FMR to enhance the Board's oversight of investment and financial risks, legal and regulatory risks, technology risks, and operational risks, including the development of additional risk reporting to the Board. For example, a working group comprised of Independent Trustees and FMR has worked and continues to work to review the Fidelity funds' valuation-related activities, reporting and risk management. Appropriate personnel, including but not limited to the fund's Chief Compliance Officer (CCO), FMR's internal auditor, the independent accountants, the fund's Treasurer and portfolio management personnel, make periodic reports to the Board's committees, as appropriate, including an annual review of FMR's risk management program for the Fidelity funds. The responsibilities of each standing committee, including their oversight responsibilities, are described further under "Standing Committees of the Fund's Trustees."
Annual Report
The fund's Statement of Additional Information (SAI) includes more information about the Trustees. To request a free copy, call Fidelity at 1-877-208-0098.
Interested Trustees*:
Correspondence intended for each Trustee who is an interested person may be sent to Fidelity Investments, 82 Devonshire Street, Boston, Massachusetts 02109.
Name, Age; Principal Occupations and Other Relevant Experience+ |
James C. Curvey (76) |
| Year of Election or Appointment: 2007 Mr. Curvey is Trustee and Acting Chairman of the Board of Trustees of certain Trusts. Mr. Curvey also serves as Trustee (2007-present) of other investment companies advised by FMR. Mr. Curvey is a Director of Fidelity Investments Money Management, Inc. (2009-present), Director of Fidelity Research & Analysis Co. (2009-present) and Director of FMR and FMR Co., Inc. (2007-present). Mr. Curvey is also Vice Chairman (2007-present) and Director of FMR LLC. In addition, Mr. Curvey serves as an Overseer for the Boston Symphony Orchestra and a member of the Trustees of Villanova University. Previously, Mr. Curvey was the Vice Chairman (2006-2007) and Director (2000-2007) of FMR Corp. |
Ronald P. O'Hanley (54) |
| Year of Election or Appointment: 2011 Mr. O'Hanley is Director of FMR Co., Inc. (2010-present), Director of Fidelity Investments Money Management, Inc. (2010-present), Director of Fidelity Research & Analysis Company (2010-present), President of Fidelity Asset Management and Corporate Services and a member of Fidelity's Executive Committee (2010-present). Previously, Mr. O'Hanley served as President and Chief Executive Officer of BNY Mellon Asset Management (2007-2010). Mr. O'Hanley also served as Vice Chairman of Bank New York Mellon Corp. and a member of that firm's Executive Committee. Prior to the 2007 merger of The Bank of New York and Mellon Financial Corporation, he was Vice Chairman of Mellon Financial Corporation and President and Chief Executive Officer of Mellon Asset Management. He joined Mellon in February 1997. Mr. O'Hanley currently serves as Chairman of the Boston Public Library Foundation Board of Directors and sits on the Board of Directors of Beth Israel Deaconess Medical Center, the Board of Trustees of the Marine Biological Laboratory and the Advisory Board of the Maxwell School of Citizenship and Public Administration at Syracuse University. Mr. O'Hanley also chairs the Council on Asset Management for the Financial Services Roundtable and is a member of the Board of Directors of Institutional Investor's U.S. Institute. |
* Trustees have been determined to be "Interested Trustees" by virtue of, among other things, their affiliation with the trust or various entities under common control with FMR.
+ The information above includes each Trustee's principal occupation during the last five years and other information relating to the experience, attributes, and skills relevant to each Trustee's qualifications to serve as a Trustee, which led to the conclusion that each Trustee should serve as a Trustee for the fund.
Independent Trustees:
Correspondence intended for each Independent Trustee (that is, the Trustees other than the Interested Trustees) may be sent to Fidelity Investments, P.O. Box 55235, Boston, Massachusetts 02205-5235.
Name, Age; Principal Occupations and Other Relevant Experience+ |
Dennis J. Dirks (63) |
| Year of Election or Appointment: 2005 Prior to his retirement in May 2003, Mr. Dirks was Chief Operating Officer and a member of the Board of The Depository Trust & Clearing Corporation (DTCC). He also served as President, Chief Operating Officer, and Board member of The Depository Trust Company (DTC) and President and Board member of the National Securities Clearing Corporation (NSCC). In addition, Mr. Dirks served as Chief Executive Officer and Board member of the Government Securities Clearing Corporation, Chief Executive Officer and Board member of the Mortgage-Backed Securities Clearing Corporation, as a Trustee and a member of the Finance Committee of Manhattan College (2005-2008), and as a Trustee and a member of the Finance Committee of AHRC of Nassau County (2006-2008). Mr. Dirks is a member of the Independent Directors Council (IDC) Governing Council (2010-present) and Board of Directors for The Brookville Center for Children's Services, Inc. (2009-present). |
Alan J. Lacy (58) |
| Year of Election or Appointment: 2008 Mr. Lacy serves as Senior Adviser (2007-present) of Oak Hill Capital Partners, L.P. (private equity). Mr. Lacy also served as Chief Executive Officer (2000-2005) and Vice Chairman (2005-2006) of Sears Holdings Corporation and Sears, Roebuck and Co. (retail). In addition, Mr. Lacy serves as a member of the Board of Directors of Dave & Buster's, Inc. (restaurant and entertainment complexes, 2010-present), The Hillman Companies, Inc. (hardware wholesalers, 2010-present), and Bristol-Myers Squibb Company (global pharmaceuticals, 2007-present). Mr. Lacy is a member of the Board of Trustees of The National Parks Conservation Association (2006-present). Previously, Mr. Lacy served as Chairman of the Board of Trustees of the National Parks Conservation Association (2008-2011) and as a member of the Board of Directors for the Western Union Company (global money transfer, 2006-2011). |
Ned C. Lautenbach (67) |
| Year of Election or Appointment: 2000 Mr. Lautenbach is Chairman of the Independent Trustees of the Equity and High Income Funds (2006-present). Mr. Lautenbach currently serves as the Lead Director of the Eaton Corporation Board of Directors (diversified industrial, 1997-present). Mr. Lautenbach is also a member of the Board of Directors of the Philharmonic Center for the Arts in Naples, Florida (1999-present); a member of the Board of Trustees of Fairfield University (2005-present); and a member of the Council on Foreign Relations (1994-present). Previously, Mr. Lautenbach was a Partner/Advisory Partner at Clayton, Dubilier & Rice, LLC (private equity investment, 1998-2010), as well as a Director of Sony Corporation (2006-2007). |
Joseph Mauriello (67) |
| Year of Election or Appointment: 2008 Prior to his retirement in January 2006, Mr. Mauriello served in numerous senior management positions including Deputy Chairman and Chief Operating Officer (2004-2005), and Vice Chairman of Financial Services (2002-2004) of KPMG LLP US (professional services, 1965-2005). Mr. Mauriello currently serves as a member of the Board of Directors of XL Group plc. (global insurance and re-insurance, 2006-present) and of Arcadia Resources Inc. (health care services and products, 2007-present). Previously, Mr. Mauriello served as a Director of the Hamilton Funds of the Bank of New York (2006-2007). |
Robert W. Selander (61) |
| Year of Election or Appointment: 2011 Previously, Mr. Selander served as a Member of the Advisory Board of Fidelity's Equity and High Income Funds (2011), Executive Vice Chairman (2010), Chief Executive Officer (2009-2010), and President and Chief Executive Officer (1997-2009) of Mastercard, Inc. |
Cornelia M. Small (67) |
| Year of Election or Appointment: 2005 Ms. Small is a member of the Board of Directors of the Teagle Foundation (2009-present). Ms. Small is also a member of the Investment Committee, and Chair (2008-present) and a member of the Board of Trustees of Smith College. In addition, Ms. Small serves on the Investment Committee of the Berkshire Taconic Community Foundation (2008-present). Previously, Ms. Small served as Chairperson of the Investment Committee (2002-2008) of Smith College. In addition, Ms. Small served as Chief Investment Officer, Director of Global Equity Investments, and a member of the Board of Directors of Scudder, Stevens & Clark and Scudder Kemper Investments. |
William S. Stavropoulos (72) |
| Year of Election or Appointment: 2001 Mr. Stavropoulos is Vice Chairman of the Independent Trustees of the Equity and High Income Funds (2006-present). Mr. Stavropoulos serves as President and Founder of the Michigan Baseball Foundation, the Great Lakes Loons (2007-present). Mr. Stavropoulos is Chairman Emeritus of the Board of Directors of The Dow Chemical Company, where he previously served in numerous senior management positions, including President, CEO (1995-2000; 2002-2004), Chairman of the Executive Committee (2000-2006), and as a member of the Board of Directors (1990-2006). Currently, Mr. Stavropoulos is Chairman of Univar (global distributor of commodity and specialty chemicals, 2010-present), a Director of Teradata Corporation (data warehousing and technology solutions, 2008-present), Chemical Financial Corporation, Maersk Inc. (industrial conglomerate), Tyco International, Inc. (multinational manufacturing and services, 2007-present), and a member of the Advisory Board for Metalmark Capital (private equity investment, 2005-present). Mr. Stavropoulos is a special advisor to Clayton, Dubilier & Rice, LLC (private equity investment). In addition, Mr. Stavropoulos is a member of the University of Notre Dame Advisory Council for the College of Science. |
David M. Thomas (62) |
| Year of Election or Appointment: 2008 Previously, Mr. Thomas served as Executive Chairman (2005-2006) and Chairman and Chief Executive Officer (2000-2005) of IMS Health, Inc. (pharmaceutical and healthcare information solutions). In addition, Mr. Thomas serves as a member of the Board of Directors of Fortune Brands, Inc. (consumer products), and Interpublic Group of Companies, Inc. (marketing communication, 2004-present). |
Michael E. Wiley (61) |
| Year of Election or Appointment: 2008 Mr. Wiley also serves as a Director of Asia Pacific Exploration Consolidated (international oil and gas exploration and production, 2008-present). Mr. Wiley serves as a Director of Tesoro Corporation (independent oil refiner and marketer, 2005-present), and a Director of Bill Barrett Corporation (exploration and production, 2005-present). In addition, Mr. Wiley also serves as a Director of Post Oak Bank (privately-held bank, 2004-present). Previously, Mr. Wiley served as a member of the Board of Trustees of the University of Tulsa (2000-2006; 2007-2010), as a Senior Energy Advisor of Katzenbach Partners, LLC (consulting, 2006-2007), as an Advisory Director of Riverstone Holdings (private investment), Chairman, President, and CEO of Baker Hughes, Inc. (oilfield services, 2000-2004), and as Director of Spinnaker Exploration Company (exploration and production, 2001-2005). |
+ The information above includes each Trustee's principal occupation during the last five years and other information relating to the experience, attributes, and skills relevant to each Trustee's qualifications to serve as a Trustee, which led to the conclusion that each Trustee should serve as a Trustee for the fund.
Advisory Board Members and Executive Officers:
Correspondence intended for each executive officer, Edward C. Johnson 3d, and Peter S. Lynch may be sent to Fidelity Investments, 82 Devonshire Street, Boston, Massachusetts 02109.
Name, Age; Principal Occupation |
Edward C. Johnson 3d (81) |
| Year of Election or Appointment: 2011 Member of the Advisory Board of Fidelity's Equity and High Income Funds. Mr. Johnson serves as Chief Executive Officer, Chairman, and a Director of FMR LLC, and also serves as Chairman and Director of FIL Limited. Previously, Mr. Johnson served as a Trustee and Chairman of the Board of certain Fidelity Trusts, Chairman and a Director of FMR, Chairman and a Director of FMR Co., Inc., and President of FMR LLC (2006-2007). |
Peter S. Lynch (67) |
| Year of Election or Appointment: 2003 Member of the Advisory Board of Fidelity's Equity and High Income Funds. Mr. Lynch is Vice Chairman and a Director of FMR and FMR Co., Inc. In addition, Mr. Lynch serves as a Trustee of Boston College and as the Chairman of the Inner-City Scholarship Fund. Previously, Mr. Lynch served on the Special Olympics International Board of Directors (1997-2006). |
Kenneth B. Robins (42) |
| Year of Election or Appointment: 2008 President and Treasurer of Fidelity's Equity and High Income Funds. Mr. Robins also serves as President and Treasurer (2010-present) and Assistant Treasurer (2009-present) of other Fidelity funds and is an employee of Fidelity Investments (2004-present). Previously, Mr. Robins served as Deputy Treasurer of the Fidelity funds (2005-2008) and Treasurer and Chief Financial Officer of The North Carolina Capital Management Trust: Cash and Term Portfolios (2006-2008). |
Brian B. Hogan (47) |
| Year of Election or Appointment: 2009 Vice President of Equity and High Income Funds. Mr. Hogan also serves as President of FMR's Equity Division (2009-present). Previously, Mr. Hogan served as Senior Vice President, Equity Research of FMR (2006-2009) and as a portfolio manager. |
Christopher S. Bartel (40) |
| Year of Election or Appointment: 2009 Vice President of Fidelity's Sector and Real Estate Equity Funds. Mr. Bartel also serves as Senior Vice President of Equity Research (2009-present). Previously, Mr. Bartel served as Managing Director of Research (2006-2009) and an analyst and portfolio manager (2000-2006). |
Scott C. Goebel (43) |
| Year of Election or Appointment: 2008 Secretary and Chief Legal Officer (CLO) of the Fidelity funds. Mr. Goebel also serves as Secretary of Fidelity Investments Money Management, Inc. (FIMM) (2010-present) and Fidelity Research and Analysis Company (FRAC) (2010-present); Secretary and CLO of The North Carolina Capital Management Trust: Cash and Term Portfolios (2008-present); General Counsel, Secretary, and Senior Vice President of FMR (2008-present) and FMR Co., Inc. (2008-present); employed by FMR LLC or an affiliate (2001-present); Chief Legal Officer of Fidelity Management & Research (Hong Kong) Limited (2008-present) and Assistant Secretary of Fidelity Management & Research (Japan) Inc. (2008-present), and Fidelity Management & Research (U.K.) Inc. (2008-present). Previously, Mr. Goebel served as Assistant Secretary of FIMM (2008-2010), FRAC (2008-2010), and the Funds (2007-2008) and as Vice President and Secretary of Fidelity Distributors Corporation (FDC) (2005-2007). |
William C. Coffey (42) |
| Year of Election or Appointment: 2009 Assistant Secretary of Fidelity's Equity and High Income Funds. Mr. Coffey also serves as Senior Vice President and Deputy General Counsel of FMR LLC (2010-present), and is an employee of Fidelity Investments. Previously, Mr. Coffey served as Vice President and Associate General Counsel of FMR LLC (2005-2009). |
Holly C. Laurent (57) |
| Year of Election or Appointment: 2008 Anti-Money Laundering (AML) Officer of the Fidelity funds. Ms. Laurent also serves as AML Officer of The North Carolina Capital Management Trust: Cash and Term Portfolios (2008-present) and is an employee of Fidelity Investments. Previously, Ms. Laurent was Senior Vice President and Head of Legal for Fidelity Business Services India Pvt. Ltd. (2006-2008), and Senior Vice President, Deputy General Counsel and Group Head for FMR LLC (2005-2006). |
Christine Reynolds (53) |
| Year of Election or Appointment: 2008 Chief Financial Officer of the Fidelity funds. Ms. Reynolds became President of Fidelity Pricing and Cash Management Services (FPCMS) in August 2008. Ms. Reynolds served as Chief Operating Officer of FPCMS (2007-2008). Previously, Ms. Reynolds served as President, Treasurer, and Anti-Money Laundering officer of the Fidelity funds (2004-2007). |
Kenneth A. Rathgeber (64) |
| Year of Election or Appointment: 2004 Chief Compliance Officer of Fidelity's Equity and High Income Funds. Mr. Rathgeber is Chief Compliance Officer of Fidelity Management & Research (Hong Kong) Limited (2008-present), Fidelity Management & Research (Japan) Inc. (2008-present), FMR (2005-present), FMR Co., Inc. (2005-present), Fidelity Management & Research (U.K.) Inc. (2005-present), Fidelity Research & Analysis Company (2005-present), Fidelity Investments Money Management, Inc. (2005-present), Pyramis Global Advisors, LLC (2005-present), and Strategic Advisers, Inc. (2005-present). |
Jeffrey S. Christian (50) |
| Year of Election or Appointment: 2009 Deputy Treasurer of the Fidelity funds. Mr. Christian is an employee of Fidelity Investments. Previously, Mr. Christian served as Chief Financial Officer (2008-2009) of certain Fidelity funds and Senior Vice President of Fidelity Pricing and Cash Management Services (FPCMS) (2004-2009). |
Joseph F. Zambello (54) |
| Year of Election or Appointment: 2011 Deputy Treasurer of the Fidelity funds. Mr. Zambello is an employee of Fidelity Investments. Previously, Mr. Zambello served as Vice President of FMR's Program Management Group (2009-2011) and Vice President of the Transfer Agent Oversight Group (2005-2009). |
Adrien E. Deberghes (44) |
| Year of Election or Appointment: 2008 Deputy Treasurer of Fidelity's Equity and High Income Funds. Mr. Deberghes also serves as Vice President and Assistant Treasurer of Fidelity Rutland Square Trust II and Fidelity Commonwealth Trust II (2011-present), Assistant Treasurer of other Fidelity funds (2010-present), and is an employee of Fidelity Investments (2008-present). Previously, Mr. Deberghes served as Senior Vice President of Mutual Fund Administration at State Street Corporation (2007-2008), Senior Director of Mutual Fund Administration at Investors Bank & Trust (2005-2007), and Director of Finance for Dunkin' Brands (2000-2005). |
Stephanie J. Dorsey (42) |
| Year of Election or Appointment: 2010 Assistant Treasurer of Fidelity's Equity and High Income Funds. Ms. Dorsey also serves as Deputy Treasurer of other Fidelity funds (2008-present) and is an employee of Fidelity Investments (2008-present). Previously, Ms. Dorsey served as Treasurer (2004-2008) of the JPMorgan Mutual Funds and Vice President (2004-2008) of JPMorgan Chase Bank. |
John R. Hebble (53) |
| Year of Election or Appointment: 2009 Assistant Treasurer of Fidelity's Equity and High Income Funds. Mr. Hebble also serves as President (2011-present), Treasurer, and Chief Financial Officer of The North Carolina Capital Management Trust: Cash and Term Portfolios (2008-present), President and Treasurer of other Fidelity funds (2008-present) and is an employee of Fidelity Investments. |
Gary W. Ryan (53) |
| Year of Election or Appointment: 2005 Assistant Treasurer of the Fidelity funds. Mr. Ryan is an employee of Fidelity Investments. Previously, Mr. Ryan served as Vice President of Fund Reporting in Fidelity Pricing and Cash Management Services (FPCMS) (1999-2005). |
Jonathan Davis (43) |
| Year of Election or Appointment: 2010 Assistant Treasurer of the Fidelity funds. Mr. Davis is also Assistant Treasurer of Fidelity Rutland Square Trust II and Fidelity Commonwealth Trust II. Mr. Davis is an employee of Fidelity Investments. Previously, Mr. Davis served as Vice President and Associate General Counsel of FMR LLC (2003-2010). |
Annual Report
Initial Class and Investor Class designate 100% of the dividends distributed in December 2011, during the fiscal year as qualifying for the dividends-received deduction for corporate shareholders.
Annual Report
Board Approval of Investment Advisory Contracts and Management Fees
VIP Consumer Staples Portfolio
Each year, the Board of Trustees, including the Independent Trustees (together, the Board), votes on the renewal of the management contract and sub-advisory agreements (together, the Advisory Contracts) for the fund. The Board, assisted by the advice of fund counsel and Independent Trustees' counsel, requests and considers a broad range of information relevant to the renewal of the Advisory Contracts throughout the year.
The Board meets regularly and considers at each of its meetings factors that are relevant to its annual consideration of the renewal of the fund's Advisory Contracts, including the services and support provided to the fund and its shareholders. The Board has established various standing committees, each composed of Independent Trustees with varying backgrounds, to which the Board has assigned specific subject matter responsibilities in order to enhance effective decision-making by the Board. The Board, acting directly and through its Committees, requests and receives information concerning the annual consideration of the renewal of the fund's Advisory Contracts. The Board also meets as needed to consider matters specifically related to the Board's annual consideration of the renewal of Advisory Contracts. Members of the Board may also meet with trustees of other Fidelity funds through ad hoc joint committees to discuss certain matters relevant to the Fidelity funds.
At its July 2011 meeting, the Board of Trustees, including the Independent Trustees, unanimously determined to renew the fund's Advisory Contracts. In reaching its determination, the Board considered all factors it believed relevant, including (i) the nature, extent, and quality of the services to be provided to the fund and its shareholders (including the investment performance of the fund); (ii) the competitiveness of the fund's management fee and total expense ratio; (iii) the total costs of the services to be provided by and the profits to be realized by Fidelity from its relationship with the fund; (iv) the extent to which economies of scale would be realized as the fund grows; and (v) whether fee levels reflect these economies of scale, if any, for the benefit of fund shareholders.
In considering whether to renew the Advisory Contracts for the fund, the Board reached a determination, with the assistance of fund counsel and Independent Trustees' counsel and through the exercise of its business judgment, that the renewal of the Advisory Contracts is in the best interests of the fund and its shareholders and that the compensation payable under the Advisory Contracts is fair and reasonable. The Board's decision to renew the Advisory Contracts was not based on any single factor, but rather was based on a comprehensive consideration of all the information provided to the Board at its meetings throughout the year. The Board, in reaching its determination to renew the Advisory Contracts, is aware that shareholders in the fund have a broad range of investment choices available to them, including a wide choice among mutual funds offered by Fidelity's competitors, and that the fund's shareholders, who have the opportunity to review and weigh the disclosure provided by the fund in its prospectus and other public disclosures, have chosen to invest in this fund, managed by Fidelity.
Nature, Extent, and Quality of Services Provided. The Board considered the staffing within the investment adviser, FMR, and the sub-advisers (together, the Investment Advisers), including the backgrounds of the fund's investment personnel and the fund's investment objective and discipline. The Independent Trustees also had discussions with senior management of Fidelity's investment operations and investment groups. The Board considered the structure of the portfolio manager compensation program and whether this structure provides appropriate incentives to act in the best interests of the fund.
Resources Dedicated to Investment Management and Support Services. The Board and the Fund Oversight and Research Committees reviewed the general qualifications and capabilities of the Investment Advisers' investment staff, including its size, education, experience, and resources, as well as the Investment Advisers' approach to recruiting, training, managing, and compensating investment personnel. The Board also noted that FMR has devoted increased resources to non-U.S. offices. The Board noted that Fidelity's analysts have extensive resources, tools and capabilities which allow them to conduct sophisticated quantitative and fundamental analysis, as well as credit analysis of issuers, counterparties and enhancers. The Board also believes that Fidelity's investment professionals have sufficient access to global information and data so as to provide competitive investment results over time, and that those professionals also have access to sophisticated tools which permit them to assess portfolio construction and risk and performance attribution characteristics continuously, as well as to transmit new information and research conclusions rapidly around the world. Additionally, in their deliberations, the Board considered the Investment Advisers' trading capabilities and resources which are an integral part of the investment management process.
Shareholder and Administrative Services. The Board considered (i) the nature, extent, quality, and cost of advisory, administrative, and shareholder services performed by the Investment Advisers and their affiliates under the Advisory Contracts and under separate agreements covering transfer agency, pricing and bookkeeping, and securities lending services for the fund; (ii) the nature and extent of the investment adviser's supervision of third party service providers, principally custodians and subcustodians; and (iii) the resources devoted to, and the record of compliance with, the fund's compliance policies and procedures. The Board also reviewed the allocation of fund brokerage, including allocations to brokers affiliated with the Investment Advisers, the use of brokerage commissions to pay fund expenses, and the use of "soft" commission dollars to pay for research services.
The Board noted that the growth of fund assets over time across the complex allows Fidelity to reinvest in the development of services designed to enhance the value or convenience of the Fidelity funds as investment vehicles. These services include 24-hour access to account information and market information through telephone representatives and over the Internet, investor education materials and asset allocation tools, and the expanded availability of Fidelity Investor Centers, with 35 new branches opening since 2010.
Annual Report
Board Approval of Investment Advisory Contracts and Management Fees - continued
Investment in a Large Fund Family. The Board considered the benefits to shareholders of investing in a Fidelity fund, including the benefits of investing in a fund that is part of a large family of funds offering a variety of investment disciplines and providing a large variety of mutual fund investor services. The Board noted that Fidelity had taken, or had made recommendations that resulted in the Fidelity funds taking, a number of actions over the previous year that benefited particular funds, including (i) continuing to dedicate additional resources to investment research and support of the senior management team that oversees asset management; (ii) rationalizing product lines through the mergers of six funds into other funds; (iii) continuing to migrate the Freedom Funds to dedicated lower cost underlying funds; (iv) obtaining shareholder approval to broaden the investment strategies for Fidelity Consumer Finance Portfolio, Fidelity Emerging Asia Fund, and Fidelity Environment and Alternative Energy Portfolio; (v) contractually agreeing to reduce the management fees and impose other expense limitations on Spartan 500 Index Fund and U.S. Bond Index Fund in connection with launching new institutional classes of these funds; (vi) changing the name, primary and supplemental benchmarks, and investment policies of Fidelity Global Strategies Fund to support the fund's flexible investment mandate and global orientation; and (vii) reducing the transfer agency account fee rates on certain accounts.
Investment Performance. The Board considered whether the fund has operated in accordance with its investment objective, as well as its record of compliance with its investment restrictions. It also reviewed the fund's absolute investment performance for each class, as well as the fund's relative investment performance for each class measured over multiple periods against a third-party-sponsored index that reflects the market sector in which the fund invests. The Board noted that FMR does not believe that a meaningful peer group exists against which to compare the fund's performance. Because the fund had been in existence less than five calendar years, the following charts considered by the Board show, over the one- and three-year periods ended December 31, 2010, the cumulative total returns of Initial Class and Investor Class of the fund and the cumulative total returns of a third-party-sponsored index ("benchmark").
VIP Consumer Staples Portfolio
The Board noted that the investment performance of Initial Class of the fund compared favorably to its benchmark for the one-year period, although the fund's three-year cumulative total return was lower than its benchmark. The Board considered that the variations in performance between the fund's classes reflect the variations in class expenses, which result in lower performance for the higher expense class. The Board also reviewed the fund's performance since inception as well as performance in the current year.
Based on its review, the Board concluded that the nature, extent, and quality of services provided to the fund under the Advisory Contracts should benefit the fund's shareholders.
Competitiveness of Management Fee and Total Expense Ratio. The Board considered the fund's management fee and total expense ratio compared to "mapped groups" of competitive funds and classes. Fidelity creates "mapped groups" by combining similar Lipper investment objective categories that have comparable management fee characteristics. Combining Lipper investment objective categories aids the Board's management fee and total expense ratio comparisons by broadening the competitive group used for comparison and by reducing the number of universes to which various Fidelity funds are compared.
Management Fee. The Board considered two proprietary management fee comparisons for the 12-month (or shorter) periods shown in the chart below. The group of Lipper funds used by the Board for management fee comparisons is referred to below as the "Total Mapped Group." The Total Mapped Group comparison focuses on a fund's standing relative to the total universe of comparable funds available to investors in terms of gross management fees before expense reimbursements or caps. "TMG %" represents the percentage of funds in the Total Mapped Group that had management fees that were lower than the fund's. For example, a TMG % of 2% means that 98% of the funds in the Total Mapped Group had higher management fees than the fund. The "Asset-Size Peer Group" (ASPG) comparison focuses on a fund's standing relative to non-Fidelity funds similar in size to the fund within the Total Mapped Group. The ASPG represents at least 15% of the funds in the Total Mapped Group with comparable asset size and management fee characteristics, subject to a minimum of 50 funds (or all funds in the Total Mapped Group if fewer than 50). Additional information, such as the ASPG quartile in which the fund's management fee ranked, is also included in the chart and considered by the Board.
Annual Report
VIP Consumer Staples Portfolio
The Board noted that the fund's management fee ranked below the median of its Total Mapped Group and below the median of its ASPG for 2010.
Based on its review, the Board concluded that the fund's management fee is fair and reasonable in light of the services that the fund receives and the other factors considered.
Total Expense Ratio. In its review of each class's total expense ratio, the Board considered the fund's management fee as well as other fund or class expenses, as applicable, such as transfer agent fees, pricing and bookkeeping fees, and custodial, legal, and audit fees. The Board also noted the effects of any waivers and reimbursements on fees and expenses. As part of its review, the Board also considered the current and historical total expense ratios of each class of the fund compared to competitive fund median expenses. Each class of the fund is compared to those funds and classes in the Total Mapped Group (used by the Board for management fee comparisons) that have a similar sales load structure.
The Board noted that the total expense ratio of each class ranked below its competitive median for 2010. The Board considered that various factors, including 12b-1 fees, positive or negative performance adjustments, and relatively higher other expenses in the case of small fund size, can affect total expense ratios. The Board also noted that Investor Class has higher transfer agent fees than traditional variable annuity classes because it is designed for lower cost annuity products, where the majority of servicing costs are incorporated into the funds' total expense ratios rather than being paid at the annuity level.
Fees Charged to Other Fidelity Clients. The Board also considered Fidelity fee structures and other information with respect to clients of FMR and its affiliates, such as other mutual funds advised or subadvised by FMR or its affiliates, pension plan clients, and other institutional clients. In March 2010, the Board created an ad hoc joint committee with the board of other Fidelity funds (the Committee) to review and compare Fidelity's institutional investment advisory business with its business of providing services to the Fidelity funds, including the differences in services provided, fees charged, and costs incurred, as well as competition in their respective marketplaces.
Based on its review of total expense ratios and fees charged to other Fidelity clients, the Board concluded that the total expense ratio of each class of the fund was reasonable in light of the services that the fund and its shareholders receive and the other factors considered, including the findings of the Committee.
Costs of the Services and Profitability. The Board considered the revenues earned and the expenses incurred by Fidelity in conducting the business of developing, marketing, distributing, managing, administering and servicing the fund and its shareholders. The Board also considered the level of Fidelity's profits in respect of all the Fidelity funds.
Annual Report
Board Approval of Investment Advisory Contracts and Management Fees - continued
On an annual basis, FMR presents to the Board Fidelity's profitability for the fund. Fidelity calculates the profitability for each fund, as well as aggregate profitability for groups of Fidelity funds and all Fidelity funds, using a series of detailed revenue and cost allocation methodologies which originate with the books and records of Fidelity on which Fidelity's audited financial statements are based. The Audit Committee of the Board reviews any significant changes from the prior year's methodologies.
PricewaterhouseCoopers LLP (PwC), independent registered public accounting firm and auditor to Fidelity and certain Fidelity funds, has been engaged annually by the Board as part of the Board's assessment of Fidelity's profitability analysis. PwC's engagement includes the review and assessment of Fidelity's methodologies used in determining the revenues and expenses attributable to Fidelity's mutual fund business, and completion of agreed-upon procedures surrounding the mathematical accuracy of fund profitability and its conformity to allocation methodologies. After considering PwC's reports issued under the engagement and information provided by Fidelity, the Board concluded that while other allocation methods may also be reasonable, Fidelity's profitability methodologies are reasonable in all material respects.
The Board also reviewed Fidelity's non-fund businesses and fall-out benefits related to the mutual fund business as well as cases where Fidelity's affiliates may benefit from or be related to the fund's business.
The Board considered the costs of the services provided by and the profits realized by Fidelity in connection with the operation of the fund and was satisfied that the profitability was not excessive in the circumstances.
Economies of Scale. The Board considered whether there have been economies of scale in respect of the management of the Fidelity funds, whether the Fidelity funds (including the fund) have appropriately benefited from any such economies of scale, and whether there is potential for realization of any further economies of scale. The Board considered the extent to which the fund will benefit from economies of scale through increased services to the fund, through waivers or reimbursements, or through fee or expense reductions. The Board also noted that in 2009, it and the board of other Fidelity funds created an ad hoc committee (the Economies of Scale Committee) to analyze whether FMR attains economies of scale in respect of the management and servicing of the Fidelity funds, whether the Fidelity funds have appropriately benefited from such economies of scale, and whether there is potential for realization of any further economies of scale.
The Board recognized that the fund's management contract incorporates a "group fee" structure, which provides for lower group fee rates as total fund assets under FMR's management increase, and for higher group fee rates as total fund assets under FMR's management decrease. FMR calculates the group fee rates based on a tiered asset "breakpoint" schedule that varies based on asset class. The Board considered that the group fee is designed to deliver the benefits of economies of scale to fund shareholders when total Fidelity fund assets increase, even if assets of any particular fund are unchanged or have declined, because some portion of Fidelity's costs are attributable to services provided to all Fidelity funds, and all funds benefit if those costs can be allocated among more assets. The Board concluded that, given the group fee structure, fund shareholders will benefit from lower management fees as assets under FMR's management increase at the fund complex level, regardless of whether Fidelity achieves any such economies of scale.
The Board concluded, taking into account the analysis of the Economies of Scale Committee, that any potential economies of scale are being appropriately shared between fund shareholders and Fidelity.
Additional Information Requested by the Board. In order to develop fully the factual basis for consideration of the Fidelity funds' Advisory Contracts, the Board requested and received additional information on certain topics, including (i) fund performance trends, actions to be taken by FMR to improve certain funds' overall performance, and Fidelity's long-term strategies for certain funds; (ii) portfolio manager changes that have occurred during the past year and length of portfolio manager tenure for different categories of funds over time; (iii) Fidelity's compensation structure for portfolio managers and other key personnel and strategies for attracting and retaining non-investment personnel; (iv) the amount of the investment that each portfolio manager has made in the Fidelity fund(s) that he or she manages; (v) historical trends in Fidelity's realization of fall-out benefits; (vi) Fidelity's group fee structures and the rationale for the individual fee rates of certain funds; (vii) fund profitability methodology and the impact of certain factors on fund profitability results; (viii) trends regarding industry use of performance fee structures and Fidelity's compliance practices with respect to performance adjustment calculations; (ix) the fee structures in place for certain other Fidelity clients; and (x) explanations regarding the relative total expense ratios of certain funds and classes, total expense competitive trends, and actions that might be taken by FMR to reduce total expense ratios for certain funds and classes.
Based on its evaluation of all of the conclusions noted above, and after considering all factors it believed relevant, the Board ultimately concluded that the advisory fee structures are fair and reasonable, and that the fund's Advisory Contracts should be renewed.
Annual Report
Investment Adviser
Fidelity Management & Research Company
Boston, MA
Investment Sub-Advisers
FMR Co., Inc.
Fidelity Management & Research (U.K.) Inc.
Fidelity Management & Research (Hong Kong) Limited
Fidelity Management & Research (Japan) Inc.
General Distributor
Fidelity Distributors Corporation
Boston, MA
Transfer and Service Agents
Fidelity Investments Institutional Operations Company, Inc.
Boston, MA
Fidelity Service Company, Inc.
Boston, MA
Custodian
State Street Bank and Trust Company
Quincy, MA
VCSP-ANN-0212
1.850994.104
Fidelity® Variable Insurance Products:
Emerging Markets Portfolio
Annual Report
December 31, 2011
Contents
Performance | (Click Here) | How the fund has done over time. |
Management's Discussion of Fund Performance | (Click Here) | The Portfolio Manager's review of fund performance and strategy. |
Shareholder Expense Example | (Click Here) | An example of shareholder expenses. |
Investment Changes | (Click Here) | A summary of major shifts in the fund's investments over the past six months. |
Investments | (Click Here) | A complete list of the fund's investments with their market values. |
Financial Statements | (Click Here) | Statements of assets and liabilities, operations, and changes in net assets, as well as financial highlights. |
Notes | (Click Here) | Notes to the financial statements. |
Report of Independent Registered Public Accounting Firm | (Click Here) | |
Trustees and Officers | (Click Here) | |
Distributions | (Click Here) | |
Board Approval of Investment Advisory Contracts and Management Fees | (Click Here) | |
To view a fund's proxy voting guidelines and proxy voting record for the 12-month period ended June 30, visit http://www.fidelity.com/proxyvotingresults or visit the Securities and Exchange Commission's (SEC) web site at http://www.sec.gov. You may also call 1-877-208-0098 to request a free copy of the proxy voting guidelines.
Fidelity Variable Insurance Products are separate account options which are purchased through a variable insurance contract.
Standard & Poor's, S&P and S&P 500 are registered service marks of The McGraw-Hill Companies, Inc. and have been licensed for use by Fidelity Distributors Corporation.
Other third party marks appearing herein are the property of their respective owners.
All other marks appearing herein are registered or unregistered trademarks or service marks of FMR LLC or an affiliated company.
This report and the financial statements contained herein are submitted for the general information of the shareholders of the fund. This report is not authorized for distribution to prospective investors in the fund unless preceded or accompanied by an effective prospectus.
A fund files its complete schedule of portfolio holdings with the SEC for the first and third quarters of each fiscal year on Form N-Q. Forms N-Q are available on the SEC's web site at http://www.sec.gov. A fund's Forms N-Q may be reviewed and copied at the SEC's Public Reference Room in Washington, DC. Information regarding the operation of the SEC's Public Reference Room may be obtained by calling 1-800-SEC-0330. For a complete list of a fund's portfolio holdings, view the most recent holdings listing, semiannual report, or annual report on Fidelity's web site at http://www.fidelity.com, http://www.advisor.fidelity.com, or http://www.401k.com, as applicable.
NOT FDIC INSURED • MAY LOSE VALUE • NO BANK GUARANTEE
Neither the fund nor Fidelity Distributors Corporation is a bank.
Annual Report
Average annual total return reflects the change in the value of an investment, assuming reinvestment of the class' distributions from dividend income and capital gains (the profits earned upon the sale of securities that have grown in value, if any) and assuming a constant rate of performance each year. During periods of reimbursement by Fidelity, a fund's total return will be greater than it would be had the reimbursement not occurred. Performance numbers are net of all underlying fund operating expenses, but do not include any insurance charges imposed by your insurance company's separate account. If performance information included the effect of these additional charges, the total returns would have been lower. How a fund did yesterday is no guarantee of how it will do tomorrow.
Average Annual Total Returns
Periods ended December 31, 2011 | Past 1
year | Life of
fund A |
VIP Emerging Markets Portfolio - Initial Class | -21.01% | -5.23% |
VIP Emerging Markets Portfolio - Service Class | -21.15% | -5.33% |
VIP Emerging Markets Portfolio - Service Class 2 | -21.30% | -5.48% |
A From January 23, 2008.
$10,000 Over Life of Fund
Let's say hypothetically that $10,000 was invested in VIP Emerging Markets Portfolio - Initial Class on January 23, 2008, when the fund started. The chart shows how the value of your investment would have changed, and also shows how the MSCI® Emerging Markets Index performed over the same period.
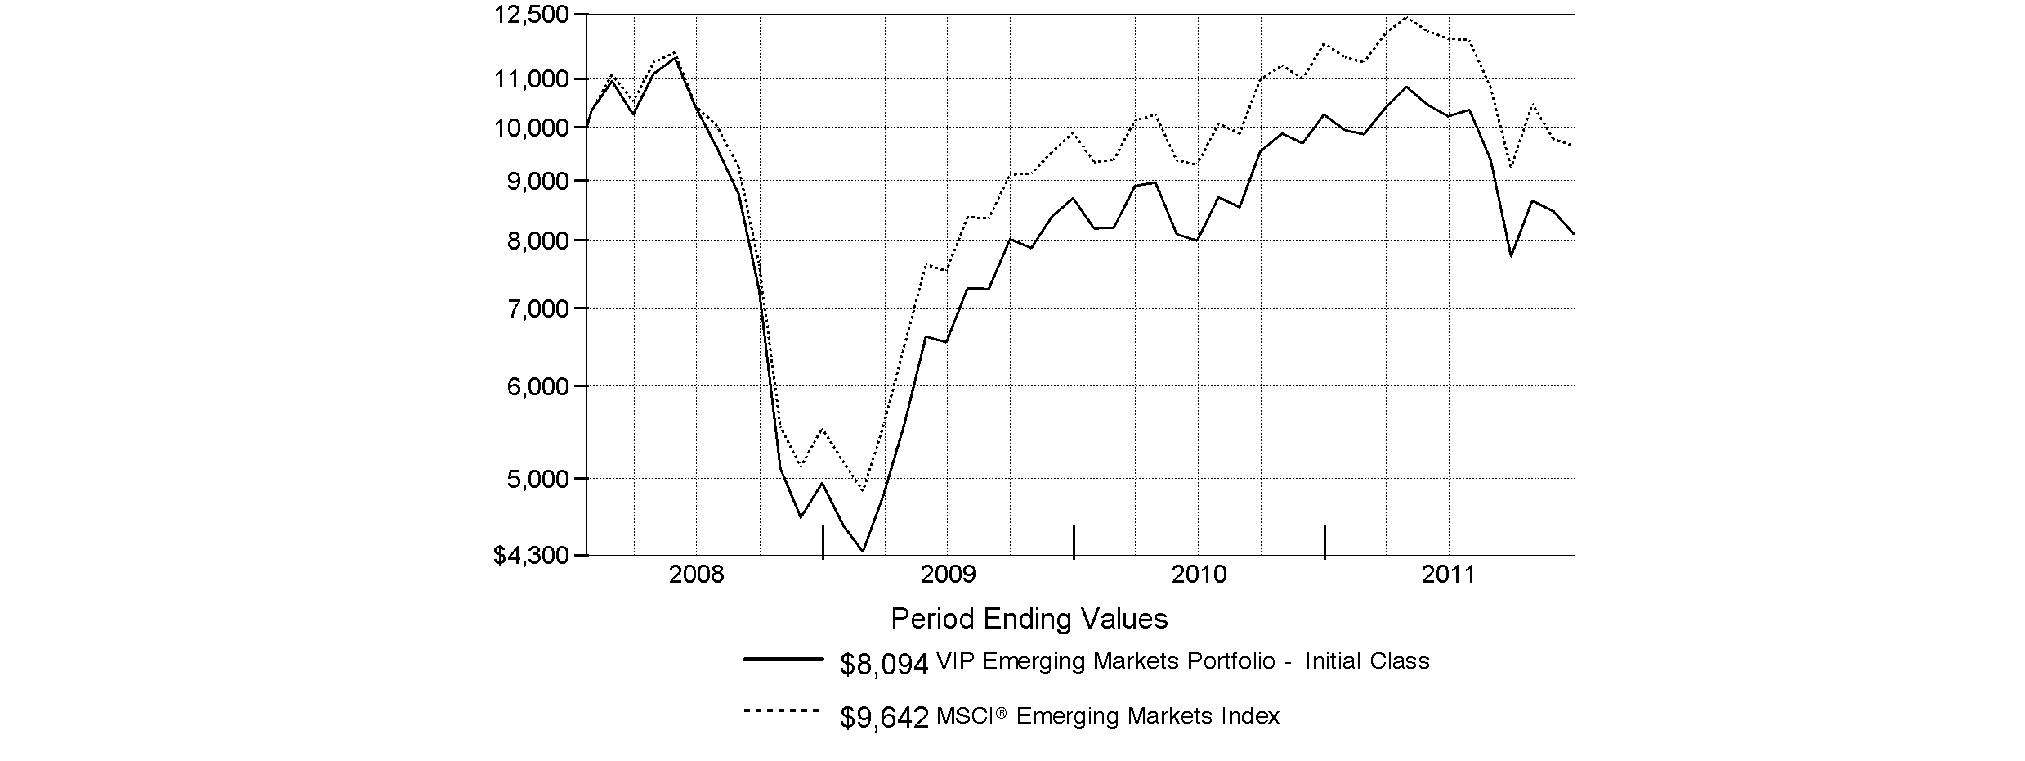
Annual Report
Market Recap: Extreme market volatility took center stage during the 12 months ending December 31, 2011, stealing the spotlight from signs of progress in the global economy. Early in the year, aggressive monetary stimulus by the U.S. federal government, improving credit-market conditions and solid corporate earnings buoyed most major asset classes. As the period progressed, however, fresh worries about sovereign debt in Europe, inflation in China, gridlock over raising the debt ceiling in the U.S. - along with Standard & Poor's early-August downgrade of the nation's long-term sovereign credit rating - and a dimmed outlook for global growth punctured investor confidence and ignited market instability. Domestic equities, as measured by the broad-based S&P 500® Index, gained 2.11%, easily outpacing the 13.61% decline of MSCI® ACWI® (All Country World Index) ex USA Index, a proxy for foreign stocks. Within the MSCI index, emerging markets declined the most (-18%), with investments here generally held back by a stronger U.S. dollar. The U.K. (-3%) fared better than the rest of Europe (-15%), which was the second-worst-performing index component. Bolstered by periodic flights to quality, U.S. investment-grade bonds posted a 7.84% advance, as reflected by the Barclays Capital® U.S. Aggregate Bond Index, outperforming the 4.37% gain of high-yield securities, as represented by The BofA Merrill LynchSM US High Yield Constrained Index. Hampered by financial woes in Europe, the sovereign debt of major developed markets outside the U.S. rose 4.86%, according to the Citigroup® Non-USD Group-of-Seven (G7) Equal Weighted Index, while the JPMorgan Emerging Markets Bond Index Global (EMBI Global) advanced 8.46%, despite the currency head wind.
Comments from Robert von Rekowsky, Portfolio Manager of VIP Emerging Markets Portfolio: During the year, the fund's share classes finished behind the -18.17% return of the MSCI® Emerging Markets Index. (For specific portfolio results, please refer to the performance section of this report.) Versus the index, stock selection in the energy sector had the most negative impact, with my picks in financials, consumer staples and information technology also weighing on performance. Geographically, weak picks and a large underweighting in South Africa curbed performance, as did security selection in China, Taiwan, Hong Kong and India. Underweighting Mexico also hurt. Unrewarding timing in the fund's ownership of wireless carrier and benchmark component China Mobile made it the fund's largest individual detractor. In the weak third quarter, the stock outperformed, and our underweighting here hampered the fund's results. As part of my effort to reduce the fund's downside vulnerability, I increased the position to an overweighting by the end of August, but China Mobile underperformed during the strong October rally, which hurt as well. Banks also figured prominently among the fund's largest detractors, including Egypt-based Commercial International Bank, South Korea's Shinhan Financial Group, Taiwan-based Taishin Financial Holding and an out-of-index position in Indian Overseas Bank. I sold Taishin Financial Holding during the period. In the case of pork producer China Yurun Food Group, questions about the safety of the company's food handling practices dented its stock, and I sold our position here by period end. Another detractor, South Korean shipbuilder Hyundai Heavy Industries, suffered weaker-than-expected orders and disappointing earnings. Conversely, positioning in consumer discretionary and materials added the most value among market sectors, while geographically my picks in Brazil and South Korea had the most favorable impact. At the stock level, Thai wireless carrier Advanced Info Service succeeded in expanding its market share, controlling costs and generating additional service revenue, which enabled its stock to deliver an outsized gain and rewarded our overweighting there. Other contributors included Korean cigarette maker KT&G, Bank Rakyat Indonesia, automaker Astra International - also based in Indonesia - and Brazilian wireless services provider TIM Participacoes.
The views expressed above reflect those of the portfolio manager(s) only through the end of the period as stated on the cover of this report and do not necessarily represent the views of Fidelity or any other person in the Fidelity organization. Any such views are subject to change at any time based upon market or other conditions and Fidelity disclaims any responsibility to update such views. These views may not be relied on as investment advice and, because investment decisions for a Fidelity fund are based on numerous factors, may not be relied on as an indication of trading intent on behalf of any Fidelity fund.
Annual Report
As a shareholder of the Fund, you incur two types of costs: (1) transaction costs, including redemption fees, and (2) ongoing costs, including management fees, distribution and/or service (12b-1) fees and other Fund expenses. This Example is intended to help you understand your ongoing costs (in dollars) of investing in the Fund and to compare these costs with the ongoing costs of investing in other mutual funds.
The Example is based on an investment of $1,000 invested at the beginning of the period and held for the entire period (July 1, 2011 to December 31, 2011).
Actual Expenses
The first line of the accompanying table for each class of the Fund provides information about actual account values and actual expenses. You may use the information in this line, together with the amount you invested, to estimate the expenses that you paid over the period. Simply divide your account value by $1,000.00 (for example, an $8,600 account value divided by $1,000.00 = 8.6), then multiply the result by the number in the first line for a class of the Fund under the heading entitled "Expenses Paid During Period" to estimate the expenses you paid on your account during this period. The estimate of expenses does not include any fees or other expenses of any variable annuity or variable life insurance product. If they were, the estimate of expenses you paid during the period would be higher, and your ending account value would be lower. In addition, the Fund, as a shareholder in the underlying Fidelity Central Funds, will indirectly bear its pro-rata share of the fees and expenses incurred by the underlying Fidelity Central Funds. These fees and expenses are not included in the Fund's annualized expense ratio used to calculate the expense estimate in the table below.
Hypothetical Example for Comparison Purposes
The second line of the accompanying table for each class of the Fund provides information about hypothetical account values and hypothetical expenses based on a Class' actual expense ratio and an assumed rate of return of 5% per year before expenses, which is not the Class' actual return. The hypothetical account values and expenses may not be used to estimate the actual ending account balance or expenses you paid for the period. You may use this information to compare the ongoing costs of investing in the Fund and other funds. To do so, compare this 5% hypothetical example with the 5% hypothetical examples that appear in the shareholder reports of the other funds. The estimate of expenses does not include any fees or other expenses of any variable annuity or variable life insurance product. If they were, the estimate of expenses you paid during the period would be higher, and your ending account value would be lower. In addition, the Fund, as a shareholder in the underlying Fidelity Central Funds, will indirectly bear its pro-rata share of the fees and expenses incurred by the underlying Fidelity Central Funds. These fees and expenses are not included in the Fund's annualized expense ratio used to calculate the expense estimate in the table below.
Please note that the expenses shown in the table are meant to highlight your ongoing costs only and do not reflect any transaction costs. Therefore, the second line of the table is useful in comparing ongoing costs only, and will not help you determine the relative total costs of owning different funds. In addition, if these transactional costs were included, your costs would have been higher.
| Annualized
Expense Ratio | Beginning
Account Value
July 1, 2011 | Ending
Account Value
December 31, 2011 | Expenses Paid
During Period*
July 1, 2011 to
December 31, 2011 |
Initial Class | 1.10% | | | |
Actual | | $ 1,000.00 | $ 792.30 | $ 4.97 |
HypotheticalA | | $ 1,000.00 | $ 1,019.66 | $ 5.60 |
Service Class | 1.20% | | | |
Actual | | $ 1,000.00 | $ 791.70 | $ 5.42 |
HypotheticalA | | $ 1,000.00 | $ 1,019.16 | $ 6.11 |
Service Class 2 | 1.35% | | | |
Actual | | $ 1,000.00 | $ 791.00 | $ 6.09 |
HypotheticalA | | $ 1,000.00 | $ 1,018.40 | $ 6.87 |
Initial Class R | 1.10% | | | |
Actual | | $ 1,000.00 | $ 792.30 | $ 4.97 |
HypotheticalA | | $ 1,000.00 | $ 1,019.66 | $ 5.60 |
Service Class 2R | 1.35% | | | |
Actual | | $ 1,000.00 | $ 791.60 | $ 6.10 |
HypotheticalA | | $ 1,000.00 | $ 1,018.40 | $ 6.87 |
Investor Class R | 1.18% | | | |
Actual | | $ 1,000.00 | $ 792.70 | $ 5.33 |
HypotheticalA | | $ 1,000.00 | $ 1,019.26 | $ 6.01 |
A 5% return per year before expenses
* Expenses are equal to each Class' annualized expense ratio, multiplied by the average account value over the period, multiplied by 184/365 (to reflect the one-half year period).
Annual Report
Investment Changes (Unaudited)
Geographic Diversification (% of fund's net assets) |
As of December 31, 2011 |
| Korea (South) | 19.4% | |
 | Brazil | 15.1% | |
| China | 8.9% | |
 | Taiwan | 6.9% | |
| Hong Kong | 6.1% | |
 | Indonesia | 5.6% | |
| India | 5.2% | |
 | Russia | 5.1% | |
| South Africa | 4.1% | |
| Other* | 23.6% | |

* Includes short term investments and other assets. |
Percentages are adjusted for the effect of futures contracts, if applicable. |
As of June 30, 2011 |
| Korea (South) | 19.5% | |
| Brazil | 15.2% | |
| Taiwan | 10.4% | |
| China | 9.4% | |
| Russia | 7.6% | |
| Indonesia | 4.1% | |
| Cayman Islands | 3.9% | |
| South Africa | 3.7% | |
| India | 3.7% | |
| Other* | 22.5% | |

* Includes short term investments and other assets. |
Percentages are adjusted for the effect of futures contracts, if applicable. |
Asset Allocation |
| % of fund's
net assets | % of fund's net assets
6 months ago |
Stocks | 98.0 | 97.8 |
Short-Term Investments and Net Other Assets | 2.0 | 2.2 |
Top Ten Stocks as of December 31, 2011 |
| % of fund's
net assets | % of fund's net assets
6 months ago |
Samsung Electronics Co. Ltd. (Korea (South), Semiconductors & Semiconductor Equipment) | 4.6 | 2.9 |
Petroleo Brasileiro SA - Petrobras (Brazil, Oil, Gas & Consumable Fuels) | 2.7 | 1.5 |
China Mobile (Hong Kong) Ltd. (Hong Kong, Wireless Telecommunication Services) | 2.0 | 0.0 |
Taiwan Semiconductor Manufacturing Co. Ltd. (Taiwan, Semiconductors & Semiconductor Equipment) | 2.0 | 2.1 |
Banco Bradesco SA (PN) sponsored ADR (Brazil, Commercial Banks) | 2.0 | 1.8 |
Hyundai Motor Co. (Korea (South), Automobiles) | 1.9 | 1.9 |
China Construction Bank Corp. (H Shares) (China, Commercial Banks) | 1.6 | 0.8 |
Vale SA (PN-A) sponsored ADR (Brazil, Metals & Mining) | 1.5 | 2.5 |
CNOOC Ltd. (Hong Kong, Oil, Gas & Consumable Fuels) | 1.4 | 1.6 |
China Petroleum & Chemical Corp. (China, Oil, Gas & Consumable Fuels) | 1.3 | 0.0 |
| 21.0 | |
Market Sectors as of December 31, 2011 |
| % of fund's
net assets | % of fund's net assets
6 months ago |
Financials | 22.1 | 22.0 |
Energy | 13.7 | 14.1 |
Information Technology | 11.9 | 13.4 |
Materials | 10.8 | 13.4 |
Consumer Discretionary | 10.6 | 10.0 |
Telecommunication Services | 9.1 | 6.3 |
Consumer Staples | 8.6 | 7.0 |
Industrials | 5.3 | 6.9 |
Utilities | 4.9 | 4.0 |
Health Care | 1.0 | 0.7 |
Annual Report
Investments December 31, 2011
Showing Percentage of Net Assets
Common Stocks - 98.0% |
| Shares | | Value |
Bailiwick of Jersey - 0.5% |
Randgold Resources Ltd. sponsored ADR | 4,600 | | $ 469,660 |
Bermuda - 2.5% |
African Minerals Ltd. (a) | 25,928 | | 177,188 |
Aquarius Platinum Ltd. (Australia) | 127,612 | | 305,376 |
Beijing Enterprises Water Group Ltd. (a) | 1,098,000 | | 299,714 |
Cheung Kong Infrastructure Holdings Ltd. | 84,000 | | 492,107 |
CNPC (Hong Kong) Ltd. | 102,000 | | 145,253 |
Credicorp Ltd. (NY Shares) | 4,401 | | 481,777 |
NWS Holdings Ltd. | 234,346 | | 345,186 |
TOTAL BERMUDA | | 2,246,601 |
Brazil - 15.1% |
Banco Bradesco SA (PN) sponsored ADR (d) | 108,640 | | 1,812,115 |
Banco do Estado do Rio Grande do Sul SA | 59,900 | | 642,980 |
BR Malls Participacoes SA | 50,300 | | 489,178 |
Brasil Foods SA sponsored ADR (d) | 22,700 | | 443,785 |
Companhia de Bebidas das Americas (AmBev) (PN) sponsored ADR | 22,397 | | 808,308 |
Companhia de Saneamento Basico do Estado de Sao Paulo (SABESP) | 24,800 | | 692,542 |
Companhia de Saneamento de Minas Gerais | 12,700 | | 227,662 |
Eletropaulo Metropolitana SA (PN-B) | 30,900 | | 605,330 |
Gol Linhas Aereas Inteligentes SA rights 1/26/12 (a) | 225 | | 0 |
Hypermarcas SA | 52,300 | | 238,595 |
Klabin SA (PN) (non-vtg.) | 128,900 | | 553,456 |
Multiplan Empreendimentos Imobiliarios SA | 6,200 | | 127,348 |
Multiplus SA | 23,400 | | 405,029 |
OGX Petroleo e Gas Participacoes SA (a) | 109,000 | | 796,790 |
Petroleo Brasileiro SA - Petrobras: | | | |
(PN) (non-vtg.) | 20,900 | | 241,059 |
(PN) sponsored ADR (d) | 91,815 | | 2,156,734 |
Qualicorp SA | 23,000 | | 206,768 |
Tegma Gestao Logistica | 31,900 | | 439,156 |
TIM Participacoes SA sponsored ADR (d) | 23,065 | | 595,077 |
Ultrapar Participacoes SA | 32,100 | | 551,482 |
Vale SA (PN-A) sponsored ADR | 64,474 | | 1,328,164 |
TOTAL BRAZIL | | 13,361,558 |
British Virgin Islands - 0.4% |
Mail.ru Group Ltd.: | | | |
GDR (a)(e) | 12,600 | | 327,600 |
GDR (Reg. S) (a) | 800 | | 20,800 |
TOTAL BRITISH VIRGIN ISLANDS | | 348,400 |
Canada - 1.4% |
Eldorado Gold Corp. | 28,394 | | 390,891 |
|
| Shares | | Value |
First Quantum Minerals Ltd. | 24,300 | | $ 478,412 |
Goldcorp, Inc. | 8,000 | | 355,145 |
TOTAL CANADA | | 1,224,448 |
Cayman Islands - 3.4% |
Baidu.com, Inc. sponsored ADR (a) | 3,850 | | 448,410 |
China Shanshui Cement Group Ltd. | 716,000 | | 476,620 |
Country Garden Holdings Co. Ltd. | 1,047,000 | | 392,291 |
Eurasia Drilling Co. Ltd. GDR (Reg. S) | 17,453 | | 410,146 |
EVA Precision Industrial Holdings Ltd. | 320,000 | | 77,460 |
New Oriental Education & Technology Group, Inc. sponsored ADR (a) | 13,900 | | 334,295 |
Shenguan Holdings Group Ltd. | 496,000 | | 287,384 |
Shenzhou International Group Holdings Ltd. | 154,000 | | 208,992 |
Silver Base Group Holdings Ltd. | 54,000 | | 43,803 |
Spreadtrum Communications, Inc. ADR (d) | 13,200 | | 275,616 |
Uni-President China Holdings Ltd. | 124,000 | | 74,241 |
TOTAL CAYMAN ISLANDS | | 3,029,258 |
Chile - 1.1% |
CFR Pharmaceuticals SA | 1,761,563 | | 414,027 |
Empresa Nacional de Telecomunicaciones SA (ENTEL) | 24,283 | | 451,070 |
Sociedad Quimica y Minera de Chile SA (PN-B) sponsored ADR (d) | 1,700 | | 91,545 |
TOTAL CHILE | | 956,642 |
China - 8.9% |
Angang Steel Co. Ltd. (H Shares) | 122,000 | | 87,809 |
China BlueChemical Ltd. (H shares) | 288,000 | | 218,041 |
China CITIC Bank Corp. Ltd. (H Shares) | 1,079,000 | | 607,116 |
China Communications Construction Co. Ltd. (H Shares) | 655,000 | | 511,916 |
China Communications Services Corp. Ltd. (H Shares) | 870,000 | | 392,063 |
China Construction Bank Corp.
(H Shares) | 2,023,000 | | 1,411,771 |
China Minsheng Banking Corp. Ltd.
(H Shares) | 927,500 | | 803,708 |
China National Building Materials Co. Ltd. (H Shares) | 348,000 | | 395,200 |
China Petroleum & Chemical Corp.: | | | |
(H Shares) | 584,000 | | 613,062 |
sponsored ADR (H Shares) (d) | 5,400 | | 567,270 |
China Southern Airlines Ltd.
(H Shares) (a) | 752,000 | | 378,950 |
Great Wall Motor Co. Ltd. (H Shares) | 336,500 | | 491,323 |
Harbin Power Equipment Co. Ltd.
(H Shares) | 314,000 | | 274,112 |
Huadian Power International Corp. Ltd. (H shares) (a) | 590,000 | | 116,228 |
Industrial & Commercial Bank of China Ltd. (H Shares) | 800,070 | | 474,895 |
Common Stocks - continued |
| Shares | | Value |
China - continued |
Maanshan Iron & Steel Ltd. (H Shares) | 272,000 | | $ 87,204 |
Yantai Changyu Pioneer Wine Co.
(B Shares) | 40,799 | | 446,517 |
TOTAL CHINA | | 7,877,185 |
Colombia - 0.2% |
Almacenes Exito SA | 10,236 | | 134,438 |
Czech Republic - 1.4% |
Ceske Energeticke Zavody A/S | 17,500 | | 696,209 |
Philip Morris CR A/S | 443 | | 282,074 |
Telefonica Czech Republic A/S | 15,000 | | 290,859 |
TOTAL CZECH REPUBLIC | | 1,269,142 |
Egypt - 0.1% |
Commercial International Bank Ltd. sponsored GDR | 32,750 | | 98,578 |
Georgia - 0.2% |
Bank of Georgia GDR (Reg. S) | 12,948 | | 168,324 |
Hong Kong - 6.1% |
China Insurance International Holdings Co. Ltd. (a) | 221,200 | | 410,125 |
China Mobile Ltd. | 188,000 | | 1,826,531 |
China Power International Development Ltd. | 2,297,000 | | 538,272 |
China Unicom Ltd. | 330,000 | | 695,692 |
CNOOC Ltd. | 694,000 | | 1,210,159 |
Dah Chong Hong Holdings Ltd. | 1,000 | | 1,178 |
Guangdong Investment Ltd. | 586,000 | | 355,376 |
Lenovo Group Ltd. | 558,000 | | 372,163 |
Sinotruk Hong Kong Ltd. | 79,500 | | 44,425 |
TOTAL HONG KONG | | 5,453,921 |
Hungary - 0.5% |
Magyar Telekom PLC | 194,400 | | 414,296 |
India - 5.2% |
Bank of Baroda | 44,618 | | 565,939 |
Bharti Airtel Ltd. | 72,534 | | 469,969 |
Hero Motocorp Ltd. | 2,509 | | 90,164 |
Hindustan Unilever Ltd. | 59,814 | | 459,648 |
Housing Development Finance Corp. Ltd. | 74,078 | | 911,111 |
Indian Overseas Bank | 147,082 | | 203,498 |
Punjab National Bank | 2,063 | | 31,918 |
Tata Consultancy Services Ltd. | 33,378 | | 730,740 |
Tata Motors Ltd. | 52,255 | | 175,742 |
Tata Steel Ltd. | 69,222 | | 437,868 |
Ultratech Cemco Ltd. | 20,661 | | 454,608 |
United Phosphorous Ltd. | 41,684 | | 99,777 |
TOTAL INDIA | | 4,630,982 |
Indonesia - 5.6% |
PT Astra International Tbk | 132,500 | | 1,081,335 |
PT Bank Rakyat Indonesia Tbk | 1,443,500 | | 1,074,566 |
PT Bank Tabungan Negara Tbk | 1,076,500 | | 143,652 |
|
| Shares | | Value |
PT Bumi Serpong Damai Tbk | 2,141,500 | | $ 231,450 |
PT Ciputra Development Tbk | 2,657,500 | | 158,263 |
PT Gadjah Tunggal Tbk | 500,000 | | 165,426 |
PT Gudang Garam Tbk | 83,000 | | 567,979 |
PT Indocement Tunggal Prakarsa Tbk | 209,000 | | 392,992 |
PT Indosat Tbk | 822,800 | | 512,691 |
PT Summarecon Agung Tbk | 887,500 | | 121,368 |
PT Tower Bersama Infrastructure Tbk | 1,363,500 | | 357,134 |
PT XL Axiata Tbk | 317,500 | | 158,444 |
TOTAL INDONESIA | | 4,965,300 |
Israel - 0.2% |
NICE Systems Ltd. sponsored ADR (a) | 5,200 | | 179,140 |
Korea (South) - 19.4% |
BS Financial Group, Inc. (a) | 38,870 | | 369,617 |
Cheil Worldwide, Inc. | 26,190 | | 427,090 |
CJ CheilJedang Corp. | 1,557 | | 387,893 |
CJ Corp. | 41 | | 2,717 |
Dongbu Insurance Co. Ltd. | 3,100 | | 142,455 |
Hana Financial Group, Inc. | 24,000 | | 734,220 |
Hankook Tire Co. Ltd. | 10,190 | | 396,797 |
Hotel Shilla Co. | 10,120 | | 335,287 |
Hyundai Department Store Co. Ltd. | 3,928 | | 550,978 |
Hyundai Fire & Marine Insurance Co. Ltd. | 16,040 | | 476,210 |
Hyundai Heavy Industries Co. Ltd. | 3,411 | | 754,380 |
Hyundai Mobis | 2,867 | | 720,420 |
Hyundai Motor Co. | 9,331 | | 1,710,342 |
Industrial Bank of Korea | 55,790 | | 600,125 |
Kia Motors Corp. | 13,284 | | 762,482 |
Korea Zinc Co. Ltd. | 1,463 | | 382,730 |
KT&G Corp. | 15,168 | | 1,062,497 |
LG Chemical Ltd. | 2 | | 546 |
LG Household & Health Care Ltd. | 769 | | 322,609 |
LIG Non-Life Insurance Co. Ltd. | 11,000 | | 216,772 |
Nong Shim Co. Ltd. | 2,404 | | 480,986 |
Orion Corp. | 547 | | 319,148 |
Samsung Electronics Co. Ltd. | 4,524 | | 4,118,918 |
Shinhan Financial Group Co. Ltd. | 27,925 | | 957,301 |
SK Chemicals Co. Ltd. | 6,509 | | 359,044 |
SK Energy Co. Ltd. | 3,447 | | 421,216 |
TK Corp. (a) | 8,311 | | 170,218 |
TOTAL KOREA (SOUTH) | | 17,182,998 |
Luxembourg - 0.5% |
Millicom International Cellular SA (depositary receipt) | 4,700 | | 470,963 |
Malaysia - 0.9% |
Axiata Group Bhd | 337,600 | | 547,402 |
Genting Bhd | 60,700 | | 210,631 |
IJM Plantation Bhd | 30,000 | | 26,688 |
TOTAL MALAYSIA | | 784,721 |
Common Stocks - continued |
| Shares | | Value |
Mexico - 0.5% |
Cemex SA de CV sponsored ADR (d) | 32,752 | | $ 176,533 |
Grupo Modelo SAB de CV Series C | 45,700 | | 289,794 |
TOTAL MEXICO | | 466,327 |
Netherlands - 0.4% |
X5 Retail Group NV GDR (Reg. S) (a) | 14,800 | | 338,032 |
Nigeria - 0.5% |
Guaranty Trust Bank PLC GDR (Reg. S) | 89,594 | | 407,653 |
Panama - 0.5% |
Copa Holdings SA Class A | 6,900 | | 404,823 |
Philippines - 0.5% |
Globe Telecom, Inc. | 17,120 | | 442,449 |
Poland - 0.2% |
Eurocash SA | 20,800 | | 172,047 |
Qatar - 0.3% |
Commercial Bank of Qatar GDR (Reg. S) | 52,310 | | 241,338 |
Russia - 5.1% |
Cherkizovo Group OJSC GDR (a) | 17,302 | | 199,897 |
Gazprom OAO sponsored ADR | 99,698 | | 1,064,874 |
Lukoil Oil Co. sponsored ADR | 8,359 | | 444,699 |
Mostotrest OAO (a) | 10,130 | | 58,652 |
NOVATEK OAO GDR | 6,875 | | 860,750 |
Rosneft Oil Co. OJSC GDR (Reg. S) | 126,000 | | 831,600 |
Sberbank (Savings Bank of the Russian Federation) (a) | 436,400 | | 1,075,281 |
TOTAL RUSSIA | | 4,535,753 |
Singapore - 0.1% |
First Resources Ltd. | 52,000 | | 60,533 |
South Africa - 4.1% |
African Bank Investments Ltd. | 126,900 | | 539,191 |
Foschini Ltd. | 37,523 | | 488,014 |
Harmony Gold Mining Co. Ltd. sponsored ADR | 29,300 | | 341,052 |
Imperial Holdings Ltd. (f) | 34,730 | | 531,323 |
Life Healthcare Group Holdings Ltd. | 165,400 | | 422,894 |
Mr Price Group Ltd. | 36,600 | | 361,802 |
Northam Platinum Ltd. | 34,723 | | 129,040 |
Sasol Ltd. | 8,000 | | 380,822 |
Sasol Ltd. sponsored ADR | 9,692 | | 459,401 |
TOTAL SOUTH AFRICA | | 3,653,539 |
Taiwan - 6.9% |
Chinatrust Financial Holding Co. Ltd. | 1,074,000 | | 670,253 |
Chroma ATE, Inc. | 128,576 | | 252,185 |
E.Sun Financial Holdings Co. Ltd. | 543,000 | | 233,982 |
Formosa Plastics Corp. | 279,000 | | 744,368 |
Hon Hai Precision Industry Co. Ltd. (Foxconn) | 372,000 | | 1,018,286 |
HTC Corp. | 22,057 | | 361,972 |
|
| Shares | | Value |
Leofoo Development Co. Ltd. (a) | 13,340 | | $ 7,554 |
Taiwan Cement Corp. | 464,825 | | 537,192 |
Taiwan Mobile Co. Ltd. | 60,000 | | 187,023 |
Taiwan Semiconductor Manufacturing Co. Ltd. | 663,609 | | 1,657,765 |
Taiwan Semiconductor Manufacturing Co. Ltd. sponsored ADR | 12,200 | | 157,502 |
Wistron Corp. | 236,000 | | 298,848 |
TOTAL TAIWAN | | 6,126,930 |
Thailand - 3.1% |
Advanced Info Service PCL (For. Reg.) | 170,000 | | 755,854 |
Asian Property Development PCL (For. Reg.) | 1,462,160 | | 229,504 |
Bangkok Expressway PCL (For.Reg.) | 279,900 | | 161,208 |
Charoen Pokphand Foods PCL (For. Reg.) | 226,600 | | 236,639 |
PTT Global Chemical PCL (For. Reg.) (a) | 109,980 | | 212,303 |
PTT PCL (For. Reg.) | 54,300 | | 546,437 |
Siam Commercial Bank PCL (For. Reg.) | 173,800 | | 640,750 |
Total Access Communication PCL (For. Reg.) | 400 | | 880 |
TOTAL THAILAND | | 2,783,575 |
Turkey - 1.5% |
Aygaz A/S | 47,409 | | 222,332 |
Eregli Demir ve Celik Fabrikalari T.A.S. | 53,408 | | 92,933 |
Ford Otomotiv Sanayi A/S | 11,000 | | 89,284 |
Tupras-Turkiye Petrol Rafinerileri A/S | 22,000 | | 466,844 |
Turkiye Garanti Bankasi A/S | 155,000 | | 485,146 |
TOTAL TURKEY | | 1,356,539 |
United Kingdom - 0.2% |
International Personal Finance PLC | 70,369 | | 187,439 |
United States of America - 0.5% |
Cognizant Technology Solutions Corp. Class A (a) | 7,400 | | 475,894 |
TOTAL COMMON STOCKS (Cost $83,176,268) |
86,919,426
|
Money Market Funds - 6.5% |
| Shares | | Value |
Fidelity Cash Central Fund, 0.11% (b) | 1,148,928 | | $ 1,148,928 |
Fidelity Securities Lending Cash Central Fund, 0.13% (b)(c) | 4,613,246 | | 4,613,246 |
TOTAL MONEY MARKET FUNDS (Cost $5,762,174) |
5,762,174
|
TOTAL INVESTMENT PORTFOLIO - 104.5% (Cost $88,938,442) | | 92,681,600 |
NET OTHER ASSETS (LIABILITIES) - (4.5)% | | (4,016,165) |
NET ASSETS - 100% | $ 88,665,435 |
Legend |
(a) Non-income producing |
(b) Affiliated fund that is available only to investment companies and other accounts managed by Fidelity Investments. The rate quoted is the annualized seven-day yield of the fund at period end. A complete unaudited listing of the fund's holdings as of its most recent quarter end is available upon request. In addition, each Fidelity Central Fund's financial statements, which are not covered by the Fund's Report of Independent Registered Public Accounting Firm, are available on the SEC's website or upon request. |
(c) Investment made with cash collateral received from securities on loan. |
(d) Security or a portion of the security is on loan at period end. |
(e) Security exempt from registration under Rule 144A of the Securities Act of 1933. These securities may be resold in transactions exempt from registration, normally to qualified institutional buyers. At the end of the period, the value of these securities amounted to $327,600 or 0.4% of net assets. |
(f) Security or a portion of the security purchased on a delayed delivery or when-issued basis. |
Affiliated Central Funds |
Information regarding fiscal year to date income earned by the Fund from investments in Fidelity Central Funds is as follows: |
Fund | Income earned |
Fidelity Cash Central Fund | $ 1,877 |
Fidelity Securities Lending Cash Central Fund | 11,200 |
Total | $ 13,077 |
Other Information |
The following is a summary of the inputs used, as of December 31, 2011, involving the Fund's assets and liabilities carried at fair value. The inputs or methodology used for valuing securities may not be an indication of the risk associated with investing in those securities. For more information on valuation inputs, and their aggregation into the levels used in the table below, please refer to the Security Valuation section in the accompanying Notes to Financial Statements. |
Valuation Inputs at Reporting Date: |
Description | Total | Level 1 | Level 2 | Level 3 |
Investments in Securities: | | | | |
Equities: | | | | |
Korea (South) | $ 17,182,998 | $ 16,225,697 | $ 957,301 | $ - |
Brazil | 13,361,558 | 13,361,558 | - | - |
China | 7,877,185 | 6,885,173 | 992,012 | - |
Taiwan | 6,126,930 | 4,469,165 | 1,657,765 | - |
Hong Kong | 5,453,921 | 1,721,539 | 3,732,382 | - |
Indonesia | 4,965,300 | 4,965,300 | - | - |
India | 4,630,982 | 3,857,383 | 773,599 | - |
Russia | 4,535,753 | 4,535,753 | - | - |
South Africa | 3,653,539 | 3,272,717 | 380,822 | - |
Other | 19,131,260 | 19,131,260 | - | - |
Money Market Funds | 5,762,174 | 5,762,174 | - | - |
Total Investments in Securities: | $ 92,681,600 | $ 84,187,719 | $ 8,493,881 | $ - |
See accompanying notes which are an integral part of the financial statements.
Annual Report
Statement of Assets and Liabilities
| December 31, 2011 |
Assets | | |
Investment in securities, at value (including securities loaned of $4,532,727) - See accompanying schedule: Unaffiliated issuers (cost $83,176,268) | $ 86,919,426 | |
Fidelity Central Funds (cost $5,762,174) | 5,762,174 | |
Total Investments (cost $88,938,442) | | $ 92,681,600 |
Cash | | 111,051 |
Foreign currency held at value (cost $34,898) | | 34,920 |
Receivable for investments sold
Regular delivery | | 666,355 |
Delayed delivery | | 105,235 |
Receivable for fund shares sold | | 49,820 |
Dividends receivable | | 286,004 |
Distributions receivable from Fidelity Central Funds | | 728 |
Prepaid expenses | | 274 |
Receivable from investment adviser for expense reductions | | 27,311 |
Other receivables | | 20,315 |
Total assets | | 93,983,613 |
| | |
Liabilities | | |
Payable for investments purchased
Regular delivery | $ 429,201 | |
Delayed delivery | 41,858 | |
Payable for fund shares redeemed | 115,859 | |
Accrued management fee | 60,781 | |
Distribution and service plan fees payable | 483 | |
Other affiliated payables | 11,858 | |
Other payables and accrued expenses | 44,892 | |
Collateral on securities loaned, at value | 4,613,246 | |
Total liabilities | | 5,318,178 |
| | |
Net Assets | | $ 88,665,435 |
Net Assets consist of: | | |
Paid in capital | | $ 92,580,072 |
Distributions in excess of net investment income | | (286,346) |
Accumulated undistributed net realized gain (loss) on investments and foreign currency transactions | | (7,369,437) |
Net unrealized appreciation (depreciation) on investments and assets and liabilities in foreign currencies | | 3,741,146 |
Net Assets | | $ 88,665,435 |
Statement of Assets and Liabilities - continued
| December 31, 2011 |
Initial Class:
Net Asset Value, offering price and redemption price per share ($29,478,476 ÷ 3,808,869 shares) | | $ 7.74 |
| | |
Service Class:
Net Asset Value, offering price and redemption price per share
($72,457 ÷ 9,332 shares) | | $ 7.76 |
| | |
Service Class 2:
Net Asset Value, offering price and redemption price per share ($2,248,724 ÷ 289,629 shares) | | $ 7.76 |
| | |
Initial Class R:
Net Asset Value, offering price and redemption price per share ($14,869,559 ÷ 1,920,891 shares) | | $ 7.74 |
| | |
Service Class 2R:
Net Asset Value, offering price and redemption price per share
($72,163 ÷ 9,269 shares) | | $ 7.79 |
| | |
Investor Class R:
Net Asset Value, offering price and redemption price per share ($41,924,056 ÷ 5,433,462 shares) | | $ 7.72 |
See accompanying notes which are an integral part of the financial statements.
Annual Report
Financial Statements - continued
Statement of Operations
| Year ended December 31, 2011 |
Investment Income | | |
Dividends | | $ 2,591,903 |
Income from Fidelity Central Funds | | 13,077 |
Income before foreign taxes withheld | | 2,604,980 |
Less foreign taxes withheld | | (273,381) |
Total income | | 2,331,599 |
| | |
Expenses | | |
Management fee | $ 761,469 | |
Transfer agent fees | 116,953 | |
Distribution and service plan fees | 4,959 | |
Accounting and security lending fees | 49,328 | |
Custodian fees and expenses | 245,788 | |
Independent trustees' compensation | 537 | |
Audit | 90,713 | |
Legal | 334 | |
Miscellaneous | 826 | |
Total expenses before reductions | 1,270,907 | |
Expense reductions | (267,305) | 1,003,602 |
Net investment income (loss) | | 1,327,997 |
Realized and Unrealized Gain (Loss) Net realized gain (loss) on: | | |
Investment securities: | | |
Unaffiliated issuers | (3,394,293) | |
Foreign currency transactions | (262,961) | |
Total net realized gain (loss) | | (3,657,254) |
Change in net unrealized appreciation (depreciation) on: Investment securities (net of decrease in deferred foreign taxes of $4,803) | (19,324,216) | |
Assets and liabilities in foreign currencies | (10,616) | |
Total change in net unrealized appreciation (depreciation) | | (19,334,832) |
Net gain (loss) | | (22,992,086) |
Net increase (decrease) in net assets resulting from operations | | $ (21,664,089) |
Statement of Changes in Net Assets
| Year ended
December 31,
2011 | Year ended
December 31,
2010 |
Increase (Decrease) in Net Assets | | |
Operations | | |
Net investment income (loss) | $ 1,327,997 | $ 817,833 |
Net realized gain (loss) | (3,657,254) | 1,482,603 |
Change in net unrealized appreciation (depreciation) | (19,334,832) | 11,348,605 |
Net increase (decrease) in net assets resulting from operations | (21,664,089) | 13,649,041 |
Distributions to shareholders from net investment income | (988,101) | (839,007) |
Distributions to shareholders from net realized gain | - | (380,090) |
Total distributions | (988,101) | (1,219,097) |
Share transactions - net increase (decrease) | 7,482,418 | 19,330,340 |
Redemption fees | 66,730 | 21,709 |
Total increase (decrease) in net assets | (15,103,042) | 31,781,993 |
| | |
Net Assets | | |
Beginning of period | 103,768,477 | 71,986,484 |
End of period (including distributions in excess of net investment income of $286,346 and distributions in excess
of net investment income of $126,246, respectively) | $ 88,665,435 | $ 103,768,477 |
See accompanying notes which are an integral part of the financial statements.
Annual Report
Financial Highlights - Initial Class
Years ended December 31, | 2011 | 2010 | 2009 | 2008 H |
Selected Per-Share Data | | | | |
Net asset value, beginning of period | $ 9.91 | $ 8.51 | $ 4.88 | $ 10.00 |
Income from Investment Operations | | | | |
Net investment income (loss) E | .13 | .09 | .04 | .13 |
Net realized and unrealized gain (loss) | (2.22) | 1.43 | 3.64 | (5.19) |
Total from investment operations | (2.09) | 1.52 | 3.68 | (5.06) |
Distributions from net investment income | (.09) | (.08) | (.02) | (.08) |
Distributions from net realized gain | - | (.04) | (.03) | - |
Total distributions | (.09) | (.12) | (.05) | (.08) |
Redemption fees added to paid in capital E | .01 | - J | - J | .02 |
Net asset value, end of period | $ 7.74 | $ 9.91 | $ 8.51 | $ 4.88 |
Total Return B,C,D | (21.01)% | 17.89% | 75.40% | (50.45)% |
Ratios to Average Net Assets F,I | | | | |
Expenses before reductions | 1.31% | 1.33% | 2.85% | 3.92% A |
Expenses net of fee waivers, if any | 1.10% | 1.10% | 1.10% | 1.10% A |
Expenses net of all reductions | 1.02% | 1.04% | 1.02% | 1.02% A |
Net investment income (loss) | 1.46% | 1.05% | .60% | 1.54% A |
Supplemental Data | | | | |
Net assets, end of period (000 omitted) | $ 29,478 | $ 18,478 | $ 250 | $ 516 |
Portfolio turnover rate G | 151% | 100% | 70% | 79% |
A Annualized
B Total returns for periods of less than one year are not annualized.
C Total returns do not reflect charges attributable to your insurance company's separate account. Inclusion of these charges would reduce the total returns shown.
D Total returns would have been lower if certain expenses had not been reduced during the applicable periods shown.
E Calculated based on average shares outstanding during the period.
F Fees and expenses of any underlying Fidelity Central Funds are not included in the Fund's expense ratio. The Fund indirectly bears its proportionate share of the expenses of any underlying Fidelity Central Funds.
G Amount does not include the portfolio activity of any underlying Fidelity Central Funds.
H For the period January 23, 2008 (commencement of operations) to December 31, 2008.
I Expense ratios reflect operating expenses of the class. Expenses before reductions do not reflect amounts reimbursed by the investment adviser or reductions from brokerage service arrangements or reductions from other expense offset arrangements and do not represent the amount paid by the class during periods when reimbursements or reductions occur. Expense ratios before reductions for start-up periods may not be representative of longer-term operating periods. Expenses net of fee waivers reflect expenses after reimbursement by the investment adviser but prior to reductions from brokerage service arrangements or other expense offset arrangements. Expenses net of all reductions represent the net expenses paid by the class.
J Amount represents less than $.01 per share.
Financial Highlights - Service Class
Years ended December 31, | 2011 | 2010 | 2009 | 2008 H |
Selected Per-Share Data | | | | |
Net asset value, beginning of period | $ 9.94 | $ 8.54 | $ 4.88 | $ 10.00 |
Income from Investment Operations | | | | |
Net investment income (loss) E | .12 | .08 | .03 | .12 |
Net realized and unrealized gain (loss) | (2.23) | 1.43 | 3.65 | (5.19) |
Total from investment operations | (2.11) | 1.51 | 3.68 | (5.07) |
Distributions from net investment income | (.08) | (.07) | - J | (.07) |
Distributions from net realized gain | - | (.04) | (.02) | - |
Total distributions | (.08) | (.11) | (.02) | (.07) |
Redemption fees added to paid in capital E | .01 | - J | - J | .02 |
Net asset value, end of period | $ 7.76 | $ 9.94 | $ 8.54 | $ 4.88 |
Total Return B,C,D | (21.15)% | 17.70% | 75.49% | (50.53)% |
Ratios to Average Net Assets F,I | | | | |
Expenses before reductions | 1.40% | 1.48% | 3.02% | 4.02% A |
Expenses net of fee waivers, if any | 1.20% | 1.20% | 1.20% | 1.20% A |
Expenses net of all reductions | 1.12% | 1.14% | 1.12% | 1.12% A |
Net investment income (loss) | 1.35% | .95% | .50% | 1.44% A |
Supplemental Data | | | | |
Net assets, end of period (000 omitted) | $ 72 | $ 102 | $ 118 | $ 396 |
Portfolio turnover rate G | 151% | 100% | 70% | 79% |
A Annualized
B Total returns for periods of less than one year are not annualized.
C Total returns do not reflect charges attributable to your insurance company's separate account. Inclusion of these charges would reduce the total returns shown.
D Total returns would have been lower if certain expenses had not been reduced during the applicable periods shown.
E Calculated based on average shares outstanding during the period.
F Fees and expenses of any underlying Fidelity Central Funds are not included in the Fund's expense ratio. The Fund indirectly bears its proportionate share of the expenses of any underlying Fidelity Central Funds.
G Amount does not include the portfolio activity of any underlying Fidelity Central Funds.
H For the period January 23, 2008 (commencement of operations) to December 31, 2008.
I Expense ratios reflect operating expenses of the class. Expenses before reductions do not reflect amounts reimbursed by the investment adviser or reductions from brokerage service arrangements or reductions from other expense offset arrangements and do not represent the amount paid by the class during periods when reimbursements or reductions occur. Expense ratios before reductions for start-up periods may not be representative of longer-term operating periods. Expenses net of fee waivers reflect expenses after reimbursement by the investment adviser but prior to reductions from brokerage service arrangements or other expense offset arrangements. Expenses net of all reductions represent the net expenses paid by the class.
J Amount represents less than $.01 per share.
See accompanying notes which are an integral part of the financial statements.
Annual Report
Financial Highlights - Service Class 2
Years ended December 31, | 2011 | 2010 | 2009 | 2008 H |
Selected Per-Share Data | | | | |
Net asset value, beginning of period | $ 9.95 | $ 8.56 | $ 4.88 | $ 10.00 |
Income from Investment Operations | | | | |
Net investment income (loss) E | .11 | .07 | .02 | .11 |
Net realized and unrealized gain (loss) | (2.24) | 1.43 | 3.66 | (5.19) |
Total from investment operations | (2.13) | 1.50 | 3.68 | (5.08) |
Distributions from net investment income | (.07) | (.07) | - | (.06) |
Distributions from net realized gain | - | (.04) | - | - |
Total distributions | (.07) | (.11) | - | (.06) |
Redemption fees added to paid in capital E | .01 | - J | - J | .02 |
Net asset value, end of period | $ 7.76 | $ 9.95 | $ 8.56 | $ 4.88 |
Total Return B,C,D | (21.30)% | 17.57% | 75.41% | (50.65)% |
Ratios to Average Net Assets F,I | | | | |
Expenses before reductions | 1.54% | 1.59% | 3.17% | 4.17% A |
Expenses net of fee waivers, if any | 1.35% | 1.35% | 1.35% | 1.35% A |
Expenses net of all reductions | 1.27% | 1.30% | 1.27% | 1.27% A |
Net investment income (loss) | 1.21% | .80% | .35% | 1.29% A |
Supplemental Data | | | | |
Net assets, end of period (000 omitted) | $ 2,249 | $ 1,348 | $ 117 | $ 395 |
Portfolio turnover rate G | 151% | 100% | 70% | 79% |
A Annualized
B Total returns for periods of less than one year are not annualized.
C Total returns do not reflect charges attributable to your insurance company's separate account. Inclusion of these charges would reduce the total returns shown.
D Total returns would have been lower if certain expenses had not been reduced during the applicable periods shown.
E Calculated based on average shares outstanding during the period.
F Fees and expenses of any underlying Fidelity Central Funds are not included in the Fund's expense ratio. The Fund indirectly bears its proportionate share of the expenses of any underlying Fidelity Central Funds.
G Amount does not include the portfolio activity of any underlying Fidelity Central Funds.
H For the period January 23, 2008 (commencement of operations) to December 31, 2008.
I Expense ratios reflect operating expenses of the class. Expenses before reductions do not reflect amounts reimbursed by the investment adviser or reductions from brokerage service arrangements or reductions from other expense offset arrangements and do not represent the amount paid by the class during periods when reimbursements or reductions occur. Expense ratios before reductions for start-up periods may not be representative of longer-term operating periods. Expenses net of fee waivers reflect expenses after reimbursement by the investment adviser but prior to reductions from brokerage service arrangements or other expense offset arrangements. Expenses net of all reductions represent the net expenses paid by the class.
J Amount represents less than $.01 per share.
Financial Highlights - Initial Class R
Years ended December 31, | 2011 | 2010 | 2009 | 2008 H |
Selected Per-Share Data | | | | |
Net asset value, beginning of period | $ 9.92 | $ 8.51 | $ 4.88 | $ 10.00 |
Income from Investment Operations | | | | |
Net investment income (loss) E | .14 | .09 | .04 | .11 |
Net realized and unrealized gain (loss) | (2.24) | 1.44 | 3.63 | (5.16) |
Total from investment operations | (2.10) | 1.53 | 3.67 | (5.05) |
Distributions from net investment income | (.09) | (.08) | (.02) | (.08) |
Distributions from net realized gain | - | (.04) | (.03) | - |
Total distributions | (.09) | (.12) | (.05) | (.08) |
Redemption fees added to paid in capital E | .01 | - J | .01 | .01 |
Net asset value, end of period | $ 7.74 | $ 9.92 | $ 8.51 | $ 4.88 |
Total Return B,C,D | (21.09)% | 18.01% | 75.40% | (50.45)% |
Ratios to Average Net Assets F,I | | | | |
Expenses before reductions | 1.30% | 1.35% | 2.03% | 3.71% A |
Expenses net of fee waivers, if any | 1.10% | 1.10% | 1.10% | 1.10% A |
Expenses net of all reductions | 1.02% | 1.04% | 1.02% | 1.02% A |
Net investment income (loss) | 1.46% | 1.05% | .60% | 1.54% A |
Supplemental Data | | | | |
Net assets, end of period (000 omitted) | $ 14,870 | $ 30,649 | $ 31,314 | $ 3,158 |
Portfolio turnover rate G | 151% | 100% | 70% | 79% |
A Annualized
B Total returns for periods of less than one year are not annualized.
C Total returns do not reflect charges attributable to your insurance company's separate account. Inclusion of these charges would reduce the total returns shown.
D Total returns would have been lower if certain expenses had not been reduced during the applicable periods shown.
E Calculated based on average shares outstanding during the period.
F Fees and expenses of any underlying Fidelity Central Funds are not included in the Fund's expense ratio. The Fund indirectly bears its proportionate share of the expenses of any underlying Fidelity Central Funds.
G Amount does not include the portfolio activity of any underlying Fidelity Central Funds.
H For the period January 23, 2008 (commencement of operations) to December 31, 2008.
I Expense ratios reflect operating expenses of the class. Expenses before reductions do not reflect amounts reimbursed by the investment adviser or reductions from brokerage service arrangements or reductions from other expense offset arrangements and do not represent the amount paid by the class during periods when reimbursements or reductions occur. Expense ratios before reductions for start-up periods may not be representative of longer-term operating periods. Expenses net of fee waivers reflect expenses after reimbursement by the investment adviser but prior to reductions from brokerage service arrangements or other expense offset arrangements. Expenses net of all reductions represent the net expenses paid by the class.
J Amount represents less than $.01 per share.
See accompanying notes which are an integral part of the financial statements.
Annual Report
Financial Highlights - Service Class 2R
Years ended December 31, | 2011 | 2010 | 2009 | 2008 H |
Selected Per-Share Data | | | | |
Net asset value, beginning of period | $ 9.97 | $ 8.56 | $ 4.88 | $ 10.00 |
Income from Investment Operations | | | | |
Net investment income (loss) E | .11 | .07 | .02 | .11 |
Net realized and unrealized gain (loss) | (2.24) | 1.43 | 3.66 | (5.19) |
Total from investment operations | (2.13) | 1.50 | 3.68 | (5.08) |
Distributions from net investment income | (.06) | (.06) | - | (.06) |
Distributions from net realized gain | - | (.04) | - | - |
Total distributions | (.06) | (.09) K | - | (.06) |
Redemption fees added to paid in capital E | .01 | - J | - J | .02 |
Net asset value, end of period | $ 7.79 | $ 9.97 | $ 8.56 | $ 4.88 |
Total Return B,C,D | (21.24)% | 17.60% | 75.41% | (50.65)% |
Ratios to Average Net Assets F,I | | | | |
Expenses before reductions | 1.56% | 1.63% | 3.17% | 4.17% A |
Expenses net of fee waivers, if any | 1.35% | 1.35% | 1.35% | 1.35% A |
Expenses net of all reductions | 1.27% | 1.29% | 1.27% | 1.27% A |
Net investment income (loss) | 1.20% | .80% | .35% | 1.29% A |
Supplemental Data | | | | |
Net assets, end of period (000 omitted) | $ 72 | $ 102 | $ 117 | $ 395 |
Portfolio turnover rate G | 151% | 100% | 70% | 79% |
A Annualized
B Total returns for periods of less than one year are not annualized.
C Total returns do not reflect charges attributable to your insurance company's separate account. Inclusion of these charges would reduce the total returns shown.
D Total returns would have been lower if certain expenses had not been reduced during the applicable periods shown.
E Calculated based on average shares outstanding during the period.
F Fees and expenses of any underlying Fidelity Central Funds are not included in the Fund's expense ratio. The Fund indirectly bears its proportionate share of the expenses of any underlying Fidelity Central Funds.
G Amount does not include the portfolio activity of any underlying Fidelity Central Funds.
H For the period January 23, 2008 (commencement of operations) to December 31, 2008.
I Expense ratios reflect operating expenses of the class. Expenses before reductions do not reflect amounts reimbursed by the investment adviser or reductions from brokerage service arrangements or reductions from other expense offset arrangements and do not represent the amount paid by the class during periods when reimbursements or reductions occur. Expense ratios before reductions for start-up periods may not be representative of longer-term operating periods. Expenses net of fee waivers reflect expenses after reimbursement by the investment adviser but prior to reductions from brokerage service arrangements or other expense offset arrangements. Expenses net of all reductions represent the net expenses paid by the class.
J Amount represents less than $.01 per share.
K Total distributions of $.09 per share is comprised of distributions from net investment income of $.056 and distributions from net realized gain of $.037 per share.
Financial Highlights - Investor Class R
Years ended December 31, | 2011 | 2010 | 2009 | 2008 H |
Selected Per-Share Data | | | | |
Net asset value, beginning of period | $ 9.89 | $ 8.50 | $ 4.87 | $ 10.00 |
Income from Investment Operations | | | | |
Net investment income (loss) E | .13 | .08 | .04 | .10 |
Net realized and unrealized gain (loss) | (2.22) | 1.43 | 3.63 | (5.16) |
Total from investment operations | (2.09) | 1.51 | 3.67 | (5.06) |
Distributions from net investment income | (.09) | (.08) | (.02) | (.08) |
Distributions from net realized gain | - | (.04) | (.03) | - |
Total distributions | (.09) | (.12) | (.05) | (.08) |
Redemption fees added to paid in capital E | .01 | - J | .01 | .01 |
Net asset value, end of period | $ 7.72 | $ 9.89 | $ 8.50 | $ 4.87 |
Total Return B,C,D | (21.05)% | 17.79% | 75.56% | (50.55)% |
Ratios to Average Net Assets F,I | | | | |
Expenses before reductions | 1.38% | 1.42% | 2.07% | 3.81% A |
Expenses net of fee waivers, if any | 1.18% | 1.18% | 1.18% | 1.18% A |
Expenses net of all reductions | 1.10% | 1.12% | 1.10% | 1.10% A |
Net investment income (loss) | 1.37% | .97% | .52% | 1.46% A |
Supplemental Data | | | | |
Net assets, end of period (000 omitted) | $ 41,924 | $ 53,089 | $ 40,070 | $ 3,377 |
Portfolio turnover rate G | 151% | 100% | 70% | 79% |
A Annualized
B Total returns for periods of less than one year are not annualized.
C Total returns do not reflect charges attributable to your insurance company's separate account. Inclusion of these charges would reduce the total returns shown.
D Total returns would have been lower if certain expenses had not been reduced during the applicable periods shown.
E Calculated based on average shares outstanding during the period.
F Fees and expenses of any underlying Fidelity Central Funds are not included in the Fund's expense ratio. The Fund indirectly bears its proportionate share of the expenses of any underlying Fidelity Central Funds.
G Amount does not include the portfolio activity of any underlying Fidelity Central Funds.
H For the period January 23, 2008 (commencement of operations) to December 31, 2008.
I Expense ratios reflect operating expenses of the class. Expenses before reductions do not reflect amounts reimbursed by the investment adviser or reductions from brokerage service arrangements or reductions from other expense offset arrangements and do not represent the amount paid by the class during periods when reimbursements or reductions occur. Expense ratios before reductions for start-up periods may not be representative of longer-term operating periods. Expenses net of fee waivers reflect expenses after reimbursement by the investment adviser but prior to reductions from brokerage service arrangements or other expense offset arrangements. Expenses net of all reductions represent the net expenses paid by the class.
J Amount represents less than $.01 per share.
See accompanying notes which are an integral part of the financial statements.
Annual Report
Notes to Financial Statements
For the period ended December 31, 2011
1. Organization.
VIP Emerging Markets Portfolio (the Fund) is a fund of Variable Insurance Products Fund IV (the Trust) and is authorized to issue an unlimited number of shares. The Trust is registered under the Investment Company Act of 1940, as amended (the 1940 Act), as an open-end management investment company organized as a Massachusetts business trust. Shares of the Fund may only be purchased by insurance companies for the purpose of funding variable annuity or variable life insurance contracts. The Fund offers the following classes of shares: Initial Class shares, Service Class shares, Service Class 2 shares, Initial Class R shares, Service Class 2R shares, and Investor Class R shares. All classes have equal rights and voting privileges, except for matters affecting a single class. Investment income, realized and unrealized capital gains and losses, the common expenses of the Fund, and certain fund-level expense reductions, if any, are allocated on a pro-rata basis to each class based on the relative net assets of each class to the total net assets of the Fund. Each class differs with respect to transfer agent and distribution and service plan fees incurred. Certain expense reductions may also differ by class. The Fund's investments in emerging markets can be subject to social, economic, regulatory, and political uncertainties and can be extremely volatile.
2. Investments in Fidelity Central Funds.
The Fund invests in Fidelity Central Funds, which are open-end investment companies available only to other investment companies and accounts managed by Fidelity Management & Research Company (FMR) and its affiliates. The Fund's Schedule of Investments lists each of the Fidelity Central Funds held as of period end, if any, as an investment of the Fund, but do not include the underlying holdings of each Fidelity Central Fund. As an Investing Fund, the Fund indirectly bears its proportionate share of the expenses of the underlying Fidelity Central Funds.
The Money Market Central Funds seek preservation of capital and current income and are managed by Fidelity Investments Money Management, Inc. (FIMM), an affiliate of FMR.
A complete unaudited list of holdings for each Fidelity Central Fund is available upon request or at the Securities and Exchange Commission (the SEC) web site at www.sec.gov. In addition, the financial statements of the Fidelity Central Funds, which are not covered by the Fund's Report of Independent Registered Public Accounting Firm, are available on the SEC web site or upon request.
3. Significant Accounting Policies.
The financial statements have been prepared in conformity with accounting principles generally accepted in the United States of America (GAAP), which require management to make certain estimates and assumptions at the date of the financial statements. Actual results could differ from those estimates. Subsequent events, if any, through the date that the financial statements were issued have been evaluated in the preparation of the financial statements. The following summarizes the significant accounting policies of the Fund:
Security Valuation. Investments are valued as of 4:00 p.m. Eastern time on the last calendar day of the period. The Fund uses independent pricing services approved by the Board of Trustees to value its investments. When current market prices or quotations are not readily available or reliable, valuations may be determined in good faith in accordance with procedures adopted by the Board of Trustees. Factors used in determining value may include market or security specific events. The frequency with which these procedures are used cannot be predicted and they may be utilized to a significant extent. The value used for net asset value (NAV) calculation under these procedures may differ from published prices for the same securities.
The Fund categorizes the inputs to valuation techniques used to value its investments into a disclosure hierarchy consisting of three levels as shown below:
Level 1 - quoted prices in active markets for identical investments
Level 2 - other significant observable inputs (including quoted prices for similar investments, interest rates, prepayment speeds, etc.)
Level 3 - unobservable inputs (including the Fund's own assumptions based on the best information available)
Changes in valuation techniques may result in transfers in or out of an assigned level within the disclosure hierarchy. The aggregate value of investments by input level, as of December 31, 2011, is included at the end of the Fund's Schedule of Investments. Valuation techniques used to value the Fund's investments by major category are as follows:
Equity securities, including restricted securities, for which market quotations are readily available, are valued at the last reported sale price or official closing price as reported by an independent pricing service on the primary market or exchange on which they are traded and are categorized as Level 1 in the hierarchy. In the event there were no sales during the day or closing prices are not available, securities are valued at the last quoted bid price or may be valued using the last available price and are generally categorized as Level 2 in the hierarchy. For foreign equity securities, when significant market or security specific events arise, comparisons to the valuation of American Depositary Receipts (ADRs), futures contracts, Exchange-traded funds (ETFs) and certain indexes as well as quoted prices for similar securities are used and are categorized as Level 2 in the hierarchy in these
Annual Report
3. Significant Accounting Policies - continued
Security Valuation - continued
circumstances. Utilizing these techniques may result in transfers between Level 1 and Level 2. For restricted equity securities and private placements where observable inputs are limited, assumptions about market activity and risk are used and are categorized as Level 3 in the hierarchy.
Investments in open-end mutual funds, including the Fidelity Central Funds, are valued at their closing net asset value each business day and are categorized as Level 1 in the hierarchy.
New Accounting Pronouncements. In May 2011, the Financial Accounting Standards Board issued Accounting Standard Update No. 2011-04, Fair Value Measurement (Topic 820) - Amendments to Achieve Common Fair Value Measurement and Disclosure Requirements in U.S. GAAP and IFRSs. The update is effective during interim and annual periods beginning after December 15, 2011 and will result in additional disclosure for transfers between levels as well as expanded disclosure for securities categorized as Level 3 under the fair value hierarchy.
In December 2011, the Financial Accounting Standards Board issued Accounting Standard Update No. 2011-11, Disclosures about Offsetting Assets and Liabilities. The update creates new disclosure requirements requiring entities to disclose both gross and net information for derivatives and other financial instruments that are either offset in the Statement of Assets and Liabilities or subject to an enforceable master netting arrangement or similar agreement. The disclosure requirements are effective for annual reporting periods beginning on or after January 1, 2013. Management is currently evaluating the impact of the update's adoption on the Fund's financial statement disclosures.
Foreign Currency. The Fund may use foreign currency contracts to facilitate transactions in foreign-denominated securities. Gains and losses from these transactions may arise from changes in the value of the foreign currency or if the counterparties do not perform under the contracts' terms.
Foreign-denominated assets, including investment securities, and liabilities are translated into U.S. dollars at the exchange rate at period end. Purchases and sales of investment securities, income and dividends received and expenses denominated in foreign currencies are translated into U.S. dollars at the exchange rate in effect on the transaction date.
The effects of exchange rate fluctuations on investments are included with the net realized and unrealized gain (loss) on investment securities. Other foreign currency transactions resulting in realized and unrealized gain (loss) are disclosed separately.
Investment Transactions and Income. For financial reporting purposes, the Fund's investment holdings and NAV include trades executed through the end of the last business day of the period. The NAV per share for processing shareholder transactions is calculated as of the close of business of the New York Stock Exchange (NYSE), normally 4:00 p.m. Eastern time and includes trades executed through the end of the prior business day. Gains and losses on securities sold are determined on the basis of identified cost. Dividend income is recorded on the ex-dividend date, except for certain dividends from foreign securities where the ex-dividend date may have passed, which are recorded as soon as the Fund is informed of the ex-dividend date. Non-cash dividends included in dividend income, if any, are recorded at the fair market value of the securities received. Distributions received on securities that represent a return of capital or capital gain are recorded as a reduction of cost of investments and/or as a realized gain. The Fund estimates the components of distributions received that may be considered return of capital distributions or capital gain distributions. Interest income and distributions from the Fidelity Central Funds are accrued as earned. Investment income is recorded net of foreign taxes withheld where recovery of such taxes is uncertain.
Expenses. Expenses directly attributable to a fund are charged to that fund. Expenses attributable to more than one fund are allocated among the respective funds on the basis of relative net assets or other appropriate methods. Expense estimates are accrued in the period to which they relate and adjustments are made when actual amounts are known.
Income Tax Information and Distributions to Shareholders. Each year, the Fund intends to qualify as a regulated investment company, including distributing substantially all of its taxable income and realized gains under Subchapter M of the Internal Revenue Code. As a result, no provision for income taxes is required. As of December 31, 2011, the Fund did not have any unrecognized tax benefits in the financial statements; nor is the Fund aware of any tax positions for which it is reasonably possible that the total amounts of unrecognized tax benefits will significantly change in the next twelve months. The Fund files a U.S. federal tax return, in addition to state and local tax returns as required. A fund's tax returns are subject to examination by the Internal Revenue Service (IRS) for a period of three fiscal years. State and local tax returns may be subject to examination for an additional fiscal year depending on the jurisdiction. Foreign taxes are provided for based on the Fund's understanding of the tax rules and rates that exist in the foreign markets in which it invests.
Distributions are declared and recorded on the ex-dividend date. Income dividends and capital gain distributions are declared separately for each class. Income and capital gain distributions are determined in accordance with income tax regulations, which may differ from GAAP.
Capital accounts within the financial statements are adjusted for permanent book-tax differences. These adjustments have no impact on net assets or the results of operations. Temporary book-tax differences will reverse in a subsequent period.
Annual Report
Notes to Financial Statements - continued
3. Significant Accounting Policies - continued
Income Tax Information and Distributions to Shareholders - continued
Book-tax differences are primarily due to foreign currency transactions, passive foreign investment companies (PFIC), capital loss carryforwards and losses deferred due to wash sales and excise tax regulations.
The federal tax cost of investment securities and unrealized appreciation (depreciation) as of period end were as follows:
Gross unrealized appreciation | $ 9,179,491 |
Gross unrealized depreciation | (6,246,389) |
Net unrealized appreciation (depreciation) on securities and other investments | $ 2,933,102 |
| |
Tax Cost | $ 89,748,498 |
The tax-based components of distributable earnings as of period end were as follows:
Capital loss carryforward | $ (6,559,382) |
Net unrealized appreciation (depreciation) | $ 2,931,090 |
Capital loss carryforwards are only available to offset future capital gains of the Fund to the extent provided by regulations and may be limited. Under the Regulated Investment Company Modernization Act of 2010 (the Act), the Fund is permitted to carry forward capital losses incurred in taxable years beginning after December 22, 2010 for an unlimited period and such capital losses are required to be used prior to any losses that expire. Capital loss carryforwards were as follows:
Fiscal year of expiration | |
2016 | $ (773,916) |
2017 | (2,824,257) |
Total with expiration | (3,598,173) |
No expiration | |
Short-term | (2,961,209) |
Total capital loss carryforward | $ (6,559,382) |
The tax character of distributions paid was as follows:
| December 31, 2011 | December 31, 2010 |
Ordinary Income | $ 988,101 | $ 1,219,097 |
Trading (Redemption) Fees. Initial Class R shares, Service Class 2 R shares and Investor Class R shares held by investors less than 60 days are subject to a redemption fee equal to 1% of the net asset value of shares redeemed. All redemption fees, which reduce the proceeds of the shareholder redemption, are retained by the Fund and accounted for as an addition to paid in capital.
4. Operating Policies.
Delayed Delivery Transactions and When-Issued Securities. During the period, the Fund transacted in securities on a delayed delivery or when-issued basis. Payment and delivery may take place after the customary settlement period for that security. The price of the underlying securities and the date when the securities will be delivered and paid for are fixed at the time the transaction is negotiated. During the time a delayed delivery sell is outstanding, the contract is marked-to-market daily and equivalent deliverable securities are held for the transaction. The securities purchased on a delayed delivery or when-issued basis are identified as such in the Fund's Schedule of Investments. The Fund may receive compensation for interest forgone in the purchase of a delayed delivery or when-issued security. With respect to purchase commitments, the Fund identifies securities as segregated in its records with a value at least equal to the amount of the commitment. Losses may arise due to changes in the value of the underlying securities or if the counterparty does not perform under the contract's terms, or if the issuer does not issue the securities due to political, economic, or other factors.
Restricted Securities. The Fund may invest in securities that are subject to legal or contractual restrictions on resale. These securities generally may be resold in transactions exempt from registration or to the public if the securities are registered. Disposal of these securities may involve time-consuming negotiations and expense, and prompt sale at an acceptable price may be difficult. Information regarding restricted securities is included at the end of the Fund's Schedule of Investments.
Annual Report
5. Purchases and Sales of Investments.
Purchases and sales of securities, other than short-term securities, aggregated $148,384,254 and $141,485,562, respectively.
6. Fees and Other Transactions with Affiliates.
Management Fee. FMR and its affiliates provide the Fund with investment management related services for which the Fund pays a monthly management fee. The management fee is the sum of an individual fund fee rate that is based on an annual rate of .55% of the Fund's average net assets and an annualized group fee rate that averaged .26% during the period. The group fee rate is based upon the average net assets of all the mutual funds advised by FMR. The group fee rate decreases as assets under management increase and increases as assets under management decrease. For the period, the total annual management fee rate was .81% of the Fund's average net assets.
Distribution and Service Plan Fees. In accordance with Rule 12b-1 of the 1940 Act, the Fund has adopted separate 12b-1 Plans for each Service Class of shares. Each Service Class pays Fidelity Distributors Corporation (FDC), an affiliate of FMR, a service fee. For the period, the service fee is based on an annual rate of .10% of Service Class' average net assets and .25% of Service Class 2's and Service Class 2R's average net assets.
For the period, total fees, all of which were re-allowed to insurance companies for the distribution of shares and providing shareholder support services were as follows:
Service Class | $ 88 |
Service Class 2 | 4,647 |
Service Class 2 R | 224 |
| $ 4,959 |
Transfer Agent Fees. Fidelity Investments Institutional Operations Company, Inc. (FIIOC), an affiliate of FMR, is the Fund's transfer, dividend disbursing, and shareholder servicing agent. FIIOC receives an asset-based fee with respect to each class. Each class (with the exception of Investor Class R) pays a transfer agent fee, excluding out of pocket expenses, equal to an annual rate of .07% of average net assets. Investor Class R pays a monthly asset-based transfer agent fee of .15% of average net assets. In addition, FIIOC receives an asset-based fee of .0045% of average net assets for typesetting, printing and mailing of shareholder reports, except proxy statements. FIIOC voluntarily agreed to waive this fee for the period August 1, 2011 through December 31, 2011 (see Expense Reductions note). For the period, transfer agent fees for each class, including printing and out of pocket expenses, were as follows:
Initial Class | $ 19,747 |
Service Class | 78 |
Service Class 2 | 1,356 |
Initial Class R | 17,225 |
Service Class 2R | 78 |
Investor Class R | 78,469 |
| $ 116,953 |
Accounting and Security Lending Fees. Fidelity Service Company, Inc. (FSC), an affiliate of FMR, maintains the Fund's accounting records. The accounting fee is based on the level of average net assets for the month. Under a separate contract, FSC administers the security lending program. The security lending fee is based on the number and duration of lending transactions.
Brokerage Commissions. The Fund placed a portion of its portfolio transactions with brokerage firms which are affiliates of the investment adviser. The commissions paid to these affiliated firms were $36 for the period.
7. Committed Line of Credit.
The Fund participates with other funds managed by FMR or an affiliate in a $4.0 billion credit facility (the "line of credit") to be utilized for temporary or emergency purposes to fund shareholder redemptions or for other short-term liquidity purposes. The Fund has agreed to pay commitment fees on its pro-rata portion of the line of credit, which amounted to $297 and is reflected in Miscellaneous expenses on the Statement of Operations. During the period, there were no borrowings on this line of credit.
Annual Report
Notes to Financial Statements - continued
8. Security Lending.
The Fund lends portfolio securities through a lending agent from time to time in order to earn additional income. For equity securities, a lending agent is used and may loan securities to certain qualified borrowers, including Fidelity Capital Markets (FCM), a broker-dealer affiliated with the Fund. On the settlement date of the loan, the Fund receives collateral (in the form of U.S. Treasury obligations, letters of credit and/or cash) against the loaned securities and maintains collateral in an amount not less than 100% of the market value of the loaned securities during the period of the loan. The market value of the loaned securities is determined at the close of business of the Fund and any additional required collateral is delivered to the Fund on the next business day. If the borrower defaults on its obligation to return the securities loaned because of insolvency or other reasons, a fund could experience delays and costs in recovering the securities loaned or in gaining access to the collateral. Any cash collateral received is invested in the Fidelity Securities Lending Cash Central Fund. The value of loaned securities and cash collateral at period end are disclosed on the Fund's Statement of Assets and Liabilities. Security lending income represents the income earned on investing cash collateral, less rebates paid to borrowers and any lending agent fees associated with the loan, plus any premium payments received for lending certain types of securities. Security lending income is presented in the Statement of Operations as a component of income from Fidelity Central Funds. Total security lending income during the period amounted to $11,200. During the period, there were no securities loaned to FCM.
9. Expense Reductions.
In addition to FIIOC waiving a portion of its transfer agent fees, FMR voluntarily agreed to reimburse each class to the extent annual operating expenses exceeded certain levels of average net assets as noted in the table below. Some expenses, for example interest expense, including commitment fees, are excluded from this reimbursement.
Expenses were reimbursed and/or waived for the following classes during the period:
| Expense
Limitations | Reimbursement/Waiver |
Initial Class | 1.10% | $ 47,545 |
Service Class | 1.20% | 180 |
Service Class 2 | 1.35% | 3,583 |
Initial Class R | 1.10% | 42,656 |
Service Class 2R | 1.35% | 182 |
Investor Class R | 1.18% | 96,764 |
| | $ 190,910 |
Many of the brokers with whom FMR places trades on behalf of the Fund provided services to the Fund in addition to trade execution. These services included payments of certain expenses on behalf of the Fund totaling $76,395 for the period.
10. Distributions to Shareholders.
Distributions to shareholders of each class were as follows:
Years ended December 31, | 2011 | 2010 |
From net investment income | | |
Initial Class | $ 323,395 | $ 147,657 |
Service Class | 711 | 719 |
Service Class 2 | 19,808 | 8,901 |
Initial Class R | 168,093 | 247,442 |
Service Class 2R | 570 | 565 |
Investor Class R | 475,524 | 433,723 |
Total | $ 988,101 | $ 839,007 |
From net realized gain | | |
Initial Class | $ - | $ 62,064 |
Service Class | - | 383 |
Service Class 2 | - | 4,185 |
Initial Class R | - | 115,662 |
Service Class 2R | - | 382 |
Investor Class R | - | 197,414 |
Total | $ - | $ 380,090 |
Annual Report
11. Share Transactions.
Transactions for each class of shares were as follows:
| Shares | Dollars |
Years ended December 31, | 2011 | 2010 | 2011 | 2010 |
Initial Class | | | | |
Shares sold | 2,281,553 | 1,907,445 | $ 20,021,746 | $ 16,225,751 |
Reinvestment of distributions | 42,329 | 21,780 | 323,395 | 209,721 |
Shares redeemed | (378,716) | (94,931) | (3,524,273) | (856,392) |
Net increase (decrease) | 1,945,166 | 1,834,294 | $ 16,820,868 | $ 15,579,080 |
Service Class | | | | |
Shares sold | - | - | $ - | $ - |
Reinvestment of distributions | 93 | 115 | 711 | 1,102 |
Shares redeemed | (998) | (3,650) | (9,971) | (31,523) |
Net increase (decrease) | (905) | (3,535) | $ (9,260) | $ (30,421) |
Service Class 2 | | | | |
Shares sold | 202,365 | 137,437 | $ 1,850,575 | $ 1,250,469 |
Reinvestment of distributions | 2,586 | 1,356 | 19,808 | 13,086 |
Shares redeemed | (50,852) | (16,991) | (469,379) | (155,917) |
Net increase (decrease) | 154,099 | 121,802 | $ 1,401,004 | $ 1,107,638 |
Initial Class R | | | | |
Shares sold | 604,766 | 1,547,303 | $ 5,608,309 | $ 14,204,050 |
Reinvestment of distributions | 22,002 | 38,007 | 168,093 | 363,104 |
Shares redeemed | (1,796,502) | (2,173,155) | (16,850,822) | (18,591,867) |
Net increase (decrease) | (1,169,734) | (587,845) | $ (11,074,420) | $ (4,024,713) |
Service Class 2R | | | | |
Shares sold | - | - | $ - | $ - |
Reinvestment of distributions | 74 | 99 | 570 | 947 |
Shares redeemed | (993) | (3,639) | (9,940) | (31,476) |
Net increase (decrease) | (919) | (3,540) | $ (9,370) | $ (30,529) |
Investor Class R | | | | |
Shares sold | 1,968,383 | 3,120,989 | $ 17,994,709 | $ 27,575,797 |
Reinvestment of distributions | 62,405 | 66,066 | 475,524 | 631,137 |
Shares redeemed | (1,963,640) | (2,534,983) | (18,116,637) | (21,477,649) |
Net increase (decrease) | 67,148 | 652,072 | $ 353,596 | $ 6,729,285 |
12. Other.
The Fund's organizational documents provide former and current trustees and officers with a limited indemnification against liabilities arising in connection with the performance of their duties to the Fund. In the normal course of business, the Fund may also enter into contracts that provide general indemnifications. The Fund's maximum exposure under these arrangements is unknown as this would be dependent on future claims that may be made against the Fund. The risk of material loss from such claims is considered remote.
At the end of the period, VIP Freedom 2020 Portfolio was the owner of record of approximately 17% of the total outstanding shares of the Fund. The VIP Freedom Funds, VIP Freedom Lifetime Income Funds and VIP Investor Freedom Funds were the owners of record, in the aggregate, of approximately 45% of the total outstanding shares of the Fund. FMR or its affiliates were the owners of record of 52% of the total outstanding shares of the Fund.
Annual Report
Report of Independent Registered Public Accounting Firm
To the Trustees of Variable Insurance Products Fund IV and Shareholders of VIP Emerging Markets Portfolio:
We have audited the accompanying statement of assets and liabilities of VIP Emerging Markets Portfolio (the Fund), a fund of Variable Insurance Products Fund IV, including the schedule of investments, as of December 31, 2011, and the related statement of operations for the year then ended, the statement of changes in net assets for each of the two years in the period then ended, and the financial highlights for each of the periods presented. These financial statements and financial highlights are the responsibility of the Fund's management. Our responsibility is to express an opinion on these financial statements and financial highlights based on our audits.
We conducted our audits in accordance with the standards of the Public Company Accounting Oversight Board (United States). Those standards require that we plan and perform the audit to obtain reasonable assurance about whether the financial statements and financial highlights are free of material misstatement. The Fund is not required to have, nor were we engaged to perform, an audit of its internal control over financial reporting. Our audits included consideration of internal control over financial reporting as a basis for designing audit procedures that are appropriate in the circumstances, but not for the purpose of expressing an opinion on the effectiveness of the Fund's internal control over financial reporting. Accordingly, we express no such opinion. An audit also includes examining, on a test basis, evidence supporting the amounts and disclosures in the financial statements, assessing the accounting principles used and significant estimates made by management, as well as evaluating the overall financial statement presentation. Our procedures included confirmation of securities owned as of December 31, 2011, by correspondence with the custodians and brokers; where replies were not received from brokers, we performed other auditing procedures. We believe that our audits provide a reasonable basis for our opinion.
In our opinion, the financial statements and financial highlights referred to above present fairly, in all material respects, the financial position of VIP Emerging Markets Portfolio as of December 31, 2011, the results of its operations for the year then ended, the changes in its net assets for each of the two years in the period then ended, and the financial highlights for each of the periods presented, in conformity with accounting principles generally accepted in the United States of America.
/s/ Deloitte & Touche LLP
DELOITTE & TOUCHE LLP
Boston, Massachusetts
February 15, 2012
Annual Report
The Trustees, Members of the Advisory Board, and executive officers of the trust and fund, as applicable, are listed below. The Board of Trustees governs the fund and is responsible for protecting the interests of shareholders. The Trustees are experienced executives who meet periodically throughout the year to oversee the fund's activities, review contractual arrangements with companies that provide services to the fund, oversee management of the risks associated with such activities and contractual arrangements, and review the fund's performance. Except for James C. Curvey, each of the Trustees oversees 226 funds advised by FMR or an affiliate. Mr. Curvey oversees 429 funds advised by FMR or an affiliate.
The Trustees hold office without limit in time except that (a) any Trustee may resign; (b) any Trustee may be removed by written instrument, signed by at least two-thirds of the number of Trustees prior to such removal; (c) any Trustee who requests to be retired or who has become incapacitated by illness or injury may be retired by written instrument signed by a majority of the other Trustees; and (d) any Trustee may be removed at any special meeting of shareholders by a two-thirds vote of the outstanding voting securities of the trust. Each Trustee who is not an interested person (as defined in the 1940 Act) (Independent Trustee), shall retire not later than the last day of the calendar year in which his or her 75th birthday occurs. The Independent Trustees may waive this mandatory retirement age policy with respect to individual Trustees. The executive officers and Advisory Board Members hold office without limit in time, except that any officer and Advisory Board Member may resign or may be removed by a vote of a majority of the Trustees at any regular meeting or any special meeting of the Trustees. Except as indicated, each individual has held the office shown or other offices in the same company for the past five years.
Experience, Skills, Attributes, and Qualifications of the Fund's Trustees. The Governance and Nominating Committee has adopted a statement of policy that describes the experience, qualifications, attributes, and skills that are necessary and desirable for potential Independent Trustee candidates (Statement of Policy). The Board believes that each Trustee satisfied at the time he or she was initially elected or appointed a Trustee, and continues to satisfy, the standards contemplated by the Statement of Policy. The Governance and Nominating Committee also engages professional search firms to help identify potential Independent Trustee candidates who have the experience, qualifications, attributes, and skills consistent with the Statement of Policy. From time to time, additional criteria based on the composition and skills of the current Independent Trustees, as well as experience or skills that may be appropriate in light of future changes to board composition, business conditions, and regulatory or other developments, have also been considered by the professional search firms and the Governance and Nominating Committee. In addition, the Board takes into account the Trustees' commitment and participation in Board and committee meetings, as well as their leadership of standing and ad hoc committees throughout their tenure.
In determining that a particular Trustee was and continues to be qualified to serve as a Trustee, the Board has considered a variety of criteria, none of which, in isolation, was controlling. The Board believes that, collectively, the Trustees have balanced and diverse experience, qualifications, attributes, and skills, which allow the Board to operate effectively in governing the fund and protecting the interests of shareholders. Information about the specific experience, skills, attributes, and qualifications of each Trustee, which in each case led to the Board's conclusion that the Trustee should serve (or continue to serve) as a trustee of the fund, is provided below.
Board Structure and Oversight Function. James C. Curvey is an interested person (as defined in the 1940 Act) and currently serves as Acting Chairman. The Trustees have determined that an interested Chairman is appropriate and benefits shareholders because an interested Chairman has a personal and professional stake in the quality and continuity of services provided to the fund. Independent Trustees exercise their informed business judgment to appoint an individual of their choosing to serve as Chairman, regardless of whether the Trustee happens to be independent or a member of management. The Independent Trustees have determined that they can act independently and effectively without having an Independent Trustee serve as Chairman and that a key structural component for assuring that they are in a position to do so is for the Independent Trustees to constitute a substantial majority for the Board. The Independent Trustees also regularly meet in executive session. Ned C. Lautenbach serves as Chairman of the Independent Trustees and as such (i) acts as a liaison between the Independent Trustees and management with respect to matters important to the Independent Trustees and (ii) with management prepares agendas for Board meetings.
Fidelity funds are overseen by different Boards of Trustees. The fund's Board oversees Fidelity's equity and high income funds and another Board oversees Fidelity's investment-grade bond, money market, and asset allocation funds. The asset allocation funds may invest in Fidelity funds overseen by the fund's Board. The use of separate Boards, each with its own committee structure, allows the Trustees of each group of Fidelity funds to focus on the unique issues of the funds they oversee, including common research, investment, and operational issues. On occasion, the separate Boards establish joint committees to address issues of overlapping consequences for the Fidelity funds overseen by each Board.
The Trustees operate using a system of committees to facilitate the timely and efficient consideration of all matters of importance to the Trustees, the fund, and fund shareholders and to facilitate compliance with legal and regulatory requirements and oversight of the fund's activities and associated risks. The Board, acting through its committees, has charged FMR and its affiliates with (i) identifying events or circumstances the occurrence of which could have demonstrably adverse effects on the fund's business and/or reputation; (ii) implementing processes and controls to lessen the possibility that such events or circumstances occur or to mitigate the effects of such events or circumstances if they do occur; and (iii) creating and maintaining a system designed to evaluate continuously business and market conditions in order to facilitate the identification and implementation processes described in (i) and (ii) above. Because the day-to-day operations and activities of the fund are carried out by or through FMR, its affiliates and other service providers, the fund's exposure to risks is mitigated but not eliminated by the processes overseen by the Trustees. While each of the Board's committees has responsibility for overseeing different aspects of the fund's activities, oversight is exercised primarily through the Operations, Audit, and Compliance Committees. In addition, the Independent Trustees have worked with FMR to enhance the Board's oversight of investment and financial risks, legal and regulatory risks, technology risks, and operational risks, including the development of additional risk reporting to the Board. For example, a working group comprised of Independent Trustees and FMR has worked and continues to work to review the Fidelity funds' valuation-related activities, reporting and risk management. Appropriate personnel, including but not limited to the fund's Chief Compliance Officer (CCO), FMR's internal auditor, the independent accountants, the fund's Treasurer and portfolio management personnel, make periodic reports to the Board's committees, as appropriate, including an annual review of FMR's risk management program for the Fidelity funds. The responsibilities of each standing committee, including their oversight responsibilities, are described further under "Standing Committees of the Fund's Trustees."
Annual Report
The fund's Statement of Additional Information (SAI) includes more information about the Trustees. To request a free copy, call Fidelity at 1-877-208-0098.
Interested Trustees*:
Correspondence intended for each Trustee who is an interested person may be sent to Fidelity Investments, 82 Devonshire Street, Boston, Massachusetts 02109.
Name, Age; Principal Occupations and Other Relevant Experience+ |
James C. Curvey (76) |
| Year of Election or Appointment: 2007 Mr. Curvey is Trustee and Acting Chairman of the Board of Trustees of certain Trusts. Mr. Curvey also serves as Trustee (2007-present) of other investment companies advised by FMR. Mr. Curvey is a Director of Fidelity Investments Money Management, Inc. (2009-present), Director of Fidelity Research & Analysis Co. (2009-present) and Director of FMR and FMR Co., Inc. (2007-present). Mr. Curvey is also Vice Chairman (2007-present) and Director of FMR LLC. In addition, Mr. Curvey serves as an Overseer for the Boston Symphony Orchestra and a member of the Trustees of Villanova University. Previously, Mr. Curvey was the Vice Chairman (2006-2007) and Director (2000-2007) of FMR Corp. |
Ronald P. O'Hanley (54) |
| Year of Election or Appointment: 2011 Mr. O'Hanley is Director of FMR Co., Inc. (2010-present), Director of Fidelity Investments Money Management, Inc. (2010-present), Director of Fidelity Research & Analysis Company (2010-present), President of Fidelity Asset Management and Corporate Services and a member of Fidelity's Executive Committee (2010-present). Previously, Mr. O'Hanley served as President and Chief Executive Officer of BNY Mellon Asset Management (2007-2010). Mr. O'Hanley also served as Vice Chairman of Bank New York Mellon Corp. and a member of that firm's Executive Committee. Prior to the 2007 merger of The Bank of New York and Mellon Financial Corporation, he was Vice Chairman of Mellon Financial Corporation and President and Chief Executive Officer of Mellon Asset Management. He joined Mellon in February 1997. Mr. O'Hanley currently serves as Chairman of the Boston Public Library Foundation Board of Directors and sits on the Board of Directors of Beth Israel Deaconess Medical Center, the Board of Trustees of the Marine Biological Laboratory and the Advisory Board of the Maxwell School of Citizenship and Public Administration at Syracuse University. Mr. O'Hanley also chairs the Council on Asset Management for the Financial Services Roundtable and is a member of the Board of Directors of Institutional Investor's U.S. Institute. |
* Trustees have been determined to be "Interested Trustees" by virtue of, among other things, their affiliation with the trust or various entities under common control with FMR.
+ The information above includes each Trustee's principal occupation during the last five years and other information relating to the experience, attributes, and skills relevant to each Trustee's qualifications to serve as a Trustee, which led to the conclusion that each Trustee should serve as a Trustee for the fund.
Independent Trustees:
Correspondence intended for each Independent Trustee (that is, the Trustees other than the Interested Trustees) may be sent to Fidelity Investments, P.O. Box 55235, Boston, Massachusetts 02205-5235.
Name, Age; Principal Occupations and Other Relevant Experience+ |
Dennis J. Dirks (63) |
| Year of Election or Appointment: 2005 Prior to his retirement in May 2003, Mr. Dirks was Chief Operating Officer and a member of the Board of The Depository Trust & Clearing Corporation (DTCC). He also served as President, Chief Operating Officer, and Board member of The Depository Trust Company (DTC) and President and Board member of the National Securities Clearing Corporation (NSCC). In addition, Mr. Dirks served as Chief Executive Officer and Board member of the Government Securities Clearing Corporation, Chief Executive Officer and Board member of the Mortgage-Backed Securities Clearing Corporation, as a Trustee and a member of the Finance Committee of Manhattan College (2005-2008), and as a Trustee and a member of the Finance Committee of AHRC of Nassau County (2006-2008). Mr. Dirks is a member of the Independent Directors Council (IDC) Governing Council (2010-present) and Board of Directors for The Brookville Center for Children's Services, Inc. (2009-present). |
Alan J. Lacy (58) |
| Year of Election or Appointment: 2008 Mr. Lacy serves as Senior Adviser (2007-present) of Oak Hill Capital Partners, L.P. (private equity). Mr. Lacy also served as Chief Executive Officer (2000-2005) and Vice Chairman (2005-2006) of Sears Holdings Corporation and Sears, Roebuck and Co. (retail). In addition, Mr. Lacy serves as a member of the Board of Directors of Dave & Buster's, Inc. (restaurant and entertainment complexes, 2010-present), The Hillman Companies, Inc. (hardware wholesalers, 2010-present), and Bristol-Myers Squibb Company (global pharmaceuticals, 2007-present). Mr. Lacy is a member of the Board of Trustees of The National Parks Conservation Association (2006-present). Previously, Mr. Lacy served as Chairman of the Board of Trustees of the National Parks Conservation Association (2008-2011) and as a member of the Board of Directors for the Western Union Company (global money transfer, 2006-2011). |
Ned C. Lautenbach (67) |
| Year of Election or Appointment: 2000 Mr. Lautenbach is Chairman of the Independent Trustees of the Equity and High Income Funds (2006-present). Mr. Lautenbach currently serves as the Lead Director of the Eaton Corporation Board of Directors (diversified industrial, 1997-present). Mr. Lautenbach is also a member of the Board of Directors of the Philharmonic Center for the Arts in Naples, Florida (1999-present); a member of the Board of Trustees of Fairfield University (2005-present); and a member of the Council on Foreign Relations (1994-present). Previously, Mr. Lautenbach was a Partner/Advisory Partner at Clayton, Dubilier & Rice, LLC (private equity investment, 1998-2010), as well as a Director of Sony Corporation (2006-2007). |
Joseph Mauriello (67) |
| Year of Election or Appointment: 2008 Prior to his retirement in January 2006, Mr. Mauriello served in numerous senior management positions including Deputy Chairman and Chief Operating Officer (2004-2005), and Vice Chairman of Financial Services (2002-2004) of KPMG LLP US (professional services, 1965-2005). Mr. Mauriello currently serves as a member of the Board of Directors of XL Group plc. (global insurance and re-insurance, 2006-present) and of Arcadia Resources Inc. (health care services and products, 2007-present). Previously, Mr. Mauriello served as a Director of the Hamilton Funds of the Bank of New York (2006-2007). |
Robert W. Selander (61) |
| Year of Election or Appointment: 2011 Previously, Mr. Selander served as a Member of the Advisory Board of Fidelity's Equity and High Income Funds (2011), Executive Vice Chairman (2010), Chief Executive Officer (2009-2010), and President and Chief Executive Officer (1997-2009) of Mastercard, Inc. |
Cornelia M. Small (67) |
| Year of Election or Appointment: 2005 Ms. Small is a member of the Board of Directors of the Teagle Foundation (2009-present). Ms. Small is also a member of the Investment Committee, and Chair (2008-present) and a member of the Board of Trustees of Smith College. In addition, Ms. Small serves on the Investment Committee of the Berkshire Taconic Community Foundation (2008-present). Previously, Ms. Small served as Chairperson of the Investment Committee (2002-2008) of Smith College. In addition, Ms. Small served as Chief Investment Officer, Director of Global Equity Investments, and a member of the Board of Directors of Scudder, Stevens & Clark and Scudder Kemper Investments. |
William S. Stavropoulos (72) |
| Year of Election or Appointment: 2001 Mr. Stavropoulos is Vice Chairman of the Independent Trustees of the Equity and High Income Funds (2006-present). Mr. Stavropoulos serves as President and Founder of the Michigan Baseball Foundation, the Great Lakes Loons (2007-present). Mr. Stavropoulos is Chairman Emeritus of the Board of Directors of The Dow Chemical Company, where he previously served in numerous senior management positions, including President, CEO (1995-2000; 2002-2004), Chairman of the Executive Committee (2000-2006), and as a member of the Board of Directors (1990-2006). Currently, Mr. Stavropoulos is Chairman of Univar (global distributor of commodity and specialty chemicals, 2010-present), a Director of Teradata Corporation (data warehousing and technology solutions, 2008-present), Chemical Financial Corporation, Maersk Inc. (industrial conglomerate), Tyco International, Inc. (multinational manufacturing and services, 2007-present), and a member of the Advisory Board for Metalmark Capital (private equity investment, 2005-present). Mr. Stavropoulos is a special advisor to Clayton, Dubilier & Rice, LLC (private equity investment). In addition, Mr. Stavropoulos is a member of the University of Notre Dame Advisory Council for the College of Science. |
David M. Thomas (62) |
| Year of Election or Appointment: 2008 Previously, Mr. Thomas served as Executive Chairman (2005-2006) and Chairman and Chief Executive Officer (2000-2005) of IMS Health, Inc. (pharmaceutical and healthcare information solutions). In addition, Mr. Thomas serves as a member of the Board of Directors of Fortune Brands, Inc. (consumer products), and Interpublic Group of Companies, Inc. (marketing communication, 2004-present). |
Michael E. Wiley (61) |
| Year of Election or Appointment: 2008 Mr. Wiley also serves as a Director of Asia Pacific Exploration Consolidated (international oil and gas exploration and production, 2008-present). Mr. Wiley serves as a Director of Tesoro Corporation (independent oil refiner and marketer, 2005-present), and a Director of Bill Barrett Corporation (exploration and production, 2005-present). In addition, Mr. Wiley also serves as a Director of Post Oak Bank (privately-held bank, 2004-present). Previously, Mr. Wiley served as a member of the Board of Trustees of the University of Tulsa (2000-2006; 2007-2010), as a Senior Energy Advisor of Katzenbach Partners, LLC (consulting, 2006-2007), as an Advisory Director of Riverstone Holdings (private investment), Chairman, President, and CEO of Baker Hughes, Inc. (oilfield services, 2000-2004), and as Director of Spinnaker Exploration Company (exploration and production, 2001-2005). |
+ The information above includes each Trustee's principal occupation during the last five years and other information relating to the experience, attributes, and skills relevant to each Trustee's qualifications to serve as a Trustee, which led to the conclusion that each Trustee should serve as a Trustee for the fund.
Advisory Board Members and Executive Officers:
Correspondence intended for each executive officer, Edward C. Johnson 3d, and Peter S. Lynch may be sent to Fidelity Investments, 82 Devonshire Street, Boston, Massachusetts 02109.
Name, Age; Principal Occupation |
Edward C. Johnson 3d (81) |
| Year of Election or Appointment: 2011 Member of the Advisory Board of Fidelity's Equity and High Income Funds. Mr. Johnson serves as Chief Executive Officer, Chairman, and a Director of FMR LLC, and also serves as Chairman and Director of FIL Limited. Previously, Mr. Johnson served as a Trustee and Chairman of the Board of certain Fidelity Trusts, Chairman and a Director of FMR, Chairman and a Director of FMR Co., Inc., and President of FMR LLC (2006-2007). |
Peter S. Lynch (67) |
| Year of Election or Appointment: 2003 Member of the Advisory Board of Fidelity's Equity and High Income Funds. Mr. Lynch is Vice Chairman and a Director of FMR and FMR Co., Inc. In addition, Mr. Lynch serves as a Trustee of Boston College and as the Chairman of the Inner-City Scholarship Fund. Previously, Mr. Lynch served on the Special Olympics International Board of Directors (1997-2006). |
Kenneth B. Robins (42) |
| Year of Election or Appointment: 2008 President and Treasurer of Fidelity's Equity and High Income Funds. Mr. Robins also serves as President and Treasurer (2010-present) and Assistant Treasurer (2009-present) of other Fidelity funds and is an employee of Fidelity Investments (2004-present). Previously, Mr. Robins served as Deputy Treasurer of the Fidelity funds (2005-2008) and Treasurer and Chief Financial Officer of The North Carolina Capital Management Trust: Cash and Term Portfolios (2006-2008). |
Bruce T. Herring (46) |
| Year of Election or Appointment: 2006 Vice President of certain Equity Funds. Mr. Herring also serves as President of Fidelity Research & Analysis Company (2010-present), Chief Investment Officer and Director of Fidelity Management & Research (U.K.) Inc. (2010-present) and Group Chief Investment Officer of FMR. Previously, Mr. Herring served as Vice President (2005-2006) and Senior Vice President (2006-2007) of Fidelity Management & Research Company, Vice President of FMR Co., Inc. (2001-2007) and as a portfolio manager for Fidelity U.S. Equity Funds. |
Brian B. Hogan (47) |
| Year of Election or Appointment: 2009 Vice President of Equity and High Income Funds. Mr. Hogan also serves as President of FMR's Equity Division (2009-present). Previously, Mr. Hogan served as Senior Vice President, Equity Research of FMR (2006-2009) and as a portfolio manager. |
Scott C. Goebel (43) |
| Year of Election or Appointment: 2008 Secretary and Chief Legal Officer (CLO) of the Fidelity funds. Mr. Goebel also serves as Secretary of Fidelity Investments Money Management, Inc. (FIMM) (2010-present) and Fidelity Research and Analysis Company (FRAC) (2010-present); Secretary and CLO of The North Carolina Capital Management Trust: Cash and Term Portfolios (2008-present); General Counsel, Secretary, and Senior Vice President of FMR (2008-present) and FMR Co., Inc. (2008-present); employed by FMR LLC or an affiliate (2001-present); Chief Legal Officer of Fidelity Management & Research (Hong Kong) Limited (2008-present) and Assistant Secretary of Fidelity Management & Research (Japan) Inc. (2008-present), and Fidelity Management & Research (U.K.) Inc. (2008-present). Previously, Mr. Goebel served as Assistant Secretary of FIMM (2008-2010), FRAC (2008-2010), and the Funds (2007-2008) and as Vice President and Secretary of Fidelity Distributors Corporation (FDC) (2005-2007). |
William C. Coffey (42) |
| Year of Election or Appointment: 2009 Assistant Secretary of Fidelity's Equity and High Income Funds. Mr. Coffey also serves as Senior Vice President and Deputy General Counsel of FMR LLC (2010-present), and is an employee of Fidelity Investments. Previously, Mr. Coffey served as Vice President and Associate General Counsel of FMR LLC (2005-2009). |
Holly C. Laurent (57) |
| Year of Election or Appointment: 2008 Anti-Money Laundering (AML) Officer of the Fidelity funds. Ms. Laurent also serves as AML Officer of The North Carolina Capital Management Trust: Cash and Term Portfolios (2008-present) and is an employee of Fidelity Investments. Previously, Ms. Laurent was Senior Vice President and Head of Legal for Fidelity Business Services India Pvt. Ltd. (2006-2008), and Senior Vice President, Deputy General Counsel and Group Head for FMR LLC (2005-2006). |
Christine Reynolds (53) |
| Year of Election or Appointment: 2008 Chief Financial Officer of the Fidelity funds. Ms. Reynolds became President of Fidelity Pricing and Cash Management Services (FPCMS) in August 2008. Ms. Reynolds served as Chief Operating Officer of FPCMS (2007-2008). Previously, Ms. Reynolds served as President, Treasurer, and Anti-Money Laundering officer of the Fidelity funds (2004-2007). |
Kenneth A. Rathgeber (64) |
| Year of Election or Appointment: 2004 Chief Compliance Officer of Fidelity's Equity and High Income Funds. Mr. Rathgeber is Chief Compliance Officer of Fidelity Management & Research (Hong Kong) Limited (2008-present), Fidelity Management & Research (Japan) Inc. (2008-present), FMR (2005-present), FMR Co., Inc. (2005-present), Fidelity Management & Research (U.K.) Inc. (2005-present), Fidelity Research & Analysis Company (2005-present), Fidelity Investments Money Management, Inc. (2005-present), Pyramis Global Advisors, LLC (2005-present), and Strategic Advisers, Inc. (2005-present). |
Jeffrey S. Christian (50) |
| Year of Election or Appointment: 2009 Deputy Treasurer of the Fidelity funds. Mr. Christian is an employee of Fidelity Investments. Previously, Mr. Christian served as Chief Financial Officer (2008-2009) of certain Fidelity funds and Senior Vice President of Fidelity Pricing and Cash Management Services (FPCMS) (2004-2009). |
Joseph F. Zambello (54) |
| Year of Election or Appointment: 2011 Deputy Treasurer of the Fidelity funds. Mr. Zambello is an employee of Fidelity Investments. Previously, Mr. Zambello served as Vice President of FMR's Program Management Group (2009-2011) and Vice President of the Transfer Agent Oversight Group (2005-2009). |
Adrien E. Deberghes (44) |
| Year of Election or Appointment: 2008 Deputy Treasurer of Fidelity's Equity and High Income Funds. Mr. Deberghes also serves as Vice President and Assistant Treasurer of Fidelity Rutland Square Trust II and Fidelity Commonwealth Trust II (2011-present), Assistant Treasurer of other Fidelity funds (2010-present), and is an employee of Fidelity Investments (2008-present). Previously, Mr. Deberghes served as Senior Vice President of Mutual Fund Administration at State Street Corporation (2007-2008), Senior Director of Mutual Fund Administration at Investors Bank & Trust (2005-2007), and Director of Finance for Dunkin' Brands (2000-2005). |
Stephanie J. Dorsey (42) |
| Year of Election or Appointment: 2010 Assistant Treasurer of Fidelity's Equity and High Income Funds. Ms. Dorsey also serves as Deputy Treasurer of other Fidelity funds (2008-present) and is an employee of Fidelity Investments (2008-present). Previously, Ms. Dorsey served as Treasurer (2004-2008) of the JPMorgan Mutual Funds and Vice President (2004-2008) of JPMorgan Chase Bank. |
John R. Hebble (53) |
| Year of Election or Appointment: 2009 Assistant Treasurer of Fidelity's Equity and High Income Funds. Mr. Hebble also serves as President (2011-present), Treasurer, and Chief Financial Officer of The North Carolina Capital Management Trust: Cash and Term Portfolios (2008-present), President and Treasurer of other Fidelity funds (2008-present) and is an employee of Fidelity Investments. |
Gary W. Ryan (53) |
| Year of Election or Appointment: 2005 Assistant Treasurer of the Fidelity funds. Mr. Ryan is an employee of Fidelity Investments. Previously, Mr. Ryan served as Vice President of Fund Reporting in Fidelity Pricing and Cash Management Services (FPCMS) (1999-2005). |
Jonathan Davis (43) |
| Year of Election or Appointment: 2010 Assistant Treasurer of the Fidelity funds. Mr. Davis is also Assistant Treasurer of Fidelity Rutland Square Trust II and Fidelity Commonwealth Trust II. Mr. Davis is an employee of Fidelity Investments. Previously, Mr. Davis served as Vice President and Associate General Counsel of FMR LLC (2003-2010). |
Annual Report
Initial Class designates 1%, Service Class designates 2%, and Service Class 2 designates 2% of the dividends distributed during the fiscal year as qualifying for the dividends-received deduction for corporate shareholders.
The amounts per share which represent income derived from sources within, and taxes paid to, foreign countries or possessions of the United States are as follows:
| Pay Date | Income | Taxes |
Initial Class | 12/16/11 | $0.108 | $0.021 |
Service Class | 12/16/11 | $0.098 | $0.021 |
Service Class 2 | 12/16/11 | $0.091 | $0.021 |
Annual Report
Board Approval of Investment Advisory Contracts and Management Fees
VIP Emerging Markets Portfolio
Each year, the Board of Trustees, including the Independent Trustees (together, the Board), votes on the renewal of the management contract and sub-advisory agreements (together, the Advisory Contracts) for the fund. The Board, assisted by the advice of fund counsel and Independent Trustees' counsel, requests and considers a broad range of information relevant to the renewal of the Advisory Contracts throughout the year.
The Board meets regularly and considers at each of its meetings factors that are relevant to its annual consideration of the renewal of the fund's Advisory Contracts, including the services and support provided to the fund and its shareholders. The Board has established various standing committees, each composed of Independent Trustees with varying backgrounds, to which the Board has assigned specific subject matter responsibilities in order to enhance effective decision-making by the Board. The Board, acting directly and through its Committees, requests and receives information concerning the annual consideration of the renewal of the fund's Advisory Contracts. The Board also meets as needed to consider matters specifically related to the Board's annual consideration of the renewal of Advisory Contracts. Members of the Board may also meet with trustees of other Fidelity funds through ad hoc joint committees to discuss certain matters relevant to the Fidelity funds.
At its July 2011 meeting, the Board of Trustees, including the Independent Trustees, unanimously determined to renew the fund's Advisory Contracts. In reaching its determination, the Board considered all factors it believed relevant, including (i) the nature, extent, and quality of the services to be provided to the fund and its shareholders (including the investment performance of the fund); (ii) the competitiveness of the fund's management fee and total expense ratio; (iii) the total costs of the services to be provided by and the profits to be realized by Fidelity from its relationship with the fund; (iv) the extent to which economies of scale would be realized as the fund grows; and (v) whether fee levels reflect these economies of scale, if any, for the benefit of fund shareholders.
In considering whether to renew the Advisory Contracts for the fund, the Board reached a determination, with the assistance of fund counsel and Independent Trustees' counsel and through the exercise of its business judgment, that the renewal of the Advisory Contracts is in the best interests of the fund and its shareholders and that the compensation payable under the Advisory Contracts is fair and reasonable. The Board's decision to renew the Advisory Contracts was not based on any single factor, but rather was based on a comprehensive consideration of all the information provided to the Board at its meetings throughout the year. The Board, in reaching its determination to renew the Advisory Contracts, is aware that shareholders in the fund have a broad range of investment choices available to them, including a wide choice among mutual funds offered by Fidelity's competitors, and that the fund's shareholders, who have the opportunity to review and weigh the disclosure provided by the fund in its prospectus and other public disclosures, have chosen to invest in this fund, managed by Fidelity.
Nature, Extent, and Quality of Services Provided. The Board considered the staffing within the investment adviser, FMR, and the sub-advisers (together, the Investment Advisers), including the backgrounds of the fund's investment personnel and the fund's investment objective and discipline. The Independent Trustees also had discussions with senior management of Fidelity's investment operations and investment groups. The Board considered the structure of the portfolio manager compensation program and whether this structure provides appropriate incentives to act in the best interests of the fund.
Resources Dedicated to Investment Management and Support Services. The Board and the Fund Oversight and Research Committees reviewed the general qualifications and capabilities of the Investment Advisers' investment staff, including its size, education, experience, and resources, as well as the Investment Advisers' approach to recruiting, training, managing, and compensating investment personnel. The Board also noted that FMR has devoted increased resources to non-U.S. offices. The Board noted that Fidelity's analysts have extensive resources, tools and capabilities which allow them to conduct sophisticated quantitative and fundamental analysis, as well as credit analysis of issuers, counterparties and enhancers. The Board also believes that Fidelity's investment professionals have sufficient access to global information and data so as to provide competitive investment results over time, and that those professionals also have access to sophisticated tools which permit them to assess portfolio construction and risk and performance attribution characteristics continuously, as well as to transmit new information and research conclusions rapidly around the world. Additionally, in their deliberations, the Board considered the Investment Advisers' trading capabilities and resources which are an integral part of the investment management process.
Shareholder and Administrative Services. The Board considered (i) the nature, extent, quality, and cost of advisory, administrative, and shareholder services performed by the Investment Advisers and their affiliates under the Advisory Contracts and under separate agreements covering transfer agency, pricing and bookkeeping, and securities lending services for the fund; (ii) the nature and extent of the investment adviser's supervision of third party service providers, principally custodians and subcustodians; and (iii) the resources devoted to, and the record of compliance with, the fund's compliance policies and procedures. The Board also reviewed the allocation of fund brokerage, including allocations to brokers affiliated with the Investment Advisers, the use of brokerage commissions to pay fund expenses, and the use of "soft" commission dollars to pay for research services.
The Board noted that the growth of fund assets over time across the complex allows Fidelity to reinvest in the development of services designed to enhance the value or convenience of the Fidelity funds as investment vehicles. These services include 24-hour access to account information and market information through telephone representatives and over the Internet, investor education materials and asset allocation tools, and the expanded availability of Fidelity Investor Centers, with 35 new branches opening since 2010.
Annual Report
Investment in a Large Fund Family. The Board considered the benefits to shareholders of investing in a Fidelity fund, including the benefits of investing in a fund that is part of a large family of funds offering a variety of investment disciplines and providing a large variety of mutual fund investor services. The Board noted that Fidelity had taken, or had made recommendations that resulted in the Fidelity funds taking, a number of actions over the previous year that benefited particular funds, including (i) continuing to dedicate additional resources to investment research and support of the senior management team that oversees asset management; (ii) rationalizing product lines through the mergers of six funds into other funds; (iii) continuing to migrate the Freedom Funds to dedicated lower cost underlying funds; (iv) obtaining shareholder approval to broaden the investment strategies for Fidelity Consumer Finance Portfolio, Fidelity Emerging Asia Fund, and Fidelity Environment and Alternative Energy Portfolio; (v) contractually agreeing to reduce the management fees and impose other expense limitations on Spartan 500 Index Fund and U.S. Bond Index Fund in connection with launching new institutional classes of these funds; (vi) changing the name, primary and supplemental benchmarks, and investment policies of Fidelity Global Strategies Fund to support the fund's flexible investment mandate and global orientation; and (vii) reducing the transfer agency account fee rates on certain accounts.
Investment Performance. The Board considered whether the fund has operated in accordance with its investment objective, as well as its record of compliance with its investment restrictions. It also reviewed the fund's absolute investment performance for each class, as well as the fund's relative investment performance for each class measured against (i) a broad-based securities market index, and (ii) a peer group of mutual funds deemed appropriate by Fidelity and reviewed by the Board. Because the fund had been in existence less than three calendar years, the following chart considered by the Board shows, for the one-year period ended December 31, 2010, the total returns of Initial Class R and Service Class 2 of the fund, the total return of a broad-based securities market index ("benchmark"), and a range of total returns of a peer group of mutual funds identified by Morningstar, Inc. as having an investment style similar to that of the fund based on underlying portfolio holdings. The returns of Initial Class R and Service Class 2 show the performance of the highest and lowest performing classes, respectively. The box within the chart shows the 25th percentile return (bottom of box) and the 75th percentile return (top of box) of the peer group. Returns shown above the box are in the first quartile and returns shown below the box are in the fourth quartile. The percentage beaten numbers noted below the chart correspond to the percentile box and represent the percentage of funds in the peer group whose performance was equal to or lower than that of the class indicated.
VIP Emerging Markets Portfolio
The Board reviewed the fund's relative investment performance against its peer group and noted that the performance of Initial Class R of the fund was in the third quartile for the period shown. The Board also noted that the investment performance of the fund was lower than its benchmark for the period shown. The Board considered that the variations in performance among the fund's classes reflect the variations in class expenses, which result in lower performance for higher expense classes. The Board also reviewed the fund's performance since inception as well as performance in the current year. The Board noted that it is difficult to evaluate in any comprehensive fashion the performance of the fund, in light of its relatively recent commencement of operations.
Based on its review, the Board concluded that the nature, extent, and quality of services provided to the fund under the Advisory Contracts should benefit the fund's shareholders.
Competitiveness of Management Fee and Total Expense Ratio. The Board considered the fund's management fee and total expense ratio compared to "mapped groups" of competitive funds and classes. Fidelity creates "mapped groups" by combining similar Lipper investment objective categories that have comparable management fee characteristics. Combining Lipper investment objective categories aids the Board's management fee and total expense ratio comparisons by broadening the competitive group used for comparison and by reducing the number of universes to which various Fidelity funds are compared.
Annual Report
Board Approval of Investment Advisory Contracts and Management Fees - continued
Management Fee. The Board considered two proprietary management fee comparisons for the 12-month (or shorter) periods shown in the chart below. The group of Lipper funds used by the Board for management fee comparisons is referred to below as the "Total Mapped Group." The Total Mapped Group comparison focuses on a fund's standing relative to the total universe of comparable funds available to investors in terms of gross management fees before expense reimbursements or caps. "TMG %" represents the percentage of funds in the Total Mapped Group that had management fees that were lower than the fund's. For example, a TMG % of 34% means that 66% of the funds in the Total Mapped Group had higher management fees than the fund. The "Asset-Size Peer Group" (ASPG) comparison focuses on a fund's standing relative to non-Fidelity funds similar in size to the fund within the Total Mapped Group. The ASPG represents at least 15% of the funds in the Total Mapped Group with comparable asset size and management fee characteristics, subject to a minimum of 50 funds (or all funds in the Total Mapped Group if fewer than 50). Additional information, such as the ASPG quartile in which the fund's management fee ranked, is also included in the chart and considered by the Board.
VIP Emerging Markets Portfolio
The Board noted that the fund's management fee ranked below the median of its Total Mapped Group and below the median of its ASPG for 2010.
Based on its review, the Board concluded that the fund's management fee is fair and reasonable in light of the services that the fund receives and the other factors considered.
Total Expense Ratio. In its review of each class's total expense ratio, the Board considered the fund's management fee as well as other fund or class expenses, as applicable, such as transfer agent fees, pricing and bookkeeping fees, fund-paid 12b-1 fees, and custodial, legal, and audit fees. The Board also noted the effects of any waivers and reimbursements on fees and expenses. As part of its review, the Board also considered the current and historical total expense ratios of each class of the fund compared to competitive fund median expenses. Each class of the fund is compared to those funds and classes in the Total Mapped Group (used by the Board for management fee comparisons) that have a similar sales load structure.
The Board noted that the total expense ratio of each of Initial Class and Initial Class R ranked equal to its competitive median for 2010 and the total expense ratio of each of Investor Class R, Service Class, Service Class 2, and Service Class 2 R ranked above its competitive median for 2010. The Board considered that various factors, including 12b-1 fees, positive or negative performance adjustments, and relatively higher other expenses in the case of small fund size, can affect total expense ratios. The Board also noted that Investor Class R has higher transfer agent fees than traditional variable annuity classes because it is designed for lower cost annuity products, where the majority of servicing costs are incorporated into the funds' total expense ratios rather than being paid at the annuity level. The Board noted that the fund offers multiple classes, each of which has a different 12b-1 fee structure, and that the multiple structures are intended to offer a range of pricing options for the intermediary market. The Board also noted that the total expense ratios of the classes vary primarily by the level of their 12b-1 fees, although differences in transfer agent fees may also cause expenses to vary from class to class.
Fees Charged to Other Fidelity Clients. The Board also considered Fidelity fee structures and other information with respect to clients of FMR and its affiliates, such as other mutual funds advised or subadvised by FMR or its affiliates, pension plan clients, and other institutional clients. In March 2010, the Board created an ad hoc joint committee with the board of other Fidelity funds (the Committee) to review and compare Fidelity's institutional investment advisory business with its business of providing services to the Fidelity funds, including the differences in services provided, fees charged, and costs incurred, as well as competition in their respective marketplaces.
Annual Report
Based on its review of total expense ratios and fees charged to other Fidelity clients, the Board concluded that the total expense ratio of each class of the fund was reasonable, although in some cases above the median of the universe presented for comparison, in light of the services that the fund and its shareholders receive and the other factors considered, including the findings of the Committee.
Costs of the Services and Profitability. The Board considered the revenues earned and the expenses incurred by Fidelity in conducting the business of developing, marketing, distributing, managing, administering and servicing the fund and its shareholders. The Board also considered the level of Fidelity's profits in respect of all the Fidelity funds.
On an annual basis, FMR presents to the Board Fidelity's profitability for the fund. Fidelity calculates the profitability for each fund, as well as aggregate profitability for groups of Fidelity funds and all Fidelity funds, using a series of detailed revenue and cost allocation methodologies which originate with the books and records of Fidelity on which Fidelity's audited financial statements are based. The Audit Committee of the Board reviews any significant changes from the prior year's methodologies.
PricewaterhouseCoopers LLP (PwC), independent registered public accounting firm and auditor to Fidelity and certain Fidelity funds, has been engaged annually by the Board as part of the Board's assessment of Fidelity's profitability analysis. PwC's engagement includes the review and assessment of Fidelity's methodologies used in determining the revenues and expenses attributable to Fidelity's mutual fund business, and completion of agreed-upon procedures surrounding the mathematical accuracy of fund profitability and its conformity to allocation methodologies. After considering PwC's reports issued under the engagement and information provided by Fidelity, the Board concluded that while other allocation methods may also be reasonable, Fidelity's profitability methodologies are reasonable in all material respects.
The Board also reviewed Fidelity's non-fund businesses and fall-out benefits related to the mutual fund business as well as cases where Fidelity's affiliates may benefit from or be related to the fund's business.
The Board considered the costs of the services provided by and the profits realized by Fidelity in connection with the operation of the fund and was satisfied that the profitability was not excessive in the circumstances.
Economies of Scale. The Board considered whether there have been economies of scale in respect of the management of the Fidelity funds, whether the Fidelity funds (including the fund) have appropriately benefited from any such economies of scale, and whether there is potential for realization of any further economies of scale. The Board considered the extent to which the fund will benefit from economies of scale through increased services to the fund, through waivers or reimbursements, or through fee or expense reductions. The Board also noted that in 2009, it and the board of other Fidelity funds created an ad hoc committee (the Economies of Scale Committee) to analyze whether FMR attains economies of scale in respect of the management and servicing of the Fidelity funds, whether the Fidelity funds have appropriately benefited from such economies of scale, and whether there is potential for realization of any further economies of scale.
The Board recognized that the fund's management contract incorporates a "group fee" structure, which provides for lower group fee rates as total fund assets under FMR's management increase, and for higher group fee rates as total fund assets under FMR's management decrease. FMR calculates the group fee rates based on a tiered asset "breakpoint" schedule that varies based on asset class. The Board considered that the group fee is designed to deliver the benefits of economies of scale to fund shareholders when total Fidelity fund assets increase, even if assets of any particular fund are unchanged or have declined, because some portion of Fidelity's costs are attributable to services provided to all Fidelity funds, and all funds benefit if those costs can be allocated among more assets. The Board concluded that, given the group fee structure, fund shareholders will benefit from lower management fees as assets under FMR's management increase at the fund complex level, regardless of whether Fidelity achieves any such economies of scale.
The Board concluded, taking into account the analysis of the Economies of Scale Committee, that any potential economies of scale are being appropriately shared between fund shareholders and Fidelity.
Additional Information Requested by the Board. In order to develop fully the factual basis for consideration of the Fidelity funds' Advisory Contracts, the Board requested and received additional information on certain topics, including (i) fund performance trends, actions to be taken by FMR to improve certain funds' overall performance, and Fidelity's long-term strategies for certain funds; (ii) portfolio manager changes that have occurred during the past year and length of portfolio manager tenure for different categories of funds over time; (iii) Fidelity's compensation structure for portfolio managers and other key personnel and strategies for attracting and retaining non-investment personnel; (iv) the amount of the investment that each portfolio manager has made in the Fidelity fund(s) that he or she manages; (v) historical trends in Fidelity's realization of fall-out benefits; (vi) Fidelity's group fee structures and the rationale for the individual fee rates of certain funds; (vii) fund profitability methodology and the impact of certain factors on fund profitability results; (viii) trends regarding industry use of performance fee structures and Fidelity's compliance practices with respect to performance adjustment calculations; (ix) the fee structures in place for certain other Fidelity clients; and (x) explanations regarding the relative total expense ratios of certain funds and classes, total expense competitive trends, and actions that might be taken by FMR to reduce total expense ratios for certain funds and classes.
Annual Report
Board Approval of Investment Advisory Contracts and Management Fees - continued
Based on its evaluation of all of the conclusions noted above, and after considering all factors it believed relevant, the Board ultimately concluded that the advisory fee structures are fair and reasonable, and that the fund's Advisory Contracts should be renewed.
Annual Report
Investment Adviser
Fidelity Management & Research Company
Boston, MA
Investment Sub-Advisers
FMR Co., Inc.
Fidelity Management & Research (U.K.) Inc.
Fidelity Management & Research (Hong Kong) Limited
Fidelity Management & Research (Japan) Inc.
FIL Investment Advisors
FIL Investment Advisors (U.K.) Ltd.
FIL Investments (Japan) Limited
General Distributor
Fidelity Distributors Corporation
Boston, MA
Transfer and Service Agents
Fidelity Investments Institutional Operations Company, Inc.
Boston, MA
Fidelity Service Company, Inc.
Boston, MA
Custodian
State Street Bank and Trust Company
Quincy, MA
VIPEM-ANN-0212
1.858135.103
Fidelity® Variable Insurance Products:
Emerging Markets Portfolio - Class R
Annual Report
December 31, 2011
Contents
Performance | (Click Here) | How the fund has done over time. |
Management's Discussion of Fund Performance | (Click Here) | The Portfolio Manager's review of fundperformance and strategy. |
Shareholder Expense Example | (Click Here) | An example of shareholder expenses. |
Investment Changes | (Click Here) | A summary of major shifts in the fund's investments over the past six months. |
Investments | (Click Here) | A complete list of the fund's investments with their
market values. |
Financial Statements | (Click Here) | Statements of assets and liabilities, operations, and
changes in net assets, as well as financial highlights. |
Notes | (Click Here) | Notes to the financial statements. |
Report of Independent Registered Public Accounting Firm | (Click Here) | |
Trustees and Officers | (Click Here) | |
Distributions | (Click Here) | |
Board Approval of Investment Advisory Contracts and Management Fees | (Click Here) | |
To view a fund's proxy voting guidelines and proxy voting record for the 12-month period ended June 30, visit http://www.fidelity.com/proxyvotingresults or visit the Securities and Exchange Commission's (SEC) web site at http://www.sec.gov. You may also call 1-877-208-0098 to request a free copy of the proxy voting guidelines.
Fidelity Variable Insurance Products are separate account options which are purchased through a variable insurance contract.
Standard & Poor's, S&P and S&P 500 are registered service marks of The McGraw-Hill Companies, Inc. and have been licensed for use by Fidelity Distributors Corporation.
Other third party marks appearing herein are the property of their respective owners.
All other marks appearing herein are registered or unregistered trademarks or service marks of FMR LLC or an affiliated company.
This report and the financial statements contained herein are submitted for the general information of the shareholders of the fund. This report is not authorized for distribution to prospective investors in the fund unless preceded or accompanied by an effective prospectus.
A fund files its complete schedule of portfolio holdings with the SEC for the first and third quarters of each fiscal year on Form N-Q. Forms N-Q are available on the SEC's web site at http://www.sec.gov. A fund's Forms N-Q may be reviewed and copied at the SEC's Public Reference Room in Washington, DC. Information regarding the operation of the SEC's Public Reference Room may be obtained by calling 1-800-SEC-0330. For a complete list of a fund's portfolio holdings, view the most recent holdings listing, semiannual report, or annual report on Fidelity's web site at http://www.fidelity.com, http://www.advisor.fidelity.com, or http://www.401k.com, as applicable.
NOT FDIC INSURED • MAY LOSE VALUE • NO BANK GUARANTEE
Neither the fund nor Fidelity Distributors Corporation is a bank.
Annual Report
Average annual total return reflects the change in the value of an investment, assuming reinvestment of the class' distributions from dividend income and capital gains (the profits earned upon the sale of securities that have grown in value, if any) and assuming a constant rate of performance each year. During periods of reimbursement by Fidelity, a fund's total return will be greater than it would be had the reimbursement not occurred. Performance numbers are net of all underlying fund operating expenses, but do not include any insurance charges imposed by your insurance company's separate account. If performance information included the effect of these additional charges, the total returns would have been lower. How a fund did yesterday is no guarantee of how it will do tomorrow.
Average Annual Total Returns
Periods ended December 31, 2011 | Past 1
year | Life of
fund A |
VIP Emerging Markets Portfolio - Initial Class R | -21.09% | -5.23% |
VIP Emerging Markets Portfolio - Service Class 2R | -21.24% | -5.45% |
VIP Emerging Markets Portfolio - Investor Class R | -21.05% | -5.29% |
A From January 23, 2008.
$10,000 Over Life of Fund
Let's say hypothetically that $10,000 was invested in VIP Emerging Markets Portfolio - Initial Class R on January 23, 2008, when the fund started. The chart shows how the value of your investment would have changed, and also shows how the MSCI® Emerging Markets Index performed over the same period.
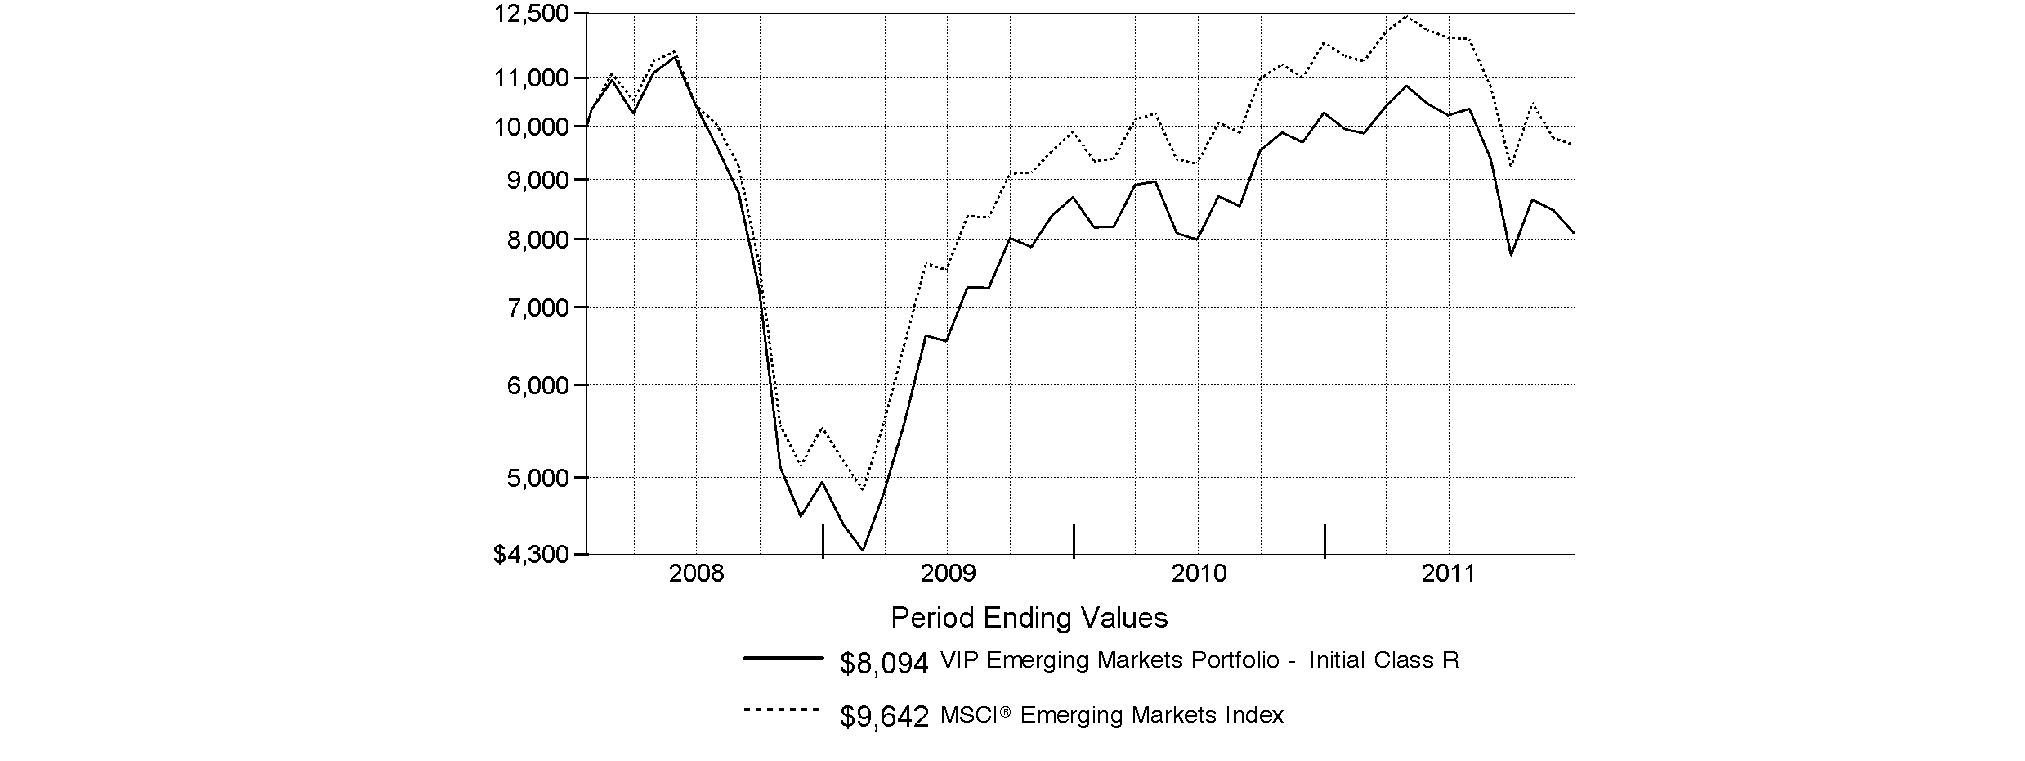
Annual Report
Market Recap: Extreme market volatility took center stage during the 12 months ending December 31, 2011, stealing the spotlight from signs of progress in the global economy. Early in the year, aggressive monetary stimulus by the U.S. federal government, improving credit-market conditions and solid corporate earnings buoyed most major asset classes. As the period progressed, however, fresh worries about sovereign debt in Europe, inflation in China, gridlock over raising the debt ceiling in the U.S. - along with Standard & Poor's early-August downgrade of the nation's long-term sovereign credit rating - and a dimmed outlook for global growth punctured investor confidence and ignited market instability. Domestic equities, as measured by the broad-based S&P 500® Index, gained 2.11%, easily outpacing the 13.61% decline of MSCI® ACWI® (All Country World Index) ex USA Index, a proxy for foreign stocks. Within the MSCI index, emerging markets declined the most (-18%), with investments here generally held back by a stronger U.S. dollar. The U.K. (-3%) fared better than the rest of Europe (-15%), which was the second-worst-performing index component. Bolstered by periodic flights to quality, U.S. investment-grade bonds posted a 7.84% advance, as reflected by the Barclays Capital® U.S. Aggregate Bond Index, outperforming the 4.37% gain of high-yield securities, as represented by The BofA Merrill LynchSM US High Yield Constrained Index. Hampered by financial woes in Europe, the sovereign debt of major developed markets outside the U.S. rose 4.86%, according to the Citigroup® Non-USD Group-of-Seven (G7) Equal Weighted Index, while the JPMorgan Emerging Markets Bond Index Global (EMBI Global) advanced 8.46%, despite the currency head wind.
Comments from Robert von Rekowsky, Portfolio Manager of VIP Emerging Markets Portfolio: During the year, the fund's share classes finished behind the -18.17% return of the MSCI® Emerging Markets Index. (For specific portfolio results, please refer to the performance section of this report.) Versus the index, stock selection in the energy sector had the most negative impact, with my picks in financials, consumer staples and information technology also weighing on performance. Geographically, weak picks and a large underweighting in South Africa curbed performance, as did security selection in China, Taiwan, Hong Kong and India. Underweighting Mexico also hurt. Unrewarding timing in the fund's ownership of wireless carrier and benchmark component China Mobile made it the fund's largest individual detractor. In the weak third quarter, the stock outperformed, and our underweighting here hampered the fund's results. As part of my effort to reduce the fund's downside vulnerability, I increased the position to an overweighting by the end of August, but China Mobile underperformed during the strong October rally, which hurt as well. Banks also figured prominently among the fund's largest detractors, including Egypt-based Commercial International Bank, South Korea's Shinhan Financial Group, Taiwan-based Taishin Financial Holding and an out-of-index position in Indian Overseas Bank. I sold Taishin Financial Holding during the period. In the case of pork producer China Yurun Food Group, questions about the safety of the company's food handling practices dented its stock, and I sold our position here by period end. Another detractor, South Korean shipbuilder Hyundai Heavy Industries, suffered weaker-than-expected orders and disappointing earnings. Conversely, positioning in consumer discretionary and materials added the most value among market sectors, while geographically my picks in Brazil and South Korea had the most favorable impact. At the stock level, Thai wireless carrier Advanced Info Service succeeded in expanding its market share, controlling costs and generating additional service revenue, which enabled its stock to deliver an outsized gain and rewarded our overweighting there. Other contributors included Korean cigarette maker KT&G, Bank Rakyat Indonesia, automaker Astra International - also based in Indonesia - and Brazilian wireless services provider TIM Participacoes.
The views expressed above reflect those of the portfolio manager(s) only through the end of the period as stated on the cover of this report and do not necessarily represent the views of Fidelity or any other person in the Fidelity organization. Any such views are subject to change at any time based upon market or other conditions and Fidelity disclaims any responsibility to update such views. These views may not be relied on as investment advice and, because investment decisions for a Fidelity fund are based on numerous factors, may not be relied on as an indication of trading intent on behalf of any Fidelity fund.
Annual Report
As a shareholder of the Fund, you incur two types of costs: (1) transaction costs, including redemption fees, and (2) ongoing costs, including management fees, distribution and/or service (12b-1) fees and other Fund expenses. This Example is intended to help you understand your ongoing costs (in dollars) of investing in the Fund and to compare these costs with the ongoing costs of investing in other mutual funds.
The Example is based on an investment of $1,000 invested at the beginning of the period and held for the entire period (July 1, 2011 to December 31, 2011).
Actual Expenses
The first line of the accompanying table for each class of the Fund provides information about actual account values and actual expenses. You may use the information in this line, together with the amount you invested, to estimate the expenses that you paid over the period. Simply divide your account value by $1,000.00 (for example, an $8,600 account value divided by $1,000.00 = 8.6), then multiply the result by the number in the first line for a class of the Fund under the heading entitled "Expenses Paid During Period" to estimate the expenses you paid on your account during this period. The estimate of expenses does not include any fees or other expenses of any variable annuity or variable life insurance product. If they were, the estimate of expenses you paid during the period would be higher, and your ending account value would be lower. In addition, the Fund, as a shareholder in the underlying Fidelity Central Funds, will indirectly bear its pro-rata share of the fees and expenses incurred by the underlying Fidelity Central Funds. These fees and expenses are not included in the Fund's annualized expense ratio used to calculate the expense estimate in the table below.
Hypothetical Example for Comparison Purposes
The second line of the accompanying table for each class of the Fund provides information about hypothetical account values and hypothetical expenses based on a Class' actual expense ratio and an assumed rate of return of 5% per year before expenses, which is not the Class' actual return. The hypothetical account values and expenses may not be used to estimate the actual ending account balance or expenses you paid for the period. You may use this information to compare the ongoing costs of investing in the Fund and other funds. To do so, compare this 5% hypothetical example with the 5% hypothetical examples that appear in the shareholder reports of the other funds. The estimate of expenses does not include any fees or other expenses of any variable annuity or variable life insurance product. If they were, the estimate of expenses you paid during the period would be higher, and your ending account value would be lower. In addition, the Fund, as a shareholder in the underlying Fidelity Central Funds, will indirectly bear its pro-rata share of the fees and expenses incurred by the underlying Fidelity Central Funds. These fees and expenses are not included in the Fund's annualized expense ratio used to calculate the expense estimate in the table below.
Please note that the expenses shown in the table are meant to highlight your ongoing costs only and do not reflect any transaction costs. Therefore, the second line of the table is useful in comparing ongoing costs only, and will not help you determine the relative total costs of owning different funds. In addition, if these transactional costs were included, your costs would have been higher.
| Annualized
Expense Ratio | Beginning
Account Value
July 1, 2011 | Ending
Account Value
December 31, 2011 | Expenses Paid
During Period*
July 1, 2011 to
December 31, 2011 |
Initial Class | 1.10% | | | |
Actual | | $ 1,000.00 | $ 792.30 | $ 4.97 |
HypotheticalA | | $ 1,000.00 | $ 1,019.66 | $ 5.60 |
Service Class | 1.20% | | | |
Actual | | $ 1,000.00 | $ 791.70 | $ 5.42 |
HypotheticalA | | $ 1,000.00 | $ 1,019.16 | $ 6.11 |
Service Class 2 | 1.35% | | | |
Actual | | $ 1,000.00 | $ 791.00 | $ 6.09 |
HypotheticalA | | $ 1,000.00 | $ 1,018.40 | $ 6.87 |
Initial Class R | 1.10% | | | |
Actual | | $ 1,000.00 | $ 792.30 | $ 4.97 |
HypotheticalA | | $ 1,000.00 | $ 1,019.66 | $ 5.60 |
Service Class 2R | 1.35% | | | |
Actual | | $ 1,000.00 | $ 791.60 | $ 6.10 |
HypotheticalA | | $ 1,000.00 | $ 1,018.40 | $ 6.87 |
Investor Class R | 1.18% | | | |
Actual | | $ 1,000.00 | $ 792.70 | $ 5.33 |
HypotheticalA | | $ 1,000.00 | $ 1,019.26 | $ 6.01 |
A 5% return per year before expenses
* Expenses are equal to each Class' annualized expense ratio, multiplied by the average account value over the period, multiplied by 184/365 (to reflect the one-half year period).
Annual Report
Investment Changes (Unaudited)
Geographic Diversification (% of fund's net assets) |
As of December 31, 2011 |
| Korea (South) | 19.4% | |
| Brazil | 15.1% | |
| China | 8.9% | |
| Taiwan | 6.9% | |
| Hong Kong | 6.1% | |
| Indonesia | 5.6% | |
| India | 5.2% | |
| Russia | 5.1% | |
| South Africa | 4.1% | |
| Other* | 23.6% | |

* Includes short term investments and other assets. |
Percentages are adjusted for the effect of futures contracts, if applicable. |
As of June 30, 2011 |
| Korea (South) | 19.5% | |
| Brazil | 15.2% | |
| Taiwan | 10.4% | |
| China | 9.4% | |
| Russia | 7.6% | |
| Indonesia | 4.1% | |
| Cayman Islands | 3.9% | |
| South Africa | 3.7% | |
| India | 3.7% | |
| Other* | 22.5% | |

* Includes short term investments and other assets. |
Percentages are adjusted for the effect of futures contracts, if applicable. |
Asset Allocation |
| % of fund's
net assets | % of fund's net assets
6 months ago |
Stocks | 98.0 | 97.8 |
Short-Term Investments and Net Other Assets | 2.0 | 2.2 |
Top Ten Stocks as of December 31, 2011 |
| % of fund's
net assets | % of fund's net assets
6 months ago |
Samsung Electronics Co. Ltd. (Korea (South), Semiconductors & Semiconductor Equipment) | 4.6 | 2.9 |
Petroleo Brasileiro SA - Petrobras (Brazil, Oil, Gas & Consumable Fuels) | 2.7 | 1.5 |
China Mobile (Hong Kong) Ltd. (Hong Kong, Wireless Telecommunication Services) | 2.0 | 0.0 |
Taiwan Semiconductor Manufacturing Co. Ltd. (Taiwan, Semiconductors & Semiconductor Equipment) | 2.0 | 2.1 |
Banco Bradesco SA (PN) sponsored ADR (Brazil, Commercial Banks) | 2.0 | 1.8 |
Hyundai Motor Co. (Korea (South), Automobiles) | 1.9 | 1.9 |
China Construction Bank Corp. (H Shares) (China, Commercial Banks) | 1.6 | 0.8 |
Vale SA (PN-A) sponsored ADR (Brazil, Metals & Mining) | 1.5 | 2.5 |
CNOOC Ltd. (Hong Kong, Oil, Gas & Consumable Fuels) | 1.4 | 1.6 |
China Petroleum & Chemical Corp. (China, Oil, Gas & Consumable Fuels) | 1.3 | 0.0 |
| 21.0 | |
Market Sectors as of December 31, 2011 |
| % of fund's
net assets | % of fund's net assets
6 months ago |
Financials | 22.1 | 22.0 |
Energy | 13.7 | 14.1 |
Information Technology | 11.9 | 13.4 |
Materials | 10.8 | 13.4 |
Consumer Discretionary | 10.6 | 10.0 |
Telecommunication Services | 9.1 | 6.3 |
Consumer Staples | 8.6 | 7.0 |
Industrials | 5.3 | 6.9 |
Utilities | 4.9 | 4.0 |
Health Care | 1.0 | 0.7 |
Annual Report
Investments December 31, 2011
Showing Percentage of Net Assets
Common Stocks - 98.0% |
| Shares | | Value |
Bailiwick of Jersey - 0.5% |
Randgold Resources Ltd. sponsored ADR | 4,600 | | $ 469,660 |
Bermuda - 2.5% |
African Minerals Ltd. (a) | 25,928 | | 177,188 |
Aquarius Platinum Ltd. (Australia) | 127,612 | | 305,376 |
Beijing Enterprises Water Group Ltd. (a) | 1,098,000 | | 299,714 |
Cheung Kong Infrastructure Holdings Ltd. | 84,000 | | 492,107 |
CNPC (Hong Kong) Ltd. | 102,000 | | 145,253 |
Credicorp Ltd. (NY Shares) | 4,401 | | 481,777 |
NWS Holdings Ltd. | 234,346 | | 345,186 |
TOTAL BERMUDA | | 2,246,601 |
Brazil - 15.1% |
Banco Bradesco SA (PN) sponsored ADR (d) | 108,640 | | 1,812,115 |
Banco do Estado do Rio Grande do Sul SA | 59,900 | | 642,980 |
BR Malls Participacoes SA | 50,300 | | 489,178 |
Brasil Foods SA sponsored ADR (d) | 22,700 | | 443,785 |
Companhia de Bebidas das Americas (AmBev) (PN) sponsored ADR | 22,397 | | 808,308 |
Companhia de Saneamento Basico do Estado de Sao Paulo (SABESP) | 24,800 | | 692,542 |
Companhia de Saneamento de Minas Gerais | 12,700 | | 227,662 |
Eletropaulo Metropolitana SA (PN-B) | 30,900 | | 605,330 |
Gol Linhas Aereas Inteligentes SA rights 1/26/12 (a) | 225 | | 0 |
Hypermarcas SA | 52,300 | | 238,595 |
Klabin SA (PN) (non-vtg.) | 128,900 | | 553,456 |
Multiplan Empreendimentos Imobiliarios SA | 6,200 | | 127,348 |
Multiplus SA | 23,400 | | 405,029 |
OGX Petroleo e Gas Participacoes SA (a) | 109,000 | | 796,790 |
Petroleo Brasileiro SA - Petrobras: | | | |
(PN) (non-vtg.) | 20,900 | | 241,059 |
(PN) sponsored ADR (d) | 91,815 | | 2,156,734 |
Qualicorp SA | 23,000 | | 206,768 |
Tegma Gestao Logistica | 31,900 | | 439,156 |
TIM Participacoes SA sponsored ADR (d) | 23,065 | | 595,077 |
Ultrapar Participacoes SA | 32,100 | | 551,482 |
Vale SA (PN-A) sponsored ADR | 64,474 | | 1,328,164 |
TOTAL BRAZIL | | 13,361,558 |
British Virgin Islands - 0.4% |
Mail.ru Group Ltd.: | | | |
GDR (a)(e) | 12,600 | | 327,600 |
GDR (Reg. S) (a) | 800 | | 20,800 |
TOTAL BRITISH VIRGIN ISLANDS | | 348,400 |
Canada - 1.4% |
Eldorado Gold Corp. | 28,394 | | 390,891 |
|
| Shares | | Value |
First Quantum Minerals Ltd. | 24,300 | | $ 478,412 |
Goldcorp, Inc. | 8,000 | | 355,145 |
TOTAL CANADA | | 1,224,448 |
Cayman Islands - 3.4% |
Baidu.com, Inc. sponsored ADR (a) | 3,850 | | 448,410 |
China Shanshui Cement Group Ltd. | 716,000 | | 476,620 |
Country Garden Holdings Co. Ltd. | 1,047,000 | | 392,291 |
Eurasia Drilling Co. Ltd. GDR (Reg. S) | 17,453 | | 410,146 |
EVA Precision Industrial Holdings Ltd. | 320,000 | | 77,460 |
New Oriental Education & Technology Group, Inc. sponsored ADR (a) | 13,900 | | 334,295 |
Shenguan Holdings Group Ltd. | 496,000 | | 287,384 |
Shenzhou International Group Holdings Ltd. | 154,000 | | 208,992 |
Silver Base Group Holdings Ltd. | 54,000 | | 43,803 |
Spreadtrum Communications, Inc. ADR (d) | 13,200 | | 275,616 |
Uni-President China Holdings Ltd. | 124,000 | | 74,241 |
TOTAL CAYMAN ISLANDS | | 3,029,258 |
Chile - 1.1% |
CFR Pharmaceuticals SA | 1,761,563 | | 414,027 |
Empresa Nacional de Telecomunicaciones SA (ENTEL) | 24,283 | | 451,070 |
Sociedad Quimica y Minera de Chile SA (PN-B) sponsored ADR (d) | 1,700 | | 91,545 |
TOTAL CHILE | | 956,642 |
China - 8.9% |
Angang Steel Co. Ltd. (H Shares) | 122,000 | | 87,809 |
China BlueChemical Ltd. (H shares) | 288,000 | | 218,041 |
China CITIC Bank Corp. Ltd. (H Shares) | 1,079,000 | | 607,116 |
China Communications Construction Co. Ltd. (H Shares) | 655,000 | | 511,916 |
China Communications Services Corp. Ltd. (H Shares) | 870,000 | | 392,063 |
China Construction Bank Corp.
(H Shares) | 2,023,000 | | 1,411,771 |
China Minsheng Banking Corp. Ltd.
(H Shares) | 927,500 | | 803,708 |
China National Building Materials Co. Ltd. (H Shares) | 348,000 | | 395,200 |
China Petroleum & Chemical Corp.: | | | |
(H Shares) | 584,000 | | 613,062 |
sponsored ADR (H Shares) (d) | 5,400 | | 567,270 |
China Southern Airlines Ltd.
(H Shares) (a) | 752,000 | | 378,950 |
Great Wall Motor Co. Ltd. (H Shares) | 336,500 | | 491,323 |
Harbin Power Equipment Co. Ltd.
(H Shares) | 314,000 | | 274,112 |
Huadian Power International Corp. Ltd. (H shares) (a) | 590,000 | | 116,228 |
Industrial & Commercial Bank of China Ltd. (H Shares) | 800,070 | | 474,895 |
Common Stocks - continued |
| Shares | | Value |
China - continued |
Maanshan Iron & Steel Ltd. (H Shares) | 272,000 | | $ 87,204 |
Yantai Changyu Pioneer Wine Co.
(B Shares) | 40,799 | | 446,517 |
TOTAL CHINA | | 7,877,185 |
Colombia - 0.2% |
Almacenes Exito SA | 10,236 | | 134,438 |
Czech Republic - 1.4% |
Ceske Energeticke Zavody A/S | 17,500 | | 696,209 |
Philip Morris CR A/S | 443 | | 282,074 |
Telefonica Czech Republic A/S | 15,000 | | 290,859 |
TOTAL CZECH REPUBLIC | | 1,269,142 |
Egypt - 0.1% |
Commercial International Bank Ltd. sponsored GDR | 32,750 | | 98,578 |
Georgia - 0.2% |
Bank of Georgia GDR (Reg. S) | 12,948 | | 168,324 |
Hong Kong - 6.1% |
China Insurance International Holdings Co. Ltd. (a) | 221,200 | | 410,125 |
China Mobile Ltd. | 188,000 | | 1,826,531 |
China Power International Development Ltd. | 2,297,000 | | 538,272 |
China Unicom Ltd. | 330,000 | | 695,692 |
CNOOC Ltd. | 694,000 | | 1,210,159 |
Dah Chong Hong Holdings Ltd. | 1,000 | | 1,178 |
Guangdong Investment Ltd. | 586,000 | | 355,376 |
Lenovo Group Ltd. | 558,000 | | 372,163 |
Sinotruk Hong Kong Ltd. | 79,500 | | 44,425 |
TOTAL HONG KONG | | 5,453,921 |
Hungary - 0.5% |
Magyar Telekom PLC | 194,400 | | 414,296 |
India - 5.2% |
Bank of Baroda | 44,618 | | 565,939 |
Bharti Airtel Ltd. | 72,534 | | 469,969 |
Hero Motocorp Ltd. | 2,509 | | 90,164 |
Hindustan Unilever Ltd. | 59,814 | | 459,648 |
Housing Development Finance Corp. Ltd. | 74,078 | | 911,111 |
Indian Overseas Bank | 147,082 | | 203,498 |
Punjab National Bank | 2,063 | | 31,918 |
Tata Consultancy Services Ltd. | 33,378 | | 730,740 |
Tata Motors Ltd. | 52,255 | | 175,742 |
Tata Steel Ltd. | 69,222 | | 437,868 |
Ultratech Cemco Ltd. | 20,661 | | 454,608 |
United Phosphorous Ltd. | 41,684 | | 99,777 |
TOTAL INDIA | | 4,630,982 |
Indonesia - 5.6% |
PT Astra International Tbk | 132,500 | | 1,081,335 |
PT Bank Rakyat Indonesia Tbk | 1,443,500 | | 1,074,566 |
PT Bank Tabungan Negara Tbk | 1,076,500 | | 143,652 |
|
| Shares | | Value |
PT Bumi Serpong Damai Tbk | 2,141,500 | | $ 231,450 |
PT Ciputra Development Tbk | 2,657,500 | | 158,263 |
PT Gadjah Tunggal Tbk | 500,000 | | 165,426 |
PT Gudang Garam Tbk | 83,000 | | 567,979 |
PT Indocement Tunggal Prakarsa Tbk | 209,000 | | 392,992 |
PT Indosat Tbk | 822,800 | | 512,691 |
PT Summarecon Agung Tbk | 887,500 | | 121,368 |
PT Tower Bersama Infrastructure Tbk | 1,363,500 | | 357,134 |
PT XL Axiata Tbk | 317,500 | | 158,444 |
TOTAL INDONESIA | | 4,965,300 |
Israel - 0.2% |
NICE Systems Ltd. sponsored ADR (a) | 5,200 | | 179,140 |
Korea (South) - 19.4% |
BS Financial Group, Inc. (a) | 38,870 | | 369,617 |
Cheil Worldwide, Inc. | 26,190 | | 427,090 |
CJ CheilJedang Corp. | 1,557 | | 387,893 |
CJ Corp. | 41 | | 2,717 |
Dongbu Insurance Co. Ltd. | 3,100 | | 142,455 |
Hana Financial Group, Inc. | 24,000 | | 734,220 |
Hankook Tire Co. Ltd. | 10,190 | | 396,797 |
Hotel Shilla Co. | 10,120 | | 335,287 |
Hyundai Department Store Co. Ltd. | 3,928 | | 550,978 |
Hyundai Fire & Marine Insurance Co. Ltd. | 16,040 | | 476,210 |
Hyundai Heavy Industries Co. Ltd. | 3,411 | | 754,380 |
Hyundai Mobis | 2,867 | | 720,420 |
Hyundai Motor Co. | 9,331 | | 1,710,342 |
Industrial Bank of Korea | 55,790 | | 600,125 |
Kia Motors Corp. | 13,284 | | 762,482 |
Korea Zinc Co. Ltd. | 1,463 | | 382,730 |
KT&G Corp. | 15,168 | | 1,062,497 |
LG Chemical Ltd. | 2 | | 546 |
LG Household & Health Care Ltd. | 769 | | 322,609 |
LIG Non-Life Insurance Co. Ltd. | 11,000 | | 216,772 |
Nong Shim Co. Ltd. | 2,404 | | 480,986 |
Orion Corp. | 547 | | 319,148 |
Samsung Electronics Co. Ltd. | 4,524 | | 4,118,918 |
Shinhan Financial Group Co. Ltd. | 27,925 | | 957,301 |
SK Chemicals Co. Ltd. | 6,509 | | 359,044 |
SK Energy Co. Ltd. | 3,447 | | 421,216 |
TK Corp. (a) | 8,311 | | 170,218 |
TOTAL KOREA (SOUTH) | | 17,182,998 |
Luxembourg - 0.5% |
Millicom International Cellular SA (depositary receipt) | 4,700 | | 470,963 |
Malaysia - 0.9% |
Axiata Group Bhd | 337,600 | | 547,402 |
Genting Bhd | 60,700 | | 210,631 |
IJM Plantation Bhd | 30,000 | | 26,688 |
TOTAL MALAYSIA | | 784,721 |
Common Stocks - continued |
| Shares | | Value |
Mexico - 0.5% |
Cemex SA de CV sponsored ADR (d) | 32,752 | | $ 176,533 |
Grupo Modelo SAB de CV Series C | 45,700 | | 289,794 |
TOTAL MEXICO | | 466,327 |
Netherlands - 0.4% |
X5 Retail Group NV GDR (Reg. S) (a) | 14,800 | | 338,032 |
Nigeria - 0.5% |
Guaranty Trust Bank PLC GDR (Reg. S) | 89,594 | | 407,653 |
Panama - 0.5% |
Copa Holdings SA Class A | 6,900 | | 404,823 |
Philippines - 0.5% |
Globe Telecom, Inc. | 17,120 | | 442,449 |
Poland - 0.2% |
Eurocash SA | 20,800 | | 172,047 |
Qatar - 0.3% |
Commercial Bank of Qatar GDR (Reg. S) | 52,310 | | 241,338 |
Russia - 5.1% |
Cherkizovo Group OJSC GDR (a) | 17,302 | | 199,897 |
Gazprom OAO sponsored ADR | 99,698 | | 1,064,874 |
Lukoil Oil Co. sponsored ADR | 8,359 | | 444,699 |
Mostotrest OAO (a) | 10,130 | | 58,652 |
NOVATEK OAO GDR | 6,875 | | 860,750 |
Rosneft Oil Co. OJSC GDR (Reg. S) | 126,000 | | 831,600 |
Sberbank (Savings Bank of the Russian Federation) (a) | 436,400 | | 1,075,281 |
TOTAL RUSSIA | | 4,535,753 |
Singapore - 0.1% |
First Resources Ltd. | 52,000 | | 60,533 |
South Africa - 4.1% |
African Bank Investments Ltd. | 126,900 | | 539,191 |
Foschini Ltd. | 37,523 | | 488,014 |
Harmony Gold Mining Co. Ltd. sponsored ADR | 29,300 | | 341,052 |
Imperial Holdings Ltd. (f) | 34,730 | | 531,323 |
Life Healthcare Group Holdings Ltd. | 165,400 | | 422,894 |
Mr Price Group Ltd. | 36,600 | | 361,802 |
Northam Platinum Ltd. | 34,723 | | 129,040 |
Sasol Ltd. | 8,000 | | 380,822 |
Sasol Ltd. sponsored ADR | 9,692 | | 459,401 |
TOTAL SOUTH AFRICA | | 3,653,539 |
Taiwan - 6.9% |
Chinatrust Financial Holding Co. Ltd. | 1,074,000 | | 670,253 |
Chroma ATE, Inc. | 128,576 | | 252,185 |
E.Sun Financial Holdings Co. Ltd. | 543,000 | | 233,982 |
Formosa Plastics Corp. | 279,000 | | 744,368 |
Hon Hai Precision Industry Co. Ltd. (Foxconn) | 372,000 | | 1,018,286 |
HTC Corp. | 22,057 | | 361,972 |
|
| Shares | | Value |
Leofoo Development Co. Ltd. (a) | 13,340 | | $ 7,554 |
Taiwan Cement Corp. | 464,825 | | 537,192 |
Taiwan Mobile Co. Ltd. | 60,000 | | 187,023 |
Taiwan Semiconductor Manufacturing Co. Ltd. | 663,609 | | 1,657,765 |
Taiwan Semiconductor Manufacturing Co. Ltd. sponsored ADR | 12,200 | | 157,502 |
Wistron Corp. | 236,000 | | 298,848 |
TOTAL TAIWAN | | 6,126,930 |
Thailand - 3.1% |
Advanced Info Service PCL (For. Reg.) | 170,000 | | 755,854 |
Asian Property Development PCL (For. Reg.) | 1,462,160 | | 229,504 |
Bangkok Expressway PCL (For.Reg.) | 279,900 | | 161,208 |
Charoen Pokphand Foods PCL (For. Reg.) | 226,600 | | 236,639 |
PTT Global Chemical PCL (For. Reg.) (a) | 109,980 | | 212,303 |
PTT PCL (For. Reg.) | 54,300 | | 546,437 |
Siam Commercial Bank PCL (For. Reg.) | 173,800 | | 640,750 |
Total Access Communication PCL (For. Reg.) | 400 | | 880 |
TOTAL THAILAND | | 2,783,575 |
Turkey - 1.5% |
Aygaz A/S | 47,409 | | 222,332 |
Eregli Demir ve Celik Fabrikalari T.A.S. | 53,408 | | 92,933 |
Ford Otomotiv Sanayi A/S | 11,000 | | 89,284 |
Tupras-Turkiye Petrol Rafinerileri A/S | 22,000 | | 466,844 |
Turkiye Garanti Bankasi A/S | 155,000 | | 485,146 |
TOTAL TURKEY | | 1,356,539 |
United Kingdom - 0.2% |
International Personal Finance PLC | 70,369 | | 187,439 |
United States of America - 0.5% |
Cognizant Technology Solutions Corp. Class A (a) | 7,400 | | 475,894 |
TOTAL COMMON STOCKS (Cost $83,176,268) |
86,919,426
|
Money Market Funds - 6.5% |
| Shares | | Value |
Fidelity Cash Central Fund, 0.11% (b) | 1,148,928 | | $ 1,148,928 |
Fidelity Securities Lending Cash Central Fund, 0.13% (b)(c) | 4,613,246 | | 4,613,246 |
TOTAL MONEY MARKET FUNDS (Cost $5,762,174) |
5,762,174
|
TOTAL INVESTMENT PORTFOLIO - 104.5% (Cost $88,938,442) | | 92,681,600 |
NET OTHER ASSETS (LIABILITIES) - (4.5)% | | (4,016,165) |
NET ASSETS - 100% | $ 88,665,435 |
Legend |
(a) Non-income producing |
(b) Affiliated fund that is available only to investment companies and other accounts managed by Fidelity Investments. The rate quoted is the annualized seven-day yield of the fund at period end. A complete unaudited listing of the fund's holdings as of its most recent quarter end is available upon request. In addition, each Fidelity Central Fund's financial statements, which are not covered by the Fund's Report of Independent Registered Public Accounting Firm, are available on the SEC's website or upon request. |
(c) Investment made with cash collateral received from securities on loan. |
(d) Security or a portion of the security is on loan at period end. |
(e) Security exempt from registration under Rule 144A of the Securities Act of 1933. These securities may be resold in transactions exempt from registration, normally to qualified institutional buyers. At the end of the period, the value of these securities amounted to $327,600 or 0.4% of net assets. |
(f) Security or a portion of the security purchased on a delayed delivery or when-issued basis. |
Affiliated Central Funds |
Information regarding fiscal year to date income earned by the Fund from investments in Fidelity Central Funds is as follows: |
Fund | Income earned |
Fidelity Cash Central Fund | $ 1,877 |
Fidelity Securities Lending Cash Central Fund | 11,200 |
Total | $ 13,077 |
Other Information |
The following is a summary of the inputs used, as of December 31, 2011, involving the Fund's assets and liabilities carried at fair value. The inputs or methodology used for valuing securities may not be an indication of the risk associated with investing in those securities. For more information on valuation inputs, and their aggregation into the levels used in the table below, please refer to the Security Valuation section in the accompanying Notes to Financial Statements. |
Valuation Inputs at Reporting Date: |
Description | Total | Level 1 | Level 2 | Level 3 |
Investments in Securities: | | | | |
Equities: | | | | |
Korea (South) | $ 17,182,998 | $ 16,225,697 | $ 957,301 | $ - |
Brazil | 13,361,558 | 13,361,558 | - | - |
China | 7,877,185 | 6,885,173 | 992,012 | - |
Taiwan | 6,126,930 | 4,469,165 | 1,657,765 | - |
Hong Kong | 5,453,921 | 1,721,539 | 3,732,382 | - |
Indonesia | 4,965,300 | 4,965,300 | - | - |
India | 4,630,982 | 3,857,383 | 773,599 | - |
Russia | 4,535,753 | 4,535,753 | - | - |
South Africa | 3,653,539 | 3,272,717 | 380,822 | - |
Other | 19,131,260 | 19,131,260 | - | - |
Money Market Funds | 5,762,174 | 5,762,174 | - | - |
Total Investments in Securities: | $ 92,681,600 | $ 84,187,719 | $ 8,493,881 | $ - |
See accompanying notes which are an integral part of the financial statements.
Annual Report
Statement of Assets and Liabilities
| December 31, 2011 |
Assets | | |
Investment in securities, at value (including securities loaned of $4,532,727) - See accompanying schedule: Unaffiliated issuers (cost $83,176,268) | $ 86,919,426 | |
Fidelity Central Funds (cost $5,762,174) | 5,762,174 | |
Total Investments (cost $88,938,442) | | $ 92,681,600 |
Cash | | 111,051 |
Foreign currency held at value (cost $34,898) | | 34,920 |
Receivable for investments sold
Regular delivery | | 666,355 |
Delayed delivery | | 105,235 |
Receivable for fund shares sold | | 49,820 |
Dividends receivable | | 286,004 |
Distributions receivable from Fidelity Central Funds | | 728 |
Prepaid expenses | | 274 |
Receivable from investment adviser for expense reductions | | 27,311 |
Other receivables | | 20,315 |
Total assets | | 93,983,613 |
| | |
Liabilities | | |
Payable for investments purchased
Regular delivery | $ 429,201 | |
Delayed delivery | 41,858 | |
Payable for fund shares redeemed | 115,859 | |
Accrued management fee | 60,781 | |
Distribution and service plan fees payable | 483 | |
Other affiliated payables | 11,858 | |
Other payables and accrued expenses | 44,892 | |
Collateral on securities loaned, at value | 4,613,246 | |
Total liabilities | | 5,318,178 |
| | |
Net Assets | | $ 88,665,435 |
Net Assets consist of: | | |
Paid in capital | | $ 92,580,072 |
Distributions in excess of net investment income | | (286,346) |
Accumulated undistributed net realized gain (loss) on investments and foreign currency transactions | | (7,369,437) |
Net unrealized appreciation (depreciation) on investments and assets and liabilities in foreign currencies | | 3,741,146 |
Net Assets | | $ 88,665,435 |
Statement of Assets and Liabilities - continued
| December 31, 2011 |
Initial Class:
Net Asset Value, offering price and redemption price per share ($29,478,476 ÷ 3,808,869 shares) | | $ 7.74 |
| | |
Service Class:
Net Asset Value, offering price and redemption price per share
($72,457 ÷ 9,332 shares) | | $ 7.76 |
| | |
Service Class 2:
Net Asset Value, offering price and redemption price per share ($2,248,724 ÷ 289,629 shares) | | $ 7.76 |
| | |
Initial Class R:
Net Asset Value, offering price and redemption price per share ($14,869,559 ÷ 1,920,891 shares) | | $ 7.74 |
| | |
Service Class 2R:
Net Asset Value, offering price and redemption price per share
($72,163 ÷ 9,269 shares) | | $ 7.79 |
| | |
Investor Class R:
Net Asset Value, offering price and redemption price per share ($41,924,056 ÷ 5,433,462 shares) | | $ 7.72 |
See accompanying notes which are an integral part of the financial statements.
Annual Report
Financial Statements - continued
Statement of Operations
| Year ended December 31, 2011 |
Investment Income | | |
Dividends | | $ 2,591,903 |
Income from Fidelity Central Funds | | 13,077 |
Income before foreign taxes withheld | | 2,604,980 |
Less foreign taxes withheld | | (273,381) |
Total income | | 2,331,599 |
| | |
Expenses | | |
Management fee | $ 761,469 | |
Transfer agent fees | 116,953 | |
Distribution and service plan fees | 4,959 | |
Accounting and security lending fees | 49,328 | |
Custodian fees and expenses | 245,788 | |
Independent trustees' compensation | 537 | |
Audit | 90,713 | |
Legal | 334 | |
Miscellaneous | 826 | |
Total expenses before reductions | 1,270,907 | |
Expense reductions | (267,305) | 1,003,602 |
Net investment income (loss) | | 1,327,997 |
Realized and Unrealized Gain (Loss) Net realized gain (loss) on: | | |
Investment securities: | | |
Unaffiliated issuers | (3,394,293) | |
Foreign currency transactions | (262,961) | |
Total net realized gain (loss) | | (3,657,254) |
Change in net unrealized appreciation (depreciation) on: Investment securities (net of decrease in deferred foreign taxes of $4,803) | (19,324,216) | |
Assets and liabilities in foreign currencies | (10,616) | |
Total change in net unrealized appreciation (depreciation) | | (19,334,832) |
Net gain (loss) | | (22,992,086) |
Net increase (decrease) in net assets resulting from operations | | $ (21,664,089) |
Statement of Changes in Net Assets
| Year ended
December 31,
2011 | Year ended
December 31,
2010 |
Increase (Decrease) in Net Assets | | |
Operations | | |
Net investment income (loss) | $ 1,327,997 | $ 817,833 |
Net realized gain (loss) | (3,657,254) | 1,482,603 |
Change in net unrealized appreciation (depreciation) | (19,334,832) | 11,348,605 |
Net increase (decrease) in net assets resulting from operations | (21,664,089) | 13,649,041 |
Distributions to shareholders from net investment income | (988,101) | (839,007) |
Distributions to shareholders from net realized gain | - | (380,090) |
Total distributions | (988,101) | (1,219,097) |
Share transactions - net increase (decrease) | 7,482,418 | 19,330,340 |
Redemption fees | 66,730 | 21,709 |
Total increase (decrease) in net assets | (15,103,042) | 31,781,993 |
| | |
Net Assets | | |
Beginning of period | 103,768,477 | 71,986,484 |
End of period (including distributions in excess of net investment income of $286,346 and distributions in excess
of net investment income of $126,246, respectively) | $ 88,665,435 | $ 103,768,477 |
See accompanying notes which are an integral part of the financial statements.
Annual Report
Financial Highlights - Initial Class
Years ended December 31, | 2011 | 2010 | 2009 | 2008 H |
Selected Per-Share Data | | | | |
Net asset value, beginning of period | $ 9.91 | $ 8.51 | $ 4.88 | $ 10.00 |
Income from Investment Operations | | | | |
Net investment income (loss) E | .13 | .09 | .04 | .13 |
Net realized and unrealized gain (loss) | (2.22) | 1.43 | 3.64 | (5.19) |
Total from investment operations | (2.09) | 1.52 | 3.68 | (5.06) |
Distributions from net investment income | (.09) | (.08) | (.02) | (.08) |
Distributions from net realized gain | - | (.04) | (.03) | - |
Total distributions | (.09) | (.12) | (.05) | (.08) |
Redemption fees added to paid in capital E | .01 | - J | - J | .02 |
Net asset value, end of period | $ 7.74 | $ 9.91 | $ 8.51 | $ 4.88 |
Total Return B,C,D | (21.01)% | 17.89% | 75.40% | (50.45)% |
Ratios to Average Net Assets F,I | | | | |
Expenses before reductions | 1.31% | 1.33% | 2.85% | 3.92% A |
Expenses net of fee waivers, if any | 1.10% | 1.10% | 1.10% | 1.10% A |
Expenses net of all reductions | 1.02% | 1.04% | 1.02% | 1.02% A |
Net investment income (loss) | 1.46% | 1.05% | .60% | 1.54% A |
Supplemental Data | | | | |
Net assets, end of period (000 omitted) | $ 29,478 | $ 18,478 | $ 250 | $ 516 |
Portfolio turnover rate G | 151% | 100% | 70% | 79% |
A Annualized
B Total returns for periods of less than one year are not annualized.
C Total returns do not reflect charges attributable to your insurance company's separate account. Inclusion of these charges would reduce the total returns shown.
D Total returns would have been lower if certain expenses had not been reduced during the applicable periods shown.
E Calculated based on average shares outstanding during the period.
F Fees and expenses of any underlying Fidelity Central Funds are not included in the Fund's expense ratio. The Fund indirectly bears its proportionate share of the expenses of any underlying Fidelity Central Funds.
G Amount does not include the portfolio activity of any underlying Fidelity Central Funds.
H For the period January 23, 2008 (commencement of operations) to December 31, 2008.
I Expense ratios reflect operating expenses of the class. Expenses before reductions do not reflect amounts reimbursed by the investment adviser or reductions from brokerage service arrangements or reductions from other expense offset arrangements and do not represent the amount paid by the class during periods when reimbursements or reductions occur. Expense ratios before reductions for start-up periods may not be representative of longer-term operating periods. Expenses net of fee waivers reflect expenses after reimbursement by the investment adviser but prior to reductions from brokerage service arrangements or other expense offset arrangements. Expenses net of all reductions represent the net expenses paid by the class.
J Amount represents less than $.01 per share.
Financial Highlights - Service Class
Years ended December 31, | 2011 | 2010 | 2009 | 2008 H |
Selected Per-Share Data | | | | |
Net asset value, beginning of period | $ 9.94 | $ 8.54 | $ 4.88 | $ 10.00 |
Income from Investment Operations | | | | |
Net investment income (loss) E | .12 | .08 | .03 | .12 |
Net realized and unrealized gain (loss) | (2.23) | 1.43 | 3.65 | (5.19) |
Total from investment operations | (2.11) | 1.51 | 3.68 | (5.07) |
Distributions from net investment income | (.08) | (.07) | - J | (.07) |
Distributions from net realized gain | - | (.04) | (.02) | - |
Total distributions | (.08) | (.11) | (.02) | (.07) |
Redemption fees added to paid in capital E | .01 | - J | - J | .02 |
Net asset value, end of period | $ 7.76 | $ 9.94 | $ 8.54 | $ 4.88 |
Total Return B,C,D | (21.15)% | 17.70% | 75.49% | (50.53)% |
Ratios to Average Net Assets F,I | | | | |
Expenses before reductions | 1.40% | 1.48% | 3.02% | 4.02% A |
Expenses net of fee waivers, if any | 1.20% | 1.20% | 1.20% | 1.20% A |
Expenses net of all reductions | 1.12% | 1.14% | 1.12% | 1.12% A |
Net investment income (loss) | 1.35% | .95% | .50% | 1.44% A |
Supplemental Data | | | | |
Net assets, end of period (000 omitted) | $ 72 | $ 102 | $ 118 | $ 396 |
Portfolio turnover rate G | 151% | 100% | 70% | 79% |
A Annualized
B Total returns for periods of less than one year are not annualized.
C Total returns do not reflect charges attributable to your insurance company's separate account. Inclusion of these charges would reduce the total returns shown.
D Total returns would have been lower if certain expenses had not been reduced during the applicable periods shown.
E Calculated based on average shares outstanding during the period.
F Fees and expenses of any underlying Fidelity Central Funds are not included in the Fund's expense ratio. The Fund indirectly bears its proportionate share of the expenses of any underlying Fidelity Central Funds.
G Amount does not include the portfolio activity of any underlying Fidelity Central Funds.
H For the period January 23, 2008 (commencement of operations) to December 31, 2008.
I Expense ratios reflect operating expenses of the class. Expenses before reductions do not reflect amounts reimbursed by the investment adviser or reductions from brokerage service arrangements or reductions from other expense offset arrangements and do not represent the amount paid by the class during periods when reimbursements or reductions occur. Expense ratios before reductions for start-up periods may not be representative of longer-term operating periods. Expenses net of fee waivers reflect expenses after reimbursement by the investment adviser but prior to reductions from brokerage service arrangements or other expense offset arrangements. Expenses net of all reductions represent the net expenses paid by the class.
J Amount represents less than $.01 per share.
See accompanying notes which are an integral part of the financial statements.
Annual Report
Financial Highlights - Service Class 2
Years ended December 31, | 2011 | 2010 | 2009 | 2008 H |
Selected Per-Share Data | | | | |
Net asset value, beginning of period | $ 9.95 | $ 8.56 | $ 4.88 | $ 10.00 |
Income from Investment Operations | | | | |
Net investment income (loss) E | .11 | .07 | .02 | .11 |
Net realized and unrealized gain (loss) | (2.24) | 1.43 | 3.66 | (5.19) |
Total from investment operations | (2.13) | 1.50 | 3.68 | (5.08) |
Distributions from net investment income | (.07) | (.07) | - | (.06) |
Distributions from net realized gain | - | (.04) | - | - |
Total distributions | (.07) | (.11) | - | (.06) |
Redemption fees added to paid in capital E | .01 | - J | - J | .02 |
Net asset value, end of period | $ 7.76 | $ 9.95 | $ 8.56 | $ 4.88 |
Total Return B,C,D | (21.30)% | 17.57% | 75.41% | (50.65)% |
Ratios to Average Net Assets F,I | | | | |
Expenses before reductions | 1.54% | 1.59% | 3.17% | 4.17% A |
Expenses net of fee waivers, if any | 1.35% | 1.35% | 1.35% | 1.35% A |
Expenses net of all reductions | 1.27% | 1.30% | 1.27% | 1.27% A |
Net investment income (loss) | 1.21% | .80% | .35% | 1.29% A |
Supplemental Data | | | | |
Net assets, end of period (000 omitted) | $ 2,249 | $ 1,348 | $ 117 | $ 395 |
Portfolio turnover rate G | 151% | 100% | 70% | 79% |
A Annualized
B Total returns for periods of less than one year are not annualized.
C Total returns do not reflect charges attributable to your insurance company's separate account. Inclusion of these charges would reduce the total returns shown.
D Total returns would have been lower if certain expenses had not been reduced during the applicable periods shown.
E Calculated based on average shares outstanding during the period.
F Fees and expenses of any underlying Fidelity Central Funds are not included in the Fund's expense ratio. The Fund indirectly bears its proportionate share of the expenses of any underlying Fidelity Central Funds.
G Amount does not include the portfolio activity of any underlying Fidelity Central Funds.
H For the period January 23, 2008 (commencement of operations) to December 31, 2008.
I Expense ratios reflect operating expenses of the class. Expenses before reductions do not reflect amounts reimbursed by the investment adviser or reductions from brokerage service arrangements or reductions from other expense offset arrangements and do not represent the amount paid by the class during periods when reimbursements or reductions occur. Expense ratios before reductions for start-up periods may not be representative of longer-term operating periods. Expenses net of fee waivers reflect expenses after reimbursement by the investment adviser but prior to reductions from brokerage service arrangements or other expense offset arrangements. Expenses net of all reductions represent the net expenses paid by the class.
J Amount represents less than $.01 per share.
Financial Highlights - Initial Class R
Years ended December 31, | 2011 | 2010 | 2009 | 2008 H |
Selected Per-Share Data | | | | |
Net asset value, beginning of period | $ 9.92 | $ 8.51 | $ 4.88 | $ 10.00 |
Income from Investment Operations | | | | |
Net investment income (loss) E | .14 | .09 | .04 | .11 |
Net realized and unrealized gain (loss) | (2.24) | 1.44 | 3.63 | (5.16) |
Total from investment operations | (2.10) | 1.53 | 3.67 | (5.05) |
Distributions from net investment income | (.09) | (.08) | (.02) | (.08) |
Distributions from net realized gain | - | (.04) | (.03) | - |
Total distributions | (.09) | (.12) | (.05) | (.08) |
Redemption fees added to paid in capital E | .01 | - J | .01 | .01 |
Net asset value, end of period | $ 7.74 | $ 9.92 | $ 8.51 | $ 4.88 |
Total Return B,C,D | (21.09)% | 18.01% | 75.40% | (50.45)% |
Ratios to Average Net Assets F,I | | | | |
Expenses before reductions | 1.30% | 1.35% | 2.03% | 3.71% A |
Expenses net of fee waivers, if any | 1.10% | 1.10% | 1.10% | 1.10% A |
Expenses net of all reductions | 1.02% | 1.04% | 1.02% | 1.02% A |
Net investment income (loss) | 1.46% | 1.05% | .60% | 1.54% A |
Supplemental Data | | | | |
Net assets, end of period (000 omitted) | $ 14,870 | $ 30,649 | $ 31,314 | $ 3,158 |
Portfolio turnover rate G | 151% | 100% | 70% | 79% |
A Annualized
B Total returns for periods of less than one year are not annualized.
C Total returns do not reflect charges attributable to your insurance company's separate account. Inclusion of these charges would reduce the total returns shown.
D Total returns would have been lower if certain expenses had not been reduced during the applicable periods shown.
E Calculated based on average shares outstanding during the period.
F Fees and expenses of any underlying Fidelity Central Funds are not included in the Fund's expense ratio. The Fund indirectly bears its proportionate share of the expenses of any underlying Fidelity Central Funds.
G Amount does not include the portfolio activity of any underlying Fidelity Central Funds.
H For the period January 23, 2008 (commencement of operations) to December 31, 2008.
I Expense ratios reflect operating expenses of the class. Expenses before reductions do not reflect amounts reimbursed by the investment adviser or reductions from brokerage service arrangements or reductions from other expense offset arrangements and do not represent the amount paid by the class during periods when reimbursements or reductions occur. Expense ratios before reductions for start-up periods may not be representative of longer-term operating periods. Expenses net of fee waivers reflect expenses after reimbursement by the investment adviser but prior to reductions from brokerage service arrangements or other expense offset arrangements. Expenses net of all reductions represent the net expenses paid by the class.
J Amount represents less than $.01 per share.
See accompanying notes which are an integral part of the financial statements.
Annual Report
Financial Highlights - Service Class 2R
Years ended December 31, | 2011 | 2010 | 2009 | 2008 H |
Selected Per-Share Data | | | | |
Net asset value, beginning of period | $ 9.97 | $ 8.56 | $ 4.88 | $ 10.00 |
Income from Investment Operations | | | | |
Net investment income (loss) E | .11 | .07 | .02 | .11 |
Net realized and unrealized gain (loss) | (2.24) | 1.43 | 3.66 | (5.19) |
Total from investment operations | (2.13) | 1.50 | 3.68 | (5.08) |
Distributions from net investment income | (.06) | (.06) | - | (.06) |
Distributions from net realized gain | - | (.04) | - | - |
Total distributions | (.06) | (.09) K | - | (.06) |
Redemption fees added to paid in capital E | .01 | - J | - J | .02 |
Net asset value, end of period | $ 7.79 | $ 9.97 | $ 8.56 | $ 4.88 |
Total Return B,C,D | (21.24)% | 17.60% | 75.41% | (50.65)% |
Ratios to Average Net Assets F,I | | | | |
Expenses before reductions | 1.56% | 1.63% | 3.17% | 4.17% A |
Expenses net of fee waivers, if any | 1.35% | 1.35% | 1.35% | 1.35% A |
Expenses net of all reductions | 1.27% | 1.29% | 1.27% | 1.27% A |
Net investment income (loss) | 1.20% | .80% | .35% | 1.29% A |
Supplemental Data | | | | |
Net assets, end of period (000 omitted) | $ 72 | $ 102 | $ 117 | $ 395 |
Portfolio turnover rate G | 151% | 100% | 70% | 79% |
A Annualized
B Total returns for periods of less than one year are not annualized.
C Total returns do not reflect charges attributable to your insurance company's separate account. Inclusion of these charges would reduce the total returns shown.
D Total returns would have been lower if certain expenses had not been reduced during the applicable periods shown.
E Calculated based on average shares outstanding during the period.
F Fees and expenses of any underlying Fidelity Central Funds are not included in the Fund's expense ratio. The Fund indirectly bears its proportionate share of the expenses of any underlying Fidelity Central Funds.
G Amount does not include the portfolio activity of any underlying Fidelity Central Funds.
H For the period January 23, 2008 (commencement of operations) to December 31, 2008.
I Expense ratios reflect operating expenses of the class. Expenses before reductions do not reflect amounts reimbursed by the investment adviser or reductions from brokerage service arrangements or reductions from other expense offset arrangements and do not represent the amount paid by the class during periods when reimbursements or reductions occur. Expense ratios before reductions for start-up periods may not be representative of longer-term operating periods. Expenses net of fee waivers reflect expenses after reimbursement by the investment adviser but prior to reductions from brokerage service arrangements or other expense offset arrangements. Expenses net of all reductions represent the net expenses paid by the class.
J Amount represents less than $.01 per share.
K Total distributions of $.09 per share is comprised of distributions from net investment income of $.056 and distributions from net realized gain of $.037 per share.
Financial Highlights - Investor Class R
Years ended December 31, | 2011 | 2010 | 2009 | 2008 H |
Selected Per-Share Data | | | | |
Net asset value, beginning of period | $ 9.89 | $ 8.50 | $ 4.87 | $ 10.00 |
Income from Investment Operations | | | | |
Net investment income (loss) E | .13 | .08 | .04 | .10 |
Net realized and unrealized gain (loss) | (2.22) | 1.43 | 3.63 | (5.16) |
Total from investment operations | (2.09) | 1.51 | 3.67 | (5.06) |
Distributions from net investment income | (.09) | (.08) | (.02) | (.08) |
Distributions from net realized gain | - | (.04) | (.03) | - |
Total distributions | (.09) | (.12) | (.05) | (.08) |
Redemption fees added to paid in capital E | .01 | - J | .01 | .01 |
Net asset value, end of period | $ 7.72 | $ 9.89 | $ 8.50 | $ 4.87 |
Total Return B,C,D | (21.05)% | 17.79% | 75.56% | (50.55)% |
Ratios to Average Net Assets F,I | | | | |
Expenses before reductions | 1.38% | 1.42% | 2.07% | 3.81% A |
Expenses net of fee waivers, if any | 1.18% | 1.18% | 1.18% | 1.18% A |
Expenses net of all reductions | 1.10% | 1.12% | 1.10% | 1.10% A |
Net investment income (loss) | 1.37% | .97% | .52% | 1.46% A |
Supplemental Data | | | | |
Net assets, end of period (000 omitted) | $ 41,924 | $ 53,089 | $ 40,070 | $ 3,377 |
Portfolio turnover rate G | 151% | 100% | 70% | 79% |
A Annualized
B Total returns for periods of less than one year are not annualized.
C Total returns do not reflect charges attributable to your insurance company's separate account. Inclusion of these charges would reduce the total returns shown.
D Total returns would have been lower if certain expenses had not been reduced during the applicable periods shown.
E Calculated based on average shares outstanding during the period.
F Fees and expenses of any underlying Fidelity Central Funds are not included in the Fund's expense ratio. The Fund indirectly bears its proportionate share of the expenses of any underlying Fidelity Central Funds.
G Amount does not include the portfolio activity of any underlying Fidelity Central Funds.
H For the period January 23, 2008 (commencement of operations) to December 31, 2008.
I Expense ratios reflect operating expenses of the class. Expenses before reductions do not reflect amounts reimbursed by the investment adviser or reductions from brokerage service arrangements or reductions from other expense offset arrangements and do not represent the amount paid by the class during periods when reimbursements or reductions occur. Expense ratios before reductions for start-up periods may not be representative of longer-term operating periods. Expenses net of fee waivers reflect expenses after reimbursement by the investment adviser but prior to reductions from brokerage service arrangements or other expense offset arrangements. Expenses net of all reductions represent the net expenses paid by the class.
J Amount represents less than $.01 per share.
See accompanying notes which are an integral part of the financial statements.
Annual Report
Notes to Financial Statements
For the period ended December 31, 2011
1. Organization.
VIP Emerging Markets Portfolio (the Fund) is a fund of Variable Insurance Products Fund IV (the Trust) and is authorized to issue an unlimited number of shares. The Trust is registered under the Investment Company Act of 1940, as amended (the 1940 Act), as an open-end management investment company organized as a Massachusetts business trust. Shares of the Fund may only be purchased by insurance companies for the purpose of funding variable annuity or variable life insurance contracts. The Fund offers the following classes of shares: Initial Class shares, Service Class shares, Service Class 2 shares, Initial Class R shares, Service Class 2R shares, and Investor Class R shares. All classes have equal rights and voting privileges, except for matters affecting a single class. Investment income, realized and unrealized capital gains and losses, the common expenses of the Fund, and certain fund-level expense reductions, if any, are allocated on a pro-rata basis to each class based on the relative net assets of each class to the total net assets of the Fund. Each class differs with respect to transfer agent and distribution and service plan fees incurred. Certain expense reductions may also differ by class. The Fund's investments in emerging markets can be subject to social, economic, regulatory, and political uncertainties and can be extremely volatile.
2. Investments in Fidelity Central Funds.
The Fund invests in Fidelity Central Funds, which are open-end investment companies available only to other investment companies and accounts managed by Fidelity Management & Research Company (FMR) and its affiliates. The Fund's Schedule of Investments lists each of the Fidelity Central Funds held as of period end, if any, as an investment of the Fund, but do not include the underlying holdings of each Fidelity Central Fund. As an Investing Fund, the Fund indirectly bears its proportionate share of the expenses of the underlying Fidelity Central Funds.
The Money Market Central Funds seek preservation of capital and current income and are managed by Fidelity Investments Money Management, Inc. (FIMM), an affiliate of FMR.
A complete unaudited list of holdings for each Fidelity Central Fund is available upon request or at the Securities and Exchange Commission (the SEC) web site at www.sec.gov. In addition, the financial statements of the Fidelity Central Funds, which are not covered by the Fund's Report of Independent Registered Public Accounting Firm, are available on the SEC web site or upon request.
3. Significant Accounting Policies.
The financial statements have been prepared in conformity with accounting principles generally accepted in the United States of America (GAAP), which require management to make certain estimates and assumptions at the date of the financial statements. Actual results could differ from those estimates. Subsequent events, if any, through the date that the financial statements were issued have been evaluated in the preparation of the financial statements. The following summarizes the significant accounting policies of the Fund:
Security Valuation. Investments are valued as of 4:00 p.m. Eastern time on the last calendar day of the period. The Fund uses independent pricing services approved by the Board of Trustees to value its investments. When current market prices or quotations are not readily available or reliable, valuations may be determined in good faith in accordance with procedures adopted by the Board of Trustees. Factors used in determining value may include market or security specific events. The frequency with which these procedures are used cannot be predicted and they may be utilized to a significant extent. The value used for net asset value (NAV) calculation under these procedures may differ from published prices for the same securities.
The Fund categorizes the inputs to valuation techniques used to value its investments into a disclosure hierarchy consisting of three levels as shown below:
Level 1 - quoted prices in active markets for identical investments
Level 2 - other significant observable inputs (including quoted prices for similar investments, interest rates, prepayment speeds, etc.)
Level 3 - unobservable inputs (including the Fund's own assumptions based on the best information available)
Changes in valuation techniques may result in transfers in or out of an assigned level within the disclosure hierarchy. The aggregate value of investments by input level, as of December 31, 2011, is included at the end of the Fund's Schedule of Investments. Valuation techniques used to value the Fund's investments by major category are as follows:
Equity securities, including restricted securities, for which market quotations are readily available, are valued at the last reported sale price or official closing price as reported by an independent pricing service on the primary market or exchange on which they are traded and are categorized as Level 1 in the hierarchy. In the event there were no sales during the day or closing prices are not available, securities are valued at the last quoted bid price or may be valued using the last available price and are generally categorized as Level 2 in the hierarchy. For foreign equity securities, when significant market or security specific events arise, comparisons to the valuation of American Depositary Receipts (ADRs), futures contracts, Exchange-traded funds (ETFs) and certain indexes as well as quoted prices for similar securities are used and are categorized as Level 2 in the hierarchy in these
Annual Report
3. Significant Accounting Policies - continued
Security Valuation - continued
circumstances. Utilizing these techniques may result in transfers between Level 1 and Level 2. For restricted equity securities and private placements where observable inputs are limited, assumptions about market activity and risk are used and are categorized as Level 3 in the hierarchy.
Investments in open-end mutual funds, including the Fidelity Central Funds, are valued at their closing net asset value each business day and are categorized as Level 1 in the hierarchy.
New Accounting Pronouncements. In May 2011, the Financial Accounting Standards Board issued Accounting Standard Update No. 2011-04, Fair Value Measurement (Topic 820) - Amendments to Achieve Common Fair Value Measurement and Disclosure Requirements in U.S. GAAP and IFRSs. The update is effective during interim and annual periods beginning after December 15, 2011 and will result in additional disclosure for transfers between levels as well as expanded disclosure for securities categorized as Level 3 under the fair value hierarchy.
In December 2011, the Financial Accounting Standards Board issued Accounting Standard Update No. 2011-11, Disclosures about Offsetting Assets and Liabilities. The update creates new disclosure requirements requiring entities to disclose both gross and net information for derivatives and other financial instruments that are either offset in the Statement of Assets and Liabilities or subject to an enforceable master netting arrangement or similar agreement. The disclosure requirements are effective for annual reporting periods beginning on or after January 1, 2013. Management is currently evaluating the impact of the update's adoption on the Fund's financial statement disclosures.
Foreign Currency. The Fund may use foreign currency contracts to facilitate transactions in foreign-denominated securities. Gains and losses from these transactions may arise from changes in the value of the foreign currency or if the counterparties do not perform under the contracts' terms.
Foreign-denominated assets, including investment securities, and liabilities are translated into U.S. dollars at the exchange rate at period end. Purchases and sales of investment securities, income and dividends received and expenses denominated in foreign currencies are translated into U.S. dollars at the exchange rate in effect on the transaction date.
The effects of exchange rate fluctuations on investments are included with the net realized and unrealized gain (loss) on investment securities. Other foreign currency transactions resulting in realized and unrealized gain (loss) are disclosed separately.
Investment Transactions and Income. For financial reporting purposes, the Fund's investment holdings and NAV include trades executed through the end of the last business day of the period. The NAV per share for processing shareholder transactions is calculated as of the close of business of the New York Stock Exchange (NYSE), normally 4:00 p.m. Eastern time and includes trades executed through the end of the prior business day. Gains and losses on securities sold are determined on the basis of identified cost. Dividend income is recorded on the ex-dividend date, except for certain dividends from foreign securities where the ex-dividend date may have passed, which are recorded as soon as the Fund is informed of the ex-dividend date. Non-cash dividends included in dividend income, if any, are recorded at the fair market value of the securities received. Distributions received on securities that represent a return of capital or capital gain are recorded as a reduction of cost of investments and/or as a realized gain. The Fund estimates the components of distributions received that may be considered return of capital distributions or capital gain distributions. Interest income and distributions from the Fidelity Central Funds are accrued as earned. Investment income is recorded net of foreign taxes withheld where recovery of such taxes is uncertain.
Expenses. Expenses directly attributable to a fund are charged to that fund. Expenses attributable to more than one fund are allocated among the respective funds on the basis of relative net assets or other appropriate methods. Expense estimates are accrued in the period to which they relate and adjustments are made when actual amounts are known.
Income Tax Information and Distributions to Shareholders. Each year, the Fund intends to qualify as a regulated investment company, including distributing substantially all of its taxable income and realized gains under Subchapter M of the Internal Revenue Code. As a result, no provision for income taxes is required. As of December 31, 2011, the Fund did not have any unrecognized tax benefits in the financial statements; nor is the Fund aware of any tax positions for which it is reasonably possible that the total amounts of unrecognized tax benefits will significantly change in the next twelve months. The Fund files a U.S. federal tax return, in addition to state and local tax returns as required. A fund's tax returns are subject to examination by the Internal Revenue Service (IRS) for a period of three fiscal years. State and local tax returns may be subject to examination for an additional fiscal year depending on the jurisdiction. Foreign taxes are provided for based on the Fund's understanding of the tax rules and rates that exist in the foreign markets in which it invests.
Distributions are declared and recorded on the ex-dividend date. Income dividends and capital gain distributions are declared separately for each class. Income and capital gain distributions are determined in accordance with income tax regulations, which may differ from GAAP.
Capital accounts within the financial statements are adjusted for permanent book-tax differences. These adjustments have no impact on net assets or the results of operations. Temporary book-tax differences will reverse in a subsequent period.
Annual Report
Notes to Financial Statements - continued
3. Significant Accounting Policies - continued
Income Tax Information and Distributions to Shareholders - continued
Book-tax differences are primarily due to foreign currency transactions, passive foreign investment companies (PFIC), capital loss carryforwards and losses deferred due to wash sales and excise tax regulations.
The federal tax cost of investment securities and unrealized appreciation (depreciation) as of period end were as follows:
Gross unrealized appreciation | $ 9,179,491 |
Gross unrealized depreciation | (6,246,389) |
Net unrealized appreciation (depreciation) on securities and other investments | $ 2,933,102 |
| |
Tax Cost | $ 89,748,498 |
The tax-based components of distributable earnings as of period end were as follows:
Capital loss carryforward | $ (6,559,382) |
Net unrealized appreciation (depreciation) | $ 2,931,090 |
Capital loss carryforwards are only available to offset future capital gains of the Fund to the extent provided by regulations and may be limited. Under the Regulated Investment Company Modernization Act of 2010 (the Act), the Fund is permitted to carry forward capital losses incurred in taxable years beginning after December 22, 2010 for an unlimited period and such capital losses are required to be used prior to any losses that expire. Capital loss carryforwards were as follows:
Fiscal year of expiration | |
2016 | $ (773,916) |
2017 | (2,824,257) |
Total with expiration | (3,598,173) |
No expiration | |
Short-term | (2,961,209) |
Total capital loss carryforward | $ (6,559,382) |
The tax character of distributions paid was as follows:
| December 31, 2011 | December 31, 2010 |
Ordinary Income | $ 988,101 | $ 1,219,097 |
Trading (Redemption) Fees. Initial Class R shares, Service Class 2 R shares and Investor Class R shares held by investors less than 60 days are subject to a redemption fee equal to 1% of the net asset value of shares redeemed. All redemption fees, which reduce the proceeds of the shareholder redemption, are retained by the Fund and accounted for as an addition to paid in capital.
4. Operating Policies.
Delayed Delivery Transactions and When-Issued Securities. During the period, the Fund transacted in securities on a delayed delivery or when-issued basis. Payment and delivery may take place after the customary settlement period for that security. The price of the underlying securities and the date when the securities will be delivered and paid for are fixed at the time the transaction is negotiated. During the time a delayed delivery sell is outstanding, the contract is marked-to-market daily and equivalent deliverable securities are held for the transaction. The securities purchased on a delayed delivery or when-issued basis are identified as such in the Fund's Schedule of Investments. The Fund may receive compensation for interest forgone in the purchase of a delayed delivery or when-issued security. With respect to purchase commitments, the Fund identifies securities as segregated in its records with a value at least equal to the amount of the commitment. Losses may arise due to changes in the value of the underlying securities or if the counterparty does not perform under the contract's terms, or if the issuer does not issue the securities due to political, economic, or other factors.
Restricted Securities. The Fund may invest in securities that are subject to legal or contractual restrictions on resale. These securities generally may be resold in transactions exempt from registration or to the public if the securities are registered. Disposal of these securities may involve time-consuming negotiations and expense, and prompt sale at an acceptable price may be difficult. Information regarding restricted securities is included at the end of the Fund's Schedule of Investments.
Annual Report
5. Purchases and Sales of Investments.
Purchases and sales of securities, other than short-term securities, aggregated $148,384,254 and $141,485,562, respectively.
6. Fees and Other Transactions with Affiliates.
Management Fee. FMR and its affiliates provide the Fund with investment management related services for which the Fund pays a monthly management fee. The management fee is the sum of an individual fund fee rate that is based on an annual rate of .55% of the Fund's average net assets and an annualized group fee rate that averaged .26% during the period. The group fee rate is based upon the average net assets of all the mutual funds advised by FMR. The group fee rate decreases as assets under management increase and increases as assets under management decrease. For the period, the total annual management fee rate was .81% of the Fund's average net assets.
Distribution and Service Plan Fees. In accordance with Rule 12b-1 of the 1940 Act, the Fund has adopted separate 12b-1 Plans for each Service Class of shares. Each Service Class pays Fidelity Distributors Corporation (FDC), an affiliate of FMR, a service fee. For the period, the service fee is based on an annual rate of .10% of Service Class' average net assets and .25% of Service Class 2's and Service Class 2R's average net assets.
For the period, total fees, all of which were re-allowed to insurance companies for the distribution of shares and providing shareholder support services were as follows:
Service Class | $ 88 |
Service Class 2 | 4,647 |
Service Class 2 R | 224 |
| $ 4,959 |
Transfer Agent Fees. Fidelity Investments Institutional Operations Company, Inc. (FIIOC), an affiliate of FMR, is the Fund's transfer, dividend disbursing, and shareholder servicing agent. FIIOC receives an asset-based fee with respect to each class. Each class (with the exception of Investor Class R) pays a transfer agent fee, excluding out of pocket expenses, equal to an annual rate of .07% of average net assets. Investor Class R pays a monthly asset-based transfer agent fee of .15% of average net assets. In addition, FIIOC receives an asset-based fee of .0045% of average net assets for typesetting, printing and mailing of shareholder reports, except proxy statements. FIIOC voluntarily agreed to waive this fee for the period August 1, 2011 through December 31, 2011 (see Expense Reductions note). For the period, transfer agent fees for each class, including printing and out of pocket expenses, were as follows:
Initial Class | $ 19,747 |
Service Class | 78 |
Service Class 2 | 1,356 |
Initial Class R | 17,225 |
Service Class 2R | 78 |
Investor Class R | 78,469 |
| $ 116,953 |
Accounting and Security Lending Fees. Fidelity Service Company, Inc. (FSC), an affiliate of FMR, maintains the Fund's accounting records. The accounting fee is based on the level of average net assets for the month. Under a separate contract, FSC administers the security lending program. The security lending fee is based on the number and duration of lending transactions.
Brokerage Commissions. The Fund placed a portion of its portfolio transactions with brokerage firms which are affiliates of the investment adviser. The commissions paid to these affiliated firms were $36 for the period.
7. Committed Line of Credit.
The Fund participates with other funds managed by FMR or an affiliate in a $4.0 billion credit facility (the "line of credit") to be utilized for temporary or emergency purposes to fund shareholder redemptions or for other short-term liquidity purposes. The Fund has agreed to pay commitment fees on its pro-rata portion of the line of credit, which amounted to $297 and is reflected in Miscellaneous expenses on the Statement of Operations. During the period, there were no borrowings on this line of credit.
Annual Report
Notes to Financial Statements - continued
8. Security Lending.
The Fund lends portfolio securities through a lending agent from time to time in order to earn additional income. For equity securities, a lending agent is used and may loan securities to certain qualified borrowers, including Fidelity Capital Markets (FCM), a broker-dealer affiliated with the Fund. On the settlement date of the loan, the Fund receives collateral (in the form of U.S. Treasury obligations, letters of credit and/or cash) against the loaned securities and maintains collateral in an amount not less than 100% of the market value of the loaned securities during the period of the loan. The market value of the loaned securities is determined at the close of business of the Fund and any additional required collateral is delivered to the Fund on the next business day. If the borrower defaults on its obligation to return the securities loaned because of insolvency or other reasons, a fund could experience delays and costs in recovering the securities loaned or in gaining access to the collateral. Any cash collateral received is invested in the Fidelity Securities Lending Cash Central Fund. The value of loaned securities and cash collateral at period end are disclosed on the Fund's Statement of Assets and Liabilities. Security lending income represents the income earned on investing cash collateral, less rebates paid to borrowers and any lending agent fees associated with the loan, plus any premium payments received for lending certain types of securities. Security lending income is presented in the Statement of Operations as a component of income from Fidelity Central Funds. Total security lending income during the period amounted to $11,200. During the period, there were no securities loaned to FCM.
9. Expense Reductions.
In addition to FIIOC waiving a portion of its transfer agent fees, FMR voluntarily agreed to reimburse each class to the extent annual operating expenses exceeded certain levels of average net assets as noted in the table below. Some expenses, for example interest expense, including commitment fees, are excluded from this reimbursement.
Expenses were reimbursed and/or waived for the following classes during the period:
| Expense
Limitations | Reimbursement/Waiver |
Initial Class | 1.10% | $ 47,545 |
Service Class | 1.20% | 180 |
Service Class 2 | 1.35% | 3,583 |
Initial Class R | 1.10% | 42,656 |
Service Class 2R | 1.35% | 182 |
Investor Class R | 1.18% | 96,764 |
| | $ 190,910 |
Many of the brokers with whom FMR places trades on behalf of the Fund provided services to the Fund in addition to trade execution. These services included payments of certain expenses on behalf of the Fund totaling $76,395 for the period.
10. Distributions to Shareholders.
Distributions to shareholders of each class were as follows:
Years ended December 31, | 2011 | 2010 |
From net investment income | | |
Initial Class | $ 323,395 | $ 147,657 |
Service Class | 711 | 719 |
Service Class 2 | 19,808 | 8,901 |
Initial Class R | 168,093 | 247,442 |
Service Class 2R | 570 | 565 |
Investor Class R | 475,524 | 433,723 |
Total | $ 988,101 | $ 839,007 |
From net realized gain | | |
Initial Class | $ - | $ 62,064 |
Service Class | - | 383 |
Service Class 2 | - | 4,185 |
Initial Class R | - | 115,662 |
Service Class 2R | - | 382 |
Investor Class R | - | 197,414 |
Total | $ - | $ 380,090 |
Annual Report
11. Share Transactions.
Transactions for each class of shares were as follows:
| Shares | Dollars |
Years ended December 31, | 2011 | 2010 | 2011 | 2010 |
Initial Class | | | | |
Shares sold | 2,281,553 | 1,907,445 | $ 20,021,746 | $ 16,225,751 |
Reinvestment of distributions | 42,329 | 21,780 | 323,395 | 209,721 |
Shares redeemed | (378,716) | (94,931) | (3,524,273) | (856,392) |
Net increase (decrease) | 1,945,166 | 1,834,294 | $ 16,820,868 | $ 15,579,080 |
Service Class | | | | |
Shares sold | - | - | $ - | $ - |
Reinvestment of distributions | 93 | 115 | 711 | 1,102 |
Shares redeemed | (998) | (3,650) | (9,971) | (31,523) |
Net increase (decrease) | (905) | (3,535) | $ (9,260) | $ (30,421) |
Service Class 2 | | | | |
Shares sold | 202,365 | 137,437 | $ 1,850,575 | $ 1,250,469 |
Reinvestment of distributions | 2,586 | 1,356 | 19,808 | 13,086 |
Shares redeemed | (50,852) | (16,991) | (469,379) | (155,917) |
Net increase (decrease) | 154,099 | 121,802 | $ 1,401,004 | $ 1,107,638 |
Initial Class R | | | | |
Shares sold | 604,766 | 1,547,303 | $ 5,608,309 | $ 14,204,050 |
Reinvestment of distributions | 22,002 | 38,007 | 168,093 | 363,104 |
Shares redeemed | (1,796,502) | (2,173,155) | (16,850,822) | (18,591,867) |
Net increase (decrease) | (1,169,734) | (587,845) | $ (11,074,420) | $ (4,024,713) |
Service Class 2R | | | | |
Shares sold | - | - | $ - | $ - |
Reinvestment of distributions | 74 | 99 | 570 | 947 |
Shares redeemed | (993) | (3,639) | (9,940) | (31,476) |
Net increase (decrease) | (919) | (3,540) | $ (9,370) | $ (30,529) |
Investor Class R | | | | |
Shares sold | 1,968,383 | 3,120,989 | $ 17,994,709 | $ 27,575,797 |
Reinvestment of distributions | 62,405 | 66,066 | 475,524 | 631,137 |
Shares redeemed | (1,963,640) | (2,534,983) | (18,116,637) | (21,477,649) |
Net increase (decrease) | 67,148 | 652,072 | $ 353,596 | $ 6,729,285 |
12. Other.
The Fund's organizational documents provide former and current trustees and officers with a limited indemnification against liabilities arising in connection with the performance of their duties to the Fund. In the normal course of business, the Fund may also enter into contracts that provide general indemnifications. The Fund's maximum exposure under these arrangements is unknown as this would be dependent on future claims that may be made against the Fund. The risk of material loss from such claims is considered remote.
At the end of the period, VIP Freedom 2020 Portfolio was the owner of record of approximately 17% of the total outstanding shares of the Fund. The VIP Freedom Funds, VIP Freedom Lifetime Income Funds and VIP Investor Freedom Funds were the owners of record, in the aggregate, of approximately 45% of the total outstanding shares of the Fund. FMR or its affiliates were the owners of record of 52% of the total outstanding shares of the Fund.
Annual Report
Report of Independent Registered Public Accounting Firm
To the Trustees of Variable Insurance Products Fund IV and Shareholders of VIP Emerging Markets Portfolio:
We have audited the accompanying statement of assets and liabilities of VIP Emerging Markets Portfolio (the Fund), a fund of Variable Insurance Products Fund IV, including the schedule of investments, as of December 31, 2011, and the related statement of operations for the year then ended, the statement of changes in net assets for each of the two years in the period then ended, and the financial highlights for each of the periods presented. These financial statements and financial highlights are the responsibility of the Fund's management. Our responsibility is to express an opinion on these financial statements and financial highlights based on our audits.
We conducted our audits in accordance with the standards of the Public Company Accounting Oversight Board (United States). Those standards require that we plan and perform the audit to obtain reasonable assurance about whether the financial statements and financial highlights are free of material misstatement. The Fund is not required to have, nor were we engaged to perform, an audit of its internal control over financial reporting. Our audits included consideration of internal control over financial reporting as a basis for designing audit procedures that are appropriate in the circumstances, but not for the purpose of expressing an opinion on the effectiveness of the Fund's internal control over financial reporting. Accordingly, we express no such opinion. An audit also includes examining, on a test basis, evidence supporting the amounts and disclosures in the financial statements, assessing the accounting principles used and significant estimates made by management, as well as evaluating the overall financial statement presentation. Our procedures included confirmation of securities owned as of December 31, 2011, by correspondence with the custodians and brokers; where replies were not received from brokers, we performed other auditing procedures. We believe that our audits provide a reasonable basis for our opinion.
In our opinion, the financial statements and financial highlights referred to above present fairly, in all material respects, the financial position of VIP Emerging Markets Portfolio as of December 31, 2011, the results of its operations for the year then ended, the changes in its net assets for each of the two years in the period then ended, and the financial highlights for each of the periods presented, in conformity with accounting principles generally accepted in the United States of America.
/s/ Deloitte & Touche LLP
DELOITTE & TOUCHE LLP
Boston, Massachusetts
February 15, 2012
Annual Report
The Trustees, Members of the Advisory Board, and executive officers of the trust and fund, as applicable, are listed below. The Board of Trustees governs the fund and is responsible for protecting the interests of shareholders. The Trustees are experienced executives who meet periodically throughout the year to oversee the fund's activities, review contractual arrangements with companies that provide services to the fund, oversee management of the risks associated with such activities and contractual arrangements, and review the fund's performance. Except for James C. Curvey, each of the Trustees oversees 226 funds advised by FMR or an affiliate. Mr. Curvey oversees 429 funds advised by FMR or an affiliate.
The Trustees hold office without limit in time except that (a) any Trustee may resign; (b) any Trustee may be removed by written instrument, signed by at least two-thirds of the number of Trustees prior to such removal; (c) any Trustee who requests to be retired or who has become incapacitated by illness or injury may be retired by written instrument signed by a majority of the other Trustees; and (d) any Trustee may be removed at any special meeting of shareholders by a two-thirds vote of the outstanding voting securities of the trust. Each Trustee who is not an interested person (as defined in the 1940 Act) (Independent Trustee), shall retire not later than the last day of the calendar year in which his or her 75th birthday occurs. The Independent Trustees may waive this mandatory retirement age policy with respect to individual Trustees. The executive officers and Advisory Board Members hold office without limit in time, except that any officer and Advisory Board Member may resign or may be removed by a vote of a majority of the Trustees at any regular meeting or any special meeting of the Trustees. Except as indicated, each individual has held the office shown or other offices in the same company for the past five years.
Experience, Skills, Attributes, and Qualifications of the Fund's Trustees. The Governance and Nominating Committee has adopted a statement of policy that describes the experience, qualifications, attributes, and skills that are necessary and desirable for potential Independent Trustee candidates (Statement of Policy). The Board believes that each Trustee satisfied at the time he or she was initially elected or appointed a Trustee, and continues to satisfy, the standards contemplated by the Statement of Policy. The Governance and Nominating Committee also engages professional search firms to help identify potential Independent Trustee candidates who have the experience, qualifications, attributes, and skills consistent with the Statement of Policy. From time to time, additional criteria based on the composition and skills of the current Independent Trustees, as well as experience or skills that may be appropriate in light of future changes to board composition, business conditions, and regulatory or other developments, have also been considered by the professional search firms and the Governance and Nominating Committee. In addition, the Board takes into account the Trustees' commitment and participation in Board and committee meetings, as well as their leadership of standing and ad hoc committees throughout their tenure.
In determining that a particular Trustee was and continues to be qualified to serve as a Trustee, the Board has considered a variety of criteria, none of which, in isolation, was controlling. The Board believes that, collectively, the Trustees have balanced and diverse experience, qualifications, attributes, and skills, which allow the Board to operate effectively in governing the fund and protecting the interests of shareholders. Information about the specific experience, skills, attributes, and qualifications of each Trustee, which in each case led to the Board's conclusion that the Trustee should serve (or continue to serve) as a trustee of the fund, is provided below.
Board Structure and Oversight Function. James C. Curvey is an interested person (as defined in the 1940 Act) and currently serves as Acting Chairman. The Trustees have determined that an interested Chairman is appropriate and benefits shareholders because an interested Chairman has a personal and professional stake in the quality and continuity of services provided to the fund. Independent Trustees exercise their informed business judgment to appoint an individual of their choosing to serve as Chairman, regardless of whether the Trustee happens to be independent or a member of management. The Independent Trustees have determined that they can act independently and effectively without having an Independent Trustee serve as Chairman and that a key structural component for assuring that they are in a position to do so is for the Independent Trustees to constitute a substantial majority for the Board. The Independent Trustees also regularly meet in executive session. Ned C. Lautenbach serves as Chairman of the Independent Trustees and as such (i) acts as a liaison between the Independent Trustees and management with respect to matters important to the Independent Trustees and (ii) with management prepares agendas for Board meetings.
Fidelity funds are overseen by different Boards of Trustees. The fund's Board oversees Fidelity's equity and high income funds and another Board oversees Fidelity's investment-grade bond, money market, and asset allocation funds. The asset allocation funds may invest in Fidelity funds overseen by the fund's Board. The use of separate Boards, each with its own committee structure, allows the Trustees of each group of Fidelity funds to focus on the unique issues of the funds they oversee, including common research, investment, and operational issues. On occasion, the separate Boards establish joint committees to address issues of overlapping consequences for the Fidelity funds overseen by each Board.
The Trustees operate using a system of committees to facilitate the timely and efficient consideration of all matters of importance to the Trustees, the fund, and fund shareholders and to facilitate compliance with legal and regulatory requirements and oversight of the fund's activities and associated risks. The Board, acting through its committees, has charged FMR and its affiliates with (i) identifying events or circumstances the occurrence of which could have demonstrably adverse effects on the fund's business and/or reputation; (ii) implementing processes and controls to lessen the possibility that such events or circumstances occur or to mitigate the effects of such events or circumstances if they do occur; and (iii) creating and maintaining a system designed to evaluate continuously business and market conditions in order to facilitate the identification and implementation processes described in (i) and (ii) above. Because the day-to-day operations and activities of the fund are carried out by or through FMR, its affiliates and other service providers, the fund's exposure to risks is mitigated but not eliminated by the processes overseen by the Trustees. While each of the Board's committees has responsibility for overseeing different aspects of the fund's activities, oversight is exercised primarily through the Operations, Audit, and Compliance Committees. In addition, the Independent Trustees have worked with FMR to enhance the Board's oversight of investment and financial risks, legal and regulatory risks, technology risks, and operational risks, including the development of additional risk reporting to the Board. For example, a working group comprised of Independent Trustees and FMR has worked and continues to work to review the Fidelity funds' valuation-related activities, reporting and risk management. Appropriate personnel, including but not limited to the fund's Chief Compliance Officer (CCO), FMR's internal auditor, the independent accountants, the fund's Treasurer and portfolio management personnel, make periodic reports to the Board's committees, as appropriate, including an annual review of FMR's risk management program for the Fidelity funds. The responsibilities of each standing committee, including their oversight responsibilities, are described further under "Standing Committees of the Fund's Trustees."
Annual Report
The fund's Statement of Additional Information (SAI) includes more information about the Trustees. To request a free copy, call Fidelity at 1-877-208-0098.
Interested Trustees*:
Correspondence intended for each Trustee who is an interested person may be sent to Fidelity Investments, 82 Devonshire Street, Boston, Massachusetts 02109.
Name, Age; Principal Occupations and Other Relevant Experience+ |
James C. Curvey (76) |
| Year of Election or Appointment: 2007 Mr. Curvey is Trustee and Acting Chairman of the Board of Trustees of certain Trusts. Mr. Curvey also serves as Trustee (2007-present) of other investment companies advised by FMR. Mr. Curvey is a Director of Fidelity Investments Money Management, Inc. (2009-present), Director of Fidelity Research & Analysis Co. (2009-present) and Director of FMR and FMR Co., Inc. (2007-present). Mr. Curvey is also Vice Chairman (2007-present) and Director of FMR LLC. In addition, Mr. Curvey serves as an Overseer for the Boston Symphony Orchestra and a member of the Trustees of Villanova University. Previously, Mr. Curvey was the Vice Chairman (2006-2007) and Director (2000-2007) of FMR Corp. |
Ronald P. O'Hanley (54) |
| Year of Election or Appointment: 2011 Mr. O'Hanley is Director of FMR Co., Inc. (2010-present), Director of Fidelity Investments Money Management, Inc. (2010-present), Director of Fidelity Research & Analysis Company (2010-present), President of Fidelity Asset Management and Corporate Services and a member of Fidelity's Executive Committee (2010-present). Previously, Mr. O'Hanley served as President and Chief Executive Officer of BNY Mellon Asset Management (2007-2010). Mr. O'Hanley also served as Vice Chairman of Bank New York Mellon Corp. and a member of that firm's Executive Committee. Prior to the 2007 merger of The Bank of New York and Mellon Financial Corporation, he was Vice Chairman of Mellon Financial Corporation and President and Chief Executive Officer of Mellon Asset Management. He joined Mellon in February 1997. Mr. O'Hanley currently serves as Chairman of the Boston Public Library Foundation Board of Directors and sits on the Board of Directors of Beth Israel Deaconess Medical Center, the Board of Trustees of the Marine Biological Laboratory and the Advisory Board of the Maxwell School of Citizenship and Public Administration at Syracuse University. Mr. O'Hanley also chairs the Council on Asset Management for the Financial Services Roundtable and is a member of the Board of Directors of Institutional Investor's U.S. Institute. |
* Trustees have been determined to be "Interested Trustees" by virtue of, among other things, their affiliation with the trust or various entities under common control with FMR.
+ The information above includes each Trustee's principal occupation during the last five years and other information relating to the experience, attributes, and skills relevant to each Trustee's qualifications to serve as a Trustee, which led to the conclusion that each Trustee should serve as a Trustee for the fund.
Independent Trustees:
Correspondence intended for each Independent Trustee (that is, the Trustees other than the Interested Trustees) may be sent to Fidelity Investments, P.O. Box 55235, Boston, Massachusetts 02205-5235.
Name, Age; Principal Occupations and Other Relevant Experience+ |
Dennis J. Dirks (63) |
| Year of Election or Appointment: 2005 Prior to his retirement in May 2003, Mr. Dirks was Chief Operating Officer and a member of the Board of The Depository Trust & Clearing Corporation (DTCC). He also served as President, Chief Operating Officer, and Board member of The Depository Trust Company (DTC) and President and Board member of the National Securities Clearing Corporation (NSCC). In addition, Mr. Dirks served as Chief Executive Officer and Board member of the Government Securities Clearing Corporation, Chief Executive Officer and Board member of the Mortgage-Backed Securities Clearing Corporation, as a Trustee and a member of the Finance Committee of Manhattan College (2005-2008), and as a Trustee and a member of the Finance Committee of AHRC of Nassau County (2006-2008). Mr. Dirks is a member of the Independent Directors Council (IDC) Governing Council (2010-present) and Board of Directors for The Brookville Center for Children's Services, Inc. (2009-present). |
Alan J. Lacy (58) |
| Year of Election or Appointment: 2008 Mr. Lacy serves as Senior Adviser (2007-present) of Oak Hill Capital Partners, L.P. (private equity). Mr. Lacy also served as Chief Executive Officer (2000-2005) and Vice Chairman (2005-2006) of Sears Holdings Corporation and Sears, Roebuck and Co. (retail). In addition, Mr. Lacy serves as a member of the Board of Directors of Dave & Buster's, Inc. (restaurant and entertainment complexes, 2010-present), The Hillman Companies, Inc. (hardware wholesalers, 2010-present), and Bristol-Myers Squibb Company (global pharmaceuticals, 2007-present). Mr. Lacy is a member of the Board of Trustees of The National Parks Conservation Association (2006-present). Previously, Mr. Lacy served as Chairman of the Board of Trustees of the National Parks Conservation Association (2008-2011) and as a member of the Board of Directors for the Western Union Company (global money transfer, 2006-2011). |
Ned C. Lautenbach (67) |
| Year of Election or Appointment: 2000 Mr. Lautenbach is Chairman of the Independent Trustees of the Equity and High Income Funds (2006-present). Mr. Lautenbach currently serves as the Lead Director of the Eaton Corporation Board of Directors (diversified industrial, 1997-present). Mr. Lautenbach is also a member of the Board of Directors of the Philharmonic Center for the Arts in Naples, Florida (1999-present); a member of the Board of Trustees of Fairfield University (2005-present); and a member of the Council on Foreign Relations (1994-present). Previously, Mr. Lautenbach was a Partner/Advisory Partner at Clayton, Dubilier & Rice, LLC (private equity investment, 1998-2010), as well as a Director of Sony Corporation (2006-2007). |
Joseph Mauriello (67) |
| Year of Election or Appointment: 2008 Prior to his retirement in January 2006, Mr. Mauriello served in numerous senior management positions including Deputy Chairman and Chief Operating Officer (2004-2005), and Vice Chairman of Financial Services (2002-2004) of KPMG LLP US (professional services, 1965-2005). Mr. Mauriello currently serves as a member of the Board of Directors of XL Group plc. (global insurance and re-insurance, 2006-present) and of Arcadia Resources Inc. (health care services and products, 2007-present). Previously, Mr. Mauriello served as a Director of the Hamilton Funds of the Bank of New York (2006-2007). |
Robert W. Selander (61) |
| Year of Election or Appointment: 2011 Previously, Mr. Selander served as a Member of the Advisory Board of Fidelity's Equity and High Income Funds (2011), Executive Vice Chairman (2010), Chief Executive Officer (2009-2010), and President and Chief Executive Officer (1997-2009) of Mastercard, Inc. |
Cornelia M. Small (67) |
| Year of Election or Appointment: 2005 Ms. Small is a member of the Board of Directors of the Teagle Foundation (2009-present). Ms. Small is also a member of the Investment Committee, and Chair (2008-present) and a member of the Board of Trustees of Smith College. In addition, Ms. Small serves on the Investment Committee of the Berkshire Taconic Community Foundation (2008-present). Previously, Ms. Small served as Chairperson of the Investment Committee (2002-2008) of Smith College. In addition, Ms. Small served as Chief Investment Officer, Director of Global Equity Investments, and a member of the Board of Directors of Scudder, Stevens & Clark and Scudder Kemper Investments. |
William S. Stavropoulos (72) |
| Year of Election or Appointment: 2001 Mr. Stavropoulos is Vice Chairman of the Independent Trustees of the Equity and High Income Funds (2006-present). Mr. Stavropoulos serves as President and Founder of the Michigan Baseball Foundation, the Great Lakes Loons (2007-present). Mr. Stavropoulos is Chairman Emeritus of the Board of Directors of The Dow Chemical Company, where he previously served in numerous senior management positions, including President, CEO (1995-2000; 2002-2004), Chairman of the Executive Committee (2000-2006), and as a member of the Board of Directors (1990-2006). Currently, Mr. Stavropoulos is Chairman of Univar (global distributor of commodity and specialty chemicals, 2010-present), a Director of Teradata Corporation (data warehousing and technology solutions, 2008-present), Chemical Financial Corporation, Maersk Inc. (industrial conglomerate), Tyco International, Inc. (multinational manufacturing and services, 2007-present), and a member of the Advisory Board for Metalmark Capital (private equity investment, 2005-present). Mr. Stavropoulos is a special advisor to Clayton, Dubilier & Rice, LLC (private equity investment). In addition, Mr. Stavropoulos is a member of the University of Notre Dame Advisory Council for the College of Science. |
David M. Thomas (62) |
| Year of Election or Appointment: 2008 Previously, Mr. Thomas served as Executive Chairman (2005-2006) and Chairman and Chief Executive Officer (2000-2005) of IMS Health, Inc. (pharmaceutical and healthcare information solutions). In addition, Mr. Thomas serves as a member of the Board of Directors of Fortune Brands, Inc. (consumer products), and Interpublic Group of Companies, Inc. (marketing communication, 2004-present). |
Michael E. Wiley (61) |
| Year of Election or Appointment: 2008 Mr. Wiley also serves as a Director of Asia Pacific Exploration Consolidated (international oil and gas exploration and production, 2008-present). Mr. Wiley serves as a Director of Tesoro Corporation (independent oil refiner and marketer, 2005-present), and a Director of Bill Barrett Corporation (exploration and production, 2005-present). In addition, Mr. Wiley also serves as a Director of Post Oak Bank (privately-held bank, 2004-present). Previously, Mr. Wiley served as a member of the Board of Trustees of the University of Tulsa (2000-2006; 2007-2010), as a Senior Energy Advisor of Katzenbach Partners, LLC (consulting, 2006-2007), as an Advisory Director of Riverstone Holdings (private investment), Chairman, President, and CEO of Baker Hughes, Inc. (oilfield services, 2000-2004), and as Director of Spinnaker Exploration Company (exploration and production, 2001-2005). |
+ The information above includes each Trustee's principal occupation during the last five years and other information relating to the experience, attributes, and skills relevant to each Trustee's qualifications to serve as a Trustee, which led to the conclusion that each Trustee should serve as a Trustee for the fund.
Advisory Board Members and Executive Officers:
Correspondence intended for each executive officer, Edward C. Johnson 3d, and Peter S. Lynch may be sent to Fidelity Investments, 82 Devonshire Street, Boston, Massachusetts 02109.
Name, Age; Principal Occupation |
Edward C. Johnson 3d (81) |
| Year of Election or Appointment: 2011 Member of the Advisory Board of Fidelity's Equity and High Income Funds. Mr. Johnson serves as Chief Executive Officer, Chairman, and a Director of FMR LLC, and also serves as Chairman and Director of FIL Limited. Previously, Mr. Johnson served as a Trustee and Chairman of the Board of certain Fidelity Trusts, Chairman and a Director of FMR, Chairman and a Director of FMR Co., Inc., and President of FMR LLC (2006-2007). |
Peter S. Lynch (67) |
| Year of Election or Appointment: 2003 Member of the Advisory Board of Fidelity's Equity and High Income Funds. Mr. Lynch is Vice Chairman and a Director of FMR and FMR Co., Inc. In addition, Mr. Lynch serves as a Trustee of Boston College and as the Chairman of the Inner-City Scholarship Fund. Previously, Mr. Lynch served on the Special Olympics International Board of Directors (1997-2006). |
Kenneth B. Robins (42) |
| Year of Election or Appointment: 2008 President and Treasurer of Fidelity's Equity and High Income Funds. Mr. Robins also serves as President and Treasurer (2010-present) and Assistant Treasurer (2009-present) of other Fidelity funds and is an employee of Fidelity Investments (2004-present). Previously, Mr. Robins served as Deputy Treasurer of the Fidelity funds (2005-2008) and Treasurer and Chief Financial Officer of The North Carolina Capital Management Trust: Cash and Term Portfolios (2006-2008). |
Bruce T. Herring (46) |
| Year of Election or Appointment: 2006 Vice President of certain Equity Funds. Mr. Herring also serves as President of Fidelity Research & Analysis Company (2010-present), Chief Investment Officer and Director of Fidelity Management & Research (U.K.) Inc. (2010-present) and Group Chief Investment Officer of FMR. Previously, Mr. Herring served as Vice President (2005-2006) and Senior Vice President (2006-2007) of Fidelity Management & Research Company, Vice President of FMR Co., Inc. (2001-2007) and as a portfolio manager for Fidelity U.S. Equity Funds. |
Brian B. Hogan (47) |
| Year of Election or Appointment: 2009 Vice President of Equity and High Income Funds. Mr. Hogan also serves as President of FMR's Equity Division (2009-present). Previously, Mr. Hogan served as Senior Vice President, Equity Research of FMR (2006-2009) and as a portfolio manager. |
Scott C. Goebel (43) |
| Year of Election or Appointment: 2008 Secretary and Chief Legal Officer (CLO) of the Fidelity funds. Mr. Goebel also serves as Secretary of Fidelity Investments Money Management, Inc. (FIMM) (2010-present) and Fidelity Research and Analysis Company (FRAC) (2010-present); Secretary and CLO of The North Carolina Capital Management Trust: Cash and Term Portfolios (2008-present); General Counsel, Secretary, and Senior Vice President of FMR (2008-present) and FMR Co., Inc. (2008-present); employed by FMR LLC or an affiliate (2001-present); Chief Legal Officer of Fidelity Management & Research (Hong Kong) Limited (2008-present) and Assistant Secretary of Fidelity Management & Research (Japan) Inc. (2008-present), and Fidelity Management & Research (U.K.) Inc. (2008-present). Previously, Mr. Goebel served as Assistant Secretary of FIMM (2008-2010), FRAC (2008-2010), and the Funds (2007-2008) and as Vice President and Secretary of Fidelity Distributors Corporation (FDC) (2005-2007). |
William C. Coffey (42) |
| Year of Election or Appointment: 2009 Assistant Secretary of Fidelity's Equity and High Income Funds. Mr. Coffey also serves as Senior Vice President and Deputy General Counsel of FMR LLC (2010-present), and is an employee of Fidelity Investments. Previously, Mr. Coffey served as Vice President and Associate General Counsel of FMR LLC (2005-2009). |
Holly C. Laurent (57) |
| Year of Election or Appointment: 2008 Anti-Money Laundering (AML) Officer of the Fidelity funds. Ms. Laurent also serves as AML Officer of The North Carolina Capital Management Trust: Cash and Term Portfolios (2008-present) and is an employee of Fidelity Investments. Previously, Ms. Laurent was Senior Vice President and Head of Legal for Fidelity Business Services India Pvt. Ltd. (2006-2008), and Senior Vice President, Deputy General Counsel and Group Head for FMR LLC (2005-2006). |
Christine Reynolds (53) |
| Year of Election or Appointment: 2008 Chief Financial Officer of the Fidelity funds. Ms. Reynolds became President of Fidelity Pricing and Cash Management Services (FPCMS) in August 2008. Ms. Reynolds served as Chief Operating Officer of FPCMS (2007-2008). Previously, Ms. Reynolds served as President, Treasurer, and Anti-Money Laundering officer of the Fidelity funds (2004-2007). |
Kenneth A. Rathgeber (64) |
| Year of Election or Appointment: 2004 Chief Compliance Officer of Fidelity's Equity and High Income Funds. Mr. Rathgeber is Chief Compliance Officer of Fidelity Management & Research (Hong Kong) Limited (2008-present), Fidelity Management & Research (Japan) Inc. (2008-present), FMR (2005-present), FMR Co., Inc. (2005-present), Fidelity Management & Research (U.K.) Inc. (2005-present), Fidelity Research & Analysis Company (2005-present), Fidelity Investments Money Management, Inc. (2005-present), Pyramis Global Advisors, LLC (2005-present), and Strategic Advisers, Inc. (2005-present). |
Jeffrey S. Christian (50) |
| Year of Election or Appointment: 2009 Deputy Treasurer of the Fidelity funds. Mr. Christian is an employee of Fidelity Investments. Previously, Mr. Christian served as Chief Financial Officer (2008-2009) of certain Fidelity funds and Senior Vice President of Fidelity Pricing and Cash Management Services (FPCMS) (2004-2009). |
Joseph F. Zambello (54) |
| Year of Election or Appointment: 2011 Deputy Treasurer of the Fidelity funds. Mr. Zambello is an employee of Fidelity Investments. Previously, Mr. Zambello served as Vice President of FMR's Program Management Group (2009-2011) and Vice President of the Transfer Agent Oversight Group (2005-2009). |
Adrien E. Deberghes (44) |
| Year of Election or Appointment: 2008 Deputy Treasurer of Fidelity's Equity and High Income Funds. Mr. Deberghes also serves as Vice President and Assistant Treasurer of Fidelity Rutland Square Trust II and Fidelity Commonwealth Trust II (2011-present), Assistant Treasurer of other Fidelity funds (2010-present), and is an employee of Fidelity Investments (2008-present). Previously, Mr. Deberghes served as Senior Vice President of Mutual Fund Administration at State Street Corporation (2007-2008), Senior Director of Mutual Fund Administration at Investors Bank & Trust (2005-2007), and Director of Finance for Dunkin' Brands (2000-2005). |
Stephanie J. Dorsey (42) |
| Year of Election or Appointment: 2010 Assistant Treasurer of Fidelity's Equity and High Income Funds. Ms. Dorsey also serves as Deputy Treasurer of other Fidelity funds (2008-present) and is an employee of Fidelity Investments (2008-present). Previously, Ms. Dorsey served as Treasurer (2004-2008) of the JPMorgan Mutual Funds and Vice President (2004-2008) of JPMorgan Chase Bank. |
John R. Hebble (53) |
| Year of Election or Appointment: 2009 Assistant Treasurer of Fidelity's Equity and High Income Funds. Mr. Hebble also serves as President (2011-present), Treasurer, and Chief Financial Officer of The North Carolina Capital Management Trust: Cash and Term Portfolios (2008-present), President and Treasurer of other Fidelity funds (2008-present) and is an employee of Fidelity Investments. |
Gary W. Ryan (53) |
| Year of Election or Appointment: 2005 Assistant Treasurer of the Fidelity funds. Mr. Ryan is an employee of Fidelity Investments. Previously, Mr. Ryan served as Vice President of Fund Reporting in Fidelity Pricing and Cash Management Services (FPCMS) (1999-2005). |
Jonathan Davis (43) |
| Year of Election or Appointment: 2010 Assistant Treasurer of the Fidelity funds. Mr. Davis is also Assistant Treasurer of Fidelity Rutland Square Trust II and Fidelity Commonwealth Trust II. Mr. Davis is an employee of Fidelity Investments. Previously, Mr. Davis served as Vice President and Associate General Counsel of FMR LLC (2003-2010). |
Annual Report
Initial Class R designates 1%, Investor Class R designates 1%, and Service Class 2R designates 2% of the dividends distributed during the fiscal year as qualifying for the dividends-received deduction for corporate shareholders.
The amounts per share which represent income derived from sources within, and taxes paid to, foreign countries or possessions of the United States are as follows:
| Pay Date | Income | Taxes |
Initial Class R | 12/16/11 | $0.108 | $0.021 |
Investor Class R | 12/16/11 | $0.108 | $0.021 |
Service Class 2R | 12/16/11 | $0.083 | $0.021 |
Annual Report
Board Approval of Investment Advisory Contracts and Management Fees
VIP Emerging Markets Portfolio
Each year, the Board of Trustees, including the Independent Trustees (together, the Board), votes on the renewal of the management contract and sub-advisory agreements (together, the Advisory Contracts) for the fund. The Board, assisted by the advice of fund counsel and Independent Trustees' counsel, requests and considers a broad range of information relevant to the renewal of the Advisory Contracts throughout the year.
The Board meets regularly and considers at each of its meetings factors that are relevant to its annual consideration of the renewal of the fund's Advisory Contracts, including the services and support provided to the fund and its shareholders. The Board has established various standing committees, each composed of Independent Trustees with varying backgrounds, to which the Board has assigned specific subject matter responsibilities in order to enhance effective decision-making by the Board. The Board, acting directly and through its Committees, requests and receives information concerning the annual consideration of the renewal of the fund's Advisory Contracts. The Board also meets as needed to consider matters specifically related to the Board's annual consideration of the renewal of Advisory Contracts. Members of the Board may also meet with trustees of other Fidelity funds through ad hoc joint committees to discuss certain matters relevant to the Fidelity funds.
At its July 2011 meeting, the Board of Trustees, including the Independent Trustees, unanimously determined to renew the fund's Advisory Contracts. In reaching its determination, the Board considered all factors it believed relevant, including (i) the nature, extent, and quality of the services to be provided to the fund and its shareholders (including the investment performance of the fund); (ii) the competitiveness of the fund's management fee and total expense ratio; (iii) the total costs of the services to be provided by and the profits to be realized by Fidelity from its relationship with the fund; (iv) the extent to which economies of scale would be realized as the fund grows; and (v) whether fee levels reflect these economies of scale, if any, for the benefit of fund shareholders.
In considering whether to renew the Advisory Contracts for the fund, the Board reached a determination, with the assistance of fund counsel and Independent Trustees' counsel and through the exercise of its business judgment, that the renewal of the Advisory Contracts is in the best interests of the fund and its shareholders and that the compensation payable under the Advisory Contracts is fair and reasonable. The Board's decision to renew the Advisory Contracts was not based on any single factor, but rather was based on a comprehensive consideration of all the information provided to the Board at its meetings throughout the year. The Board, in reaching its determination to renew the Advisory Contracts, is aware that shareholders in the fund have a broad range of investment choices available to them, including a wide choice among mutual funds offered by Fidelity's competitors, and that the fund's shareholders, who have the opportunity to review and weigh the disclosure provided by the fund in its prospectus and other public disclosures, have chosen to invest in this fund, managed by Fidelity.
Nature, Extent, and Quality of Services Provided. The Board considered the staffing within the investment adviser, FMR, and the sub-advisers (together, the Investment Advisers), including the backgrounds of the fund's investment personnel and the fund's investment objective and discipline. The Independent Trustees also had discussions with senior management of Fidelity's investment operations and investment groups. The Board considered the structure of the portfolio manager compensation program and whether this structure provides appropriate incentives to act in the best interests of the fund.
Resources Dedicated to Investment Management and Support Services. The Board and the Fund Oversight and Research Committees reviewed the general qualifications and capabilities of the Investment Advisers' investment staff, including its size, education, experience, and resources, as well as the Investment Advisers' approach to recruiting, training, managing, and compensating investment personnel. The Board also noted that FMR has devoted increased resources to non-U.S. offices. The Board noted that Fidelity's analysts have extensive resources, tools and capabilities which allow them to conduct sophisticated quantitative and fundamental analysis, as well as credit analysis of issuers, counterparties and enhancers. The Board also believes that Fidelity's investment professionals have sufficient access to global information and data so as to provide competitive investment results over time, and that those professionals also have access to sophisticated tools which permit them to assess portfolio construction and risk and performance attribution characteristics continuously, as well as to transmit new information and research conclusions rapidly around the world. Additionally, in their deliberations, the Board considered the Investment Advisers' trading capabilities and resources which are an integral part of the investment management process.
Shareholder and Administrative Services. The Board considered (i) the nature, extent, quality, and cost of advisory, administrative, and shareholder services performed by the Investment Advisers and their affiliates under the Advisory Contracts and under separate agreements covering transfer agency, pricing and bookkeeping, and securities lending services for the fund; (ii) the nature and extent of the investment adviser's supervision of third party service providers, principally custodians and subcustodians; and (iii) the resources devoted to, and the record of compliance with, the fund's compliance policies and procedures. The Board also reviewed the allocation of fund brokerage, including allocations to brokers affiliated with the Investment Advisers, the use of brokerage commissions to pay fund expenses, and the use of "soft" commission dollars to pay for research services.
The Board noted that the growth of fund assets over time across the complex allows Fidelity to reinvest in the development of services designed to enhance the value or convenience of the Fidelity funds as investment vehicles. These services include 24-hour access to account information and market information through telephone representatives and over the Internet, investor education materials and asset allocation tools, and the expanded availability of Fidelity Investor Centers, with 35 new branches opening since 2010.
Annual Report
Investment in a Large Fund Family. The Board considered the benefits to shareholders of investing in a Fidelity fund, including the benefits of investing in a fund that is part of a large family of funds offering a variety of investment disciplines and providing a large variety of mutual fund investor services. The Board noted that Fidelity had taken, or had made recommendations that resulted in the Fidelity funds taking, a number of actions over the previous year that benefited particular funds, including (i) continuing to dedicate additional resources to investment research and support of the senior management team that oversees asset management; (ii) rationalizing product lines through the mergers of six funds into other funds; (iii) continuing to migrate the Freedom Funds to dedicated lower cost underlying funds; (iv) obtaining shareholder approval to broaden the investment strategies for Fidelity Consumer Finance Portfolio, Fidelity Emerging Asia Fund, and Fidelity Environment and Alternative Energy Portfolio; (v) contractually agreeing to reduce the management fees and impose other expense limitations on Spartan 500 Index Fund and U.S. Bond Index Fund in connection with launching new institutional classes of these funds; (vi) changing the name, primary and supplemental benchmarks, and investment policies of Fidelity Global Strategies Fund to support the fund's flexible investment mandate and global orientation; and (vii) reducing the transfer agency account fee rates on certain accounts.
Investment Performance. The Board considered whether the fund has operated in accordance with its investment objective, as well as its record of compliance with its investment restrictions. It also reviewed the fund's absolute investment performance for each class, as well as the fund's relative investment performance for each class measured against (i) a broad-based securities market index, and (ii) a peer group of mutual funds deemed appropriate by Fidelity and reviewed by the Board. Because the fund had been in existence less than three calendar years, the following chart considered by the Board shows, for the one-year period ended December 31, 2010, the total returns of Initial Class R and Service Class 2 of the fund, the total return of a broad-based securities market index ("benchmark"), and a range of total returns of a peer group of mutual funds identified by Morningstar, Inc. as having an investment style similar to that of the fund based on underlying portfolio holdings. The returns of Initial Class R and Service Class 2 show the performance of the highest and lowest performing classes, respectively. The box within the chart shows the 25th percentile return (bottom of box) and the 75th percentile return (top of box) of the peer group. Returns shown above the box are in the first quartile and returns shown below the box are in the fourth quartile. The percentage beaten numbers noted below the chart correspond to the percentile box and represent the percentage of funds in the peer group whose performance was equal to or lower than that of the class indicated.
VIP Emerging Markets Portfolio
The Board reviewed the fund's relative investment performance against its peer group and noted that the performance of Initial Class R of the fund was in the third quartile for the period shown. The Board also noted that the investment performance of the fund was lower than its benchmark for the period shown. The Board considered that the variations in performance among the fund's classes reflect the variations in class expenses, which result in lower performance for higher expense classes. The Board also reviewed the fund's performance since inception as well as performance in the current year. The Board noted that it is difficult to evaluate in any comprehensive fashion the performance of the fund, in light of its relatively recent commencement of operations.
Based on its review, the Board concluded that the nature, extent, and quality of services provided to the fund under the Advisory Contracts should benefit the fund's shareholders.
Competitiveness of Management Fee and Total Expense Ratio. The Board considered the fund's management fee and total expense ratio compared to "mapped groups" of competitive funds and classes. Fidelity creates "mapped groups" by combining similar Lipper investment objective categories that have comparable management fee characteristics. Combining Lipper investment objective categories aids the Board's management fee and total expense ratio comparisons by broadening the competitive group used for comparison and by reducing the number of universes to which various Fidelity funds are compared.
Annual Report
Board Approval of Investment Advisory Contracts and Management Fees - continued
Management Fee. The Board considered two proprietary management fee comparisons for the 12-month (or shorter) periods shown in the chart below. The group of Lipper funds used by the Board for management fee comparisons is referred to below as the "Total Mapped Group." The Total Mapped Group comparison focuses on a fund's standing relative to the total universe of comparable funds available to investors in terms of gross management fees before expense reimbursements or caps. "TMG %" represents the percentage of funds in the Total Mapped Group that had management fees that were lower than the fund's. For example, a TMG % of 34% means that 66% of the funds in the Total Mapped Group had higher management fees than the fund. The "Asset-Size Peer Group" (ASPG) comparison focuses on a fund's standing relative to non-Fidelity funds similar in size to the fund within the Total Mapped Group. The ASPG represents at least 15% of the funds in the Total Mapped Group with comparable asset size and management fee characteristics, subject to a minimum of 50 funds (or all funds in the Total Mapped Group if fewer than 50). Additional information, such as the ASPG quartile in which the fund's management fee ranked, is also included in the chart and considered by the Board.
VIP Emerging Markets Portfolio
The Board noted that the fund's management fee ranked below the median of its Total Mapped Group and below the median of its ASPG for 2010.
Based on its review, the Board concluded that the fund's management fee is fair and reasonable in light of the services that the fund receives and the other factors considered.
Total Expense Ratio. In its review of each class's total expense ratio, the Board considered the fund's management fee as well as other fund or class expenses, as applicable, such as transfer agent fees, pricing and bookkeeping fees, fund-paid 12b-1 fees, and custodial, legal, and audit fees. The Board also noted the effects of any waivers and reimbursements on fees and expenses. As part of its review, the Board also considered the current and historical total expense ratios of each class of the fund compared to competitive fund median expenses. Each class of the fund is compared to those funds and classes in the Total Mapped Group (used by the Board for management fee comparisons) that have a similar sales load structure.
The Board noted that the total expense ratio of each of Initial Class and Initial Class R ranked equal to its competitive median for 2010 and the total expense ratio of each of Investor Class R, Service Class, Service Class 2, and Service Class 2 R ranked above its competitive median for 2010. The Board considered that various factors, including 12b-1 fees, positive or negative performance adjustments, and relatively higher other expenses in the case of small fund size, can affect total expense ratios. The Board also noted that Investor Class R has higher transfer agent fees than traditional variable annuity classes because it is designed for lower cost annuity products, where the majority of servicing costs are incorporated into the funds' total expense ratios rather than being paid at the annuity level. The Board noted that the fund offers multiple classes, each of which has a different 12b-1 fee structure, and that the multiple structures are intended to offer a range of pricing options for the intermediary market. The Board also noted that the total expense ratios of the classes vary primarily by the level of their 12b-1 fees, although differences in transfer agent fees may also cause expenses to vary from class to class.
Fees Charged to Other Fidelity Clients. The Board also considered Fidelity fee structures and other information with respect to clients of FMR and its affiliates, such as other mutual funds advised or subadvised by FMR or its affiliates, pension plan clients, and other institutional clients. In March 2010, the Board created an ad hoc joint committee with the board of other Fidelity funds (the Committee) to review and compare Fidelity's institutional investment advisory business with its business of providing services to the Fidelity funds, including the differences in services provided, fees charged, and costs incurred, as well as competition in their respective marketplaces.
Annual Report
Based on its review of total expense ratios and fees charged to other Fidelity clients, the Board concluded that the total expense ratio of each class of the fund was reasonable, although in some cases above the median of the universe presented for comparison, in light of the services that the fund and its shareholders receive and the other factors considered, including the findings of the Committee.
Costs of the Services and Profitability. The Board considered the revenues earned and the expenses incurred by Fidelity in conducting the business of developing, marketing, distributing, managing, administering and servicing the fund and its shareholders. The Board also considered the level of Fidelity's profits in respect of all the Fidelity funds.
On an annual basis, FMR presents to the Board Fidelity's profitability for the fund. Fidelity calculates the profitability for each fund, as well as aggregate profitability for groups of Fidelity funds and all Fidelity funds, using a series of detailed revenue and cost allocation methodologies which originate with the books and records of Fidelity on which Fidelity's audited financial statements are based. The Audit Committee of the Board reviews any significant changes from the prior year's methodologies.
PricewaterhouseCoopers LLP (PwC), independent registered public accounting firm and auditor to Fidelity and certain Fidelity funds, has been engaged annually by the Board as part of the Board's assessment of Fidelity's profitability analysis. PwC's engagement includes the review and assessment of Fidelity's methodologies used in determining the revenues and expenses attributable to Fidelity's mutual fund business, and completion of agreed-upon procedures surrounding the mathematical accuracy of fund profitability and its conformity to allocation methodologies. After considering PwC's reports issued under the engagement and information provided by Fidelity, the Board concluded that while other allocation methods may also be reasonable, Fidelity's profitability methodologies are reasonable in all material respects.
The Board also reviewed Fidelity's non-fund businesses and fall-out benefits related to the mutual fund business as well as cases where Fidelity's affiliates may benefit from or be related to the fund's business.
The Board considered the costs of the services provided by and the profits realized by Fidelity in connection with the operation of the fund and was satisfied that the profitability was not excessive in the circumstances.
Economies of Scale. The Board considered whether there have been economies of scale in respect of the management of the Fidelity funds, whether the Fidelity funds (including the fund) have appropriately benefited from any such economies of scale, and whether there is potential for realization of any further economies of scale. The Board considered the extent to which the fund will benefit from economies of scale through increased services to the fund, through waivers or reimbursements, or through fee or expense reductions. The Board also noted that in 2009, it and the board of other Fidelity funds created an ad hoc committee (the Economies of Scale Committee) to analyze whether FMR attains economies of scale in respect of the management and servicing of the Fidelity funds, whether the Fidelity funds have appropriately benefited from such economies of scale, and whether there is potential for realization of any further economies of scale.
The Board recognized that the fund's management contract incorporates a "group fee" structure, which provides for lower group fee rates as total fund assets under FMR's management increase, and for higher group fee rates as total fund assets under FMR's management decrease. FMR calculates the group fee rates based on a tiered asset "breakpoint" schedule that varies based on asset class. The Board considered that the group fee is designed to deliver the benefits of economies of scale to fund shareholders when total Fidelity fund assets increase, even if assets of any particular fund are unchanged or have declined, because some portion of Fidelity's costs are attributable to services provided to all Fidelity funds, and all funds benefit if those costs can be allocated among more assets. The Board concluded that, given the group fee structure, fund shareholders will benefit from lower management fees as assets under FMR's management increase at the fund complex level, regardless of whether Fidelity achieves any such economies of scale.
The Board concluded, taking into account the analysis of the Economies of Scale Committee, that any potential economies of scale are being appropriately shared between fund shareholders and Fidelity.
Additional Information Requested by the Board. In order to develop fully the factual basis for consideration of the Fidelity funds' Advisory Contracts, the Board requested and received additional information on certain topics, including (i) fund performance trends, actions to be taken by FMR to improve certain funds' overall performance, and Fidelity's long-term strategies for certain funds; (ii) portfolio manager changes that have occurred during the past year and length of portfolio manager tenure for different categories of funds over time; (iii) Fidelity's compensation structure for portfolio managers and other key personnel and strategies for attracting and retaining non-investment personnel; (iv) the amount of the investment that each portfolio manager has made in the Fidelity fund(s) that he or she manages; (v) historical trends in Fidelity's realization of fall-out benefits; (vi) Fidelity's group fee structures and the rationale for the individual fee rates of certain funds; (vii) fund profitability methodology and the impact of certain factors on fund profitability results; (viii) trends regarding industry use of performance fee structures and Fidelity's compliance practices with respect to performance adjustment calculations; (ix) the fee structures in place for certain other Fidelity clients; and (x) explanations regarding the relative total expense ratios of certain funds and classes, total expense competitive trends, and actions that might be taken by FMR to reduce total expense ratios for certain funds and classes.
Annual Report
Board Approval of Investment Advisory Contracts and Management Fees - continued
Based on its evaluation of all of the conclusions noted above, and after considering all factors it believed relevant, the Board ultimately concluded that the advisory fee structures are fair and reasonable, and that the fund's Advisory Contracts should be renewed.
Annual Report
Investment Adviser
Fidelity Management & Research Company
Boston, MA
Investment Sub-Advisers
FMR Co., Inc.
Fidelity Management & Research (U.K.) Inc.
Fidelity Management & Research (Hong Kong) Limited
Fidelity Management & Research (Japan) Inc.
FIL Investment Advisors
FIL Investment Advisors (U.K.) Ltd.
FIL Investments (Japan) Limited
General Distributor
Fidelity Distributors Corporation
Boston, MA
Transfer and Service Agents
Fidelity Investments Institutional Operations Company, Inc.
Boston, MA
Fidelity Service Company, Inc.
Boston, MA
Custodian
State Street Bank and Trust Company
Quincy, MA
VIPEMR-ANN-0212
1.888698.103
Fidelity® Variable Insurance Products:
Energy Portfolio: Service Class 2
Annual Report
December 31, 2011
Contents
Performance | (Click Here) | How the fund has done over time. |
Management's Discussion of Fund Performance | (Click Here) | The Portfolio Manager's review of fund performance and strategy. |
Shareholder Expense Example | (Click Here) | An example of shareholder expenses. |
Investment Changes | (Click Here) | A summary of major shifts in the fund's investments over the past six months. |
Investments | (Click Here) | A complete list of the fund's investments with their market values. |
Financial Statements | (Click Here) | Statements of assets and liabilities, operations, and changes in net assets, as well as financial highlights. |
Notes | (Click Here) | Notes to the financial statements. |
Report of Independent Registered Public Accounting Firm | (Click Here) | |
Trustees and Officers | (Click Here) | |
Distributions | (Click Here) | |
Board Approval of Investment Advisory Contracts and Management Fees | (Click Here) | |
To view a fund's proxy voting guidelines and proxy voting record for the 12-month period ended June 30, visit http://www.fidelity.com/proxyvotingresults or visit the Securities and Exchange Commission's (SEC) web site at http://www.sec.gov. You may also call 1-877-208-0098 to request a free copy of the proxy voting guidelines.
Fidelity Variable Insurance Products are separate account options which are purchased through a variable insurance contract.
Standard & Poor's, S&P and S&P 500 are registered service marks of The McGraw-Hill Companies, Inc. and have been licensed for use by Fidelity Distributors Corporation.
Other third party marks appearing herein are the property of their respective owners.
All other marks appearing herein are registered or unregistered trademarks or service marks of FMR LLC or an affiliated company.
This report and the financial statements contained herein are submitted for the general information of the shareholders of the fund. This report is not authorized for distribution to prospective investors in the fund unless preceded or accompanied by an effective prospectus.
A fund files its complete schedule of portfolio holdings with the SEC for the first and third quarters of each fiscal year on Form N-Q. Forms N-Q are available on the SEC's web site at http://www.sec.gov. A fund's Forms N-Q may be reviewed and copied at the SEC's Public Reference Room in Washington, DC. Information regarding the operation of the SEC's Public Reference Room may be obtained by calling 1-800-SEC-0330. For a complete list of the fund's portfolio holdings, view the most recent holdings listing, semiannual report, or annual report on Fidelity's web site at http://www.fidelity.com, http://www.advisor.fidelity.com, or http://www.401k.com, as applicable.
NOT FDIC INSURED • MAY LOSE VALUE • NO BANK GUARANTEE
Neither the fund nor Fidelity Distributors Corporation is a bank.
Annual Report
Average annual total return reflects the change in the value of an investment, assuming reinvestment of the class' distributions from dividend income and capital gains (the profits earned upon the sale of securities that have grown in value, if any) and assuming a constant rate of performance each year. During periods of reimbursement by Fidelity, a fund's total return will be greater than it would be had the reimbursement not occurred. Performance numbers are net of all underlying fund operating expenses, but do not include any insurance charges imposed by your insurance company's separate account. If performance information included the effect of these additional charges, the total returns would have been lower. How a fund did yesterday is no guarantee of how it will do tomorrow.
Average Annual Total Returns
Periods ended December 31, 2011 | Past 1
year | Past 5
years | Past 10
years |
VIP Energy Portfolio - Service Class 2 A,B | -5.20% | 2.05% | 10.44% |
A Prior to October 1, 2006, VIP Energy Portfolio operated under certain different investment policies. The historical performance for the fund may not represent its current investment policies.
B The initial offering of Service Class 2 shares took place on April 6, 2005. Returns prior to April 6, 2005 are those of Initial Class and do not include the effects of Service Class 2's 12b-1 fee. Had Service Class 2's 12b-1 fee been reflected, returns prior to April 6, 2005 would have been lower.
$10,000 Over 10 Years
Let's say hypothetically that $10,000 was invested in VIP Energy Portfolio - Service Class 2 on December 31, 2001. The chart shows how the value of your investment would have changed, and also shows how the S&P 500® Index performed over the same period. The initial offering of Service Class 2 took place on April 6, 2005. See above for additional information regarding the performance of Service Class 2.
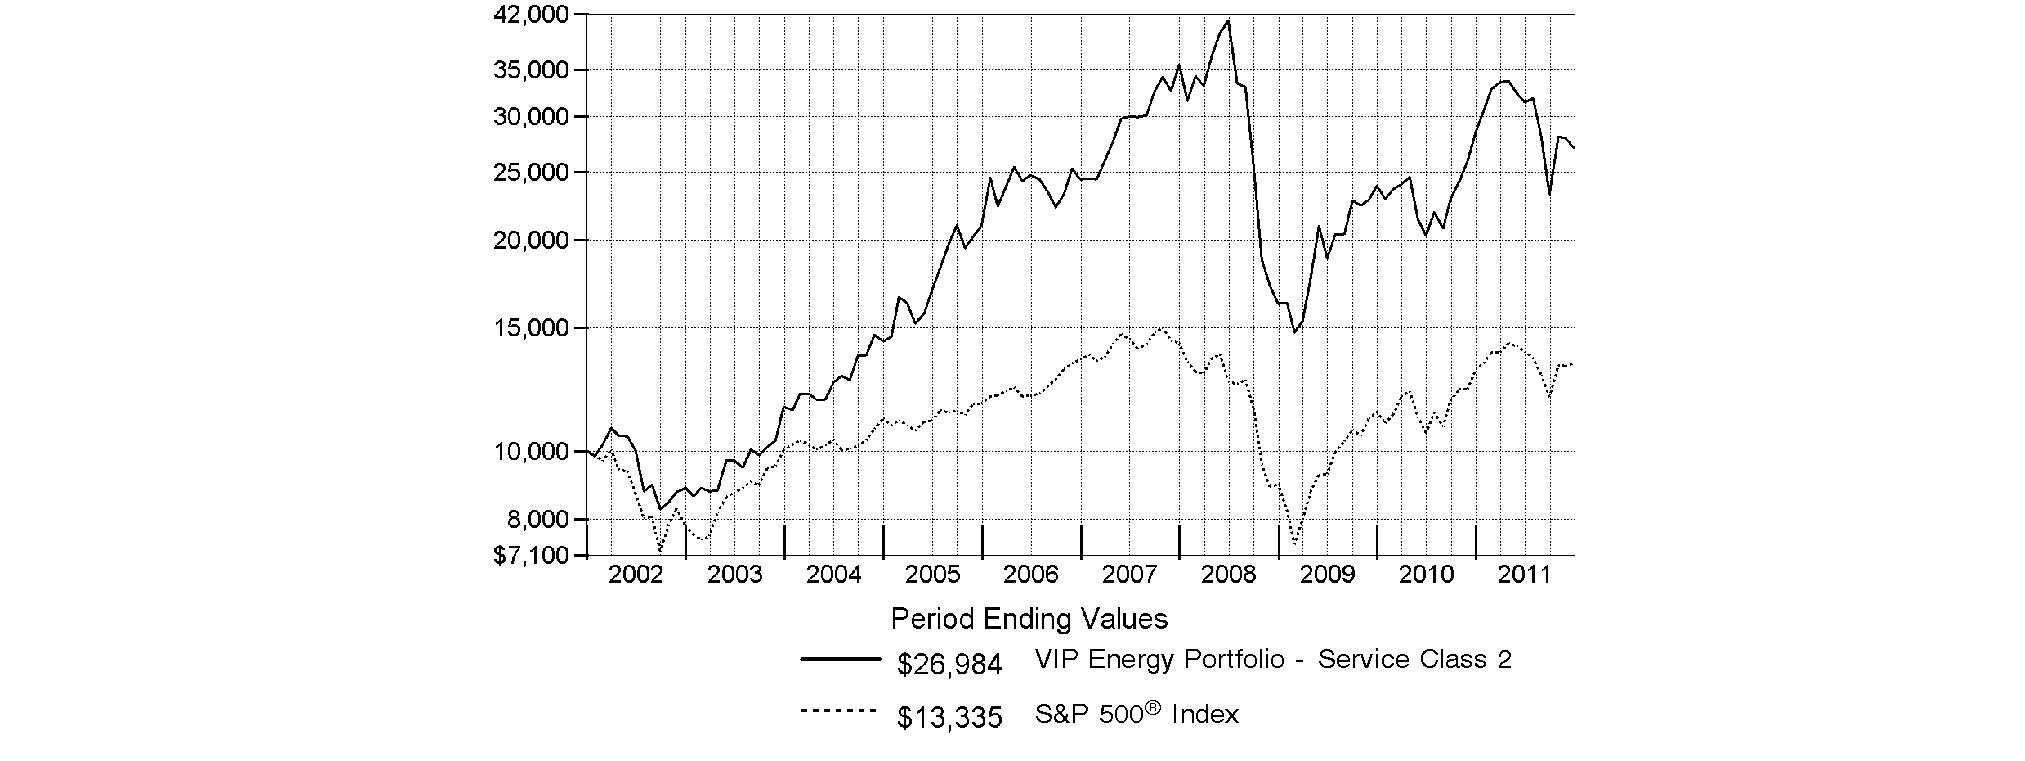
Annual Report
Market Recap: Extreme market volatility took center stage during the 12 months ending December 31, 2011, stealing the spotlight from signs of progress in the global economy. Early in the year, aggressive monetary stimulus by the U.S. federal government, improving credit-market conditions and solid corporate earnings buoyed most major asset classes. As the period progressed, however, fresh worries about sovereign debt in Europe, inflation in China, gridlock over raising the debt ceiling in the U.S. - along with Standard & Poor's early-August downgrade of the nation's long-term sovereign credit rating - and a dimmed outlook for global growth punctured investor confidence and ignited market instability. Domestic equities, as measured by the broad-based S&P 500® Index, gained 2.11%, easily outpacing the 13.61% decline of MSCI® ACWI® (All Country World Index) ex USA Index, a proxy for foreign stocks. Within the MSCI index, emerging markets declined the most (-18%), with investments here generally held back by a stronger U.S. dollar. The U.K. (-3%) fared better than the rest of Europe (-15%), which was the second-worst-performing index component. Bolstered by periodic flights to quality, U.S. investment-grade bonds posted a 7.84% advance, as reflected by the Barclays Capital® U.S. Aggregate Bond Index, outperforming the 4.37% gain of high-yield securities, as represented by The BofA Merrill LynchSM US High Yield Constrained Index. Hampered by financial woes in Europe, the sovereign debt of major developed markets outside the U.S. rose 4.86%, according to the Citigroup® Non-USD Group-of-Seven (G7) Equal Weighted Index, while the JPMorgan Emerging Markets Bond Index Global (EMBI Global) advanced 8.46%, despite the currency head wind.
Comments from John Dowd, Portfolio Manager of VIP Energy Portfolio: For the year, the fund's share classes significantly underperformed the 2.99% gain of the MSCI® U.S. IM Energy 25/50 Index and the S&P 500®. (For specific portfolio results, please refer to the performance section of this report.) It was a choppy period, one in which crude oil prices and energy stocks seesawed but finished moderately higher. Relative to the MSCI index, the fund was hurt by underweightings in both integrated oil/gas and pipeline companies within oil/gas storage and transport, both of which outperformed as investors were drawn to more-stable, dividend-paying energy stocks in the second half of the year. Stock selection in integrated oil/gas also meaningfully detracted, as did my choices within oil/gas exploration/production (E&P) and positioning in oil/gas drilling. Conversely, solid stock picks and a sizable overweighting in the outperforming oil/gas refining and marketing segment aided the fund's results. Among individual stocks, the largest relative detractor was a stake in coal firm Alpha Natural Resources, which incurred operational difficulties and higher-than-expected costs after buying troubled miner Massey Energy in June. A sizable underweighting in integrated oil firm and benchmark giant Exxon Mobil hurt, as the stock rose amid investors' flight to safety. A stake in oil/gas driller Transocean detracted, as its earnings were hurt by continued low utilization of its offshore rig fleet and its stock fell. I sold Transocean by period end. Contributors included mid-continent oil refiners Holly and Frontier Oil, which merged during the period, and Marathon Oil, an integrated oil firm with mid-continent refining capabilities. Not owning index component Devon Energy also helped, as the E&P firm was hurt by lower natural gas prices.
The views expressed above reflect those of the portfolio manager(s) only through the end of the period as stated on the cover of this report and do not necessarily represent the views of Fidelity or any other person in the Fidelity organization. Any such views are subject to change at any time based upon market or other conditions and Fidelity disclaims any responsibility to update such views. These views may not be relied on as investment advice and, because investment decisions for a Fidelity fund are based on numerous factors, may not be relied on as an indication of trading intent on behalf of any Fidelity fund.
Annual Report
As a shareholder of the Fund, you incur two types of costs: (1) transaction costs, including redemption fees, and (2) ongoing costs, including management fees, distribution and/or service (12b-1) fees and other Fund expenses. This Example is intended to help you understand your ongoing costs (in dollars) of investing in the Fund and to compare these costs with the ongoing costs of investing in other mutual funds.
The Example is based on an investment of $1,000 invested at the beginning of the period and held for the entire period (July 1, 2011 to December 31, 2011).
Actual Expenses
The first line of the accompanying table for each class of the Fund provides information about actual account values and actual expenses. You may use the information in this line, together with the amount you invested, to estimate the expenses that you paid over the period. Simply divide your account value by $1,000.00 (for example, an $8,600 account value divided by $1,000.00 = 8.6), then multiply the result by the number in the first line for a class of the Fund under the heading entitled "Expenses Paid During Period" to estimate the expenses you paid on your account during this period. The estimate of expenses does not include any fees or other expenses of any variable annuity or variable life insurance product. If they were, the estimate of expenses you paid during the period would be higher, and your ending account value would be lower. In addition, the Fund, as a shareholder in the underlying Fidelity Central Funds, will indirectly bear its pro-rata share of the fees and expenses incurred by the underlying Fidelity Central Funds. These fees and expenses are not included in the Fund's annualized expense ratio used to calculate the expense estimate in the table below.
Hypothetical Example for Comparison Purposes
The second line of the accompanying table for each class of the Fund provides information about hypothetical account values and hypothetical expenses based on a Class' actual expense ratio and an assumed rate of return of 5% per year before expenses, which is not the Class' actual return. The hypothetical account values and expenses may not be used to estimate the actual ending account balance or expenses you paid for the period. You may use this information to compare the ongoing costs of investing in the Fund and other funds. To do so, compare this 5% hypothetical example with the 5% hypothetical examples that appear in the shareholder reports of the other funds. The estimate of expenses does not include any fees or other expenses of any variable annuity or variable life insurance product. If they were, the estimate of expenses you paid during the period would be higher, and your ending account value would be lower. In addition, the Fund, as a shareholder in the underlying Fidelity Central Funds, will indirectly bear its pro-rata share of the fees and expenses incurred by the underlying Fidelity Central Funds. These fees and expenses are not included in the Fund's annualized expense ratio used to calculate the expense estimate in the table below.
Please note that the expenses shown in the table are meant to highlight your ongoing costs only and do not reflect any transaction costs. Therefore, the second line of the table is useful in comparing ongoing costs only, and will not help you determine the relative total costs of owning different funds. In addition, if these transactional costs were included, your costs would have been higher.
| Annualized
Expense Ratio | Beginning
Account Value
July 1, 2011 | Ending
Account Value
December 31, 2011 | Expenses Paid
During Period*
July 1, 2011 to
December 31, 2011 |
Initial Class | .69% | | | |
Actual | | $ 1,000.00 | $ 859.20 | $ 3.23 |
HypotheticalA | | $ 1,000.00 | $ 1,021.73 | $ 3.52 |
Service Class 2 | .94% | | | |
Actual | | $ 1,000.00 | $ 858.50 | $ 4.40 |
HypotheticalA | | $ 1,000.00 | $ 1,020.47 | $ 4.79 |
Investor Class | .77% | | | |
Actual | | $ 1,000.00 | $ 858.90 | $ 3.61 |
HypotheticalA | | $ 1,000.00 | $ 1,021.32 | $ 3.92 |
A 5% return per year before expenses
* Expenses are equal to each Class' annualized expense ratio, multiplied by the average account value over the period, multiplied by 184/365 (to reflect the one-half year period).
Annual Report
Investment Changes (Unaudited)
Top Ten Stocks as of December 31, 2011 |
| % of fund's
net assets | % of fund's net assets
6 months ago |
Chevron Corp. | 16.2 | 10.9 |
Exxon Mobil Corp. | 7.7 | 10.7 |
Occidental Petroleum Corp. | 7.5 | 5.7 |
Schlumberger Ltd. | 5.5 | 6.0 |
Hess Corp. | 5.1 | 3.9 |
National Oilwell Varco, Inc. | 3.9 | 2.8 |
Marathon Oil Corp. | 3.6 | 5.6 |
EOG Resources, Inc. | 3.5 | 0.0 |
Halliburton Co. | 3.3 | 4.1 |
Ensco International Ltd. ADR | 2.6 | 2.3 |
| 58.9 | |
Top Industries (% of fund's net assets) |
As of December 31, 2011 |
| Oil, Gas &
Consumable Fuels | 72.2% | |
| Energy Equipment & Services | 25.7% | |
| Chemicals | 1.2% | |
| Construction & Engineering | 0.5% | |
| All Others* | 0.4% | |

As of June 30, 2011 |
| Oil, Gas &
Consumable Fuels | 64.3% | |
| Energy Equipment & Services | 32.2% | |
| Chemicals | 1.2% | |
| Construction & Engineering | 1.0% | |
| Metals & Mining | 0.8% | |
| All Others* | 0.5% | |

* Includes short-term investments and net other assets. |
Annual Report
Investments December 31, 2011
Showing Percentage of Net Assets
Common Stocks - 99.6% |
| Shares | | Value |
CHEMICALS - 1.2% |
Specialty Chemicals - 1.2% |
LyondellBasell Industries NV Class A | 133,090 | | $ 4,324,094 |
CONSTRUCTION & ENGINEERING - 0.5% |
Construction & Engineering - 0.5% |
Foster Wheeler AG (a) | 87,843 | | 1,681,315 |
ENERGY EQUIPMENT & SERVICES - 25.7% |
Oil & Gas Drilling - 7.4% |
Discovery Offshore S.A. (a)(e) | 392,110 | | 557,352 |
Ensco International Ltd. ADR | 201,788 | | 9,467,893 |
Nabors Industries Ltd. (a) | 41,900 | | 726,546 |
Noble Corp. | 162,870 | | 4,921,931 |
Northern Offshore Ltd. | 204,728 | | 436,506 |
Ocean Rig UDW, Inc. (United States) | 100,900 | | 1,230,980 |
Parker Drilling Co. (a) | 236,130 | | 1,693,052 |
Patterson-UTI Energy, Inc. | 118,200 | | 2,361,636 |
Rowan Companies, Inc. (a) | 156,000 | | 4,731,480 |
Vantage Drilling Co. (a) | 542,200 | | 628,952 |
| | 26,756,328 |
Oil & Gas Equipment & Services - 18.3% |
Baker Hughes, Inc. | 159,325 | | 7,749,568 |
Cal Dive International, Inc. (a) | 88,736 | | 199,656 |
Compagnie Generale de Geophysique SA (a) | 64,900 | | 1,506,632 |
Halliburton Co. | 347,019 | | 11,975,626 |
Key Energy Services, Inc. (a) | 63,079 | | 975,832 |
McDermott International, Inc. (a) | 61,900 | | 712,469 |
National Oilwell Varco, Inc. | 209,267 | | 14,228,063 |
Oil States International, Inc. (a) | 64,510 | | 4,926,629 |
RPC, Inc. (d) | 18,193 | | 332,022 |
Schlumberger Ltd. | 288,049 | | 19,676,627 |
Schoeller-Bleckmann Oilfield Equipment AG | 8,018 | | 707,931 |
Superior Energy Services, Inc. (a) | 29,454 | | 837,672 |
Weatherford International Ltd. (a) | 131,242 | | 1,921,383 |
Willbros Group, Inc. (a) | 81,733 | | 299,960 |
| | 66,050,070 |
TOTAL ENERGY EQUIPMENT & SERVICES | | 92,806,398 |
OIL, GAS & CONSUMABLE FUELS - 72.2% |
Coal & Consumable Fuels - 2.5% |
Alpha Natural Resources, Inc. (a) | 307,332 | | 6,278,793 |
Peabody Energy Corp. | 79,036 | | 2,616,882 |
| | 8,895,675 |
|
| Shares | | Value |
Integrated Oil & Gas - 38.8% |
Chevron Corp. | 551,879 | | $ 58,719,926 |
Exxon Mobil Corp. | 329,308 | | 27,912,146 |
Hess Corp. | 321,583 | | 18,265,914 |
Occidental Petroleum Corp. | 287,786 | | 26,965,548 |
Suncor Energy, Inc. | 289,400 | | 8,348,951 |
| | 140,212,485 |
Oil & Gas Exploration & Production - 20.8% |
Anadarko Petroleum Corp. | 51,998 | | 3,969,007 |
Apache Corp. | 97,442 | | 8,826,296 |
Bankers Petroleum Ltd. (a) | 296,800 | | 1,293,983 |
Cabot Oil & Gas Corp. | 6,700 | | 508,530 |
Canadian Natural Resources Ltd. | 82,500 | | 3,090,510 |
EOG Resources, Inc. | 128,948 | | 12,702,667 |
EV Energy Partners LP | 42,719 | | 2,815,182 |
EXCO Resources, Inc. | 33,000 | | 344,850 |
Gran Tierra Energy, Inc. (Canada) (a) | 515,600 | | 2,490,919 |
Marathon Oil Corp. | 440,425 | | 12,891,240 |
Niko Resources Ltd. | 7,200 | | 340,982 |
Noble Energy, Inc. | 58,316 | | 5,504,447 |
Northern Oil & Gas, Inc. (a) | 25,042 | | 600,507 |
Oasis Petroleum, Inc. (a)(d) | 43,520 | | 1,265,997 |
Pacific Rubiales Energy Corp. | 40,000 | | 735,664 |
Painted Pony Petroleum Ltd. (a)(e) | 2,500 | | 27,494 |
Painted Pony Petroleum Ltd. Class A (a) | 56,600 | | 622,467 |
Petrominerales Ltd. | 26,633 | | 433,074 |
Pioneer Natural Resources Co. | 65,834 | | 5,890,826 |
QEP Resources, Inc. | 31,800 | | 931,740 |
Rosetta Resources, Inc. (a) | 18,748 | | 815,538 |
SM Energy Co. | 88,708 | | 6,484,555 |
Stone Energy Corp. (a) | 21,396 | | 564,426 |
Swift Energy Co. (a) | 31,942 | | 949,316 |
Whiting Petroleum Corp. (a) | 21,866 | | 1,020,924 |
| | 75,121,141 |
Oil & Gas Refining & Marketing - 7.2% |
CVR Energy, Inc. (a) | 81,846 | | 1,532,976 |
HollyFrontier Corp. | 196,359 | | 4,594,801 |
Marathon Petroleum Corp. | 284,072 | | 9,456,757 |
Tesoro Corp. (a) | 185,327 | | 4,329,239 |
Valero Energy Corp. | 300,024 | | 6,315,505 |
| | 26,229,278 |
Oil & Gas Storage & Transport - 2.9% |
Atlas Energy LP | 10,363 | | 251,821 |
Atlas Pipeline Partners, LP | 50,928 | | 1,891,975 |
Williams Companies, Inc. | 257,000 | | 8,486,140 |
| | 10,629,936 |
TOTAL OIL, GAS & CONSUMABLE FUELS | | 261,088,515 |
TOTAL COMMON STOCKS (Cost $345,266,488) |
359,900,322
|
Money Market Funds - 0.7% |
| Shares | | Value |
Fidelity Cash Central Fund, 0.11% (b) | 1,998,335 | | $ 1,998,335 |
Fidelity Securities Lending Cash Central Fund, 0.13% (b)(c) | 446,920 | | 446,920 |
TOTAL MONEY MARKET FUNDS (Cost $2,445,255) |
2,445,255
|
TOTAL INVESTMENT PORTFOLIO - 100.3% (Cost $347,711,743) | | 362,345,577 |
NET OTHER ASSETS (LIABILITIES) - (0.3)% | | (957,731) |
NET ASSETS - 100% | $ 361,387,846 |
Legend |
(a) Non-income producing |
(b) Affiliated fund that is available only to investment companies and other accounts managed by Fidelity Investments. The rate quoted is the annualized seven-day yield of the fund at period end. A complete unaudited listing of the fund's holdings as of its most recent quarter end is available upon request. In addition, each Fidelity Central Fund's financial statements, which are not covered by the Fund's Report of Independent Registered Public Accounting Firm, are available on the SEC's website or upon request. |
(c) Investment made with cash collateral received from securities on loan. |
(d) Security or a portion of the security is on loan at period end. |
(e) Security exempt from registration under Rule 144A of the Securities Act of 1933. These securities may be resold in transactions exempt from registration, normally to qualified institutional buyers. At the end of the period, the value of these securities amounted to $584,846 or 0.2% of net assets. |
Affiliated Central Funds |
Information regarding fiscal year to date income earned by the Fund from investments in Fidelity Central Funds is as follows: |
Fund | Income earned |
Fidelity Cash Central Fund | $ 4,897 |
Fidelity Securities Lending Cash Central Fund | 34,966 |
Total | $ 39,863 |
Other Information |
The following is a summary of the inputs used, as of December 31, 2011, involving the Fund's assets and liabilities carried at fair value. The inputs or methodology used for valuing securities may not be an indication of the risk associated with investing in those securities. For more information on valuation inputs, and their aggregation into the levels used in the tables below, please refer to the Security Valuation section in the accompanying Notes to Financial Statements. |
Valuation Inputs at Reporting Date: |
Description | Total | Level 1 | Level 2 | Level 3 |
Investments in Securities: | | | | |
Common Stocks | $ 359,900,322 | $ 357,685,759 | $ 2,214,563 | $ - |
Money Market Funds | 2,445,255 | 2,445,255 | - | - |
Total Investments in Securities: | $ 362,345,577 | $ 360,131,014 | $ 2,214,563 | $ - |
The following is a reconciliation of Investments in Securities for which Level 3 inputs were used in determining value: |
Investments in Securities: | |
Beginning Balance | $ 200,308 |
Total Realized Gain (Loss) | (47,206) |
Total Unrealized Gain (Loss) | 38,184 |
Cost of Purchases | - |
Proceeds of Sales | (191,286) |
Amortization/Accretion | - |
Transfers in to Level 3 | - |
Transfers out of Level 3 | - |
Ending Balance | $ - |
The change in unrealized gain (loss) for the period attributable to Level 3 securities held at December 31, 2011 | $ - |
The information used in the above reconciliation represents fiscal year to date activity for any Investments in Securities identified as using Level 3 inputs at either the beginning or the end of the current fiscal period. Transfers in or out of Level 3 represent the beginning value of any Security or Instrument where a change in the pricing level occurred from the beginning to the end of the period. The cost of purchases and the proceeds of sales may include securities received or delivered through corporate actions or exchanges. Realized and unrealized gains (losses) disclosed in the reconciliation are included in Net Gain (Loss) on the Fund's Statement of Operations. |
Distribution of investments by country of issue, as a percentage of total net assets, is as follows: (Unaudited) |
United States of America | 82.4% |
Curacao | 5.5% |
Canada | 4.1% |
United Kingdom | 2.6% |
Switzerland | 2.4% |
Netherlands | 1.2% |
Others (Individually Less Than 1%) | 1.8% |
| 100.0% |
See accompanying notes which are an integral part of the financial statements.
Annual Report
Statement of Assets and Liabilities
| December 31, 2011 |
| | |
Assets | | |
Investment in securities, at value (including securities loaned of $430,741) - See accompanying schedule: Unaffiliated issuers (cost $345,266,488) | $ 359,900,322 | |
Fidelity Central Funds (cost $2,445,255) | 2,445,255 | |
Total Investments (cost $347,711,743) | | $ 362,345,577 |
Cash | | 79 |
Receivable for investments sold | | 79,463 |
Receivable for fund shares sold | | 8,130 |
Dividends receivable | | 262,176 |
Distributions receivable from Fidelity Central Funds | | 488 |
Prepaid expenses | | 1,381 |
Other receivables | | 3,088 |
Total assets | | 362,700,382 |
| | |
Liabilities | | |
Payable for fund shares redeemed | $ 596,529 | |
Accrued management fee | 168,570 | |
Distribution and service plan fees payable | 26,570 | |
Other affiliated payables | 39,119 | |
Other payables and accrued
expenses | 34,828 | |
Collateral on securities loaned, at value | 446,920 | |
Total liabilities | | 1,312,536 |
| | |
Net Assets | | $ 361,387,846 |
Net Assets consist of: | | |
Paid in capital | | $ 377,575,321 |
Distributions in excess of net investment income | | (22,832) |
Accumulated undistributed net realized gain (loss) on investments and foreign currency transactions | | (30,798,519) |
Net unrealized appreciation (depreciation) on investments and assets and liabilities in foreign
currencies | | 14,633,876 |
Net Assets | | $ 361,387,846 |
Statement of Assets and Liabilities - continued
| December 31, 2011 |
| | |
Initial Class:
Net Asset Value, offering price and redemption price per share ($126,722,637 ÷ 6,736,576 shares) | | $ 18.81 |
| | |
Service Class 2:
Net Asset Value, offering price and redemption price per share ($127,186,619 ÷ 6,794,005 shares) | | $ 18.72 |
| | |
Investor Class:
Net Asset Value, offering price and redemption price per share ($107,478,590 ÷ 5,724,621 shares) | | $ 18.77 |
See accompanying notes which are an integral part of the financial statements.
Annual Report
Financial Statements - continued
Statement of Operations
| Year ended December 31, 2011 |
| | |
Investment Income | | |
Dividends | | $ 7,143,793 |
Interest | | 8,280 |
Income from Fidelity Central Funds | | 39,863 |
Total income | | 7,191,936 |
| | |
Expenses | | |
Management fee | $ 2,385,410 | |
Transfer agent fees | 416,932 | |
Distribution and service plan fees | 368,050 | |
Accounting and security lending fees | 167,530 | |
Custodian fees and expenses | 26,822 | |
Independent trustees' compensation | 2,402 | |
Audit | 37,489 | |
Legal | 1,633 | |
Interest | 614 | |
Miscellaneous | 4,062 | |
Total expenses before reductions | 3,410,944 | |
Expense reductions | (23,420) | 3,387,524 |
Net investment income (loss) | | 3,804,412 |
Realized and Unrealized Gain (Loss) Net realized gain (loss) on: | | |
Investment securities: | | |
Unaffiliated issuers | 34,186,050 | |
Foreign currency transactions | (7,130) | |
Total net realized gain (loss) | | 34,178,920 |
Change in net unrealized appreciation (depreciation) on: Investment securities | (63,151,605) | |
Assets and liabilities in foreign currencies | (638) | |
Total change in net unrealized appreciation (depreciation) | | (63,152,243) |
Net gain (loss) | | (28,973,323) |
Net increase (decrease) in net assets resulting from operations | | $ (25,168,911) |
Statement of Changes in Net Assets
| Year ended
December 31, 2011 | Year ended
December 31, 2010 |
Increase (Decrease) in Net Assets | | |
Operations | | |
Net investment income (loss) | $ 3,804,412 | $ 1,821,852 |
Net realized gain (loss) | 34,178,920 | 2,129,268 |
Change in net unrealized appreciation (depreciation) | (63,152,243) | 52,797,353 |
Net increase (decrease) in net assets resulting from operations | (25,168,911) | 56,748,473 |
Distributions to shareholders from net investment income | (3,961,918) | (1,680,556) |
Share transactions - net increase (decrease) | 8,835,144 | (41,330,324) |
Redemption fees | 184,377 | 143,706 |
Total increase (decrease) in net assets | (20,111,308) | 13,881,299 |
| | |
Net Assets | | |
Beginning of period | 381,499,154 | 367,617,855 |
End of period (including distributions in excess of net investment income of $22,832 and undistributed net investment income of $125,041, respectively) | $ 361,387,846 | $ 381,499,154 |
See accompanying notes which are an integral part of the financial statements.
Annual Report
Financial Highlights - Initial Class
Years ended December 31, | 2011 | 2010 | 2009 | 2008 | 2007 |
Selected Per-Share Data | | | | | |
Net asset value, beginning of period | $ 20.05 | $ 16.88 | $ 11.46 | $ 26.55 | $ 19.04 |
Income from Investment Operations | | | | | |
Net investment income (loss)C | .21 | .11 | .07 | .03 | .07 |
Net realized and unrealized gain (loss) | (1.23) | 3.16 | 5.41 | (14.31) | 8.62 |
Total from investment operations | (1.02) | 3.27 | 5.48 | (14.28) | 8.69 |
Distributions from net investment income | (.23) | (.11) | (.07) | (.03) | (.06) |
Distributions from net realized gain | - | - | - | (.80) | (1.13) |
Total distributions | (.23) | (.11) | (.07) | (.83) | (1.19) |
Redemption fees added to paid in capitalC | .01 | .01 | .01 | .02 | .01 |
Net asset value, end of period | $ 18.81 | $ 20.05 | $ 16.88 | $ 11.46 | $ 26.55 |
Total ReturnA,B | (4.99)% | 19.45% | 47.90% | (54.26)% | 45.97% |
Ratios to Average Net AssetsD,F | | | | | |
Expenses before reductions | .69% | .70% | .71% | .70% | .70% |
Expenses net of fee waivers, if any | .69% | .69% | .71% | .70% | .70% |
Expenses net of all reductions | .68% | .69% | .70% | .69% | .70% |
Net investment income (loss) | 1.00% | .65% | .47% | .13% | .31% |
Supplemental Data | | | | | |
Net assets, end of period (000 omitted) | $ 126,723 | $ 148,774 | $ 152,028 | $ 117,940 | $ 355,854 |
Portfolio turnover rateE | 94% | 105% | 113% | 130% | 61% |
A Total returns do not reflect charges attributable to your insurance company's separate account. Inclusion of these charges would reduce the total returns shown.
B Total returns would have been lower if certain expenses had not been reduced during the applicable periods shown.
C Calculated based on average shares outstanding during the period.
D Fees and expenses of any underlying Fidelity Central Funds are not included in the Fund's expense ratio. The Fund indirectly bears its proportionate share of the expenses of any underlying Fidelity Central Funds.
E Amount does not include the portfolio activity of any underlying Fidelity Central Funds.
F Expense ratios reflect operating expenses of the class. Expenses before reductions do not reflect amounts reimbursed by the investment adviser or reductions from brokerage service arrangements or reductions from other expense offset arrangements and do not represent the amount paid by the class during periods when reimbursements or reductions occur. Expenses net of fee waivers reflect expenses after reimbursement by the investment adviser but prior to reductions from brokerage service arrangements or other expense offset arrangements. Expenses net of all reductions represent the net expenses paid by the class.
Financial Highlights - Service Class 2
Years ended December 31, | 2011 | 2010 | 2009 | 2008 | 2007 |
Selected Per-Share Data | | | | | |
Net asset value, beginning of period | $ 19.94 | $ 16.79 | $ 11.40 | $ 26.44 | $ 18.98 |
Income from Investment Operations | | | | | |
Net investment income (loss)C | .16 | .07 | .03 | (.03) | .02 |
Net realized and unrealized gain (loss) | (1.21) | 3.13 | 5.38 | (14.23) | 8.58 |
Total from investment operations | (1.05) | 3.20 | 5.41 | (14.26) | 8.60 |
Distributions from net investment income | (.18) | (.06) | (.03) | - | (.02) |
Distributions from net realized gain | - | - | - | (.80) | (1.13) |
Total distributions | (.18) | (.06) | (.03) | (.80) | (1.15) |
Redemption fees added to paid in capitalC | .01 | .01 | .01 | .02 | .01 |
Net asset value, end of period | $ 18.72 | $ 19.94 | $ 16.79 | $ 11.40 | $ 26.44 |
Total ReturnA,B | (5.20)% | 19.16% | 47.57% | (54.40)% | 45.64% |
Ratios to Average Net AssetsD,F | | | | | |
Expenses before reductions | .94% | .95% | .96% | .95% | .95% |
Expenses net of fee waivers, if any | .93% | .94% | .96% | .95% | .95% |
Expenses net of all reductions | .93% | .94% | .95% | .94% | .94% |
Net investment income (loss) | .75% | .40% | .22% | (.12)% | .07% |
Supplemental Data | | | | | |
Net assets, end of period (000 omitted) | $ 127,187 | $ 129,043 | $ 125,669 | $ 90,109 | $ 193,887 |
Portfolio turnover rateE | 94% | 105% | 113% | 130% | 61% |
A Total returns do not reflect charges attributable to your insurance company's separate account. Inclusion of these charges would reduce the total returns shown.
B Total returns would have been lower if certain expenses had not been reduced during the applicable periods shown.
C Calculated based on average shares outstanding during the period.
D Fees and expenses of any underlying Fidelity Central Funds are not included in the Fund's expense ratio. The Fund indirectly bears its proportionate share of the expenses of any underlying Fidelity Central Funds.
E Amount does not include the portfolio activity of any underlying Fidelity Central Funds.
F Expense ratios reflect operating expenses of the class. Expenses before reductions do not reflect amounts reimbursed by the investment adviser or reductions from brokerage service arrangements or reductions from other expense offset arrangements and do not represent the amount paid by the class during periods when reimbursements or reductions occur. Expenses net of fee waivers reflect expenses after reimbursement by the investment adviser but prior to reductions from brokerage service arrangements or other expense offset arrangements. Expenses net of all reductions represent the net expenses paid by the class.
See accompanying notes which are an integral part of the financial statements.
Annual Report
Financial Highlights - Investor Class
Years ended December 31, | 2011 | 2010 | 2009 | 2008 | 2007 |
Selected Per-Share Data | | | | | |
Net asset value, beginning of period | $ 20.01 | $ 16.85 | $ 11.44 | $ 26.49 | $ 19.00 |
Income from Investment Operations | | | | | |
Net investment income (loss)C | .19 | .09 | .05 | .01 | .05 |
Net realized and unrealized gain (loss) | (1.23) | 3.16 | 5.41 | (14.28) | 8.61 |
Total from investment operations | (1.04) | 3.25 | 5.46 | (14.27) | 8.66 |
Distributions from net investment income | (.21) | (.10) | (.06) | -G | (.05) |
Distributions from net realized gain | - | - | - | (.80) | (1.13) |
Total distributions | (.21) | (.10) | (.06) | (.80) | (1.18) |
Redemption fees added to paid in capitalC | .01 | .01 | .01 | .02 | .01 |
Net asset value, end of period | $ 18.77 | $ 20.01 | $ 16.85 | $ 11.44 | $ 26.49 |
Total ReturnA,B | (5.09)% | 19.34% | 47.79% | (54.32)% | 45.88% |
Ratios to Average Net AssetsD,F | | | | | |
Expenses before reductions | .77% | .79% | .81% | .79% | .81% |
Expenses net of fee waivers, if any | .77% | .78% | .81% | .79% | .81% |
Expenses net of all reductions | .77% | .77% | .80% | .78% | .81% |
Net investment income (loss) | .92% | .57% | .37% | .04% | .20% |
Supplemental Data | | | | | |
Net assets, end of period (000 omitted) | $ 107,479 | $ 103,682 | $ 89,921 | $ 55,256 | $ 131,198 |
Portfolio turnover rateE | 94% | 105% | 113% | 130% | 61% |
A Total returns do not reflect charges attributable to your insurance company's separate account. Inclusion of these charges would reduce the total returns shown.
B Total returns would have been lower if certain expenses had not been reduced during the applicable periods shown.
C Calculated based on average shares outstanding during the period.
D Fees and expenses of any underlying Fidelity Central Funds are not included in the Fund's expense ratio. The Fund indirectly bears its proportionate share of the expenses of any underlying Fidelity Central Funds.
E Amount does not include the portfolio activity of any underlying Fidelity Central Funds.
F Expense ratios reflect operating expenses of the class. Expenses before reductions do not reflect amounts reimbursed by the investment adviser or reductions from brokerage service arrangements or reductions from other expense offset arrangements and do not represent the amount paid by the class during periods when reimbursements or reductions occur. Expenses net of fee waivers reflect expenses after reimbursement by the investment adviser but prior to reductions from brokerage service arrangements or other expense offset arrangements. Expenses net of all reductions represent the net expenses paid by the class.
G Amount represents less than $.01 per share.
See accompanying notes which are an integral part of the financial statements.
Annual Report
Notes to Financial Statements
For the period ended December 31, 2011
1. Organization.
VIP Energy Portfolio (the Fund) is a non-diversified fund of Variable Insurance Products Fund IV (the Trust) and is authorized to issue an unlimited number of shares. The Trust is registered under the Investment Company Act of 1940, as amended (the 1940 Act), as an open-end management investment company organized as a Massachusetts business trust. Shares of the Fund may only be purchased by insurance companies for the purpose of funding variable annuity or variable life insurance contracts. The Fund offers the following classes of shares: Initial Class shares, Service Class 2 shares, and Investor Class shares. All classes have equal rights and voting privileges, except for matters affecting a single class. Investment income, realized and unrealized capital gains and losses, the common expenses of the Fund, and certain fund-level expense reductions, if any, are allocated on a pro-rata basis to each class based on the relative net assets of each class to the total net assets of the Fund. Each class differs with respect to transfer agent and distribution and service plan fees incurred. Certain expense reductions may also differ by class.
2. Investments in Fidelity Central Funds.
The Fund invests in Fidelity Central Funds, which are open-end investment companies available only to other investment companies and accounts managed by Fidelity Management & Research Company (FMR) and its affiliates. The Fund's Schedule of Investments lists each of the Fidelity Central Funds held as of period end, if any, as an investment of the Fund, but do not include the underlying holdings of each Fidelity Central Fund. As an Investing Fund, the Fund indirectly bears its proportionate share of the expenses of the underlying Fidelity Central Funds.
The Money Market Central Funds seek preservation of capital and current income and are managed by Fidelity Investments Money Management, Inc. (FIMM), an affiliate of FMR.
A complete unaudited list of holdings for each Fidelity Central Fund is available upon request or at the Securities and Exchange Commission (the SEC) web site at www.sec.gov. In addition, the financial statements of the Fidelity Central Funds, which are not covered by the Fund's Report of Independent Registered Public Accounting Firm, are available on the SEC web site or upon request.
3. Significant Accounting Policies.
The financial statements have been prepared in conformity with accounting principles generally accepted in the United States of America (GAAP), which require management to make certain estimates and assumptions at the date of the financial statements. Actual results could differ from those estimates. Subsequent events, if any, through the date that the financial statements were issued have been evaluated in the preparation of the financial statements. The following summarizes the significant accounting policies of the Fund:
Security Valuation. Investments are valued as of 4:00 p.m. Eastern time on the last calendar day of the period. The Fund uses independent pricing services approved by the Board of Trustees to value its investments. When current market prices or quotations are not readily available or reliable, valuations may be determined in good faith in accordance with procedures adopted by the Board of Trustees. Factors used in determining value may include market or security specific events. The frequency with which these procedures are used cannot be predicted and they may be utilized to a significant extent. The value used for net asset value (NAV) calculation under these procedures may differ from published prices for the same securities.
The Fund categorizes the inputs to valuation techniques used to value its investments into a disclosure hierarchy consisting of three levels as shown below:
Level 1 - quoted prices in active markets for identical investments
Level 2 - other significant observable inputs (including quoted prices for similar investments, interest rates, prepayment speeds, etc.)
Level 3 - unobservable inputs (including the Fund's own assumptions based on the best information available)
Changes in valuation techniques may result in transfers in or out of an assigned level within the disclosure hierarchy. The aggregate value of investments by input level, as of December 31, 2011, as well as a roll forward of Level 3 securities, is included at the end of the Fund's Schedule of Investments. Valuation techniques used to value the Fund's investments by major category are as follows:
Equity securities, including restricted securities, for which market quotations are readily available, are valued at the last reported sale price or official closing price as reported by an independent pricing service on the primary market or exchange on which they are traded and are categorized as Level 1 in the hierarchy. In the event there were no sales during the day or closing prices are not available, securities are valued at the last quoted bid price or may be valued using the last available price and are generally categorized as Level 2 in the hierarchy. For foreign equity securities, when significant market or security specific events arise, comparisons to the valuation of American Depositary Receipts (ADRs), futures contracts, Exchange-traded funds (ETFs) and certain indexes as well as quoted prices for similar securities are used and are categorized as Level 2 in the hierarchy in these circumstances. Utilizing these techniques may result in transfers between Level 1 and Level 2. For restricted equity securities and private placements where observable inputs are limited, assumptions about market activity and risk are used and are categorized as Level 3 in the hierarchy.
Annual Report
Notes to Financial Statements - continued
3. Significant Accounting Policies - continued
Security Valuation - continued
Investments in open-end mutual funds, including Fidelity Central Funds, are valued at their closing net asset value each business day and are categorized as Level 1 in the hierarchy.
New Accounting Pronouncements. In May 2011, the Financial Accounting Standards Board issued Accounting Standard Update No. 2011-04, Fair Value Measurement (Topic 820) - Amendments to Achieve Common Fair Value Measurement and Disclosure Requirements in U.S. GAAP and IFRSs. The update is effective during interim and annual periods beginning after December 15, 2011 and will result in additional disclosure for transfers between levels as well as expanded disclosure for securities categorized as Level 3 under the fair value hierarchy.
In December 2011, the Financial Accounting Standards Board issued Accounting Standard Update No. 2011-11, Disclosures about Offsetting Assets and Liabilities. The update creates new disclosure requirements requiring entities to disclose both gross and net information for derivatives and other financial instruments that are either offset in the Statement of Assets and Liabilities or subject to an enforceable master netting arrangement or similar agreement. The disclosure requirements are effective for annual reporting periods beginning on or after January 1, 2013. Management is currently evaluating the impact of the update's adoption on the Fund's financial statement disclosures.
Foreign Currency. The Fund may use foreign currency contracts to facilitate transactions in foreign-denominated securities. Gains and losses from these transactions may arise from changes in the value of the foreign currency or if the counterparties do not perform under the contracts' terms.
Foreign-denominated assets, including investment securities, and liabilities are translated into U.S. dollars at the exchange rate at period end. Purchases and sales of investment securities, income and dividends received and expenses denominated in foreign currencies are translated into U.S. dollars at the exchange rate in effect on the transaction date.
The effects of exchange rate fluctuations on investments are included with the net realized and unrealized gain (loss) on investment securities. Other foreign currency transactions resulting in realized and unrealized gain (loss) are disclosed separately.
Investment Transactions and Income. For financial reporting purposes, the Fund's investment holdings and NAV include trades executed through the end of the last business day of the period. The NAV per share for processing shareholder transactions is calculated as of the close of business of the New York Stock Exchange (NYSE), normally 4:00 p.m. Eastern time and includes trades executed through the end of the prior business day. Gains and losses on securities sold are determined on the basis of identified cost and may include proceeds received from litigation. Dividend income is recorded on the ex-dividend date, except for certain dividends from foreign securities where the ex-dividend date may have passed, which are recorded as soon as the Fund is informed of the ex-dividend date. Non-cash dividends included in dividend income, if any, are recorded at the fair market value of the securities received. Distributions received on securities that represent a return of capital or capital gain are recorded as a reduction of cost of investments and/or as a realized gain. The Fund estimates the components of distributions received that may be considered return of capital distributions or capital gain distributions. Interest income and distributions from the Fidelity Central Funds are accrued as earned. Interest income includes coupon interest and amortization of premium and accretion of discount on debt securities. Investment income is recorded net of foreign taxes withheld where recovery of such taxes is uncertain.
Expenses. Expenses directly attributable to a fund are charged to that fund. Expenses attributable to more than one fund are allocated among the respective funds on the basis of relative net assets or other appropriate methods. Expense estimates are accrued in the period to which they relate and adjustments are made when actual amounts are known.
Income Tax Information and Distributions to Shareholders. Each year, the Fund intends to qualify as a regulated investment company, including distributing substantially all of its taxable income and realized gains under Subchapter M of the Internal Revenue Code. As a result, no provision for income taxes is required. As of December 31, 2011, the Fund did not have any unrecognized tax benefits in the financial statements; nor is the Fund aware of any tax positions for which it is reasonably possible that the total amounts of unrecognized tax benefits will significantly change in the next twelve months. The Fund files a U.S. federal tax return, in addition to state and local tax returns as required. A fund's tax returns are subject to examination by the Internal Revenue Service (IRS) for a period of three fiscal years. State and local tax returns may be subject to examination for an additional fiscal year depending on the jurisdiction. Foreign taxes are provided for based on the Fund's understanding of the tax rules and rates that exist in the foreign markets in which it invests.
Distributions are declared and recorded on the ex-dividend date. Income dividends and capital gain distributions are declared separately for each class. Income and capital gain distributions are determined in accordance with income tax regulations, which may differ from GAAP.
Capital accounts within the financial statements are adjusted for permanent book-tax differences. These adjustments have no impact on net assets or the results of operations. Temporary book-tax differences will reverse in a subsequent period.
Book-tax differences are primarily due to foreign currency transactions, passive foreign investment companies (PFIC), partnerships, capital loss carryforwards and losses deferred due to wash sales and excise tax regulations.
Annual Report
3. Significant Accounting Policies - continued
Income Tax Information and Distributions to Shareholders - continued
The federal tax cost of investment securities and unrealized appreciation (depreciation) as of period end were as follows:
Gross unrealized appreciation | $ 51,328,166 |
Gross unrealized depreciation | (39,843,260) |
Net unrealized appreciation (depreciation) on securities and other investments | $ 11,484,906 |
| |
Tax Cost | $ 350,860,671 |
The tax-based components of distributable earnings as of period end were as follows:
Capital loss carryforward | $ (27,649,589) |
Net unrealized appreciation (depreciation) | $ 11,484,948 |
Capital loss carryforwards are only available to offset future capital gains of the Fund to the extent provided by regulations and may be limited. Under the Regulated Investment Company Modernization Act of 2010 (the Act), the Fund is permitted to carry forward capital losses incurred in taxable years beginning after December 22, 2010 for an unlimited period and such capital losses are required to be used prior to any losses that expire. Capital loss carryforwards were as follows:
Fiscal year of expiration | |
2017 | $ (19,894,860) |
2018 | (7,754,729) |
Total with expiration | $ (27,649,589) |
The tax character of distributions paid was as follows:
| December 31, 2011 | December 31, 2010 |
Ordinary Income | $ 3,961,918 | $ 1,680,556 |
Trading (Redemption) Fees. Initial Class shares, Service Class 2 shares, and Investor Class shares held by investors less than 60 days are subject to a redemption fee equal to 1% of the net asset value of shares redeemed. All redemption fees, which reduce the proceeds of the shareholder redemption, are retained by the Fund and accounted for as an addition to paid in capital.
4. Operating Policies.
Restricted Securities. The Fund may invest in securities that are subject to legal or contractual restrictions on resale. These securities generally may be resold in transactions exempt from registration or to the public if the securities are registered. Disposal of these securities may involve time-consuming negotiations and expense, and prompt sale at an acceptable price may be difficult. Information regarding restricted securities is included at the end of the Fund's Schedule of Investments.
5. Purchases and Sales of Investments.
Purchases and sales of securities, other than short-term securities, aggregated $413,602,462 and $403,458,502, respectively.
6. Fees and Other Transactions with Affiliates.
Management Fee. FMR and its affiliates provide the Fund with investment management related services for which the Fund pays a monthly management fee. The management fee is the sum of an individual fund fee rate that is based on an annual rate of .30% of the Fund's average net assets and an annualized group fee rate that averaged .26% during the period. The group fee rate is based upon the average net assets of all the mutual funds advised by FMR. The group fee rate decreases as assets under management increase and increases as assets under management decrease. For the period, the total annual management fee rate was .56% of the Fund's average net assets.
Annual Report
Notes to Financial Statements - continued
6. Fees and Other Transactions with Affiliates - continued
Distribution and Service Plan Fees. In accordance with Rule 12b-1 of the 1940 Act, the Fund has adopted a separate 12b-1 Plan for Service Class 2 shares. Service Class 2 pays Fidelity Distributors Corporation (FDC), an affiliate of FMR, a service fee. For the period, the service fee is based on an annual rate of .25% of Service Class 2's average net assets.
For the period, total fees for Service Class 2, all of which was re-allowed to insurance companies for the distribution of shares and providing shareholder support services were $368,050.
Transfer Agent Fees. Fidelity Investments Institutional Operations Company, Inc. (FIIOC), an affiliate of FMR, is the Fund's transfer, dividend disbursing, and shareholder servicing agent. FIIOC receives an asset-based fee with respect to each class. Each class (with the exception of Investor Class) pays a transfer agent fee, excluding out of pocket expenses, equal to an annual rate of .07% of average net assets. Investor Class pays a monthly asset-based transfer agent fee of .15% of average net assets. In addition, FIIOC receives an asset-based fee of .0045% of average net assets for typesetting, printing and mailing of shareholder reports, except proxy statements. FIIOC voluntarily agreed to waive this fee for the period August 1, 2011 through December 31, 2011 (see Expense Reductions note). For the period, transfer agent fees for each class, including printing and out of pocket expenses, were as follows:
Initial Class | $ 116,043 |
Service Class 2 | 105,898 |
Investor Class | 194,991 |
| $ 416,932 |
Accounting and Security Lending Fees. Fidelity Service Company, Inc. (FSC), an affiliate of FMR, maintains the Fund's accounting records. The accounting fee is based on the level of average net assets for the month. Under a separate contract, FSC administers the security lending program. The security lending fee is based on the number and duration of lending transactions.
Brokerage Commissions. The Fund placed a portion of its portfolio transactions with brokerage firms which are affiliates of the investment adviser. The commissions paid to these affiliated firms were $4,272 for the period.
Interfund Lending Program. Pursuant to an Exemptive Order issued by the SEC, the Fund, along with other registered investment companies having management contracts with FMR, may participate in an interfund lending program. This program provides an alternative credit facility allowing the funds to borrow from, or lend money to, other participating affiliated funds. At period end, there were no interfund loans outstanding. The Fund's activity in this program during the period for which loans were outstanding was as follows:
Borrower or Lender | Average Loan
Balance | Weighted Average Interest Rate | Interest
Expense |
Borrower | $ 9,120,143 | .35% | $ 614 |
7. Committed Line of Credit.
The Fund participates with other funds managed by FMR or an affiliate in a $4.0 billion credit facility (the "line of credit") to be utilized for temporary or emergency purposes to fund shareholder redemptions or for other short-term liquidity purposes. The Fund has agreed to pay commitment fees on its pro-rata portion of the line of credit, which amounted to $1,265 and is reflected in Miscellaneous expenses on the Statement of Operations. During the period, there were no borrowings on this line of credit.
8. Security Lending.
The Fund lends portfolio securities through a lending agent from time to time in order to earn additional income. For equity securities, a lending agent is used and may loan securities to certain qualified borrowers, including Fidelity Capital Markets (FCM), a broker-dealer affiliated with the Fund. On the settlement date of the loan, the Fund receives collateral (in the form of U.S. Treasury obligations, letters of credit and/or cash) against the loaned securities and maintains collateral in an amount not less than 100% of the market value of the loaned securities during the period of the loan. The market value of the loaned securities is determined at the close of business of the Fund and any additional required collateral is delivered to the Fund on the next business day. If the borrower defaults on its obligation to return the securities loaned because of insolvency or other reasons, a fund could experience delays and costs in recovering the securities loaned or in gaining access to the collateral. Any cash collateral received is invested in the Fidelity Securities Lending Cash Central Fund. The value of loaned securities and cash collateral at period end are disclosed on the Fund's Statement
Annual Report
8. Security Lending - continued
of Assets and Liabilities. Security lending income represents the income earned on investing cash collateral, less rebates paid to borrowers and any lending agent fees associated with the loan, plus any premium payments received for lending certain types of securities. Security lending income is presented in the Statement of Operations as a component of income from Fidelity Central Funds. Total security lending income during the period amounted to $34,966. During the period, there were no securities loaned to FCM.
9. Expense Reductions.
FMR or its affiliates agreed to waive certain fees during the period as noted in the table below.
Initial Class | $ 2,554 |
Service Class 2 | 2,391 |
Investor Class | 2,003 |
| $ 6,948 |
Many of the brokers with whom FMR places trades on behalf of the Fund provided services to the Fund in addition to trade execution. These services included payments of certain expenses on behalf of the Fund totaling $16,472 for the period.
10. Distributions to Shareholders.
Distributions to shareholders of each class were as follows:
Years ended December 31, | 2011 | 2010 |
From net investment income | | |
Initial Class | $ 1,547,182 | $ 800,107 |
Service Class 2 | 1,203,739 | 408,455 |
Investor Class | 1,210,997 | 471,994 |
Total | $ 3,961,918 | $ 1,680,556 |
11. Share Transactions.
Transactions for each class of shares were as follows:
| Shares | Dollars |
Years ended December 31, | 2011 | 2010 | 2011 | 2010 |
Initial Class | | | | |
Shares sold | 1,574,590 | 918,470 | $ 33,949,092 | $ 15,869,720 |
Reinvestment of distributions | 85,265 | 41,413 | 1,547,182 | 800,107 |
Shares redeemed | (2,344,843) | (2,546,072) | (48,318,203) | (41,769,770) |
Net increase (decrease) | (684,988) | (1,586,189) | $ (12,821,929) | $ (25,099,943) |
Service Class 2 | | | | |
Shares sold | 1,956,741 | 892,222 | $ 41,895,225 | $ 15,494,576 |
Reinvestment of distributions | 66,560 | 21,240 | 1,203,739 | 408,455 |
Shares redeemed | (1,700,278) | (1,926,104) | (34,316,363) | (31,528,158) |
Net increase (decrease) | 323,023 | (1,012,642) | $ 8,782,601 | $ (15,625,127) |
Investor Class | | | | |
Shares sold | 2,182,108 | 1,261,085 | $ 46,827,100 | $ 22,374,304 |
Reinvestment of distributions | 66,898 | 24,468 | 1,210,997 | 471,994 |
Shares redeemed | (1,706,869) | (1,440,817) | (35,163,625) | (23,451,552) |
Net increase (decrease) | 542,137 | (155,264) | $ 12,874,472 | $ (605,254) |
12. Other.
The Fund's organizational documents provide former and current trustees and officers with a limited indemnification against liabilities arising in connection with the performance of their duties to the Fund. In the normal course of business, the Fund may also enter into contracts that provide general indemnifications. The Fund's maximum exposure under these arrangements is unknown as this would be dependent on future claims that may be made against the Fund. The risk of material loss from such claims is considered remote.
At the end of the period, FMR or its affiliates were the owners of record of 64% of the total outstanding shares of the Fund and one otherwise unaffiliated shareholder was the owner of record of 35% of the total outstanding shares of the Fund.
Annual Report
Report of Independent Registered Public Accounting Firm
To the Trustees of Variable Insurance Products Fund IV and the Shareholders of VIP Energy Portfolio:
In our opinion, the accompanying statement of assets and liabilities, including the schedule of investments, and the related statements of operations and of changes in net assets and the financial highlights present fairly, in all material respects, the financial position of VIP Energy Portfolio (a fund of Variable Insurance Products Fund IV) at December 31, 2011, the results of its operations for the year then ended, the changes in its net assets for each of the two years in the period then ended and the financial highlights for each of the five years in the period then ended, in conformity with accounting principles generally accepted in the United States of America. These financial statements and financial highlights (hereafter referred to as "financial statements") are the responsibility of the VIP Energy Portfolio's management. Our responsibility is to express an opinion on these financial statements based on our audits. We conducted our audits of these financial statements in accordance with the standards of the Public Company Accounting Oversight Board (United States). Those standards require that we plan and perform the audit to obtain reasonable assurance about whether the financial statements are free of material misstatement. An audit includes examining, on a test basis, evidence supporting the amounts and disclosures in the financial statements, assessing the accounting principles used and significant estimates made by management, and evaluating the overall financial statement presentation. We believe that our audits, which included confirmation of securities at December 31, 2011 by correspondence with the custodian and brokers, provide a reasonable basis for our opinion.
/s/ PricewaterhouseCoopers LLP
PricewaterhouseCoopers LLP
Boston, Massachusetts
February 15, 2012
Annual Report
The Trustees, Members of the Advisory Board, and executive officers of the trust and fund, as applicable, are listed below. The Board of Trustees governs the fund and is responsible for protecting the interests of shareholders. The Trustees are experienced executives who meet periodically throughout the year to oversee the fund's activities, review contractual arrangements with companies that provide services to the fund, oversee management of the risks associated with such activities and contractual arrangements, and review the fund's performance. Except for James C. Curvey, each of the Trustees oversees 226 funds advised by FMR or an affiliate. Mr. Curvey oversees 429 funds advised by FMR or an affiliate.
The Trustees hold office without limit in time except that (a) any Trustee may resign; (b) any Trustee may be removed by written instrument, signed by at least two-thirds of the number of Trustees prior to such removal; (c) any Trustee who requests to be retired or who has become incapacitated by illness or injury may be retired by written instrument signed by a majority of the other Trustees; and (d) any Trustee may be removed at any special meeting of shareholders by a two-thirds vote of the outstanding voting securities of the trust. Each Trustee who is not an interested person (as defined in the 1940 Act) (Independent Trustee), shall retire not later than the last day of the calendar year in which his or her 75th birthday occurs. The Independent Trustees may waive this mandatory retirement age policy with respect to individual Trustees. The executive officers and Advisory Board Members hold office without limit in time, except that any officer and Advisory Board Member may resign or may be removed by a vote of a majority of the Trustees at any regular meeting or any special meeting of the Trustees. Except as indicated, each individual has held the office shown or other offices in the same company for the past five years.
Experience, Skills, Attributes, and Qualifications of the Fund's Trustees. The Governance and Nominating Committee has adopted a statement of policy that describes the experience, qualifications, attributes, and skills that are necessary and desirable for potential Independent Trustee candidates (Statement of Policy). The Board believes that each Trustee satisfied at the time he or she was initially elected or appointed a Trustee, and continues to satisfy, the standards contemplated by the Statement of Policy. The Governance and Nominating Committee also engages professional search firms to help identify potential Independent Trustee candidates who have the experience, qualifications, attributes, and skills consistent with the Statement of Policy. From time to time, additional criteria based on the composition and skills of the current Independent Trustees, as well as experience or skills that may be appropriate in light of future changes to board composition, business conditions, and regulatory or other developments, have also been considered by the professional search firms and the Governance and Nominating Committee. In addition, the Board takes into account the Trustees' commitment and participation in Board and committee meetings, as well as their leadership of standing and ad hoc committees throughout their tenure.
In determining that a particular Trustee was and continues to be qualified to serve as a Trustee, the Board has considered a variety of criteria, none of which, in isolation, was controlling. The Board believes that, collectively, the Trustees have balanced and diverse experience, qualifications, attributes, and skills, which allow the Board to operate effectively in governing the fund and protecting the interests of shareholders. Information about the specific experience, skills, attributes, and qualifications of each Trustee, which in each case led to the Board's conclusion that the Trustee should serve (or continue to serve) as a trustee of the fund, is provided below.
Board Structure and Oversight Function. James C. Curvey is an interested person (as defined in the 1940 Act) and currently serves as Acting Chairman. The Trustees have determined that an interested Chairman is appropriate and benefits shareholders because an interested Chairman has a personal and professional stake in the quality and continuity of services provided to the fund. Independent Trustees exercise their informed business judgment to appoint an individual of their choosing to serve as Chairman, regardless of whether the Trustee happens to be independent or a member of management. The Independent Trustees have determined that they can act independently and effectively without having an Independent Trustee serve as Chairman and that a key structural component for assuring that they are in a position to do so is for the Independent Trustees to constitute a substantial majority for the Board. The Independent Trustees also regularly meet in executive session. Ned C. Lautenbach serves as Chairman of the Independent Trustees and as such (i) acts as a liaison between the Independent Trustees and management with respect to matters important to the Independent Trustees and (ii) with management prepares agendas for Board meetings.
Fidelity funds are overseen by different Boards of Trustees. The fund's Board oversees Fidelity's equity and high income funds and another Board oversees Fidelity's investment-grade bond, money market, and asset allocation funds. The asset allocation funds may invest in Fidelity funds overseen by the fund's Board. The use of separate Boards, each with its own committee structure, allows the Trustees of each group of Fidelity funds to focus on the unique issues of the funds they oversee, including common research, investment, and operational issues. On occasion, the separate Boards establish joint committees to address issues of overlapping consequences for the Fidelity funds overseen by each Board.
The Trustees operate using a system of committees to facilitate the timely and efficient consideration of all matters of importance to the Trustees, the fund, and fund shareholders and to facilitate compliance with legal and regulatory requirements and oversight of the fund's activities and associated risks. The Board, acting through its committees, has charged FMR and its affiliates with (i) identifying events or circumstances the occurrence of which could have demonstrably adverse effects on the fund's business and/or reputation; (ii) implementing processes and controls to lessen the possibility that such events or circumstances occur or to mitigate the effects of such events or circumstances if they do occur; and (iii) creating and maintaining a system designed to evaluate continuously business and market conditions in order to facilitate the identification and implementation processes described in (i) and (ii) above. Because the day-to-day operations and activities of the fund are carried out by or through FMR, its affiliates and other service providers, the fund's exposure to risks is mitigated but not eliminated by the processes overseen by the Trustees. While each of the Board's committees has responsibility for overseeing different aspects of the fund's activities, oversight is exercised primarily through the Operations, Audit, and Compliance Committees. In addition, the Independent Trustees have worked with FMR to enhance the Board's oversight of investment and financial risks, legal and regulatory risks, technology risks, and operational risks, including the development of additional risk reporting to the Board. For example, a working group comprised of Independent Trustees and FMR has worked and continues to work to review the Fidelity funds' valuation-related activities, reporting and risk management. Appropriate personnel, including but not limited to the fund's Chief Compliance Officer (CCO), FMR's internal auditor, the independent accountants, the fund's Treasurer and portfolio management personnel, make periodic reports to the Board's committees, as appropriate, including an annual review of FMR's risk management program for the Fidelity funds. The responsibilities of each standing committee, including their oversight responsibilities, are described further under "Standing Committees of the Fund's Trustees."
Annual Report
Trustees and Officers - continued
The fund's Statement of Additional Information (SAI) includes more information about the Trustees. To request a free copy, call Fidelity at 1-877-208-0098.
Interested Trustees*:
Correspondence intended for each Trustee who is an interested person may be sent to Fidelity Investments, 82 Devonshire Street, Boston, Massachusetts 02109.
Name, Age; Principal Occupations and Other Relevant Experience+ |
James C. Curvey (76) |
| Year of Election or Appointment: 2007 Mr. Curvey is Trustee and Acting Chairman of the Board of Trustees of certain Trusts. Mr. Curvey also serves as Trustee (2007-present) of other investment companies advised by FMR. Mr. Curvey is a Director of Fidelity Investments Money Management, Inc. (2009-present), Director of Fidelity Research & Analysis Co. (2009-present) and Director of FMR and FMR Co., Inc. (2007-present). Mr. Curvey is also Vice Chairman (2007-present) and Director of FMR LLC. In addition, Mr. Curvey serves as an Overseer for the Boston Symphony Orchestra and a member of the Trustees of Villanova University. Previously, Mr. Curvey was the Vice Chairman (2006-2007) and Director (2000-2007) of FMR Corp. |
Ronald P. O'Hanley (54) |
| Year of Election or Appointment: 2011 Mr. O'Hanley is Director of FMR Co., Inc. (2010-present), Director of Fidelity Investments Money Management, Inc. (2010-present), Director of Fidelity Research & Analysis Company (2010-present), President of Fidelity Asset Management and Corporate Services and a member of Fidelity's Executive Committee (2010-present). Previously, Mr. O'Hanley served as President and Chief Executive Officer of BNY Mellon Asset Management (2007-2010). Mr. O'Hanley also served as Vice Chairman of Bank New York Mellon Corp. and a member of that firm's Executive Committee. Prior to the 2007 merger of The Bank of New York and Mellon Financial Corporation, he was Vice Chairman of Mellon Financial Corporation and President and Chief Executive Officer of Mellon Asset Management. He joined Mellon in February 1997. Mr. O'Hanley currently serves as Chairman of the Boston Public Library Foundation Board of Directors and sits on the Board of Directors of Beth Israel Deaconess Medical Center, the Board of Trustees of the Marine Biological Laboratory and the Advisory Board of the Maxwell School of Citizenship and Public Administration at Syracuse University. Mr. O'Hanley also chairs the Council on Asset Management for the Financial Services Roundtable and is a member of the Board of Directors of Institutional Investor's U.S. Institute. |
* Trustees have been determined to be "Interested Trustees" by virtue of, among other things, their affiliation with the trust or various entities under common control with FMR.
+ The information above includes each Trustee's principal occupation during the last five years and other information relating to the experience, attributes, and skills relevant to each Trustee's qualifications to serve as a Trustee, which led to the conclusion that each Trustee should serve as a Trustee for the fund.
Independent Trustees:
Correspondence intended for each Independent Trustee (that is, the Trustees other than the Interested Trustees) may be sent to Fidelity Investments, P.O. Box 55235, Boston, Massachusetts 02205-5235.
Name, Age; Principal Occupations and Other Relevant Experience+ |
Dennis J. Dirks (63) |
| Year of Election or Appointment: 2005 Prior to his retirement in May 2003, Mr. Dirks was Chief Operating Officer and a member of the Board of The Depository Trust & Clearing Corporation (DTCC). He also served as President, Chief Operating Officer, and Board member of The Depository Trust Company (DTC) and President and Board member of the National Securities Clearing Corporation (NSCC). In addition, Mr. Dirks served as Chief Executive Officer and Board member of the Government Securities Clearing Corporation, Chief Executive Officer and Board member of the Mortgage-Backed Securities Clearing Corporation, as a Trustee and a member of the Finance Committee of Manhattan College (2005-2008), and as a Trustee and a member of the Finance Committee of AHRC of Nassau County (2006-2008). Mr. Dirks is a member of the Independent Directors Council (IDC) Governing Council (2010-present) and Board of Directors for The Brookville Center for Children's Services, Inc. (2009-present). |
Alan J. Lacy (58) |
| Year of Election or Appointment: 2008 Mr. Lacy serves as Senior Adviser (2007-present) of Oak Hill Capital Partners, L.P. (private equity). Mr. Lacy also served as Chief Executive Officer (2000-2005) and Vice Chairman (2005-2006) of Sears Holdings Corporation and Sears, Roebuck and Co. (retail). In addition, Mr. Lacy serves as a member of the Board of Directors of Dave & Buster's, Inc. (restaurant and entertainment complexes, 2010-present), The Hillman Companies, Inc. (hardware wholesalers, 2010-present), and Bristol-Myers Squibb Company (global pharmaceuticals, 2007-present). Mr. Lacy is a member of the Board of Trustees of The National Parks Conservation Association (2006-present). Previously, Mr. Lacy served as Chairman of the Board of Trustees of the National Parks Conservation Association (2008-2011) and as a member of the Board of Directors for the Western Union Company (global money transfer, 2006-2011). |
Ned C. Lautenbach (67) |
| Year of Election or Appointment: 2000 Mr. Lautenbach is Chairman of the Independent Trustees of the Equity and High Income Funds (2006-present). Mr. Lautenbach currently serves as the Lead Director of the Eaton Corporation Board of Directors (diversified industrial, 1997-present). Mr. Lautenbach is also a member of the Board of Directors of the Philharmonic Center for the Arts in Naples, Florida (1999-present); a member of the Board of Trustees of Fairfield University (2005-present); and a member of the Council on Foreign Relations (1994-present). Previously, Mr. Lautenbach was a Partner/Advisory Partner at Clayton, Dubilier & Rice, LLC (private equity investment, 1998-2010), as well as a Director of Sony Corporation (2006-2007). |
Joseph Mauriello (67) |
| Year of Election or Appointment: 2008 Prior to his retirement in January 2006, Mr. Mauriello served in numerous senior management positions including Deputy Chairman and Chief Operating Officer (2004-2005), and Vice Chairman of Financial Services (2002-2004) of KPMG LLP US (professional services, 1965-2005). Mr. Mauriello currently serves as a member of the Board of Directors of XL Group plc. (global insurance and re-insurance, 2006-present) and of Arcadia Resources Inc. (health care services and products, 2007-present). Previously, Mr. Mauriello served as a Director of the Hamilton Funds of the Bank of New York (2006-2007). |
Robert W. Selander (61) |
| Year of Election or Appointment: 2011 Previously, Mr. Selander served as a Member of the Advisory Board of Fidelity's Equity and High Income Funds (2011), Executive Vice Chairman (2010), Chief Executive Officer (2009-2010), and President and Chief Executive Officer (1997-2009) of Mastercard, Inc. |
Cornelia M. Small (67) |
| Year of Election or Appointment: 2005 Ms. Small is a member of the Board of Directors of the Teagle Foundation (2009-present). Ms. Small is also a member of the Investment Committee, and Chair (2008-present) and a member of the Board of Trustees of Smith College. In addition, Ms. Small serves on the Investment Committee of the Berkshire Taconic Community Foundation (2008-present). Previously, Ms. Small served as Chairperson of the Investment Committee (2002-2008) of Smith College. In addition, Ms. Small served as Chief Investment Officer, Director of Global Equity Investments, and a member of the Board of Directors of Scudder, Stevens & Clark and Scudder Kemper Investments. |
William S. Stavropoulos (72) |
| Year of Election or Appointment: 2001 Mr. Stavropoulos is Vice Chairman of the Independent Trustees of the Equity and High Income Funds (2006-present). Mr. Stavropoulos serves as President and Founder of the Michigan Baseball Foundation, the Great Lakes Loons (2007-present). Mr. Stavropoulos is Chairman Emeritus of the Board of Directors of The Dow Chemical Company, where he previously served in numerous senior management positions, including President, CEO (1995-2000; 2002-2004), Chairman of the Executive Committee (2000-2006), and as a member of the Board of Directors (1990-2006). Currently, Mr. Stavropoulos is Chairman of Univar (global distributor of commodity and specialty chemicals, 2010-present), a Director of Teradata Corporation (data warehousing and technology solutions, 2008-present), Chemical Financial Corporation, Maersk Inc. (industrial conglomerate), Tyco International, Inc. (multinational manufacturing and services, 2007-present), and a member of the Advisory Board for Metalmark Capital (private equity investment, 2005-present). Mr. Stavropoulos is a special advisor to Clayton, Dubilier & Rice, LLC (private equity investment). In addition, Mr. Stavropoulos is a member of the University of Notre Dame Advisory Council for the College of Science. |
David M. Thomas (62) |
| Year of Election or Appointment: 2008 Previously, Mr. Thomas served as Executive Chairman (2005-2006) and Chairman and Chief Executive Officer (2000-2005) of IMS Health, Inc. (pharmaceutical and healthcare information solutions). In addition, Mr. Thomas serves as a member of the Board of Directors of Fortune Brands, Inc. (consumer products), and Interpublic Group of Companies, Inc. (marketing communication, 2004-present). |
Michael E. Wiley (61) |
| Year of Election or Appointment: 2008 Mr. Wiley also serves as a Director of Asia Pacific Exploration Consolidated (international oil and gas exploration and production, 2008-present). Mr. Wiley serves as a Director of Tesoro Corporation (independent oil refiner and marketer, 2005-present), and a Director of Bill Barrett Corporation (exploration and production, 2005-present). In addition, Mr. Wiley also serves as a Director of Post Oak Bank (privately-held bank, 2004-present). Previously, Mr. Wiley served as a member of the Board of Trustees of the University of Tulsa (2000-2006; 2007-2010), as a Senior Energy Advisor of Katzenbach Partners, LLC (consulting, 2006-2007), as an Advisory Director of Riverstone Holdings (private investment), Chairman, President, and CEO of Baker Hughes, Inc. (oilfield services, 2000-2004), and as Director of Spinnaker Exploration Company (exploration and production, 2001-2005). |
+ The information above includes each Trustee's principal occupation during the last five years and other information relating to the experience, attributes, and skills relevant to each Trustee's qualifications to serve as a Trustee, which led to the conclusion that each Trustee should serve as a Trustee for the fund.
Advisory Board Members and Executive Officers:
Correspondence intended for each executive officer, Edward C. Johnson 3d, and Peter S. Lynch may be sent to Fidelity Investments, 82 Devonshire Street, Boston, Massachusetts 02109.
Name, Age; Principal Occupation |
Edward C. Johnson 3d (81) |
| Year of Election or Appointment: 2011 Member of the Advisory Board of Fidelity's Equity and High Income Funds. Mr. Johnson serves as Chief Executive Officer, Chairman, and a Director of FMR LLC, and also serves as Chairman and Director of FIL Limited. Previously, Mr. Johnson served as a Trustee and Chairman of the Board of certain Fidelity Trusts, Chairman and a Director of FMR, Chairman and a Director of FMR Co., Inc., and President of FMR LLC (2006-2007). |
Peter S. Lynch (67) |
| Year of Election or Appointment: 2003 Member of the Advisory Board of Fidelity's Equity and High Income Funds. Mr. Lynch is Vice Chairman and a Director of FMR and FMR Co., Inc. In addition, Mr. Lynch serves as a Trustee of Boston College and as the Chairman of the Inner-City Scholarship Fund. Previously, Mr. Lynch served on the Special Olympics International Board of Directors (1997-2006). |
Kenneth B. Robins (42) |
| Year of Election or Appointment: 2008 President and Treasurer of Fidelity's Equity and High Income Funds. Mr. Robins also serves as President and Treasurer (2010-present) and Assistant Treasurer (2009-present) of other Fidelity funds and is an employee of Fidelity Investments (2004-present). Previously, Mr. Robins served as Deputy Treasurer of the Fidelity funds (2005-2008) and Treasurer and Chief Financial Officer of The North Carolina Capital Management Trust: Cash and Term Portfolios (2006-2008). |
Brian B. Hogan (47) |
| Year of Election or Appointment: 2009 Vice President of Equity and High Income Funds. Mr. Hogan also serves as President of FMR's Equity Division (2009-present). Previously, Mr. Hogan served as Senior Vice President, Equity Research of FMR (2006-2009) and as a portfolio manager. |
Christopher S. Bartel (40) |
| Year of Election or Appointment: 2009 Vice President of Fidelity's Sector and Real Estate Equity Funds. Mr. Bartel also serves as Senior Vice President of Equity Research (2009-present). Previously, Mr. Bartel served as Managing Director of Research (2006-2009) and an analyst and portfolio manager (2000-2006). |
Scott C. Goebel (43) |
| Year of Election or Appointment: 2008 Secretary and Chief Legal Officer (CLO) of the Fidelity funds. Mr. Goebel also serves as Secretary of Fidelity Investments Money Management, Inc. (FIMM) (2010-present) and Fidelity Research and Analysis Company (FRAC) (2010-present); Secretary and CLO of The North Carolina Capital Management Trust: Cash and Term Portfolios (2008-present); General Counsel, Secretary, and Senior Vice President of FMR (2008-present) and FMR Co., Inc. (2008-present); employed by FMR LLC or an affiliate (2001-present); Chief Legal Officer of Fidelity Management & Research (Hong Kong) Limited (2008-present) and Assistant Secretary of Fidelity Management & Research (Japan) Inc. (2008-present), and Fidelity Management & Research (U.K.) Inc. (2008-present). Previously, Mr. Goebel served as Assistant Secretary of FIMM (2008-2010), FRAC (2008-2010), and the Funds (2007-2008) and as Vice President and Secretary of Fidelity Distributors Corporation (FDC) (2005-2007). |
William C. Coffey (42) |
| Year of Election or Appointment: 2009 Assistant Secretary of Fidelity's Equity and High Income Funds. Mr. Coffey also serves as Senior Vice President and Deputy General Counsel of FMR LLC (2010-present), and is an employee of Fidelity Investments. Previously, Mr. Coffey served as Vice President and Associate General Counsel of FMR LLC (2005-2009). |
Holly C. Laurent (57) |
| Year of Election or Appointment: 2008 Anti-Money Laundering (AML) Officer of the Fidelity funds. Ms. Laurent also serves as AML Officer of The North Carolina Capital Management Trust: Cash and Term Portfolios (2008-present) and is an employee of Fidelity Investments. Previously, Ms. Laurent was Senior Vice President and Head of Legal for Fidelity Business Services India Pvt. Ltd. (2006-2008), and Senior Vice President, Deputy General Counsel and Group Head for FMR LLC (2005-2006). |
Christine Reynolds (53) |
| Year of Election or Appointment: 2008 Chief Financial Officer of the Fidelity funds. Ms. Reynolds became President of Fidelity Pricing and Cash Management Services (FPCMS) in August 2008. Ms. Reynolds served as Chief Operating Officer of FPCMS (2007-2008). Previously, Ms. Reynolds served as President, Treasurer, and Anti-Money Laundering officer of the Fidelity funds (2004-2007). |
Kenneth A. Rathgeber (64) |
| Year of Election or Appointment: 2004 Chief Compliance Officer of Fidelity's Equity and High Income Funds. Mr. Rathgeber is Chief Compliance Officer of Fidelity Management & Research (Hong Kong) Limited (2008-present), Fidelity Management & Research (Japan) Inc. (2008-present), FMR (2005-present), FMR Co., Inc. (2005-present), Fidelity Management & Research (U.K.) Inc. (2005-present), Fidelity Research & Analysis Company (2005-present), Fidelity Investments Money Management, Inc. (2005-present), Pyramis Global Advisors, LLC (2005-present), and Strategic Advisers, Inc. (2005-present). |
Jeffrey S. Christian (50) |
| Year of Election or Appointment: 2009 Deputy Treasurer of the Fidelity funds. Mr. Christian is an employee of Fidelity Investments. Previously, Mr. Christian served as Chief Financial Officer (2008-2009) of certain Fidelity funds and Senior Vice President of Fidelity Pricing and Cash Management Services (FPCMS) (2004-2009). |
Joseph F. Zambello (54) |
| Year of Election or Appointment: 2011 Deputy Treasurer of the Fidelity funds. Mr. Zambello is an employee of Fidelity Investments. Previously, Mr. Zambello served as Vice President of FMR's Program Management Group (2009-2011) and Vice President of the Transfer Agent Oversight Group (2005-2009). |
Adrien E. Deberghes (44) |
| Year of Election or Appointment: 2008 Deputy Treasurer of Fidelity's Equity and High Income Funds. Mr. Deberghes also serves as Vice President and Assistant Treasurer of Fidelity Rutland Square Trust II and Fidelity Commonwealth Trust II (2011-present), Assistant Treasurer of other Fidelity funds (2010-present), and is an employee of Fidelity Investments (2008-present). Previously, Mr. Deberghes served as Senior Vice President of Mutual Fund Administration at State Street Corporation (2007-2008), Senior Director of Mutual Fund Administration at Investors Bank & Trust (2005-2007), and Director of Finance for Dunkin' Brands (2000-2005). |
Stephanie J. Dorsey (42) |
| Year of Election or Appointment: 2010 Assistant Treasurer of Fidelity's Equity and High Income Funds. Ms. Dorsey also serves as Deputy Treasurer of other Fidelity funds (2008-present) and is an employee of Fidelity Investments (2008-present). Previously, Ms. Dorsey served as Treasurer (2004-2008) of the JPMorgan Mutual Funds and Vice President (2004-2008) of JPMorgan Chase Bank. |
John R. Hebble (53) |
| Year of Election or Appointment: 2009 Assistant Treasurer of Fidelity's Equity and High Income Funds. Mr. Hebble also serves as President (2011-present), Treasurer, and Chief Financial Officer of The North Carolina Capital Management Trust: Cash and Term Portfolios (2008-present), President and Treasurer of other Fidelity funds (2008-present) and is an employee of Fidelity Investments. |
Gary W. Ryan (53) |
| Year of Election or Appointment: 2005 Assistant Treasurer of the Fidelity funds. Mr. Ryan is an employee of Fidelity Investments. Previously, Mr. Ryan served as Vice President of Fund Reporting in Fidelity Pricing and Cash Management Services (FPCMS) (1999-2005). |
Jonathan Davis (43) |
| Year of Election or Appointment: 2010 Assistant Treasurer of the Fidelity funds. Mr. Davis is also Assistant Treasurer of Fidelity Rutland Square Trust II and Fidelity Commonwealth Trust II. Mr. Davis is an employee of Fidelity Investments. Previously, Mr. Davis served as Vice President and Associate General Counsel of FMR LLC (2003-2010). |
Annual Report
Service Class 2R designates 100% of the dividends distributed in February and December 2011, respectively during the fiscal year as qualifying for the dividends-received deduction for corporate shareholders.
Annual Report
Board Approval of Investment Advisory Contracts and Management Fees
VIP Energy Portfolio
Each year, the Board of Trustees, including the Independent Trustees (together, the Board), votes on the renewal of the management contract and sub-advisory agreements (together, the Advisory Contracts) for the fund. The Board, assisted by the advice of fund counsel and Independent Trustees' counsel, requests and considers a broad range of information relevant to the renewal of the Advisory Contracts throughout the year.
The Board meets regularly and considers at each of its meetings factors that are relevant to its annual consideration of the renewal of the fund's Advisory Contracts, including the services and support provided to the fund and its shareholders. The Board has established various standing committees, each composed of Independent Trustees with varying backgrounds, to which the Board has assigned specific subject matter responsibilities in order to enhance effective decision-making by the Board. The Board, acting directly and through its Committees, requests and receives information concerning the annual consideration of the renewal of the fund's Advisory Contracts. The Board also meets as needed to consider matters specifically related to the Board's annual consideration of the renewal of Advisory Contracts. Members of the Board may also meet with trustees of other Fidelity funds through ad hoc joint committees to discuss certain matters relevant to the Fidelity funds.
At its July 2011 meeting, the Board of Trustees, including the Independent Trustees, unanimously determined to renew the fund's Advisory Contracts. In reaching its determination, the Board considered all factors it believed relevant, including (i) the nature, extent, and quality of the services to be provided to the fund and its shareholders (including the investment performance of the fund); (ii) the competitiveness of the fund's management fee and total expense ratio; (iii) the total costs of the services to be provided by and the profits to be realized by Fidelity from its relationship with the fund; (iv) the extent to which economies of scale would be realized as the fund grows; and (v) whether fee levels reflect these economies of scale, if any, for the benefit of fund shareholders.
In considering whether to renew the Advisory Contracts for the fund, the Board reached a determination, with the assistance of fund counsel and Independent Trustees' counsel and through the exercise of its business judgment, that the renewal of the Advisory Contracts is in the best interests of the fund and its shareholders and that the compensation payable under the Advisory Contracts is fair and reasonable. The Board's decision to renew the Advisory Contracts was not based on any single factor, but rather was based on a comprehensive consideration of all the information provided to the Board at its meetings throughout the year. The Board, in reaching its determination to renew the Advisory Contracts, is aware that shareholders in the fund have a broad range of investment choices available to them, including a wide choice among mutual funds offered by Fidelity's competitors, and that the fund's shareholders, who have the opportunity to review and weigh the disclosure provided by the fund in its prospectus and other public disclosures, have chosen to invest in this fund, managed by Fidelity.
Nature, Extent, and Quality of Services Provided. The Board considered the staffing within the investment adviser, FMR, and the sub-advisers (together, the Investment Advisers), including the backgrounds of the fund's investment personnel and the fund's investment objective and discipline. The Independent Trustees also had discussions with senior management of Fidelity's investment operations and investment groups. The Board considered the structure of the portfolio manager compensation program and whether this structure provides appropriate incentives to act in the best interests of the fund.
Resources Dedicated to Investment Management and Support Services. The Board and the Fund Oversight and Research Committees reviewed the general qualifications and capabilities of the Investment Advisers' investment staff, including its size, education, experience, and resources, as well as the Investment Advisers' approach to recruiting, training, managing, and compensating investment personnel. The Board also noted that FMR has devoted increased resources to non-U.S. offices. The Board noted that Fidelity's analysts have extensive resources, tools and capabilities which allow them to conduct sophisticated quantitative and fundamental analysis, as well as credit analysis of issuers, counterparties and enhancers. The Board also believes that Fidelity's investment professionals have sufficient access to global information and data so as to provide competitive investment results over time, and that those professionals also have access to sophisticated tools which permit them to assess portfolio construction and risk and performance attribution characteristics continuously, as well as to transmit new information and research conclusions rapidly around the world. Additionally, in their deliberations, the Board considered the Investment Advisers' trading capabilities and resources which are an integral part of the investment management process.
Shareholder and Administrative Services. The Board considered (i) the nature, extent, quality, and cost of advisory, administrative, and shareholder services performed by the Investment Advisers and their affiliates under the Advisory Contracts and under separate agreements covering transfer agency, pricing and bookkeeping, and securities lending services for the fund; (ii) the nature and extent of the investment adviser's supervision of third party service providers, principally custodians and subcustodians; and (iii) the resources devoted to, and the record of compliance with, the fund's compliance policies and procedures. The Board also reviewed the allocation of fund brokerage, including allocations to brokers affiliated with the Investment Advisers, the use of brokerage commissions to pay fund expenses, and the use of "soft" commission dollars to pay for research services.
The Board noted that the growth of fund assets over time across the complex allows Fidelity to reinvest in the development of services designed to enhance the value or convenience of the Fidelity funds as investment vehicles. These services include 24-hour access to account information and market information through telephone representatives and over the Internet, investor education materials and asset allocation tools, and the expanded availability of Fidelity Investor Centers, with 35 new branches opening since 2010.
Annual Report
Investment in a Large Fund Family. The Board considered the benefits to shareholders of investing in a Fidelity fund, including the benefits of investing in a fund that is part of a large family of funds offering a variety of investment disciplines and providing a large variety of mutual fund investor services. The Board noted that Fidelity had taken, or had made recommendations that resulted in the Fidelity funds taking, a number of actions over the previous year that benefited particular funds, including (i) continuing to dedicate additional resources to investment research and support of the senior management team that oversees asset management; (ii) rationalizing product lines through the mergers of six funds into other funds; (iii) continuing to migrate the Freedom Funds to dedicated lower cost underlying funds; (iv) obtaining shareholder approval to broaden the investment strategies for Fidelity Consumer Finance Portfolio, Fidelity Emerging Asia Fund, and Fidelity Environment and Alternative Energy Portfolio; (v) contractually agreeing to reduce the management fees and impose other expense limitations on Spartan 500 Index Fund and U.S. Bond Index Fund in connection with launching new institutional classes of these funds; (vi) changing the name, primary and supplemental benchmarks, and investment policies of Fidelity Global Strategies Fund to support the fund's flexible investment mandate and global orientation; and (vii) reducing the transfer agency account fee rates on certain accounts.
Investment Performance. The Board considered whether the fund has operated in accordance with its investment objective, as well as its record of compliance with its investment restrictions. It also reviewed the fund's absolute investment performance for each class, as well as the fund's relative investment performance for each class measured over multiple periods against a third-party-sponsored index that reflects the market sector in which the fund invests. The Board noted that FMR does not believe that a meaningful peer group exists against which to compare the fund's performance. The following charts considered by the Board show, over the one-, three-, and five-year periods ended December 31, 2010, the cumulative total returns of Initial Class and Service Class 2 of the fund and the cumulative total returns of a third-party-sponsored index ("benchmark"). The returns of Initial Class and Service Class 2 show the performance of the highest and lowest performing classes, respectively (based on five-year performance).
VIP Energy Portfolio
The Board noted that the investment performance of the fund was lower than its benchmark for all the periods shown. The Board considered that the variations in performance among the fund's classes reflect the variations in class expenses, which result in lower performance for higher expense classes. The Board discussed with FMR actions that have been taken by FMR to improve the fund's below-benchmark performance. The Board also reviewed the fund's performance since inception as well as performance in the current year. The Board will continue to closely monitor the performance of the fund in the coming year and discuss with FMR other appropriate actions to address the performance of the fund.
Based on its review, the Board concluded that the nature, extent, and quality of services provided to the fund under the Advisory Contracts should benefit the fund's shareholders.
Competitiveness of Management Fee and Total Expense Ratio. The Board considered the fund's management fee and total expense ratio compared to "mapped groups" of competitive funds and classes. Fidelity creates "mapped groups" by combining similar Lipper investment objective categories that have comparable management fee characteristics. Combining Lipper investment objective categories aids the Board's management fee and total expense ratio comparisons by broadening the competitive group used for comparison and by reducing the number of universes to which various Fidelity funds are compared.
Management Fee. The Board considered two proprietary management fee comparisons for the 12-month periods shown in the chart below. The group of Lipper funds used by the Board for management fee comparisons is referred to below as the "Total Mapped Group." The Total Mapped Group comparison focuses on a fund's standing relative to the total universe of comparable funds available to investors in terms of gross management fees before expense reimbursements or caps. "TMG %" represents the percentage of funds in the Total Mapped Group that had management fees that were lower than the fund's. For example, a TMG % of 2% means that 98% of the funds in the Total Mapped Group had higher management fees than the fund. The "Asset-Size Peer Group" (ASPG) comparison focuses on a fund's standing relative to non-Fidelity funds similar in size to the fund within the Total Mapped Group. The ASPG represents at least 15% of the funds in the Total Mapped Group with comparable asset size and management fee characteristics, subject to a minimum of 50 funds (or all funds in the Total Mapped Group if fewer than 50). Additional information, such as the ASPG quartile in which the fund's management fee ranked, is also included in the chart and considered by the Board.
Annual Report
Board Approval of Investment Advisory Contracts and Management Fees - continued
VIP Energy Portfolio
The Board noted that the fund's management fee ranked below the median of its Total Mapped Group and below the median of its ASPG for 2010.
Based on its review, the Board concluded that the fund's management fee is fair and reasonable in light of the services that the fund receives and the other factors considered.
Total Expense Ratio. In its review of each class's total expense ratio, the Board considered the fund's management fee as well as other fund or class expenses, as applicable, such as transfer agent fees, pricing and bookkeeping fees, fund-paid 12b-1 fees, and custodial, legal, and audit fees. The Board also noted the effects of any waivers and reimbursements on fees and expenses. As part of its review, the Board also considered the current and historical total expense ratios of each class of the fund compared to competitive fund median expenses. Each class of the fund is compared to those funds and classes in the Total Mapped Group (used by the Board for management fee comparisons) that have a similar sales load structure.
The Board noted that the total expense ratio of each class ranked below its competitive median for 2010. The Board considered that various factors, including 12b-1 fees, positive or negative performance adjustments, and relatively higher other expenses in the case of small fund size, can affect total expense ratios. The Board also noted that Investor Class has higher transfer agent fees than traditional variable annuity classes because it is designed for lower cost annuity products, where the majority of servicing costs are incorporated into the funds' total expense ratios rather than being paid at the annuity level.
Fees Charged to Other Fidelity Clients. The Board also considered Fidelity fee structures and other information with respect to clients of FMR and its affiliates, such as other mutual funds advised or subadvised by FMR or its affiliates, pension plan clients, and other institutional clients. In March 2010, the Board created an ad hoc joint committee with the board of other Fidelity funds (the Committee) to review and compare Fidelity's institutional investment advisory business with its business of providing services to the Fidelity funds, including the differences in services provided, fees charged, and costs incurred, as well as competition in their respective marketplaces.
Based on its review of total expense ratios and fees charged to other Fidelity clients, the Board concluded that the total expense ratio of each class of the fund was reasonable in light of the services that the fund and its shareholders receive and the other factors considered, including the findings of the Committee.
Costs of the Services and Profitability. The Board considered the revenues earned and the expenses incurred by Fidelity in conducting the business of developing, marketing, distributing, managing, administering and servicing the fund and its shareholders. The Board also considered the level of Fidelity's profits in respect of all the Fidelity funds.
Annual Report
On an annual basis, FMR presents to the Board Fidelity's profitability for the fund. Fidelity calculates the profitability for each fund, as well as aggregate profitability for groups of Fidelity funds and all Fidelity funds, using a series of detailed revenue and cost allocation methodologies which originate with the books and records of Fidelity on which Fidelity's audited financial statements are based. The Audit Committee of the Board reviews any significant changes from the prior year's methodologies.
PricewaterhouseCoopers LLP (PwC), independent registered public accounting firm and auditor to Fidelity and certain Fidelity funds, has been engaged annually by the Board as part of the Board's assessment of Fidelity's profitability analysis. PwC's engagement includes the review and assessment of Fidelity's methodologies used in determining the revenues and expenses attributable to Fidelity's mutual fund business, and completion of agreed-upon procedures surrounding the mathematical accuracy of fund profitability and its conformity to allocation methodologies. After considering PwC's reports issued under the engagement and information provided by Fidelity, the Board concluded that while other allocation methods may also be reasonable, Fidelity's profitability methodologies are reasonable in all material respects.
The Board also reviewed Fidelity's non-fund businesses and fall-out benefits related to the mutual fund business as well as cases where Fidelity's affiliates may benefit from or be related to the fund's business.
The Board considered the costs of the services provided by and the profits realized by Fidelity in connection with the operation of the fund and was satisfied that the profitability was not excessive in the circumstances.
Economies of Scale. The Board considered whether there have been economies of scale in respect of the management of the Fidelity funds, whether the Fidelity funds (including the fund) have appropriately benefited from any such economies of scale, and whether there is potential for realization of any further economies of scale. The Board considered the extent to which the fund will benefit from economies of scale through increased services to the fund, through waivers or reimbursements, or through fee or expense reductions. The Board also noted that in 2009, it and the board of other Fidelity funds created an ad hoc committee (the Economies of Scale Committee) to analyze whether FMR attains economies of scale in respect of the management and servicing of the Fidelity funds, whether the Fidelity funds have appropriately benefited from such economies of scale, and whether there is potential for realization of any further economies of scale.
The Board recognized that the fund's management contract incorporates a "group fee" structure, which provides for lower group fee rates as total fund assets under FMR's management increase, and for higher group fee rates as total fund assets under FMR's management decrease. FMR calculates the group fee rates based on a tiered asset "breakpoint" schedule that varies based on asset class. The Board considered that the group fee is designed to deliver the benefits of economies of scale to fund shareholders when total Fidelity fund assets increase, even if assets of any particular fund are unchanged or have declined, because some portion of Fidelity's costs are attributable to services provided to all Fidelity funds, and all funds benefit if those costs can be allocated among more assets. The Board concluded that, given the group fee structure, fund shareholders will benefit from lower management fees as assets under FMR's management increase at the fund complex level, regardless of whether Fidelity achieves any such economies of scale.
The Board concluded, taking into account the analysis of the Economies of Scale Committee, that any potential economies of scale are being appropriately shared between fund shareholders and Fidelity.
Additional Information Requested by the Board. In order to develop fully the factual basis for consideration of the Fidelity funds' Advisory Contracts, the Board requested and received additional information on certain topics, including (i) fund performance trends, actions to be taken by FMR to improve certain funds' overall performance, and Fidelity's long-term strategies for certain funds; (ii) portfolio manager changes that have occurred during the past year and length of portfolio manager tenure for different categories of funds over time; (iii) Fidelity's compensation structure for portfolio managers and other key personnel and strategies for attracting and retaining non-investment personnel; (iv) the amount of the investment that each portfolio manager has made in the Fidelity fund(s) that he or she manages; (v) historical trends in Fidelity's realization of fall-out benefits; (vi) Fidelity's group fee structures and the rationale for the individual fee rates of certain funds; (vii) fund profitability methodology and the impact of certain factors on fund profitability results; (viii) trends regarding industry use of performance fee structures and Fidelity's compliance practices with respect to performance adjustment calculations; (ix) the fee structures in place for certain other Fidelity clients; and (x) explanations regarding the relative total expense ratios of certain funds and classes, total expense competitive trends, and actions that might be taken by FMR to reduce total expense ratios for certain funds and classes.
Based on its evaluation of all of the conclusions noted above, and after considering all factors it believed relevant, the Board ultimately concluded that the advisory fee structures are fair and reasonable, and that the fund's Advisory Contracts should be renewed.
Annual Report
Investment Adviser
Fidelity Management & Research Company
Boston, MA
Investment Sub-Advisers
FMR Co., Inc.
Fidelity Management & Research (U.K.) Inc.
Fidelity Management & Research (Hong Kong) Limited
Fidelity Management & Research (Japan) Inc.
General Distributor
Fidelity Distributors Corporation
Boston, MA
Transfer and Service Agents
Fidelity Investments Institutional Operations Company, Inc.
Boston, MA
Fidelity Service Company, Inc.
Boston, MA
Custodian
State Street Bank & Trust Co.
Quincy, MA
VNR2-ANN-0212
1.826359.107
Fidelity® Variable Insurance Products:
Energy Portfolio
Annual Report
December 31, 2011
Contents
Performance | (Click Here) | How the fund has done over time. |
Management's Discussion of Fund Performance | (Click Here) | The Portfolio Manager's review of fund performance and strategy. |
Shareholder Expense Example | (Click Here) | An example of shareholder expenses. |
Investment Changes | (Click Here) | A summary of major shifts in the fund's investments over the past six months. |
Investments | (Click Here) | A complete list of the fund's investments with their market values. |
Financial Statements | (Click Here) | Statements of assets and liabilities, operations, and changes in net assets, as well as financial highlights. |
Notes | (Click Here) | Notes to the financial statements. |
Report of Independent Registered Public Accounting Firm | (Click Here) | |
Trustees and Officers | (Click Here) | |
Distributions | (Click Here) | |
Board Approval of Investment Advisory Contracts and Management Fees | (Click Here) | |
To view a fund's proxy voting guidelines and proxy voting record for the 12-month period ended June 30, visit http://www.fidelity.com/proxyvotingresults or visit the Securities and Exchange Commission's (SEC) web site at http://www.sec.gov. You may also call 1-877-208-0098 to request a free copy of the proxy voting guidelines.
Fidelity Variable Insurance Products are separate account options which are purchased through a variable insurance contract.
Standard & Poor's, S&P and S&P 500 are registered service marks of The McGraw-Hill Companies, Inc. and have been licensed for use by Fidelity Distributors Corporation.
Other third party marks appearing herein are the property of their respective owners.
All other marks appearing herein are registered or unregistered trademarks or service marks of FMR LLC or an affiliated company.
This report and the financial statements contained herein are submitted for the general information of the shareholders of the fund. This report is not authorized for distribution to prospective investors in the fund unless preceded or accompanied by an effective prospectus.
A fund files its complete schedule of portfolio holdings with the SEC for the first and third quarters of each fiscal year on Form N-Q. Forms N-Q are available on the SEC's web site at http://www.sec.gov. A fund's Forms N-Q may be reviewed and copied at the SEC's Public Reference Room in Washington, DC. Information regarding the operation of the SEC's Public Reference Room may be obtained by calling 1-800-SEC-0330. For a complete list of the fund's portfolio holdings, view the most recent holdings listing, semiannual report, or annual report on Fidelity's web site at http://www.fidelity.com, http://www.advisor.fidelity.com, or http://www.401k.com, as applicable.
NOT FDIC INSURED • MAY LOSE VALUE • NO BANK GUARANTEE
Neither the fund nor Fidelity Distributors Corporation is a bank.
Annual Report
Average annual total return reflects the change in the value of an investment, assuming reinvestment of the class' distributions from dividend income and capital gains (the profits earned upon the sale of securities that have grown in value, if any) and assuming a constant rate of performance each year. During periods of reimbursement by Fidelity, a fund's total return will be greater than it would be had the reimbursement not occurred. Performance numbers are net of all underlying fund operating expenses, but do not include any insurance charges imposed by your insurance company's separate account. If performance information included the effect of these additional charges, the total returns would have been lower. How a fund did yesterday is no guarantee of how it will do tomorrow.
Average Annual Total Returns
Periods ended December 31, 2011 | Past 1
year | Past 5
years | Past 10
years |
VIP Energy Portfolio - Initial Class A | -4.99% | 2.30% | 10.62% |
VIP Energy Portfolio - Investor ClassA,B | -5.09% | 2.21% | 10.54% |
A Prior to October 1, 2006, VIP Energy Portfolio operated under certain different investment policies. The historical performance for the fund may not represent its current investment policies.
B The initial offering of Investor Class took place on July 21, 2005. Returns prior to July 21, 2005 are those of Initial Class. If Investor Class's transfer agent fee had been reflected, returns prior to July 21, 2005 would have been lower.
$10,000 Over 10 Years
Let's say hypothetically that $10,000 was invested in VIP Energy Portfolio - Initial Class on December 31, 2001. The chart shows how the value of your investment would have changed, and also shows how the S&P 500® Index performed over the same period.
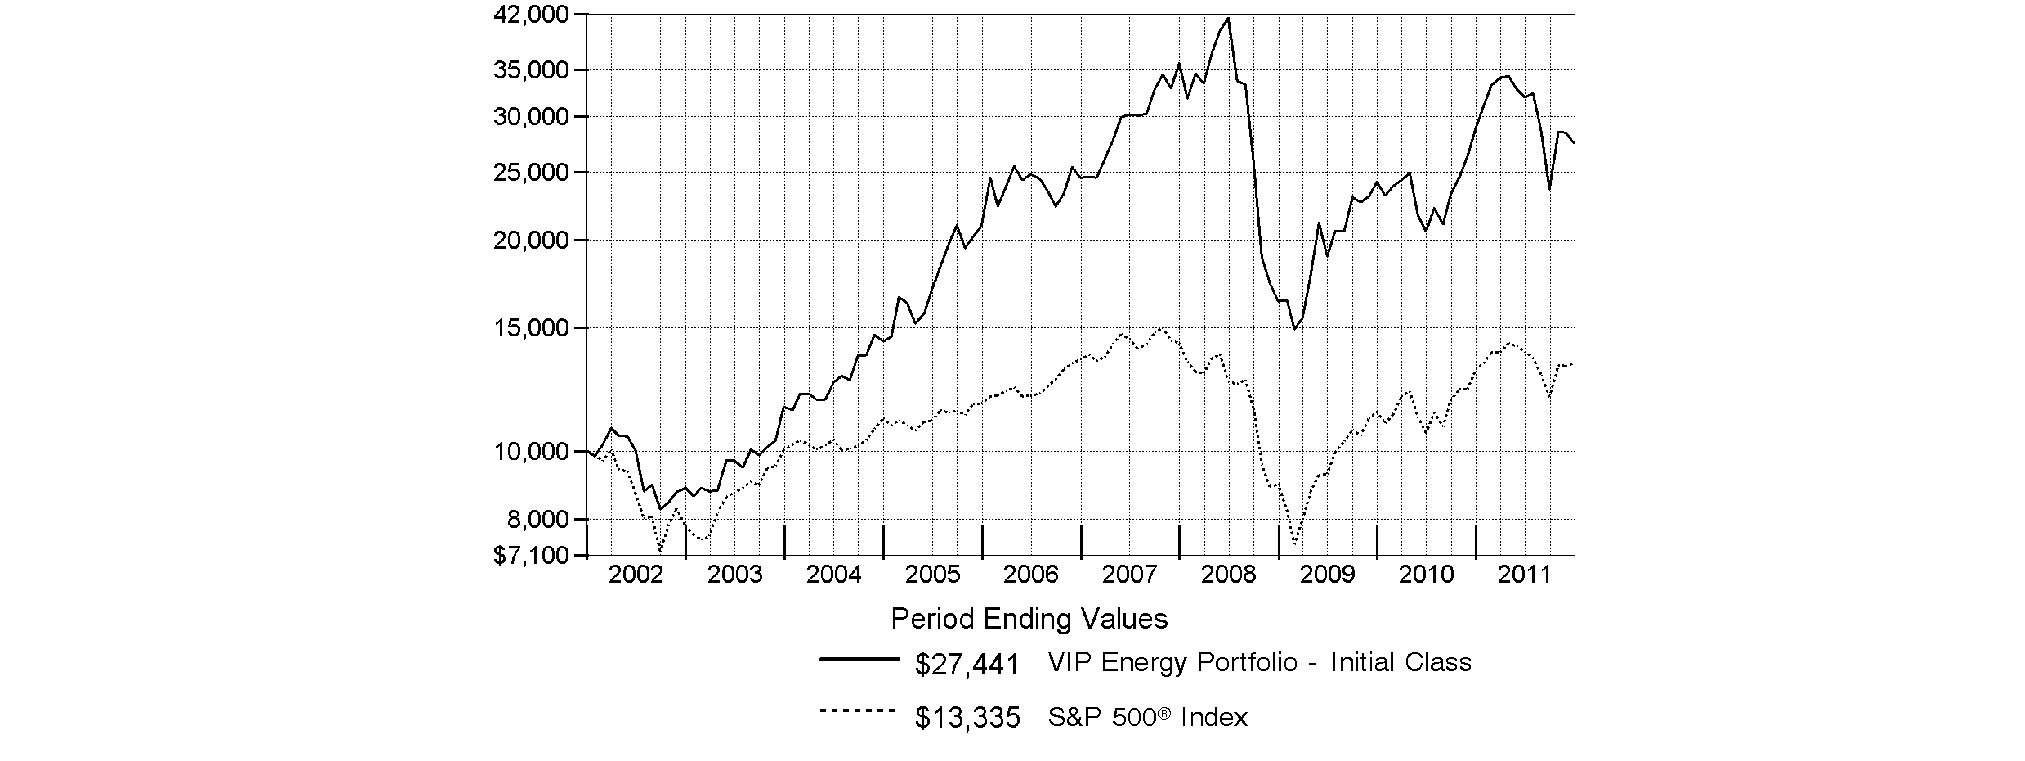
Annual Report
Market Recap: Extreme market volatility took center stage during the 12 months ending December 31, 2011, stealing the spotlight from signs of progress in the global economy. Early in the year, aggressive monetary stimulus by the U.S. federal government, improving credit-market conditions and solid corporate earnings buoyed most major asset classes. As the period progressed, however, fresh worries about sovereign debt in Europe, inflation in China, gridlock over raising the debt ceiling in the U.S. - along with Standard & Poor's early-August downgrade of the nation's long-term sovereign credit rating - and a dimmed outlook for global growth punctured investor confidence and ignited market instability. Domestic equities, as measured by the broad-based S&P 500® Index, gained 2.11%, easily outpacing the 13.61% decline of MSCI® ACWI® (All Country World Index) ex USA Index, a proxy for foreign stocks. Within the MSCI index, emerging markets declined the most (-18%), with investments here generally held back by a stronger U.S. dollar. The U.K. (-3%) fared better than the rest of Europe (-15%), which was the second-worst-performing index component. Bolstered by periodic flights to quality, U.S. investment-grade bonds posted a 7.84% advance, as reflected by the Barclays Capital® U.S. Aggregate Bond Index, outperforming the 4.37% gain of high-yield securities, as represented by The BofA Merrill LynchSM US High Yield Constrained Index. Hampered by financial woes in Europe, the sovereign debt of major developed markets outside the U.S. rose 4.86%, according to the Citigroup® Non-USD Group-of-Seven (G7) Equal Weighted Index, while the JPMorgan Emerging Markets Bond Index Global (EMBI Global) advanced 8.46%, despite the currency head wind.
Comments from John Dowd, Portfolio Manager of VIP Energy Portfolio: For the year, the fund's share classes significantly underperformed the 2.99% gain of the MSCI® U.S. IM Energy 25/50 Index and the S&P 500®. (For specific portfolio results, please refer to the performance section of this report.) It was a choppy period, one in which crude oil prices and energy stocks seesawed but finished moderately higher. Relative to the MSCI index, the fund was hurt by underweightings in both integrated oil/gas and pipeline companies within oil/gas storage and transport, both of which outperformed as investors were drawn to more-stable, dividend-paying energy stocks in the second half of the year. Stock selection in integrated oil/gas also meaningfully detracted, as did my choices within oil/gas exploration/production (E&P) and positioning in oil/gas drilling. Conversely, solid stock picks and a sizable overweighting in the outperforming oil/gas refining and marketing segment aided the fund's results. Among individual stocks, the largest relative detractor was a stake in coal firm Alpha Natural Resources, which incurred operational difficulties and higher-than-expected costs after buying troubled miner Massey Energy in June. A sizable underweighting in integrated oil firm and benchmark giant Exxon Mobil hurt, as the stock rose amid investors' flight to safety. A stake in oil/gas driller Transocean detracted, as its earnings were hurt by continued low utilization of its offshore rig fleet and its stock fell. I sold Transocean by period end. Contributors included mid-continent oil refiners Holly and Frontier Oil, which merged during the period, and Marathon Oil, an integrated oil firm with mid-continent refining capabilities. Not owning index component Devon Energy also helped, as the E&P firm was hurt by lower natural gas prices.
The views expressed above reflect those of the portfolio manager(s) only through the end of the period as stated on the cover of this report and do not necessarily represent the views of Fidelity or any other person in the Fidelity organization. Any such views are subject to change at any time based upon market or other conditions and Fidelity disclaims any responsibility to update such views. These views may not be relied on as investment advice and, because investment decisions for a Fidelity fund are based on numerous factors, may not be relied on as an indication of trading intent on behalf of any Fidelity fund.
Annual Report
As a shareholder of the Fund, you incur two types of costs: (1) transaction costs, including redemption fees, and (2) ongoing costs, including management fees, distribution and/or service (12b-1) fees and other Fund expenses. This Example is intended to help you understand your ongoing costs (in dollars) of investing in the Fund and to compare these costs with the ongoing costs of investing in other mutual funds.
The Example is based on an investment of $1,000 invested at the beginning of the period and held for the entire period (July 1, 2011 to December 31, 2011).
Actual Expenses
The first line of the accompanying table for each class of the Fund provides information about actual account values and actual expenses. You may use the information in this line, together with the amount you invested, to estimate the expenses that you paid over the period. Simply divide your account value by $1,000.00 (for example, an $8,600 account value divided by $1,000.00 = 8.6), then multiply the result by the number in the first line for a class of the Fund under the heading entitled "Expenses Paid During Period" to estimate the expenses you paid on your account during this period. The estimate of expenses does not include any fees or other expenses of any variable annuity or variable life insurance product. If they were, the estimate of expenses you paid during the period would be higher, and your ending account value would be lower. In addition, the Fund, as a shareholder in the underlying Fidelity Central Funds, will indirectly bear its pro-rata share of the fees and expenses incurred by the underlying Fidelity Central Funds. These fees and expenses are not included in the Fund's annualized expense ratio used to calculate the expense estimate in the table below.
Hypothetical Example for Comparison Purposes
The second line of the accompanying table for each class of the Fund provides information about hypothetical account values and hypothetical expenses based on a Class' actual expense ratio and an assumed rate of return of 5% per year before expenses, which is not the Class' actual return. The hypothetical account values and expenses may not be used to estimate the actual ending account balance or expenses you paid for the period. You may use this information to compare the ongoing costs of investing in the Fund and other funds. To do so, compare this 5% hypothetical example with the 5% hypothetical examples that appear in the shareholder reports of the other funds. The estimate of expenses does not include any fees or other expenses of any variable annuity or variable life insurance product. If they were, the estimate of expenses you paid during the period would be higher, and your ending account value would be lower. In addition, the Fund, as a shareholder in the underlying Fidelity Central Funds, will indirectly bear its pro-rata share of the fees and expenses incurred by the underlying Fidelity Central Funds. These fees and expenses are not included in the Fund's annualized expense ratio used to calculate the expense estimate in the table below.
Please note that the expenses shown in the table are meant to highlight your ongoing costs only and do not reflect any transaction costs. Therefore, the second line of the table is useful in comparing ongoing costs only, and will not help you determine the relative total costs of owning different funds. In addition, if these transactional costs were included, your costs would have been higher.
| Annualized
Expense Ratio | Beginning
Account Value
July 1, 2011 | Ending
Account Value
December 31, 2011 | Expenses Paid
During Period*
July 1, 2011 to
December 31, 2011 |
Initial Class | .69% | | | |
Actual | | $ 1,000.00 | $ 859.20 | $ 3.23 |
HypotheticalA | | $ 1,000.00 | $ 1,021.73 | $ 3.52 |
Service Class 2 | .94% | | | |
Actual | | $ 1,000.00 | $ 858.50 | $ 4.40 |
HypotheticalA | | $ 1,000.00 | $ 1,020.47 | $ 4.79 |
Investor Class | .77% | | | |
Actual | | $ 1,000.00 | $ 858.90 | $ 3.61 |
HypotheticalA | | $ 1,000.00 | $ 1,021.32 | $ 3.92 |
A 5% return per year before expenses
* Expenses are equal to each Class' annualized expense ratio, multiplied by the average account value over the period, multiplied by 184/365 (to reflect the one-half year period).
Annual Report
Investment Changes (Unaudited)
Top Ten Stocks as of December 31, 2011 |
| % of fund's
net assets | % of fund's net assets
6 months ago |
Chevron Corp. | 16.2 | 10.9 |
Exxon Mobil Corp. | 7.7 | 10.7 |
Occidental Petroleum Corp. | 7.5 | 5.7 |
Schlumberger Ltd. | 5.5 | 6.0 |
Hess Corp. | 5.1 | 3.9 |
National Oilwell Varco, Inc. | 3.9 | 2.8 |
Marathon Oil Corp. | 3.6 | 5.6 |
EOG Resources, Inc. | 3.5 | 0.0 |
Halliburton Co. | 3.3 | 4.1 |
Ensco International Ltd. ADR | 2.6 | 2.3 |
| 58.9 | |
Top Industries (% of fund's net assets) |
As of December 31, 2011 |
| Oil, Gas &
Consumable Fuels | 72.2% | |
| Energy Equipment & Services | 25.7% | |
| Chemicals | 1.2% | |
| Construction & Engineering | 0.5% | |
| All Others* | 0.4% | |

As of June 30, 2011 |
| Oil, Gas &
Consumable Fuels | 64.3% | |
| Energy Equipment & Services | 32.2% | |
| Chemicals | 1.2% | |
| Construction & Engineering | 1.0% | |
| Metals & Mining | 0.8% | |
| All Others* | 0.5% | |

* Includes short-term investments and net other assets. |
Annual Report
Investments December 31, 2011
Showing Percentage of Net Assets
Common Stocks - 99.6% |
| Shares | | Value |
CHEMICALS - 1.2% |
Specialty Chemicals - 1.2% |
LyondellBasell Industries NV Class A | 133,090 | | $ 4,324,094 |
CONSTRUCTION & ENGINEERING - 0.5% |
Construction & Engineering - 0.5% |
Foster Wheeler AG (a) | 87,843 | | 1,681,315 |
ENERGY EQUIPMENT & SERVICES - 25.7% |
Oil & Gas Drilling - 7.4% |
Discovery Offshore S.A. (a)(e) | 392,110 | | 557,352 |
Ensco International Ltd. ADR | 201,788 | | 9,467,893 |
Nabors Industries Ltd. (a) | 41,900 | | 726,546 |
Noble Corp. | 162,870 | | 4,921,931 |
Northern Offshore Ltd. | 204,728 | | 436,506 |
Ocean Rig UDW, Inc. (United States) | 100,900 | | 1,230,980 |
Parker Drilling Co. (a) | 236,130 | | 1,693,052 |
Patterson-UTI Energy, Inc. | 118,200 | | 2,361,636 |
Rowan Companies, Inc. (a) | 156,000 | | 4,731,480 |
Vantage Drilling Co. (a) | 542,200 | | 628,952 |
| | 26,756,328 |
Oil & Gas Equipment & Services - 18.3% |
Baker Hughes, Inc. | 159,325 | | 7,749,568 |
Cal Dive International, Inc. (a) | 88,736 | | 199,656 |
Compagnie Generale de Geophysique SA (a) | 64,900 | | 1,506,632 |
Halliburton Co. | 347,019 | | 11,975,626 |
Key Energy Services, Inc. (a) | 63,079 | | 975,832 |
McDermott International, Inc. (a) | 61,900 | | 712,469 |
National Oilwell Varco, Inc. | 209,267 | | 14,228,063 |
Oil States International, Inc. (a) | 64,510 | | 4,926,629 |
RPC, Inc. (d) | 18,193 | | 332,022 |
Schlumberger Ltd. | 288,049 | | 19,676,627 |
Schoeller-Bleckmann Oilfield Equipment AG | 8,018 | | 707,931 |
Superior Energy Services, Inc. (a) | 29,454 | | 837,672 |
Weatherford International Ltd. (a) | 131,242 | | 1,921,383 |
Willbros Group, Inc. (a) | 81,733 | | 299,960 |
| | 66,050,070 |
TOTAL ENERGY EQUIPMENT & SERVICES | | 92,806,398 |
OIL, GAS & CONSUMABLE FUELS - 72.2% |
Coal & Consumable Fuels - 2.5% |
Alpha Natural Resources, Inc. (a) | 307,332 | | 6,278,793 |
Peabody Energy Corp. | 79,036 | | 2,616,882 |
| | 8,895,675 |
|
| Shares | | Value |
Integrated Oil & Gas - 38.8% |
Chevron Corp. | 551,879 | | $ 58,719,926 |
Exxon Mobil Corp. | 329,308 | | 27,912,146 |
Hess Corp. | 321,583 | | 18,265,914 |
Occidental Petroleum Corp. | 287,786 | | 26,965,548 |
Suncor Energy, Inc. | 289,400 | | 8,348,951 |
| | 140,212,485 |
Oil & Gas Exploration & Production - 20.8% |
Anadarko Petroleum Corp. | 51,998 | | 3,969,007 |
Apache Corp. | 97,442 | | 8,826,296 |
Bankers Petroleum Ltd. (a) | 296,800 | | 1,293,983 |
Cabot Oil & Gas Corp. | 6,700 | | 508,530 |
Canadian Natural Resources Ltd. | 82,500 | | 3,090,510 |
EOG Resources, Inc. | 128,948 | | 12,702,667 |
EV Energy Partners LP | 42,719 | | 2,815,182 |
EXCO Resources, Inc. | 33,000 | | 344,850 |
Gran Tierra Energy, Inc. (Canada) (a) | 515,600 | | 2,490,919 |
Marathon Oil Corp. | 440,425 | | 12,891,240 |
Niko Resources Ltd. | 7,200 | | 340,982 |
Noble Energy, Inc. | 58,316 | | 5,504,447 |
Northern Oil & Gas, Inc. (a) | 25,042 | | 600,507 |
Oasis Petroleum, Inc. (a)(d) | 43,520 | | 1,265,997 |
Pacific Rubiales Energy Corp. | 40,000 | | 735,664 |
Painted Pony Petroleum Ltd. (a)(e) | 2,500 | | 27,494 |
Painted Pony Petroleum Ltd. Class A (a) | 56,600 | | 622,467 |
Petrominerales Ltd. | 26,633 | | 433,074 |
Pioneer Natural Resources Co. | 65,834 | | 5,890,826 |
QEP Resources, Inc. | 31,800 | | 931,740 |
Rosetta Resources, Inc. (a) | 18,748 | | 815,538 |
SM Energy Co. | 88,708 | | 6,484,555 |
Stone Energy Corp. (a) | 21,396 | | 564,426 |
Swift Energy Co. (a) | 31,942 | | 949,316 |
Whiting Petroleum Corp. (a) | 21,866 | | 1,020,924 |
| | 75,121,141 |
Oil & Gas Refining & Marketing - 7.2% |
CVR Energy, Inc. (a) | 81,846 | | 1,532,976 |
HollyFrontier Corp. | 196,359 | | 4,594,801 |
Marathon Petroleum Corp. | 284,072 | | 9,456,757 |
Tesoro Corp. (a) | 185,327 | | 4,329,239 |
Valero Energy Corp. | 300,024 | | 6,315,505 |
| | 26,229,278 |
Oil & Gas Storage & Transport - 2.9% |
Atlas Energy LP | 10,363 | | 251,821 |
Atlas Pipeline Partners, LP | 50,928 | | 1,891,975 |
Williams Companies, Inc. | 257,000 | | 8,486,140 |
| | 10,629,936 |
TOTAL OIL, GAS & CONSUMABLE FUELS | | 261,088,515 |
TOTAL COMMON STOCKS (Cost $345,266,488) |
359,900,322
|
Money Market Funds - 0.7% |
| Shares | | Value |
Fidelity Cash Central Fund, 0.11% (b) | 1,998,335 | | $ 1,998,335 |
Fidelity Securities Lending Cash Central Fund, 0.13% (b)(c) | 446,920 | | 446,920 |
TOTAL MONEY MARKET FUNDS (Cost $2,445,255) |
2,445,255
|
TOTAL INVESTMENT PORTFOLIO - 100.3% (Cost $347,711,743) | | 362,345,577 |
NET OTHER ASSETS (LIABILITIES) - (0.3)% | | (957,731) |
NET ASSETS - 100% | $ 361,387,846 |
Legend |
(a) Non-income producing |
(b) Affiliated fund that is available only to investment companies and other accounts managed by Fidelity Investments. The rate quoted is the annualized seven-day yield of the fund at period end. A complete unaudited listing of the fund's holdings as of its most recent quarter end is available upon request. In addition, each Fidelity Central Fund's financial statements, which are not covered by the Fund's Report of Independent Registered Public Accounting Firm, are available on the SEC's website or upon request. |
(c) Investment made with cash collateral received from securities on loan. |
(d) Security or a portion of the security is on loan at period end. |
(e) Security exempt from registration under Rule 144A of the Securities Act of 1933. These securities may be resold in transactions exempt from registration, normally to qualified institutional buyers. At the end of the period, the value of these securities amounted to $584,846 or 0.2% of net assets. |
Affiliated Central Funds |
Information regarding fiscal year to date income earned by the Fund from investments in Fidelity Central Funds is as follows: |
Fund | Income earned |
Fidelity Cash Central Fund | $ 4,897 |
Fidelity Securities Lending Cash Central Fund | 34,966 |
Total | $ 39,863 |
Other Information |
The following is a summary of the inputs used, as of December 31, 2011, involving the Fund's assets and liabilities carried at fair value. The inputs or methodology used for valuing securities may not be an indication of the risk associated with investing in those securities. For more information on valuation inputs, and their aggregation into the levels used in the tables below, please refer to the Security Valuation section in the accompanying Notes to Financial Statements. |
Valuation Inputs at Reporting Date: |
Description | Total | Level 1 | Level 2 | Level 3 |
Investments in Securities: | | | | |
Common Stocks | $ 359,900,322 | $ 357,685,759 | $ 2,214,563 | $ - |
Money Market Funds | 2,445,255 | 2,445,255 | - | - |
Total Investments in Securities: | $ 362,345,577 | $ 360,131,014 | $ 2,214,563 | $ - |
The following is a reconciliation of Investments in Securities for which Level 3 inputs were used in determining value: |
Investments in Securities: | |
Beginning Balance | $ 200,308 |
Total Realized Gain (Loss) | (47,206) |
Total Unrealized Gain (Loss) | 38,184 |
Cost of Purchases | - |
Proceeds of Sales | (191,286) |
Amortization/Accretion | - |
Transfers in to Level 3 | - |
Transfers out of Level 3 | - |
Ending Balance | $ - |
The change in unrealized gain (loss) for the period attributable to Level 3 securities held at December 31, 2011 | $ - |
The information used in the above reconciliation represents fiscal year to date activity for any Investments in Securities identified as using Level 3 inputs at either the beginning or the end of the current fiscal period. Transfers in or out of Level 3 represent the beginning value of any Security or Instrument where a change in the pricing level occurred from the beginning to the end of the period. The cost of purchases and the proceeds of sales may include securities received or delivered through corporate actions or exchanges. Realized and unrealized gains (losses) disclosed in the reconciliation are included in Net Gain (Loss) on the Fund's Statement of Operations. |
Distribution of investments by country of issue, as a percentage of total net assets, is as follows: (Unaudited) |
United States of America | 82.4% |
Curacao | 5.5% |
Canada | 4.1% |
United Kingdom | 2.6% |
Switzerland | 2.4% |
Netherlands | 1.2% |
Others (Individually Less Than 1%) | 1.8% |
| 100.0% |
See accompanying notes which are an integral part of the financial statements.
Annual Report
Statement of Assets and Liabilities
| December 31, 2011 |
| | |
Assets | | |
Investment in securities, at value (including securities loaned of $430,741) - See accompanying schedule: Unaffiliated issuers (cost $345,266,488) | $ 359,900,322 | |
Fidelity Central Funds (cost $2,445,255) | 2,445,255 | |
Total Investments (cost $347,711,743) | | $ 362,345,577 |
Cash | | 79 |
Receivable for investments sold | | 79,463 |
Receivable for fund shares sold | | 8,130 |
Dividends receivable | | 262,176 |
Distributions receivable from Fidelity Central Funds | | 488 |
Prepaid expenses | | 1,381 |
Other receivables | | 3,088 |
Total assets | | 362,700,382 |
| | |
Liabilities | | |
Payable for fund shares redeemed | $ 596,529 | |
Accrued management fee | 168,570 | |
Distribution and service plan fees payable | 26,570 | |
Other affiliated payables | 39,119 | |
Other payables and accrued
expenses | 34,828 | |
Collateral on securities loaned, at value | 446,920 | |
Total liabilities | | 1,312,536 |
| | |
Net Assets | | $ 361,387,846 |
Net Assets consist of: | | |
Paid in capital | | $ 377,575,321 |
Distributions in excess of net investment income | | (22,832) |
Accumulated undistributed net realized gain (loss) on investments and foreign currency transactions | | (30,798,519) |
Net unrealized appreciation (depreciation) on investments and assets and liabilities in foreign
currencies | | 14,633,876 |
Net Assets | | $ 361,387,846 |
Statement of Assets and Liabilities - continued
| December 31, 2011 |
| | |
Initial Class:
Net Asset Value, offering price and redemption price per share ($126,722,637 ÷ 6,736,576 shares) | | $ 18.81 |
| | |
Service Class 2:
Net Asset Value, offering price and redemption price per share ($127,186,619 ÷ 6,794,005 shares) | | $ 18.72 |
| | |
Investor Class:
Net Asset Value, offering price and redemption price per share ($107,478,590 ÷ 5,724,621 shares) | | $ 18.77 |
See accompanying notes which are an integral part of the financial statements.
Annual Report
Financial Statements - continued
Statement of Operations
| Year ended December 31, 2011 |
| | |
Investment Income | | |
Dividends | | $ 7,143,793 |
Interest | | 8,280 |
Income from Fidelity Central Funds | | 39,863 |
Total income | | 7,191,936 |
| | |
Expenses | | |
Management fee | $ 2,385,410 | |
Transfer agent fees | 416,932 | |
Distribution and service plan fees | 368,050 | |
Accounting and security lending fees | 167,530 | |
Custodian fees and expenses | 26,822 | |
Independent trustees' compensation | 2,402 | |
Audit | 37,489 | |
Legal | 1,633 | |
Interest | 614 | |
Miscellaneous | 4,062 | |
Total expenses before reductions | 3,410,944 | |
Expense reductions | (23,420) | 3,387,524 |
Net investment income (loss) | | 3,804,412 |
Realized and Unrealized Gain (Loss) Net realized gain (loss) on: | | |
Investment securities: | | |
Unaffiliated issuers | 34,186,050 | |
Foreign currency transactions | (7,130) | |
Total net realized gain (loss) | | 34,178,920 |
Change in net unrealized appreciation (depreciation) on: Investment securities | (63,151,605) | |
Assets and liabilities in foreign currencies | (638) | |
Total change in net unrealized appreciation (depreciation) | | (63,152,243) |
Net gain (loss) | | (28,973,323) |
Net increase (decrease) in net assets resulting from operations | | $ (25,168,911) |
Statement of Changes in Net Assets
| Year ended
December 31, 2011 | Year ended
December 31, 2010 |
Increase (Decrease) in Net Assets | | |
Operations | | |
Net investment income (loss) | $ 3,804,412 | $ 1,821,852 |
Net realized gain (loss) | 34,178,920 | 2,129,268 |
Change in net unrealized appreciation (depreciation) | (63,152,243) | 52,797,353 |
Net increase (decrease) in net assets resulting from operations | (25,168,911) | 56,748,473 |
Distributions to shareholders from net investment income | (3,961,918) | (1,680,556) |
Share transactions - net increase (decrease) | 8,835,144 | (41,330,324) |
Redemption fees | 184,377 | 143,706 |
Total increase (decrease) in net assets | (20,111,308) | 13,881,299 |
| | |
Net Assets | | |
Beginning of period | 381,499,154 | 367,617,855 |
End of period (including distributions in excess of net investment income of $22,832 and undistributed net investment income of $125,041, respectively) | $ 361,387,846 | $ 381,499,154 |
See accompanying notes which are an integral part of the financial statements.
Annual Report
Financial Highlights - Initial Class
Years ended December 31, | 2011 | 2010 | 2009 | 2008 | 2007 |
Selected Per-Share Data | | | | | |
Net asset value, beginning of period | $ 20.05 | $ 16.88 | $ 11.46 | $ 26.55 | $ 19.04 |
Income from Investment Operations | | | | | |
Net investment income (loss)C | .21 | .11 | .07 | .03 | .07 |
Net realized and unrealized gain (loss) | (1.23) | 3.16 | 5.41 | (14.31) | 8.62 |
Total from investment operations | (1.02) | 3.27 | 5.48 | (14.28) | 8.69 |
Distributions from net investment income | (.23) | (.11) | (.07) | (.03) | (.06) |
Distributions from net realized gain | - | - | - | (.80) | (1.13) |
Total distributions | (.23) | (.11) | (.07) | (.83) | (1.19) |
Redemption fees added to paid in capitalC | .01 | .01 | .01 | .02 | .01 |
Net asset value, end of period | $ 18.81 | $ 20.05 | $ 16.88 | $ 11.46 | $ 26.55 |
Total ReturnA,B | (4.99)% | 19.45% | 47.90% | (54.26)% | 45.97% |
Ratios to Average Net AssetsD,F | | | | | |
Expenses before reductions | .69% | .70% | .71% | .70% | .70% |
Expenses net of fee waivers, if any | .69% | .69% | .71% | .70% | .70% |
Expenses net of all reductions | .68% | .69% | .70% | .69% | .70% |
Net investment income (loss) | 1.00% | .65% | .47% | .13% | .31% |
Supplemental Data | | | | | |
Net assets, end of period (000 omitted) | $ 126,723 | $ 148,774 | $ 152,028 | $ 117,940 | $ 355,854 |
Portfolio turnover rateE | 94% | 105% | 113% | 130% | 61% |
A Total returns do not reflect charges attributable to your insurance company's separate account. Inclusion of these charges would reduce the total returns shown.
B Total returns would have been lower if certain expenses had not been reduced during the applicable periods shown.
C Calculated based on average shares outstanding during the period.
D Fees and expenses of any underlying Fidelity Central Funds are not included in the Fund's expense ratio. The Fund indirectly bears its proportionate share of the expenses of any underlying Fidelity Central Funds.
E Amount does not include the portfolio activity of any underlying Fidelity Central Funds.
F Expense ratios reflect operating expenses of the class. Expenses before reductions do not reflect amounts reimbursed by the investment adviser or reductions from brokerage service arrangements or reductions from other expense offset arrangements and do not represent the amount paid by the class during periods when reimbursements or reductions occur. Expenses net of fee waivers reflect expenses after reimbursement by the investment adviser but prior to reductions from brokerage service arrangements or other expense offset arrangements. Expenses net of all reductions represent the net expenses paid by the class.
Financial Highlights - Service Class 2
Years ended December 31, | 2011 | 2010 | 2009 | 2008 | 2007 |
Selected Per-Share Data | | | | | |
Net asset value, beginning of period | $ 19.94 | $ 16.79 | $ 11.40 | $ 26.44 | $ 18.98 |
Income from Investment Operations | | | | | |
Net investment income (loss)C | .16 | .07 | .03 | (.03) | .02 |
Net realized and unrealized gain (loss) | (1.21) | 3.13 | 5.38 | (14.23) | 8.58 |
Total from investment operations | (1.05) | 3.20 | 5.41 | (14.26) | 8.60 |
Distributions from net investment income | (.18) | (.06) | (.03) | - | (.02) |
Distributions from net realized gain | - | - | - | (.80) | (1.13) |
Total distributions | (.18) | (.06) | (.03) | (.80) | (1.15) |
Redemption fees added to paid in capitalC | .01 | .01 | .01 | .02 | .01 |
Net asset value, end of period | $ 18.72 | $ 19.94 | $ 16.79 | $ 11.40 | $ 26.44 |
Total ReturnA,B | (5.20)% | 19.16% | 47.57% | (54.40)% | 45.64% |
Ratios to Average Net AssetsD,F | | | | | |
Expenses before reductions | .94% | .95% | .96% | .95% | .95% |
Expenses net of fee waivers, if any | .93% | .94% | .96% | .95% | .95% |
Expenses net of all reductions | .93% | .94% | .95% | .94% | .94% |
Net investment income (loss) | .75% | .40% | .22% | (.12)% | .07% |
Supplemental Data | | | | | |
Net assets, end of period (000 omitted) | $ 127,187 | $ 129,043 | $ 125,669 | $ 90,109 | $ 193,887 |
Portfolio turnover rateE | 94% | 105% | 113% | 130% | 61% |
A Total returns do not reflect charges attributable to your insurance company's separate account. Inclusion of these charges would reduce the total returns shown.
B Total returns would have been lower if certain expenses had not been reduced during the applicable periods shown.
C Calculated based on average shares outstanding during the period.
D Fees and expenses of any underlying Fidelity Central Funds are not included in the Fund's expense ratio. The Fund indirectly bears its proportionate share of the expenses of any underlying Fidelity Central Funds.
E Amount does not include the portfolio activity of any underlying Fidelity Central Funds.
F Expense ratios reflect operating expenses of the class. Expenses before reductions do not reflect amounts reimbursed by the investment adviser or reductions from brokerage service arrangements or reductions from other expense offset arrangements and do not represent the amount paid by the class during periods when reimbursements or reductions occur. Expenses net of fee waivers reflect expenses after reimbursement by the investment adviser but prior to reductions from brokerage service arrangements or other expense offset arrangements. Expenses net of all reductions represent the net expenses paid by the class.
See accompanying notes which are an integral part of the financial statements.
Annual Report
Financial Highlights - Investor Class
Years ended December 31, | 2011 | 2010 | 2009 | 2008 | 2007 |
Selected Per-Share Data | | | | | |
Net asset value, beginning of period | $ 20.01 | $ 16.85 | $ 11.44 | $ 26.49 | $ 19.00 |
Income from Investment Operations | | | | | |
Net investment income (loss)C | .19 | .09 | .05 | .01 | .05 |
Net realized and unrealized gain (loss) | (1.23) | 3.16 | 5.41 | (14.28) | 8.61 |
Total from investment operations | (1.04) | 3.25 | 5.46 | (14.27) | 8.66 |
Distributions from net investment income | (.21) | (.10) | (.06) | -G | (.05) |
Distributions from net realized gain | - | - | - | (.80) | (1.13) |
Total distributions | (.21) | (.10) | (.06) | (.80) | (1.18) |
Redemption fees added to paid in capitalC | .01 | .01 | .01 | .02 | .01 |
Net asset value, end of period | $ 18.77 | $ 20.01 | $ 16.85 | $ 11.44 | $ 26.49 |
Total ReturnA,B | (5.09)% | 19.34% | 47.79% | (54.32)% | 45.88% |
Ratios to Average Net AssetsD,F | | | | | |
Expenses before reductions | .77% | .79% | .81% | .79% | .81% |
Expenses net of fee waivers, if any | .77% | .78% | .81% | .79% | .81% |
Expenses net of all reductions | .77% | .77% | .80% | .78% | .81% |
Net investment income (loss) | .92% | .57% | .37% | .04% | .20% |
Supplemental Data | | | | | |
Net assets, end of period (000 omitted) | $ 107,479 | $ 103,682 | $ 89,921 | $ 55,256 | $ 131,198 |
Portfolio turnover rateE | 94% | 105% | 113% | 130% | 61% |
A Total returns do not reflect charges attributable to your insurance company's separate account. Inclusion of these charges would reduce the total returns shown.
B Total returns would have been lower if certain expenses had not been reduced during the applicable periods shown.
C Calculated based on average shares outstanding during the period.
D Fees and expenses of any underlying Fidelity Central Funds are not included in the Fund's expense ratio. The Fund indirectly bears its proportionate share of the expenses of any underlying Fidelity Central Funds.
E Amount does not include the portfolio activity of any underlying Fidelity Central Funds.
F Expense ratios reflect operating expenses of the class. Expenses before reductions do not reflect amounts reimbursed by the investment adviser or reductions from brokerage service arrangements or reductions from other expense offset arrangements and do not represent the amount paid by the class during periods when reimbursements or reductions occur. Expenses net of fee waivers reflect expenses after reimbursement by the investment adviser but prior to reductions from brokerage service arrangements or other expense offset arrangements. Expenses net of all reductions represent the net expenses paid by the class.
G Amount represents less than $.01 per share.
See accompanying notes which are an integral part of the financial statements.
Annual Report
Notes to Financial Statements
For the period ended December 31, 2011
1. Organization.
VIP Energy Portfolio (the Fund) is a non-diversified fund of Variable Insurance Products Fund IV (the Trust) and is authorized to issue an unlimited number of shares. The Trust is registered under the Investment Company Act of 1940, as amended (the 1940 Act), as an open-end management investment company organized as a Massachusetts business trust. Shares of the Fund may only be purchased by insurance companies for the purpose of funding variable annuity or variable life insurance contracts. The Fund offers the following classes of shares: Initial Class shares, Service Class 2 shares, and Investor Class shares. All classes have equal rights and voting privileges, except for matters affecting a single class. Investment income, realized and unrealized capital gains and losses, the common expenses of the Fund, and certain fund-level expense reductions, if any, are allocated on a pro-rata basis to each class based on the relative net assets of each class to the total net assets of the Fund. Each class differs with respect to transfer agent and distribution and service plan fees incurred. Certain expense reductions may also differ by class.
2. Investments in Fidelity Central Funds.
The Fund invests in Fidelity Central Funds, which are open-end investment companies available only to other investment companies and accounts managed by Fidelity Management & Research Company (FMR) and its affiliates. The Fund's Schedule of Investments lists each of the Fidelity Central Funds held as of period end, if any, as an investment of the Fund, but do not include the underlying holdings of each Fidelity Central Fund. As an Investing Fund, the Fund indirectly bears its proportionate share of the expenses of the underlying Fidelity Central Funds.
The Money Market Central Funds seek preservation of capital and current income and are managed by Fidelity Investments Money Management, Inc. (FIMM), an affiliate of FMR.
A complete unaudited list of holdings for each Fidelity Central Fund is available upon request or at the Securities and Exchange Commission (the SEC) web site at www.sec.gov. In addition, the financial statements of the Fidelity Central Funds, which are not covered by the Fund's Report of Independent Registered Public Accounting Firm, are available on the SEC web site or upon request.
3. Significant Accounting Policies.
The financial statements have been prepared in conformity with accounting principles generally accepted in the United States of America (GAAP), which require management to make certain estimates and assumptions at the date of the financial statements. Actual results could differ from those estimates. Subsequent events, if any, through the date that the financial statements were issued have been evaluated in the preparation of the financial statements. The following summarizes the significant accounting policies of the Fund:
Security Valuation. Investments are valued as of 4:00 p.m. Eastern time on the last calendar day of the period. The Fund uses independent pricing services approved by the Board of Trustees to value its investments. When current market prices or quotations are not readily available or reliable, valuations may be determined in good faith in accordance with procedures adopted by the Board of Trustees. Factors used in determining value may include market or security specific events. The frequency with which these procedures are used cannot be predicted and they may be utilized to a significant extent. The value used for net asset value (NAV) calculation under these procedures may differ from published prices for the same securities.
The Fund categorizes the inputs to valuation techniques used to value its investments into a disclosure hierarchy consisting of three levels as shown below:
Level 1 - quoted prices in active markets for identical investments
Level 2 - other significant observable inputs (including quoted prices for similar investments, interest rates, prepayment speeds, etc.)
Level 3 - unobservable inputs (including the Fund's own assumptions based on the best information available)
Changes in valuation techniques may result in transfers in or out of an assigned level within the disclosure hierarchy. The aggregate value of investments by input level, as of December 31, 2011, as well as a roll forward of Level 3 securities, is included at the end of the Fund's Schedule of Investments. Valuation techniques used to value the Fund's investments by major category are as follows:
Equity securities, including restricted securities, for which market quotations are readily available, are valued at the last reported sale price or official closing price as reported by an independent pricing service on the primary market or exchange on which they are traded and are categorized as Level 1 in the hierarchy. In the event there were no sales during the day or closing prices are not available, securities are valued at the last quoted bid price or may be valued using the last available price and are generally categorized as Level 2 in the hierarchy. For foreign equity securities, when significant market or security specific events arise, comparisons to the valuation of American Depositary Receipts (ADRs), futures contracts, Exchange-traded funds (ETFs) and certain indexes as well as quoted prices for similar securities are used and are categorized as Level 2 in the hierarchy in these circumstances. Utilizing these techniques may result in transfers between Level 1 and Level 2. For restricted equity securities and private placements where observable inputs are limited, assumptions about market activity and risk are used and are categorized as Level 3 in the hierarchy.
Annual Report
Notes to Financial Statements - continued
3. Significant Accounting Policies - continued
Security Valuation - continued
Investments in open-end mutual funds, including Fidelity Central Funds, are valued at their closing net asset value each business day and are categorized as Level 1 in the hierarchy.
New Accounting Pronouncements. In May 2011, the Financial Accounting Standards Board issued Accounting Standard Update No. 2011-04, Fair Value Measurement (Topic 820) - Amendments to Achieve Common Fair Value Measurement and Disclosure Requirements in U.S. GAAP and IFRSs. The update is effective during interim and annual periods beginning after December 15, 2011 and will result in additional disclosure for transfers between levels as well as expanded disclosure for securities categorized as Level 3 under the fair value hierarchy.
In December 2011, the Financial Accounting Standards Board issued Accounting Standard Update No. 2011-11, Disclosures about Offsetting Assets and Liabilities. The update creates new disclosure requirements requiring entities to disclose both gross and net information for derivatives and other financial instruments that are either offset in the Statement of Assets and Liabilities or subject to an enforceable master netting arrangement or similar agreement. The disclosure requirements are effective for annual reporting periods beginning on or after January 1, 2013. Management is currently evaluating the impact of the update's adoption on the Fund's financial statement disclosures.
Foreign Currency. The Fund may use foreign currency contracts to facilitate transactions in foreign-denominated securities. Gains and losses from these transactions may arise from changes in the value of the foreign currency or if the counterparties do not perform under the contracts' terms.
Foreign-denominated assets, including investment securities, and liabilities are translated into U.S. dollars at the exchange rate at period end. Purchases and sales of investment securities, income and dividends received and expenses denominated in foreign currencies are translated into U.S. dollars at the exchange rate in effect on the transaction date.
The effects of exchange rate fluctuations on investments are included with the net realized and unrealized gain (loss) on investment securities. Other foreign currency transactions resulting in realized and unrealized gain (loss) are disclosed separately.
Investment Transactions and Income. For financial reporting purposes, the Fund's investment holdings and NAV include trades executed through the end of the last business day of the period. The NAV per share for processing shareholder transactions is calculated as of the close of business of the New York Stock Exchange (NYSE), normally 4:00 p.m. Eastern time and includes trades executed through the end of the prior business day. Gains and losses on securities sold are determined on the basis of identified cost and may include proceeds received from litigation. Dividend income is recorded on the ex-dividend date, except for certain dividends from foreign securities where the ex-dividend date may have passed, which are recorded as soon as the Fund is informed of the ex-dividend date. Non-cash dividends included in dividend income, if any, are recorded at the fair market value of the securities received. Distributions received on securities that represent a return of capital or capital gain are recorded as a reduction of cost of investments and/or as a realized gain. The Fund estimates the components of distributions received that may be considered return of capital distributions or capital gain distributions. Interest income and distributions from the Fidelity Central Funds are accrued as earned. Interest income includes coupon interest and amortization of premium and accretion of discount on debt securities. Investment income is recorded net of foreign taxes withheld where recovery of such taxes is uncertain.
Expenses. Expenses directly attributable to a fund are charged to that fund. Expenses attributable to more than one fund are allocated among the respective funds on the basis of relative net assets or other appropriate methods. Expense estimates are accrued in the period to which they relate and adjustments are made when actual amounts are known.
Income Tax Information and Distributions to Shareholders. Each year, the Fund intends to qualify as a regulated investment company, including distributing substantially all of its taxable income and realized gains under Subchapter M of the Internal Revenue Code. As a result, no provision for income taxes is required. As of December 31, 2011, the Fund did not have any unrecognized tax benefits in the financial statements; nor is the Fund aware of any tax positions for which it is reasonably possible that the total amounts of unrecognized tax benefits will significantly change in the next twelve months. The Fund files a U.S. federal tax return, in addition to state and local tax returns as required. A fund's tax returns are subject to examination by the Internal Revenue Service (IRS) for a period of three fiscal years. State and local tax returns may be subject to examination for an additional fiscal year depending on the jurisdiction. Foreign taxes are provided for based on the Fund's understanding of the tax rules and rates that exist in the foreign markets in which it invests.
Distributions are declared and recorded on the ex-dividend date. Income dividends and capital gain distributions are declared separately for each class. Income and capital gain distributions are determined in accordance with income tax regulations, which may differ from GAAP.
Capital accounts within the financial statements are adjusted for permanent book-tax differences. These adjustments have no impact on net assets or the results of operations. Temporary book-tax differences will reverse in a subsequent period.
Book-tax differences are primarily due to foreign currency transactions, passive foreign investment companies (PFIC), partnerships, capital loss carryforwards and losses deferred due to wash sales and excise tax regulations.
Annual Report
3. Significant Accounting Policies - continued
Income Tax Information and Distributions to Shareholders - continued
The federal tax cost of investment securities and unrealized appreciation (depreciation) as of period end were as follows:
Gross unrealized appreciation | $ 51,328,166 |
Gross unrealized depreciation | (39,843,260) |
Net unrealized appreciation (depreciation) on securities and other investments | $ 11,484,906 |
| |
Tax Cost | $ 350,860,671 |
The tax-based components of distributable earnings as of period end were as follows:
Capital loss carryforward | $ (27,649,589) |
Net unrealized appreciation (depreciation) | $ 11,484,948 |
Capital loss carryforwards are only available to offset future capital gains of the Fund to the extent provided by regulations and may be limited. Under the Regulated Investment Company Modernization Act of 2010 (the Act), the Fund is permitted to carry forward capital losses incurred in taxable years beginning after December 22, 2010 for an unlimited period and such capital losses are required to be used prior to any losses that expire. Capital loss carryforwards were as follows:
Fiscal year of expiration | |
2017 | $ (19,894,860) |
2018 | (7,754,729) |
Total with expiration | $ (27,649,589) |
The tax character of distributions paid was as follows:
| December 31, 2011 | December 31, 2010 |
Ordinary Income | $ 3,961,918 | $ 1,680,556 |
Trading (Redemption) Fees. Initial Class shares, Service Class 2 shares, and Investor Class shares held by investors less than 60 days are subject to a redemption fee equal to 1% of the net asset value of shares redeemed. All redemption fees, which reduce the proceeds of the shareholder redemption, are retained by the Fund and accounted for as an addition to paid in capital.
4. Operating Policies.
Restricted Securities. The Fund may invest in securities that are subject to legal or contractual restrictions on resale. These securities generally may be resold in transactions exempt from registration or to the public if the securities are registered. Disposal of these securities may involve time-consuming negotiations and expense, and prompt sale at an acceptable price may be difficult. Information regarding restricted securities is included at the end of the Fund's Schedule of Investments.
5. Purchases and Sales of Investments.
Purchases and sales of securities, other than short-term securities, aggregated $413,602,462 and $403,458,502, respectively.
6. Fees and Other Transactions with Affiliates.
Management Fee. FMR and its affiliates provide the Fund with investment management related services for which the Fund pays a monthly management fee. The management fee is the sum of an individual fund fee rate that is based on an annual rate of .30% of the Fund's average net assets and an annualized group fee rate that averaged .26% during the period. The group fee rate is based upon the average net assets of all the mutual funds advised by FMR. The group fee rate decreases as assets under management increase and increases as assets under management decrease. For the period, the total annual management fee rate was .56% of the Fund's average net assets.
Annual Report
Notes to Financial Statements - continued
6. Fees and Other Transactions with Affiliates - continued
Distribution and Service Plan Fees. In accordance with Rule 12b-1 of the 1940 Act, the Fund has adopted a separate 12b-1 Plan for Service Class 2 shares. Service Class 2 pays Fidelity Distributors Corporation (FDC), an affiliate of FMR, a service fee. For the period, the service fee is based on an annual rate of .25% of Service Class 2's average net assets.
For the period, total fees for Service Class 2, all of which was re-allowed to insurance companies for the distribution of shares and providing shareholder support services were $368,050.
Transfer Agent Fees. Fidelity Investments Institutional Operations Company, Inc. (FIIOC), an affiliate of FMR, is the Fund's transfer, dividend disbursing, and shareholder servicing agent. FIIOC receives an asset-based fee with respect to each class. Each class (with the exception of Investor Class) pays a transfer agent fee, excluding out of pocket expenses, equal to an annual rate of .07% of average net assets. Investor Class pays a monthly asset-based transfer agent fee of .15% of average net assets. In addition, FIIOC receives an asset-based fee of .0045% of average net assets for typesetting, printing and mailing of shareholder reports, except proxy statements. FIIOC voluntarily agreed to waive this fee for the period August 1, 2011 through December 31, 2011 (see Expense Reductions note). For the period, transfer agent fees for each class, including printing and out of pocket expenses, were as follows:
Initial Class | $ 116,043 |
Service Class 2 | 105,898 |
Investor Class | 194,991 |
| $ 416,932 |
Accounting and Security Lending Fees. Fidelity Service Company, Inc. (FSC), an affiliate of FMR, maintains the Fund's accounting records. The accounting fee is based on the level of average net assets for the month. Under a separate contract, FSC administers the security lending program. The security lending fee is based on the number and duration of lending transactions.
Brokerage Commissions. The Fund placed a portion of its portfolio transactions with brokerage firms which are affiliates of the investment adviser. The commissions paid to these affiliated firms were $4,272 for the period.
Interfund Lending Program. Pursuant to an Exemptive Order issued by the SEC, the Fund, along with other registered investment companies having management contracts with FMR, may participate in an interfund lending program. This program provides an alternative credit facility allowing the funds to borrow from, or lend money to, other participating affiliated funds. At period end, there were no interfund loans outstanding. The Fund's activity in this program during the period for which loans were outstanding was as follows:
Borrower or Lender | Average Loan
Balance | Weighted Average Interest Rate | Interest
Expense |
Borrower | $ 9,120,143 | .35% | $ 614 |
7. Committed Line of Credit.
The Fund participates with other funds managed by FMR or an affiliate in a $4.0 billion credit facility (the "line of credit") to be utilized for temporary or emergency purposes to fund shareholder redemptions or for other short-term liquidity purposes. The Fund has agreed to pay commitment fees on its pro-rata portion of the line of credit, which amounted to $1,265 and is reflected in Miscellaneous expenses on the Statement of Operations. During the period, there were no borrowings on this line of credit.
8. Security Lending.
The Fund lends portfolio securities through a lending agent from time to time in order to earn additional income. For equity securities, a lending agent is used and may loan securities to certain qualified borrowers, including Fidelity Capital Markets (FCM), a broker-dealer affiliated with the Fund. On the settlement date of the loan, the Fund receives collateral (in the form of U.S. Treasury obligations, letters of credit and/or cash) against the loaned securities and maintains collateral in an amount not less than 100% of the market value of the loaned securities during the period of the loan. The market value of the loaned securities is determined at the close of business of the Fund and any additional required collateral is delivered to the Fund on the next business day. If the borrower defaults on its obligation to return the securities loaned because of insolvency or other reasons, a fund could experience delays and costs in recovering the securities loaned or in gaining access to the collateral. Any cash collateral received is invested in the Fidelity Securities Lending Cash Central Fund. The value of loaned securities and cash collateral at period end are disclosed on the Fund's Statement
Annual Report
8. Security Lending - continued
of Assets and Liabilities. Security lending income represents the income earned on investing cash collateral, less rebates paid to borrowers and any lending agent fees associated with the loan, plus any premium payments received for lending certain types of securities. Security lending income is presented in the Statement of Operations as a component of income from Fidelity Central Funds. Total security lending income during the period amounted to $34,966. During the period, there were no securities loaned to FCM.
9. Expense Reductions.
FMR or its affiliates agreed to waive certain fees during the period as noted in the table below.
Initial Class | $ 2,554 |
Service Class 2 | 2,391 |
Investor Class | 2,003 |
| $ 6,948 |
Many of the brokers with whom FMR places trades on behalf of the Fund provided services to the Fund in addition to trade execution. These services included payments of certain expenses on behalf of the Fund totaling $16,472 for the period.
10. Distributions to Shareholders.
Distributions to shareholders of each class were as follows:
Years ended December 31, | 2011 | 2010 |
From net investment income | | |
Initial Class | $ 1,547,182 | $ 800,107 |
Service Class 2 | 1,203,739 | 408,455 |
Investor Class | 1,210,997 | 471,994 |
Total | $ 3,961,918 | $ 1,680,556 |
11. Share Transactions.
Transactions for each class of shares were as follows:
| Shares | Dollars |
Years ended December 31, | 2011 | 2010 | 2011 | 2010 |
Initial Class | | | | |
Shares sold | 1,574,590 | 918,470 | $ 33,949,092 | $ 15,869,720 |
Reinvestment of distributions | 85,265 | 41,413 | 1,547,182 | 800,107 |
Shares redeemed | (2,344,843) | (2,546,072) | (48,318,203) | (41,769,770) |
Net increase (decrease) | (684,988) | (1,586,189) | $ (12,821,929) | $ (25,099,943) |
Service Class 2 | | | | |
Shares sold | 1,956,741 | 892,222 | $ 41,895,225 | $ 15,494,576 |
Reinvestment of distributions | 66,560 | 21,240 | 1,203,739 | 408,455 |
Shares redeemed | (1,700,278) | (1,926,104) | (34,316,363) | (31,528,158) |
Net increase (decrease) | 323,023 | (1,012,642) | $ 8,782,601 | $ (15,625,127) |
Investor Class | | | | |
Shares sold | 2,182,108 | 1,261,085 | $ 46,827,100 | $ 22,374,304 |
Reinvestment of distributions | 66,898 | 24,468 | 1,210,997 | 471,994 |
Shares redeemed | (1,706,869) | (1,440,817) | (35,163,625) | (23,451,552) |
Net increase (decrease) | 542,137 | (155,264) | $ 12,874,472 | $ (605,254) |
12. Other.
The Fund's organizational documents provide former and current trustees and officers with a limited indemnification against liabilities arising in connection with the performance of their duties to the Fund. In the normal course of business, the Fund may also enter into contracts that provide general indemnifications. The Fund's maximum exposure under these arrangements is unknown as this would be dependent on future claims that may be made against the Fund. The risk of material loss from such claims is considered remote.
At the end of the period, FMR or its affiliates were the owners of record of 64% of the total outstanding shares of the Fund and one otherwise unaffiliated shareholder was the owner of record of 35% of the total outstanding shares of the Fund.
Annual Report
Report of Independent Registered Public Accounting Firm
To the Trustees of Variable Insurance Products Fund IV and the Shareholders of VIP Energy Portfolio:
In our opinion, the accompanying statement of assets and liabilities, including the schedule of investments, and the related statements of operations and of changes in net assets and the financial highlights present fairly, in all material respects, the financial position of VIP Energy Portfolio (a fund of Variable Insurance Products Fund IV) at December 31, 2011, the results of its operations for the year then ended, the changes in its net assets for each of the two years in the period then ended and the financial highlights for each of the five years in the period then ended, in conformity with accounting principles generally accepted in the United States of America. These financial statements and financial highlights (hereafter referred to as "financial statements") are the responsibility of the VIP Energy Portfolio's management. Our responsibility is to express an opinion on these financial statements based on our audits. We conducted our audits of these financial statements in accordance with the standards of the Public Company Accounting Oversight Board (United States). Those standards require that we plan and perform the audit to obtain reasonable assurance about whether the financial statements are free of material misstatement. An audit includes examining, on a test basis, evidence supporting the amounts and disclosures in the financial statements, assessing the accounting principles used and significant estimates made by management, and evaluating the overall financial statement presentation. We believe that our audits, which included confirmation of securities at December 31, 2011 by correspondence with the custodian and brokers, provide a reasonable basis for our opinion.
/s/ PricewaterhouseCoopers LLP
PricewaterhouseCoopers LLP
Boston, Massachusetts
February 15, 2012
Annual Report
The Trustees, Members of the Advisory Board, and executive officers of the trust and fund, as applicable, are listed below. The Board of Trustees governs the fund and is responsible for protecting the interests of shareholders. The Trustees are experienced executives who meet periodically throughout the year to oversee the fund's activities, review contractual arrangements with companies that provide services to the fund, oversee management of the risks associated with such activities and contractual arrangements, and review the fund's performance. Except for James C. Curvey, each of the Trustees oversees 226 funds advised by FMR or an affiliate. Mr. Curvey oversees 429 funds advised by FMR or an affiliate.
The Trustees hold office without limit in time except that (a) any Trustee may resign; (b) any Trustee may be removed by written instrument, signed by at least two-thirds of the number of Trustees prior to such removal; (c) any Trustee who requests to be retired or who has become incapacitated by illness or injury may be retired by written instrument signed by a majority of the other Trustees; and (d) any Trustee may be removed at any special meeting of shareholders by a two-thirds vote of the outstanding voting securities of the trust. Each Trustee who is not an interested person (as defined in the 1940 Act) (Independent Trustee), shall retire not later than the last day of the calendar year in which his or her 75th birthday occurs. The Independent Trustees may waive this mandatory retirement age policy with respect to individual Trustees. The executive officers and Advisory Board Members hold office without limit in time, except that any officer and Advisory Board Member may resign or may be removed by a vote of a majority of the Trustees at any regular meeting or any special meeting of the Trustees. Except as indicated, each individual has held the office shown or other offices in the same company for the past five years.
Experience, Skills, Attributes, and Qualifications of the Fund's Trustees. The Governance and Nominating Committee has adopted a statement of policy that describes the experience, qualifications, attributes, and skills that are necessary and desirable for potential Independent Trustee candidates (Statement of Policy). The Board believes that each Trustee satisfied at the time he or she was initially elected or appointed a Trustee, and continues to satisfy, the standards contemplated by the Statement of Policy. The Governance and Nominating Committee also engages professional search firms to help identify potential Independent Trustee candidates who have the experience, qualifications, attributes, and skills consistent with the Statement of Policy. From time to time, additional criteria based on the composition and skills of the current Independent Trustees, as well as experience or skills that may be appropriate in light of future changes to board composition, business conditions, and regulatory or other developments, have also been considered by the professional search firms and the Governance and Nominating Committee. In addition, the Board takes into account the Trustees' commitment and participation in Board and committee meetings, as well as their leadership of standing and ad hoc committees throughout their tenure.
In determining that a particular Trustee was and continues to be qualified to serve as a Trustee, the Board has considered a variety of criteria, none of which, in isolation, was controlling. The Board believes that, collectively, the Trustees have balanced and diverse experience, qualifications, attributes, and skills, which allow the Board to operate effectively in governing the fund and protecting the interests of shareholders. Information about the specific experience, skills, attributes, and qualifications of each Trustee, which in each case led to the Board's conclusion that the Trustee should serve (or continue to serve) as a trustee of the fund, is provided below.
Board Structure and Oversight Function. James C. Curvey is an interested person (as defined in the 1940 Act) and currently serves as Acting Chairman. The Trustees have determined that an interested Chairman is appropriate and benefits shareholders because an interested Chairman has a personal and professional stake in the quality and continuity of services provided to the fund. Independent Trustees exercise their informed business judgment to appoint an individual of their choosing to serve as Chairman, regardless of whether the Trustee happens to be independent or a member of management. The Independent Trustees have determined that they can act independently and effectively without having an Independent Trustee serve as Chairman and that a key structural component for assuring that they are in a position to do so is for the Independent Trustees to constitute a substantial majority for the Board. The Independent Trustees also regularly meet in executive session. Ned C. Lautenbach serves as Chairman of the Independent Trustees and as such (i) acts as a liaison between the Independent Trustees and management with respect to matters important to the Independent Trustees and (ii) with management prepares agendas for Board meetings.
Fidelity funds are overseen by different Boards of Trustees. The fund's Board oversees Fidelity's equity and high income funds and another Board oversees Fidelity's investment-grade bond, money market, and asset allocation funds. The asset allocation funds may invest in Fidelity funds overseen by the fund's Board. The use of separate Boards, each with its own committee structure, allows the Trustees of each group of Fidelity funds to focus on the unique issues of the funds they oversee, including common research, investment, and operational issues. On occasion, the separate Boards establish joint committees to address issues of overlapping consequences for the Fidelity funds overseen by each Board.
The Trustees operate using a system of committees to facilitate the timely and efficient consideration of all matters of importance to the Trustees, the fund, and fund shareholders and to facilitate compliance with legal and regulatory requirements and oversight of the fund's activities and associated risks. The Board, acting through its committees, has charged FMR and its affiliates with (i) identifying events or circumstances the occurrence of which could have demonstrably adverse effects on the fund's business and/or reputation; (ii) implementing processes and controls to lessen the possibility that such events or circumstances occur or to mitigate the effects of such events or circumstances if they do occur; and (iii) creating and maintaining a system designed to evaluate continuously business and market conditions in order to facilitate the identification and implementation processes described in (i) and (ii) above. Because the day-to-day operations and activities of the fund are carried out by or through FMR, its affiliates and other service providers, the fund's exposure to risks is mitigated but not eliminated by the processes overseen by the Trustees. While each of the Board's committees has responsibility for overseeing different aspects of the fund's activities, oversight is exercised primarily through the Operations, Audit, and Compliance Committees. In addition, the Independent Trustees have worked with FMR to enhance the Board's oversight of investment and financial risks, legal and regulatory risks, technology risks, and operational risks, including the development of additional risk reporting to the Board. For example, a working group comprised of Independent Trustees and FMR has worked and continues to work to review the Fidelity funds' valuation-related activities, reporting and risk management. Appropriate personnel, including but not limited to the fund's Chief Compliance Officer (CCO), FMR's internal auditor, the independent accountants, the fund's Treasurer and portfolio management personnel, make periodic reports to the Board's committees, as appropriate, including an annual review of FMR's risk management program for the Fidelity funds. The responsibilities of each standing committee, including their oversight responsibilities, are described further under "Standing Committees of the Fund's Trustees."
Annual Report
Trustees and Officers - continued
The fund's Statement of Additional Information (SAI) includes more information about the Trustees. To request a free copy, call Fidelity at 1-877-208-0098.
Interested Trustees*:
Correspondence intended for each Trustee who is an interested person may be sent to Fidelity Investments, 82 Devonshire Street, Boston, Massachusetts 02109.
Name, Age; Principal Occupations and Other Relevant Experience+ |
James C. Curvey (76) |
| Year of Election or Appointment: 2007 Mr. Curvey is Trustee and Acting Chairman of the Board of Trustees of certain Trusts. Mr. Curvey also serves as Trustee (2007-present) of other investment companies advised by FMR. Mr. Curvey is a Director of Fidelity Investments Money Management, Inc. (2009-present), Director of Fidelity Research & Analysis Co. (2009-present) and Director of FMR and FMR Co., Inc. (2007-present). Mr. Curvey is also Vice Chairman (2007-present) and Director of FMR LLC. In addition, Mr. Curvey serves as an Overseer for the Boston Symphony Orchestra and a member of the Trustees of Villanova University. Previously, Mr. Curvey was the Vice Chairman (2006-2007) and Director (2000-2007) of FMR Corp. |
Ronald P. O'Hanley (54) |
| Year of Election or Appointment: 2011 Mr. O'Hanley is Director of FMR Co., Inc. (2010-present), Director of Fidelity Investments Money Management, Inc. (2010-present), Director of Fidelity Research & Analysis Company (2010-present), President of Fidelity Asset Management and Corporate Services and a member of Fidelity's Executive Committee (2010-present). Previously, Mr. O'Hanley served as President and Chief Executive Officer of BNY Mellon Asset Management (2007-2010). Mr. O'Hanley also served as Vice Chairman of Bank New York Mellon Corp. and a member of that firm's Executive Committee. Prior to the 2007 merger of The Bank of New York and Mellon Financial Corporation, he was Vice Chairman of Mellon Financial Corporation and President and Chief Executive Officer of Mellon Asset Management. He joined Mellon in February 1997. Mr. O'Hanley currently serves as Chairman of the Boston Public Library Foundation Board of Directors and sits on the Board of Directors of Beth Israel Deaconess Medical Center, the Board of Trustees of the Marine Biological Laboratory and the Advisory Board of the Maxwell School of Citizenship and Public Administration at Syracuse University. Mr. O'Hanley also chairs the Council on Asset Management for the Financial Services Roundtable and is a member of the Board of Directors of Institutional Investor's U.S. Institute. |
* Trustees have been determined to be "Interested Trustees" by virtue of, among other things, their affiliation with the trust or various entities under common control with FMR.
+ The information above includes each Trustee's principal occupation during the last five years and other information relating to the experience, attributes, and skills relevant to each Trustee's qualifications to serve as a Trustee, which led to the conclusion that each Trustee should serve as a Trustee for the fund.
Independent Trustees:
Correspondence intended for each Independent Trustee (that is, the Trustees other than the Interested Trustees) may be sent to Fidelity Investments, P.O. Box 55235, Boston, Massachusetts 02205-5235.
Name, Age; Principal Occupations and Other Relevant Experience+ |
Dennis J. Dirks (63) |
| Year of Election or Appointment: 2005 Prior to his retirement in May 2003, Mr. Dirks was Chief Operating Officer and a member of the Board of The Depository Trust & Clearing Corporation (DTCC). He also served as President, Chief Operating Officer, and Board member of The Depository Trust Company (DTC) and President and Board member of the National Securities Clearing Corporation (NSCC). In addition, Mr. Dirks served as Chief Executive Officer and Board member of the Government Securities Clearing Corporation, Chief Executive Officer and Board member of the Mortgage-Backed Securities Clearing Corporation, as a Trustee and a member of the Finance Committee of Manhattan College (2005-2008), and as a Trustee and a member of the Finance Committee of AHRC of Nassau County (2006-2008). Mr. Dirks is a member of the Independent Directors Council (IDC) Governing Council (2010-present) and Board of Directors for The Brookville Center for Children's Services, Inc. (2009-present). |
Alan J. Lacy (58) |
| Year of Election or Appointment: 2008 Mr. Lacy serves as Senior Adviser (2007-present) of Oak Hill Capital Partners, L.P. (private equity). Mr. Lacy also served as Chief Executive Officer (2000-2005) and Vice Chairman (2005-2006) of Sears Holdings Corporation and Sears, Roebuck and Co. (retail). In addition, Mr. Lacy serves as a member of the Board of Directors of Dave & Buster's, Inc. (restaurant and entertainment complexes, 2010-present), The Hillman Companies, Inc. (hardware wholesalers, 2010-present), and Bristol-Myers Squibb Company (global pharmaceuticals, 2007-present). Mr. Lacy is a member of the Board of Trustees of The National Parks Conservation Association (2006-present). Previously, Mr. Lacy served as Chairman of the Board of Trustees of the National Parks Conservation Association (2008-2011) and as a member of the Board of Directors for the Western Union Company (global money transfer, 2006-2011). |
Ned C. Lautenbach (67) |
| Year of Election or Appointment: 2000 Mr. Lautenbach is Chairman of the Independent Trustees of the Equity and High Income Funds (2006-present). Mr. Lautenbach currently serves as the Lead Director of the Eaton Corporation Board of Directors (diversified industrial, 1997-present). Mr. Lautenbach is also a member of the Board of Directors of the Philharmonic Center for the Arts in Naples, Florida (1999-present); a member of the Board of Trustees of Fairfield University (2005-present); and a member of the Council on Foreign Relations (1994-present). Previously, Mr. Lautenbach was a Partner/Advisory Partner at Clayton, Dubilier & Rice, LLC (private equity investment, 1998-2010), as well as a Director of Sony Corporation (2006-2007). |
Joseph Mauriello (67) |
| Year of Election or Appointment: 2008 Prior to his retirement in January 2006, Mr. Mauriello served in numerous senior management positions including Deputy Chairman and Chief Operating Officer (2004-2005), and Vice Chairman of Financial Services (2002-2004) of KPMG LLP US (professional services, 1965-2005). Mr. Mauriello currently serves as a member of the Board of Directors of XL Group plc. (global insurance and re-insurance, 2006-present) and of Arcadia Resources Inc. (health care services and products, 2007-present). Previously, Mr. Mauriello served as a Director of the Hamilton Funds of the Bank of New York (2006-2007). |
Robert W. Selander (61) |
| Year of Election or Appointment: 2011 Previously, Mr. Selander served as a Member of the Advisory Board of Fidelity's Equity and High Income Funds (2011), Executive Vice Chairman (2010), Chief Executive Officer (2009-2010), and President and Chief Executive Officer (1997-2009) of Mastercard, Inc. |
Cornelia M. Small (67) |
| Year of Election or Appointment: 2005 Ms. Small is a member of the Board of Directors of the Teagle Foundation (2009-present). Ms. Small is also a member of the Investment Committee, and Chair (2008-present) and a member of the Board of Trustees of Smith College. In addition, Ms. Small serves on the Investment Committee of the Berkshire Taconic Community Foundation (2008-present). Previously, Ms. Small served as Chairperson of the Investment Committee (2002-2008) of Smith College. In addition, Ms. Small served as Chief Investment Officer, Director of Global Equity Investments, and a member of the Board of Directors of Scudder, Stevens & Clark and Scudder Kemper Investments. |
William S. Stavropoulos (72) |
| Year of Election or Appointment: 2001 Mr. Stavropoulos is Vice Chairman of the Independent Trustees of the Equity and High Income Funds (2006-present). Mr. Stavropoulos serves as President and Founder of the Michigan Baseball Foundation, the Great Lakes Loons (2007-present). Mr. Stavropoulos is Chairman Emeritus of the Board of Directors of The Dow Chemical Company, where he previously served in numerous senior management positions, including President, CEO (1995-2000; 2002-2004), Chairman of the Executive Committee (2000-2006), and as a member of the Board of Directors (1990-2006). Currently, Mr. Stavropoulos is Chairman of Univar (global distributor of commodity and specialty chemicals, 2010-present), a Director of Teradata Corporation (data warehousing and technology solutions, 2008-present), Chemical Financial Corporation, Maersk Inc. (industrial conglomerate), Tyco International, Inc. (multinational manufacturing and services, 2007-present), and a member of the Advisory Board for Metalmark Capital (private equity investment, 2005-present). Mr. Stavropoulos is a special advisor to Clayton, Dubilier & Rice, LLC (private equity investment). In addition, Mr. Stavropoulos is a member of the University of Notre Dame Advisory Council for the College of Science. |
David M. Thomas (62) |
| Year of Election or Appointment: 2008 Previously, Mr. Thomas served as Executive Chairman (2005-2006) and Chairman and Chief Executive Officer (2000-2005) of IMS Health, Inc. (pharmaceutical and healthcare information solutions). In addition, Mr. Thomas serves as a member of the Board of Directors of Fortune Brands, Inc. (consumer products), and Interpublic Group of Companies, Inc. (marketing communication, 2004-present). |
Michael E. Wiley (61) |
| Year of Election or Appointment: 2008 Mr. Wiley also serves as a Director of Asia Pacific Exploration Consolidated (international oil and gas exploration and production, 2008-present). Mr. Wiley serves as a Director of Tesoro Corporation (independent oil refiner and marketer, 2005-present), and a Director of Bill Barrett Corporation (exploration and production, 2005-present). In addition, Mr. Wiley also serves as a Director of Post Oak Bank (privately-held bank, 2004-present). Previously, Mr. Wiley served as a member of the Board of Trustees of the University of Tulsa (2000-2006; 2007-2010), as a Senior Energy Advisor of Katzenbach Partners, LLC (consulting, 2006-2007), as an Advisory Director of Riverstone Holdings (private investment), Chairman, President, and CEO of Baker Hughes, Inc. (oilfield services, 2000-2004), and as Director of Spinnaker Exploration Company (exploration and production, 2001-2005). |
+ The information above includes each Trustee's principal occupation during the last five years and other information relating to the experience, attributes, and skills relevant to each Trustee's qualifications to serve as a Trustee, which led to the conclusion that each Trustee should serve as a Trustee for the fund.
Advisory Board Members and Executive Officers:
Correspondence intended for each executive officer, Edward C. Johnson 3d, and Peter S. Lynch may be sent to Fidelity Investments, 82 Devonshire Street, Boston, Massachusetts 02109.
Name, Age; Principal Occupation |
Edward C. Johnson 3d (81) |
| Year of Election or Appointment: 2011 Member of the Advisory Board of Fidelity's Equity and High Income Funds. Mr. Johnson serves as Chief Executive Officer, Chairman, and a Director of FMR LLC, and also serves as Chairman and Director of FIL Limited. Previously, Mr. Johnson served as a Trustee and Chairman of the Board of certain Fidelity Trusts, Chairman and a Director of FMR, Chairman and a Director of FMR Co., Inc., and President of FMR LLC (2006-2007). |
Peter S. Lynch (67) |
| Year of Election or Appointment: 2003 Member of the Advisory Board of Fidelity's Equity and High Income Funds. Mr. Lynch is Vice Chairman and a Director of FMR and FMR Co., Inc. In addition, Mr. Lynch serves as a Trustee of Boston College and as the Chairman of the Inner-City Scholarship Fund. Previously, Mr. Lynch served on the Special Olympics International Board of Directors (1997-2006). |
Kenneth B. Robins (42) |
| Year of Election or Appointment: 2008 President and Treasurer of Fidelity's Equity and High Income Funds. Mr. Robins also serves as President and Treasurer (2010-present) and Assistant Treasurer (2009-present) of other Fidelity funds and is an employee of Fidelity Investments (2004-present). Previously, Mr. Robins served as Deputy Treasurer of the Fidelity funds (2005-2008) and Treasurer and Chief Financial Officer of The North Carolina Capital Management Trust: Cash and Term Portfolios (2006-2008). |
Brian B. Hogan (47) |
| Year of Election or Appointment: 2009 Vice President of Equity and High Income Funds. Mr. Hogan also serves as President of FMR's Equity Division (2009-present). Previously, Mr. Hogan served as Senior Vice President, Equity Research of FMR (2006-2009) and as a portfolio manager. |
Christopher S. Bartel (40) |
| Year of Election or Appointment: 2009 Vice President of Fidelity's Sector and Real Estate Equity Funds. Mr. Bartel also serves as Senior Vice President of Equity Research (2009-present). Previously, Mr. Bartel served as Managing Director of Research (2006-2009) and an analyst and portfolio manager (2000-2006). |
Scott C. Goebel (43) |
| Year of Election or Appointment: 2008 Secretary and Chief Legal Officer (CLO) of the Fidelity funds. Mr. Goebel also serves as Secretary of Fidelity Investments Money Management, Inc. (FIMM) (2010-present) and Fidelity Research and Analysis Company (FRAC) (2010-present); Secretary and CLO of The North Carolina Capital Management Trust: Cash and Term Portfolios (2008-present); General Counsel, Secretary, and Senior Vice President of FMR (2008-present) and FMR Co., Inc. (2008-present); employed by FMR LLC or an affiliate (2001-present); Chief Legal Officer of Fidelity Management & Research (Hong Kong) Limited (2008-present) and Assistant Secretary of Fidelity Management & Research (Japan) Inc. (2008-present), and Fidelity Management & Research (U.K.) Inc. (2008-present). Previously, Mr. Goebel served as Assistant Secretary of FIMM (2008-2010), FRAC (2008-2010), and the Funds (2007-2008) and as Vice President and Secretary of Fidelity Distributors Corporation (FDC) (2005-2007). |
William C. Coffey (42) |
| Year of Election or Appointment: 2009 Assistant Secretary of Fidelity's Equity and High Income Funds. Mr. Coffey also serves as Senior Vice President and Deputy General Counsel of FMR LLC (2010-present), and is an employee of Fidelity Investments. Previously, Mr. Coffey served as Vice President and Associate General Counsel of FMR LLC (2005-2009). |
Holly C. Laurent (57) |
| Year of Election or Appointment: 2008 Anti-Money Laundering (AML) Officer of the Fidelity funds. Ms. Laurent also serves as AML Officer of The North Carolina Capital Management Trust: Cash and Term Portfolios (2008-present) and is an employee of Fidelity Investments. Previously, Ms. Laurent was Senior Vice President and Head of Legal for Fidelity Business Services India Pvt. Ltd. (2006-2008), and Senior Vice President, Deputy General Counsel and Group Head for FMR LLC (2005-2006). |
Christine Reynolds (53) |
| Year of Election or Appointment: 2008 Chief Financial Officer of the Fidelity funds. Ms. Reynolds became President of Fidelity Pricing and Cash Management Services (FPCMS) in August 2008. Ms. Reynolds served as Chief Operating Officer of FPCMS (2007-2008). Previously, Ms. Reynolds served as President, Treasurer, and Anti-Money Laundering officer of the Fidelity funds (2004-2007). |
Kenneth A. Rathgeber (64) |
| Year of Election or Appointment: 2004 Chief Compliance Officer of Fidelity's Equity and High Income Funds. Mr. Rathgeber is Chief Compliance Officer of Fidelity Management & Research (Hong Kong) Limited (2008-present), Fidelity Management & Research (Japan) Inc. (2008-present), FMR (2005-present), FMR Co., Inc. (2005-present), Fidelity Management & Research (U.K.) Inc. (2005-present), Fidelity Research & Analysis Company (2005-present), Fidelity Investments Money Management, Inc. (2005-present), Pyramis Global Advisors, LLC (2005-present), and Strategic Advisers, Inc. (2005-present). |
Jeffrey S. Christian (50) |
| Year of Election or Appointment: 2009 Deputy Treasurer of the Fidelity funds. Mr. Christian is an employee of Fidelity Investments. Previously, Mr. Christian served as Chief Financial Officer (2008-2009) of certain Fidelity funds and Senior Vice President of Fidelity Pricing and Cash Management Services (FPCMS) (2004-2009). |
Joseph F. Zambello (54) |
| Year of Election or Appointment: 2011 Deputy Treasurer of the Fidelity funds. Mr. Zambello is an employee of Fidelity Investments. Previously, Mr. Zambello served as Vice President of FMR's Program Management Group (2009-2011) and Vice President of the Transfer Agent Oversight Group (2005-2009). |
Adrien E. Deberghes (44) |
| Year of Election or Appointment: 2008 Deputy Treasurer of Fidelity's Equity and High Income Funds. Mr. Deberghes also serves as Vice President and Assistant Treasurer of Fidelity Rutland Square Trust II and Fidelity Commonwealth Trust II (2011-present), Assistant Treasurer of other Fidelity funds (2010-present), and is an employee of Fidelity Investments (2008-present). Previously, Mr. Deberghes served as Senior Vice President of Mutual Fund Administration at State Street Corporation (2007-2008), Senior Director of Mutual Fund Administration at Investors Bank & Trust (2005-2007), and Director of Finance for Dunkin' Brands (2000-2005). |
Stephanie J. Dorsey (42) |
| Year of Election or Appointment: 2010 Assistant Treasurer of Fidelity's Equity and High Income Funds. Ms. Dorsey also serves as Deputy Treasurer of other Fidelity funds (2008-present) and is an employee of Fidelity Investments (2008-present). Previously, Ms. Dorsey served as Treasurer (2004-2008) of the JPMorgan Mutual Funds and Vice President (2004-2008) of JPMorgan Chase Bank. |
John R. Hebble (53) |
| Year of Election or Appointment: 2009 Assistant Treasurer of Fidelity's Equity and High Income Funds. Mr. Hebble also serves as President (2011-present), Treasurer, and Chief Financial Officer of The North Carolina Capital Management Trust: Cash and Term Portfolios (2008-present), President and Treasurer of other Fidelity funds (2008-present) and is an employee of Fidelity Investments. |
Gary W. Ryan (53) |
| Year of Election or Appointment: 2005 Assistant Treasurer of the Fidelity funds. Mr. Ryan is an employee of Fidelity Investments. Previously, Mr. Ryan served as Vice President of Fund Reporting in Fidelity Pricing and Cash Management Services (FPCMS) (1999-2005). |
Jonathan Davis (43) |
| Year of Election or Appointment: 2010 Assistant Treasurer of the Fidelity funds. Mr. Davis is also Assistant Treasurer of Fidelity Rutland Square Trust II and Fidelity Commonwealth Trust II. Mr. Davis is an employee of Fidelity Investments. Previously, Mr. Davis served as Vice President and Associate General Counsel of FMR LLC (2003-2010). |
Annual Report
Initial Class and Investor Class designate 100% of the dividends distributed in February and December 2011, respectively during the fiscal year as qualifying for the dividends-received deduction for corporate shareholders.
Annual Report
Board Approval of Investment Advisory Contracts and Management Fees
VIP Energy Portfolio
Each year, the Board of Trustees, including the Independent Trustees (together, the Board), votes on the renewal of the management contract and sub-advisory agreements (together, the Advisory Contracts) for the fund. The Board, assisted by the advice of fund counsel and Independent Trustees' counsel, requests and considers a broad range of information relevant to the renewal of the Advisory Contracts throughout the year.
The Board meets regularly and considers at each of its meetings factors that are relevant to its annual consideration of the renewal of the fund's Advisory Contracts, including the services and support provided to the fund and its shareholders. The Board has established various standing committees, each composed of Independent Trustees with varying backgrounds, to which the Board has assigned specific subject matter responsibilities in order to enhance effective decision-making by the Board. The Board, acting directly and through its Committees, requests and receives information concerning the annual consideration of the renewal of the fund's Advisory Contracts. The Board also meets as needed to consider matters specifically related to the Board's annual consideration of the renewal of Advisory Contracts. Members of the Board may also meet with trustees of other Fidelity funds through ad hoc joint committees to discuss certain matters relevant to the Fidelity funds.
At its July 2011 meeting, the Board of Trustees, including the Independent Trustees, unanimously determined to renew the fund's Advisory Contracts. In reaching its determination, the Board considered all factors it believed relevant, including (i) the nature, extent, and quality of the services to be provided to the fund and its shareholders (including the investment performance of the fund); (ii) the competitiveness of the fund's management fee and total expense ratio; (iii) the total costs of the services to be provided by and the profits to be realized by Fidelity from its relationship with the fund; (iv) the extent to which economies of scale would be realized as the fund grows; and (v) whether fee levels reflect these economies of scale, if any, for the benefit of fund shareholders.
In considering whether to renew the Advisory Contracts for the fund, the Board reached a determination, with the assistance of fund counsel and Independent Trustees' counsel and through the exercise of its business judgment, that the renewal of the Advisory Contracts is in the best interests of the fund and its shareholders and that the compensation payable under the Advisory Contracts is fair and reasonable. The Board's decision to renew the Advisory Contracts was not based on any single factor, but rather was based on a comprehensive consideration of all the information provided to the Board at its meetings throughout the year. The Board, in reaching its determination to renew the Advisory Contracts, is aware that shareholders in the fund have a broad range of investment choices available to them, including a wide choice among mutual funds offered by Fidelity's competitors, and that the fund's shareholders, who have the opportunity to review and weigh the disclosure provided by the fund in its prospectus and other public disclosures, have chosen to invest in this fund, managed by Fidelity.
Nature, Extent, and Quality of Services Provided. The Board considered the staffing within the investment adviser, FMR, and the sub-advisers (together, the Investment Advisers), including the backgrounds of the fund's investment personnel and the fund's investment objective and discipline. The Independent Trustees also had discussions with senior management of Fidelity's investment operations and investment groups. The Board considered the structure of the portfolio manager compensation program and whether this structure provides appropriate incentives to act in the best interests of the fund.
Resources Dedicated to Investment Management and Support Services. The Board and the Fund Oversight and Research Committees reviewed the general qualifications and capabilities of the Investment Advisers' investment staff, including its size, education, experience, and resources, as well as the Investment Advisers' approach to recruiting, training, managing, and compensating investment personnel. The Board also noted that FMR has devoted increased resources to non-U.S. offices. The Board noted that Fidelity's analysts have extensive resources, tools and capabilities which allow them to conduct sophisticated quantitative and fundamental analysis, as well as credit analysis of issuers, counterparties and enhancers. The Board also believes that Fidelity's investment professionals have sufficient access to global information and data so as to provide competitive investment results over time, and that those professionals also have access to sophisticated tools which permit them to assess portfolio construction and risk and performance attribution characteristics continuously, as well as to transmit new information and research conclusions rapidly around the world. Additionally, in their deliberations, the Board considered the Investment Advisers' trading capabilities and resources which are an integral part of the investment management process.
Shareholder and Administrative Services. The Board considered (i) the nature, extent, quality, and cost of advisory, administrative, and shareholder services performed by the Investment Advisers and their affiliates under the Advisory Contracts and under separate agreements covering transfer agency, pricing and bookkeeping, and securities lending services for the fund; (ii) the nature and extent of the investment adviser's supervision of third party service providers, principally custodians and subcustodians; and (iii) the resources devoted to, and the record of compliance with, the fund's compliance policies and procedures. The Board also reviewed the allocation of fund brokerage, including allocations to brokers affiliated with the Investment Advisers, the use of brokerage commissions to pay fund expenses, and the use of "soft" commission dollars to pay for research services.
The Board noted that the growth of fund assets over time across the complex allows Fidelity to reinvest in the development of services designed to enhance the value or convenience of the Fidelity funds as investment vehicles. These services include 24-hour access to account information and market information through telephone representatives and over the Internet, investor education materials and asset allocation tools, and the expanded availability of Fidelity Investor Centers, with 35 new branches opening since 2010.
Annual Report
Investment in a Large Fund Family. The Board considered the benefits to shareholders of investing in a Fidelity fund, including the benefits of investing in a fund that is part of a large family of funds offering a variety of investment disciplines and providing a large variety of mutual fund investor services. The Board noted that Fidelity had taken, or had made recommendations that resulted in the Fidelity funds taking, a number of actions over the previous year that benefited particular funds, including (i) continuing to dedicate additional resources to investment research and support of the senior management team that oversees asset management; (ii) rationalizing product lines through the mergers of six funds into other funds; (iii) continuing to migrate the Freedom Funds to dedicated lower cost underlying funds; (iv) obtaining shareholder approval to broaden the investment strategies for Fidelity Consumer Finance Portfolio, Fidelity Emerging Asia Fund, and Fidelity Environment and Alternative Energy Portfolio; (v) contractually agreeing to reduce the management fees and impose other expense limitations on Spartan 500 Index Fund and U.S. Bond Index Fund in connection with launching new institutional classes of these funds; (vi) changing the name, primary and supplemental benchmarks, and investment policies of Fidelity Global Strategies Fund to support the fund's flexible investment mandate and global orientation; and (vii) reducing the transfer agency account fee rates on certain accounts.
Investment Performance. The Board considered whether the fund has operated in accordance with its investment objective, as well as its record of compliance with its investment restrictions. It also reviewed the fund's absolute investment performance for each class, as well as the fund's relative investment performance for each class measured over multiple periods against a third-party-sponsored index that reflects the market sector in which the fund invests. The Board noted that FMR does not believe that a meaningful peer group exists against which to compare the fund's performance. The following charts considered by the Board show, over the one-, three-, and five-year periods ended December 31, 2010, the cumulative total returns of Initial Class and Service Class 2 of the fund and the cumulative total returns of a third-party-sponsored index ("benchmark"). The returns of Initial Class and Service Class 2 show the performance of the highest and lowest performing classes, respectively (based on five-year performance).
VIP Energy Portfolio
The Board noted that the investment performance of the fund was lower than its benchmark for all the periods shown. The Board considered that the variations in performance among the fund's classes reflect the variations in class expenses, which result in lower performance for higher expense classes. The Board discussed with FMR actions that have been taken by FMR to improve the fund's below-benchmark performance. The Board also reviewed the fund's performance since inception as well as performance in the current year. The Board will continue to closely monitor the performance of the fund in the coming year and discuss with FMR other appropriate actions to address the performance of the fund.
Based on its review, the Board concluded that the nature, extent, and quality of services provided to the fund under the Advisory Contracts should benefit the fund's shareholders.
Competitiveness of Management Fee and Total Expense Ratio. The Board considered the fund's management fee and total expense ratio compared to "mapped groups" of competitive funds and classes. Fidelity creates "mapped groups" by combining similar Lipper investment objective categories that have comparable management fee characteristics. Combining Lipper investment objective categories aids the Board's management fee and total expense ratio comparisons by broadening the competitive group used for comparison and by reducing the number of universes to which various Fidelity funds are compared.
Management Fee. The Board considered two proprietary management fee comparisons for the 12-month periods shown in the chart below. The group of Lipper funds used by the Board for management fee comparisons is referred to below as the "Total Mapped Group." The Total Mapped Group comparison focuses on a fund's standing relative to the total universe of comparable funds available to investors in terms of gross management fees before expense reimbursements or caps. "TMG %" represents the percentage of funds in the Total Mapped Group that had management fees that were lower than the fund's. For example, a TMG % of 2% means that 98% of the funds in the Total Mapped Group had higher management fees than the fund. The "Asset-Size Peer Group" (ASPG) comparison focuses on a fund's standing relative to non-Fidelity funds similar in size to the fund within the Total Mapped Group. The ASPG represents at least 15% of the funds in the Total Mapped Group with comparable asset size and management fee characteristics, subject to a minimum of 50 funds (or all funds in the Total Mapped Group if fewer than 50). Additional information, such as the ASPG quartile in which the fund's management fee ranked, is also included in the chart and considered by the Board.
Annual Report
Board Approval of Investment Advisory Contracts and Management Fees - continued
VIP Energy Portfolio
The Board noted that the fund's management fee ranked below the median of its Total Mapped Group and below the median of its ASPG for 2010.
Based on its review, the Board concluded that the fund's management fee is fair and reasonable in light of the services that the fund receives and the other factors considered.
Total Expense Ratio. In its review of each class's total expense ratio, the Board considered the fund's management fee as well as other fund or class expenses, as applicable, such as transfer agent fees, pricing and bookkeeping fees, fund-paid 12b-1 fees, and custodial, legal, and audit fees. The Board also noted the effects of any waivers and reimbursements on fees and expenses. As part of its review, the Board also considered the current and historical total expense ratios of each class of the fund compared to competitive fund median expenses. Each class of the fund is compared to those funds and classes in the Total Mapped Group (used by the Board for management fee comparisons) that have a similar sales load structure.
The Board noted that the total expense ratio of each class ranked below its competitive median for 2010. The Board considered that various factors, including 12b-1 fees, positive or negative performance adjustments, and relatively higher other expenses in the case of small fund size, can affect total expense ratios. The Board also noted that Investor Class has higher transfer agent fees than traditional variable annuity classes because it is designed for lower cost annuity products, where the majority of servicing costs are incorporated into the funds' total expense ratios rather than being paid at the annuity level.
Fees Charged to Other Fidelity Clients. The Board also considered Fidelity fee structures and other information with respect to clients of FMR and its affiliates, such as other mutual funds advised or subadvised by FMR or its affiliates, pension plan clients, and other institutional clients. In March 2010, the Board created an ad hoc joint committee with the board of other Fidelity funds (the Committee) to review and compare Fidelity's institutional investment advisory business with its business of providing services to the Fidelity funds, including the differences in services provided, fees charged, and costs incurred, as well as competition in their respective marketplaces.
Based on its review of total expense ratios and fees charged to other Fidelity clients, the Board concluded that the total expense ratio of each class of the fund was reasonable in light of the services that the fund and its shareholders receive and the other factors considered, including the findings of the Committee.
Costs of the Services and Profitability. The Board considered the revenues earned and the expenses incurred by Fidelity in conducting the business of developing, marketing, distributing, managing, administering and servicing the fund and its shareholders. The Board also considered the level of Fidelity's profits in respect of all the Fidelity funds.
Annual Report
On an annual basis, FMR presents to the Board Fidelity's profitability for the fund. Fidelity calculates the profitability for each fund, as well as aggregate profitability for groups of Fidelity funds and all Fidelity funds, using a series of detailed revenue and cost allocation methodologies which originate with the books and records of Fidelity on which Fidelity's audited financial statements are based. The Audit Committee of the Board reviews any significant changes from the prior year's methodologies.
PricewaterhouseCoopers LLP (PwC), independent registered public accounting firm and auditor to Fidelity and certain Fidelity funds, has been engaged annually by the Board as part of the Board's assessment of Fidelity's profitability analysis. PwC's engagement includes the review and assessment of Fidelity's methodologies used in determining the revenues and expenses attributable to Fidelity's mutual fund business, and completion of agreed-upon procedures surrounding the mathematical accuracy of fund profitability and its conformity to allocation methodologies. After considering PwC's reports issued under the engagement and information provided by Fidelity, the Board concluded that while other allocation methods may also be reasonable, Fidelity's profitability methodologies are reasonable in all material respects.
The Board also reviewed Fidelity's non-fund businesses and fall-out benefits related to the mutual fund business as well as cases where Fidelity's affiliates may benefit from or be related to the fund's business.
The Board considered the costs of the services provided by and the profits realized by Fidelity in connection with the operation of the fund and was satisfied that the profitability was not excessive in the circumstances.
Economies of Scale. The Board considered whether there have been economies of scale in respect of the management of the Fidelity funds, whether the Fidelity funds (including the fund) have appropriately benefited from any such economies of scale, and whether there is potential for realization of any further economies of scale. The Board considered the extent to which the fund will benefit from economies of scale through increased services to the fund, through waivers or reimbursements, or through fee or expense reductions. The Board also noted that in 2009, it and the board of other Fidelity funds created an ad hoc committee (the Economies of Scale Committee) to analyze whether FMR attains economies of scale in respect of the management and servicing of the Fidelity funds, whether the Fidelity funds have appropriately benefited from such economies of scale, and whether there is potential for realization of any further economies of scale.
The Board recognized that the fund's management contract incorporates a "group fee" structure, which provides for lower group fee rates as total fund assets under FMR's management increase, and for higher group fee rates as total fund assets under FMR's management decrease. FMR calculates the group fee rates based on a tiered asset "breakpoint" schedule that varies based on asset class. The Board considered that the group fee is designed to deliver the benefits of economies of scale to fund shareholders when total Fidelity fund assets increase, even if assets of any particular fund are unchanged or have declined, because some portion of Fidelity's costs are attributable to services provided to all Fidelity funds, and all funds benefit if those costs can be allocated among more assets. The Board concluded that, given the group fee structure, fund shareholders will benefit from lower management fees as assets under FMR's management increase at the fund complex level, regardless of whether Fidelity achieves any such economies of scale.
The Board concluded, taking into account the analysis of the Economies of Scale Committee, that any potential economies of scale are being appropriately shared between fund shareholders and Fidelity.
Additional Information Requested by the Board. In order to develop fully the factual basis for consideration of the Fidelity funds' Advisory Contracts, the Board requested and received additional information on certain topics, including (i) fund performance trends, actions to be taken by FMR to improve certain funds' overall performance, and Fidelity's long-term strategies for certain funds; (ii) portfolio manager changes that have occurred during the past year and length of portfolio manager tenure for different categories of funds over time; (iii) Fidelity's compensation structure for portfolio managers and other key personnel and strategies for attracting and retaining non-investment personnel; (iv) the amount of the investment that each portfolio manager has made in the Fidelity fund(s) that he or she manages; (v) historical trends in Fidelity's realization of fall-out benefits; (vi) Fidelity's group fee structures and the rationale for the individual fee rates of certain funds; (vii) fund profitability methodology and the impact of certain factors on fund profitability results; (viii) trends regarding industry use of performance fee structures and Fidelity's compliance practices with respect to performance adjustment calculations; (ix) the fee structures in place for certain other Fidelity clients; and (x) explanations regarding the relative total expense ratios of certain funds and classes, total expense competitive trends, and actions that might be taken by FMR to reduce total expense ratios for certain funds and classes.
Based on its evaluation of all of the conclusions noted above, and after considering all factors it believed relevant, the Board ultimately concluded that the advisory fee structures are fair and reasonable, and that the fund's Advisory Contracts should be renewed.
Annual Report
Investment Adviser
Fidelity Management & Research Company
Boston, MA
Investment Sub-Advisers
FMR Co., Inc.
Fidelity Management & Research (U.K.) Inc.
Fidelity Management & Research (Hong Kong) Limited
Fidelity Management & Research (Japan) Inc.
General Distributor
Fidelity Distributors Corporation
Boston, MA
Transfer and Service Agents
Fidelity Investments Institutional Operations Company, Inc.
Boston, MA
Fidelity Service Company, Inc.
Boston, MA
Custodian
State Street Bank & Trust Co.
Quincy, MA
VNRIC-ANN-0212
1.817379.106
Fidelity® Variable Insurance Products:
Financial Services Portfolio
Annual Report
December 31, 2011
Contents
Performance | (Click Here) | How the fund has done over time. |
Management's Discussion of Fund Performance | (Click Here) | The Portfolio Manager's review of fundperformance and strategy. |
Shareholder Expense Example | (Click Here) | An example of shareholder expenses. |
Investment Changes | (Click Here) | A summary of major shifts in the fund's investments over the past six months. |
Investments | (Click Here) | A complete list of the fund's investments with their
market values. |
Financial Statements | (Click Here) | Statements of assets and liabilities, operations, and
changes in net assets, as well as financial highlights. |
Notes | (Click Here) | Notes to the financial statements. |
Report of Independent Registered Public Accounting Firm | (Click Here) | |
Trustees and Officers | (Click Here) | |
Distributions | (Click Here) | |
Board Approval of Investment Advisory Contracts and Management Fees | (Click Here) | |
To view a fund's proxy voting guidelines and proxy voting record for the 12-month period ended June 30, visit http://www.fidelity.com/proxyvotingresults or visit the Securities and Exchange Commission's (SEC) web site at http://www.sec.gov. You may also call 1-877-208-0098 to request a free copy of the proxy voting guidelines.
Fidelity Variable Insurance Products are separate account options which are purchased through a variable insurance contract.
Standard & Poor's, S&P and S&P 500 are registered service marks of The McGraw-Hill Companies, Inc. and have been licensed for use by Fidelity Distributors Corporation.
Other third party marks appearing herein are the property of their respective owners.
All other marks appearing herein are registered or unregistered trademarks or service marks of FMR LLC or an affiliated company.
This report and the financial statements contained herein are submitted for the general information of the shareholders of the fund. This report is not authorized for distribution to prospective investors in the fund unless preceded or accompanied by an effective prospectus.
A fund files its complete schedule of portfolio holdings with the SEC for the first and third quarters of each fiscal year on Form N-Q. Forms N-Q are available on the SEC's web site at http://www.sec.gov. A fund's Forms N-Q may be reviewed and copied at the SEC's Public Reference Room in Washington, DC. Information regarding the operation of the SEC's Public Reference Room may be obtained by calling 1-800-SEC-0330. For a complete list of a fund's portfolio holdings, view the most recent holdings listing, semiannual report, or annual report on Fidelity's web site at http://www.fidelity.com, http://www.advisor.fidelity.com, or http://www.401k.com, as applicable.
NOT FDIC INSURED • MAY LOSE VALUE • NO BANK GUARANTEE
Neither the fund nor Fidelity Distributors Corporation is a bank.
Annual Report
Average annual total return reflects the change in the value of an investment, assuming reinvestment of the class' distributions from dividend income and capital gains (the profits earned upon the sale of securities that have grown in value, if any) and assuming a constant rate of performance each year. During periods of reimbursement by Fidelity, a fund's total return will be greater than it would be had the reimbursement not occurred. Performance numbers are net of all underlying fund operating expenses, but do not include any insurance charges imposed by your insurance company's separate account. If performance information included the effect of these additional charges, the total returns would have been lower. How a fund did yesterday is no guarantee of how it will do tomorrow.
Average Annual Total Returns
Periods ended December 31, 2011 | Past 1
year | Past 5
years | Past 10
years |
VIP Financial Services Portfolio - Initial Class | -20.46% | -14.04% | -2.71% |
VIP Financial Services Portfolio - Investor Class A | -20.47% | -14.11% | -2.76% |
A The initial offering of Investor Class shares took place on July 21, 2005. Returns prior to July 21, 2005 are those of Initial Class. Had Investor Class's transfer agent fee been reflected, returns prior to July 21, 2005 would have been lower.
$10,000 Over 10 Years
Let's say hypothetically that $10,000 was invested in VIP Financial Services Portfolio - Initial Class on December 31, 2001. The chart shows how the value of your investment would have changed, and also shows how the S&P 500® Index performed over the same period.
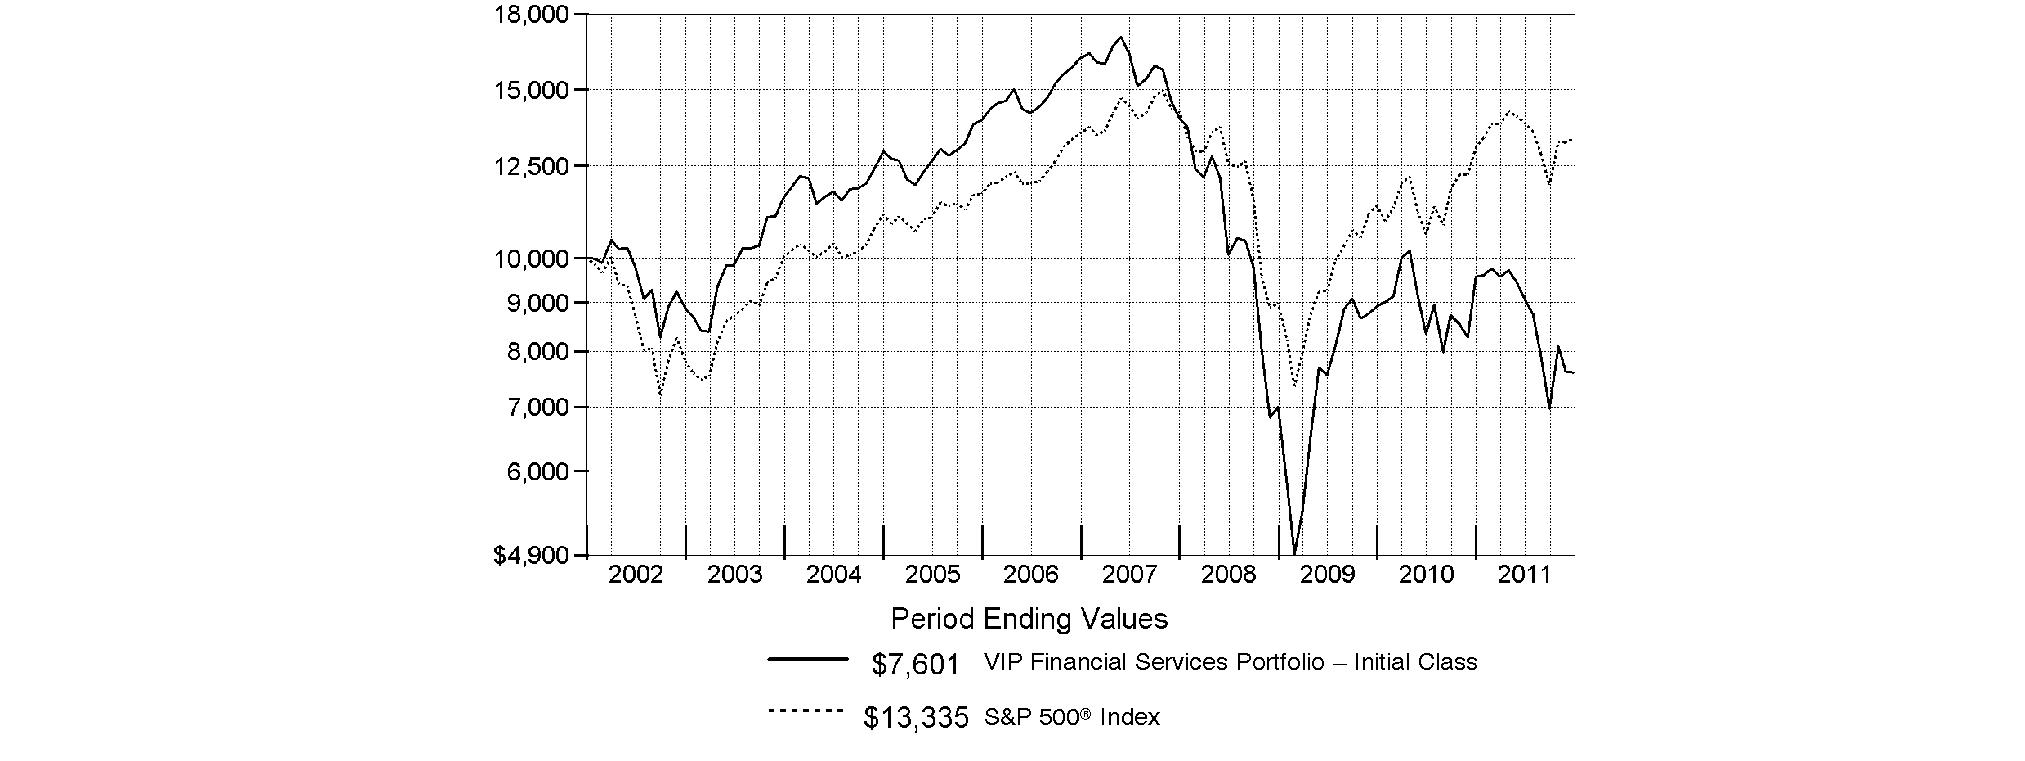
Annual Report
Market Recap: Extreme market volatility took center stage during the 12 months ending December 31, 2011, stealing the spotlight from signs of progress in the global economy. Early in the year, aggressive monetary stimulus by the U.S. federal government, improving credit-market conditions and solid corporate earnings buoyed most major asset classes. As the period progressed, however, fresh worries about sovereign debt in Europe, inflation in China, gridlock over raising the debt ceiling in the U.S. - along with Standard & Poor's early-August downgrade of the nation's long-term sovereign credit rating - and a dimmed outlook for global growth punctured investor confidence and ignited market instability. Domestic equities, as measured by the broad-based S&P 500® Index, gained 2.11%, easily outpacing the 13.61% decline of MSCI® ACWI® (All Country World Index) ex USA Index, a proxy for foreign stocks. Within the MSCI index, emerging markets declined the most (-18%), with investments here generally held back by a stronger U.S. dollar. The U.K. (-3%) fared better than the rest of Europe (-15%), which was the second-worst-performing index component. Bolstered by periodic flights to quality, U.S. investment-grade bonds posted a 7.84% advance, as reflected by the Barclays Capital® U.S. Aggregate Bond Index, outperforming the 4.37% gain of high-yield securities, as represented by The BofA Merrill LynchSM US High Yield Constrained Index. Hampered by financial woes in Europe, the sovereign debt of major developed markets outside the U.S. rose 4.86%, according to the Citigroup® Non-USD Group-of-Seven (G7) Equal Weighted Index, while the JPMorgan Emerging Markets Bond Index Global (EMBI Global) advanced 8.46%, despite the currency head wind.
Comments from Benjamin Hesse, Portfolio Manager of VIP Financial Services Portfolio: For the year, the fund's share classes lagged both the -14.24% return of the MSCI® U.S. IM Financials 25/50 Index and the S&P 500®. (For specific portfolio results, please refer to the performance section of this report.) Versus the MSCI index, an overweighting in investment banking/brokerage hurt performance the most, as weak trading volumes, exposure to Europe and concerns over the future of both proprietary trading and derivatives severely pressured the industry. Individual detractors there included online broker E*TRADE Financial, industry leader Morgan Stanley and commodities/derivatives broker MF Global Holdings, which filed for bankruptcy on October 31. Security selection was disappointing, particularly within regional banks, diversified banks, specialized finance and consumer finance. Among individual detractors here was Texas-based diversified bank Comerica, whose shares were pressured by low interest rates and slow loan growth. Conversely, the fund benefited from exposure to out-of-index data processing/outsourced services stocks, including card processor MasterCard. The stock gained from more clarity on debit card transaction fees. Within other diversified financial services, an underweighting in Bank of America, a large index component, also contributed, as the stock plunged. Some of the stocks mentioned were no longer in the portfolio at period end.
The views expressed above reflect those of the portfolio manager(s) only through the end of the period as stated on the cover of this report and do not necessarily represent the views of Fidelity or any other person in the Fidelity organization. Any such views are subject to change at any time based upon market or other conditions and Fidelity disclaims any responsibility to update such views. These views may not be relied on as investment advice and, because investment decisions for a Fidelity fund are based on numerous factors, may not be relied on as an indication of trading intent on behalf of any Fidelity fund.
Annual Report
As a shareholder of the Fund, you incur two types of costs: (1) transaction costs, including redemption fees, and (2) ongoing costs, including management fees and other Fund expenses. This Example is intended to help you understand your ongoing costs (in dollars) of investing in the Fund and to compare these costs with the ongoing costs of investing in other mutual funds.
The Example is based on an investment of $1,000 invested at the beginning of the period and held for the entire period (July 1, 2011 to December 31, 2011).
Actual Expenses
The first line of the accompanying table for each class of the Fund provides information about actual account values and actual expenses. You may use the information in this line, together with the amount you invested, to estimate the expenses that you paid over the period. Simply divide your account value by $1,000.00 (for example, an $8,600 account value divided by $1,000.00 = 8.6), then multiply the result by the number in the first line for a class of the Fund under the heading entitled "Expenses Paid During Period" to estimate the expenses you paid on your account during this period. The estimate of expenses does not include any fees or other expenses of any variable annuity or variable life insurance product. If they were, the estimate of expenses you paid during the period would be higher, and your ending account value would be lower. In addition, the Fund, as a shareholder in the underlying Fidelity Central Funds, will indirectly bear its pro-rata share of the fees and expenses incurred by the underlying Fidelity Central Funds. These fees and expenses are not included in the Fund's annualized expense ratio used to calculate the expense estimate in the table below.
Hypothetical Example for Comparison Purposes
The second line of the accompanying table for each class of the Fund provides information about hypothetical account values and hypothetical expenses based on a Class' actual expense ratio and an assumed rate of return of 5% per year before expenses, which is not the Class' actual return. The hypothetical account values and expenses may not be used to estimate the actual ending account balance or expenses you paid for the period. You may use this information to compare the ongoing costs of investing in the Fund and other funds. To do so, compare this 5% hypothetical example with the 5% hypothetical examples that appear in the shareholder reports of the other funds. The estimate of expenses does not include any fees or other expenses of any variable annuity or variable life insurance product. If they were, the estimate of expenses you paid during the period would be higher, and your ending account value would be lower. In addition, the Fund, as a shareholder in the underlying Fidelity Central Funds, will indirectly bear its pro-rata share of the fees and expenses incurred by the underlying Fidelity Central Funds. These fees and expenses are not included in the Fund's annualized expense ratio used to calculate the expense estimate in the table below.
Please note that the expenses shown in the table are meant to highlight your ongoing costs only and do not reflect any transaction costs. Therefore, the second line of the table is useful in comparing ongoing costs only, and will not help you determine the relative total costs of owning different funds. In addition, if these transactional costs were included, your costs would have been higher.
| Annualized Expense Ratio | Beginning
Account Value
July 1, 2011 | Ending
Account Value
December 31, 2011 | Expenses Paid
During Period*
July 1, 2011 to
December 31, 2011 |
Initial Class | 1.03% | | | |
Actual | | $ 1,000.00 | $ 839.10 | $ 4.77 |
HypotheticalA | | $ 1,000.00 | $ 1,020.01 | $ 5.24 |
Investor Class | 1.11% | | | |
Actual | | $ 1,000.00 | $ 840.50 | $ 5.15 |
HypotheticalA | | $ 1,000.00 | $ 1,019.61 | $ 5.65 |
A 5% return per year before expenses
* Expenses are equal to each Class' annualized expense ratio, multiplied by the average account value over the period, multiplied by 184/365 (to reflect the one-half year period).
Annual Report
Investment Changes (Unaudited)
Top Ten Stocks as of December 31, 2011 |
| % of fund's
net assets | % of fund's net assets
6 months ago |
JPMorgan Chase & Co. | 5.3 | 4.5 |
Bank of America Corp. | 5.2 | 3.7 |
Citigroup, Inc. | 5.0 | 5.5 |
Morgan Stanley | 4.9 | 4.9 |
E*TRADE Financial Corp. | 4.3 | 4.4 |
Regions Financial Corp. | 3.9 | 3.0 |
AFLAC, Inc. | 3.8 | 0.0 |
Barclays PLC sponsored ADR | 3.2 | 0.0 |
UBS AG (NY Shares) | 3.1 | 0.0 |
Lazard Ltd. Class A | 2.6 | 1.6 |
| 41.3 | |
Top Industries (% of fund's net assets) |
As of December 31, 2011 |
| Capital Markets | 22.3% | |
| Commercial Banks | 20.0% | |
| Diversified Financial Services | 15.7% | |
| Real Estate Investment Trusts | 12.4% | |
| Insurance | 11.8% | |
| All Others* | 17.8% | |

As of June 30, 2011 |
| Capital Markets | 27.1% | |
| Commercial Banks | 23.2% | |
| Diversified Financial Services | 15.9% | |
| IT Services | 10.4% | |
| Consumer Finance | 6.4% | |
| All Others* | 17.0% | |

* Includes short-term investments and net other assets. |
Annual Report
Investments December 31, 2011
Showing Percentage of Net Assets
Common Stocks - 97.7% |
| Shares | | Value |
CAPITAL MARKETS - 22.3% |
Asset Management & Custody Banks - 4.3% |
Affiliated Managers Group, Inc. (a) | 450 | | $ 43,178 |
Apollo Global Management LLC Class A | 25,069 | | 311,106 |
Bank of New York Mellon Corp. | 100 | | 1,991 |
BlackRock, Inc. Class A | 71 | | 12,655 |
Invesco Ltd. | 10,577 | | 212,492 |
Julius Baer Group Ltd. | 70 | | 2,738 |
Legg Mason, Inc. | 162 | | 3,896 |
Northern Trust Corp. | 1,900 | | 75,354 |
State Street Corp. | 92 | | 3,709 |
The Blackstone Group LP | 30,092 | | 421,589 |
| | 1,088,708 |
Diversified Capital Markets - 3.2% |
Credit Suisse Group sponsored ADR | 100 | | 2,348 |
HFF, Inc. (a) | 1,727 | | 17,840 |
UBS AG (NY Shares) (a) | 68,300 | | 807,989 |
| | 828,177 |
Investment Banking & Brokerage - 14.8% |
Charles Schwab Corp. | 200 | | 2,252 |
E*TRADE Financial Corp. (a) | 138,641 | | 1,103,582 |
Evercore Partners, Inc. Class A | 16,046 | | 427,145 |
GFI Group, Inc. | 77,439 | | 319,049 |
Goldman Sachs Group, Inc. | 57 | | 5,155 |
Investment Technology Group, Inc. (a) | 904 | | 9,772 |
Lazard Ltd. Class A | 25,271 | | 659,826 |
Macquarie Group Ltd. | 91 | | 2,214 |
Morgan Stanley | 83,464 | | 1,262,810 |
| | 3,791,805 |
TOTAL CAPITAL MARKETS | | 5,708,690 |
COMMERCIAL BANKS - 20.0% |
Diversified Banks - 8.1% |
Banco ABC Brasil SA | 1,000 | | 6,693 |
Banco Bradesco SA (PN) sponsored ADR | 200 | | 3,336 |
Banco Macro SA sponsored ADR | 100 | | 1,950 |
Banco Pine SA | 22 | | 156 |
Banco Santander SA (Brasil) ADR | 600 | | 4,884 |
BanColombia SA sponsored ADR | 1,300 | | 77,428 |
Bank of Baroda | 1,821 | | 23,098 |
Barclays PLC sponsored ADR (c) | 75,083 | | 825,162 |
BBVA Banco Frances SA sponsored ADR | 500 | | 2,435 |
BNP Paribas SA | 100 | | 3,929 |
Comerica, Inc. | 3,989 | | 102,916 |
CorpBanca SA sponsored ADR | 100 | | 1,989 |
Grupo Financiero Galicia SA sponsored ADR (c) | 400 | | 2,372 |
Guaranty Trust Bank PLC GDR (Reg. S) | 1,200 | | 5,460 |
HSBC Holdings PLC sponsored ADR | 3,400 | | 129,540 |
ICICI Bank Ltd. sponsored ADR | 5,400 | | 142,722 |
Industrial & Commercial Bank of China Ltd. (H Shares) | 1,000 | | 594 |
|
| Shares | | Value |
Intesa Sanpaolo SpA | 748 | | $ 1,253 |
Itau Unibanco Banco Multiplo SA sponsored ADR | 106 | | 1,967 |
National Australia Bank Ltd. | 59 | | 1,409 |
Nordea Bank AB | 200 | | 1,548 |
PT Bank Central Asia Tbk | 3,000 | | 2,647 |
Raiffeisen International Bank-Holding AG | 300 | | 7,767 |
Sberbank (Savings Bank of the Russian Federation) sponsored ADR | 200 | | 1,988 |
Standard Chartered PLC (United Kingdom) | 577 | | 12,627 |
Sumitomo Mitsui Financial Group, Inc. | 500 | | 13,867 |
Swedbank AB (A Shares) | 200 | | 2,591 |
The Jammu & Kashmir Bank Ltd. | 1,677 | | 21,371 |
U.S. Bancorp | 200 | | 5,410 |
UniCredit SpA | 50 | | 416 |
Wells Fargo & Co. | 22,372 | | 616,572 |
Yes Bank Ltd. | 13,517 | | 60,886 |
| | 2,086,983 |
Regional Banks - 11.9% |
Banco Daycoval SA (PN) | 5,000 | | 25,225 |
BancTrust Financial Group, Inc. (a) | 7,400 | | 9,176 |
Bank of the Ozarks, Inc. | 100 | | 2,963 |
BB&T Corp. | 200 | | 5,034 |
Boston Private Financial Holdings, Inc. | 500 | | 3,970 |
Bridge Capital Holdings (a) | 11,030 | | 114,712 |
Canadian Western Bank, Edmonton | 500 | | 12,667 |
Cascade Bancorp (a) | 200 | | 876 |
CIT Group, Inc. (a) | 55 | | 1,918 |
Citizens & Northern Corp. | 100 | | 1,847 |
City Holding Co. | 100 | | 3,389 |
City National Corp. | 1,500 | | 66,270 |
CNB Financial Corp., Pennsylvania | 200 | | 3,156 |
CoBiz, Inc. | 40,720 | | 234,954 |
Fifth Third Bancorp | 21,800 | | 277,296 |
First Commonwealth Financial Corp. | 6,000 | | 31,560 |
First Horizon National Corp. | 27,900 | | 223,200 |
First Interstate Bancsystem, Inc. | 16,920 | | 220,468 |
First Midwest Bancorp, Inc., Delaware | 100 | | 1,013 |
FNB Corp., Pennsylvania | 2,600 | | 29,406 |
Glacier Bancorp, Inc. | 477 | | 5,738 |
Huntington Bancshares, Inc. | 492 | | 2,701 |
KeyCorp | 321 | | 2,468 |
Landmark Bancorp, Inc. | 93 | | 1,753 |
MidWestOne Financial Group, Inc. | 2 | | 29 |
Northrim Bancorp, Inc. | 462 | | 8,090 |
Pacific Continental Corp. | 5,753 | | 50,914 |
PNC Financial Services Group, Inc. | 130 | | 7,497 |
PT Bank Tabungan Negara Tbk | 391,000 | | 52,176 |
Regions Financial Corp. | 231,921 | | 997,260 |
Savannah Bancorp, Inc. (a) | 3,451 | | 17,082 |
SCBT Financial Corp. | 200 | | 5,802 |
SunTrust Banks, Inc. | 4,541 | | 80,376 |
Common Stocks - continued |
| Shares | | Value |
COMMERCIAL BANKS - CONTINUED |
Regional Banks - continued |
Susquehanna Bancshares, Inc. | 15,256 | | $ 127,845 |
SVB Financial Group (a) | 24 | | 1,145 |
Synovus Financial Corp. (c) | 102,451 | | 144,456 |
TCF Financial Corp. | 255 | | 2,632 |
Texas Capital Bancshares, Inc. (a) | 1,000 | | 30,610 |
Valley National Bancorp (c) | 1,200 | | 14,844 |
Virginia Commerce Bancorp, Inc. (a) | 100 | | 773 |
Washington Trust Bancorp, Inc. | 100 | | 2,386 |
Webster Financial Corp. | 6,300 | | 128,457 |
Western Alliance Bancorp. (a) | 13,300 | | 82,859 |
Zions Bancorporation | 142 | | 2,312 |
| | 3,039,305 |
TOTAL COMMERCIAL BANKS | | 5,126,288 |
COMMERCIAL SERVICES & SUPPLIES - 0.0% |
Diversified Support Services - 0.0% |
Intrum Justitia AB | 200 | | 3,132 |
CONSUMER FINANCE - 3.9% |
Consumer Finance - 3.9% |
Advance America Cash Advance Centers, Inc. | 52,680 | | 471,486 |
Capital One Financial Corp. | 4,173 | | 176,476 |
Discover Financial Services | 100 | | 2,400 |
EZCORP, Inc. (non-vtg.) Class A (a) | 4,612 | | 121,618 |
First Cash Financial Services, Inc. (a) | 1,310 | | 45,968 |
Green Dot Corp. Class A (a)(c) | 1,020 | | 31,844 |
International Personal Finance PLC | 20,900 | | 55,670 |
Nelnet, Inc. Class A | 200 | | 4,894 |
Netspend Holdings, Inc. (a) | 299 | | 2,425 |
PT Clipan Finance Indonesia Tbk | 77,000 | | 3,652 |
SLM Corp. | 5,680 | | 76,112 |
| | 992,545 |
DIVERSIFIED CONSUMER SERVICES - 2.0% |
Specialized Consumer Services - 2.0% |
Sotheby's Class A (Ltd. vtg.) | 18,201 | | 519,275 |
DIVERSIFIED FINANCIAL SERVICES - 15.7% |
Other Diversified Financial Services - 15.5% |
Bank of America Corp. | 240,395 | | 1,336,596 |
Citigroup, Inc. | 48,040 | | 1,263,932 |
JPMorgan Chase & Co. | 40,989 | | 1,362,884 |
| | 3,963,412 |
Specialized Finance - 0.2% |
BM&F Bovespa SA | 500 | | 2,630 |
CME Group, Inc. | 13 | | 3,168 |
Life Partners Holdings, Inc. (c) | 600 | | 3,876 |
|
| Shares | | Value |
Moody's Corp. | 100 | | $ 3,368 |
PHH Corp. (a) | 3,758 | | 40,211 |
| | 53,253 |
TOTAL DIVERSIFIED FINANCIAL SERVICES | | 4,016,665 |
ENERGY EQUIPMENT & SERVICES - 0.0% |
Oil & Gas Equipment & Services - 0.0% |
SBM Offshore NV | 300 | | 6,182 |
HOTELS, RESTAURANTS & LEISURE - 0.5% |
Casinos & Gaming - 0.3% |
MGM Mirage, Inc. (a) | 6,504 | | 67,837 |
Hotels, Resorts & Cruise Lines - 0.2% |
Starwood Hotels & Resorts Worldwide, Inc. | 1,100 | | 52,767 |
TOTAL HOTELS, RESTAURANTS & LEISURE | | 120,604 |
HOUSEHOLD DURABLES - 0.6% |
Homebuilding - 0.6% |
Standard Pacific Corp. (a)(c) | 49,700 | | 158,046 |
INSURANCE - 11.8% |
Life & Health Insurance - 4.6% |
AFLAC, Inc. | 22,228 | | 961,583 |
Citizens, Inc. Class A (a) | 500 | | 4,845 |
CNO Financial Group, Inc. (a) | 400 | | 2,524 |
FBL Financial Group, Inc. Class A | 100 | | 3,402 |
Lincoln National Corp. | 100 | | 1,942 |
MetLife, Inc. | 4,113 | | 128,243 |
Phoenix Companies, Inc. (a) | 1,300 | | 2,184 |
Ping An Insurance Group Co. China Ltd. (H Shares) | 500 | | 3,296 |
Prudential Financial, Inc. | 1,036 | | 51,924 |
Resolution Ltd. | 700 | | 2,733 |
StanCorp Financial Group, Inc. | 100 | | 3,675 |
Symetra Financial Corp. | 200 | | 1,814 |
Unum Group | 100 | | 2,107 |
| | 1,170,272 |
Multi-Line Insurance - 2.8% |
American International Group, Inc. (a) | 100 | | 2,320 |
Genworth Financial, Inc. Class A (a) | 99,300 | | 650,415 |
Hartford Financial Services Group, Inc. | 1,400 | | 22,750 |
Loews Corp. | 800 | | 30,120 |
Porto Seguro SA | 500 | | 5,716 |
| | 711,321 |
Property & Casualty Insurance - 2.4% |
ACE Ltd. | 900 | | 63,108 |
Allstate Corp. | 100 | | 2,741 |
Assured Guaranty Ltd. | 100 | | 1,314 |
Axis Capital Holdings Ltd. | 1,000 | | 31,960 |
Berkshire Hathaway, Inc. Class B (a) | 796 | | 60,735 |
Fidelity National Financial, Inc. Class A | 12,100 | | 192,753 |
Common Stocks - continued |
| Shares | | Value |
INSURANCE - CONTINUED |
Property & Casualty Insurance - continued |
First American Financial Corp. | 4,729 | | $ 59,916 |
W.R. Berkley Corp. | 1,000 | | 34,390 |
XL Group PLC Class A | 9,126 | | 180,421 |
| | 627,338 |
Reinsurance - 2.0% |
Arch Capital Group Ltd. (a) | 2,593 | | 96,537 |
Montpelier Re Holdings Ltd. | 200 | | 3,550 |
Platinum Underwriters Holdings Ltd. | 2,200 | | 75,042 |
Validus Holdings Ltd. | 10,660 | | 335,790 |
| | 510,919 |
TOTAL INSURANCE | | 3,019,850 |
INTERNET SOFTWARE & SERVICES - 2.0% |
Internet Software & Services - 2.0% |
China Finance Online Co. Ltd. ADR (a) | 36 | | 58 |
eBay, Inc. (a) | 16,803 | | 509,635 |
| | 509,693 |
IT SERVICES - 0.2% |
Data Processing & Outsourced Services - 0.2% |
Cielo SA | 100 | | 2,587 |
Fidelity National Information Services, Inc. | 200 | | 5,318 |
Fiserv, Inc. (a) | 89 | | 5,228 |
MoneyGram International, Inc. (a) | 100 | | 1,775 |
Redecard SA | 200 | | 3,133 |
The Western Union Co. | 1,408 | | 25,710 |
Total System Services, Inc. | 100 | | 1,956 |
VeriFone Systems, Inc. (a) | 14 | | 497 |
| | 46,204 |
IT Consulting & Other Services - 0.0% |
Accenture PLC Class A | 100 | | 5,323 |
TOTAL IT SERVICES | | 51,527 |
PROFESSIONAL SERVICES - 0.0% |
Research & Consulting Services - 0.0% |
Equifax, Inc. | 65 | | 2,518 |
REAL ESTATE INVESTMENT TRUSTS - 12.4% |
Diversified REITs - 1.0% |
American Assets Trust, Inc. | 1,400 | | 28,714 |
Colonial Properties Trust (SBI) | 10,200 | | 212,772 |
Vornado Realty Trust | 200 | | 15,372 |
| | 256,858 |
Industrial REITs - 0.2% |
DCT Industrial Trust, Inc. | 10,700 | | 54,784 |
|
| Shares | | Value |
Prologis, Inc. | 100 | | $ 2,859 |
Stag Industrial, Inc. | 300 | | 3,441 |
| | 61,084 |
Mortgage REITs - 0.1% |
American Capital Agency Corp. | 46 | | 1,292 |
American Capital Mortgage Investment Corp. | 400 | | 7,528 |
Pennymac Mortgage Investment Trust | 200 | | 3,324 |
| | 12,144 |
Office REITs - 2.7% |
Boston Properties, Inc. | 1,400 | | 139,440 |
Corporate Office Properties Trust (SBI) | 100 | | 2,126 |
Douglas Emmett, Inc. | 9,900 | | 180,576 |
Highwoods Properties, Inc. (SBI) | 1,700 | | 50,439 |
Lexington Corporate Properties Trust (c) | 43,065 | | 322,557 |
MPG Office Trust, Inc. (a) | 1,200 | | 2,388 |
| | 697,526 |
Residential REITs - 2.8% |
American Campus Communities, Inc. | 900 | | 37,764 |
Apartment Investment & Management Co. Class A | 97 | | 2,222 |
AvalonBay Communities, Inc. | 1,100 | | 143,660 |
BRE Properties, Inc. | 100 | | 5,048 |
Camden Property Trust (SBI) | 4,600 | | 286,304 |
Campus Crest Communities, Inc. | 300 | | 3,018 |
Essex Property Trust, Inc. | 52 | | 7,307 |
Home Properties, Inc. | 500 | | 28,785 |
Post Properties, Inc. | 2,600 | | 113,672 |
UDR, Inc. | 3,405 | | 85,466 |
| | 713,246 |
Retail REITs - 0.1% |
Glimcher Realty Trust | 78 | | 718 |
Kimco Realty Corp. | 200 | | 3,248 |
Simon Property Group, Inc. | 153 | | 19,728 |
Urstadt Biddle Properties, Inc. Class A | 300 | | 5,424 |
| | 29,118 |
Specialized REITs - 5.5% |
Big Yellow Group PLC | 19,873 | | 75,714 |
CubeSmart | 3,000 | | 31,920 |
DiamondRock Hospitality Co. | 5,200 | | 50,128 |
HCP, Inc. | 5,787 | | 239,755 |
Health Care REIT, Inc. | 1,200 | | 65,436 |
Host Hotels & Resorts, Inc. | 4,500 | | 66,465 |
Plum Creek Timber Co., Inc. | 700 | | 25,592 |
Potlatch Corp. | 500 | | 15,555 |
Public Storage | 131 | | 17,614 |
Rayonier, Inc. | 100 | | 4,463 |
Strategic Hotel & Resorts, Inc. (a) | 102,938 | | 552,777 |
Sunstone Hotel Investors, Inc. (a) | 5,200 | | 42,380 |
Common Stocks - continued |
| Shares | | Value |
REAL ESTATE INVESTMENT TRUSTS - CONTINUED |
Specialized REITs - continued |
Ventas, Inc. | 2,378 | | $ 131,099 |
Weyerhaeuser Co. | 5,300 | | 98,951 |
| | 1,417,849 |
TOTAL REAL ESTATE INVESTMENT TRUSTS | | 3,187,825 |
REAL ESTATE MANAGEMENT & DEVELOPMENT - 4.0% |
Diversified Real Estate Activities - 1.2% |
Tejon Ranch Co. (a) | 1,200 | | 29,376 |
The St. Joe Co. (a)(c) | 18,500 | | 271,210 |
| | 300,586 |
Real Estate Development - 0.0% |
Bukit Sembawang Estates Ltd. | 2,000 | | 6,044 |
Real Estate Operating Companies - 0.0% |
BR Malls Participacoes SA | 100 | | 973 |
Castellum AB | 200 | | 2,479 |
Thomas Properties Group, Inc. | 500 | | 1,665 |
| | 5,117 |
Real Estate Services - 2.8% |
CBRE Group, Inc. (a) | 33,256 | | 506,156 |
Jones Lang LaSalle, Inc. | 3,388 | | 207,549 |
Kennedy-Wilson Holdings, Inc. | 500 | | 5,290 |
| | 718,995 |
TOTAL REAL ESTATE MANAGEMENT & DEVELOPMENT | | 1,030,742 |
SPECIALTY RETAIL - 2.2% |
Computer & Electronics Retail - 2.0% |
Rent-A-Center, Inc. | 13,364 | | 494,468 |
Home Improvement Retail - 0.2% |
Home Depot, Inc. | 1,360 | | 57,174 |
TOTAL SPECIALTY RETAIL | | 551,642 |
THRIFTS & MORTGAGE FINANCE - 0.1% |
Thrifts & Mortgage Finance - 0.1% |
Brookline Bancorp, Inc., Delaware | 200 | | 1,688 |
Cape Bancorp, Inc. (a) | 300 | | 2,355 |
Cheviot Financial Corp. | 2,424 | | 18,035 |
Hudson City Bancorp, Inc. | 200 | | 1,250 |
|
| Shares | | Value |
People's United Financial, Inc. | 200 | | $ 2,570 |
Washington Mutual, Inc. (a) | 11,457 | | 618 |
Washington Mutual, Inc. (a)(e) | 5,300 | | 286 |
| | 26,802 |
WIRELESS TELECOMMUNICATION SERVICES - 0.0% |
Wireless Telecommunication Services - 0.0% |
American Tower Corp. Class A | 100 | | 6,001 |
TOTAL COMMON STOCKS (Cost $27,209,682) |
25,038,027
|
Money Market Funds - 7.2% |
| | | |
Fidelity Cash Central Fund, 0.11% (b) | 349,250 | | 349,250 |
Fidelity Securities Lending Cash Central Fund, 0.13% (b)(d) | 1,484,975 | | 1,484,975 |
TOTAL MONEY MARKET FUNDS (Cost $1,834,225) |
1,834,225
|
TOTAL INVESTMENT PORTFOLIO - 104.9% (Cost $29,043,907) | 26,872,252 |
NET OTHER ASSETS (LIABILITIES) - (4.9)% | (1,246,175) |
NET ASSETS - 100% | $ 25,626,077 |
Legend |
(a) Non-income producing |
(b) Affiliated fund that is available only to investment companies and other accounts managed by Fidelity Investments. The rate quoted is the annualized seven-day yield of the fund at period end. A complete unaudited listing of the fund's holdings as of its most recent quarter end is available upon request. In addition, each Fidelity Central Fund's financial statements, which are not covered by the Fund's Report of Independent Registered Public Accounting Firm, are available on the SEC's website or upon request. |
(c) Security or a portion of the security is on loan at period end. |
(d) Investment made with cash collateral received from securities on loan. |
(e) Restricted securities - Investment in securities not registered under the Securities Act of 1933 (excluding 144A issues). At the end of the period, the value of restricted securities (excluding 144A issues) amounted to $286 or 0.0% of net assets. |
Additional information on each restricted holding is as follows: |
Security | Acquisition Date | Acquisition Cost |
Washington Mutual, Inc. | 4/8/08 | $ 46,375 |
Affiliated Central Funds |
Information regarding fiscal year to date income earned by the Fund from investments in Fidelity Central Funds is as follows: |
Fund | Income earned |
Fidelity Cash Central Fund | $ 117 |
Fidelity Securities Lending Cash Central Fund | 4,539 |
Total | $ 4,656 |
Other Information |
The following is a summary of the inputs used, as of December 31, 2011, involving the Fund's assets and liabilities carried at fair value. The inputs or methodology used for valuing securities may not be an indication of the risk associated with investing in those securities. For more information on valuation inputs, and their aggregation into the levels used in the table below, please refer to the Security Valuation section in the accompanying Notes to Financial Statements. |
Valuation Inputs at Reporting Date: |
Description | Total | Level 1 | Level 2 | Level 3 |
Investments in Securities: | | | | |
Common Stocks | $ 25,038,027 | $ 24,993,295 | $ 44,732 | $ - |
Money Market Funds | 1,834,225 | 1,834,225 | - | - |
Total Investments in Securities: | $ 26,872,252 | $ 26,827,520 | $ 44,732 | $ - |
Distribution of investments by country of issue, as a percentage of total net assets, is as follows: (Unaudited) |
United States of America | 84.2% |
Bermuda | 5.5% |
United Kingdom | 4.3% |
Switzerland | 3.4% |
India | 1.1% |
Others (Individually Less Than 1%) | 1.5% |
| 100.0% |
See accompanying notes which are an integral part of the financial statements.
Annual Report
Statement of Assets and Liabilities
| December 31, 2011 |
| | |
Assets | | |
Investment in securities, at value (including securities loaned of $1,438,507) - See accompanying schedule: Unaffiliated issuers (cost $27,209,682) | $ 25,038,027 | |
Fidelity Central Funds (cost $1,834,225) | 1,834,225 | |
Total Investments (cost $29,043,907) | | $ 26,872,252 |
Receivable for investments sold | | 520,331 |
Receivable for fund shares sold | | 3,903 |
Dividends receivable | | 29,316 |
Distributions receivable from Fidelity Central Funds | | 849 |
Prepaid expenses | | 57 |
Other receivables | | 6,120 |
Total assets | | 27,432,828 |
| | |
Liabilities | | |
Payable to custodian bank | $ 2,162 | |
Payable for investments purchased | 250,616 | |
Payable for fund shares redeemed | 16,937 | |
Accrued management fee | 12,037 | |
Other affiliated payables | 3,240 | |
Other payables and accrued expenses | 36,784 | |
Collateral on securities loaned, at value | 1,484,975 | |
Total liabilities | | 1,806,751 |
| | |
Net Assets | | $ 25,626,077 |
Net Assets consist of: | | |
Paid in capital | | $ 45,824,709 |
Distributions in excess of net investment income | | (34,836) |
Accumulated undistributed net realized gain (loss) on investments and foreign currency transactions | | (17,992,350) |
Net unrealized appreciation (depreciation) on investments and assets and liabilities in foreign currencies | | (2,171,446) |
Net Assets | | $ 25,626,077 |
Statement of Assets and Liabilities - continued
| December 31, 2011 |
Initial Class:
Net Asset Value, offering price and redemption price per share ($11,804,955 ÷ 2,126,037 shares) | | $ 5.55 |
| | |
Investor Class:
Net Asset Value, offering price and redemption price per share ($13,821,122 ÷ 2,496,093 shares) | | $ 5.54 |
See accompanying notes which are an integral part of the financial statements.
Annual Report
Statement of Operations
| Year ended December 31, 2011 |
| | |
Investment Income | | |
Dividends | | $ 358,511 |
Interest | | 539 |
Income from Fidelity Central Funds | | 4,656 |
Total income | | 363,706 |
| | |
Expenses | | |
Management fee | $ 189,868 | |
Transfer agent fees | 46,794 | |
Accounting and security lending fees | 13,533 | |
Custodian fees and expenses | 28,512 | |
Independent trustees' compensation | 193 | |
Audit | 45,364 | |
Legal | 172 | |
Miscellaneous | 377 | |
Total expenses before reductions | 324,813 | |
Expense reductions | (20,389) | 304,424 |
Net investment income (loss) | | 59,282 |
Realized and Unrealized Gain (Loss) Net realized gain (loss) on: | | |
Investment securities: | | |
Unaffiliated issuers | (3,150,413) | |
Foreign currency transactions | (45,586) | |
Total net realized gain (loss) | | (3,195,999) |
Change in net unrealized appreciation (depreciation) on: Investment securities | (4,006,533) | |
Assets and liabilities in foreign currencies | 100 | |
Total change in net unrealized appreciation (depreciation) | | (4,066,533) |
Net gain (loss) | | (7,202,532) |
Net increase (decrease) in net assets resulting from operations | | $ (7,143,250) |
Statement of Changes in Net Assets
| Year ended
December 31, 2011 | Year ended
December 31, 2010 |
Increase (Decrease) in Net Assets | | |
Operations | | |
Net investment income (loss) | $ 59,282 | $ 123,372 |
Net realized gain (loss) | (3,195,999) | 411,816 |
Change in net unrealized appreciation (depreciation) | (4,006,533) | (791,713) |
Net increase (decrease) in net assets resulting from operations | (7,143,250) | (256,525) |
Distributions to shareholders from net investment income | (114,942) | (76,655) |
Share transactions - net increase (decrease) | (7,950,716) | 4,212,776 |
Redemption fees | 21,144 | 25,036 |
Total increase (decrease) in net assets | (15,187,764) | 3,904,632 |
| | |
Net Assets | | |
Beginning of period | 40,813,841 | 36,909,209 |
End of period (including distributions in excess of net investment income of $34,836 and undistributed net investment income of $22,678, respectively) | $ 25,626,077 | $ 40,813,841 |
See accompanying notes which are an integral part of the financial statements.
Annual Report
Financial Highlights - Initial Class
Years ended December 31, | 2011 | 2010 | 2009 | 2008 | 2007 |
Selected Per-Share Data | | | | | |
Net asset value, beginning of period | $ 7.01 | $ 6.55 | $ 5.22 | $ 11.57 | $ 14.60 |
Income from Investment Operations | | | | | |
Net investment income (loss) C | .01 | .02 | .06 | .21 | .20 |
Net realized and unrealized gain (loss) | (1.44) | .46 | 1.35 | (5.68) | (2.02) |
Total from investment operations | (1.43) | .48 | 1.41 | (5.47) | (1.82) |
Distributions from net investment income | (.03) | (.02) | (.09) | (.15) | (.36) |
Distributions from net realized gain | - | - | - | (.74) | (.86) |
Total distributions | (.03) | (.02) | (.09) | (.89) | (1.22) |
Redemption fees added to paid in capital C | - G | - G | .01 | .01 | .01 |
Net asset value, end of period | $ 5.55 | $ 7.01 | $ 6.55 | $ 5.22 | $ 11.57 |
Total Return A,B | (20.46)% | 7.28% | 27.30% | (50.08)% | (13.43)% |
Ratios to Average Net Assets D,F | | | | | |
Expenses before reductions | .92% | .90% | .91% | .84% | .87% |
Expenses net of fee waivers, if any | .91% | .90% | .91% | .84% | .87% |
Expenses net of all reductions | .86% | .85% | .87% | .84% | .87% |
Net investment income (loss) | .22% | .34% | 1.09% | 2.64% | 1.48% |
Supplemental Data | | | | | |
Net assets, end of period (000 omitted) | $ 11,805 | $ 18,959 | $ 20,155 | $ 17,436 | $ 23,631 |
Portfolio turnover rate E | 350% | 288% | 336% | 100% | 48% |
A Total returns do not reflect charges attributable to your insurance company's separate account. Inclusion of these charges would reduce the total returns shown.
B Total returns would have been lower if certain expenses had not been reduced during the applicable periods shown.
C Calculated based on average shares outstanding during the period.
D Fees and expenses of any underlying Fidelity Central Funds are not included in the Fund's expense ratio. The Fund indirectly bears its proportionate share of the expenses of any underlying Fidelity Central Funds.
E Amount does not include the portfolio activity of any underlying Fidelity Central Funds.
F Expense ratios reflect operating expenses of the class. Expenses before reductions do not reflect amounts reimbursed by the investment adviser or reductions from brokerage service arrangements or reductions from other expense offset arrangements and do not represent the amount paid by the class during periods when reimbursements or reductions occur. Expenses net of fee waivers reflect expenses after reimbursement by the investment adviser but prior to reductions from brokerage service arrangements or other expense offset arrangements. Expenses net of all reductions represent the net expenses paid by the class.
G Amount represents less than $.01 per share.
Financial Highlights - Investor Class
Years ended December 31, | 2011 | 2010 | 2009 | 2008 | 2007 |
Selected Per-Share Data | | | | | |
Net asset value, beginning of period | $ 6.99 | $ 6.53 | $ 5.20 | $ 11.54 | $ 14.57 |
Income from Investment Operations | | | | | |
Net investment income (loss) C | .01 | .02 | .06 | .20 | .18 |
Net realized and unrealized gain (loss) | (1.44) | .45 | 1.34 | (5.67) | (2.02) |
Total from investment operations | (1.43) | .47 | 1.40 | (5.47) | (1.84) |
Distributions from net investment income | (.02) | (.01) | (.08) | (.14) | (.34) |
Distributions from net realized gain | - | - | - | (.74) | (.86) |
Total distributions | (.02) | (.01) | (.08) | (.88) | (1.20) |
Redemption fees added to paid in capital C | - G | - G | .01 | .01 | .01 |
Net asset value, end of period | $ 5.54 | $ 6.99 | $ 6.53 | $ 5.20 | $ 11.54 |
Total Return A,B | (20.47)% | 7.24% | 27.30% | (50.18)% | (13.60)% |
Ratios to Average Net Assets D,F | | | | | |
Expenses before reductions | .99% | .99% | 1.01% | .94% | .99% |
Expenses net of fee waivers, if any | .99% | .98% | 1.01% | .94% | .99% |
Expenses net of all reductions | .93% | .94% | .97% | .94% | .99% |
Net investment income (loss) | .14% | .25% | .99% | 2.54% | 1.36% |
Supplemental Data | | | | | |
Net assets, end of period (000 omitted) | $ 13,821 | $ 21,855 | $ 16,754 | $ 12,012 | $ 10,530 |
Portfolio turnover rate E | 350% | 288% | 336% | 100% | 48% |
A Total returns do not reflect charges attributable to your insurance company's separate account. Inclusion of these charges would reduce the total returns shown.
B Total returns would have been lower if certain expenses had not been reduced during the applicable periods shown.
C Calculated based on average shares outstanding during the period.
D Fees and expenses of any underlying Fidelity Central Funds are not included in the Fund's expense ratio. The Fund indirectly bears its proportionate share of the expenses of any underlying Fidelity Central Funds.
E Amount does not include the portfolio activity of any underlying Fidelity Central Funds.
F Expense ratios reflect operating expenses of the class. Expenses before reductions do not reflect amounts reimbursed by the investment adviser or reductions from brokerage service arrangements or reductions from other expense offset arrangements and do not represent the amount paid by the class during periods when reimbursements or reductions occur. Expenses net of fee waivers reflect expenses after reimbursement by the investment adviser but prior to reductions from brokerage service arrangements or other expense offset arrangements. Expenses net of all reductions represent the net expenses paid by the class.
G Amount represents less than $.01 per share.
See accompanying notes which are an integral part of the financial statements.
Annual Report
Notes to Financial Statements
For the period ended December 31, 2011
1. Organization.
VIP Financial Services Portfolio (the Fund) is a fund of Variable Insurance Products Fund IV (the Trust) and is authorized to issue an unlimited number of shares. The Trust is registered under the Investment Company Act of 1940, as amended (the 1940 Act), as an open-end management investment company organized as a Massachusetts business trust. Shares of the Fund may only be purchased by insurance companies for the purpose of funding variable annuity or variable life insurance contracts. The Fund offers the following classes of shares: Initial Class shares and Investor Class shares. All classes have equal rights and voting privileges, except for matters affecting a single class. Investment income, realized and unrealized capital gains and losses, the common expenses of the Fund, and certain fund-level expense reductions, if any, are allocated on a pro-rata basis to each class based on the relative net assets of each class to the total net assets of the Fund. Each class differs with respect to transfer agent fees incurred. Certain expense reductions may also differ by class. The Fund's investments in emerging markets can be subject to social, economic, regulatory, and political uncertainties and can be extremely volatile.
2. Investments in Fidelity Central Funds.
The Fund invests in Fidelity Central Funds, which are open-end investment companies available only to other investment companies and accounts managed by Fidelity Management & Research Company (FMR) and its affiliates. The Fund's Schedule of Investments lists each of the Fidelity Central Funds held as of period end, if any, as an investment of the Fund, but do not include the underlying holdings of each Fidelity Central Fund. As an Investing Fund, the Fund indirectly bears its proportionate share of the expenses of the underlying Fidelity Central Funds.
The Money Market Central Funds seek preservation of capital and current income and are managed by Fidelity Investments Money Management, Inc. (FIMM), an affiliate of FMR.
A complete unaudited list of holdings for each Fidelity Central Fund is available upon request or at the Securities and Exchange Commission (the SEC) web site at www.sec.gov. In addition, the financial statements of the Fidelity Central Funds, which are not covered by the Fund's Report of Independent Registered Public Accounting Firm, are available on the SEC web site or upon request.
3. Significant Accounting Policies.
The financial statements have been prepared in conformity with accounting principles generally accepted in the United States of America (GAAP), which require management to make certain estimates and assumptions at the date of the financial statements. Actual results could differ from those estimates. Subsequent events, if any, through the date that the financial statements were issued have been evaluated in the preparation of the financial statements. The following summarizes the significant accounting policies of the Fund:
Security Valuation. Investments are valued as of 4:00 p.m. Eastern time on the last calendar day of the period. The Fund uses independent pricing services approved by the Board of Trustees to value its investments. When current market prices or quotations are not readily available or reliable, valuations may be determined in good faith in accordance with procedures adopted by the Board of Trustees. Factors used in determining value may include market or security specific events. The frequency with which these procedures are used cannot be predicted and they may be utilized to a significant extent. The value used for net asset value (NAV) calculation under these procedures may differ from published prices for the same securities.
The Fund categorizes the inputs to valuation techniques used to value its investments into a disclosure hierarchy consisting of three levels as shown below:
Level 1 - quoted prices in active markets for identical investments
Level 2 - other significant observable inputs (including quoted prices for similar investments, interest rates, prepayment speeds, etc.)
Level 3 - unobservable inputs (including the Fund's own assumptions based on the best information available)
Changes in valuation techniques may result in transfers in or out of an assigned level within the disclosure hierarchy. The aggregate value of investments by input level, as of December 31, 2011, is included at the end of the Fund's Schedule of Investments. Valuation techniques used to value the Fund's investments by major category are as follows:
Equity securities, including restricted securities, for which market quotations are readily available, are valued at the last reported sale price or official closing price as reported by an independent pricing service on the primary market or exchange on which they are traded and are categorized as Level 1 in the hierarchy. In the event there were no sales during the day or closing prices are not available, securities are valued at the last quoted bid price or may be valued using the last available price and are generally categorized as Level 2 in the hierarchy. For foreign equity securities, when significant market or security specific events arise, comparisons to the valuation of American Depositary Receipts (ADRs), futures contracts, Exchange-traded funds (ETFs) and certain indexes as well as quoted prices for similar securities are used and are categorized as Level 2 in the hierarchy in these circumstances. Utilizing these techniques may result in transfers between Level 1 and Level 2. For restricted equity securities and private placements where observable inputs are limited, assumptions about market activity and risk are used and are categorized as Level 3 in the hierarchy.
Annual Report
Notes to Financial Statements - continued
3. Significant Accounting Policies - continued
Security Valuation - continued
Investments in open-end mutual funds ,including the Fidelity Central Funds, are valued at their closing net asset value each business day and are categorized as Level 1 in the hierarchy. Short-term securities with remaining maturities of sixty days or less may be valued at amortized cost, which approximates fair value, and are categorized as Level 2 in the hierarchy.
New Accounting Pronouncements. In May 2011, the Financial Accounting Standards Board issued Accounting Standard Update No. 2011-04, Fair Value Measurement (Topic 820) - Amendments to Achieve Common Fair Value Measurement and Disclosure Requirements in U.S. GAAP and IFRSs. The update is effective during interim and annual periods beginning after December 15, 2011 and will result in additional disclosure for transfers between levels as well as expanded disclosure for securities categorized as Level 3 under the fair value hierarchy.
In December 2011, the Financial Accounting Standards Board issued Accounting Standard Update No. 2011-11, Disclosures about Offsetting Assets and Liabilities. The update creates new disclosure requirements requiring entities to disclose both gross and net information for derivatives and other financial instruments that are either offset in the Statement of Assets and Liabilities or subject to an enforceable master netting arrangement or similar agreement. The disclosure requirements are effective for annual reporting periods beginning on or after January 1, 2013. Management is currently evaluating the impact of the update's adoption on the Fund's financial statement disclosures.
Foreign Currency. The Fund may use foreign currency contracts to facilitate transactions in foreign-denominated securities. Gains and losses from these transactions may arise from changes in the value of the foreign currency or if the counterparties do not perform under the contracts' terms.
Foreign-denominated assets, including investment securities, and liabilities are translated into U.S. dollars at the exchange rate at period end. Purchases and sales of investment securities, income and dividends received and expenses denominated in foreign currencies are translated into U.S. dollars at the exchange rate in effect on the transaction date.
The effects of exchange rate fluctuations on investments are included with the net realized and unrealized gain (loss) on investment securities. Other foreign currency transactions resulting in realized and unrealized gain (loss) are disclosed separately.
Investment Transactions and Income. For financial reporting purposes, the Fund's investment holdings and NAV include trades executed through the end of the last business day of the period. The NAV per share for processing shareholder transactions is calculated as of the close of business of the New York Stock Exchange (NYSE), normally 4:00 p.m. Eastern time and includes trades executed through the end of the prior business day. Gains and losses on securities sold are determined on the basis of identified cost and may include proceeds received from litigation. Dividend income is recorded on the ex-dividend date, except for certain dividends from foreign securities where the ex-dividend date may have passed, which are recorded as soon as the Fund is informed of the ex-dividend date. Non-cash dividends included in dividend income, if any, are recorded at the fair market value of the securities received. Distributions received on securities that represent a return of capital or capital gain are recorded as a reduction of cost of investments and/or as a realized gain. The Fund estimates the components of distributions received that may be considered return of capital distributions or capital gain distributions. As a result of a change in the estimate of the return of capital component of dividend income realized in the year ended December 31, 2010, dividend income has been reduced $54,618 with a corresponding increase to net unrealized appreciation (depreciation). The change in estimate has no impact on total net assets or total return of the Fund. Interest income and distributions from the Fidelity Central Funds are accrued as earned. Interest income includes coupon interest and amortization of premium and accretion of discount on debt securities. Investment income is recorded net of foreign taxes withheld where recovery of such taxes is uncertain.
Expenses. Expenses directly attributable to a fund are charged to that fund. Expenses attributable to more than one fund are allocated among the respective funds on the basis of relative net assets or other appropriate methods. Expense estimates are accrued in the period to which they relate and adjustments are made when actual amounts are known.
Income Tax Information and Distributions to Shareholders. Each year, the Fund intends to qualify as a regulated investment company, including distributing substantially all of its taxable income and realized gains under Subchapter M of the Internal Revenue Code. As a result, no provision for income taxes is required. As of December 31, 2011, the Fund did not have any unrecognized tax benefits in the financial statements; nor is the Fund aware of any tax positions for which it is reasonably possible that the total amounts of unrecognized tax benefits will significantly change in the next twelve months. The Fund files a U.S. federal tax return, in addition to state and local tax returns as required. A fund's tax returns are subject to examination by the Internal Revenue Service (IRS) for a period of three fiscal years. State and local tax returns may be subject to examination for an additional fiscal year depending on the jurisdiction. Foreign taxes are provided for based on the Fund's understanding of the tax rules and rates that exist in the foreign markets in which it invests.
Annual Report
3. Significant Accounting Policies - continued
Income Tax Information and Distributions to Shareholders - continued
Distributions are declared and recorded on the ex-dividend date. Income dividends and capital gain distributions are declared separately for each class. Income and capital gain distributions are determined in accordance with income tax regulations, which may differ from GAAP.
Capital accounts within the financial statements are adjusted for permanent book-tax differences. These adjustments have no impact on net assets or the results of operations. Temporary book-tax differences will reverse in a subsequent period.
Book-tax differences are primarily due to foreign currency transactions, certain foreign taxes, partnerships, equity-debt classifications, capital loss carryforwards, and losses deferred due to wash sales and excise tax regulations.
The federal tax cost of investment securities and unrealized appreciation (depreciation) as of period end were as follows:
Gross unrealized appreciation | $ 1,073,260 |
Gross unrealized depreciation | (3,984,963) |
Net unrealized appreciation (depreciation) on securities and other investments | $ (2,911,703) |
| |
Tax Cost | $ 29,783,955 |
The tax-based components of distributable earnings as of period end were as follows:
Capital loss carryforward | $ (17,252,302) |
Net unrealized appreciation (depreciation) | $ (2,911,494) |
Capital loss carryforwards are only available to offset future capital gains of the Fund to the extent provided by regulations and may be limited. Under the Regulated Investment Company Modernization Act of 2010 (the Act), the Fund is permitted to carry forward capital losses incurred in taxable years beginning after December 22, 2010 for an unlimited period and such capital losses are required to be used prior to any losses that expire. Capital loss carryforwards were as follows:
Fiscal year of expiration | |
2016 | $ (5,270,638) |
2017 | (8,647,927) |
Total with expiration | (13,918,565) |
No expiration | |
Short-term | (2,212,588) |
Long-term | (1,121,149) |
Total no expiration | (3,333,737) |
Total capital loss carryforward | $ (17,252,302) |
The tax character of distributions paid was as follows:
| December 31, 2011 | December 31, 2010 |
Ordinary Income | $ 114,942 | $ 76,655 |
Trading (Redemption) Fees. Shares held by investors less than 60 days are subject to a redemption fee equal to 1% of the net asset value of shares redeemed. All redemption fees, which reduce the proceeds of the shareholder redemption, are retained by the Fund and accounted for as an addition to paid in capital.
4. Operating Policies.
Restricted Securities. The Fund may invest in securities that are subject to legal or contractual restrictions on resale. These securities generally may be resold in transactions exempt from registration or to the public if the securities are registered. Disposal of these securities may involve time-consuming negotiations and expense, and prompt sale at an acceptable price may be difficult. Information regarding restricted securities is included at the end of the Fund's Schedule of Investments.
5. Purchases and Sales of Investments.
Purchases and sales of securities, other than short-term securities, aggregated $117,001,684 and $124,443,503, respectively.
Annual Report
Notes to Financial Statements - continued
6. Fees and Other Transactions with Affiliates.
Management Fee. FMR and its affiliates provide the Fund with investment management related services for which the Fund pays a monthly management fee. The management fee is the sum of an individual fund fee rate that is based on an annual rate of .30% of the Fund's average net assets and an annualized group fee rate that averaged .26% during the period. The group fee rate is based upon the average net assets of all the mutual funds advised by FMR. The group fee rate decreases as assets under management increase and increases as assets under management decrease. For the period, the total annual management fee rate was .56% of the Fund's average net assets.
Transfer Agent Fees. Fidelity Investments Institutional Operations Company, Inc. (FIIOC), an affiliate of FMR, is the Fund's transfer, dividend disbursing, and shareholder servicing agent. FIIOC receives an asset-based fee with respect to each class. Each class (with the exception of Investor Class) pays a transfer agent fee, excluding out of pocket expenses, equal to an annual rate of .07% of average net assets. Investor Class pays a monthly asset-based transfer agent fee of .15% of average net assets. In addition, FIIOC receives an asset-based fee of .0045% of average net assets for typesetting, printing and mailing of shareholder reports, except proxy statements. FIIOC voluntarily agreed to waive this fee for the period August 1, 2011 through December 31, 2011 (see Expense Reductions note). For the period, transfer agent fees for each class, including printing and out of pocket expenses, were as follows:
Initial Class | $ 14,358 |
Investor Class | 32,436 |
| $ 46,794 |
Accounting and Security Lending Fees. Fidelity Service Company, Inc. (FSC), an affiliate of FMR, maintains the Fund's accounting records. The accounting fee is based on the level of average net assets for the month. Under a separate contract, FSC administers the security lending program. The security lending fee is based on the number and duration of lending transactions.
Brokerage Commissions. The Fund placed a portion of its portfolio transactions with brokerage firms which are affiliates of the investment adviser. The commissions paid to these affiliated firms were $8,003 for the period.
7. Committed Line of Credit.
The Fund participates with other funds managed by FMR or an affiliate in a $4.0 billion credit facility (the "line of credit") to be utilized for temporary or emergency purposes to fund shareholder redemptions or for other short-term liquidity purposes. The Fund has agreed to pay commitment fees on its pro-rata portion of the line of credit, which amounted to $111 and is reflected in Miscellaneous expenses on the Statement of Operations. During the period, there were no borrowings on this line of credit.
8. Security Lending.
The Fund lends portfolio securities through a lending agent from time to time in order to earn additional income. For equity securities, a lending agent is used and may loan securities to certain qualified borrowers, including Fidelity Capital Markets (FCM), a broker-dealer affiliated with the Fund. On the settlement date of the loan, the Fund receives collateral (in the form of U.S. Treasury obligations, letters of credit and/or cash) against the loaned securities and maintains collateral in an amount not less than 100% of the market value of the loaned securities during the period of the loan. The market value of the loaned securities is determined at the close of business of the Fund and any additional required collateral is delivered to the Fund on the next business day. If the borrower defaults on its obligation to return the securities loaned because of insolvency or other reasons, a fund could experience delays and costs in recovering the securities loaned or in gaining access to the collateral. Any cash collateral received is invested in the Fidelity Securities Lending Cash Central Fund. The value of loaned securities and cash collateral at period end are disclosed on the Fund's Statement of Assets and Liabilities. Security lending income represents the income earned on investing cash collateral, less rebates paid to borrowers and any lending agent fees associated with the loan, plus any premium payments received for lending certain types of securities. Security lending income is presented in the Statement of Operations as a component of income from Fidelity Central Funds. Total security lending income during the period amounted to $4,539. During the period, there were no securities loaned to FCM.
9. Expense Reductions.
FMR or its affiliates agreed to waive certain fees during the period as noted in the table below.
Initial Class | $ 218 |
Investor Class | 277 |
| $ 495 |
Many of the brokers with whom FMR places trades on behalf of the Fund provided services to the Fund in addition to trade execution. These services included payments of certain expenses on behalf of the Fund totaling $19,894 for the period.
Annual Report
10. Distributions to Shareholders.
Distributions to shareholders of each class were as follows:
Years ended December 31, | 2011 | 2010 |
From net investment income | | |
Initial Class | $ 59,537 | $ 42,604 |
Investor Class | 55,405 | 34,051 |
Total | $ 114,942 | $ 76,655 |
11. Share Transactions.
Transactions for each class of shares were as follows:
| Shares | Dollars |
Years ended December 31, | 2011 | 2010 | 2011 | 2010 |
Initial Class | | | | |
Shares sold | 1,039,994 | 2,381,105 | $ 6,684,536 | $ 17,410,002 |
Reinvestment of distributions | 10,399 | 6,451 | 59,537 | 42,604 |
Shares redeemed | (1,628,494) | (2,758,772) | (10,826,548) | (17,958,382) |
Net increase (decrease) | (578,101) | (371,216) | $ (4,082,475) | $ (505,776) |
Investor Class | | | | |
Shares sold | 1,382,202 | 2,187,245 | $ 9,178,576 | $ 15,259,152 |
Reinvestment of distributions | 9,500 | 5,183 | 55,405 | 34,051 |
Shares redeemed | (2,022,704) | (1,629,111) | (13,102,222) | (10,574,651) |
Net increase (decrease) | (631,002) | 563,317 | $ (3,868,241) | $ 4,718,552 |
12. Other.
The Fund's organizational documents provide former and current trustees and officers with a limited indemnification against liabilities arising in connection with the performance of their duties to the Fund. In the normal course of business, the Fund may also enter into contracts that provide general indemnifications. The Fund's maximum exposure under these arrangements is unknown as this would be dependent on future claims that may be made against the Fund. The risk of material loss from such claims is considered remote.
At the end of the period, FMR or its affiliates were the owners of record of 100% of the total outstanding shares of the Fund.
Annual Report
Report of Independent Registered Public Accounting Firm
To the Trustees of Variable Insurance Products Fund IV and the Shareholders of VIP Financial Services Portfolio:
In our opinion, the accompanying statement of assets and liabilities, including the schedule of investments, and the related statements of operations and of changes in net assets and the financial highlights present fairly, in all material respects, the financial position of VIP Financial Services Portfolio (a fund of Variable Insurance Products Fund IV) at December 31, 2011, the results of its operations for the year then ended, the changes in its net assets for each of the two years in the period then ended and the financial highlights for each of the five years in the period then ended, in conformity with accounting principles generally accepted in the United States of America. These financial statements and financial highlights (hereafter referred to as "financial statements") are the responsibility of the VIP Financial Services Portfolio's management. Our responsibility is to express an opinion on these financial statements based on our audits. We conducted our audits of these financial statements in accordance with the standards of the Public Company Accounting Oversight Board (United States). Those standards require that we plan and perform the audit to obtain reasonable assurance about whether the financial statements are free of material misstatement. An audit includes examining, on a test basis, evidence supporting the amounts and disclosures in the financial statements, assessing the accounting principles used and significant estimates made by management, and evaluating the overall financial statement presentation. We believe that our audits, which included confirmation of securities at December 31, 2011 by correspondence with the custodian and brokers, provide a reasonable basis for our opinion.
/s/ PricewaterhouseCoopers LLP
PricewaterhouseCoopers LLP
Boston, Massachusetts
February 14, 2012
Annual Report
The Trustees, Members of the Advisory Board, and executive officers of the trust and fund, as applicable, are listed below. The Board of Trustees governs the fund and is responsible for protecting the interests of shareholders. The Trustees are experienced executives who meet periodically throughout the year to oversee the fund's activities, review contractual arrangements with companies that provide services to the fund, oversee management of the risks associated with such activities and contractual arrangements, and review the fund's performance. Except for James C. Curvey, each of the Trustees oversees 226 funds advised by FMR or an affiliate. Mr. Curvey oversees 429 funds advised by FMR or an affiliate.
The Trustees hold office without limit in time except that (a) any Trustee may resign; (b) any Trustee may be removed by written instrument, signed by at least two-thirds of the number of Trustees prior to such removal; (c) any Trustee who requests to be retired or who has become incapacitated by illness or injury may be retired by written instrument signed by a majority of the other Trustees; and (d) any Trustee may be removed at any special meeting of shareholders by a two-thirds vote of the outstanding voting securities of the trust. Each Trustee who is not an interested person (as defined in the 1940 Act) (Independent Trustee), shall retire not later than the last day of the calendar year in which his or her 75th birthday occurs. The Independent Trustees may waive this mandatory retirement age policy with respect to individual Trustees. The executive officers and Advisory Board Members hold office without limit in time, except that any officer and Advisory Board Member may resign or may be removed by a vote of a majority of the Trustees at any regular meeting or any special meeting of the Trustees. Except as indicated, each individual has held the office shown or other offices in the same company for the past five years.
Experience, Skills, Attributes, and Qualifications of the Fund's Trustees. The Governance and Nominating Committee has adopted a statement of policy that describes the experience, qualifications, attributes, and skills that are necessary and desirable for potential Independent Trustee candidates (Statement of Policy). The Board believes that each Trustee satisfied at the time he or she was initially elected or appointed a Trustee, and continues to satisfy, the standards contemplated by the Statement of Policy. The Governance and Nominating Committee also engages professional search firms to help identify potential Independent Trustee candidates who have the experience, qualifications, attributes, and skills consistent with the Statement of Policy. From time to time, additional criteria based on the composition and skills of the current Independent Trustees, as well as experience or skills that may be appropriate in light of future changes to board composition, business conditions, and regulatory or other developments, have also been considered by the professional search firms and the Governance and Nominating Committee. In addition, the Board takes into account the Trustees' commitment and participation in Board and committee meetings, as well as their leadership of standing and ad hoc committees throughout their tenure.
In determining that a particular Trustee was and continues to be qualified to serve as a Trustee, the Board has considered a variety of criteria, none of which, in isolation, was controlling. The Board believes that, collectively, the Trustees have balanced and diverse experience, qualifications, attributes, and skills, which allow the Board to operate effectively in governing the fund and protecting the interests of shareholders. Information about the specific experience, skills, attributes, and qualifications of each Trustee, which in each case led to the Board's conclusion that the Trustee should serve (or continue to serve) as a trustee of the fund, is provided below.
Board Structure and Oversight Function. James C. Curvey is an interested person (as defined in the 1940 Act) and currently serves as Acting Chairman. The Trustees have determined that an interested Chairman is appropriate and benefits shareholders because an interested Chairman has a personal and professional stake in the quality and continuity of services provided to the fund. Independent Trustees exercise their informed business judgment to appoint an individual of their choosing to serve as Chairman, regardless of whether the Trustee happens to be independent or a member of management. The Independent Trustees have determined that they can act independently and effectively without having an Independent Trustee serve as Chairman and that a key structural component for assuring that they are in a position to do so is for the Independent Trustees to constitute a substantial majority for the Board. The Independent Trustees also regularly meet in executive session. Ned C. Lautenbach serves as Chairman of the Independent Trustees and as such (i) acts as a liaison between the Independent Trustees and management with respect to matters important to the Independent Trustees and (ii) with management prepares agendas for Board meetings.
Fidelity funds are overseen by different Boards of Trustees. The fund's Board oversees Fidelity's equity and high income funds and another Board oversees Fidelity's investment-grade bond, money market, and asset allocation funds. The asset allocation funds may invest in Fidelity funds overseen by the fund's Board. The use of separate Boards, each with its own committee structure, allows the Trustees of each group of Fidelity funds to focus on the unique issues of the funds they oversee, including common research, investment, and operational issues. On occasion, the separate Boards establish joint committees to address issues of overlapping consequences for the Fidelity funds overseen by each Board.
The Trustees operate using a system of committees to facilitate the timely and efficient consideration of all matters of importance to the Trustees, the fund, and fund shareholders and to facilitate compliance with legal and regulatory requirements and oversight of the fund's activities and associated risks. The Board, acting through its committees, has charged FMR and its affiliates with (i) identifying events or circumstances the occurrence of which could have demonstrably adverse effects on the fund's business and/or reputation; (ii) implementing processes and controls to lessen the possibility that such events or circumstances occur or to mitigate the effects of such events or circumstances if they do occur; and (iii) creating and maintaining a system designed to evaluate continuously business and market conditions in order to facilitate the identification and implementation processes described in (i) and (ii) above. Because the day-to-day operations and activities of the fund are carried out by or through FMR, its affiliates and other service providers, the fund's exposure to risks is mitigated but not eliminated by the processes overseen by the Trustees. While each of the Board's committees has responsibility for overseeing different aspects of the fund's activities, oversight is exercised primarily through the Operations, Audit, and Compliance Committees. In addition, the Independent Trustees have worked with FMR to enhance the Board's oversight of investment and financial risks, legal and regulatory risks, technology risks, and operational risks, including the development of additional risk reporting to the Board. For example, a working group comprised of Independent Trustees and FMR has worked and continues to work to review the Fidelity funds' valuation-related activities, reporting and risk management. Appropriate personnel, including but not limited to the fund's Chief Compliance Officer (CCO), FMR's internal auditor, the independent accountants, the fund's Treasurer and portfolio management personnel, make periodic reports to the Board's committees, as appropriate, including an annual review of FMR's risk management program for the Fidelity funds. The responsibilities of each standing committee, including their oversight responsibilities, are described further under "Standing Committees of the Fund's Trustees."
Annual Report
The fund's Statement of Additional Information (SAI) includes more information about the Trustees. To request a free copy, call Fidelity at 1-877-208-0098.
Interested Trustees*:
Correspondence intended for each Trustee who is an interested person may be sent to Fidelity Investments, 82 Devonshire Street, Boston, Massachusetts 02109.
Name, Age; Principal Occupations and Other Relevant Experience+ |
James C. Curvey (76) |
| Year of Election or Appointment: 2007 Mr. Curvey is Trustee and Acting Chairman of the Board of Trustees of certain Trusts. Mr. Curvey also serves as Trustee (2007-present) of other investment companies advised by FMR. Mr. Curvey is a Director of Fidelity Investments Money Management, Inc. (2009-present), Director of Fidelity Research & Analysis Co. (2009-present) and Director of FMR and FMR Co., Inc. (2007-present). Mr. Curvey is also Vice Chairman (2007-present) and Director of FMR LLC. In addition, Mr. Curvey serves as an Overseer for the Boston Symphony Orchestra and a member of the Trustees of Villanova University. Previously, Mr. Curvey was the Vice Chairman (2006-2007) and Director (2000-2007) of FMR Corp. |
Ronald P. O'Hanley (54) |
| Year of Election or Appointment: 2011 Mr. O'Hanley is Director of FMR Co., Inc. (2010-present), Director of Fidelity Investments Money Management, Inc. (2010-present), Director of Fidelity Research & Analysis Company (2010-present), President of Fidelity Asset Management and Corporate Services and a member of Fidelity's Executive Committee (2010-present). Previously, Mr. O'Hanley served as President and Chief Executive Officer of BNY Mellon Asset Management (2007-2010). Mr. O'Hanley also served as Vice Chairman of Bank New York Mellon Corp. and a member of that firm's Executive Committee. Prior to the 2007 merger of The Bank of New York and Mellon Financial Corporation, he was Vice Chairman of Mellon Financial Corporation and President and Chief Executive Officer of Mellon Asset Management. He joined Mellon in February 1997. Mr. O'Hanley currently serves as Chairman of the Boston Public Library Foundation Board of Directors and sits on the Board of Directors of Beth Israel Deaconess Medical Center, the Board of Trustees of the Marine Biological Laboratory and the Advisory Board of the Maxwell School of Citizenship and Public Administration at Syracuse University. Mr. O'Hanley also chairs the Council on Asset Management for the Financial Services Roundtable and is a member of the Board of Directors of Institutional Investor's U.S. Institute. |
* Trustees have been determined to be "Interested Trustees" by virtue of, among other things, their affiliation with the trust or various entities under common control with FMR.
+ The information above includes each Trustee's principal occupation during the last five years and other information relating to the experience, attributes, and skills relevant to each Trustee's qualifications to serve as a Trustee, which led to the conclusion that each Trustee should serve as a Trustee for the fund.
Independent Trustees:
Correspondence intended for each Independent Trustee (that is, the Trustees other than the Interested Trustees) may be sent to Fidelity Investments, P.O. Box 55235, Boston, Massachusetts 02205-5235.
Name, Age; Principal Occupations and Other Relevant Experience+ |
Dennis J. Dirks (63) |
| Year of Election or Appointment: 2005 Prior to his retirement in May 2003, Mr. Dirks was Chief Operating Officer and a member of the Board of The Depository Trust & Clearing Corporation (DTCC). He also served as President, Chief Operating Officer, and Board member of The Depository Trust Company (DTC) and President and Board member of the National Securities Clearing Corporation (NSCC). In addition, Mr. Dirks served as Chief Executive Officer and Board member of the Government Securities Clearing Corporation, Chief Executive Officer and Board member of the Mortgage-Backed Securities Clearing Corporation, as a Trustee and a member of the Finance Committee of Manhattan College (2005-2008), and as a Trustee and a member of the Finance Committee of AHRC of Nassau County (2006-2008). Mr. Dirks is a member of the Independent Directors Council (IDC) Governing Council (2010-present) and Board of Directors for The Brookville Center for Children's Services, Inc. (2009-present). |
Alan J. Lacy (58) |
| Year of Election or Appointment: 2008 Mr. Lacy serves as Senior Adviser (2007-present) of Oak Hill Capital Partners, L.P. (private equity). Mr. Lacy also served as Chief Executive Officer (2000-2005) and Vice Chairman (2005-2006) of Sears Holdings Corporation and Sears, Roebuck and Co. (retail). In addition, Mr. Lacy serves as a member of the Board of Directors of Dave & Buster's, Inc. (restaurant and entertainment complexes, 2010-present), The Hillman Companies, Inc. (hardware wholesalers, 2010-present), and Bristol-Myers Squibb Company (global pharmaceuticals, 2007-present). Mr. Lacy is a member of the Board of Trustees of The National Parks Conservation Association (2006-present). Previously, Mr. Lacy served as Chairman of the Board of Trustees of the National Parks Conservation Association (2008-2011) and as a member of the Board of Directors for the Western Union Company (global money transfer, 2006-2011). |
Ned C. Lautenbach (67) |
| Year of Election or Appointment: 2000 Mr. Lautenbach is Chairman of the Independent Trustees of the Equity and High Income Funds (2006-present). Mr. Lautenbach currently serves as the Lead Director of the Eaton Corporation Board of Directors (diversified industrial, 1997-present). Mr. Lautenbach is also a member of the Board of Directors of the Philharmonic Center for the Arts in Naples, Florida (1999-present); a member of the Board of Trustees of Fairfield University (2005-present); and a member of the Council on Foreign Relations (1994-present). Previously, Mr. Lautenbach was a Partner/Advisory Partner at Clayton, Dubilier & Rice, LLC (private equity investment, 1998-2010), as well as a Director of Sony Corporation (2006-2007). |
Joseph Mauriello (67) |
| Year of Election or Appointment: 2008 Prior to his retirement in January 2006, Mr. Mauriello served in numerous senior management positions including Deputy Chairman and Chief Operating Officer (2004-2005), and Vice Chairman of Financial Services (2002-2004) of KPMG LLP US (professional services, 1965-2005). Mr. Mauriello currently serves as a member of the Board of Directors of XL Group plc. (global insurance and re-insurance, 2006-present) and of Arcadia Resources Inc. (health care services and products, 2007-present). Previously, Mr. Mauriello served as a Director of the Hamilton Funds of the Bank of New York (2006-2007). |
Robert W. Selander (61) |
| Year of Election or Appointment: 2011 Previously, Mr. Selander served as a Member of the Advisory Board of Fidelity's Equity and High Income Funds (2011), Executive Vice Chairman (2010), Chief Executive Officer (2009-2010), and President and Chief Executive Officer (1997-2009) of Mastercard, Inc. |
Cornelia M. Small (67) |
| Year of Election or Appointment: 2005 Ms. Small is a member of the Board of Directors of the Teagle Foundation (2009-present). Ms. Small is also a member of the Investment Committee, and Chair (2008-present) and a member of the Board of Trustees of Smith College. In addition, Ms. Small serves on the Investment Committee of the Berkshire Taconic Community Foundation (2008-present). Previously, Ms. Small served as Chairperson of the Investment Committee (2002-2008) of Smith College. In addition, Ms. Small served as Chief Investment Officer, Director of Global Equity Investments, and a member of the Board of Directors of Scudder, Stevens & Clark and Scudder Kemper Investments. |
William S. Stavropoulos (72) |
| Year of Election or Appointment: 2001 Mr. Stavropoulos is Vice Chairman of the Independent Trustees of the Equity and High Income Funds (2006-present). Mr. Stavropoulos serves as President and Founder of the Michigan Baseball Foundation, the Great Lakes Loons (2007-present). Mr. Stavropoulos is Chairman Emeritus of the Board of Directors of The Dow Chemical Company, where he previously served in numerous senior management positions, including President, CEO (1995-2000; 2002-2004), Chairman of the Executive Committee (2000-2006), and as a member of the Board of Directors (1990-2006). Currently, Mr. Stavropoulos is Chairman of Univar (global distributor of commodity and specialty chemicals, 2010-present), a Director of Teradata Corporation (data warehousing and technology solutions, 2008-present), Chemical Financial Corporation, Maersk Inc. (industrial conglomerate), Tyco International, Inc. (multinational manufacturing and services, 2007-present), and a member of the Advisory Board for Metalmark Capital (private equity investment, 2005-present). Mr. Stavropoulos is a special advisor to Clayton, Dubilier & Rice, LLC (private equity investment). In addition, Mr. Stavropoulos is a member of the University of Notre Dame Advisory Council for the College of Science. |
David M. Thomas (62) |
| Year of Election or Appointment: 2008 Previously, Mr. Thomas served as Executive Chairman (2005-2006) and Chairman and Chief Executive Officer (2000-2005) of IMS Health, Inc. (pharmaceutical and healthcare information solutions). In addition, Mr. Thomas serves as a member of the Board of Directors of Fortune Brands, Inc. (consumer products), and Interpublic Group of Companies, Inc. (marketing communication, 2004-present). |
Michael E. Wiley (61) |
| Year of Election or Appointment: 2008 Mr. Wiley also serves as a Director of Asia Pacific Exploration Consolidated (international oil and gas exploration and production, 2008-present). Mr. Wiley serves as a Director of Tesoro Corporation (independent oil refiner and marketer, 2005-present), and a Director of Bill Barrett Corporation (exploration and production, 2005-present). In addition, Mr. Wiley also serves as a Director of Post Oak Bank (privately-held bank, 2004-present). Previously, Mr. Wiley served as a member of the Board of Trustees of the University of Tulsa (2000-2006; 2007-2010), as a Senior Energy Advisor of Katzenbach Partners, LLC (consulting, 2006-2007), as an Advisory Director of Riverstone Holdings (private investment), Chairman, President, and CEO of Baker Hughes, Inc. (oilfield services, 2000-2004), and as Director of Spinnaker Exploration Company (exploration and production, 2001-2005). |
+ The information above includes each Trustee's principal occupation during the last five years and other information relating to the experience, attributes, and skills relevant to each Trustee's qualifications to serve as a Trustee, which led to the conclusion that each Trustee should serve as a Trustee for the fund.
Advisory Board Members and Executive Officers:
Correspondence intended for each executive officer, Edward C. Johnson 3d, and Peter S. Lynch may be sent to Fidelity Investments, 82 Devonshire Street, Boston, Massachusetts 02109.
Name, Age; Principal Occupation |
Edward C. Johnson 3d (81) |
| Year of Election or Appointment: 2011 Member of the Advisory Board of Fidelity's Equity and High Income Funds. Mr. Johnson serves as Chief Executive Officer, Chairman, and a Director of FMR LLC, and also serves as Chairman and Director of FIL Limited. Previously, Mr. Johnson served as a Trustee and Chairman of the Board of certain Fidelity Trusts, Chairman and a Director of FMR, Chairman and a Director of FMR Co., Inc., and President of FMR LLC (2006-2007). |
Peter S. Lynch (67) |
| Year of Election or Appointment: 2003 Member of the Advisory Board of Fidelity's Equity and High Income Funds. Mr. Lynch is Vice Chairman and a Director of FMR and FMR Co., Inc. In addition, Mr. Lynch serves as a Trustee of Boston College and as the Chairman of the Inner-City Scholarship Fund. Previously, Mr. Lynch served on the Special Olympics International Board of Directors (1997-2006). |
Kenneth B. Robins (42) |
| Year of Election or Appointment: 2008 President and Treasurer of Fidelity's Equity and High Income Funds. Mr. Robins also serves as President and Treasurer (2010-present) and Assistant Treasurer (2009-present) of other Fidelity funds and is an employee of Fidelity Investments (2004-present). Previously, Mr. Robins served as Deputy Treasurer of the Fidelity funds (2005-2008) and Treasurer and Chief Financial Officer of The North Carolina Capital Management Trust: Cash and Term Portfolios (2006-2008). |
Brian B. Hogan (47) |
| Year of Election or Appointment: 2009 Vice President of Equity and High Income Funds. Mr. Hogan also serves as President of FMR's Equity Division (2009-present). Previously, Mr. Hogan served as Senior Vice President, Equity Research of FMR (2006-2009) and as a portfolio manager. |
Christopher S. Bartel (40) |
| Year of Election or Appointment: 2009 Vice President of Fidelity's Sector and Real Estate Equity Funds. Mr. Bartel also serves as Senior Vice President of Equity Research (2009-present). Previously, Mr. Bartel served as Managing Director of Research (2006-2009) and an analyst and portfolio manager (2000-2006). |
Scott C. Goebel (43) |
| Year of Election or Appointment: 2008 Secretary and Chief Legal Officer (CLO) of the Fidelity funds. Mr. Goebel also serves as Secretary of Fidelity Investments Money Management, Inc. (FIMM) (2010-present) and Fidelity Research and Analysis Company (FRAC) (2010-present); Secretary and CLO of The North Carolina Capital Management Trust: Cash and Term Portfolios (2008-present); General Counsel, Secretary, and Senior Vice President of FMR (2008-present) and FMR Co., Inc. (2008-present); employed by FMR LLC or an affiliate (2001-present); Chief Legal Officer of Fidelity Management & Research (Hong Kong) Limited (2008-present) and Assistant Secretary of Fidelity Management & Research (Japan) Inc. (2008-present), and Fidelity Management & Research (U.K.) Inc. (2008-present). Previously, Mr. Goebel served as Assistant Secretary of FIMM (2008-2010), FRAC (2008-2010), and the Funds (2007-2008) and as Vice President and Secretary of Fidelity Distributors Corporation (FDC) (2005-2007). |
William C. Coffey (42) |
| Year of Election or Appointment: 2009 Assistant Secretary of Fidelity's Equity and High Income Funds. Mr. Coffey also serves as Senior Vice President and Deputy General Counsel of FMR LLC (2010-present), and is an employee of Fidelity Investments. Previously, Mr. Coffey served as Vice President and Associate General Counsel of FMR LLC (2005-2009). |
Holly C. Laurent (57) |
| Year of Election or Appointment: 2008 Anti-Money Laundering (AML) Officer of the Fidelity funds. Ms. Laurent also serves as AML Officer of The North Carolina Capital Management Trust: Cash and Term Portfolios (2008-present) and is an employee of Fidelity Investments. Previously, Ms. Laurent was Senior Vice President and Head of Legal for Fidelity Business Services India Pvt. Ltd. (2006-2008), and Senior Vice President, Deputy General Counsel and Group Head for FMR LLC (2005-2006). |
Christine Reynolds (53) |
| Year of Election or Appointment: 2008 Chief Financial Officer of the Fidelity funds. Ms. Reynolds became President of Fidelity Pricing and Cash Management Services (FPCMS) in August 2008. Ms. Reynolds served as Chief Operating Officer of FPCMS (2007-2008). Previously, Ms. Reynolds served as President, Treasurer, and Anti-Money Laundering officer of the Fidelity funds (2004-2007). |
Kenneth A. Rathgeber (64) |
| Year of Election or Appointment: 2004 Chief Compliance Officer of Fidelity's Equity and High Income Funds. Mr. Rathgeber is Chief Compliance Officer of Fidelity Management & Research (Hong Kong) Limited (2008-present), Fidelity Management & Research (Japan) Inc. (2008-present), FMR (2005-present), FMR Co., Inc. (2005-present), Fidelity Management & Research (U.K.) Inc. (2005-present), Fidelity Research & Analysis Company (2005-present), Fidelity Investments Money Management, Inc. (2005-present), Pyramis Global Advisors, LLC (2005-present), and Strategic Advisers, Inc. (2005-present). |
Jeffrey S. Christian (50) |
| Year of Election or Appointment: 2009 Deputy Treasurer of the Fidelity funds. Mr. Christian is an employee of Fidelity Investments. Previously, Mr. Christian served as Chief Financial Officer (2008-2009) of certain Fidelity funds and Senior Vice President of Fidelity Pricing and Cash Management Services (FPCMS) (2004-2009). |
Joseph F. Zambello (54) |
| Year of Election or Appointment: 2011 Deputy Treasurer of the Fidelity funds. Mr. Zambello is an employee of Fidelity Investments. Previously, Mr. Zambello served as Vice President of FMR's Program Management Group (2009-2011) and Vice President of the Transfer Agent Oversight Group (2005-2009). |
Adrien E. Deberghes (44) |
| Year of Election or Appointment: 2008 Deputy Treasurer of Fidelity's Equity and High Income Funds. Mr. Deberghes also serves as Vice President and Assistant Treasurer of Fidelity Rutland Square Trust II and Fidelity Commonwealth Trust II (2011-present), Assistant Treasurer of other Fidelity funds (2010-present), and is an employee of Fidelity Investments (2008-present). Previously, Mr. Deberghes served as Senior Vice President of Mutual Fund Administration at State Street Corporation (2007-2008), Senior Director of Mutual Fund Administration at Investors Bank & Trust (2005-2007), and Director of Finance for Dunkin' Brands (2000-2005). |
Stephanie J. Dorsey (42) |
| Year of Election or Appointment: 2010 Assistant Treasurer of Fidelity's Equity and High Income Funds. Ms. Dorsey also serves as Deputy Treasurer of other Fidelity funds (2008-present) and is an employee of Fidelity Investments (2008-present). Previously, Ms. Dorsey served as Treasurer (2004-2008) of the JPMorgan Mutual Funds and Vice President (2004-2008) of JPMorgan Chase Bank. |
John R. Hebble (53) |
| Year of Election or Appointment: 2009 Assistant Treasurer of Fidelity's Equity and High Income Funds. Mr. Hebble also serves as President (2011-present), Treasurer, and Chief Financial Officer of The North Carolina Capital Management Trust: Cash and Term Portfolios (2008-present), President and Treasurer of other Fidelity funds (2008-present) and is an employee of Fidelity Investments. |
Gary W. Ryan (53) |
| Year of Election or Appointment: 2005 Assistant Treasurer of the Fidelity funds. Mr. Ryan is an employee of Fidelity Investments. Previously, Mr. Ryan served as Vice President of Fund Reporting in Fidelity Pricing and Cash Management Services (FPCMS) (1999-2005). |
Jonathan Davis (43) |
| Year of Election or Appointment: 2010 Assistant Treasurer of the Fidelity funds. Mr. Davis is also Assistant Treasurer of Fidelity Rutland Square Trust II and Fidelity Commonwealth Trust II. Mr. Davis is an employee of Fidelity Investments. Previously, Mr. Davis served as Vice President and Associate General Counsel of FMR LLC (2003-2010). |
Annual Report
Initial Class and Investor Class designate 100% of the dividends distributed during the fiscal year as qualifying for the dividends-received deduction for corporate shareholders.
Annual Report
Board Approval of Investment Advisory Contracts and Management Fees
VIP Financial Services Portfolio
Each year, the Board of Trustees, including the Independent Trustees (together, the Board), votes on the renewal of the management contract and sub-advisory agreements (together, the Advisory Contracts) for the fund. The Board, assisted by the advice of fund counsel and Independent Trustees' counsel, requests and considers a broad range of information relevant to the renewal of the Advisory Contracts throughout the year.
The Board meets regularly and considers at each of its meetings factors that are relevant to its annual consideration of the renewal of the fund's Advisory Contracts, including the services and support provided to the fund and its shareholders. The Board has established various standing committees, each composed of Independent Trustees with varying backgrounds, to which the Board has assigned specific subject matter responsibilities in order to enhance effective decision-making by the Board. The Board, acting directly and through its Committees, requests and receives information concerning the annual consideration of the renewal of the fund's Advisory Contracts. The Board also meets as needed to consider matters specifically related to the Board's annual consideration of the renewal of Advisory Contracts. Members of the Board may also meet with trustees of other Fidelity funds through ad hoc joint committees to discuss certain matters relevant to the Fidelity funds.
At its July 2011 meeting, the Board of Trustees, including the Independent Trustees, unanimously determined to renew the fund's Advisory Contracts. In reaching its determination, the Board considered all factors it believed relevant, including (i) the nature, extent, and quality of the services to be provided to the fund and its shareholders (including the investment performance of the fund); (ii) the competitiveness of the fund's management fee and total expense ratio; (iii) the total costs of the services to be provided by and the profits to be realized by Fidelity from its relationship with the fund; (iv) the extent to which economies of scale would be realized as the fund grows; and (v) whether fee levels reflect these economies of scale, if any, for the benefit of fund shareholders.
In considering whether to renew the Advisory Contracts for the fund, the Board reached a determination, with the assistance of fund counsel and Independent Trustees' counsel and through the exercise of its business judgment, that the renewal of the Advisory Contracts is in the best interests of the fund and its shareholders and that the compensation payable under the Advisory Contracts is fair and reasonable. The Board's decision to renew the Advisory Contracts was not based on any single factor, but rather was based on a comprehensive consideration of all the information provided to the Board at its meetings throughout the year. The Board, in reaching its determination to renew the Advisory Contracts, is aware that shareholders in the fund have a broad range of investment choices available to them, including a wide choice among mutual funds offered by Fidelity's competitors, and that the fund's shareholders, who have the opportunity to review and weigh the disclosure provided by the fund in its prospectus and other public disclosures, have chosen to invest in this fund, managed by Fidelity.
Nature, Extent, and Quality of Services Provided. The Board considered the staffing within the investment adviser, FMR, and the sub-advisers (together, the Investment Advisers), including the backgrounds of the fund's investment personnel and the fund's investment objective and discipline. The Independent Trustees also had discussions with senior management of Fidelity's investment operations and investment groups. The Board considered the structure of the portfolio manager compensation program and whether this structure provides appropriate incentives to act in the best interests of the fund.
Resources Dedicated to Investment Management and Support Services. The Board and the Fund Oversight and Research Committees reviewed the general qualifications and capabilities of the Investment Advisers' investment staff, including its size, education, experience, and resources, as well as the Investment Advisers' approach to recruiting, training, managing, and compensating investment personnel. The Board also noted that FMR has devoted increased resources to non-U.S. offices. The Board noted that Fidelity's analysts have extensive resources, tools and capabilities which allow them to conduct sophisticated quantitative and fundamental analysis, as well as credit analysis of issuers, counterparties and enhancers. The Board also believes that Fidelity's investment professionals have sufficient access to global information and data so as to provide competitive investment results over time, and that those professionals also have access to sophisticated tools which permit them to assess portfolio construction and risk and performance attribution characteristics continuously, as well as to transmit new information and research conclusions rapidly around the world. Additionally, in their deliberations, the Board considered the Investment Advisers' trading capabilities and resources which are an integral part of the investment management process.
Shareholder and Administrative Services. The Board considered (i) the nature, extent, quality, and cost of advisory, administrative, and shareholder services performed by the Investment Advisers and their affiliates under the Advisory Contracts and under separate agreements covering transfer agency, pricing and bookkeeping, and securities lending services for the fund; (ii) the nature and extent of the investment adviser's supervision of third party service providers, principally custodians and subcustodians; and (iii) the resources devoted to, and the record of compliance with, the fund's compliance policies and procedures. The Board also reviewed the allocation of fund brokerage, including allocations to brokers affiliated with the Investment Advisers, the use of brokerage commissions to pay fund expenses, and the use of "soft" commission dollars to pay for research services.
The Board noted that the growth of fund assets over time across the complex allows Fidelity to reinvest in the development of services designed to enhance the value or convenience of the Fidelity funds as investment vehicles. These services include 24-hour access to account information and market information through telephone representatives and over the Internet, investor education materials and asset allocation tools, and the expanded availability of Fidelity Investor Centers, with 35 new branches opening since 2010.
Annual Report
Board Approval of Investment Advisory Contracts and Management Fees - continued
Investment in a Large Fund Family. The Board considered the benefits to shareholders of investing in a Fidelity fund, including the benefits of investing in a fund that is part of a large family of funds offering a variety of investment disciplines and providing a large variety of mutual fund investor services. The Board noted that Fidelity had taken, or had made recommendations that resulted in the Fidelity funds taking, a number of actions over the previous year that benefited particular funds, including (i) continuing to dedicate additional resources to investment research and support of the senior management team that oversees asset management; (ii) rationalizing product lines through the mergers of six funds into other funds; (iii) continuing to migrate the Freedom Funds to dedicated lower cost underlying funds; (iv) obtaining shareholder approval to broaden the investment strategies for Fidelity Consumer Finance Portfolio, Fidelity Emerging Asia Fund, and Fidelity Environment and Alternative Energy Portfolio; (v) contractually agreeing to reduce the management fees and impose other expense limitations on Spartan 500 Index Fund and U.S. Bond Index Fund in connection with launching new institutional classes of these funds; (vi) changing the name, primary and supplemental benchmarks, and investment policies of Fidelity Global Strategies Fund to support the fund's flexible investment mandate and global orientation; and (vii) reducing the transfer agency account fee rates on certain accounts.
Investment Performance. The Board considered whether the fund has operated in accordance with its investment objective, as well as its record of compliance with its investment restrictions. It also reviewed the fund's absolute investment performance for each class, as well as the fund's relative investment performance for each class measured over multiple periods against a third-party-sponsored index that reflects the market sector in which the fund invests. The Board noted that FMR does not believe that a meaningful peer group exists against which to compare the fund's performance. The following charts considered by the Board show, over the one-, three-, and five-year periods ended December 31, 2010, the cumulative total returns of Initial Class and Investor Class of the fund and the cumulative total returns of a third-party-sponsored index ("benchmark").
VIP Financial Services Portfolio
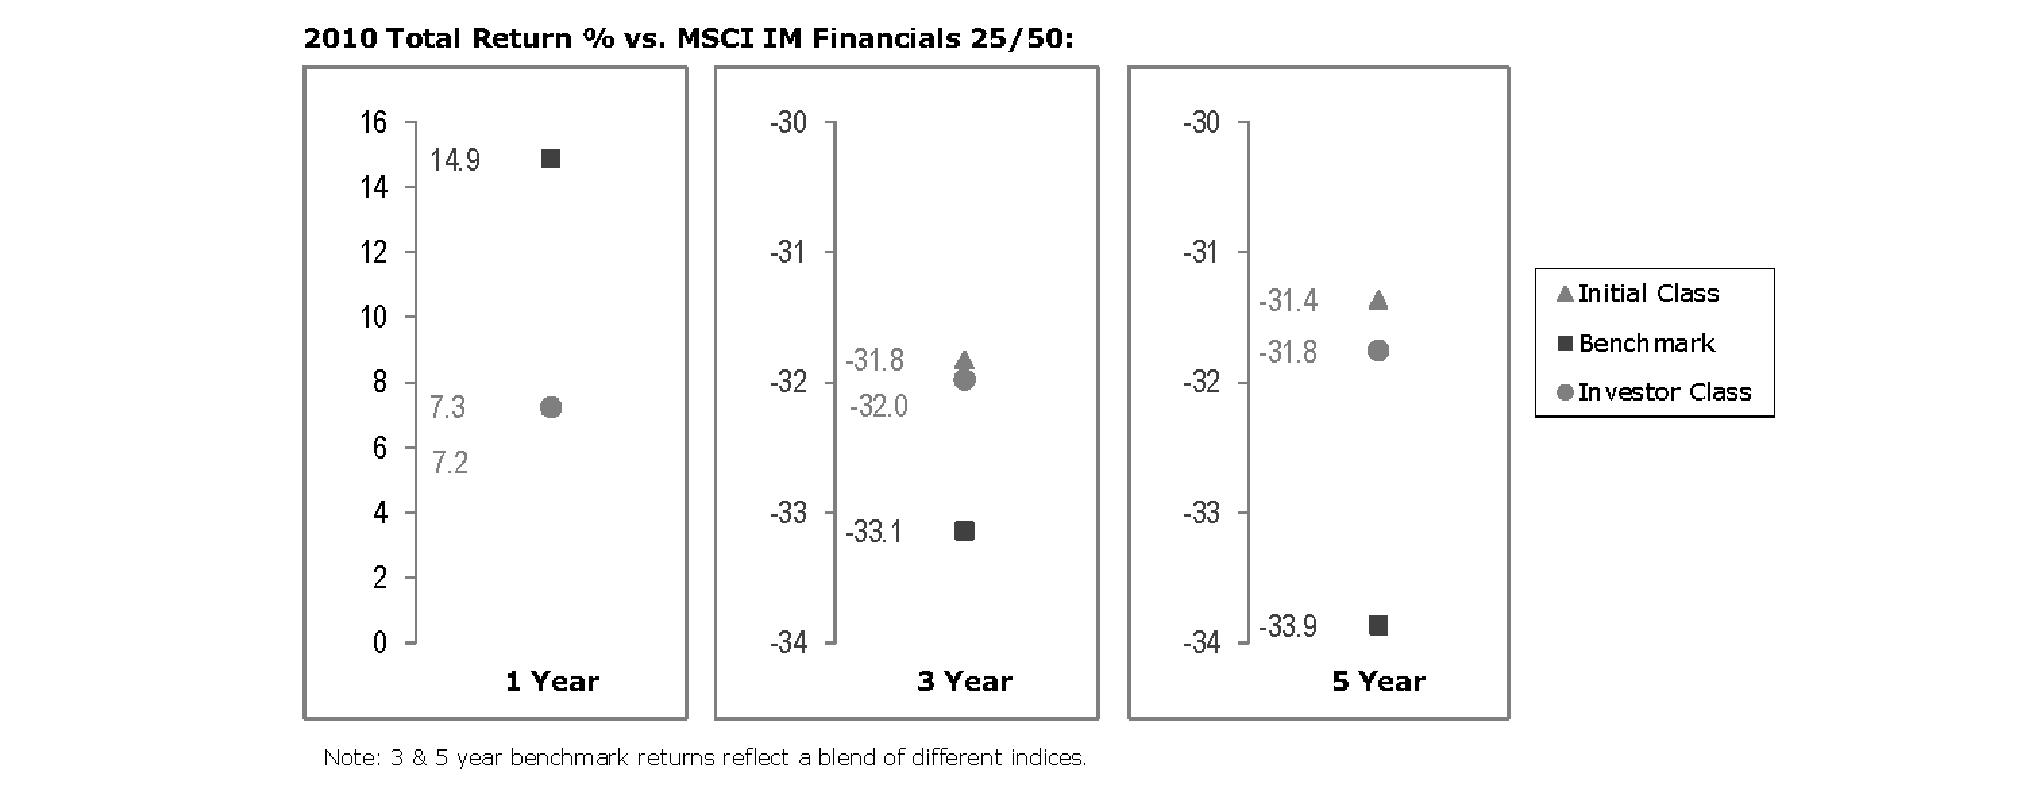
The Board noted that the investment performance of Initial Class of the fund compared favorably to its benchmark for the three- and five-year periods, although the fund's one-year total return was lower than its benchmark. The Board considered that the variations in performance between the fund's classes reflect the variations in class expenses, which result in lower performance for the higher expense class. The Board also reviewed the fund's performance since inception as well as performance in the current year. The Board will continue to closely monitor performance.
Based on its review, the Board concluded that the nature, extent, and quality of services provided to the fund under the Advisory Contracts should benefit the fund's shareholders.
Competitiveness of Management Fee and Total Expense Ratio. The Board considered the fund's management fee and total expense ratio compared to "mapped groups" of competitive funds and classes. Fidelity creates "mapped groups" by combining similar Lipper investment objective categories that have comparable management fee characteristics. Combining Lipper investment objective categories aids the Board's management fee and total expense ratio comparisons by broadening the competitive group used for comparison and by reducing the number of universes to which various Fidelity funds are compared.
Management Fee. The Board considered two proprietary management fee comparisons for the 12-month periods shown in the chart below. The group of Lipper funds used by the Board for management fee comparisons is referred to below as the "Total Mapped Group." The Total Mapped Group comparison focuses on a fund's standing relative to the total universe of comparable funds available to investors in terms of gross management fees before expense reimbursements or caps. "TMG %" represents the percentage of funds in the Total Mapped Group that had management fees that were lower than the fund's. For example, a TMG % of 2% means that 98% of the funds in the Total Mapped Group had higher management fees than the fund. The "Asset-Size Peer Group" (ASPG) comparison focuses on a fund's standing relative to non-Fidelity funds similar in size to the fund within the Total Mapped Group. The ASPG represents at least 15% of the funds in the Total Mapped Group with comparable asset size and management fee characteristics, subject to a minimum of 50 funds (or all funds in the Total Mapped Group if fewer than 50). Additional information, such as the ASPG quartile in which the fund's management fee ranked, is also included in the chart and considered by the Board.
Annual Report
VIP Financial Services Portfolio
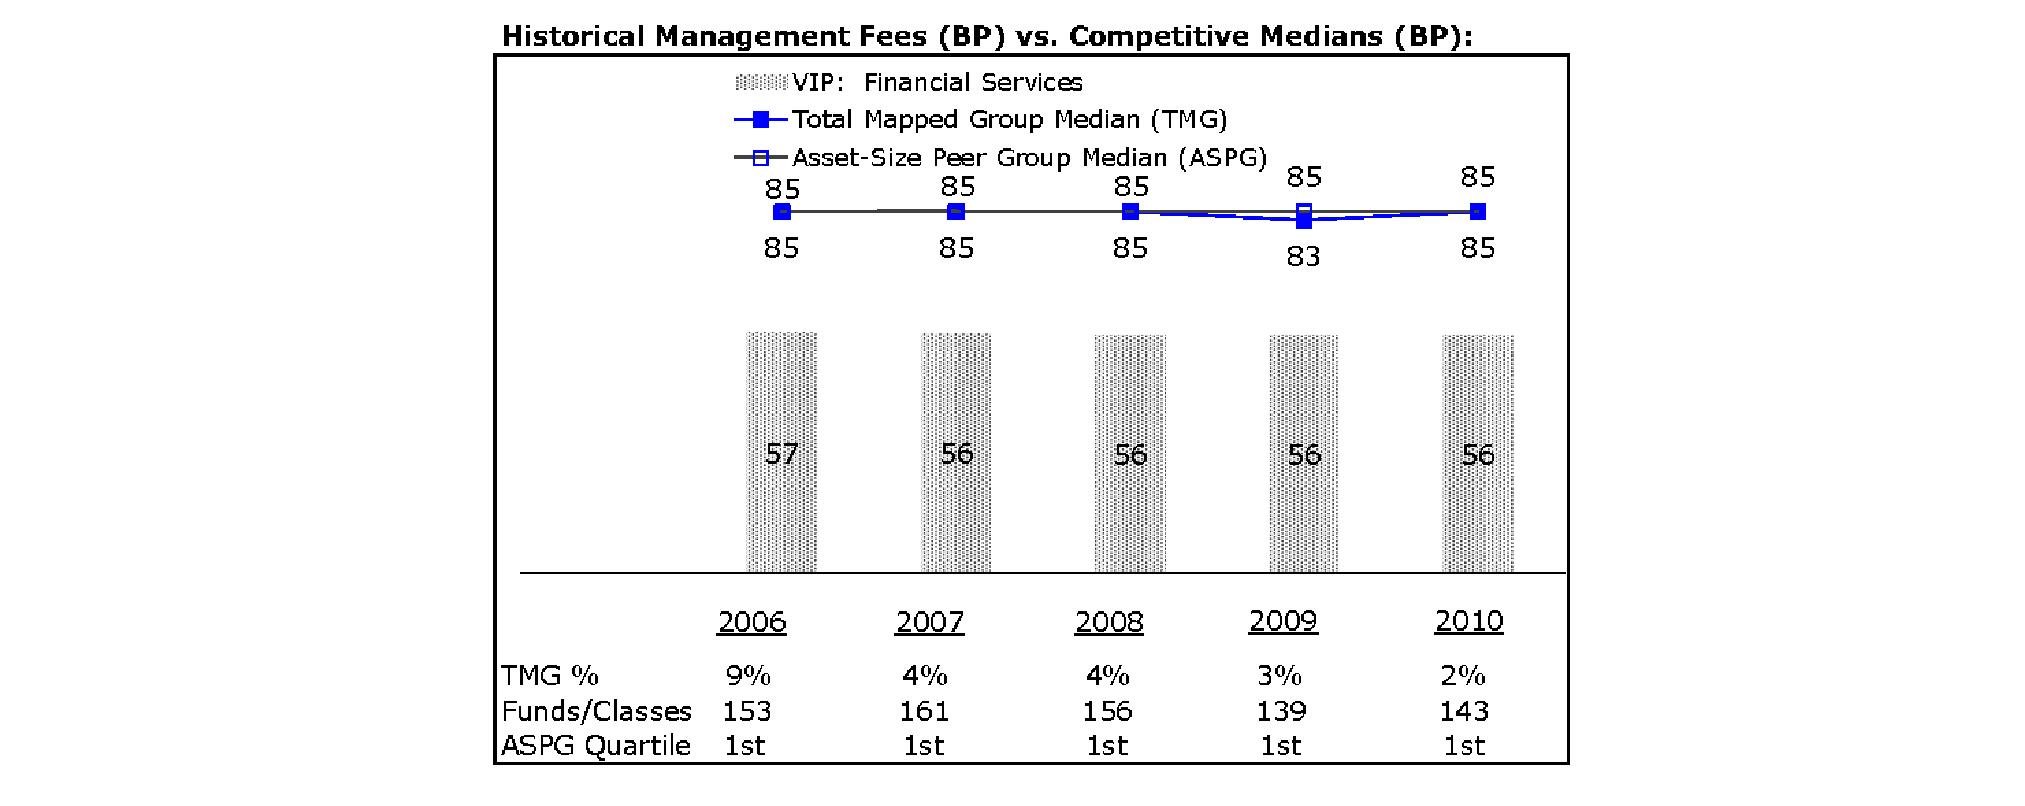
The Board noted that the fund's management fee ranked below the median of its Total Mapped Group and below the median of its ASPG for 2010.
Based on its review, the Board concluded that the fund's management fee is fair and reasonable in light of the services that the fund receives and the other factors considered.
Total Expense Ratio. In its review of each class's total expense ratio, the Board considered the fund's management fee as well as other fund or class expenses, as applicable, such as transfer agent fees, pricing and bookkeeping fees, and custodial, legal, and audit fees. The Board also noted the effects of any waivers and reimbursements on fees and expenses. As part of its review, the Board also considered the current and historical total expense ratios of each class of the fund compared to competitive fund median expenses. Each class of the fund is compared to those funds and classes in the Total Mapped Group (used by the Board for management fee comparisons) that have a similar sales load structure.
The Board noted that the total expense ratio of each class ranked below its competitive median for 2010. The Board considered that various factors, including 12b-1 fees, positive or negative performance adjustments, and relatively higher other expenses in the case of small fund size, can affect total expense ratios. The Board also noted that Investor Class has higher transfer agent fees than traditional variable annuity classes because it is designed for lower cost annuity products, where the majority of servicing costs are incorporated into the funds' total expense ratios rather than being paid at the annuity level.
Fees Charged to Other Fidelity Clients. The Board also considered Fidelity fee structures and other information with respect to clients of FMR and its affiliates, such as other mutual funds advised or subadvised by FMR or its affiliates, pension plan clients, and other institutional clients. In March 2010, the Board created an ad hoc joint committee with the board of other Fidelity funds (the Committee) to review and compare Fidelity's institutional investment advisory business with its business of providing services to the Fidelity funds, including the differences in services provided, fees charged, and costs incurred, as well as competition in their respective marketplaces.
Based on its review of total expense ratios and fees charged to other Fidelity clients, the Board concluded that the total expense ratio of each class of the fund was reasonable in light of the services that the fund and its shareholders receive and the other factors considered, including the findings of the Committee.
Costs of the Services and Profitability. The Board considered the revenues earned and the expenses incurred by Fidelity in conducting the business of developing, marketing, distributing, managing, administering and servicing the fund and its shareholders. The Board also considered the level of Fidelity's profits in respect of all the Fidelity funds.
On an annual basis, FMR presents to the Board Fidelity's profitability for the fund. Fidelity calculates the profitability for each fund, as well as aggregate profitability for groups of Fidelity funds and all Fidelity funds, using a series of detailed revenue and cost allocation methodologies which originate with the books and records of Fidelity on which Fidelity's audited financial statements are based. The Audit Committee of the Board reviews any significant changes from the prior year's methodologies.
Annual Report
Board Approval of Investment Advisory Contracts and Management Fees - continued
PricewaterhouseCoopers LLP (PwC), independent registered public accounting firm and auditor to Fidelity and certain Fidelity funds, has been engaged annually by the Board as part of the Board's assessment of Fidelity's profitability analysis. PwC's engagement includes the review and assessment of Fidelity's methodologies used in determining the revenues and expenses attributable to Fidelity's mutual fund business, and completion of agreed-upon procedures surrounding the mathematical accuracy of fund profitability and its conformity to allocation methodologies. After considering PwC's reports issued under the engagement and information provided by Fidelity, the Board concluded that while other allocation methods may also be reasonable, Fidelity's profitability methodologies are reasonable in all material respects.
The Board also reviewed Fidelity's non-fund businesses and fall-out benefits related to the mutual fund business as well as cases where Fidelity's affiliates may benefit from or be related to the fund's business.
The Board considered the costs of the services provided by and the profits realized by Fidelity in connection with the operation of the fund and was satisfied that the profitability was not excessive in the circumstances.
Economies of Scale. The Board considered whether there have been economies of scale in respect of the management of the Fidelity funds, whether the Fidelity funds (including the fund) have appropriately benefited from any such economies of scale, and whether there is potential for realization of any further economies of scale. The Board considered the extent to which the fund will benefit from economies of scale through increased services to the fund, through waivers or reimbursements, or through fee or expense reductions. The Board also noted that in 2009, it and the board of other Fidelity funds created an ad hoc committee (the Economies of Scale Committee) to analyze whether FMR attains economies of scale in respect of the management and servicing of the Fidelity funds, whether the Fidelity funds have appropriately benefited from such economies of scale, and whether there is potential for realization of any further economies of scale.
The Board recognized that the fund's management contract incorporates a "group fee" structure, which provides for lower group fee rates as total fund assets under FMR's management increase, and for higher group fee rates as total fund assets under FMR's management decrease. FMR calculates the group fee rates based on a tiered asset "breakpoint" schedule that varies based on asset class. The Board considered that the group fee is designed to deliver the benefits of economies of scale to fund shareholders when total Fidelity fund assets increase, even if assets of any particular fund are unchanged or have declined, because some portion of Fidelity's costs are attributable to services provided to all Fidelity funds, and all funds benefit if those costs can be allocated among more assets. The Board concluded that, given the group fee structure, fund shareholders will benefit from lower management fees as assets under FMR's management increase at the fund complex level, regardless of whether Fidelity achieves any such economies of scale.
The Board concluded, taking into account the analysis of the Economies of Scale Committee, that any potential economies of scale are being appropriately shared between fund shareholders and Fidelity.
Additional Information Requested by the Board. In order to develop fully the factual basis for consideration of the Fidelity funds' Advisory Contracts, the Board requested and received additional information on certain topics, including (i) fund performance trends, actions to be taken by FMR to improve certain funds' overall performance, and Fidelity's long-term strategies for certain funds; (ii) portfolio manager changes that have occurred during the past year and length of portfolio manager tenure for different categories of funds over time; (iii) Fidelity's compensation structure for portfolio managers and other key personnel and strategies for attracting and retaining non-investment personnel; (iv) the amount of the investment that each portfolio manager has made in the Fidelity fund(s) that he or she manages; (v) historical trends in Fidelity's realization of fall-out benefits; (vi) Fidelity's group fee structures and the rationale for the individual fee rates of certain funds; (vii) fund profitability methodology and the impact of certain factors on fund profitability results; (viii) trends regarding industry use of performance fee structures and Fidelity's compliance practices with respect to performance adjustment calculations; (ix) the fee structures in place for certain other Fidelity clients; and (x) explanations regarding the relative total expense ratios of certain funds and classes, total expense competitive trends, and actions that might be taken by FMR to reduce total expense ratios for certain funds and classes.
Based on its evaluation of all of the conclusions noted above, and after considering all factors it believed relevant, the Board ultimately concluded that the advisory fee structures are fair and reasonable, and that the fund's Advisory Contracts should be renewed.
Annual Report
Investment Adviser
Fidelity Management & Research Company
Boston, MA
Investment Sub-Advisers
FMR Co., Inc.
Fidelity Management & Research (U.K.) Inc.
Fidelity Management & Research (Hong Kong) Limited
Fidelity Management & Research (Japan) Inc.
General Distributor
Fidelity Distributors Corporation
Boston, MA
Transfer and Service Agents
Fidelity Investments Institutional Operations Company, Inc.
Boston, MA
Fidelity Service Company, Inc.
Boston, MA
Custodian
JPMorgan Chase Bank
New York, NY
VFSIC-ANN-0212
1.817367.107
Fidelity® Variable Insurance Products:
Growth Stock Portfolio
Annual Report
December 31, 2011
Contents
Performance | (Click Here) | How the fund has done over time. |
Management's Discussion of Fund Performance | (Click Here) | The Portfolio Managers' review of fundperformance and strategy. |
Shareholder Expense Example | (Click Here) | An example of shareholder expenses. |
Investment Changes | (Click Here) | A summary of major shifts in the fund's investments over the past six months. |
Investments | (Click Here) | A complete list of the fund's investments with their
market values. |
Financial Statements | (Click Here) | Statements of assets and liabilities, operations, and
changes in net assets, as well as financial highlights. |
Notes | (Click Here) | Notes to the financial statements. |
Report of Independent Registered Public Accounting Firm | (Click Here) | |
Trustees and Officers | (Click Here) | |
Board Approval of Investment Advisory Contracts and Management Fees | (Click Here) | |
To view a fund's proxy voting guidelines and proxy voting record for the 12-month period ended June 30, visit http://www.fidelity.com/proxyvotingresults or visit the Securities and Exchange Commission's (SEC) web site at http://www.sec.gov. You may also call 1-877-208-0098 to request a free copy of the proxy voting guidelines.
Fidelity Variable Insurance Products are separate account options which are purchased through a variable insurance contract.
Standard & Poor's, S&P and S&P 500 are registered service marks of The McGraw-Hill Companies, Inc. and have been licensed for use by Fidelity Distributors Corporation.
Other third party marks appearing herein are the property of their respective owners.
All other marks appearing herein are registered or unregistered trademarks or service marks of FMR LLC or an affiliated company.
This report and the financial statements contained herein are submitted for the general information of the shareholders of the fund. This report is not authorized for distribution to prospective investors in the fund unless preceded or accompanied by an effective prospectus.
A fund files its complete schedule of portfolio holdings with the SEC for the first and third quarters of each fiscal year on Form N-Q. Forms N-Q are available on the SEC's web site at http://www.sec.gov. A fund's Forms N-Q may be reviewed and copied at the SEC's Public Reference Room in Washington, DC. Information regarding the operation of the SEC's Public Reference Room may be obtained by calling 1-800-SEC-0330. For a complete list of a fund's portfolio holdings, view the most recent holdings listing, semiannual report, or annual report on Fidelity's web site at http://www.fidelity.com, http://www.advisor.fidelity.com, or http://www.401k.com, as applicable.
NOT FDIC INSURED • MAY LOSE VALUE • NO BANK GUARANTEE
Neither the fund nor Fidelity Distributors Corporation is a bank.
Annual Report
Average annual total return reflects the change in the value of an investment, assuming reinvestment of the class' distributions from dividend income and capital gains (the profits earned upon the sale of securities that have grown in value, if any) and assuming a constant rate of performance each year. During periods of reimbursement by Fidelity, a fund's total return will be greater than it would be had the reimbursement not occurred. Performance numbers are net of all underlying fund operating expenses, but do not include any insurance charges imposed by your insurance company's separate account. If performance information included the effect of these additional charges, the total returns would have been lower. How a fund did yesterday is no guarantee of how it will do tomorrow.
Average Annual Total Returns
Periods ended December 31, 2011 | Past 1
year | Past 5
years | Life of
fund A |
VIP Growth Stock Portfolio - Initial Class | 0.81% | 3.54% | 5.71% |
VIP Growth Stock Portfolio - Service Class | 0.67% | 3.43% | 5.60% |
VIP Growth Stock Portfolio - Service Class 2 | 0.45% | 3.26% | 5.44% |
VIP Growth Stock Portfolio - Investor Class B | 0.67% | 3.42% | 5.63% |
A From December 11, 2002
B The initial offering of Investor Class shares took place on July 21, 2005. Returns prior to July 21, 2005 are those of Initial Class. Had Investor Class's transfer agent fee been reflected, returns prior to July 21, 2005, would have been lower.
$10,000 Over Life of Fund
Let's say hypothetically that $10,000 was invested in VIP Growth Stock Portfolio - Initial Class on December 11, 2002, when the fund started. The chart shows how the value of your investment would have changed, and also shows how the Russell 1000® Growth Index performed over the same period.
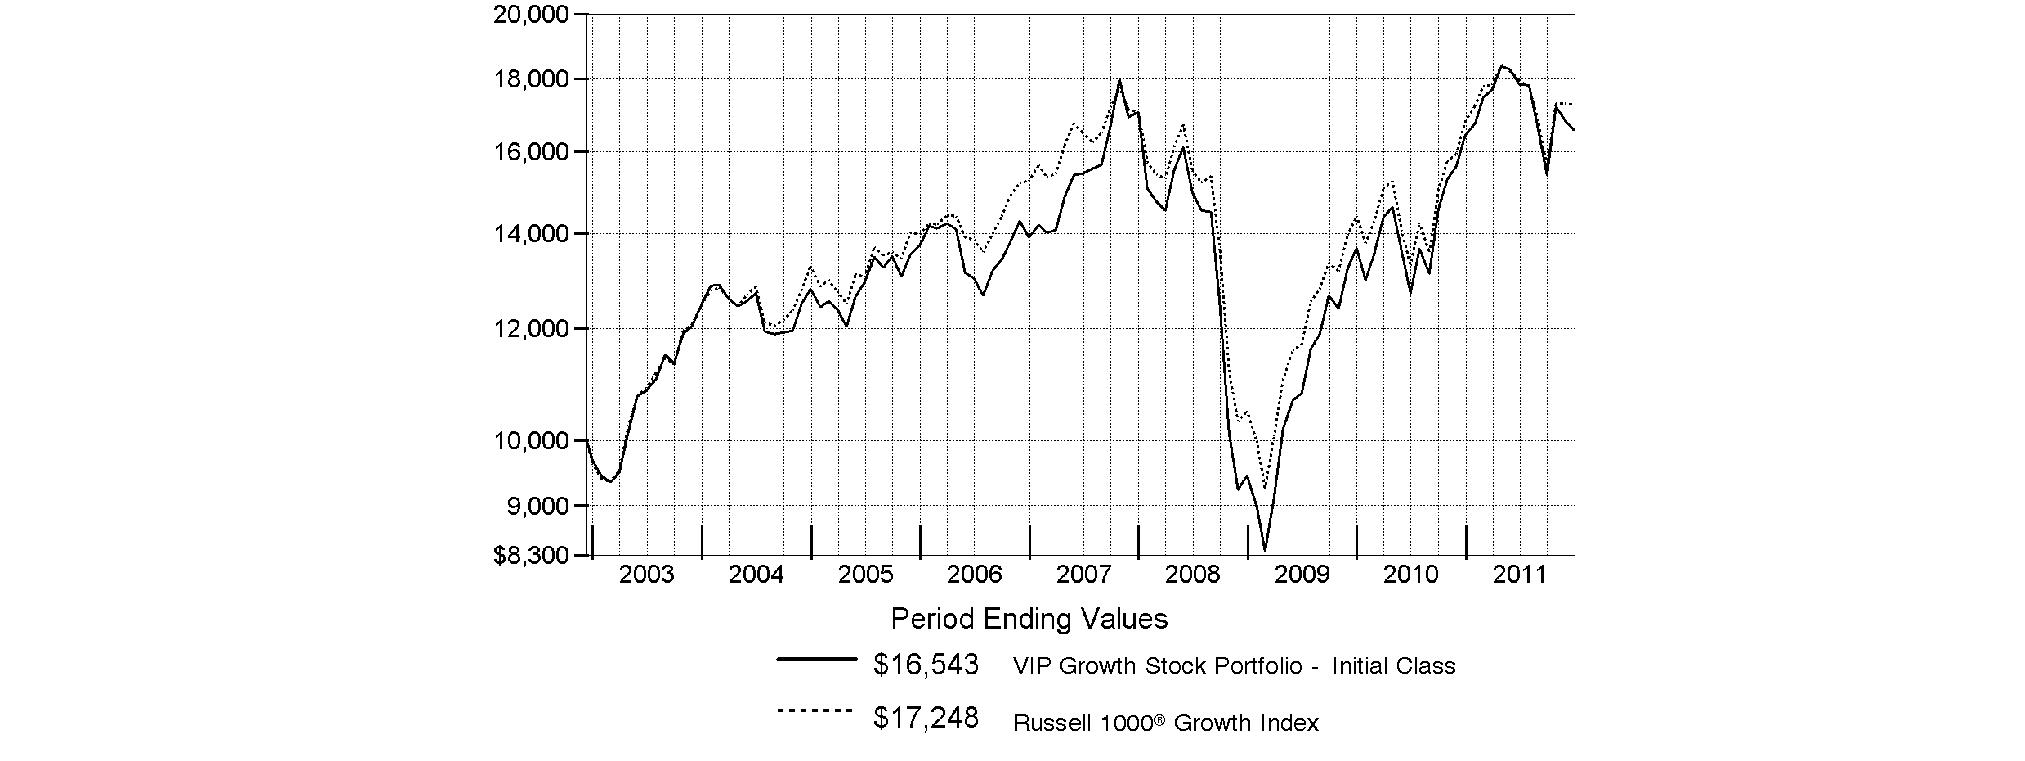
Annual Report
Market Recap: Extreme market volatility took center stage during the 12 months ending December 31, 2011, stealing the spotlight from signs of progress in the global economy. Early in the year, aggressive monetary stimulus by the U.S. federal government, improving credit-market conditions and solid corporate earnings buoyed most major asset classes. As the period progressed, however, fresh worries about sovereign debt in Europe, inflation in China, gridlock over raising the debt ceiling in the U.S. - along with Standard & Poor's early-August downgrade of the nation's long-term sovereign credit rating - and a dimmed outlook for global growth punctured investor confidence and ignited market instability. Domestic equities, as measured by the broad-based S&P 500® Index, gained 2.11%, easily outpacing the 13.61% decline of MSCI® ACWI® (All Country World Index) ex USA Index, a proxy for foreign stocks. Within the MSCI index, emerging markets declined the most (-18%), with investments here generally held back by a stronger U.S. dollar. The U.K. (-3%) fared better than the rest of Europe (-15%), which was the second-worst-performing index component. Bolstered by periodic flights to quality, U.S. investment-grade bonds posted a 7.84% advance, as reflected by the Barclays Capital® U.S. Aggregate Bond Index, outperforming the 4.37% gain of high-yield securities, as represented by The BofA Merrill LynchSM US High Yield Constrained Index. Hampered by financial woes in Europe, the sovereign debt of major developed markets outside the U.S. rose 4.86%, according to the Citigroup® Non-USD Group-of-Seven (G7) Equal Weighted Index, while the JPMorgan Emerging Markets Bond Index Global (EMBI Global) advanced 8.46%, despite the currency head wind.
Comments from Jeffrey Feingold, Portfolio Manager of VIP Growth Stock Portfolio for the period covered by this update: For the year, the fund's share classes lagged the 2.64% gain of the Russell 1000® Growth Index. (For specific portfolio results, please refer to the performance section of this report.) Security selection was disappointing in industrials and financials, followed - to a much lesser degree - by information technology and energy. In terms of individual detractors, a lack of exposure to tobacco company Philip Morris International and a sizable underweighting in software and services provider International Business Machines hurt, as the stocks of both major index constituents benefited from the shift toward safer-haven, dividend-paying names. Minimal exposure to another index constituent, fast-food chain McDonald's, also hampered performance, as better-than-expected earnings pushed the stock higher. An overweighting in Ireland-based climate-control company Ingersoll-Rand, whose shares were pressured by weak housing trends, detracted. Ingersoll-Rand was added to the index in July as part of the annual Russell reconstitution. Conversely, security selection in consumer discretionary, particularly retailing, aided performance. Individual standouts included the stocks of Tempur-Pedic International, a premium bedding company that benefited from higher-than-expected sales and earnings, and Herbalife, a weight-management products and nutritional supplements company that gained from expanded sales in the U.S. and overseas.
Note to shareholders: Daniel Kelley will become Portfolio Manager on January 12, 2012.
The views expressed above reflect those of the portfolio manager(s) only through the end of the period as stated on the cover of this report and do not necessarily represent the views of Fidelity or any other person in the Fidelity organization. Any such views are subject to change at any time based upon market or other conditions and Fidelity disclaims any responsibility to update such views. These views may not be relied on as investment advice and, because investment decisions for a Fidelity fund are based on numerous factors, may not be relied on as an indication of trading intent on behalf of any Fidelity fund.
Annual Report
As a shareholder of the Fund, you incur two types of costs: (1) transaction costs, and (2) ongoing costs, including management fees, distribution and/or service (12b-1) fees and other Fund expenses. This Example is intended to help you understand your ongoing costs (in dollars) of investing in the Fund and to compare these costs with the ongoing costs of investing in other mutual funds.
The Example is based on an investment of $1,000 invested at the beginning of the period and held for the entire period (July 1, 2011 to December 31, 2011).
Actual Expenses
The first line of the accompanying table for each class of the Fund provides information about actual account values and actual expenses. You may use the information in this line, together with the amount you invested, to estimate the expenses that you paid over the period. Simply divide your account value by $1,000.00 (for example, an $8,600 account value divided by $1,000.00 = 8.6), then multiply the result by the number in the first line for a class of the Fund under the heading entitled "Expenses Paid During Period" to estimate the expenses you paid on your account during this period. The estimate of expenses does not include any fees or other expenses of any variable annuity or variable life insurance product. If they were, the estimate of expenses you paid during the period would be higher, and your ending account value would be lower. In addition, the Fund, as a shareholder in the underlying Fidelity Central Funds, will indirectly bear its pro-rata share of the fees and expenses incurred by the underlying Fidelity Central Funds. These fees and expenses are not included in the Fund's annualized expense ratio used to calculate the expense estimate in the table below.
Hypothetical Example for Comparison Purposes
The second line of the accompanying table for each class of the Fund provides information about hypothetical account values and hypothetical expenses based on a Class' actual expense ratio and an assumed rate of return of 5% per year before expenses, which is not the Class' actual return. The hypothetical account values and expenses may not be used to estimate the actual ending account balance or expenses you paid for the period. You may use this information to compare the ongoing costs of investing in the Fund and other funds. To do so, compare this 5% hypothetical example with the 5% hypothetical examples that appear in the shareholder reports of the other funds. The estimate of expenses does not include any fees or other expenses of any variable annuity or variable life insurance product. If they were, the estimate of expenses you paid during the period would be higher, and your ending account value would be lower. In addition, the Fund, as a shareholder in the underlying Fidelity Central Funds, will indirectly bear its pro-rata share of the fees and expenses incurred by the underlying Fidelity Central Funds. These fees and expenses are not included in the Fund's annualized expense ratio used to calculate the expense estimate in the table below.
Please note that the expenses shown in the table are meant to highlight your ongoing costs only and do not reflect any transaction costs. Therefore, the second line of the table is useful in comparing ongoing costs only, and will not help you determine the relative total costs of owning different funds.
| Annualized Expense Ratio | Beginning
Account Value
July 1, 2011 | Ending
Account Value
December 31, 2011 | Expenses Paid
During Period*
July 1, 2011 to
December 31, 2011 |
Initial Class | .85% | | | |
Actual | | $ 1,000.00 | $ 927.30 | $ 4.13 |
HypotheticalA | | $ 1,000.00 | $ 1,020.92 | $ 4.33 |
Service Class | .95% | | | |
Actual | | $ 1,000.00 | $ 926.80 | $ 4.61 |
HypotheticalA | | $ 1,000.00 | $ 1,020.42 | $ 4.84 |
Service Class 2 | 1.10% | | | |
Actual | | $ 1,000.00 | $ 926.00 | $ 5.34 |
HypotheticalA | | $ 1,000.00 | $ 1,019.66 | $ 5.60 |
Investor Class | .93% | | | |
Actual | | $ 1,000.00 | $ 926.80 | $ 4.52 |
HypotheticalA | | $ 1,000.00 | $ 1,020.52 | $ 4.74 |
A 5% return per year before expenses
* Expenses are equal to each Class' annualized expense ratio, multiplied by the average account value over the period, multiplied by 184/365 (to reflect the one-half year period).
Annual Report
Investment Changes (Unaudited)
Top Ten Stocks as of December 31, 2011 |
| % of fund's
net assets | % of fund's net assets
6 months ago |
Apple, Inc. | 7.9 | 6.2 |
Exxon Mobil Corp. | 3.7 | 4.5 |
Google, Inc. Class A | 3.6 | 3.4 |
Oracle Corp. | 2.3 | 1.8 |
TJX Companies, Inc. | 1.9 | 1.5 |
Cognizant Technology Solutions Corp. Class A | 1.8 | 2.3 |
Schiff Nutrition International, Inc. | 1.7 | 1.3 |
QUALCOMM, Inc. | 1.7 | 2.0 |
United Technologies Corp. | 1.6 | 1.6 |
Motorola Solutions, Inc. | 1.5 | 0.0 |
| 27.7 | |
Top Five Market Sectors as of December 31, 2011 |
| % of fund's
net assets | % of fund's net assets
6 months ago |
Information Technology | 30.1 | 28.4 |
Consumer Discretionary | 16.0 | 14.2 |
Industrials | 10.9 | 12.2 |
Health Care | 10.2 | 10.5 |
Energy | 10.0 | 11.8 |
Asset Allocation (% of fund's net assets) |
As of December 31, 2011* | As of June 30, 2011** |
 | Stocks 96.5% | | | Stocks 98.3% | |
 | Short-Term
Investments and
Net Other Assets 3.5% | | | Short-Term
Investments and
Net Other Assets 1.7% | |
* Foreign investments | 8.0% | | ** Foreign investments | 13.1% | |

Annual Report
Investments December 31, 2011
Showing Percentage of Net Assets
Common Stocks - 96.4% |
| Shares | | Value |
CONSUMER DISCRETIONARY - 15.9% |
Auto Components - 0.3% |
Autoliv, Inc. | 1,900 | | $ 101,631 |
Automobiles - 0.0% |
Tesla Motors, Inc. (a) | 200 | | 5,712 |
Diversified Consumer Services - 0.2% |
Weight Watchers International, Inc. | 1,400 | | 77,014 |
Hotels, Restaurants & Leisure - 1.9% |
Arcos Dorados Holdings, Inc. | 3,700 | | 75,961 |
Brinker International, Inc. | 13,700 | | 366,612 |
Chipotle Mexican Grill, Inc. (a) | 200 | | 67,548 |
Denny's Corp. (a) | 14,600 | | 54,896 |
Dunkin' Brands Group, Inc. (a) | 2,700 | | 67,446 |
McDonald's Corp. | 300 | | 30,099 |
| | 662,562 |
Household Durables - 2.4% |
D.R. Horton, Inc. | 3,600 | | 45,396 |
iRobot Corp. (a) | 3,700 | | 110,445 |
Leggett & Platt, Inc. | 2,100 | | 48,384 |
Lennar Corp. Class A | 1,000 | | 19,650 |
Meritage Homes Corp. (a) | 3,853 | | 89,351 |
Ryland Group, Inc. | 3,700 | | 58,312 |
Standard Pacific Corp. (a) | 25,100 | | 79,818 |
Tempur-Pedic International, Inc. (a) | 6,700 | | 351,951 |
Toll Brothers, Inc. (a) | 1,000 | | 20,420 |
| | 823,727 |
Internet & Catalog Retail - 2.3% |
Amazon.com, Inc. (a) | 2,960 | | 512,376 |
Groupon, Inc. Class A (a)(d) | 4,500 | | 92,835 |
Priceline.com, Inc. (a) | 400 | | 187,084 |
| | 792,295 |
Media - 0.9% |
Discovery Communications, Inc. (a) | 1,500 | | 61,455 |
Pandora Media, Inc. | 100 | | 1,001 |
Time Warner, Inc. | 4,500 | | 162,630 |
Valassis Communications, Inc. (a) | 4,000 | | 76,920 |
| | 302,006 |
Multiline Retail - 1.7% |
Dollar General Corp. (a) | 5,800 | | 238,612 |
Dollar Tree, Inc. (a) | 4,100 | | 340,751 |
| | 579,363 |
Specialty Retail - 5.3% |
Charming Shoppes, Inc. (a) | 14,300 | | 70,070 |
Express, Inc. | 200 | | 3,988 |
Guess?, Inc. | 1,500 | | 44,730 |
Limited Brands, Inc. | 4,000 | | 161,400 |
Lowe's Companies, Inc. | 6,700 | | 170,046 |
Mattress Firm Holding Corp. | 500 | | 11,595 |
PetSmart, Inc. | 2,700 | | 138,483 |
Sally Beauty Holdings, Inc. (a) | 17,200 | | 363,436 |
|
| Shares | | Value |
TJX Companies, Inc. | 10,300 | | $ 664,865 |
Tractor Supply Co. | 1,100 | | 77,165 |
Urban Outfitters, Inc. (a) | 100 | | 2,756 |
Vitamin Shoppe, Inc. (a) | 2,800 | | 111,664 |
| | 1,820,198 |
Textiles, Apparel & Luxury Goods - 0.9% |
Deckers Outdoor Corp. (a) | 900 | | 68,013 |
Michael Kors Holdings Ltd. | 200 | | 5,450 |
PVH Corp. | 3,300 | | 232,617 |
| | 306,080 |
TOTAL CONSUMER DISCRETIONARY | | 5,470,588 |
CONSUMER STAPLES - 9.7% |
Beverages - 1.7% |
Beam, Inc. | 700 | | 35,861 |
Dr Pepper Snapple Group, Inc. | 4,600 | | 181,608 |
PepsiCo, Inc. | 1,700 | | 112,795 |
SABMiller PLC | 1,800 | | 63,364 |
The Coca-Cola Co. | 2,750 | | 192,418 |
| | 586,046 |
Food & Staples Retailing - 0.8% |
CVS Caremark Corp. | 2,400 | | 97,872 |
Wal-Mart de Mexico SA de CV Series V | 12,500 | | 34,245 |
Whole Foods Market, Inc. | 2,300 | | 160,034 |
| | 292,151 |
Food Products - 1.3% |
Danone sponsored ADR | 10,600 | | 133,984 |
Green Mountain Coffee Roasters, Inc. (a) | 4,600 | | 206,310 |
Mead Johnson Nutrition Co. Class A | 1,300 | | 89,349 |
SunOpta, Inc. (a) | 400 | | 1,928 |
| | 431,571 |
Household Products - 2.8% |
Colgate-Palmolive Co. | 4,500 | | 415,755 |
Kimberly-Clark Corp. | 3,000 | | 220,680 |
Procter & Gamble Co. | 5,000 | | 333,550 |
| | 969,985 |
Personal Products - 3.1% |
Herbalife Ltd. | 6,900 | | 356,523 |
Nu Skin Enterprises, Inc. Class A | 2,900 | | 140,853 |
Schiff Nutrition International, Inc. (a) | 54,828 | | 586,660 |
| | 1,084,036 |
TOTAL CONSUMER STAPLES | | 3,363,789 |
ENERGY - 10.0% |
Energy Equipment & Services - 2.0% |
Baker Hughes, Inc. | 2,700 | | 131,328 |
Dresser-Rand Group, Inc. (a) | 2,300 | | 114,793 |
Halliburton Co. | 4,400 | | 151,844 |
Helix Energy Solutions Group, Inc. (a) | 900 | | 14,220 |
Noble Corp. | 1,000 | | 30,220 |
Common Stocks - continued |
| Shares | | Value |
ENERGY - continued |
Energy Equipment & Services - continued |
Oceaneering International, Inc. | 2,700 | | $ 124,551 |
Schlumberger Ltd. | 1,590 | | 108,613 |
| | 675,569 |
Oil, Gas & Consumable Fuels - 8.0% |
Alpha Natural Resources, Inc. (a) | 2,352 | | 48,051 |
Amyris, Inc. (a) | 3,200 | | 36,928 |
Atlas Pipeline Partners, LP | 1,600 | | 59,440 |
BP PLC sponsored ADR | 1,400 | | 59,836 |
Cabot Oil & Gas Corp. | 2,700 | | 204,930 |
Chesapeake Energy Corp. | 2,400 | | 53,496 |
Chevron Corp. | 2,400 | | 255,360 |
Exxon Mobil Corp. | 15,090 | | 1,279,028 |
Hess Corp. | 2,800 | | 159,040 |
HollyFrontier Corp. | 3,900 | | 91,260 |
Inergy Midstream LP | 1,300 | | 24,635 |
Marathon Oil Corp. | 2,300 | | 67,321 |
Marathon Petroleum Corp. | 2,750 | | 91,548 |
Occidental Petroleum Corp. | 1,900 | | 178,030 |
Solazyme, Inc. | 400 | | 4,760 |
Southwestern Energy Co. (a) | 2,500 | | 79,850 |
Whiting Petroleum Corp. (a) | 1,400 | | 65,366 |
| | 2,758,879 |
TOTAL ENERGY | | 3,434,448 |
FINANCIALS - 3.2% |
Capital Markets - 1.1% |
Charles Schwab Corp. | 10,000 | | 112,600 |
HFF, Inc. (a) | 1,900 | | 19,627 |
Morgan Stanley | 10,900 | | 164,917 |
TD Ameritrade Holding Corp. | 3,700 | | 57,905 |
UBS AG (NY Shares) (a) | 2,800 | | 33,124 |
| | 388,173 |
Commercial Banks - 0.9% |
Aozora Bank Ltd. | 19,000 | | 52,335 |
Barclays PLC | 13,285 | | 36,387 |
U.S. Bancorp | 3,400 | | 91,970 |
Wells Fargo & Co. | 5,400 | | 148,824 |
| | 329,516 |
Consumer Finance - 0.2% |
SLM Corp. | 5,400 | | 72,360 |
Diversified Financial Services - 0.7% |
Citigroup, Inc. | 5,420 | | 142,600 |
JPMorgan Chase & Co. | 2,700 | | 89,775 |
| | 232,375 |
|
| Shares | | Value |
Real Estate Management & Development - 0.3% |
CBRE Group, Inc. (a) | 3,300 | | $ 50,226 |
Jones Lang LaSalle, Inc. | 800 | | 49,008 |
| | 99,234 |
TOTAL FINANCIALS | | 1,121,658 |
HEALTH CARE - 10.2% |
Biotechnology - 5.5% |
Achillion Pharmaceuticals, Inc. (a) | 11,900 | | 90,678 |
ADVENTRX Pharmaceuticals, Inc. (a) | 25,638 | | 14,870 |
ADVENTRX Pharmaceuticals, Inc. warrants 11/11/16 (a) | 8,919 | | 464 |
Alexion Pharmaceuticals, Inc. (a) | 2,500 | | 178,750 |
Amgen, Inc. | 1,600 | | 102,736 |
Amicus Therapeutics, Inc. (a) | 15,117 | | 52,002 |
Amylin Pharmaceuticals, Inc. (a) | 500 | | 5,690 |
Ardea Biosciences, Inc. (a) | 2,020 | | 33,956 |
ARIAD Pharmaceuticals, Inc. (a) | 9,900 | | 121,275 |
ArQule, Inc. (a) | 6,600 | | 37,224 |
Biogen Idec, Inc. (a) | 2,800 | | 308,140 |
BioMarin Pharmaceutical, Inc. (a) | 4,000 | | 137,520 |
Clovis Oncology, Inc. | 400 | | 5,636 |
Dynavax Technologies Corp. (a) | 21,600 | | 71,712 |
Exelixis, Inc. (a) | 5,300 | | 25,096 |
Geron Corp. (a)(d) | 8,400 | | 12,432 |
Gilead Sciences, Inc. (a) | 5,800 | | 237,394 |
Inhibitex, Inc. (a) | 6,500 | | 71,110 |
Lexicon Pharmaceuticals, Inc. (a) | 31,728 | | 40,929 |
Neurocrine Biosciences, Inc. (a) | 11,900 | | 101,150 |
NPS Pharmaceuticals, Inc. (a) | 3,800 | | 25,042 |
Synageva BioPharma Corp. (a) | 400 | | 10,652 |
Theravance, Inc. (a) | 2,400 | | 53,040 |
United Therapeutics Corp. (a) | 1,300 | | 61,425 |
Vertex Pharmaceuticals, Inc. (a) | 2,800 | | 92,988 |
ZIOPHARM Oncology, Inc. (a) | 3,800 | | 16,758 |
| | 1,908,669 |
Health Care Equipment & Supplies - 1.1% |
Alere, Inc. (a) | 6,825 | | 157,589 |
Edwards Lifesciences Corp. (a) | 1,600 | | 113,120 |
HeartWare International, Inc. (a) | 800 | | 55,200 |
Mako Surgical Corp. (a) | 800 | | 20,168 |
MELA Sciences, Inc. (a)(d) | 3,000 | | 11,070 |
Sirona Dental Systems, Inc. (a) | 100 | | 4,404 |
Stryker Corp. | 100 | | 4,971 |
| | 366,522 |
Health Care Providers & Services - 1.6% |
Aetna, Inc. | 900 | | 37,971 |
McKesson Corp. | 2,300 | | 179,193 |
Medco Health Solutions, Inc. (a) | 4,600 | | 257,140 |
WellPoint, Inc. | 1,200 | | 79,500 |
| | 553,804 |
Common Stocks - continued |
| Shares | | Value |
HEALTH CARE - continued |
Health Care Technology - 0.4% |
athenahealth, Inc. (a) | 1,000 | | $ 49,120 |
Cerner Corp. (a) | 1,600 | | 98,000 |
| | 147,120 |
Life Sciences Tools & Services - 0.1% |
Illumina, Inc. (a) | 800 | | 24,384 |
Pharmaceuticals - 1.5% |
Allergan, Inc. | 100 | | 8,774 |
AVANIR Pharmaceuticals Class A (a)(d) | 19,200 | | 39,360 |
Cadence Pharmaceuticals, Inc. (a) | 6,700 | | 26,465 |
Elan Corp. PLC sponsored ADR (a) | 8,300 | | 114,042 |
Eli Lilly & Co. | 4,300 | | 178,708 |
GlaxoSmithKline PLC sponsored ADR | 800 | | 36,504 |
Impax Laboratories, Inc. (a) | 900 | | 18,153 |
MAP Pharmaceuticals, Inc. (a) | 33 | | 435 |
Optimer Pharmaceuticals, Inc. (a) | 2,500 | | 30,600 |
Shire PLC sponsored ADR | 800 | | 83,120 |
| | 536,161 |
TOTAL HEALTH CARE | | 3,536,660 |
INDUSTRIALS - 10.9% |
Aerospace & Defense - 3.8% |
Precision Castparts Corp. | 1,600 | | 263,664 |
Raytheon Co. | 2,200 | | 106,436 |
Rockwell Collins, Inc. | 4,400 | | 243,628 |
Textron, Inc. | 7,900 | | 146,071 |
United Technologies Corp. | 7,500 | | 548,175 |
| | 1,307,974 |
Airlines - 0.4% |
Copa Holdings SA Class A | 1,300 | | 76,271 |
Southwest Airlines Co. | 7,000 | | 59,920 |
| | 136,191 |
Building Products - 0.1% |
Armstrong World Industries, Inc. | 1,000 | | 43,870 |
Commercial Services & Supplies - 0.0% |
Sykes Enterprises, Inc. (a) | 200 | | 3,132 |
Construction & Engineering - 0.8% |
Fluor Corp. | 3,100 | | 155,775 |
Jacobs Engineering Group, Inc. (a) | 2,100 | | 85,218 |
KBR, Inc. | 600 | | 16,722 |
| | 257,715 |
Electrical Equipment - 0.4% |
Alstom SA | 2,826 | | 85,706 |
Emerson Electric Co. | 900 | | 41,931 |
Regal-Beloit Corp. | 300 | | 15,291 |
| | 142,928 |
Industrial Conglomerates - 0.4% |
General Electric Co. | 7,600 | | 136,116 |
|
| Shares | | Value |
Machinery - 1.8% |
Cummins, Inc. | 3,800 | | $ 334,476 |
Fanuc Corp. | 100 | | 15,306 |
Ingersoll-Rand PLC | 7,800 | | 237,666 |
Manitowoc Co., Inc. | 2,100 | | 19,299 |
WABCO Holdings, Inc. (a) | 200 | | 8,680 |
Wabtec Corp. | 300 | | 20,985 |
| | 636,412 |
Professional Services - 2.2% |
IHS, Inc. Class A (a) | 1,500 | | 129,240 |
Kforce, Inc. (a) | 4,600 | | 56,718 |
Manpower, Inc. | 3,400 | | 121,550 |
Robert Half International, Inc. | 4,700 | | 133,762 |
Towers Watson & Co. | 5,300 | | 317,629 |
| | 758,899 |
Road & Rail - 0.4% |
Union Pacific Corp. | 1,400 | | 148,316 |
Trading Companies & Distributors - 0.6% |
Mills Estruturas e Servicos de Engenharia SA | 1,000 | | 9,500 |
WESCO International, Inc. (a) | 3,600 | | 190,836 |
| | 200,336 |
TOTAL INDUSTRIALS | | 3,771,889 |
INFORMATION TECHNOLOGY - 30.1% |
Communications Equipment - 4.2% |
Cisco Systems, Inc. | 9,500 | | 171,760 |
Juniper Networks, Inc. (a) | 4,600 | | 93,886 |
Motorola Solutions, Inc. | 11,100 | | 513,819 |
Polycom, Inc. (a) | 2,400 | | 39,120 |
QUALCOMM, Inc. | 10,600 | | 579,820 |
Riverbed Technology, Inc. (a) | 1,900 | | 44,650 |
| | 1,443,055 |
Computers & Peripherals - 8.1% |
Apple, Inc. (a) | 6,700 | | 2,713,499 |
EMC Corp. (a) | 100 | | 2,154 |
SanDisk Corp. (a) | 1,600 | | 78,736 |
| | 2,794,389 |
Electronic Equipment & Components - 0.4% |
Arrow Electronics, Inc. (a) | 3,300 | | 123,453 |
Internet Software & Services - 6.6% |
Baidu.com, Inc. sponsored ADR (a) | 1,000 | | 116,470 |
Cornerstone OnDemand, Inc. (d) | 2,800 | | 51,072 |
eBay, Inc. (a) | 9,900 | | 300,267 |
Facebook, Inc. Class B (e) | 1,414 | | 35,350 |
Google, Inc. Class A (a) | 1,930 | | 1,246,587 |
Mail.ru Group Ltd. GDR (Reg. S) (a) | 1,200 | | 31,200 |
NIC, Inc. | 4,100 | | 54,571 |
Rackspace Hosting, Inc. (a) | 8,900 | | 382,789 |
Saba Software, Inc. (a) | 2,600 | | 20,514 |
Common Stocks - continued |
| Shares | | Value |
INFORMATION TECHNOLOGY - continued |
Internet Software & Services - continued |
VeriSign, Inc. | 600 | | $ 21,432 |
Yandex NV | 1,100 | | 21,670 |
| | 2,281,922 |
IT Services - 3.1% |
Cardtronics, Inc. (a) | 100 | | 2,706 |
Cognizant Technology Solutions Corp. Class A (a) | 9,860 | | 634,097 |
International Business Machines Corp. | 1,600 | | 294,208 |
MasterCard, Inc. Class A | 200 | | 74,564 |
Virtusa Corp. (a) | 4,500 | | 65,160 |
| | 1,070,735 |
Office Electronics - 0.1% |
Xerox Corp. | 2,800 | | 22,288 |
Semiconductors & Semiconductor Equipment - 1.7% |
ASML Holding NV | 900 | | 37,611 |
Avago Technologies Ltd. | 1,600 | | 46,176 |
Broadcom Corp. Class A | 1,800 | | 52,848 |
Cymer, Inc. (a) | 800 | | 39,808 |
Freescale Semiconductor Holdings I Ltd. | 7,600 | | 96,140 |
Inphi Corp. (a) | 100 | | 1,196 |
KLA-Tencor Corp. | 700 | | 33,775 |
Marvell Technology Group Ltd. (a) | 8,600 | | 119,110 |
NVIDIA Corp. (a) | 6,700 | | 92,862 |
NXP Semiconductors NV (a) | 4,100 | | 63,017 |
Taiwan Semiconductor Manufacturing Co. Ltd. sponsored ADR | 900 | | 11,619 |
| | 594,162 |
Software - 5.9% |
Aspen Technology, Inc. (a) | 1,900 | | 32,965 |
Citrix Systems, Inc. (a) | 2,500 | | 151,800 |
Informatica Corp. (a) | 3,300 | | 121,869 |
Intuit, Inc. | 1,600 | | 84,144 |
Jive Software, Inc. | 1,200 | | 19,200 |
Kenexa Corp. (a) | 1,900 | | 50,730 |
MICROS Systems, Inc. (a) | 100 | | 4,658 |
Microsoft Corp. | 700 | | 18,172 |
Nexon Co. Ltd. | 800 | | 11,507 |
Oracle Corp. | 30,500 | | 782,325 |
Red Hat, Inc. (a) | 2,700 | | 111,483 |
salesforce.com, Inc. (a) | 4,000 | | 405,840 |
Solera Holdings, Inc. | 2,600 | | 115,804 |
Taleo Corp. Class A (a) | 1,200 | | 46,428 |
|
| Shares | | Value |
VMware, Inc. Class A (a) | 900 | | $ 74,871 |
Zynga, Inc. | 900 | | 8,469 |
| | 2,040,265 |
TOTAL INFORMATION TECHNOLOGY | | 10,370,269 |
MATERIALS - 4.5% |
Chemicals - 2.2% |
Ashland, Inc. | 2,900 | | 165,764 |
CF Industries Holdings, Inc. | 1,400 | | 202,972 |
Innophos Holdings, Inc. | 1,700 | | 82,552 |
LyondellBasell Industries NV Class A | 2,700 | | 87,723 |
Sherwin-Williams Co. | 100 | | 8,927 |
Solutia, Inc. | 200 | | 3,456 |
W.R. Grace & Co. (a) | 4,500 | | 206,640 |
| | 758,034 |
Metals & Mining - 2.3% |
Alcoa, Inc. | 3,500 | | 30,275 |
AngloGold Ashanti Ltd. sponsored ADR | 1,900 | | 80,655 |
Barrick Gold Corp. | 2,900 | | 131,417 |
Freeport-McMoRan Copper & Gold, Inc. | 1,600 | | 58,864 |
Goldcorp, Inc. | 3,400 | | 150,937 |
Ivanhoe Mines Ltd. (a) | 4,600 | | 81,711 |
Kinross Gold Corp. | 4,700 | | 53,673 |
Newcrest Mining Ltd. | 1,870 | | 56,606 |
Newmont Mining Corp. | 2,700 | | 162,027 |
| | 806,165 |
TOTAL MATERIALS | | 1,564,199 |
TELECOMMUNICATION SERVICES - 1.9% |
Diversified Telecommunication Services - 0.1% |
inContact, Inc. (a) | 3,900 | | 17,277 |
Wireless Telecommunication Services - 1.8% |
American Tower Corp. Class A | 7,800 | | 468,078 |
SBA Communications Corp. Class A (a) | 3,700 | | 158,952 |
| | 627,030 |
TOTAL TELECOMMUNICATION SERVICES | | 644,307 |
TOTAL COMMON STOCKS (Cost $30,573,252) | 33,277,807 |
Nonconvertible Preferred Stocks - 0.1% |
| | | |
CONSUMER DISCRETIONARY - 0.1% |
Automobiles - 0.1% |
Volkswagen AG (Cost $27,645) | 200 | | 29,965 |
Money Market Funds - 4.2% |
| Shares | | Value |
Fidelity Cash Central Fund, 0.11% (b) | 1,258,399 | | $ 1,258,399 |
Fidelity Securities Lending Cash Central Fund, 0.13% (b)(c) | 182,550 | | 182,550 |
TOTAL MONEY MARKET FUNDS (Cost $1,440,949) | 1,440,949 |
TOTAL INVESTMENT PORTFOLIO - 100.7% (Cost $32,041,846) | 34,748,721 |
NET OTHER ASSETS (LIABILITIES) - (0.7)% | (246,939) |
NET ASSETS - 100% | $ 34,501,782 |
Legend |
(a) Non-income producing |
(b) Affiliated fund that is available only to investment companies and other accounts managed by Fidelity Investments. The rate quoted is the annualized seven-day yield of the fund at period end. A complete unaudited listing of the fund's holdings as of its most recent quarter end is available upon request. In addition, each Fidelity Central Fund's financial statements, which are not covered by the Fund's Report of Independent Registered Public Accounting Firm, are available on the SEC's website or upon request. |
(c) Investment made with cash collateral received from securities on loan. |
(d) Security or a portion of the security is on loan at period end. |
(e) Restricted securities - Investment in securities not registered under the Securities Act of 1933 (excluding 144A issues). At the end of the period, the value of restricted securities (excluding 144A issues) amounted to $35,350 or 0.1% of net assets. |
Additional information on each restricted holding is as follows: |
Security | Acquisition Date | Acquisition Cost |
Facebook, Inc. Class B | 3/31/11 - 5/19/11 | $ 35,360 |
Affiliated Central Funds |
Information regarding fiscal year to date income earned by the Fund from investments in Fidelity Central Funds is as follows: |
Fund | Income earned |
Fidelity Cash Central Fund | $ 957 |
Fidelity Securities Lending Cash Central Fund | 21,520 |
Total | $ 22,477 |
Other Information |
The following is a summary of the inputs used, as of December 31, 2011, involving the Fund's assets and liabilities carried at fair value. The inputs or methodology used for valuing securities may not be an indication of the risk associated with investing in those securities. For more information on valuation inputs, and their aggregation into the levels used in the tables below, please refer to the Security Valuation section in the accompanying Notes to Financial Statements. |
Valuation Inputs at Reporting Date: |
Description | Total | Level 1 | Level 2 | Level 3 |
Investments in Securities: | | | | |
Equities: | | | | |
Consumer Discretionary | $ 5,500,553 | $ 5,500,553 | $ - | $ - |
Consumer Staples | 3,363,789 | 3,363,789 | - | - |
Energy | 3,434,448 | 3,434,448 | - | - |
Financials | 1,121,658 | 1,085,271 | 36,387 | - |
Health Care | 3,536,660 | 3,536,196 | 464 | - |
Industrials | 3,771,889 | 3,771,889 | - | - |
Information Technology | 10,370,269 | 10,334,919 | - | 35,350 |
Materials | 1,564,199 | 1,564,199 | - | - |
Telecommunication Services | 644,307 | 644,307 | - | - |
Money Market Funds | 1,440,949 | 1,440,949 | - | - |
Total Investments in Securities: | $ 34,748,721 | $ 34,676,520 | $ 36,851 | $ 35,350 |
The following is a reconciliation of Investments in Securities for which Level 3 inputs were used in determining value: |
Investments in Securities: | |
Beginning Balance | $ - |
Total Realized Gain (Loss) | - |
Total Unrealized Gain (Loss) | (10) |
Cost of Purchases | 35,360 |
Proceeds of Sales | - |
Amortization/Accretion | - |
Transfers in to Level 3 | - |
Transfers out of Level 3 | - |
Ending Balance | $ 35,350 |
The change in unrealized gain (loss) for the period attributable to Level 3 securities held at December 31, 2011 | $ (10) |
The information used in the above reconciliation represents fiscal year to date activity for any Investments in Securities identified as using Level 3 inputs at either the beginning or the end of the current fiscal period. Transfers in or out of Level 3 represent the beginning value of any Security or Instrument where a change in the pricing level occurred from the beginning to the end of the period. The cost of purchases and the proceeds of sales may include securities received or delivered through corporate actions or exchanges. Realized and unrealized gains (losses) disclosed in the reconciliation are included in Net Gain (Loss) on the Fund's Statement of Operations. |
See accompanying notes which are an integral part of the financial statements.
Annual Report
Statement of Assets and Liabilities
| December 31, 2011 |
Assets | | |
Investment in securities, at value (including securities loaned of $175,910) - See accompanying schedule: Unaffiliated issuers (cost $30,600,897) | $ 33,307,772 | |
Fidelity Central Funds (cost $1,440,949) | 1,440,949 | |
Total Investments (cost $32,041,846) | | $ 34,748,721 |
Cash | | 413 |
Receivable for fund shares sold | | 7,512 |
Dividends receivable | | 13,441 |
Distributions receivable from Fidelity Central Funds | | 3,066 |
Prepaid expenses | | 122 |
Receivable from investment adviser for expense reductions | | 5,156 |
Other receivables | | 425 |
Total assets | | 34,778,856 |
| | |
Liabilities | | |
Payable for investments purchased | $ 13,376 | |
Payable for fund shares redeemed | 14,170 | |
Accrued management fee | 15,919 | |
Distribution and service plan fees payable | 339 | |
Other affiliated payables | 4,613 | |
Other payables and accrued expenses | 46,107 | |
Collateral on securities loaned, at value | 182,550 | |
Total liabilities | | 277,074 |
| | |
Net Assets | | $ 34,501,782 |
Net Assets consist of: | | |
Paid in capital | | $ 34,983,424 |
Accumulated undistributed net realized gain (loss) on investments and foreign currency transactions | | (3,188,410) |
Net unrealized appreciation (depreciation) on investments and assets and liabilities in foreign currencies | | 2,706,768 |
Net Assets | | $ 34,501,782 |
Statement of Assets and Liabilities - continued
| December 31, 2011 |
Initial Class:
Net Asset Value, offering price and redemption price per share ($9,012,088 ÷ 660,940.2 shares) | | $ 13.64 |
| | |
Service Class:
Net Asset Value, offering price and redemption price per share ($402,265 ÷ 29,693.3 shares) | | $ 13.55 |
| | |
Service Class 2:
Net Asset Value, offering price and redemption price per share ($1,415,238 ÷ 105,654.3 shares) | | $ 13.39 |
| | |
Investor Class:
Net Asset Value, offering price and redemption price per share ($23,672,191 ÷ 1,748,223.9 shares) | | $ 13.54 |
See accompanying notes which are an integral part of the financial statements.
Annual Report
Financial Statements - continued
Statement of Operations
| Year ended December 31, 2011 |
Investment Income | | |
Dividends | | $ 273,670 |
Interest | | 1 |
Income from Fidelity Central Funds (including $21,520 from security lending) | | 22,477 |
Total income | | 296,148 |
| | |
Expenses | | |
Management fee | $ 181,499 | |
Transfer agent fees | 47,533 | |
Distribution and service plan fees | 6,131 | |
Accounting and security lending fees | 12,699 | |
Custodian fees and expenses | 30,402 | |
Independent trustees' compensation | 180 | |
Audit | 53,082 | |
Legal | 109 | |
Miscellaneous | 228 | |
Total expenses before reductions | 331,863 | |
Expense reductions | (33,648) | 298,215 |
Net investment income (loss) | | (2,067) |
Realized and Unrealized Gain (Loss) Net realized gain (loss) on: | | |
Investment securities: | | |
Unaffiliated issuers | 573,310 | |
Foreign currency transactions | (5,808) | |
Total net realized gain (loss) | | 567,502 |
Change in net unrealized appreciation (depreciation) on: Investment securities | (1,485,189) | |
Assets and liabilities in foreign currencies | (73) | |
Total change in net unrealized appreciation (depreciation) | | (1,485,262) |
Net gain (loss) | | (917,760) |
Net increase (decrease) in net assets resulting from operations | | $ (919,827) |
Statement of Changes in Net Assets
| Year ended December 31, 2011 | Year ended December 31, 2010 |
Increase (Decrease) in Net Assets | | |
Operations | | |
Net investment income (loss) | $ (2,067) | $ (11,171) |
Net realized gain (loss) | 567,502 | 1,076,846 |
Change in net unrealized appreciation (depreciation) | (1,485,262) | 2,442,733 |
Net increase (decrease) in net assets resulting
from operations | (919,827) | 3,508,408 |
Share transactions - net increase (decrease) | 10,822,831 | 6,165,555 |
Total increase (decrease) in net assets | 9,903,004 | 9,673,963 |
| | |
Net Assets | | |
Beginning of period | 24,598,778 | 14,924,815 |
End of period | $ 34,501,782 | $ 24,598,778 |
See accompanying notes which are an integral part of the financial statements.
Annual Report
Financial Highlights - Initial Class
Years ended December 31, | 2011 | 2010 | 2009 | 2008 | 2007 |
Selected Per-Share Data | | | | | |
Net asset value, beginning of period | $ 13.53 | $ 11.27 | $ 7.81 | $ 14.15 | $ 12.07 |
Income from Investment Operations | | | | | |
Net investment income (loss) C | .01 | - I | .04 | .02 | - I |
Net realized and unrealized gain (loss) | .10 G | 2.26 | 3.46 | (6.34) | 2.74 |
Total from investment operations | .11 | 2.26 | 3.50 | (6.32) | 2.74 |
Distributions from net investment income | - | - | (.04) | (.02) | - |
Distributions from net realized gain | - | - | - | - | (.66) |
Total distributions | - | - | (.04) | (.02) | (.66) |
Net asset value, end of period | $ 13.64 | $ 13.53 | $ 11.27 | $ 7.81 | $ 14.15 |
Total Return A,B | .81% | 20.05% | 44.86% | (44.67)% | 22.67% |
Ratios to Average Net Assets D,H | | | | | |
Expenses before reductions | .96% | 1.09% | 1.35% | 1.16% | 1.10% |
Expenses net of fee waivers, if any | .85% | .85% | .85% | .85% | .85% |
Expenses net of all reductions | .84% | .84% | .84% | .85% | .84% |
Net investment income (loss) | .07% | .01% | .39% | .19% | -% F |
Supplemental Data | | | | | |
Net assets, end of period (000 omitted) | $ 9,012 | $ 7,008 | $ 5,374 | $ 3,368 | $ 13,752 |
Portfolio turnover rate E | 84% | 114% | 173% | 137% | 167% |
A Total returns do not reflect charges attributable to your insurance company's separate account. Inclusion of these charges would reduce the total returns shown.
B Total returns would have been lower if certain expenses had not been reduced during the applicable periods shown.
C Calculated based on average shares outstanding during the period.
D Fees and expenses of any underlying Fidelity Central Funds are not included in the Fund's expense ratio. The Fund indirectly bears its proportionate share of the expenses of any underlying Fidelity Central Funds.
E Amount does not include the portfolio activity of any underlying Fidelity Central Funds.
F Amount represents less than .01%.
G The amount shown for a share outstanding does not correspond with the aggregate net gain (loss) on investments for the period due to the timing of sales and repurchases of shares in relation to fluctuating market values of the investments of the Fund.
H Expense ratios reflect operating expenses of the class. Expenses before reductions do not reflect amounts reimbursed by the investment adviser or reductions from brokerage service arrangements or reductions from other expense offset arrangements and do not represent the amount paid by the class during periods when reimbursements or reductions occur. Expenses net of fee waivers reflect expenses after reimbursement by the investment adviser but prior to reductions from brokerage service arrangements or other expense offset arrangements. Expenses net of all reductions represent the net expenses paid by the class.
I Amount represents less than $.01 per share.
See accompanying notes which are an integral part of the financial statements.
Annual Report
Financial Highlights - Service Class
Years ended December 31, | 2011 | 2010 | 2009 | 2008 | 2007 |
Selected Per-Share Data | | | | | |
Net asset value, beginning of period | $ 13.46 | $ 11.22 | $ 7.78 | $ 14.08 | $ 12.02 |
Income from Investment Operations | | | | | |
Net investment income (loss) C | - H | (.01) | .03 | .01 | (.01) |
Net realized and unrealized gain (loss) | .09 F | 2.25 | 3.44 | (6.30) | 2.73 |
Total from investment operations | .09 | 2.24 | 3.47 | (6.29) | 2.72 |
Distributions from net investment income | - | - | (.03) | (.01) | - |
Distributions from net realized gain | - | - | - | - | (.66) |
Total distributions | - | - | (.03) | (.01) | (.66) |
Net asset value, end of period | $ 13.55 | $ 13.46 | $ 11.22 | $ 7.78 | $ 14.08 |
Total Return A,B | .67% | 19.96% | 44.61% | (44.71)% | 22.60% |
Ratios to Average Net Assets D,G | | | | | |
Expenses before reductions | 1.04% | 1.17% | 1.42% | 1.22% | 1.17% |
Expenses net of fee waivers, if any | .95% | .95% | .95% | .95% | .95% |
Expenses net of all reductions | .94% | .94% | .94% | .95% | .95% |
Net investment income (loss) | (.03)% | (.10)% | .30% | .09% | (.10)% |
Supplemental Data | | | | | |
Net assets, end of period (000 omitted) | $ 402 | $ 573 | $ 823 | $ 1,021 | $ 2,545 |
Portfolio turnover rate E | 84% | 114% | 173% | 137% | 167% |
A Total returns do not reflect charges attributable to your insurance company's separate account. Inclusion of these charges would reduce the total returns shown.
B Total returns would have been lower if certain expenses had not been reduced during the applicable periods shown.
C Calculated based on average shares outstanding during the period.
D Fees and expenses of any underlying Fidelity Central Funds are not included in the Fund's expense ratio. The Fund indirectly bears its proportionate share of the expenses of any underlying Fidelity Central Funds.
E Amount does not include the portfolio activity of any underlying Fidelity Central Funds.
F The amount shown for a share outstanding does not correspond with the aggregate net gain (loss) on investments for the period due to the timing of sales and repurchases of shares in relation to fluctuating market values of the investments of the Fund.
G Expense ratios reflect operating expenses of the class. Expenses before reductions do not reflect amounts reimbursed by the investment adviser or reductions from brokerage service arrangements or reductions from other expense offset arrangements and do not represent the amount paid by the class during periods when reimbursements or reductions occur. Expenses net of fee waivers reflect expenses after reimbursement by the investment adviser but prior to reductions from brokerage service arrangements or other expense offset arrangements. Expenses net of all reductions represent the net expenses paid by the class.
H Amount represents less than $.01 per share.
See accompanying notes which are an integral part of the financial statements.
Annual Report
Financial Highlights - Service Class 2
Years ended December 31, | 2011 | 2010 | 2009 | 2008 | 2007 |
Selected Per-Share Data | | | | | |
Net asset value, beginning of period | $ 13.33 | $ 11.13 | $ 7.71 | $ 13.96 | $ 11.95 |
Income from Investment Operations | | | | | |
Net investment income (loss) C | (.03) | (.03) | .01 | (.01) | (.03) |
Net realized and unrealized gain (loss) | .09 F | 2.23 | 3.42 | (6.24) | 2.70 |
Total from investment operations | .06 | 2.20 | 3.43 | (6.25) | 2.67 |
Distributions from net investment income | - | - | (.01) | - | - |
Distributions from net realized gain | - | - | - | - | (.66) |
Total distributions | - | - | (.01) | - | (.66) |
Net asset value, end of period | $ 13.39 | $ 13.33 | $ 11.13 | $ 7.71 | $ 13.96 |
Total Return A,B | .45% | 19.77% | 44.42% | (44.77)% | 22.31% |
Ratios to Average Net Assets D,G | | | | | |
Expenses before reductions | 1.26% | 1.42% | 1.67% | 1.42% | 1.38% |
Expenses net of fee waivers, if any | 1.10% | 1.10% | 1.10% | 1.10% | 1.10% |
Expenses net of all reductions | 1.10% | 1.10% | 1.09% | 1.10% | 1.09% |
Net investment income (loss) | (.19)% | (.25)% | .15% | (.06)% | (.25)% |
Supplemental Data | | | | | |
Net assets, end of period (000 omitted) | $ 1,415 | $ 2,592 | $ 1,684 | $ 2,183 | $ 5,116 |
Portfolio turnover rate E | 84% | 114% | 173% | 137% | 167% |
A Total returns do not reflect charges attributable to your insurance company's separate account. Inclusion of these charges would reduce the total returns shown.
B Total returns would have been lower if certain expenses had not been reduced during the applicable periods shown.
C Calculated based on average shares outstanding during the period.
D Fees and expenses of any underlying Fidelity Central Funds are not included in the Fund's expense ratio. The Fund indirectly bears its proportionate share of the expenses of any underlying Fidelity Central Funds.
E Amount does not include the portfolio activity of any underlying Fidelity Central Funds.
F The amount shown for a share outstanding does not correspond with the aggregate net gain (loss) on investments for the period due to the timing of sales and repurchases of shares in relation to fluctuating market values of the investments of the Fund.
G Expense ratios reflect operating expenses of the class. Expenses before reductions do not reflect amounts reimbursed by the investment adviser or reductions from brokerage service arrangements or reductions from other expense offset arrangements and do not represent the amount paid by the class during periods when reimbursements or reductions occur. Expenses net of fee waivers reflect expenses after reimbursement by the investment adviser but prior to reductions from brokerage service arrangements or other expense offset arrangements. Expenses net of all reductions represent the net expenses paid by the class.
See accompanying notes which are an integral part of the financial statements.
Annual Report
Financial Highlights - Investor Class
Years ended December 31, | 2011 | 2010 | 2009 | 2008 | 2007 |
Selected Per-Share Data | | | | | |
Net asset value, beginning of period | $ 13.45 | $ 11.21 | $ 7.78 | $ 14.10 | $ 12.05 |
Income from Investment Operations | | | | | |
Net investment income (loss) C | - H | (.01) | .03 | .01 | (.02) |
Net realized and unrealized gain (loss) | .09 F | 2.25 | 3.44 | (6.31) | 2.73 |
Total from investment operations | .09 | 2.24 | 3.47 | (6.30) | 2.71 |
Distributions from net investment income | - | - | (.04) | (.02) | - |
Distributions from net realized gain | - | - | - | - | (.66) |
Total distributions | - | - | (.04) | (.02) | (.66) |
Net asset value, end of period | $ 13.54 | $ 13.45 | $ 11.21 | $ 7.78 | $ 14.10 |
Total Return A,B | .67% | 19.98% | 44.64% | (44.69)% | 22.45% |
Ratios to Average Net Assets D,G | | | | | |
Expenses before reductions | 1.02% | 1.16% | 1.43% | 1.25% | 1.22% |
Expenses net of fee waivers, if any | .93% | .93% | .93% | .93% | 1.00% |
Expenses net of all reductions | .93% | .92% | .93% | .93% | .99% |
Net investment income (loss) | (.02)% | (.08)% | .31% | .11% | (.15)% |
Supplemental Data | | | | | |
Net assets, end of period (000 omitted) | $ 23,672 | $ 14,427 | $ 7,044 | $ 3,416 | $ 9,142 |
Portfolio turnover rate E | 84% | 114% | 173% | 137% | 167% |
A Total returns do not reflect charges attributable to your insurance company's separate account. Inclusion of these charges would reduce the total returns shown.
B Total returns would have been lower if certain expenses had not been reduced during the applicable periods shown.
C Calculated based on average shares outstanding during the period.
D Fees and expenses of any underlying Fidelity Central Funds are not included in the Fund's expense ratio. The Fund indirectly bears its proportionate share of the expenses of any underlying Fidelity Central Funds.
E Amount does not include the portfolio activity of any underlying Fidelity Central Funds.
F The amount shown for a share outstanding does not correspond with the aggregate net gain (loss) on investments for the period due to the timing of sales and repurchases of shares in relation to fluctuating market values of the investments of the Fund.
G Expense ratios reflect operating expenses of the class. Expenses before reductions do not reflect amounts reimbursed by the investment adviser or reductions from brokerage service arrangements or reductions from other expense offset arrangements and do not represent the amount paid by the class during periods when reimbursements or reductions occur. Expenses net of fee waivers reflect expenses after reimbursement by the investment adviser but prior to reductions from brokerage service arrangements or other expense offset arrangements. Expenses net of all reductions represent the net expenses paid by the class.
H Amount represents less than $.01 per share.
See accompanying notes which are an integral part of the financial statements.
Annual Report
Notes to Financial Statements
For the period ended December 31, 2011
1. Organization.
VIP Growth Stock Portfolio (the Fund) is a fund of Variable Insurance Products Fund IV (the Trust) and is authorized to issue an unlimited number of shares. The Trust is registered under the Investment Company Act of 1940, as amended (the 1940 Act), as an open-end management investment company organized as a Massachusetts business trust. Shares of the Fund may only be purchased by insurance companies for the purpose of funding variable annuity or variable life insurance contracts. The Fund offers the following classes of shares: Initial Class shares, Service Class shares, Service Class 2 shares and Investor Class shares. All classes have equal rights and voting privileges, except for matters affecting a single class. Investment income, realized and unrealized capital gains and losses, the common expenses of the Fund, and certain fund-level expense reductions, if any, are allocated on a pro-rata basis to each class based on the relative net assets of each class to the total net assets of the Fund. Each class differs with respect to transfer agent and distribution and service plan fees incurred. Certain expense reductions may also differ by class.
2. Investments in Fidelity Central Funds.
The Fund invests in Fidelity Central Funds, which are open-end investment companies available only to other investment companies and accounts managed by Fidelity Management & Research Company (FMR) and its affiliates. The Fund's Schedule of Investments lists each of the Fidelity Central Funds held as of period end, if any, as an investment of the Fund, but do not include the underlying holdings of each Fidelity Central Fund. As an Investing Fund, the Fund indirectly bears its proportionate share of the expenses of the underlying Fidelity Central Funds.
The Money Market Central Funds seek preservation of capital and current income and are managed by Fidelity Investments Money Management, Inc. (FIMM), an affiliate of FMR.
A complete unaudited list of holdings for each Fidelity Central Fund is available upon request or at the Securities and Exchange Commission (the SEC) web site at www.sec.gov. In addition, the financial statements of the Fidelity Central Funds, which are not covered by the Fund's Report of Independent Registered Public Accounting Firm, are available on the SEC web site or upon request.
3. Significant Accounting Policies.
The financial statements have been prepared in conformity with accounting principles generally accepted in the United States of America (GAAP), which require management to make certain estimates and assumptions at the date of the financial statements. Actual results could differ from those estimates. Subsequent events, if any, through the date that the financial statements were issued have been evaluated in the preparation of the financial statements. The following summarizes the significant accounting policies of the Fund:
Security Valuation. Investments are valued as of 4:00 p.m. Eastern time on the last calendar day of the period. The Fund uses independent pricing services approved by the Board of Trustees to value its investments. When current market prices or quotations are not readily available or reliable, valuations may be determined in good faith in accordance with procedures adopted by the Board of Trustees. Factors used in determining value may include market or security specific events. The frequency with which these procedures are used cannot be predicted and they may be utilized to a significant extent. The value used for net asset value (NAV) calculation under these procedures may differ from published prices for the same securities.
The Fund categorizes the inputs to valuation techniques used to value its investments into a disclosure hierarchy consisting of three levels as shown below:
Level 1 - quoted prices in active markets for identical investments
Level 2 - other significant observable inputs (including quoted prices for similar investments, interest rates, prepayment speeds, etc.)
Level 3 - unobservable inputs (including the Fund's own assumptions based on the best information available)
Changes in valuation techniques may result in transfers in or out of an assigned level within the disclosure hierarchy. The aggregate value of investments by input level, as of December 31, 2011, as well as a roll forward of Level 3 securities, is included at the end of the Fund's Schedule of Investments. Valuation techniques used to value the Fund's investments by major category are as follows:
Equity securities, including restricted securities, for which market quotations are readily available, are valued at the last reported sale price or official closing price as reported by an independent pricing service on the primary market or exchange on which they are traded and are categorized as Level 1 in the hierarchy. In the event there were no sales during the day or closing prices are not available, securities are valued at the last quoted bid price or may be valued using the last available price and are generally categorized as Level 2 in the hierarchy. For foreign equity securities, when significant market or security specific events arise, comparisons to the valuation of American Depositary Receipts (ADRs), futures contracts, Exchange-traded funds (ETFs) and certain indexes as well as quoted prices for similar securities are used and are categorized as Level 2 in the hierarchy in these circumstances. Utilizing these techniques may result in transfers between Level 1 and Level 2. For restricted equity securities and private placements where observable inputs are limited, assumptions about market activity and risk are used and are categorized as Level 3 in the hierarchy.
Annual Report
Notes to Financial Statements - continued
3. Significant Accounting Policies - continued
Security Valuation - continued
Investments in open-end mutual funds, including the Fidelity Central Funds, are valued at their closing net asset value each business day and are categorized as Level 1 in the hierarchy.
New Accounting Pronouncements. In May 2011, the Financial Accounting Standards Board issued Accounting Standard Update No. 2011-04, Fair Value Measurement (Topic 820) - Amendments to Achieve Common Fair Value Measurement and Disclosure Requirements in U.S. GAAP and IFRSs. The update is effective during interim and annual periods beginning after December 15, 2011 and will result in additional disclosure for transfers between levels as well as expanded disclosure for securities categorized as Level 3 under the fair value hierarchy.
In December 2011, the Financial Accounting Standards Board issued Accounting Standard Update No. 2011-11, Disclosures about Offsetting Assets and Liabilities. The update creates new disclosure requirements requiring entities to disclose both gross and net information for derivatives and other financial instruments that are either offset in the Statement of Assets and Liabilities or subject to an enforceable master netting arrangement or similar agreement. The disclosure requirements are effective for annual reporting periods beginning on or after January 1, 2013. Management is currently evaluating the impact of the update's adoption on the Fund's financial statement disclosures.
Foreign Currency. The Fund may use foreign currency contracts to facilitate transactions in foreign-denominated securities. Gains and losses from these transactions may arise from changes in the value of the foreign currency or if the counterparties do not perform under the contracts' terms.
Foreign-denominated assets, including investment securities, and liabilities are translated into U.S. dollars at the exchange rate at period end. Purchases and sales of investment securities, income and dividends received and expenses denominated in foreign currencies are translated into U.S. dollars at the exchange rate in effect on the transaction date.
The effects of exchange rate fluctuations on investments are included with the net realized and unrealized gain (loss) on investment securities. Other foreign currency transactions resulting in realized and unrealized gain (loss) are disclosed separately.
Investment Transactions and Income. For financial reporting purposes, the Fund's investment holdings and NAV include trades executed through the end of the last business day of the period. The NAV per share for processing shareholder transactions is calculated as of the close of business of the New York Stock Exchange (NYSE), normally 4:00 p.m. Eastern time and includes trades executed through the end of the prior business day. Gains and losses on securities sold are determined on the basis of identified cost and may include proceeds received from litigation. Dividend income is recorded on the ex-dividend date, except for certain dividends from foreign securities where the ex-dividend date may have passed, which are recorded as soon as the Fund is informed of the ex-dividend date. Non-cash dividends included in dividend income, if any, are recorded at the fair market value of the securities received. Distributions received on securities that represent a return of capital or capital gain are recorded as a reduction of cost of investments and/or as a realized gain. The Fund estimates the components of distributions received that may be considered return of capital distributions or capital gain distributions. Interest income and distributions from the Fidelity Central Funds are accrued as earned. Interest income includes coupon interest and amortization of premium and accretion of discount on debt securities. Investment income is recorded net of foreign taxes withheld where recovery of such taxes is uncertain.
Expenses. Expenses directly attributable to a fund are charged to that fund. Expenses attributable to more than one fund are allocated among the respective funds on the basis of relative net assets or other appropriate methods. Expense estimates are accrued in the period to which they relate and adjustments are made when actual amounts are known.
Income Tax Information and Distributions to Shareholders. Each year, the Fund intends to qualify as a regulated investment company, including distributing substantially all of its taxable income and realized gains under Subchapter M of the Internal Revenue Code. As a result, no provision for income taxes is required. As of December 31, 2011, the Fund did not have any unrecognized tax benefits in the financial statements; nor is the Fund aware of any tax positions for which it is reasonably possible that the total amounts of unrecognized tax benefits will significantly change in the next twelve months. The Fund files a U.S. federal tax return, in addition to state and local tax returns as required. A fund's tax returns are subject to examination by the Internal Revenue Service (IRS) for a period of three fiscal years. State and local tax returns may be subject to examination for an additional fiscal year depending on the jurisdiction. Foreign taxes are provided for based on the Fund's understanding of the tax rules and rates that exist in the foreign markets in which it invests.
Distributions are declared and recorded on the ex-dividend date. Income dividends and capital gain distributions are declared separately for each class. Income and capital gain distributions are determined in accordance with income tax regulations, which may differ from GAAP.
Capital accounts within the financial statements are adjusted for permanent book-tax differences. These adjustments have no impact on net assets or the results of operations. Temporary book-tax differences will reverse in a subsequent period.
Book-tax differences are primarily due to foreign currency transactions, passive foreign investment companies (PFIC), partnerships, net operating losses, capital loss carryforwards and losses deferred due to wash sales and excise tax regulations.
Annual Report
3. Significant Accounting Policies - continued
Income Tax Information and Distributions to Shareholders - continued
The federal tax cost of investment securities and unrealized appreciation (depreciation) as of period end were as follows:
Gross unrealized appreciation | $ 5,125,678 |
Gross unrealized depreciation | (2,532,517) |
Net unrealized appreciation (depreciation) on securities and other investments | $ 2,593,161 |
Tax Cost | $ 32,155,560 |
The tax-based components of distributable earnings as of period end were as follows:
Capital loss carryforward | $ (2,742,332) |
Net unrealized appreciation (depreciation) | $ 2,593,054 |
Capital loss carryforwards are only available to offset future capital gains of the Fund to the extent provided by regulations and may be limited. Under the Regulated Investment Company Modernization Act of 2010 (the Act), the Fund is permitted to carry forward capital losses incurred in taxable years beginning after December 22, 2010 for an unlimited period and such capital losses are required to be used prior to any losses that expire. Capital loss carryforwards were as follows:
Fiscal year of expiration | |
2016 | $ (411,704) |
2017 | (2,330,628) |
Total with expiration | $ (2,742,332) |
4. Operating Policies.
Restricted Securities. The Fund may invest in securities that are subject to legal or contractual restrictions on resale. These securities generally may be resold in transactions exempt from registration or to the public if the securities are registered. Disposal of these securities may involve time-consuming negotiations and expense, and prompt sale at an acceptable price may be difficult. Information regarding restricted securities is included at the end of the Fund's Schedule of Investments.
5. Purchases and Sales of Investments.
Purchases and sales of securities, other than short-term securities, aggregated $37,614,989 and $26,946,033, respectively.
6. Fees and Other Transactions with Affiliates.
Management Fee. FMR and its affiliates provide the Fund with investment management related services for which the Fund pays a monthly management fee. The management fee is the sum of an individual fund fee rate that is based on an annual rate of .30% of the Fund's average net assets and an annualized group fee rate that averaged .26% during the period. The group fee rate is based upon the average net assets of all the mutual funds advised by FMR. The group fee rate decreases as assets under management increase and increases as assets under management decrease. For the period, the total annual management fee rate was .56% of the Fund's average net assets.
Distribution and Service Plan Fees. In accordance with Rule 12b-1 of the 1940 Act, the Fund has adopted separate 12b-1 Plans for each Service Class of shares. Each Service Class pays Fidelity Distributors Corporation (FDC), an affiliate of FMR, a service fee. For the period, the service fee is based on an annual rate of .10% of Service Class' average net assets and .25% of Service Class 2's average net assets.
For the period, total fees, all of which were re-allowed to insurance companies for the distribution of shares and providing shareholder support services were as follows:
Service Class | $ 499 |
Service Class 2 | 5,632 |
| $ 6,131 |
Annual Report
Notes to Financial Statements - continued
6. Fees and Other Transactions with Affiliates - continued
Transfer Agent Fees. Fidelity Investments Institutional Operations Company, Inc. (FIIOC), an affiliate of FMR, is the Fund's transfer, dividend disbursing, and shareholder servicing agent. FIIOC receives an asset-based fee with respect to each class. Each class (with the exception of Investor Class) pays a transfer agent fee, excluding out of pocket expenses, equal to an annual rate of .07% of average net assets. Investor Class pays a monthly asset-based transfer agent fee of .15% of average net assets. In addition, FIIOC receives an asset-based fee of .0045% of average net assets for typesetting, printing and mailing of shareholder reports, except proxy statements. FIIOC voluntarily agreed to waive this fee for the period August 1, 2011 through December 31, 2011 (see Expense Reductions note). For the period, transfer agent fees for each class, including printing and out of pocket expenses, were as follows:
Initial Class | $ 8,738 |
Service Class | 405 |
Service Class 2 | 3,450 |
Investor Class | 34,940 |
| $ 47,533 |
Accounting and Security Lending Fees. Fidelity Service Company, Inc. (FSC), an affiliate of FMR, maintains the Fund's accounting records. The accounting fee is based on the level of average net assets for the month. Under a separate contract, FSC administers the security lending program. The security lending fee is based on the number and duration of lending transactions.
Brokerage Commissions. The Fund placed a portion of its portfolio transactions with brokerage firms which are affiliates of the investment adviser. The commissions paid to these affiliated firms were $1,308 for the period.
7. Committed Line of Credit.
The Fund participates with other funds managed by FMR or an affiliate in a $4.0 billion credit facility (the "line of credit") to be utilized for temporary or emergency purposes to fund shareholder redemptions or for other short-term liquidity purposes. The Fund has agreed to pay commitment fees on its pro-rata portion of the line of credit, which amounted to $87 and is reflected in Miscellaneous expenses on the Statement of Operations. During the period, there were no borrowings on this line of credit.
8. Security Lending.
The Fund lends portfolio securities through a lending agent from time to time in order to earn additional income. For equity securities, a lending agent is used and may loan securities to certain qualified borrowers, including Fidelity Capital Markets (FCM), a broker-dealer affiliated with the Fund. On the settlement date of the loan, the Fund receives collateral (in the form of U.S. Treasury obligations, letters of credit and/or cash) against the loaned securities and maintains collateral in an amount not less than 100% of the market value of the loaned securities during the period of the loan. The market value of the loaned securities is determined at the close of business of the Fund and any additional required collateral is delivered to the Fund on the next business day. If the borrower defaults on its obligation to return the securities loaned because of insolvency or other reasons, a fund could experience delays and costs in recovering the securities loaned or in gaining access to the collateral. Any cash collateral received is invested in the Fidelity Securities Lending Cash Central Fund. The value of loaned securities and cash collateral at period end are disclosed on the Fund's Statement of Assets and Liabilities. At period end, there were no security loans outstanding with FCM. Security lending income represents the income earned on investing cash collateral, less rebates paid to borrowers and any lending agent fees associated with the loan, plus any premium payments received for lending certain types of securities. Security lending income is presented in the Statement of Operations as a component of income from Fidelity Central Funds, and includes $39 from securities loaned to FCM.
9. Expense Reductions.
In addition to FIIOC waiving a portion of its transfer agent fees, FMR voluntarily agreed to reimburse each class to the extent annual operating expenses exceeded certain levels of average net assets as noted in the table below. Some expenses, for example interest expense, including commitment fees, are excluded from this reimbursement.
Annual Report
9. Expense Reductions - continued
Expenses were reimbursed and/or waived for the following classes during the period:
| Expense
Limitations | Reimbursement/Waiver |
Initial Class | .85% | $ 9,162 |
Service Class | .95% | 430 |
Service Class 2 | 1.10% | 3,528 |
Investor Class | .93% | 18,855 |
| | $ 31,975 |
Many of the brokers with whom FMR places trades on behalf of the Fund provided services to the Fund in addition to trade execution. These services included payments of certain expenses on behalf of the Fund totaling $1,673 for the period.
10. Share Transactions.
Transactions for each class of shares were as follows:
| Shares | Dollars |
Years ended December 31, | 2011 | 2010 | 2011 | 2010 |
Initial Class | | | | |
Shares sold | 431,203 | 260,041 | $ 6,122,430 | $ 3,046,011 |
Shares redeemed | (288,058) | (219,070) | (4,022,846) | (2,515,104) |
Net increase (decrease) | 143,145 | 40,971 | $ 2,099,584 | $ 530,907 |
Service Class | | | | |
Shares sold | - | - | $ - | $ - |
Shares redeemed | (12,847) | (30,783) | (176,853) | (358,163) |
Net increase (decrease) | (12,847) | (30,783) | $ (176,853) | $ (358,163) |
Service Class 2 | | | | |
Shares sold | 38,336 | 106,491 | $ 532,559 | $ 1,360,264 |
Shares redeemed | (127,122) | (63,429) | (1,689,914) | (719,641) |
Net increase (decrease) | (88,786) | 43,062 | $ (1,157,355) | $ 640,623 |
Investor Class | | | | |
Shares sold | 1,469,969 | 700,899 | $ 20,654,000 | $ 8,319,842 |
Shares redeemed | (794,269) | (256,737) | (10,596,545) | (2,967,654) |
Net increase (decrease) | 675,700 | 444,162 | $ 10,057,455 | $ 5,352,188 |
11. Other.
The Fund's organizational documents provide former and current trustees and officers with a limited indemnification against liabilities arising in connection with the performance of their duties to the Fund. In the normal course of business, the Fund may also enter into contracts that provide general indemnifications. The Fund's maximum exposure under these arrangements is unknown as this would be dependent on future claims that may be made against the Fund. The risk of material loss from such claims is considered remote.
At the end of the period, FMR or its affiliates were owners of record of 96% of the total shares outstanding of the Fund.
Annual Report
Report of Independent Registered Public Accounting Firm
To the Trustees of Variable Insurance Products Fund IV and the Shareholders of VIP Growth Stock Portfolio:
In our opinion, the accompanying statement of assets and liabilities, including the schedule of investments, and the related statements of operations and of changes in net assets and the financial highlights present fairly, in all material respects, the financial position of VIP Growth Stock Portfolio (a fund of Variable Insurance Products Fund IV) at December 31, 2011, the results of its operations for the year then ended, the changes in its net assets for each of the two years in the period then ended and the financial highlights for each of the five years in the period then ended, in conformity with accounting principles generally accepted in the United States of America. These financial statements and financial highlights (hereafter referred to as "financial statements") are the responsibility of the VIP Growth Stock Portfolio's management. Our responsibility is to express an opinion on these financial statements based on our audits. We conducted our audits of these financial statements in accordance with the standards of the Public Company Accounting Oversight Board (United States). Those standards require that we plan and perform the audit to obtain reasonable assurance about whether the financial statements are free of material misstatement. An audit includes examining, on a test basis, evidence supporting the amounts and disclosures in the financial statements, assessing the accounting principles used and significant estimates made by management, and evaluating the overall financial statement presentation. We believe that our audits, which included confirmation of securities at December 31, 2011 by correspondence with the custodian and brokers, provide a reasonable basis for our opinion.
/s/ PricewaterhouseCoopers LLP
PricewaterhouseCoopers LLP
Boston, Massachusetts
February 15, 2012
Annual Report
The Trustees, Members of the Advisory Board, and executive officers of the trust and fund, as applicable, are listed below. The Board of Trustees governs the fund and is responsible for protecting the interests of shareholders. The Trustees are experienced executives who meet periodically throughout the year to oversee the fund's activities, review contractual arrangements with companies that provide services to the fund, oversee management of the risks associated with such activities and contractual arrangements, and review the fund's performance. Except for James C. Curvey, each of the Trustees oversees 226 funds advised by FMR or an affiliate. Mr. Curvey oversees 429 funds advised by FMR or an affiliate.
The Trustees hold office without limit in time except that (a) any Trustee may resign; (b) any Trustee may be removed by written instrument, signed by at least two-thirds of the number of Trustees prior to such removal; (c) any Trustee who requests to be retired or who has become incapacitated by illness or injury may be retired by written instrument signed by a majority of the other Trustees; and (d) any Trustee may be removed at any special meeting of shareholders by a two-thirds vote of the outstanding voting securities of the trust. Each Trustee who is not an interested person (as defined in the 1940 Act) (Independent Trustee), shall retire not later than the last day of the calendar year in which his or her 75th birthday occurs. The Independent Trustees may waive this mandatory retirement age policy with respect to individual Trustees. The executive officers and Advisory Board Members hold office without limit in time, except that any officer and Advisory Board Member may resign or may be removed by a vote of a majority of the Trustees at any regular meeting or any special meeting of the Trustees. Except as indicated, each individual has held the office shown or other offices in the same company for the past five years.
Experience, Skills, Attributes, and Qualifications of the Fund's Trustees. The Governance and Nominating Committee has adopted a statement of policy that describes the experience, qualifications, attributes, and skills that are necessary and desirable for potential Independent Trustee candidates (Statement of Policy). The Board believes that each Trustee satisfied at the time he or she was initially elected or appointed a Trustee, and continues to satisfy, the standards contemplated by the Statement of Policy. The Governance and Nominating Committee also engages professional search firms to help identify potential Independent Trustee candidates who have the experience, qualifications, attributes, and skills consistent with the Statement of Policy. From time to time, additional criteria based on the composition and skills of the current Independent Trustees, as well as experience or skills that may be appropriate in light of future changes to board composition, business conditions, and regulatory or other developments, have also been considered by the professional search firms and the Governance and Nominating Committee. In addition, the Board takes into account the Trustees' commitment and participation in Board and committee meetings, as well as their leadership of standing and ad hoc committees throughout their tenure.
In determining that a particular Trustee was and continues to be qualified to serve as a Trustee, the Board has considered a variety of criteria, none of which, in isolation, was controlling. The Board believes that, collectively, the Trustees have balanced and diverse experience, qualifications, attributes, and skills, which allow the Board to operate effectively in governing the fund and protecting the interests of shareholders. Information about the specific experience, skills, attributes, and qualifications of each Trustee, which in each case led to the Board's conclusion that the Trustee should serve (or continue to serve) as a trustee of the fund, is provided below.
Board Structure and Oversight Function. James C. Curvey is an interested person (as defined in the 1940 Act) and currently serves as Acting Chairman. The Trustees have determined that an interested Chairman is appropriate and benefits shareholders because an interested Chairman has a personal and professional stake in the quality and continuity of services provided to the fund. Independent Trustees exercise their informed business judgment to appoint an individual of their choosing to serve as Chairman, regardless of whether the Trustee happens to be independent or a member of management. The Independent Trustees have determined that they can act independently and effectively without having an Independent Trustee serve as Chairman and that a key structural component for assuring that they are in a position to do so is for the Independent Trustees to constitute a substantial majority for the Board. The Independent Trustees also regularly meet in executive session. Ned C. Lautenbach serves as Chairman of the Independent Trustees and as such (i) acts as a liaison between the Independent Trustees and management with respect to matters important to the Independent Trustees and (ii) with management prepares agendas for Board meetings.
Fidelity funds are overseen by different Boards of Trustees. The fund's Board oversees Fidelity's equity and high income funds and another Board oversees Fidelity's investment-grade bond, money market, and asset allocation funds. The asset allocation funds may invest in Fidelity funds overseen by the fund's Board. The use of separate Boards, each with its own committee structure, allows the Trustees of each group of Fidelity funds to focus on the unique issues of the funds they oversee, including common research, investment, and operational issues. On occasion, the separate Boards establish joint committees to address issues of overlapping consequences for the Fidelity funds overseen by each Board.
The Trustees operate using a system of committees to facilitate the timely and efficient consideration of all matters of importance to the Trustees, the fund, and fund shareholders and to facilitate compliance with legal and regulatory requirements and oversight of the fund's activities and associated risks. The Board, acting through its committees, has charged FMR and its affiliates with (i) identifying events or circumstances the occurrence of which could have demonstrably adverse effects on the fund's business and/or reputation; (ii) implementing processes and controls to lessen the possibility that such events or circumstances occur or to mitigate the effects of such events or circumstances if they do occur; and (iii) creating and maintaining a system designed to evaluate continuously business and market conditions in order to facilitate the identification and implementation processes described in (i) and (ii) above. Because the day-to-day operations and activities of the fund are carried out by or through FMR, its affiliates and other service providers, the fund's exposure to risks is mitigated but not eliminated by the processes overseen by the Trustees. While each of the Board's committees has responsibility for overseeing different aspects of the fund's activities, oversight is exercised primarily through the Operations, Audit, and Compliance Committees. In addition, the Independent Trustees have worked with FMR to enhance the Board's oversight of investment and financial risks, legal and regulatory risks, technology risks, and operational risks, including the development of additional risk reporting to the Board. For example, a working group comprised of Independent Trustees and FMR has worked and continues to work to review the Fidelity funds' valuation-related activities, reporting and risk management. Appropriate personnel, including but not limited to the fund's Chief Compliance Officer (CCO), FMR's internal auditor, the independent accountants, the fund's Treasurer and portfolio management personnel, make periodic reports to the Board's committees, as appropriate, including an annual review of FMR's risk management program for the Fidelity funds. The responsibilities of each standing committee, including their oversight responsibilities, are described further under "Standing Committees of the Fund's Trustees."
Annual Report
The fund's Statement of Additional Information (SAI) includes more information about the Trustees. To request a free copy, call Fidelity at 1-877-208-0098.
Interested Trustees*:
Correspondence intended for each Trustee who is an interested person may be sent to Fidelity Investments, 82 Devonshire Street, Boston, Massachusetts 02109.
Name, Age; Principal Occupations and Other Relevant Experience+ |
James C. Curvey (76) |
| Year of Election or Appointment: 2007 Mr. Curvey is Trustee and Acting Chairman of the Board of Trustees of certain Trusts. Mr. Curvey also serves as Trustee (2007-present) of other investment companies advised by FMR. Mr. Curvey is a Director of Fidelity Investments Money Management, Inc. (2009-present), Director of Fidelity Research & Analysis Co. (2009-present) and Director of FMR and FMR Co., Inc. (2007-present). Mr. Curvey is also Vice Chairman (2007-present) and Director of FMR LLC. In addition, Mr. Curvey serves as an Overseer for the Boston Symphony Orchestra and a member of the Trustees of Villanova University. Previously, Mr. Curvey was the Vice Chairman (2006-2007) and Director (2000-2007) of FMR Corp. |
Ronald P. O'Hanley (54) |
| Year of Election or Appointment: 2011 Mr. O'Hanley is Director of FMR Co., Inc. (2010-present), Director of Fidelity Investments Money Management, Inc. (2010-present), Director of Fidelity Research & Analysis Company (2010-present), President of Fidelity Asset Management and Corporate Services and a member of Fidelity's Executive Committee (2010-present). Previously, Mr. O'Hanley served as President and Chief Executive Officer of BNY Mellon Asset Management (2007-2010). Mr. O'Hanley also served as Vice Chairman of Bank New York Mellon Corp. and a member of that firm's Executive Committee. Prior to the 2007 merger of The Bank of New York and Mellon Financial Corporation, he was Vice Chairman of Mellon Financial Corporation and President and Chief Executive Officer of Mellon Asset Management. He joined Mellon in February 1997. Mr. O'Hanley currently serves as Chairman of the Boston Public Library Foundation Board of Directors and sits on the Board of Directors of Beth Israel Deaconess Medical Center, the Board of Trustees of the Marine Biological Laboratory and the Advisory Board of the Maxwell School of Citizenship and Public Administration at Syracuse University. Mr. O'Hanley also chairs the Council on Asset Management for the Financial Services Roundtable and is a member of the Board of Directors of Institutional Investor's U.S. Institute. |
* Trustees have been determined to be "Interested Trustees" by virtue of, among other things, their affiliation with the trust or various entities under common control with FMR.
+ The information above includes each Trustee's principal occupation during the last five years and other information relating to the experience, attributes, and skills relevant to each Trustee's qualifications to serve as a Trustee, which led to the conclusion that each Trustee should serve as a Trustee for the fund.
Independent Trustees:
Correspondence intended for each Independent Trustee (that is, the Trustees other than the Interested Trustees) may be sent to Fidelity Investments, P.O. Box 55235, Boston, Massachusetts 02205-5235.
Name, Age; Principal Occupations and Other Relevant Experience+ |
Dennis J. Dirks (63) |
| Year of Election or Appointment: 2005 Prior to his retirement in May 2003, Mr. Dirks was Chief Operating Officer and a member of the Board of The Depository Trust & Clearing Corporation (DTCC). He also served as President, Chief Operating Officer, and Board member of The Depository Trust Company (DTC) and President and Board member of the National Securities Clearing Corporation (NSCC). In addition, Mr. Dirks served as Chief Executive Officer and Board member of the Government Securities Clearing Corporation, Chief Executive Officer and Board member of the Mortgage-Backed Securities Clearing Corporation, as a Trustee and a member of the Finance Committee of Manhattan College (2005-2008), and as a Trustee and a member of the Finance Committee of AHRC of Nassau County (2006-2008). Mr. Dirks is a member of the Independent Directors Council (IDC) Governing Council (2010-present) and Board of Directors for The Brookville Center for Children's Services, Inc. (2009-present). |
Alan J. Lacy (58) |
| Year of Election or Appointment: 2008 Mr. Lacy serves as Senior Adviser (2007-present) of Oak Hill Capital Partners, L.P. (private equity). Mr. Lacy also served as Chief Executive Officer (2000-2005) and Vice Chairman (2005-2006) of Sears Holdings Corporation and Sears, Roebuck and Co. (retail). In addition, Mr. Lacy serves as a member of the Board of Directors of Dave & Buster's, Inc. (restaurant and entertainment complexes, 2010-present), The Hillman Companies, Inc. (hardware wholesalers, 2010-present), and Bristol-Myers Squibb Company (global pharmaceuticals, 2007-present). Mr. Lacy is a member of the Board of Trustees of The National Parks Conservation Association (2006-present). Previously, Mr. Lacy served as Chairman of the Board of Trustees of the National Parks Conservation Association (2008-2011) and as a member of the Board of Directors for the Western Union Company (global money transfer, 2006-2011). |
Ned C. Lautenbach (67) |
| Year of Election or Appointment: 2000 Mr. Lautenbach is Chairman of the Independent Trustees of the Equity and High Income Funds (2006-present). Mr. Lautenbach currently serves as the Lead Director of the Eaton Corporation Board of Directors (diversified industrial, 1997-present). Mr. Lautenbach is also a member of the Board of Directors of the Philharmonic Center for the Arts in Naples, Florida (1999-present); a member of the Board of Trustees of Fairfield University (2005-present); and a member of the Council on Foreign Relations (1994-present). Previously, Mr. Lautenbach was a Partner/Advisory Partner at Clayton, Dubilier & Rice, LLC (private equity investment, 1998-2010), as well as a Director of Sony Corporation (2006-2007). |
Joseph Mauriello (67) |
| Year of Election or Appointment: 2008 Prior to his retirement in January 2006, Mr. Mauriello served in numerous senior management positions including Deputy Chairman and Chief Operating Officer (2004-2005), and Vice Chairman of Financial Services (2002-2004) of KPMG LLP US (professional services, 1965-2005). Mr. Mauriello currently serves as a member of the Board of Directors of XL Group plc. (global insurance and re-insurance, 2006-present) and of Arcadia Resources Inc. (health care services and products, 2007-present). Previously, Mr. Mauriello served as a Director of the Hamilton Funds of the Bank of New York (2006-2007). |
Robert W. Selander (61) |
| Year of Election or Appointment: 2011 Previously, Mr. Selander served as a Member of the Advisory Board of Fidelity's Equity and High Income Funds (2011), Executive Vice Chairman (2010), Chief Executive Officer (2009-2010), and President and Chief Executive Officer (1997-2009) of Mastercard, Inc. |
Cornelia M. Small (67) |
| Year of Election or Appointment: 2005 Ms. Small is a member of the Board of Directors of the Teagle Foundation (2009-present). Ms. Small is also a member of the Investment Committee, and Chair (2008-present) and a member of the Board of Trustees of Smith College. In addition, Ms. Small serves on the Investment Committee of the Berkshire Taconic Community Foundation (2008-present). Previously, Ms. Small served as Chairperson of the Investment Committee (2002-2008) of Smith College. In addition, Ms. Small served as Chief Investment Officer, Director of Global Equity Investments, and a member of the Board of Directors of Scudder, Stevens & Clark and Scudder Kemper Investments. |
William S. Stavropoulos (72) |
| Year of Election or Appointment: 2001 Mr. Stavropoulos is Vice Chairman of the Independent Trustees of the Equity and High Income Funds (2006-present). Mr. Stavropoulos serves as President and Founder of the Michigan Baseball Foundation, the Great Lakes Loons (2007-present). Mr. Stavropoulos is Chairman Emeritus of the Board of Directors of The Dow Chemical Company, where he previously served in numerous senior management positions, including President, CEO (1995-2000; 2002-2004), Chairman of the Executive Committee (2000-2006), and as a member of the Board of Directors (1990-2006). Currently, Mr. Stavropoulos is Chairman of Univar (global distributor of commodity and specialty chemicals, 2010-present), a Director of Teradata Corporation (data warehousing and technology solutions, 2008-present), Chemical Financial Corporation, Maersk Inc. (industrial conglomerate), Tyco International, Inc. (multinational manufacturing and services, 2007-present), and a member of the Advisory Board for Metalmark Capital (private equity investment, 2005-present). Mr. Stavropoulos is a special advisor to Clayton, Dubilier & Rice, LLC (private equity investment). In addition, Mr. Stavropoulos is a member of the University of Notre Dame Advisory Council for the College of Science. |
David M. Thomas (62) |
| Year of Election or Appointment: 2008 Previously, Mr. Thomas served as Executive Chairman (2005-2006) and Chairman and Chief Executive Officer (2000-2005) of IMS Health, Inc. (pharmaceutical and healthcare information solutions). In addition, Mr. Thomas serves as a member of the Board of Directors of Fortune Brands, Inc. (consumer products), and Interpublic Group of Companies, Inc. (marketing communication, 2004-present). |
Michael E. Wiley (61) |
| Year of Election or Appointment: 2008 Mr. Wiley also serves as a Director of Asia Pacific Exploration Consolidated (international oil and gas exploration and production, 2008-present). Mr. Wiley serves as a Director of Tesoro Corporation (independent oil refiner and marketer, 2005-present), and a Director of Bill Barrett Corporation (exploration and production, 2005-present). In addition, Mr. Wiley also serves as a Director of Post Oak Bank (privately-held bank, 2004-present). Previously, Mr. Wiley served as a member of the Board of Trustees of the University of Tulsa (2000-2006; 2007-2010), as a Senior Energy Advisor of Katzenbach Partners, LLC (consulting, 2006-2007), as an Advisory Director of Riverstone Holdings (private investment), Chairman, President, and CEO of Baker Hughes, Inc. (oilfield services, 2000-2004), and as Director of Spinnaker Exploration Company (exploration and production, 2001-2005). |
+ The information above includes each Trustee's principal occupation during the last five years and other information relating to the experience, attributes, and skills relevant to each Trustee's qualifications to serve as a Trustee, which led to the conclusion that each Trustee should serve as a Trustee for the fund.
Advisory Board Members and Executive Officers:
Correspondence intended for each executive officer, Edward C. Johnson 3d, and Peter S. Lynch may be sent to Fidelity Investments, 82 Devonshire Street, Boston, Massachusetts 02109.
Name, Age; Principal Occupation |
Edward C. Johnson 3d (81) |
| Year of Election or Appointment: 2011 Member of the Advisory Board of Fidelity's Equity and High Income Funds. Mr. Johnson serves as Chief Executive Officer, Chairman, and a Director of FMR LLC, and also serves as Chairman and Director of FIL Limited. Previously, Mr. Johnson served as a Trustee and Chairman of the Board of certain Fidelity Trusts, Chairman and a Director of FMR, Chairman and a Director of FMR Co., Inc., and President of FMR LLC (2006-2007). |
Peter S. Lynch (67) |
| Year of Election or Appointment: 2003 Member of the Advisory Board of Fidelity's Equity and High Income Funds. Mr. Lynch is Vice Chairman and a Director of FMR and FMR Co., Inc. In addition, Mr. Lynch serves as a Trustee of Boston College and as the Chairman of the Inner-City Scholarship Fund. Previously, Mr. Lynch served on the Special Olympics International Board of Directors (1997-2006). |
Kenneth B. Robins (42) |
| Year of Election or Appointment: 2008 President and Treasurer of Fidelity's Equity and High Income Funds. Mr. Robins also serves as President and Treasurer (2010-present) and Assistant Treasurer (2009-present) of other Fidelity funds and is an employee of Fidelity Investments (2004-present). Previously, Mr. Robins served as Deputy Treasurer of the Fidelity funds (2005-2008) and Treasurer and Chief Financial Officer of The North Carolina Capital Management Trust: Cash and Term Portfolios (2006-2008). |
Bruce T. Herring (46) |
| Year of Election or Appointment: 2006 Vice President of certain Equity Funds. Mr. Herring also serves as President of Fidelity Research & Analysis Company (2010-present), Chief Investment Officer and Director of Fidelity Management & Research (U.K.) Inc. (2010-present) and Group Chief Investments Officer of FMR. Previously, Mr. Herring served as Vice President (2005-2006) and Senior Vice President (2006-2007) of Fidelity Management & Research Company, Vice President of FMR Co., Inc. (2001-2007) and as a portfolio manager for Fidelity U.S. Equity Funds. |
Brian B. Hogan (47) |
| Year of Election or Appointment: 2009 Vice President of Equity and High Income Funds. Mr. Hogan also serves as President of FMR's Equity Division (2009-present). Previously, Mr. Hogan served as Senior Vice President, Equity Research of FMR (2006-2009) and as a portfolio manager. |
Christopher S. Bartel (40) |
| Year of Election or Appointment: 2009 Vice President of Fidelity's Sector and Real Estate Equity Funds. Mr. Bartel also serves as Senior Vice President of Equity Research (2009-present). Previously, Mr. Bartel served as Managing Director of Research (2006-2009) and an analyst and portfolio manager (2000-2006). |
Scott C. Goebel (43) |
| Year of Election or Appointment: 2008 Secretary and Chief Legal Officer (CLO) of the Fidelity funds. Mr. Goebel also serves as Secretary of Fidelity Investments Money Management, Inc. (FIMM) (2010-present) and Fidelity Research and Analysis Company (FRAC) (2010-present); Secretary and CLO of The North Carolina Capital Management Trust: Cash and Term Portfolios (2008-present); General Counsel, Secretary, and Senior Vice President of FMR (2008-present) and FMR Co., Inc. (2008-present); employed by FMR LLC or an affiliate (2001-present); Chief Legal Officer of Fidelity Management & Research (Hong Kong) Limited (2008-present) and Assistant Secretary of Fidelity Management & Research (Japan) Inc. (2008-present), and Fidelity Management & Research (U.K.) Inc. (2008-present). Previously, Mr. Goebel served as Assistant Secretary of FIMM (2008-2010), FRAC (2008-2010), and the Funds (2007-2008) and as Vice President and Secretary of Fidelity Distributors Corporation (FDC) (2005-2007). |
William C. Coffey (42) |
| Year of Election or Appointment: 2009 Assistant Secretary of Fidelity's Equity and High Income Funds. Mr. Coffey also serves as Senior Vice President and Deputy General Counsel of FMR LLC (2010-present), and is an employee of Fidelity Investments. Previously, Mr. Coffey served as Vice President and Associate General Counsel of FMR LLC (2005-2009). |
Holly C. Laurent (57) |
| Year of Election or Appointment: 2008 Anti-Money Laundering (AML) Officer of the Fidelity funds. Ms. Laurent also serves as AML Officer of The North Carolina Capital Management Trust: Cash and Term Portfolios (2008-present) and is an employee of Fidelity Investments. Previously, Ms. Laurent was Senior Vice President and Head of Legal for Fidelity Business Services India Pvt. Ltd. (2006-2008), and Senior Vice President, Deputy General Counsel and Group Head for FMR LLC (2005-2006). |
Christine Reynolds (53) |
| Year of Election or Appointment: 2008 Chief Financial Officer of the Fidelity funds. Ms. Reynolds became President of Fidelity Pricing and Cash Management Services (FPCMS) in August 2008. Ms. Reynolds served as Chief Operating Officer of FPCMS (2007-2008). Previously, Ms. Reynolds served as President, Treasurer, and Anti-Money Laundering officer of the Fidelity funds (2004-2007). |
Kenneth A. Rathgeber (64) |
| Year of Election or Appointment: 2004 Chief Compliance Officer of Fidelity's Equity and High Income Funds. Mr. Rathgeber is Chief Compliance Officer of Fidelity Management & Research (Hong Kong) Limited (2008-present), Fidelity Management & Research (Japan) Inc. (2008-present), FMR (2005-present), FMR Co., Inc. (2005-present), Fidelity Management & Research (U.K.) Inc. (2005-present), Fidelity Research & Analysis Company (2005-present), Fidelity Investments Money Management, Inc. (2005-present), Pyramis Global Advisors, LLC (2005-present), and Strategic Advisers, Inc. (2005-present). |
Jeffrey S. Christian (50) |
| Year of Election or Appointment: 2009 Deputy Treasurer of the Fidelity funds. Mr. Christian is an employee of Fidelity Investments. Previously, Mr. Christian served as Chief Financial Officer (2008-2009) of certain Fidelity funds and Senior Vice President of Fidelity Pricing and Cash Management Services (FPCMS) (2004-2009). |
Joseph F. Zambello (54) |
| Year of Election or Appointment: 2011 Deputy Treasurer of the Fidelity funds. Mr. Zambello is an employee of Fidelity Investments. Previously, Mr. Zambello served as Vice President of FMR's Program Management Group (2009-2011) and Vice President of the Transfer Agent Oversight Group (2005-2009). |
Adrien E. Deberghes (44) |
| Year of Election or Appointment: 2008 Deputy Treasurer of Fidelity's Equity and High Income Funds. Mr. Deberghes also serves as Vice President and Assistant Treasurer of Fidelity Rutland Square Trust II and Fidelity Commonwealth Trust II (2011-present), Assistant Treasurer of other Fidelity funds (2010-present), and is an employee of Fidelity Investments (2008-present). Previously, Mr. Deberghes served as Senior Vice President of Mutual Fund Administration at State Street Corporation (2007-2008), Senior Director of Mutual Fund Administration at Investors Bank & Trust (2005-2007), and Director of Finance for Dunkin' Brands (2000-2005). |
Name, Age; Principal Occupation |
Stephanie J. Dorsey (42) |
| Year of Election or Appointment: 2010 Assistant Treasurer of Fidelity's Equity and High Income Funds. Ms. Dorsey also serves as Deputy Treasurer of other Fidelity funds (2008-present) and is an employee of Fidelity Investments (2008-present). Previously, Ms. Dorsey served as Treasurer (2004-2008) of the JPMorgan Mutual Funds and Vice President (2004-2008) of JPMorgan Chase Bank. |
John R. Hebble (53) |
| Year of Election or Appointment: 2009 Assistant Treasurer of Fidelity's Equity and High Income Funds. Mr. Hebble also serves as President (2011-present), Treasurer, and Chief Financial Officer of The North Carolina Capital Management Trust: Cash and Term Portfolios (2008-present), President and Treasurer of other Fidelity funds (2008-present) and is an employee of Fidelity Investments. |
Gary W. Ryan (53) |
| Year of Election or Appointment: 2005 Assistant Treasurer of the Fidelity funds. Mr. Ryan is an employee of Fidelity Investments. Previously, Mr. Ryan served as Vice President of Fund Reporting in Fidelity Pricing and Cash Management Services (FPCMS) (1999-2005). |
Jonathan Davis (43) |
| Year of Election or Appointment: 2010 Assistant Treasurer of the Fidelity funds. Mr. Davis is also Assistant Treasurer of Fidelity Rutland Square Trust II and Fidelity Commonwealth Trust II. Mr. Davis is an employee of Fidelity Investments. Previously, Mr. Davis served as Vice President and Associate General Counsel of FMR LLC (2003-2010). |
Annual Report
Board Approval of Investment Advisory Contracts and Management Fees
VIP Growth Stock Portfolio
Each year, the Board of Trustees, including the Independent Trustees (together, the Board), votes on the renewal of the management contract and sub-advisory agreements (together, the Advisory Contracts) for the fund. The Board, assisted by the advice of fund counsel and Independent Trustees' counsel, requests and considers a broad range of information relevant to the renewal of the Advisory Contracts throughout the year.
The Board meets regularly and considers at each of its meetings factors that are relevant to its annual consideration of the renewal of the fund's Advisory Contracts, including the services and support provided to the fund and its shareholders. The Board has established various standing committees, each composed of Independent Trustees with varying backgrounds, to which the Board has assigned specific subject matter responsibilities in order to enhance effective decision-making by the Board. The Board, acting directly and through its Committees, requests and receives information concerning the annual consideration of the renewal of the fund's Advisory Contracts. The Board also meets as needed to consider matters specifically related to the Board's annual consideration of the renewal of Advisory Contracts. Members of the Board may also meet with trustees of other Fidelity funds through ad hoc joint committees to discuss certain matters relevant to the Fidelity funds.
At its July 2011 meeting, the Board of Trustees, including the Independent Trustees, unanimously determined to renew the fund's Advisory Contracts. In reaching its determination, the Board considered all factors it believed relevant, including (i) the nature, extent, and quality of the services to be provided to the fund and its shareholders (including the investment performance of the fund); (ii) the competitiveness of the fund's management fee and total expense ratio; (iii) the total costs of the services to be provided by and the profits to be realized by Fidelity from its relationship with the fund; (iv) the extent to which economies of scale would be realized as the fund grows; and (v) whether fee levels reflect these economies of scale, if any, for the benefit of fund shareholders.
In considering whether to renew the Advisory Contracts for the fund, the Board reached a determination, with the assistance of fund counsel and Independent Trustees' counsel and through the exercise of its business judgment, that the renewal of the Advisory Contracts is in the best interests of the fund and its shareholders and that the compensation payable under the Advisory Contracts is fair and reasonable. The Board's decision to renew the Advisory Contracts was not based on any single factor, but rather was based on a comprehensive consideration of all the information provided to the Board at its meetings throughout the year. The Board, in reaching its determination to renew the Advisory Contracts, is aware that shareholders in the fund have a broad range of investment choices available to them, including a wide choice among mutual funds offered by Fidelity's competitors, and that the fund's shareholders, who have the opportunity to review and weigh the disclosure provided by the fund in its prospectus and other public disclosures, have chosen to invest in this fund, managed by Fidelity.
Nature, Extent, and Quality of Services Provided. The Board considered the staffing within the investment adviser, FMR, and the sub-advisers (together, the Investment Advisers), including the backgrounds of the fund's investment personnel and the fund's investment objective and discipline. The Independent Trustees also had discussions with senior management of Fidelity's investment operations and investment groups. The Board considered the structure of the portfolio manager compensation program and whether this structure provides appropriate incentives to act in the best interests of the fund.
Resources Dedicated to Investment Management and Support Services. The Board and the Fund Oversight and Research Committees reviewed the general qualifications and capabilities of the Investment Advisers' investment staff, including its size, education, experience, and resources, as well as the Investment Advisers' approach to recruiting, training, managing, and compensating investment personnel. The Board also noted that FMR has devoted increased resources to non-U.S. offices. The Board noted that Fidelity's analysts have extensive resources, tools and capabilities which allow them to conduct sophisticated quantitative and fundamental analysis, as well as credit analysis of issuers, counterparties and enhancers. The Board also believes that Fidelity's investment professionals have sufficient access to global information and data so as to provide competitive investment results over time, and that those professionals also have access to sophisticated tools which permit them to assess portfolio construction and risk and performance attribution characteristics continuously, as well as to transmit new information and research conclusions rapidly around the world. Additionally, in their deliberations, the Board considered the Investment Advisers' trading capabilities and resources which are an integral part of the investment management process.
Shareholder and Administrative Services. The Board considered (i) the nature, extent, quality, and cost of advisory, administrative, and shareholder services performed by the Investment Advisers and their affiliates under the Advisory Contracts and under separate agreements covering transfer agency, pricing and bookkeeping, and securities lending services for the fund; (ii) the nature and extent of the investment adviser's supervision of third party service providers, principally custodians and subcustodians; and (iii) the resources devoted to, and the record of compliance with, the fund's compliance policies and procedures. The Board also reviewed the allocation of fund brokerage, including allocations to brokers affiliated with the Investment Advisers, the use of brokerage commissions to pay fund expenses, and the use of "soft" commission dollars to pay for research services.
The Board noted that the growth of fund assets over time across the complex allows Fidelity to reinvest in the development of services designed to enhance the value or convenience of the Fidelity funds as investment vehicles. These services include 24-hour access to account information and market information through telephone representatives and over the Internet, investor education materials and asset allocation tools, and the expanded availability of Fidelity Investor Centers, with 35 new branches opening since 2010.
Annual Report
Investment in a Large Fund Family. The Board considered the benefits to shareholders of investing in a Fidelity fund, including the benefits of investing in a fund that is part of a large family of funds offering a variety of investment disciplines and providing a large variety of mutual fund investor services. The Board noted that Fidelity had taken, or had made recommendations that resulted in the Fidelity funds taking, a number of actions over the previous year that benefited particular funds, including (i) continuing to dedicate additional resources to investment research and support of the senior management team that oversees asset management; (ii) rationalizing product lines through the mergers of six funds into other funds; (iii) continuing to migrate the Freedom Funds to dedicated lower cost underlying funds; (iv) obtaining shareholder approval to broaden the investment strategies for Fidelity Consumer Finance Portfolio, Fidelity Emerging Asia Fund, and Fidelity Environment and Alternative Energy Portfolio; (v) contractually agreeing to reduce the management fees and impose other expense limitations on Spartan 500 Index Fund and U.S. Bond Index Fund in connection with launching new institutional classes of these funds; (vi) changing the name, primary and supplemental benchmarks, and investment policies of Fidelity Global Strategies Fund to support the fund's flexible investment mandate and global orientation; and (vii) reducing the transfer agency account fee rates on certain accounts.
Investment Performance. The Board considered whether the fund has operated in accordance with its investment objective, as well as its record of compliance with its investment restrictions. It also reviewed the fund's absolute investment performance for each class, as well as the fund's relative investment performance for each class measured over multiple periods against (i) a broad-based securities market index, and (ii) a peer group of mutual funds deemed appropriate by Fidelity and reviewed by the Board. The following charts considered by the Board show, over the one-, three-, and five-year periods ended December 31, 2010, the cumulative total returns of Initial Class and Service Class 2 of the fund, the cumulative total returns of a broad-based securities market index ("benchmark"), and a range of cumulative total returns of a peer group of mutual funds identified by Morningstar, Inc. as having an investment style similar to that of the fund based on underlying portfolio holdings. The returns of Initial Class and Service Class 2 show the performance of the highest and lowest performing classes, respectively (based on five-year performance). The box within each chart shows the 25th percentile return (bottom of box) and the 75th percentile return (top of box) of the peer group. Returns shown above the box are in the first quartile and returns shown below the box are in the fourth quartile. The percentage beaten numbers noted below each chart correspond to the percentile box and represent the percentage of funds in the peer group whose performance was equal to or lower than that of the class indicated.
VIP Growth Stock Portfolio
The Board reviewed the fund's relative investment performance against its peer group and noted that the performance of Initial Class of the fund was in the first quartile for the one-year period and the second quartile for the three- and five-year periods. The Board also noted that the investment performance of the fund was lower than its benchmark for the three- and five-year periods, although the one-year total return of Initial Class compared favorably to its benchmark. The Board considered that the variations in performance among the fund's classes reflect the variations in class expenses, which result in lower performance for higher expense classes. The Board also reviewed the fund's performance since inception as well as performance in the current year.
Based on its review, the Board concluded that the nature, extent, and quality of services provided to the fund under the Advisory Contracts should benefit the fund's shareholders.
Annual Report
Board Approval of Investment Advisory Contracts and Management Fees - continued
Competitiveness of Management Fee and Total Expense Ratio. The Board considered the fund's management fee and total expense ratio compared to "mapped groups" of competitive funds and classes. Fidelity creates "mapped groups" by combining similar Lipper investment objective categories that have comparable management fee characteristics. Combining Lipper investment objective categories aids the Board's management fee and total expense ratio comparisons by broadening the competitive group used for comparison and by reducing the number of universes to which various Fidelity funds are compared.
Management Fee. The Board considered two proprietary management fee comparisons for the 12-month periods shown in the chart below. The group of Lipper funds used by the Board for management fee comparisons is referred to below as the "Total Mapped Group." The Total Mapped Group comparison focuses on a fund's standing relative to the total universe of comparable funds available to investors in terms of gross management fees before expense reimbursements or caps. "TMG %" represents the percentage of funds in the Total Mapped Group that had management fees that were lower than the fund's. For example, a TMG % of 10% means that 90% of the funds in the Total Mapped Group had higher management fees than the fund. The "Asset-Size Peer Group" (ASPG) comparison focuses on a fund's standing relative to non-Fidelity funds similar in size to the fund within the Total Mapped Group. The ASPG represents at least 15% of the funds in the Total Mapped Group with comparable asset size and management fee characteristics, subject to a minimum of 50 funds (or all funds in the Total Mapped Group if fewer than 50). Additional information, such as the ASPG quartile in which the fund's management fee ranked, is also included in the chart and considered by the Board.
VIP Growth Stock Portfolio
The Board noted that the fund's management fee ranked below the median of its Total Mapped Group and below the median of its ASPG for 2010.
Based on its review, the Board concluded that the fund's management fee is fair and reasonable in light of the services that the fund receives and the other factors considered.
Total Expense Ratio. In its review of each class's total expense ratio, the Board considered the fund's management fee as well as other fund or class expenses, as applicable, such as transfer agent fees, pricing and bookkeeping fees, fund-paid 12b-1 fees, and custodial, legal, and audit fees. The Board also noted the effects of any waivers and reimbursements on fees and expenses. As part of its review, the Board also considered the current and historical total expense ratios of each class of the fund compared to competitive fund median expenses. Each class of the fund is compared to those funds and classes in the Total Mapped Group (used by the Board for management fee comparisons) that have a similar sales load structure.
The Board noted that the total expense ratio of each of Initial Class and Investor Class ranked below its competitive median for 2010 and the total expense ratio of each of Service Class and Service Class 2 ranked above its competitive median for 2010. The Board considered that various factors, including 12b-1 fees, positive or negative performance adjustments, and relatively higher other expenses in the case of small fund size, can affect total expense ratios. The Board also noted that Investor Class has higher transfer agent fees than traditional variable annuity classes because it is designed for lower cost annuity products, where the majority of servicing costs are incorporated into the funds' total expense ratios rather than being paid at the annuity level. The Board noted that the fund offers multiple classes, each of which has a different 12b-1 fee structure, and that the multiple structures are intended to offer a range of pricing options for the intermediary market. The Board also noted that the total expense ratios of the classes vary primarily by the level of their 12b-1 fees, although differences in transfer agent fees may also cause expenses to vary from class to class.
Annual Report
Fees Charged to Other Fidelity Clients. The Board also considered Fidelity fee structures and other information with respect to clients of FMR and its affiliates, such as other mutual funds advised or subadvised by FMR or its affiliates, pension plan clients, and other institutional clients. In March 2010, the Board created an ad hoc joint committee with the board of other Fidelity funds (the Committee) to review and compare Fidelity's institutional investment advisory business with its business of providing services to the Fidelity funds, including the differences in services provided, fees charged, and costs incurred, as well as competition in their respective marketplaces.
Based on its review of total expense ratios and fees charged to other Fidelity clients, the Board concluded that the total expense ratio of each class of the fund was reasonable, although in some cases above the median of the universe presented for comparison, in light of the services that the fund and its shareholders receive and the other factors considered, including the findings of the Committee.
Costs of the Services and Profitability. The Board considered the revenues earned and the expenses incurred by Fidelity in conducting the business of developing, marketing, distributing, managing, administering and servicing the fund and its shareholders. The Board also considered the level of Fidelity's profits in respect of all the Fidelity funds.
On an annual basis, FMR presents to the Board Fidelity's profitability for the fund. Fidelity calculates the profitability for each fund, as well as aggregate profitability for groups of Fidelity funds and all Fidelity funds, using a series of detailed revenue and cost allocation methodologies which originate with the books and records of Fidelity on which Fidelity's audited financial statements are based. The Audit Committee of the Board reviews any significant changes from the prior year's methodologies.
PricewaterhouseCoopers LLP (PwC), independent registered public accounting firm and auditor to Fidelity and certain Fidelity funds, has been engaged annually by the Board as part of the Board's assessment of Fidelity's profitability analysis. PwC's engagement includes the review and assessment of Fidelity's methodologies used in determining the revenues and expenses attributable to Fidelity's mutual fund business, and completion of agreed-upon procedures surrounding the mathematical accuracy of fund profitability and its conformity to allocation methodologies. After considering PwC's reports issued under the engagement and information provided by Fidelity, the Board concluded that while other allocation methods may also be reasonable, Fidelity's profitability methodologies are reasonable in all material respects.
The Board also reviewed Fidelity's non-fund businesses and fall-out benefits related to the mutual fund business as well as cases where Fidelity's affiliates may benefit from or be related to the fund's business.
The Board considered the costs of the services provided by and the profits realized by Fidelity in connection with the operation of the fund and was satisfied that the profitability was not excessive in the circumstances.
Economies of Scale. The Board considered whether there have been economies of scale in respect of the management of the Fidelity funds, whether the Fidelity funds (including the fund) have appropriately benefited from any such economies of scale, and whether there is potential for realization of any further economies of scale. The Board considered the extent to which the fund will benefit from economies of scale through increased services to the fund, through waivers or reimbursements, or through fee or expense reductions. The Board also noted that in 2009, it and the board of other Fidelity funds created an ad hoc committee (the Economies of Scale Committee) to analyze whether FMR attains economies of scale in respect of the management and servicing of the Fidelity funds, whether the Fidelity funds have appropriately benefited from such economies of scale, and whether there is potential for realization of any further economies of scale.
The Board recognized that the fund's management contract incorporates a "group fee" structure, which provides for lower group fee rates as total fund assets under FMR's management increase, and for higher group fee rates as total fund assets under FMR's management decrease. FMR calculates the group fee rates based on a tiered asset "breakpoint" schedule that varies based on asset class. The Board considered that the group fee is designed to deliver the benefits of economies of scale to fund shareholders when total Fidelity fund assets increase, even if assets of any particular fund are unchanged or have declined, because some portion of Fidelity's costs are attributable to services provided to all Fidelity funds, and all funds benefit if those costs can be allocated among more assets. The Board concluded that, given the group fee structure, fund shareholders will benefit from lower management fees as assets under FMR's management increase at the fund complex level, regardless of whether Fidelity achieves any such economies of scale.
The Board concluded, taking into account the analysis of the Economies of Scale Committee, that any potential economies of scale are being appropriately shared between fund shareholders and Fidelity.
Additional Information Requested by the Board. In order to develop fully the factual basis for consideration of the Fidelity funds' Advisory Contracts, the Board requested and received additional information on certain topics, including (i) fund performance trends, actions to be taken by FMR to improve certain funds' overall performance, and Fidelity's long-term strategies for certain funds; (ii) portfolio manager changes that have occurred during the past year and length of portfolio manager tenure for different categories of funds over time; (iii) Fidelity's compensation structure for portfolio managers and other key personnel and strategies for attracting and retaining non-investment personnel; (iv) the amount of the investment that each portfolio manager has made in the Fidelity fund(s) that he or she manages; (v) historical trends in Fidelity's realization of fall-out benefits; (vi) Fidelity's group fee structures and the rationale for the individual fee rates of certain funds; (vii) fund profitability methodology and the impact of certain factors on fund profitability results; (viii) trends regarding industry use of performance fee structures and Fidelity's compliance practices with respect to performance adjustment calculations; (ix) the fee structures in place for certain other Fidelity clients; and (x) explanations regarding the relative total expense ratios of certain funds and classes, total expense competitive trends, and actions that might be taken by FMR to reduce total expense ratios for certain funds and classes.
Annual Report
Board Approval of Investment Advisory Contracts and Management Fees - continued
Based on its evaluation of all of the conclusions noted above, and after considering all factors it believed relevant, the Board ultimately concluded that the advisory fee structures are fair and reasonable, and that the fund's Advisory Contracts should be renewed.
Annual Report
Investment Adviser
Fidelity Management & Research Company
Boston, MA
Investment Sub-Advisers
FMR Co., Inc.
Fidelity Management & Research (U.K.) Inc.
Fidelity Management & Research (Hong Kong) Limited
Fidelity Management & Research (Japan) Inc.
General Distributor
Fidelity Distributors Corporation
Boston, MA
Transfer and Service Agents
Fidelity Investments Institutional Operations Company, Inc.
Boston, MA
Fidelity Service Company, Inc.
Boston, MA
Custodian
The Bank of New York Mellon
New York, NY
VIPGR-ANN-0212
1.781993.109
Fidelity® Variable Insurance Products:
Health Care Portfolio
Annual Report
December 31, 2011
Contents
Performance | (Click Here) | How the fund has done over time. |
Management's Discussion of Fund Performance | (Click Here) | The Portfolio Manager's review of fund performance and strategy. |
Shareholder Expense Example | (Click Here) | An example of shareholder expenses. |
Investment Changes | (Click Here) | A summary of major shifts in the fund's investments over the past six months. |
Investments | (Click Here) | A complete list of the fund's investments with their market values. |
Financial Statements | (Click Here) | Statements of assets and liabilities, operations, and changes in net assets, as well as financial highlights. |
Notes | (Click Here) | Notes to the financial statements. |
Report of Independent Registered Public Accounting Firm | (Click Here) | |
Trustees and Officers | (Click Here) | |
Distributions | (Click Here) | |
Board Approval of Investment Advisory Contracts and Management Fees | (Click Here) | |
To view a fund's proxy voting guidelines and proxy voting record for the 12-month period ended June 30, visit http://www.fidelity.com/proxyvotingresults or visit the Securities and Exchange Commission's (SEC) web site at http://www.sec.gov. You may also call 1-877-208-0098 to request a free copy of the proxy voting guidelines.
Fidelity Variable Insurance Products are separate account options which are purchased through a variable insurance contract.
Standard & Poor's, S&P and S&P 500 are registered service marks of The McGraw-Hill Companies, Inc. and have been licensed for use by Fidelity Distributors Corporation.
Other third party marks appearing herein are the property of their respective owners.
All other marks appearing herein are registered or unregistered trademarks or service marks of FMR LLC or an affiliated company.
This report and the financial statements contained herein are submitted for the general information of the shareholders of the fund. This report is not authorized for distribution to prospective investors in the fund unless preceded or accompanied by an effective prospectus.
A fund files its complete schedule of portfolio holdings with the SEC for the first and third quarters of each fiscal year on Form N-Q. Forms N-Q are available on the SEC's web site at http://www.sec.gov. A fund's Forms N-Q may be reviewed and copied at the SEC's Public Reference Room in Washington, DC. Information regarding the operation of the SEC's Public Reference Room may be obtained by calling 1-800-SEC-0330. For a complete list of the fund's portfolio holdings, view the most recent holdings listing, semiannual report, or annual report on Fidelity's web site at http://www.fidelity.com, http://www.advisor.fidelity.com, or http://www.401k.com, as applicable.
NOT FDIC INSURED • MAY LOSE VALUE • NO BANK GUARANTEE
Neither the fund nor Fidelity Distributors Corporation is a bank.
Annual Report
Average annual total return reflects the change in the value of an investment, assuming reinvestment of the class' distributions from dividend income and capital gains (the profits earned upon the sale of securities that have grown in value, if any) and assuming a constant rate of performance each year. During periods of reimbursement by Fidelity, a fund's total return will be greater than it would be had the reimbursement not occurred. Performance numbers are net of all underlying fund operating expenses, but do not include any insurance charges imposed by your insurance company's separate account. If performance information included the effect of these additional charges, the total returns would have been lower. How a fund did yesterday is no guarantee of how it will do tomorrow.
Average Annual Total Returns
Periods ended December 31, 2011 | Past 1
year | Past 5
years | Past 10
years |
VIP Health Care Portfolio - Initial Class | 8.31% | 4.72% | 5.11% |
VIP Health Care Portfolio - Investor Class A | 8.26% | 4.61% | 5.03% |
A The initial offering of Investor Class took place on July 21, 2005. Returns prior to July 21, 2005 are those of Initial Class. Had Investor Class's transfer agent fee been reflected, returns prior to July 21, 2005 would have been lower.
$10,000 Over 10 Years
Let's say hypothetically that $10,000 was invested in VIP Health Care Portfolio - Initial Class on December 31, 2001. The chart shows how the value of your investment would have changed, and also shows how the S&P 500® Index performed over the same period.
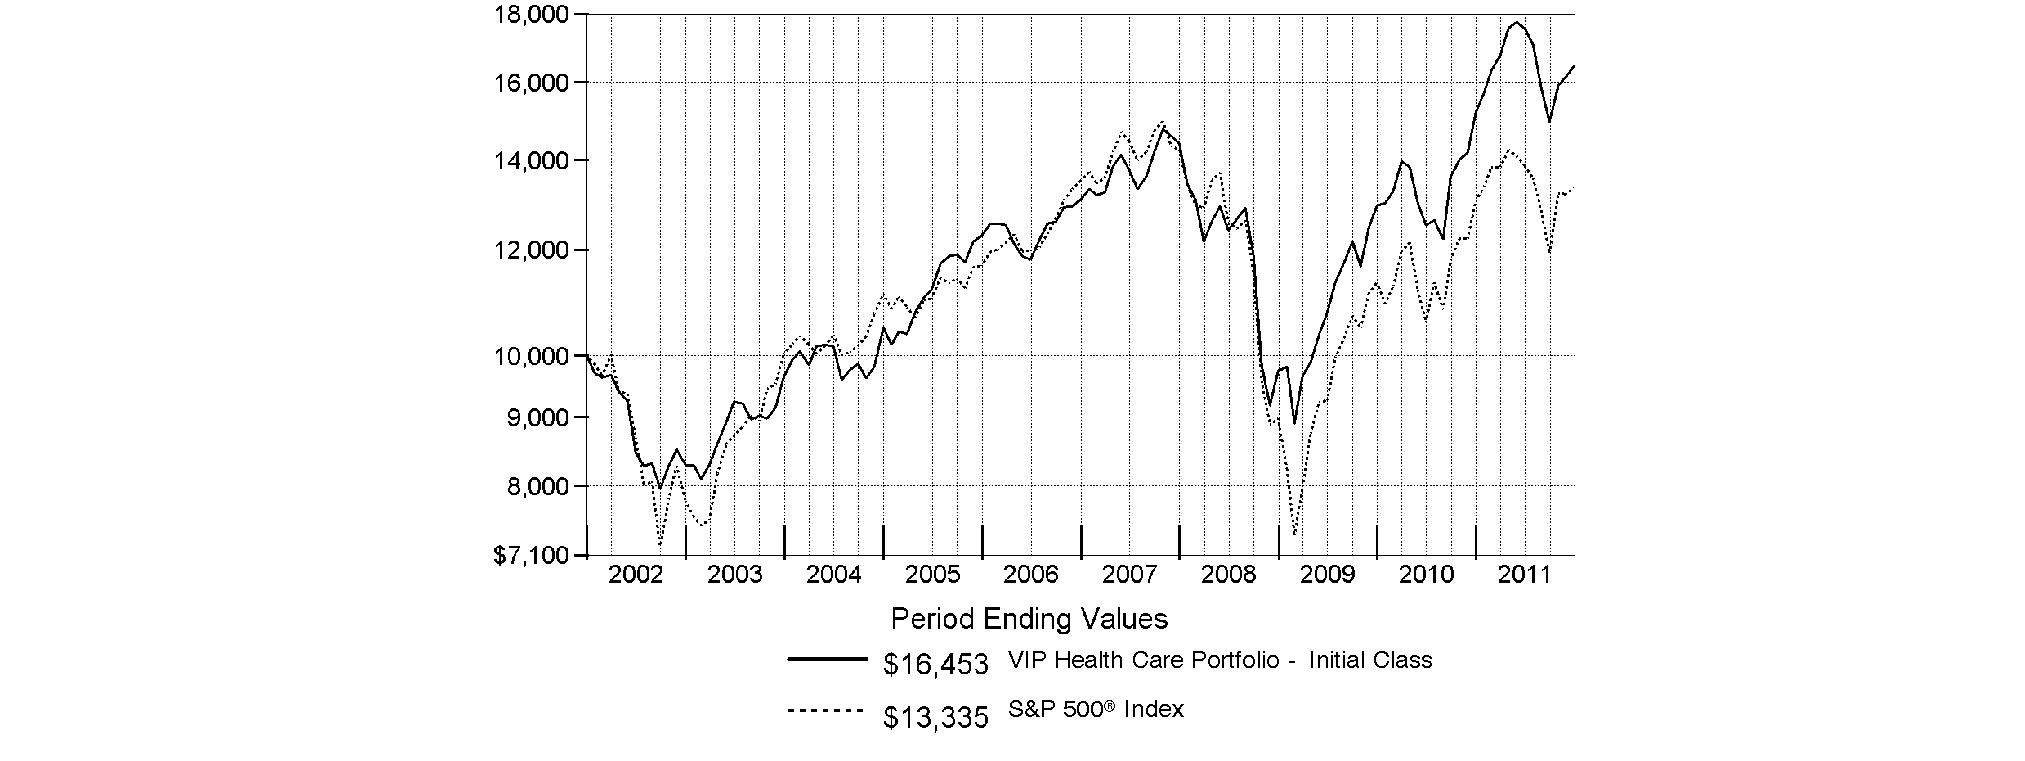
Annual Report
Market Recap: Extreme market volatility took center stage during the 12 months ending December 31, 2011, stealing the spotlight from signs of progress in the global economy. Early in the year, aggressive monetary stimulus by the U.S. federal government, improving credit-market conditions and solid corporate earnings buoyed most major asset classes. As the period progressed, however, fresh worries about sovereign debt in Europe, inflation in China, gridlock over raising the debt ceiling in the U.S. - along with Standard & Poor's early-August downgrade of the nation's long-term sovereign credit rating - and a dimmed outlook for global growth punctured investor confidence and ignited market instability. Domestic equities, as measured by the broad-based S&P 500® Index, gained 2.11%, easily outpacing the 13.61% decline of MSCI® ACWI® (All Country World Index) ex USA Index, a proxy for foreign stocks. Within the MSCI index, emerging markets declined the most (-18%), with investments here generally held back by a stronger U.S. dollar. The U.K. (-3%) fared better than the rest of Europe (-15%), which was the second-worst-performing index component. Bolstered by periodic flights to quality, U.S. investment-grade bonds posted a 7.84% advance, as reflected by the Barclays Capital® U.S. Aggregate Bond Index, outperforming the 4.37% gain of high-yield securities, as represented by The BofA Merrill LynchSM US High Yield Constrained Index. Hampered by financial woes in Europe, the sovereign debt of major developed markets outside the U.S. rose 4.86%, according to the Citigroup® Non-USD Group-of-Seven (G7) Equal Weighted Index, while the JPMorgan Emerging Markets Bond Index Global (EMBI Global) advanced 8.46%, despite the currency head wind.
Comments from Edward Yoon, Portfolio Manager of VIP Health Care Portfolio: For the year, the fund's share classes trailed the MSCI® U.S. IM Health Care 25/50 Index, which advanced 10.72%, but handily outpaced the S&P 500® Index. (For specific portfolio results, please refer to the performance section of this report.) Relative to the MSCI index, the fund's limited allocation to managed health care, on average, and substantial underweighting in pharmaceuticals, the index's largest component, hurt the most, despite strong stock selection in the latter industry. I gradually increased the fund's position in managed health care to an overweighting by period end. An overweighting in the struggling health care services area more than offset beneficial picks here, while the fund's modest cash position and overweighting in heath care equipment also meaningfully detracted. Conversely, positioning in biotechnology provided the biggest boost, as I emphazied several strong-performing names. In terms of individual securities, underweighting Pfizer, Bristol-Myers Squibb and Abbott Laboratories, three large-cap pharmaceutical firms and major benchmark components that performed well during the past year, proved unproductive. I sold Bristol-Myers from the fund by period end. The fund also was hurt by biopharmaceutical firm Targacept and medical device manufacturer Boston Scientific, both of whose shares lagged during the period. On the other hand, the largest contribution came from an out-of-benchmark investment in Canada's Valeant Pharmaceuticals International. Also in pharma, a non-index position in Ireland-based specialty pharmaceutical maker Shire helped. Elsewhere, the fund benefited from overweightings in three well-performing biotech firms, Alexion Pharmaceuticals, ARIAD Pharmaceuticals and Amgen.
The views expressed above reflect those of the portfolio manager(s) only through the end of the period as stated on the cover of this report and do not necessarily represent the views of Fidelity or any other person in the Fidelity organization. Any such views are subject to change at any time based upon market or other conditions and Fidelity disclaims any responsibility to update such views. These views may not be relied on as investment advice and, because investment decisions for a Fidelity fund are based on numerous factors, may not be relied on as an indication of trading intent on behalf of any Fidelity fund.
Annual Report
As a shareholder of the Fund, you incur two types of costs: (1) transaction costs, including redemption fees, and (2) ongoing costs, including management fees and other Fund expenses. This Example is intended to help you understand your ongoing costs (in dollars) of investing in the Fund and to compare these costs with the ongoing costs of investing in other mutual funds.
The Example is based on an investment of $1,000 invested at the beginning of the period and held for the entire period (July 1, 2011 to December 31, 2011).
Actual Expenses
The first line of the accompanying table for each class of the Fund provides information about actual account values and actual expenses. You may use the information in this line, together with the amount you invested, to estimate the expenses that you paid over the period. Simply divide your account value by $1,000.00 (for example, an $8,600 account value divided by $1,000.00 = 8.6), then multiply the result by the number in the first line for a class of the Fund under the heading entitled "Expenses Paid During Period" to estimate the expenses you paid on your account during this period. The estimate of expenses does not include any fees or other expenses of any variable annuity or variable life insurance product. If they were, the estimate of expenses you paid during the period would be higher, and your ending account value would be lower. In addition, the Fund, as a shareholder in the underlying Fidelity Central Funds, will indirectly bear its pro-rata share of the fees and expenses incurred by the underlying Fidelity Central Funds. These fees and expenses are not included in the Fund's annualized expense ratio used to calculate the expense estimate in the table below.
Hypothetical Example for Comparison Purposes
The second line of the accompanying table for each class of the Fund provides information about hypothetical account values and hypothetical expenses based on a Class' actual expense ratio and an assumed rate of return of 5% per year before expenses, which is not the Class' actual return. The hypothetical account values and expenses may not be used to estimate the actual ending account balance or expenses you paid for the period. You may use this information to compare the ongoing costs of investing in the Fund and other funds. To do so, compare this 5% hypothetical example with the 5% hypothetical examples that appear in the shareholder reports of the other funds. The estimate of expenses does not include any fees or other expenses of any variable annuity or variable life insurance product. If they were, the estimate of expenses you paid during the period would be higher, and your ending account value would be lower. In addition, the Fund, as a shareholder in the underlying Fidelity Central Funds, will indirectly bear its pro-rata share of the fees and expenses incurred by the underlying Fidelity Central Funds. These fees and expenses are not included in the Fund's annualized expense ratio used to calculate the expense estimate in the table below.
Please note that the expenses shown in the table are meant to highlight your ongoing costs only and do not reflect any transaction costs. Therefore, the second line of the table is useful in comparing ongoing costs only, and will not help you determine the relative total costs of owning different funds. In addition, if these transactional costs were included, your costs would have been higher.
| Annualized Expense Ratio | Beginning
Account Value
July 1, 2011 | Ending
Account Value
December 31, 2011 | Expenses Paid
During Period*
July 1, 2011 to December 31, 2011 |
Initial Class | .74% | | | |
Actual | | $ 1,000.00 | $ 938.30 | $ 3.62 |
Hypothetical A | | $ 1,000.00 | $ 1,021.48 | $ 3.77 |
Investor Class | .83% | | | |
Actual | | $ 1,000.00 | $ 938.10 | $ 4.05 |
Hypothetical A | | $ 1,000.00 | $ 1,021.02 | $ 4.23 |
A 5% return per year before expenses
* Expenses are equal to each Class' annualized expense ratio, multiplied by the average account value over the period, multiplied by 184/365 (to reflect the one-half year period).
Annual Report
Investment Changes (Unaudited)
Top Ten Stocks as of December 31, 2011 |
| % of fund's
net assets | % of fund's net assets
6 months ago |
Amgen, Inc. | 7.4 | 4.5 |
WellPoint, Inc. | 4.1 | 1.3 |
Merck & Co., Inc. | 4.1 | 2.7 |
Covidien PLC | 4.1 | 5.9 |
Express Scripts, Inc. | 3.1 | 0.7 |
UnitedHealth Group, Inc. | 3.0 | 1.3 |
GlaxoSmithKline PLC sponsored ADR | 2.9 | 0.0 |
Medco Health Solutions, Inc. | 2.9 | 4.4 |
Biogen Idec, Inc. | 2.6 | 1.7 |
Alexion Pharmaceuticals, Inc. | 2.4 | 1.3 |
| 36.6 | |
Top Industries (% of fund's net assets) |
As of December 31, 2011 |
| Health Care
Providers & Services | 30.5% | |
| Biotechnology | 26.3% | |
| Pharmaceuticals | 20.1% | |
| Health Care
Equipment & Supplies | 14.6% | |
| Food & Staples Retailing | 1.5% | |
| All Others* | 7.0% | |

As of June 30, 2011 |
| Health Care
Equipment & Supplies | 23.4% | |
| Health Care
Providers & Services | 21.6% | |
| Biotechnology | 20.7% | |
| Pharmaceuticals | 14.8% | |
| Life Sciences
Tools & Services | 8.4% | |
| All Others* | 11.1% | |

* Includes short-term investments and net other assets. |
Annual Report
Investments December 31, 2011
Showing Percentage of Net Assets
Common Stocks - 97.2% |
| Shares | | Value |
BIOTECHNOLOGY - 26.3% |
Biotechnology - 26.3% |
Achillion Pharmaceuticals, Inc. (a)(d) | 52,000 | | $ 396,240 |
Acorda Therapeutics, Inc. (a) | 36,900 | | 879,696 |
Alexion Pharmaceuticals, Inc. (a) | 40,600 | | 2,902,900 |
AMAG Pharmaceuticals, Inc. (a) | 8,800 | | 166,408 |
Amgen, Inc. | 141,241 | | 9,069,082 |
Amylin Pharmaceuticals, Inc. (a) | 25,000 | | 284,500 |
Anthera Pharmaceuticals, Inc. (a) | 40,612 | | 249,358 |
Ardea Biosciences, Inc. (a)(d) | 53,200 | | 894,292 |
ARIAD Pharmaceuticals, Inc. (a) | 95,962 | | 1,175,535 |
AVEO Pharmaceuticals, Inc. (a) | 22,921 | | 394,241 |
Biogen Idec, Inc. (a) | 29,500 | | 3,246,475 |
BioMarin Pharmaceutical, Inc. (a) | 83,060 | | 2,855,603 |
Chelsea Therapeutics International Ltd. (a)(d) | 50,762 | | 260,409 |
Dynavax Technologies Corp. (a) | 207,086 | | 687,526 |
Gilead Sciences, Inc. (a) | 67,615 | | 2,767,482 |
Human Genome Sciences, Inc. (a) | 36,900 | | 272,691 |
Inhibitex, Inc. (a) | 86,900 | | 950,686 |
Neurocrine Biosciences, Inc. (a) | 47,297 | | 402,025 |
NPS Pharmaceuticals, Inc. (a) | 55,700 | | 367,063 |
ONYX Pharmaceuticals, Inc. (a) | 21,200 | | 931,740 |
Seattle Genetics, Inc. (a) | 30,776 | | 514,421 |
Synageva BioPharma Corp. (a)(d) | 23,001 | | 612,517 |
Targacept, Inc. (a)(d) | 37,433 | | 208,502 |
Theravance, Inc. (a)(d) | 43,000 | | 950,300 |
United Therapeutics Corp. (a) | 18,452 | | 871,857 |
| | 32,311,549 |
DIVERSIFIED CONSUMER SERVICES - 0.5% |
Specialized Consumer Services - 0.5% |
Carriage Services, Inc. | 61,339 | | 343,498 |
Stewart Enterprises, Inc. Class A | 38,432 | | 221,368 |
| | 564,866 |
FOOD & STAPLES RETAILING - 1.5% |
Drug Retail - 1.5% |
CVS Caremark Corp. | 24,600 | | 1,003,188 |
Drogasil SA | 123,000 | | 856,220 |
| | 1,859,408 |
HEALTH CARE EQUIPMENT & SUPPLIES - 14.6% |
Health Care Equipment - 12.8% |
Baxter International, Inc. | 47,980 | | 2,374,050 |
Boston Scientific Corp. (a) | 356,700 | | 1,904,778 |
Conceptus, Inc. (a) | 43,454 | | 549,259 |
CONMED Corp. (a) | 15,400 | | 395,318 |
Covidien PLC | 110,689 | | 4,982,112 |
Cyberonics, Inc. (a) | 13,900 | | 465,650 |
HeartWare International, Inc. (a)(d) | 10,500 | | 724,500 |
Masimo Corp. | 17,336 | | 323,923 |
|
| Shares | | Value |
Opto Circuits India Ltd. | 56,993 | | $ 214,255 |
Orthofix International NV (a) | 14,000 | | 493,220 |
William Demant Holding A/S (a) | 6,800 | | 565,532 |
Wright Medical Group, Inc. (a) | 62,800 | | 1,036,200 |
Zeltiq Aesthetics, Inc. (d) | 22,335 | | 253,726 |
Zimmer Holdings, Inc. (a) | 27,700 | | 1,479,734 |
| | 15,762,257 |
Health Care Supplies - 1.8% |
The Cooper Companies, Inc. | 30,400 | | 2,143,808 |
TOTAL HEALTH CARE EQUIPMENT & SUPPLIES | | 17,906,065 |
HEALTH CARE PROVIDERS & SERVICES - 30.5% |
Health Care Distributors & Services - 1.6% |
Amplifon SpA | 74,000 | | 313,411 |
McKesson Corp. | 21,179 | | 1,650,056 |
| | 1,963,467 |
Health Care Facilities - 1.7% |
Capital Senior Living Corp. (a) | 70,000 | | 555,800 |
Emeritus Corp. (a) | 25,328 | | 443,493 |
Hanger Orthopedic Group, Inc. (a) | 23,690 | | 442,766 |
LCA-Vision, Inc. (a) | 48,300 | | 140,070 |
Sunrise Senior Living, Inc. (a) | 67,135 | | 435,035 |
| | 2,017,164 |
Health Care Services - 16.7% |
Accretive Health, Inc. (a) | 35,603 | | 818,157 |
Catalyst Health Solutions, Inc. (a) | 18,000 | | 936,000 |
Express Scripts, Inc. (a) | 86,068 | | 3,846,379 |
Fresenius Medical Care AG & Co. KGaA | 17,187 | | 1,167,548 |
HMS Holdings Corp. (a) | 14,900 | | 476,502 |
Laboratory Corp. of America Holdings (a) | 30,700 | | 2,639,279 |
Medco Health Solutions, Inc. (a) | 63,461 | | 3,547,470 |
MEDNAX, Inc. (a) | 25,800 | | 1,857,858 |
Omnicare, Inc. | 49,200 | | 1,694,940 |
Quest Diagnostics, Inc. | 46,700 | | 2,711,402 |
Team Health Holdings, Inc. (a) | 39,925 | | 881,145 |
| | 20,576,680 |
Managed Health Care - 10.5% |
Aetna, Inc. | 36,900 | | 1,556,811 |
Humana, Inc. | 26,400 | | 2,312,904 |
UnitedHealth Group, Inc. | 73,133 | | 3,706,380 |
Universal American Spin Corp. (a) | 25,000 | | 317,750 |
WellPoint, Inc. | 76,377 | | 5,059,976 |
| | 12,953,821 |
TOTAL HEALTH CARE PROVIDERS & SERVICES | | 37,511,132 |
HEALTH CARE TECHNOLOGY - 1.4% |
Health Care Technology - 1.4% |
Allscripts-Misys Healthcare Solutions, Inc. (a) | 29,580 | | 560,245 |
Common Stocks - continued |
| Shares | | Value |
HEALTH CARE TECHNOLOGY - CONTINUED |
Health Care Technology - continued |
athenahealth, Inc. (a) | 18,463 | | $ 906,903 |
Epocrates, Inc. (a) | 29,600 | | 230,880 |
| | 1,698,028 |
INTERNET SOFTWARE & SERVICES - 0.5% |
Internet Software & Services - 0.5% |
WebMD Health Corp. (a) | 16,900 | | 634,595 |
PERSONAL PRODUCTS - 0.4% |
Personal Products - 0.4% |
Prestige Brands Holdings, Inc. (a) | 43,744 | | 492,995 |
PHARMACEUTICALS - 20.0% |
Pharmaceuticals - 20.0% |
Abbott Laboratories | 24,600 | | 1,383,258 |
Cardiome Pharma Corp. (a) | 90,500 | | 238,015 |
Columbia Laboratories, Inc. (a)(d) | 70,000 | | 175,000 |
Elan Corp. PLC sponsored ADR (a) | 92,200 | | 1,266,828 |
Eli Lilly & Co. | 41,500 | | 1,724,740 |
GlaxoSmithKline PLC sponsored ADR | 78,700 | | 3,591,081 |
Meda AB (A Shares) | 49,200 | | 511,956 |
Medicis Pharmaceutical Corp. Class A | 9,897 | | 329,075 |
Merck & Co., Inc. | 132,216 | | 4,984,543 |
Optimer Pharmaceuticals, Inc. (a)(d) | 46,667 | | 571,204 |
Pacira Pharmaceuticals, Inc. | 16,900 | | 146,185 |
Pfizer, Inc. | 30,750 | | 665,430 |
Sanofi-aventis sponsored ADR | 67,650 | | 2,471,931 |
Shire PLC sponsored ADR | 24,000 | | 2,493,600 |
Valeant Pharmaceuticals International, Inc. (Canada) | 55,360 | | 2,590,787 |
Watson Pharmaceuticals, Inc. (a) | 21,500 | | 1,297,310 |
XenoPort, Inc. (a) | 22,900 | | 87,249 |
| | 24,528,192 |
PROFESSIONAL SERVICES - 1.1% |
Research & Consulting Services - 1.1% |
Advisory Board Co. (a) | 7,800 | | 578,838 |
Qualicorp SA | 89,900 | | 808,193 |
| | 1,387,031 |
SOFTWARE - 0.4% |
Application Software - 0.4% |
Nuance Communications, Inc. (a) | 21,500 | | 540,940 |
TOTAL COMMON STOCKS (Cost $111,428,056) |
119,434,801
|
Convertible Preferred Stocks - 0.1% |
| Shares | | Value |
PHARMACEUTICALS - 0.1% |
Pharmaceuticals - 0.1% |
Merrimack Pharmaceuticals, Inc.
Series G (e)
(Cost $104,839) | 14,977 | | $ 104,839 |
Money Market Funds - 4.8% |
| | | |
Fidelity Cash Central Fund, 0.11% (b) | 2,902,841 | | 2,902,841 |
Fidelity Securities Lending Cash Central Fund, 0.13% (b)(c) | 3,027,125 | | 3,027,125 |
TOTAL MONEY MARKET FUNDS (Cost $5,929,966) |
5,929,966
|
TOTAL INVESTMENT PORTFOLIO - 102.1% (Cost $117,462,861) | | 125,469,606 |
NET OTHER ASSETS (LIABILITIES) - (2.1)% | | (2,542,799) |
NET ASSETS - 100% | $ 122,926,807 |
Legend |
(a) Non-income producing |
(b) Affiliated fund that is available only to investment companies and other accounts managed by Fidelity Investments. The rate quoted is the annualized seven-day yield of the fund at period end. A complete unaudited listing of the fund's holdings as of its most recent quarter end is available upon request. In addition, each Fidelity Central Fund's financial statements, which are not covered by the Fund's Report of Independent Registered Public Accounting Firm, are available on the SEC's website or upon request. |
(c) Investment made with cash collateral received from securities on loan. |
(d) Security or a portion of the security is on loan at period end. |
(e) Restricted securities - Investment in securities not registered under the Securities Act of 1933 (excluding 144A issues). At the end of the period, the value of restricted securities (excluding 144A issues) amounted to $104,839 or 0.1% of net assets. |
Additional information on each restricted holding is as follows: |
Security | Acquisition Date | Acquisition Cost |
Merrimack Pharmaceuticals, Inc. Series G | 3/31/11 | $ 104,839 |
Affiliated Central Funds |
Information regarding fiscal year to date income earned by the Fund from investments in Fidelity Central Funds is as follows: |
Fund | Income earned |
Fidelity Cash Central Fund | $ 6,120 |
Fidelity Securities Lending Cash Central Fund | 12,299 |
Total | $ 18,419 |
Other Information |
The following is a summary of the inputs used, as of December 31, 2011, involving the Fund's assets and liabilities carried at fair value. The inputs or methodology used for valuing securities may not be an indication of the risk associated with investing in those securities. For more information on valuation inputs, and their aggregation into the levels used in the tables below, please refer to the Security Valuation section in the accompanying Notes to Financial Statements. |
Valuation Inputs at Reporting Date: |
Description | Total | Level 1 | Level 2 | Level 3 |
Investments in Securities: | | | | |
Common Stocks | $ 119,434,801 | $ 118,267,253 | $ 1,167,548 | $ - |
Convertible Preferred Stocks | 104,839 | - | - | 104,839 |
Money Market Funds | 5,929,966 | 5,929,966 | - | - |
Total Investments in Securities: | $ 125,469,606 | $ 124,197,219 | $ 1,167,548 | $ 104,839 |
The following is a reconciliation of Investments in Securities for which Level 3 inputs were used in determining value: |
Investments in Securities: | |
Beginning Balance | $ - |
Total Realized Gain (Loss) | - |
Total Unrealized Gain (Loss) | - |
Cost of Purchases | 104,839 |
Proceeds of Sales | - |
Amortization/Accretion | - |
Transfers in to Level 3 | - |
Transfers out of Level 3 | - |
Ending Balance | $ 104,839 |
The change in unrealized gain (loss) for the period attributable to Level 3 securities held at December 31, 2011 | $ - |
The information used in the above reconciliation represents fiscal year to date activity for any Investments in Securities identified as using Level 3 inputs at either the beginning or the end of the current fiscal period. Transfers in or out of Level 3 represent the beginning value of any Security or Instrument where a change in the pricing level occurred from the beginning to the end of the period. The cost of purchases and the proceeds of sales may include securities received or delivered through corporate actions or exchanges. Realized and unrealized gains (losses) disclosed in the reconciliation are included in Net Gain (Loss) on the Fund's Statement of Operations. |
Distribution of investments by country of issue, as a percentage of total net assets, is as follows: (Unaudited) |
United States of America | 81.7% |
Ireland | 5.1% |
United Kingdom | 2.9% |
Canada | 2.3% |
Bailiwick of Jersey | 2.0% |
France | 2.0% |
Brazil | 1.3% |
Others (Individually Less Than 1%) | 2.7% |
| 100.0% |
See accompanying notes which are an integral part of the financial statements.
Annual Report
Statement of Assets and Liabilities
| December 31, 2011 |
| | |
Assets | | |
Investment in securities, at value (including securities loaned of $2,925,034) - See accompanying schedule: Unaffiliated issuers (cost $111,532,895) | $ 119,539,640 | |
Fidelity Central Funds (cost $5,929,966) | 5,929,966 | |
Total Investments (cost $117,462,861) | | $ 125,469,606 |
Foreign currency held at value (cost $36,882) | | 36,931 |
Receivable for fund shares sold | | 485,053 |
Dividends receivable | | 113,002 |
Distributions receivable from Fidelity Central Funds | | 2,207 |
Prepaid expenses | | 448 |
Other receivables | | 7,197 |
Total assets | | 126,114,444 |
| | |
Liabilities | | |
Payable for investments purchased | $ 52,595 | |
Payable for fund shares redeemed | 5 | |
Accrued management fee | 54,928 | |
Other affiliated payables | 15,055 | |
Other payables and accrued expenses | 37,929 | |
Collateral on securities loaned, at value | 3,027,125 | |
Total liabilities | | 3,187,637 |
| | |
Net Assets | | $ 122,926,807 |
Net Assets consist of: | | |
Paid in capital | | $ 111,789,186 |
Accumulated net investment loss | | (3,764) |
Accumulated undistributed net realized gain (loss) on investments and foreign currency transactions | | 3,135,761 |
Net unrealized appreciation (depreciation) on investments and assets and liabilities in foreign currencies | | 8,005,624 |
Net Assets | | $ 122,926,807 |
Statement of Assets and Liabilities - continued
| December 31, 2011 |
Initial Class:
Net Asset Value, offering price and redemption price per share ($52,429,690 ÷ 3,829,763 shares) | | $ 13.69 |
| | |
Investor Class:
Net Asset Value, offering price and redemption price per share ($70,497,117 ÷ 5,173,257 shares) | | $ 13.63 |
See accompanying notes which are an integral part of the financial statements.
Annual Report
Statement of Operations
| Year ended December 31, 2011 |
| | |
Investment Income | | |
Dividends | | $ 729,921 |
Income from Fidelity Central Funds | | 18,419 |
Total income | | 748,340 |
| | |
Expenses | | |
Management fee | $ 593,191 | |
Transfer agent fees | 129,341 | |
Accounting and security lending fees | 42,333 | |
Custodian fees and expenses | 26,954 | |
Independent trustees' compensation | 586 | |
Audit | 44,998 | |
Legal | 363 | |
Miscellaneous | 788 | |
Total expenses before reductions | 838,554 | |
Expense reductions | (13,421) | 825,133 |
Net investment income (loss) | | (76,793) |
Realized and Unrealized Gain (Loss) Net realized gain (loss) on: | | |
Investment securities: | | |
Unaffiliated issuers | 7,887,177 | |
Foreign currency transactions | (37,572) | |
Total net realized gain (loss) | | 7,849,605 |
Change in net unrealized appreciation (depreciation) on: Investment securities | (4,596,336) | |
Assets and liabilities in foreign currencies | (870) | |
Total change in net unrealized appreciation (depreciation) | | (4,597,206) |
Net gain (loss) | | 3,252,399 |
Net increase (decrease) in net assets resulting from operations | | $ 3,175,606 |
Statement of Changes in Net Assets
| Year ended December 31, 2011 | Year ended December 31, 2010 |
Increase (Decrease) in Net Assets | | |
Operations | | |
Net investment income (loss) | $ (76,793) | $ 87,396 |
Net realized gain (loss) | 7,849,605 | 5,118,295 |
Change in net unrealized appreciation (depreciation) | (4,597,206) | 4,473,321 |
Net increase (decrease) in net assets resulting
from operations | 3,175,606 | 9,679,012 |
Distributions to shareholders from net investment income | - | (95,078) |
Share transactions - net increase (decrease) | 51,772,909 | (3,931,126) |
Redemption fees | 73,707 | 16,002 |
Total increase (decrease) in net assets | 55,022,222 | 5,668,810 |
| | |
Net Assets | | |
Beginning of period | 67,904,585 | 62,235,775 |
End of period (including accumulated net investment loss of $3,764 and undistributed net investment income of $0, respectively) | $ 122,926,807 | $ 67,904,585 |
See accompanying notes which are an integral part of the financial statements.
Annual Report
Financial Highlights - Initial Class
Years ended December 31, | 2011 | 2010 | 2009 | 2008 | 2007 |
Selected Per-Share Data | | | | | |
Net asset value, beginning of period | $ 12.64 | $ 10.79 | $ 8.15 | $ 13.57 | $ 13.17 |
Income from Investment Operations | | | | | |
Net investment income (loss) C | - H | .02 F | .03 | .04 | .03 |
Net realized and unrealized gain (loss) | 1.04 | 1.85 | 2.64 | (4.05) | 1.25 |
Total from investment operations | 1.04 | 1.87 | 2.67 | (4.01) | 1.28 |
Distributions from net investment income | - | (.02) | (.03) | (.04) | (.07) |
Distributions from net realized gain | - | - | - | (1.37) | (.81) |
Total distributions | - | (.02) | (.03) | (1.41) | (.88) |
Redemption fees added to paid in capital C | .01 | - H | - H | - H | - H |
Net asset value, end of period | $ 13.69 | $ 12.64 | $ 10.79 | $ 8.15 | $ 13.57 |
Total Return A, B | 8.31% | 17.35% | 32.80% | (32.31)% | 10.21% |
Ratios to Average Net Assets D, G | | | | | |
Expenses before reductions | .74% | .79% | .83% | .84% | .81% |
Expenses net of fee waivers, if any | .74% | .78% | .83% | .84% | .81% |
Expenses net of all reductions | .73% | .78% | .82% | .84% | .80% |
Net investment income (loss) | (.03)% | .17% F | .30% | .36% | .23% |
Supplemental Data | | | | | |
Net assets, end of period (000 omitted) | $ 52,430 | $ 36,651 | $ 37,787 | $ 37,961 | $ 55,676 |
Portfolio turnover rate E | 138% | 108% | 132% | 189% | 128% |
A Total returns do not reflect charges attributable to your insurance company's separate account. Inclusion of these charges would reduce the total returns shown.
B Total returns would have been lower if certain expenses had not been reduced during the applicable periods shown.
C Calculated based on average shares outstanding during the period.
D Fees and expenses of any underlying Fidelity Central Funds are not included in the Fund's expense ratio. The Fund indirectly bears its proportionate share of the expenses of any underlying Fidelity Central Funds.
E Amount does not include the portfolio activity of any underlying Fidelity Central Funds.
F Investment income per share reflects a special dividend which amounted to $.01 per share. Excluding the special dividend, the ratio of net investment income (loss) to average net assets would have been .04%.
G Expense ratios reflect operating expenses of the class. Expenses before reductions do not reflect amounts reimbursed by the investment adviser or reductions from brokerage service arrangements or reductions from other expense offset arrangements and do not represent the amount paid by the class during periods when reimbursements or reductions occur. Expenses net of fee waivers reflect expenses after reimbursement by the investment adviser but prior to reductions from brokerage service arrangements or other expense offset arrangements. Expenses net of all reductions represent the net expenses paid by the class.
H Amount represents less than $.01 per share.
Financial Highlights - Investor Class
Years ended December 31, | 2011 | 2010 | 2009 | 2008 | 2007 |
Selected Per-Share Data | | | | | |
Net asset value, beginning of period | $ 12.59 | $ 10.75 | $ 8.13 | $ 13.53 | $ 13.14 |
Income from Investment Operations | | | | | |
Net investment income (loss) C | (.01) | .01 F | .02 | .03 | .01 |
Net realized and unrealized gain (loss) | 1.04 | 1.84 | 2.62 | (4.03) | 1.24 |
Total from investment operations | 1.03 | 1.85 | 2.64 | (4.00) | 1.25 |
Distributions from net investment income | - | (.01) | (.02) | (.03) | (.05) |
Distributions from net realized gain | - | - | - | (1.37) | (.81) |
Total distributions | - | (.01) | (.02) | (1.40) | (.86) |
Redemption fees added to paid in capital C | .01 | - H | - H | - H | - H |
Net asset value, end of period | $ 13.63 | $ 12.59 | $ 10.75 | $ 8.13 | $ 13.53 |
Total Return A, B | 8.26% | 17.24% | 32.53% | (32.31)% | 10.01% |
Ratios to Average Net Assets D, G | | | | | |
Expenses before reductions | .82% | .88% | .94% | .94% | .93% |
Expenses net of fee waivers, if any | .82% | .87% | .94% | .94% | .93% |
Expenses net of all reductions | .81% | .86% | .93% | .93% | .92% |
Net investment income (loss) | (.11)% | .09% F | .20% | .26% | .11% |
Supplemental Data | | | | | |
Net assets, end of period (000 omitted) | $ 70,497 | $ 31,254 | $ 24,448 | $ 21,901 | $ 26,948 |
Portfolio turnover rate E | 138% | 108% | 132% | 189% | 128% |
A Total returns do not reflect charges attributable to your insurance company's separate account. Inclusion of these charges would reduce the total returns shown.
B Total returns would have been lower if certain expenses had not been reduced during the applicable periods shown.
C Calculated based on average shares outstanding during the period.
D Fees and expenses of any underlying Fidelity Central Funds are not included in the Fund's expense ratio. The Fund indirectly bears its proportionate share of the expenses of any underlying Fidelity Central Funds.
E Amount does not include the portfolio activity of any underlying Fidelity Central Funds.
F Investment income per share reflects a special dividend which amounted to $.01 per share. Excluding the special dividend, the ratio of net investment income (loss) to average net assets would have been (.04)%.
G Expense ratios reflect operating expenses of the class. Expenses before reductions do not reflect amounts reimbursed by the investment adviser or reductions from brokerage service arrangements or reductions from other expense offset arrangements and do not represent the amount paid by the class during periods when reimbursements or reductions occur. Expenses net of fee waivers reflect expenses after reimbursement by the investment adviser but prior to reductions from brokerage service arrangements or other expense offset arrangements. Expenses net of all reductions represent the net expenses paid by the class.
H Amount represents less than $.01 per share.
See accompanying notes which are an integral part of the financial statements.
Annual Report
Notes to Financial Statements
For the period ended December 31, 2011
1. Organization.
VIP Health Care Portfolio (the Fund) is a non-diversified fund of Variable Insurance Products Fund IV (the Trust) and is authorized to issue an unlimited number of shares. The Trust is registered under the Investment Company Act of 1940, as amended (the 1940 Act), as an open-end management investment company organized as a Massachusetts business trust. Shares of the Fund may only be purchased by insurance companies for the purpose of funding variable annuity or variable life insurance contracts. The Fund offers the following classes of shares: Initial Class shares and Investor Class shares. All classes have equal rights and voting privileges, except for matters affecting a single class. Investment income, realized and unrealized capital gains and losses, the common expenses of the Fund, and certain fund-level expense reductions, if any, are allocated on a pro-rata basis to each class based on the relative net assets of each class to the total net assets of the Fund. Each class differs with respect to transfer agent fees incurred. Certain expense reductions may also differ by class.
2. Investments in Fidelity Central Funds.
The Fund invests in Fidelity Central Funds, which are open-end investment companies available only to other investment companies and accounts managed by Fidelity Management & Research Company (FMR) and its affiliates. The Fund's Schedule of Investments lists each of the Fidelity Central Funds held as of period end, if any, as an investment of the Fund, but do not include the underlying holdings of each Fidelity Central Fund. As an Investing Fund, the Fund indirectly bears its proportionate share of the expenses of the underlying Fidelity Central Funds.
The Money Market Central Funds seek preservation of capital and current income and are managed by Fidelity Investments Money Management, Inc. (FIMM), an affiliate of FMR.
A complete unaudited list of holdings for each Fidelity Central Fund is available upon request or at the Securities and Exchange Commission (the SEC) web site at www.sec.gov. In addition, the financial statements of the Fidelity Central Funds, which are not covered by the Fund's Report of Independent Registered Public Accounting Firm, are available on the SEC web site or upon request.
3. Significant Accounting Policies.
The financial statements have been prepared in conformity with accounting principles generally accepted in the United States of America (GAAP), which require management to make certain estimates and assumptions at the date of the financial statements. Actual results could differ from those estimates. Subsequent events, if any, through the date that the financial statements were issued have been evaluated in the preparation of the financial statements. The following summarizes the significant accounting policies of the Fund:
Security Valuation. Investments are valued as of 4:00 p.m. Eastern time on the last calendar day of the period. The Fund uses independent pricing services approved by the Board of Trustees to value its investments. When current market prices or quotations are not readily available or reliable, valuations may be determined in good faith in accordance with procedures adopted by the Board of Trustees. Factors used in determining value may include market or security specific events. The frequency with which these procedures are used cannot be predicted and they may be utilized to a significant extent. The value used for net asset value (NAV) calculation under these procedures may differ from published prices for the same securities.
The Fund categorizes the inputs to valuation techniques used to value its investments into a disclosure hierarchy consisting of three levels as shown below:
Level 1 - quoted prices in active markets for identical investments
Level 2 - other significant observable inputs (including quoted prices for similar investments, interest rates, prepayment speeds, etc.)
Level 3 - unobservable inputs (including the Fund's own assumptions based on the best information available)
Changes in valuation techniques may result in transfers in or out of an assigned level within the disclosure hierarchy. The aggregate value of investments by input level, as of December 31, 2011, as well as a roll forward of Level 3 securities, is included at the end of the Fund's Schedule of Investments. Valuation techniques used to value the Fund's investments by major category are as follows:
Equity securities, including restricted securities, for which market quotations are readily available, are valued at the last reported sale price or official closing price as reported by an independent pricing service on the primary market or exchange on which they are traded and are categorized as Level 1 in the hierarchy. In the event there were no sales during the day or closing prices are not available, securities are valued at the last quoted bid price or may be valued using the last available price and are generally categorized as Level 2 in the hierarchy. For foreign equity securities, when significant market or security specific events arise, comparisons to the valuation of American Depositary Receipts (ADRs), futures contracts, Exchange-traded funds (ETFs) and certain indexes as well as quoted prices for similar securities are used and are categorized as Level 2 in the hierarchy in these circumstances. Utilizing these techniques may result in transfers between Level 1 and Level 2. For restricted equity securities and private placements where observable inputs are limited, assumptions about market activity and risk are used and are categorized as Level 3 in the hierarchy.
Annual Report
3. Significant Accounting Policies - continued
Security Valuation - continued
Investments in open-end mutual funds, including the Fidelity Central Funds, are valued at their closing net asset value each business day and are categorized as Level 1 in the hierarchy.
New Accounting Pronouncements. In May 2011, the Financial Accounting Standards Board issued Accounting Standard Update No. 2011-04, Fair Value Measurement (Topic 820) - Amendments to Achieve Common Fair Value Measurement and Disclosure Requirements in U.S. GAAP and IFRSs. The update is effective during interim and annual periods beginning after December 15, 2011 and will result in additional disclosure for transfers between levels as well as expanded disclosure for securities categorized as Level 3 under the fair value hierarchy.
In December 2011, the Financial Accounting Standards Board issued Accounting Standard Update No. 2011-11, Disclosures about Offsetting Assets and Liabilities. The update creates new disclosure requirements requiring entities to disclose both gross and net information for derivatives and other financial instruments that are either offset in the Statement of Assets and Liabilities or subject to an enforceable master netting arrangement or similar agreement. The disclosure requirements are effective for annual reporting periods beginning on or after January 1, 2013. Management is currently evaluating the impact of the update's adoption on the Fund's financial statement disclosures.
Foreign Currency. The Fund may use foreign currency contracts to facilitate transactions in foreign-denominated securities. Gains and losses from these transactions may arise from changes in the value of the foreign currency or if the counterparties do not perform under the contracts' terms.
Foreign-denominated assets, including investment securities, and liabilities are translated into U.S. dollars at the exchange rate at period end. Purchases and sales of investment securities, income and dividends received and expenses denominated in foreign currencies are translated into U.S. dollars at the exchange rate in effect on the transaction date.
The effects of exchange rate fluctuations on investments are included with the net realized and unrealized gain (loss) on investment securities. Other foreign currency transactions resulting in realized and unrealized gain (loss) are disclosed separately.
Investment Transactions and Income. For financial reporting purposes, the Fund's investment holdings and NAV include trades executed through the end of the last business day of the period. The NAV per share for processing shareholder transactions is calculated as of the close of business of the New York Stock Exchange (NYSE), normally 4:00 p.m. Eastern time and includes trades executed through the end of the prior business day. Gains and losses on securities sold are determined on the basis of identified cost and may include proceeds received from litigation. Dividend income is recorded on the ex-dividend date, except for certain dividends from foreign securities where the ex-dividend date may have passed, which are recorded as soon as the Fund is informed of the ex-dividend date. Non-cash dividends included in dividend income, if any, are recorded at the fair market value of the securities received. Distributions received on securities that represent a return of capital or capital gain are recorded as a reduction of cost of investments and/or as a realized gain. The Fund estimates the components of distributions received that may be considered return of capital distributions or capital gain distributions. Interest income and distributions from the Fidelity Central Funds are accrued as earned. Interest income includes coupon interest and amortization of premium and accretion of discount on debt securities. Investment income is recorded net of foreign taxes withheld where recovery of such taxes is uncertain.
Expenses. Expenses directly attributable to a fund are charged to that fund. Expenses attributable to more than one fund are allocated among the respective funds on the basis of relative net assets or other appropriate methods. Expense estimates are accrued in the period to which they relate and adjustments are made when actual amounts are known.
Income Tax Information and Distributions to Shareholders. Each year, the Fund intends to qualify as a regulated investment company, including distributing substantially all of its taxable income and realized gains under Subchapter M of the Internal Revenue Code. As a result, no provision for income taxes is required. As of December 31, 2011, the Fund did not have any unrecognized tax benefits in the financial statements; nor is the Fund aware of any tax positions for which it is reasonably possible that the total amounts of unrecognized tax benefits will significantly change in the next twelve months. The Fund files a U.S. federal tax return, in addition to state and local tax returns as required. A fund's tax returns are subject to examination by the Internal Revenue Service (IRS) for a period of three fiscal years. State and local tax returns may be subject to examination for an additional fiscal year depending on the jurisdiction. Foreign taxes are provided for based on the Fund's understanding of the tax rules and rates that exist in the foreign markets in which it invests.
Distributions are declared and recorded on the ex-dividend date. Income dividends and capital gain distributions are declared separately for each class. Income and capital gain distributions are determined in accordance with income tax regulations, which may differ from GAAP.
Capital accounts within the financial statements are adjusted for permanent book-tax differences. These adjustments have no impact on net assets or the results of operations. Temporary book-tax differences will reverse in a subsequent period.
Annual Report
Notes to Financial Statements - continued
3. Significant Accounting Policies - continued
Income Tax Information and Distributions to Shareholders - continued
Book-tax differences are primarily due to foreign currency transactions, net operating losses, capital loss carryforwards and losses deferred due to wash sales and excise tax regulations.
The federal tax cost of investment securities and unrealized appreciation (depreciation) as of period end were as follows:
Gross unrealized appreciation | $ 14,205,544 |
Gross unrealized depreciation | (7,263,860) |
Net unrealized appreciation (depreciation) on securities and other investments | $ 6,941,684 |
| |
Tax Cost | $ 118,527,922 |
The tax-based components of distributable earnings as of period end were as follows:
Undistributed long-term capital gain | $ 4,200,822 |
Net unrealized appreciation (depreciation) | $ 6,940,563 |
The tax character of distributions paid was as follows:
| December 31, 2011 | December 31, 2010 |
Ordinary Income | $ - | $ 95,078 |
Trading (Redemption) Fees. Shares held by investors less than 60 days are subject to a redemption fee equal to 1% of the net asset value of shares redeemed. All redemption fees, which reduce the proceeds of the shareholder redemption, are retained by the Fund and accounted for as an addition to paid in capital.
4. Operating Policies.
Restricted Securities. The Fund may invest in securities that are subject to legal or contractual restrictions on resale. These securities generally may be resold in transactions exempt from registration or to the public if the securities are registered. Disposal of these securities may involve time-consuming negotiations and expense, and prompt sale at an acceptable price may be difficult. Information regarding restricted securities is included at the end of the Fund's Schedule of Investments.
5. Purchases and Sales of Investments.
Purchases and sales of securities, other than short-term securities, aggregated $191,686,488 and $141,739,310, respectively.
6. Fees and Other Transactions with Affiliates.
Management Fee. FMR and its affiliates provide the Fund with investment management related services for which the Fund pays a monthly management fee. The management fee is the sum of an individual fund fee rate that is based on an annual rate of .30% of the Fund's average net assets and an annualized group fee rate that averaged .26% during the period. The group fee rate is based upon the average net assets of all the mutual funds advised by FMR. The group fee rate decreases as assets under management increase and increases as assets under management decrease. For the period, the total annual management fee rate was .56% of the Fund's average net assets.
Transfer Agent Fees. Fidelity Investments Institutional Operations Company, Inc. (FIIOC), an affiliate of FMR, is the Fund's transfer, dividend disbursing, and shareholder servicing agent. FIIOC receives an asset-based fee with respect to each class. Each class (with the exception of Investor Class) pays a transfer agent fee, excluding out of pocket expenses, equal to an annual rate of .07% of average net assets. Investor Class pays a monthly asset-based transfer agent fee of .15% of average net assets. In addition, FIIOC receives an asset-based fee of .0045% of average net assets for typesetting, printing and mailing of shareholder reports, except proxy statements. FIIOC voluntarily agreed to waive this fee for the period August 1, 2011 through December 31, 2011 (see Expense Reductions note). For the period, transfer agent fees for each class, including printing and out of pocket expenses, were as follows:
Initial Class | $ 38,482 | |
Investor Class | 90,859 | |
| $ 129,341 | |
Annual Report
6. Fees and Other Transactions with Affiliates - continued
Accounting and Security Lending Fees. Fidelity Service Company, Inc. (FSC), an affiliate of FMR, maintains the Fund's accounting records. The accounting fee is based on the level of average net assets for the month. Under a separate contract, FSC administers the security lending program. The security lending fee is based on the number and duration of lending transactions.
Brokerage Commissions. The Fund placed a portion of its portfolio transactions with brokerage firms which are affiliates of the investment adviser. The commissions paid to these affiliated firms were $4,048 for the period.
7. Committed Line of Credit.
The Fund participates with other funds managed by FMR or an affiliate in a $4.0 billion credit facility (the "line of credit") to be utilized for temporary or emergency purposes to fund shareholder redemptions or for other short-term liquidity purposes. The Fund has agreed to pay commitment fees on its pro-rata portion of the line of credit, which amounted to $276 and is reflected in Miscellaneous expenses on the Statement of Operations. During the period, there were no borrowings on this line of credit.
8. Security Lending.
The Fund lends portfolio securities through a lending agent from time to time in order to earn additional income. For equity securities, a lending agent is used and may loan securities to certain qualified borrowers, including Fidelity Capital Markets (FCM), a broker-dealer affiliated with the Fund. On the settlement date of the loan, the Fund receives collateral (in the form of U.S. Treasury obligations, letters of credit and/or cash) against the loaned securities and maintains collateral in an amount not less than 100% of the market value of the loaned securities during the period of the loan. The market value of the loaned securities is determined at the close of business of the Fund and any additional required collateral is delivered to the Fund on the next business day. If the borrower defaults on its obligation to return the securities loaned because of insolvency or other reasons, a fund could experience delays and costs in recovering the securities loaned or in gaining access to the collateral. Any cash collateral received is invested in the Fidelity Securities Lending Cash Central Fund. The value of loaned securities and cash collateral at period end are disclosed on the Fund's Statement of Assets and Liabilities. At period end, there were no security loans outstanding with FCM. Security lending income represents the income earned on investing cash collateral, less rebates paid to borrowers and any lending agent fees associated with the loan, plus any premium payments received for lending certain types of securities. Security lending income is presented in the Statement of Operations as a component of income from Fidelity Central Funds. Total security lending income during the period amounted to $12,299, including $9 from securities loaned to FCM.
9. Expense Reductions.
FMR or its affiliates agreed to waive certain fees during the period as noted in the table below.
Initial Class | $ 978 |
Investor Class | 1,120 |
| $ 2,098 |
Many of the brokers with whom FMR places trades on behalf of the Fund provided services to the Fund in addition to trade execution. These services included payments of certain expenses on behalf of the Fund totaling $11,323 for the period.
10. Distributions to Shareholders.
Distributions to shareholders of each class were as follows:
Years ended December 31, | 2011 | 2010 |
From net investment income | | |
Initial Class | $ - | $ 63,626 |
Investor Class | - | 31,452 |
Total | $ - | $ 95,078 |
Annual Report
Notes to Financial Statements - continued
11. Share Transactions.
Transactions for each class of shares were as follows:
| Shares | Dollars |
Years ended December 31, | 2011 | 2010 | 2011 | 2010 |
Initial Class | | | | |
Shares sold | 2,340,898 | 391,589 | $ 33,111,141 | $ 4,450,278 |
Reinvestment of distributions | - | 4,998 | - | 63,626 |
Shares redeemed | (1,411,679) | (998,727) | (19,120,275) | (11,104,327) |
Net increase (decrease) | 929,219 | (602,140) | $ 13,990,866 | $ (6,590,423) |
Investor Class | | | | |
Shares sold | 3,670,634 | 834,983 | $ 50,464,384 | $ 9,599,046 |
Reinvestment of distributions | - | 2,480 | - | 31,452 |
Shares redeemed | (980,198) | (629,065) | (12,682,341) | (6,971,201) |
Net increase (decrease) | 2,690,436 | 208,398 | $ 37,782,043 | $ 2,659,297 |
12. Other.
The Fund's organizational documents provide former and current trustees and officers with a limited indemnification against liabilities arising in connection with the performance of their duties to the Fund. In the normal course of business, the Fund may also enter into contracts that provide general indemnifications. The Fund's maximum exposure under these arrangements is unknown as this would be dependent on future claims that may be made against the Fund. The risk of material loss from such claims is considered remote.
At the end of the period, FMR or its affiliates were the owners of record of 100% of the total outstanding shares of the Fund.
Annual Report
Report of Independent Registered Public Accounting Firm
To the Trustees of Variable Insurance Products Fund IV and the Shareholders of VIP Health Care Portfolio:
In our opinion, the accompanying statement of assets and liabilities, including the schedule of investments, and the related statements of operations and of changes in net assets and the financial highlights present fairly, in all material respects, the financial position of VIP Health Care Portfolio (a fund of Variable Insurance Products Fund IV) at December 31, 2011, the results of its operations for the year then ended, the changes in its net assets for each of the two years in the period then ended and the financial highlights for each of the five years in the period then ended, in conformity with accounting principles generally accepted in the United States of America. These financial statements and financial highlights (hereafter referred to as "financial statements") are the responsibility of the VIP Health Care Portfolio's management. Our responsibility is to express an opinion on these financial statements based on our audits. We conducted our audits of these financial statements in accordance with the standards of the Public Company Accounting Oversight Board (United States). Those standards require that we plan and perform the audit to obtain reasonable assurance about whether the financial statements are free of material misstatement. An audit includes examining, on a test basis, evidence supporting the amounts and disclosures in the financial statements, assessing the accounting principles used and significant estimates made by management, and evaluating the overall financial statement presentation. We believe that our audits, which included confirmation of securities at December 31, 2011 by correspondence with the custodian and brokers, provide a reasonable basis for our opinion.
/s/ PricewaterhouseCoopers LLP
PricewaterhouseCoopers LLP
Boston, Massachusetts
February 15, 2012
Annual Report
The Trustees, Members of the Advisory Board, and executive officers of the trust and fund, as applicable, are listed below. The Board of Trustees governs the fund and is responsible for protecting the interests of shareholders. The Trustees are experienced executives who meet periodically throughout the year to oversee the fund's activities, review contractual arrangements with companies that provide services to the fund, oversee management of the risks associated with such activities and contractual arrangements, and review the fund's performance. Except for James C. Curvey, each of the Trustees oversees 226 funds advised by FMR or an affiliate. Mr. Curvey oversees 429 funds advised by FMR or an affiliate.
The Trustees hold office without limit in time except that (a) any Trustee may resign; (b) any Trustee may be removed by written instrument, signed by at least two-thirds of the number of Trustees prior to such removal; (c) any Trustee who requests to be retired or who has become incapacitated by illness or injury may be retired by written instrument signed by a majority of the other Trustees; and (d) any Trustee may be removed at any special meeting of shareholders by a two-thirds vote of the outstanding voting securities of the trust. Each Trustee who is not an interested person (as defined in the 1940 Act) (Independent Trustee), shall retire not later than the last day of the calendar year in which his or her 75th birthday occurs. The Independent Trustees may waive this mandatory retirement age policy with respect to individual Trustees. The executive officers and Advisory Board Members hold office without limit in time, except that any officer and Advisory Board Member may resign or may be removed by a vote of a majority of the Trustees at any regular meeting or any special meeting of the Trustees. Except as indicated, each individual has held the office shown or other offices in the same company for the past five years.
Experience, Skills, Attributes, and Qualifications of the Fund's Trustees. The Governance and Nominating Committee has adopted a statement of policy that describes the experience, qualifications, attributes, and skills that are necessary and desirable for potential Independent Trustee candidates (Statement of Policy). The Board believes that each Trustee satisfied at the time he or she was initially elected or appointed a Trustee, and continues to satisfy, the standards contemplated by the Statement of Policy. The Governance and Nominating Committee also engages professional search firms to help identify potential Independent Trustee candidates who have the experience, qualifications, attributes, and skills consistent with the Statement of Policy. From time to time, additional criteria based on the composition and skills of the current Independent Trustees, as well as experience or skills that may be appropriate in light of future changes to board composition, business conditions, and regulatory or other developments, have also been considered by the professional search firms and the Governance and Nominating Committee. In addition, the Board takes into account the Trustees' commitment and participation in Board and committee meetings, as well as their leadership of standing and ad hoc committees throughout their tenure.
In determining that a particular Trustee was and continues to be qualified to serve as a Trustee, the Board has considered a variety of criteria, none of which, in isolation, was controlling. The Board believes that, collectively, the Trustees have balanced and diverse experience, qualifications, attributes, and skills, which allow the Board to operate effectively in governing the fund and protecting the interests of shareholders. Information about the specific experience, skills, attributes, and qualifications of each Trustee, which in each case led to the Board's conclusion that the Trustee should serve (or continue to serve) as a trustee of the fund, is provided below.
Board Structure and Oversight Function. James C. Curvey is an interested person (as defined in the 1940 Act) and currently serves as Acting Chairman. The Trustees have determined that an interested Chairman is appropriate and benefits shareholders because an interested Chairman has a personal and professional stake in the quality and continuity of services provided to the fund. Independent Trustees exercise their informed business judgment to appoint an individual of their choosing to serve as Chairman, regardless of whether the Trustee happens to be independent or a member of management. The Independent Trustees have determined that they can act independently and effectively without having an Independent Trustee serve as Chairman and that a key structural component for assuring that they are in a position to do so is for the Independent Trustees to constitute a substantial majority for the Board. The Independent Trustees also regularly meet in executive session. Ned C. Lautenbach serves as Chairman of the Independent Trustees and as such (i) acts as a liaison between the Independent Trustees and management with respect to matters important to the Independent Trustees and (ii) with management prepares agendas for Board meetings.
Fidelity funds are overseen by different Boards of Trustees. The fund's Board oversees Fidelity's equity and high income funds and another Board oversees Fidelity's investment-grade bond, money market, and asset allocation funds. The asset allocation funds may invest in Fidelity funds overseen by the fund's Board. The use of separate Boards, each with its own committee structure, allows the Trustees of each group of Fidelity funds to focus on the unique issues of the funds they oversee, including common research, investment, and operational issues. On occasion, the separate Boards establish joint committees to address issues of overlapping consequences for the Fidelity funds overseen by each Board.
The Trustees operate using a system of committees to facilitate the timely and efficient consideration of all matters of importance to the Trustees, the fund, and fund shareholders and to facilitate compliance with legal and regulatory requirements and oversight of the fund's activities and associated risks. The Board, acting through its committees, has charged FMR and its affiliates with (i) identifying events or circumstances the occurrence of which could have demonstrably adverse effects on the fund's business and/or reputation; (ii) implementing processes and controls to lessen the possibility that such events or circumstances occur or to mitigate the effects of such events or circumstances if they do occur; and (iii) creating and maintaining a system designed to evaluate continuously business and market conditions in order to facilitate the identification and implementation processes described in (i) and (ii) above. Because the day-to-day operations and activities of the fund are carried out by or through FMR, its affiliates and other service providers, the fund's exposure to risks is mitigated but not eliminated by the processes overseen by the Trustees. While each of the Board's committees has responsibility for overseeing different aspects of the funds' activities, oversight is exercised primarily through the Operations, Audit, and Compliance Committees. In addition, the Independent Trustees have worked with FMR to enhance the Board's oversight of investment and financial risks, legal and regulatory risks, technology risks, and operational risks, including the development of additional risk reporting to the Board. For example, a working group comprised of Independent Trustees and FMR has worked and continues to work to review the Fidelity funds' valuation-related activities, reporting and risk management. Appropriate personnel, including but not limited to the fund's Chief Compliance Officer (CCO), FMR's internal auditor, the independent accountants, the fund's Treasurer and portfolio management personnel, make periodic reports to the Board's committees, as appropriate, including an annual review of FMR's risk management program for the Fidelity funds. The responsibilities of each standing committee, including their oversight responsibilities, are described further under "Standing Committees of the Fund's Trustees."
Annual Report
The fund's Statement of Additional Information (SAI) includes more information about the Trustees. To request a free copy, call Fidelity at 1-877-208-0098.
Interested Trustees*:
Correspondence intended for each Trustee who is an interested person may be sent to Fidelity Investments, 82 Devonshire Street, Boston, Massachusetts 02109.
Name, Age; Principal Occupations and Other Relevant Experience+ |
James C. Curvey (76) |
| Year of Election or Appointment: 2007 Mr. Curvey is Trustee and Acting Chairman of the Board of Trustees of certain Trusts. Mr. Curvey also serves as Trustee (2007-present) of other investment companies advised by FMR. Mr. Curvey is a Director of Fidelity Investments Money Management, Inc. (2009-present), Director of Fidelity Research & Analysis Co. (2009-present) and Director of FMR and FMR Co., Inc. (2007-present). Mr. Curvey is also Vice Chairman (2007-present) and Director of FMR LLC. In addition, Mr. Curvey serves as an Overseer for the Boston Symphony Orchestra and a member of the Trustees of Villanova University. Previously, Mr. Curvey was the Vice Chairman (2006-2007) and Director (2000-2007) of FMR Corp. |
Ronald P. O'Hanley (54) |
| Year of Election or Appointment: 2011 Mr. O'Hanley is Director of FMR Co., Inc. (2010-present), Director of Fidelity Investments Money Management, Inc. (2010-present), Director of Fidelity Research & Analysis Company (2010-present), President of Fidelity Asset Management and Corporate Services and a member of Fidelity's Executive Committee (2010-present). Previously, Mr. O'Hanley served as President and Chief Executive Officer of BNY Mellon Asset Management (2007-2010). Mr. O'Hanley also served as Vice Chairman of Bank New York Mellon Corp. and a member of that firm's Executive Committee. Prior to the 2007 merger of The Bank of New York and Mellon Financial Corporation, he was Vice Chairman of Mellon Financial Corporation and President and Chief Executive Officer of Mellon Asset Management. He joined Mellon in February 1997. Mr. O'Hanley currently serves as Chairman of the Boston Public Library Foundation Board of Directors and sits on the Board of Directors of Beth Israel Deaconess Medical Center, the Board of Trustees of the Marine Biological Laboratory and the Advisory Board of the Maxwell School of Citizenship and Public Administration at Syracuse University. Mr. O'Hanley also chairs the Council on Asset Management for the Financial Services Roundtable and is a member of the Board of Directors of Institutional Investor's U.S. Institute. |
* Trustees have been determined to be "Interested Trustees" by virtue of, among other things, their affiliation with the trust or various entities under common control with FMR.
+ The information above includes each Trustee's principal occupation during the last five years and other information relating to the experience, attributes, and skills relevant to each Trustee's qualifications to serve as a Trustee, which led to the conclusion that each Trustee should serve as a Trustee for each fund.
Independent Trustees:
Correspondence intended for each Independent Trustee (that is, the Trustees other than the Interested Trustees) may be sent to Fidelity Investments, P.O. Box 55235, Boston, Massachusetts 02205-5235.
Name, Age; Principal Occupations and Other Relevant Experience+ |
Dennis J. Dirks (63) |
| Year of Election or Appointment: 2005 Prior to his retirement in May 2003, Mr. Dirks was Chief Operating Officer and a member of the Board of The Depository Trust & Clearing Corporation (DTCC). He also served as President, Chief Operating Officer, and Board member of The Depository Trust Company (DTC) and President and Board member of the National Securities Clearing Corporation (NSCC). In addition, Mr. Dirks served as Chief Executive Officer and Board member of the Government Securities Clearing Corporation, Chief Executive Officer and Board member of the Mortgage-Backed Securities Clearing Corporation, as a Trustee and a member of the Finance Committee of Manhattan College (2005-2008), and as a Trustee and a member of the Finance Committee of AHRC of Nassau County (2006-2008). Mr. Dirks is a member of the Independent Directors Council (IDC) Governing Council (2010-present) and Board of Directors for The Brookville Center for Children's Services, Inc. (2009-present). |
Alan J. Lacy (58) |
| Year of Election or Appointment: 2008 Mr. Lacy serves as Senior Adviser (2007-present) of Oak Hill Capital Partners, L.P. (private equity). Mr. Lacy also served as Chief Executive Officer (2000-2005) and Vice Chairman (2005-2006) of Sears Holdings Corporation and Sears, Roebuck and Co. (retail). In addition, Mr. Lacy serves as a member of the Board of Directors of Dave & Buster's, Inc. (restaurant and entertainment complexes, 2010-present), The Hillman Companies, Inc. (hardware wholesalers, 2010-present), and Bristol-Myers Squibb Company (global pharmaceuticals, 2007-present). Mr. Lacy is a member of the Board of Trustees of The National Parks Conservation Association (2006-present). Previously, Mr. Lacy served as Chairman of the Board of Trustees of the National Parks Conservation Association (2008-2011) and as a member of the Board of Directors for the Western Union Company (global money transfer, 2006-2011). |
Ned C. Lautenbach (67) |
| Year of Election or Appointment: 2000 Mr. Lautenbach is Chairman of the Independent Trustees of the Equity and High Income Funds (2006-present). Mr. Lautenbach currently serves as the Lead Director of the Eaton Corporation Board of Directors (diversified industrial, 1997-present). Mr. Lautenbach is also a member of the Board of Directors of the Philharmonic Center for the Arts in Naples, Florida (1999-present); a member of the Board of Trustees of Fairfield University (2005-present); and a member of the Council on Foreign Relations (1994-present). Previously, Mr. Lautenbach was a Partner/Advisory Partner at Clayton, Dubilier & Rice, LLC (private equity investment, 1998-2010), as well as a Director of Sony Corporation (2006-2007). |
Joseph Mauriello (67) |
| Year of Election or Appointment: 2008 Prior to his retirement in January 2006, Mr. Mauriello served in numerous senior management positions including Deputy Chairman and Chief Operating Officer (2004-2005), and Vice Chairman of Financial Services (2002-2004) of KPMG LLP US (professional services, 1965-2005). Mr. Mauriello currently serves as a member of the Board of Directors of XL Group plc. (global insurance and re-insurance, 2006-present) and of Arcadia Resources Inc. (health care services and products, 2007-present). Previously, Mr. Mauriello served as a Director of the Hamilton Funds of the Bank of New York (2006-2007). |
Robert W. Selander (61) |
| Year of Election or Appointment: 2011 Previously, Mr. Selander served as a Member of the Advisory Board of Fidelity's Equity and High Income Funds (2011), Executive Vice Chairman (2010), Chief Executive Officer (2009-2010), and President and Chief Executive Officer (1997-2009) of Mastercard, Inc. |
Cornelia M. Small (67) |
| Year of Election or Appointment: 2005 Ms. Small is a member of the Board of Directors of the Teagle Foundation (2009-present). Ms. Small is also a member of the Investment Committee, and Chair (2008-present) and a member of the Board of Trustees of Smith College. In addition, Ms. Small serves on the Investment Committee of the Berkshire Taconic Community Foundation (2008-present). Previously, Ms. Small served as Chairperson of the Investment Committee (2002-2008) of Smith College. In addition, Ms. Small served as Chief Investment Officer, Director of Global Equity Investments, and a member of the Board of Directors of Scudder, Stevens & Clark and Scudder Kemper Investments. |
William S. Stavropoulos (72) |
| Year of Election or Appointment: 2001 Mr. Stavropoulos is Vice Chairman of the Independent Trustees of the Equity and High Income Funds (2006-present). Mr. Stavropoulos serves as President and Founder of the Michigan Baseball Foundation, the Great Lakes Loons (2007-present). Mr. Stavropoulos is Chairman Emeritus of the Board of Directors of The Dow Chemical Company, where he previously served in numerous senior management positions, including President, CEO (1995-2000; 2002-2004), Chairman of the Executive Committee (2000-2006), and as a member of the Board of Directors (1990-2006). Currently, Mr. Stavropoulos is Chairman of Univar (global distributor of commodity and specialty chemicals, 2010-present), a Director of Teradata Corporation (data warehousing and technology solutions, 2008-present), Chemical Financial Corporation, Maersk Inc. (industrial conglomerate), Tyco International, Inc. (multinational manufacturing and services, 2007-present), and a member of the Advisory Board for Metalmark Capital (private equity investment, 2005-present). Mr. Stavropoulos is a special advisor to Clayton, Dubilier & Rice, LLC (private equity investment). In addition, Mr. Stavropoulos is a member of the University of Notre Dame Advisory Council for the College of Science. |
David M. Thomas (62) |
| Year of Election or Appointment: 2008 Previously, Mr. Thomas served as Executive Chairman (2005-2006) and Chairman and Chief Executive Officer (2000-2005) of IMS Health, Inc. (pharmaceutical and healthcare information solutions). In addition, Mr. Thomas serves as a member of the Board of Directors of Fortune Brands, Inc. (consumer products), and Interpublic Group of Companies, Inc. (marketing communication, 2004-present). |
Michael E. Wiley (61) |
| Year of Election or Appointment: 2008 Mr. Wiley also serves as a Director of Asia Pacific Exploration Consolidated (international oil and gas exploration and production, 2008-present). Mr. Wiley serves as a Director of Tesoro Corporation (independent oil refiner and marketer, 2005-present), and a Director of Bill Barrett Corporation (exploration and production, 2005-present). In addition, Mr. Wiley also serves as a Director of Post Oak Bank (privately-held bank, 2004-present). Previously, Mr. Wiley served as a member of the Board of Trustees of the University of Tulsa (2000-2006; 2007-2010), as a Senior Energy Advisor of Katzenbach Partners, LLC (consulting, 2006-2007), as an Advisory Director of Riverstone Holdings (private investment), Chairman, President, and CEO of Baker Hughes, Inc. (oilfield services, 2000-2004), and as Director of Spinnaker Exploration Company (exploration and production, 2001-2005). |
+ The information above includes each Trustee's principal occupation during the last five years and other information relating to the experience, attributes, and skills relevant to each Trustee's qualifications to serve as a Trustee, which led to the conclusion that each Trustee should serve as a Trustee for each fund.
Advisory Board Members and Executive Officers:
Correspondence intended for each executive officer, Edward C. Johnson 3d, and Peter S. Lynch may be sent to Fidelity Investments, 82 Devonshire Street, Boston, Massachusetts 02109.
Name, Age; Principal Occupation |
Edward C. Johnson 3d (81) |
| Year of Election or Appointment: 2011 Member of the Advisory Board of Fidelity's Equity and High Income Funds. Mr. Johnson serves as Chief Executive Officer, Chairman, and a Director of FMR LLC, and also serves as Chairman and Director of FIL Limited. Previously, Mr. Johnson served as a Trustee and Chairman of the Board of certain Fidelity Trusts, Chairman and a Director of FMR, Chairman and a Director of FMR Co., Inc., and President of FMR LLC (2006-2007). |
Peter S. Lynch (67) |
| Year of Election or Appointment: 2003 Member of the Advisory Board of Fidelity's Equity and High Income Funds. Mr. Lynch is Vice Chairman and a Director of FMR and FMR Co., Inc. In addition, Mr. Lynch serves as a Trustee of Boston College and as the Chairman of the Inner-City Scholarship Fund. Previously, Mr. Lynch served on the Special Olympics International Board of Directors (1997-2006). |
Kenneth B. Robins (42) |
| Year of Election or Appointment: 2008 President and Treasurer of Fidelity's Equity and High Income Funds. Mr. Robins also serves as President and Treasurer (2010-present) and Assistant Treasurer (2009-present) of other Fidelity funds and is an employee of Fidelity Investments (2004-present). Previously, Mr. Robins served as Deputy Treasurer of the Fidelity funds (2005-2008) and Treasurer and Chief Financial Officer of The North Carolina Capital Management Trust: Cash and Term Portfolios (2006-2008). |
Brian B. Hogan (47) |
| Year of Election or Appointment: 2009 Vice President of Equity and High Income Funds. Mr. Hogan also serves as President of FMR's Equity Division (2009-present). Previously, Mr. Hogan served as Senior Vice President, Equity Research of FMR (2006-2009) and as a portfolio manager. |
Christopher S. Bartel (40) |
| Year of Election or Appointment: 2009 Vice President of Fidelity's Sector and Real Estate Equity Funds. Mr. Bartel also serves as Senior Vice President of Equity Research (2009-present). Previously, Mr. Bartel served as Managing Director of Research (2006-2009) and an analyst and portfolio manager (2000-2006). |
Scott C. Goebel (43) |
| Year of Election or Appointment: 2008 Secretary and Chief Legal Officer (CLO) of the Fidelity funds. Mr. Goebel also serves as Secretary of Fidelity Investments Money Management, Inc. (FIMM) (2010-present) and Fidelity Research and Analysis Company (FRAC) (2010-present); Secretary and CLO of The North Carolina Capital Management Trust: Cash and Term Portfolios (2008-present); General Counsel, Secretary, and Senior Vice President of FMR (2008-present) and FMR Co., Inc. (2008-present); employed by FMR LLC or an affiliate (2001-present); Chief Legal Officer of Fidelity Management & Research (Hong Kong) Limited (2008-present) and Assistant Secretary of Fidelity Management & Research (Japan) Inc. (2008-present), and Fidelity Management & Research (U.K.) Inc. (2008-present). Previously, Mr. Goebel served as Assistant Secretary of FIMM (2008-2010), FRAC (2008-2010), and the Funds (2007-2008) and as Vice President and Secretary of Fidelity Distributors Corporation (FDC) (2005-2007). |
William C. Coffey (42) |
| Year of Election or Appointment: 2009 Assistant Secretary of Fidelity's Equity and High Income Funds. Mr. Coffey also serves as Senior Vice President and Deputy General Counsel of FMR LLC (2010-present), and is an employee of Fidelity Investments. Previously, Mr. Coffey served as Vice President and Associate General Counsel of FMR LLC (2005-2009). |
Holly C. Laurent (57) |
| Year of Election or Appointment: 2008 Anti-Money Laundering (AML) Officer of the Fidelity funds. Ms. Laurent also serves as AML Officer of The North Carolina Capital Management Trust: Cash and Term Portfolios (2008-present) and is an employee of Fidelity Investments. Previously, Ms. Laurent was Senior Vice President and Head of Legal for Fidelity Business Services India Pvt. Ltd. (2006-2008), and Senior Vice President, Deputy General Counsel and Group Head for FMR LLC (2005-2006). |
Christine Reynolds (53) |
| Year of Election or Appointment: 2008 Chief Financial Officer of the Fidelity funds. Ms. Reynolds became President of Fidelity Pricing and Cash Management Services (FPCMS) in August 2008. Ms. Reynolds served as Chief Operating Officer of FPCMS (2007-2008). Previously, Ms. Reynolds served as President, Treasurer, and Anti-Money Laundering officer of the Fidelity funds (2004-2007). |
Kenneth A. Rathgeber (64) |
| Year of Election or Appointment: 2004 Chief Compliance Officer of Fidelity's Equity and High Income Funds. Mr. Rathgeber is Chief Compliance Officer of Fidelity Management & Research (Hong Kong) Limited (2008-present), Fidelity Management & Research (Japan) Inc. (2008-present), FMR (2005-present), FMR Co., Inc. (2005-present), Fidelity Management & Research (U.K.) Inc. (2005-present), Fidelity Research & Analysis Company (2005-present), Fidelity Investments Money Management, Inc. (2005-present), Pyramis Global Advisors, LLC (2005-present), and Strategic Advisers, Inc. (2005-present). |
Jeffrey S. Christian (50) |
| Year of Election or Appointment: 2009 Deputy Treasurer of the Fidelity funds. Mr. Christian is an employee of Fidelity Investments. Previously, Mr. Christian served as Chief Financial Officer (2008-2009) of certain Fidelity funds and Senior Vice President of Fidelity Pricing and Cash Management Services (FPCMS) (2004-2009). |
Joseph F. Zambello (54) |
| Year of Election or Appointment: 2011 Deputy Treasurer of the Fidelity funds. Mr. Zambello is an employee of Fidelity Investments. Previously, Mr. Zambello served as Vice President of FMR's Program Management Group (2009-2011) and Vice President of the Transfer Agent Oversight Group (2005-2009). |
Adrien E. Deberghes (44) |
| Year of Election or Appointment: 2008 Deputy Treasurer of Fidelity's Equity and High Income Funds. Mr. Deberghes also serves as Vice President and Assistant Treasurer of Fidelity Rutland Square Trust II and Fidelity Commonwealth Trust II (2011-present), Assistant Treasurer of other Fidelity funds (2010-present), and is an employee of Fidelity Investments (2008-present). Previously, Mr. Deberghes served as Senior Vice President of Mutual Fund Administration at State Street Corporation (2007-2008), Senior Director of Mutual Fund Administration at Investors Bank & Trust (2005-2007), and Director of Finance for Dunkin' Brands (2000-2005). |
Stephanie J. Dorsey (42) |
| Year of Election or Appointment: 2010 Assistant Treasurer of Fidelity's Equity and High Income Funds. Ms. Dorsey also serves as Deputy Treasurer of other Fidelity funds (2008-present) and is an employee of Fidelity Investments (2008-present). Previously, Ms. Dorsey served as Treasurer (2004-2008) of the JPMorgan Mutual Funds and Vice President (2004-2008) of JPMorgan Chase Bank. |
John R. Hebble (53) |
| Year of Election or Appointment: 2009 Assistant Treasurer of Fidelity's Equity and High Income Funds. Mr. Hebble also serves as President (2011-present), Treasurer, and Chief Financial Officer of The North Carolina Capital Management Trust: Cash and Term Portfolios (2008-present), President and Treasurer of other Fidelity funds (2008-present) and is an employee of Fidelity Investments. |
Gary W. Ryan (53) |
| Year of Election or Appointment: 2005 Assistant Treasurer of the Fidelity funds. Mr. Ryan is an employee of Fidelity Investments. Previously, Mr. Ryan served as Vice President of Fund Reporting in Fidelity Pricing and Cash Management Services (FPCMS) (1999-2005). |
Jonathan Davis (43) |
| Year of Election or Appointment: 2010 Assistant Treasurer of the Fidelity funds. Mr. Davis is also Assistant Treasurer of Fidelity Rutland Square Trust II and Fidelity Commonwealth Trust II. Mr. Davis is an employee of Fidelity Investments. Previously, Mr. Davis served as Vice President and Associate General Counsel of FMR LLC (2003-2010). |
Annual Report
The Board of Trustees of VIP Health Care Portfolio voted to pay to shareholders of record at the opening of business on record date, the following distributions per share derived from capital gains realized from sales of portfolio securities:
| Pay Date | Record Date | Capital Gains |
Initial Class | 02/03/12 | 02/03/12 | $0.42 |
Investor Class | 02/03/12 | 02/03/12 | $0.42 |
The fund hereby designates as a capital gain dividend with respect to the taxable year ended December 31, 2011, $4,200,822, or, if subsequently determined to be different, the net capital gain of such year.
Annual Report
Board Approval of Investment Advisory Contracts and Management Fees
VIP Health Care Portfolio
Each year, the Board of Trustees, including the Independent Trustees (together, the Board), votes on the renewal of the management contract and sub-advisory agreements (together, the Advisory Contracts) for the fund. The Board, assisted by the advice of fund counsel and Independent Trustees' counsel, requests and considers a broad range of information relevant to the renewal of the Advisory Contracts throughout the year.
The Board meets regularly and considers at each of its meetings factors that are relevant to its annual consideration of the renewal of the fund's Advisory Contracts, including the services and support provided to the fund and its shareholders. The Board has established various standing committees, each composed of Independent Trustees with varying backgrounds, to which the Board has assigned specific subject matter responsibilities in order to enhance effective decision-making by the Board. The Board, acting directly and through its Committees, requests and receives information concerning the annual consideration of the renewal of the fund's Advisory Contracts. The Board also meets as needed to consider matters specifically related to the Board's annual consideration of the renewal of Advisory Contracts. Members of the Board may also meet with trustees of other Fidelity funds through ad hoc joint committees to discuss certain matters relevant to the Fidelity funds.
At its July 2011 meeting, the Board of Trustees, including the Independent Trustees, unanimously determined to renew the fund's Advisory Contracts. In reaching its determination, the Board considered all factors it believed relevant, including (i) the nature, extent, and quality of the services to be provided to the fund and its shareholders (including the investment performance of the fund); (ii) the competitiveness of the fund's management fee and total expense ratio; (iii) the total costs of the services to be provided by and the profits to be realized by Fidelity from its relationship with the fund; (iv) the extent to which economies of scale would be realized as the fund grows; and (v) whether fee levels reflect these economies of scale, if any, for the benefit of fund shareholders.
In considering whether to renew the Advisory Contracts for the fund, the Board reached a determination, with the assistance of fund counsel and Independent Trustees' counsel and through the exercise of its business judgment, that the renewal of the Advisory Contracts is in the best interests of the fund and its shareholders and that the compensation payable under the Advisory Contracts is fair and reasonable. The Board's decision to renew the Advisory Contracts was not based on any single factor, but rather was based on a comprehensive consideration of all the information provided to the Board at its meetings throughout the year. The Board, in reaching its determination to renew the Advisory Contracts, is aware that shareholders in the fund have a broad range of investment choices available to them, including a wide choice among mutual funds offered by Fidelity's competitors, and that the fund's shareholders, who have the opportunity to review and weigh the disclosure provided by the fund in its prospectus and other public disclosures, have chosen to invest in this fund, managed by Fidelity.
Nature, Extent, and Quality of Services Provided. The Board considered the staffing within the investment adviser, FMR, and the sub-advisers (together, the Investment Advisers), including the backgrounds of the fund's investment personnel and the fund's investment objective and discipline. The Independent Trustees also had discussions with senior management of Fidelity's investment operations and investment groups. The Board considered the structure of the portfolio manager compensation program and whether this structure provides appropriate incentives to act in the best interests of the fund.
Resources Dedicated to Investment Management and Support Services. The Board and the Fund Oversight and Research Committees reviewed the general qualifications and capabilities of the Investment Advisers' investment staff, including its size, education, experience, and resources, as well as the Investment Advisers' approach to recruiting, training, managing, and compensating investment personnel. The Board also noted that FMR has devoted increased resources to non-U.S. offices. The Board noted that Fidelity's analysts have extensive resources, tools and capabilities which allow them to conduct sophisticated quantitative and fundamental analysis, as well as credit analysis of issuers, counterparties and enhancers. The Board also believes that Fidelity's investment professionals have sufficient access to global information and data so as to provide competitive investment results over time, and that those professionals also have access to sophisticated tools which permit them to assess portfolio construction and risk and performance attribution characteristics continuously, as well as to transmit new information and research conclusions rapidly around the world. Additionally, in their deliberations, the Board considered the Investment Advisers' trading capabilities and resources which are an integral part of the investment management process.
Shareholder and Administrative Services. The Board considered (i) the nature, extent, quality, and cost of advisory, administrative, and shareholder services performed by the Investment Advisers and their affiliates under the Advisory Contracts and under separate agreements covering transfer agency, pricing and bookkeeping, and securities lending services for the fund; (ii) the nature and extent of the investment adviser's supervision of third party service providers, principally custodians and subcustodians; and (iii) the resources devoted to, and the record of compliance with, the fund's compliance policies and procedures. The Board also reviewed the allocation of fund brokerage, including allocations to brokers affiliated with the Investment Advisers, the use of brokerage commissions to pay fund expenses, and the use of "soft" commission dollars to pay for research services.
The Board noted that the growth of fund assets over time across the complex allows Fidelity to reinvest in the development of services designed to enhance the value or convenience of the Fidelity funds as investment vehicles. These services include 24-hour access to account information and market information through telephone representatives and over the Internet, investor education materials and asset allocation tools, and the expanded availability of Fidelity Investor Centers, with 35 new branches opening since 2010.
Annual Report
Board Approval of Investment Advisory Contracts and Management Fees - continued
Investment in a Large Fund Family. The Board considered the benefits to shareholders of investing in a Fidelity fund, including the benefits of investing in a fund that is part of a large family of funds offering a variety of investment disciplines and providing a large variety of mutual fund investor services. The Board noted that Fidelity had taken, or had made recommendations that resulted in the Fidelity funds taking, a number of actions over the previous year that benefited particular funds, including (i) continuing to dedicate additional resources to investment research and support of the senior management team that oversees asset management; (ii) rationalizing product lines through the mergers of six funds into other funds; (iii) continuing to migrate the Freedom Funds to dedicated lower cost underlying funds; (iv) obtaining shareholder approval to broaden the investment strategies for Fidelity Consumer Finance Portfolio, Fidelity Emerging Asia Fund, and Fidelity Environment and Alternative Energy Portfolio; (v) contractually agreeing to reduce the management fees and impose other expense limitations on Spartan 500 Index Fund and U.S. Bond Index Fund in connection with launching new institutional classes of these funds; (vi) changing the name, primary and supplemental benchmarks, and investment policies of Fidelity Global Strategies Fund to support the fund's flexible investment mandate and global orientation; and (vii) reducing the transfer agency account fee rates on certain accounts.
Investment Performance. The Board considered whether the fund has operated in accordance with its investment objective, as well as its record of compliance with its investment restrictions. It also reviewed the fund's absolute investment performance for each class, as well as the fund's relative investment performance for each class measured over multiple periods against a third-party-sponsored index that reflects the market sector in which the fund invests. The Board noted that FMR does not believe that a meaningful peer group exists against which to compare the fund's performance. The following charts considered by the Board show, over the one-, three-, and five-year periods ended December 31, 2010, the cumulative total returns of Initial Class and Investor Class of the fund and the cumulative total returns of a third-party-sponsored index ("benchmark").
VIP Health Care Portfolio
The Board noted that the investment performance of Initial Class of the fund compared favorably to its benchmark for all the periods shown. The Board considered that the variations in performance between the fund's classes reflect the variations in class expenses, which result in lower performance for the higher expense class. The Board also reviewed the fund's performance since inception as well as performance in the current year.
Based on its review, the Board concluded that the nature, extent, and quality of services provided to the fund under the Advisory Contracts should benefit the fund's shareholders.
Competitiveness of Management Fee and Total Expense Ratio. The Board considered the fund's management fee and total expense ratio compared to "mapped groups" of competitive funds and classes. Fidelity creates "mapped groups" by combining similar Lipper investment objective categories that have comparable management fee characteristics. Combining Lipper investment objective categories aids the Board's management fee and total expense ratio comparisons by broadening the competitive group used for comparison and by reducing the number of universes to which various Fidelity funds are compared.
Management Fee. The Board considered two proprietary management fee comparisons for the 12-month periods shown in the chart below. The group of Lipper funds used by the Board for management fee comparisons is referred to below as the "Total Mapped Group." The Total Mapped Group comparison focuses on a fund's standing relative to the total universe of comparable funds available to investors in terms of gross management fees before expense reimbursements or caps. "TMG %" represents the percentage of funds in the Total Mapped Group that had management fees that were lower than the fund's. For example, a TMG % of 2% means that 98% of the funds in the Total Mapped Group had higher management fees than the fund. The "Asset-Size Peer Group" (ASPG) comparison focuses on a fund's standing relative to non-Fidelity funds similar in size to the fund within the Total Mapped Group. The ASPG represents at least 15% of the funds in the Total Mapped Group with comparable asset size and management fee characteristics, subject to a minimum of 50 funds (or all funds in the Total Mapped Group if fewer than 50). Additional information, such as the ASPG quartile in which the fund's management fee ranked, is also included in the chart and considered by the Board.
Annual Report
VIP Health Care Portfolio
The Board noted that the fund's management fee ranked below the median of its Total Mapped Group and below the median of its ASPG for 2010.
Based on its review, the Board concluded that the fund's management fee is fair and reasonable in light of the services that the fund receives and the other factors considered.
Total Expense Ratio. In its review of each class's total expense ratio, the Board considered the fund's management fee as well as other fund or class expenses, as applicable, such as transfer agent fees, pricing and bookkeeping fees, and custodial, legal, and audit fees. The Board also noted the effects of any waivers and reimbursements on fees and expenses. As part of its review, the Board also considered the current and historical total expense ratios of each class of the fund compared to competitive fund median expenses. Each class of the fund is compared to those funds and classes in the Total Mapped Group (used by the Board for management fee comparisons) that have a similar sales load structure.
The Board noted that the total expense ratio of each class ranked below its competitive median for 2010. The Board considered that various factors, including 12b-1 fees, positive or negative performance adjustments, and relatively higher other expenses in the case of small fund size, can affect total expense ratios. The Board also noted that Investor Class has higher transfer agent fees than traditional variable annuity classes because it is designed for lower cost annuity products, where the majority of servicing costs are incorporated into the funds' total expense ratios rather than being paid at the annuity level.
Fees Charged to Other Fidelity Clients. The Board also considered Fidelity fee structures and other information with respect to clients of FMR and its affiliates, such as other mutual funds advised or subadvised by FMR or its affiliates, pension plan clients, and other institutional clients. In March 2010, the Board created an ad hoc joint committee with the board of other Fidelity funds (the Committee) to review and compare Fidelity's institutional investment advisory business with its business of providing services to the Fidelity funds, including the differences in services provided, fees charged, and costs incurred, as well as competition in their respective marketplaces.
Based on its review of total expense ratios and fees charged to other Fidelity clients, the Board concluded that the total expense ratio of each class of the fund was reasonable in light of the services that the fund and its shareholders receive and the other factors considered, including the findings of the Committee.
Costs of the Services and Profitability. The Board considered the revenues earned and the expenses incurred by Fidelity in conducting the business of developing, marketing, distributing, managing, administering and servicing the fund and its shareholders. The Board also considered the level of Fidelity's profits in respect of all the Fidelity funds.
On an annual basis, FMR presents to the Board Fidelity's profitability for the fund. Fidelity calculates the profitability for each fund, as well as aggregate profitability for groups of Fidelity funds and all Fidelity funds, using a series of detailed revenue and cost allocation methodologies which originate with the books and records of Fidelity on which Fidelity's audited financial statements are based. The Audit Committee of the Board reviews any significant changes from the prior year's methodologies.
Annual Report
Board Approval of Investment Advisory Contracts and Management Fees - continued
PricewaterhouseCoopers LLP (PwC), independent registered public accounting firm and auditor to Fidelity and certain Fidelity funds, has been engaged annually by the Board as part of the Board's assessment of Fidelity's profitability analysis. PwC's engagement includes the review and assessment of Fidelity's methodologies used in determining the revenues and expenses attributable to Fidelity's mutual fund business, and completion of agreed-upon procedures surrounding the mathematical accuracy of fund profitability and its conformity to allocation methodologies. After considering PwC's reports issued under the engagement and information provided by Fidelity, the Board concluded that while other allocation methods may also be reasonable, Fidelity's profitability methodologies are reasonable in all material respects.
The Board also reviewed Fidelity's non-fund businesses and fall-out benefits related to the mutual fund business as well as cases where Fidelity's affiliates may benefit from or be related to the fund's business.
The Board considered the costs of the services provided by and the profits realized by Fidelity in connection with the operation of the fund and was satisfied that the profitability was not excessive in the circumstances.
Economies of Scale. The Board considered whether there have been economies of scale in respect of the management of the Fidelity funds, whether the Fidelity funds (including the fund) have appropriately benefited from any such economies of scale, and whether there is potential for realization of any further economies of scale. The Board considered the extent to which the fund will benefit from economies of scale through increased services to the fund, through waivers or reimbursements, or through fee or expense reductions. The Board also noted that in 2009, it and the board of other Fidelity funds created an ad hoc committee (the Economies of Scale Committee) to analyze whether FMR attains economies of scale in respect of the management and servicing of the Fidelity funds, whether the Fidelity funds have appropriately benefited from such economies of scale, and whether there is potential for realization of any further economies of scale.
The Board recognized that the fund's management contract incorporates a "group fee" structure, which provides for lower group fee rates as total fund assets under FMR's management increase, and for higher group fee rates as total fund assets under FMR's management decrease. FMR calculates the group fee rates based on a tiered asset "breakpoint" schedule that varies based on asset class. The Board considered that the group fee is designed to deliver the benefits of economies of scale to fund shareholders when total Fidelity fund assets increase, even if assets of any particular fund are unchanged or have declined, because some portion of Fidelity's costs are attributable to services provided to all Fidelity funds, and all funds benefit if those costs can be allocated among more assets. The Board concluded that, given the group fee structure, fund shareholders will benefit from lower management fees as assets under FMR's management increase at the fund complex level, regardless of whether Fidelity achieves any such economies of scale.
The Board concluded, taking into account the analysis of the Economies of Scale Committee, that any potential economies of scale are being appropriately shared between fund shareholders and Fidelity.
Additional Information Requested by the Board. In order to develop fully the factual basis for consideration of the Fidelity funds' Advisory Contracts, the Board requested and received additional information on certain topics, including (i) fund performance trends, actions to be taken by FMR to improve certain funds' overall performance, and Fidelity's long-term strategies for certain funds; (ii) portfolio manager changes that have occurred during the past year and length of portfolio manager tenure for different categories of funds over time; (iii) Fidelity's compensation structure for portfolio managers and other key personnel and strategies for attracting and retaining non-investment personnel; (iv) the amount of the investment that each portfolio manager has made in the Fidelity fund(s) that he or she manages; (v) historical trends in Fidelity's realization of fall-out benefits; (vi) Fidelity's group fee structures and the rationale for the individual fee rates of certain funds; (vii) fund profitability methodology and the impact of certain factors on fund profitability results; (viii) trends regarding industry use of performance fee structures and Fidelity's compliance practices with respect to performance adjustment calculations; (ix) the fee structures in place for certain other Fidelity clients; and (x) explanations regarding the relative total expense ratios of certain funds and classes, total expense competitive trends, and actions that might be taken by FMR to reduce total expense ratios for certain funds and classes.
Based on its evaluation of all of the conclusions noted above, and after considering all factors it believed relevant, the Board ultimately concluded that the advisory fee structures are fair and reasonable, and that the fund's Advisory Contracts should be renewed.
Annual Report
Investment Adviser
Fidelity Management & Research Company
Boston, MA
Investment Sub-Advisers
FMR Co., Inc.
Fidelity Management & Research (U.K.) Inc.
Fidelity Management & Research (Hong Kong) Limited
Fidelity Management & Research (Japan) Inc.
General Distributor
Fidelity Distributors Corporation
Boston, MA
Transfer and Service Agents
Fidelity Investments Institutional Operations Company, Inc.
Boston, MA
Fidelity Service Company, Inc.
Boston, MA
Custodian
JPMorgan Chase Bank
New York, NY
VHCIC-ANN-0212
1.817373.106
Fidelity® Variable Insurance Products:
Industrials Portfolio
Annual Report
December 31, 2011
Contents
Performance | (Click Here) | How the fund has done over time. |
Management's Discussion of Fund Performance | (Click Here) | The Portfolio Manager's review of fund performance and strategy. |
Shareholder Expense Example | (Click Here) | An example of shareholder expenses. |
Investment Changes | (Click Here) | A summary of major shifts in the fund's investments over the past six months. |
Investments | (Click Here) | A complete list of the fund's investments with their market values. |
Financial Statements | (Click Here) | Statements of assets and liabilities, operations, and changes in net assets, as well as financial highlights. |
Notes | (Click Here) | Notes to the financial statements. |
Report of Independent Registered Public Accounting Firm | (Click Here) | |
Trustees and Officers | (Click Here) | |
Distributions | (Click Here) | |
Board Approval of Investment Advisory Contracts and Management Fees | (Click Here) | |
To view a fund's proxy voting guidelines and proxy voting record for the 12-month period ended June 30, visit http://www.fidelity.com/proxyvotingresults or visit the Securities and Exchange Commission's (SEC) web site at http://www.sec.gov. You may also call 1-877-208-0098 to request a free copy of the proxy voting guidelines.
Fidelity Variable Insurance Products are separate account options which are purchased through a variable insurance contract.
Standard & Poor's, S&P and S&P 500 are registered service marks of The McGraw-Hill Companies, Inc. and have been licensed for use by Fidelity Distributors Corporation.
Other third party marks appearing herein are the property of their respective owners.
All other marks appearing herein are registered or unregistered trademarks or service marks of FMR LLC or an affiliated company.
This report and the financial statements contained herein are submitted for the general information of the shareholders of the fund. This report is not authorized for distribution to prospective investors in the fund unless preceded or accompanied by an effective prospectus.
A fund files its complete schedule of portfolio holdings with the SEC for the first and third quarters of each fiscal year on Form N-Q. Forms N-Q are available on the SEC's web site at http://www.sec.gov. A fund's Forms N-Q may be reviewed and copied at the SEC's Public Reference Room in Washington, DC. Information regarding the operation of the SEC's Public Reference Room may be obtained by calling 1-800-SEC-0330. For a complete list of a fund's portfolio holdings, view the most recent holdings listing, semiannual report, or annual report on Fidelity's web site at http://www.fidelity.com, http://www.advisor.fidelity.com, or http://www.401k.com, as applicable.
NOT FDIC INSURED • MAY LOSE VALUE • NO BANK GUARANTEE
Neither the fund nor Fidelity Distributors Corporation is a bank.
Annual Report
Average annual total return reflects the change in the value of an investment, assuming reinvestment of the class' distributions from dividend income and capital gains (the profits earned upon the sale of securities that have grown in value, if any) and assuming a constant rate of performance each year. During periods of reimbursement by Fidelity, a fund's total return will be greater than it would be had the reimbursement not occurred. Performance numbers are net of all underlying fund operating expenses, but do not include any insurance charges imposed by your insurance company's separate account. If performance information included the effect of these additional charges, the total returns would have been lower. How a fund did yesterday is no guarantee of how it will do tomorrow.
Average Annual Total Returns
Periods ended December 31, 2011 | Past 1
year | Past 5
years | Past 10
years |
VIP Industrials Portfolio - Initial Class A | -4.65% | 4.50% | 8.44% |
VIP Industrials Portfolio - Investor Class A,B | -4.70% | 4.42% | 8.36% |
A Prior to October 1, 2006, VIP Industrials Portfolio operated under certain different investment policies. The historical performance for the fund may not represent its current investment policies.
B The initial offering of Investor Class shares took place on July 21, 2005. Returns prior to July 21, 2005, are those of Initial Class. Had Investor Class's transfer agent fee been reflected, returns prior to July 21, 2005, would have been lower.
$10,000 Over 10 Years
Let's say hypothetically that $10,000 was invested in VIP Industrials Portfolio - Initial Class on December 31, 2001. The chart shows how the value of your investment would have changed, and also shows how the S&P 500® Index performed over the same period.
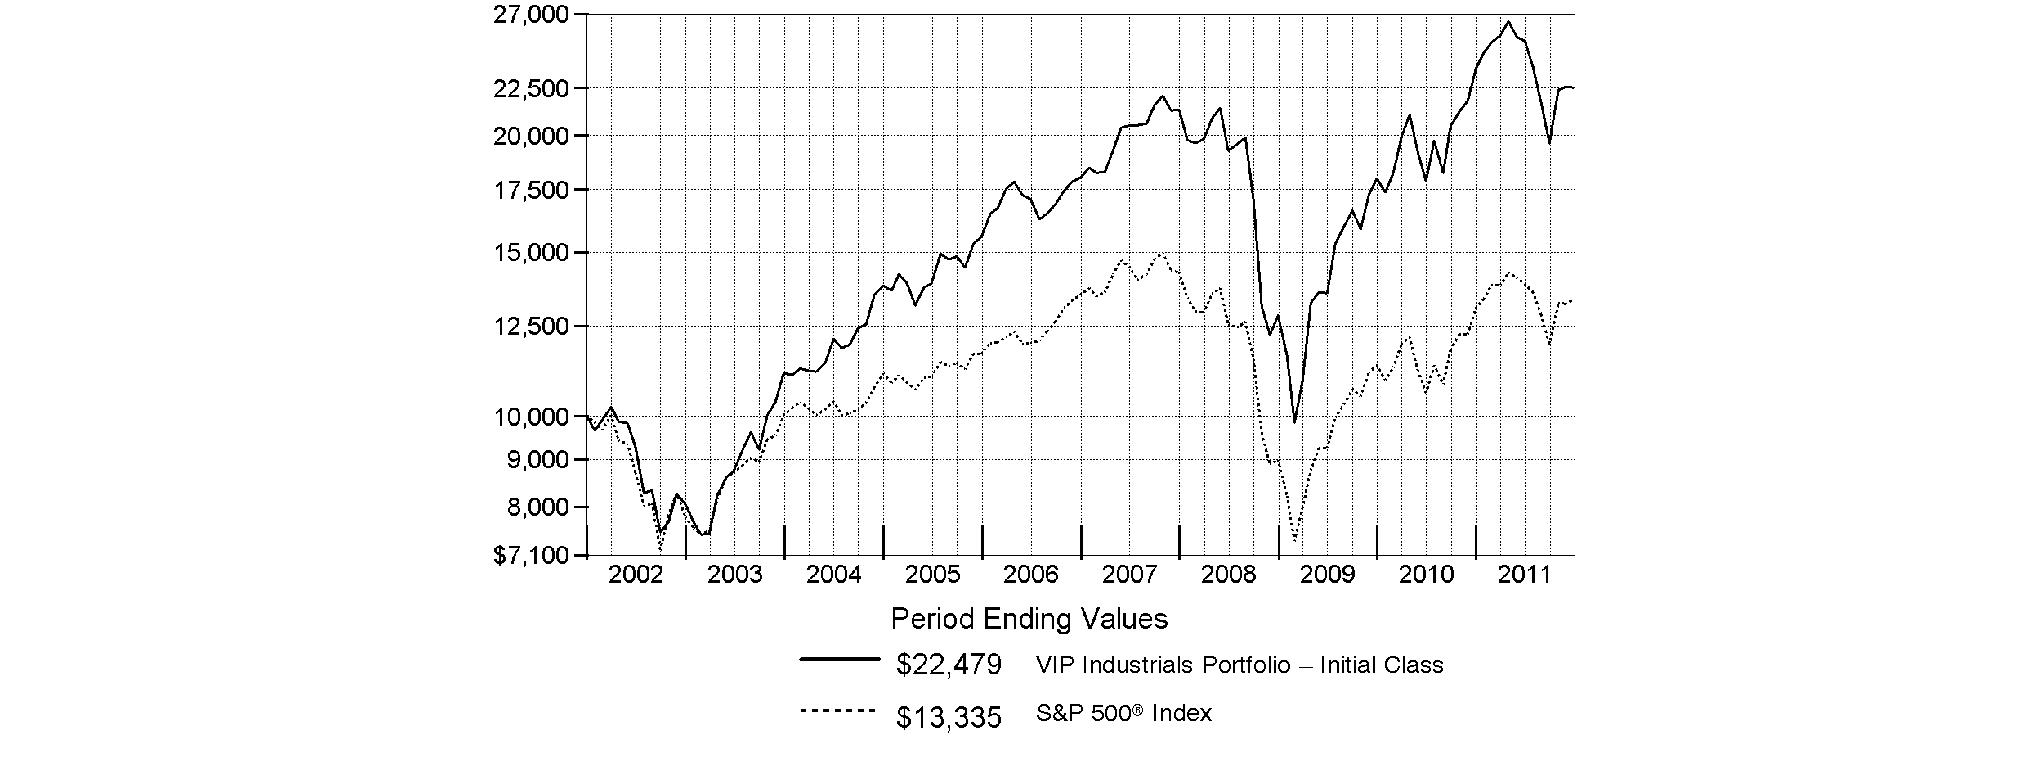
Annual Report
Market Recap: Extreme market volatility took center stage during the 12 months ending December 31, 2011, stealing the spotlight from signs of progress in the global economy. Early in the year, aggressive monetary stimulus by the U.S. federal government, improving credit-market conditions and solid corporate earnings buoyed most major asset classes. As the period progressed, however, fresh worries about sovereign debt in Europe, inflation in China, gridlock over raising the debt ceiling in the U.S. - along with Standard & Poor's early-August downgrade of the nation's long-term sovereign credit rating - and a dimmed outlook for global growth punctured investor confidence and ignited market instability. Domestic equities, as measured by the broad-based S&P 500® Index, gained 2.11%, easily outpacing the 13.61% decline of MSCI® ACWI® (All Country World Index) ex USA Index, a proxy for foreign stocks. Within the MSCI index, emerging markets declined the most (-18%), with investments here generally held back by a stronger U.S. dollar. The U.K. (-3%) fared better than the rest of Europe (-15%), which was the second-worst-performing index component. Bolstered by periodic flights to quality, U.S. investment-grade bonds posted a 7.84% advance, as reflected by the Barclays Capital® U.S. Aggregate Bond Index, outperforming the 4.37% gain of high-yield securities, as represented by The BofA Merrill LynchSM US High Yield Constrained Index. Hampered by financial woes in Europe, the sovereign debt of major developed markets outside the U.S. rose 4.86%, according to the Citigroup® Non-USD Group-of-Seven (G7) Equal Weighted Index, while the JPMorgan Emerging Markets Bond Index Global (EMBI Global) advanced 8.46%, despite the currency head wind.
Comments from Tobias Welo, Portfolio Manager of VIP Industrials Portfolio: During the year, the fund's share classes lagged the -2.02% return of the MSCI® U.S. IM Industrials 25/50 Index and also trailed the broadly based S&P 500® Index. (For specific portfolio results, please refer to the performance section of this report.) The fund managed to stay about even with the MSCI index through mid-year. Later in the summer, as the investment environment deteriorated, I made the decision to modestly increase the fund's cash holdings and to raise its allocations to several high-quality companies I thought might outperform in a slower-growth environment. While the fund continued to roughly keep pace with the MSCI index in the weak third quarter, its more-defensive tilt dampened results in the fourth quarter, when share prices enjoyed a solid rebound. For the full one-year period, stock selection in industrial machinery and trading companies/distributors worked against the fund's relative results, as did positioning in electrical components/equipment and construction/engineering. At the stock level, diversified industrial and commercial products firm Ingersoll-Rand was the fund's largest detractor. The company experienced rising inventories amid slowing demand, and issued disappointing financial guidance or results on several occasions. Also curbing fund performance were construction/engineering firm Foster Wheeler, GrafTech International - which sells graphite electrodes, a component in the arc furnaces used for forging steel - and India-based Jain Irrigation Systems. Underweighting and ultimately selling strong-performing aerospace manufacturer and index component Boeing worked against us as well. Conversely, minimal representation in the weak-performing airlines group boosted relative performance, as did stock picking in human resource/employment services. Aerospace components supplier Goodrich was the fund's top relative contributor. The stock surged higher in September after the company received a lucrative takeover bid from United Technologies, and I sold Goodrich by period end to lock in profits. Rail carrier Union Pacific also added value, along with heavy equipment maker Caterpillar - the latter of which I sold during the summer to good effect - and employee benefits consultant Towers Watson.
The views expressed above reflect those of the portfolio manager(s) only through the end of the period as stated on the cover of this report and do not necessarily represent the views of Fidelity or any other person in the Fidelity organization. Any such views are subject to change at any time based upon market or other conditions and Fidelity disclaims any responsibility to update such views. These views may not be relied on as investment advice and, because investment decisions for a Fidelity fund are based on numerous factors, may not be relied on as an indication of trading intent on behalf of any Fidelity fund.
Annual Report
As a shareholder of the Fund, you incur two types of costs: (1) transaction costs, including redemption fees, and (2) ongoing costs, including management fees and other Fund expenses. This Example is intended to help you understand your ongoing costs (in dollars) of investing in the Fund and to compare these costs with the ongoing costs of investing in other mutual funds.
The Example is based on an investment of $1,000 invested at the beginning of the period and held for the entire period (July 1, 2011 to December 31, 2011).
Actual Expenses
The first line of the accompanying table for each class of the Fund provides information about actual account values and actual expenses. You may use the information in this line, together with the amount you invested, to estimate the expenses that you paid over the period. Simply divide your account value by $1,000.00 (for example, an $8,600 account value divided by $1,000.00 = 8.6), then multiply the result by the number in the first line for a class of the Fund under the heading entitled "Expenses Paid During Period" to estimate the expenses you paid on your account during this period. The estimate of expenses does not include any fees or other expenses of any variable annuity or variable life insurance product. If they were, the estimate of expenses you paid during the period would be higher, and your ending account value would be lower. In addition, the Fund, as a shareholder in the underlying Fidelity Central Funds, will indirectly bear its pro-rata share of the fees and expenses incurred by the underlying Fidelity Central Funds. These fees and expenses are not included in the Fund's annualized expense ratio used to calculate the expense estimate in the table below.
Hypothetical Example for Comparison Purposes
The second line of the accompanying table for each class of the Fund provides information about hypothetical account values and hypothetical expenses based on a Class' actual expense ratio and an assumed rate of return of 5% per year before expenses, which is not the Class' actual return. The hypothetical account values and expenses may not be used to estimate the actual ending account balance or expenses you paid for the period. You may use this information to compare the ongoing costs of investing in the Fund and other funds. To do so, compare this 5% hypothetical example with the 5% hypothetical examples that appear in the shareholder reports of the other funds. The estimate of expenses does not include any fees or other expenses of any variable annuity or variable life insurance product. If they were, the estimate of expenses you paid during the period would be higher, and your ending account value would be lower. In addition, the Fund, as a shareholder in the underlying Fidelity Central Funds, will indirectly bear its pro-rata share of the fees and expenses incurred by the underlying Fidelity Central Funds. These fees and expenses are not included in the Fund's annualized expense ratio used to calculate the expense estimate in the table below.
Please note that the expenses shown in the table are meant to highlight your ongoing costs only and do not reflect any transaction costs. Therefore, the second line of the table is useful in comparing ongoing costs only, and will not help you determine the relative total costs of owning different funds. In addition, if these transactional costs were included, your costs would have been higher.
| Annualized
Expense Ratio | Beginning
Account Value
July 1, 2011 | Ending
Account Value
December 31, 2011 | Expenses Paid
During Period*
July 1, 2011 to
December 31, 2011 |
Initial Class | .74% | | | |
Actual | | $ 1,000.00 | $ 890.40 | $ 3.53 |
Hypothetical A | | $ 1,000.00 | $ 1,021.48 | $ 3.77 |
Investor Class | .83% | | | |
Actual | | $ 1,000.00 | $ 890.20 | $ 3.95 |
Hypothetical A | | $ 1,000.00 | $ 1,021.02 | $ 4.23 |
A 5% return per year before expenses
* Expenses are equal to each Class' annualized expense ratio, multiplied by the average account value over the period, multiplied by 184/365 (to reflect the one-half year period).
Annual Report
Investment Changes (Unaudited)
Top Ten Stocks as of December 31, 2011 |
| % of fund's
net assets | % of fund's net assets
6 months ago |
General Electric Co. | 13.5 | 12.9 |
United Technologies Corp. | 6.2 | 5.6 |
Union Pacific Corp. | 5.0 | 4.9 |
United Parcel Service, Inc. Class B | 3.9 | 0.0 |
3M Co. | 3.8 | 1.3 |
Danaher Corp. | 3.8 | 3.4 |
Honeywell International, Inc. | 3.4 | 3.5 |
Emerson Electric Co. | 3.3 | 3.8 |
Cummins, Inc. | 3.0 | 2.7 |
CSX Corp. | 2.3 | 0.0 |
| 48.2 | |
Top Industries (% of fund's net assets) |
As of December 31, 2011 |
| Industrial Conglomerates | 23.9% | |
| Machinery | 16.1% | |
| Aerospace & Defense | 15.0% | |
| Electrical Equipment | 11.2% | |
| Road & Rail | 7.8% | |
| All Others* | 26.0% | |

As of June 30, 2011 |
| Aerospace & Defense | 23.2% | |
| Machinery | 19.2% | |
| Industrial Conglomerates | 17.5% | |
| Electrical Equipment | 10.8% | |
| Construction & Engineering | 6.6% | |
| All Others* | 22.7% | |

* Includes short-term investments and net other assets. |
Annual Report
Investments December 31, 2011
Showing Percentage of Net Assets
Common Stocks - 97.0% |
| Shares | | Value |
AEROSPACE & DEFENSE - 15.0% |
Aerospace & Defense - 15.0% |
Esterline Technologies Corp. (a) | 8,584 | | $ 480,446 |
Honeywell International, Inc. | 51,834 | | 2,817,178 |
Precision Castparts Corp. | 9,077 | | 1,495,799 |
Rockwell Collins, Inc. | 20,098 | | 1,112,826 |
Textron, Inc. | 74,760 | | 1,382,312 |
United Technologies Corp. | 70,152 | | 5,127,410 |
| | 12,415,971 |
AIR FREIGHT & LOGISTICS - 5.5% |
Air Freight & Logistics - 5.5% |
C.H. Robinson Worldwide, Inc. | 11,870 | | 828,289 |
United Parcel Service, Inc. Class B | 44,721 | | 3,273,130 |
UTI Worldwide, Inc. | 37,356 | | 496,461 |
| | 4,597,880 |
AUTO COMPONENTS - 0.5% |
Auto Parts & Equipment - 0.5% |
Autoliv, Inc. | 8,200 | | 438,618 |
BUILDING PRODUCTS - 2.2% |
Building Products - 2.2% |
Armstrong World Industries, Inc. | 17,200 | | 754,564 |
Owens Corning (a) | 35,600 | | 1,022,432 |
| | 1,776,996 |
COMMERCIAL SERVICES & SUPPLIES - 2.0% |
Environmental & Facility Services - 1.4% |
Republic Services, Inc. | 43,518 | | 1,198,921 |
Office Services & Supplies - 0.6% |
Mine Safety Appliances Co. | 14,147 | | 468,549 |
TOTAL COMMERCIAL SERVICES & SUPPLIES | | 1,667,470 |
CONSTRUCTION & ENGINEERING - 4.1% |
Construction & Engineering - 4.1% |
AECOM Technology Corp. (a) | 32,334 | | 665,110 |
EMCOR Group, Inc. | 31,639 | | 848,242 |
Foster Wheeler AG (a) | 28,640 | | 548,170 |
Jacobs Engineering Group, Inc. (a) | 21,907 | | 888,986 |
Quanta Services, Inc. (a) | 21,349 | | 459,857 |
| | 3,410,365 |
ELECTRICAL EQUIPMENT - 11.2% |
Electrical Components & Equipment - 11.2% |
AMETEK, Inc. | 25,625 | | 1,078,813 |
Cooper Industries PLC Class A | 19,913 | | 1,078,289 |
Emerson Electric Co. | 58,884 | | 2,743,406 |
GrafTech International Ltd. (a) | 51,700 | | 705,705 |
Hubbell, Inc. Class B | 9,383 | | 627,347 |
Polypore International, Inc. (a) | 11,000 | | 483,890 |
Prysmian SpA | 27,687 | | 343,866 |
|
| Shares | | Value |
Regal-Beloit Corp. | 22,495 | | $ 1,146,570 |
Roper Industries, Inc. | 12,442 | | 1,080,837 |
| | 9,288,723 |
ENERGY EQUIPMENT & SERVICES - 0.5% |
Oil & Gas Equipment & Services - 0.5% |
McDermott International, Inc. (a) | 35,900 | | 413,209 |
INDUSTRIAL CONGLOMERATES - 23.9% |
Industrial Conglomerates - 23.9% |
3M Co. | 38,993 | | 3,186,898 |
Carlisle Companies, Inc. | 9,917 | | 439,323 |
Danaher Corp. | 67,148 | | 3,158,642 |
General Electric Co. | 627,331 | | 11,235,498 |
Tyco International Ltd. | 39,873 | | 1,862,468 |
| | 19,882,829 |
MACHINERY - 16.1% |
Construction & Farm Machinery & Heavy Trucks - 5.4% |
Cummins, Inc. | 27,933 | | 2,458,663 |
Fiat Industrial SpA (a) | 67,404 | | 578,016 |
Jain Irrigation Systems Ltd. | 172,591 | | 281,765 |
Jain Irrigation Systems Ltd. DVR (a) | 8,629 | | 5,737 |
Manitowoc Co., Inc. | 30,916 | | 284,118 |
Sauer-Danfoss, Inc. (a) | 5,700 | | 206,397 |
WABCO Holdings, Inc. (a) | 16,200 | | 703,080 |
| | 4,517,776 |
Industrial Machinery - 10.7% |
Actuant Corp. Class A | 22,354 | | 507,212 |
Dover Corp. | 17,500 | | 1,015,875 |
Flowserve Corp. | 9,205 | | 914,241 |
Graco, Inc. | 24,232 | | 990,846 |
Harsco Corp. | 5,089 | | 104,732 |
Ingersoll-Rand PLC | 44,209 | | 1,347,048 |
Pall Corp. | 19,500 | | 1,114,425 |
Parker Hannifin Corp. | 21,900 | | 1,669,875 |
SPX Corp. | 8,800 | | 530,376 |
TriMas Corp. (a) | 38,072 | | 683,392 |
| | 8,878,022 |
TOTAL MACHINERY | | 13,395,798 |
PROFESSIONAL SERVICES - 4.1% |
Human Resource & Employment Services - 2.5% |
Kforce, Inc. (a) | 36,843 | | 454,274 |
Manpower, Inc. | 11,300 | | 403,975 |
Robert Half International, Inc. | 23,600 | | 671,656 |
Towers Watson & Co. | 9,514 | | 570,174 |
| | 2,100,079 |
Common Stocks - continued |
| Shares | | Value |
PROFESSIONAL SERVICES - CONTINUED |
Research & Consulting Services - 1.6% |
Bureau Veritas SA | 3,800 | | $ 276,924 |
IHS, Inc. Class A (a) | 12,171 | | 1,048,653 |
| | 1,325,577 |
TOTAL PROFESSIONAL SERVICES | | 3,425,656 |
ROAD & RAIL - 7.8% |
Railroads - 7.3% |
CSX Corp. | 88,550 | | 1,864,863 |
Union Pacific Corp. | 39,528 | | 4,187,596 |
| | 6,052,459 |
Trucking - 0.5% |
Con-way, Inc. | 15,036 | | 438,450 |
TOTAL ROAD & RAIL | | 6,490,909 |
TRADING COMPANIES & DISTRIBUTORS - 4.1% |
Trading Companies & Distributors - 4.1% |
Mills Estruturas e Servicos de Engenharia SA | 59,500 | | 565,237 |
Rush Enterprises, Inc. Class A (a) | 18,923 | | 395,869 |
W.W. Grainger, Inc. | 4,900 | | 917,231 |
Watsco, Inc. | 9,600 | | 630,336 |
WESCO International, Inc. (a) | 17,050 | | 903,821 |
| | 3,412,494 |
TOTAL COMMON STOCKS (Cost $76,265,307) |
80,616,918
|
Convertible Bonds - 0.5% |
| Principal Amount | | |
BUILDING PRODUCTS - 0.5% |
Building Products - 0.5% |
Aspen Aerogels, Inc.: | | | | |
8% 6/1/14 (d) | | $ 249,306 | | 249,306 |
8% 12/6/14 (d) | | 176,300 | | 176,300 |
TOTAL CONVERTIBLE BONDS (Cost $425,606) |
425,606
|
U.S. Treasury Obligations - 0.1% |
|
U.S. Treasury Bills, yield at date of purchase 0.01% 3/1/12 (c)
(Cost $99,999) | | 100,000 | |
99,998
|
Money Market Funds - 2.3% |
| Shares | | Value |
Fidelity Cash Central Fund, 0.11% (b)
(Cost $1,875,105) | 1,875,105 | | $ 1,875,105 |
TOTAL INVESTMENT PORTFOLIO - 99.9% (Cost $78,666,017) | | 83,017,627 |
NET OTHER ASSETS (LIABILITIES) - 0.1% | | 97,056 |
NET ASSETS - 100% | $ 83,114,683 |
Futures Contracts |
| Expiration Date | | Underlying Face Amount at Value | | Unrealized Appreciation/(Depreciation) |
Purchased |
Equity Index Contracts |
26 CME E-mini S&P Select Sector Industrial Index Contracts | March 2012 | | $ 874,900 | | $ (4) |
|
The face value of futures purchased as a percentage of net assets is 1.1% |
Legend |
(a) Non-income producing |
(b) Affiliated fund that is available only to investment companies and other accounts managed by Fidelity Investments. The rate quoted is the annualized seven-day yield of the fund at period end. A complete unaudited listing of the fund's holdings as of its most recent quarter end is available upon request. In addition, each Fidelity Central Fund's financial statements, which are not covered by the Fund's Report of Independent Registered Public Accounting Firm, are available on the SEC's website or upon request. |
(c) Security or a portion of the security was pledged to cover margin requirements for futures contracts. At the period end, the value of securities pledged amounted to $99,998. |
(d) Restricted securities - Investment in securities not registered under the Securities Act of 1933 (excluding 144A issues). At the end of the period, the value of restricted securities (excluding 144A issues) amounted to $425,606 or 0.5% of net assets. |
Additional information on each restricted holding is as follows: |
Security | Acquisition Date | Acquisition Cost |
Aspen Aerogels, Inc. 8% 6/1/14 | 6/14/11 | $ 249,306 |
Aspen Aerogels, Inc. 8% 12/6/14 | 12/6/11 | $ 176,300 |
Affiliated Central Funds |
Information regarding fiscal year to date income earned by the Fund from investments in Fidelity Central Funds is as follows: |
Fund | Income earned |
Fidelity Cash Central Fund | $ 3,685 |
Fidelity Securities Lending Cash Central Fund | 9,700 |
Total | $ 13,385 |
Other Information |
The following is a summary of the inputs used, as of December 31, 2011, involving the Fund's assets and liabilities carried at fair value. The inputs or methodology used for valuing securities may not be an indication of the risk associated with investing in those securities. For more information on valuation inputs, and their aggregation into the levels used in the tables below, please refer to the Security Valuation section in the accompanying Notes to Financial Statements. |
Valuation Inputs at Reporting Date: |
Description | Total | Level 1 | Level 2 | Level 3 |
Investments in Securities: | | | | |
Common Stocks | $ 80,616,918 | $ 80,616,918 | $ - | $ - |
Convertible Bonds | 425,606 | - | - | 425,606 |
U.S. Treasury Obligations | 99,998 | - | 99,998 | - |
Money Market Funds | 1,875,105 | 1,875,105 | - | - |
Total Investments in Securities: | $ 83,017,627 | $ 82,492,023 | $ 99,998 | $ 425,606 |
Derivative Instruments: | | | | |
Liabilities | | | | |
Futures Contracts | $ (4) | $ (4) | $ - | $ - |
The following is a reconciliation of Investments in Securities for which Level 3 inputs were used in determining value: |
Investments in Securities: | |
Beginning Balance | $ - |
Total Realized Gain (Loss) | - |
Total Unrealized Gain (Loss) | - |
Cost of Purchases | 425,606 |
Proceeds of Sales | - |
Amortization/Accretion | - |
Transfers in to Level 3 | - |
Transfers out of Level 3 | - |
Ending Balance | $ 425,606 |
The change in unrealized gain (loss) for the period attributable to Level 3 securities held at December 31, 2011 | $ - |
The information used in the above reconciliation represents fiscal year to date activity for any Investments in Securities identified as using Level 3 inputs at either the beginning or the end of the current fiscal period. Transfers in or out of Level 3 represent the beginning value of any Security or Instrument where a change in the pricing level occurred from the beginning to the end of the period. The cost of purchases and the proceeds of sales may include securities received or delivered through corporate actions or exchanges. Realized and unrealized gains (losses) disclosed in the reconciliation are included in Net Gain (Loss) on the Fund's Statement of Operations. |
Value of Derivative Instruments |
The following table is a summary of the Fund's value of derivative instruments by risk exposure as of December 31, 2011. For additional information on derivative instruments, please refer to the Derivative Instruments section in the accompanying Notes to Financial Statements. |
Risk Exposure /
Derivative Type | Value |
| Asset | Liability |
Equity Risk | | |
Futures Contracts (a) | $ - | $ (4) |
Total Value of Derivatives | $ - | $ (4) |
(a) Reflects cumulative appreciation/(depreciation) on futures contracts as disclosed on the Schedule of Investments. Only the period end variation margin is separately disclosed on the Statement of Assets and Liabilities. |
See accompanying notes which are an integral part of the financial statements.
Annual Report
Statement of Assets and Liabilities
| December 31, 2011 |
Assets | | |
Investment in securities, at value - See accompanying schedule: Unaffiliated issuers (cost $76,790,912) | $ 81,142,522 | |
Fidelity Central Funds (cost $1,875,105) | 1,875,105 | |
Total Investments (cost $78,666,017) | | $ 83,017,627 |
Receivable for investments sold | | 71,980 |
Dividends receivable | | 178,164 |
Interest receivable | | 11,850 |
Distributions receivable from Fidelity Central Funds | | 281 |
Prepaid expenses | | 350 |
Other receivables | | 688 |
Total assets | | 83,280,940 |
| | |
Liabilities | | |
Payable for investments purchased | $ 7,341 | |
Payable for fund shares redeemed | 71,558 | |
Accrued management fee | 38,871 | |
Payable for daily variation margin on futures contracts | 3,900 | |
Other affiliated payables | 10,686 | |
Other payables and accrued expenses | 33,901 | |
Total liabilities | | 166,257 |
| | |
Net Assets | | $ 83,114,683 |
Net Assets consist of: | | |
Paid in capital | | $ 82,530,698 |
Distributions in excess of net investment income | | (395) |
Accumulated undistributed net realized gain (loss) on investments and foreign currency transactions | | (3,767,054) |
Net unrealized appreciation (depreciation) on investments and assets and liabilities in foreign currencies | | 4,351,434 |
Net Assets | | $ 83,114,683 |
Statement of Assets and Liabilities - continued
| December 31, 2011 |
Initial Class:
Net Asset Value, offering price and redemption price per share ($34,853,931 ÷ 2,438,362 shares) | | $ 14.29 |
| | |
Investor Class:
Net Asset Value, offering price and redemption price per share ($48,260,752 ÷ 3,389,344 shares) | | $ 14.24 |
See accompanying notes which are an integral part of the financial statements.
Annual Report
Financial Statements - continued
Statement of Operations
| Year ended December 31, 2011 |
Investment Income | | |
Dividends | | $ 1,649,467 |
Interest | | 11,860 |
Income from Fidelity Central Funds | | 13,385 |
Total income | | 1,674,712 |
| | |
Expenses | | |
Management fee | $ 580,485 | |
Transfer agent fees | 129,542 | |
Accounting and security lending fees | 40,643 | |
Custodian fees and expenses | 24,082 | |
Independent trustees' compensation | 583 | |
Audit | 38,615 | |
Legal | 395 | |
Miscellaneous | 824 | |
Total expenses before reductions | 815,169 | |
Expense reductions | (8,201) | 806,968 |
Net investment income (loss) | | 867,744 |
Realized and Unrealized Gain (Loss) Net realized gain (loss) on: | | |
Investment securities: | | |
Unaffiliated issuers | 6,062,626 | |
Foreign currency transactions | (18,376) | |
Futures contracts | 101,622 | |
Total net realized gain (loss) | | 6,145,872 |
Change in net unrealized appreciation (depreciation) on: Investment securities | (14,690,540) | |
Assets and liabilities in foreign currencies | (292) | |
Futures contracts | (4) | |
Total change in net unrealized appreciation (depreciation) | | (14,690,836) |
Net gain (loss) | | (8,544,964) |
Net increase (decrease) in net assets resulting from operations | | $ (7,677,220) |
Statement of Changes in Net Assets
| Year ended
December 31, 2011 | Year ended
December 31, 2010 |
Increase (Decrease) in Net Assets | | |
Operations | | |
Net investment income (loss) | $ 867,744 | $ 509,405 |
Net realized gain (loss) | 6,145,872 | 5,081,295 |
Change in net unrealized appreciation (depreciation) | (14,690,836) | 12,728,692 |
Net increase (decrease) in net assets resulting from operations | (7,677,220) | 18,319,392 |
Distributions to shareholders from net investment income | (889,220) | (468,304) |
Share transactions - net increase (decrease) | (484,759) | 16,185,455 |
Redemption fees | 39,357 | 27,168 |
Total increase (decrease) in net assets | (9,011,842) | 34,063,711 |
| | |
Net Assets | | |
Beginning of period | 92,126,525 | 58,062,814 |
End of period (including distributions in excess of net investment income of $395 and undistributed net investment income of $22,058, respectively) | $ 83,114,683 | $ 92,126,525 |
See accompanying notes which are an integral part of the financial statements.
Annual Report
Financial Highlights - Initial Class
Years ended December 31, | 2011 | 2010 | 2009 | 2008 | 2007 |
Selected Per-Share Data | | | | | |
Net asset value, beginning of period | $ 15.16 | $ 11.63 | $ 8.37 | $ 14.43 | $ 13.90 |
Income from Investment Operations | | | | | |
Net investment income (loss) C | .13 | .10 | .10 | .12 | .10 |
Net realized and unrealized gain (loss) | (.85) | 3.51 | 3.27 | (5.79) | 2.43 |
Total from investment operations | (.72) | 3.61 | 3.37 | (5.67) | 2.53 |
Distributions from net investment income | (.16) | (.09) | (.11) | (.14) | (.09) |
Distributions from net realized gain | - | - | - | (.26) | (1.91) |
Total distributions | (.16) | (.09) | (.11) | (.40) | (2.00) |
Redemption fees added to paid in capital C | .01 | .01 | - G | .01 | - G |
Net asset value, end of period | $ 14.29 | $ 15.16 | $ 11.63 | $ 8.37 | $ 14.43 |
Total Return A,B | (4.65)% | 31.09% | 40.22% | (39.84)% | 18.21% |
Ratios to Average Net Assets D,F | | | | | |
Expenses before reductions | .74% | .77% | .81% | .78% | .78% |
Expenses net of fee waivers, if any | .74% | .76% | .81% | .78% | .78% |
Expenses net of all reductions | .73% | .75% | .80% | .78% | .78% |
Net investment income (loss) | .88% | .77% | 1.10% | 1.02% | .64% |
Supplemental Data | | | | | |
Net assets, end of period (000 omitted) | $ 34,854 | $ 43,295 | $ 32,183 | $ 23,747 | $ 50,586 |
Portfolio turnover rate E | 111% | 91% | 117% | 138% | 122% |
A Total returns do not reflect charges attributable to your insurance company's separate account. Inclusion of these charges would reduce the total returns shown.
B Total returns would have been lower if certain expenses had not been reduced during the applicable periods shown.
C Calculated based on average shares outstanding during the period.
D Fees and expenses of any underlying Fidelity Central Funds are not included in the Fund's expense ratio. The Fund indirectly bears its proportionate share of the expenses of any underlying Fidelity Central Funds.
E Amount does not include the portfolio activity of any underlying Fidelity Central Funds.
F Expense ratios reflect operating expenses of the class. Expenses before reductions do not reflect amounts reimbursed by the investment adviser or reductions from brokerage service arrangements or reductions from other expense offset arrangements and do not represent the amount paid by the class during periods when reimbursements or reductions occur. Expenses net of fee waivers reflect expenses after reimbursement by the investment adviser but prior to reductions from brokerage service arrangements or other expense offset arrangements. Expenses net of all reductions represent the net expenses paid by the class.
G Amount represents less than $.01 per share.
Financial Highlights - Investor Class
Years ended December 31, | 2011 | 2010 | 2009 | 2008 | 2007 |
Selected Per-Share Data | | | | | |
Net asset value, beginning of period | $ 15.10 | $ 11.59 | $ 8.35 | $ 14.38 | $ 13.86 |
Income from Investment Operations | | | | | |
Net investment income (loss) C | .12 | .09 | .09 | .11 | .08 |
Net realized and unrealized gain (loss) | (.84) | 3.49 | 3.25 | (5.76) | 2.43 |
Total from investment operations | (.72) | 3.58 | 3.34 | (5.65) | 2.51 |
Distributions from net investment income | (.15) | (.08) | (.10) | (.13) | (.08) |
Distributions from net realized gain | - | - | - | (.26) | (1.91) |
Total distributions | (.15) | (.08) | (.10) | (.39) | (1.99) |
Redemption fees added to paid in capital C | .01 | .01 | - G | .01 | - G |
Net asset value, end of period | $ 14.24 | $ 15.10 | $ 11.59 | $ 8.35 | $ 14.38 |
Total Return A,B | (4.70)% | 30.96% | 39.97% | (39.84)% | 18.12% |
Ratios to Average Net Assets D,F | | | | | |
Expenses before reductions | .82% | .85% | .91% | .88% | .90% |
Expenses net of fee waivers, if any | .82% | .84% | .91% | .88% | .90% |
Expenses net of all reductions | .81% | .84% | .90% | .87% | .90% |
Net investment income (loss) | .80% | .69% | 1.00% | .92% | .52% |
Supplemental Data | | | | | |
Net assets, end of period (000 omitted) | $ 48,261 | $ 48,832 | $ 25,879 | $ 17,359 | $ 26,063 |
Portfolio turnover rate E | 111% | 91% | 117% | 138% | 122% |
A Total returns do not reflect charges attributable to your insurance company's separate account. Inclusion of these charges would reduce the total returns shown.
B Total returns would have been lower if certain expenses had not been reduced during the applicable periods shown.
C Calculated based on average shares outstanding during the period.
D Fees and expenses of any underlying Fidelity Central Funds are not included in the Fund's expense ratio. The Fund indirectly bears its proportionate share of the expenses of any underlying Fidelity Central Funds.
E Amount does not include the portfolio activity of any underlying Fidelity Central Funds.
F Expense ratios reflect operating expenses of the class. Expenses before reductions do not reflect amounts reimbursed by the investment adviser or reductions from brokerage service arrangements or reductions from other expense offset arrangements and do not represent the amount paid by the class during periods when reimbursements or reductions occur. Expenses net of fee waivers reflect expenses after reimbursement by the investment adviser but prior to reductions from brokerage service arrangements or other expense offset arrangements. Expenses net of all reductions represent the net expenses paid by the class.
G Amount represents less than $.01 per share.
See accompanying notes which are an integral part of the financial statements.
Annual Report
Notes to Financial Statements
For the period ended December 31, 2011
1. Organization.
VIP Industrials Portfolio (the Fund) is a non-diversified fund of Variable Insurance Products Fund IV (the Trust) and is authorized to issue an unlimited number of shares. The Trust is registered under the Investment Company Act of 1940, as amended (the 1940 Act), as an open-end management investment company organized as a Massachusetts business trust. Shares of the Fund may only be purchased by insurance companies for the purpose of funding variable annuity or variable life insurance contracts. The Fund offers the following classes of shares: Initial Class shares and Investor Class shares. All classes have equal rights and voting privileges, except for matters affecting a single class. Investment income, realized and unrealized capital gains and losses, the common expenses of the Fund, and certain fund-level expense reductions, if any, are allocated on a pro-rata basis to each class based on the relative net assets of each class to the total net assets of the Fund. Each class differs with respect to transfer agent fees incurred. Certain expense reductions may also differ by class.
2. Investments in Fidelity Central Funds.
The Fund invests in Fidelity Central Funds, which are open-end investment companies available only to other investment companies and accounts managed by Fidelity Management & Research Company (FMR) and its affiliates. The Fund's Schedule of Investments lists each of the Fidelity Central Funds held as of period end, if any, as an investment of the Fund, but do not include the underlying holdings of each Fidelity Central Fund. As an Investing Fund, the Fund indirectly bears its proportionate share of the expenses of the underlying Fidelity Central Funds.
The Money Market Central Funds seek preservation of capital and current income and are managed by Fidelity Investments Money Management, Inc. (FIMM), an affiliate of FMR.
A complete unaudited list of holdings for each Fidelity Central Fund is available upon request or at the Securities and Exchange Commission (the SEC) web site at www.sec.gov. In addition, the financial statements of the Fidelity Central Funds, which are not covered by the Fund's Report of Independent Registered Public Accounting Firm, are available on the SEC web site or upon request.
3. Significant Accounting Policies.
The financial statements have been prepared in conformity with accounting principles generally accepted in the United States of America (GAAP), which require management to make certain estimates and assumptions at the date of the financial statements. Actual results could differ from those estimates. Subsequent events, if any, through the date that the financial statements were issued have been evaluated in the preparation of the financial statements. The following summarizes the significant accounting policies of the Fund:
Security Valuation. Investments are valued as of 4:00 p.m. Eastern time on the last calendar day of the period. The Fund uses independent pricing services approved by the Board of Trustees to value its investments. When current market prices or quotations are not readily available or reliable, valuations may be determined in good faith in accordance with procedures adopted by the Board of Trustees. Factors used in determining value may include market or security specific events. The frequency with which these procedures are used cannot be predicted and they may be utilized to a significant extent. The value used for net asset value (NAV) calculation under these procedures may differ from published prices for the same securities.
The Fund categorizes the inputs to valuation techniques used to value its investments into a disclosure hierarchy consisting of three levels as shown below:
Level 1 - quoted prices in active markets for identical investments
Level 2 - other significant observable inputs (including quoted prices for similar investments, interest rates, prepayment speeds, etc.)
Level 3 - unobservable inputs (including the Fund's own assumptions based on the best information available)
Changes in valuation techniques may result in transfers in or out of an assigned level within the disclosure hierarchy. The aggregate value of investments by input level, as of December 31, 2011, as well as a roll forward of Level 3 securities, is included at the end of the Fund's Schedule of Investments. Valuation techniques used to value the Fund's investments by major category are as follows:
Equity securities, including restricted securities, for which market quotations are readily available, are valued at the last reported sale price or official closing price as reported by an independent pricing service on the primary market or exchange on which they are traded and are categorized as Level 1 in the hierarchy. In the event there were no sales during the day or closing prices are not available, securities are valued at the last quoted bid price or may be valued using the last available price and are generally categorized as Level 2 in the hierarchy. For foreign equity securities, when significant market or security specific events arise, comparisons to the valuation of American Depositary Receipts (ADRs), futures contracts, Exchange-traded funds (ETFs) and certain indexes as well as quoted prices for similar securities are used and are categorized as Level 2 in the hierarchy in these circumstances. Utilizing these techniques may result in transfers between Level 1 and Level 2. For restricted equity securities and private placements where observable inputs are limited, assumptions about market activity and risk are used and are categorized as Level 3 in the hierarchy.
Annual Report
3. Significant Accounting Policies - continued
Security Valuation - continued
Debt securities, including restricted securities, are valued based on evaluated prices received from independent pricing services or from dealers who make markets in such securities. For corporate bonds and U.S. government and government agency obligations, pricing services utilize matrix pricing which considers yield or price of bonds of comparable quality, coupon, maturity and type as well as dealer supplied prices and are generally categorized as Level 2 in the hierarchy.
When independent prices are unavailable or unreliable, debt securities may be valued utilizing pricing matrices which consider similar factors that would be used by independent pricing services. These are generally categorized as Level 2 in the hierarchy but may be Level 3 depending on the circumstances.
Futures contracts are valued at the settlement price established each day by the board of trade or exchange on which they are traded and are categorized as Level 1 in the hierarchy. Investments in open-end mutual funds, including the Fidelity Central Funds, are valued at their closing net asset value each business day and are categorized as Level 1 in the hierarchy. Short-term securities with remaining maturities of sixty days or less may be valued at amortized cost, which approximates fair value, and are categorized as Level 2 in the hierarchy.
New Accounting Pronouncements. In May 2011, the Financial Accounting Standards Board issued Accounting Standard Update No. 2011-04, Fair Value Measurement (Topic 820) - Amendments to Achieve Common Fair Value Measurement and Disclosure Requirements in U.S. GAAP and IFRSs. The update is effective during interim and annual periods beginning after December 15, 2011 and will result in additional disclosure for transfers between levels as well as expanded disclosure for securities categorized as Level 3 under the fair value hierarchy.
In December 2011, the Financial Accounting Standards Board issued Accounting Standard Update No. 2011-11, Disclosures about Offsetting Assets and Liabilities. The update creates new disclosure requirements requiring entities to disclose both gross and net information for derivatives and other financial instruments that are either offset in the Statement of Assets and Liabilities or subject to an enforceable master netting arrangement or similar agreement. The disclosure requirements are effective for annual reporting periods beginning on or after January 1, 2013. Management is currently evaluating the impact of the update's adoption on the Fund's financial statement disclosures.
Foreign Currency. The Fund may use foreign currency contracts to facilitate transactions in foreign-denominated securities. Gains and losses from these transactions may arise from changes in the value of the foreign currency or if the counterparties do not perform under the contracts' terms.
Foreign-denominated assets, including investment securities, and liabilities are translated into U.S. dollars at the exchange rate at period end. Purchases and sales of investment securities, income and dividends received and expenses denominated in foreign currencies are translated into U.S. dollars at the exchange rate in effect on the transaction date.
The effects of exchange rate fluctuations on investments are included with the net realized and unrealized gain (loss) on investment securities. Other foreign currency transactions resulting in realized and unrealized gain (loss) are disclosed separately.
Investment Transactions and Income. For financial reporting purposes, the Fund's investment holdings and NAV include trades executed through the end of the last business day of the period. The NAV per share for processing shareholder transactions is calculated as of the close of business of the New York Stock Exchange (NYSE), normally 4:00 p.m. Eastern time and includes trades executed through the end of the prior business day. Gains and losses on securities sold are determined on the basis of identified cost and may include proceeds received from litigation. Dividend income is recorded on the ex-dividend date, except for certain dividends from foreign securities where the ex-dividend date may have passed, which are recorded as soon as the Fund is informed of the ex-dividend date. Non-cash dividends included in dividend income, if any, are recorded at the fair market value of the securities received. Distributions received on securities that represent a return of capital or capital gain are recorded as a reduction of cost of investments and/or as a realized gain. The Fund estimates the components of distributions received that may be considered return of capital distributions or capital gain distributions. Interest income and distributions from the Fidelity Central Funds are accrued as earned. Interest income includes coupon interest and amortization of premium and accretion of discount on debt securities. Investment income is recorded net of foreign taxes withheld where recovery of such taxes is uncertain.
Expenses. Expenses directly attributable to a fund are charged to that fund. Expenses attributable to more than one fund are allocated among the respective funds on the basis of relative net assets or other appropriate methods. Expense estimates are accrued in the period to which they relate and adjustments are made when actual amounts are known.
Income Tax Information and Distributions to Shareholders. Each year, the Fund intends to qualify as a regulated investment company, including distributing substantially all of its taxable income and realized gains under Subchapter M of the Internal Revenue Code. As a result, no provision for income taxes is required. As of December 31, 2011, the Fund did not have any unrecognized tax benefits in the financial statements; nor is the Fund aware of any tax positions for which it is reasonably possible that the total amounts of unrecognized tax benefits will significantly change in the next twelve months. The Fund files a U.S. federal tax return, in addition to state and local tax returns as required. A fund's tax returns are subject to
Annual Report
Notes to Financial Statements - continued
3. Significant Accounting Policies - continued
Income Tax Information and Distributions to Shareholders - continued
examination by the Internal Revenue Service (IRS) for a period of three fiscal years. State and local tax returns may be subject to examination for an additional fiscal year depending on the jurisdiction. Foreign taxes are provided for based on the Fund's understanding of the tax rules and rates that exist in the foreign markets in which it invests.
Distributions are declared and recorded on the ex-dividend date. Income dividends and capital gain distributions are declared separately for each class. Income and capital gain distributions are determined in accordance with income tax regulations, which may differ from GAAP.
Capital accounts within the financial statements are adjusted for permanent book-tax differences. These adjustments have no impact on net assets or the results of operations. Temporary book-tax differences will reverse in a subsequent period.
Book-tax differences are primarily due to foreign currency transactions, futures transactions, capital loss carryforwards, and losses deferred due to wash sales and excise tax regulations.
The federal tax cost of investment securities and unrealized appreciation (depreciation) as of period end were as follows:
Gross unrealized appreciation | $ 9,620,906 |
Gross unrealized depreciation | (5,911,842) |
Net unrealized appreciation (depreciation) on securities and other investments | $ 3,709,064 |
| |
Tax Cost | $ 79,308,563 |
The tax-based components of distributable earnings as of period end were as follows:
Capital loss carryforward | $ (3,124,513) |
Net unrealized appreciation (depreciation) | $ 3,712,792 |
Capital loss carryforwards are only available to offset future capital gains of the Fund to the extent provided by regulations and may be limited. Under the Regulated Investment Company Modernization Act of 2010 (the Act), the Fund is permitted to carry forward capital losses incurred in taxable years beginning after December 22, 2010 for an unlimited period and such capital losses are required to be used prior to any losses that expire. Capital loss carryforwards were as follows:
Fiscal year of expiration | |
2017 | $ (3,124,513) |
The tax character of distributions paid was as follows:
| December 31, 2011 | December 31, 2010 |
Ordinary Income | $ 889,220 | $ 468,304 |
Trading (Redemption) Fees. Shares held by investors less than 60 days are subject to a redemption fee equal to 1% of the net asset value of shares redeemed. All redemption fees, which reduce the proceeds of the shareholder redemption, are retained by the Fund and accounted for as an addition to paid in capital.
4. Operating Policies.
Restricted Securities. The Fund may invest in securities that are subject to legal or contractual restrictions on resale. These securities generally may be resold in transactions exempt from registration or to the public if the securities are registered. Disposal of these securities may involve time-consuming negotiations and expense, and prompt sale at an acceptable price may be difficult. Information regarding restricted securities is included at the end of the Fund's Schedule of Investments.
5. Derivative Instruments.
Risk Exposures and the Use of Derivative Instruments. The Fund used derivative instruments (derivatives), including futures contracts, in order to meet its investment objectives. The strategy is to use derivatives to increase returns and to manage exposure to certain risks as defined below. The success of any strategy involving derivatives depends on analysis of numerous economic factors, and if the strategies for investment do not work as intended, the Fund may not achieve its objectives.
Annual Report
5. Derivative Instruments - continued
Risk Exposures and the Use of Derivative Instruments - continued
The Fund's use of derivatives increased or decreased its exposure to the following risk:
Equity Risk | Equity risk relates to the fluctuations in the value of financial instruments as a result of changes in market prices (other than those arising from interest rate risk or foreign exchange risk), whether caused by factors specific to an individual investment, its issuer, or all factors affecting all instruments traded in a market or market segment. |
The Fund is also exposed to additional risks from investing in derivatives, such as liquidity risk and counterparty credit risk. Liquidity risk is the risk that the Fund will be unable to sell the derivative in the open market in a timely manner. Counterparty credit risk is the risk that the counterparty will not be able to fulfill its obligation to the Fund. The Fund's maximum risk of loss from counterparty credit risk is generally the aggregate unrealized appreciation and unpaid counterparty payments in excess of any collateral pledged by the counterparty to the Fund. Counterparty risk related to exchange-traded futures contracts is minimal because of the protection provided by the exchange on which they trade. Derivatives involve, to varying degrees, risk of loss in excess of the amounts recognized in the Statement of Assets and Liabilities.
Futures Contracts. A futures contract is an agreement between two parties to buy or sell a specified underlying instrument for a fixed price at a specified future date. The Fund used futures contracts to manage its exposure to the stock market.
Upon entering into a futures contract, a fund is required to deposit either cash or securities (initial margin) with a clearing broker in an amount equal to a certain percentage of the face value of the contract. Futures contracts are marked-to-market daily and subsequent payments (variation margin) are made or received by a fund depending on the daily fluctuations in the value of the futures contracts and are recorded as unrealized appreciation or (depreciation). This receivable and/or payable is included in daily variation margin on futures contracts in the Statement of Assets and Liabilities. Realized gain or (loss) is recorded upon the expiration or closing of a futures contract.
The underlying face amount at value of open futures contracts at period end is shown in the Schedule of Investments under the caption "Futures Contracts." This amount reflects each contract's exposure to the underlying instrument at period end and is representative of activity for the period. Securities deposited to meet initial margin requirements are identified in the Schedule of Investments.
Certain risks arise upon entering into futures contracts, including the risk that an illiquid market limits the ability to close out a futures contract prior to settlement date.
During the period the Fund recognized net realized gain (loss) of $101,622 and a change in net unrealized appreciation (depreciation) of $(4) related to its investment in futures contracts. These amounts are included in the Statement of Operations.
6. Purchases and Sales of Investments.
Purchases and sales of securities, other than short-term securities, aggregated $113,538,832 and $114,454,977, respectively.
7. Fees and Other Transactions with Affiliates.
Management Fee. FMR and its affiliates provide the Fund with investment management related services for which the Fund pays a monthly management fee. The management fee is the sum of an individual fund fee rate that is based on an annual rate of .30% of the Fund's average net assets and an annualized group fee rate that averaged .26% during the period. The group fee rate is based upon the average net assets of all the mutual funds advised by FMR. The group fee rate decreases as assets under management increase and increases as assets under management decrease. For the period, the total annual management fee rate was .56% of the Fund's average net assets.
Transfer Agent Fees. Fidelity Investments Institutional Operations Company, Inc. (FIIOC), an affiliate of FMR, is the Fund's transfer, dividend disbursing, and shareholder servicing agent. FIIOC receives an asset-based fee with respect to each class. Each class (with the exception of Investor Class) pays a transfer agent fee, excluding out of pocket expenses, equal to an annual rate of .07% of average net assets. Investor Class pays a monthly asset-based transfer agent fee of .15% of average net assets. In addition, FIIOC receives an asset-based fee of .0045% of average net assets for typesetting, printing and mailing of shareholder reports, except proxy statements. FIIOC voluntarily agreed to waive this fee for the period August 1, 2011 through December 31, 2011 (see Expense Reductions note). For the period, transfer agent fees for each class, including printing and out of pocket expenses, were as follows:
Initial Class | $ 35,866 |
Investor Class | 93,676 |
| $ 129,542 |
Annual Report
Notes to Financial Statements - continued
7. Fees and Other Transactions with Affiliates - continued
Accounting and Security Lending Fees. Fidelity Service Company, Inc. (FSC), an affiliate of FMR, maintains the Fund's accounting records. The accounting fee is based on the level of average net assets for the month. Under a separate contract, FSC administers the security lending program. The security lending fee is based on the number and duration of lending transactions.
Brokerage Commissions. The Fund placed a portion of its portfolio transactions with brokerage firms which are affiliates of the investment adviser. The commissions paid to these affiliated firms were $2,514 for the period.
8. Committed Line of Credit.
The Fund participates with other funds managed by FMR or an affiliate in a $4.0 billion credit facility (the "line of credit") to be utilized for temporary or emergency purposes to fund shareholder redemptions or for other short-term liquidity purposes. The Fund has agreed to pay commitment fees on its pro-rata portion of the line of credit, which amounted to $310 and is reflected in Miscellaneous expenses on the Statement of Operations. During the period, there were no borrowings on this line of credit.
9. Security Lending.
The Fund lends portfolio securities through a lending agent from time to time in order to earn additional income. For equity securities, a lending agent is used and may loan securities to certain qualified borrowers, including Fidelity Capital Markets (FCM), a broker-dealer affiliated with the Fund. On the settlement date of the loan, the Fund receives collateral (in the form of U.S. Treasury obligations, letters of credit and/or cash) against the loaned securities and maintains collateral in an amount not less than 100% of the market value of the loaned securities during the period of the loan. The market value of the loaned securities is determined at the close of business of the Fund and any additional required collateral is delivered to the Fund on the next business day. If the borrower defaults on its obligation to return the securities loaned because of insolvency or other reasons, a fund could experience delays and costs in recovering the securities loaned or in gaining access to the collateral. Any cash collateral received is invested in the Fidelity Securities Lending Cash Central Fund. At period end, there were no security loans outstanding. Security lending income represents the income earned on investing cash collateral, less rebates paid to borrowers and any lending agent fees associated with the loan, plus any premium payments received for lending certain types of securities. Security lending income is presented in the Statement of Operations as a component of income from Fidelity Central Funds. Total security lending income during the period amounted to $9,700. During the period, there were no securities loaned to FCM.
10. Expense Reductions.
FMR or its affiliates agreed to waive certain fees during the period as noted in the table below.
Initial Class | $ 695 |
Investor Class | 883 |
| $ 1,578 |
Many of the brokers with whom FMR places trades on behalf of the Fund provided services to the Fund in addition to trade execution. These services included payments of certain expenses on behalf of the Fund totaling $6,623 for the period.
11. Distributions to Shareholders.
Distributions to shareholders of each class were as follows:
Years ended December 31, | 2011 | 2010 |
From net investment income | | |
Initial Class | $ 393,213 | $ 236,371 |
Investor Class | 496,007 | 231,933 |
Total | $ 889,220 | $ 468,304 |
Annual Report
12. Share Transactions.
Transactions for each class of shares were as follows:
| Shares | Dollars |
Years ended December 31, | 2011 | 2010 | 2011 | 2010 |
Initial Class | | | | |
Shares sold | 1,093,796 | 772,352 | $ 17,512,561 | $ 10,403,734 |
Reinvestment of distributions | 28,339 | 15,769 | 393,213 | 236,371 |
Shares redeemed | (1,538,769) | (700,942) | (22,544,337) | (8,772,538) |
Net increase (decrease) | (416,634) | 87,179 | $ (4,638,563) | $ 1,867,567 |
Investor Class | | | | |
Shares sold | 2,054,344 | 1,541,960 | $ 32,148,714 | $ 20,928,604 |
Reinvestment of distributions | 35,884 | 15,535 | 496,007 | 231,933 |
Shares redeemed | (1,933,876) | (558,313) | (28,490,917) | (6,842,649) |
Net increase (decrease) | 156,352 | 999,182 | $ 4,153,804 | $ 14,317,888 |
13. Other.
The Fund's organizational documents provide former and current trustees and officers with a limited indemnification against liabilities arising in connection with the performance of their duties to the Fund. In the normal course of business, the Fund may also enter into contracts that provide general indemnifications. The Fund's maximum exposure under these arrangements is unknown as this would be dependent on future claims that may be made against the Fund. The risk of material loss from such claims is considered remote.
At the end of the period, FMR or its affiliates were the owners of record of 99% of the total outstanding shares of the Fund.
Annual Report
Report of Independent Registered Public Accounting Firm
To the Trustees of Variable Insurance Products Fund IV and the Shareholders of VIP Industrials Portfolio:
In our opinion, the accompanying statement of assets and liabilities, including the schedule of investments, and the related statements of operations and of changes in net assets and the financial highlights present fairly, in all material respects, the financial position of VIP Industrials Portfolio (a fund of Variable Insurance Products Fund IV) at December 31, 2011, the results of its operations for the year then ended, the changes in its net assets for each of the two years in the period then ended and the financial highlights for each of the five years in the period then ended, in conformity with accounting principles generally accepted in the United States of America. These financial statements and financial highlights (hereafter referred to as "financial statements") are the responsibility of the VIP Industrials Portfolio's management. Our responsibility is to express an opinion on these financial statements based on our audits. We conducted our audits of these financial statements in accordance with the standards of the Public Company Accounting Oversight Board (United States). Those standards require that we plan and perform the audit to obtain reasonable assurance about whether the financial statements are free of material misstatement. An audit includes examining, on a test basis, evidence supporting the amounts and disclosures in the financial statements, assessing the accounting principles used and significant estimates made by management, and evaluating the overall financial statement presentation. We believe that our audits, which included confirmation of securities at December 31, 2011 by correspondence with the custodian and brokers, provide a reasonable basis for our opinion.
/s/ PricewaterhouseCoopers LLP
PricewaterhouseCoopers LLP
Boston, Massachusetts
February 15, 2012
Annual Report
The Trustees, Members of the Advisory Board, and executive officers of the trust and fund, as applicable, are listed below. The Board of Trustees governs the fund and is responsible for protecting the interests of shareholders. The Trustees are experienced executives who meet periodically throughout the year to oversee the fund's activities, review contractual arrangements with companies that provide services to the fund, oversee management of the risks associated with such activities and contractual arrangements, and review the fund's performance. Except for James C. Curvey, each of the Trustees oversees 226 funds advised by FMR or an affiliate. Mr. Curvey oversees 429 funds advised by FMR or an affiliate.
The Trustees hold office without limit in time except that (a) any Trustee may resign; (b) any Trustee may be removed by written instrument, signed by at least two-thirds of the number of Trustees prior to such removal; (c) any Trustee who requests to be retired or who has become incapacitated by illness or injury may be retired by written instrument signed by a majority of the other Trustees; and (d) any Trustee may be removed at any special meeting of shareholders by a two-thirds vote of the outstanding voting securities of the trust. Each Trustee who is not an interested person (as defined in the 1940 Act) (Independent Trustee), shall retire not later than the last day of the calendar year in which his or her 75th birthday occurs. The Independent Trustees may waive this mandatory retirement age policy with respect to individual Trustees. The executive officers and Advisory Board Members hold office without limit in time, except that any officer and Advisory Board Member may resign or may be removed by a vote of a majority of the Trustees at any regular meeting or any special meeting of the Trustees. Except as indicated, each individual has held the office shown or other offices in the same company for the past five years.
Experience, Skills, Attributes, and Qualifications of the Fund's Trustees. The Governance and Nominating Committee has adopted a statement of policy that describes the experience, qualifications, attributes, and skills that are necessary and desirable for potential Independent Trustee candidates (Statement of Policy). The Board believes that each Trustee satisfied at the time he or she was initially elected or appointed a Trustee, and continues to satisfy, the standards contemplated by the Statement of Policy. The Governance and Nominating Committee also engages professional search firms to help identify potential Independent Trustee candidates who have the experience, qualifications, attributes, and skills consistent with the Statement of Policy. From time to time, additional criteria based on the composition and skills of the current Independent Trustees, as well as experience or skills that may be appropriate in light of future changes to board composition, business conditions, and regulatory or other developments, have also been considered by the professional search firms and the Governance and Nominating Committee. In addition, the Board takes into account the Trustees' commitment and participation in Board and committee meetings, as well as their leadership of standing and ad hoc committees throughout their tenure.
In determining that a particular Trustee was and continues to be qualified to serve as a Trustee, the Board has considered a variety of criteria, none of which, in isolation, was controlling. The Board believes that, collectively, the Trustees have balanced and diverse experience, qualifications, attributes, and skills, which allow the Board to operate effectively in governing the fund and protecting the interests of shareholders. Information about the specific experience, skills, attributes, and qualifications of each Trustee, which in each case led to the Board's conclusion that the Trustee should serve (or continue to serve) as a trustee of the fund, is provided below.
Board Structure and Oversight Function. James C. Curvey is an interested person (as defined in the 1940 Act) and currently serves as Acting Chairman. The Trustees have determined that an interested Chairman is appropriate and benefits shareholders because an interested Chairman has a personal and professional stake in the quality and continuity of services provided to the fund. Independent Trustees exercise their informed business judgment to appoint an individual of their choosing to serve as Chairman, regardless of whether the Trustee happens to be independent or a member of management. The Independent Trustees have determined that they can act independently and effectively without having an Independent Trustee serve as Chairman and that a key structural component for assuring that they are in a position to do so is for the Independent Trustees to constitute a substantial majority for the Board. The Independent Trustees also regularly meet in executive session. Ned C. Lautenbach serves as Chairman of the Independent Trustees and as such (i) acts as a liaison between the Independent Trustees and management with respect to matters important to the Independent Trustees and (ii) with management prepares agendas for Board meetings.
Fidelity funds are overseen by different Boards of Trustees. The fund's Board oversees Fidelity's equity and high income funds and another Board oversees Fidelity's investment-grade bond, money market, and asset allocation funds. The asset allocation funds may invest in Fidelity funds overseen by the fund's Board. The use of separate Boards, each with its own committee structure, allows the Trustees of each group of Fidelity funds to focus on the unique issues of the funds they oversee, including common research, investment, and operational issues. On occasion, the separate Boards establish joint committees to address issues of overlapping consequences for the Fidelity funds overseen by each Board.
The Trustees operate using a system of committees to facilitate the timely and efficient consideration of all matters of importance to the Trustees, the fund, and fund shareholders and to facilitate compliance with legal and regulatory requirements and oversight of the fund's activities and associated risks. The Board, acting through its committees, has charged FMR and its affiliates with (i) identifying events or circumstances the occurrence of which could have demonstrably adverse effects on the fund's business and/or reputation; (ii) implementing processes and controls to lessen the possibility that such events or circumstances occur or to mitigate the effects of such events or circumstances if they do occur; and (iii) creating and maintaining a system designed to evaluate continuously business and market conditions in order to facilitate the identification and implementation processes described in (i) and (ii) above. Because the day-to-day operations and activities of the fund are carried out by or through FMR, its affiliates and other service providers, the fund's exposure to risks is mitigated but not eliminated by the processes overseen by the Trustees. While each of the Board's committees has responsibility for overseeing different aspects of the fund's activities, oversight is exercised primarily through the Operations, Audit, and Compliance Committees. In addition, the Independent Trustees have worked with FMR to enhance the Board's oversight of investment and financial risks, legal and regulatory risks, technology risks, and operational risks, including the development of additional risk reporting to the Board. For example, a working group comprised of Independent Trustees and FMR has worked and continues to work to review the Fidelity funds' valuation-related activities, reporting and risk management. Appropriate personnel, including but not limited to the fund's Chief Compliance Officer (CCO), FMR's internal auditor, the independent accountants, the fund's Treasurer and portfolio management personnel, make periodic reports to the Board's committees, as appropriate, including an annual review of FMR's risk management program for the Fidelity funds. The responsibilities of each standing committee, including their oversight responsibilities, are described further under "Standing Committees of the Fund's Trustees."
Annual Report
The fund's Statement of Additional Information (SAI) includes more information about the Trustees. To request a free copy, call Fidelity at 1-877-208-0098.
Interested Trustees*:
Correspondence intended for each Trustee who is an interested person may be sent to Fidelity Investments, 82 Devonshire Street, Boston, Massachusetts 02109.
Name, Age; Principal Occupations and Other Relevant Experience+ |
James C. Curvey (76) |
| Year of Election or Appointment: 2007 Mr. Curvey is Trustee and Acting Chairman of the Board of Trustees of certain Trusts. Mr. Curvey also serves as Trustee (2007-present) of other investment companies advised by FMR. Mr. Curvey is a Director of Fidelity Investments Money Management, Inc. (2009-present), Director of Fidelity Research & Analysis Co. (2009-present) and Director of FMR and FMR Co., Inc. (2007-present). Mr. Curvey is also Vice Chairman (2007-present) and Director of FMR LLC. In addition, Mr. Curvey serves as an Overseer for the Boston Symphony Orchestra and a member of the Trustees of Villanova University. Previously, Mr. Curvey was the Vice Chairman (2006-2007) and Director (2000-2007) of FMR Corp. |
Ronald P. O'Hanley (54) |
| Year of Election or Appointment: 2011 Mr. O'Hanley is Director of FMR Co., Inc. (2010-present), Director of Fidelity Investments Money Management, Inc. (2010-present), Director of Fidelity Research & Analysis Company (2010-present), President of Fidelity Asset Management and Corporate Services and a member of Fidelity's Executive Committee (2010-present). Previously, Mr. O'Hanley served as President and Chief Executive Officer of BNY Mellon Asset Management (2007-2010). Mr. O'Hanley also served as Vice Chairman of Bank New York Mellon Corp. and a member of that firm's Executive Committee. Prior to the 2007 merger of The Bank of New York and Mellon Financial Corporation, he was Vice Chairman of Mellon Financial Corporation and President and Chief Executive Officer of Mellon Asset Management. He joined Mellon in February 1997. Mr. O'Hanley currently serves as Chairman of the Boston Public Library Foundation Board of Directors and sits on the Board of Directors of Beth Israel Deaconess Medical Center, the Board of Trustees of the Marine Biological Laboratory and the Advisory Board of the Maxwell School of Citizenship and Public Administration at Syracuse University. Mr. O'Hanley also chairs the Council on Asset Management for the Financial Services Roundtable and is a member of the Board of Directors of Institutional Investor's U.S. Institute. |
* Trustees have been determined to be "Interested Trustees" by virtue of, among other things, their affiliation with the trust or various entities under common control with FMR.
+ The information above includes each Trustee's principal occupation during the last five years and other information relating to the experience, attributes, and skills relevant to each Trustee's qualifications to serve as a Trustee, which led to the conclusion that each Trustee should serve as a Trustee for the fund.
Independent Trustees:
Correspondence intended for each Independent Trustee (that is, the Trustees other than the Interested Trustees) may be sent to Fidelity Investments, P.O. Box 55235, Boston, Massachusetts 02205-5235.
Name, Age; Principal Occupations and Other Relevant Experience+ |
Dennis J. Dirks (63) |
| Year of Election or Appointment: 2005 Prior to his retirement in May 2003, Mr. Dirks was Chief Operating Officer and a member of the Board of The Depository Trust & Clearing Corporation (DTCC). He also served as President, Chief Operating Officer, and Board member of The Depository Trust Company (DTC) and President and Board member of the National Securities Clearing Corporation (NSCC). In addition, Mr. Dirks served as Chief Executive Officer and Board member of the Government Securities Clearing Corporation, Chief Executive Officer and Board member of the Mortgage-Backed Securities Clearing Corporation, as a Trustee and a member of the Finance Committee of Manhattan College (2005-2008), and as a Trustee and a member of the Finance Committee of AHRC of Nassau County (2006-2008). Mr. Dirks is a member of the Independent Directors Council (IDC) Governing Council (2010-present) and Board of Directors for The Brookville Center for Children's Services, Inc. (2009-present). |
Alan J. Lacy (58) |
| Year of Election or Appointment: 2008 Mr. Lacy serves as Senior Adviser (2007-present) of Oak Hill Capital Partners, L.P. (private equity). Mr. Lacy also served as Chief Executive Officer (2000-2005) and Vice Chairman (2005-2006) of Sears Holdings Corporation and Sears, Roebuck and Co. (retail). In addition, Mr. Lacy serves as a member of the Board of Directors of Dave & Buster's, Inc. (restaurant and entertainment complexes, 2010-present), The Hillman Companies, Inc. (hardware wholesalers, 2010-present), and Bristol-Myers Squibb Company (global pharmaceuticals, 2007-present). Mr. Lacy is a member of the Board of Trustees of The National Parks Conservation Association (2006-present). Previously, Mr. Lacy served as Chairman of the Board of Trustees of the National Parks Conservation Association (2008-2011) and as a member of the Board of Directors for the Western Union Company (global money transfer, 2006-2011). |
Ned C. Lautenbach (67) |
| Year of Election or Appointment: 2000 Mr. Lautenbach is Chairman of the Independent Trustees of the Equity and High Income Funds (2006-present). Mr. Lautenbach currently serves as the Lead Director of the Eaton Corporation Board of Directors (diversified industrial, 1997-present). Mr. Lautenbach is also a member of the Board of Directors of the Philharmonic Center for the Arts in Naples, Florida (1999-present); a member of the Board of Trustees of Fairfield University (2005-present); and a member of the Council on Foreign Relations (1994-present). Previously, Mr. Lautenbach was a Partner/Advisory Partner at Clayton, Dubilier & Rice, LLC (private equity investment, 1998-2010), as well as a Director of Sony Corporation (2006-2007). |
Joseph Mauriello (67) |
| Year of Election or Appointment: 2008 Prior to his retirement in January 2006, Mr. Mauriello served in numerous senior management positions including Deputy Chairman and Chief Operating Officer (2004-2005), and Vice Chairman of Financial Services (2002-2004) of KPMG LLP US (professional services, 1965-2005). Mr. Mauriello currently serves as a member of the Board of Directors of XL Group plc. (global insurance and re-insurance, 2006-present) and of Arcadia Resources Inc. (health care services and products, 2007-present). Previously, Mr. Mauriello served as a Director of the Hamilton Funds of the Bank of New York (2006-2007). |
Robert W. Selander (61) |
| Year of Election or Appointment: 2011 Previously, Mr. Selander served as a Member of the Advisory Board of Fidelity's Equity and High Income Funds (2011), Executive Vice Chairman (2010), Chief Executive Officer (2009-2010), and President and Chief Executive Officer (1997-2009) of Mastercard, Inc. |
Cornelia M. Small (67) |
| Year of Election or Appointment: 2005 Ms. Small is a member of the Board of Directors of the Teagle Foundation (2009-present). Ms. Small is also a member of the Investment Committee, and Chair (2008-present) and a member of the Board of Trustees of Smith College. In addition, Ms. Small serves on the Investment Committee of the Berkshire Taconic Community Foundation (2008-present). Previously, Ms. Small served as Chairperson of the Investment Committee (2002-2008) of Smith College. In addition, Ms. Small served as Chief Investment Officer, Director of Global Equity Investments, and a member of the Board of Directors of Scudder, Stevens & Clark and Scudder Kemper Investments. |
William S. Stavropoulos (72) |
| Year of Election or Appointment: 2001 Mr. Stavropoulos is Vice Chairman of the Independent Trustees of the Equity and High Income Funds (2006-present). Mr. Stavropoulos serves as President and Founder of the Michigan Baseball Foundation, the Great Lakes Loons (2007-present). Mr. Stavropoulos is Chairman Emeritus of the Board of Directors of The Dow Chemical Company, where he previously served in numerous senior management positions, including President, CEO (1995-2000; 2002-2004), Chairman of the Executive Committee (2000-2006), and as a member of the Board of Directors (1990-2006). Currently, Mr. Stavropoulos is Chairman of Univar (global distributor of commodity and specialty chemicals, 2010-present), a Director of Teradata Corporation (data warehousing and technology solutions, 2008-present), Chemical Financial Corporation, Maersk Inc. (industrial conglomerate), Tyco International, Inc. (multinational manufacturing and services, 2007-present), and a member of the Advisory Board for Metalmark Capital (private equity investment, 2005-present). Mr. Stavropoulos is a special advisor to Clayton, Dubilier & Rice, LLC (private equity investment). In addition, Mr. Stavropoulos is a member of the University of Notre Dame Advisory Council for the College of Science. |
David M. Thomas (62) |
| Year of Election or Appointment: 2008 Previously, Mr. Thomas served as Executive Chairman (2005-2006) and Chairman and Chief Executive Officer (2000-2005) of IMS Health, Inc. (pharmaceutical and healthcare information solutions). In addition, Mr. Thomas serves as a member of the Board of Directors of Fortune Brands, Inc. (consumer products), and Interpublic Group of Companies, Inc. (marketing communication, 2004-present). |
Michael E. Wiley (61) |
| Year of Election or Appointment: 2008 Mr. Wiley also serves as a Director of Asia Pacific Exploration Consolidated (international oil and gas exploration and production, 2008-present). Mr. Wiley serves as a Director of Tesoro Corporation (independent oil refiner and marketer, 2005-present), and a Director of Bill Barrett Corporation (exploration and production, 2005-present). In addition, Mr. Wiley also serves as a Director of Post Oak Bank (privately-held bank, 2004-present). Previously, Mr. Wiley served as a member of the Board of Trustees of the University of Tulsa (2000-2006; 2007-2010), as a Senior Energy Advisor of Katzenbach Partners, LLC (consulting, 2006-2007), as an Advisory Director of Riverstone Holdings (private investment), Chairman, President, and CEO of Baker Hughes, Inc. (oilfield services, 2000-2004), and as Director of Spinnaker Exploration Company (exploration and production, 2001-2005). |
+ The information above includes each Trustee's principal occupation during the last five years and other information relating to the experience, attributes, and skills relevant to each Trustee's qualifications to serve as a Trustee, which led to the conclusion that each Trustee should serve as a Trustee for the fund.
Advisory Board Members and Executive Officers:
Correspondence intended for each executive officer, Edward C. Johnson 3d, and Peter S. Lynch may be sent to Fidelity Investments, 82 Devonshire Street, Boston, Massachusetts 02109.
Name, Age; Principal Occupation |
Edward C. Johnson 3d (81) |
| Year of Election or Appointment: 2011 Member of the Advisory Board of Fidelity's Equity and High Income Funds. Mr. Johnson serves as Chief Executive Officer, Chairman, and a Director of FMR LLC, and also serves as Chairman and Director of FIL Limited. Previously, Mr. Johnson served as a Trustee and Chairman of the Board of certain Fidelity Trusts, Chairman and a Director of FMR, Chairman and a Director of FMR Co., Inc., and President of FMR LLC (2006-2007). |
Peter S. Lynch (67) |
| Year of Election or Appointment: 2003 Member of the Advisory Board of Fidelity's Equity and High Income Funds. Mr. Lynch is Vice Chairman and a Director of FMR and FMR Co., Inc. In addition, Mr. Lynch serves as a Trustee of Boston College and as the Chairman of the Inner-City Scholarship Fund. Previously, Mr. Lynch served on the Special Olympics International Board of Directors (1997-2006). |
Kenneth B. Robins (42) |
| Year of Election or Appointment: 2008 President and Treasurer of Fidelity's Equity and High Income Funds. Mr. Robins also serves as President and Treasurer (2010-present) and Assistant Treasurer (2009-present) of other Fidelity funds and is an employee of Fidelity Investments (2004-present). Previously, Mr. Robins served as Deputy Treasurer of the Fidelity funds (2005-2008) and Treasurer and Chief Financial Officer of The North Carolina Capital Management Trust: Cash and Term Portfolios (2006-2008). |
Brian B. Hogan (47) |
| Year of Election or Appointment: 2009 Vice President of Equity and High Income Funds. Mr. Hogan also serves as President of FMR's Equity Division (2009-present). Previously, Mr. Hogan served as Senior Vice President, Equity Research of FMR (2006-2009) and as a portfolio manager. |
Christopher S. Bartel (40) |
| Year of Election or Appointment: 2009 Vice President of Fidelity's Sector and Real Estate Equity Funds. Mr. Bartel also serves as Senior Vice President of Equity Research (2009-present). Previously, Mr. Bartel served as Managing Director of Research (2006-2009) and an analyst and portfolio manager (2000-2006). |
Scott C. Goebel (43) |
| Year of Election or Appointment: 2008 Secretary and Chief Legal Officer (CLO) of the Fidelity funds. Mr. Goebel also serves as Secretary of Fidelity Investments Money Management, Inc. (FIMM) (2010-present) and Fidelity Research and Analysis Company (FRAC) (2010-present); Secretary and CLO of The North Carolina Capital Management Trust: Cash and Term Portfolios (2008-present); General Counsel, Secretary, and Senior Vice President of FMR (2008-present) and FMR Co., Inc. (2008-present); employed by FMR LLC or an affiliate (2001-present); Chief Legal Officer of Fidelity Management & Research (Hong Kong) Limited (2008-present) and Assistant Secretary of Fidelity Management & Research (Japan) Inc. (2008-present), and Fidelity Management & Research (U.K.) Inc. (2008-present). Previously, Mr. Goebel served as Assistant Secretary of FIMM (2008-2010), FRAC (2008-2010), and the Funds (2007-2008) and as Vice President and Secretary of Fidelity Distributors Corporation (FDC) (2005-2007). |
William C. Coffey (42) |
| Year of Election or Appointment: 2009 Assistant Secretary of Fidelity's Equity and High Income Funds. Mr. Coffey also serves as Senior Vice President and Deputy General Counsel of FMR LLC (2010-present), and is an employee of Fidelity Investments. Previously, Mr. Coffey served as Vice President and Associate General Counsel of FMR LLC (2005-2009). |
Holly C. Laurent (57) |
| Year of Election or Appointment: 2008 Anti-Money Laundering (AML) Officer of the Fidelity funds. Ms. Laurent also serves as AML Officer of The North Carolina Capital Management Trust: Cash and Term Portfolios (2008-present) and is an employee of Fidelity Investments. Previously, Ms. Laurent was Senior Vice President and Head of Legal for Fidelity Business Services India Pvt. Ltd. (2006-2008), and Senior Vice President, Deputy General Counsel and Group Head for FMR LLC (2005-2006). |
Christine Reynolds (53) |
| Year of Election or Appointment: 2008 Chief Financial Officer of the Fidelity funds. Ms. Reynolds became President of Fidelity Pricing and Cash Management Services (FPCMS) in August 2008. Ms. Reynolds served as Chief Operating Officer of FPCMS (2007-2008). Previously, Ms. Reynolds served as President, Treasurer, and Anti-Money Laundering officer of the Fidelity funds (2004-2007). |
Kenneth A. Rathgeber (64) |
| Year of Election or Appointment: 2004 Chief Compliance Officer of Fidelity's Equity and High Income Funds. Mr. Rathgeber is Chief Compliance Officer of Fidelity Management & Research (Hong Kong) Limited (2008-present), Fidelity Management & Research (Japan) Inc. (2008-present), FMR (2005-present), FMR Co., Inc. (2005-present), Fidelity Management & Research (U.K.) Inc. (2005-present), Fidelity Research & Analysis Company (2005-present), Fidelity Investments Money Management, Inc. (2005-present), Pyramis Global Advisors, LLC (2005-present), and Strategic Advisers, Inc. (2005-present). |
Jeffrey S. Christian (50) |
| Year of Election or Appointment: 2009 Deputy Treasurer of the Fidelity funds. Mr. Christian is an employee of Fidelity Investments. Previously, Mr. Christian served as Chief Financial Officer (2008-2009) of certain Fidelity funds and Senior Vice President of Fidelity Pricing and Cash Management Services (FPCMS) (2004-2009). |
Joseph F. Zambello (54) |
| Year of Election or Appointment: 2011 Deputy Treasurer of the Fidelity funds. Mr. Zambello is an employee of Fidelity Investments. Previously, Mr. Zambello served as Vice President of FMR's Program Management Group (2009-2011) and Vice President of the Transfer Agent Oversight Group (2005-2009). |
Adrien E. Deberghes (44) |
| Year of Election or Appointment: 2008 Deputy Treasurer of Fidelity's Equity and High Income Funds. Mr. Deberghes also serves as Vice President and Assistant Treasurer of Fidelity Rutland Square Trust II and Fidelity Commonwealth Trust II (2011-present), Assistant Treasurer of other Fidelity funds (2010-present), and is an employee of Fidelity Investments (2008-present). Previously, Mr. Deberghes served as Senior Vice President of Mutual Fund Administration at State Street Corporation (2007-2008), Senior Director of Mutual Fund Administration at Investors Bank & Trust (2005-2007), and Director of Finance for Dunkin' Brands (2000-2005). |
Stephanie J. Dorsey (42) |
| Year of Election or Appointment: 2010 Assistant Treasurer of Fidelity's Equity and High Income Funds. Ms. Dorsey also serves as Deputy Treasurer of other Fidelity funds (2008-present) and is an employee of Fidelity Investments (2008-present). Previously, Ms. Dorsey served as Treasurer (2004-2008) of the JPMorgan Mutual Funds and Vice President (2004-2008) of JPMorgan Chase Bank. |
John R. Hebble (53) |
| Year of Election or Appointment: 2009 Assistant Treasurer of Fidelity's Equity and High Income Funds. Mr. Hebble also serves as President (2011-present), Treasurer, and Chief Financial Officer of The North Carolina Capital Management Trust: Cash and Term Portfolios (2008-present), President and Treasurer of other Fidelity funds (2008-present) and is an employee of Fidelity Investments. |
Gary W. Ryan (53) |
| Year of Election or Appointment: 2005 Assistant Treasurer of the Fidelity funds. Mr. Ryan is an employee of Fidelity Investments. Previously, Mr. Ryan served as Vice President of Fund Reporting in Fidelity Pricing and Cash Management Services (FPCMS) (1999-2005). |
Jonathan Davis (43) |
| Year of Election or Appointment: 2010 Assistant Treasurer of the Fidelity funds. Mr. Davis is also Assistant Treasurer of Fidelity Rutland Square Trust II and Fidelity Commonwealth Trust II. Mr. Davis is an employee of Fidelity Investments. Previously, Mr. Davis served as Vice President and Associate General Counsel of FMR LLC (2003-2010). |
Annual Report
Initial Class and Investor Class designate 100% of the dividends distributed during the fiscal year as qualifying for the dividends-received deduction for corporate shareholders.
Annual Report
Board Approval of Investment Advisory Contracts and Management Fees
VIP Industrials Portfolio
Each year, the Board of Trustees, including the Independent Trustees (together, the Board), votes on the renewal of the management contract and sub-advisory agreements (together, the Advisory Contracts) for the fund. The Board, assisted by the advice of fund counsel and Independent Trustees' counsel, requests and considers a broad range of information relevant to the renewal of the Advisory Contracts throughout the year.
The Board meets regularly and considers at each of its meetings factors that are relevant to its annual consideration of the renewal of the fund's Advisory Contracts, including the services and support provided to the fund and its shareholders. The Board has established various standing committees, each composed of Independent Trustees with varying backgrounds, to which the Board has assigned specific subject matter responsibilities in order to enhance effective decision-making by the Board. The Board, acting directly and through its Committees, requests and receives information concerning the annual consideration of the renewal of the fund's Advisory Contracts. The Board also meets as needed to consider matters specifically related to the Board's annual consideration of the renewal of Advisory Contracts. Members of the Board may also meet with trustees of other Fidelity funds through ad hoc joint committees to discuss certain matters relevant to the Fidelity funds.
At its July 2011 meeting, the Board of Trustees, including the Independent Trustees, unanimously determined to renew the fund's Advisory Contracts. In reaching its determination, the Board considered all factors it believed relevant, including (i) the nature, extent, and quality of the services to be provided to the fund and its shareholders (including the investment performance of the fund); (ii) the competitiveness of the fund's management fee and total expense ratio; (iii) the total costs of the services to be provided by and the profits to be realized by Fidelity from its relationship with the fund; (iv) the extent to which economies of scale would be realized as the fund grows; and (v) whether fee levels reflect these economies of scale, if any, for the benefit of fund shareholders.
In considering whether to renew the Advisory Contracts for the fund, the Board reached a determination, with the assistance of fund counsel and Independent Trustees' counsel and through the exercise of its business judgment, that the renewal of the Advisory Contracts is in the best interests of the fund and its shareholders and that the compensation payable under the Advisory Contracts is fair and reasonable. The Board's decision to renew the Advisory Contracts was not based on any single factor, but rather was based on a comprehensive consideration of all the information provided to the Board at its meetings throughout the year. The Board, in reaching its determination to renew the Advisory Contracts, is aware that shareholders in the fund have a broad range of investment choices available to them, including a wide choice among mutual funds offered by Fidelity's competitors, and that the fund's shareholders, who have the opportunity to review and weigh the disclosure provided by the fund in its prospectus and other public disclosures, have chosen to invest in this fund, managed by Fidelity.
Nature, Extent, and Quality of Services Provided. The Board considered the staffing within the investment adviser, FMR, and the sub-advisers (together, the Investment Advisers), including the backgrounds of the fund's investment personnel and the fund's investment objective and discipline. The Independent Trustees also had discussions with senior management of Fidelity's investment operations and investment groups. The Board considered the structure of the portfolio manager compensation program and whether this structure provides appropriate incentives to act in the best interests of the fund.
Resources Dedicated to Investment Management and Support Services. The Board and the Fund Oversight and Research Committees reviewed the general qualifications and capabilities of the Investment Advisers' investment staff, including its size, education, experience, and resources, as well as the Investment Advisers' approach to recruiting, training, managing, and compensating investment personnel. The Board also noted that FMR has devoted increased resources to non-U.S. offices. The Board noted that Fidelity's analysts have extensive resources, tools and capabilities which allow them to conduct sophisticated quantitative and fundamental analysis, as well as credit analysis of issuers, counterparties and enhancers. The Board also believes that Fidelity's investment professionals have sufficient access to global information and data so as to provide competitive investment results over time, and that those professionals also have access to sophisticated tools which permit them to assess portfolio construction and risk and performance attribution characteristics continuously, as well as to transmit new information and research conclusions rapidly around the world. Additionally, in their deliberations, the Board considered the Investment Advisers' trading capabilities and resources which are an integral part of the investment management process.
Shareholder and Administrative Services. The Board considered (i) the nature, extent, quality, and cost of advisory, administrative, and shareholder services performed by the Investment Advisers and their affiliates under the Advisory Contracts and under separate agreements covering transfer agency, pricing and bookkeeping, and securities lending services for the fund; (ii) the nature and extent of the investment adviser's supervision of third party service providers, principally custodians and subcustodians; and (iii) the resources devoted to, and the record of compliance with, the fund's compliance policies and procedures. The Board also reviewed the allocation of fund brokerage, including allocations to brokers affiliated with the Investment Advisers, the use of brokerage commissions to pay fund expenses, and the use of "soft" commission dollars to pay for research services.
The Board noted that the growth of fund assets over time across the complex allows Fidelity to reinvest in the development of services designed to enhance the value or convenience of the Fidelity funds as investment vehicles. These services include 24-hour access to account information and market information through telephone representatives and over the Internet, investor education materials and asset allocation tools, and the expanded availability of Fidelity Investor Centers, with 35 new branches opening since 2010.
Annual Report
Board Approval of Investment Advisory Contracts and Management Fees - continued
Investment in a Large Fund Family. The Board considered the benefits to shareholders of investing in a Fidelity fund, including the benefits of investing in a fund that is part of a large family of funds offering a variety of investment disciplines and providing a large variety of mutual fund investor services. The Board noted that Fidelity had taken, or had made recommendations that resulted in the Fidelity funds taking, a number of actions over the previous year that benefited particular funds, including (i) continuing to dedicate additional resources to investment research and support of the senior management team that oversees asset management; (ii) rationalizing product lines through the mergers of six funds into other funds; (iii) continuing to migrate the Freedom Funds to dedicated lower cost underlying funds; (iv) obtaining shareholder approval to broaden the investment strategies for Fidelity Consumer Finance Portfolio, Fidelity Emerging Asia Fund, and Fidelity Environment and Alternative Energy Portfolio; (v) contractually agreeing to reduce the management fees and impose other expense limitations on Spartan 500 Index Fund and U.S. Bond Index Fund in connection with launching new institutional classes of these funds; (vi) changing the name, primary and supplemental benchmarks, and investment policies of Fidelity Global Strategies Fund to support the fund's flexible investment mandate and global orientation; and (vii) reducing the transfer agency account fee rates on certain accounts.
Investment Performance. The Board considered whether the fund has operated in accordance with its investment objective, as well as its record of compliance with its investment restrictions. It also reviewed the fund's absolute investment performance for each class, as well as the fund's relative investment performance for each class measured over multiple periods against a third-party-sponsored index that reflects the market sector in which the fund invests. The Board noted that FMR does not believe that a meaningful peer group exists against which to compare the fund's performance. The following charts considered by the Board show, over the one-, three-, and five-year periods ended December 31, 2010, the cumulative total returns of Initial Class and Investor Class of the fund and the cumulative total returns of a third-party-sponsored index ("benchmark").
VIP Industrials Portfolio
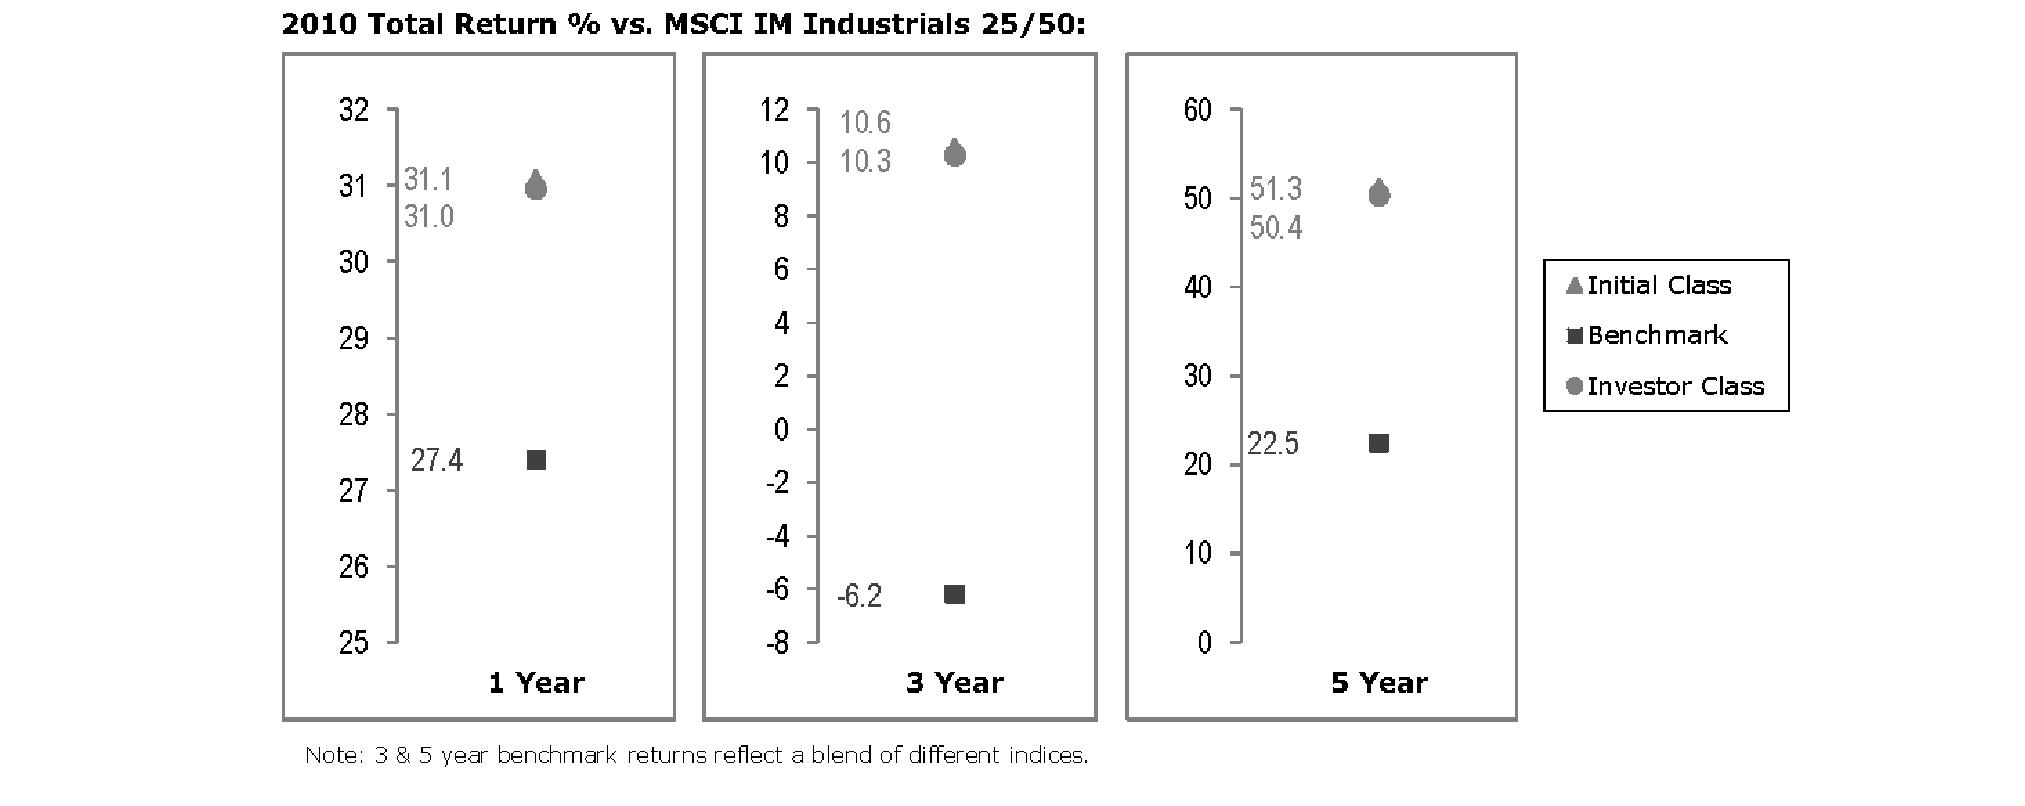
The Board noted that the investment performance of Initial Class of the fund compared favorably to its benchmark for all the periods shown. The Board considered that the variations in performance between the fund's classes reflect the variations in class expenses, which result in lower performance for the higher expense class. The Board also reviewed the fund's performance since inception as well as performance in the current year.
Based on its review, the Board concluded that the nature, extent, and quality of services provided to the fund under the Advisory Contracts should benefit the fund's shareholders.
Competitiveness of Management Fee and Total Expense Ratio. The Board considered the fund's management fee and total expense ratio compared to "mapped groups" of competitive funds and classes. Fidelity creates "mapped groups" by combining similar Lipper investment objective categories that have comparable management fee characteristics. Combining Lipper investment objective categories aids the Board's management fee and total expense ratio comparisons by broadening the competitive group used for comparison and by reducing the number of universes to which various Fidelity funds are compared.
Management Fee. The Board considered two proprietary management fee comparisons for the 12-month periods shown in the chart below. The group of Lipper funds used by the Board for management fee comparisons is referred to below as the "Total Mapped Group." The Total Mapped Group comparison focuses on a fund's standing relative to the total universe of comparable funds available to investors in terms of gross management fees before expense reimbursements or caps. "TMG %" represents the percentage of funds in the Total Mapped Group that had management fees that were lower than the fund's. For example, a TMG % of 2% means that 98% of the funds in the Total Mapped Group had higher management fees than the fund. The "Asset-Size Peer Group" (ASPG) comparison focuses on a fund's standing relative to non-Fidelity funds similar in size to the fund within the Total Mapped Group. The ASPG represents at least 15% of the funds in the Total Mapped Group with comparable asset size and management fee characteristics, subject to a minimum of 50 funds (or all funds in the Total Mapped Group if fewer than 50). Additional information, such as the ASPG quartile in which the fund's management fee ranked, is also included in the chart and considered by the Board.
Annual Report
VIP Industrials Portfolio
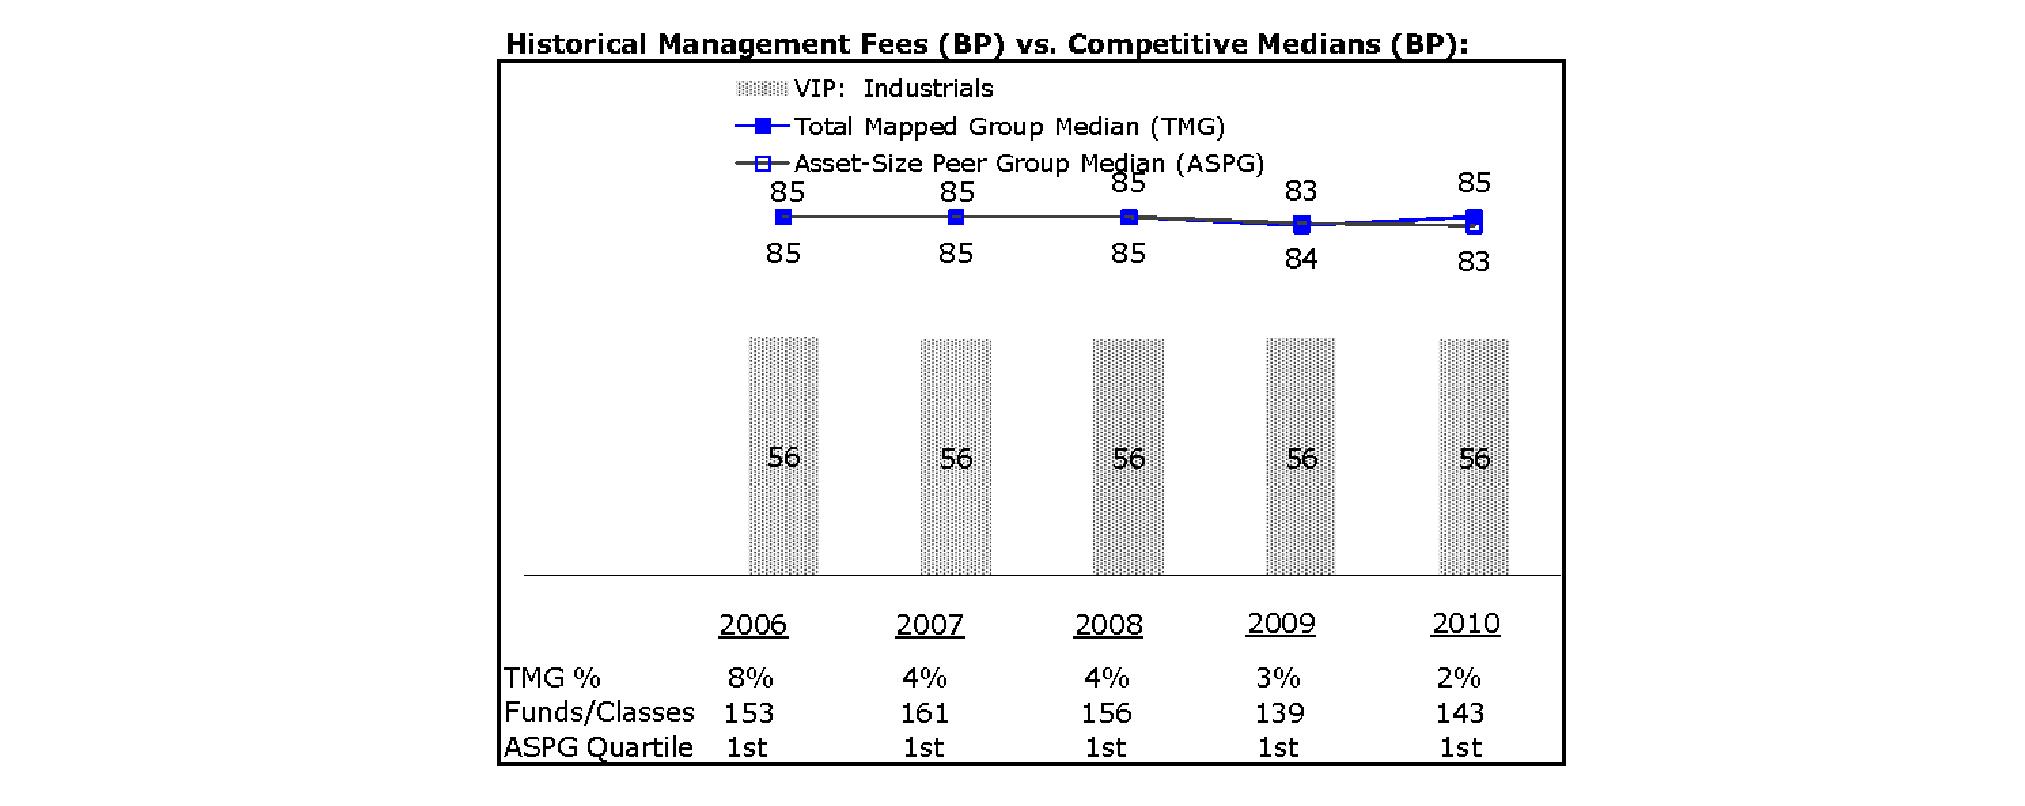
The Board noted that the fund's management fee ranked below the median of its Total Mapped Group and below the median of its ASPG for 2010.
Based on its review, the Board concluded that the fund's management fee is fair and reasonable in light of the services that the fund receives and the other factors considered.
Total Expense Ratio. In its review of each class's total expense ratio, the Board considered the fund's management fee as well as other fund or class expenses, as applicable, such as transfer agent fees, pricing and bookkeeping fees, and custodial, legal, and audit fees. The Board also noted the effects of any waivers and reimbursements on fees and expenses. As part of its review, the Board also considered the current and historical total expense ratios of each class of the fund compared to competitive fund median expenses. Each class of the fund is compared to those funds and classes in the Total Mapped Group (used by the Board for management fee comparisons) that have a similar sales load structure.
The Board noted that the total expense ratio of each class ranked below its competitive median for 2010. The Board considered that various factors, including 12b-1 fees, positive or negative performance adjustments, and relatively higher other expenses in the case of small fund size, can affect total expense ratios. The Board also noted that Investor Class has higher transfer agent fees than traditional variable annuity classes because it is designed for lower cost annuity products, where the majority of servicing costs are incorporated into the funds' total expense ratios rather than being paid at the annuity level.
Fees Charged to Other Fidelity Clients. The Board also considered Fidelity fee structures and other information with respect to clients of FMR and its affiliates, such as other mutual funds advised or subadvised by FMR or its affiliates, pension plan clients, and other institutional clients. In March 2010, the Board created an ad hoc joint committee with the board of other Fidelity funds (the Committee) to review and compare Fidelity's institutional investment advisory business with its business of providing services to the Fidelity funds, including the differences in services provided, fees charged, and costs incurred, as well as competition in their respective marketplaces.
Based on its review of total expense ratios and fees charged to other Fidelity clients, the Board concluded that the total expense ratio of each class of the fund was reasonable in light of the services that the fund and its shareholders receive and the other factors considered, including the findings of the Committee.
Costs of the Services and Profitability. The Board considered the revenues earned and the expenses incurred by Fidelity in conducting the business of developing, marketing, distributing, managing, administering and servicing the fund and its shareholders. The Board also considered the level of Fidelity's profits in respect of all the Fidelity funds.
On an annual basis, FMR presents to the Board Fidelity's profitability for the fund. Fidelity calculates the profitability for each fund, as well as aggregate profitability for groups of Fidelity funds and all Fidelity funds, using a series of detailed revenue and cost allocation methodologies which originate with the books and records of Fidelity on which Fidelity's audited financial statements are based. The Audit Committee of the Board reviews any significant changes from the prior year's methodologies.
Annual Report
Board Approval of Investment Advisory Contracts and Management Fees - continued
PricewaterhouseCoopers LLP (PwC), independent registered public accounting firm and auditor to Fidelity and certain Fidelity funds, has been engaged annually by the Board as part of the Board's assessment of Fidelity's profitability analysis. PwC's engagement includes the review and assessment of Fidelity's methodologies used in determining the revenues and expenses attributable to Fidelity's mutual fund business, and completion of agreed-upon procedures surrounding the mathematical accuracy of fund profitability and its conformity to allocation methodologies. After considering PwC's reports issued under the engagement and information provided by Fidelity, the Board concluded that while other allocation methods may also be reasonable, Fidelity's profitability methodologies are reasonable in all material respects.
The Board also reviewed Fidelity's non-fund businesses and fall-out benefits related to the mutual fund business as well as cases where Fidelity's affiliates may benefit from or be related to the fund's business.
The Board considered the costs of the services provided by and the profits realized by Fidelity in connection with the operation of the fund and was satisfied that the profitability was not excessive in the circumstances.
Economies of Scale. The Board considered whether there have been economies of scale in respect of the management of the Fidelity funds, whether the Fidelity funds (including the fund) have appropriately benefited from any such economies of scale, and whether there is potential for realization of any further economies of scale. The Board considered the extent to which the fund will benefit from economies of scale through increased services to the fund, through waivers or reimbursements, or through fee or expense reductions. The Board also noted that in 2009, it and the board of other Fidelity funds created an ad hoc committee (the Economies of Scale Committee) to analyze whether FMR attains economies of scale in respect of the management and servicing of the Fidelity funds, whether the Fidelity funds have appropriately benefited from such economies of scale, and whether there is potential for realization of any further economies of scale.
The Board recognized that the fund's management contract incorporates a "group fee" structure, which provides for lower group fee rates as total fund assets under FMR's management increase, and for higher group fee rates as total fund assets under FMR's management decrease. FMR calculates the group fee rates based on a tiered asset "breakpoint" schedule that varies based on asset class. The Board considered that the group fee is designed to deliver the benefits of economies of scale to fund shareholders when total Fidelity fund assets increase, even if assets of any particular fund are unchanged or have declined, because some portion of Fidelity's costs are attributable to services provided to all Fidelity funds, and all funds benefit if those costs can be allocated among more assets. The Board concluded that, given the group fee structure, fund shareholders will benefit from lower management fees as assets under FMR's management increase at the fund complex level, regardless of whether Fidelity achieves any such economies of scale.
The Board concluded, taking into account the analysis of the Economies of Scale Committee, that any potential economies of scale are being appropriately shared between fund shareholders and Fidelity.
Additional Information Requested by the Board. In order to develop fully the factual basis for consideration of the Fidelity funds' Advisory Contracts, the Board requested and received additional information on certain topics, including (i) fund performance trends, actions to be taken by FMR to improve certain funds' overall performance, and Fidelity's long-term strategies for certain funds; (ii) portfolio manager changes that have occurred during the past year and length of portfolio manager tenure for different categories of funds over time; (iii) Fidelity's compensation structure for portfolio managers and other key personnel and strategies for attracting and retaining non-investment personnel; (iv) the amount of the investment that each portfolio manager has made in the Fidelity fund(s) that he or she manages; (v) historical trends in Fidelity's realization of fall-out benefits; (vi) Fidelity's group fee structures and the rationale for the individual fee rates of certain funds; (vii) fund profitability methodology and the impact of certain factors on fund profitability results; (viii) trends regarding industry use of performance fee structures and Fidelity's compliance practices with respect to performance adjustment calculations; (ix) the fee structures in place for certain other Fidelity clients; and (x) explanations regarding the relative total expense ratios of certain funds and classes, total expense competitive trends, and actions that might be taken by FMR to reduce total expense ratios for certain funds and classes.
Based on its evaluation of all of the conclusions noted above, and after considering all factors it believed relevant, the Board ultimately concluded that the advisory fee structures are fair and reasonable, and that the fund's Advisory Contracts should be renewed.
Annual Report
Investment Adviser
Fidelity Management & Research Company
Boston, MA
Investment Sub-Advisers
FMR Co., Inc.
Fidelity Management & Research (U.K.) Inc.
Fidelity Management & Research (Hong Kong) Limited
Fidelity Management & Research (Japan) Inc.
General Distributor
Fidelity Distributors Corporation
Boston, MA
Transfer and Service Agents
Fidelity Investments Institutional Operations Company, Inc.
Boston, MA
Fidelity Service Company, Inc.
Boston, MA
Custodian
JPMorgan Chase Bank
New York, NY
VCYLIC-ANN-0212
1.817361.106
Fidelity® Variable Insurance Products:
International Capital Appreciation Portfolio - Class R
Annual Report
December 31, 2011
Contents
Performance | (Click Here) | How the fund has done over time. |
Management's Discussion of Fund Performance | (Click Here) | The Portfolio Manager's review of fundperformance and strategy. |
Shareholder Expense Example | (Click Here) | An example of shareholder expenses. |
Investment Changes | (Click Here) | A summary of major shifts in the fund's investments over the past six months. |
Investments | (Click Here) | A complete list of the fund's investments with their
market values. |
Financial Statements | (Click Here) | Statements of assets and liabilities, operations, and
changes in net assets, as well as financial highlights. |
Notes | (Click Here) | Notes to the financial statements. |
Report of Independent Registered Public Accounting Firm | (Click Here) | |
Trustees and Officers | (Click Here) | |
Distributions | (Click Here) | |
Board Approval of Investment Advisory Contracts and Management Fees | (Click Here) | |
To view a fund's proxy voting guidelines and proxy voting record for the 12-month period ended June 30, visit http://www.fidelity.com/proxyvotingresults or visit the Securities and Exchange Commission's (SEC) web site at http://www.sec.gov. You may also call 1-877-208-0098 to request a free copy of the proxy voting guidelines.
Fidelity Variable Insurance Products are separate account options which are purchased through a variable insurance contract.
Standard & Poor's, S&P and S&P 500 are registered service marks of The McGraw-Hill Companies, Inc. and have been licensed for use by Fidelity Distributors Corporation.
Other third party marks appearing herein are the property of their respective owners.
All other marks appearing herein are registered or unregistered trademarks or service marks of FMR LLC or an affiliated company.
This report and the financial statements contained herein are submitted for the general information of the shareholders of the fund. This report is not authorized for distribution to prospective investors in the fund unless preceded or accompanied by an effective prospectus.
A fund files its complete schedule of portfolio holdings with the SEC for the first and third quarters of each fiscal year on Form N-Q. Forms N-Q are available on the SEC's web site at http://www.sec.gov. A fund's Forms N-Q may be reviewed and copied at the SEC's Public Reference Room in Washington, DC. Information regarding the operation of the SEC's Public Reference Room may be obtained by calling 1-800-SEC-0330. For a complete list of a fund's portfolio holdings, view the most recent holdings listing, semiannual report, or annual report on Fidelity's web site at http://www.fidelity.com, http://www.advisor.fidelity.com, or http://www.401k.com, as applicable.
NOT FDIC INSURED • MAY LOSE VALUE • NO BANK GUARANTEE
Neither the fund nor Fidelity Distributors Corporation is a bank.
Annual Report
Average annual total return reflects the change in the value of an investment, assuming reinvestment of the class' distributions from dividend income and capital gains (the profits earned upon the sale of securities that have grown in value, if any) and assuming a constant rate of performance each year. During periods of reimbursement by Fidelity, a fund's total return will be greater than it would be had the reimbursement not occurred. Performance numbers are net of all underlying fund operating expenses, but do not include any insurance charges imposed by your insurance company's separate account. If performance information included the effect of these additional charges, the total returns would have been lower. How a fund did yesterday is no guarantee of how it will do tomorrow.
Average Annual Total Returns
Periods ended December 31, 2011 | Past 1
year | Past 5
years | Life of
fundA |
VIP International Capital Appreciation Portfolio - Initial Class R | -12.57% | -3.92% | 1.08% |
VIP International Capital Appreciation Portfolio - Service Class R | -12.60% | -4.01% | 0.98% |
VIP International Capital Appreciation Portfolio - Service Class 2R | -12.77% | -4.16% | 0.83% |
VIP International Capital Appreciation Portfolio - Investor Class R B | -12.63% | -4.00% | 0.99% |
A From December 22, 2004.
B The initial offering of Investor Class R shares took place on July 21, 2005. Returns prior to July 21, 2005 are those of Initial Class R. Had Investor Class R's transfer agent fee been reflected, returns prior to July 21, 2005, would have been lower.
$10,000 Over Life of Fund
Let's say hypothetically that $10,000 was invested in VIP International Capital Appreciation Portfolio - Initial Class R on December 22, 2004, when the fund started. The chart shows how the value of your investment would have changed, and also shows how the MSCI® ACWI® (All Country World Index) ex USA Index performed over the same period.
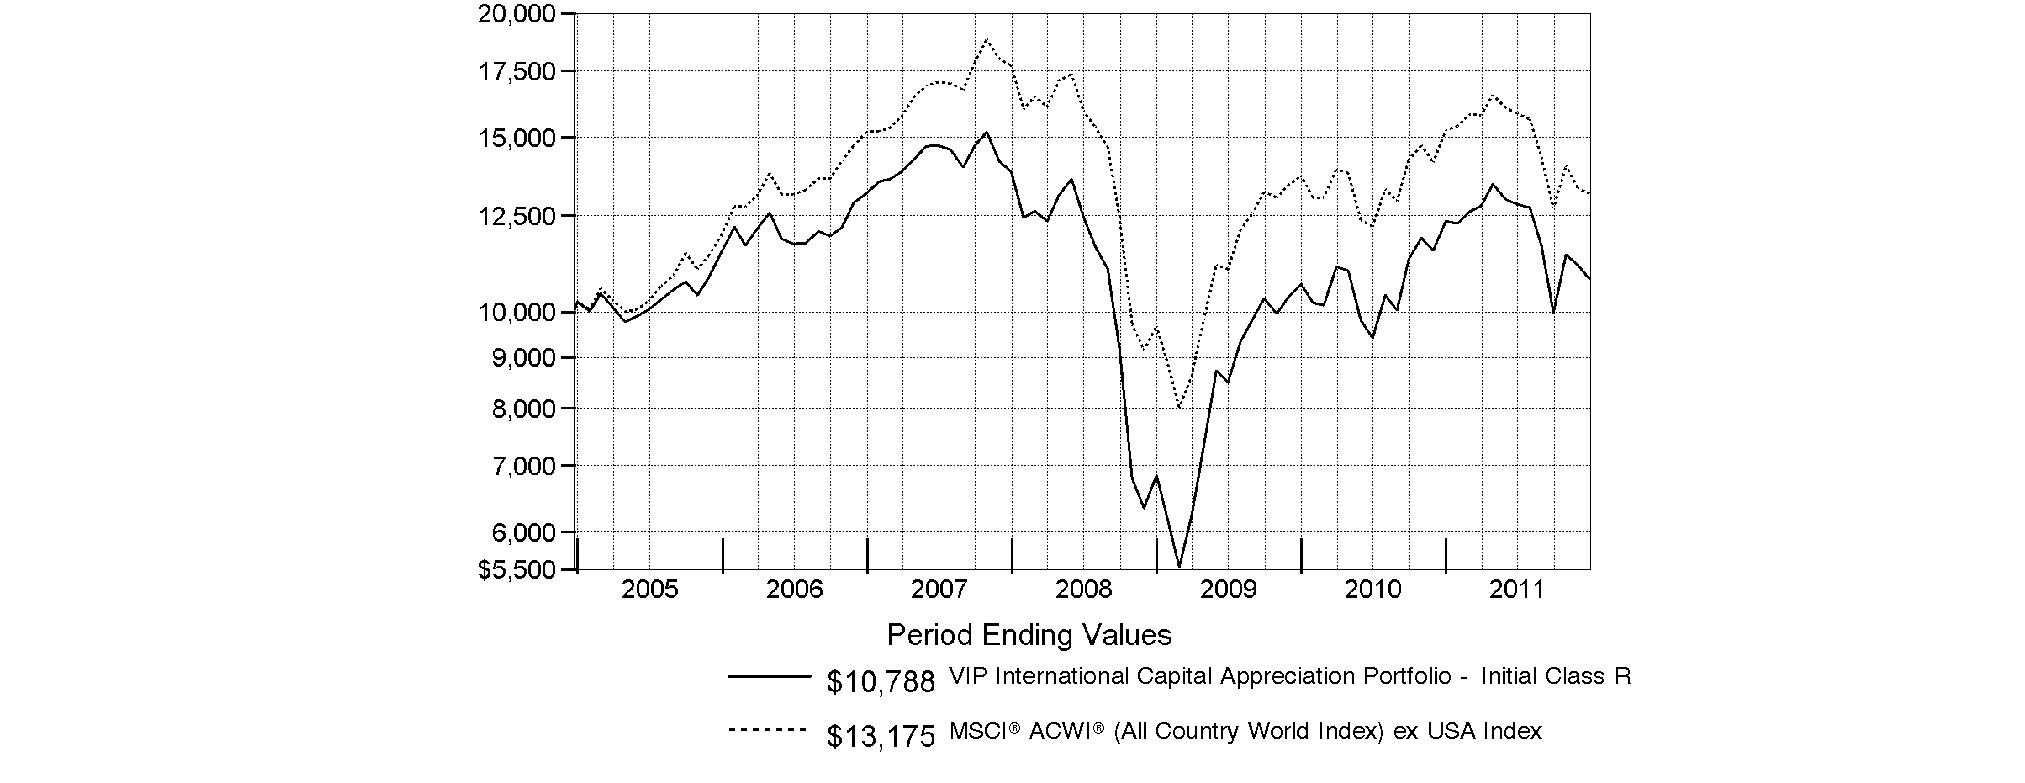
Annual Report
Market Recap: Extreme market volatility took center stage during the 12 months ending December 31, 2011, stealing the spotlight from signs of progress in the global economy. Early in the year, aggressive monetary stimulus by the U.S. federal government, improving credit-market conditions and solid corporate earnings buoyed most major asset classes. As the period progressed, however, fresh worries about sovereign debt in Europe, inflation in China, gridlock over raising the debt ceiling in the U.S. - along with Standard & Poor's early-August downgrade of the nation's long-term sovereign credit rating - and a dimmed outlook for global growth punctured investor confidence and ignited market instability. Domestic equities, as measured by the broad-based S&P 500® Index, gained 2.11%, easily outpacing the 13.61% decline of MSCI® ACWI® (All Country World Index) ex USA Index, a proxy for foreign stocks. Within the MSCI index, emerging markets declined the most -18%), with investments here generally held back by a stronger U.S. dollar. The U.K. (-3%) fared better than the rest of Europe (-15%), which was the second-worst-performing index component. Bolstered by periodic flights to quality, U.S. investment-grade bonds posted a 7.84% advance, as reflected by the Barclays Capital® U.S. Aggregate Bond Index, outperforming the 4.37% gain of high-yield securities, as represented by The BofA Merrill LynchSM US High Yield Constrained Index. Hampered by financial woes in Europe, the sovereign debt of major developed markets outside the U.S. rose 4.86%, according to the Citigroup® Non-USD Group-of-Seven (G7) Equal Weighted Index, while the JPMorgan Emerging Markets Bond Index Global (EMBI Global) advanced 8.46%, despite the currency head wind.
Comments from Sammy Simnegar, Portfolio Manager of VIP International Capital Appreciation Portfolio: During the year, the fund's share classes finished modestly ahead of the MSCI index. (For specific portfolio results, please refer to the performance section of this report.) Versus the index, the fund got a performance boost from overweighting consumer staples. Stock selection in consumer discretionary, information technology and energy also lifted performance. Geographically, positioning in various areas within emerging markets had a meaningful positive impact. Specifically, stock picking and a sizable overweighting in Indonesia bolstered our results, as did security selection in Brazil. Elsewhere, a sizable out-of-benchmark allocation to the United States, which I added to during the period, contributed, along with an underweighting in Japan. Four of the fund's five largest relative contributors were based in Indonesia, where robust economic growth and stock-market outperformance proved beneficial. Mitra Adiperkasa, the largest contributor, owns franchises for Reebok and several other well-known consumer brands. Solid earnings growth amid rapid expansion of the company's store base drove the stock's advance. Other major contributors calling Indonesia home were tobacco firm Gudang Garam, ACE Hardware Indonesia and Global Mediacom. The fund also benefited from its holdings in global payments company MasterCard and a small position in Royal Gold. All of the contributors I've mentioned, except for Gudang Garam, were out-of-index positions, and Royal Gold was sold from the fund by period end. Conversely, stock selection and a sizable underweighting in health care detracted from performance. A large underweighting in telecommunication services also hurt. At the stock level, Vedanta Resources, a U.K. metals and mining firm with significant assets in India, suffered from corporate governance issues and was sold from the fund. Swiss food and beverage maker Nestle - the fund's second-largest holding at period end - also meaningfully detracted. Untimely ownership - including overweighted exposure in advance of the Swiss government's August intervention to weaken the nation's currency - hurt our position. An out-of-benchmark stake in Canadian junior silver miner Aurcana, a low-priced and highly volatile stock that I sold, detracted as well.
The views expressed above reflect those of the portfolio manager(s) only through the end of the period as stated on the cover of this report and do not necessarily represent the views of Fidelity or any other person in the Fidelity organization. Any such views are subject to change at any time based upon market or other conditions and Fidelity disclaims any responsibility to update such views. These views may not be relied on as investment advice and, because investment decisions for a Fidelity fund are based on numerous factors, may not be relied on as an indication of trading intent on behalf of any Fidelity fund.
Annual Report
As a shareholder of the Fund, you incur two types of costs: (1) transaction costs, including redemption fees, and (2) ongoing costs, including management fees, distribution and/or service (12b-1) fees and other Fund expenses. This Example is intended to help you understand your ongoing costs (in dollars) of investing in the Fund and to compare these costs with the ongoing costs of investing in other mutual funds.
The Example is based on an investment of $1,000 invested at the beginning of the period and held for the entire period (July 1, 2011 to December 31, 2011).
Actual Expenses
The first line of the accompanying table for each class of the Fund provides information about actual account values and actual expenses. You may use the information in this line, together with the amount you invested, to estimate the expenses that you paid over the period. Simply divide your account value by $1,000.00 (for example, an $8,600 account value divided by $1,000.00 = 8.6), then multiply the result by the number in the first line for a class of the Fund under the heading entitled "Expenses Paid During Period" to estimate the expenses you paid on your account during this period. The estimate of expenses does not include any fees or other expenses of any variable annuity or variable life insurance product. If they were, the estimate of expenses you paid during the period would be higher, and your ending account value would be lower. In addition, the Fund, as a shareholder in the underlying Fidelity Central Funds, will indirectly bear its pro-rata share of the fees and expenses incurred by the underlying Fidelity Central Funds. These fees and expenses are not included in the Fund's annualized expense ratio used to calculate the expense estimate in the table below.
Hypothetical Example for Comparison Purposes
The second line of the accompanying table for each class of the Fund provides information about hypothetical account values and hypothetical expenses based on a Class' actual expense ratio and an assumed rate of return of 5% per year before expenses, which is not the Class' actual return. The hypothetical account values and expenses may not be used to estimate the actual ending account balance or expenses you paid for the period. You may use this information to compare the ongoing costs of investing in the Fund and other funds. To do so, compare this 5% hypothetical example with the 5% hypothetical examples that appear in the shareholder reports of the other funds. The estimate of expenses does not include any fees or other expenses of any variable annuity or variable life insurance product. If they were, the estimate of expenses you paid during the period would be higher, and your ending account value would be lower. In addition, the Fund, as a shareholder in the underlying Fidelity Central Funds, will indirectly bear its pro-rata share of the fees and expenses incurred by the underlying Fidelity Central Funds. These fees and expenses are not included in the Fund's annualized expense ratio used to calculate the expense estimate in the table below.
Please note that the expenses shown in the table are meant to highlight your ongoing costs only and do not reflect any transaction costs. Therefore, the second line of the table is useful in comparing ongoing costs only, and will not help you determine the relative total costs of owning different funds. In addition, if these transactional costs were included, your costs would have been higher.
| Annualized
Expense Ratio | Beginning
Account Value
July 1, 2011 | Ending
Account Value
December 31, 2011 | Expenses Paid
During Period*
July 1, 2011 to
December 31, 2011 |
Initial Class | 1.10% | | | |
Actual | | $ 1,000.00 | $ 841.50 | $ 5.11 |
HypotheticalA | | $ 1,000.00 | $ 1,019.66 | $ 5.60 |
Service Class | 1.20% | | | |
Actual | | $ 1,000.00 | $ 841.10 | $ 5.57 |
HypotheticalA | | $ 1,000.00 | $ 1,019.16 | $ 6.11 |
Service Class 2 | 1.35% | | | |
Actual | | $ 1,000.00 | $ 841.40 | $ 6.27 |
HypotheticalA | | $ 1,000.00 | $ 1,018.40 | $ 6.87 |
Initial Class R | 1.10% | | | |
Actual | | $ 1,000.00 | $ 841.50 | $ 5.11 |
HypotheticalA | | $ 1,000.00 | $ 1,019.66 | $ 5.60 |
Service Class R | 1.20% | | | |
Actual | | $ 1,000.00 | $ 841.10 | $ 5.57 |
HypotheticalA | | $ 1,000.00 | $ 1,019.16 | $ 6.11 |
Service Class 2R | 1.35% | | | |
Actual | | $ 1,000.00 | $ 841.10 | $ 6.26 |
HypotheticalA | | $ 1,000.00 | $ 1,018.40 | $ 6.87 |
Investor Class R | 1.18% | | | |
Actual | | $ 1,000.00 | $ 841.50 | $ 5.48 |
HypotheticalA | | $ 1,000.00 | $ 1,019.26 | $ 6.01 |
A 5% return per year before expenses
* Expenses are equal to each Class' annualized expense ratio, multiplied by the average account value over the period, multiplied by 184/365 (to reflect the one-half year period).
Annual Report
Investment Changes (Unaudited)
Geographic Diversification (% of fund's net assets) |
As of December 31, 2011 |
| United States of America | 18.3% | |
| United Kingdom | 16.3% | |
| Japan | 9.0% | |
| France | 7.8% | |
| Germany | 4.8% | |
| Indonesia | 4.7% | |
| Brazil | 4.5% | |
| India | 4.4% | |
| Switzerland | 4.3% | |
| Other | 25.9% | |

Percentages are adjusted for the effect of futures contracts, if applicable. |
As of June 30, 2011 |
| United States of America | 15.4% | |
| Japan | 11.7% | |
| United Kingdom | 10.6% | |
| France | 8.1% | |
| Indonesia | 4.4% | |
| Brazil | 4.4% | |
| Switzerland | 4.2% | |
| Cayman Islands | 4.1% | |
| Germany | 4.1% | |
| Other | 33.0% | |

Percentages are adjusted for the effect of futures contracts, if applicable. |
Asset Allocation |
| % of fund's
net assets | % of fund's net assets
6 months ago |
Stocks | 98.3 | 98.9 |
Short-Term Investments and Net Other Assets | 1.7 | 1.1 |
Top Ten Stocks as of December 31, 2011 |
| % of fund's
net assets | % of fund's net assets
6 months ago |
Royal Dutch Shell PLC Class B (United Kingdom, Oil, Gas & Consumable Fuels) | 2.2 | 1.8 |
Nestle SA (Switzerland, Food Products) | 1.8 | 1.8 |
BHP Billiton PLC ADR (United Kingdom, Metals & Mining) | 1.7 | 0.0 |
British American Tobacco PLC (United Kingdom) (United Kingdom, Tobacco) | 1.6 | 1.0 |
Unilever PLC (United Kingdom, Food Products) | 1.1 | 1.1 |
Siemens AG sponsored ADR (Germany, Industrial Conglomerates) | 1.0 | 1.2 |
BG Group PLC (United Kingdom, Oil, Gas & Consumable Fuels) | 1.0 | 1.0 |
Philip Morris International, Inc. (United States of America, Tobacco) | 0.9 | 0.5 |
BASF AG (Germany, Chemicals) | 0.9 | 0.0 |
Diageo PLC sponsored ADR (United Kingdom, Beverages) | 0.9 | 0.0 |
| 13.1 | |
Market Sectors as of December 31, 2011 |
| % of fund's
net assets | % of fund's net assets
6 months ago |
Consumer Discretionary | 23.1 | 19.3 |
Consumer Staples | 21.3 | 18.1 |
Materials | 13.2 | 12.6 |
Financials | 12.1 | 18.2 |
Industrials | 10.8 | 11.7 |
Information Technology | 8.7 | 9.4 |
Energy | 5.8 | 7.3 |
Health Care | 3.3 | 2.3 |
Annual Report
Investments December 31, 2011
Showing Percentage of Net Assets
Common Stocks - 96.2% |
| Shares | | Value |
Australia - 1.0% |
Atlas Iron Ltd. | 63,062 | | $ 174,124 |
Fortescue Metals Group Ltd. | 40,357 | | 176,228 |
TOTAL AUSTRALIA | | 350,352 |
Belgium - 1.4% |
Anheuser-Busch InBev SA NV | 5,068 | | 309,352 |
Umicore SA | 4,656 | | 192,072 |
TOTAL BELGIUM | | 501,424 |
Bermuda - 1.1% |
Credicorp Ltd. (NY Shares) | 1,900 | | 207,993 |
Petra Diamonds Ltd. (a) | 100,885 | | 180,193 |
TOTAL BERMUDA | | 388,186 |
Brazil - 4.5% |
BR Malls Participacoes SA | 20,000 | | 194,504 |
Brasil Foods SA sponsored ADR (d) | 10,600 | | 207,230 |
Cia.Hering SA | 8,600 | | 149,826 |
Companhia de Bebidas das Americas (AmBev) (PN) sponsored ADR | 6,600 | | 238,194 |
Iguatemi Empresa de Shopping Centers SA | 9,800 | | 182,304 |
Itau Unibanco Banco Multiplo SA sponsored ADR | 15,300 | | 283,968 |
Multiplan Empreendimentos Imobiliarios SA | 9,300 | | 191,021 |
Souza Cruz Industria Comerico | 15,900 | | 195,507 |
TOTAL BRAZIL | | 1,642,554 |
Canada - 1.3% |
First Quantum Minerals Ltd. | 10,400 | | 204,753 |
Potash Corp. of Saskatchewan, Inc. | 6,400 | | 264,635 |
TOTAL CANADA | | 469,388 |
Cayman Islands - 2.9% |
Baidu.com, Inc. sponsored ADR (a) | 1,500 | | 174,705 |
Belle International Holdings Ltd. | 108,000 | | 188,283 |
Golden Eagle Retail Group Ltd. (H Shares) | 88,000 | | 186,048 |
Hengdeli Holdings Ltd. | 540,000 | | 176,602 |
Intime Department Store Group Co. Ltd. | 175,500 | | 179,644 |
SINA Corp. (a) | 3,046 | | 158,392 |
TOTAL CAYMAN ISLANDS | | 1,063,674 |
Chile - 0.6% |
Banco Santander Chile sponsored ADR | 2,700 | | 204,390 |
China - 0.5% |
Shandong Weigao Medical Pol Co. Ltd. (H Shares) | 192,000 | | 172,801 |
Curacao - 0.5% |
Schlumberger Ltd. | 2,500 | | 170,775 |
|
| Shares | | Value |
Denmark - 0.8% |
Novo Nordisk A/S Series B sponsored ADR | 2,600 | | $ 299,676 |
Finland - 1.0% |
Kone Oyj (B Shares) | 3,700 | | 192,050 |
Nokian Tyres PLC | 5,886 | | 189,557 |
TOTAL FINLAND | | 381,607 |
France - 7.8% |
Air Liquide SA | 2,200 | | 272,210 |
Atos Origin SA | 3,827 | | 167,979 |
BNP Paribas SA | 6,769 | | 265,920 |
Casino Guichard Perrachon SA | 2,254 | | 189,876 |
Christian Dior SA | 1,688 | | 200,163 |
Danone | 4,100 | | 257,763 |
Edenred | 7,800 | | 192,032 |
LVMH Moet Hennessy - Louis Vuitton | 1,932 | | 273,585 |
Pernod Ricard SA | 2,500 | | 231,892 |
PPR SA | 1,400 | | 200,516 |
Remy Cointreau SA | 2,300 | | 184,849 |
Schneider Electric SA | 4,429 | | 233,214 |
Technip SA | 2,200 | | 206,799 |
TOTAL FRANCE | | 2,876,798 |
Germany - 3.7% |
BASF AG | 4,692 | | 327,291 |
Bayerische Motoren Werke AG (BMW) | 3,333 | | 223,305 |
Delticom AG | 1,896 | | 163,694 |
SAP AG | 5,500 | | 290,938 |
Siemens AG sponsored ADR | 3,800 | | 363,318 |
TOTAL GERMANY | | 1,368,546 |
India - 4.4% |
Asian Paints India Ltd. | 3,680 | | 179,946 |
Bajaj Auto Ltd. | 5,790 | | 173,804 |
Gitanjali Gems Ltd. | 28,551 | | 162,506 |
HDFC Bank Ltd. | 26,238 | | 211,371 |
ITC Ltd. | 51,178 | | 194,325 |
Jubilant Foodworks Ltd. (a) | 11,446 | | 162,876 |
Smithkline Beecham Consumer Healthcare Ltd. | 3,898 | | 186,797 |
Tata Motors Ltd. | 53,869 | | 181,170 |
Titan Industries Ltd. | 54,174 | | 174,738 |
TOTAL INDIA | | 1,627,533 |
Indonesia - 4.7% |
PT ACE Hardware Indonesia Tbk | 483,500 | | 218,621 |
PT Astra International Tbk | 26,500 | | 216,267 |
PT Bank Mandiri (Persero) Tbk | 249,500 | | 185,732 |
PT Bank Rakyat Indonesia Tbk | 275,000 | | 204,715 |
PT Global Mediacom Tbk | 1,604,000 | | 175,127 |
PT Gudang Garam Tbk | 26,500 | | 181,343 |
PT Kalbe Farma Tbk | 463,000 | | 173,609 |
Common Stocks - continued |
| Shares | | Value |
Indonesia - continued |
PT Mitra Adiperkasa Tbk | 311,500 | | $ 176,920 |
PT Modern Internasional Tbk | 554,500 | | 195,688 |
TOTAL INDONESIA | | 1,728,022 |
Ireland - 0.5% |
Kenmare Resources PLC (a) | 264,900 | | 189,258 |
Israel - 1.0% |
Check Point Software Technologies Ltd. (a) | 3,300 | | 173,382 |
Israel Chemicals Ltd. | 18,000 | | 186,563 |
TOTAL ISRAEL | | 359,945 |
Italy - 2.0% |
Prada SpA | 42,700 | | 193,251 |
Saipem SpA | 4,798 | | 204,016 |
Salvatore Ferragamo Italia SpA (a) | 13,300 | | 175,254 |
Tod's SpA | 2,106 | | 171,875 |
TOTAL ITALY | | 744,396 |
Japan - 9.0% |
Canon, Inc. sponsored ADR | 6,585 | | 290,003 |
Fanuc Corp. | 1,600 | | 244,891 |
Fast Retailing Co. Ltd. | 1,100 | | 200,091 |
Japan Tobacco, Inc. | 48 | | 225,765 |
Kakaku.com, Inc. | 4,700 | | 172,330 |
Keyence Corp. | 800 | | 192,919 |
Komatsu Ltd. | 9,600 | | 224,393 |
Makita Corp. | 5,900 | | 190,956 |
Mitsubishi Corp. | 12,000 | | 242,448 |
Mitsui & Co. Ltd. | 15,800 | | 245,730 |
Nabtesco Corp. | 9,600 | | 174,999 |
Rakuten, Inc. | 174 | | 187,192 |
Start Today Co. Ltd. (d) | 7,700 | | 180,182 |
Sysmex Corp. | 5,300 | | 172,707 |
THK Co. Ltd. | 9,200 | | 181,334 |
Unicharm Corp. | 4,000 | | 197,233 |
TOTAL JAPAN | | 3,323,173 |
Korea (South) - 0.7% |
Hyundai Motor Co. | 1,309 | | 239,935 |
Netherlands - 1.1% |
ING Groep NV sponsored ADR (a)(d) | 33,314 | | 238,861 |
LyondellBasell Industries NV Class A | 5,300 | | 172,197 |
TOTAL NETHERLANDS | | 411,058 |
Nigeria - 1.0% |
Guaranty Trust Bank PLC GDR (Reg. S) | 40,516 | | 184,348 |
Guinness Nigeria PLC | 130,097 | | 200,396 |
TOTAL NIGERIA | | 384,744 |
|
| Shares | | Value |
Portugal - 0.5% |
Jeronimo Martins SGPS SA | 11,295 | | $ 186,993 |
Russia - 1.7% |
Magnit OJSC GDR (Reg. S) | 9,700 | | 205,252 |
Sberbank (Savings Bank of the Russian Federation) (a) | 89,400 | | 220,280 |
TNK-BP Holding (a) | 78,700 | | 202,786 |
TOTAL RUSSIA | | 628,318 |
South Africa - 1.7% |
Mr Price Group Ltd. | 18,600 | | 183,866 |
Naspers Ltd. Class N (e) | 5,100 | | 223,134 |
Shoprite Holdings Ltd. | 12,500 | | 210,899 |
TOTAL SOUTH AFRICA | | 617,899 |
Spain - 0.6% |
Inditex SA | 2,611 | | 213,866 |
Sweden - 1.9% |
Atlas Copco AB (A Shares) | 10,700 | | 230,144 |
H&M Hennes & Mauritz AB (B Shares) | 8,371 | | 269,224 |
Swedish Match Co. | 5,800 | | 205,924 |
TOTAL SWEDEN | | 705,292 |
Switzerland - 4.3% |
Compagnie Financiere Richemont SA Series A | 4,661 | | 235,792 |
Dufry AG (a) | 1,910 | | 175,818 |
Nestle SA | 11,701 | | 672,793 |
Swatch Group AG (Bearer) | 580 | | 217,079 |
UBS AG (NY Shares) (a) | 23,900 | | 282,737 |
TOTAL SWITZERLAND | | 1,584,219 |
Thailand - 1.0% |
C.P. Seven Eleven PCL (For. Reg.) | 115,400 | | 188,986 |
Siam Makro PCL (For. Reg.) | 24,900 | | 188,326 |
TOTAL THAILAND | | 377,312 |
Turkey - 0.5% |
Turkiye Garanti Bankasi A/S | 59,091 | | 184,953 |
United Kingdom - 16.3% |
Anglo American PLC (United Kingdom) | 8,000 | | 295,596 |
Antofagasta PLC | 11,100 | | 209,466 |
Barclays PLC sponsored ADR | 23,400 | | 257,166 |
BG Group PLC | 16,646 | | 355,877 |
BHP Billiton PLC ADR | 10,943 | | 638,962 |
British American Tobacco PLC (United Kingdom) | 12,500 | | 593,062 |
Burberry Group PLC | 10,300 | | 189,570 |
Diageo PLC sponsored ADR | 3,600 | | 314,712 |
Imperial Tobacco Group PLC | 7,216 | | 272,903 |
Johnson Matthey PLC | 6,651 | | 189,659 |
Meggitt PLC | 36,000 | | 197,262 |
Reckitt Benckiser Group PLC | 5,000 | | 246,951 |
Royal Dutch Shell PLC Class B | 21,009 | | 799,213 |
Common Stocks - continued |
| Shares | | Value |
United Kingdom - continued |
SABMiller PLC | 7,300 | | $ 256,976 |
Standard Chartered PLC (United Kingdom) | 13,963 | | 305,565 |
The Weir Group PLC | 6,400 | | 201,984 |
Unilever PLC | 12,400 | | 415,863 |
Xstrata PLC | 16,397 | | 249,067 |
TOTAL UNITED KINGDOM | | 5,989,854 |
United States of America - 16.2% |
Allergan, Inc. | 2,100 | | 184,254 |
Apple, Inc. (a) | 455 | | 184,275 |
Caterpillar, Inc. | 2,000 | | 181,200 |
CF Industries Holdings, Inc. | 1,300 | | 188,474 |
Citrix Systems, Inc. (a) | 2,700 | | 163,944 |
Coach, Inc. | 2,900 | | 177,016 |
Crown Holdings, Inc. (a) | 5,150 | | 172,937 |
Cummins, Inc. | 1,900 | | 167,238 |
EMC Corp. (a) | 7,693 | | 165,707 |
First Cash Financial Services, Inc. (a) | 4,700 | | 164,923 |
Freeport-McMoRan Copper & Gold, Inc. | 4,586 | | 168,719 |
Google, Inc. Class A (a) | 300 | | 193,770 |
Halliburton Co. | 5,400 | | 186,354 |
Joy Global, Inc. | 2,200 | | 164,934 |
JPMorgan Chase & Co. | 5,611 | | 186,566 |
Las Vegas Sands Corp. (a) | 3,975 | | 169,852 |
Lorillard, Inc. | 1,600 | | 182,400 |
MasterCard, Inc. Class A | 440 | | 164,041 |
Mead Johnson Nutrition Co. Class A | 2,600 | | 178,698 |
NIKE, Inc. Class B | 1,700 | | 163,829 |
Oracle Corp. | 6,600 | | 169,290 |
Perrigo Co. | 1,800 | | 175,140 |
Philip Morris International, Inc. | 4,200 | | 329,616 |
Rackspace Hosting, Inc. (a) | 4,100 | | 176,341 |
salesforce.com, Inc. (a) | 1,700 | | 172,482 |
The Coca-Cola Co. | 2,500 | | 174,925 |
The Mosaic Co. | 3,400 | | 171,462 |
Tiffany & Co., Inc. | 2,644 | | 175,191 |
TJX Companies, Inc. | 2,800 | | 180,740 |
United Technologies Corp. | 2,300 | | 168,107 |
Visa, Inc. Class A | 1,700 | | 172,601 |
Wells Fargo & Co. | 6,508 | | 179,360 |
Yum! Brands, Inc. | 3,070 | | 181,161 |
TOTAL UNITED STATES OF AMERICA | | 5,935,547 |
TOTAL COMMON STOCKS (Cost $34,625,351) |
35,322,488
|
Preferred Stocks - 2.1% |
| Shares | | Value |
Convertible Preferred Stocks - 0.4% |
United States of America - 0.4% |
Citigroup, Inc. 7.50% | 2,100 | | $ 170,625 |
Nonconvertible Preferred Stocks - 1.7% |
Germany - 1.1% |
Hugo Boss AG (non-vtg.) | 2,400 | | 176,763 |
Volkswagen AG | 1,600 | | 239,723 |
TOTAL GERMANY | | 416,486 |
Italy - 0.6% |
Fiat Industrial SpA (a) | 32,200 | | 197,228 |
TOTAL NONCONVERTIBLE PREFERRED STOCKS | | 613,714 |
TOTAL PREFERRED STOCKS (Cost $829,047) |
784,339
|
Money Market Funds - 3.3% |
| | | |
Fidelity Cash Central Fund, 0.11% (b) | 669,898 | | 669,898 |
Fidelity Securities Lending Cash Central Fund, 0.13% (b)(c) | 520,645 | | 520,645 |
TOTAL MONEY MARKET FUNDS (Cost $1,190,543) |
1,190,543
|
TOTAL INVESTMENT PORTFOLIO - 101.6% (Cost $36,644,941) | | 37,297,370 |
NET OTHER ASSETS (LIABILITIES) - (1.6)% | | (570,315) |
NET ASSETS - 100% | $ 36,727,055 |
Legend |
(a) Non-income producing |
(b) Affiliated fund that is available only to investment companies and other accounts managed by Fidelity Investments. The rate quoted is the annualized seven-day yield of the fund at period end. A complete unaudited listing of the fund's holdings as of its most recent quarter end is available upon request. In addition, each Fidelity Central Fund's financial statements, which are not covered by the Fund's Report of Independent Registered Public Accounting Firm, are available on the SEC's website or upon request. |
(c) Investment made with cash collateral received from securities on loan. |
(d) Security or a portion of the security is on loan at period end. |
(e) Security or a portion of the security purchased on a delayed delivery or when-issued basis. |
Affiliated Central Funds |
Information regarding fiscal year to date income earned by the Fund from investments in Fidelity Central Funds is as follows: |
Fund | Income earned |
Fidelity Cash Central Fund | $ 292 |
Fidelity Securities Lending Cash Central Fund | 15,048 |
Total | $ 15,340 |
Other Information |
The following is a summary of the inputs used, as of December 31, 2011, involving the Fund's assets and liabilities carried at fair value. The inputs or methodology used for valuing securities may not be an indication of the risk associated with investing in those securities. For more information on valuation inputs, and their aggregation into the levels used in the table below, please refer to the Security Valuation section in the accompanying Notes to Financial Statements. |
Valuation Inputs at Reporting Date: |
Description | Total | Level 1 | Level 2 | Level 3 |
Investments in Securities: | | | | |
Equities: | | | | |
United States of America | $ 6,106,172 | $ 6,106,172 | $ - | $ - |
United Kingdom | 5,989,854 | 4,181,716 | 1,808,138 | - |
Japan | 3,323,173 | 3,323,173 | - | - |
France | 2,876,798 | 2,876,798 | - | - |
Germany | 1,785,032 | 1,494,094 | 290,938 | - |
Indonesia | 1,728,022 | 1,728,022 | - | - |
Brazil | 1,642,554 | 1,642,554 | - | - |
India | 1,627,533 | 1,234,992 | 392,541 | - |
Switzerland | 1,584,219 | 1,584,219 | - | - |
Other | 9,443,470 | 9,134,118 | 309,352 | - |
Money Market Funds | 1,190,543 | 1,190,543 | - | - |
Total Investments in Securities: | $ 37,297,370 | $ 34,496,401 | $ 2,800,969 | $ - |
See accompanying notes which are an integral part of the financial statements.
Annual Report
Statement of Assets and Liabilities
| December 31, 2011 |
Assets | | |
Investment in securities, at value (including securities loaned of $498,936) - See accompanying schedule: Unaffiliated issuers (cost $35,454,398) | $ 36,106,827 | |
Fidelity Central Funds (cost $1,190,543) | 1,190,543 | |
Total Investments (cost $36,644,941) | | $ 37,297,370 |
Foreign currency held at value (cost $362) | | 363 |
Receivable for investments sold
Regular delivery | | 18,684 |
Delayed delivery | | 13,003 |
Dividends receivable | | 95,868 |
Distributions receivable from Fidelity Central Funds | | 379 |
Prepaid expenses | | 114 |
Receivable from investment adviser for expense reductions | | 9,676 |
Other receivables | | 58,682 |
Total assets | | 37,494,139 |
| | |
Liabilities | | |
Payable for investments purchased | $ 140,269 | |
Payable for fund shares redeemed | 19,957 | |
Accrued management fee | 21,673 | |
Distribution and service plan fees payable | 65 | |
Other affiliated payables | 5,351 | |
Other payables and accrued expenses | 59,124 | |
Collateral on securities loaned, at value | 520,645 | |
Total liabilities | | 767,084 |
| | |
Net Assets | | $ 36,727,055 |
Net Assets consist of: | | |
Paid in capital | | $ 59,002,737 |
Distributions in excess of net investment income | | (14,902) |
Accumulated undistributed net realized gain (loss) on investments and foreign currency transactions | | (22,900,610) |
Net unrealized appreciation (depreciation) on investments and assets and liabilities in foreign currencies | | 639,830 |
Net Assets | | $ 36,727,055 |
Statement of Assets and Liabilities - continued
| December 31, 2011 |
Initial Class:
Net Asset Value, offering price and redemption price per share ($511,204 ÷ 60,708 shares) | | $ 8.42 |
| | |
Service Class:
Net Asset Value, offering price and redemption price per share
($74,547 ÷ 8,865 shares) | | $ 8.41 |
| | |
Service Class 2:
Net Asset Value, offering price and redemption price per share ($166,119 ÷ 19,785 shares) | | $ 8.40 |
| | |
Initial Class R:
Net Asset Value, offering price and redemption price per share ($10,557,130 ÷ 1,253,495 shares) | | $ 8.42 |
| | |
| | |
Service Class R:
Net Asset Value, offering price and redemption price per share
($74,547 ÷ 8,865 shares) | | $ 8.41 |
| | |
Service Class 2R:
Net Asset Value, offering price and redemption price per share
($81,276 ÷ 9,675 shares) | | $ 8.40 |
| | |
Investor Class R :
Net Asset Value, offering price and redemption price per share ($25,262,232 ÷ 3,018,033 shares) | | $ 8.37 |
See accompanying notes which are an integral part of the financial statements.
Annual Report
Statement of Operations
| Year ended December 31, 2011 |
Investment Income | | |
Dividends | | $ 845,485 |
Income from Fidelity Central Funds | | 15,340 |
Income before foreign taxes withheld | | 860,825 |
Less foreign taxes withheld | | (61,946) |
Total income | | 798,879 |
| | |
Expenses | | |
Management fee | $ 295,371 | |
Transfer agent fees | 58,888 | |
Distribution and service plan fees | 694 | |
Accounting and security lending fees | 21,931 | |
Custodian fees and expenses | 113,098 | |
Independent trustees' compensation | 239 | |
Audit | 81,075 | |
Legal | 169 | |
Miscellaneous | 417 | |
Total expenses before reductions | 571,882 | |
Expense reductions | (116,832) | 455,050 |
Net investment income (loss) | | 343,829 |
Realized and Unrealized Gain (Loss) Net realized gain (loss) on: | | |
Investment securities: | | |
Unaffiliated issuers | 258,060 | |
Foreign currency transactions | (47,246) | |
Total net realized gain (loss) | | 210,814 |
Change in net unrealized appreciation (depreciation) on: Investment securities (net of decrease in deferred foreign taxes of $27,938) | (5,698,370) | |
Assets and liabilities in foreign currencies | (12,699) | |
Total change in net unrealized appreciation (depreciation) | | (5,711,069) |
Net gain (loss) | | (5,500,255) |
Net increase (decrease) in net assets resulting from operations | | $ (5,156,426) |
See accompanying notes which are an integral part of the financial statements.
Annual Report
Financial Statements - continued
Statement of Changes in Net Assets
| Year ended
December 31, 2011 | Year ened
December 31, 2010 |
Increase (Decrease) in Net Assets | | |
Operations | | |
Net investment income (loss) | $ 343,829 | $ 501,549 |
Net realized gain (loss) | 210,814 | 3,396,257 |
Change in net unrealized appreciation (depreciation) | (5,711,069) | 2,011,744 |
Net increase (decrease) in net assets resulting from operations | (5,156,426) | 5,909,550 |
Distributions to shareholders from net investment income | (367,246) | (494,828) |
Distributions to shareholders from net realized gain | (46,342) | (483,411) |
Total distributions | (413,588) | (978,239) |
Share transactions - net increase (decrease) | (3,417,273) | (5,534,279) |
Redemption fees | 4,434 | 10,678 |
Total increase (decrease) in net assets | (8,982,853) | (592,290) |
| | |
Net Assets | | |
Beginning of period | 45,709,908 | 46,302,198 |
End of period (including distributions in excess of net investment income of $14,902 and undistributed net investment income of $6,999, respectively) | $ 36,727,055 | $ 45,709,908 |
See accompanying notes which are an integral part of the financial statements.
Annual Report
Financial Highlights - Initial Class
Years ended December 31, | 2011 | 2010 | 2009 | 2008 | 2007 |
Selected Per-Share Data | | | | | |
Net asset value, beginning of period | $ 9.74 | $ 8.60 | $ 5.61 | $ 11.44 | $ 12.68 |
Income from Investment Operations | | | | | |
Net investment income (loss) C | .08 | .10 | .07 | .15 | .11 F |
Net realized and unrealized gain (loss) | (1.30) | 1.24 | 3.07 | (5.92) | .53 |
Total from investment operations | (1.22) | 1.34 | 3.14 | (5.77) | .64 |
Distributions from net investment income | (.09) | (.11) | (.06) | - | (.09) |
Distributions from net realized gain | (.01) | (.10) | (.09) | (.06) | (1.79) |
Total distributions | (.10) | (.20) I | (.15) | (.06) | (1.88) |
Redemption fees added to paid in capital C, H | - | - | - | - | - |
Net asset value, end of period | $ 8.42 | $ 9.74 | $ 8.60 | $ 5.61 | $ 11.44 |
Total Return A,B | (12.57)% | 15.73% | 56.04% | (50.69)% | 5.17% |
Ratios to Average Net Assets D,G | | | | | |
Expenses before reductions | 1.30% | 1.60% | 1.81% | 1.54% | 1.20% |
Expenses net of fee waivers, if any | 1.10% | 1.10% | 1.10% | 1.10% | 1.10% |
Expenses net of all reductions | 1.03% | .96% | .93% | .91% | 1.07% |
Net investment income (loss) | .88% | 1.19% | 1.03% | 1.65% | .82% F |
Supplemental Data | | | | | |
Net assets, end of period (000 omitted) | $ 511 | $ 732 | $ 645 | $ 388 | $ 1,409 |
Portfolio turnover rate E | 236% | 463% | 416% | 350% | 224% |
A Total returns do not reflect charges attributable to your insurance company's separate account. Inclusion of these charges would reduce the total returns shown.
B Total returns would have been lower if certain expenses had not been reduced during the applicable periods shown.
C Calculated based on average shares outstanding during the period.
D Fees and expenses of any underlying Fidelity Central Funds are not included in the Fund's expense ratio. The Fund indirectly bears its proportionate share of the expenses of any underlying Fidelity Central Funds.
E Amount does not include the portfolio activity of any underlying Fidelity Central Funds.
F Investment income per share reflects a special dividend which amounted to $.02 per share. Excluding the special dividend, the ratio of net investment income (loss) to average net assets would have been .68%.
G Expense ratios reflect operating expenses of the class. Expenses before reductions do not reflect amounts reimbursed by the investment adviser or reductions from brokerage service arrangements or reductions from other expense offset arrangements and do not represent the amount paid by the class during periods when reimbursements or reductions occur. Expenses net of fee waivers reflect expenses after reimbursement by the investment adviser but prior to reductions from brokerage service arrangements or other expense offset arrangements. Expenses net of all reductions represent the net expenses paid by the class.
H Amount represents less than $.01 per share.
I Total distributions of $.20 per share is comprised of distributions from net investment income of $.105 and distributions from net realized gain of $.097 per share.
Financial Highlights - Service Class
Years ended December 31, | 2011 | 2010 | 2009 | 2008 | 2007 |
Selected Per-Share Data | | | | | |
Net asset value, beginning of period | $ 9.72 | $ 8.58 | $ 5.61 | $ 11.43 | $ 12.67 |
Income from Investment Operations | | | | | |
Net investment income (loss) C | .07 | .10 | .06 | .14 | .10 F |
Net realized and unrealized gain (loss) | (1.29) | 1.23 | 3.05 | (5.90) | .53 |
Total from investment operations | (1.22) | 1.33 | 3.11 | (5.76) | .63 |
Distributions from net investment income | (.08) | (.10) | (.05) | - | (.08) |
Distributions from net realized gain | (.01) | (.10) | (.09) | (.06) | (1.79) |
Total distributions | (.09) | (.19) I | (.14) | (.06) | (1.87) |
Redemption fees added to paid in capital C, H | - | - | - | - | - |
Net asset value, end of period | $ 8.41 | $ 9.72 | $ 8.58 | $ 5.61 | $ 11.43 |
Total Return A,B | (12.60)% | 15.65% | 55.52% | (50.64)% | 5.06% |
Ratios to Average Net Assets D,G | | | | | |
Expenses before reductions | 1.42% | 1.67% | 1.73% | 1.51% | 1.20% |
Expenses net of fee waivers, if any | 1.20% | 1.20% | 1.20% | 1.20% | 1.20% |
Expenses net of all reductions | 1.14% | 1.05% | 1.04% | 1.01% | 1.16% |
Net investment income (loss) | .78% | 1.09% | .92% | 1.55% | .72% F |
Supplemental Data | | | | | |
Net assets, end of period (000 omitted) | $ 75 | $ 100 | $ 117 | $ 135 | $ 414 |
Portfolio turnover rate E | 236% | 463% | 416% | 350% | 224% |
A Total returns do not reflect charges attributable to your insurance company's separate account. Inclusion of these charges would reduce the total returns shown.
B Total returns would have been lower if certain expenses had not been reduced during the applicable periods shown.
C Calculated based on average shares outstanding during the period.
D Fees and expenses of any underlying Fidelity Central Funds are not included in the Fund's expense ratio. The Fund indirectly bears its proportionate share of the expenses of any underlying Fidelity Central Funds.
E Amount does not include the portfolio activity of any underlying Fidelity Central Funds.
F Investment income per share reflects a special dividend which amounted to $.02 per share. Excluding the special dividend, the ratio of net investment income (loss) to average net assets would have been .58%.
G Expense ratios reflect operating expenses of the class. Expenses before reductions do not reflect amounts reimbursed by the investment adviser or reductions from brokerage service arrangements or reductions from other expense offset arrangements and do not represent the amount paid by the class during periods when reimbursements or reductions occur. Expenses net of fee waivers reflect expenses after reimbursement by the investment adviser but prior to reductions from brokerage service arrangements or other expense offset arrangements. Expenses net of all reductions represent the net expenses paid by the class.
H Amount represents less than $.01 per share.
I Total distributions of $.19 per share is comprised of distributions from net investment income of $.095 and distributions from net realized gain of $.097 per share.
See accompanying notes which are an integral part of the financial statements.
Annual Report
Financial Highlights - Service Class 2
Years ended December 31, | 2011 | 2010 | 2009 | 2008 | 2007 |
Selected Per-Share Data | | | | | |
Net asset value, beginning of period | $ 9.72 | $ 8.57 | $ 5.60 | $ 11.43 | $ 12.67 |
Income from Investment Operations | | | | | |
Net investment income (loss) | .06 | .08 | .05 | .12 | .08 F |
Net realized and unrealized gain (loss) C | (1.30) | 1.24 | 3.05 | (5.89) | .53 |
Total from investment operations | (1.24) | 1.32 | 3.10 | (5.77) | .61 |
Distributions from net investment income | (.07) | (.07) | (.04) | - | (.06) |
Distributions from net realized gain | (.01) | (.10) | (.09) | (.06) | (1.79) |
Total distributions | (.08) | (.17) | (.13) | (.06) | (1.85) |
Redemption fees added to paid in capital C, H | - | - | - | - | - |
Net asset value, end of period | $ 8.40 | $ 9.72 | $ 8.57 | $ 5.60 | $ 11.43 |
Total Return A,B | (12.74)% | 15.53% | 55.44% | (50.73)% | 4.89% |
Ratios to Average Net Assets D,G | | | | | |
Expenses before reductions | 1.58% | 1.88% | 2.02% | 1.79% | 1.41% |
Expenses net of fee waivers, if any | 1.35% | 1.35% | 1.35% | 1.35% | 1.35% |
Expenses net of all reductions | 1.28% | 1.21% | 1.19% | 1.16% | 1.32% |
Net investment income (loss) | .63% | .94% | .77% | 1.40% | .57% F |
Supplemental Data | | | | | |
Net assets, end of period (000 omitted) | $ 166 | $ 115 | $ 424 | $ 302 | $ 550 |
Portfolio turnover rate E | 236% | 463% | 416% | 350% | 224% |
A Total returns do not reflect charges attributable to your insurance company's separate account. Inclusion of these charges would reduce the total returns shown.
B Total returns would have been lower if certain expenses had not been reduced during the applicable periods shown.
C Calculated based on average shares outstanding during the period.
D Fees and expenses of any underlying Fidelity Central Funds are not included in the Fund's expense ratio. The Fund indirectly bears its proportionate share of the expenses of any underlying Fidelity Central Funds.
E Amount does not include the portfolio activity of any underlying Fidelity Central Funds.
F Investment income per share reflects a special dividend which amounted to $.02 per share. Excluding the special dividend, the ratio of net investment income (loss) to average net assets would have been .43%.
G Expense ratios reflect operating expenses of the class. Expenses before reductions do not reflect amounts reimbursed by the investment adviser or reductions from brokerage service arrangements or reductions from other expense offset arrangements and do not represent the amount paid by the class during periods when reimbursements or reductions occur. Expenses net of fee waivers reflect expenses after reimbursement by the investment adviser but prior to reductions from brokerage service arrangements or other expense offset arrangements. Expenses net of all reductions represent the net expenses paid by the class.
H Amount represents less than $.01 per share.
Financial Highlights - Initial Class R
Years ended December 31, | 2011 | 2010 | 2009 | 2008 | 2007 |
Selected Per-Share Data | | | | | |
Net asset value, beginning of period | $ 9.74 | $ 8.60 | $ 5.62 | $ 11.44 | $ 12.68 |
Income from Investment Operations | | | | | |
Net investment income (loss) C | .08 | .10 | .07 | .15 | .11 F |
Net realized and unrealized gain (loss) | (1.30) | 1.24 | 3.06 | (5.91) | .53 |
Total from investment operations | (1.22) | 1.34 | 3.13 | (5.76) | .64 |
Distributions from net investment income | (.09) | (.11) | (.06) | - | (.09) |
Distributions from net realized gain | (.01) | (.10) | (.09) | (.06) | (1.79) |
Total distributions | (.10) | (.20) I | (.15) | (.06) | (1.88) |
Redemption fees added to paid in capital C, H | - | - | - | - | - |
Net asset value, end of period | $ 8.42 | $ 9.74 | $ 8.60 | $ 5.62 | $ 11.44 |
Total Return A,B | (12.57)% | 15.73% | 55.76% | (50.60)% | 5.17% |
Ratios to Average Net Assets D,G | | | | | |
Expenses before reductions | 1.33% | 1.55% | 1.60% | 1.44% | 1.11% |
Expenses net of fee waivers, if any | 1.10% | 1.10% | 1.10% | 1.10% | 1.10% |
Expenses net of all reductions | 1.03% | .95% | .93% | .91% | 1.06% |
Net investment income (loss) | .88% | 1.19% | 1.02% | 1.65% | .82% F |
Supplemental Data | | | | | |
Net assets, end of period (000 omitted) | $ 10,557 | $ 15,305 | $ 17,150 | $ 8,483 | $ 32,345 |
Portfolio turnover rate E | 236% | 463% | 416% | 350% | 224% |
A Total returns do not reflect charges attributable to your insurance company's separate account. Inclusion of these charges would reduce the total returns shown.
B Total returns would have been lower if certain expenses had not been reduced during the applicable periods shown.
C Calculated based on average shares outstanding during the period.
D Fees and expenses of any underlying Fidelity Central Funds are not included in the Fund's expense ratio. The Fund indirectly bears its proportionate share of the expenses of any underlying Fidelity Central Funds.
E Amount does not include the portfolio activity of any underlying Fidelity Central Funds.
F Investment income per share reflects a special dividend which amounted to $.02 per share. Excluding the special dividend, the ratio of net investment income (loss) to average net assets would have been .68%.
G Expense ratios reflect operating expenses of the class. Expenses before reductions do not reflect amounts reimbursed by the investment adviser or reductions from brokerage service arrangements or reductions from other expense offset arrangements and do not represent the amount paid by the class during periods when reimbursements or reductions occur. Expenses net of fee waivers reflect expenses after reimbursement by the investment adviser but prior to reductions from brokerage service arrangements or other expense offset arrangements. Expenses net of all reductions represent the net expenses paid by the class.
H Amount represents less than $.01 per share.
I Total distributions of $.20 per share is comprised of distributions from net investment income of $.105 and distributions from net realized gain of $.097 per share.
See accompanying notes which are an integral part of the financial statements.
Annual Report
Financial Highlights - Service Class R
Years ended December 31, | 2011 | 2010 | 2009 | 2008 | 2007 |
Selected Per-Share Data | | | | | |
Net asset value, beginning of period | $ 9.72 | $ 8.58 | $ 5.61 | $ 11.43 | $ 12.67 |
Income from Investment Operations | | | | | |
Net investment income (loss) C | .07 | .10 | .06 | .14 | .10 F |
Net realized and unrealized gain (loss) | (1.29) | 1.23 | 3.05 | (5.90) | .53 |
Total from investment operations | (1.22) | 1.33 | 3.11 | (5.76) | .63 |
Distributions from net investment income | (.08) | (.10) | (.05) | - | (.08) |
Distributions from net realized gain | (.01) | (.10) | (.09) | (.06) | (1.79) |
Total distributions | (.09) | (.19) I | (.14) | (.06) | (1.87) |
Redemption fees added to paid in capital C, H | - | - | - | - | - |
Net asset value, end of period | $ 8.41 | $ 9.72 | $ 8.58 | $ 5.61 | $ 11.43 |
Total Return A,B | (12.60)% | 15.65% | 55.52% | (50.64)% | 5.06% |
Ratios to Average Net Assets D,G | | | | | |
Expenses before reductions | 1.42% | 1.67% | 1.73% | 1.51% | 1.20% |
Expenses net of fee waivers, if any | 1.20% | 1.20% | 1.20% | 1.20% | 1.20% |
Expenses net of all reductions | 1.14% | 1.05% | 1.04% | 1.01% | 1.16% |
Net investment income (loss) | .78% | 1.09% | .92% | 1.55% | .72% F |
Supplemental Data | | | | | |
Net assets, end of period (000 omitted) | $ 75 | $ 100 | $ 117 | $ 135 | $ 414 |
Portfolio turnover rate E | 236% | 463% | 416% | 350% | 224% |
A Total returns do not reflect charges attributable to your insurance company's separate account. Inclusion of these charges would reduce the total returns shown.
B Total returns would have been lower if certain expenses had not been reduced during the applicable periods shown.
C Calculated based on average shares outstanding during the period.
D Fees and expenses of any underlying Fidelity Central Funds are not included in the Fund's expense ratio. The Fund indirectly bears its proportionate share of the expenses of any underlying Fidelity Central Funds.
E Amount does not include the portfolio activity of any underlying Fidelity Central Funds.
F Investment income per share reflects a special dividend which amounted to $.02 per share. Excluding the special dividend, the ratio of net investment income (loss) to average net assets would have been .58%.
G Expense ratios reflect operating expenses of the class. Expenses before reductions do not reflect amounts reimbursed by the investment adviser or reductions from brokerage service arrangements or reductions from other expense offset arrangements and do not represent the amount paid by the class during periods when reimbursements or reductions occur. Expenses net of fee waivers reflect expenses after reimbursement by the investment adviser but prior to reductions from brokerage service arrangements or other expense offset arrangements. Expenses net of all reductions represent the net expenses paid by the class.
H Amount represents less than $.01 per share.
I Total distributions of $.19 per share is comprised of distributions from net investment income of $.095 and distributions from net realized gain of $.097 per share.
Financial Highlights - Service Class 2R
Years ended December 31, | 2011 | 2010 | 2009 | 2008 | 2007 |
Selected Per-Share Data | | | | | |
Net asset value, beginning of period | $ 9.71 | $ 8.57 | $ 5.60 | $ 11.43 | $ 12.67 |
Income from Investment Operations | | | | | |
Net investment income (loss) C | .06 | .08 | .05 | .13 | .08 F |
Net realized and unrealized gain (loss) | (1.30) | 1.23 | 3.05 | (5.90) | .53 |
Total from investment operations | (1.24) | 1.31 | 3.10 | (5.77) | .61 |
Distributions from net investment income | (.06) | (.08) | (.04) | - | (.06) |
Distributions from net realized gain | (.01) | (.10) | (.09) | (.06) | (1.79) |
Total distributions | (.07) | (.17) I | (.13) | (.06) | (1.85) |
Redemption fees added to paid in capital C, H | - | - | - | - | - |
Net asset value, end of period | $ 8.40 | $ 9.71 | $ 8.57 | $ 5.60 | $ 11.43 |
Total Return A,B | (12.77)% | 15.45% | 55.36% | (50.73)% | 4.90% |
Ratios to Average Net Assets D,G | | | | | |
Expenses before reductions | 1.57% | 1.83% | 1.87% | 1.66% | 1.35% |
Expenses net of fee waivers, if any | 1.35% | 1.35% | 1.35% | 1.35% | 1.35% |
Expenses net of all reductions | 1.28% | 1.21% | 1.19% | 1.16% | 1.31% |
Net investment income (loss) | .63% | .94% | .77% | 1.40% | .57% F |
Supplemental Data | | | | | |
Net assets, end of period (000 omitted) | $ 81 | $ 109 | $ 155 | $ 179 | $ 550 |
Portfolio turnover rate E | 236% | 463% | 416% | 350% | 224% |
A Total returns do not reflect charges attributable to your insurance company's separate account. Inclusion of these charges would reduce the total returns shown.
B Total returns would have been lower if certain expenses had not been reduced during the applicable periods shown.
C Calculated based on average shares outstanding during the period.
D Fees and expenses of any underlying Fidelity Central Funds are not included in the Fund's expense ratio. The Fund indirectly bears its proportionate share of the expenses of any underlying Fidelity Central Funds.
E Amount does not include the portfolio activity of any underlying Fidelity Central Funds.
F Investment income per share reflects a special dividend which amounted to $.02 per share. Excluding the special dividend, the ratio of net investment income (loss) to average net assets would have been .43%.
G Expense ratios reflect operating expenses of the class. Expenses before reductions do not reflect amounts reimbursed by the investment adviser or reductions from brokerage service arrangements or reductions from other expense offset arrangements and do not represent the amount paid by the class during periods when reimbursements or reductions occur. Expenses net of fee waivers reflect expenses after reimbursement by the investment adviser but prior to reductions from brokerage service arrangements or other expense offset arrangements. Expenses net of all reductions represent the net expenses paid by the class.
H Amount represents less than $.01 per share.
I Total distributions of $.17 per share is comprised of distributions from net investment income of $.077 and distributions from net realized gain of $.097 per share.
See accompanying notes which are an integral part of the financial statements.
Annual Report
Financial Highlights - Investor Class R
Years ended December 31, | 2011 | 2010 | 2009 | 2008 | 2007 |
Selected Per-Share Data | | | | | |
Net asset value, beginning of period | $ 9.69 | $ 8.56 | $ 5.60 | $ 11.41 | $ 12.65 |
Income from Investment Operations | | | | | |
Net investment income (loss) C | .07 | .10 | .07 | .14 | .09 F |
Net realized and unrealized gain (loss) | (1.29) | 1.23 | 3.04 | (5.89) | .54 |
Total from investment operations | (1.22) | 1.33 | 3.11 | (5.75) | .63 |
Distributions from net investment income | (.09) | (.11) | (.06) | - | (.08) |
Distributions from net realized gain | (.01) | (.10) | (.09) | (.06) | (1.79) |
Total distributions | (.10) | (.20) I | (.15) | (.06) | (1.87) |
Redemption fees added to paid in capital C, H | - | - | - | - | - |
Net asset value, end of period | $ 8.37 | $ 9.69 | $ 8.56 | $ 5.60 | $ 11.41 |
Total Return A,B | (12.63)% | 15.69% | 55.61% | (50.65)% | 5.07% |
Ratios to Average Net Assets D,G | | | | | |
Expenses before reductions | 1.39% | 1.63% | 1.68% | 1.51% | 1.22% |
Expenses net of fee waivers, if any | 1.18% | 1.18% | 1.18% | 1.17% | 1.22% |
Expenses net of all reductions | 1.12% | 1.04% | 1.01% | .97% | 1.18% |
Net investment income (loss) | .80% | 1.11% | .94% | 1.59% | .71% F |
Supplemental Data | | | | | |
Net assets, end of period (000 omitted) | $ 25,262 | $ 29,249 | $ 27,695 | $ 14,208 | $ 38,719 |
Portfolio turnover rate E | 236% | 463% | 416% | 350% | 224% |
A Total returns do not reflect charges attributable to your insurance company's separate account. Inclusion of these charges would reduce the total returns shown.
B Total returns would have been lower if certain expenses had not been reduced during the applicable periods shown.
C Calculated based on average shares outstanding during the period.
D Fees and expenses of any underlying Fidelity Central Funds are not included in the Fund's expense ratio. The Fund indirectly bears its proportionate share of the expenses of any underlying Fidelity Central Funds.
E Amount does not include the portfolio activity of any underlying Fidelity Central Funds.
F Investment income per share reflects a special dividend which amounted to $.02 per share. Excluding the special dividend, the ratio of net investment income (loss) to average net assets would have been .57%.
G Expense ratios reflect operating expenses of the class. Expenses before reductions do not reflect amounts reimbursed by the investment adviser or reductions from brokerage service arrangements or reductions from other expense offset arrangements and do not represent the amount paid by the class during periods when reimbursements or reductions occur. Expenses net of fee waivers reflect expenses after reimbursement by the investment adviser but prior to reductions from brokerage service arrangements or other expense offset arrangements. Expenses net of all reductions represent the net expenses paid by the class.
H Amount represents less than $.01 per share.
I Total distributions of $.20 per share is comprised of distributions from net investment income of $.105 and distributions from net realized gain of $.097 per share.
See accompanying notes which are an integral part of the financial statements.
Annual Report
Notes to Financial Statements
For the period ended December 31, 2011
1. Organization.
VIP International Capital Appreciation Portfolio (the Fund) is a fund of Variable Insurance Products Fund IV (the Trust) and is authorized to issue an unlimited number of shares. The Trust is registered under the Investment Company Act of 1940, as amended (the 1940 Act), as an open-end management investment company organized as a Massachusetts business trust. Shares of the Fund may only be purchased by insurance companies for the purpose of funding variable annuity or variable life insurance contracts. The Fund offers the following classes of shares: Initial Class shares, Service Class shares, Service Class 2 shares, Initial Class R shares, Service Class R shares, Service Class 2R shares, and Investor Class R shares. All classes have equal rights and voting privileges, except for matters affecting a single class. Investment income, realized and unrealized capital gains and losses, the common expenses of the Fund, and certain fund-level expense reductions, if any, are allocated on a pro-rata basis to each class based on the relative net assets of each class to the total net assets of the Fund. Each class differs with respect to transfer agent and distribution and service plan fees incurred. Certain expense reductions may also differ by class. The Fund's investments in emerging markets can be subject to social, economic, regulatory, and political uncertainties and can be extremely volatile.
2. Investments in Fidelity Central Funds.
The Fund invests in Fidelity Central Funds, which are open-end investment companies available only to other investment companies and accounts managed by Fidelity Management & Research Company (FMR) and its affiliates. The Fund's Schedule of Investments lists each of the Fidelity Central Funds held as of period end, if any, as an investment of the Fund, but do not include the underlying holdings of each Fidelity Central Fund. As an Investing Fund, the Fund indirectly bears its proportionate share of the expenses of the underlying Fidelity Central Funds.
The Money Market Central Funds seek preservation of capital and current income and are managed by Fidelity Investments Money Management, Inc. (FIMM), an affiliate of FMR.
A complete unaudited list of holdings for each Fidelity Central Fund is available upon request or at the Securities and Exchange Commission (the SEC) web site at www.sec.gov. In addition, the financial statements of the Fidelity Central Funds, which are not covered by the Fund's Report of Independent Registered Public Accounting Firm, are available on the SEC web site or upon request.
3. Significant Accounting Policies.
The financial statements have been prepared in conformity with accounting principles generally accepted in the United States of America (GAAP), which require management to make certain estimates and assumptions at the date of the financial statements. Actual results could differ from those estimates. Subsequent events, if any, through the date that the financial statements were issued have been evaluated in the preparation of the financial statements. The following summarizes the significant accounting policies of the Fund:
Security Valuation. Investments are valued as of 4:00 p.m. Eastern time on the last calendar day of the period. The Fund uses independent pricing services approved by the Board of Trustees to value its investments. When current market prices or quotations are not readily available or reliable, valuations may be determined in good faith in accordance with procedures adopted by the Board of Trustees. Factors used in determining value may include market or security specific events. The frequency with which these procedures are used cannot be predicted and they may be utilized to a significant extent. The value used for net asset value (NAV) calculation under these procedures may differ from published prices for the same securities.
The Fund categorizes the inputs to valuation techniques used to value its investments into a disclosure hierarchy consisting of three levels as shown below:
Level 1 - quoted prices in active markets for identical investments
Level 2 - other significant observable inputs (including quoted prices for similar investments, interest rates, prepayment speeds, etc.)
Level 3 - unobservable inputs (including the Fund's own assumptions based on the best information available)
Changes in valuation techniques may result in transfers in or out of an assigned level within the disclosure hierarchy. The aggregate value of investments by input level, as of December 31, 2011, is included at the end of the Fund's Schedule of Investments. Valuation techniques used to value the Fund's investments by major category are as follows:
Equity securities, including restricted securities, for which market quotations are readily available, are valued at the last reported sale price or official closing price as reported by an independent pricing service on the primary market or exchange on which they are traded and are categorized as Level 1 in the hierarchy. In the event there were no sales during the day or closing prices are not available, securities are valued at the last quoted bid price or may be valued using the last available price and are generally categorized as Level 2 in the hierarchy. For foreign equity securities, when significant market or security specific events arise, comparisons to the valuation of American Depositary Receipts (ADRs), futures contracts, Exchange-traded funds (ETFs) and certain indexes as well as quoted prices for similar securities are used and are categorized as Level 2 in the hierarchy in these
Annual Report
Notes to Financial Statements - continued
3. Significant Accounting Policies - continued
Security Valuation - continued
circumstances. Utilizing these techniques may result in transfers between Level 1 and Level 2. For restricted equity securities and private placements where observable inputs are limited, assumptions about market activity and risk are used and are categorized as Level 3 in the hierarchy.
Investments in open-end mutual funds, including the Fidelity Central Funds, are valued at their closing net asset value each business day and are categorized as Level 1 in the hierarchy.
New Accounting Pronouncements. In May 2011, the Financial Accounting Standards Board issued Accounting Standard Update No. 2011-04, Fair Value Measurement (Topic 820) - Amendments to Achieve Common Fair Value Measurement and Disclosure Requirements in U.S. GAAP and IFRSs. The update is effective during interim and annual periods beginning after December 15, 2011, and will result in additional disclosure for transfers between levels as well as expanded disclosure for securities categorized as Level 3 under the fair value hierarchy.
In December 2011, the Financial Accounting Standards Board issued Accounting Standard Update No. 2011-11, Disclosures about Offsetting Assets and Liabilities. The update creates new disclosure requirements requiring entities to disclose both gross and net information for derivatives and other financial instruments that are either offset in the Statement of Assets and Liabilities or subject to an enforceable master netting arrangement or similar agreement. The disclosure requirements are effective for annual reporting periods beginning on or after January 1, 2013. Management is currently evaluating the impact of the update's adoption on the Fund's financial statement disclosures.
Foreign Currency. The Fund may use foreign currency contracts to facilitate transactions in foreign-denominated securities. Gains and losses from these transactions may arise from changes in the value of the foreign currency or if the counterparties do not perform under the contracts' terms.
Foreign-denominated assets, including investment securities, and liabilities are translated into U.S. dollars at the exchange rate at period end. Purchases and sales of investment securities, income and dividends received and expenses denominated in foreign currencies are translated into U.S. dollars at the exchange rate in effect on the transaction date.
The effects of exchange rate fluctuations on investments are included with the net realized and unrealized gain (loss) on investment securities. Other foreign currency transactions resulting in realized and unrealized gain (loss) are disclosed separately.
Investment Transactions and Income. For financial reporting purposes, the Fund's investment holdings and NAV include trades executed through the end of the last business day of the period. The NAV per share for processing shareholder transactions is calculated as of the close of business of the New York Stock Exchange (NYSE), normally 4:00 p.m. Eastern time and includes trades executed through the end of the prior business day. Gains and losses on securities sold are determined on the basis of identified cost. Dividend income is recorded on the ex-dividend date, except for certain dividends from foreign securities where the ex-dividend date may have passed, which are recorded as soon as the Fund is informed of the ex-dividend date. Non-cash dividends included in dividend income, if any, are recorded at the fair market value of the securities received. Distributions received on securities that represent a return of capital or capital gain are recorded as a reduction of cost of investments and/or as a realized gain. The Fund estimates the components of distributions received that may be considered return of capital distributions or capital gain distributions. Interest income and distributions from the Fidelity Central Funds are accrued as earned. Interest income includes coupon interest and amortization of premium and accretion of discount on debt securities. Investment income is recorded net of foreign taxes withheld where recovery of such taxes is uncertain.
Expenses. Expenses directly attributable to a fund are charged to that fund. Expenses attributable to more than one fund are allocated among the respective funds on the basis of relative net assets or other appropriate methods. Expense estimates are accrued in the period to which they relate and adjustments are made when actual amounts are known.
Income Tax Information and Distributions to Shareholders. Each year, the Fund intends to qualify as a regulated investment company, including distributing substantially all of its taxable income and realized gains under Subchapter M of the Internal Revenue Code. As a result, no provision for income taxes is required. As of December 31, 2011, the Fund did not have any unrecognized tax benefits in the financial statements; nor is the Fund aware of any tax positions for which it is reasonably possible that the total amounts of unrecognized tax benefits will significantly change in the next twelve months. The Fund files a U.S. federal tax return, in addition to state and local tax returns as required. A fund's tax returns are subject to examination by the Internal Revenue Service (IRS) for a period of three fiscal years. State and local tax returns may be subject to examination for an additional fiscal year depending on the jurisdiction. Foreign taxes are provided for based on the Fund's understanding of the tax rules and rates that exist in the foreign markets in which it invests.
Distributions are declared and recorded on the ex-dividend date. Income dividends and capital gain distributions are declared separately for each class. Income and capital gain distributions are determined in accordance with income tax regulations, which may differ from GAAP.
Capital accounts within the financial statements are adjusted for permanent book-tax differences. These adjustments have no impact on net assets or the results of operations. Temporary book-tax differences will reverse in a subsequent period.
Annual Report
3. Significant Accounting Policies - continued
Income Tax Information and Distributions to Shareholders - continued
Book-tax differences are primarily due to foreign currency transactions, certain foreign taxes, passive foreign investment companies (PFIC), equity-debt classifications, capital loss carryforwards and losses deferred due to wash sales and excise tax regulations.
The federal tax cost of investment securities and unrealized appreciation (depreciation) as of period end were as follows:
Gross unrealized appreciation | $ 3,266,996 |
Gross unrealized depreciation | (3,038,967) |
Net unrealized appreciation (depreciation) on securities and other investments | $ 228,029 |
| |
Tax Cost | $ 37,069,341 |
The tax-based components of distributable earnings as of period end were as follows:
Capital loss carryforward | $ (22,476,211) |
Net unrealized appreciation (depreciation) | $ 215,430 |
Capital loss carryforwards are only available to offset future capital gains of the Fund to the extent provided by regulations and may be limited. Under the Regulated Investment Company Modernization Act of 2010 (the Act), the Fund is permitted to carry forward capital losses incurred in taxable years beginning after December 22, 2010 for an unlimited period and such capital losses are required to be used prior to any losses that expire. Capital loss carryforwards were as follows:
Fiscal year of expiration | |
2016 | $ (17,897,996) |
2017 | (4,429,182) |
Total with expiration | (22,327,178) |
No expiration | |
Short-term | (149,033) |
Total capital loss carryforward | $ (22,476,211) |
The tax character of distributions paid was as follows:
| December 31, 2011 | December 31, 2010 |
Ordinary Income | $ 413,588 | $ 978,239 |
Trading (Redemption) Fees. Initial Class R shares, Service Class R shares, Service Class 2R shares and Investor Class R shares held by investors less than 60 days are subject to a redemption fee equal to 1% of the net asset value of shares redeemed. All redemption fees, which reduce the proceeds of the shareholder redemption, are retained by the Fund and accounted for as an addition to paid in capital.
4. Operating Policies.
Delayed Delivery Transactions and When-Issued Securities. During the period, the Fund transacted in securities on a delayed delivery or when-issued basis. Payment and delivery may take place after the customary settlement period for that security. The price of the underlying securities and the date when the securities will be delivered and paid for are fixed at the time the transaction is negotiated. During the time a delayed delivery sell is outstanding, the contract is marked-to-market daily and equivalent deliverable securities are held for the transaction. The Fund may receive compensation for interest forgone in the purchase of a delayed delivery or when-issued security. With respect to purchase commitments, the Fund identifies securities as segregated in its records with a value at least equal to the amount of the commitment. Losses may arise due to changes in the value of the underlying securities or if the counterparty does not perform under the contract's terms, or if the issuer does not issue the securities due to political, economic, or other factors.
5. Purchases and Sales of Investments.
Purchases and sales of securities, other than short-term securities, aggregated $98,601,262 and $102,030,084, respectively.
Annual Report
Notes to Financial Statements - continued
6. Fees and Other Transactions with Affiliates.
Management Fee. FMR and its affiliates provide the Fund with investment management related services for which the Fund pays a monthly management fee. The management fee is the sum of an individual fund fee rate that is based on an annual rate of .45% of the Fund's average net assets and an annualized group fee rate that averaged .26% during the period. The group fee rate is based upon the average net assets of all the mutual funds advised by FMR. The group fee rate decreases as assets under management increase and increases as assets under management decrease. For the period, the total annual management fee rate was .71% of the Fund's average net assets.
Distribution and Service Plan Fees. In accordance with Rule 12b-1 of the 1940 Act, the Fund has adopted separate 12b-1 Plans for each Service Class of shares. Each Service Class pays Fidelity Distributors Corporation (FDC), an affiliate of FMR, a service fee. For the period, the service fee is based on an annual rate of .10% of Service Class' and Service Class R's average net assets and .25% of Service Class 2's and Service Class 2R's average net assets.
For the period, total fees, all of which were re-allowed to insurance companies for the distribution of shares and providing shareholder support services were as follows:
Service Class | $ 87 |
Service Class 2 | 279 |
Service Class R | 87 |
Service Class 2 R | 241 |
| $ 694 |
Transfer Agent Fees. Fidelity Investments Institutional Operations Company, Inc. (FIIOC), an affiliate of FMR, is the Fund's transfer, dividend disbursing, and shareholder servicing agent. FIIOC receives an asset-based fee with respect to each class. Each class (with the exception of Investor Class) pays a transfer agent fee, excluding out of pocket expenses, equal to an annual rate of .07% of average net assets. Investor Class pays a monthly asset-based transfer agent fee of .15% of average net assets. In addition, FIIOC receives an asset-based fee of .0045% of average net assets for typesetting, printing and mailing of shareholder reports, except proxy statements. FIIOC voluntarily agreed to waive this fee for the period August 1, 2011 through December 31, 2011 (see Expense Reductions note). For the period, transfer agent fees for each class, including printing and out of pocket expenses, were as follows:
Initial Class | $ 479 |
Service Class | 81 |
Service Class 2 | 104 |
Initial Class R | 12,103 |
Service Class R | 81 |
Service Class 2R | 91 |
Investor Class R | 45,949 |
| $ 58,888 |
Accounting and Security Lending Fees. Fidelity Service Company, Inc. (FSC), an affiliate of FMR, maintains the Fund's accounting records. The accounting fee is based on the level of average net assets for the month. Under a separate contract, FSC administers the security lending program. The security lending fee is based on the number and duration of lending transactions.
Brokerage Commissions. The Fund placed a portion of its portfolio transactions with brokerage firms which are affiliates of the investment adviser. The commissions paid to these affiliated firms were $873 for the period.
7. Committed Line of Credit.
The Fund participates with other funds managed by FMR or an affiliate in a $4.0 billion credit facility (the "line of credit") to be utilized for temporary or emergency purposes to fund shareholder redemptions or for other short-term liquidity purposes. The Fund has agreed to pay commitment fees on its pro-rata portion of the line of credit, which amounted to $135 and is reflected in Miscellaneous expenses on the Statement of Operations. During the period, there were no borrowings on this line of credit.
Annual Report
8. Security Lending.
The Fund lends portfolio securities through a lending agent from time to time in order to earn additional income. For equity securities, a lending agent is used and may loan securities to certain qualified borrowers, including Fidelity Capital Markets (FCM), a broker-dealer affiliated with the Fund. On the settlement date of the loan, the Fund receives collateral (in the form of U.S. Treasury obligations, letters of credit and/or cash) against the loaned securities and maintains collateral in an amount not less than 100% of the market value of the loaned securities during the period of the loan. The market value of the loaned securities is determined at the close of business of the Fund and any additional required collateral is delivered to the Fund on the next business day. If the borrower defaults on its obligation to return the securities loaned because of insolvency or other reasons, a fund could experience delays and costs in recovering the securities loaned or in gaining access to the collateral. Any cash collateral received is invested in the Fidelity Securities Lending Cash Central Fund. The value of loaned securities and cash collateral at period end are disclosed on the Fund's Statement of Assets and Liabilities. Security lending income represents the income earned on investing cash collateral, less rebates paid to borrowers and any lending agent fees associated with the loan, plus any premium payments received for lending certain types of securities. Security lending income is presented in the Statement of Operations as a component of income from Fidelity Central Funds. Total security lending income during the period amounted to $15,048. During the period, there were no securities loaned to FCM.
9. Expense Reductions.
In addition to FIIOC waiving a portion of its transfer agent fees, FMR voluntarily agreed to reimburse each class to the extent annual operating expenses exceeded certain levels of average net assets as noted in the table below. Some expenses, for example interest expense, including commitment fees, are excluded from this reimbursement.
Expenses were reimbursed and/or waived for the following classes during the period:
| Expense
Limitations | Reimbursement/Waiver |
| | |
Initial Class | 1.10% | $ 1,320 |
Service Class | 1.20% | 193 |
Service Class 2 | 1.35% | 257 |
Initial Class R | 1.10% | 28,643 |
Service Class R | 1.20% | 192 |
Service Class 2R | 1.35% | 216 |
Investor Class R | 1.18% | 59,065 |
| | $ 89,886 |
Many of the brokers with whom FMR places trades on behalf of the Fund provided services to the Fund in addition to trade execution. These services included payments of certain expenses on behalf of the Fund totaling $26,946 for the period.
10. Distributions to Shareholders.
Distributions to shareholders of each class were as follows:
Years ended December 31, | 2011 | 2010 |
From net investment income | | |
Initial Class | $ 5,745 | $ 7,768 |
Service Class | 659 | 961 |
Service Class 2 | 1,393 | 434 |
Initial Class R | 106,074 | 168,615 |
Service Class R | 659 | 961 |
Service Class 2R | 576 | 883 |
Investor Class R | 252,140 | 315,206 |
Total | $ 367,246 | $ 494,828 |
From net realized gain | | |
Initial Class | $ 710 | $ 7,019 |
Service Class | 103 | 1,064 |
Service Class 2 | 118 | 542 |
Initial Class R | 15,106 | 168,298 |
Service Class R | 103 | 1,064 |
Service Class 2R | 112 | 1,291 |
Investor Class R | 30,090 | 304,133 |
Total | $ 46,342 | $ 483,411 |
Annual Report
Notes to Financial Statements - continued
11. Share Transactions.
Transactions for each class of shares were as follows:
| Shares | Dollars |
Years ended December 31, | 2011 | 2010 | 2011 | 2010 |
Initial Class | | | | |
Shares sold | 9,948 | 25,624 | $ 92,977 | $ 225,829 |
Reinvestment of distributions | 772 | 1,589 | 6,455 | 14,787 |
Shares redeemed | (25,233) | (26,957) | (229,878) | (240,709) |
Net increase (decrease) | (14,513) | 256 | $ (130,446) | $ (93) |
Service Class | | | | |
Reinvestment of distributions | 91 | 220 | 762 | 2,025 |
Shares redeemed | (1,482) | (3,601) | (14,607) | (31,344) |
Net increase (decrease) | (1,391) | (3,381) | $ (13,845) | $ (29,319) |
Service Class 2 | | | | |
Shares sold | 14,513 | 6,746 | $ 124,622 | $ 65,263 |
Reinvestment of distributions | 182 | 105 | 1,511 | 976 |
Shares redeemed | (6,711) | (44,506) | (63,592) | (374,788) |
Net increase (decrease) | 7,984 | (37,655) | $ 62,541 | $ (308,549) |
Initial Class R | | | | |
Shares sold | 232,892 | 440,907 | $ 2,111,957 | $ 3,898,339 |
Reinvestment of distributions | 14,449 | 36,492 | 121,180 | 336,913 |
Shares redeemed | (565,660) | (900,018) | (5,402,699) | (7,801,721) |
Net increase (decrease) | (318,319) | (422,619) | $ (3,169,562) | $ (3,566,469) |
Service Class R | | | | |
Reinvestment of distributions | 91 | 220 | 762 | 2,025 |
Shares redeemed | (1,482) | (3,601) | (14,607) | (31,344) |
Net increase (decrease) | (1,391) | (3,381) | $ (13,845) | $ (29,319) |
Service Class 2R | | | | |
Reinvestment of distributions | 82 | 239 | 688 | 2,174 |
Shares redeemed | (1,621) | (7,096) | (15,942) | (61,060) |
Net increase (decrease) | (1,539) | (6,857) | $ (15,254) | $ (58,886) |
Investor Class R | | | | |
Shares sold | 671,787 | 675,944 | $ 6,287,236 | $ 6,013,493 |
Reinvestment of distributions | 33,954 | 67,265 | 282,230 | 619,339 |
Shares redeemed | (707,406) | (958,233) | (6,706,328) | (8,174,476) |
Net increase (decrease) | (1,665) | (215,024) | $ (136,862) | $ (1,541,644) |
12. Other.
The Fund's organizational documents provide former and current trustees and officers with a limited indemnification against liabilities arising in connection with the performance of their duties to the Fund. In the normal course of business, the Fund may also enter into contracts that provide general indemnifications. The Fund's maximum exposure under these arrangements is unknown as this would be dependent on future claims that may be made against the Fund. The risk of material loss from such claims is considered remote.
At the end of the period, FMR or its affiliates were the owners of record of 98% of the total outstanding shares of the Fund.
Annual Report
Report of Independent Registered Public Accounting Firm
To the Trustees of Variable Insurance Products Fund IV and the Shareholders of VIP International Capital Appreciation Portfolio:
In our opinion, the accompanying statement of assets and liabilities, including the schedule of investments, and the related statements of operations and of changes in net assets and the financial highlights present fairly, in all material respects, the financial position of VIP International Capital Appreciation Portfolio (a fund of Variable Insurance Products Fund IV) at December 31, 2011, the results of its operations for the year then ended, the changes in its net assets for each of the two years in the period then ended and the financial highlights for each of the five years in the period then ended, in conformity with accounting principles generally accepted in the United States of America. These financial statements and financial highlights (hereafter referred to as "financial statements") are the responsibility of the VIP International Capital Appreciation Portfolio's management. Our responsibility is to express an opinion on these financial statements based on our audits. We conducted our audits of these financial statements in accordance with the standards of the Public Company Accounting Oversight Board (United States). Those standards require that we plan and perform the audit to obtain reasonable assurance about whether the financial statements are free of material misstatement. An audit includes examining, on a test basis, evidence supporting the amounts and disclosures in the financial statements, assessing the accounting principles used and significant estimates made by management, and evaluating the overall financial statement presentation. We believe that our audits, which included confirmation of securities at December 31, 2011 by correspondence with the custodian and brokers, provide a reasonable basis for our opinion.
/s/ PricewaterhouseCoopers LLP
PricewaterhouseCoopers LLP
Boston, Massachusetts
February 16, 2012
Annual Report
The Trustees, Members of the Advisory Board, and executive officers of the trust and fund, as applicable, are listed below. The Board of Trustees governs the fund and is responsible for protecting the interests of shareholders. The Trustees are experienced executives who meet periodically throughout the year to oversee the fund's activities, review contractual arrangements with companies that provide services to the fund, oversee management of the risks associated with such activities and contractual arrangements, and review the fund's performance. Except for James C. Curvey, each of the Trustees oversees 226 funds advised by FMR or an affiliate. Mr. Curvey oversees 429 funds advised by FMR or an affiliate.
The Trustees hold office without limit in time except that (a) any Trustee may resign; (b) any Trustee may be removed by written instrument, signed by at least two-thirds of the number of Trustees prior to such removal; (c) any Trustee who requests to be retired or who has become incapacitated by illness or injury may be retired by written instrument signed by a majority of the other Trustees; and (d) any Trustee may be removed at any special meeting of shareholders by a two-thirds vote of the outstanding voting securities of the trust. Each Trustee who is not an interested person (as defined in the 1940 Act) (Independent Trustee), shall retire not later than the last day of the calendar year in which his or her 75th birthday occurs. The Independent Trustees may waive this mandatory retirement age policy with respect to individual Trustees. The executive officers and Advisory Board Members hold office without limit in time, except that any officer and Advisory Board Member may resign or may be removed by a vote of a majority of the Trustees at any regular meeting or any special meeting of the Trustees. Except as indicated, each individual has held the office shown or other offices in the same company for the past five years.
Experience, Skills, Attributes, and Qualifications of the Fund's Trustees. The Governance and Nominating Committee has adopted a statement of policy that describes the experience, qualifications, attributes, and skills that are necessary and desirable for potential Independent Trustee candidates (Statement of Policy). The Board believes that each Trustee satisfied at the time he or she was initially elected or appointed a Trustee, and continues to satisfy, the standards contemplated by the Statement of Policy. The Governance and Nominating Committee also engages professional search firms to help identify potential Independent Trustee candidates who have the experience, qualifications, attributes, and skills consistent with the Statement of Policy. From time to time, additional criteria based on the composition and skills of the current Independent Trustees, as well as experience or skills that may be appropriate in light of future changes to board composition, business conditions, and regulatory or other developments, have also been considered by the professional search firms and the Governance and Nominating Committee. In addition, the Board takes into account the Trustees' commitment and participation in Board and committee meetings, as well as their leadership of standing and ad hoc committees throughout their tenure.
In determining that a particular Trustee was and continues to be qualified to serve as a Trustee, the Board has considered a variety of criteria, none of which, in isolation, was controlling. The Board believes that, collectively, the Trustees have balanced and diverse experience, qualifications, attributes, and skills, which allow the Board to operate effectively in governing the fund and protecting the interests of shareholders. Information about the specific experience, skills, attributes, and qualifications of each Trustee, which in each case led to the Board's conclusion that the Trustee should serve (or continue to serve) as a trustee of the fund, is provided below.
Board Structure and Oversight Function. James C. Curvey is an interested person (as defined in the 1940 Act) and currently serves as Acting Chairman. The Trustees have determined that an interested Chairman is appropriate and benefits shareholders because an interested Chairman has a personal and professional stake in the quality and continuity of services provided to the fund. Independent Trustees exercise their informed business judgment to appoint an individual of their choosing to serve as Chairman, regardless of whether the Trustee happens to be independent or a member of management. The Independent Trustees have determined that they can act independently and effectively without having an Independent Trustee serve as Chairman and that a key structural component for assuring that they are in a position to do so is for the Independent Trustees to constitute a substantial majority for the Board. The Independent Trustees also regularly meet in executive session. Ned C. Lautenbach serves as Chairman of the Independent Trustees and as such (i) acts as a liaison between the Independent Trustees and management with respect to matters important to the Independent Trustees and (ii) with management prepares agendas for Board meetings.
Fidelity funds are overseen by different Boards of Trustees. The fund's Board oversees Fidelity's equity and high income funds and another Board oversees Fidelity's investment-grade bond, money market, and asset allocation funds. The asset allocation funds may invest in Fidelity funds overseen by the fund's Board. The use of separate Boards, each with its own committee structure, allows the Trustees of each group of Fidelity funds to focus on the unique issues of the funds they oversee, including common research, investment, and operational issues. On occasion, the separate Boards establish joint committees to address issues of overlapping consequences for the Fidelity funds overseen by each Board.
The Trustees operate using a system of committees to facilitate the timely and efficient consideration of all matters of importance to the Trustees, the fund, and fund shareholders and to facilitate compliance with legal and regulatory requirements and oversight of the fund's activities and associated risks. The Board, acting through its committees, has charged FMR and its affiliates with (i) identifying events or circumstances the occurrence of which could have demonstrably adverse effects on the fund's business and/or reputation; (ii) implementing processes and controls to lessen the possibility that such events or circumstances occur or to mitigate the effects of such events or circumstances if they do occur; and (iii) creating and maintaining a system designed to evaluate continuously business and market conditions in order to facilitate the identification and implementation processes described in (i) and (ii) above. Because the day-to-day operations and activities of the fund are carried out by or through FMR, its affiliates and other service providers, the fund's exposure to risks is mitigated but not eliminated by the processes overseen by the Trustees. While each of the Board's committees has responsibility for overseeing different aspects of the fund's activities, oversight is exercised primarily through the Operations, Audit, and Compliance Committees. In addition, the Independent Trustees have worked with FMR to enhance the Board's oversight of investment and financial risks, legal and regulatory risks, technology risks, and operational risks, including the development of additional risk reporting to the Board. For example, a working group comprised of Independent Trustees and FMR has worked and continues to work to review the Fidelity funds' valuation-related activities, reporting and risk management. Appropriate personnel, including but not limited to the fund's Chief Compliance Officer (CCO), FMR's internal auditor, the independent accountants, the fund's Treasurer and portfolio management personnel, make periodic reports to the Board's committees, as appropriate, including an annual review of FMR's risk management program for the Fidelity funds. The responsibilities of each standing committee, including their oversight responsibilities, are described further under "Standing Committees of the Fund's Trustees."
Annual Report
The fund's Statement of Additional Information (SAI) includes more information about the Trustees. To request a free copy, call Fidelity at 1-877-208-0098.
Interested Trustees*:
Correspondence intended for each Trustee who is an interested person may be sent to Fidelity Investments, 82 Devonshire Street, Boston, Massachusetts 02109.
Name, Age; Principal Occupations and Other Relevant Experience+ |
James C. Curvey (76) |
| Year of Election or Appointment: 2007 Mr. Curvey is Trustee and Acting Chairman of the Board of Trustees of certain Trusts. Mr. Curvey also serves as Trustee (2007-present) of other investment companies advised by FMR. Mr. Curvey is a Director of Fidelity Investments Money Management, Inc. (2009-present), Director of Fidelity Research & Analysis Co. (2009-present) and Director of FMR and FMR Co., Inc. (2007-present). Mr. Curvey is also Vice Chairman (2007-present) and Director of FMR LLC. In addition, Mr. Curvey serves as an Overseer for the Boston Symphony Orchestra and a member of the Trustees of Villanova University. Previously, Mr. Curvey was the Vice Chairman (2006-2007) and Director (2000-2007) of FMR Corp. |
Ronald P. O'Hanley (54) |
| Year of Election or Appointment: 2011 Mr. O'Hanley is Director of FMR Co., Inc. (2010-present), Director of Fidelity Investments Money Management, Inc. (2010-present), Director of Fidelity Research & Analysis Company (2010-present), President of Fidelity Asset Management and Corporate Services and a member of Fidelity's Executive Committee (2010-present). Previously, Mr. O'Hanley served as President and Chief Executive Officer of BNY Mellon Asset Management (2007-2010). Mr. O'Hanley also served as Vice Chairman of Bank New York Mellon Corp. and a member of that firm's Executive Committee. Prior to the 2007 merger of The Bank of New York and Mellon Financial Corporation, he was Vice Chairman of Mellon Financial Corporation and President and Chief Executive Officer of Mellon Asset Management. He joined Mellon in February 1997. Mr. O'Hanley currently serves as Chairman of the Boston Public Library Foundation Board of Directors and sits on the Board of Directors of Beth Israel Deaconess Medical Center, the Board of Trustees of the Marine Biological Laboratory and the Advisory Board of the Maxwell School of Citizenship and Public Administration at Syracuse University. Mr. O'Hanley also chairs the Council on Asset Management for the Financial Services Roundtable and is a member of the Board of Directors of Institutional Investor's U.S. Institute. |
* Trustees have been determined to be "Interested Trustees" by virtue of, among other things, their affiliation with the trust or various entities under common control with FMR.
+ The information above includes each Trustee's principal occupation during the last five years and other information relating to the experience, attributes, and skills relevant to each Trustee's qualifications to serve as a Trustee, which led to the conclusion that each Trustee should serve as a Trustee for the fund.
Independent Trustees:
Correspondence intended for each Independent Trustee (that is, the Trustees other than the Interested Trustees) may be sent to Fidelity Investments, P.O. Box 55235, Boston, Massachusetts 02205-5235.
Name, Age; Principal Occupations and Other Relevant Experience+ |
Dennis J. Dirks (63) |
| Year of Election or Appointment: 2005 Prior to his retirement in May 2003, Mr. Dirks was Chief Operating Officer and a member of the Board of The Depository Trust & Clearing Corporation (DTCC). He also served as President, Chief Operating Officer, and Board member of The Depository Trust Company (DTC) and President and Board member of the National Securities Clearing Corporation (NSCC). In addition, Mr. Dirks served as Chief Executive Officer and Board member of the Government Securities Clearing Corporation, Chief Executive Officer and Board member of the Mortgage-Backed Securities Clearing Corporation, as a Trustee and a member of the Finance Committee of Manhattan College (2005-2008), and as a Trustee and a member of the Finance Committee of AHRC of Nassau County (2006-2008). Mr. Dirks is a member of the Independent Directors Council (IDC) Governing Council (2010-present) and Board of Directors for The Brookville Center for Children's Services, Inc. (2009-present). |
Alan J. Lacy (58) |
| Year of Election or Appointment: 2008 Mr. Lacy serves as Senior Adviser (2007-present) of Oak Hill Capital Partners, L.P. (private equity). Mr. Lacy also served as Chief Executive Officer (2000-2005) and Vice Chairman (2005-2006) of Sears Holdings Corporation and Sears, Roebuck and Co. (retail). In addition, Mr. Lacy serves as a member of the Board of Directors of Dave & Buster's, Inc. (restaurant and entertainment complexes, 2010-present), The Hillman Companies, Inc. (hardware wholesalers, 2010-present), and Bristol-Myers Squibb Company (global pharmaceuticals, 2007-present). Mr. Lacy is a member of the Board of Trustees of The National Parks Conservation Association (2006-present). Previously, Mr. Lacy served as Chairman of the Board of Trustees of the National Parks Conservation Association (2008-2011) and as a member of the Board of Directors for the Western Union Company (global money transfer, 2006-2011). |
Ned C. Lautenbach (67) |
| Year of Election or Appointment: 2000 Mr. Lautenbach is Chairman of the Independent Trustees of the Equity and High Income Funds (2006-present). Mr. Lautenbach currently serves as the Lead Director of the Eaton Corporation Board of Directors (diversified industrial, 1997-present). Mr. Lautenbach is also a member of the Board of Directors of the Philharmonic Center for the Arts in Naples, Florida (1999-present); a member of the Board of Trustees of Fairfield University (2005-present); and a member of the Council on Foreign Relations (1994-present). Previously, Mr. Lautenbach was a Partner/Advisory Partner at Clayton, Dubilier & Rice, LLC (private equity investment, 1998-2010), as well as a Director of Sony Corporation (2006-2007). |
Joseph Mauriello (67) |
| Year of Election or Appointment: 2008 Prior to his retirement in January 2006, Mr. Mauriello served in numerous senior management positions including Deputy Chairman and Chief Operating Officer (2004-2005), and Vice Chairman of Financial Services (2002-2004) of KPMG LLP US (professional services, 1965-2005). Mr. Mauriello currently serves as a member of the Board of Directors of XL Group plc. (global insurance and re-insurance, 2006-present) and of Arcadia Resources Inc. (health care services and products, 2007-present). Previously, Mr. Mauriello served as a Director of the Hamilton Funds of the Bank of New York (2006-2007). |
Robert W. Selander (61) |
| Year of Election or Appointment: 2011 Previously, Mr. Selander served as a Member of the Advisory Board of Fidelity's Equity and High Income Funds (2011), Executive Vice Chairman (2010), Chief Executive Officer (2009-2010), and President and Chief Executive Officer (1997-2009) of Mastercard, Inc. |
Cornelia M. Small (67) |
| Year of Election or Appointment: 2005 Ms. Small is a member of the Board of Directors of the Teagle Foundation (2009-present). Ms. Small is also a member of the Investment Committee, and Chair (2008-present) and a member of the Board of Trustees of Smith College. In addition, Ms. Small serves on the Investment Committee of the Berkshire Taconic Community Foundation (2008-present). Previously, Ms. Small served as Chairperson of the Investment Committee (2002-2008) of Smith College. In addition, Ms. Small served as Chief Investment Officer, Director of Global Equity Investments, and a member of the Board of Directors of Scudder, Stevens & Clark and Scudder Kemper Investments. |
William S. Stavropoulos (72) |
| Year of Election or Appointment: 2001 Mr. Stavropoulos is Vice Chairman of the Independent Trustees of the Equity and High Income Funds (2006-present). Mr. Stavropoulos serves as President and Founder of the Michigan Baseball Foundation, the Great Lakes Loons (2007-present). Mr. Stavropoulos is Chairman Emeritus of the Board of Directors of The Dow Chemical Company, where he previously served in numerous senior management positions, including President, CEO (1995-2000; 2002-2004), Chairman of the Executive Committee (2000-2006), and as a member of the Board of Directors (1990-2006). Currently, Mr. Stavropoulos is Chairman of Univar (global distributor of commodity and specialty chemicals, 2010-present), a Director of Teradata Corporation (data warehousing and technology solutions, 2008-present), Chemical Financial Corporation, Maersk Inc. (industrial conglomerate), Tyco International, Inc. (multinational manufacturing and services, 2007-present), and a member of the Advisory Board for Metalmark Capital (private equity investment, 2005-present). Mr. Stavropoulos is a special advisor to Clayton, Dubilier & Rice, LLC (private equity investment). In addition, Mr. Stavropoulos is a member of the University of Notre Dame Advisory Council for the College of Science. |
David M. Thomas (62) |
| Year of Election or Appointment: 2008 Previously, Mr. Thomas served as Executive Chairman (2005-2006) and Chairman and Chief Executive Officer (2000-2005) of IMS Health, Inc. (pharmaceutical and healthcare information solutions). In addition, Mr. Thomas serves as a member of the Board of Directors of Fortune Brands, Inc. (consumer products), and Interpublic Group of Companies, Inc. (marketing communication, 2004-present). |
Michael E. Wiley (61) |
| Year of Election or Appointment: 2008 Mr. Wiley also serves as a Director of Asia Pacific Exploration Consolidated (international oil and gas exploration and production, 2008-present). Mr. Wiley serves as a Director of Tesoro Corporation (independent oil refiner and marketer, 2005-present), and a Director of Bill Barrett Corporation (exploration and production, 2005-present). In addition, Mr. Wiley also serves as a Director of Post Oak Bank (privately-held bank, 2004-present). Previously, Mr. Wiley served as a member of the Board of Trustees of the University of Tulsa (2000-2006; 2007-2010), as a Senior Energy Advisor of Katzenbach Partners, LLC (consulting, 2006-2007), as an Advisory Director of Riverstone Holdings (private investment), Chairman, President, and CEO of Baker Hughes, Inc. (oilfield services, 2000-2004), and as Director of Spinnaker Exploration Company (exploration and production, 2001-2005). |
+ The information above includes each Trustee's principal occupation during the last five years and other information relating to the experience, attributes, and skills relevant to each Trustee's qualifications to serve as a Trustee, which led to the conclusion that each Trustee should serve as a Trustee for the fund.
Advisory Board Members and Executive Officers:
Correspondence intended for each executive officer, Edward C. Johnson 3d, and Peter S. Lynch may be sent to Fidelity Investments, 82 Devonshire Street, Boston, Massachusetts 02109.
Name, Age; Principal Occupation |
Edward C. Johnson 3d (81) |
| Year of Election or Appointment: 2011 Member of the Advisory Board of Fidelity's Equity and High Income Funds. Mr. Johnson serves as Chief Executive Officer, Chairman, and a Director of FMR LLC, and also serves as Chairman and Director of FIL Limited. Previously, Mr. Johnson served as a Trustee and Chairman of the Board of certain Fidelity Trusts, Chairman and a Director of FMR, Chairman and a Director of FMR Co., Inc., and President of FMR LLC (2006-2007). |
Peter S. Lynch (67) |
| Year of Election or Appointment: 2003 Member of the Advisory Board of Fidelity's Equity and High Income Funds. Mr. Lynch is Vice Chairman and a Director of FMR and FMR Co., Inc. In addition, Mr. Lynch serves as a Trustee of Boston College and as the Chairman of the Inner-City Scholarship Fund. Previously, Mr. Lynch served on the Special Olympics International Board of Directors (1997-2006). |
Kenneth B. Robins (42) |
| Year of Election or Appointment: 2008 President and Treasurer of Fidelity's Equity and High Income Funds. Mr. Robins also serves as President and Treasurer (2010-present) and Assistant Treasurer (2009-present) of other Fidelity funds and is an employee of Fidelity Investments (2004-present). Previously, Mr. Robins served as Deputy Treasurer of the Fidelity funds (2005-2008) and Treasurer and Chief Financial Officer of The North Carolina Capital Management Trust: Cash and Term Portfolios (2006-2008). |
Bruce T. Herring (46) |
| Year of Election or Appointment: 2006 Vice President of certain Equity Funds. Mr. Herring also serves as President of Fidelity Research & Analysis Company (2010-present), Chief Investment Officer and Director of Fidelity Management & Research (U.K.) Inc. (2010-present) and Group Chief Investment Officer of FMR. Previously, Mr. Herring served as Vice President (2005-2006) and Senior Vice President (2006-2007) of Fidelity Management & Research Company, Vice President of FMR Co., Inc. (2001-2007) and as a portfolio manager for Fidelity U.S. Equity Funds. |
Brian B. Hogan (47) |
| Year of Election or Appointment: 2009 Vice President of Equity and High Income Funds. Mr. Hogan also serves as President of FMR's Equity Division (2009-present). Previously, Mr. Hogan served as Senior Vice President, Equity Research of FMR (2006-2009) and as a portfolio manager. |
Scott C. Goebel (43) |
| Year of Election or Appointment: 2008 Secretary and Chief Legal Officer (CLO) of the Fidelity funds. Mr. Goebel also serves as Secretary of Fidelity Investments Money Management, Inc. (FIMM) (2010-present) and Fidelity Research and Analysis Company (FRAC) (2010-present); Secretary and CLO of The North Carolina Capital Management Trust: Cash and Term Portfolios (2008-present); General Counsel, Secretary, and Senior Vice President of FMR (2008-present) and FMR Co., Inc. (2008-present); employed by FMR LLC or an affiliate (2001-present); Chief Legal Officer of Fidelity Management & Research (Hong Kong) Limited (2008-present) and Assistant Secretary of Fidelity Management & Research (Japan) Inc. (2008-present), and Fidelity Management & Research (U.K.) Inc. (2008-present). Previously, Mr. Goebel served as Assistant Secretary of FIMM (2008-2010), FRAC (2008-2010), and the Funds (2007-2008) and as Vice President and Secretary of Fidelity Distributors Corporation (FDC) (2005-2007). |
William C. Coffey (42) |
| Year of Election or Appointment: 2009 Assistant Secretary of Fidelity's Equity and High Income Funds. Mr. Coffey also serves as Senior Vice President and Deputy General Counsel of FMR LLC (2010-present), and is an employee of Fidelity Investments. Previously, Mr. Coffey served as Vice President and Associate General Counsel of FMR LLC (2005-2009). |
Holly C. Laurent (57) |
| Year of Election or Appointment: 2008 Anti-Money Laundering (AML) Officer of the Fidelity funds. Ms. Laurent also serves as AML Officer of The North Carolina Capital Management Trust: Cash and Term Portfolios (2008-present) and is an employee of Fidelity Investments. Previously, Ms. Laurent was Senior Vice President and Head of Legal for Fidelity Business Services India Pvt. Ltd. (2006-2008), and Senior Vice President, Deputy General Counsel and Group Head for FMR LLC (2005-2006). |
Christine Reynolds (53) |
| Year of Election or Appointment: 2008 Chief Financial Officer of the Fidelity funds. Ms. Reynolds became President of Fidelity Pricing and Cash Management Services (FPCMS) in August 2008. Ms. Reynolds served as Chief Operating Officer of FPCMS (2007-2008). Previously, Ms. Reynolds served as President, Treasurer, and Anti-Money Laundering officer of the Fidelity funds (2004-2007). |
Kenneth A. Rathgeber (64) |
| Year of Election or Appointment: 2004 Chief Compliance Officer of Fidelity's Equity and High Income Funds. Mr. Rathgeber is Chief Compliance Officer of Fidelity Management & Research (Hong Kong) Limited (2008-present), Fidelity Management & Research (Japan) Inc. (2008-present), FMR (2005-present), FMR Co., Inc. (2005-present), Fidelity Management & Research (U.K.) Inc. (2005-present), Fidelity Research & Analysis Company (2005-present), Fidelity Investments Money Management, Inc. (2005-present), Pyramis Global Advisors, LLC (2005-present), and Strategic Advisers, Inc. (2005-present). |
Jeffrey S. Christian (50) |
| Year of Election or Appointment: 2009 Deputy Treasurer of the Fidelity funds. Mr. Christian is an employee of Fidelity Investments. Previously, Mr. Christian served as Chief Financial Officer (2008-2009) of certain Fidelity funds and Senior Vice President of Fidelity Pricing and Cash Management Services (FPCMS) (2004-2009). |
Joseph F. Zambello (54) |
| Year of Election or Appointment: 2011 Deputy Treasurer of the Fidelity funds. Mr. Zambello is an employee of Fidelity Investments. Previously, Mr. Zambello served as Vice President of FMR's Program Management Group (2009-2011) and Vice President of the Transfer Agent Oversight Group (2005-2009). |
Adrien E. Deberghes (44) |
| Year of Election or Appointment: 2008 Deputy Treasurer of Fidelity's Equity and High Income Funds. Mr. Deberghes also serves as Vice President and Assistant Treasurer of Fidelity Rutland Square Trust II and Fidelity Commonwealth Trust II (2011-present), Assistant Treasurer of other Fidelity funds (2010-present), and is an employee of Fidelity Investments (2008-present). Previously, Mr. Deberghes served as Senior Vice President of Mutual Fund Administration at State Street Corporation (2007-2008), Senior Director of Mutual Fund Administration at Investors Bank & Trust (2005-2007), and Director of Finance for Dunkin' Brands (2000-2005). |
Stephanie J. Dorsey (42) |
| Year of Election or Appointment: 2010 Assistant Treasurer of Fidelity's Equity and High Income Funds. Ms. Dorsey also serves as Deputy Treasurer of other Fidelity funds (2008-present) and is an employee of Fidelity Investments (2008-present). Previously, Ms. Dorsey served as Treasurer (2004-2008) of the JPMorgan Mutual Funds and Vice President (2004-2008) of JPMorgan Chase Bank. |
John R. Hebble (53) |
| Year of Election or Appointment: 2009 Assistant Treasurer of Fidelity's Equity and High Income Funds. Mr. Hebble also serves as President (2011-present), Treasurer, and Chief Financial Officer of The North Carolina Capital Management Trust: Cash and Term Portfolios (2008-present), President and Treasurer of other Fidelity funds (2008-present) and is an employee of Fidelity Investments. |
Gary W. Ryan (53) |
| Year of Election or Appointment: 2005 Assistant Treasurer of the Fidelity funds. Mr. Ryan is an employee of Fidelity Investments. Previously, Mr. Ryan served as Vice President of Fund Reporting in Fidelity Pricing and Cash Management Services (FPCMS) (1999-2005). |
Jonathan Davis (43) |
| Year of Election or Appointment: 2010 Assistant Treasurer of the Fidelity funds. Mr. Davis is also Assistant Treasurer of Fidelity Rutland Square Trust II and Fidelity Commonwealth Trust II. Mr. Davis is an employee of Fidelity Investments. Previously, Mr. Davis served as Vice President and Associate General Counsel of FMR LLC (2003-2010). |
Annual Report
Initial Class R designates 2% and 11%, Service Class R designates 2% and 12%, Service Class 2R designates 2% and 14%, and Investor Class R designates 2% and 11% of the dividends distributed in February and December 2011 respectively, during the fiscal year as qualifying for the dividends-received deduction for corporate shareholders.
The percentage of dividends distributed during the fiscal year representing income derived from sources within, and taxes paid to, foreign countries or possessions of the United States are as follows:
| Pay Date | Income | Taxes |
Initial Class R | 02/11/2011 | $0.010 | $0.000 |
Initial Class R | 12/16/2011 | $0.094 | $0.009 |
Service Class R | 02/11/2011 | $0.010 | $0.000 |
Service Class R | 12/16/2011 | $0.084 | $0.009 |
Service Class 2R | 02/11/2011 | $0.010 | $0.000 |
Service Class 2R | 12/16/2011 | $0.069 | $0.009 |
Investor Class R | 02/11/2011 | $0.010 | $0.000 |
Investor Class R | 12/16/2011 | $0.094 | $0.009 |
Annual Report
Board Approval of Investment Advisory Contracts and Management Fees
VIP International Capital Appreciation Portfolio
Each year, the Board of Trustees, including the Independent Trustees (together, the Board), votes on the renewal of the management contract and sub-advisory agreements (together, the Advisory Contracts) for the fund. The Board, assisted by the advice of fund counsel and Independent Trustees' counsel, requests and considers a broad range of information relevant to the renewal of the Advisory Contracts throughout the year.
The Board meets regularly and considers at each of its meetings factors that are relevant to its annual consideration of the renewal of the fund's Advisory Contracts, including the services and support provided to the fund and its shareholders. The Board has established various standing committees, each composed of Independent Trustees with varying backgrounds, to which the Board has assigned specific subject matter responsibilities in order to enhance effective decision-making by the Board. The Board, acting directly and through its Committees, requests and receives information concerning the annual consideration of the renewal of the fund's Advisory Contracts. The Board also meets as needed to consider matters specifically related to the Board's annual consideration of the renewal of Advisory Contracts. Members of the Board may also meet with trustees of other Fidelity funds through ad hoc joint committees to discuss certain matters relevant to the Fidelity funds.
At its July 2011 meeting, the Board of Trustees, including the Independent Trustees, unanimously determined to renew the fund's Advisory Contracts. In reaching its determination, the Board considered all factors it believed relevant, including (i) the nature, extent, and quality of the services to be provided to the fund and its shareholders (including the investment performance of the fund); (ii) the competitiveness of the fund's management fee and total expense ratio; (iii) the total costs of the services to be provided by and the profits to be realized by Fidelity from its relationship with the fund; (iv) the extent to which economies of scale would be realized as the fund grows; and (v) whether fee levels reflect these economies of scale, if any, for the benefit of fund shareholders.
In considering whether to renew the Advisory Contracts for the fund, the Board reached a determination, with the assistance of fund counsel and Independent Trustees' counsel and through the exercise of its business judgment, that the renewal of the Advisory Contracts is in the best interests of the fund and its shareholders and that the compensation payable under the Advisory Contracts is fair and reasonable. The Board's decision to renew the Advisory Contracts was not based on any single factor, but rather was based on a comprehensive consideration of all the information provided to the Board at its meetings throughout the year. The Board, in reaching its determination to renew the Advisory Contracts, is aware that shareholders in the fund have a broad range of investment choices available to them, including a wide choice among mutual funds offered by Fidelity's competitors, and that the fund's shareholders, who have the opportunity to review and weigh the disclosure provided by the fund in its prospectus and other public disclosures, have chosen to invest in this fund, managed by Fidelity.
Nature, Extent, and Quality of Services Provided. The Board considered the staffing within the investment adviser, FMR, and the sub-advisers (together, the Investment Advisers), including the backgrounds of the fund's investment personnel and the fund's investment objective and discipline. The Independent Trustees also had discussions with senior management of Fidelity's investment operations and investment groups. The Board considered the structure of the portfolio manager compensation program and whether this structure provides appropriate incentives to act in the best interests of the fund.
Resources Dedicated to Investment Management and Support Services. The Board and the Fund Oversight and Research Committees reviewed the general qualifications and capabilities of the Investment Advisers' investment staff, including its size, education, experience, and resources, as well as the Investment Advisers' approach to recruiting, training, managing, and compensating investment personnel. The Board also noted that FMR has devoted increased resources to non-U.S. offices. The Board noted that Fidelity's analysts have extensive resources, tools and capabilities which allow them to conduct sophisticated quantitative and fundamental analysis, as well as credit analysis of issuers, counterparties and enhancers. The Board also believes that Fidelity's investment professionals have sufficient access to global information and data so as to provide competitive investment results over time, and that those professionals also have access to sophisticated tools which permit them to assess portfolio construction and risk and performance attribution characteristics continuously, as well as to transmit new information and research conclusions rapidly around the world. Additionally, in their deliberations, the Board considered the Investment Advisers' trading capabilities and resources which are an integral part of the investment management process.
Shareholder and Administrative Services. The Board considered (i) the nature, extent, quality, and cost of advisory, administrative, and shareholder services performed by the Investment Advisers and their affiliates under the Advisory Contracts and under separate agreements covering transfer agency, pricing and bookkeeping, and securities lending services for the fund; (ii) the nature and extent of the investment adviser's supervision of third party service providers, principally custodians and subcustodians; and (iii) the resources devoted to, and the record of compliance with, the fund's compliance policies and procedures. The Board also reviewed the allocation of fund brokerage, including allocations to brokers affiliated with the Investment Advisers, the use of brokerage commissions to pay fund expenses, and the use of "soft" commission dollars to pay for research services.
The Board noted that the growth of fund assets over time across the complex allows Fidelity to reinvest in the development of services designed to enhance the value or convenience of the Fidelity funds as investment vehicles. These services include 24-hour access to account information and market information through telephone representatives and over the Internet, investor education materials and asset allocation tools, and the expanded availability of Fidelity Investor Centers, with 35 new branches opening since 2010.
Annual Report
Board Approval of Investment Advisory Contracts and Management Fees - continued
Investment in a Large Fund Family. The Board considered the benefits to shareholders of investing in a Fidelity fund, including the benefits of investing in a fund that is part of a large family of funds offering a variety of investment disciplines and providing a large variety of mutual fund investor services. The Board noted that Fidelity had taken, or had made recommendations that resulted in the Fidelity funds taking, a number of actions over the previous year that benefited particular funds, including (i) continuing to dedicate additional resources to investment research and support of the senior management team that oversees asset management; (ii) rationalizing product lines through the mergers of six funds into other funds; (iii) continuing to migrate the Freedom Funds to dedicated lower cost underlying funds; (iv) obtaining shareholder approval to broaden the investment strategies for Fidelity Consumer Finance Portfolio, Fidelity Emerging Asia Fund, and Fidelity Environment and Alternative Energy Portfolio; (v) contractually agreeing to reduce the management fees and impose other expense limitations on Spartan 500 Index Fund and U.S. Bond Index Fund in connection with launching new institutional classes of these funds; (vi) changing the name, primary and supplemental benchmarks, and investment policies of Fidelity Global Strategies Fund to support the fund's flexible investment mandate and global orientation; and (vii) reducing the transfer agency account fee rates on certain accounts.
Investment Performance. The Board considered whether the fund has operated in accordance with its investment objective, as well as its record of compliance with its investment restrictions. It also reviewed the fund's absolute investment performance for each class, as well as the fund's relative investment performance for each class measured over multiple periods against (i) a broad-based securities market index, and (ii) a custom peer group of mutual funds deemed appropriate by Fidelity and reviewed by the Board. The following charts considered by the Board show, over the one-, three-, and five-year periods ended December 31, 2010, the cumulative total returns of Initial Class R and Service Class 2 R of the fund, the cumulative total returns of a broad-based securities market index ("benchmark"), and a range of cumulative total returns of a custom peer group of mutual funds defined by FMR based on categories assigned by Morningstar, Inc. The returns of Initial Class R and Service Class 2 R show the performance of the highest and lowest performing classes, respectively (based on five-year performance). The box within each chart shows the 25th percentile return (bottom of box) and the 75th percentile return (top of box) of the peer group. Returns shown above the box are in the first quartile and returns shown below the box are in the fourth quartile. The percentage beaten numbers noted below each chart correspond to the percentile box and represent the percentage of funds in the peer group whose performance was equal to or lower than that of the class indicated. The fund's custom peer group, defined by FMR, is a peer group that FMR believes provides a more meaningful performance comparison than the peer group assigned by Morningstar, Inc., which assigns mutual funds to categories based on their investment styles as measured by their underlying portfolio holdings.
VIP International Capital Appreciation Portfolio
The Board reviewed the fund's relative investment performance against its peer group and noted that the performance of Initial Class R of the fund was in the first quartile for the one- and three-year periods and the third quartile for the five-year period. The Board also noted that the investment performance of Initial Class R of the fund compared favorably to its benchmark for the one- and three-year periods, although the five-year cumulative total return of the fund was lower than its benchmark. The Board considered that the variations in performance among the fund's classes reflect the variations in class expenses, which result in lower performance for higher expense classes. The Board also reviewed the fund's performance since inception as well as performance in the current year.
Based on its review, the Board concluded that the nature, extent, and quality of services provided to the fund under the Advisory Contracts should benefit the fund's shareholders.
Annual Report
Competitiveness of Management Fee and Total Expense Ratio. The Board considered the fund's management fee and total expense ratio compared to "mapped groups" of competitive funds and classes. Fidelity creates "mapped groups" by combining similar Lipper investment objective categories that have comparable management fee characteristics. Combining Lipper investment objective categories aids the Board's management fee and total expense ratio comparisons by broadening the competitive group used for comparison and by reducing the number of universes to which various Fidelity funds are compared.
Management Fee. The Board considered two proprietary management fee comparisons for the 12-month periods shown in the chart below. The group of Lipper funds used by the Board for management fee comparisons is referred to below as the "Total Mapped Group." The Total Mapped Group comparison focuses on a fund's standing relative to the total universe of comparable funds available to investors in terms of gross management fees before expense reimbursements or caps. "TMG %" represents the percentage of funds in the Total Mapped Group that had management fees that were lower than the fund's. For example, a TMG % of 16% means that 84% of the funds in the Total Mapped Group had higher management fees than the fund. The "Asset-Size Peer Group" (ASPG) comparison focuses on a fund's standing relative to non-Fidelity funds similar in size to the fund within the Total Mapped Group. The ASPG represents at least 15% of the funds in the Total Mapped Group with comparable asset size and management fee characteristics, subject to a minimum of 50 funds (or all funds in the Total Mapped Group if fewer than 50). Additional information, such as the ASPG quartile in which the fund's management fee ranked, is also included in the chart and considered by the Board.
VIP International Capital Appreciation Portfolio
The Board noted that the fund's management fee ranked below the median of its Total Mapped Group and below the median of its ASPG for 2010.
Based on its review, the Board concluded that the fund's management fee is fair and reasonable in light of the services that the fund receives and the other factors considered.
Total Expense Ratio. In its review of each class's total expense ratio, the Board considered the fund's management fee as well as other fund or class expenses, as applicable, such as transfer agent fees, pricing and bookkeeping fees, fund-paid 12b-1 fees, and custodial, legal, and audit fees. The Board also noted the effects of any waivers and reimbursements on fees and expenses. As part of its review, the Board also considered the current and historical total expense ratios of each class of the fund compared to competitive fund median expenses. Each class of the fund is compared to those funds and classes in the Total Mapped Group (used by the Board for management fee comparisons) that have a similar sales load structure.
The Board noted that the total expense ratio of each of Initial Class and Initial Class R ranked equal to its competitive median for 2010 and the total expense ratio of each of Investor Class R, Service Class, Service Class 2, Service Class R, and Service Class 2 R ranked above its competitive median for 2010. The Board considered that various factors, including 12b-1 fees, positive or negative performance adjustments, and relatively higher other expenses in the case of small fund size, can affect total expense ratios. The Board also noted that Investor Class R has higher transfer agent fees than traditional variable annuity classes because it is designed for lower cost annuity products, where the majority of servicing costs are incorporated into the funds' total expense ratios rather than being paid at the annuity level. The Board noted that the fund offers multiple classes, each of which has a different 12b-1 fee structure, and that the multiple structures are intended to offer a range of pricing options for the intermediary market. The Board also noted that the total expense ratios of the classes vary primarily by the level of their 12b-1 fees, although differences in transfer agent fees may also cause expenses to vary from class to class.
Annual Report
Board Approval of Investment Advisory Contracts and Management Fees - continued
Fees Charged to Other Fidelity Clients. The Board also considered Fidelity fee structures and other information with respect to clients of FMR and its affiliates, such as other mutual funds advised or subadvised by FMR or its affiliates, pension plan clients, and other institutional clients. In March 2010, the Board created an ad hoc joint committee with the board of other Fidelity funds (the Committee) to review and compare Fidelity's institutional investment advisory business with its business of providing services to the Fidelity funds, including the differences in services provided, fees charged, and costs incurred, as well as competition in their respective marketplaces.
Based on its review of total expense ratios and fees charged to other Fidelity clients, the Board concluded that the total expense ratio of each class of the fund was reasonable, although in some cases above the median of the universe presented for comparison, in light of the services that the fund and its shareholders receive and the other factors considered, including the findings of the Committee.
Costs of the Services and Profitability. The Board considered the revenues earned and the expenses incurred by Fidelity in conducting the business of developing, marketing, distributing, managing, administering and servicing the fund and its shareholders. The Board also considered the level of Fidelity's profits in respect of all the Fidelity funds.
On an annual basis, FMR presents to the Board Fidelity's profitability for the fund. Fidelity calculates the profitability for each fund, as well as aggregate profitability for groups of Fidelity funds and all Fidelity funds, using a series of detailed revenue and cost allocation methodologies which originate with the books and records of Fidelity on which Fidelity's audited financial statements are based. The Audit Committee of the Board reviews any significant changes from the prior year's methodologies.
PricewaterhouseCoopers LLP (PwC), independent registered public accounting firm and auditor to Fidelity and certain Fidelity funds, has been engaged annually by the Board as part of the Board's assessment of Fidelity's profitability analysis. PwC's engagement includes the review and assessment of Fidelity's methodologies used in determining the revenues and expenses attributable to Fidelity's mutual fund business, and completion of agreed-upon procedures surrounding the mathematical accuracy of fund profitability and its conformity to allocation methodologies. After considering PwC's reports issued under the engagement and information provided by Fidelity, the Board concluded that while other allocation methods may also be reasonable, Fidelity's profitability methodologies are reasonable in all material respects.
The Board also reviewed Fidelity's non-fund businesses and fall-out benefits related to the mutual fund business as well as cases where Fidelity's affiliates may benefit from or be related to the fund's business.
The Board considered the costs of the services provided by and the profits realized by Fidelity in connection with the operation of the fund and was satisfied that the profitability was not excessive in the circumstances.
Economies of Scale. The Board considered whether there have been economies of scale in respect of the management of the Fidelity funds, whether the Fidelity funds (including the fund) have appropriately benefited from any such economies of scale, and whether there is potential for realization of any further economies of scale. The Board considered the extent to which the fund will benefit from economies of scale through increased services to the fund, through waivers or reimbursements, or through fee or expense reductions. The Board also noted that in 2009, it and the board of other Fidelity funds created an ad hoc committee (the Economies of Scale Committee) to analyze whether FMR attains economies of scale in respect of the management and servicing of the Fidelity funds, whether the Fidelity funds have appropriately benefited from such economies of scale, and whether there is potential for realization of any further economies of scale.
The Board recognized that the fund's management contract incorporates a "group fee" structure, which provides for lower group fee rates as total fund assets under FMR's management increase, and for higher group fee rates as total fund assets under FMR's management decrease. FMR calculates the group fee rates based on a tiered asset "breakpoint" schedule that varies based on asset class. The Board considered that the group fee is designed to deliver the benefits of economies of scale to fund shareholders when total Fidelity fund assets increase, even if assets of any particular fund are unchanged or have declined, because some portion of Fidelity's costs are attributable to services provided to all Fidelity funds, and all funds benefit if those costs can be allocated among more assets. The Board concluded that, given the group fee structure, fund shareholders will benefit from lower management fees as assets under FMR's management increase at the fund complex level, regardless of whether Fidelity achieves any such economies of scale.
The Board concluded, taking into account the analysis of the Economies of Scale Committee, that any potential economies of scale are being appropriately shared between fund shareholders and Fidelity.
Additional Information Requested by the Board. In order to develop fully the factual basis for consideration of the Fidelity funds' Advisory Contracts, the Board requested and received additional information on certain topics, including (i) fund performance trends, actions to be taken by FMR to improve certain funds' overall performance, and Fidelity's long-term strategies for certain funds; (ii) portfolio manager changes that have occurred during the past year and length of portfolio manager tenure for different categories of funds over time; (iii) Fidelity's compensation structure for portfolio managers and other key personnel and strategies for attracting and retaining non-investment personnel; (iv) the amount of the investment that each portfolio manager has made in the Fidelity fund(s) that he or she manages; (v) historical trends in Fidelity's realization of fall-out benefits; (vi) Fidelity's group fee structures and the rationale for the individual fee rates of certain funds; (vii) fund profitability methodology and the impact of certain factors on fund profitability results; (viii) trends regarding industry use of performance fee structures and Fidelity's compliance practices with respect to performance adjustment calculations; (ix) the fee structures in place for certain other Fidelity clients; and (x) explanations regarding the relative total expense ratios of certain funds and classes, total expense competitive trends, and actions that might be taken by FMR to reduce total expense ratios for certain funds and classes.
Annual Report
Based on its evaluation of all of the conclusions noted above, and after considering all factors it believed relevant, the Board ultimately concluded that the advisory fee structures are fair and reasonable, and that the fund's Advisory Contracts should be renewed.
Annual Report
Investment Adviser
Fidelity Management & Research Company
Boston, MA
Investment Sub-Advisers
FMR Co., Inc.
Fidelity Management & Research (U.K.) Inc.
FIL Investment Advisors
FIL Investment Advisors (UK) Limited
Fidelity Management & Research (Hong Kong) Limited
Fidelity Management & Research (Japan) Inc.
General Distributor
Fidelity Distributors Corporation
Boston, MA
Transfer and Service Agents
Fidelity Investments Institutional Operations Company, Inc.
Boston, MA
Fidelity Service Company, Inc.
Boston, MA
Custodian
Brown Brothers Harriman & Co.
Boston, MA
VIPCAR-ANN-0212
1.805787.107
Fidelity® Variable Insurance Products:
International Capital Appreciation Portfolio
Annual Report
December 31, 2011
Contents
Performance | (Click Here) | How the fund has done over time. |
Management's Discussion of Fund Performance | (Click Here) | The Portfolio Manager's review of fundperformance and strategy. |
Shareholder Expense Example | (Click Here) | An example of shareholder expenses. |
Investment Changes | (Click Here) | A summary of major shifts in the fund's investments over the past six months. |
Investments | (Click Here) | A complete list of the fund's investments with their
market values. |
Financial Statements | (Click Here) | Statements of assets and liabilities, operations, and
changes in net assets, as well as financial highlights. |
Notes | (Click Here) | Notes to the financial statements. |
Report of Independent Registered Public Accounting Firm | (Click Here) | |
Trustees and Officers | (Click Here) | |
Distributions | (Click Here) | |
Board Approval of Investment Advisory Contracts and Management Fees | (Click Here) | |
To view a fund's proxy voting guidelines and proxy voting record for the 12-month period ended June 30, visit http://www.fidelity.com/proxyvotingresults or visit the Securities and Exchange Commission's (SEC) web site at http://www.sec.gov. You may also call 1-877-208-0098 to request a free copy of the proxy voting guidelines.
Fidelity Variable Insurance Products are separate account options which are purchased through a variable insurance contract.
Standard & Poor's, S&P and S&P 500 are registered service marks of The McGraw-Hill Companies, Inc. and have been licensed for use by Fidelity Distributors Corporation.
Other third party marks appearing herein are the property of their respective owners.
All other marks appearing herein are registered or unregistered trademarks or service marks of FMR LLC or an affiliated company.
This report and the financial statements contained herein are submitted for the general information of the shareholders of the fund. This report is not authorized for distribution to prospective investors in the fund unless preceded or accompanied by an effective prospectus.
A fund files its complete schedule of portfolio holdings with the SEC for the first and third quarters of each fiscal year on Form N-Q. Forms N-Q are available on the SEC's web site at http://www.sec.gov. A fund's Forms N-Q may be reviewed and copied at the SEC's Public Reference Room in Washington, DC. Information regarding the operation of the SEC's Public Reference Room may be obtained by calling 1-800-SEC-0330. For a complete list of a fund's portfolio holdings, view the most recent holdings listing, semiannual report, or annual report on Fidelity's web site at http://www.fidelity.com, http://www.advisor.fidelity.com, or http://www.401k.com, as applicable.
NOT FDIC INSURED • MAY LOSE VALUE • NO BANK GUARANTEE
Neither the fund nor Fidelity Distributors Corporation is a bank.
Annual Report
Average annual total return reflects the change in the value of an investment, assuming reinvestment of the class' distributions from dividend income and capital gains (the profits earned upon the sale of securities that have grown in value, if any) and assuming a constant rate of performance each year. During periods of reimbursement by Fidelity, a fund's total return will be greater than it would be had the reimbursement not occurred. Performance numbers are net of all underlying fund operating expenses, but do not include any insurance charges imposed by your insurance company's separate account. If performance information included the effect of these additional charges, the total returns would have been lower. How a fund did yesterday is no guarantee of how it will do tomorrow.
Average Annual Total Returns
Periods ended December 31, 2011 | Past 1
Year | Past 5
Years | Life of
fundA |
VIP International Capital Appreciation Portfolio - Initial Class | -12.57% | -3.92% | 1.08% |
VIP International Capital Appreciation Portfolio - Service Class | -12.60% | -4.01% | 0.98% |
VIP International Capital Appreciation Portfolio - Service Class 2 | -12.74% | -4.13% | 0.85% |
A From December 22, 2004.
$10,000 Over Life of Fund
Let's say hypothetically that $10,000 was invested in VIP International Capital Appreciation Portfolio - Initial Class on December 22, 2004, when the fund started. The chart shows how the value of your investment would have changed, and also shows how the MSCI® ACWI® (All Country World Index) ex USA Index performed over the same period.
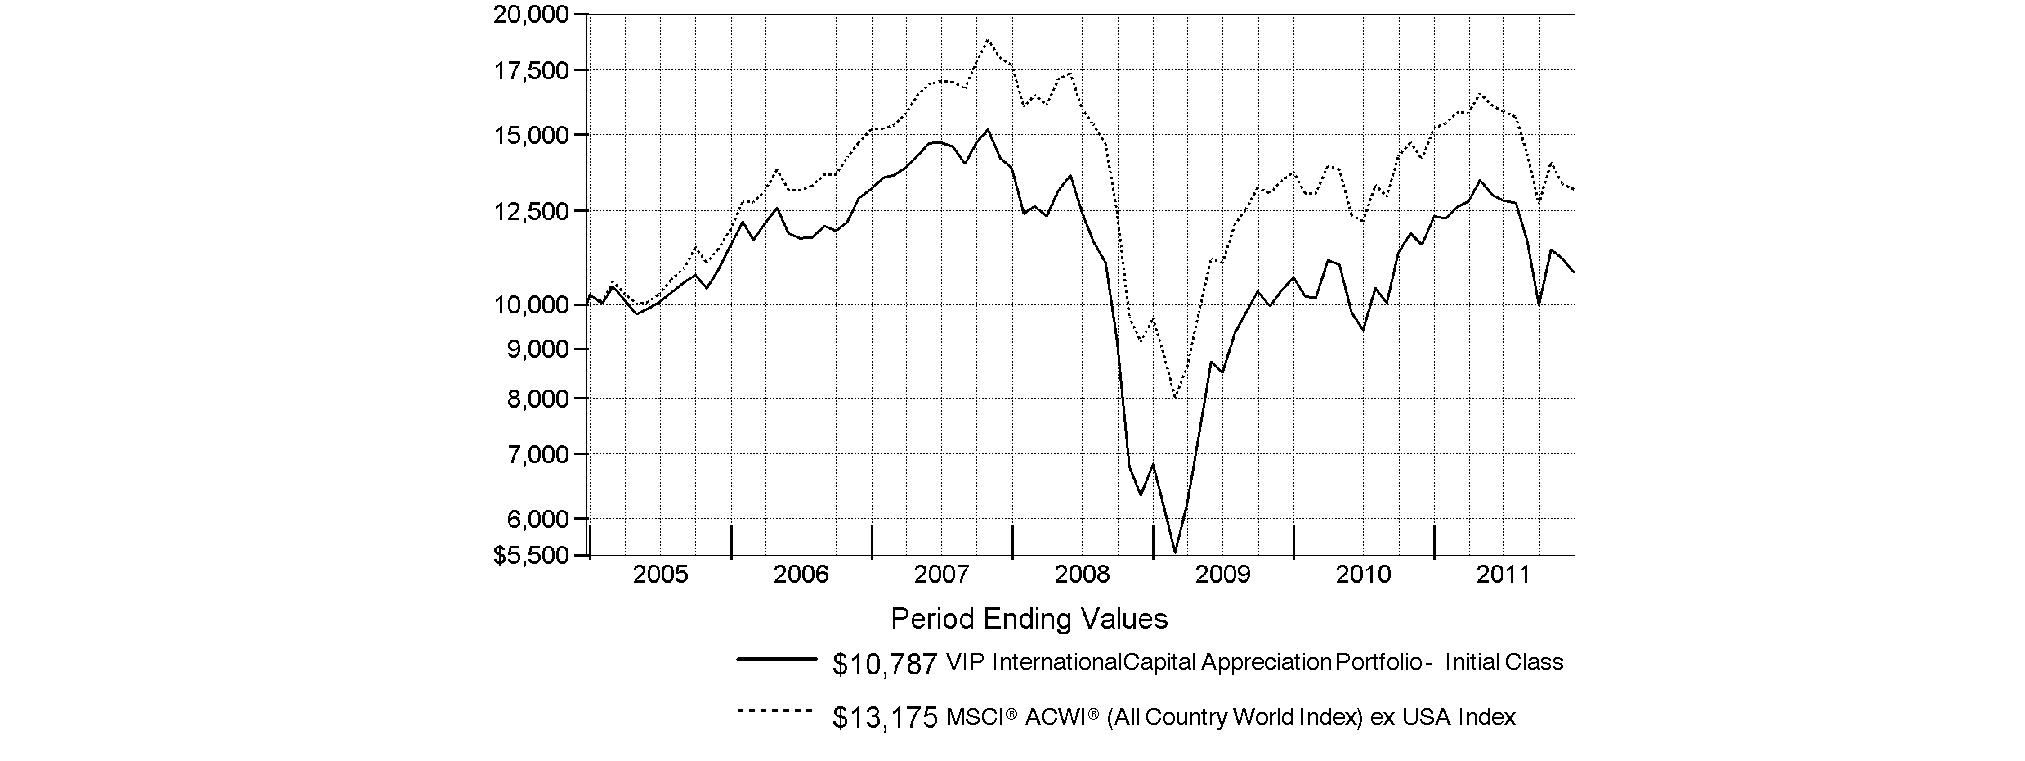
Annual Report
Market Recap: Extreme market volatility took center stage during the 12 months ending December 31, 2011, stealing the spotlight from signs of progress in the global economy. Early in the year, aggressive monetary stimulus by the U.S. federal government, improving credit-market conditions and solid corporate earnings buoyed most major asset classes. As the period progressed, however, fresh worries about sovereign debt in Europe, inflation in China, gridlock over raising the debt ceiling in the U.S. - along with Standard & Poor's early-August downgrade of the nation's long-term sovereign credit rating - and a dimmed outlook for global growth punctured investor confidence and ignited market instability. Domestic equities, as measured by the broad-based S&P 500® Index, gained 2.11%, easily outpacing the 13.61% decline of MSCI® ACWI® (All Country World Index) ex USA Index, a proxy for foreign stocks. Within the MSCI index, emerging markets declined the most -18%), with investments here generally held back by a stronger U.S. dollar. The U.K. (-3%) fared better than the rest of Europe (-15%), which was the second-worst-performing index component. Bolstered by periodic flights to quality, U.S. investment-grade bonds posted a 7.84% advance, as reflected by the Barclays Capital® U.S. Aggregate Bond Index, outperforming the 4.37% gain of high-yield securities, as represented by The BofA Merrill LynchSM US High Yield Constrained Index. Hampered by financial woes in Europe, the sovereign debt of major developed markets outside the U.S. rose 4.86%, according to the Citigroup® Non-USD Group-of-Seven (G7) Equal Weighted Index, while the JPMorgan Emerging Markets Bond Index Global (EMBI Global) advanced 8.46%, despite the currency head wind.
Comments from Sammy Simnegar, Portfolio Manager of VIP International Capital Appreciation Portfolio: During the year, the fund's share classes finished modestly ahead of the MSCI index. (For specific portfolio results, please refer to the performance section of this report.) Versus the index, the fund got a performance boost from overweighting consumer staples. Stock selection in consumer discretionary, information technology and energy also lifted performance. Geographically, positioning in various areas within emerging markets had a meaningful positive impact. Specifically, stock picking and a sizable overweighting in Indonesia bolstered our results, as did security selection in Brazil. Elsewhere, a sizable out-of-benchmark allocation to the United States, which I added to during the period, contributed, along with an underweighting in Japan. Four of the fund's five largest relative contributors were based in Indonesia, where robust economic growth and stock-market outperformance proved beneficial. Mitra Adiperkasa, the largest contributor, owns franchises for Reebok and several other well-known consumer brands. Solid earnings growth amid rapid expansion of the company's store base drove the stock's advance. Other major contributors calling Indonesia home were tobacco firm Gudang Garam, ACE Hardware Indonesia and Global Mediacom. The fund also benefited from its holdings in global payments company MasterCard and a small position in Royal Gold. All of the contributors I've mentioned, except for Gudang Garam, were out-of-index positions, and Royal Gold was sold from the fund by period end. Conversely, stock selection and a sizable underweighting in health care detracted from performance. A large underweighting in telecommunication services also hurt. At the stock level, Vedanta Resources, a U.K. metals and mining firm with significant assets in India, suffered from corporate governance issues and was sold from the fund. Swiss food and beverage maker Nestle - the fund's second-largest holding at period end - also meaningfully detracted. Untimely ownership - including overweighted exposure in advance of the Swiss government's August intervention to weaken the nation's currency - hurt our position. An out-of-benchmark stake in Canadian junior silver miner Aurcana, a low-priced and highly volatile stock that I sold, detracted as well.
The views expressed above reflect those of the portfolio manager(s) only through the end of the period as stated on the cover of this report and do not necessarily represent the views of Fidelity or any other person in the Fidelity organization. Any such views are subject to change at any time based upon market or other conditions and Fidelity disclaims any responsibility to update such views. These views may not be relied on as investment advice and, because investment decisions for a Fidelity fund are based on numerous factors, may not be relied on as an indication of trading intent on behalf of any Fidelity fund.
Annual Report
As a shareholder of the Fund, you incur two types of costs: (1) transaction costs, including redemption fees, and (2) ongoing costs, including management fees, distribution and/or service (12b-1) fees and other Fund expenses. This Example is intended to help you understand your ongoing costs (in dollars) of investing in the Fund and to compare these costs with the ongoing costs of investing in other mutual funds.
The Example is based on an investment of $1,000 invested at the beginning of the period and held for the entire period (July 1, 2011 to December 31, 2011).
Actual Expenses
The first line of the accompanying table for each class of the Fund provides information about actual account values and actual expenses. You may use the information in this line, together with the amount you invested, to estimate the expenses that you paid over the period. Simply divide your account value by $1,000.00 (for example, an $8,600 account value divided by $1,000.00 = 8.6), then multiply the result by the number in the first line for a class of the Fund under the heading entitled "Expenses Paid During Period" to estimate the expenses you paid on your account during this period. The estimate of expenses does not include any fees or other expenses of any variable annuity or variable life insurance product. If they were, the estimate of expenses you paid during the period would be higher, and your ending account value would be lower. In addition, the Fund, as a shareholder in the underlying Fidelity Central Funds, will indirectly bear its pro-rata share of the fees and expenses incurred by the underlying Fidelity Central Funds. These fees and expenses are not included in the Fund's annualized expense ratio used to calculate the expense estimate in the table below.
Hypothetical Example for Comparison Purposes
The second line of the accompanying table for each class of the Fund provides information about hypothetical account values and hypothetical expenses based on a Class' actual expense ratio and an assumed rate of return of 5% per year before expenses, which is not the Class' actual return. The hypothetical account values and expenses may not be used to estimate the actual ending account balance or expenses you paid for the period. You may use this information to compare the ongoing costs of investing in the Fund and other funds. To do so, compare this 5% hypothetical example with the 5% hypothetical examples that appear in the shareholder reports of the other funds. The estimate of expenses does not include any fees or other expenses of any variable annuity or variable life insurance product. If they were, the estimate of expenses you paid during the period would be higher, and your ending account value would be lower. In addition, the Fund, as a shareholder in the underlying Fidelity Central Funds, will indirectly bear its pro-rata share of the fees and expenses incurred by the underlying Fidelity Central Funds. These fees and expenses are not included in the Fund's annualized expense ratio used to calculate the expense estimate in the table below.
Please note that the expenses shown in the table are meant to highlight your ongoing costs only and do not reflect any transaction costs. Therefore, the second line of the table is useful in comparing ongoing costs only, and will not help you determine the relative total costs of owning different funds. In addition, if these transactional costs were included, your costs would have been higher.
| Annualized
Expense Ratio | Beginning
Account Value
July 1, 2011 | Ending
Account Value
December 31, 2011 | Expenses Paid
During Period*
July 1, 2011 to
December 31, 2011 |
Initial Class | 1.10% | | | |
Actual | | $ 1,000.00 | $ 841.50 | $ 5.11 |
HypotheticalA | | $ 1,000.00 | $ 1,019.66 | $ 5.60 |
Service Class | 1.20% | | | |
Actual | | $ 1,000.00 | $ 841.10 | $ 5.57 |
HypotheticalA | | $ 1,000.00 | $ 1,019.16 | $ 6.11 |
Service Class 2 | 1.35% | | | |
Actual | | $ 1,000.00 | $ 841.40 | $ 6.27 |
HypotheticalA | | $ 1,000.00 | $ 1,018.40 | $ 6.87 |
Initial Class R | 1.10% | | | |
Actual | | $ 1,000.00 | $ 841.50 | $ 5.11 |
HypotheticalA | | $ 1,000.00 | $ 1,019.66 | $ 5.60 |
Service Class R | 1.20% | | | |
Actual | | $ 1,000.00 | $ 841.10 | $ 5.57 |
HypotheticalA | | $ 1,000.00 | $ 1,019.16 | $ 6.11 |
Service Class 2R | 1.35% | | | |
Actual | | $ 1,000.00 | $ 841.10 | $ 6.26 |
HypotheticalA | | $ 1,000.00 | $ 1,018.40 | $ 6.87 |
Investor Class R | 1.18% | | | |
Actual | | $ 1,000.00 | $ 841.50 | $ 5.48 |
HypotheticalA | | $ 1,000.00 | $ 1,019.26 | $ 6.01 |
A 5% return per year before expenses
* Expenses are equal to each Class' annualized expense ratio, multiplied by the average account value over the period, multiplied by 184/365 (to reflect the one-half year period).
Annual Report
Investment Changes (Unaudited)
Geographic Diversification (% of fund's net assets) |
As of December 31, 2011 |
| United States of America | 18.3% | |
| United Kingdom | 16.3% | |
| Japan | 9.0% | |
| France | 7.8% | |
| Germany | 4.8% | |
| Indonesia | 4.7% | |
| Brazil | 4.5% | |
| India | 4.4% | |
| Switzerland | 4.3% | |
| Other | 25.9% | |

Percentages are adjusted for the effect of futures contracts, if applicable. |
As of June 30, 2011 |
| United States of America | 15.4% | |
| Japan | 11.7% | |
| United Kingdom | 10.6% | |
| France | 8.1% | |
| Indonesia | 4.4% | |
| Brazil | 4.4% | |
| Switzerland | 4.2% | |
| Cayman Islands | 4.1% | |
| Germany | 4.1% | |
| Other | 33.0% | |

Percentages are adjusted for the effect of futures contracts, if applicable. |
Asset Allocation |
| % of fund's
net assets | % of fund's net assets
6 months ago |
Stocks | 98.3 | 98.9 |
Short-Term Investments and Net Other Assets | 1.7 | 1.1 |
Top Ten Stocks as of December 31, 2011 |
| % of fund's
net assets | % of fund's net assets
6 months ago |
Royal Dutch Shell PLC Class B (United Kingdom, Oil, Gas & Consumable Fuels) | 2.2 | 1.8 |
Nestle SA (Switzerland, Food Products) | 1.8 | 1.8 |
BHP Billiton PLC ADR (United Kingdom, Metals & Mining) | 1.7 | 0.0 |
British American Tobacco PLC (United Kingdom) (United Kingdom, Tobacco) | 1.6 | 1.0 |
Unilever PLC (United Kingdom, Food Products) | 1.1 | 1.1 |
Siemens AG sponsored ADR (Germany, Industrial Conglomerates) | 1.0 | 1.2 |
BG Group PLC (United Kingdom, Oil, Gas & Consumable Fuels) | 1.0 | 1.0 |
Philip Morris International, Inc. (United States of America, Tobacco) | 0.9 | 0.5 |
BASF AG (Germany, Chemicals) | 0.9 | 0.0 |
Diageo PLC sponsored ADR (United Kingdom, Beverages) | 0.9 | 0.0 |
| 13.1 | |
Market Sectors as of December 31, 2011 |
| % of fund's
net assets | % of fund's net assets
6 months ago |
Consumer Discretionary | 23.1 | 19.3 |
Consumer Staples | 21.3 | 18.1 |
Materials | 13.2 | 12.6 |
Financials | 12.1 | 18.2 |
Industrials | 10.8 | 11.7 |
Information Technology | 8.7 | 9.4 |
Energy | 5.8 | 7.3 |
Health Care | 3.3 | 2.3 |
Annual Report
Investments December 31, 2011
Showing Percentage of Net Assets
Common Stocks - 96.2% |
| Shares | | Value |
Australia - 1.0% |
Atlas Iron Ltd. | 63,062 | | $ 174,124 |
Fortescue Metals Group Ltd. | 40,357 | | 176,228 |
TOTAL AUSTRALIA | | 350,352 |
Belgium - 1.4% |
Anheuser-Busch InBev SA NV | 5,068 | | 309,352 |
Umicore SA | 4,656 | | 192,072 |
TOTAL BELGIUM | | 501,424 |
Bermuda - 1.1% |
Credicorp Ltd. (NY Shares) | 1,900 | | 207,993 |
Petra Diamonds Ltd. (a) | 100,885 | | 180,193 |
TOTAL BERMUDA | | 388,186 |
Brazil - 4.5% |
BR Malls Participacoes SA | 20,000 | | 194,504 |
Brasil Foods SA sponsored ADR (d) | 10,600 | | 207,230 |
Cia.Hering SA | 8,600 | | 149,826 |
Companhia de Bebidas das Americas (AmBev) (PN) sponsored ADR | 6,600 | | 238,194 |
Iguatemi Empresa de Shopping Centers SA | 9,800 | | 182,304 |
Itau Unibanco Banco Multiplo SA sponsored ADR | 15,300 | | 283,968 |
Multiplan Empreendimentos Imobiliarios SA | 9,300 | | 191,021 |
Souza Cruz Industria Comerico | 15,900 | | 195,507 |
TOTAL BRAZIL | | 1,642,554 |
Canada - 1.3% |
First Quantum Minerals Ltd. | 10,400 | | 204,753 |
Potash Corp. of Saskatchewan, Inc. | 6,400 | | 264,635 |
TOTAL CANADA | | 469,388 |
Cayman Islands - 2.9% |
Baidu.com, Inc. sponsored ADR (a) | 1,500 | | 174,705 |
Belle International Holdings Ltd. | 108,000 | | 188,283 |
Golden Eagle Retail Group Ltd. (H Shares) | 88,000 | | 186,048 |
Hengdeli Holdings Ltd. | 540,000 | | 176,602 |
Intime Department Store Group Co. Ltd. | 175,500 | | 179,644 |
SINA Corp. (a) | 3,046 | | 158,392 |
TOTAL CAYMAN ISLANDS | | 1,063,674 |
Chile - 0.6% |
Banco Santander Chile sponsored ADR | 2,700 | | 204,390 |
China - 0.5% |
Shandong Weigao Medical Pol Co. Ltd. (H Shares) | 192,000 | | 172,801 |
Curacao - 0.5% |
Schlumberger Ltd. | 2,500 | | 170,775 |
|
| Shares | | Value |
Denmark - 0.8% |
Novo Nordisk A/S Series B sponsored ADR | 2,600 | | $ 299,676 |
Finland - 1.0% |
Kone Oyj (B Shares) | 3,700 | | 192,050 |
Nokian Tyres PLC | 5,886 | | 189,557 |
TOTAL FINLAND | | 381,607 |
France - 7.8% |
Air Liquide SA | 2,200 | | 272,210 |
Atos Origin SA | 3,827 | | 167,979 |
BNP Paribas SA | 6,769 | | 265,920 |
Casino Guichard Perrachon SA | 2,254 | | 189,876 |
Christian Dior SA | 1,688 | | 200,163 |
Danone | 4,100 | | 257,763 |
Edenred | 7,800 | | 192,032 |
LVMH Moet Hennessy - Louis Vuitton | 1,932 | | 273,585 |
Pernod Ricard SA | 2,500 | | 231,892 |
PPR SA | 1,400 | | 200,516 |
Remy Cointreau SA | 2,300 | | 184,849 |
Schneider Electric SA | 4,429 | | 233,214 |
Technip SA | 2,200 | | 206,799 |
TOTAL FRANCE | | 2,876,798 |
Germany - 3.7% |
BASF AG | 4,692 | | 327,291 |
Bayerische Motoren Werke AG (BMW) | 3,333 | | 223,305 |
Delticom AG | 1,896 | | 163,694 |
SAP AG | 5,500 | | 290,938 |
Siemens AG sponsored ADR | 3,800 | | 363,318 |
TOTAL GERMANY | | 1,368,546 |
India - 4.4% |
Asian Paints India Ltd. | 3,680 | | 179,946 |
Bajaj Auto Ltd. | 5,790 | | 173,804 |
Gitanjali Gems Ltd. | 28,551 | | 162,506 |
HDFC Bank Ltd. | 26,238 | | 211,371 |
ITC Ltd. | 51,178 | | 194,325 |
Jubilant Foodworks Ltd. (a) | 11,446 | | 162,876 |
Smithkline Beecham Consumer Healthcare Ltd. | 3,898 | | 186,797 |
Tata Motors Ltd. | 53,869 | | 181,170 |
Titan Industries Ltd. | 54,174 | | 174,738 |
TOTAL INDIA | | 1,627,533 |
Indonesia - 4.7% |
PT ACE Hardware Indonesia Tbk | 483,500 | | 218,621 |
PT Astra International Tbk | 26,500 | | 216,267 |
PT Bank Mandiri (Persero) Tbk | 249,500 | | 185,732 |
PT Bank Rakyat Indonesia Tbk | 275,000 | | 204,715 |
PT Global Mediacom Tbk | 1,604,000 | | 175,127 |
PT Gudang Garam Tbk | 26,500 | | 181,343 |
PT Kalbe Farma Tbk | 463,000 | | 173,609 |
Common Stocks - continued |
| Shares | | Value |
Indonesia - continued |
PT Mitra Adiperkasa Tbk | 311,500 | | $ 176,920 |
PT Modern Internasional Tbk | 554,500 | | 195,688 |
TOTAL INDONESIA | | 1,728,022 |
Ireland - 0.5% |
Kenmare Resources PLC (a) | 264,900 | | 189,258 |
Israel - 1.0% |
Check Point Software Technologies Ltd. (a) | 3,300 | | 173,382 |
Israel Chemicals Ltd. | 18,000 | | 186,563 |
TOTAL ISRAEL | | 359,945 |
Italy - 2.0% |
Prada SpA | 42,700 | | 193,251 |
Saipem SpA | 4,798 | | 204,016 |
Salvatore Ferragamo Italia SpA (a) | 13,300 | | 175,254 |
Tod's SpA | 2,106 | | 171,875 |
TOTAL ITALY | | 744,396 |
Japan - 9.0% |
Canon, Inc. sponsored ADR | 6,585 | | 290,003 |
Fanuc Corp. | 1,600 | | 244,891 |
Fast Retailing Co. Ltd. | 1,100 | | 200,091 |
Japan Tobacco, Inc. | 48 | | 225,765 |
Kakaku.com, Inc. | 4,700 | | 172,330 |
Keyence Corp. | 800 | | 192,919 |
Komatsu Ltd. | 9,600 | | 224,393 |
Makita Corp. | 5,900 | | 190,956 |
Mitsubishi Corp. | 12,000 | | 242,448 |
Mitsui & Co. Ltd. | 15,800 | | 245,730 |
Nabtesco Corp. | 9,600 | | 174,999 |
Rakuten, Inc. | 174 | | 187,192 |
Start Today Co. Ltd. (d) | 7,700 | | 180,182 |
Sysmex Corp. | 5,300 | | 172,707 |
THK Co. Ltd. | 9,200 | | 181,334 |
Unicharm Corp. | 4,000 | | 197,233 |
TOTAL JAPAN | | 3,323,173 |
Korea (South) - 0.7% |
Hyundai Motor Co. | 1,309 | | 239,935 |
Netherlands - 1.1% |
ING Groep NV sponsored ADR (a)(d) | 33,314 | | 238,861 |
LyondellBasell Industries NV Class A | 5,300 | | 172,197 |
TOTAL NETHERLANDS | | 411,058 |
Nigeria - 1.0% |
Guaranty Trust Bank PLC GDR (Reg. S) | 40,516 | | 184,348 |
Guinness Nigeria PLC | 130,097 | | 200,396 |
TOTAL NIGERIA | | 384,744 |
|
| Shares | | Value |
Portugal - 0.5% |
Jeronimo Martins SGPS SA | 11,295 | | $ 186,993 |
Russia - 1.7% |
Magnit OJSC GDR (Reg. S) | 9,700 | | 205,252 |
Sberbank (Savings Bank of the Russian Federation) (a) | 89,400 | | 220,280 |
TNK-BP Holding (a) | 78,700 | | 202,786 |
TOTAL RUSSIA | | 628,318 |
South Africa - 1.7% |
Mr Price Group Ltd. | 18,600 | | 183,866 |
Naspers Ltd. Class N (e) | 5,100 | | 223,134 |
Shoprite Holdings Ltd. | 12,500 | | 210,899 |
TOTAL SOUTH AFRICA | | 617,899 |
Spain - 0.6% |
Inditex SA | 2,611 | | 213,866 |
Sweden - 1.9% |
Atlas Copco AB (A Shares) | 10,700 | | 230,144 |
H&M Hennes & Mauritz AB (B Shares) | 8,371 | | 269,224 |
Swedish Match Co. | 5,800 | | 205,924 |
TOTAL SWEDEN | | 705,292 |
Switzerland - 4.3% |
Compagnie Financiere Richemont SA Series A | 4,661 | | 235,792 |
Dufry AG (a) | 1,910 | | 175,818 |
Nestle SA | 11,701 | | 672,793 |
Swatch Group AG (Bearer) | 580 | | 217,079 |
UBS AG (NY Shares) (a) | 23,900 | | 282,737 |
TOTAL SWITZERLAND | | 1,584,219 |
Thailand - 1.0% |
C.P. Seven Eleven PCL (For. Reg.) | 115,400 | | 188,986 |
Siam Makro PCL (For. Reg.) | 24,900 | | 188,326 |
TOTAL THAILAND | | 377,312 |
Turkey - 0.5% |
Turkiye Garanti Bankasi A/S | 59,091 | | 184,953 |
United Kingdom - 16.3% |
Anglo American PLC (United Kingdom) | 8,000 | | 295,596 |
Antofagasta PLC | 11,100 | | 209,466 |
Barclays PLC sponsored ADR | 23,400 | | 257,166 |
BG Group PLC | 16,646 | | 355,877 |
BHP Billiton PLC ADR | 10,943 | | 638,962 |
British American Tobacco PLC (United Kingdom) | 12,500 | | 593,062 |
Burberry Group PLC | 10,300 | | 189,570 |
Diageo PLC sponsored ADR | 3,600 | | 314,712 |
Imperial Tobacco Group PLC | 7,216 | | 272,903 |
Johnson Matthey PLC | 6,651 | | 189,659 |
Meggitt PLC | 36,000 | | 197,262 |
Reckitt Benckiser Group PLC | 5,000 | | 246,951 |
Royal Dutch Shell PLC Class B | 21,009 | | 799,213 |
Common Stocks - continued |
| Shares | | Value |
United Kingdom - continued |
SABMiller PLC | 7,300 | | $ 256,976 |
Standard Chartered PLC (United Kingdom) | 13,963 | | 305,565 |
The Weir Group PLC | 6,400 | | 201,984 |
Unilever PLC | 12,400 | | 415,863 |
Xstrata PLC | 16,397 | | 249,067 |
TOTAL UNITED KINGDOM | | 5,989,854 |
United States of America - 16.2% |
Allergan, Inc. | 2,100 | | 184,254 |
Apple, Inc. (a) | 455 | | 184,275 |
Caterpillar, Inc. | 2,000 | | 181,200 |
CF Industries Holdings, Inc. | 1,300 | | 188,474 |
Citrix Systems, Inc. (a) | 2,700 | | 163,944 |
Coach, Inc. | 2,900 | | 177,016 |
Crown Holdings, Inc. (a) | 5,150 | | 172,937 |
Cummins, Inc. | 1,900 | | 167,238 |
EMC Corp. (a) | 7,693 | | 165,707 |
First Cash Financial Services, Inc. (a) | 4,700 | | 164,923 |
Freeport-McMoRan Copper & Gold, Inc. | 4,586 | | 168,719 |
Google, Inc. Class A (a) | 300 | | 193,770 |
Halliburton Co. | 5,400 | | 186,354 |
Joy Global, Inc. | 2,200 | | 164,934 |
JPMorgan Chase & Co. | 5,611 | | 186,566 |
Las Vegas Sands Corp. (a) | 3,975 | | 169,852 |
Lorillard, Inc. | 1,600 | | 182,400 |
MasterCard, Inc. Class A | 440 | | 164,041 |
Mead Johnson Nutrition Co. Class A | 2,600 | | 178,698 |
NIKE, Inc. Class B | 1,700 | | 163,829 |
Oracle Corp. | 6,600 | | 169,290 |
Perrigo Co. | 1,800 | | 175,140 |
Philip Morris International, Inc. | 4,200 | | 329,616 |
Rackspace Hosting, Inc. (a) | 4,100 | | 176,341 |
salesforce.com, Inc. (a) | 1,700 | | 172,482 |
The Coca-Cola Co. | 2,500 | | 174,925 |
The Mosaic Co. | 3,400 | | 171,462 |
Tiffany & Co., Inc. | 2,644 | | 175,191 |
TJX Companies, Inc. | 2,800 | | 180,740 |
United Technologies Corp. | 2,300 | | 168,107 |
Visa, Inc. Class A | 1,700 | | 172,601 |
Wells Fargo & Co. | 6,508 | | 179,360 |
Yum! Brands, Inc. | 3,070 | | 181,161 |
TOTAL UNITED STATES OF AMERICA | | 5,935,547 |
TOTAL COMMON STOCKS (Cost $34,625,351) |
35,322,488
|
Preferred Stocks - 2.1% |
| Shares | | Value |
Convertible Preferred Stocks - 0.4% |
United States of America - 0.4% |
Citigroup, Inc. 7.50% | 2,100 | | $ 170,625 |
Nonconvertible Preferred Stocks - 1.7% |
Germany - 1.1% |
Hugo Boss AG (non-vtg.) | 2,400 | | 176,763 |
Volkswagen AG | 1,600 | | 239,723 |
TOTAL GERMANY | | 416,486 |
Italy - 0.6% |
Fiat Industrial SpA (a) | 32,200 | | 197,228 |
TOTAL NONCONVERTIBLE PREFERRED STOCKS | | 613,714 |
TOTAL PREFERRED STOCKS (Cost $829,047) |
784,339
|
Money Market Funds - 3.3% |
| | | |
Fidelity Cash Central Fund, 0.11% (b) | 669,898 | | 669,898 |
Fidelity Securities Lending Cash Central Fund, 0.13% (b)(c) | 520,645 | | 520,645 |
TOTAL MONEY MARKET FUNDS (Cost $1,190,543) |
1,190,543
|
TOTAL INVESTMENT PORTFOLIO - 101.6% (Cost $36,644,941) | | 37,297,370 |
NET OTHER ASSETS (LIABILITIES) - (1.6)% | | (570,315) |
NET ASSETS - 100% | $ 36,727,055 |
Legend |
(a) Non-income producing |
(b) Affiliated fund that is available only to investment companies and other accounts managed by Fidelity Investments. The rate quoted is the annualized seven-day yield of the fund at period end. A complete unaudited listing of the fund's holdings as of its most recent quarter end is available upon request. In addition, each Fidelity Central Fund's financial statements, which are not covered by the Fund's Report of Independent Registered Public Accounting Firm, are available on the SEC's website or upon request. |
(c) Investment made with cash collateral received from securities on loan. |
(d) Security or a portion of the security is on loan at period end. |
(e) Security or a portion of the security purchased on a delayed delivery or when-issued basis. |
Affiliated Central Funds |
Information regarding fiscal year to date income earned by the Fund from investments in Fidelity Central Funds is as follows: |
Fund | Income earned |
Fidelity Cash Central Fund | $ 292 |
Fidelity Securities Lending Cash Central Fund | 15,048 |
Total | $ 15,340 |
Other Information |
The following is a summary of the inputs used, as of December 31, 2011, involving the Fund's assets and liabilities carried at fair value. The inputs or methodology used for valuing securities may not be an indication of the risk associated with investing in those securities. For more information on valuation inputs, and their aggregation into the levels used in the table below, please refer to the Security Valuation section in the accompanying Notes to Financial Statements. |
Valuation Inputs at Reporting Date: |
Description | Total | Level 1 | Level 2 | Level 3 |
Investments in Securities: | | | | |
Equities: | | | | |
United States of America | $ 6,106,172 | $ 6,106,172 | $ - | $ - |
United Kingdom | 5,989,854 | 4,181,716 | 1,808,138 | - |
Japan | 3,323,173 | 3,323,173 | - | - |
France | 2,876,798 | 2,876,798 | - | - |
Germany | 1,785,032 | 1,494,094 | 290,938 | - |
Indonesia | 1,728,022 | 1,728,022 | - | - |
Brazil | 1,642,554 | 1,642,554 | - | - |
India | 1,627,533 | 1,234,992 | 392,541 | - |
Switzerland | 1,584,219 | 1,584,219 | - | - |
Other | 9,443,470 | 9,134,118 | 309,352 | - |
Money Market Funds | 1,190,543 | 1,190,543 | - | - |
Total Investments in Securities: | $ 37,297,370 | $ 34,496,401 | $ 2,800,969 | $ - |
See accompanying notes which are an integral part of the financial statements.
Annual Report
Statement of Assets and Liabilities
| December 31, 2011 |
Assets | | |
Investment in securities, at value (including securities loaned of $498,936) - See accompanying schedule: Unaffiliated issuers (cost $35,454,398) | $ 36,106,827 | |
Fidelity Central Funds (cost $1,190,543) | 1,190,543 | |
Total Investments (cost $36,644,941) | | $ 37,297,370 |
Foreign currency held at value (cost $362) | | 363 |
Receivable for investments sold
Regular delivery | | 18,684 |
Delayed delivery | | 13,003 |
Dividends receivable | | 95,868 |
Distributions receivable from Fidelity Central Funds | | 379 |
Prepaid expenses | | 114 |
Receivable from investment adviser for expense reductions | | 9,676 |
Other receivables | | 58,682 |
Total assets | | 37,494,139 |
| | |
Liabilities | | |
Payable for investments purchased | $ 140,269 | |
Payable for fund shares redeemed | 19,957 | |
Accrued management fee | 21,673 | |
Distribution and service plan fees payable | 65 | |
Other affiliated payables | 5,351 | |
Other payables and accrued expenses | 59,124 | |
Collateral on securities loaned, at value | 520,645 | |
Total liabilities | | 767,084 |
| | |
Net Assets | | $ 36,727,055 |
Net Assets consist of: | | |
Paid in capital | | $ 59,002,737 |
Distributions in excess of net investment income | | (14,902) |
Accumulated undistributed net realized gain (loss) on investments and foreign currency transactions | | (22,900,610) |
Net unrealized appreciation (depreciation) on investments and assets and liabilities in foreign currencies | | 639,830 |
Net Assets | | $ 36,727,055 |
Statement of Assets and Liabilities - continued
| December 31, 2011 |
Initial Class:
Net Asset Value, offering price and redemption price per share ($511,204 ÷ 60,708 shares) | | $ 8.42 |
| | |
Service Class:
Net Asset Value, offering price and redemption price per share
($74,547 ÷ 8,865 shares) | | $ 8.41 |
| | |
Service Class 2:
Net Asset Value, offering price and redemption price per share ($166,119 ÷ 19,785 shares) | | $ 8.40 |
| | |
Initial Class R:
Net Asset Value, offering price and redemption price per share ($10,557,130 ÷ 1,253,495 shares) | | $ 8.42 |
| | |
| | |
Service Class R:
Net Asset Value, offering price and redemption price per share
($74,547 ÷ 8,865 shares) | | $ 8.41 |
| | |
Service Class 2R:
Net Asset Value, offering price and redemption price per share
($81,276 ÷ 9,675 shares) | | $ 8.40 |
| | |
Investor Class R :
Net Asset Value, offering price and redemption price per share ($25,262,232 ÷ 3,018,033 shares) | | $ 8.37 |
See accompanying notes which are an integral part of the financial statements.
Annual Report
Statement of Operations
| Year ended December 31, 2011 |
Investment Income | | |
Dividends | | $ 845,485 |
Income from Fidelity Central Funds | | 15,340 |
Income before foreign taxes withheld | | 860,825 |
Less foreign taxes withheld | | (61,946) |
Total income | | 798,879 |
| | |
Expenses | | |
Management fee | $ 295,371 | |
Transfer agent fees | 58,888 | |
Distribution and service plan fees | 694 | |
Accounting and security lending fees | 21,931 | |
Custodian fees and expenses | 113,098 | |
Independent trustees' compensation | 239 | |
Audit | 81,075 | |
Legal | 169 | |
Miscellaneous | 417 | |
Total expenses before reductions | 571,882 | |
Expense reductions | (116,832) | 455,050 |
Net investment income (loss) | | 343,829 |
Realized and Unrealized Gain (Loss) Net realized gain (loss) on: | | |
Investment securities: | | |
Unaffiliated issuers | 258,060 | |
Foreign currency transactions | (47,246) | |
Total net realized gain (loss) | | 210,814 |
Change in net unrealized appreciation (depreciation) on: Investment securities (net of decrease in deferred foreign taxes of $27,938) | (5,698,370) | |
Assets and liabilities in foreign currencies | (12,699) | |
Total change in net unrealized appreciation (depreciation) | | (5,711,069) |
Net gain (loss) | | (5,500,255) |
Net increase (decrease) in net assets resulting from operations | | $ (5,156,426) |
See accompanying notes which are an integral part of the financial statements.
Annual Report
Financial Statements - continued
Statement of Changes in Net Assets
| Year ended
December 31, 2011 | Year ened
December 31, 2010 |
Increase (Decrease) in Net Assets | | |
Operations | | |
Net investment income (loss) | $ 343,829 | $ 501,549 |
Net realized gain (loss) | 210,814 | 3,396,257 |
Change in net unrealized appreciation (depreciation) | (5,711,069) | 2,011,744 |
Net increase (decrease) in net assets resulting from operations | (5,156,426) | 5,909,550 |
Distributions to shareholders from net investment income | (367,246) | (494,828) |
Distributions to shareholders from net realized gain | (46,342) | (483,411) |
Total distributions | (413,588) | (978,239) |
Share transactions - net increase (decrease) | (3,417,273) | (5,534,279) |
Redemption fees | 4,434 | 10,678 |
Total increase (decrease) in net assets | (8,982,853) | (592,290) |
| | |
Net Assets | | |
Beginning of period | 45,709,908 | 46,302,198 |
End of period (including distributions in excess of net investment income of $14,902 and undistributed net investment income of $6,999, respectively) | $ 36,727,055 | $ 45,709,908 |
See accompanying notes which are an integral part of the financial statements.
Annual Report
Financial Highlights - Initial Class
Years ended December 31, | 2011 | 2010 | 2009 | 2008 | 2007 |
Selected Per-Share Data | | | | | |
Net asset value, beginning of period | $ 9.74 | $ 8.60 | $ 5.61 | $ 11.44 | $ 12.68 |
Income from Investment Operations | | | | | |
Net investment income (loss) C | .08 | .10 | .07 | .15 | .11 F |
Net realized and unrealized gain (loss) | (1.30) | 1.24 | 3.07 | (5.92) | .53 |
Total from investment operations | (1.22) | 1.34 | 3.14 | (5.77) | .64 |
Distributions from net investment income | (.09) | (.11) | (.06) | - | (.09) |
Distributions from net realized gain | (.01) | (.10) | (.09) | (.06) | (1.79) |
Total distributions | (.10) | (.20) I | (.15) | (.06) | (1.88) |
Redemption fees added to paid in capital C, H | - | - | - | - | - |
Net asset value, end of period | $ 8.42 | $ 9.74 | $ 8.60 | $ 5.61 | $ 11.44 |
Total Return A,B | (12.57)% | 15.73% | 56.04% | (50.69)% | 5.17% |
Ratios to Average Net Assets D,G | | | | | |
Expenses before reductions | 1.30% | 1.60% | 1.81% | 1.54% | 1.20% |
Expenses net of fee waivers, if any | 1.10% | 1.10% | 1.10% | 1.10% | 1.10% |
Expenses net of all reductions | 1.03% | .96% | .93% | .91% | 1.07% |
Net investment income (loss) | .88% | 1.19% | 1.03% | 1.65% | .82% F |
Supplemental Data | | | | | |
Net assets, end of period (000 omitted) | $ 511 | $ 732 | $ 645 | $ 388 | $ 1,409 |
Portfolio turnover rate E | 236% | 463% | 416% | 350% | 224% |
A Total returns do not reflect charges attributable to your insurance company's separate account. Inclusion of these charges would reduce the total returns shown.
B Total returns would have been lower if certain expenses had not been reduced during the applicable periods shown.
C Calculated based on average shares outstanding during the period.
D Fees and expenses of any underlying Fidelity Central Funds are not included in the Fund's expense ratio. The Fund indirectly bears its proportionate share of the expenses of any underlying Fidelity Central Funds.
E Amount does not include the portfolio activity of any underlying Fidelity Central Funds.
F Investment income per share reflects a special dividend which amounted to $.02 per share. Excluding the special dividend, the ratio of net investment income (loss) to average net assets would have been .68%.
G Expense ratios reflect operating expenses of the class. Expenses before reductions do not reflect amounts reimbursed by the investment adviser or reductions from brokerage service arrangements or reductions from other expense offset arrangements and do not represent the amount paid by the class during periods when reimbursements or reductions occur. Expenses net of fee waivers reflect expenses after reimbursement by the investment adviser but prior to reductions from brokerage service arrangements or other expense offset arrangements. Expenses net of all reductions represent the net expenses paid by the class.
H Amount represents less than $.01 per share.
I Total distributions of $.20 per share is comprised of distributions from net investment income of $.105 and distributions from net realized gain of $.097 per share.
Financial Highlights - Service Class
Years ended December 31, | 2011 | 2010 | 2009 | 2008 | 2007 |
Selected Per-Share Data | | | | | |
Net asset value, beginning of period | $ 9.72 | $ 8.58 | $ 5.61 | $ 11.43 | $ 12.67 |
Income from Investment Operations | | | | | |
Net investment income (loss) C | .07 | .10 | .06 | .14 | .10 F |
Net realized and unrealized gain (loss) | (1.29) | 1.23 | 3.05 | (5.90) | .53 |
Total from investment operations | (1.22) | 1.33 | 3.11 | (5.76) | .63 |
Distributions from net investment income | (.08) | (.10) | (.05) | - | (.08) |
Distributions from net realized gain | (.01) | (.10) | (.09) | (.06) | (1.79) |
Total distributions | (.09) | (.19) I | (.14) | (.06) | (1.87) |
Redemption fees added to paid in capital C, H | - | - | - | - | - |
Net asset value, end of period | $ 8.41 | $ 9.72 | $ 8.58 | $ 5.61 | $ 11.43 |
Total Return A,B | (12.60)% | 15.65% | 55.52% | (50.64)% | 5.06% |
Ratios to Average Net Assets D,G | | | | | |
Expenses before reductions | 1.42% | 1.67% | 1.73% | 1.51% | 1.20% |
Expenses net of fee waivers, if any | 1.20% | 1.20% | 1.20% | 1.20% | 1.20% |
Expenses net of all reductions | 1.14% | 1.05% | 1.04% | 1.01% | 1.16% |
Net investment income (loss) | .78% | 1.09% | .92% | 1.55% | .72% F |
Supplemental Data | | | | | |
Net assets, end of period (000 omitted) | $ 75 | $ 100 | $ 117 | $ 135 | $ 414 |
Portfolio turnover rate E | 236% | 463% | 416% | 350% | 224% |
A Total returns do not reflect charges attributable to your insurance company's separate account. Inclusion of these charges would reduce the total returns shown.
B Total returns would have been lower if certain expenses had not been reduced during the applicable periods shown.
C Calculated based on average shares outstanding during the period.
D Fees and expenses of any underlying Fidelity Central Funds are not included in the Fund's expense ratio. The Fund indirectly bears its proportionate share of the expenses of any underlying Fidelity Central Funds.
E Amount does not include the portfolio activity of any underlying Fidelity Central Funds.
F Investment income per share reflects a special dividend which amounted to $.02 per share. Excluding the special dividend, the ratio of net investment income (loss) to average net assets would have been .58%.
G Expense ratios reflect operating expenses of the class. Expenses before reductions do not reflect amounts reimbursed by the investment adviser or reductions from brokerage service arrangements or reductions from other expense offset arrangements and do not represent the amount paid by the class during periods when reimbursements or reductions occur. Expenses net of fee waivers reflect expenses after reimbursement by the investment adviser but prior to reductions from brokerage service arrangements or other expense offset arrangements. Expenses net of all reductions represent the net expenses paid by the class.
H Amount represents less than $.01 per share.
I Total distributions of $.19 per share is comprised of distributions from net investment income of $.095 and distributions from net realized gain of $.097 per share.
See accompanying notes which are an integral part of the financial statements.
Annual Report
Financial Highlights - Service Class 2
Years ended December 31, | 2011 | 2010 | 2009 | 2008 | 2007 |
Selected Per-Share Data | | | | | |
Net asset value, beginning of period | $ 9.72 | $ 8.57 | $ 5.60 | $ 11.43 | $ 12.67 |
Income from Investment Operations | | | | | |
Net investment income (loss) | .06 | .08 | .05 | .12 | .08 F |
Net realized and unrealized gain (loss) C | (1.30) | 1.24 | 3.05 | (5.89) | .53 |
Total from investment operations | (1.24) | 1.32 | 3.10 | (5.77) | .61 |
Distributions from net investment income | (.07) | (.07) | (.04) | - | (.06) |
Distributions from net realized gain | (.01) | (.10) | (.09) | (.06) | (1.79) |
Total distributions | (.08) | (.17) | (.13) | (.06) | (1.85) |
Redemption fees added to paid in capital C, H | - | - | - | - | - |
Net asset value, end of period | $ 8.40 | $ 9.72 | $ 8.57 | $ 5.60 | $ 11.43 |
Total Return A,B | (12.74)% | 15.53% | 55.44% | (50.73)% | 4.89% |
Ratios to Average Net Assets D,G | | | | | |
Expenses before reductions | 1.58% | 1.88% | 2.02% | 1.79% | 1.41% |
Expenses net of fee waivers, if any | 1.35% | 1.35% | 1.35% | 1.35% | 1.35% |
Expenses net of all reductions | 1.28% | 1.21% | 1.19% | 1.16% | 1.32% |
Net investment income (loss) | .63% | .94% | .77% | 1.40% | .57% F |
Supplemental Data | | | | | |
Net assets, end of period (000 omitted) | $ 166 | $ 115 | $ 424 | $ 302 | $ 550 |
Portfolio turnover rate E | 236% | 463% | 416% | 350% | 224% |
A Total returns do not reflect charges attributable to your insurance company's separate account. Inclusion of these charges would reduce the total returns shown.
B Total returns would have been lower if certain expenses had not been reduced during the applicable periods shown.
C Calculated based on average shares outstanding during the period.
D Fees and expenses of any underlying Fidelity Central Funds are not included in the Fund's expense ratio. The Fund indirectly bears its proportionate share of the expenses of any underlying Fidelity Central Funds.
E Amount does not include the portfolio activity of any underlying Fidelity Central Funds.
F Investment income per share reflects a special dividend which amounted to $.02 per share. Excluding the special dividend, the ratio of net investment income (loss) to average net assets would have been .43%.
G Expense ratios reflect operating expenses of the class. Expenses before reductions do not reflect amounts reimbursed by the investment adviser or reductions from brokerage service arrangements or reductions from other expense offset arrangements and do not represent the amount paid by the class during periods when reimbursements or reductions occur. Expenses net of fee waivers reflect expenses after reimbursement by the investment adviser but prior to reductions from brokerage service arrangements or other expense offset arrangements. Expenses net of all reductions represent the net expenses paid by the class.
H Amount represents less than $.01 per share.
Financial Highlights - Initial Class R
Years ended December 31, | 2011 | 2010 | 2009 | 2008 | 2007 |
Selected Per-Share Data | | | | | |
Net asset value, beginning of period | $ 9.74 | $ 8.60 | $ 5.62 | $ 11.44 | $ 12.68 |
Income from Investment Operations | | | | | |
Net investment income (loss) C | .08 | .10 | .07 | .15 | .11 F |
Net realized and unrealized gain (loss) | (1.30) | 1.24 | 3.06 | (5.91) | .53 |
Total from investment operations | (1.22) | 1.34 | 3.13 | (5.76) | .64 |
Distributions from net investment income | (.09) | (.11) | (.06) | - | (.09) |
Distributions from net realized gain | (.01) | (.10) | (.09) | (.06) | (1.79) |
Total distributions | (.10) | (.20) I | (.15) | (.06) | (1.88) |
Redemption fees added to paid in capital C, H | - | - | - | - | - |
Net asset value, end of period | $ 8.42 | $ 9.74 | $ 8.60 | $ 5.62 | $ 11.44 |
Total Return A,B | (12.57)% | 15.73% | 55.76% | (50.60)% | 5.17% |
Ratios to Average Net Assets D,G | | | | | |
Expenses before reductions | 1.33% | 1.55% | 1.60% | 1.44% | 1.11% |
Expenses net of fee waivers, if any | 1.10% | 1.10% | 1.10% | 1.10% | 1.10% |
Expenses net of all reductions | 1.03% | .95% | .93% | .91% | 1.06% |
Net investment income (loss) | .88% | 1.19% | 1.02% | 1.65% | .82% F |
Supplemental Data | | | | | |
Net assets, end of period (000 omitted) | $ 10,557 | $ 15,305 | $ 17,150 | $ 8,483 | $ 32,345 |
Portfolio turnover rate E | 236% | 463% | 416% | 350% | 224% |
A Total returns do not reflect charges attributable to your insurance company's separate account. Inclusion of these charges would reduce the total returns shown.
B Total returns would have been lower if certain expenses had not been reduced during the applicable periods shown.
C Calculated based on average shares outstanding during the period.
D Fees and expenses of any underlying Fidelity Central Funds are not included in the Fund's expense ratio. The Fund indirectly bears its proportionate share of the expenses of any underlying Fidelity Central Funds.
E Amount does not include the portfolio activity of any underlying Fidelity Central Funds.
F Investment income per share reflects a special dividend which amounted to $.02 per share. Excluding the special dividend, the ratio of net investment income (loss) to average net assets would have been .68%.
G Expense ratios reflect operating expenses of the class. Expenses before reductions do not reflect amounts reimbursed by the investment adviser or reductions from brokerage service arrangements or reductions from other expense offset arrangements and do not represent the amount paid by the class during periods when reimbursements or reductions occur. Expenses net of fee waivers reflect expenses after reimbursement by the investment adviser but prior to reductions from brokerage service arrangements or other expense offset arrangements. Expenses net of all reductions represent the net expenses paid by the class.
H Amount represents less than $.01 per share.
I Total distributions of $.20 per share is comprised of distributions from net investment income of $.105 and distributions from net realized gain of $.097 per share.
See accompanying notes which are an integral part of the financial statements.
Annual Report
Financial Highlights - Service Class R
Years ended December 31, | 2011 | 2010 | 2009 | 2008 | 2007 |
Selected Per-Share Data | | | | | |
Net asset value, beginning of period | $ 9.72 | $ 8.58 | $ 5.61 | $ 11.43 | $ 12.67 |
Income from Investment Operations | | | | | |
Net investment income (loss) C | .07 | .10 | .06 | .14 | .10 F |
Net realized and unrealized gain (loss) | (1.29) | 1.23 | 3.05 | (5.90) | .53 |
Total from investment operations | (1.22) | 1.33 | 3.11 | (5.76) | .63 |
Distributions from net investment income | (.08) | (.10) | (.05) | - | (.08) |
Distributions from net realized gain | (.01) | (.10) | (.09) | (.06) | (1.79) |
Total distributions | (.09) | (.19) I | (.14) | (.06) | (1.87) |
Redemption fees added to paid in capital C, H | - | - | - | - | - |
Net asset value, end of period | $ 8.41 | $ 9.72 | $ 8.58 | $ 5.61 | $ 11.43 |
Total Return A,B | (12.60)% | 15.65% | 55.52% | (50.64)% | 5.06% |
Ratios to Average Net Assets D,G | | | | | |
Expenses before reductions | 1.42% | 1.67% | 1.73% | 1.51% | 1.20% |
Expenses net of fee waivers, if any | 1.20% | 1.20% | 1.20% | 1.20% | 1.20% |
Expenses net of all reductions | 1.14% | 1.05% | 1.04% | 1.01% | 1.16% |
Net investment income (loss) | .78% | 1.09% | .92% | 1.55% | .72% F |
Supplemental Data | | | | | |
Net assets, end of period (000 omitted) | $ 75 | $ 100 | $ 117 | $ 135 | $ 414 |
Portfolio turnover rate E | 236% | 463% | 416% | 350% | 224% |
A Total returns do not reflect charges attributable to your insurance company's separate account. Inclusion of these charges would reduce the total returns shown.
B Total returns would have been lower if certain expenses had not been reduced during the applicable periods shown.
C Calculated based on average shares outstanding during the period.
D Fees and expenses of any underlying Fidelity Central Funds are not included in the Fund's expense ratio. The Fund indirectly bears its proportionate share of the expenses of any underlying Fidelity Central Funds.
E Amount does not include the portfolio activity of any underlying Fidelity Central Funds.
F Investment income per share reflects a special dividend which amounted to $.02 per share. Excluding the special dividend, the ratio of net investment income (loss) to average net assets would have been .58%.
G Expense ratios reflect operating expenses of the class. Expenses before reductions do not reflect amounts reimbursed by the investment adviser or reductions from brokerage service arrangements or reductions from other expense offset arrangements and do not represent the amount paid by the class during periods when reimbursements or reductions occur. Expenses net of fee waivers reflect expenses after reimbursement by the investment adviser but prior to reductions from brokerage service arrangements or other expense offset arrangements. Expenses net of all reductions represent the net expenses paid by the class.
H Amount represents less than $.01 per share.
I Total distributions of $.19 per share is comprised of distributions from net investment income of $.095 and distributions from net realized gain of $.097 per share.
Financial Highlights - Service Class 2R
Years ended December 31, | 2011 | 2010 | 2009 | 2008 | 2007 |
Selected Per-Share Data | | | | | |
Net asset value, beginning of period | $ 9.71 | $ 8.57 | $ 5.60 | $ 11.43 | $ 12.67 |
Income from Investment Operations | | | | | |
Net investment income (loss) C | .06 | .08 | .05 | .13 | .08 F |
Net realized and unrealized gain (loss) | (1.30) | 1.23 | 3.05 | (5.90) | .53 |
Total from investment operations | (1.24) | 1.31 | 3.10 | (5.77) | .61 |
Distributions from net investment income | (.06) | (.08) | (.04) | - | (.06) |
Distributions from net realized gain | (.01) | (.10) | (.09) | (.06) | (1.79) |
Total distributions | (.07) | (.17) I | (.13) | (.06) | (1.85) |
Redemption fees added to paid in capital C, H | - | - | - | - | - |
Net asset value, end of period | $ 8.40 | $ 9.71 | $ 8.57 | $ 5.60 | $ 11.43 |
Total Return A,B | (12.77)% | 15.45% | 55.36% | (50.73)% | 4.90% |
Ratios to Average Net Assets D,G | | | | | |
Expenses before reductions | 1.57% | 1.83% | 1.87% | 1.66% | 1.35% |
Expenses net of fee waivers, if any | 1.35% | 1.35% | 1.35% | 1.35% | 1.35% |
Expenses net of all reductions | 1.28% | 1.21% | 1.19% | 1.16% | 1.31% |
Net investment income (loss) | .63% | .94% | .77% | 1.40% | .57% F |
Supplemental Data | | | | | |
Net assets, end of period (000 omitted) | $ 81 | $ 109 | $ 155 | $ 179 | $ 550 |
Portfolio turnover rate E | 236% | 463% | 416% | 350% | 224% |
A Total returns do not reflect charges attributable to your insurance company's separate account. Inclusion of these charges would reduce the total returns shown.
B Total returns would have been lower if certain expenses had not been reduced during the applicable periods shown.
C Calculated based on average shares outstanding during the period.
D Fees and expenses of any underlying Fidelity Central Funds are not included in the Fund's expense ratio. The Fund indirectly bears its proportionate share of the expenses of any underlying Fidelity Central Funds.
E Amount does not include the portfolio activity of any underlying Fidelity Central Funds.
F Investment income per share reflects a special dividend which amounted to $.02 per share. Excluding the special dividend, the ratio of net investment income (loss) to average net assets would have been .43%.
G Expense ratios reflect operating expenses of the class. Expenses before reductions do not reflect amounts reimbursed by the investment adviser or reductions from brokerage service arrangements or reductions from other expense offset arrangements and do not represent the amount paid by the class during periods when reimbursements or reductions occur. Expenses net of fee waivers reflect expenses after reimbursement by the investment adviser but prior to reductions from brokerage service arrangements or other expense offset arrangements. Expenses net of all reductions represent the net expenses paid by the class.
H Amount represents less than $.01 per share.
I Total distributions of $.17 per share is comprised of distributions from net investment income of $.077 and distributions from net realized gain of $.097 per share.
See accompanying notes which are an integral part of the financial statements.
Annual Report
Financial Highlights - Investor Class R
Years ended December 31, | 2011 | 2010 | 2009 | 2008 | 2007 |
Selected Per-Share Data | | | | | |
Net asset value, beginning of period | $ 9.69 | $ 8.56 | $ 5.60 | $ 11.41 | $ 12.65 |
Income from Investment Operations | | | | | |
Net investment income (loss) C | .07 | .10 | .07 | .14 | .09 F |
Net realized and unrealized gain (loss) | (1.29) | 1.23 | 3.04 | (5.89) | .54 |
Total from investment operations | (1.22) | 1.33 | 3.11 | (5.75) | .63 |
Distributions from net investment income | (.09) | (.11) | (.06) | - | (.08) |
Distributions from net realized gain | (.01) | (.10) | (.09) | (.06) | (1.79) |
Total distributions | (.10) | (.20) I | (.15) | (.06) | (1.87) |
Redemption fees added to paid in capital C, H | - | - | - | - | - |
Net asset value, end of period | $ 8.37 | $ 9.69 | $ 8.56 | $ 5.60 | $ 11.41 |
Total Return A,B | (12.63)% | 15.69% | 55.61% | (50.65)% | 5.07% |
Ratios to Average Net Assets D,G | | | | | |
Expenses before reductions | 1.39% | 1.63% | 1.68% | 1.51% | 1.22% |
Expenses net of fee waivers, if any | 1.18% | 1.18% | 1.18% | 1.17% | 1.22% |
Expenses net of all reductions | 1.12% | 1.04% | 1.01% | .97% | 1.18% |
Net investment income (loss) | .80% | 1.11% | .94% | 1.59% | .71% F |
Supplemental Data | | | | | |
Net assets, end of period (000 omitted) | $ 25,262 | $ 29,249 | $ 27,695 | $ 14,208 | $ 38,719 |
Portfolio turnover rate E | 236% | 463% | 416% | 350% | 224% |
A Total returns do not reflect charges attributable to your insurance company's separate account. Inclusion of these charges would reduce the total returns shown.
B Total returns would have been lower if certain expenses had not been reduced during the applicable periods shown.
C Calculated based on average shares outstanding during the period.
D Fees and expenses of any underlying Fidelity Central Funds are not included in the Fund's expense ratio. The Fund indirectly bears its proportionate share of the expenses of any underlying Fidelity Central Funds.
E Amount does not include the portfolio activity of any underlying Fidelity Central Funds.
F Investment income per share reflects a special dividend which amounted to $.02 per share. Excluding the special dividend, the ratio of net investment income (loss) to average net assets would have been .57%.
G Expense ratios reflect operating expenses of the class. Expenses before reductions do not reflect amounts reimbursed by the investment adviser or reductions from brokerage service arrangements or reductions from other expense offset arrangements and do not represent the amount paid by the class during periods when reimbursements or reductions occur. Expenses net of fee waivers reflect expenses after reimbursement by the investment adviser but prior to reductions from brokerage service arrangements or other expense offset arrangements. Expenses net of all reductions represent the net expenses paid by the class.
H Amount represents less than $.01 per share.
I Total distributions of $.20 per share is comprised of distributions from net investment income of $.105 and distributions from net realized gain of $.097 per share.
See accompanying notes which are an integral part of the financial statements.
Annual Report
Notes to Financial Statements
For the period ended December 31, 2011
1. Organization.
VIP International Capital Appreciation Portfolio (the Fund) is a fund of Variable Insurance Products Fund IV (the Trust) and is authorized to issue an unlimited number of shares. The Trust is registered under the Investment Company Act of 1940, as amended (the 1940 Act), as an open-end management investment company organized as a Massachusetts business trust. Shares of the Fund may only be purchased by insurance companies for the purpose of funding variable annuity or variable life insurance contracts. The Fund offers the following classes of shares: Initial Class shares, Service Class shares, Service Class 2 shares, Initial Class R shares, Service Class R shares, Service Class 2R shares, and Investor Class R shares. All classes have equal rights and voting privileges, except for matters affecting a single class. Investment income, realized and unrealized capital gains and losses, the common expenses of the Fund, and certain fund-level expense reductions, if any, are allocated on a pro-rata basis to each class based on the relative net assets of each class to the total net assets of the Fund. Each class differs with respect to transfer agent and distribution and service plan fees incurred. Certain expense reductions may also differ by class. The Fund's investments in emerging markets can be subject to social, economic, regulatory, and political uncertainties and can be extremely volatile.
2. Investments in Fidelity Central Funds.
The Fund invests in Fidelity Central Funds, which are open-end investment companies available only to other investment companies and accounts managed by Fidelity Management & Research Company (FMR) and its affiliates. The Fund's Schedule of Investments lists each of the Fidelity Central Funds held as of period end, if any, as an investment of the Fund, but do not include the underlying holdings of each Fidelity Central Fund. As an Investing Fund, the Fund indirectly bears its proportionate share of the expenses of the underlying Fidelity Central Funds.
The Money Market Central Funds seek preservation of capital and current income and are managed by Fidelity Investments Money Management, Inc. (FIMM), an affiliate of FMR.
A complete unaudited list of holdings for each Fidelity Central Fund is available upon request or at the Securities and Exchange Commission (the SEC) web site at www.sec.gov. In addition, the financial statements of the Fidelity Central Funds, which are not covered by the Fund's Report of Independent Registered Public Accounting Firm, are available on the SEC web site or upon request.
3. Significant Accounting Policies.
The financial statements have been prepared in conformity with accounting principles generally accepted in the United States of America (GAAP), which require management to make certain estimates and assumptions at the date of the financial statements. Actual results could differ from those estimates. Subsequent events, if any, through the date that the financial statements were issued have been evaluated in the preparation of the financial statements. The following summarizes the significant accounting policies of the Fund:
Security Valuation. Investments are valued as of 4:00 p.m. Eastern time on the last calendar day of the period. The Fund uses independent pricing services approved by the Board of Trustees to value its investments. When current market prices or quotations are not readily available or reliable, valuations may be determined in good faith in accordance with procedures adopted by the Board of Trustees. Factors used in determining value may include market or security specific events. The frequency with which these procedures are used cannot be predicted and they may be utilized to a significant extent. The value used for net asset value (NAV) calculation under these procedures may differ from published prices for the same securities.
The Fund categorizes the inputs to valuation techniques used to value its investments into a disclosure hierarchy consisting of three levels as shown below:
Level 1 - quoted prices in active markets for identical investments
Level 2 - other significant observable inputs (including quoted prices for similar investments, interest rates, prepayment speeds, etc.)
Level 3 - unobservable inputs (including the Fund's own assumptions based on the best information available)
Changes in valuation techniques may result in transfers in or out of an assigned level within the disclosure hierarchy. The aggregate value of investments by input level, as of December 31, 2011, is included at the end of the Fund's Schedule of Investments. Valuation techniques used to value the Fund's investments by major category are as follows:
Equity securities, including restricted securities, for which market quotations are readily available, are valued at the last reported sale price or official closing price as reported by an independent pricing service on the primary market or exchange on which they are traded and are categorized as Level 1 in the hierarchy. In the event there were no sales during the day or closing prices are not available, securities are valued at the last quoted bid price or may be valued using the last available price and are generally categorized as Level 2 in the hierarchy. For foreign equity securities, when significant market or security specific events arise, comparisons to the valuation of American Depositary Receipts (ADRs), futures contracts, Exchange-traded funds (ETFs) and certain indexes as well as quoted prices for similar securities are used and are categorized as Level 2 in the hierarchy in these
Annual Report
Notes to Financial Statements - continued
3. Significant Accounting Policies - continued
Security Valuation - continued
circumstances. Utilizing these techniques may result in transfers between Level 1 and Level 2. For restricted equity securities and private placements where observable inputs are limited, assumptions about market activity and risk are used and are categorized as Level 3 in the hierarchy.
Investments in open-end mutual funds, including the Fidelity Central Funds, are valued at their closing net asset value each business day and are categorized as Level 1 in the hierarchy.
New Accounting Pronouncements. In May 2011, the Financial Accounting Standards Board issued Accounting Standard Update No. 2011-04, Fair Value Measurement (Topic 820) - Amendments to Achieve Common Fair Value Measurement and Disclosure Requirements in U.S. GAAP and IFRSs. The update is effective during interim and annual periods beginning after December 15, 2011, and will result in additional disclosure for transfers between levels as well as expanded disclosure for securities categorized as Level 3 under the fair value hierarchy.
In December 2011, the Financial Accounting Standards Board issued Accounting Standard Update No. 2011-11, Disclosures about Offsetting Assets and Liabilities. The update creates new disclosure requirements requiring entities to disclose both gross and net information for derivatives and other financial instruments that are either offset in the Statement of Assets and Liabilities or subject to an enforceable master netting arrangement or similar agreement. The disclosure requirements are effective for annual reporting periods beginning on or after January 1, 2013. Management is currently evaluating the impact of the update's adoption on the Fund's financial statement disclosures.
Foreign Currency. The Fund may use foreign currency contracts to facilitate transactions in foreign-denominated securities. Gains and losses from these transactions may arise from changes in the value of the foreign currency or if the counterparties do not perform under the contracts' terms.
Foreign-denominated assets, including investment securities, and liabilities are translated into U.S. dollars at the exchange rate at period end. Purchases and sales of investment securities, income and dividends received and expenses denominated in foreign currencies are translated into U.S. dollars at the exchange rate in effect on the transaction date.
The effects of exchange rate fluctuations on investments are included with the net realized and unrealized gain (loss) on investment securities. Other foreign currency transactions resulting in realized and unrealized gain (loss) are disclosed separately.
Investment Transactions and Income. For financial reporting purposes, the Fund's investment holdings and NAV include trades executed through the end of the last business day of the period. The NAV per share for processing shareholder transactions is calculated as of the close of business of the New York Stock Exchange (NYSE), normally 4:00 p.m. Eastern time and includes trades executed through the end of the prior business day. Gains and losses on securities sold are determined on the basis of identified cost. Dividend income is recorded on the ex-dividend date, except for certain dividends from foreign securities where the ex-dividend date may have passed, which are recorded as soon as the Fund is informed of the ex-dividend date. Non-cash dividends included in dividend income, if any, are recorded at the fair market value of the securities received. Distributions received on securities that represent a return of capital or capital gain are recorded as a reduction of cost of investments and/or as a realized gain. The Fund estimates the components of distributions received that may be considered return of capital distributions or capital gain distributions. Interest income and distributions from the Fidelity Central Funds are accrued as earned. Interest income includes coupon interest and amortization of premium and accretion of discount on debt securities. Investment income is recorded net of foreign taxes withheld where recovery of such taxes is uncertain.
Expenses. Expenses directly attributable to a fund are charged to that fund. Expenses attributable to more than one fund are allocated among the respective funds on the basis of relative net assets or other appropriate methods. Expense estimates are accrued in the period to which they relate and adjustments are made when actual amounts are known.
Income Tax Information and Distributions to Shareholders. Each year, the Fund intends to qualify as a regulated investment company, including distributing substantially all of its taxable income and realized gains under Subchapter M of the Internal Revenue Code. As a result, no provision for income taxes is required. As of December 31, 2011, the Fund did not have any unrecognized tax benefits in the financial statements; nor is the Fund aware of any tax positions for which it is reasonably possible that the total amounts of unrecognized tax benefits will significantly change in the next twelve months. The Fund files a U.S. federal tax return, in addition to state and local tax returns as required. A fund's tax returns are subject to examination by the Internal Revenue Service (IRS) for a period of three fiscal years. State and local tax returns may be subject to examination for an additional fiscal year depending on the jurisdiction. Foreign taxes are provided for based on the Fund's understanding of the tax rules and rates that exist in the foreign markets in which it invests.
Distributions are declared and recorded on the ex-dividend date. Income dividends and capital gain distributions are declared separately for each class. Income and capital gain distributions are determined in accordance with income tax regulations, which may differ from GAAP.
Capital accounts within the financial statements are adjusted for permanent book-tax differences. These adjustments have no impact on net assets or the results of operations. Temporary book-tax differences will reverse in a subsequent period.
Annual Report
3. Significant Accounting Policies - continued
Income Tax Information and Distributions to Shareholders - continued
Book-tax differences are primarily due to foreign currency transactions, certain foreign taxes, passive foreign investment companies (PFIC), equity-debt classifications, capital loss carryforwards and losses deferred due to wash sales and excise tax regulations.
The federal tax cost of investment securities and unrealized appreciation (depreciation) as of period end were as follows:
Gross unrealized appreciation | $ 3,266,996 |
Gross unrealized depreciation | (3,038,967) |
Net unrealized appreciation (depreciation) on securities and other investments | $ 228,029 |
| |
Tax Cost | $ 37,069,341 |
The tax-based components of distributable earnings as of period end were as follows:
Capital loss carryforward | $ (22,476,211) |
Net unrealized appreciation (depreciation) | $ 215,430 |
Capital loss carryforwards are only available to offset future capital gains of the Fund to the extent provided by regulations and may be limited. Under the Regulated Investment Company Modernization Act of 2010 (the Act), the Fund is permitted to carry forward capital losses incurred in taxable years beginning after December 22, 2010 for an unlimited period and such capital losses are required to be used prior to any losses that expire. Capital loss carryforwards were as follows:
Fiscal year of expiration | |
2016 | $ (17,897,996) |
2017 | (4,429,182) |
Total with expiration | (22,327,178) |
No expiration | |
Short-term | (149,033) |
Total capital loss carryforward | $ (22,476,211) |
The tax character of distributions paid was as follows:
| December 31, 2011 | December 31, 2010 |
Ordinary Income | $ 413,588 | $ 978,239 |
Trading (Redemption) Fees. Initial Class R shares, Service Class R shares, Service Class 2R shares and Investor Class R shares held by investors less than 60 days are subject to a redemption fee equal to 1% of the net asset value of shares redeemed. All redemption fees, which reduce the proceeds of the shareholder redemption, are retained by the Fund and accounted for as an addition to paid in capital.
4. Operating Policies.
Delayed Delivery Transactions and When-Issued Securities. During the period, the Fund transacted in securities on a delayed delivery or when-issued basis. Payment and delivery may take place after the customary settlement period for that security. The price of the underlying securities and the date when the securities will be delivered and paid for are fixed at the time the transaction is negotiated. During the time a delayed delivery sell is outstanding, the contract is marked-to-market daily and equivalent deliverable securities are held for the transaction. The Fund may receive compensation for interest forgone in the purchase of a delayed delivery or when-issued security. With respect to purchase commitments, the Fund identifies securities as segregated in its records with a value at least equal to the amount of the commitment. Losses may arise due to changes in the value of the underlying securities or if the counterparty does not perform under the contract's terms, or if the issuer does not issue the securities due to political, economic, or other factors.
5. Purchases and Sales of Investments.
Purchases and sales of securities, other than short-term securities, aggregated $98,601,262 and $102,030,084, respectively.
Annual Report
Notes to Financial Statements - continued
6. Fees and Other Transactions with Affiliates.
Management Fee. FMR and its affiliates provide the Fund with investment management related services for which the Fund pays a monthly management fee. The management fee is the sum of an individual fund fee rate that is based on an annual rate of .45% of the Fund's average net assets and an annualized group fee rate that averaged .26% during the period. The group fee rate is based upon the average net assets of all the mutual funds advised by FMR. The group fee rate decreases as assets under management increase and increases as assets under management decrease. For the period, the total annual management fee rate was .71% of the Fund's average net assets.
Distribution and Service Plan Fees. In accordance with Rule 12b-1 of the 1940 Act, the Fund has adopted separate 12b-1 Plans for each Service Class of shares. Each Service Class pays Fidelity Distributors Corporation (FDC), an affiliate of FMR, a service fee. For the period, the service fee is based on an annual rate of .10% of Service Class' and Service Class R's average net assets and .25% of Service Class 2's and Service Class 2R's average net assets.
For the period, total fees, all of which were re-allowed to insurance companies for the distribution of shares and providing shareholder support services were as follows:
Service Class | $ 87 |
Service Class 2 | 279 |
Service Class R | 87 |
Service Class 2 R | 241 |
| $ 694 |
Transfer Agent Fees. Fidelity Investments Institutional Operations Company, Inc. (FIIOC), an affiliate of FMR, is the Fund's transfer, dividend disbursing, and shareholder servicing agent. FIIOC receives an asset-based fee with respect to each class. Each class (with the exception of Investor Class) pays a transfer agent fee, excluding out of pocket expenses, equal to an annual rate of .07% of average net assets. Investor Class pays a monthly asset-based transfer agent fee of .15% of average net assets. In addition, FIIOC receives an asset-based fee of .0045% of average net assets for typesetting, printing and mailing of shareholder reports, except proxy statements. FIIOC voluntarily agreed to waive this fee for the period August 1, 2011 through December 31, 2011 (see Expense Reductions note). For the period, transfer agent fees for each class, including printing and out of pocket expenses, were as follows:
Initial Class | $ 479 |
Service Class | 81 |
Service Class 2 | 104 |
Initial Class R | 12,103 |
Service Class R | 81 |
Service Class 2R | 91 |
Investor Class R | 45,949 |
| $ 58,888 |
Accounting and Security Lending Fees. Fidelity Service Company, Inc. (FSC), an affiliate of FMR, maintains the Fund's accounting records. The accounting fee is based on the level of average net assets for the month. Under a separate contract, FSC administers the security lending program. The security lending fee is based on the number and duration of lending transactions.
Brokerage Commissions. The Fund placed a portion of its portfolio transactions with brokerage firms which are affiliates of the investment adviser. The commissions paid to these affiliated firms were $873 for the period.
7. Committed Line of Credit.
The Fund participates with other funds managed by FMR or an affiliate in a $4.0 billion credit facility (the "line of credit") to be utilized for temporary or emergency purposes to fund shareholder redemptions or for other short-term liquidity purposes. The Fund has agreed to pay commitment fees on its pro-rata portion of the line of credit, which amounted to $135 and is reflected in Miscellaneous expenses on the Statement of Operations. During the period, there were no borrowings on this line of credit.
Annual Report
8. Security Lending.
The Fund lends portfolio securities through a lending agent from time to time in order to earn additional income. For equity securities, a lending agent is used and may loan securities to certain qualified borrowers, including Fidelity Capital Markets (FCM), a broker-dealer affiliated with the Fund. On the settlement date of the loan, the Fund receives collateral (in the form of U.S. Treasury obligations, letters of credit and/or cash) against the loaned securities and maintains collateral in an amount not less than 100% of the market value of the loaned securities during the period of the loan. The market value of the loaned securities is determined at the close of business of the Fund and any additional required collateral is delivered to the Fund on the next business day. If the borrower defaults on its obligation to return the securities loaned because of insolvency or other reasons, a fund could experience delays and costs in recovering the securities loaned or in gaining access to the collateral. Any cash collateral received is invested in the Fidelity Securities Lending Cash Central Fund. The value of loaned securities and cash collateral at period end are disclosed on the Fund's Statement of Assets and Liabilities. Security lending income represents the income earned on investing cash collateral, less rebates paid to borrowers and any lending agent fees associated with the loan, plus any premium payments received for lending certain types of securities. Security lending income is presented in the Statement of Operations as a component of income from Fidelity Central Funds. Total security lending income during the period amounted to $15,048. During the period, there were no securities loaned to FCM.
9. Expense Reductions.
In addition to FIIOC waiving a portion of its transfer agent fees, FMR voluntarily agreed to reimburse each class to the extent annual operating expenses exceeded certain levels of average net assets as noted in the table below. Some expenses, for example interest expense, including commitment fees, are excluded from this reimbursement.
Expenses were reimbursed and/or waived for the following classes during the period:
| Expense
Limitations | Reimbursement/Waiver |
| | |
Initial Class | 1.10% | $ 1,320 |
Service Class | 1.20% | 193 |
Service Class 2 | 1.35% | 257 |
Initial Class R | 1.10% | 28,643 |
Service Class R | 1.20% | 192 |
Service Class 2R | 1.35% | 216 |
Investor Class R | 1.18% | 59,065 |
| | $ 89,886 |
Many of the brokers with whom FMR places trades on behalf of the Fund provided services to the Fund in addition to trade execution. These services included payments of certain expenses on behalf of the Fund totaling $26,946 for the period.
10. Distributions to Shareholders.
Distributions to shareholders of each class were as follows:
Years ended December 31, | 2011 | 2010 |
From net investment income | | |
Initial Class | $ 5,745 | $ 7,768 |
Service Class | 659 | 961 |
Service Class 2 | 1,393 | 434 |
Initial Class R | 106,074 | 168,615 |
Service Class R | 659 | 961 |
Service Class 2R | 576 | 883 |
Investor Class R | 252,140 | 315,206 |
Total | $ 367,246 | $ 494,828 |
From net realized gain | | |
Initial Class | $ 710 | $ 7,019 |
Service Class | 103 | 1,064 |
Service Class 2 | 118 | 542 |
Initial Class R | 15,106 | 168,298 |
Service Class R | 103 | 1,064 |
Service Class 2R | 112 | 1,291 |
Investor Class R | 30,090 | 304,133 |
Total | $ 46,342 | $ 483,411 |
Annual Report
Notes to Financial Statements - continued
11. Share Transactions.
Transactions for each class of shares were as follows:
| Shares | Dollars |
Years ended December 31, | 2011 | 2010 | 2011 | 2010 |
Initial Class | | | | |
Shares sold | 9,948 | 25,624 | $ 92,977 | $ 225,829 |
Reinvestment of distributions | 772 | 1,589 | 6,455 | 14,787 |
Shares redeemed | (25,233) | (26,957) | (229,878) | (240,709) |
Net increase (decrease) | (14,513) | 256 | $ (130,446) | $ (93) |
Service Class | | | | |
Reinvestment of distributions | 91 | 220 | 762 | 2,025 |
Shares redeemed | (1,482) | (3,601) | (14,607) | (31,344) |
Net increase (decrease) | (1,391) | (3,381) | $ (13,845) | $ (29,319) |
Service Class 2 | | | | |
Shares sold | 14,513 | 6,746 | $ 124,622 | $ 65,263 |
Reinvestment of distributions | 182 | 105 | 1,511 | 976 |
Shares redeemed | (6,711) | (44,506) | (63,592) | (374,788) |
Net increase (decrease) | 7,984 | (37,655) | $ 62,541 | $ (308,549) |
Initial Class R | | | | |
Shares sold | 232,892 | 440,907 | $ 2,111,957 | $ 3,898,339 |
Reinvestment of distributions | 14,449 | 36,492 | 121,180 | 336,913 |
Shares redeemed | (565,660) | (900,018) | (5,402,699) | (7,801,721) |
Net increase (decrease) | (318,319) | (422,619) | $ (3,169,562) | $ (3,566,469) |
Service Class R | | | | |
Reinvestment of distributions | 91 | 220 | 762 | 2,025 |
Shares redeemed | (1,482) | (3,601) | (14,607) | (31,344) |
Net increase (decrease) | (1,391) | (3,381) | $ (13,845) | $ (29,319) |
Service Class 2R | | | | |
Reinvestment of distributions | 82 | 239 | 688 | 2,174 |
Shares redeemed | (1,621) | (7,096) | (15,942) | (61,060) |
Net increase (decrease) | (1,539) | (6,857) | $ (15,254) | $ (58,886) |
Investor Class R | | | | |
Shares sold | 671,787 | 675,944 | $ 6,287,236 | $ 6,013,493 |
Reinvestment of distributions | 33,954 | 67,265 | 282,230 | 619,339 |
Shares redeemed | (707,406) | (958,233) | (6,706,328) | (8,174,476) |
Net increase (decrease) | (1,665) | (215,024) | $ (136,862) | $ (1,541,644) |
12. Other.
The Fund's organizational documents provide former and current trustees and officers with a limited indemnification against liabilities arising in connection with the performance of their duties to the Fund. In the normal course of business, the Fund may also enter into contracts that provide general indemnifications. The Fund's maximum exposure under these arrangements is unknown as this would be dependent on future claims that may be made against the Fund. The risk of material loss from such claims is considered remote.
At the end of the period, FMR or its affiliates were the owners of record of 98% of the total outstanding shares of the Fund.
Annual Report
Report of Independent Registered Public Accounting Firm
To the Trustees of Variable Insurance Products Fund IV and the Shareholders of VIP International Capital Appreciation Portfolio:
In our opinion, the accompanying statement of assets and liabilities, including the schedule of investments, and the related statements of operations and of changes in net assets and the financial highlights present fairly, in all material respects, the financial position of VIP International Capital Appreciation Portfolio (a fund of Variable Insurance Products Fund IV) at December 31, 2011, the results of its operations for the year then ended, the changes in its net assets for each of the two years in the period then ended and the financial highlights for each of the five years in the period then ended, in conformity with accounting principles generally accepted in the United States of America. These financial statements and financial highlights (hereafter referred to as "financial statements") are the responsibility of the VIP International Capital Appreciation Portfolio's management. Our responsibility is to express an opinion on these financial statements based on our audits. We conducted our audits of these financial statements in accordance with the standards of the Public Company Accounting Oversight Board (United States). Those standards require that we plan and perform the audit to obtain reasonable assurance about whether the financial statements are free of material misstatement. An audit includes examining, on a test basis, evidence supporting the amounts and disclosures in the financial statements, assessing the accounting principles used and significant estimates made by management, and evaluating the overall financial statement presentation. We believe that our audits, which included confirmation of securities at December 31, 2011 by correspondence with the custodian and brokers, provide a reasonable basis for our opinion.
/s/ PricewaterhouseCoopers LLP
PricewaterhouseCoopers LLP
Boston, Massachusetts
February 16, 2012
Annual Report
The Trustees, Members of the Advisory Board, and executive officers of the trust and fund, as applicable, are listed below. The Board of Trustees governs the fund and is responsible for protecting the interests of shareholders. The Trustees are experienced executives who meet periodically throughout the year to oversee the fund's activities, review contractual arrangements with companies that provide services to the fund, oversee management of the risks associated with such activities and contractual arrangements, and review the fund's performance. Except for James C. Curvey, each of the Trustees oversees 226 funds advised by FMR or an affiliate. Mr. Curvey oversees 429 funds advised by FMR or an affiliate.
The Trustees hold office without limit in time except that (a) any Trustee may resign; (b) any Trustee may be removed by written instrument, signed by at least two-thirds of the number of Trustees prior to such removal; (c) any Trustee who requests to be retired or who has become incapacitated by illness or injury may be retired by written instrument signed by a majority of the other Trustees; and (d) any Trustee may be removed at any special meeting of shareholders by a two-thirds vote of the outstanding voting securities of the trust. Each Trustee who is not an interested person (as defined in the 1940 Act) (Independent Trustee), shall retire not later than the last day of the calendar year in which his or her 75th birthday occurs. The Independent Trustees may waive this mandatory retirement age policy with respect to individual Trustees. The executive officers and Advisory Board Members hold office without limit in time, except that any officer and Advisory Board Member may resign or may be removed by a vote of a majority of the Trustees at any regular meeting or any special meeting of the Trustees. Except as indicated, each individual has held the office shown or other offices in the same company for the past five years.
Experience, Skills, Attributes, and Qualifications of the Fund's Trustees. The Governance and Nominating Committee has adopted a statement of policy that describes the experience, qualifications, attributes, and skills that are necessary and desirable for potential Independent Trustee candidates (Statement of Policy). The Board believes that each Trustee satisfied at the time he or she was initially elected or appointed a Trustee, and continues to satisfy, the standards contemplated by the Statement of Policy. The Governance and Nominating Committee also engages professional search firms to help identify potential Independent Trustee candidates who have the experience, qualifications, attributes, and skills consistent with the Statement of Policy. From time to time, additional criteria based on the composition and skills of the current Independent Trustees, as well as experience or skills that may be appropriate in light of future changes to board composition, business conditions, and regulatory or other developments, have also been considered by the professional search firms and the Governance and Nominating Committee. In addition, the Board takes into account the Trustees' commitment and participation in Board and committee meetings, as well as their leadership of standing and ad hoc committees throughout their tenure.
In determining that a particular Trustee was and continues to be qualified to serve as a Trustee, the Board has considered a variety of criteria, none of which, in isolation, was controlling. The Board believes that, collectively, the Trustees have balanced and diverse experience, qualifications, attributes, and skills, which allow the Board to operate effectively in governing the fund and protecting the interests of shareholders. Information about the specific experience, skills, attributes, and qualifications of each Trustee, which in each case led to the Board's conclusion that the Trustee should serve (or continue to serve) as a trustee of the fund, is provided below.
Board Structure and Oversight Function. James C. Curvey is an interested person (as defined in the 1940 Act) and currently serves as Acting Chairman. The Trustees have determined that an interested Chairman is appropriate and benefits shareholders because an interested Chairman has a personal and professional stake in the quality and continuity of services provided to the fund. Independent Trustees exercise their informed business judgment to appoint an individual of their choosing to serve as Chairman, regardless of whether the Trustee happens to be independent or a member of management. The Independent Trustees have determined that they can act independently and effectively without having an Independent Trustee serve as Chairman and that a key structural component for assuring that they are in a position to do so is for the Independent Trustees to constitute a substantial majority for the Board. The Independent Trustees also regularly meet in executive session. Ned C. Lautenbach serves as Chairman of the Independent Trustees and as such (i) acts as a liaison between the Independent Trustees and management with respect to matters important to the Independent Trustees and (ii) with management prepares agendas for Board meetings.
Fidelity funds are overseen by different Boards of Trustees. The fund's Board oversees Fidelity's equity and high income funds and another Board oversees Fidelity's investment-grade bond, money market, and asset allocation funds. The asset allocation funds may invest in Fidelity funds overseen by the fund's Board. The use of separate Boards, each with its own committee structure, allows the Trustees of each group of Fidelity funds to focus on the unique issues of the funds they oversee, including common research, investment, and operational issues. On occasion, the separate Boards establish joint committees to address issues of overlapping consequences for the Fidelity funds overseen by each Board.
The Trustees operate using a system of committees to facilitate the timely and efficient consideration of all matters of importance to the Trustees, the fund, and fund shareholders and to facilitate compliance with legal and regulatory requirements and oversight of the fund's activities and associated risks. The Board, acting through its committees, has charged FMR and its affiliates with (i) identifying events or circumstances the occurrence of which could have demonstrably adverse effects on the fund's business and/or reputation; (ii) implementing processes and controls to lessen the possibility that such events or circumstances occur or to mitigate the effects of such events or circumstances if they do occur; and (iii) creating and maintaining a system designed to evaluate continuously business and market conditions in order to facilitate the identification and implementation processes described in (i) and (ii) above. Because the day-to-day operations and activities of the fund are carried out by or through FMR, its affiliates and other service providers, the fund's exposure to risks is mitigated but not eliminated by the processes overseen by the Trustees. While each of the Board's committees has responsibility for overseeing different aspects of the fund's activities, oversight is exercised primarily through the Operations, Audit, and Compliance Committees. In addition, the Independent Trustees have worked with FMR to enhance the Board's oversight of investment and financial risks, legal and regulatory risks, technology risks, and operational risks, including the development of additional risk reporting to the Board. For example, a working group comprised of Independent Trustees and FMR has worked and continues to work to review the Fidelity funds' valuation-related activities, reporting and risk management. Appropriate personnel, including but not limited to the fund's Chief Compliance Officer (CCO), FMR's internal auditor, the independent accountants, the fund's Treasurer and portfolio management personnel, make periodic reports to the Board's committees, as appropriate, including an annual review of FMR's risk management program for the Fidelity funds. The responsibilities of each standing committee, including their oversight responsibilities, are described further under "Standing Committees of the Fund's Trustees."
Annual Report
The fund's Statement of Additional Information (SAI) includes more information about the Trustees. To request a free copy, call Fidelity at 1-877-208-0098.
Interested Trustees*:
Correspondence intended for each Trustee who is an interested person may be sent to Fidelity Investments, 82 Devonshire Street, Boston, Massachusetts 02109.
Name, Age; Principal Occupations and Other Relevant Experience+ |
James C. Curvey (76) |
| Year of Election or Appointment: 2007 Mr. Curvey is Trustee and Acting Chairman of the Board of Trustees of certain Trusts. Mr. Curvey also serves as Trustee (2007-present) of other investment companies advised by FMR. Mr. Curvey is a Director of Fidelity Investments Money Management, Inc. (2009-present), Director of Fidelity Research & Analysis Co. (2009-present) and Director of FMR and FMR Co., Inc. (2007-present). Mr. Curvey is also Vice Chairman (2007-present) and Director of FMR LLC. In addition, Mr. Curvey serves as an Overseer for the Boston Symphony Orchestra and a member of the Trustees of Villanova University. Previously, Mr. Curvey was the Vice Chairman (2006-2007) and Director (2000-2007) of FMR Corp. |
Ronald P. O'Hanley (54) |
| Year of Election or Appointment: 2011 Mr. O'Hanley is Director of FMR Co., Inc. (2010-present), Director of Fidelity Investments Money Management, Inc. (2010-present), Director of Fidelity Research & Analysis Company (2010-present), President of Fidelity Asset Management and Corporate Services and a member of Fidelity's Executive Committee (2010-present). Previously, Mr. O'Hanley served as President and Chief Executive Officer of BNY Mellon Asset Management (2007-2010). Mr. O'Hanley also served as Vice Chairman of Bank New York Mellon Corp. and a member of that firm's Executive Committee. Prior to the 2007 merger of The Bank of New York and Mellon Financial Corporation, he was Vice Chairman of Mellon Financial Corporation and President and Chief Executive Officer of Mellon Asset Management. He joined Mellon in February 1997. Mr. O'Hanley currently serves as Chairman of the Boston Public Library Foundation Board of Directors and sits on the Board of Directors of Beth Israel Deaconess Medical Center, the Board of Trustees of the Marine Biological Laboratory and the Advisory Board of the Maxwell School of Citizenship and Public Administration at Syracuse University. Mr. O'Hanley also chairs the Council on Asset Management for the Financial Services Roundtable and is a member of the Board of Directors of Institutional Investor's U.S. Institute. |
* Trustees have been determined to be "Interested Trustees" by virtue of, among other things, their affiliation with the trust or various entities under common control with FMR.
+ The information above includes each Trustee's principal occupation during the last five years and other information relating to the experience, attributes, and skills relevant to each Trustee's qualifications to serve as a Trustee, which led to the conclusion that each Trustee should serve as a Trustee for the fund.
Independent Trustees:
Correspondence intended for each Independent Trustee (that is, the Trustees other than the Interested Trustees) may be sent to Fidelity Investments, P.O. Box 55235, Boston, Massachusetts 02205-5235.
Name, Age; Principal Occupations and Other Relevant Experience+ |
Dennis J. Dirks (63) |
| Year of Election or Appointment: 2005 Prior to his retirement in May 2003, Mr. Dirks was Chief Operating Officer and a member of the Board of The Depository Trust & Clearing Corporation (DTCC). He also served as President, Chief Operating Officer, and Board member of The Depository Trust Company (DTC) and President and Board member of the National Securities Clearing Corporation (NSCC). In addition, Mr. Dirks served as Chief Executive Officer and Board member of the Government Securities Clearing Corporation, Chief Executive Officer and Board member of the Mortgage-Backed Securities Clearing Corporation, as a Trustee and a member of the Finance Committee of Manhattan College (2005-2008), and as a Trustee and a member of the Finance Committee of AHRC of Nassau County (2006-2008). Mr. Dirks is a member of the Independent Directors Council (IDC) Governing Council (2010-present) and Board of Directors for The Brookville Center for Children's Services, Inc. (2009-present). |
Alan J. Lacy (58) |
| Year of Election or Appointment: 2008 Mr. Lacy serves as Senior Adviser (2007-present) of Oak Hill Capital Partners, L.P. (private equity). Mr. Lacy also served as Chief Executive Officer (2000-2005) and Vice Chairman (2005-2006) of Sears Holdings Corporation and Sears, Roebuck and Co. (retail). In addition, Mr. Lacy serves as a member of the Board of Directors of Dave & Buster's, Inc. (restaurant and entertainment complexes, 2010-present), The Hillman Companies, Inc. (hardware wholesalers, 2010-present), and Bristol-Myers Squibb Company (global pharmaceuticals, 2007-present). Mr. Lacy is a member of the Board of Trustees of The National Parks Conservation Association (2006-present). Previously, Mr. Lacy served as Chairman of the Board of Trustees of the National Parks Conservation Association (2008-2011) and as a member of the Board of Directors for the Western Union Company (global money transfer, 2006-2011). |
Ned C. Lautenbach (67) |
| Year of Election or Appointment: 2000 Mr. Lautenbach is Chairman of the Independent Trustees of the Equity and High Income Funds (2006-present). Mr. Lautenbach currently serves as the Lead Director of the Eaton Corporation Board of Directors (diversified industrial, 1997-present). Mr. Lautenbach is also a member of the Board of Directors of the Philharmonic Center for the Arts in Naples, Florida (1999-present); a member of the Board of Trustees of Fairfield University (2005-present); and a member of the Council on Foreign Relations (1994-present). Previously, Mr. Lautenbach was a Partner/Advisory Partner at Clayton, Dubilier & Rice, LLC (private equity investment, 1998-2010), as well as a Director of Sony Corporation (2006-2007). |
Joseph Mauriello (67) |
| Year of Election or Appointment: 2008 Prior to his retirement in January 2006, Mr. Mauriello served in numerous senior management positions including Deputy Chairman and Chief Operating Officer (2004-2005), and Vice Chairman of Financial Services (2002-2004) of KPMG LLP US (professional services, 1965-2005). Mr. Mauriello currently serves as a member of the Board of Directors of XL Group plc. (global insurance and re-insurance, 2006-present) and of Arcadia Resources Inc. (health care services and products, 2007-present). Previously, Mr. Mauriello served as a Director of the Hamilton Funds of the Bank of New York (2006-2007). |
Robert W. Selander (61) |
| Year of Election or Appointment: 2011 Previously, Mr. Selander served as a Member of the Advisory Board of Fidelity's Equity and High Income Funds (2011), Executive Vice Chairman (2010), Chief Executive Officer (2009-2010), and President and Chief Executive Officer (1997-2009) of Mastercard, Inc. |
Cornelia M. Small (67) |
| Year of Election or Appointment: 2005 Ms. Small is a member of the Board of Directors of the Teagle Foundation (2009-present). Ms. Small is also a member of the Investment Committee, and Chair (2008-present) and a member of the Board of Trustees of Smith College. In addition, Ms. Small serves on the Investment Committee of the Berkshire Taconic Community Foundation (2008-present). Previously, Ms. Small served as Chairperson of the Investment Committee (2002-2008) of Smith College. In addition, Ms. Small served as Chief Investment Officer, Director of Global Equity Investments, and a member of the Board of Directors of Scudder, Stevens & Clark and Scudder Kemper Investments. |
William S. Stavropoulos (72) |
| Year of Election or Appointment: 2001 Mr. Stavropoulos is Vice Chairman of the Independent Trustees of the Equity and High Income Funds (2006-present). Mr. Stavropoulos serves as President and Founder of the Michigan Baseball Foundation, the Great Lakes Loons (2007-present). Mr. Stavropoulos is Chairman Emeritus of the Board of Directors of The Dow Chemical Company, where he previously served in numerous senior management positions, including President, CEO (1995-2000; 2002-2004), Chairman of the Executive Committee (2000-2006), and as a member of the Board of Directors (1990-2006). Currently, Mr. Stavropoulos is Chairman of Univar (global distributor of commodity and specialty chemicals, 2010-present), a Director of Teradata Corporation (data warehousing and technology solutions, 2008-present), Chemical Financial Corporation, Maersk Inc. (industrial conglomerate), Tyco International, Inc. (multinational manufacturing and services, 2007-present), and a member of the Advisory Board for Metalmark Capital (private equity investment, 2005-present). Mr. Stavropoulos is a special advisor to Clayton, Dubilier & Rice, LLC (private equity investment). In addition, Mr. Stavropoulos is a member of the University of Notre Dame Advisory Council for the College of Science. |
David M. Thomas (62) |
| Year of Election or Appointment: 2008 Previously, Mr. Thomas served as Executive Chairman (2005-2006) and Chairman and Chief Executive Officer (2000-2005) of IMS Health, Inc. (pharmaceutical and healthcare information solutions). In addition, Mr. Thomas serves as a member of the Board of Directors of Fortune Brands, Inc. (consumer products), and Interpublic Group of Companies, Inc. (marketing communication, 2004-present). |
Michael E. Wiley (61) |
| Year of Election or Appointment: 2008 Mr. Wiley also serves as a Director of Asia Pacific Exploration Consolidated (international oil and gas exploration and production, 2008-present). Mr. Wiley serves as a Director of Tesoro Corporation (independent oil refiner and marketer, 2005-present), and a Director of Bill Barrett Corporation (exploration and production, 2005-present). In addition, Mr. Wiley also serves as a Director of Post Oak Bank (privately-held bank, 2004-present). Previously, Mr. Wiley served as a member of the Board of Trustees of the University of Tulsa (2000-2006; 2007-2010), as a Senior Energy Advisor of Katzenbach Partners, LLC (consulting, 2006-2007), as an Advisory Director of Riverstone Holdings (private investment), Chairman, President, and CEO of Baker Hughes, Inc. (oilfield services, 2000-2004), and as Director of Spinnaker Exploration Company (exploration and production, 2001-2005). |
+ The information above includes each Trustee's principal occupation during the last five years and other information relating to the experience, attributes, and skills relevant to each Trustee's qualifications to serve as a Trustee, which led to the conclusion that each Trustee should serve as a Trustee for the fund.
Advisory Board Members and Executive Officers:
Correspondence intended for each executive officer, Edward C. Johnson 3d, and Peter S. Lynch may be sent to Fidelity Investments, 82 Devonshire Street, Boston, Massachusetts 02109.
Name, Age; Principal Occupation |
Edward C. Johnson 3d (81) |
| Year of Election or Appointment: 2011 Member of the Advisory Board of Fidelity's Equity and High Income Funds. Mr. Johnson serves as Chief Executive Officer, Chairman, and a Director of FMR LLC, and also serves as Chairman and Director of FIL Limited. Previously, Mr. Johnson served as a Trustee and Chairman of the Board of certain Fidelity Trusts, Chairman and a Director of FMR, Chairman and a Director of FMR Co., Inc., and President of FMR LLC (2006-2007). |
Peter S. Lynch (67) |
| Year of Election or Appointment: 2003 Member of the Advisory Board of Fidelity's Equity and High Income Funds. Mr. Lynch is Vice Chairman and a Director of FMR and FMR Co., Inc. In addition, Mr. Lynch serves as a Trustee of Boston College and as the Chairman of the Inner-City Scholarship Fund. Previously, Mr. Lynch served on the Special Olympics International Board of Directors (1997-2006). |
Kenneth B. Robins (42) |
| Year of Election or Appointment: 2008 President and Treasurer of Fidelity's Equity and High Income Funds. Mr. Robins also serves as President and Treasurer (2010-present) and Assistant Treasurer (2009-present) of other Fidelity funds and is an employee of Fidelity Investments (2004-present). Previously, Mr. Robins served as Deputy Treasurer of the Fidelity funds (2005-2008) and Treasurer and Chief Financial Officer of The North Carolina Capital Management Trust: Cash and Term Portfolios (2006-2008). |
Bruce T. Herring (46) |
| Year of Election or Appointment: 2006 Vice President of certain Equity Funds. Mr. Herring also serves as President of Fidelity Research & Analysis Company (2010-present), Chief Investment Officer and Director of Fidelity Management & Research (U.K.) Inc. (2010-present) and Group Chief Investment Officer of FMR. Previously, Mr. Herring served as Vice President (2005-2006) and Senior Vice President (2006-2007) of Fidelity Management & Research Company, Vice President of FMR Co., Inc. (2001-2007) and as a portfolio manager for Fidelity U.S. Equity Funds. |
Brian B. Hogan (47) |
| Year of Election or Appointment: 2009 Vice President of Equity and High Income Funds. Mr. Hogan also serves as President of FMR's Equity Division (2009-present). Previously, Mr. Hogan served as Senior Vice President, Equity Research of FMR (2006-2009) and as a portfolio manager. |
Scott C. Goebel (43) |
| Year of Election or Appointment: 2008 Secretary and Chief Legal Officer (CLO) of the Fidelity funds. Mr. Goebel also serves as Secretary of Fidelity Investments Money Management, Inc. (FIMM) (2010-present) and Fidelity Research and Analysis Company (FRAC) (2010-present); Secretary and CLO of The North Carolina Capital Management Trust: Cash and Term Portfolios (2008-present); General Counsel, Secretary, and Senior Vice President of FMR (2008-present) and FMR Co., Inc. (2008-present); employed by FMR LLC or an affiliate (2001-present); Chief Legal Officer of Fidelity Management & Research (Hong Kong) Limited (2008-present) and Assistant Secretary of Fidelity Management & Research (Japan) Inc. (2008-present), and Fidelity Management & Research (U.K.) Inc. (2008-present). Previously, Mr. Goebel served as Assistant Secretary of FIMM (2008-2010), FRAC (2008-2010), and the Funds (2007-2008) and as Vice President and Secretary of Fidelity Distributors Corporation (FDC) (2005-2007). |
William C. Coffey (42) |
| Year of Election or Appointment: 2009 Assistant Secretary of Fidelity's Equity and High Income Funds. Mr. Coffey also serves as Senior Vice President and Deputy General Counsel of FMR LLC (2010-present), and is an employee of Fidelity Investments. Previously, Mr. Coffey served as Vice President and Associate General Counsel of FMR LLC (2005-2009). |
Holly C. Laurent (57) |
| Year of Election or Appointment: 2008 Anti-Money Laundering (AML) Officer of the Fidelity funds. Ms. Laurent also serves as AML Officer of The North Carolina Capital Management Trust: Cash and Term Portfolios (2008-present) and is an employee of Fidelity Investments. Previously, Ms. Laurent was Senior Vice President and Head of Legal for Fidelity Business Services India Pvt. Ltd. (2006-2008), and Senior Vice President, Deputy General Counsel and Group Head for FMR LLC (2005-2006). |
Christine Reynolds (53) |
| Year of Election or Appointment: 2008 Chief Financial Officer of the Fidelity funds. Ms. Reynolds became President of Fidelity Pricing and Cash Management Services (FPCMS) in August 2008. Ms. Reynolds served as Chief Operating Officer of FPCMS (2007-2008). Previously, Ms. Reynolds served as President, Treasurer, and Anti-Money Laundering officer of the Fidelity funds (2004-2007). |
Kenneth A. Rathgeber (64) |
| Year of Election or Appointment: 2004 Chief Compliance Officer of Fidelity's Equity and High Income Funds. Mr. Rathgeber is Chief Compliance Officer of Fidelity Management & Research (Hong Kong) Limited (2008-present), Fidelity Management & Research (Japan) Inc. (2008-present), FMR (2005-present), FMR Co., Inc. (2005-present), Fidelity Management & Research (U.K.) Inc. (2005-present), Fidelity Research & Analysis Company (2005-present), Fidelity Investments Money Management, Inc. (2005-present), Pyramis Global Advisors, LLC (2005-present), and Strategic Advisers, Inc. (2005-present). |
Jeffrey S. Christian (50) |
| Year of Election or Appointment: 2009 Deputy Treasurer of the Fidelity funds. Mr. Christian is an employee of Fidelity Investments. Previously, Mr. Christian served as Chief Financial Officer (2008-2009) of certain Fidelity funds and Senior Vice President of Fidelity Pricing and Cash Management Services (FPCMS) (2004-2009). |
Joseph F. Zambello (54) |
| Year of Election or Appointment: 2011 Deputy Treasurer of the Fidelity funds. Mr. Zambello is an employee of Fidelity Investments. Previously, Mr. Zambello served as Vice President of FMR's Program Management Group (2009-2011) and Vice President of the Transfer Agent Oversight Group (2005-2009). |
Adrien E. Deberghes (44) |
| Year of Election or Appointment: 2008 Deputy Treasurer of Fidelity's Equity and High Income Funds. Mr. Deberghes also serves as Vice President and Assistant Treasurer of Fidelity Rutland Square Trust II and Fidelity Commonwealth Trust II (2011-present), Assistant Treasurer of other Fidelity funds (2010-present), and is an employee of Fidelity Investments (2008-present). Previously, Mr. Deberghes served as Senior Vice President of Mutual Fund Administration at State Street Corporation (2007-2008), Senior Director of Mutual Fund Administration at Investors Bank & Trust (2005-2007), and Director of Finance for Dunkin' Brands (2000-2005). |
Stephanie J. Dorsey (42) |
| Year of Election or Appointment: 2010 Assistant Treasurer of Fidelity's Equity and High Income Funds. Ms. Dorsey also serves as Deputy Treasurer of other Fidelity funds (2008-present) and is an employee of Fidelity Investments (2008-present). Previously, Ms. Dorsey served as Treasurer (2004-2008) of the JPMorgan Mutual Funds and Vice President (2004-2008) of JPMorgan Chase Bank. |
John R. Hebble (53) |
| Year of Election or Appointment: 2009 Assistant Treasurer of Fidelity's Equity and High Income Funds. Mr. Hebble also serves as President (2011-present), Treasurer, and Chief Financial Officer of The North Carolina Capital Management Trust: Cash and Term Portfolios (2008-present), President and Treasurer of other Fidelity funds (2008-present) and is an employee of Fidelity Investments. |
Gary W. Ryan (53) |
| Year of Election or Appointment: 2005 Assistant Treasurer of the Fidelity funds. Mr. Ryan is an employee of Fidelity Investments. Previously, Mr. Ryan served as Vice President of Fund Reporting in Fidelity Pricing and Cash Management Services (FPCMS) (1999-2005). |
Jonathan Davis (43) |
| Year of Election or Appointment: 2010 Assistant Treasurer of the Fidelity funds. Mr. Davis is also Assistant Treasurer of Fidelity Rutland Square Trust II and Fidelity Commonwealth Trust II. Mr. Davis is an employee of Fidelity Investments. Previously, Mr. Davis served as Vice President and Associate General Counsel of FMR LLC (2003-2010). |
Annual Report
Initial Class designates 2% and 11%, Service Class designates 2% and 12%, and Service Class 2 designates 2% and 13% of the dividends distributed in February and December 2011 respectively, during the fiscal year as qualifying for the dividends-received deduction for corporate shareholders.
The percentage of dividends distributed during the fiscal year representing income derived from sources within, and taxes paid to, foreign countries or possessions of the United States are as follows:
| Pay Date | Income | Taxes |
Initial Class | 02/11/2011 | $0.010 | $0.000 |
Initial Class | 12/16/2011 | $0.094 | $0.009 |
Service Class | 02/11/2011 | $0.010 | $0.000 |
Service Class | 12/16/2011 | $0.084 | $0.009 |
Service Class 2 | 02/11/2011 | $0.010 | $0.000 |
Service Class 2 | 12/16/2011 | $0.080 | $0.009 |
Annual Report
Board Approval of Investment Advisory Contracts and Management Fees
VIP International Capital Appreciation Portfolio
Each year, the Board of Trustees, including the Independent Trustees (together, the Board), votes on the renewal of the management contract and sub-advisory agreements (together, the Advisory Contracts) for the fund. The Board, assisted by the advice of fund counsel and Independent Trustees' counsel, requests and considers a broad range of information relevant to the renewal of the Advisory Contracts throughout the year.
The Board meets regularly and considers at each of its meetings factors that are relevant to its annual consideration of the renewal of the fund's Advisory Contracts, including the services and support provided to the fund and its shareholders. The Board has established various standing committees, each composed of Independent Trustees with varying backgrounds, to which the Board has assigned specific subject matter responsibilities in order to enhance effective decision-making by the Board. The Board, acting directly and through its Committees, requests and receives information concerning the annual consideration of the renewal of the fund's Advisory Contracts. The Board also meets as needed to consider matters specifically related to the Board's annual consideration of the renewal of Advisory Contracts. Members of the Board may also meet with trustees of other Fidelity funds through ad hoc joint committees to discuss certain matters relevant to the Fidelity funds.
At its July 2011 meeting, the Board of Trustees, including the Independent Trustees, unanimously determined to renew the fund's Advisory Contracts. In reaching its determination, the Board considered all factors it believed relevant, including (i) the nature, extent, and quality of the services to be provided to the fund and its shareholders (including the investment performance of the fund); (ii) the competitiveness of the fund's management fee and total expense ratio; (iii) the total costs of the services to be provided by and the profits to be realized by Fidelity from its relationship with the fund; (iv) the extent to which economies of scale would be realized as the fund grows; and (v) whether fee levels reflect these economies of scale, if any, for the benefit of fund shareholders.
In considering whether to renew the Advisory Contracts for the fund, the Board reached a determination, with the assistance of fund counsel and Independent Trustees' counsel and through the exercise of its business judgment, that the renewal of the Advisory Contracts is in the best interests of the fund and its shareholders and that the compensation payable under the Advisory Contracts is fair and reasonable. The Board's decision to renew the Advisory Contracts was not based on any single factor, but rather was based on a comprehensive consideration of all the information provided to the Board at its meetings throughout the year. The Board, in reaching its determination to renew the Advisory Contracts, is aware that shareholders in the fund have a broad range of investment choices available to them, including a wide choice among mutual funds offered by Fidelity's competitors, and that the fund's shareholders, who have the opportunity to review and weigh the disclosure provided by the fund in its prospectus and other public disclosures, have chosen to invest in this fund, managed by Fidelity.
Nature, Extent, and Quality of Services Provided. The Board considered the staffing within the investment adviser, FMR, and the sub-advisers (together, the Investment Advisers), including the backgrounds of the fund's investment personnel and the fund's investment objective and discipline. The Independent Trustees also had discussions with senior management of Fidelity's investment operations and investment groups. The Board considered the structure of the portfolio manager compensation program and whether this structure provides appropriate incentives to act in the best interests of the fund.
Resources Dedicated to Investment Management and Support Services. The Board and the Fund Oversight and Research Committees reviewed the general qualifications and capabilities of the Investment Advisers' investment staff, including its size, education, experience, and resources, as well as the Investment Advisers' approach to recruiting, training, managing, and compensating investment personnel. The Board also noted that FMR has devoted increased resources to non-U.S. offices. The Board noted that Fidelity's analysts have extensive resources, tools and capabilities which allow them to conduct sophisticated quantitative and fundamental analysis, as well as credit analysis of issuers, counterparties and enhancers. The Board also believes that Fidelity's investment professionals have sufficient access to global information and data so as to provide competitive investment results over time, and that those professionals also have access to sophisticated tools which permit them to assess portfolio construction and risk and performance attribution characteristics continuously, as well as to transmit new information and research conclusions rapidly around the world. Additionally, in their deliberations, the Board considered the Investment Advisers' trading capabilities and resources which are an integral part of the investment management process.
Shareholder and Administrative Services. The Board considered (i) the nature, extent, quality, and cost of advisory, administrative, and shareholder services performed by the Investment Advisers and their affiliates under the Advisory Contracts and under separate agreements covering transfer agency, pricing and bookkeeping, and securities lending services for the fund; (ii) the nature and extent of the investment adviser's supervision of third party service providers, principally custodians and subcustodians; and (iii) the resources devoted to, and the record of compliance with, the fund's compliance policies and procedures. The Board also reviewed the allocation of fund brokerage, including allocations to brokers affiliated with the Investment Advisers, the use of brokerage commissions to pay fund expenses, and the use of "soft" commission dollars to pay for research services.
The Board noted that the growth of fund assets over time across the complex allows Fidelity to reinvest in the development of services designed to enhance the value or convenience of the Fidelity funds as investment vehicles. These services include 24-hour access to account information and market information through telephone representatives and over the Internet, investor education materials and asset allocation tools, and the expanded availability of Fidelity Investor Centers, with 35 new branches opening since 2010.
Annual Report
Board Approval of Investment Advisory Contracts and Management Fees - continued
Investment in a Large Fund Family. The Board considered the benefits to shareholders of investing in a Fidelity fund, including the benefits of investing in a fund that is part of a large family of funds offering a variety of investment disciplines and providing a large variety of mutual fund investor services. The Board noted that Fidelity had taken, or had made recommendations that resulted in the Fidelity funds taking, a number of actions over the previous year that benefited particular funds, including (i) continuing to dedicate additional resources to investment research and support of the senior management team that oversees asset management; (ii) rationalizing product lines through the mergers of six funds into other funds; (iii) continuing to migrate the Freedom Funds to dedicated lower cost underlying funds; (iv) obtaining shareholder approval to broaden the investment strategies for Fidelity Consumer Finance Portfolio, Fidelity Emerging Asia Fund, and Fidelity Environment and Alternative Energy Portfolio; (v) contractually agreeing to reduce the management fees and impose other expense limitations on Spartan 500 Index Fund and U.S. Bond Index Fund in connection with launching new institutional classes of these funds; (vi) changing the name, primary and supplemental benchmarks, and investment policies of Fidelity Global Strategies Fund to support the fund's flexible investment mandate and global orientation; and (vii) reducing the transfer agency account fee rates on certain accounts.
Investment Performance. The Board considered whether the fund has operated in accordance with its investment objective, as well as its record of compliance with its investment restrictions. It also reviewed the fund's absolute investment performance for each class, as well as the fund's relative investment performance for each class measured over multiple periods against (i) a broad-based securities market index, and (ii) a custom peer group of mutual funds deemed appropriate by Fidelity and reviewed by the Board. The following charts considered by the Board show, over the one-, three-, and five-year periods ended December 31, 2010, the cumulative total returns of Initial Class R and Service Class 2 R of the fund, the cumulative total returns of a broad-based securities market index ("benchmark"), and a range of cumulative total returns of a custom peer group of mutual funds defined by FMR based on categories assigned by Morningstar, Inc. The returns of Initial Class R and Service Class 2 R show the performance of the highest and lowest performing classes, respectively (based on five-year performance). The box within each chart shows the 25th percentile return (bottom of box) and the 75th percentile return (top of box) of the peer group. Returns shown above the box are in the first quartile and returns shown below the box are in the fourth quartile. The percentage beaten numbers noted below each chart correspond to the percentile box and represent the percentage of funds in the peer group whose performance was equal to or lower than that of the class indicated. The fund's custom peer group, defined by FMR, is a peer group that FMR believes provides a more meaningful performance comparison than the peer group assigned by Morningstar, Inc., which assigns mutual funds to categories based on their investment styles as measured by their underlying portfolio holdings.
VIP International Capital Appreciation Portfolio
The Board reviewed the fund's relative investment performance against its peer group and noted that the performance of Initial Class R of the fund was in the first quartile for the one- and three-year periods and the third quartile for the five-year period. The Board also noted that the investment performance of Initial Class R of the fund compared favorably to its benchmark for the one- and three-year periods, although the five-year cumulative total return of the fund was lower than its benchmark. The Board considered that the variations in performance among the fund's classes reflect the variations in class expenses, which result in lower performance for higher expense classes. The Board also reviewed the fund's performance since inception as well as performance in the current year.
Based on its review, the Board concluded that the nature, extent, and quality of services provided to the fund under the Advisory Contracts should benefit the fund's shareholders.
Annual Report
Competitiveness of Management Fee and Total Expense Ratio. The Board considered the fund's management fee and total expense ratio compared to "mapped groups" of competitive funds and classes. Fidelity creates "mapped groups" by combining similar Lipper investment objective categories that have comparable management fee characteristics. Combining Lipper investment objective categories aids the Board's management fee and total expense ratio comparisons by broadening the competitive group used for comparison and by reducing the number of universes to which various Fidelity funds are compared.
Management Fee. The Board considered two proprietary management fee comparisons for the 12-month periods shown in the chart below. The group of Lipper funds used by the Board for management fee comparisons is referred to below as the "Total Mapped Group." The Total Mapped Group comparison focuses on a fund's standing relative to the total universe of comparable funds available to investors in terms of gross management fees before expense reimbursements or caps. "TMG %" represents the percentage of funds in the Total Mapped Group that had management fees that were lower than the fund's. For example, a TMG % of 16% means that 84% of the funds in the Total Mapped Group had higher management fees than the fund. The "Asset-Size Peer Group" (ASPG) comparison focuses on a fund's standing relative to non-Fidelity funds similar in size to the fund within the Total Mapped Group. The ASPG represents at least 15% of the funds in the Total Mapped Group with comparable asset size and management fee characteristics, subject to a minimum of 50 funds (or all funds in the Total Mapped Group if fewer than 50). Additional information, such as the ASPG quartile in which the fund's management fee ranked, is also included in the chart and considered by the Board.
VIP International Capital Appreciation Portfolio
The Board noted that the fund's management fee ranked below the median of its Total Mapped Group and below the median of its ASPG for 2010.
Based on its review, the Board concluded that the fund's management fee is fair and reasonable in light of the services that the fund receives and the other factors considered.
Total Expense Ratio. In its review of each class's total expense ratio, the Board considered the fund's management fee as well as other fund or class expenses, as applicable, such as transfer agent fees, pricing and bookkeeping fees, fund-paid 12b-1 fees, and custodial, legal, and audit fees. The Board also noted the effects of any waivers and reimbursements on fees and expenses. As part of its review, the Board also considered the current and historical total expense ratios of each class of the fund compared to competitive fund median expenses. Each class of the fund is compared to those funds and classes in the Total Mapped Group (used by the Board for management fee comparisons) that have a similar sales load structure.
The Board noted that the total expense ratio of each of Initial Class and Initial Class R ranked equal to its competitive median for 2010 and the total expense ratio of each of Investor Class R, Service Class, Service Class 2, Service Class R, and Service Class 2 R ranked above its competitive median for 2010. The Board considered that various factors, including 12b-1 fees, positive or negative performance adjustments, and relatively higher other expenses in the case of small fund size, can affect total expense ratios. The Board also noted that Investor Class R has higher transfer agent fees than traditional variable annuity classes because it is designed for lower cost annuity products, where the majority of servicing costs are incorporated into the funds' total expense ratios rather than being paid at the annuity level. The Board noted that the fund offers multiple classes, each of which has a different 12b-1 fee structure, and that the multiple structures are intended to offer a range of pricing options for the intermediary market. The Board also noted that the total expense ratios of the classes vary primarily by the level of their 12b-1 fees, although differences in transfer agent fees may also cause expenses to vary from class to class.
Annual Report
Board Approval of Investment Advisory Contracts and Management Fees - continued
Fees Charged to Other Fidelity Clients. The Board also considered Fidelity fee structures and other information with respect to clients of FMR and its affiliates, such as other mutual funds advised or subadvised by FMR or its affiliates, pension plan clients, and other institutional clients. In March 2010, the Board created an ad hoc joint committee with the board of other Fidelity funds (the Committee) to review and compare Fidelity's institutional investment advisory business with its business of providing services to the Fidelity funds, including the differences in services provided, fees charged, and costs incurred, as well as competition in their respective marketplaces.
Based on its review of total expense ratios and fees charged to other Fidelity clients, the Board concluded that the total expense ratio of each class of the fund was reasonable, although in some cases above the median of the universe presented for comparison, in light of the services that the fund and its shareholders receive and the other factors considered, including the findings of the Committee.
Costs of the Services and Profitability. The Board considered the revenues earned and the expenses incurred by Fidelity in conducting the business of developing, marketing, distributing, managing, administering and servicing the fund and its shareholders. The Board also considered the level of Fidelity's profits in respect of all the Fidelity funds.
On an annual basis, FMR presents to the Board Fidelity's profitability for the fund. Fidelity calculates the profitability for each fund, as well as aggregate profitability for groups of Fidelity funds and all Fidelity funds, using a series of detailed revenue and cost allocation methodologies which originate with the books and records of Fidelity on which Fidelity's audited financial statements are based. The Audit Committee of the Board reviews any significant changes from the prior year's methodologies.
PricewaterhouseCoopers LLP (PwC), independent registered public accounting firm and auditor to Fidelity and certain Fidelity funds, has been engaged annually by the Board as part of the Board's assessment of Fidelity's profitability analysis. PwC's engagement includes the review and assessment of Fidelity's methodologies used in determining the revenues and expenses attributable to Fidelity's mutual fund business, and completion of agreed-upon procedures surrounding the mathematical accuracy of fund profitability and its conformity to allocation methodologies. After considering PwC's reports issued under the engagement and information provided by Fidelity, the Board concluded that while other allocation methods may also be reasonable, Fidelity's profitability methodologies are reasonable in all material respects.
The Board also reviewed Fidelity's non-fund businesses and fall-out benefits related to the mutual fund business as well as cases where Fidelity's affiliates may benefit from or be related to the fund's business.
The Board considered the costs of the services provided by and the profits realized by Fidelity in connection with the operation of the fund and was satisfied that the profitability was not excessive in the circumstances.
Economies of Scale. The Board considered whether there have been economies of scale in respect of the management of the Fidelity funds, whether the Fidelity funds (including the fund) have appropriately benefited from any such economies of scale, and whether there is potential for realization of any further economies of scale. The Board considered the extent to which the fund will benefit from economies of scale through increased services to the fund, through waivers or reimbursements, or through fee or expense reductions. The Board also noted that in 2009, it and the board of other Fidelity funds created an ad hoc committee (the Economies of Scale Committee) to analyze whether FMR attains economies of scale in respect of the management and servicing of the Fidelity funds, whether the Fidelity funds have appropriately benefited from such economies of scale, and whether there is potential for realization of any further economies of scale.
The Board recognized that the fund's management contract incorporates a "group fee" structure, which provides for lower group fee rates as total fund assets under FMR's management increase, and for higher group fee rates as total fund assets under FMR's management decrease. FMR calculates the group fee rates based on a tiered asset "breakpoint" schedule that varies based on asset class. The Board considered that the group fee is designed to deliver the benefits of economies of scale to fund shareholders when total Fidelity fund assets increase, even if assets of any particular fund are unchanged or have declined, because some portion of Fidelity's costs are attributable to services provided to all Fidelity funds, and all funds benefit if those costs can be allocated among more assets. The Board concluded that, given the group fee structure, fund shareholders will benefit from lower management fees as assets under FMR's management increase at the fund complex level, regardless of whether Fidelity achieves any such economies of scale.
The Board concluded, taking into account the analysis of the Economies of Scale Committee, that any potential economies of scale are being appropriately shared between fund shareholders and Fidelity.
Additional Information Requested by the Board. In order to develop fully the factual basis for consideration of the Fidelity funds' Advisory Contracts, the Board requested and received additional information on certain topics, including (i) fund performance trends, actions to be taken by FMR to improve certain funds' overall performance, and Fidelity's long-term strategies for certain funds; (ii) portfolio manager changes that have occurred during the past year and length of portfolio manager tenure for different categories of funds over time; (iii) Fidelity's compensation structure for portfolio managers and other key personnel and strategies for attracting and retaining non-investment personnel; (iv) the amount of the investment that each portfolio manager has made in the Fidelity fund(s) that he or she manages; (v) historical trends in Fidelity's realization of fall-out benefits; (vi) Fidelity's group fee structures and the rationale for the individual fee rates of certain funds; (vii) fund profitability methodology and the impact of certain factors on fund profitability results; (viii) trends regarding industry use of performance fee structures and Fidelity's compliance practices with respect to performance adjustment calculations; (ix) the fee structures in place for certain other Fidelity clients; and (x) explanations regarding the relative total expense ratios of certain funds and classes, total expense competitive trends, and actions that might be taken by FMR to reduce total expense ratios for certain funds and classes.
Annual Report
Based on its evaluation of all of the conclusions noted above, and after considering all factors it believed relevant, the Board ultimately concluded that the advisory fee structures are fair and reasonable, and that the fund's Advisory Contracts should be renewed.
Annual Report
Investment Adviser
Fidelity Management & Research Company
Boston, MA
Investment Sub-Advisers
FMR Co., Inc.
Fidelity Management & Research (U.K.) Inc.
FIL Investment Advisors
FIL Investment Advisors (UK) Limited
Fidelity Management & Research (Hong Kong) Limited
Fidelity Management & Research (Japan) Inc.
General Distributor
Fidelity Distributors Corporation
Boston, MA
Transfer and Service Agents
Fidelity Investments Institutional Operations Company, Inc.
Boston, MA
Fidelity Service Company, Inc.
Boston, MA
Custodian
Brown Brothers Harriman & Co.
Boston, MA
VIPCAP-ANN-0212
1.811843.107
Fidelity® Variable Insurance Products:
Materials Portfolio
Annual Report
December 31, 2011
Contents
Performance | (Click Here) | How the fund has done over time. |
Management's Discussion of Fund Performance | (Click Here) | The Portfolio Manager's review of fund performance and strategy. |
Shareholder Expense Example | (Click Here) | An example of shareholder expenses. |
Investment Changes | (Click Here) | A summary of major shifts in the fund's investments over the past six months. |
Investments | (Click Here) | A complete list of the fund's investments with their market values. |
Financial Statements | (Click Here) | Statements of assets and liabilities, operations, and changes in net assets, as well as financial highlights. |
Notes | (Click Here) | Notes to the financial statements. |
Report of Independent Registered Public Accounting Firm | (Click Here) | |
Trustees and Officers | (Click Here) | |
Distributions | (Click Here) | |
Board Approval of Investment Advisory Contracts and Management Fees | (Click Here) | |
To view a fund's proxy voting guidelines and proxy voting record for the 12-month period ended June 30, visit http://www.fidelity.com/proxyvotingresults or visit the Securities and Exchange Commission's (SEC) web site at http://www.sec.gov. You may also call 1-877-208-0098 to request a free copy of the proxy voting guidelines.
Fidelity Variable Insurance Products are separate account options which are purchased through a variable insurance contract.
Standard & Poor's, S&P and S&P 500 are registered service marks of The McGraw-Hill Companies, Inc. and have been licensed for use by Fidelity Distributors Corporation.
Other third party marks appearing herein are the property of their respective owners.
All other marks appearing herein are registered or unregistered trademarks or service marks of FMR LLC or an affiliated company.
This report and the financial statements contained herein are submitted for the general information of the shareholders of the fund. This report is not authorized for distribution to prospective investors in the fund unless preceded or accompanied by an effective prospectus.
A fund files its complete schedule of portfolio holdings with the SEC for the first and third quarters of each fiscal year on Form N-Q. Forms N-Q are available on the SEC's web site at http://www.sec.gov. A fund's Forms N-Q may be reviewed and copied at the SEC's Public Reference Room in Washington, DC. Information regarding the operation of the SEC's Public Reference Room may be obtained by calling 1-800-SEC-0330. For a complete list of a fund's portfolio holdings, view the most recent holdings listing, semiannual report, or annual report on Fidelity's web site at http://www.fidelity.com, http://www.advisor.fidelity.com, or http://www.401k.com, as applicable.
NOT FDIC INSURED • MAY LOSE VALUE • NO BANK GUARANTEE
Neither the fund nor Fidelity Distributors Corporation is a bank.
Annual Report
Average annual total return reflects the change in the value of an investment, assuming reinvestment of the class' distributions from dividend income and capital gains (the profits earned upon the sale of securities that have grown in value, if any) and assuming a constant rate of performance each year. During periods of reimbursement by Fidelity, a fund's total return will be greater than it would be had the reimbursement not occurred. Performance numbers are net of all underlying fund operating expenses, but do not include any insurance charges imposed by your insurance company's separate account. If performance information included the effect of these additional charges, the total returns would have been lower. How a fund did yesterday is no guarantee of how it will do tomorrow.
Average Annual Total Returns
Periods ended December 31, 2011 | | Past 1
year | Life of
fund A |
VIP Materials Portfolio - Initial Class | | -8.20% | 5.10% |
VIP Materials Portfolio - Investor Class | | -8.30% | 5.00% |
A From April 24, 2007.
$10,000 Over Life of Fund
Let's say hypothetically that $10,000 was invested in VIP Materials Portfolio - Initial Class on April 24, 2007, when the fund started. The chart shows how the value of your investment would have changed, and also shows how the S&P 500® Index performed over the same period.
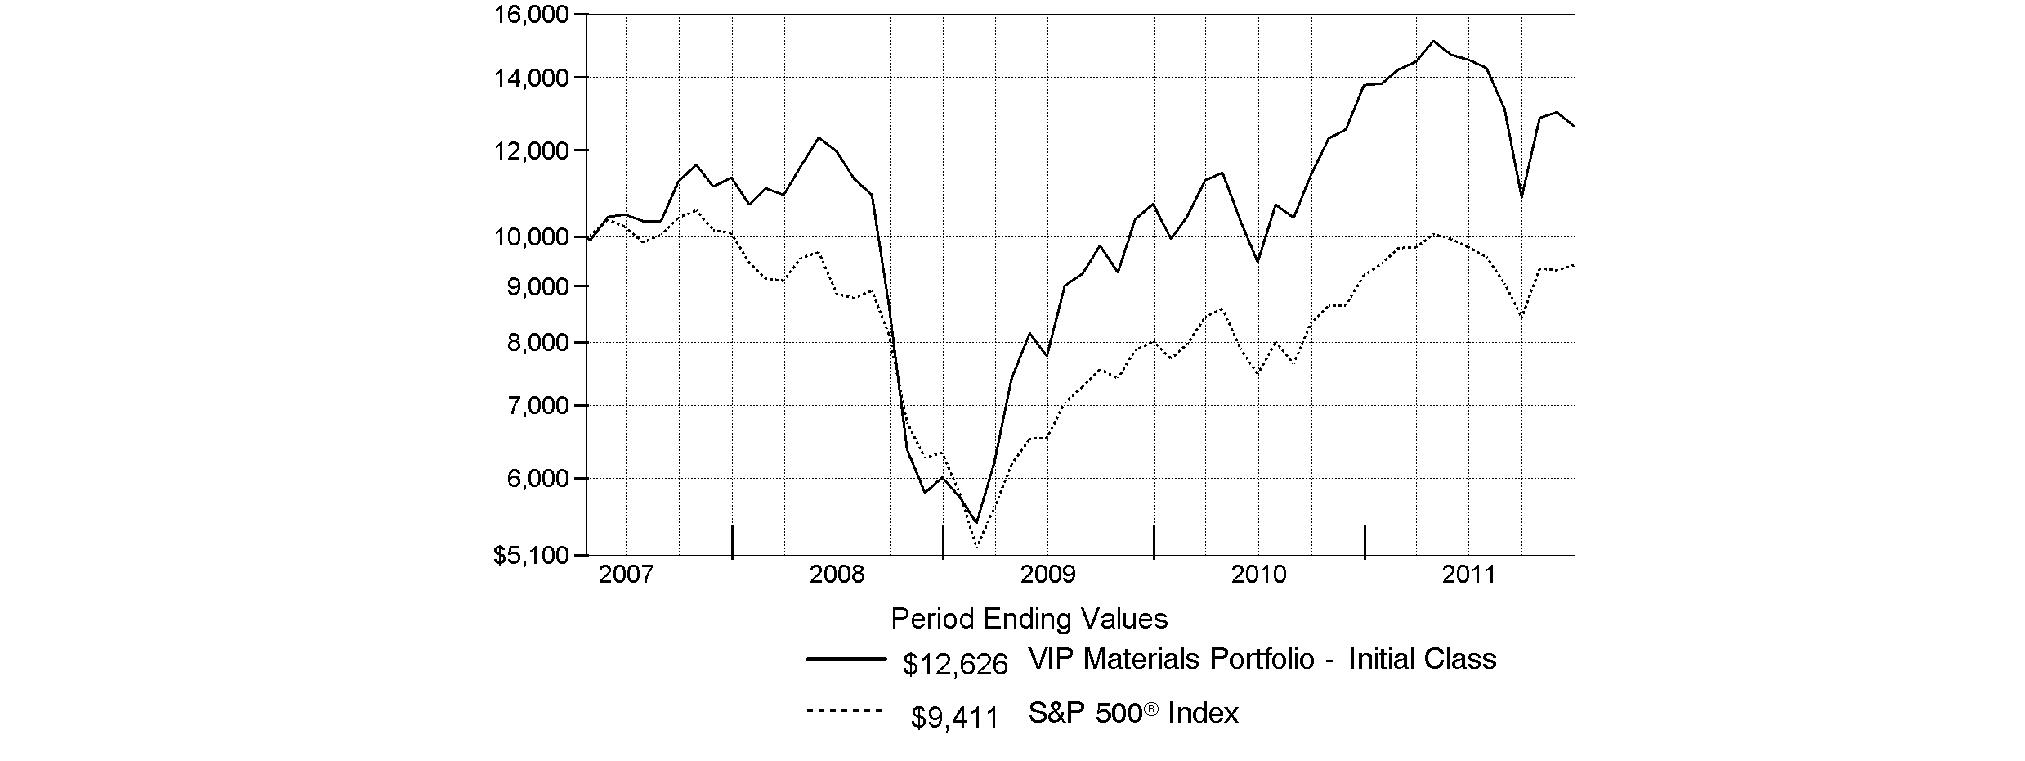
Annual Report
Market Recap: Extreme market volatility took center stage during the 12 months ending December 31, 2011, stealing the spotlight from signs of progress in the global economy. Early in the year, aggressive monetary stimulus by the U.S. federal government, improving credit-market conditions and solid corporate earnings buoyed most major asset classes. As the period progressed, however, fresh worries about sovereign debt in Europe, inflation in China, gridlock over raising the debt ceiling in the U.S. - along with Standard & Poor's early-August downgrade of the nation's long-term sovereign credit rating - and a dimmed outlook for global growth punctured investor confidence and ignited market instability. Domestic equities, as measured by the broad-based S&P 500® Index, gained 2.11%, easily outpacing the 13.61% decline of the MSCI® ACWI® (All Country World Index) ex USA Index, a proxy for foreign stocks. Within the MSCI index, emerging markets declined the most (-18%), with investments here generally held back by a stronger U.S. dollar. The U.K. (-3%) fared better than the rest of Europe (-15%), which was the second-worst-performing index component. Bolstered by periodic flights to quality, U.S. investment-grade bonds posted a 7.84% advance, as reflected by the Barclays Capital® U.S. Aggregate Bond Index, outperforming the 4.37% gain of high-yield securities, as represented by The BofA Merrill LynchSM US High Yield Constrained Index. Hampered by financial woes in Europe, the sovereign debt of major developed markets outside the U.S. rose 4.86%, according to the Citigroup® Non-USD Group-of-Seven (G7) Equal Weighted Index, while the JPMorgan Emerging Markets Bond Index Global (EMBI Global) advanced 8.46%, despite the currency head wind.
Comments from Tobias Welo, Portfolio Manager of VIP Materials Portfolio: During the year, the fund's share classes outpaced the -9.30% return of the MSCI® U.S. IM Materials 25/50 Index but considerably lagged the S&P 500®. (For specific portfolio results, please refer to the performance section of this report.) Versus the MSCI index, performance benefited from underweighting and eventually eliminating our stake in aluminum companies - especially the fund's top relative contributor, index component Alcoa, which I sold during the summer, thereby avoiding the stock's subsequent, precipitous decline. The fund's results also were lifted by solid stock picking in metal/glass containers. An overweighting and security selection in specialty chemicals added value as well. Aside from Alcoa, contributors included weak-performing major index component Freeport-McMoRan Copper & Gold, a contributor to relative performance because I underweighted it. Timely ownership of CF Industries Holdings, the largest U.S. maker of nitrogen fertilizer, also aided the fund's performance, as did overweighting Innophos Holdings - a producer of specialty phosphates for food/beverage, pharmaceutical and industrial applications - and Carpenter Technology, a producer of steel and specialty metals. I sold CF Industries Holdings in August. Conversely, not owning stocks from the paper products group curbed performance, given its gain of almost 9%. Positioning in industrial gases also hurt. Among individual holdings, underweighting agricultural chemicals provider and large benchmark component Monsanto for much of the year hampered the fund, given the stock's modest gain. In the second half of the year, I added to the fund's holdings here, increasing our position to an overweighting and making Monsanto the fund's second-largest holding at period end. Avoiding two other strong-performing index components, International Paper and Lubrizol - the latter a maker of engine-oil additives - worked against us as well. In Lubrizol's case, the company was acquired by Berkshire Hathaway in September on attractive terms. Elsewhere, I thought industrial gases supplier Praxair was fully valued and sold it in the fourth quarter, only to see the stock strengthen further to finish out the year, which detracted from relative performance.
The views expressed above reflect those of the portfolio manager(s) only through the end of the period as stated on the cover of this report and do not necessarily represent the views of Fidelity or any other person in the Fidelity organization. Any such views are subject to change at any time based upon market or other conditions and Fidelity disclaims any responsibility to update such views. These views may not be relied on as investment advice and, because investment decisions for a Fidelity fund are based on numerous factors, may not be relied on as an indication of trading intent on behalf of any Fidelity fund.
Annual Report
As a shareholder of the Fund, you incur two types of costs: (1) transaction costs, including redemption fees, and (2) ongoing costs, including management fees and other Fund expenses. This Example is intended to help you understand your ongoing costs (in dollars) of investing in the Fund and to compare these costs with the ongoing costs of investing in other mutual funds.
The Example is based on an investment of $1,000 invested at the beginning of the period and held for the entire period (July 1, 2011 to December 31, 2011).
Actual Expenses
The first line of the accompanying table for each class of the Fund provides information about actual account values and actual expenses. You may use the information in this line, together with the amount you invested, to estimate the expenses that you paid over the period. Simply divide your account value by $1,000.00 (for example, an $8,600 account value divided by $1,000.00 = 8.6), then multiply the result by the number in the first line for a class of the Fund under the heading entitled "Expenses Paid During Period" to estimate the expenses you paid on your account during this period. The estimate of expenses does not include any fees or other expenses of any variable annuity or variable life insurance product. If they were, the estimate of expenses you paid during the period would be higher, and your ending account value would be lower. In addition, the Fund, as a shareholder in the underlying Fidelity Central Funds, will indirectly bear its pro-rata share of the fees and expenses incurred by the underlying Fidelity Central Funds. These fees and expenses are not included in the Fund's annualized expense ratio used to calculate the expense estimate in the table below.
Hypothetical Example for Comparison Purposes
The second line of the accompanying table for each class of the Fund provides information about hypothetical account values and hypothetical expenses based on a Class' actual expense ratio and an assumed rate of return of 5% per year before expenses, which is not the Class' actual return. The hypothetical account values and expenses may not be used to estimate the actual ending account balance or expenses you paid for the period. You may use this information to compare the ongoing costs of investing in the Fund and other funds. To do so, compare this 5% hypothetical example with the 5% hypothetical examples that appear in the shareholder reports of the other funds. The estimate of expenses does not include any fees or other expenses of any variable annuity or variable life insurance product. If they were, the estimate of expenses you paid during the period would be higher, and your ending account value would be lower. In addition, the Fund, as a shareholder in the underlying Fidelity Central Funds, will indirectly bear its pro-rata share of the fees and expenses incurred by the underlying Fidelity Central Funds. These fees and expenses are not included in the Fund's annualized expense ratio used to calculate the expense estimate in the table below.
Please note that the expenses shown in the table are meant to highlight your ongoing costs only and do not reflect any transaction costs. Therefore, the second line of the table is useful in comparing ongoing costs only, and will not help you determine the relative total costs of owning different funds. In addition, if these transactional costs were included, your costs would have been higher.
| Annualized Expense Ratio | Beginning
Account Value
July 1, 2011 | Ending
Account Value
December 31, 2011 | Expenses Paid
During Period*
July 1, 2011 to
December 31, 2011 |
Initial Class | .76% | | | |
Actual | | $ 1,000.00 | $ 870.20 | $ 3.58 |
HypotheticalA | | $ 1,000.00 | $ 1,021.37 | $ 3.87 |
Investor Class | .84% | | | |
Actual | | $ 1,000.00 | $ 869.90 | $ 3.96 |
HypotheticalA | | $ 1,000.00 | $ 1,020.97 | $ 4.28 |
A 5% return per year before expenses
* Expenses are equal to each Class' annualized expense ratio, multiplied by the average account value over the period, multiplied by 184/365 (to reflect the one-half year period).
Annual Report
Investment Changes (Unaudited)
Top Ten Stocks as of December 31, 2011 |
| % of fund's
net assets | % of fund's net assets
6 months ago |
E.I. du Pont de Nemours & Co. | 8.7 | 8.2 |
Monsanto Co. | 7.0 | 2.1 |
Dow Chemical Co. | 6.2 | 7.7 |
Newmont Mining Corp. | 5.8 | 4.4 |
Air Products & Chemicals, Inc. | 5.3 | 3.5 |
Ecolab, Inc. | 4.8 | 1.8 |
The Mosaic Co. | 3.7 | 3.0 |
Freeport-McMoRan Copper & Gold, Inc. | 3.5 | 5.1 |
LyondellBasell Industries NV
Class A | 3.0 | 1.8 |
PPG Industries, Inc. | 2.9 | 3.3 |
| 50.9 | |
Top Industries (% of fund's net assets) |
As of December 31, 2011 |
| Chemicals | 62.4% | |
| Metals & Mining | 23.3% | |
| Containers & Packaging | 7.9% | |
| Food Products | 1.2% | |
| Building Products | 0.7% | |
| All Others* | 4.5% | |

As of June 30, 2011 |
| Chemicals | 61.2% | |
| Metals & Mining | 27.1% | |
| Containers & Packaging | 6.3% | |
| Food Products | 1.0% | |
| Real Estate Investment Trusts | 0.7% | |
| All Others* | 3.7% | |

* Includes short-term investments and net other assets. |
Annual Report
Investments December 31, 2011
Showing Percentage of Net Assets
Common Stocks - 96.1% |
| Shares | | Value |
CHEMICALS - 62.4% |
Commodity Chemicals - 1.2% |
Arkema SA | 9,055 | | $ 641,127 |
Georgia Gulf Corp. (a) | 15,729 | | 306,558 |
| | 947,685 |
Diversified Chemicals - 22.2% |
Ashland, Inc. | 25,277 | | 1,444,833 |
BASF AG | 5,728 | | 399,558 |
Cabot Corp. | 20,090 | | 645,693 |
Dow Chemical Co. | 164,962 | | 4,744,307 |
E.I. du Pont de Nemours & Co. | 147,250 | | 6,741,105 |
Lanxess AG | 7,758 | | 401,678 |
Olin Corp. | 25,207 | | 495,318 |
PPG Industries, Inc. | 27,004 | | 2,254,564 |
| | 17,127,056 |
Fertilizers & Agricultural Chemicals - 12.1% |
CVR Partners LP | 11,779 | | 292,355 |
Israel Chemicals Ltd. | 36,400 | | 377,271 |
Monsanto Co. | 77,388 | | 5,422,577 |
Rentech Nitrogen Partners LP | 22,900 | | 374,415 |
The Mosaic Co. | 57,627 | | 2,906,130 |
| | 9,372,748 |
Industrial Gases - 5.3% |
Air Products & Chemicals, Inc. | 48,111 | | 4,098,576 |
Specialty Chemicals - 21.6% |
Celanese Corp. Class A | 35,083 | | 1,553,124 |
Cytec Industries, Inc. | 18,968 | | 846,921 |
Ecolab, Inc. (d) | 63,953 | | 3,697,123 |
H.B. Fuller Co. | 15,400 | | 355,894 |
Innophos Holdings, Inc. | 18,862 | | 915,939 |
Innospec, Inc. (a) | 11,105 | | 311,717 |
Kraton Performance Polymers, Inc. (a) | 31,937 | | 648,321 |
LyondellBasell Industries NV Class A | 71,482 | | 2,322,450 |
OMNOVA Solutions, Inc. (a) | 54,745 | | 252,374 |
Rockwood Holdings, Inc. (a) | 12,968 | | 510,550 |
Sherwin-Williams Co. | 22,757 | | 2,031,517 |
Sigma Aldrich Corp. | 21,470 | | 1,341,016 |
W.R. Grace & Co. (a) | 40,690 | | 1,868,485 |
| | 16,655,431 |
TOTAL CHEMICALS | | 48,201,496 |
COMMERCIAL SERVICES & SUPPLIES - 0.5% |
Environmental & Facility Services - 0.5% |
Swisher Hygiene, Inc. | 19,833 | | 74,176 |
Swisher Hygiene, Inc. (Canada) (a)(d) | 82,100 | | 307,054 |
| | 381,230 |
CONTAINERS & PACKAGING - 7.9% |
Metal & Glass Containers - 5.4% |
Aptargroup, Inc. | 26,700 | | 1,392,939 |
|
| Shares | | Value |
Ball Corp. | 59,500 | | $ 2,124,745 |
Silgan Holdings, Inc. | 16,800 | | 649,152 |
| | 4,166,836 |
Paper Packaging - 2.5% |
Rock-Tenn Co. Class A | 33,487 | | 1,932,200 |
TOTAL CONTAINERS & PACKAGING | | 6,099,036 |
ELECTRICAL EQUIPMENT - 0.5% |
Electrical Components & Equipment - 0.5% |
GrafTech International Ltd. (a) | 27,472 | | 374,993 |
FOOD PRODUCTS - 1.2% |
Agricultural Products - 1.2% |
Archer Daniels Midland Co. | 31,554 | | 902,444 |
METALS & MINING - 23.3% |
Diversified Metals & Mining - 9.7% |
Copper Mountain Mining Corp. (a) | 128,100 | | 708,173 |
First Quantum Minerals Ltd. | 84,700 | | 1,667,552 |
Freeport-McMoRan Copper & Gold, Inc. | 72,847 | | 2,680,041 |
HudBay Minerals, Inc. | 25,400 | | 252,903 |
Ivanhoe Mines Ltd. (a) | 77,000 | | 1,367,763 |
Kenmare Resources PLC (a) | 160,700 | | 114,812 |
Walter Energy, Inc. (d) | 11,377 | | 688,991 |
| | 7,480,235 |
Gold - 7.7% |
Goldcorp, Inc. | 14,900 | | 661,458 |
Kinross Gold Corp. | 34,600 | | 395,128 |
Newcrest Mining Ltd. | 12,822 | | 388,128 |
Newmont Mining Corp. | 75,220 | | 4,513,952 |
| | 5,958,666 |
Precious Metals & Minerals - 0.3% |
African Minerals Ltd. (a) | 37,619 | | 257,083 |
Steel - 5.6% |
Carpenter Technology Corp. | 20,100 | | 1,034,748 |
Fortescue Metals Group Ltd. | 87,474 | | 381,974 |
Haynes International, Inc. | 10,186 | | 556,156 |
Nucor Corp. | 27,935 | | 1,105,388 |
Reliance Steel & Aluminum Co. | 26,335 | | 1,282,251 |
| | 4,360,517 |
TOTAL METALS & MINING | | 18,056,501 |
OIL, GAS & CONSUMABLE FUELS - 0.3% |
Coal & Consumable Fuels - 0.3% |
Bumi PLC | 17,919 | | 244,912 |
TOTAL COMMON STOCKS (Cost $73,877,476) |
74,260,612
|
Convertible Bonds - 0.7% |
| Principal Amount | | Value |
BUILDING PRODUCTS - 0.7% |
Building Products - 0.7% |
Aspen Aerogels, Inc. 8% 6/1/14 (f)
(Cost $569,500) | | $ 569,500 | | $ 569,500 |
U.S. Treasury Obligations - 0.2% |
|
U.S. Treasury Bills, yield at date of purchase 0.01% 3/1/12 (e)
(Cost $124,998) | | 125,000 | |
124,997
|
Money Market Funds - 4.0% |
| Shares | | |
Fidelity Cash Central Fund, 0.11% (b) | 2,153,885 | | 2,153,885 |
Fidelity Securities Lending Cash Central Fund, 0.13% (b)(c) | 911,086 | | 911,086 |
TOTAL MONEY MARKET FUNDS (Cost $3,064,971) |
3,064,971
|
TOTAL INVESTMENT PORTFOLIO - 101.0% (Cost $77,636,945) | 78,020,080 |
NET OTHER ASSETS (LIABILITIES) - (1.0)% | (744,553) |
NET ASSETS - 100% | $ 77,275,527 |
Futures Contracts |
| Expiration Date | | Underlying Face Amount at Value | | Unrealized Appreciation/(Depreciation) |
Purchased |
Equity Index Contracts |
23 CME E-mini S&P Select Sector Materials Index Contracts | March 2012 | | $ 810,290 | | $ (9,014) |
|
The face value of futures purchased as a percentage of net assets is 1%. |
Legend |
(a) Non-income producing |
(b) Affiliated fund that is available only to investment companies and other accounts managed by Fidelity Investments. The rate quoted is the annualized seven-day yield of the fund at period end. A complete unaudited listing of the fund's holdings as of its most recent quarter end is available upon request. In addition, each Fidelity Central Fund's financial statements, which are not covered by the Fund's Report of Independent Registered Public Accounting Firm, are available on the SEC's website or upon request. |
(c) Investment made with cash collateral received from securities on loan. |
(d) Security or a portion of the security is on loan at period end. |
(e) Security or a portion of the security was pledged to cover margin requirements for futures contracts. At the period end, the value of securities pledged amounted to $124,997. |
(f) Restricted securities - Investment in securities not registered under the Securities Act of 1933 (excluding 144A issues). At the end of the period, the value of restricted securities (excluding 144A issues) amounted to $569,500 or 0.7% of net assets. |
Additional information on each restricted holding is as follows: |
Security | Acquisition Date | Acquisition Cost |
Aspen Aerogels, Inc. 8% 6/1/14 | 6/1/11 | $ 569,500 |
Affiliated Central Funds |
Information regarding fiscal year to date income earned by the Fund from investments in Fidelity Central Funds is as follows: |
Fund | Income earned |
Fidelity Cash Central Fund | $ 3,587 |
Fidelity Securities Lending Cash Central Fund | 31,802 |
Total | $ 35,389 |
Other Information |
The following is a summary of the inputs used, as of December 31, 2011, involving the Fund's assets and liabilities carried at fair value. The inputs or methodology used for valuing securities may not be an indication of the risk associated with investing in those securities. For more information on valuation inputs, and their aggregation into the levels used in the tables below, please refer to the Security Valuation section in the accompanying Notes to Financial Statements. |
Valuation Inputs at Reporting Date: |
Description | Total | Level 1 | Level 2 | Level 3 |
Investments in Securities: | | | | |
Common Stocks | $ 74,260,612 | $ 74,260,612 | $ - | $ - |
Convertible Bonds | 569,500 | - | - | 569,500 |
U.S. Treasury Obligations | 124,997 | - | 124,997 | - |
Money Market Funds | 3,064,971 | 3,064,971 | - | - |
Total Investments in Securities: | $ 78,020,080 | $ 77,325,583 | $ 124,997 | $ 569,500 |
Derivative Instruments: | | | | |
Liabilities | | | | |
Futures Contracts | $ (9,014) | $ (9,014) | $ - | $ - |
The following is a reconciliation of Investments in Securities for which Level 3 inputs were used in determining value: |
Investments in Securities: | |
Beginning Balance | $ - |
Total Realized Gain (Loss) | - |
Total Unrealized Gain (Loss) | - |
Cost of Purchases | 569,500 |
Proceeds of Sales | - |
Amortization/Accretion | - |
Transfers in to Level 3 | - |
Transfers out of Level 3 | - |
Ending Balance | $ 569,500 |
The change in unrealized gain (loss) for the period attributable to Level 3 securities held at December 31, 2011 | $ - |
The information used in the above reconciliation represents fiscal year to date activity for any Investments in Securities identified as using Level 3 inputs at either the beginning or the end of the current fiscal period. Transfers in or out of Level 3 represent the beginning value of any Security or Instrument where a change in the pricing level occurred from the beginning to the end of the period. The cost of purchases and the proceeds of sales may include securities received or delivered through corporate actions or exchanges. Realized and unrealized gains (losses) disclosed in the reconciliation are included in Net Gain (Loss) on the Fund's Statement of Operations. |
Value of Derivative Instruments |
The following table is a summary of the Fund's value of derivative instruments by risk exposure as of December 31, 2011. For additional information on derivative instruments, please refer to the Derivative Instruments section in the accompanying Notes to Financial Statements. |
Risk Exposure /
Derivative Type | Value |
| Asset | Liability |
Equity Risk | | |
Futures Contracts (a) | $ - | $ (9,014) |
Total Value of Derivatives | $ - | $ (9,014) |
(a) Reflects cumulative appreciation/(depreciation) on futures contracts as disclosed on the Schedule of Investments. Only the period end variation margin is separately disclosed on the Statement of Assets and Liabilities. |
Other Information |
Distribution of investments by country of issue, as a percentage of total net assets, is as follows: (Unaudited) |
United States of America | 86.4% |
Canada | 6.6% |
Netherlands | 3.0% |
Germany | 1.0% |
Australia | 1.0% |
Others (Individually Less Than 1%) | 2.0% |
| 100.0% |
See accompanying notes which are an integral part of the financial statements.
Annual Report
Statement of Assets and Liabilities
| December 31, 2011 |
| | |
Assets | | |
Investment in securities, at value (including securities loaned of $887,425) - See accompanying schedule: Unaffiliated issuers (cost $74,571,974) | $ 74,955,109 | |
Fidelity Central Funds (cost $3,064,971) | 3,064,971 | |
Total Investments (cost $77,636,945) | | $ 78,020,080 |
Cash | | 26,206 |
Foreign currency held at value (cost $7,722) | | 7,722 |
Receivable for investments sold | | 324,326 |
Receivable for fund shares sold | | 976 |
Dividends receivable | | 91,985 |
Interest receivable | | 26,450 |
Distributions receivable from Fidelity Central Funds | | 1,805 |
Receivable for daily variation margin on futures contracts | | 690 |
Prepaid expenses | | 348 |
Other receivables | | 756 |
Total assets | | 78,501,344 |
| | |
Liabilities | | |
Payable for investments purchased | $ 147,062 | |
Payable for fund shares redeemed | 86,585 | |
Accrued management fee | 36,337 | |
Other affiliated payables | 10,333 | |
Other payables and accrued expenses | 34,414 | |
Collateral on securities loaned, at value | 911,086 | |
Total liabilities | | 1,225,817 |
| | |
Net Assets | | $ 77,275,527 |
Net Assets consist of: | | |
Paid in capital | | $ 74,369,619 |
Accumulated undistributed net realized gain (loss) on investments and foreign currency transactions | | 2,531,726 |
Net unrealized appreciation (depreciation) on investments and assets and liabilities in foreign currencies | | 374,182 |
Net Assets | | $ 77,275,527 |
Statement of Assets and Liabilities - continued
| December 31, 2011 |
Initial Class:
Net Asset Value, offering price and redemption price per share ($27,413,896 ÷ 2,349,507 shares) | | $ 11.67 |
| | |
Investor Class:
Net Asset Value, offering price and redemption price per share ($49,861,631 ÷ 4,273,402 shares) | | $ 11.67 |
See accompanying notes which are an integral part of the financial statements.
Annual Report
Fund Name
Financial Statements - continued
Statement of Operations
| Year ended December 31, 2011 |
| | |
Investment Income | | |
Dividends | | $ 1,593,303 |
Special dividends | | 354,265 |
Interest | | 26,459 |
Income from Fidelity Central Funds | | 35,389 |
Total income | | 2,009,416 |
| | |
Expenses | | |
Management fee | $ 552,800 | |
Transfer agent fees | 129,672 | |
Accounting and security lending fees | 39,300 | |
Custodian fees and expenses | 28,780 | |
Independent trustees' compensation | 560 | |
Audit | 46,029 | |
Legal | 372 | |
Miscellaneous | 754 | |
Total expenses before reductions | 798,267 | |
Expense reductions | (8,802) | 789,465 |
Net investment income (loss) | | 1,219,951 |
Realized and Unrealized Gain (Loss) Net realized gain (loss) on: | | |
Investment securities: | | |
Unaffiliated issuers | 7,039,127 | |
Foreign currency transactions | (16,640) | |
Futures contracts | 46,237 | |
Total net realized gain (loss) | | 7,068,724 |
Change in net unrealized appreciation (depreciation) on: Investment securities (net of decrease in deferred foreign taxes of $723) | (17,729,262) | |
Assets and liabilities in foreign currencies | 241 | |
Futures contracts | (9,014) | |
Total change in net unrealized appreciation (depreciation) | | (17,738,035) |
Net gain (loss) | | (10,669,311) |
Net increase (decrease) in net assets resulting from operations | | $ (9,449,360) |
Statement of Changes in Net Assets
| Year ended December 31, 2011 | Year ended December 31, 2010 |
Increase (Decrease) in Net Assets | | |
Operations | | |
Net investment income (loss) | $ 1,219,951 | $ 1,559,845 |
Net realized gain (loss) | 7,068,724 | 4,677,306 |
Change in net unrealized appreciation (depreciation) | (17,738,035) | 10,200,079 |
Net increase (decrease) in net assets resulting from operations | (9,449,360) | 16,437,230 |
Distributions to shareholders from net investment income | (1,275,950) | (1,597,131) |
Distributions to shareholders from net realized gain | - | (21,424) |
Total distributions | (1,275,950) | (1,618,555) |
Share transactions - net increase (decrease) | (14,149,208) | 14,458,074 |
Redemption fees | 40,180 | 42,650 |
Total increase (decrease) in net assets | (24,834,338) | 29,319,399 |
| | |
Net Assets | | |
Beginning of period | 102,109,865 | 72,790,466 |
End of period | $ 77,275,527 | $ 102,109,865 |
See accompanying notes which are an integral part of the financial statements.
Annual Report
Financial Highlights - Initial Class
Years ended December 31, | 2011 | 2010 | 2009 | 2008 | 2007 L |
Selected Per-Share Data | | | | | |
Net asset value, beginning of period | $ 12.94 | $ 10.25 | $ 5.80 | $ 11.13 | $ 10.00 |
Income from Investment Operations | | | | | |
Net investment income (loss) E | .16 H | .25 I | .10 J | .07 | .10 K |
Net realized and unrealized gain (loss) | (1.24) | 2.66 | 4.42 | (5.31) | 1.20 |
Total from investment operations | (1.08) | 2.91 | 4.52 | (5.24) | 1.30 |
Distributions from net investment income | (.20) | (.23) | (.08) | (.08) | (.07) |
Distributions from net realized gain | - | - N | - | (.06) | (.11) |
Total distributions | (.20) | (.23) | (.08) | (.14) | (.18) |
Redemption fees added to paid in capital E | .01 | .01 | .01 | .05 | .01 |
Net asset value, end of period | $ 11.67 | $ 12.94 | $ 10.25 | $ 5.80 | $ 11.13 |
Total Return B,C,D | (8.20)% | 28.54% | 78.09% | (46.88)% | 13.12% |
Ratios to Average Net Assets F,M | | | | | |
Expenses before reductions | .76% | .79% | .82% | .88% | 1.08% A |
Expenses net of fee waivers, if any | .76% | .78% | .82% | .88% | 1.00% A |
Expenses net of all reductions | .75% | .77% | .81% | .88% | 1.00% A |
Net investment income (loss) | 1.28% H | 2.31% I | 1.27% J | .74% | 1.31% A,K |
Supplemental Data | | | | | |
Net assets, end of period (000 omitted) | $ 27,414 | $ 46,131 | $ 34,218 | $ 9,963 | $ 13,730 |
Portfolio turnover rate G | 105% | 115% | 105% | 171% | 35% A |
A Annualized B Total returns for periods of less than one year are not annualized. C Total returns do not reflect charges attributable to your insurance company's separate account. Inclusion of these charges would reduce the total returns shown. D Total returns would have been lower if certain expenses had not been reduced during the applicable periods shown. E Calculated based on average shares outstanding during the period. F Fees and expenses of any underlying Fidelity Central Funds are not included in the Fund's expense ratio. The Fund indirectly bears its proportionate share of the expenses of any underlying Fidelity Central Funds. G Amount does not include the portfolio activity of any underlying Fidelity Central Funds. H Investment income per share reflects a special dividend which amounted to $.05 per share. Excluding the special dividend, the ratio of net investment income (loss) to average net assets would have been .93%. I Investment income per share reflects a special dividend which amounted to $.16 per share. Excluding the special dividend, the ratio of net investment income (loss) to average net assets would have been .86%. J Investment income per share reflects a special dividend which amounted to $.02 per share. Excluding the special dividend, the ratio of net investment income (loss) to average net assets would have been 1.03%. K Investment income per share reflects a special dividend which amounted to $.02 per share. Excluding the special dividend, the ratio of net investment income (loss) to average net assets would have been 1.03%. L For the period April 24, 2007 (commencement of operations) to December 31, 2007. M Expense ratios reflect operating expenses of the class. Expenses before reductions do not reflect amounts reimbursed by the investment adviser or reductions from brokerage service arrangements or reductions from other expense offset arrangements and do not represent the amount paid by the class during periods when reimbursements or reductions occur. Expense ratios before reductions for start-up periods may not be representative of longer-term operating periods. Expenses net of fee waivers reflect expenses after reimbursement by the investment adviser but prior to reductions from brokerage service arrangements or other expense offset arrangements. Expenses net of all reductions represent the net expenses paid by the class. N Amount represents less than $.01 per share. |
Financial Highlights - Investor Class
Years ended December 31, | 2011 | 2010 | 2009 | 2008 | 2007 L |
Selected Per-Share Data | | | | | |
Net asset value, beginning of period | $ 12.94 | $ 10.25 | $ 5.80 | $ 11.13 | $ 10.00 |
Income from Investment Operations | | | | | |
Net investment income (loss) E | .15 H | .24 I | .10 J | .06 | .09 K |
Net realized and unrealized gain (loss) | (1.24) | 2.66 | 4.41 | (5.31) | 1.21 |
Total from investment operations | (1.09) | 2.90 | 4.51 | (5.25) | 1.30 |
Distributions from net investment income | (.19) | (.22) | (.07) | (.07) | (.07) |
Distributions from net realized gain | - | - N | - | (.06) | (.11) |
Total distributions | (.19) | (.22) | (.07) | (.13) | (.18) |
Redemption fees added to paid in capital E | .01 | .01 | .01 | .05 | .01 |
Net asset value, end of period | $ 11.67 | $ 12.94 | $ 10.25 | $ 5.80 | $ 11.13 |
Total Return B,C,D | (8.30)% | 28.45% | 78.02% | (46.98)% | 13.05% |
Ratios to Average Net Assets F,M | | | | | |
Expenses before reductions | .84% | .87% | .91% | .97% | 1.20% A |
Expenses net of fee waivers, if any | .84% | .86% | .91% | .97% | 1.15% A |
Expenses net of all reductions | .83% | .85% | .90% | .96% | 1.15% A |
Net investment income (loss) | 1.20% H | 2.23% I | 1.18% J | .65% | 1.16% A,K |
Supplemental Data | | | | | |
Net assets, end of period (000 omitted) | $ 49,862 | $ 55,979 | $ 38,572 | $ 7,844 | $ 10,793 |
Portfolio turnover rate G | 105% | 115% | 105% | 171% | 35% A |
A Annualized B Total returns for periods of less than one year are not annualized. C Total returns do not reflect charges attributable to your insurance company's separate account. Inclusion of these charges would reduce the total returns shown. D Total returns would have been lower if certain expenses had not been reduced during the applicable periods shown. E Calculated based on average shares outstanding during the period. F Fees and expenses of any underlying Fidelity Central Funds are not included in the Fund's expense ratio. The Fund indirectly bears its proportionate share of the expenses of any underlying Fidelity Central Funds. G Amount does not include the portfolio activity of any underlying Fidelity Central Funds. H Investment income per share reflects a special dividend which amounted to $.05 per share. Excluding the special dividend, the ratio of net investment income (loss) to average net assets would have been .85%. I Investment income per share reflects a special dividend which amounted to $.16 per share. Excluding the special dividend, the ratio of net investment income (loss) to average net assets would have been .78%. J Investment income per share reflects a special dividend which amounted to $.02 per share. Excluding the special dividend, the ratio of net investment income (loss) to average net assets would have been .94%. K Investment income per share reflects a special dividend which amounted to $.02 per share. Excluding the special dividend, the ratio of net investment income (loss) to average net assets would have been .88%. L For the period April 24, 2007 (commencement of operations) to December 31, 2007. M Expense ratios reflect operating expenses of the class. Expenses before reductions do not reflect amounts reimbursed by the investment adviser or reductions from brokerage service arrangements or reductions from other expense offset arrangements and do not represent the amount paid by the class during periods when reimbursements or reductions occur. Expense ratios before reductions for start-up periods may not be representative of longer-term operating periods. Expenses net of fee waivers reflect expenses after reimbursement by the investment adviser but prior to reductions from brokerage service arrangements or other expense offset arrangements. Expenses net of all reductions represent the net expenses paid by the class. N Amount represents less than $.01 per share. |
See accompanying notes which are an integral part of the financial statements.
Annual Report
Notes to Financial Statements
For the period ended December 31, 2011
1. Organization.
VIP Materials Portfolio (the Fund) is a non-diversified fund of Variable Insurance Products Fund IV (the Trust) and is authorized to issue an unlimited number of shares. The Trust is registered under the Investment Company Act of 1940, as amended (the 1940 Act), as an open-end management investment company organized as a Massachusetts business trust. Shares of the Fund may only be purchased by insurance companies for the purpose of funding variable annuity or variable life insurance contracts. The Fund offers the following classes of shares: Initial Class shares and Investor Class shares. All classes have equal rights and voting privileges, except for matters affecting a single class. Investment income, realized and unrealized capital gains and losses, the common expenses of the Fund, and certain fund-level expense reductions, if any, are allocated on a pro-rata basis to each class based on the relative net assets of each class to the total net assets of the Fund. Each class differs with respect to transfer agent fees incurred. Certain expense reductions may also differ by class.
2. Investments in Fidelity Central Funds.
The Fund invests in Fidelity Central Funds, which are open-end investment companies available only to other investment companies and accounts managed by Fidelity Management & Research Company (FMR) and its affiliates. The Fund's Schedule of Investments lists each of the Fidelity Central Funds held as of period end, if any, as an investment of the Fund, but do not include the underlying holdings of each Fidelity Central Fund. As an Investing Fund, the Fund indirectly bears its proportionate share of the expenses of the underlying Fidelity Central Funds.
The Money Market Central Funds seek preservation of capital and current income and are managed by Fidelity Investments Money Management, Inc. (FIMM), an affiliate of FMR.
A complete unaudited list of holdings for each Fidelity Central Fund is available upon request or at the Securities and Exchange Commission (the SEC) web site at www.sec.gov. In addition, the financial statements of the Fidelity Central Funds, which are not covered by the Fund's Report of Independent Registered Public Accounting Firm, are available on the SEC web site or upon request.
3. Significant Accounting Policies.
The financial statements have been prepared in conformity with accounting principles generally accepted in the United States of America (GAAP), which require management to make certain estimates and assumptions at the date of the financial statements. Actual results could differ from those estimates. Subsequent events, if any, through the date that the financial statements were issued have been evaluated in the preparation of the financial statements. The following summarizes the significant accounting policies of the Fund:
Security Valuation. Investments are valued as of 4:00 p.m. Eastern time on the last calendar day of the period. The Fund uses independent pricing services approved by the Board of Trustees to value its investments. When current market prices or quotations are not readily available or reliable, valuations may be determined in good faith in accordance with procedures adopted by the Board of Trustees. Factors used in determining value may include market or security specific events, changes in interest rates and credit quality. The frequency with which these procedures are used cannot be predicted and they may be utilized to a significant extent. The value used for net asset value (NAV) calculation under these procedures may differ from published prices for the same securities.
The Fund categorizes the inputs to valuation techniques used to value its investments into a disclosure hierarchy consisting of three levels as shown below:
Level 1 - quoted prices in active markets for identical investments
Level 2 - other significant observable inputs (including quoted prices for similar investments, interest rates, prepayment speeds, etc.)
Level 3 - unobservable inputs (including the Fund's own assumptions based on the best information available)
Changes in valuation techniques may result in transfers in or out of an assigned level within the disclosure hierarchy. The aggregate value of investments by input level, as of December 31, 2011, as well as a roll forward of Level 3 securities, is included at the end of the Fund's Schedule of Investments. Valuation techniques used to value the Fund's investments by major category are as follows:
Equity securities, including restricted securities, for which market quotations are readily available, are valued at the last reported sale price or official closing price as reported by an independent pricing service on the primary market or exchange on which they are traded and are categorized as Level 1 in the hierarchy. In the event there were no sales during the day or closing prices are not available, securities are valued at the last quoted bid price or may be valued using the last available price and are generally categorized as Level 2 in the hierarchy. For foreign equity securities, when significant market or security specific events arise, comparisons to the valuation of American Depositary Receipts (ADRs), futures contracts, Exchange-traded funds (ETFs) and certain indexes as well as quoted prices for similar securities are used and are categorized as Level 2 in the hierarchy in these circumstances. Utilizing these techniques may result in transfers between Level 1 and Level 2. For restricted equity securities and private placements where observable inputs are limited, assumptions about market activity and risk are used and are categorized as Level 3 in the hierarchy.
Annual Report
Notes to Financial Statements - continued
3. Significant Accounting Policies - continued
Security Valuation - continued
Debt securities, including restricted securities, are valued based on evaluated prices received from independent pricing services or from dealers who make markets in such securities. For corporate bonds and U.S. government and government agency obligations, pricing services utilize matrix pricing which considers yield or price of bonds of comparable quality, coupon, maturity and type as well as dealer supplied prices and are generally categorized as Level 2 in the hierarchy.
When independent prices are unavailable or unreliable, debt securities may be valued utilizing pricing matrices which consider similar factors that would be used by independent pricing services. These are generally categorized as Level 2 in the hierarchy but may be Level 3 depending on the circumstances.
Futures contracts are valued at the settlement price established each day by the board of trade or exchange on which they are traded and are categorized as Level 1 in the hierarchy. Investments in open-end mutual funds, including the Fidelity Central Funds, are valued at their closing net asset value each business day and are categorized as Level 1 in the hierarchy.
New Accounting Pronouncements. In May 2011, the Financial Accounting Standards Board issued Accounting Standard Update No. 2011-04, Fair Value Measurement (Topic 820) - Amendments to Achieve Common Fair Value Measurement and Disclosure Requirements in U.S. GAAP and IFRSs. The update is effective during interim and annual periods beginning after December 15, 2011 and will result in additional disclosure for transfers between levels as well as expanded disclosure for securities categorized as Level 3 under the fair value hierarchy.
In December 2011, the Financial Accounting Standards Board issued Accounting Standard Update No. 2011-11, Disclosures about Offsetting Assets and Liabilities. The update creates new disclosure requirements requiring entities to disclose both gross and net information for derivatives and other financial instruments that are either offset in the Statement of Assets and Liabilities or subject to an enforceable master netting arrangement or similar agreement. The disclosure requirements are effective for annual reporting periods beginning on or after January 1, 2013. Management is currently evaluating the impact of the update's adoption on the Fund's financial statement disclosures.
Foreign Currency. The Fund may use foreign currency contracts to facilitate transactions in foreign-denominated securities. Gains and losses from these transactions may arise from changes in the value of the foreign currency or if the counterparties do not perform under the contracts' terms.
Foreign-denominated assets, including investment securities, and liabilities are translated into U.S. dollars at the exchange rate at period end. Purchases and sales of investment securities, income and dividends received and expenses denominated in foreign currencies are translated into U.S. dollars at the exchange rate in effect on the transaction date.
The effects of exchange rate fluctuations on investments are included with the net realized and unrealized gain (loss) on investment securities. Other foreign currency transactions resulting in realized and unrealized gain (loss) are disclosed separately.
Investment Transactions and Income. For financial reporting purposes, the Fund's investment holdings and NAV include trades executed through the end of the last business day of the period. The NAV per share for processing shareholder transactions is calculated as of the close of business of the New York Stock Exchange (NYSE), normally 4:00 p.m. Eastern time and includes trades executed through the end of the prior business day. Gains and losses on securities sold are determined on the basis of identified cost. Dividend income is recorded on the ex-dividend date, except for certain dividends from foreign securities where the ex-dividend date may have passed, which are recorded as soon as the Fund is informed of the ex-dividend date. Non-cash dividends included in dividend income, if any, are recorded at the fair market value of the securities received. Distributions received on securities that represent a return of capital or capital gain are recorded as a reduction of cost of investments and/or as a realized gain. The Fund estimates the components of distributions received that may be considered return of capital distributions or capital gain distributions. Large, non-recurring dividends recognized by the Fund are presented separately on the Statement of Operations as "Special Dividends" and the impact of these dividends is presented in the Financial Highlights. Interest income and distributions from the Fidelity Central Funds are accrued as earned. Interest income includes coupon interest and amortization of premium and accretion of discount on debt securities. Investment income is recorded net of foreign taxes withheld where recovery of such taxes is uncertain.
Expenses. Expenses directly attributable to a fund are charged to that fund. Expenses attributable to more than one fund are allocated among the respective funds on the basis of relative net assets or other appropriate methods. Expense estimates are accrued in the period to which they relate and adjustments are made when actual amounts are known.
Annual Report
3. Significant Accounting Policies - continued
Income Tax Information and Distributions to Shareholders. Each year, the Fund intends to qualify as a regulated investment company, including distributing substantially all of its taxable income and realized gains under Subchapter M of the Internal Revenue Code. As a result, no provision for income taxes is required. As of December 31, 2011, the Fund did not have any unrecognized tax benefits in the financial statements; nor is the Fund aware of any tax positions for which it is reasonably possible that the total amounts of unrecognized tax benefits will significantly change in the next twelve months. The Fund files a U.S. federal tax return, in addition to state and local tax returns as required. A fund's tax returns are subject to examination by the Internal Revenue Service (IRS) for a period of three fiscal years. State and local tax returns may be subject to examination for an additional fiscal year depending on the jurisdiction. Foreign taxes are provided for based on the Fund's understanding of the tax rules and rates that exist in the foreign markets in which it invests.
Distributions are declared and recorded on the ex-dividend date. Income dividends and capital gain distributions are declared separately for each class. Income and capital gain distributions are determined in accordance with income tax regulations, which may differ from GAAP.
Capital accounts within the financial statements are adjusted for permanent book-tax differences. These adjustments have no impact on net assets or the results of operations. Temporary book-tax differences will reverse in a subsequent period.
Book-tax differences are primarily due to futures transactions, foreign currency transactions, partnerships, passive foreign investment companies (PFIC), capital loss carryforwards and losses deferred due to wash sales.
The federal tax cost of investment securities and unrealized appreciation (depreciation) as of period end were as follows:
Gross unrealized appreciation | $ 8,604,687 |
Gross unrealized depreciation | (9,086,980) |
Net unrealized appreciation (depreciation) on securities and other investments | $ (482,293) |
| |
Tax Cost | $ 78,502,373 |
The tax-based components of distributable earnings as of period end were as follows:
Undistributed ordinary income | $ 23,256 |
Undistributed long-term capital gain | $ 3,364,884 |
Net unrealized appreciation (depreciation) | $ (482,232) |
The tax character of distributions paid was as follows:
| December 31, 2011 | December 31, 2010 |
Ordinary Income | $ 1,275,950 | $ 1,618,555 |
Trading (Redemption) Fees. Shares held by investors less than 60 days are subject to a redemption fee equal to 1% of the net asset value of shares redeemed. All redemption fees, which reduce the proceeds of the shareholder redemption, are retained by the Fund and accounted for as an addition to paid in capital.
4. Operating Policies.
Restricted Securities. The Fund may invest in securities that are subject to legal or contractual restrictions on resale. These securities generally may be resold in transactions exempt from registration or to the public if the securities are registered. Disposal of these securities may involve time-consuming negotiations and expense, and prompt sale at an acceptable price may be difficult. Information regarding restricted securities is included at the end of the Fund's Schedule of Investments.
Annual Report
Notes to Financial Statements - continued
5. Derivative Instruments.
Risk Exposures and the Use of Derivative Instruments. The Fund used derivative instruments (derivatives), including futures contracts in order to meet its investment objectives. The strategy is to use derivatives to increase returns and to manage exposure to certain risks as defined below. The success of any strategy involving derivatives depends on analysis of numerous economic factors, and if the strategies for investment do not work as intended, the Fund may not achieve its objectives.
The Fund's use of derivatives increased or decreased its exposure to the following risk:
Equity Risk | Equity risk relates to the fluctuations in the value of financial instruments as a result of changes in market prices (other than those arising from interest rate risk or foreign exchange risk), whether caused by factors specific to an individual investment, its issuer, or all factors affecting all instruments traded in a market or market segment. |
The Fund is also exposed to additional risks from investing in derivatives, such as liquidity risk and counterparty credit risk. Liquidity risk is the risk that the Fund will be unable to sell the derivative in the open market in a timely manner. Counterparty credit risk is the risk that the counterparty will not be able to fulfill its obligation to the Fund. The Fund's maximum risk of loss from counterparty credit risk is generally the aggregate unrealized appreciation and unpaid counterparty payments in excess of any collateral pledged by the counterparty to the Fund. Counterparty risk related to exchange-traded futures contracts is minimal because of the protection provided by the exchange on which they trade. Derivatives involve, to varying degrees, risk of loss in excess of the amounts recognized in the Statement of Assets and Liabilities.
Futures Contracts. A futures contract is an agreement between two parties to buy or sell a specified underlying instrument for a fixed price at a specified future date. The Fund used futures contracts to manage its exposure to the stock market.
Upon entering into a futures contract, a fund is required to deposit either cash or securities (initial margin) with a clearing broker in an amount equal to a certain percentage of the face value of the contract. Futures contracts are marked-to-market daily and subsequent payments are made or received by a fund depending on the daily fluctuations in the value of the futures contracts and are recorded as unrealized appreciation or (depreciation). This receivable and/or payable is included in daily variation margin on futures contracts in the Statement of Assets and Liabilities. Realized gain or (loss) is recorded upon the expiration or closing of a futures contract.
The underlying face amount at value of open futures contracts at period end is shown in the Schedule of Investments under the caption "Futures Contracts." This amount reflects each contract's exposure to the underlying instrument at period end and is representative of activity for the period. Securities deposited to meet initial margin requirements are identified in the Schedule of Investments.
Certain risks arise upon entering into futures contracts, including the risk that an illiquid market limits the ability to close out a futures contract prior to settlement date.
During the period the Fund recognized net realized gain (loss) of $46,237 and a change in net unrealized appreciation (depreciation) of $(9,014) related to its investment in futures contracts. These amounts are included in the Statement of Operations.
6. Purchases and Sales of Investments.
Purchases and sales of securities, other than short-term securities, aggregated $102,077,951 and $116,912,281, respectively.
7. Fees and Other Transactions with Affiliates.
Management Fee. FMR and its affiliates provide the Fund with investment management related services for which the Fund pays a monthly management fee. The management fee is the sum of an individual fund fee rate that is based on an annual rate of .30% of the Fund's average net assets and an annualized group fee rate that averaged .26% during the period. The group fee rate is based upon the average net assets of all the mutual funds advised by FMR. The group fee rate decreases as assets under management increase and increases as assets under management decrease. For the period, the total annual management fee rate was .56% of the Fund's average net assets.
Transfer Agent Fees. Fidelity Investments Institutional Operations Company, Inc. (FIIOC), an affiliate of FMR, is the Fund's transfer, dividend disbursing, and shareholder servicing agent. FIIOC receives an asset-based fee with respect to each class. Each class (with the exception of Investor Class) pays a transfer agent fee, excluding out of pocket expenses, equal to an annual rate of .07% of average net assets. Investor Class pays a monthly asset-based transfer agent fee of .15% of average net assets. In addition, FIIOC receives an asset-based fee of .0045% of average net assets for typesetting, printing and mailing of shareholder reports, except proxy statements. FIIOC voluntarily agreed to waive this fee for the period August 1, 2011 through December 31, 2011 (see Expense Reductions note). For the period, transfer agent fees for each class, including printing and out of pocket expenses, were as follows:
Initial Class | $ 29,853 |
Investor Class | 99,819 |
| $ 129,672 |
Annual Report
7. Fees and Other Transactions with Affiliates - continued
Accounting and Security Lending Fees. Fidelity Service Company, Inc. (FSC), an affiliate of FMR, maintains the Fund's accounting records. The accounting fee is based on the level of average net assets for the month. Under a separate contract, FSC administers the security lending program. The security lending fee is based on the number and duration of lending transactions.
Brokerage Commissions. The Fund placed a portion of its portfolio transactions with brokerage firms which are affiliates of the investment adviser. The commissions paid to these affiliated firms were $1,447 for the period.
8. Committed Line of Credit.
The Fund participates with other funds managed by FMR or an affiliate in a $4.0 billion credit facility (the "line of credit") to be utilized for temporary or emergency purposes to fund shareholder redemptions or for other short-term liquidity purposes. The Fund has agreed to pay commitment fees on its pro-rata portion of the line of credit, which amounted to $299 and is reflected in Miscellaneous expenses on the Statement of Operations. During the period, there were no borrowings on this line of credit.
9. Security Lending.
The Fund lends portfolio securities through a lending agent from time to time in order to earn additional income. For equity securities, a lending agent is used and may loan securities to certain qualified borrowers, including Fidelity Capital Markets (FCM), a broker-dealer affiliated with the Fund. On the settlement date of the loan, the Fund receives collateral (in the form of U.S. Treasury obligations, letters of credit and/or cash) against the loaned securities and maintains collateral in an amount not less than 100% of the market value of the loaned securities during the period of the loan. The market value of the loaned securities is determined at the close of business of the Fund and any additional required collateral is delivered to the Fund on the next business day. If the borrower defaults on its obligation to return the securities loaned because of insolvency or other reasons, a fund could experience delays and costs in recovering the securities loaned or in gaining access to the collateral. Any cash collateral received is invested in the Fidelity Securities Lending Cash Central Fund. The value of loaned securities and cash collateral at period end are disclosed on the Fund's Statement of Assets and Liabilities. Security lending income represents the income earned on investing cash collateral, less rebates paid to borrowers and any lending agent fees associated with the loan, plus any premium payments received for lending certain types of securities. Security lending income is presented in the Statement of Operations as a component of income from Fidelity Central Funds. Total security lending income during the period amounted to $31,802. During the period, there were no securities loaned to FCM.
10. Expense Reductions.
FMR or its affiliates agreed to waive certain fees during the period as noted in the table below.
Initial Class | $ 571 |
Investor Class | 961 |
| $ 1,532 |
Many of the brokers with whom FMR places trades on behalf of the Fund provided services to the Fund in addition to trade execution. These services included payments of certain expenses on behalf of the Fund totaling $7,270 for the period.
11. Distributions to Shareholders.
Distributions to shareholders of each class were as follows:
Years ended December 31, | 2011 | | 2010 |
From net investment income | | | |
Initial Class | $ 473,628 | | $ 768,995 |
Investor Class | 802,322 | | 828,136 |
Total | $ 1,275,950 | | $ 1,597,131 |
From net realized gain | | | |
Initial Class | $ - | | $ 9,884 |
Investor Class | - | | 11,540 |
Total | $ - | | $ 21,424 |
Annual Report
Notes to Financial Statements - continued
12. Share Transactions.
Transactions for each class of shares were as follows:
| Shares | Dollars |
Years ended December 31, | 2011 | 2010 | 2011 | 2010 |
Initial Class | | | | |
Shares sold | 879,897 | 1,674,640 | $ 11,600,497 | $ 19,438,449 |
Reinvestment of distributions | 41,877 | 61,964 | 473,628 | 778,878 |
Shares redeemed | (2,136,225) | (1,510,202) | (26,723,106) | (15,253,448) |
Net increase (decrease) | (1,214,451) | 226,402 | $ (14,648,981) | $ 4,963,879 |
Investor Class | | | | |
Shares sold | 2,106,512 | 2,259,987 | $ 27,668,003 | $ 26,397,630 |
Reinvestment of distributions | 70,939 | 66,823 | 802,322 | 839,676 |
Shares redeemed | (2,229,980) | (1,763,634) | (27,970,552) | (17,743,111) |
Net increase (decrease) | (52,529) | 563,176 | $ 499,773 | $ 9,494,195 |
13. Other.
The Fund's organizational documents provide former and current trustees and officers with a limited indemnification against liabilities arising in connection with the performance of their duties to the Fund. In the normal course of business, the Fund may also enter into contracts that provide general indemnifications. The Fund's maximum exposure under these arrangements is unknown as this would be dependent on future claims that may be made against the Fund. The risk of material loss from such claims is considered remote.
At the end of the period, FMR or its affiliates were the owners of record of 100% of the total outstanding shares of the fund.
Annual Report
Report of Independent Registered Public Accounting Firm
To the Trustees of Variable Insurance Products Fund IV and the Shareholders of VIP Materials Portfolio:
In our opinion, the accompanying statement of assets and liabilities, including the schedule of investments, and the related statements of operations and of changes in net assets and the financial highlights present fairly, in all material respects, the financial position of VIP Materials Portfolio (a fund of Variable Insurance Products Fund IV) at December 31, 2011, the results of its operations for the year then ended, the changes in its net assets for each of the two years in the period then ended and the financial highlights for each of the five years in the period then ended, in conformity with accounting principles generally accepted in the United States of America. These financial statements and financial highlights (hereafter referred to as "financial statements") are the responsibility of the VIP Materials Portfolio's management. Our responsibility is to express an opinion on these financial statements based on our audits. We conducted our audits of these financial statements in accordance with the standards of the Public Company Accounting Oversight Board (United States). Those standards require that we plan and perform the audit to obtain reasonable assurance about whether the financial statements are free of material misstatement. An audit includes examining, on a test basis, evidence supporting the amounts and disclosures in the financial statements, assessing the accounting principles used and significant estimates made by management, and evaluating the overall financial statement presentation. We believe that our audits, which included confirmation of securities at December 31, 2011 by correspondence with the custodian and brokers, provide a reasonable basis for our opinion.
/s/ PricewaterhouseCoopers LLP
PricewaterhouseCoopers LLP
Boston, Massachusetts
February 14, 2012
Annual Report
The Trustees, Members of the Advisory Board, and executive officers of the trust and fund, as applicable, are listed below. The Board of Trustees governs the fund and is responsible for protecting the interests of shareholders. The Trustees are experienced executives who meet periodically throughout the year to oversee the fund's activities, review contractual arrangements with companies that provide services to the fund, oversee management of the risks associated with such activities and contractual arrangements, and review the fund's performance. Except for James C. Curvey, each of the Trustees oversees 226 funds advised by FMR or an affiliate. Mr. Curvey oversees 429 funds advised by FMR or an affiliate.
The Trustees hold office without limit in time except that (a) any Trustee may resign; (b) any Trustee may be removed by written instrument, signed by at least two-thirds of the number of Trustees prior to such removal; (c) any Trustee who requests to be retired or who has become incapacitated by illness or injury may be retired by written instrument signed by a majority of the other Trustees; and (d) any Trustee may be removed at any special meeting of shareholders by a two-thirds vote of the outstanding voting securities of the trust. Each Trustee who is not an interested person (as defined in the 1940 Act) (Independent Trustee), shall retire not later than the last day of the calendar year in which his or her 75th birthday occurs. The Independent Trustees may waive this mandatory retirement age policy with respect to individual Trustees. The executive officers and Advisory Board Members hold office without limit in time, except that any officer and Advisory Board Member may resign or may be removed by a vote of a majority of the Trustees at any regular meeting or any special meeting of the Trustees. Except as indicated, each individual has held the office shown or other offices in the same company for the past five years.
Experience, Skills, Attributes, and Qualifications of the Fund's Trustees. The Governance and Nominating Committee has adopted a statement of policy that describes the experience, qualifications, attributes, and skills that are necessary and desirable for potential Independent Trustee candidates (Statement of Policy). The Board believes that each Trustee satisfied at the time he or she was initially elected or appointed a Trustee, and continues to satisfy, the standards contemplated by the Statement of Policy. The Governance and Nominating Committee also engages professional search firms to help identify potential Independent Trustee candidates who have the experience, qualifications, attributes, and skills consistent with the Statement of Policy. From time to time, additional criteria based on the composition and skills of the current Independent Trustees, as well as experience or skills that may be appropriate in light of future changes to board composition, business conditions, and regulatory or other developments, have also been considered by the professional search firms and the Governance and Nominating Committee. In addition, the Board takes into account the Trustees' commitment and participation in Board and committee meetings, as well as their leadership of standing and ad hoc committees throughout their tenure.
In determining that a particular Trustee was and continues to be qualified to serve as a Trustee, the Board has considered a variety of criteria, none of which, in isolation, was controlling. The Board believes that, collectively, the Trustees have balanced and diverse experience, qualifications, attributes, and skills, which allow the Board to operate effectively in governing the fund and protecting the interests of shareholders. Information about the specific experience, skills, attributes, and qualifications of each Trustee, which in each case led to the Board's conclusion that the Trustee should serve (or continue to serve) as a trustee of the fund, is provided below.
Board Structure and Oversight Function. James C. Curvey is an interested person (as defined in the 1940 Act) and currently serves as Acting Chairman. The Trustees have determined that an interested Chairman is appropriate and benefits shareholders because an interested Chairman has a personal and professional stake in the quality and continuity of services provided to the fund. Independent Trustees exercise their informed business judgment to appoint an individual of their choosing to serve as Chairman, regardless of whether the Trustee happens to be independent or a member of management. The Independent Trustees have determined that they can act independently and effectively without having an Independent Trustee serve as Chairman and that a key structural component for assuring that they are in a position to do so is for the Independent Trustees to constitute a substantial majority for the Board. The Independent Trustees also regularly meet in executive session. Ned C. Lautenbach serves as Chairman of the Independent Trustees and as such (i) acts as a liaison between the Independent Trustees and management with respect to matters important to the Independent Trustees and (ii) with management prepares agendas for Board meetings.
Fidelity funds are overseen by different Boards of Trustees. The fund's Board oversees Fidelity's equity and high income funds and another Board oversees Fidelity's investment-grade bond, money market, and asset allocation funds. The asset allocation funds may invest in Fidelity funds overseen by the fund's Board. The use of separate Boards, each with its own committee structure, allows the Trustees of each group of Fidelity funds to focus on the unique issues of the funds they oversee, including common research, investment, and operational issues. On occasion, the separate Boards establish joint committees to address issues of overlapping consequences for the Fidelity funds overseen by each Board.
The Trustees operate using a system of committees to facilitate the timely and efficient consideration of all matters of importance to the Trustees, the fund, and fund shareholders and to facilitate compliance with legal and regulatory requirements and oversight of the fund's activities and associated risks. The Board, acting through its committees, has charged FMR and its affiliates with (i) identifying events or circumstances the occurrence of which could have demonstrably adverse effects on the fund's business and/or reputation; (ii) implementing processes and controls to lessen the possibility that such events or circumstances occur or to mitigate the effects of such events or circumstances if they do occur; and (iii) creating and maintaining a system designed to evaluate continuously business and market conditions in order to facilitate the identification and implementation processes described in (i) and (ii) above. Because the day-to-day operations and activities of the fund are carried out by or through FMR, its affiliates and other service providers, the fund's exposure to risks is mitigated but not eliminated by the processes overseen by the Trustees. While each of the Board's committees has responsibility for overseeing different aspects of the fund's activities, oversight is exercised primarily through the Operations, Audit, and Compliance Committees. In addition, the Independent Trustees have worked with FMR to enhance the Board's oversight of investment and financial risks, legal and regulatory risks, technology risks, and operational risks, including the development of additional risk reporting to the Board. For example, a working group comprised of Independent Trustees and FMR has worked and continues to work to review the Fidelity funds' valuation-related activities, reporting and risk management. Appropriate personnel, including but not limited to the fund's Chief Compliance Officer (CCO), FMR's internal auditor, the independent accountants, the fund's Treasurer and portfolio management personnel, make periodic reports to the Board's committees, as appropriate, including an annual review of FMR's risk management program for the Fidelity funds. The responsibilities of each standing committee, including their oversight responsibilities, are described further under "Standing Committees of the Fund's Trustees."
Annual Report
Trustees and Officers - continued
The fund's Statement of Additional Information (SAI) includes more information about the Trustees. To request a free copy, call Fidelity at 1-877-208-0098.
Interested Trustees*:
Correspondence intended for each Trustee who is an interested person may be sent to Fidelity Investments, 82 Devonshire Street, Boston, Massachusetts 02109.
Name, Age; Principal Occupations and Other Relevant Experience+ |
James C. Curvey (76) |
| Year of Election or Appointment: 2007 Mr. Curvey is Trustee and Acting Chairman of the Board of Trustees of certain Trusts. Mr. Curvey also serves as Trustee (2007-present) of other investment companies advised by FMR. Mr. Curvey is a Director of Fidelity Investments Money Management, Inc. (2009-present), Director of Fidelity Research & Analysis Co. (2009-present) and Director of FMR and FMR Co., Inc. (2007-present). Mr. Curvey is also Vice Chairman (2007-present) and Director of FMR LLC. In addition, Mr. Curvey serves as an Overseer for the Boston Symphony Orchestra and a member of the Trustees of Villanova University. Previously, Mr. Curvey was the Vice Chairman (2006-2007) and Director (2000-2007) of FMR Corp. |
Ronald P. O'Hanley (54) |
| Year of Election or Appointment: 2011
Mr. O'Hanley is Director of FMR Co., Inc. (2010-present), Director of Fidelity Investments Money Management, Inc. (2010-present), Director of Fidelity Research & Analysis Company (2010-present), President of Fidelity Asset Management and Corporate Services and a member of Fidelity's Executive Committee (2010-present). Previously, Mr. O'Hanley served as President and Chief Executive Officer of BNY Mellon Asset Management (2007-2010). Mr. O'Hanley also served as Vice Chairman of Bank New York Mellon Corp. and a member of that firm's Executive Committee. Prior to the 2007 merger of The Bank of New York and Mellon Financial Corporation, he was Vice Chairman of Mellon Financial Corporation and President and Chief Executive Officer of Mellon Asset Management. He joined Mellon in February 1997. Mr. O'Hanley currently serves as Chairman of the Boston Public Library Foundation Board of Directors and sits on the Board of Directors of Beth Israel Deaconess Medical Center, the Board of Trustees of the Marine Biological Laboratory and the Advisory Board of the Maxwell School of Citizenship and Public Administration at Syracuse University. Mr. O'Hanley also chairs the Council on Asset Management for the Financial Services Roundtable and is a member of the Board of Directors of Institutional Investor's U.S. Institute. |
* Trustees have been determined to be "Interested Trustees" by virtue of, among other things, their affiliation with the trust or various entities under common control with FMR.
+ The information above includes each Trustee's principal occupation during the last five years and other information relating to the experience, attributes, and skills relevant to each Trustee's qualifications to serve as a Trustee, which led to the conclusion that each Trustee should serve as a Trustee for the fund.
Independent Trustees:
Correspondence intended for each Independent Trustee (that is, the Trustees other than the Interested Trustees) may be sent to Fidelity Investments, P.O. Box 55235, Boston, Massachusetts 02205-5235.
Name, Age; Principal Occupations and Other Relevant Experience+ |
Dennis J. Dirks (63) |
| Year of Election or Appointment: 2005 Prior to his retirement in May 2003, Mr. Dirks was Chief Operating Officer and a member of the Board of The Depository Trust & Clearing Corporation (DTCC). He also served as President, Chief Operating Officer, and Board member of The Depository Trust Company (DTC) and President and Board member of the National Securities Clearing Corporation (NSCC). In addition, Mr. Dirks served as Chief Executive Officer and Board member of the Government Securities Clearing Corporation, Chief Executive Officer and Board member of the Mortgage-Backed Securities Clearing Corporation, as a Trustee and a member of the Finance Committee of Manhattan College (2005-2008), and as a Trustee and a member of the Finance Committee of AHRC of Nassau County (2006-2008). Mr. Dirks is a member of the Independent Directors Council (IDC) Governing Council (2010-present) and Board of Directors for The Brookville Center for Children's Services, Inc. (2009-present). |
Alan J. Lacy (58) |
| Year of Election or Appointment: 2008 Mr. Lacy serves as Senior Adviser (2007-present) of Oak Hill Capital Partners, L.P. (private equity). Mr. Lacy also served as Chief Executive Officer (2000-2005) and Vice Chairman (2005-2006) of Sears Holdings Corporation and Sears, Roebuck and Co. (retail). In addition, Mr. Lacy serves as a member of the Board of Directors of Dave & Buster's, Inc. (restaurant and entertainment complexes, 2010-present), The Hillman Companies, Inc. (hardware wholesalers, 2010-present), and Bristol-Myers Squibb Company (global pharmaceuticals, 2007-present). Mr. Lacy is a member of the Board of Trustees of The National Parks Conservation Association (2006-present). Previously, Mr. Lacy served as Chairman of the Board of Trustees of the National Parks Conservation Association (2008-2011) and as a member of the Board of Directors for the Western Union Company (global money transfer, 2006-2011). |
Ned C. Lautenbach (67) |
| Year of Election or Appointment: 2000 Mr. Lautenbach is Chairman of the Independent Trustees of the Equity and High Income Funds (2006-present). Mr. Lautenbach currently serves as the Lead Director of the Eaton Corporation Board of Directors (diversified industrial, 1997-present). Mr. Lautenbach is also a member of the Board of Directors of the Philharmonic Center for the Arts in Naples, Florida (1999-present); a member of the Board of Trustees of Fairfield University (2005-present); and a member of the Council on Foreign Relations (1994-present). Previously, Mr. Lautenbach was a Partner/Advisory Partner at Clayton, Dubilier & Rice, LLC (private equity investment, 1998-2010), as well as a Director of Sony Corporation (2006-2007). |
Joseph Mauriello (67) |
| Year of Election or Appointment: 2008 Prior to his retirement in January 2006, Mr. Mauriello served in numerous senior management positions including Deputy Chairman and Chief Operating Officer (2004-2005), and Vice Chairman of Financial Services (2002-2004) of KPMG LLP US (professional services, 1965-2005). Mr. Mauriello currently serves as a member of the Board of Directors of XL Group plc. (global insurance and re-insurance, 2006-present) and of Arcadia Resources Inc. (health care services and products, 2007-present). Previously, Mr. Mauriello served as a Director of the Hamilton Funds of the Bank of New York (2006-2007). |
Robert W. Selander (61) |
| Year of Election or Appointment: 2011 Previously, Mr. Selander served as a Member of the Advisory Board of Fidelity's Equity and High Income Funds (2011), Executive Vice Chairman (2010), Chief Executive Officer (2009-2010), and President and Chief Executive Officer (1997-2009) of Mastercard, Inc. |
Cornelia M. Small (67) |
| Year of Election or Appointment: 2005 Ms. Small is a member of the Board of Directors of the Teagle Foundation (2009-present). Ms. Small is also a member of the Investment Committee, and Chair (2008-present) and a member of the Board of Trustees of Smith College. In addition, Ms. Small serves on the Investment Committee of the Berkshire Taconic Community Foundation (2008-present). Previously, Ms. Small served as Chairperson of the Investment Committee (2002-2008) of Smith College. In addition, Ms. Small served as Chief Investment Officer, Director of Global Equity Investments, and a member of the Board of Directors of Scudder, Stevens & Clark and Scudder Kemper Investments. |
William S. Stavropoulos (72) |
| Year of Election or Appointment: 2001
Mr. Stavropoulos is Vice Chairman of the Independent Trustees of the Equity and High Income Funds (2006-present). Mr. Stavropoulos serves as President and Founder of the Michigan Baseball Foundation, the Great Lakes Loons (2007-present). Mr. Stavropoulos is Chairman Emeritus of the Board of Directors of The Dow Chemical Company, where he previously served in numerous senior management positions, including President, CEO (1995-2000; 2002-2004), Chairman of the Executive Committee (2000-2006), and as a member of the Board of Directors (1990-2006). Currently, Mr. Stavropoulos is Chairman of Univar (global distributor of commodity and specialty chemicals, 2010-present), a Director of Teradata Corporation (data warehousing and technology solutions, 2008-present), Chemical Financial Corporation, Maersk Inc. (industrial conglomerate), Tyco International, Inc. (multinational manufacturing and services, 2007-present), and a member of the Advisory Board for Metalmark Capital (private equity investment, 2005-present). Mr. Stavropoulos is a special advisor to Clayton, Dubilier & Rice, LLC (private equity investment). In addition, Mr. Stavropoulos is a member of the University of Notre Dame Advisory Council for the College of Science. |
David M. Thomas (62) |
| Year of Election or Appointment: 2008 Previously, Mr. Thomas served as Executive Chairman (2005-2006) and Chairman and Chief Executive Officer (2000-2005) of IMS Health, Inc. (pharmaceutical and healthcare information solutions). In addition, Mr. Thomas serves as a member of the Board of Directors of Fortune Brands, Inc. (consumer products), and Interpublic Group of Companies, Inc. (marketing communication, 2004-present). |
Michael E. Wiley (61) |
| Year of Election or Appointment: 2008 Mr. Wiley also serves as a Director of Asia Pacific Exploration Consolidated (international oil and gas exploration and production, 2008-present). Mr. Wiley serves as a Director of Tesoro Corporation (independent oil refiner and marketer, 2005-present), and a Director of Bill Barrett Corporation (exploration and production, 2005-present). In addition, Mr. Wiley also serves as a Director of Post Oak Bank (privately-held bank, 2004-present). Previously, Mr. Wiley served as a member of the Board of Trustees of the University of Tulsa (2000-2006; 2007-2010), as a Senior Energy Advisor of Katzenbach Partners, LLC (consulting, 2006-2007), as an Advisory Director of Riverstone Holdings (private investment), Chairman, President, and CEO of Baker Hughes, Inc. (oilfield services, 2000-2004), and as Director of Spinnaker Exploration Company (exploration and production, 2001-2005). |
+ The information above includes each Trustee's principal occupation during the last five years and other information relating to the experience, attributes, and skills relevant to each Trustee's qualifications to serve as a Trustee, which led to the conclusion that each Trustee should serve as a Trustee for the fund.
Advisory Board Members and Executive Officers:
Correspondence intended for each executive officer, Edward C. Johnson 3d, and Peter S. Lynch may be sent to Fidelity Investments, 82 Devonshire Street, Boston, Massachusetts 02109.
Name, Age; Principal Occupation |
Edward C. Johnson 3d (81) |
| Year of Election or Appointment: 2011 Member of the Advisory Board of Fidelity's Equity and High Income Funds. Mr. Johnson serves as Chief Executive Officer, Chairman, and a Director of FMR LLC, and also serves as Chairman and Director of FIL Limited. Previously, Mr. Johnson served as a Trustee and Chairman of the Board of certain Fidelity Trusts, Chairman and a Director of FMR, Chairman and a Director of FMR Co., Inc., and President of FMR LLC (2006-2007). |
Peter S. Lynch (67) |
| Year of Election or Appointment: 2003 Member of the Advisory Board of Fidelity's Equity and High Income Funds. Mr. Lynch is Vice Chairman and a Director of FMR and FMR Co., Inc. In addition, Mr. Lynch serves as a Trustee of Boston College and as the Chairman of the Inner-City Scholarship Fund. Previously, Mr. Lynch served on the Special Olympics International Board of Directors (1997-2006). |
Kenneth B. Robins (42) |
| Year of Election or Appointment: 2008 President and Treasurer of Fidelity's Equity and High Income Funds. Mr. Robins also serves as President and Treasurer (2010-present) and Assistant Treasurer (2009-present) of other Fidelity funds and is an employee of Fidelity Investments (2004-present). Previously, Mr. Robins served as Deputy Treasurer of the Fidelity funds (2005-2008) and Treasurer and Chief Financial Officer of The North Carolina Capital Management Trust: Cash and Term Portfolios (2006-2008). |
Brian B. Hogan (47) |
| Year of Election or Appointment: 2009 Vice President of Equity and High Income Funds. Mr. Hogan also serves as President of FMR's Equity Division (2009-present). Previously, Mr. Hogan served as Senior Vice President, Equity Research of FMR (2006-2009) and as a portfolio manager. |
Christopher S. Bartel (40) |
| Year of Election or Appointment: 2009 Vice President of Fidelity's Sector and Real Estate Equity Funds. Mr. Bartel also serves as Senior Vice President of Equity Research (2009-present). Previously, Mr. Bartel served as Managing Director of Research (2006-2009) and an analyst and portfolio manager (2000-2006). |
Thomas C. Hense (47) |
| Year of Election or Appointment: 2008 or 2010 Vice President of Fidelity's High Income (2008), Small Cap (2008), and Value (2010) Funds. Previously, Mr. Hense served as a portfolio manager for Fidelity's Institutional Money Management Group (Pyramis) (2003-2008). |
Scott C. Goebel (43) |
| Year of Election or Appointment: 2008 Secretary and Chief Legal Officer (CLO) of the Fidelity funds. Mr. Goebel also serves as Secretary of Fidelity Investments Money Management, Inc. (FIMM) (2010-present) and Fidelity Research and Analysis Company (FRAC) (2010-present); Secretary and CLO of The North Carolina Capital Management Trust: Cash and Term Portfolios (2008-present); General Counsel, Secretary, and Senior Vice President of FMR (2008-present) and FMR Co., Inc. (2008-present); employed by FMR LLC or an affiliate (2001-present); Chief Legal Officer of Fidelity Management & Research (Hong Kong) Limited (2008-present) and Assistant Secretary of Fidelity Management & Research (Japan) Inc. (2008-present), and Fidelity Management & Research (U.K.) Inc. (2008-present). Previously, Mr. Goebel served as Assistant Secretary of FIMM (2008-2010), FRAC (2008-2010), and the Funds (2007-2008) and as Vice President and Secretary of Fidelity Distributors Corporation (FDC) (2005-2007). |
William C. Coffey (42) |
| Year of Election or Appointment: 2009 Assistant Secretary of Fidelity's Equity and High Income Funds. Mr. Coffey also serves as Senior Vice President and Deputy General Counsel of FMR LLC (2010-present), and is an employee of Fidelity Investments. Previously, Mr. Coffey served as Vice President and Associate General Counsel of FMR LLC (2005-2009). |
Holly C. Laurent (57) |
| Year of Election or Appointment: 2008 Anti-Money Laundering (AML) Officer of the Fidelity funds. Ms. Laurent also serves as AML Officer of The North Carolina Capital Management Trust: Cash and Term Portfolios (2008-present) and is an employee of Fidelity Investments. Previously, Ms. Laurent was Senior Vice President and Head of Legal for Fidelity Business Services India Pvt. Ltd. (2006-2008), and Senior Vice President, Deputy General Counsel and Group Head for FMR LLC (2005-2006). |
Christine Reynolds (53) |
| Year of Election or Appointment: 2008 Chief Financial Officer of the Fidelity funds. Ms. Reynolds became President of Fidelity Pricing and Cash Management Services (FPCMS) in August 2008. Ms. Reynolds served as Chief Operating Officer of FPCMS (2007-2008). Previously, Ms. Reynolds served as President, Treasurer, and Anti-Money Laundering officer of the Fidelity funds (2004-2007). |
Kenneth A. Rathgeber (64) |
| Year of Election or Appointment: 2004 Chief Compliance Officer of Fidelity's Equity and High Income Funds. Mr. Rathgeber is Chief Compliance Officer of Fidelity Management & Research (Hong Kong) Limited (2008-present), Fidelity Management & Research (Japan) Inc. (2008-present), FMR (2005-present), FMR Co., Inc. (2005-present), Fidelity Management & Research (U.K.) Inc. (2005-present), Fidelity Research & Analysis Company (2005-present), Fidelity Investments Money Management, Inc. (2005-present), Pyramis Global Advisors, LLC (2005-present), and Strategic Advisers, Inc. (2005-present). |
Jeffrey S. Christian (50) |
| Year of Election or Appointment: 2009 Deputy Treasurer of the Fidelity funds. Mr. Christian is an employee of Fidelity Investments. Previously, Mr. Christian served as Chief Financial Officer (2008-2009) of certain Fidelity funds and Senior Vice President of Fidelity Pricing and Cash Management Services (FPCMS) (2004-2009). |
Joseph F. Zambello (54) |
| Year of Election or Appointment: 2011 Deputy Treasurer of the Fidelity funds. Mr. Zambello is an employee of Fidelity Investments. Previously, Mr. Zambello served as Vice President of FMR's Program Management Group (2009-2011) and Vice President of the Transfer Agent Oversight Group (2005-2009). |
Adrien E. Deberghes (44) |
| Year of Election or Appointment: 2008 Deputy Treasurer of Fidelity's Equity and High Income Funds. Mr. Deberghes also serves as Vice President and Assistant Treasurer of Fidelity Rutland Square Trust II and Fidelity Commonwealth Trust II (2011-present), Assistant Treasurer of other Fidelity funds (2010-present), and is an employee of Fidelity Investments (2008-present). Previously, Mr. Deberghes served as Senior Vice President of Mutual Fund Administration at State Street Corporation (2007-2008), Senior Director of Mutual Fund Administration at Investors Bank & Trust (2005-2007), and Director of Finance for Dunkin' Brands (2000-2005). |
Stephanie J. Dorsey (42) |
| Year of Election or Appointment: 2010 Assistant Treasurer of Fidelity's Equity and High Income Funds. Ms. Dorsey also serves as Deputy Treasurer of other Fidelity funds (2008-present) and is an employee of Fidelity Investments (2008-present). Previously, Ms. Dorsey served as Treasurer (2004-2008) of the JPMorgan Mutual Funds and Vice President (2004-2008) of JPMorgan Chase Bank. |
John R. Hebble (53) |
| Year of Election or Appointment: 2009 Assistant Treasurer of Fidelity's Equity and High Income Funds. Mr. Hebble also serves as President (2011-present), Treasurer, and Chief Financial Officer of The North Carolina Capital Management Trust: Cash and Term Portfolios (2008-present), President and Treasurer of other Fidelity funds (2008-present) and is an employee of Fidelity Investments. |
Gary W. Ryan (53) |
| Year of Election or Appointment: 2005 Assistant Treasurer of the Fidelity funds. Mr. Ryan is an employee of Fidelity Investments. Previously, Mr. Ryan served as Vice President of Fund Reporting in Fidelity Pricing and Cash Management Services (FPCMS) (1999-2005). |
Jonathan Davis (43) |
| Year of Election or Appointment: 2010 Assistant Treasurer of the Fidelity funds. Mr. Davis is also Assistant Treasurer of Fidelity Rutland Square Trust II and Fidelity Commonwealth Trust II. Mr. Davis is an employee of Fidelity Investments. Previously, Mr. Davis served as Vice President and Associate General Counsel of FMR LLC (2003-2010). |
Annual Report
The Board of Trustees of VIP Materials Portfolio voted to pay to shareholders of record at the opening of business on record date, the following distributions per share derived from capital gains realized from sales of portfolio securities:
| Pay Date | Record Date | Capital Gains |
Initial Class | 02/10/2012 | 02/10/2012 | $0.470 |
Investor Class | 02/10/2012 | 02/10/2012 | $0.470 |
The fund hereby designates as a capital gain dividend with respect to the taxable year ended December 31, 2011, $3,364,884 or, if subsequently determined to be different, the net capital gain of such year.
Initial Class and Investor Class designates 100% of the dividends distributed in December, during the fiscal year as qualifying for the dividends-received deduction for corporate shareholders.
Annual Report
Board Approval of Investment Advisory Contracts and Management Fees
VIP Materials Portfolio
Each year, the Board of Trustees, including the Independent Trustees (together, the Board), votes on the renewal of the management contract and sub-advisory agreements (together, the Advisory Contracts) for the fund. The Board, assisted by the advice of fund counsel and Independent Trustees' counsel, requests and considers a broad range of information relevant to the renewal of the Advisory Contracts throughout the year.
The Board meets regularly and considers at each of its meetings factors that are relevant to its annual consideration of the renewal of the fund's Advisory Contracts, including the services and support provided to the fund and its shareholders. The Board has established various standing committees, each composed of Independent Trustees with varying backgrounds, to which the Board has assigned specific subject matter responsibilities in order to enhance effective decision-making by the Board. The Board, acting directly and through its Committees, requests and receives information concerning the annual consideration of the renewal of the fund's Advisory Contracts. The Board also meets as needed to consider matters specifically related to the Board's annual consideration of the renewal of Advisory Contracts. Members of the Board may also meet with trustees of other Fidelity funds through ad hoc joint committees to discuss certain matters relevant to the Fidelity funds.
At its July 2011 meeting, the Board of Trustees, including the Independent Trustees, unanimously determined to renew the fund's Advisory Contracts. In reaching its determination, the Board considered all factors it believed relevant, including (i) the nature, extent, and quality of the services to be provided to the fund and its shareholders (including the investment performance of the fund); (ii) the competitiveness of the fund's management fee and total expense ratio; (iii) the total costs of the services to be provided by and the profits to be realized by Fidelity from its relationship with the fund; (iv) the extent to which economies of scale would be realized as the fund grows; and (v) whether fee levels reflect these economies of scale, if any, for the benefit of fund shareholders.
In considering whether to renew the Advisory Contracts for the fund, the Board reached a determination, with the assistance of fund counsel and Independent Trustees' counsel and through the exercise of its business judgment, that the renewal of the Advisory Contracts is in the best interests of the fund and its shareholders and that the compensation payable under the Advisory Contracts is fair and reasonable. The Board's decision to renew the Advisory Contracts was not based on any single factor, but rather was based on a comprehensive consideration of all the information provided to the Board at its meetings throughout the year. The Board, in reaching its determination to renew the Advisory Contracts, is aware that shareholders in the fund have a broad range of investment choices available to them, including a wide choice among mutual funds offered by Fidelity's competitors, and that the fund's shareholders, who have the opportunity to review and weigh the disclosure provided by the fund in its prospectus and other public disclosures, have chosen to invest in this fund, managed by Fidelity.
Nature, Extent, and Quality of Services Provided. The Board considered the staffing within the investment adviser, FMR, and the sub-advisers (together, the Investment Advisers), including the backgrounds of the fund's investment personnel and the fund's investment objective and discipline. The Independent Trustees also had discussions with senior management of Fidelity's investment operations and investment groups. The Board considered the structure of the portfolio manager compensation program and whether this structure provides appropriate incentives to act in the best interests of the fund.
Resources Dedicated to Investment Management and Support Services. The Board and the Fund Oversight and Research Committees reviewed the general qualifications and capabilities of the Investment Advisers' investment staff, including its size, education, experience, and resources, as well as the Investment Advisers' approach to recruiting, training, managing, and compensating investment personnel. The Board also noted that FMR has devoted increased resources to non-U.S. offices. The Board noted that Fidelity's analysts have extensive resources, tools and capabilities which allow them to conduct sophisticated quantitative and fundamental analysis, as well as credit analysis of issuers, counterparties and enhancers. The Board also believes that Fidelity's investment professionals have sufficient access to global information and data so as to provide competitive investment results over time, and that those professionals also have access to sophisticated tools which permit them to assess portfolio construction and risk and performance attribution characteristics continuously, as well as to transmit new information and research conclusions rapidly around the world. Additionally, in their deliberations, the Board considered the Investment Advisers' trading capabilities and resources which are an integral part of the investment management process.
Shareholder and Administrative Services. The Board considered (i) the nature, extent, quality, and cost of advisory, administrative, and shareholder services performed by the Investment Advisers and their affiliates under the Advisory Contracts and under separate agreements covering transfer agency, pricing and bookkeeping, and securities lending services for the fund; (ii) the nature and extent of the investment adviser's supervision of third party service providers, principally custodians and subcustodians; and (iii) the resources devoted to, and the record of compliance with, the fund's compliance policies and procedures. The Board also reviewed the allocation of fund brokerage, including allocations to brokers affiliated with the Investment Advisers, the use of brokerage commissions to pay fund expenses, and the use of "soft" commission dollars to pay for research services.
The Board noted that the growth of fund assets over time across the complex allows Fidelity to reinvest in the development of services designed to enhance the value or convenience of the Fidelity funds as investment vehicles. These services include 24-hour access to account information and market information through telephone representatives and over the Internet, investor education materials and asset allocation tools, and the expanded availability of Fidelity Investor Centers, with 35 new branches opening since 2010.
Annual Report
Investment in a Large Fund Family. The Board considered the benefits to shareholders of investing in a Fidelity fund, including the benefits of investing in a fund that is part of a large family of funds offering a variety of investment disciplines and providing a large variety of mutual fund investor services. The Board noted that Fidelity had taken, or had made recommendations that resulted in the Fidelity funds taking, a number of actions over the previous year that benefited particular funds, including (i) continuing to dedicate additional resources to investment research and support of the senior management team that oversees asset management; (ii) rationalizing product lines through the mergers of six funds into other funds; (iii) continuing to migrate the Freedom Funds to dedicated lower cost underlying funds; (iv) obtaining shareholder approval to broaden the investment strategies for Fidelity Consumer Finance Portfolio, Fidelity Emerging Asia Fund, and Fidelity Environment and Alternative Energy Portfolio; (v) contractually agreeing to reduce the management fees and impose other expense limitations on Spartan 500 Index Fund and U.S. Bond Index Fund in connection with launching new institutional classes of these funds; (vi) changing the name, primary and supplemental benchmarks, and investment policies of Fidelity Global Strategies Fund to support the fund's flexible investment mandate and global orientation; and (vii) reducing the transfer agency account fee rates on certain accounts.
Investment Performance. The Board considered whether the fund has operated in accordance with its investment objective, as well as its record of compliance with its investment restrictions. It also reviewed the fund's absolute investment performance for each class, as well as the fund's relative investment performance for each class measured over multiple periods against a third-party-sponsored index that reflects the market sector in which the fund invests. The Board noted that FMR does not believe that a meaningful peer group exists against which to compare the fund's performance. Because the fund had been in existence less than five calendar years, the following charts considered by the Board show, over the one- and three-year periods ended December 31, 2010, the cumulative total returns of Initial Class and Investor Class of the fund and the cumulative total returns of a third-party-sponsored index ("benchmark").
VIP Materials Portfolio
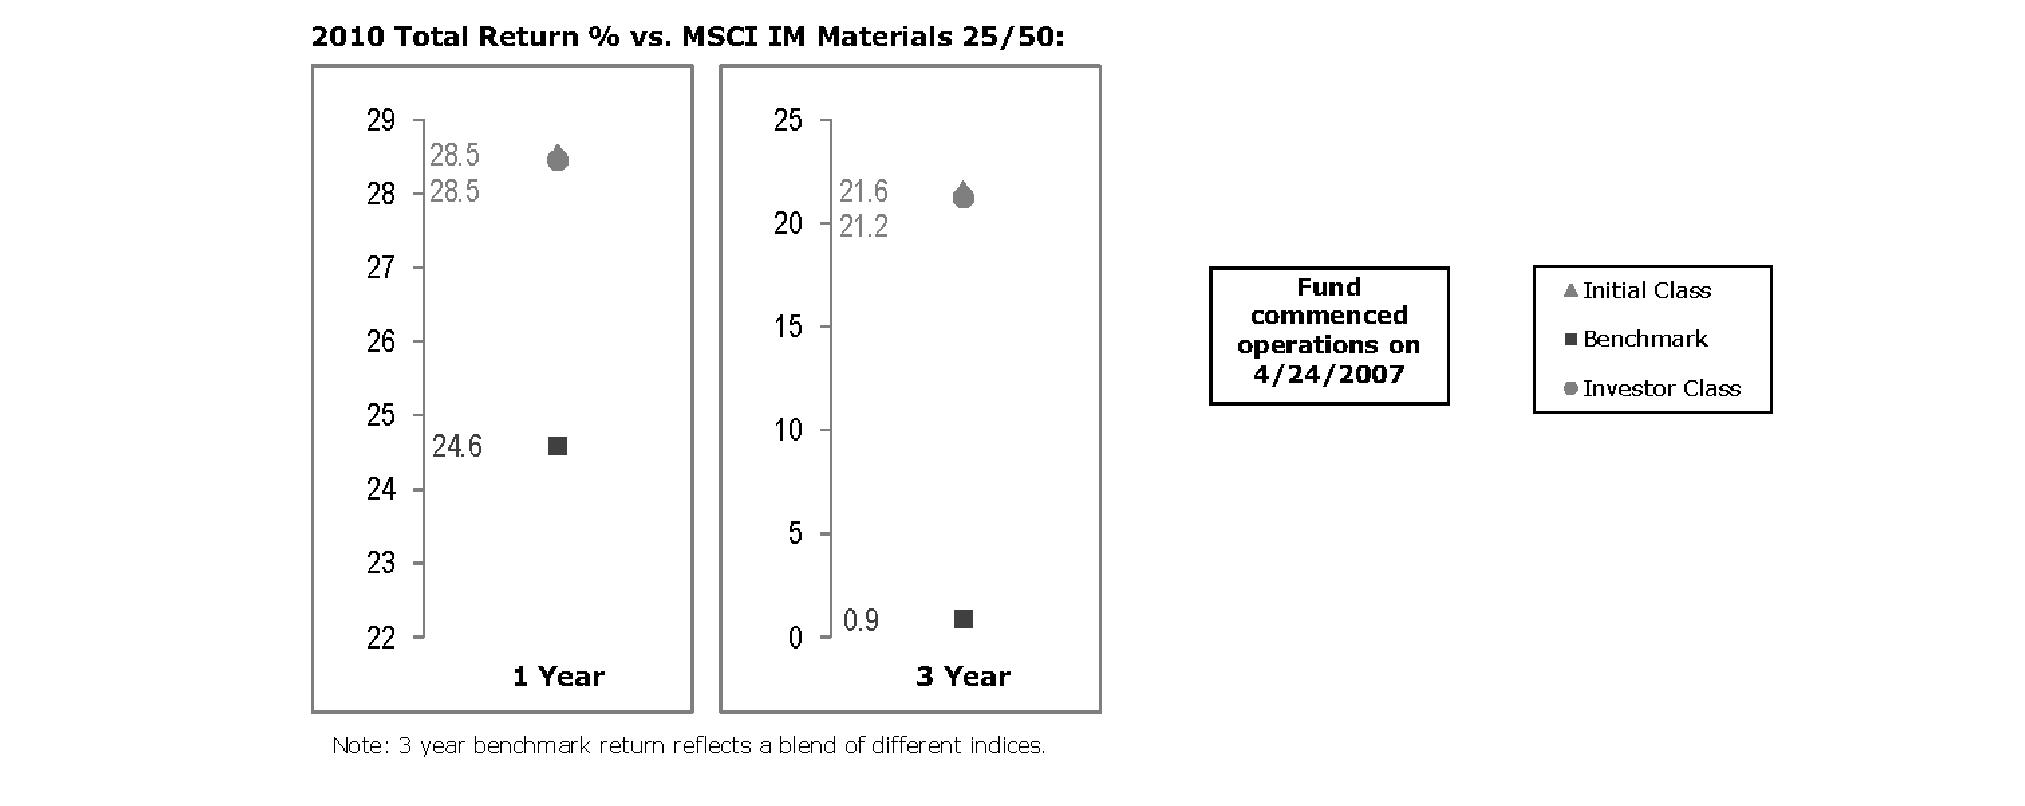
The Board noted that the investment performance of Initial Class of the fund compared favorably to its benchmark for all the periods shown. The Board considered that the variations in performance between the fund's classes reflect the variations in class expenses, which result in lower performance for the higher expense class. The Board also reviewed the fund's performance since inception as well as performance in the current year.
Based on its review, the Board concluded that the nature, extent, and quality of services provided to the fund under the Advisory Contracts should benefit the fund's shareholders.
Competitiveness of Management Fee and Total Expense Ratio. The Board considered the fund's management fee and total expense ratio compared to "mapped groups" of competitive funds and classes. Fidelity creates "mapped groups" by combining similar Lipper investment objective categories that have comparable management fee characteristics. Combining Lipper investment objective categories aids the Board's management fee and total expense ratio comparisons by broadening the competitive group used for comparison and by reducing the number of universes to which various Fidelity funds are compared.
Management Fee. The Board considered two proprietary management fee comparisons for the 12-month (or shorter) periods shown in the chart below. The group of Lipper funds used by the Board for management fee comparisons is referred to below as the "Total Mapped Group." The Total Mapped Group comparison focuses on a fund's standing relative to the total universe of comparable funds available to investors in terms of gross management fees before expense reimbursements or caps. "TMG %" represents the percentage of funds in the Total Mapped Group that had management fees that were lower than the fund's. For example, a TMG % of 2% means that 98% of the funds in the Total Mapped Group had higher management fees than the fund. The "Asset-Size Peer Group" (ASPG) comparison focuses on a fund's standing relative to non-Fidelity funds similar in size to the fund within the Total Mapped Group. The ASPG represents at least 15% of the funds in the Total Mapped Group with comparable asset size and management fee characteristics, subject to a minimum of 50 funds (or all funds in the Total Mapped Group if fewer than 50). Additional information, such as the ASPG quartile in which the fund's management fee ranked, is also included in the chart and considered by the Board.
Annual Report
Board Approval of Investment Advisory Contracts and Management Fees - continued
VIP Materials Portfolio
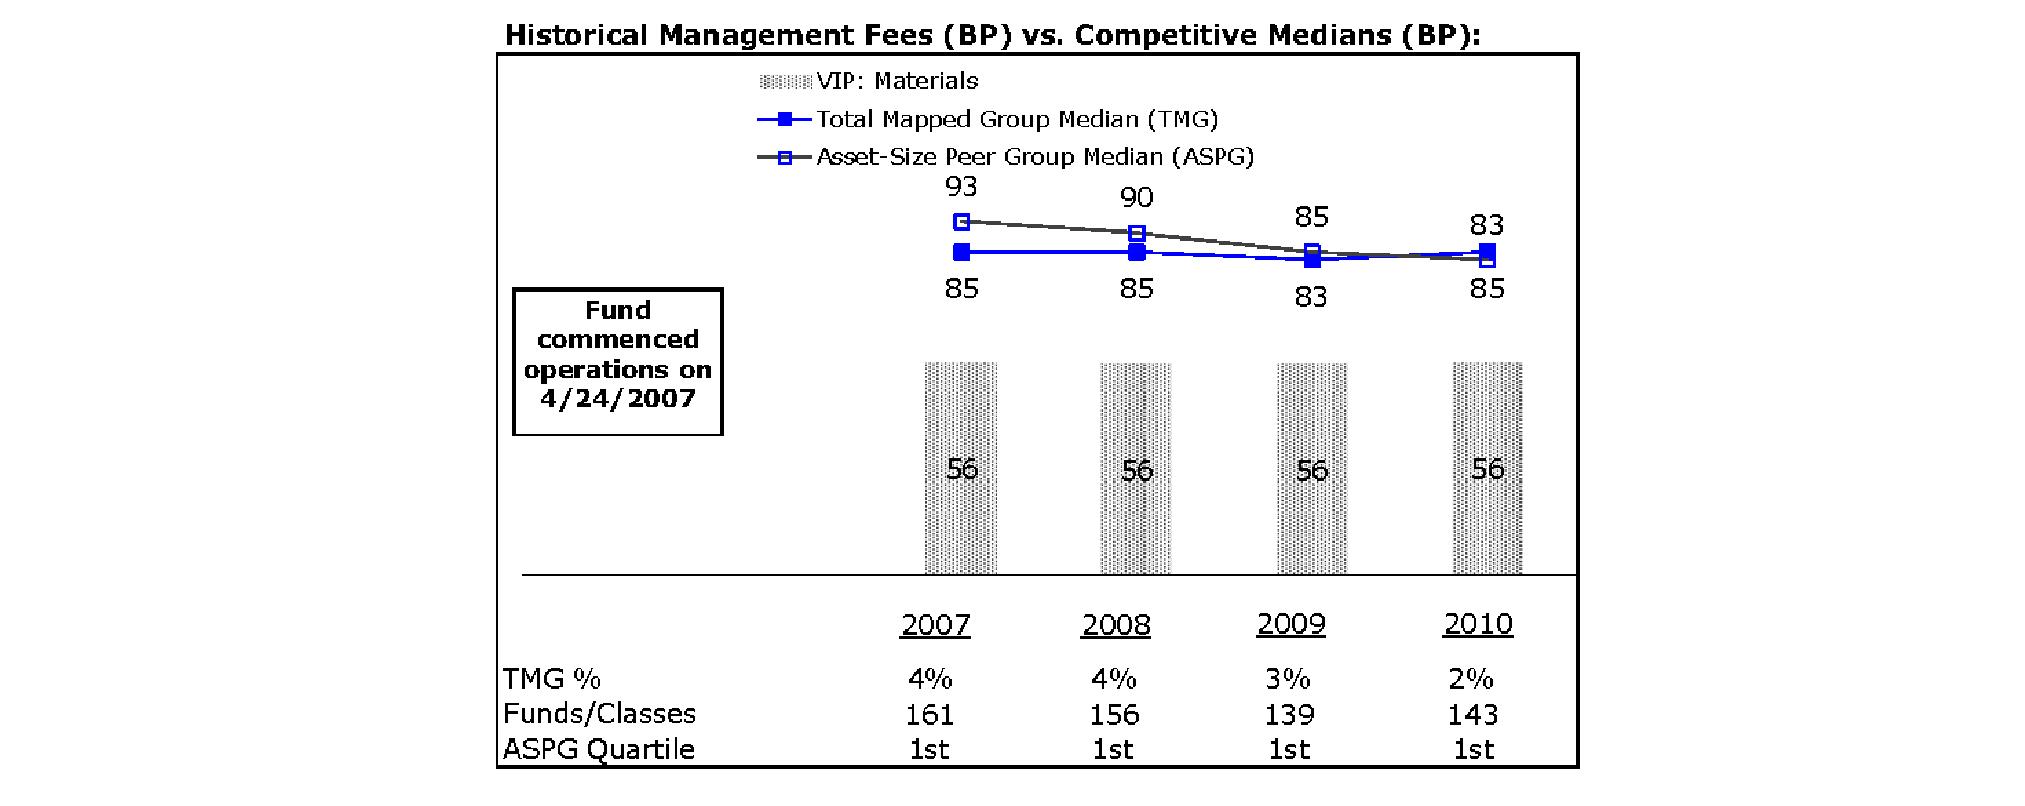
The Board noted that the fund's management fee ranked below the median of its Total Mapped Group and below the median of its ASPG for 2010.
Based on its review, the Board concluded that the fund's management fee is fair and reasonable in light of the services that the fund receives and the other factors considered.
Total Expense Ratio. In its review of each class's total expense ratio, the Board considered the fund's management fee as well as other fund or class expenses, as applicable, such as transfer agent fees, pricing and bookkeeping fees, and custodial, legal, and audit fees. The Board also noted the effects of any waivers and reimbursements on fees and expenses. As part of its review, the Board also considered the current and historical total expense ratios of each class of the fund compared to competitive fund median expenses. Each class of the fund is compared to those funds and classes in the Total Mapped Group (used by the Board for management fee comparisons) that have a similar sales load structure.
The Board noted that the total expense ratio of each class ranked below its competitive median for 2010. The Board considered that various factors, including 12b-1 fees, positive or negative performance adjustments, and relatively higher other expenses in the case of small fund size, can affect total expense ratios. The Board also noted that Investor Class has higher transfer agent fees than traditional variable annuity classes because it is designed for lower cost annuity products, where the majority of servicing costs are incorporated into the funds' total expense ratios rather than being paid at the annuity level.
Fees Charged to Other Fidelity Clients. The Board also considered Fidelity fee structures and other information with respect to clients of FMR and its affiliates, such as other mutual funds advised or subadvised by FMR or its affiliates, pension plan clients, and other institutional clients. In March 2010, the Board created an ad hoc joint committee with the board of other Fidelity funds (the Committee) to review and compare Fidelity's institutional investment advisory business with its business of providing services to the Fidelity funds, including the differences in services provided, fees charged, and costs incurred, as well as competition in their respective marketplaces.
Based on its review of total expense ratios and fees charged to other Fidelity clients, the Board concluded that the total expense ratio of each class of the fund was reasonable in light of the services that the fund and its shareholders receive and the other factors considered, including the findings of the Committee.
Costs of the Services and Profitability. The Board considered the revenues earned and the expenses incurred by Fidelity in conducting the business of developing, marketing, distributing, managing, administering and servicing the fund and its shareholders. The Board also considered the level of Fidelity's profits in respect of all the Fidelity funds.
On an annual basis, FMR presents to the Board Fidelity's profitability for the fund. Fidelity calculates the profitability for each fund, as well as aggregate profitability for groups of Fidelity funds and all Fidelity funds, using a series of detailed revenue and cost allocation methodologies which originate with the books and records of Fidelity on which Fidelity's audited financial statements are based. The Audit Committee of the Board reviews any significant changes from the prior year's methodologies.
Annual Report
PricewaterhouseCoopers LLP (PwC), independent registered public accounting firm and auditor to Fidelity and certain Fidelity funds, has been engaged annually by the Board as part of the Board's assessment of Fidelity's profitability analysis. PwC's engagement includes the review and assessment of Fidelity's methodologies used in determining the revenues and expenses attributable to Fidelity's mutual fund business, and completion of agreed-upon procedures surrounding the mathematical accuracy of fund profitability and its conformity to allocation methodologies. After considering PwC's reports issued under the engagement and information provided by Fidelity, the Board concluded that while other allocation methods may also be reasonable, Fidelity's profitability methodologies are reasonable in all material respects.
The Board also reviewed Fidelity's non-fund businesses and fall-out benefits related to the mutual fund business as well as cases where Fidelity's affiliates may benefit from or be related to the fund's business.
The Board considered the costs of the services provided by and the profits realized by Fidelity in connection with the operation of the fund and was satisfied that the profitability was not excessive in the circumstances.
Economies of Scale. The Board considered whether there have been economies of scale in respect of the management of the Fidelity funds, whether the Fidelity funds (including the fund) have appropriately benefited from any such economies of scale, and whether there is potential for realization of any further economies of scale. The Board considered the extent to which the fund will benefit from economies of scale through increased services to the fund, through waivers or reimbursements, or through fee or expense reductions. The Board also noted that in 2009, it and the board of other Fidelity funds created an ad hoc committee (the Economies of Scale Committee) to analyze whether FMR attains economies of scale in respect of the management and servicing of the Fidelity funds, whether the Fidelity funds have appropriately benefited from such economies of scale, and whether there is potential for realization of any further economies of scale.
The Board recognized that the fund's management contract incorporates a "group fee" structure, which provides for lower group fee rates as total fund assets under FMR's management increase, and for higher group fee rates as total fund assets under FMR's management decrease. FMR calculates the group fee rates based on a tiered asset "breakpoint" schedule that varies based on asset class. The Board considered that the group fee is designed to deliver the benefits of economies of scale to fund shareholders when total Fidelity fund assets increase, even if assets of any particular fund are unchanged or have declined, because some portion of Fidelity's costs are attributable to services provided to all Fidelity funds, and all funds benefit if those costs can be allocated among more assets. The Board concluded that, given the group fee structure, fund shareholders will benefit from lower management fees as assets under FMR's management increase at the fund complex level, regardless of whether Fidelity achieves any such economies of scale.
The Board concluded, taking into account the analysis of the Economies of Scale Committee, that any potential economies of scale are being appropriately shared between fund shareholders and Fidelity.
Additional Information Requested by the Board. In order to develop fully the factual basis for consideration of the Fidelity funds' Advisory Contracts, the Board requested and received additional information on certain topics, including (i) fund performance trends, actions to be taken by FMR to improve certain funds' overall performance, and Fidelity's long-term strategies for certain funds; (ii) portfolio manager changes that have occurred during the past year and length of portfolio manager tenure for different categories of funds over time; (iii) Fidelity's compensation structure for portfolio managers and other key personnel and strategies for attracting and retaining non-investment personnel; (iv) the amount of the investment that each portfolio manager has made in the Fidelity fund(s) that he or she manages; (v) historical trends in Fidelity's realization of fall-out benefits; (vi) Fidelity's group fee structures and the rationale for the individual fee rates of certain funds; (vii) fund profitability methodology and the impact of certain factors on fund profitability results; (viii) trends regarding industry use of performance fee structures and Fidelity's compliance practices with respect to performance adjustment calculations; (ix) the fee structures in place for certain other Fidelity clients; and (x) explanations regarding the relative total expense ratios of certain funds and classes, total expense competitive trends, and actions that might be taken by FMR to reduce total expense ratios for certain funds and classes.
Based on its evaluation of all of the conclusions noted above, and after considering all factors it believed relevant, the Board ultimately concluded that the advisory fee structures are fair and reasonable, and that the fund's Advisory Contracts should be renewed.
Annual Report
Investment Adviser
Fidelity Management & Research Company
Boston, MA
Investment Sub-Advisers
FMR Co., Inc.
Fidelity Management & Research (U.K.) Inc.
Fidelity Management & Research (Hong Kong) Limited
Fidelity Management & Research (Japan) Inc.
General Distributor
Fidelity Distributors Corporation
Boston, MA
Transfer and Service Agents
Fidelity Investments Institutional Operations Company, Inc.
Boston, MA
Fidelity Service Company, Inc.
Boston, MA
Custodian
State Street Bank and Trust Company
Quincy, MA
VMATP-ANN-0212
1.850999.104
Fidelity® Variable Insurance Products:
Real Estate Portfolio
Annual Report
December 31, 2011
Contents
Performance | (Click Here) | How the fund has done over time. |
Management's Discussion of Fund Performance | (Click Here) | The Portfolio Manager's review of fundperformance and strategy. |
Shareholder Expense Example | (Click Here) | An example of shareholder expenses. |
Investment Changes | (Click Here) | A summary of major shifts in the fund's investments over the past six months. |
Investments | (Click Here) | A complete list of the fund's investments with their
market values. |
Financial Statements | (Click Here) | Statements of assets and liabilities, operations, and
changes in net assets, as well as financial highlights. |
Notes | (Click Here) | Notes to the financial statements. |
Report of Independent Registered Public Accounting Firm | (Click Here) | |
Trustees and Officers | (Click Here) | |
Board Approval of Investment Advisory Contracts and Management Fees | (Click Here) | |
To view a fund's proxy voting guidelines and proxy voting record for the 12-month period ended June 30, visit http://www.fidelity.com/proxyvotingresults or visit the Securities and Exchange Commission's (SEC) web site at http://www.sec.gov. You may also call 1-877-208-0098 to request a free copy of the proxy voting guidelines.
Fidelity® Variable Insurance Products are separate account options which are purchased through a variable insurance contract.
Standard & Poor's, S&P and S&P 500 are registered service marks of The McGraw-Hill Companies, Inc. and have been licensed for use by Fidelity Distributors Corporation.
Other third party marks appearing herein are the property of their respective owners.
All other marks appearing herein are registered or unregistered trademarks or service marks of FMR LLC or an affiliated company.
This report and the financial statements contained herein are submitted for the general information of the shareholders of the fund. This report is not authorized for distribution to prospective investors in the fund unless preceded or accompanied by an effective prospectus.
A fund files its complete schedule of portfolio holdings with the SEC for the first and third quarters of each fiscal year on Form N-Q. Forms N-Q are available on the SEC's web site at http://www.sec.gov. A fund's Forms N-Q may be reviewed and copied at the SEC's Public Reference Room in Washington, DC. Information regarding the operation of the SEC's Public Reference Room may be obtained by calling 1-800-SEC-0330. For a complete list of a fund's portfolio holdings, view the most recent holdings listing, semiannual report, or annual report on Fidelity's web site at http://www.fidelity.com, http://www.advisor.fidelity.com, or http://www.401k.com as applicable.
NOT FDIC INSURED • MAY LOSE VALUE • NO BANK GUARANTEE
Neither the fund nor Fidelity Distributors Corporation is a bank.
Annual Report
Average annual total return reflects the change in the value of an investment, assuming reinvestment of the class' distributions from dividend income and capital gains (the profits earned upon the sale of securities that have grown in value, if any) and assuming a constant rate of performance each year. During periods of reimbursement by Fidelity, a fund's total return will be greater than it would be had the reimbursement not occurred. Performance numbers are net of all underlying fund operating expenses, but do not include any insurance charges imposed by your insurance company's separate account. If performance information included the effect of these additional charges, the total returns would have been lower. How a fund did yesterday is no guarantee of how it will do tomorrow.
Average Annual Total Returns
Periods ended December 31, 2011 | Past 1
year | Past 5
years | Life of fund A |
VIP Real Estate Portfolio - Initial Class | 8.09% | -0.81% | 11.78% |
VIP Real Estate Portfolio - Service Class | 7.96% | -0.91% | 11.67% |
VIP Real Estate Portfolio - Service Class 2 | 7.78% | -1.06% | 11.49% |
VIP Real Estate Portfolio - Investor Class B | 8.03% | -0.90% | 11.70% |
A From November 6, 2002.
B The initial offering of Investor Class shares took place on July 21, 2005. Returns prior to July 21, 2005, are those of Initial Class. Had Investor Class's transfer agent fee been reflected, returns prior to July 21, 2005, would have been lower.
$10,000 Over Life of Fund
Let's say hypothetically that $10,000 was invested in VIP Real Estate Portfolio - Initial Class on November 6, 2002, when the fund started. The chart shows how the value of your investment would have changed, and also shows how the S&P 500® Index performed over the same period.
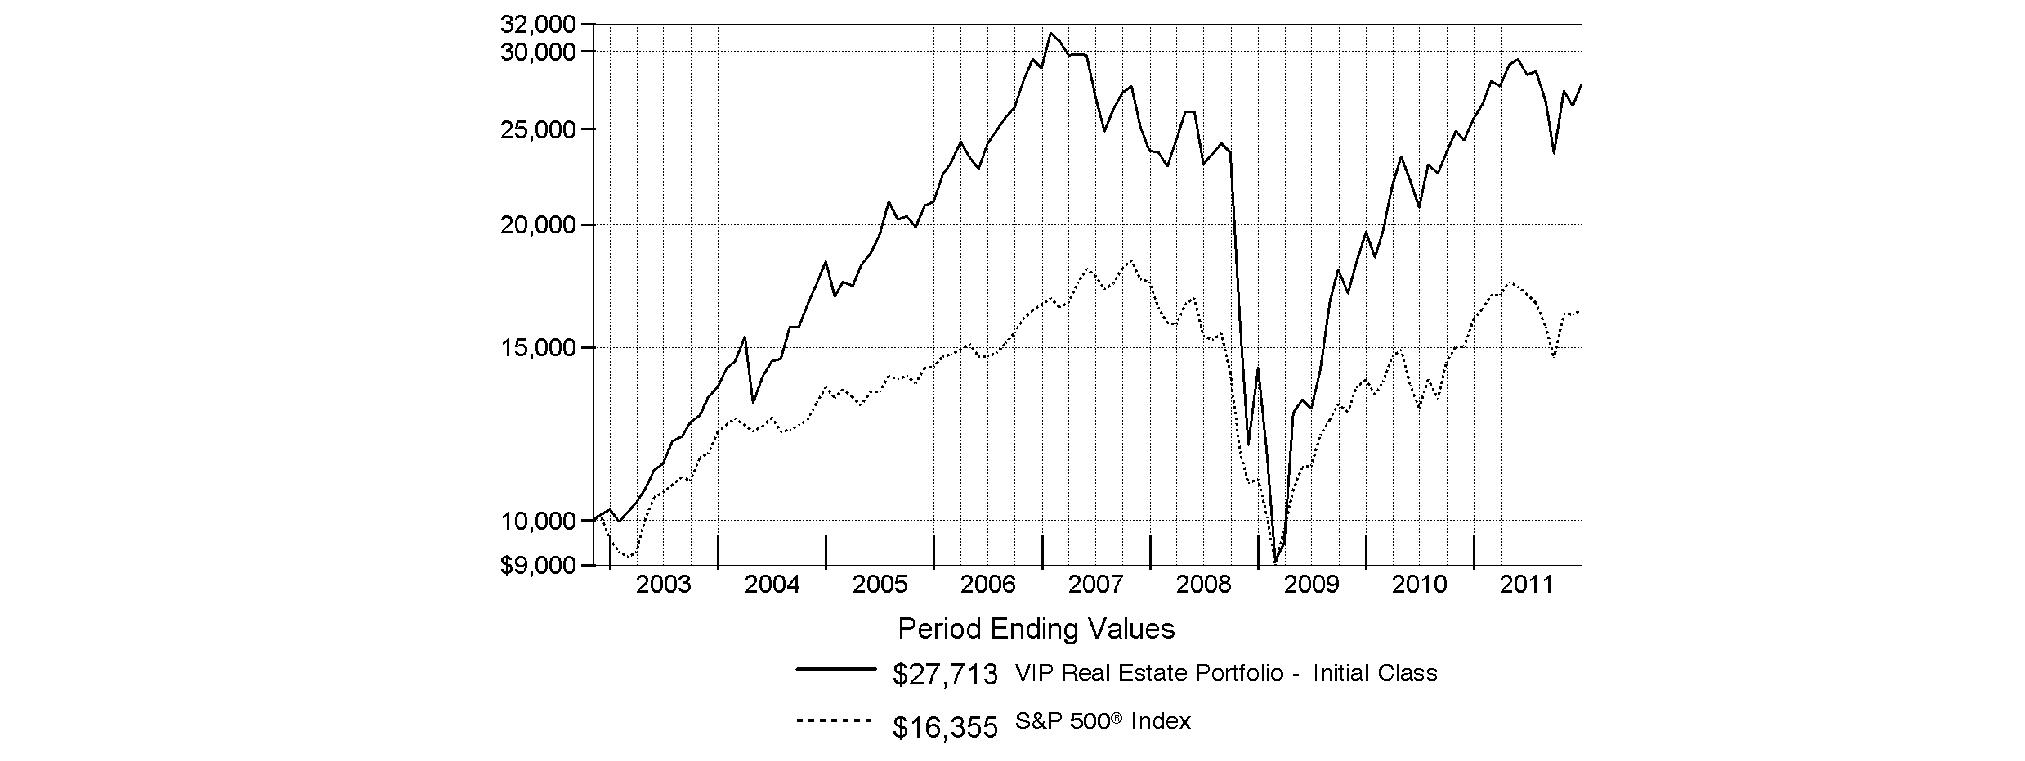
Annual Report
Market Recap: Extreme market volatility took center stage during the 12 months ending December 31, 2011, stealing the spotlight from signs of progress in the global economy. Early in the year, aggressive monetary stimulus by the U.S. federal government, improving credit-market conditions and solid corporate earnings buoyed most major asset classes. As the period progressed, however, fresh worries about sovereign debt in Europe, inflation in China, gridlock over raising the debt ceiling in the U.S. - along with Standard & Poor's early-August downgrade of the nation's long-term sovereign credit rating - and a dimmed outlook for global growth punctured investor confidence and ignited market instability. Domestic equities, as measured by the broad-based S&P 500® Index, gained 2.11%, easily outpacing the 13.61% decline of MSCI® ACWI® (All Country World Index) ex USA Index, a proxy for foreign stocks. Within the MSCI index, emerging markets declined the most (-18%), with investments here generally held back by a stronger U.S. dollar. The U.K. (-3%) fared better than the rest of Europe (-15%), which was the second-worst-performing index component. Bolstered by periodic flights to quality, U.S. investment-grade bonds posted a 7.84% advance, as reflected by the Barclays Capital® U.S. Aggregate Bond Index, outperforming the 4.37% gain of high-yield securities, as represented by The BofA Merrill LynchSM US High Yield Constrained Index. Hampered by financial woes in Europe, the sovereign debt of major developed markets outside the U.S. rose 4.86%, according to the Citigroup® Non-USD Group-of-Seven (G7) Equal Weighted Index, while the JPMorgan Emerging Markets Bond Index Global (EMBI Global) advanced 8.46%, despite the currency head wind.
Comments from Samuel Wald, Portfolio Manager of VIP Real Estate Portfolio: For the year ending December 31, 2011, the fund's share classes trailed the 8.87% return of the Dow Jones U.S. Select Real Estate Securities IndexSM. However, it significantly outpaced the 2.11% return of the broad equity market, as measured by the S&P 500®. (For specific portfolio results, please refer to the performance section of this report.) Hotel REITs did poorly during the parts of the year when investors worried about how a slowing economy would affect business. As such, Sunstone Hotel Investors and DiamondRock Hospitality were two of the fund's biggest laggards. Another sizable negative was an out-of-benchmark stake in St. Joe. This real estate developer that focuses on the Florida market - a particularly hard-hit area in the past several years - faced its own economic concerns and lost more than 40% of its value during the year. Healthcare Realty Trust, an owner of medical office buildings that I sold by period end, failed to lease its space as quickly as the market had hoped, while another health care REIT, HCP, also detracted. In the latter case, however, the fund's underperformance came from being underweighted in this relatively defensive large-cap company during times when the stock performed well. Two other disappointments were out-of-benchmark senior-living operators Brookdale Senior Living and Emeritus. The fund's leading relative contributor was a healthy underweighting in Host Hotels & Resorts, a poor-performing hotel REIT. Also boosting returns was an overweighting in Public Storage. This self-storage company is a very defensive stock, as it finances its operations very conservatively. In addition, self-storage companies' short average tenant stays can make them among the first to benefit from an improving economy. Apartment stocks also have relatively short leases, and this lifted shares of Essex Property Trust. Other notable relative contributors included student-housing company Education Realty Trust; Digital Realty Trust, an operator of data centers that overcame fears of oversupply in the industry; and office and shopping center REIT Vornado Realty Trust, a struggling benchmark component in which the fund was underweighted.
The views expressed above reflect those of the portfolio manager(s) only through the end of the period as stated on the cover of this report and do not necessarily represent the views of Fidelity or any other person in the Fidelity organization. Any such views are subject to change at any time based upon market or other conditions and Fidelity disclaims any responsibility to update such views. These views may not be relied on as investment advice and, because investment decisions for a Fidelity fund are based on numerous factors, may not be relied on as an indication of trading intent on behalf of any Fidelity fund.
Annual Report
As a shareholder of the Fund, you incur two types of costs: (1) transaction costs, and (2) ongoing costs, including management fees, distribution and/or service (12b-1) fees and other Fund expenses. This Example is intended to help you understand your ongoing costs (in dollars) of investing in the Fund and to compare these costs with the ongoing costs of investing in other mutual funds.
The Example is based on an investment of $1,000 invested at the beginning of the period and held for the entire period (July 1, 2011 to December 31, 2011).
Actual Expenses
The first line of the accompanying table for each class of the Fund provides information about actual account values and actual expenses. You may use the information in this line, together with the amount you invested, to estimate the expenses that you paid over the period. Simply divide your account value by $1,000.00 (for example, an $8,600 account value divided by $1,000.00 = 8.6), then multiply the result by the number in the first line for a class of the Fund under the heading entitled "Expenses Paid During Period" to estimate the expenses you paid on your account during this period. The estimate of expenses does not include any fees or other expenses of any variable annuity or variable life insurance product. If they were, the estimate of expenses you paid during the period would be higher, and your ending account value would be lower. In addition, the Fund, as a shareholder in the underlying Fidelity Central Funds, will indirectly bear its pro-rata share of the fees and expenses incurred by the underlying Fidelity Central Funds. These fees and expenses are not included in the Fund's annualized expense ratio used to calculate the expense estimate in the table below.
Hypothetical Example for Comparison Purposes
The second line of the accompanying table for each class of the Fund provides information about hypothetical account values and hypothetical expenses based on a Class' actual expense ratio and an assumed rate of return of 5% per year before expenses, which is not the Class' actual return. The hypothetical account values and expenses may not be used to estimate the actual ending account balance or expenses you paid for the period. You may use this information to compare the ongoing costs of investing in the Fund and other funds. To do so, compare this 5% hypothetical example with the 5% hypothetical examples that appear in the shareholder reports of the other funds. The estimate of expenses does not include any fees or other expenses of any variable annuity or variable life insurance product. If they were, the estimate of expenses you paid during the period would be higher, and your ending account value would be lower. In addition, the Fund, as a shareholder in the underlying Fidelity Central Funds, will indirectly bear its pro-rata share of the fees and expenses incurred by the underlying Fidelity Central Funds. These fees and expenses are not included in the Fund's annualized expense ratio used to calculate the expense estimate in the table below.
Please note that the expenses shown in the table are meant to highlight your ongoing costs only and do not reflect any transaction costs. Therefore, the second line of the table is useful in comparing ongoing costs only, and will not help you determine the relative total costs of owning different funds.
| Annualized Expense Ratio | Beginning
Account Value
July 1, 2011 | Ending
Account Value
December 31, 2011 | Expenses Paid
During Period*
July 1, 2011 to
December 31, 2011 |
Initial Class | .71% | | | |
Actual | | $ 1,000.00 | $ 976.00 | $ 3.54 |
HypotheticalA | | $ 1,000.00 | $ 1,021.63 | $ 3.62 |
Service Class | .81% | | | |
Actual | | $ 1,000.00 | $ 975.40 | $ 4.03 |
HypotheticalA | | $ 1,000.00 | $ 1,021.12 | $ 4.13 |
Service Class 2 | .95% | | | |
Actual | | $ 1,000.00 | $ 974.30 | $ 4.73 |
HypotheticalA | | $ 1,000.00 | $ 1,020.42 | $ 4.84 |
Investor Class | .79% | | | |
Actual | | $ 1,000.00 | $ 975.90 | $ 3.93 |
HypotheticalA | | $ 1,000.00 | $ 1,021.22 | $ 4.02 |
A 5% return per year before expenses
* Expenses are equal to each Class' annualized expense ratio, multiplied by the average account value over the period, multiplied by 184/365 (to reflect the one-half year period).
Annual Report
Investment Changes (Unaudited)
Top Ten Stocks as of December 31, 2011 |
| % of fund's
net assets | % of fund's net assets
6 months ago |
Simon Property Group, Inc. | 11.4 | 9.5 |
Public Storage | 7.9 | 7.1 |
Ventas, Inc. | 6.3 | 6.3 |
Prologis, Inc. | 5.7 | 6.4 |
Boston Properties, Inc. | 4.5 | 5.0 |
Digital Realty Trust, Inc. | 4.0 | 3.2 |
Equity Residential (SBI) | 4.0 | 3.5 |
Essex Property Trust, Inc. | 4.0 | 3.9 |
SL Green Realty Corp. | 3.7 | 4.5 |
Camden Property Trust (SBI) | 3.5 | 0.2 |
| 55.0 | |
Top Five REIT Sectors as of December 31, 2011 |
| % of fund's
net assets | % of fund's net assets
6 months ago |
REITs - Apartments | 17.3 | 15.4 |
REITs - Malls | 16.1 | 15.4 |
REITs - Industrial Buildings | 14.7 | 14.7 |
REITs - Office Buildings | 14.4 | 16.8 |
REITs - Health Care Facilities | 10.0 | 10.9 |
Asset Allocation (% of fund's net assets) |
As of December 31, 2011 * | As of June 30, 2011 ** |
| Stocks 95.9% | | | Stocks 98.0% | |
 | Convertible
Securities† 0.0% | | | Convertible
Securities† 0.0% | |
| Short-Term
Investments and
Net Other Assets 4.1% | | | Short-Term
Investments and
Net Other Assets 2.0% | |
* Foreign investments | 0.7% | | ** Foreign investments | 1.2% | |

† Amount represents less than 0.1% |
Annual Report
Investments December 31, 2011
Showing Percentage of Net Assets
Common Stocks - 95.9% |
| Shares | | Value |
HEALTH CARE PROVIDERS & SERVICES - 3.5% |
Health Care Facilities - 3.5% |
Brookdale Senior Living, Inc. (a) | 276,700 | | $ 4,811,813 |
Emeritus Corp. (a) | 190,837 | | 3,341,556 |
Sunrise Senior Living, Inc. (a)(d) | 157,531 | | 1,020,801 |
TOTAL HEALTH CARE FACILITIES | | 9,174,170 |
REAL ESTATE INVESTMENT TRUSTS - 90.6% |
REITs - Apartments - 17.3% |
AvalonBay Communities, Inc. | 24,892 | | 3,250,895 |
Camden Property Trust (SBI) | 148,233 | | 9,226,022 |
Education Realty Trust, Inc. | 618,300 | | 6,325,209 |
Equity Residential (SBI) | 183,974 | | 10,492,037 |
Essex Property Trust, Inc. | 74,331 | | 10,444,249 |
Post Properties, Inc. | 132,712 | | 5,802,169 |
TOTAL REITS - APARTMENTS | | 45,540,581 |
REITs - Health Care Facilities - 10.0% |
HCP, Inc. | 140,641 | | 5,826,757 |
Health Care REIT, Inc. | 71,625 | | 3,905,711 |
Ventas, Inc. | 300,371 | | 16,559,453 |
TOTAL REITS - HEALTH CARE FACILITIES | | 26,291,921 |
REITs - Hotels - 5.0% |
Chesapeake Lodging Trust | 249,409 | | 3,855,863 |
DiamondRock Hospitality Co. | 398,346 | | 3,840,055 |
Host Hotels & Resorts, Inc. | 254,230 | | 3,754,977 |
Sunstone Hotel Investors, Inc. (a) | 210,032 | | 1,711,761 |
TOTAL REITS - HOTELS | | 13,162,656 |
REITs - Industrial Buildings - 14.7% |
DCT Industrial Trust, Inc. | 416,300 | | 2,131,456 |
Prologis, Inc. | 520,967 | | 14,894,447 |
Public Storage | 154,089 | | 20,718,807 |
Stag Industrial, Inc. | 79,000 | | 906,130 |
TOTAL REITS - INDUSTRIAL BUILDINGS | | 38,650,840 |
REITs - Malls - 16.1% |
CBL & Associates Properties, Inc. | 499,044 | | 7,834,991 |
Simon Property Group, Inc. | 232,484 | | 29,976,486 |
The Macerich Co. | 88,640 | | 4,485,184 |
TOTAL REITS - MALLS | | 42,296,661 |
|
| Shares | | Value |
REITs - Management/Investment - 4.0% |
Digital Realty Trust, Inc. (d) | 159,351 | | $ 10,623,931 |
REITs - Office Buildings - 14.4% |
Alexandria Real Estate Equities, Inc. | 55,198 | | 3,807,006 |
Boston Properties, Inc. | 117,592 | | 11,712,163 |
Douglas Emmett, Inc. | 351,205 | | 6,405,979 |
Highwoods Properties, Inc. (SBI) | 208,193 | | 6,177,086 |
SL Green Realty Corp. | 147,952 | | 9,859,521 |
TOTAL REITS - OFFICE BUILDINGS | | 37,961,755 |
REITs - Shopping Centers - 9.1% |
Acadia Realty Trust (SBI) | 251,836 | | 5,071,977 |
DDR Corp. | 665,275 | | 8,096,397 |
Equity One, Inc. | 64,600 | | 1,096,908 |
Excel Trust, Inc. | 99,562 | | 1,194,744 |
Glimcher Realty Trust | 294,699 | | 2,711,231 |
Kite Realty Group Trust | 220,815 | | 995,876 |
Vornado Realty Trust | 63,239 | | 4,860,550 |
TOTAL REITS - SHOPPING CENTERS | | 24,027,683 |
TOTAL REAL ESTATE INVESTMENT TRUSTS | | 238,556,028 |
REAL ESTATE MANAGEMENT & DEVELOPMENT - 1.8% |
Diversified Real Estate Activities - 0.4% |
The St. Joe Co. (a)(d) | 70,775 | | 1,037,562 |
Real Estate Operating Companies - 1.4% |
Brookfield Properties Corp. | 126,090 | | 1,977,275 |
Forest City Enterprises, Inc. Class A (a) | 147,220 | | 1,740,140 |
TOTAL REAL ESTATE OPERATING COMPANIES | | 3,717,415 |
TOTAL REAL ESTATE MANAGEMENT & DEVELOPMENT | | 4,754,977 |
TOTAL COMMON STOCKS (Cost $204,781,785) |
252,485,175
|
Convertible Preferred Stocks - 0.0% |
| | | |
REAL ESTATE MANAGEMENT & DEVELOPMENT - 0.0% |
Real Estate Services - 0.0% |
Grubb & Ellis Co. 12.00% (e) (Cost $270,000) | 2,700 | |
17,550
|
Money Market Funds - 7.4% |
| Shares | | Value |
Fidelity Cash Central Fund, 0.11% (b) | 10,508,907 | | $ 10,508,907 |
Fidelity Securities Lending Cash Central Fund, 0.13% (b)(c) | 8,904,869 | | 8,904,869 |
TOTAL MONEY MARKET FUNDS (Cost $19,413,776) |
19,413,776
|
TOTAL INVESTMENT PORTFOLIO - 103.3% (Cost $224,465,561) | 271,916,501 |
NET OTHER ASSETS (LIABILITIES) - (3.3)% | (8,568,424) |
NET ASSETS - 100% | $ 263,348,077 |
Legend |
(a) Non-income producing |
(b) Affiliated fund that is available only to investment companies and other accounts managed by Fidelity Investments. The rate quoted is the annualized seven-day yield of the fund at period end. A complete unaudited listing of the fund's holdings as of its most recent quarter end is available upon request. In addition, each Fidelity Central Fund's financial statements, which are not covered by the Fund's Report of Independent Registered Public Accounting Firm, are available on the SEC's website or upon request. |
(c) Investment made with cash collateral received from securities on loan. |
(d) Security or a portion of the security is on loan at period end. |
(e) Security exempt from registration under Rule 144A of the Securities Act of 1933. These securities may be resold in transactions exempt from registration, normally to qualified institutional buyers. At the end of the period, the value of these securities amounted to $17,550 or 0.0% of net assets. |
Affiliated Central Funds |
Information regarding fiscal year to date income earned by the Fund from investments in Fidelity Central Funds is as follows: |
Fund | Income earned |
Fidelity Cash Central Fund | $ 10,297 |
Fidelity Securities Lending Cash Central Fund | 249,993 |
Total | $ 260,290 |
Other Information |
The following is a summary of the inputs used, as of December 31, 2011, involving the Fund's assets and liabilities carried at fair value. The inputs or methodology used for valuing securities may not be an indication of the risk associated with investing in those securities. For more information on valuation inputs, and their aggregation into the levels used in the table below, please refer to the Security Valuation section in the accompanying Notes to Financial Statements. |
Valuation Inputs at Reporting Date: |
Description | Total | Level 1 | Level 2 | Level 3 |
Investments in Securities: | | | | |
Common Stocks | $ 252,485,175 | $ 252,485,175 | $ - | $ - |
Convertible Preferred Stocks | 17,550 | - | 17,550 | - |
Money Market Funds | 19,413,776 | 19,413,776 | - | - |
Total Investments in Securities: | $ 271,916,501 | $ 271,898,951 | $ 17,550 | $ - |
See accompanying notes which are an integral part of the financial statements.
Annual Report
Statement of Assets and Liabilities
| December 31, 2011 |
| | |
Assets | | |
Investment in securities, at value (including securities loaned of $8,645,549) - See accompanying schedule: Unaffiliated issuers (cost $205,051,785) | $ 252,502,725 | |
Fidelity Central Funds (cost $19,413,776) | 19,413,776 | |
Total Investments (cost $224,465,561) | | $ 271,916,501 |
Cash | | 5,777 |
Foreign currency held at value (cost $9,190) | | 9,190 |
Receivable for investments sold | | 513,161 |
Receivable for fund shares sold | | 221,629 |
Dividends receivable | | 961,605 |
Distributions receivable from Fidelity Central Funds | | 4,792 |
Prepaid expenses | | 833 |
Other receivables | | 983 |
Total assets | | 273,634,471 |
| | |
Liabilities | | |
Payable for investments purchased | $ 1,091,574 | |
Payable for fund shares redeemed | 75,511 | |
Accrued management fee | 117,973 | |
Distribution and service plan fees payable | 25,386 | |
Other affiliated payables | 27,570 | |
Other payables and accrued expenses | 43,511 | |
Collateral on securities loaned, at value | 8,904,869 | |
Total liabilities | | 10,286,394 |
| | |
Net Assets | | $ 263,348,077 |
Net Assets consist of: | | |
Paid in capital | | $ 226,512,772 |
Undistributed net investment income | | 337,305 |
Accumulated undistributed net realized gain (loss) on investments and foreign currency transactions | | (10,952,940) |
Net unrealized appreciation (depreciation) on investments | | 47,450,940 |
Net Assets | | $ 263,348,077 |
Statement of Assets and Liabilities - continued
| December 31, 2011 |
| | |
Initial Class:
Net Asset Value, offering price and redemption price per share ($54,873,756 ÷ 3,652,800 shares) | | $ 15.02 |
| | |
Service Class:
Net Asset Value, offering price and redemption price per share ($597,392 ÷ 39,819 shares) | | $ 15.00 |
| | |
Service Class 2:
Net Asset Value, offering price and redemption price per share ($127,231,426 ÷ 8,559,274 shares) | | $ 14.86 |
| | |
Investor Class:
Net Asset Value, offering price and redemption price per share ($80,645,503 ÷ 5,387,708 shares) | | $ 14.97 |
See accompanying notes which are an integral part of the financial statements.
Annual Report
Statement of Operations
| Year ended December 31, 2011 |
| | |
Investment Income | | |
Dividends | | $ 5,470,666 |
Interest | | 2,314 |
Income from Fidelity Central Funds | | 260,290 |
Total income | | 5,733,270 |
| | |
Expenses | | |
Management fee | $ 1,398,072 | |
Transfer agent fees | 253,203 | |
Distribution and service plan fees | 290,082 | |
Accounting and security lending fees | 100,506 | |
Custodian fees and expenses | 26,164 | |
Independent trustees' compensation | 1,403 | |
Audit | 49,612 | |
Legal | 898 | |
Miscellaneous | 2,169 | |
Total expenses before reductions | 2,122,109 | |
Expense reductions | (12,623) | 2,109,486 |
Net investment income (loss) | | 3,623,784 |
Realized and Unrealized Gain (Loss) Net realized gain (loss) on: | | |
Investment securities: | | |
Unaffiliated issuers | 7,369,535 | |
Foreign currency transactions | (245) | |
Total net realized gain (loss) | | 7,369,290 |
Change in net unrealized appreciation (depreciation) on investment securities | | 6,178,354 |
Net gain (loss) | | 13,547,644 |
Net increase (decrease) in net assets resulting from operations | | $ 17,171,428 |
Statement of Changes in Net Assets
| Year ended
December 31,
2011 | Year ended
December 31,
2010 |
Increase (Decrease) in Net Assets | | |
Operations | | |
Net investment income (loss) | $ 3,623,784 | $ 1,643,043 |
Net realized gain (loss) | 7,369,290 | 5,424,260 |
Change in net unrealized appreciation (depreciation) | 6,178,354 | 34,601,498 |
Net increase (decrease) in net assets resulting
from operations | 17,171,428 | 41,668,801 |
Distributions to shareholders from net investment income | (2,624,868) | (2,468,435) |
Share transactions - net increase (decrease) | 27,706,393 | 95,325,522 |
Total increase (decrease) in net assets | 42,252,953 | 134,525,888 |
| | |
Net Assets | | |
Beginning of period | 221,095,124 | 86,569,236 |
End of period (including undistributed net investment income of $337,305 and distributions in excess of net investment income of $686,298, respectively) | $ 263,348,077 | $ 221,095,124 |
See accompanying notes which are an integral part of the financial statements.
Annual Report
Financial Highlights - Initial Class
Years ended December 31, | 2011 | 2010 | 2009 | 2008 | 2007 |
Selected Per-Share Data | | | | | |
Net asset value, beginning of period | $ 14.06 | $ 10.93 | $ 8.13 | $ 14.38 | $ 22.74 |
Income from Investment Operations | | | | | |
Net investment income (loss) C | .23 | .15 | .24 | .33 | .27 |
Net realized and unrealized gain (loss) | .90 | 3.16 | 2.80 | (6.06) | (4.15) |
Total from investment operations | 1.13 | 3.31 | 3.04 | (5.73) | (3.88) |
Distributions from net investment income | (.17) | (.18) | (.24) | (.36) | (.36) |
Distributions from net realized gain | - | - | - | (.16) | (4.12) |
Total distributions | (.17) | (.18) | (.24) | (.52) | (4.48) |
Net asset value, end of period | $ 15.02 | $ 14.06 | $ 10.93 | $ 8.13 | $ 14.38 |
Total Return A, B | 8.09% | 30.42% | 37.69% | (39.87)% | (17.72)% |
Ratios to Average Net Assets D, F | | | | | |
Expenses before reductions | .71% | .73% | .80% | .76% | .74% |
Expenses net of fee waivers, if any | .71% | .73% | .80% | .76% | .74% |
Expenses net of all reductions | .70% | .72% | .80% | .76% | .74% |
Net investment income (loss) | 1.58% | 1.22% | 3.01% | 2.51% | 1.21% |
Supplemental Data | | | | | |
Net assets, end of period (000 omitted) | $ 54,874 | $ 56,893 | $ 41,714 | $ 32,918 | $ 68,401 |
Portfolio turnover rate E | 61% | 64% | 94% | 87% | 102% |
A Total returns do not reflect charges attributable to your insurance company's separate account. Inclusion of these charges would reduce the total returns shown.
B Total returns would have been lower if certain expenses had not been reduced during the applicable periods shown.
C Calculated based on average shares outstanding during the period.
D Fees and expenses of any underlying Fidelity Central Funds are not included in the Fund's expense ratio. The Fund indirectly bears its proportionate share of the expenses of any underlying Fidelity Central Funds.
E Amount does not include the portfolio activity of any underlying Fidelity Central Funds.
F Expense ratios reflect operating expenses of the class. Expenses before reductions do not reflect amounts reimbursed by the investment adviser or reductions from brokerage service arrangements or reductions from other expense offset arrangements and do not represent the amount paid by the class during periods when reimbursements or reductions occur. Expenses net of fee waivers reflect expenses after reimbursement by the investment adviser but prior to reductions from brokerage service arrangements or other expense offset arrangements. Expenses net of all reductions represent the net expenses paid by the class.
Financial Highlights - Service Class
Years ended December 31, | 2011 | 2010 | 2009 | 2008 | 2007 |
Selected Per-Share Data | | | | | |
Net asset value, beginning of period | $ 14.04 | $ 10.91 | $ 8.11 | $ 14.33 | $ 22.69 |
Income from Investment Operations | | | | | |
Net investment income (loss) C | .22 | .14 | .23 | .32 | .24 |
Net realized and unrealized gain (loss) | .89 | 3.15 | 2.80 | (6.04) | (4.13) |
Total from investment operations | 1.11 | 3.29 | 3.03 | (5.72) | (3.89) |
Distributions from net investment income | (.15) | (.16) | (.23) | (.34) | (.35) |
Distributions from net realized gain | - | - | - | (.16) | (4.12) |
Total distributions | (.15) | (.16) | (.23) | (.50) | (4.47) |
Net asset value, end of period | $ 15.00 | $ 14.04 | $ 10.91 | $ 8.11 | $ 14.33 |
Total Return A, B | 7.96% | 30.30% | 37.62% | (39.95)% | (17.80)% |
Ratios to Average Net Assets D, F | | | | | |
Expenses before reductions | .81% | .83% | .90% | .86% | .83% |
Expenses net of fee waivers, if any | .81% | .83% | .90% | .86% | .83% |
Expenses net of all reductions | .80% | .82% | .89% | .85% | .83% |
Net investment income (loss) | 1.48% | 1.12% | 2.91% | 2.41% | 1.12% |
Supplemental Data | | | | | |
Net assets, end of period (000 omitted) | $ 597 | $ 793 | $ 1,051 | $ 1,385 | $ 3,543 |
Portfolio turnover rate E | 61% | 64% | 94% | 87% | 102% |
A Total returns do not reflect charges attributable to your insurance company's separate account. Inclusion of these charges would reduce the total returns shown.
B Total returns would have been lower if certain expenses had not been reduced during the applicable periods shown.
C Calculated based on average shares outstanding during the period.
D Fees and expenses of any underlying Fidelity Central Funds are not included in the Fund's expense ratio. The Fund indirectly bears its proportionate share of the expenses of any underlying Fidelity Central Funds.
E Amount does not include the portfolio activity of any underlying Fidelity Central Funds.
F Expense ratios reflect operating expenses of the class. Expenses before reductions do not reflect amounts reimbursed by the investment adviser or reductions from brokerage service arrangements or reductions from other expense offset arrangements and do not represent the amount paid by the class during periods when reimbursements or reductions occur. Expenses net of fee waivers reflect expenses after reimbursement by the investment adviser but prior to reductions from brokerage service arrangements or other expense offset arrangements. Expenses net of all reductions represent the net expenses paid by the class.
See accompanying notes which are an integral part of the financial statements.
Annual Report
Financial Highlights - Service Class 2
Years ended December 31, | 2011 | 2010 | 2009 | 2008 | 2007 |
Selected Per-Share Data | | | | | |
Net asset value, beginning of period | $ 13.92 | $ 10.84 | $ 8.07 | $ 14.28 | $ 22.62 |
Income from Investment Operations | | | | | |
Net investment income (loss) C | .19 | .12 | .23 | .28 | .21 |
Net realized and unrealized gain (loss) | .89 | 3.13 | 2.76 | (5.99) | (4.11) |
Total from investment operations | 1.08 | 3.25 | 2.99 | (5.71) | (3.90) |
Distributions from net investment income | (.14) | (.17) | (.22) | (.34) | (.32) |
Distributions from net realized gain | - | - | - | (.16) | (4.12) |
Total distributions | (.14) | (.17) | (.22) | (.50) | (4.44) |
Net asset value, end of period | $ 14.86 | $ 13.92 | $ 10.84 | $ 8.07 | $ 14.28 |
Total Return A, B | 7.78% | 30.09% | 37.40% | (40.06)% | (17.91)% |
Ratios to Average Net Assets D, F | | | | | |
Expenses before reductions | .95% | .98% | 1.07% | 1.03% | .98% |
Expenses net of fee waivers, if any | .95% | .97% | 1.07% | 1.03% | .98% |
Expenses net of all reductions | .95% | .96% | 1.06% | 1.03% | .98% |
Net investment income (loss) | 1.34% | .97% | 2.74% | 2.24% | .97% |
Supplemental Data | | | | | |
Net assets, end of period (000 omitted) | $ 127,231 | $ 101,038 | $ 9,878 | $ 2,864 | $ 3,558 |
Portfolio turnover rate E | 61% | 64% | 94% | 87% | 102% |
A Total returns do not reflect charges attributable to your insurance company's separate account. Inclusion of these charges would reduce the total returns shown.
B Total returns would have been lower if certain expenses had not been reduced during the applicable periods shown.
C Calculated based on average shares outstanding during the period.
D Fees and expenses of any underlying Fidelity Central Funds are not included in the Fund's expense ratio. The Fund indirectly bears its proportionate share of the expenses of any underlying Fidelity Central Funds.
E Amount does not include the portfolio activity of any underlying Fidelity Central Funds.
F Expense ratios reflect operating expenses of the class. Expenses before reductions do not reflect amounts reimbursed by the investment adviser or reductions from brokerage service arrangements or reductions from other expense offset arrangements and do not represent the amount paid by the class during periods when reimbursements or reductions occur. Expenses net of fee waivers reflect expenses after reimbursement by the investment adviser but prior to reductions from brokerage service arrangements or other expense offset arrangements. Expenses net of all reductions represent the net expenses paid by the class.
Financial Highlights - Investor Class
Years ended December 31, | 2011 | 2010 | 2009 | 2008 | 2007 |
Selected Per-Share Data | | | | | |
Net asset value, beginning of period | $ 14.01 | $ 10.90 | $ 8.11 | $ 14.34 | $ 22.69 |
Income from Investment Operations | | | | | |
Net investment income (loss) C | .22 | .14 | .24 | .31 | .24 |
Net realized and unrealized gain (loss) | .90 | 3.14 | 2.78 | (6.03) | (4.13) |
Total from investment operations | 1.12 | 3.28 | 3.02 | (5.72) | (3.89) |
Distributions from net investment income | (.16) | (.17) | (.23) | (.35) | (.34) |
Distributions from net realized gain | - | - | - | (.16) | (4.12) |
Total distributions | (.16) | (.17) | (.23) | (.51) | (4.46) |
Net asset value, end of period | $ 14.97 | $ 14.01 | $ 10.90 | $ 8.11 | $ 14.34 |
Total Return A, B | 8.03% | 30.25% | 37.57% | (39.91)% | (17.83)% |
Ratios to Average Net Assets D, F | | | | | |
Expenses before reductions | .79% | .82% | .90% | .85% | .85% |
Expenses net of fee waivers, if any | .79% | .81% | .90% | .85% | .85% |
Expenses net of all reductions | .78% | .80% | .89% | .85% | .85% |
Net investment income (loss) | 1.50% | 1.13% | 2.91% | 2.42% | 1.10% |
Supplemental Data | | | | | |
Net assets, end of period (000 omitted) | $ 80,646 | $ 62,371 | $ 33,926 | $ 22,711 | $ 31,632 |
Portfolio turnover rate E | 61% | 64% | 94% | 87% | 102% |
A Total returns do not reflect charges attributable to your insurance company's separate account. Inclusion of these charges would reduce the total returns shown.
B Total returns would have been lower if certain expenses had not been reduced during the applicable periods shown.
C Calculated based on average shares outstanding during the period.
D Fees and expenses of any underlying Fidelity Central Funds are not included in the Fund's expense ratio. The Fund indirectly bears its proportionate share of the expenses of any underlying Fidelity Central Funds.
E Amount does not include the portfolio activity of any underlying Fidelity Central Funds.
F Expense ratios reflect operating expenses of the class. Expenses before reductions do not reflect amounts reimbursed by the investment adviser or reductions from brokerage service arrangements or reductions from other expense offset arrangements and do not represent the amount paid by the class during periods when reimbursements or reductions occur. Expenses net of fee waivers reflect expenses after reimbursement by the investment adviser but prior to reductions from brokerage service arrangements or other expense offset arrangements. Expenses net of all reductions represent the net expenses paid by the class.
See accompanying notes which are an integral part of the financial statements.
Annual Report
Notes to Financial Statements
For the period ended December 31, 2011
1. Organization.
VIP Real Estate Portfolio (the Fund) is a non-diversified fund of Variable Insurance Products Fund IV (the Trust) and is authorized to issue an unlimited number of shares. The Trust is registered under the Investment Company Act of 1940, as amended (the 1940 Act), as an open-end management investment company organized as a Massachusetts business trust. Shares of the Fund may only be purchased by insurance companies for the purpose of funding variable annuity or variable life insurance contracts. The Fund offers the following classes of shares: Initial Class shares, Service Class shares, Service Class 2 shares and Investor Class shares. All classes have equal rights and voting privileges, except for matters affecting a single class. Investment income, realized and unrealized capital gains and losses, the common expenses of the Fund, and certain fund-level expense reductions, if any, are allocated on a pro-rata basis to each class based on the relative net assets of each class to the total net assets of the Fund. Each class differs with respect to transfer agent and distribution and service plan fees incurred. Certain expense reductions may also differ by class.
2. Investments in Fidelity Central Funds.
The Fund invests in Fidelity Central Funds, which are open-end investment companies available only to other investment companies and accounts managed by Fidelity Management & Research Company (FMR) and its affiliates. The Fund's Schedule of Investments lists each of the Fidelity Central Funds held as of period end, if any, as an investment of the Fund, but do not include the underlying holdings of each Fidelity Central Fund. As an Investing Fund, the Fund indirectly bears its proportionate share of the expenses of the underlying Fidelity Central Funds.
The Money Market Central Funds seek preservation of capital and current income and are managed by Fidelity Investments Money Management, Inc. (FIMM), an affiliate of FMR.
A complete unaudited list of holdings for each Fidelity Central Fund is available upon request or at the Securities and Exchange Commission (the SEC) web site at www.sec.gov. In addition, the financial statements of the Fidelity Central Funds, which are not covered by the Fund's Report of Independent Registered Public Accounting Firm are available on the SEC web site or upon request.
3. Significant Accounting Policies.
The financial statements have been prepared in conformity with accounting principles generally accepted in the United States of America (GAAP), which require management to make certain estimates and assumptions at the date of the financial statements. Actual results could differ from those estimates. Subsequent events, if any, through the date that the financial statements were issued have been evaluated in the preparation of the financial statements. The following summarizes the significant accounting policies of the Fund:
Security Valuation. Investments are valued as of 4:00 p.m. Eastern time on the last calendar day of the period. The Fund uses independent pricing services approved by the Board of Trustees to value its investments. When current market prices or quotations are not readily available or reliable, valuations may be determined in good faith in accordance with procedures adopted by the Board of Trustees. Factors used in determining value may include market or security specific events. The frequency with which these procedures are used cannot be predicted and they may be utilized to a significant extent. The value used for net asset value (NAV) calculation under these procedures may differ from published prices for the same securities.
The Fund categorizes the inputs to valuation techniques used to value its investments into a disclosure hierarchy consisting of three levels as shown below:
Level 1 - quoted prices in active markets for identical investments
Level 2 - other significant observable inputs (including quoted prices for similar investments, interest rates, prepayment speeds, etc.)
Level 3 - unobservable inputs (including the Fund's own assumptions based on the best information available)
Changes in valuation techniques may result in transfers in or out of an assigned level within the disclosure hierarchy. The aggregate value of investments by input level, as of December 31, 2011, is included at the end of the Fund's Schedule of Investments. Valuation techniques used to value the Fund's investments by major category are as follows:
Equity securities, including restricted securities, for which market quotations are readily available, are valued at the last reported sale price or official closing price as reported by an independent pricing service on the primary market or exchange on which they are traded and are categorized as Level 1 in the hierarchy. In the event there were no sales during the day or closing prices are not available, securities are valued at the last quoted bid price or may be valued using the last available price and are generally categorized as Level 2 in the hierarchy. For foreign equity securities, when significant market or security specific events arise, comparisons to the valuation of American Depositary Receipts (ADRs), futures contracts, Exchange-traded funds (ETFs) and certain indexes as well as quoted prices for similar securities are used and are categorized as Level 2 in the hierarchy in these circumstances. Utilizing these techniques may result in transfers between Level 1 and Level 2. For restricted equity securities and private placements where observable inputs are limited, assumptions about market activity and risk are used and are categorized as Level 3 in the hierarchy.
Investments in open-end mutual funds, including the Fidelity Central Funds, are valued at their closing net asset value each business day and are categorized as Level 1 in the hierarchy.
Annual Report
Notes to Financial Statements - continued
3. Significant Accounting Policies - continued
New Accounting Pronouncements. In May 2011, the Financial Accounting Standards Board issued Accounting Standard Update No. 2011-04, Fair Value Measurement (Topic 820) - Amendments to Achieve Common Fair Value Measurement and Disclosure Requirements in U.S. GAAP and IFRSs. The update is effective during interim and annual periods beginning after December 15, 2011 and will result in additional disclosure for transfers between levels as well as expanded disclosure for securities categorized as Level 3 under the fair value hierarchy.
In December 2011, the Financial Accounting Standards Board issued Accounting Standard Update No. 2011-11, Disclosures about Offsetting Assets and Liabilities. The update creates new disclosure requirements requiring entities to disclose both gross and net information for derivatives and other financial instruments that are either offset in the Statement of Assets and Liabilities or subject to an enforceable master netting arrangement or similar agreement. The disclosure requirements are effective for annual reporting periods beginning on or after January 1, 2013. Management is currently evaluating the impact of the update's adoption on the Fund's financial statement disclosures.
Foreign Currency. The Fund may use foreign currency contracts to facilitate transactions in foreign-denominated securities. Gains and losses from these transactions may arise from changes in the value of the foreign currency or if the counterparties do not perform under the contracts' terms.
Foreign-denominated assets, including investment securities, and liabilities are translated into U.S. dollars at the exchange rate at period end. Purchases and sales of investment securities, income and dividends received and expenses denominated in foreign currencies are translated into U.S. dollars at the exchange rate in effect on the transaction date.
The effects of exchange rate fluctuations on investments are included with the net realized and unrealized gain (loss) on investment securities. Other foreign currency transactions resulting in realized and unrealized gain (loss) are disclosed separately.
Investment Transactions and Income. For financial reporting purposes, the Fund's investment holdings and NAV include trades executed through the end of the last business day of the period. The NAV per share for processing shareholder transactions is calculated as of the close of business of the New York Stock Exchange (NYSE), normally 4:00 p.m. Eastern time and includes trades executed through the end of the prior business day. Gains and losses on securities sold are determined on the basis of identified cost and may include proceeds received from litigation. Dividend income is recorded on the ex-dividend date, except for certain dividends from foreign securities where the ex-dividend date may have passed, which are recorded as soon as the Fund is informed of the ex-dividend date. Non-cash dividends included in dividend income, if any, are recorded at the fair market value of the securities received. Distributions received on securities that represent a return of capital or capital gain are recorded as a reduction of cost of investments and/or as a realized gain. The Fund estimates the components of distributions received that may be considered return of capital distributions or capital gain distributions. Interest income and distributions from the Fidelity Central Funds are accrued as earned. Interest income includes coupon interest and amortization of premium and accretion of discount on debt securities. Investment income is recorded net of foreign taxes withheld where recovery of such taxes is uncertain.
Expenses. Expenses directly attributable to a fund are charged to that fund. Expenses attributable to more than one fund are allocated among the respective funds on the basis of relative net assets or other appropriate methods. Expense estimates are accrued in the period to which they relate and adjustments are made when actual amounts are known.
Income Tax Information and Distributions to Shareholders. Each year, the Fund intends to qualify as a regulated investment company, including distributing substantially all of its taxable income and realized gains under Subchapter M of the Internal Revenue Code. As a result, no provision for income taxes is required. As of December 31, 2011, the Fund did not have any unrecognized tax benefits in the financial statements; nor is the Fund aware of any tax positions for which it is reasonably possible that the total amounts of unrecognized tax benefits will significantly change in the next twelve months. The Fund files a U.S. federal tax return, in addition to state and local tax returns as required. A fund's tax returns are subject to examination by the Internal Revenue Service (IRS) for a period of three fiscal years. State and local tax returns may be subject to examination for an additional fiscal year depending on the jurisdiction. Foreign taxes are provided for based on the Fund's understanding of the tax rules and rates that exist in the foreign markets in which it invests.
Distributions are declared and recorded on the ex-dividend date. Income dividends and capital gain distributions are declared separately for each class. Income and capital gain distributions are determined in accordance with income tax regulations, which may differ from GAAP.
Capital accounts within the financial statements are adjusted for permanent book-tax differences. These adjustments have no impact on net assets or the results of operations. Temporary book-tax differences will reverse in a subsequent period.
Book-tax differences are primarily due to foreign currency transactions, non-taxable dividends, capital loss carryforwards and losses deferred due to wash sales and excise tax regulations.
Annual Report
3. Significant Accounting Policies - continued
Income Tax Information and Distributions to Shareholders - continued
The federal tax cost of investment securities and unrealized appreciation (depreciation) as of period end were as follows:
Gross unrealized appreciation | $ 58,125,893 |
Gross unrealized depreciation | (12,340,335) |
Net unrealized appreciation (depreciation) on securities and other investments | $ 45,785,558 |
Tax Cost | $ 226,130,943 |
The tax-based components of distributable earnings as of period end were as follows:
Undistributed ordinary income | $ 337,305 |
Capital loss carryforward | $ (8,796,378) |
Net unrealized appreciation (depreciation) | $ 45,785,558 |
Capital loss carryforwards are only available to offset future capital gains of the Fund to the extent provided by regulations and may be limited. Under the Regulated Investment Company Modernization Act of 2010 (the Act), the Fund is permitted to carry forward capital losses incurred in taxable years beginning after December 22, 2010 for an unlimited period and such capital losses are required to be used prior to any losses that expire. Capital loss carryforwards were as follows:
Fiscal year of expiration | |
2017 | $ (8,796,378) |
The tax character of distributions paid was as follows:
| December 31, 2011 | December 31, 2010 |
Ordinary Income | $ 2,624,868 | $ 2,468,435 |
4. Operating Policies.
Restricted Securities. The Fund may invest in securities that are subject to legal or contractual restrictions on resale. These securities generally may be resold in transactions exempt from registration or to the public if the securities are registered. Disposal of these securities may involve time-consuming negotiations and expense, and prompt sale at an acceptable price may be difficult. Information regarding restricted securities is included at the end of the Fund's Schedule of Investments.
5. Purchases and Sales of Investments.
Purchases and sales of securities, other than short-term securities, aggregated $173,685,232 and $149,995,623, respectively.
6. Fees and Other Transactions with Affiliates.
Management Fee. FMR and its affiliates provide the Fund with investment management related services for which the Fund pays a monthly management fee. The management fee is the sum of an individual fund fee rate that is based on an annual rate of .30% of the Fund's average net assets and an annualized group fee rate that averaged .26% during the period. The group fee rate is based upon the average net assets of all the mutual funds advised by FMR. The group fee rate decreases as assets under management increase and increases as assets under management decrease. For the period, the total annual management fee rate was .56% of the Fund's average net assets.
Distribution and Service Plan Fees. In accordance with Rule 12b-1 of the 1940 Act, the Fund has adopted separate 12b-1 Plans for each Service Class of shares. Each Service Class pays Fidelity Distributors Corporation (FDC), an affiliate of FMR, a service fee. For the period, the service fee is based on an annual rate of .10% of Service Class' average net assets and .25% of Service Class 2's average net assets.
For the period, total fees, all of which were re-allowed to insurance companies for the distribution of shares and providing shareholder support services were as follows:
Service Class | $ 701 |
Service Class 2 | 289,381 |
| $ 290,082 |
Annual Report
Notes to Financial Statements - continued
6. Fees and Other Transactions with Affiliates - continued
Transfer Agent Fees. Fidelity Investments Institutional Operations Company, Inc. (FIIOC), an affiliate of FMR, is the Fund's transfer, dividend disbursing, and shareholder servicing agent. FIIOC receives an asset-based fee with respect to each class. Each class (with the exception of Investor Class) pays a transfer agent fee, excluding out of pocket expenses, equal to an annual rate of .07% of average net assets. Investor Class pays a monthly asset-based transfer agent fee of .15% of average net assets. In addition, FIIOC receives an asset-based fee of .0045% of average net assets for typesetting, printing and mailing of shareholder reports, except proxy statements. FIIOC voluntarily agreed to waive this fee for the period August 1, 2011 through December 31, 2011 (see Expense Reductions note). For the period, transfer agent fees for each class, including printing and out of pocket expenses, were as follows:
Initial Class | $ 44,820 |
Service Class | 541 |
Service Class 2 | 85,115 |
Investor Class | 122,727 |
| $ 253,203 |
Accounting and Security Lending Fees. Fidelity Service Company, Inc. (FSC), an affiliate of FMR, maintains the Fund's accounting records. The accounting fee is based on the level of average net assets for the month. Under a separate contract, FSC administers the security lending program. The security lending fee is based on the number and duration of lending transactions.
Brokerage Commissions. The Fund placed a portion of its portfolio transactions with brokerage firms which are affiliates of the investment adviser. The commissions paid to these affiliated firms were $4,929 for the period.
7. Committed Line of Credit.
The Fund participates with other funds managed by FMR or an affiliate in a $4.0 billion credit facility (the "line of credit") to be utilized for temporary or emergency purposes to fund shareholder redemptions or for other short-term liquidity purposes. The Fund has agreed to pay commitment fees on its pro-rata portion of the line of credit, which amounted to $737 and is reflected in Miscellaneous expenses on the Statement of Operations. During the period, there were no borrowings on this line of credit.
8. Security Lending.
The Fund lends portfolio securities through a lending agent from time to time in order to earn additional income. For equity securities, a lending agent is used and may loan securities to certain qualified borrowers, including Fidelity Capital Markets (FCM), a broker-dealer affiliated with the Fund. On the settlement date of the loan, the Fund receives collateral (in the form of U.S. Treasury obligations, letters of credit and/or cash) against the loaned securities and maintains collateral in an amount not less than 100% of the market value of the loaned securities during the period of the loan. The market value of the loaned securities is determined at the close of business of the Fund and any additional required collateral is delivered to the Fund on the next business day. If the borrower defaults on its obligation to return the securities loaned because of insolvency or other reasons, a fund could experience delays and costs in recovering the securities loaned or in gaining access to the collateral. Any cash collateral received is invested in the Fidelity Securities Lending Cash Central Fund. The value of loaned securities and cash collateral at period end are disclosed on the Fund's Statement of Assets and Liabilities. At period end, there were no security loans outstanding with FCM. Security lending income represents the income earned on investing cash collateral, less rebates paid to borrowers and any lending agent fees associated with the loan, plus any premium payments received for lending certain types of securities. Security lending income is presented in the Statement of Operations as a component of income from Fidelity Central Funds. Total security lending income during the period amounted to $249,993, including $8,103 from securities loaned to FCM.
9. Expense Reductions.
FMR or its affiliates agreed to waive certain fees during the period as noted in the table below.
Initial Class | $ 1,046 |
Service Class | 13 |
Service Class 2 | 2,109 |
Investor Class | 1,401 |
| $ 4,569 |
Many of the brokers with whom FMR places trades on behalf of the Fund provided services to the Fund in addition to trade execution. These services included payments of certain expenses on behalf of the Fund totaling $8,042 for the period. In addition, through arrangements with the Fund's custodian, credits realized as a result of uninvested cash balances were used to reduce the Fund's expenses. During the period, these credits reduced the Fund's custody expenses by $12.
Annual Report
10. Distributions to Shareholders.
Distributions to shareholders of each class were as follows:
Years ended December 31, | 2011 | 2010 |
From net investment income | | |
Initial Class | $ 613,782 | $ 709,586 |
Service Class | 5,950 | 10,202 |
Service Class 2 | 1,157,729 | 1,025,592 |
Investor Class | 847,407 | 723,055 |
Total | $ 2,624,868 | $ 2,468,435 |
11. Share Transactions.
Transactions for each class of shares were as follows:
| Shares | Dollars |
Years ended December 31, | 2011 | 2010 | 2011 | 2010 |
Initial Class | | | | |
Shares sold | 690,403 | 1,702,146 | $ 10,363,547 | $ 21,466,837 |
Reinvestment of distributions | 42,535 | 54,676 | 613,782 | 709,586 |
Shares redeemed | (1,126,489) | (1,525,235) | (16,201,169) | (18,550,051) |
Net increase (decrease) | (393,551) | 231,587 | $ (5,223,840) | $ 3,626,372 |
Service Class | | | | |
Shares sold | - | - | $ - | $ - |
Reinvestment of distributions | 413 | 811 | 5,950 | 10,202 |
Shares redeemed | (17,064) | (40,685) | (248,209) | (503,857) |
Net increase (decrease) | (16,651) | (39,874) | $ (242,259) | $ (493,655) |
Service Class 2 | | | | |
Shares sold | 3,481,909 | 7,627,300 | $ 50,103,771 | $ 90,519,353 |
Reinvestment of distributions | 81,073 | 77,314 | 1,157,729 | 1,025,592 |
Shares redeemed | (2,263,345) | (1,356,033) | (32,808,590) | (16,978,350) |
Net increase (decrease) | 1,299,637 | 6,348,581 | $ 18,452,910 | $ 74,566,595 |
Investor Class | | | | |
Shares sold | 1,948,807 | 2,227,709 | $ 29,026,685 | $ 28,497,534 |
Reinvestment of distributions | 58,930 | 55,531 | 847,407 | 723,055 |
Shares redeemed | (1,071,550) | (943,977) | (15,154,510) | (11,594,379) |
Net increase (decrease) | 936,187 | 1,339,263 | $ 14,719,582 | $ 17,626,210 |
12. Other.
The Fund's organizational documents provide former and current trustees and officers with a limited indemnification against liabilities arising in connection with the performance of their duties to the Fund. In the normal course of business, the Fund may also enter into contracts that provide general indemnifications. The Fund's maximum exposure under these arrangements is unknown as this would be dependent on future claims that may be made against the Fund. The risk of material loss from such claims is considered remote.
At the end of the period, FMR or its affiliates were the owners of record of 50% of the total outstanding shares of the Fund and one otherwise unaffiliated shareholder was the owner of record of 45% of the total outstanding shares of the Fund.
Annual Report
Report of Independent Registered Public Accounting Firm
To the Trustees of Variable Insurance Products Fund IV and the Shareholders of VIP Real Estate Portfolio:
In our opinion, the accompanying statement of assets and liabilities, including the schedule of investments, and the related statements of operations and of changes in net assets and the financial highlights present fairly, in all material respects, the financial position of VIP Real Estate Portfolio (a fund of Variable Insurance Products Fund IV) at December 31, 2011, the results of its operations for the year then ended, the changes in its net assets for each of the two years in the period then ended and the financial highlights for each of the five years in the period then ended, in conformity with accounting principles generally accepted in the United States of America. These financial statements and financial highlights (hereafter referred to as "financial statements") are the responsibility of the VIP Real Estate Portfolio's management. Our responsibility is to express an opinion on these financial statements based on our audits. We conducted our audits of these financial statements in accordance with the standards of the Public Company Accounting Oversight Board (United States). Those standards require that we plan and perform the audit to obtain reasonable assurance about whether the financial statements are free of material misstatement. An audit includes examining, on a test basis, evidence supporting the amounts and disclosures in the financial statements, assessing the accounting principles used and significant estimates made by management, and evaluating the overall financial statement presentation. We believe that our audits, which included confirmation of securities at December 31, 2011 by correspondence with the custodian and brokers, provide a reasonable basis for our opinion.
/s/ PricewaterhouseCoopers LLP
PricewaterhouseCoopers LLP
Boston, Massachusetts
February 15, 2012
Annual Report
The Trustees, Members of the Advisory Board, and executive officers of the trust and fund, as applicable, are listed below. The Board of Trustees governs the fund and is responsible for protecting the interests of shareholders. The Trustees are experienced executives who meet periodically throughout the year to oversee the fund's activities, review contractual arrangements with companies that provide services to the fund, oversee management of the risks associated with such activities and contractual arrangements, and review the fund's performance. Except for James C. Curvey, each of the Trustees oversees 226 funds advised by FMR or an affiliate. Mr. Curvey oversees 429 funds advised by FMR or an affiliate.
The Trustees hold office without limit in time except that (a) any Trustee may resign; (b) any Trustee may be removed by written instrument, signed by at least two-thirds of the number of Trustees prior to such removal; (c) any Trustee who requests to be retired or who has become incapacitated by illness or injury may be retired by written instrument signed by a majority of the other Trustees; and (d) any Trustee may be removed at any special meeting of shareholders by a two-thirds vote of the outstanding voting securities of the trust. Each Trustee who is not an interested person (as defined in the 1940 Act) (Independent Trustee), shall retire not later than the last day of the calendar year in which his or her 75th birthday occurs. The Independent Trustees may waive this mandatory retirement age policy with respect to individual Trustees. The executive officers and Advisory Board Members hold office without limit in time, except that any officer and Advisory Board Member may resign or may be removed by a vote of a majority of the Trustees at any regular meeting or any special meeting of the Trustees. Except as indicated, each individual has held the office shown or other offices in the same company for the past five years.
Experience, Skills, Attributes, and Qualifications of the Fund's Trustees. The Governance and Nominating Committee has adopted a statement of policy that describes the experience, qualifications, attributes, and skills that are necessary and desirable for potential Independent Trustee candidates (Statement of Policy). The Board believes that each Trustee satisfied at the time he or she was initially elected or appointed a Trustee, and continues to satisfy, the standards contemplated by the Statement of Policy. The Governance and Nominating Committee also engages professional search firms to help identify potential Independent Trustee candidates who have the experience, qualifications, attributes, and skills consistent with the Statement of Policy. From time to time, additional criteria based on the composition and skills of the current Independent Trustees, as well as experience or skills that may be appropriate in light of future changes to board composition, business conditions, and regulatory or other developments, have also been considered by the professional search firms and the Governance and Nominating Committee. In addition, the Board takes into account the Trustees' commitment and participation in Board and committee meetings, as well as their leadership of standing and ad hoc committees throughout their tenure.
In determining that a particular Trustee was and continues to be qualified to serve as a Trustee, the Board has considered a variety of criteria, none of which, in isolation, was controlling. The Board believes that, collectively, the Trustees have balanced and diverse experience, qualifications, attributes, and skills, which allow the Board to operate effectively in governing the fund and protecting the interests of shareholders. Information about the specific experience, skills, attributes, and qualifications of each Trustee, which in each case led to the Board's conclusion that the Trustee should serve (or continue to serve) as a trustee of the fund, is provided below.
Board Structure and Oversight Function. James C. Curvey is an interested person (as defined in the 1940 Act) and currently serves as Acting Chairman. The Trustees have determined that an interested Chairman is appropriate and benefits shareholders because an interested Chairman has a personal and professional stake in the quality and continuity of services provided to the fund. Independent Trustees exercise their informed business judgment to appoint an individual of their choosing to serve as Chairman, regardless of whether the Trustee happens to be independent or a member of management. The Independent Trustees have determined that they can act independently and effectively without having an Independent Trustee serve as Chairman and that a key structural component for assuring that they are in a position to do so is for the Independent Trustees to constitute a substantial majority for the Board. The Independent Trustees also regularly meet in executive session. Ned C. Lautenbach serves as Chairman of the Independent Trustees and as such (i) acts as a liaison between the Independent Trustees and management with respect to matters important to the Independent Trustees and (ii) with management prepares agendas for Board meetings.
Fidelity funds are overseen by different Boards of Trustees. The fund's Board oversees Fidelity's equity and high income funds and another Board oversees Fidelity's investment-grade bond, money market, and asset allocation funds. The asset allocation funds may invest in Fidelity funds overseen by the fund's Board. The use of separate Boards, each with its own committee structure, allows the Trustees of each group of Fidelity funds to focus on the unique issues of the funds they oversee, including common research, investment, and operational issues. On occasion, the separate Boards establish joint committees to address issues of overlapping consequences for the Fidelity funds overseen by each Board.
The Trustees operate using a system of committees to facilitate the timely and efficient consideration of all matters of importance to the Trustees, the fund, and fund shareholders and to facilitate compliance with legal and regulatory requirements and oversight of the fund's activities and associated risks. The Board, acting through its committees, has charged FMR and its affiliates with (i) identifying events or circumstances the occurrence of which could have demonstrably adverse effects on the fund's business and/or reputation; (ii) implementing processes and controls to lessen the possibility that such events or circumstances occur or to mitigate the effects of such events or circumstances if they do occur; and (iii) creating and maintaining a system designed to evaluate continuously business and market conditions in order to facilitate the identification and implementation processes described in (i) and (ii) above. Because the day-to-day operations and activities of the fund are carried out by or through FMR, its affiliates and other service providers, the fund's exposure to risks is mitigated but not eliminated by the processes overseen by the Trustees. While each of the Board's committees has responsibility for overseeing different aspects of the fund's activities, oversight is exercised primarily through the Operations, Audit, and Compliance Committees. In addition, the Independent Trustees have worked with FMR to enhance the Board's oversight of investment and financial risks, legal and regulatory risks, technology risks, and operational risks, including the development of additional risk reporting to the Board. For example, a working group comprised of Independent Trustees and FMR has worked and continues to work to review the Fidelity funds' valuation-related activities, reporting and risk management. Appropriate personnel, including but not limited to the fund's Chief Compliance Officer (CCO), FMR's internal auditor, the independent accountants, the fund's Treasurer and portfolio management personnel, make periodic reports to the Board's committees, as appropriate, including an annual review of FMR's risk management program for the Fidelity funds. The responsibilities of each standing committee, including their oversight responsibilities, are described further under "Standing Committees of the Fund's Trustees."
Annual Report
Trustees and Officers - continued
The fund's Statement of Additional Information (SAI) includes more information about the Trustees. To request a free copy, call Fidelity at 1-877-208-0098.
Interested Trustees*:
Correspondence intended for each Trustee who is an interested person may be sent to Fidelity Investments, 82 Devonshire Street, Boston, Massachusetts 02109.
Name, Age; Principal Occupations and Other Relevant Experience+ |
James C. Curvey (76) |
| Year of Election or Appointment: 2007 Mr. Curvey is Trustee and Acting Chairman of the Board of Trustees of certain Trusts. Mr. Curvey also serves as Trustee (2007-present) of other investment companies advised by FMR. Mr. Curvey is a Director of Fidelity Investments Money Management, Inc. (2009-present), Director of Fidelity Research & Analysis Co. (2009-present) and Director of FMR and FMR Co., Inc. (2007-present). Mr. Curvey is also Vice Chairman (2007-present) and Director of FMR LLC. In addition, Mr. Curvey serves as an Overseer for the Boston Symphony Orchestra and a member of the Trustees of Villanova University. Previously, Mr. Curvey was the Vice Chairman (2006-2007) and Director (2000-2007) of FMR Corp. |
Ronald P. O'Hanley (54) |
| Year of Election or Appointment: 2011 Mr. O'Hanley is Director of FMR Co., Inc. (2010-present), Director of Fidelity Investments Money Management, Inc. (2010-present), Director of Fidelity Research & Analysis Company (2010-present), President of Fidelity Asset Management and Corporate Services and a member of Fidelity's Executive Committee (2010-present). Previously, Mr. O'Hanley served as President and Chief Executive Officer of BNY Mellon Asset Management (2007-2010). Mr. O'Hanley also served as Vice Chairman of Bank New York Mellon Corp. and a member of that firm's Executive Committee. Prior to the 2007 merger of The Bank of New York and Mellon Financial Corporation, he was Vice Chairman of Mellon Financial Corporation and President and Chief Executive Officer of Mellon Asset Management. He joined Mellon in February 1997. Mr. O'Hanley currently serves as Chairman of the Boston Public Library Foundation Board of Directors and sits on the Board of Directors of Beth Israel Deaconess Medical Center, the Board of Trustees of the Marine Biological Laboratory and the Advisory Board of the Maxwell School of Citizenship and Public Administration at Syracuse University. Mr. O'Hanley also chairs the Council on Asset Management for the Financial Services Roundtable and is a member of the Board of Directors of Institutional Investor's U.S. Institute. |
* Trustees have been determined to be "Interested Trustees" by virtue of, among other things, their affiliation with the trust or various entities under common control with FMR.
+ The information above includes each Trustee's principal occupation during the last five years and other information relating to the experience, attributes, and skills relevant to each Trustee's qualifications to serve as a Trustee, which led to the conclusion that each Trustee should serve as a Trustee for the fund.
Independent Trustees:
Correspondence intended for each Independent Trustee (that is, the Trustees other than the Interested Trustees) may be sent to Fidelity Investments, P.O. Box 55235, Boston, Massachusetts 02205-5235.
Name, Age; Principal Occupations and Other Relevant Experience+ |
Dennis J. Dirks (63) |
| Year of Election or Appointment: 2005 Prior to his retirement in May 2003, Mr. Dirks was Chief Operating Officer and a member of the Board of The Depository Trust & Clearing Corporation (DTCC). He also served as President, Chief Operating Officer, and Board member of The Depository Trust Company (DTC) and President and Board member of the National Securities Clearing Corporation (NSCC). In addition, Mr. Dirks served as Chief Executive Officer and Board member of the Government Securities Clearing Corporation, Chief Executive Officer and Board member of the Mortgage-Backed Securities Clearing Corporation, as a Trustee and a member of the Finance Committee of Manhattan College (2005-2008), and as a Trustee and a member of the Finance Committee of AHRC of Nassau County (2006-2008). Mr. Dirks is a member of the Independent Directors Council (IDC) Governing Council (2010-present) and Board of Directors for The Brookville Center for Children's Services, Inc. (2009-present). |
Alan J. Lacy (58) |
| Year of Election or Appointment: 2008 Mr. Lacy serves as Senior Adviser (2007-present) of Oak Hill Capital Partners, L.P. (private equity). Mr. Lacy also served as Chief Executive Officer (2000-2005) and Vice Chairman (2005-2006) of Sears Holdings Corporation and Sears, Roebuck and Co. (retail). In addition, Mr. Lacy serves as a member of the Board of Directors of Dave & Buster's, Inc. (restaurant and entertainment complexes, 2010-present), The Hillman Companies, Inc. (hardware wholesalers, 2010-present), and Bristol-Myers Squibb Company (global pharmaceuticals, 2007-present). Mr. Lacy is a member of the Board of Trustees of The National Parks Conservation Association (2006-present). Previously, Mr. Lacy served as Chairman of the Board of Trustees of the National Parks Conservation Association (2008-2011) and as a member of the Board of Directors for the Western Union Company (global money transfer, 2006-2011). |
Ned C. Lautenbach (67) |
| Year of Election or Appointment: 2000 Mr. Lautenbach is Chairman of the Independent Trustees of the Equity and High Income Funds (2006-present). Mr. Lautenbach currently serves as the Lead Director of the Eaton Corporation Board of Directors (diversified industrial, 1997-present). Mr. Lautenbach is also a member of the Board of Directors of the Philharmonic Center for the Arts in Naples, Florida (1999-present); a member of the Board of Trustees of Fairfield University (2005-present); and a member of the Council on Foreign Relations (1994-present). Previously, Mr. Lautenbach was a Partner/Advisory Partner at Clayton, Dubilier & Rice, LLC (private equity investment, 1998-2010), as well as a Director of Sony Corporation (2006-2007). |
Joseph Mauriello (67) |
| Year of Election or Appointment: 2008 Prior to his retirement in January 2006, Mr. Mauriello served in numerous senior management positions including Deputy Chairman and Chief Operating Officer (2004-2005), and Vice Chairman of Financial Services (2002-2004) of KPMG LLP US (professional services, 1965-2005). Mr. Mauriello currently serves as a member of the Board of Directors of XL Group plc. (global insurance and re-insurance, 2006-present) and of Arcadia Resources Inc. (health care services and products, 2007-present). Previously, Mr. Mauriello served as a Director of the Hamilton Funds of the Bank of New York (2006-2007). |
Robert W. Selander (61) |
| Year of Election or Appointment: 2011 Previously, Mr. Selander served as a Member of the Advisory Board of Fidelity's Equity and High Income Funds (2011), Executive Vice Chairman (2010), Chief Executive Officer (2009-2010), and President and Chief Executive Officer (1997-2009) of Mastercard, Inc. |
Cornelia M. Small (67) |
| Year of Election or Appointment: 2005 Ms. Small is a member of the Board of Directors of the Teagle Foundation (2009-present). Ms. Small is also a member of the Investment Committee, and Chair (2008-present) and a member of the Board of Trustees of Smith College. In addition, Ms. Small serves on the Investment Committee of the Berkshire Taconic Community Foundation (2008-present). Previously, Ms. Small served as Chairperson of the Investment Committee (2002-2008) of Smith College. In addition, Ms. Small served as Chief Investment Officer, Director of Global Equity Investments, and a member of the Board of Directors of Scudder, Stevens & Clark and Scudder Kemper Investments. |
William S. Stavropoulos (72) |
| Year of Election or Appointment: 2001 Mr. Stavropoulos is Vice Chairman of the Independent Trustees of the Equity and High Income Funds (2006-present). Mr. Stavropoulos serves as President and Founder of the Michigan Baseball Foundation, the Great Lakes Loons (2007-present). Mr. Stavropoulos is Chairman Emeritus of the Board of Directors of The Dow Chemical Company, where he previously served in numerous senior management positions, including President, CEO (1995-2000; 2002-2004), Chairman of the Executive Committee (2000-2006), and as a member of the Board of Directors (1990-2006). Currently, Mr. Stavropoulos is Chairman of Univar (global distributor of commodity and specialty chemicals, 2010-present), a Director of Teradata Corporation (data warehousing and technology solutions, 2008-present), Chemical Financial Corporation, Maersk Inc. (industrial conglomerate), Tyco International, Inc. (multinational manufacturing and services, 2007-present), and a member of the Advisory Board for Metalmark Capital (private equity investment, 2005-present). Mr. Stavropoulos is a special advisor to Clayton, Dubilier & Rice, LLC (private equity investment). In addition, Mr. Stavropoulos is a member of the University of Notre Dame Advisory Council for the College of Science. |
David M. Thomas (62) |
| Year of Election or Appointment: 2008 Previously, Mr. Thomas served as Executive Chairman (2005-2006) and Chairman and Chief Executive Officer (2000-2005) of IMS Health, Inc. (pharmaceutical and healthcare information solutions). In addition, Mr. Thomas serves as a member of the Board of Directors of Fortune Brands, Inc. (consumer products), and Interpublic Group of Companies, Inc. (marketing communication, 2004-present). |
Michael E. Wiley (61) |
| Year of Election or Appointment: 2008 Mr. Wiley also serves as a Director of Asia Pacific Exploration Consolidated (international oil and gas exploration and production, 2008-present). Mr. Wiley serves as a Director of Tesoro Corporation (independent oil refiner and marketer, 2005-present), and a Director of Bill Barrett Corporation (exploration and production, 2005-present). In addition, Mr. Wiley also serves as a Director of Post Oak Bank (privately-held bank, 2004-present). Previously, Mr. Wiley served as a member of the Board of Trustees of the University of Tulsa (2000-2006; 2007-2010), as a Senior Energy Advisor of Katzenbach Partners, LLC (consulting, 2006-2007), as an Advisory Director of Riverstone Holdings (private investment), Chairman, President, and CEO of Baker Hughes, Inc. (oilfield services, 2000-2004), and as Director of Spinnaker Exploration Company (exploration and production, 2001-2005). |
+ The information above includes each Trustee's principal occupation during the last five years and other information relating to the experience, attributes, and skills relevant to each Trustee's qualifications to serve as a Trustee, which led to the conclusion that each Trustee should serve as a Trustee for the fund.
Advisory Board Members and Executive Officers:
Correspondence intended for each executive officer, Edward C. Johnson 3d, and Peter S. Lynch may be sent to Fidelity Investments, 82 Devonshire Street, Boston, Massachusetts 02109.
Name, Age; Principal Occupation |
Edward C. Johnson 3d (81) |
| Year of Election or Appointment: 2011 Member of the Advisory Board of Fidelity's Equity and High Income Funds. Mr. Johnson serves as Chief Executive Officer, Chairman, and a Director of FMR LLC, and also serves as Chairman and Director of FIL Limited. Previously, Mr. Johnson served as a Trustee and Chairman of the Board of certain Fidelity Trusts, Chairman and a Director of FMR, Chairman and a Director of FMR Co., Inc., and President of FMR LLC (2006-2007). |
Peter S. Lynch (67) |
| Year of Election or Appointment: 2003 Member of the Advisory Board of Fidelity's Equity and High Income Funds. Mr. Lynch is Vice Chairman and a Director of FMR and FMR Co., Inc. In addition, Mr. Lynch serves as a Trustee of Boston College and as the Chairman of the Inner-City Scholarship Fund. Previously, Mr. Lynch served on the Special Olympics International Board of Directors (1997-2006). |
Kenneth B. Robins (42) |
| Year of Election or Appointment: 2008 President and Treasurer of Fidelity's Equity and High Income Funds. Mr. Robins also serves as President and Treasurer (2010-present) and Assistant Treasurer (2009-present) of other Fidelity funds and is an employee of Fidelity Investments (2004-present). Previously, Mr. Robins served as Deputy Treasurer of the Fidelity funds (2005-2008) and Treasurer and Chief Financial Officer of The North Carolina Capital Management Trust: Cash and Term Portfolios (2006-2008). |
Brian B. Hogan (47) |
| Year of Election or Appointment: 2009 Vice President of Equity and High Income Funds. Mr. Hogan also serves as President of FMR's Equity Division (2009-present). Previously, Mr. Hogan served as Senior Vice President, Equity Research of FMR (2006-2009) and as a portfolio manager. |
Christopher S. Bartel (40) |
| Year of Election or Appointment: 2009 Vice President of Fidelity's Sector and Real Estate Equity Funds. Mr. Bartel also serves as Senior Vice President of Equity Research (2009-present). Previously, Mr. Bartel served as Managing Director of Research (2006-2009) and an analyst and portfolio manager (2000-2006). |
Scott C. Goebel (43) |
| Year of Election or Appointment: 2008 Secretary and Chief Legal Officer (CLO) of the Fidelity funds. Mr. Goebel also serves as Secretary of Fidelity Investments Money Management, Inc. (FIMM) (2010-present) and Fidelity Research and Analysis Company (FRAC) (2010-present); Secretary and CLO of The North Carolina Capital Management Trust: Cash and Term Portfolios (2008-present); General Counsel, Secretary, and Senior Vice President of FMR (2008-present) and FMR Co., Inc. (2008-present); employed by FMR LLC or an affiliate (2001-present); Chief Legal Officer of Fidelity Management & Research (Hong Kong) Limited (2008-present) and Assistant Secretary of Fidelity Management & Research (Japan) Inc. (2008-present), and Fidelity Management & Research (U.K.) Inc. (2008-present). Previously, Mr. Goebel served as Assistant Secretary of FIMM (2008-2010), FRAC (2008-2010), and the Funds (2007-2008) and as Vice President and Secretary of Fidelity Distributors Corporation (FDC) (2005-2007). |
William C. Coffey (42) |
| Year of Election or Appointment: 2009 Assistant Secretary of Fidelity's Equity and High Income Funds. Mr. Coffey also serves as Senior Vice President and Deputy General Counsel of FMR LLC (2010-present), and is an employee of Fidelity Investments. Previously, Mr. Coffey served as Vice President and Associate General Counsel of FMR LLC (2005-2009). |
Holly C. Laurent (57) |
| Year of Election or Appointment: 2008 Anti-Money Laundering (AML) Officer of the Fidelity funds. Ms. Laurent also serves as AML Officer of The North Carolina Capital Management Trust: Cash and Term Portfolios (2008-present) and is an employee of Fidelity Investments. Previously, Ms. Laurent was Senior Vice President and Head of Legal for Fidelity Business Services India Pvt. Ltd. (2006-2008), and Senior Vice President, Deputy General Counsel and Group Head for FMR LLC (2005-2006). |
Christine Reynolds (53) |
| Year of Election or Appointment: 2008 Chief Financial Officer of the Fidelity funds. Ms. Reynolds became President of Fidelity Pricing and Cash Management Services (FPCMS) in August 2008. Ms. Reynolds served as Chief Operating Officer of FPCMS (2007-2008). Previously, Ms. Reynolds served as President, Treasurer, and Anti-Money Laundering officer of the Fidelity funds (2004-2007). |
Kenneth A. Rathgeber (64) |
| Year of Election or Appointment: 2004 Chief Compliance Officer of Fidelity's Equity and High Income Funds. Mr. Rathgeber is Chief Compliance Officer of Fidelity Management & Research (Hong Kong) Limited (2008-present), Fidelity Management & Research (Japan) Inc. (2008-present), FMR (2005-present), FMR Co., Inc. (2005-present), Fidelity Management & Research (U.K.) Inc. (2005-present), Fidelity Research & Analysis Company (2005-present), Fidelity Investments Money Management, Inc. (2005-present), Pyramis Global Advisors, LLC (2005-present), and Strategic Advisers, Inc. (2005-present). |
Jeffrey S. Christian (50) |
| Year of Election or Appointment: 2009 Deputy Treasurer of the Fidelity funds. Mr. Christian is an employee of Fidelity Investments. Previously, Mr. Christian served as Chief Financial Officer (2008-2009) of certain Fidelity funds and Senior Vice President of Fidelity Pricing and Cash Management Services (FPCMS) (2004-2009). |
Joseph F. Zambello (54) |
| Year of Election or Appointment: 2011 Deputy Treasurer of the Fidelity funds. Mr. Zambello is an employee of Fidelity Investments. Previously, Mr. Zambello served as Vice President of FMR's Program Management Group (2009-2011) and Vice President of the Transfer Agent Oversight Group (2005-2009). |
Adrien E. Deberghes (44) |
| Year of Election or Appointment: 2008 Deputy Treasurer of Fidelity's Equity and High Income Funds. Mr. Deberghes also serves as Vice President and Assistant Treasurer of Fidelity Rutland Square Trust II and Fidelity Commonwealth Trust II (2011-present), Assistant Treasurer of other Fidelity funds (2010-present), and is an employee of Fidelity Investments (2008-present). Previously, Mr. Deberghes served as Senior Vice President of Mutual Fund Administration at State Street Corporation (2007-2008), Senior Director of Mutual Fund Administration at Investors Bank & Trust (2005-2007), and Director of Finance for Dunkin' Brands (2000-2005). |
Stephanie J. Dorsey (42) |
| Year of Election or Appointment: 2010 Assistant Treasurer of Fidelity's Equity and High Income Funds. Ms. Dorsey also serves as Deputy Treasurer of other Fidelity funds (2008-present) and is an employee of Fidelity Investments (2008-present). Previously, Ms. Dorsey served as Treasurer (2004-2008) of the JPMorgan Mutual Funds and Vice President (2004-2008) of JPMorgan Chase Bank. |
John R. Hebble (53) |
| Year of Election or Appointment: 2009 Assistant Treasurer of Fidelity's Equity and High Income Funds. Mr. Hebble also serves as President (2011-present), Treasurer, and Chief Financial Officer of The North Carolina Capital Management Trust: Cash and Term Portfolios (2008-present), President and Treasurer of other Fidelity funds (2008-present) and is an employee of Fidelity Investments. |
Gary W. Ryan (53) |
| Year of Election or Appointment: 2005 Assistant Treasurer of the Fidelity funds. Mr. Ryan is an employee of Fidelity Investments. Previously, Mr. Ryan served as Vice President of Fund Reporting in Fidelity Pricing and Cash Management Services (FPCMS) (1999-2005). |
Jonathan Davis (43) |
| Year of Election or Appointment: 2010 Assistant Treasurer of the Fidelity funds. Mr. Davis is also Assistant Treasurer of Fidelity Rutland Square Trust II and Fidelity Commonwealth Trust II. Mr. Davis is an employee of Fidelity Investments. Previously, Mr. Davis served as Vice President and Associate General Counsel of FMR LLC (2003-2010). |
Annual Report
Board Approval of Investment Advisory Contracts and Management Fees
VIP Real Estate Portfolio
Each year, the Board of Trustees, including the Independent Trustees (together, the Board), votes on the renewal of the management contract and sub-advisory agreements (together, the Advisory Contracts) for the fund. The Board, assisted by the advice of fund counsel and Independent Trustees' counsel, requests and considers a broad range of information relevant to the renewal of the Advisory Contracts throughout the year.
The Board meets regularly and considers at each of its meetings factors that are relevant to its annual consideration of the renewal of the fund's Advisory Contracts, including the services and support provided to the fund and its shareholders. The Board has established various standing committees, each composed of Independent Trustees with varying backgrounds, to which the Board has assigned specific subject matter responsibilities in order to enhance effective decision-making by the Board. The Board, acting directly and through its Committees, requests and receives information concerning the annual consideration of the renewal of the fund's Advisory Contracts. The Board also meets as needed to consider matters specifically related to the Board's annual consideration of the renewal of Advisory Contracts. Members of the Board may also meet with trustees of other Fidelity funds through ad hoc joint committees to discuss certain matters relevant to the Fidelity funds.
At its July 2011 meeting, the Board of Trustees, including the Independent Trustees, unanimously determined to renew the fund's Advisory Contracts. In reaching its determination, the Board considered all factors it believed relevant, including (i) the nature, extent, and quality of the services to be provided to the fund and its shareholders (including the investment performance of the fund); (ii) the competitiveness of the fund's management fee and total expense ratio; (iii) the total costs of the services to be provided by and the profits to be realized by Fidelity from its relationship with the fund; (iv) the extent to which economies of scale would be realized as the fund grows; and (v) whether fee levels reflect these economies of scale, if any, for the benefit of fund shareholders.
In considering whether to renew the Advisory Contracts for the fund, the Board reached a determination, with the assistance of fund counsel and Independent Trustees' counsel and through the exercise of its business judgment, that the renewal of the Advisory Contracts is in the best interests of the fund and its shareholders and that the compensation payable under the Advisory Contracts is fair and reasonable. The Board's decision to renew the Advisory Contracts was not based on any single factor, but rather was based on a comprehensive consideration of all the information provided to the Board at its meetings throughout the year. The Board, in reaching its determination to renew the Advisory Contracts, is aware that shareholders in the fund have a broad range of investment choices available to them, including a wide choice among mutual funds offered by Fidelity's competitors, and that the fund's shareholders, who have the opportunity to review and weigh the disclosure provided by the fund in its prospectus and other public disclosures, have chosen to invest in this fund, managed by Fidelity.
Nature, Extent, and Quality of Services Provided. The Board considered the staffing within the investment adviser, FMR, and the sub-advisers (together, the Investment Advisers), including the backgrounds of the fund's investment personnel and the fund's investment objective and discipline. The Independent Trustees also had discussions with senior management of Fidelity's investment operations and investment groups. The Board considered the structure of the portfolio manager compensation program and whether this structure provides appropriate incentives to act in the best interests of the fund.
Resources Dedicated to Investment Management and Support Services. The Board and the Fund Oversight and Research Committees reviewed the general qualifications and capabilities of the Investment Advisers' investment staff, including its size, education, experience, and resources, as well as the Investment Advisers' approach to recruiting, training, managing, and compensating investment personnel. The Board also noted that FMR has devoted increased resources to non-U.S. offices. The Board noted that Fidelity's analysts have extensive resources, tools and capabilities which allow them to conduct sophisticated quantitative and fundamental analysis, as well as credit analysis of issuers, counterparties and enhancers. The Board also believes that Fidelity's investment professionals have sufficient access to global information and data so as to provide competitive investment results over time, and that those professionals also have access to sophisticated tools which permit them to assess portfolio construction risk and performance attribution characteristics continuously, as well as to transmit new information and research conclusions rapidly around the world. Additionally, in their deliberations, the Board considered the Investment Advisers' trading capabilities and resources which are an integral part of the investment management process.
Shareholder and Administrative Services. The Board considered (i) the nature, extent, quality, and cost of advisory, administrative, and shareholder services performed by the Investment Advisers and their affiliates under the Advisory Contracts and under separate agreements covering transfer agency, pricing and bookkeeping, and securities lending services for the fund; (ii) the nature and extent of the investment adviser's supervision of third party service providers, principally custodians and subcustodians; and (iii) the resources devoted to, and the record of compliance with, the fund's compliance policies and procedures. The Board also reviewed the allocation of fund brokerage, including allocations to brokers affiliated with the Investment Advisers, the use of brokerage commissions to pay fund expenses, and the use of "soft" commission dollars to pay for research services.
The Board noted that the growth of fund assets over time across the complex allows Fidelity to reinvest in the development of services designed to enhance the value or convenience of the Fidelity funds as investment vehicles. These services include 24-hour access to account information and market information through telephone representatives and over the Internet, investor education materials and asset allocation tools, and the expanded availability of Fidelity Investor Centers, with 35 new branches opening since 2010.
Annual Report
Board Approval of Investment Advisory Contracts and Management Fees - continued
Investment in a Large Fund Family. The Board considered the benefits to shareholders of investing in a Fidelity fund, including the benefits of investing in a fund that is part of a large family of funds offering a variety of investment disciplines and providing a large variety of mutual fund investor services. The Board noted that Fidelity had taken, or had made recommendations that resulted in the Fidelity funds taking, a number of actions over the previous year that benefited particular funds, including (i) continuing to dedicate additional resources to investment research and support of the senior management team that oversees asset management; (ii) rationalizing product lines through the mergers of six funds into other funds; (iii) continuing to migrate the Freedom Funds to dedicated lower cost underlying funds; (iv) obtaining shareholder approval to broaden the investment strategies for Fidelity Consumer Finance Portfolio, Fidelity Emerging Asia Fund, and Fidelity Environment and Alternative Energy Portfolio; (v) contractually agreeing to reduce the management fees and impose other expense limitations on Spartan 500 Index Fund and U.S. Bond Index Fund in connection with launching new institutional classes of these funds; (vi) changing the name, primary and supplemental benchmarks, and investment policies of Fidelity Global Strategies Fund to support the fund's flexible investment mandate and global orientation; and (vii) reducing the transfer agency account fee rates on certain accounts.
Investment Performance. The Board considered whether the fund has operated in accordance with its investment objective, as well as its record of compliance with its investment restrictions. It also reviewed the fund's absolute investment performance for each class, as well as the fund's relative investment performance for each class measured over multiple periods against a broad-based securities market index. The Board noted that FMR does not believe that a meaningful peer group exists against which to compare the fund's performance. The following charts considered by the Board show, over the one-, three-, and five-year periods ended December 31, 2010, the cumulative total returns of Initial Class and Service Class 2 of the fund and the cumulative total returns of a broad-based securities market index ("benchmark"). The returns of Initial Class and Service Class 2 show the performance of the highest and lowest performing classes, respectively (based on five-year performance).
VIP Real Estate Portfolio
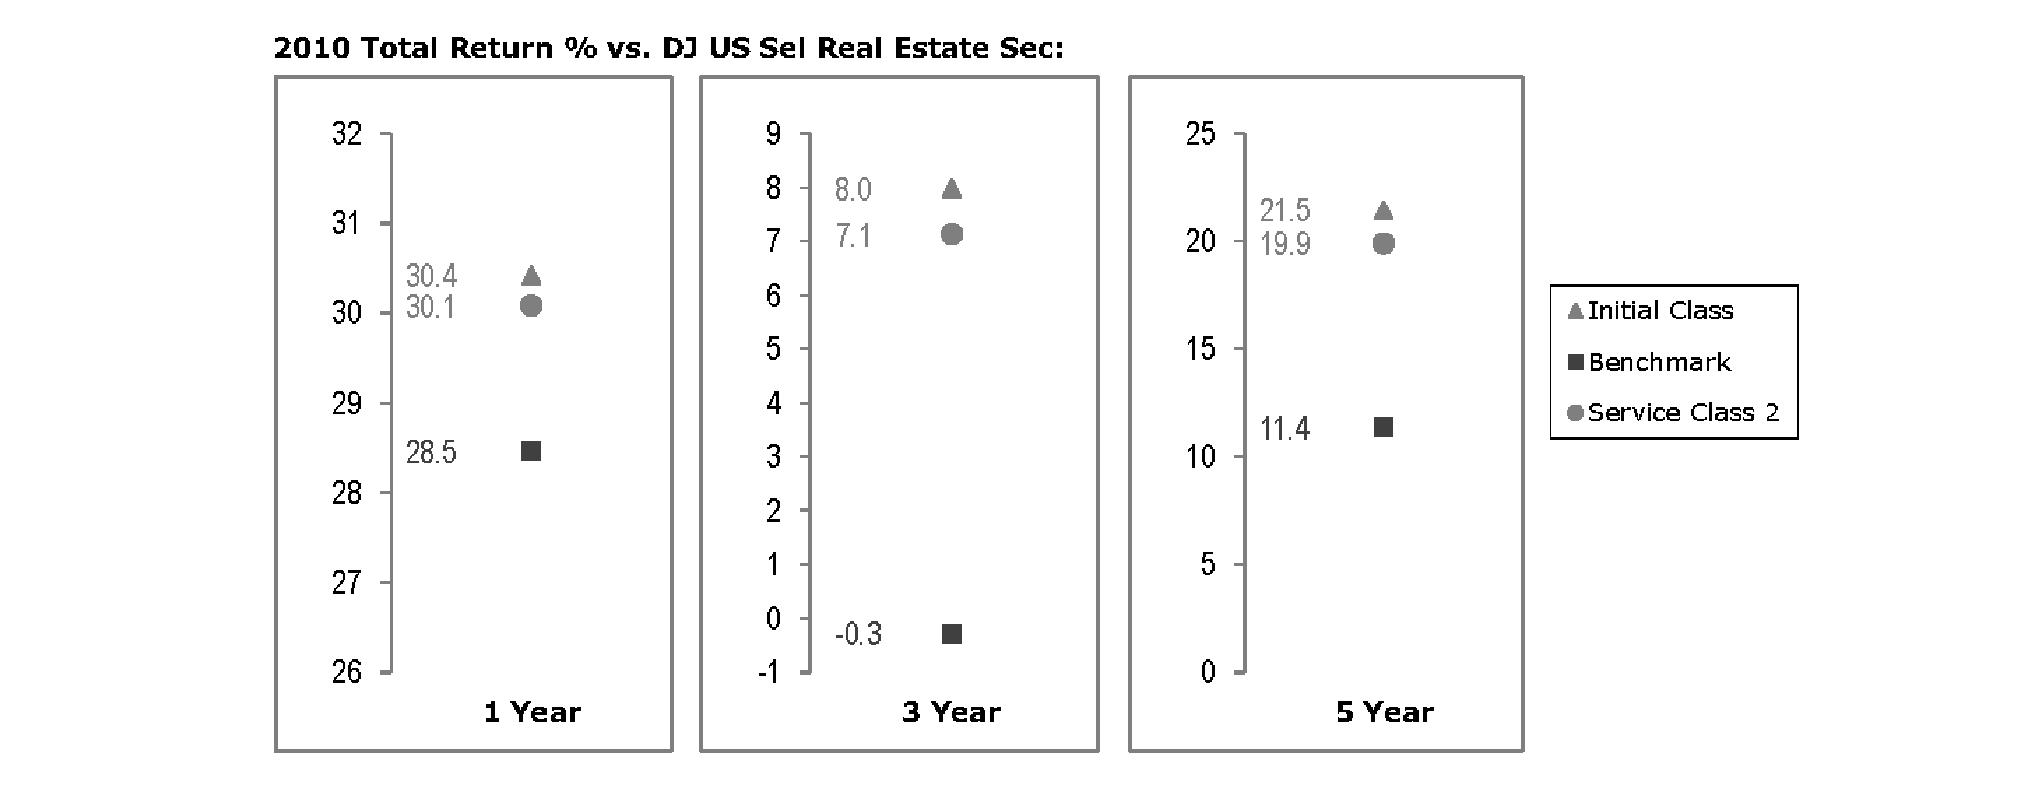
The Board noted that the investment performance of Initial Class of the fund compared favorably to its benchmark for all the periods shown. The Board considered that the variations in performance among the fund's classes reflect the variations in class expenses, which result in lower performance for higher expense classes. The Board also reviewed the fund's performance since inception as well as performance in the current year.
Based on its review, the Board concluded that the nature, extent, and quality of services provided to the fund under the Advisory Contracts should benefit the fund's shareholders.
Competitiveness of Management Fee and Total Expense Ratio. The Board considered the fund's management fee and total expense ratio compared to "mapped groups" of competitive funds and classes. Fidelity creates "mapped groups" by combining similar Lipper investment objective categories that have comparable management fee characteristics. Combining Lipper investment objective categories aids the Board's management fee and total expense ratio comparisons by broadening the competitive group used for comparison and by reducing the number of universes to which various Fidelity funds are compared.
Management Fee. The Board considered two proprietary management fee comparisons for the 12-month periods shown in the chart below. The group of Lipper funds used by the Board for management fee comparisons is referred to below as the "Total Mapped Group." The Total Mapped Group comparison focuses on a fund's standing relative to the total universe of comparable funds available to investors in terms of gross management fees before expense reimbursements or caps. "TMG %" represents the percentage of funds in the Total Mapped Group that had management fees that were lower than the fund's. For example, a TMG % of 2% means that 98% of the funds in the Total Mapped Group had higher management fees than the fund. The "Asset-Size Peer Group" (ASPG) comparison focuses on a fund's standing relative to non-Fidelity funds similar in size to the fund within the Total Mapped Group. The ASPG represents at least 15% of the funds in the Total Mapped Group with comparable asset size and management fee characteristics, subject to a minimum of 50 funds (or all funds in the Total Mapped Group if fewer than 50). Additional information, such as the ASPG quartile in which the fund's management fee ranked, is also included in the chart and considered by the Board.
Annual Report
VIP Real Estate Portfolio
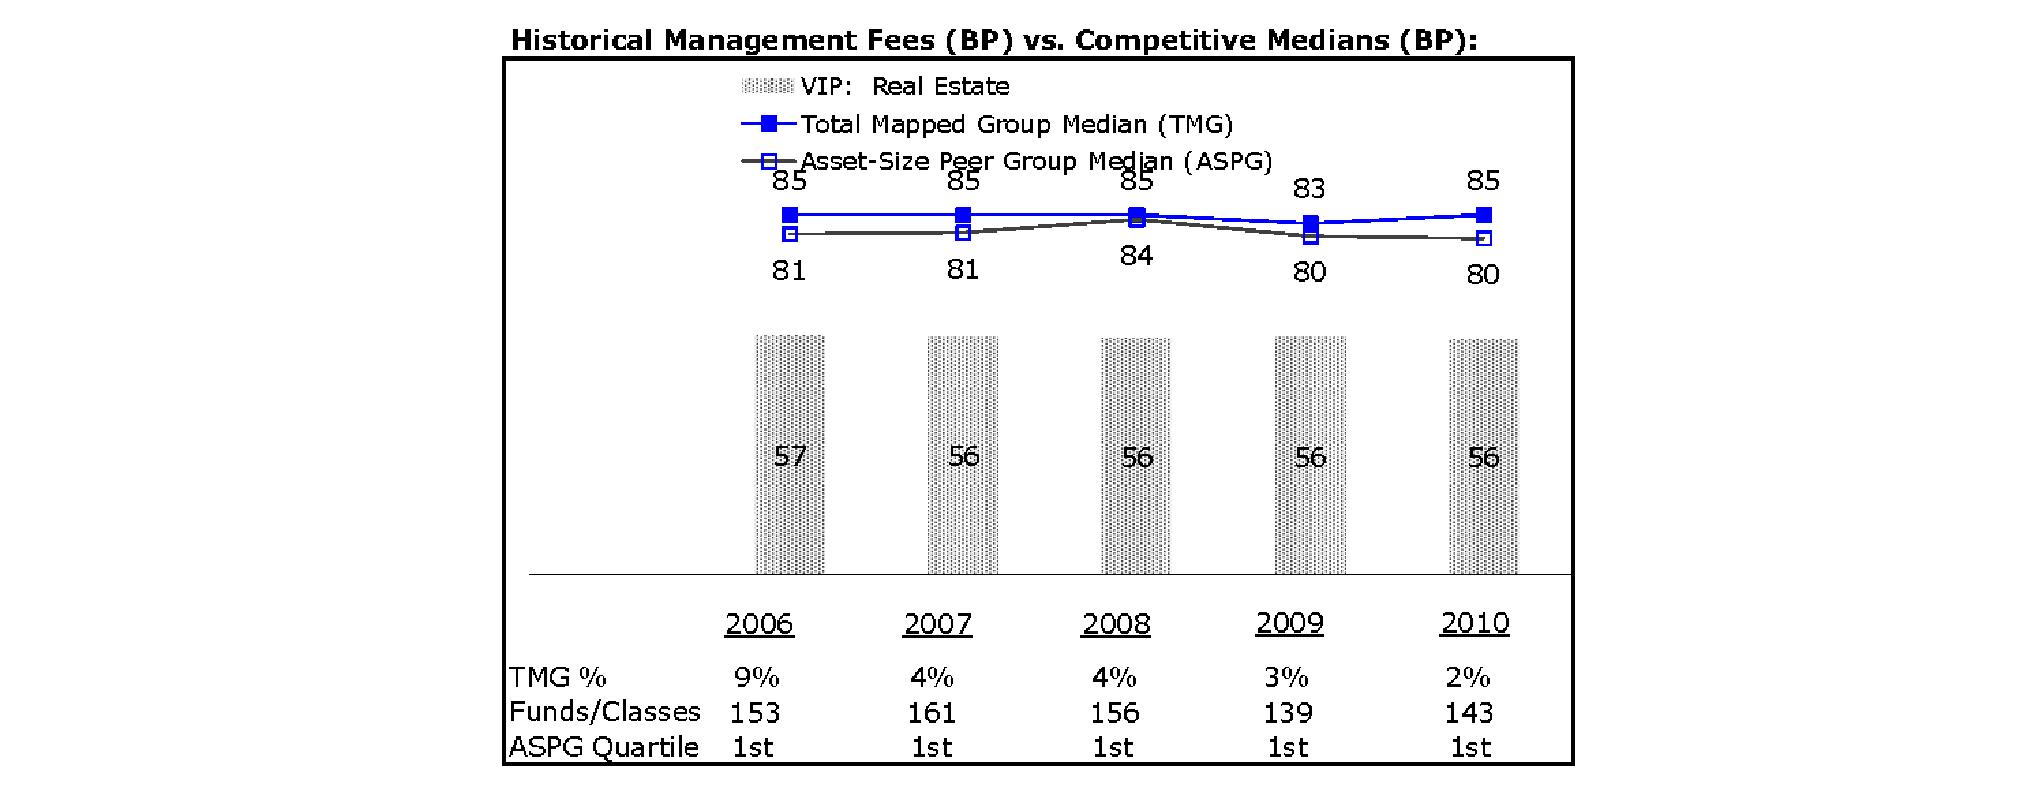
The Board noted that the fund's management fee ranked below the median of its Total Mapped Group and below the median of its ASPG for 2010.
Based on its review, the Board concluded that the fund's management fee is fair and reasonable in light of the services that the fund receives and the other factors considered.
Total Expense Ratio. In its review of each class's total expense ratio, the Board considered the fund's management fee as well as other fund or class expenses, as applicable, such as transfer agent fees, pricing and bookkeeping fees, fund-paid 12b-1 fees, and custodial, legal, and audit fees. The Board also noted the effects of any waivers and reimbursements on fees and expenses. As part of its review, the Board also considered the current and historical total expense ratios of each class of the fund compared to competitive fund median expenses. Each class of the fund is compared to those funds and classes in the Total Mapped Group (used by the Board for management fee comparisons) that have a similar sales load structure.
The Board noted that the total expense ratio of each class ranked below its competitive median for 2010. The Board considered that various factors, including 12b-1 fees, positive or negative performance adjustments, and relatively higher other expenses in the case of small fund size, can affect total expense ratios. The Board also noted that Investor Class has higher transfer agent fees than traditional variable annuity classes because it is designed for lower cost annuity products, where the majority of servicing costs are incorporated into the funds' total expense ratios rather than being paid at the annuity level.
Fees Charged to Other Fidelity Clients. The Board also considered Fidelity fee structures and other information with respect to clients of FMR and its affiliates, such as other mutual funds advised or subadvised by FMR or its affiliates, pension plan clients, and other institutional clients. In March 2010, the Board created an ad hoc joint committee with the board of other Fidelity funds (the Committee) to review and compare Fidelity's institutional investment advisory business with its business of providing services to the Fidelity funds, including the differences in services provided, fees charged, and costs incurred, as well as competition in their respective marketplaces.
Based on its review of total expense ratios and fees charged to other Fidelity clients, the Board concluded that the total expense ratio of each class of the fund was reasonable in light of the services that the fund and its shareholders receive and the other factors considered, including the findings of the Committee.
Costs of the Services and Profitability. The Board considered the revenues earned and the expenses incurred by Fidelity in conducting the business of developing, marketing, distributing, managing, administering and servicing the fund and its shareholders. The Board also considered the level of Fidelity's profits in respect of all the Fidelity funds.
On an annual basis, FMR presents to the Board Fidelity's profitability for the fund. Fidelity calculates the profitability for each fund, as well as aggregate profitability for groups of Fidelity funds and all Fidelity funds, using a series of detailed revenue and cost allocation methodologies which originate with the books and records of Fidelity on which Fidelity's audited financial statements are based. The Audit Committee of the Board reviews any significant changes from the prior year's methodologies.
Annual Report
Board Approval of Investment Advisory Contracts and Management Fees - continued
PricewaterhouseCoopers LLP (PwC), independent registered public accounting firm and auditor to Fidelity and certain Fidelity funds, has been engaged annually by the Board as part of the Board's assessment of Fidelity's profitability analysis. PwC's engagement includes the review and assessment of Fidelity's methodologies used in determining the revenues and expenses attributable to Fidelity's mutual fund business, and completion of agreed-upon procedures surrounding the mathematical accuracy of fund profitability and its conformity to allocation methodologies. After considering PwC's reports issued under the engagement and information provided by Fidelity, the Board concluded that while other allocation methods may also be reasonable, Fidelity's profitability methodologies are reasonable in all material respects.
The Board also reviewed Fidelity's non-fund businesses and fall-out benefits related to the mutual fund business as well as cases where Fidelity's affiliates may benefit from or be related to the fund's business.
The Board considered the costs of the services provided by and the profits realized by Fidelity in connection with the operation of the fund and was satisfied that the profitability was not excessive in the circumstances.
Economies of Scale. The Board considered whether there have been economies of scale in respect of the management of the Fidelity funds, whether the Fidelity funds (including the fund) have appropriately benefited from any such economies of scale, and whether there is potential for realization of any further economies of scale. The Board considered the extent to which the fund will benefit from economies of scale through increased services to the fund, through waivers or reimbursements, or through fee or expense reductions. The Board also noted that in 2009, it and the board of other Fidelity funds created an ad hoc committee (the Economies of Scale Committee) to analyze whether FMR attains economies of scale in respect of the management and servicing of the Fidelity funds, whether the Fidelity funds have appropriately benefited from such economies of scale, and whether there is potential for realization of any further economies of scale.
The Board recognized that the fund's management contract incorporates a "group fee" structure, which provides for lower group fee rates as total fund assets under FMR's management increase, and for higher group fee rates as total fund assets under FMR's management decrease. FMR calculates the group fee rates based on a tiered asset "breakpoint" schedule that varies based on asset class. The Board considered that the group fee is designed to deliver the benefits of economies of scale to fund shareholders when total Fidelity fund assets increase, even if assets of any particular fund are unchanged or have declined, because some portion of Fidelity's costs are attributable to services provided to all Fidelity funds, and all funds benefit if those costs can be allocated among more assets. The Board concluded that, given the group fee structure, fund shareholders will benefit from lower management fees as assets under FMR's management increase at the fund complex level, regardless of whether Fidelity achieves any such economies of scale.
The Board concluded, taking into account the analysis of the Economies of Scale Committee, that any potential economies of scale are being appropriately shared between fund shareholders and Fidelity.
Additional Information Requested by the Board. In order to develop fully the factual basis for consideration of the Fidelity funds' Advisory Contracts, the Board requested and received additional information on certain topics, including (i) fund performance trends, actions to be taken by FMR to improve certain funds' overall performance, and Fidelity's long-term strategies for certain funds; (ii) portfolio manager changes that have occurred during the past year and length of portfolio manager tenure for different categories of funds over time; (iii) Fidelity's compensation structure for portfolio managers and other key personnel and strategies for attracting and retaining non-investment personnel; (iv) the amount of the investment that each portfolio manager has made in the Fidelity fund(s) that he or she manages; (v) historical trends in Fidelity's realization of fall-out benefits; (vi) Fidelity's group fee structures and the rationale for the individual fee rates of certain funds; (vii) fund profitability methodology and the impact of certain factors on fund profitability results; (viii) trends regarding industry use of performance fee structures and Fidelity's compliance practices with respect to performance adjustment calculations; (ix) the fee structures in place for certain other Fidelity clients; and (x) explanations regarding the relative total expense ratios of certain funds and classes, total expense competitive trends, and actions that might be taken by FMR to reduce total expense ratios for certain funds and classes.
Based on its evaluation of all of the conclusions noted above, and after considering all factors it believed relevant, the Board ultimately concluded that the advisory fee structures are fair and reasonable, and that the fund's Advisory Contracts should be renewed.
Annual Report
Annual Report
Annual Report
Investment Adviser
Fidelity Management & Research Company
Boston, MA
Investment Sub-Advisers
FMR Co., Inc.
Fidelity Management & Research (U.K.) Inc.
Fidelity Management & Research (Japan) Inc.
Fidelity Management & Research (Hong Kong) Limited
General Distributor
Fidelity Distributors Corporation
Boston, MA
Transfer and Service Agents
Fidelity Investments Institutional Operations Company, Inc.
Boston, MA
Fidelity Service Company, Inc.
Boston, MA
Custodian
The Bank of New York Mellon
New York, NY
VIPRE-ANN-0212
1.781992.109
Fidelity® Variable Insurance Products:
Technology Portfolio
Annual Report
December 31, 2011
Contents
Performance | (Click Here) | How the fund has done over time. |
Management's Discussion of Fund Performance | (Click Here) | The Portfolio Manager's review of fundperformance and strategy. |
Shareholder Expense Example | (Click Here) | An example of shareholder expenses. |
Investment Changes | (Click Here) | A summary of major shifts in the fund's investments over the past six months. |
Investments | (Click Here) | A complete list of the fund's investments with their market values. |
Financial Statements | (Click Here) | Statements of assets and liabilities, operations, and changes in net assets, as well as financial highlights. |
Notes | (Click Here) | Notes to the financial statements. |
Report of Independent Registered Public Accounting Firm | (Click Here) | |
Trustees and Officers | (Click Here) | |
Distributions | (Click Here) | |
Board Approval of Investment Advisory Contracts and Management Fees | (Click Here) | |
To view a fund's proxy voting guidelines and proxy voting record for the 12-month period ended June 30, visit http://www.fidelity.com/proxyvotingresults or visit the Securities and Exchange Commission's (SEC) web site at http://www.sec.gov. You may also call 1-877-208-0098 to request a free copy of the proxy voting guidelines.
Fidelity® Variable Insurance Products are separate account options which are purchased through a variable insurance contract.
Standard & Poor's, S&P and S&P 500 are registered service marks of The McGraw-Hill Companies, Inc. and have been licensed for use by Fidelity Distributors Corporation.
Other third party marks appearing herein are the property of their respective owners.
All other marks appearing herein are registered or unregistered trademarks or service marks of FMR LLC or an affiliated company.
This report and the financial statements contained herein are submitted for the general information of the shareholders of the fund. This report is not authorized for distribution to prospective investors in the fund unless preceded or accompanied by an effective prospectus.
A fund files its complete schedule of portfolio holdings with the SEC for the first and third quarters of each fiscal year on Form N-Q. Forms N-Q are available on the SEC's web site at http://www.sec.gov. A fund's Forms N-Q may be reviewed and copied at the SEC's Public Reference Room in Washington, DC. Information regarding the operation of the SEC's Public Reference Room may be obtained by calling 1-800-SEC-0330. For a complete list of a fund's portfolio holdings, view the most recent holdings listing, semiannual report, or annual report on Fidelity's web site at http://www.fidelity.com, http://www.advisor.fidelity.com, or http://www.401k.com, as applicable.
NOT FDIC INSURED • MAY LOSE VALUE • NO BANK GUARANTEE
Neither the fund nor Fidelity Distributors Corporation is a bank.
Annual Report
Average annual total return reflects the change in the value of an investment, assuming reinvestment of the class' distributions from dividend income and capital gains (the profits earned upon the sale of securities that have grown in value, if any) and assuming a constant rate of performance each year. During periods of reimbursement by Fidelity, a fund's total return will be greater than it would be had the reimbursement not occurred. Performance numbers are net of all underlying fund operating expenses, but do not include any insurance charges imposed by your insurance company's separate account. If performance information included the effect of these additional charges, the total returns would have been lower. How a fund did yesterday is no guarantee of how it will do tomorrow.
Average Annual Total Returns
Periods ended December 31, 2011 | Past 1
year | Past 5
years | Past 10
years |
VIP Technology Portfolio - Initial Class | -9.78% | 5.11% | 4.35% |
VIP Technology Portfolio - Investor Class A | -9.92% | 4.98% | 4.26% |
A The initial offering of Investor Class shares took place on July 21, 2005. Returns prior to July 21, 2005 are those of Initial Class. Had Investor Class's transfer agent fee been reflected, returns prior to July 21, 2005 would have been lower.
$10,000 Over 10 Years
Let's say hypothetically that $10,000 was invested in VIP Technology Portfolio - Initial Class on December 31, 2001. The chart shows how the value of your investment would have changed, and also shows how the S&P 500® Index performed over the same period.
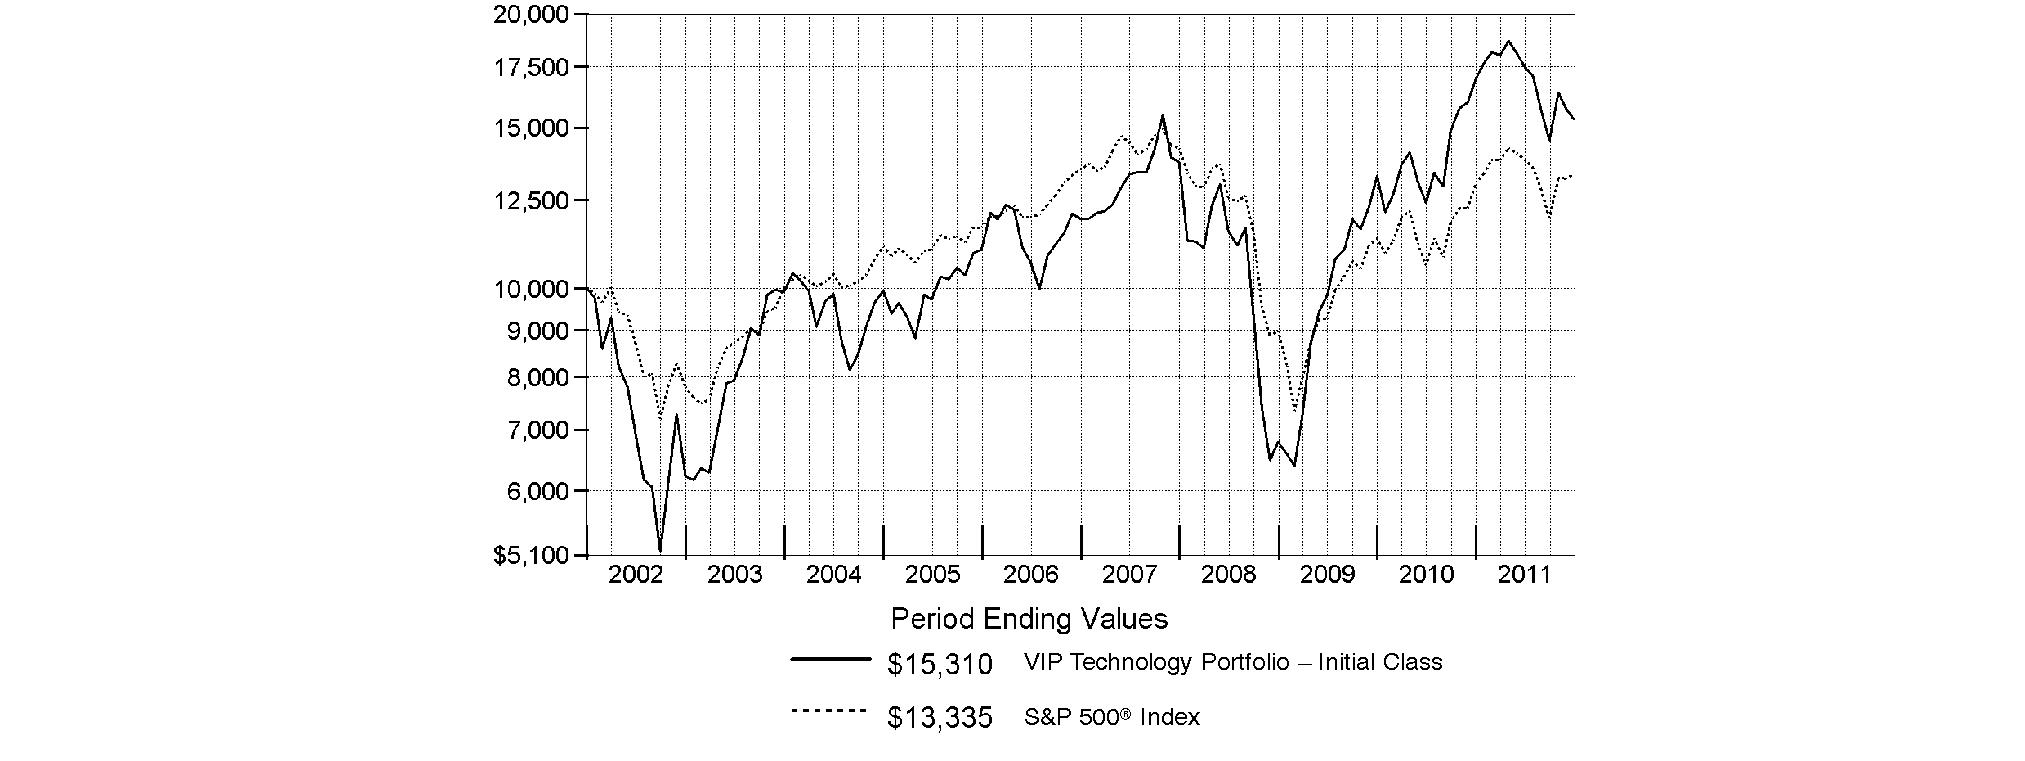
Annual Report
Market Recap: Extreme market volatility took center stage during the 12 months ending December 31, 2011, stealing the spotlight from signs of progress in the global economy. Early in the year, aggressive monetary stimulus by the U.S. federal government, improving credit-market conditions and solid corporate earnings buoyed most major asset classes. As the period progressed, however, fresh worries about sovereign debt in Europe, inflation in China, gridlock over raising the debt ceiling in the U.S. - along with Standard & Poor's early-August downgrade of the nation's long-term sovereign credit rating - and a dimmed outlook for global growth punctured investor confidence and ignited market instability. Domestic equities, as measured by the broad-based S&P 500® Index, gained 2.11%, easily outpacing the 13.61% decline of MSCI® ACWI® (All Country World Index) ex USA Index, a proxy for foreign stocks. Within the MSCI index, emerging markets declined the most (-18%), with investments here generally held back by a stronger U.S. dollar. The U.K. (-3%) fared better than the rest of Europe (-15%), which was the second-worst-performing index component. Bolstered by periodic flights to quality, U.S. investment-grade bonds posted a 7.84% advance, as reflected by the Barclays Capital® U.S. Aggregate Bond Index, outperforming the 4.37% gain of high-yield securities, as represented by The BofA Merrill LynchSM US High Yield Constrained Index. Hampered by financial woes in Europe, the sovereign debt of major developed markets outside the U.S. rose 4.86%, according to the Citigroup® Non-USD Group-of-Seven (G7) Equal Weighted Index, while the JPMorgan Emerging Markets Bond Index Global (EMBI Global) advanced 8.46%, despite the currency head wind.
Comments from Charlie Chai, Portfolio Manager of VIP Technology Portfolio: During the past year, the fund's share classes significantly lagged the 0.66% mark of the MSCI® U.S. IM Information Technology 25/50 Index and also fell far short of the S&P 500®. (For specific portfolio results, please refer to the performance section of this report.) Versus the MSCI index, weak stock selection in semiconductors was responsible for a lot of the fund's underperformance, with positioning in application software and IT consulting/other services curbing results as well. The two biggest individual detractors were large, defensive index components in which the fund had sizable underweightings: technology services provider International Business Machines and personal computer chip maker Intel. Also curbing the fund's results were several positions in the Chinese solar power industry, including Trina Solar, JinkoSolar Holding - which I sold in September - and JA Solar Holdings, as well as salesforce.com, an important player in cloud computing for customer relationship management software and other applications, and AsiaInfo-Linkage, a China-based provider of telecommunications software and technology security products that was removed from the benchmark in June. Conversely, underweighting systems software aided performance, as did stock picking in computer hardware and semiconductor equipment. At the individual stock level, limiting exposure to computer/printer maker and major index component Hewlett-Packard was the right call, given the stock's decline of 38%. Underweighting personal computer software giant Microsoft, another weak performer, bolstered our results within systems software. Timely ownership of SanDisk, a manufacturer of the NAND flash memory used in mobile devices such as smartphones and tablets, and stake in Accenture, which I view as a smaller, faster-growing version of IBM, further aided performance. In absolute terms, the biggest contributor by far was Apple, which also was the fund's largest position at period end. However, the stock was a modest detractor from relative performance because I underweighted it for much of the period.
The views expressed above reflect those of the portfolio manager(s) only through the end of the period as stated on the cover of this report and do not necessarily represent the views of Fidelity or any other person in the Fidelity organization. Any such views are subject to change at any time based upon market or other conditions and Fidelity disclaims any responsibility to update such views. These views may not be relied on as investment advice and, because investment decisions for a Fidelity fund are based on numerous factors, may not be relied on as an indication of trading intent on behalf of any Fidelity fund.
Annual Report
As a shareholder of the Fund, you incur two types of costs: (1) transaction costs, including redemption fees, and (2) ongoing costs, including management fees and other Fund expenses. This Example is intended to help you understand your ongoing costs (in dollars) of investing in the Fund and to compare these costs with the ongoing costs of investing in other mutual funds.
The Example is based on an investment of $1,000 invested at the beginning of the period and held for the entire period (July 1, 2011 to December 31, 2011).
Actual Expenses
The first line of the accompanying table for each class of the Fund provides information about actual account values and actual expenses. You may use the information in this line, together with the amount you invested, to estimate the expenses that you paid over the period. Simply divide your account value by $1,000.00 (for example, an $8,600 account value divided by $1,000.00 = 8.6), then multiply the result by the number in the first line for a class of the Fund under the heading entitled "Expenses Paid During Period" to estimate the expenses you paid on your account during this period. The estimate of expenses does not include any fees or other expenses of any variable annuity or variable life insurance product. If they were, the estimate of expenses you paid during the period would be higher, and your ending account value would be lower. In addition, the Fund, as a shareholder in the underlying Fidelity Central Funds, will indirectly bear its pro-rata share of the fees and expenses incurred by the underlying Fidelity Central Funds. These fees and expenses are not included in the Fund's annualized expense ratio used to calculate the expense estimate in the table below.
Hypothetical Example for Comparison Purposes
The second line of the accompanying table for each class of the Fund provides information about hypothetical account values and hypothetical expenses based on a Class' actual expense ratio and an assumed rate of return of 5% per year before expenses, which is not the Class' actual return. The hypothetical account values and expenses may not be used to estimate the actual ending account balance or expenses you paid for the period. You may use this information to compare the ongoing costs of investing in the Fund and other funds. To do so, compare this 5% hypothetical example with the 5% hypothetical examples that appear in the shareholder reports of the other funds. The estimate of expenses does not include any fees or other expenses of any variable annuity or variable life insurance product. If they were, the estimate of expenses you paid during the period would be higher, and your ending account value would be lower. In addition, the Fund, as a shareholder in the underlying Fidelity Central Funds, will indirectly bear its pro-rata share of the fees and expenses incurred by the underlying Fidelity Central Funds. These fees and expenses are not included in the Fund's annualized expense ratio used to calculate the expense estimate in the table below.
Please note that the expenses shown in the table are meant to highlight your ongoing costs only and do not reflect any transaction costs. Therefore, the second line of the table is useful in comparing ongoing costs only, and will not help you determine the relative total costs of owning different funds. In addition, if these transactional costs were included, your costs would have been higher.
| Annualized
Expense Ratio | Beginning
Account Value
July 1, 2011 | Ending
Account Value
December 31, 2011 | Expenses Paid
During Period*
July 1, 2011 to
December 31, 2011 |
Initial Class | .72% | | | |
Actual | | $ 1,000.00 | $ 876.00 | $ 3.40 |
HypotheticalA | | $ 1,000.00 | $ 1,021.58 | $ 3.67 |
Investor Class | .80% | | | |
Actual | | $ 1,000.00 | $ 874.50 | $ 3.78 |
HypotheticalA | | $ 1,000.00 | $ 1,021.17 | $ 4.08 |
A 5% return per year before expenses
* Expenses are equal to each Class' annualized expense ratio, multiplied by the average account value over the period, multiplied by 184/365 (to reflect the one-half year period).
Annual Report
Investment Changes (Unaudited)
Top Ten Stocks as of December 31, 2011 |
| % of fund's
net assets | % of fund's net assets
6 months ago |
Apple, Inc. | 14.4 | 8.6 |
Google, Inc. Class A | 6.0 | 3.6 |
Oracle Corp. | 3.7 | 5.9 |
salesforce.com, Inc. | 2.9 | 3.3 |
ASML Holding NV | 2.7 | 0.1 |
eBay, Inc. | 2.2 | 1.3 |
Citrix Systems, Inc. | 1.9 | 1.2 |
Texas Instruments, Inc. | 1.8 | 0.0 |
EMC Corp. | 1.6 | 3.0 |
Novellus Systems, Inc. | 1.5 | 0.0 |
| 38.7 | |
Top Industries (% of fund's net assets) |
As of December 31, 2011 |
| Semiconductors & Semiconductor Equipment | 24.7% | |
| Software | 22.5% | |
| Computers & Peripherals | 17.8% | |
| Internet Software & Services | 13.6% | |
| Communications Equipment | 5.2% | |
| All Others* | 16.2% | |

As of June 30, 2011 |
| Software | 30.0% | |
| Computers & Peripherals | 14.9% | |
| IT Services | 11.4% | |
| Semiconductors & Semiconductor Equipment | 11.1% | |
| Internet Software & Services | 10.3% | |
| All Others* | 22.3% | |

* Includes short-term investments and net other assets. |
Annual Report
Investments December 31, 2011
Showing Percentage of Net Assets
Common Stocks - 96.5% |
| Shares | | Value |
AUTOMOBILES - 0.1% |
Automobile Manufacturers - 0.1% |
Tesla Motors, Inc. (a) | 6,800 | | $ 194,208 |
CHEMICALS - 0.2% |
Specialty Chemicals - 0.2% |
JSR Corp. | 18,000 | | 332,099 |
COMMUNICATIONS EQUIPMENT - 5.1% |
Communications Equipment - 5.1% |
Acme Packet, Inc. (a) | 18,800 | | 581,108 |
Aruba Networks, Inc. (a) | 3,500 | | 64,820 |
Brocade Communications Systems, Inc. (a) | 45,000 | | 233,550 |
China Wireless Technologies Ltd. | 48,000 | | 8,652 |
Ciena Corp. (a) | 55,100 | | 666,710 |
Cisco Systems, Inc. | 16,737 | | 302,605 |
F5 Networks, Inc. (a) | 9,118 | | 967,602 |
Finisar Corp. (a) | 31,900 | | 534,166 |
Infinera Corp. (a) | 13,800 | | 86,664 |
Juniper Networks, Inc. (a) | 1,600 | | 32,656 |
Motorola Solutions, Inc. | 6,800 | | 314,772 |
Polycom, Inc. (a) | 65,100 | | 1,061,130 |
QUALCOMM, Inc. | 21,834 | | 1,194,320 |
Riverbed Technology, Inc. (a) | 9,400 | | 220,900 |
Sandvine Corp. (a) | 100,288 | | 109,812 |
Sandvine Corp. (U.K.) (a) | 252,300 | | 282,425 |
ShoreTel, Inc. (a) | 9,900 | | 63,162 |
Sonus Networks, Inc. (a) | 5,300 | | 12,720 |
ZTE Corp. (H Shares) | 244,200 | | 765,621 |
| | 7,503,395 |
COMPUTERS & PERIPHERALS - 17.8% |
Computer Hardware - 14.8% |
Apple, Inc. (a) | 52,445 | | 21,240,222 |
Hewlett-Packard Co. | 5,517 | | 142,118 |
Stratasys, Inc. (a) | 13,110 | | 398,675 |
| | 21,781,015 |
Computer Storage & Peripherals - 3.0% |
Catcher Technology Co. Ltd. | 4,000 | | 18,557 |
EMC Corp. (a) | 107,700 | | 2,319,858 |
Gemalto NV | 3,425 | | 166,604 |
Imagination Technologies Group PLC (a) | 58,700 | | 500,523 |
Intevac, Inc. (a) | 1,500 | | 11,100 |
SanDisk Corp. (a) | 28,019 | | 1,378,815 |
SIMPLO Technology Co. Ltd. | 14,000 | | 81,823 |
Smart Technologies, Inc. Class A (a)(d) | 11,200 | | 41,328 |
| | 4,518,608 |
TOTAL COMPUTERS & PERIPHERALS | | 26,299,623 |
|
| Shares | | Value |
CONSUMER FINANCE - 0.0% |
Consumer Finance - 0.0% |
Netspend Holdings, Inc. (a) | 700 | | $ 5,677 |
DIVERSIFIED CONSUMER SERVICES - 0.5% |
Education Services - 0.5% |
New Oriental Education & Technology Group, Inc. sponsored ADR (a) | 33,100 | | 796,055 |
ELECTRICAL EQUIPMENT - 0.1% |
Electrical Components & Equipment - 0.1% |
Acuity Brands, Inc. | 316 | | 16,748 |
Dynapack International Technology Corp. | 40,000 | | 152,551 |
| | 169,299 |
ELECTRONIC EQUIPMENT & COMPONENTS - 3.6% |
Electronic Components - 1.6% |
Amphenol Corp. Class A | 3,500 | | 158,865 |
AVX Corp. | 1,300 | | 16,588 |
Cheng Uei Precision Industries Co. Ltd. | 36,567 | | 71,480 |
Corning, Inc. | 1,200 | | 15,576 |
DTS, Inc. (a) | 400 | | 10,896 |
E Ink Holdings, Inc. GDR (a)(e) | 1,000 | | 13,043 |
Omron Corp. | 3,600 | | 72,360 |
Universal Display Corp. (a)(d) | 51,900 | | 1,904,211 |
Vishay Intertechnology, Inc. (a) | 12,300 | | 110,577 |
Wintek Corp. | 2,797 | | 1,986 |
Young Fast Optoelectron Co. Ltd. | 698 | | 1,434 |
| | 2,377,016 |
Electronic Equipment & Instruments - 0.2% |
Chroma ATE, Inc. | 84,945 | | 166,608 |
Comverge, Inc. (a) | 1,211 | | 1,526 |
Itron, Inc. (a) | 400 | | 14,308 |
RealD, Inc. (a)(d) | 9,800 | | 77,812 |
| | 260,254 |
Electronic Manufacturing Services - 1.3% |
Fabrinet (a) | 11,000 | | 150,480 |
Jabil Circuit, Inc. | 33,000 | | 648,780 |
KEMET Corp. (a) | 7,700 | | 54,285 |
Multi-Fineline Electronix, Inc. (a) | 411 | | 8,446 |
TE Connectivity Ltd. | 600 | | 18,486 |
Trimble Navigation Ltd. (a) | 25,085 | | 1,088,689 |
| | 1,969,166 |
Technology Distributors - 0.5% |
Anixter International, Inc. (a) | 300 | | 17,892 |
Arrow Electronics, Inc. (a) | 600 | | 22,446 |
Digital China Holdings Ltd. (H Shares) | 297,000 | | 460,418 |
Supreme Electronics Co. Ltd. | 141,000 | | 68,440 |
Common Stocks - continued |
| Shares | | Value |
ELECTRONIC EQUIPMENT & COMPONENTS - CONTINUED |
Technology Distributors - continued |
VST Holdings Ltd. (a) | 270,000 | | $ 33,721 |
WPG Holding Co. Ltd. | 96,056 | | 110,694 |
| | 713,611 |
TOTAL ELECTRONIC EQUIPMENT & COMPONENTS | | 5,320,047 |
HEALTH CARE EQUIPMENT & SUPPLIES - 0.5% |
Health Care Equipment - 0.3% |
Biosensors International Group Ltd. (a) | 406,000 | | 447,581 |
China Medical Technologies, Inc. sponsored ADR (a)(d) | 300 | | 852 |
Mingyuan Medicare Development Co. Ltd. (a) | 200,000 | | 5,768 |
| | 454,201 |
Health Care Supplies - 0.2% |
Shandong Weigao Medical Pol Co. Ltd. (H Shares) | 316,000 | | 284,402 |
TOTAL HEALTH CARE EQUIPMENT & SUPPLIES | | 738,603 |
HEALTH CARE TECHNOLOGY - 0.0% |
Health Care Technology - 0.0% |
athenahealth, Inc. (a) | 100 | | 4,912 |
HOUSEHOLD DURABLES - 0.1% |
Household Appliances - 0.1% |
Techtronic Industries Co. Ltd. | 146,500 | | 150,714 |
INTERNET & CATALOG RETAIL - 1.8% |
Internet Retail - 1.8% |
Amazon.com, Inc. (a) | 4,000 | | 692,400 |
Groupon, Inc. Class A (a) | 8,200 | | 169,166 |
MakeMyTrip Ltd. (a) | 3,400 | | 81,736 |
Priceline.com, Inc. (a) | 288 | | 134,700 |
Rakuten, Inc. | 1,149 | | 1,236,110 |
Start Today Co. Ltd. | 11,500 | | 269,103 |
| | 2,583,215 |
INTERNET SOFTWARE & SERVICES - 13.6% |
Internet Software & Services - 13.6% |
Alibaba.com Ltd. | 16,500 | | 17,060 |
Baidu.com, Inc. sponsored ADR (a) | 1,300 | | 151,411 |
China Finance Online Co. Ltd. ADR (a) | 16,800 | | 27,216 |
Constant Contact, Inc. (a) | 900 | | 20,889 |
Cornerstone OnDemand, Inc. | 5,400 | | 98,496 |
DealerTrack Holdings, Inc. (a) | 1,500 | | 40,890 |
eBay, Inc. (a) | 104,700 | | 3,175,551 |
Facebook, Inc. Class B (f) | 9,689 | | 242,225 |
Google, Inc. Class A (a) | 13,800 | | 8,913,420 |
Kakaku.com, Inc. | 14,800 | | 542,657 |
LivePerson, Inc. (a) | 8,800 | | 110,440 |
LogMeIn, Inc. (a) | 9,391 | | 362,023 |
|
| Shares | | Value |
MercadoLibre, Inc. | 9,100 | | $ 723,814 |
Open Text Corp. (a) | 20,000 | | 1,025,727 |
OpenTable, Inc. (a) | 300 | | 11,739 |
Opera Software ASA | 39,900 | | 194,164 |
PChome Online, Inc. | 43,000 | | 264,801 |
Phoenix New Media Ltd. ADR | 8,800 | | 49,104 |
Qihoo 360 Technology Co. Ltd. ADR | 200 | | 3,138 |
Rackspace Hosting, Inc. (a) | 36,600 | | 1,574,166 |
Renren, Inc. ADR | 1,500 | | 5,325 |
Responsys, Inc. | 400 | | 3,556 |
RightNow Technologies, Inc. (a) | 7,400 | | 316,202 |
SciQuest, Inc. (a) | 16,015 | | 228,534 |
SINA Corp. (a)(d) | 17,300 | | 899,600 |
So-Net Entertainment Corp. | 75 | | 272,949 |
VistaPrint Ltd. (a) | 600 | | 18,360 |
Vocus, Inc. (a) | 15,000 | | 331,350 |
Yahoo!, Inc. (a) | 23,900 | | 385,507 |
| | 20,010,314 |
IT SERVICES - 3.8% |
Data Processing & Outsourced Services - 0.9% |
Fiserv, Inc. (a) | 1,400 | | 82,236 |
MasterCard, Inc. Class A | 2,800 | | 1,043,896 |
Syntel, Inc. | 2,000 | | 93,540 |
Teletech Holdings, Inc. (a) | 4,994 | | 80,903 |
Visa, Inc. Class A | 200 | | 20,306 |
| | 1,320,881 |
IT Consulting & Other Services - 2.9% |
Accenture PLC Class A | 10,767 | | 573,127 |
Atos Origin SA | 1,913 | | 83,968 |
Camelot Information Systems, Inc. ADR (a) | 10,500 | | 29,925 |
China Information Technology, Inc. (a) | 83 | | 52 |
Cognizant Technology Solutions Corp. Class A (a) | 24,300 | | 1,562,733 |
HiSoft Technology International Ltd. ADR (a) | 2,500 | | 23,075 |
iGate Corp. | 1,200 | | 18,876 |
International Business Machines Corp. | 4,300 | | 790,684 |
Lionbridge Technologies, Inc. (a) | 132,300 | | 302,967 |
Teradata Corp. (a) | 14,600 | | 708,246 |
Virtusa Corp. (a) | 10,000 | | 144,800 |
| | 4,238,453 |
TOTAL IT SERVICES | | 5,559,334 |
LIFE SCIENCES TOOLS & SERVICES - 0.0% |
Life Sciences Tools & Services - 0.0% |
Agilent Technologies, Inc. (a) | 2,100 | | 73,353 |
MACHINERY - 0.3% |
Industrial Machinery - 0.3% |
Fanuc Corp. | 300 | | 45,917 |
Common Stocks - continued |
| Shares | | Value |
MACHINERY - CONTINUED |
Industrial Machinery - continued |
Shin Zu Shing Co. Ltd. | 3,515 | | $ 6,790 |
THK Co. Ltd. | 16,700 | | 329,161 |
| | 381,868 |
MEDIA - 0.6% |
Advertising - 0.2% |
Dentsu, Inc. | 100 | | 3,052 |
ReachLocal, Inc. (a)(d) | 38,300 | | 236,694 |
| | 239,746 |
Cable & Satellite - 0.3% |
DISH Network Corp. Class A | 17,500 | | 498,400 |
Movies & Entertainment - 0.1% |
IMAX Corp. (a) | 5,900 | | 108,147 |
Publishing - 0.0% |
Next Media Ltd. (a) | 400,000 | | 35,022 |
TOTAL MEDIA | | 881,315 |
METALS & MINING - 0.0% |
Diversified Metals & Mining - 0.0% |
Timminco Ltd. (a) | 700 | | 103 |
PROFESSIONAL SERVICES - 0.5% |
Human Resource & Employment Services - 0.4% |
51job, Inc. sponsored ADR (a) | 14,100 | | 591,354 |
Research & Consulting Services - 0.1% |
Acacia Research Corp. - Acacia Technologies (a) | 4,300 | | 156,993 |
eClerx | 4,935 | | 64,235 |
| | 221,228 |
TOTAL PROFESSIONAL SERVICES | | 812,582 |
REAL ESTATE MANAGEMENT & DEVELOPMENT - 0.1% |
Real Estate Services - 0.1% |
China Real Estate Information Corp. ADR (a) | 21,800 | | 88,290 |
SEMICONDUCTORS & SEMICONDUCTOR EQUIPMENT - 24.4% |
Semiconductor Equipment - 8.1% |
Amkor Technology, Inc. (a)(d) | 17,395 | | 75,842 |
Applied Materials, Inc. | 1,400 | | 14,994 |
ASM International NV unit | 20,000 | | 583,600 |
ASML Holding NV | 96,000 | | 4,011,840 |
centrotherm photovoltaics AG | 500 | | 6,404 |
Cymer, Inc. (a) | 22,300 | | 1,109,648 |
Entegris, Inc. (a) | 55,800 | | 486,855 |
GCL-Poly Energy Holdings Ltd. | 529,000 | | 147,803 |
Genesis Photonics, Inc. | 16,000 | | 20,208 |
KLA-Tencor Corp. | 32,600 | | 1,572,950 |
Novellus Systems, Inc. (a) | 53,400 | | 2,204,886 |
STR Holdings, Inc. (a) | 1,300 | | 10,699 |
|
| Shares | | Value |
Teradyne, Inc. (a) | 39,000 | | $ 531,570 |
Tokyo Electron Ltd. | 8,800 | | 447,632 |
Ultratech, Inc. (a) | 31,400 | | 771,498 |
| | 11,996,429 |
Semiconductors - 16.3% |
Altera Corp. | 42,000 | | 1,558,200 |
Applied Micro Circuits Corp. (a) | 12,600 | | 84,672 |
ARM Holdings PLC sponsored ADR | 27,700 | | 766,459 |
Atmel Corp. (a) | 16,000 | | 129,600 |
Avago Technologies Ltd. | 26,000 | | 750,360 |
BCD Semiconductor Manufacturing Ltd. ADR | 66,700 | | 265,466 |
Broadcom Corp. Class A | 500 | | 14,680 |
Canadian Solar, Inc. (a) | 3,400 | | 9,044 |
Cavium, Inc. (a) | 30,291 | | 861,173 |
Cree, Inc. (a)(d) | 33,000 | | 727,320 |
Cypress Semiconductor Corp. | 24,100 | | 407,049 |
Diodes, Inc. (a) | 3,600 | | 76,680 |
Duksan Hi-Metal Co. Ltd. (a) | 34,806 | | 760,787 |
Energy Conversion Devices, Inc. (a)(d) | 2,100 | | 424 |
Epistar Corp. | 199,000 | | 422,510 |
Fairchild Semiconductor International, Inc. (a) | 82,800 | | 996,912 |
Freescale Semiconductor Holdings I Ltd. | 49,600 | | 627,440 |
Gintech Energy Corp. | 1,549 | | 1,670 |
Hittite Microwave Corp. (a) | 321 | | 15,851 |
Hynix Semiconductor, Inc. | 15,710 | | 296,747 |
Infineon Technologies AG | 49,300 | | 371,142 |
Inphi Corp. (a) | 16,500 | | 197,340 |
Intel Corp. | 600 | | 14,550 |
International Rectifier Corp. (a) | 11,100 | | 215,562 |
Intersil Corp. Class A | 14,300 | | 149,292 |
JA Solar Holdings Co. Ltd. ADR (a)(d) | 116,600 | | 156,244 |
MagnaChip Semiconductor Corp. | 23,400 | | 175,032 |
Micron Technology, Inc. (a) | 313,600 | | 1,972,544 |
Microsemi Corp. (a) | 900 | | 15,075 |
Monolithic Power Systems, Inc. (a) | 31,600 | | 476,212 |
Netlogic Microsystems, Inc. (a) | 5,400 | | 267,678 |
NVIDIA Corp. (a) | 71,500 | | 990,990 |
NXP Semiconductors NV (a) | 89,400 | | 1,374,078 |
ON Semiconductor Corp. (a) | 136,800 | | 1,056,096 |
Phison Electronics Corp. | 55,000 | | 331,435 |
Power Integrations, Inc. (d) | 5,314 | | 176,212 |
Radiant Opto-Electronics Corp. | 151,352 | | 432,292 |
Rambus, Inc. (a) | 36,700 | | 277,085 |
RDA Microelectronics, Inc. sponsored ADR (a) | 27,200 | | 297,296 |
RF Micro Devices, Inc. (a) | 123,400 | | 666,360 |
Seoul Semiconductor Co. Ltd. | 10,897 | | 196,925 |
Silicon Laboratories, Inc. (a) | 4,700 | | 204,074 |
Silicon Motion Technology Corp. sponsored ADR (a) | 18,500 | | 378,880 |
Skyworks Solutions, Inc. (a) | 19,400 | | 314,668 |
Spansion, Inc. Class A (a) | 13,200 | | 109,296 |
Common Stocks - continued |
| Shares | | Value |
SEMICONDUCTORS & SEMICONDUCTOR EQUIPMENT - CONTINUED |
Semiconductors - continued |
Spreadtrum Communications, Inc. ADR (d) | 39,400 | | $ 822,672 |
SunPower Corp. (a) | 364 | | 2,268 |
Texas Instruments, Inc. | 92,100 | | 2,681,031 |
Trina Solar Ltd. (a)(d) | 11,100 | | 74,148 |
Volterra Semiconductor Corp. (a) | 2,000 | | 51,220 |
Xilinx, Inc. | 23,900 | | 766,234 |
YoungTek Electronics Corp. | 171 | | 315 |
| | 23,987,290 |
TOTAL SEMICONDUCTORS & SEMICONDUCTOR EQUIPMENT | | 35,983,719 |
SOFTWARE - 22.5% |
Application Software - 15.1% |
ANSYS, Inc. (a) | 11,000 | | 630,080 |
AsiaInfo-Linkage, Inc. (a)(d) | 20,800 | | 161,200 |
Aspen Technology, Inc. (a) | 53,800 | | 933,430 |
Autodesk, Inc. (a) | 30,800 | | 934,164 |
AutoNavi Holdings Ltd. ADR (a) | 24,500 | | 245,735 |
BroadSoft, Inc. (a)(d) | 27,400 | | 827,480 |
Cadence Design Systems, Inc. (a) | 9,100 | | 94,640 |
Citrix Systems, Inc. (a) | 45,900 | | 2,787,048 |
Concur Technologies, Inc. (a) | 29,900 | | 1,518,621 |
Convio, Inc. (a) | 33,200 | | 367,192 |
Descartes Systems Group, Inc. (a) | 78,200 | | 562,082 |
Informatica Corp. (a) | 11,700 | | 432,081 |
Intuit, Inc. | 11,700 | | 615,303 |
JDA Software Group, Inc. (a) | 643 | | 20,827 |
Jive Software, Inc. | 400 | | 6,400 |
Kenexa Corp. (a) | 4,200 | | 112,140 |
Kingdee International Software Group Co. Ltd. | 1,842,400 | | 495,792 |
Magma Design Automation, Inc. (a) | 54,000 | | 387,720 |
Manhattan Associates, Inc. (a) | 1,288 | | 52,138 |
Micro Focus International PLC | 33,400 | | 200,342 |
MicroStrategy, Inc. Class A (a) | 7,601 | | 823,340 |
Nuance Communications, Inc. (a) | 16,500 | | 415,140 |
Parametric Technology Corp. (a) | 39,068 | | 713,382 |
Pegasystems, Inc. (d) | 19,600 | | 576,240 |
QLIK Technologies, Inc. (a) | 16,500 | | 399,300 |
RealPage, Inc. (a) | 6,900 | | 174,363 |
salesforce.com, Inc. (a) | 42,000 | | 4,261,320 |
SolarWinds, Inc. (a) | 32,000 | | 894,400 |
SuccessFactors, Inc. (a) | 5,900 | | 235,233 |
Synopsys, Inc. (a) | 8,100 | | 220,320 |
Taleo Corp. Class A (a) | 28,100 | | 1,087,189 |
|
| Shares | | Value |
TIBCO Software, Inc. (a) | 600 | | $ 14,346 |
Ultimate Software Group, Inc. (a) | 9,000 | | 586,080 |
VanceInfo Technologies, Inc. ADR (a)(d) | 40,400 | | 366,428 |
Verint Systems, Inc. (a) | 3,100 | | 85,374 |
| | 22,236,870 |
Home Entertainment Software - 0.3% |
NCsoft Corp. | 1,282 | | 339,241 |
Nexon Co. Ltd. | 3,700 | | 53,218 |
Perfect World Co. Ltd. sponsored ADR Class B (a) | 700 | | 7,329 |
Rosetta Stone, Inc. (a) | 1,100 | | 8,393 |
| | 408,181 |
Systems Software - 7.1% |
Allot Communications Ltd. (a) | 19,100 | | 290,320 |
Ariba, Inc. (a) | 45,892 | | 1,288,647 |
Check Point Software Technologies Ltd. (a) | 1,400 | | 73,556 |
CommVault Systems, Inc. (a) | 34,600 | | 1,478,112 |
Fortinet, Inc. (a) | 33,100 | | 721,911 |
Insyde Software Corp. | 5,823 | | 27,591 |
Microsoft Corp. | 6,125 | | 159,005 |
NetSuite, Inc. (a) | 7,800 | | 316,290 |
Oracle Corp. | 214,700 | | 5,507,055 |
Red Hat, Inc. (a) | 6,400 | | 264,256 |
Rovi Corp. (a) | 5,319 | | 130,741 |
Symantec Corp. (a) | 1,100 | | 17,215 |
Totvs SA | 14,700 | | 262,410 |
| | 10,537,109 |
TOTAL SOFTWARE | | 33,182,160 |
WIRELESS TELECOMMUNICATION SERVICES - 0.9% |
Wireless Telecommunication Services - 0.9% |
American Tower Corp. Class A | 10,500 | | 630,105 |
Crown Castle International Corp. (a) | 2,000 | | 89,600 |
SBA Communications Corp. Class A (a) | 13,700 | | 588,552 |
| | 1,308,257 |
TOTAL COMMON STOCKS (Cost $132,079,369) |
142,379,142
|
Convertible Bonds - 0.4% |
| Principal Amount | | |
COMMUNICATIONS EQUIPMENT - 0.1% |
Communications Equipment - 0.1% |
Ciena Corp. 0.25% 5/1/13 | | $ 150,000 | | 146,715 |
Convertible Bonds - continued |
| Principal
Amount | | Value |
SEMICONDUCTORS & SEMICONDUCTOR EQUIPMENT - 0.3% |
Semiconductors - 0.3% |
JA Solar Holdings Co. Ltd. 4.5% 5/15/13 | | $ 510,000 | | $ 374,850 |
TOTAL CONVERTIBLE BONDS (Cost $550,970) |
521,565
|
Money Market Funds - 6.5% |
| Shares | | |
Fidelity Cash Central Fund, 0.11% (b) | 4,659,135 | | 4,659,135 |
Fidelity Securities Lending Cash Central Fund, 0.13% (b)(c) | 4,907,803 | | 4,907,803 |
TOTAL MONEY MARKET FUNDS (Cost $9,566,938) |
9,566,938
|
TOTAL INVESTMENT PORTFOLIO - 103.4% (Cost $142,197,277) | | 152,467,645 |
NET OTHER ASSETS (LIABILITIES) - (3.4)% | | (4,966,129) |
NET ASSETS - 100% | $ 147,501,516 |
Legend |
(a) Non-income producing |
(b) Affiliated fund that is available only to investment companies and other accounts managed by Fidelity Investments. The rate quoted is the annualized seven-day yield of the fund at period end. A complete unaudited listing of the fund's holdings as of its most recent quarter end is available upon request. In addition, each Fidelity Central Fund's financial statements, which are not covered by the Fund's Report of Independent Registered Public Accounting Firm, are available on the SEC's website or upon request. |
(c) Investment made with cash collateral received from securities on loan. |
(d) Security or a portion of the security is on loan at period end. |
(e) Security exempt from registration under Rule 144A of the Securities Act of 1933. These securities may be resold in transactions exempt from registration, normally to qualified institutional buyers. At the end of the period, the value of these securities amounted to $13,043 or 0.0% of net assets. |
(f) Restricted securities - Investment in securities not registered under the Securities Act of 1933 (excluding 144A issues). At the end of the period, the value of restricted securities (excluding 144A issues) amounted to $242,225 or 0.2% of net assets. |
Additional information on each restricted holding is as follows: |
Security | Acquisition Date | Acquisition Cost |
Facebook, Inc. Class B | 3/31/11 - 5/19/11 | $ 242,289 |
Affiliated Central Funds |
Information regarding fiscal year to date income earned by the Fund from investments in Fidelity Central Funds is as follows: |
Fund | Income earned |
Fidelity Cash Central Fund | $ 6,340 |
Fidelity Securities Lending Cash Central Fund | 200,668 |
Total | $ 207,008 |
Other Information |
The following is a summary of the inputs used, as of December 31, 2011, involving the Fund's assets and liabilities carried at fair value. The inputs or methodology used for valuing securities may not be an indication of the risk associated with investing in those securities. For more information on valuation inputs, and their aggregation into the levels used in the tables below, please refer to the Security Valuation section in the accompanying Notes to Financial Statements. |
Valuation Inputs at Reporting Date: |
Description | Total | Level 1 | Level 2 | Level 3 |
Investments in Securities: | | | | |
Common Stocks | $ 142,379,142 | $ 142,136,917 | $ - | $ 242,225 |
Convertible Bonds | 521,565 | - | 521,565 | - |
Money Market Funds | 9,566,938 | 9,566,938 | - | - |
Total Investments in Securities: | $ 152,467,645 | $ 151,703,855 | $ 521,565 | $ 242,225 |
The following is a reconciliation of Investments in Securities for which Level 3 inputs were used in determining value: |
Investments in Securities: | |
Beginning Balance | $ - |
Total Realized Gain (Loss) | - |
Total Unrealized Gain (Loss) | (64) |
Cost of Purchases | 242,289 |
Proceeds of Sales | - |
Amortization/Accretion | - |
Transfers in to Level 3 | - |
Transfers out of Level 3 | - |
Ending Balance | $ 242,225 |
The change in unrealized gain (loss) for the period attributable to Level 3 securities held at December 31, 2011 | $ (64) |
The information used in the above reconciliation represents fiscal year to date activity for any Investments in Securities identified as using Level 3 inputs at either the beginning or the end of the current fiscal period Transfers in or out of Level 3 represent the beginning value of any Security or Instrument where a change in the pricing level occurred from the beginning to the end of the period. The cost of purchases and the proceeds of sales may include securities received or delivered through corporate actions or exchanges. Realized and unrealized gains (losses) disclosed in the reconciliation are included in Net Gain (Loss) on the Fund's Statement of Operations. |
Distribution of investments by country of issue, as a percentage of total net assets, is as follows: (Unaudited) |
United States of America | 80.3% |
Cayman Islands | 4.4% |
Netherlands | 4.1% |
Japan | 2.6% |
Taiwan | 1.5% |
Canada | 1.5% |
Korea (South) | 1.0% |
Bermuda | 1.0% |
Others (Individually Less Than 1%) | 3.6% |
| 100.0% |
See accompanying notes which are an integral part of the financial statements.
Annual Report
Statement of Assets and Liabilities
| December 31, 2011 |
| | |
Assets | | |
Investment in securities, at value (including securities loaned of $4,781,641) - See accompanying schedule: Unaffiliated issuers (cost $132,630,339) | $ 142,900,707 | |
Fidelity Central Funds (cost $9,566,938) | 9,566,938 | |
Total Investments (cost $142,197,277) | | $ 152,467,645 |
Foreign currency held at value (cost $20,046) | | 19,933 |
Receivable for investments sold | | 896,364 |
Receivable for fund shares sold | | 5,829 |
Dividends receivable | | 12,898 |
Interest receivable | | 2,962 |
Distributions receivable from Fidelity Central Funds | | 6,788 |
Prepaid expenses | | 542 |
Other receivables | | 56,084 |
Total assets | | 153,469,045 |
| | |
Liabilities | | |
Payable for investments purchased | $ 652,425 | |
Payable for fund shares redeemed | 282,837 | |
Accrued management fee | 70,017 | |
Other affiliated payables | 18,615 | |
Other payables and accrued expenses | 35,832 | |
Collateral on securities loaned, at value | 4,907,803 | |
Total liabilities | | 5,967,529 |
| | |
Net Assets | | $ 147,501,516 |
Net Assets consist of: | | |
Paid in capital | | $ 123,560,383 |
Accumulated net investment loss | | (12,831) |
Accumulated undistributed net realized gain (loss) on investments and foreign currency transactions | | 13,683,708 |
Net unrealized appreciation (depreciation) on investments and assets and liabilities in foreign currencies | | 10,270,256 |
Net Assets | | $ 147,501,516 |
Statement of Assets and Liabilities - continued
| December 31, 2011 |
| | |
Initial Class:
Net Asset Value, offering price and redemption price per share ($69,912,157 ÷ 7,129,919 shares) | | $ 9.81 |
| | |
Investor Class:
Net Asset Value, offering price and redemption price per share ($77,589,359 ÷ 7,954,936 shares) | | $ 9.75 |
See accompanying notes which are an integral part of the financial statements.
Annual Report
Financial Statements - continued
Statement of Operations
| Year ended December 31, 2011 |
| | |
Investment Income | | |
Dividends | | $ 661,657 |
Interest | | 25,304 |
Income from Fidelity Central Funds (including $200,668 from security lending) | | 207,008 |
Total income | | 893,969 |
| | |
Expenses | | |
Management fee | $ 1,050,276 | |
Transfer agent fees | 222,434 | |
Accounting and security lending fees | 74,996 | |
Custodian fees and expenses | 34,800 | |
Independent trustees' compensation | 1,067 | |
Audit | 42,231 | |
Legal | 753 | |
Interest | 283 | |
Miscellaneous | 1,594 | |
Total expenses before reductions | 1,428,434 | |
Expense reductions | (31,003) | 1,397,431 |
Net investment income (loss) | | (503,462) |
Realized and Unrealized Gain (Loss) Net realized gain (loss) on: | | |
Investment securities: | | |
Unaffiliated issuers | 17,585,596 | |
Foreign currency transactions | 4,558 | |
Total net realized gain (loss) | | 17,590,154 |
Change in net unrealized appreciation (depreciation) on: Investment securities | (36,161,960) | |
Assets and liabilities in foreign currencies | (180) | |
Total change in net unrealized appreciation (depreciation) | | (36,162,140) |
Net gain (loss) | | (18,571,986) |
Net increase (decrease) in net assets resulting from operations | | $ (19,075,448) |
Statement of Changes in Net Assets
| Year ended
December 31,
2011 | Year ended
December 31,
2010 |
Increase (Decrease) in Net Assets | | |
Operations | | |
Net investment income (loss) | $ (503,462) | $ (594,832) |
Net realized gain (loss) | 17,590,154 | 21,727,514 |
Change in net unrealized appreciation (depreciation) | (36,162,140) | 14,642,560 |
Net increase (decrease) in net assets resulting from operations | (19,075,448) | 35,775,242 |
Distributions to shareholders from net realized gain | (6,522,480) | - |
Share transactions - net increase (decrease) | (19,563,936) | 4,540,824 |
Redemption fees | 65,581 | 70,230 |
Total increase (decrease) in net assets | (45,096,283) | 40,386,296 |
| | |
Net Assets | | |
Beginning of period | 192,597,799 | 152,211,503 |
End of period (including accumulated net investment loss of $12,831 and accumulated net investment loss of $0, respectively) | $ 147,501,516 | $ 192,597,799 |
See accompanying notes which are an integral part of the financial statements.
Annual Report
Financial Highlights - Initial Class
Years ended December 31, | 2011 | 2010 | 2009 | 2008 | 2007 |
Selected Per-Share Data | | | | | |
Net asset value, beginning of period | $ 11.28 | $ 8.83 | $ 4.51 | $ 11.02 | $ 10.37 |
Income from Investment Operations | | | | | |
Net investment income (loss) C | (.03) | (.03) | .01 F | .01 | (.05) |
Net realized and unrealized gain (loss) | (1.04) | 2.48 | 4.32 | (5.01) | 1.52 |
Total from investment operations | (1.07) | 2.45 | 4.33 | (5.00) | 1.47 |
Distributions from net investment income | - | - | (.01) | (.01) | - |
Distributions from net realized gain | (.40) | - | - | (1.49) | (.83) |
Total distributions | (.40) | - | (.01) | (1.51) I | (.83) |
Redemption fees added to paid in capital C | - H | - H | - H | - H | .01 |
Net asset value, end of period | $ 9.81 | $ 11.28 | $ 8.83 | $ 4.51 | $ 11.02 |
Total Return A, B | (9.78)% | 27.75% | 96.02% | (50.77)% | 15.36% |
Ratios to Average Net Assets D, G | | | | | |
Expenses before reductions | .72% | .73% | .78% | .81% | .81% |
Expenses net of fee waivers, if any | .72% | .72% | .78% | .81% | .81% |
Expenses net of all reductions | .70% | .71% | .76% | .79% | .79% |
Net investment income (loss) | (.23)% | (.35)% | .13% F | .19% | (.44)% |
Supplemental Data | | | | | |
Net assets, end of period (000 omitted) | $ 69,912 | $ 100,854 | $ 88,231 | $ 25,400 | $ 70,788 |
Portfolio turnover rate E | 153% | 114% | 130% | 237% | 213% |
A Total returns do not reflect charges attributable to your insurance company's separate account. Inclusion of these charges would reduce the total returns shown.
B Total returns would have been lower if certain expenses had not been reduced during the applicable periods shown.
C Calculated based on average shares outstanding during the period.
D Fees and expenses of any underlying Fidelity Central Funds are not included in the Fund's expense ratio. The Fund indirectly bears its proportionate share of the expenses of any underlying Fidelity Central Funds.
E Amount does not include the portfolio activity of any underlying Fidelity Central Funds.
F Investment income per share reflects a special dividend which amounted to $.01 per share. Excluding the special dividend, the ratio of net investment income (loss) to average net assets would have been (.08)%.
G Expense ratios reflect operating expenses of the class. Expenses before reductions do not reflect amounts reimbursed by the investment adviser or reductions from brokerage service arrangements or reductions from other expense offset arrangements and do not represent the amount paid by the class during periods when reimbursements or reductions occur. Expenses net of fee waivers reflect expenses after reimbursement by the investment adviser but prior to reductions from brokerage service arrangements or other expense offset arrangements. Expenses net of all reductions represent the net expenses paid by the class.
H Amount represents less than $.01 per share.
I Total distributions of $1.51 per share is comprised of distributions from net investment income of $.011 and distributions from net realized gain of $1.494 per share.
Financial Highlights - Investor Class
Years ended December 31, | 2011 | 2010 | 2009 | 2008 | 2007 |
Selected Per-Share Data | | | | | |
Net asset value, beginning of period | $ 11.22 | $ 8.79 | $ 4.50 | $ 10.97 | $ 10.34 |
Income from Investment Operations | | | | | |
Net investment income (loss) C | (.03) | (.04) | - F, H | .01 | (.06) |
Net realized and unrealized gain (loss) | (1.05) | 2.47 | 4.30 | (4.99) | 1.50 |
Total from investment operations | (1.08) | 2.43 | 4.30 | (4.98) | 1.44 |
Distributions from net investment income | - | - | (.01) | (.01) | - |
Distributions from net realized gain | (.39) | - | - | (1.49) | (.82) |
Total distributions | (.39) | - | (.01) | (1.49) I | (.82) |
Redemption fees added to paid in capital C | - H | - H | - H | - H | .01 |
Net asset value, end of period | $ 9.75 | $ 11.22 | $ 8.79 | $ 4.50 | $ 10.97 |
Total Return A, B | (9.92)% | 27.65% | 95.49% | (50.74)% | 15.15% |
Ratios to Average Net Assets D, G | | | | | |
Expenses before reductions | .80% | .81% | .88% | .90% | .93% |
Expenses net of fee waivers, if any | .80% | .81% | .88% | .90% | .93% |
Expenses net of all reductions | .78% | .80% | .85% | .89% | .91% |
Net investment income (loss) | (.31)% | (.44)% | .03% F | .10% | (.56)% |
Supplemental Data | | | | | |
Net assets, end of period (000 omitted) | $ 77,589 | $ 91,743 | $ 63,980 | $ 12,903 | $ 34,367 |
Portfolio turnover rate E | 153% | 114% | 130% | 237% | 213% |
A Total returns do not reflect charges attributable to your insurance company's separate account. Inclusion of these charges would reduce the total returns shown.
B Total returns would have been lower if certain expenses had not been reduced during the applicable periods shown.
C Calculated based on average shares outstanding during the period.
D Fees and expenses of any underlying Fidelity Central Funds are not included in the Fund's expense ratio. The Fund indirectly bears its proportionate share of the expenses of any underlying Fidelity Central Funds.
E Amount does not include the portfolio activity of any underlying Fidelity Central Funds.
F Investment income per share reflects a special dividend which amounted to $.01 per share. Excluding the special dividend, the ratio of net investment income (loss) to average net assets would have been (.17)%.
G Expense ratios reflect operating expenses of the class. Expenses before reductions do not reflect amounts reimbursed by the investment adviser or reductions from brokerage service arrangements or reductions from other expense offset arrangements and do not represent the amount paid by the class during periods when reimbursements or reductions occur. Expenses net of fee waivers reflect expenses after reimbursement by the investment adviser but prior to reductions from brokerage service arrangements or other expense offset arrangements. Expenses net of all reductions represent the net expenses paid by the class.
H Amount represents less than $.01 per share.
I Total distributions of $1.49 per share is comprised of distributions from net investment income of $.005 and distributions from net realized gain of $1.485 per share.
See accompanying notes which are an integral part of the financial statements.
Annual Report
Notes to Financial Statements
For the period ended December 31, 2011
1. Organization.
VIP Technology Portfolio (the Fund) is a non-diversified fund of Variable Insurance Products Fund IV (the Trust) and is authorized to issue an unlimited number of shares. The Trust is registered under the Investment Company Act of 1940, as amended (the 1940 Act), as an open-end management investment company organized as a Massachusetts business trust. Shares of the Fund may only be purchased by insurance companies for the purpose of funding variable annuity or variable life insurance contracts. The Fund offers the following classes of shares: Initial Class shares and Investor Class shares. All classes have equal rights and voting privileges, except for matters affecting a single class. Investment income, realized and unrealized capital gains and losses, the common expenses of the Fund, and certain fund-level expense reductions, if any, are allocated on a pro-rata basis to each class based on the relative net assets of each class to the total net assets of the Fund. Each class differs with respect to transfer agent fees incurred. Certain expense reductions may also differ by class. The Fund's investments in emerging markets can be subject to social, economic, regulatory, and political uncertainties and can be extremely volatile.
2. Investments in Fidelity Central Funds.
The Fund invests in Fidelity Central Funds, which are open-end investment companies available only to other investment companies and accounts managed by Fidelity Management & Research Company (FMR) and its affiliates. The Fund's Schedule of Investments lists each of the Fidelity Central Funds held as of period end, if any, as an investment of the Fund, but do not include the underlying holdings of each Fidelity Central Fund. As an Investing Fund, the Fund indirectly bears its proportionate share of the expenses of the underlying Fidelity Central Funds.
The Money Market Central Funds seek preservation of capital and current income and are managed by Fidelity Investments Money Management, Inc. (FIMM), an affiliate of FMR.
A complete unaudited list of holdings for each Fidelity Central Fund is available upon request or at the Securities and Exchange Commission (the SEC) web site at www.sec.gov. In addition, the financial statements of the Fidelity Central Funds, which are not covered by the Fund's Report of Independent Registered Public Accounting Firm, are available on the SEC web site or upon request.
3. Significant Accounting Policies.
The financial statements have been prepared in conformity with accounting principles generally accepted in the United States of America (GAAP), which require management to make certain estimates and assumptions at the date of the financial statements. Actual results could differ from those estimates. Subsequent events, if any, through the date that the financial statements were issued have been evaluated in the preparation of the financial statements. The following summarizes the significant accounting policies of the Fund:
Security Valuation. Investments are valued as of 4:00 p.m. Eastern time on the last calendar day of the period. The Fund uses independent pricing services approved by the Board of Trustees to value its investments. When current market prices or quotations are not readily available or reliable, valuations may be determined in good faith in accordance with procedures adopted by the Board of Trustees. Factors used in determining value may include market or security specific events, changes in interest rates and credit quality. The frequency with which these procedures are used cannot be predicted and they may be utilized to a significant extent. The value used for net asset value (NAV) calculation under these procedures may differ from published prices for the same securities.
The Fund categorizes the inputs to valuation techniques used to value its investments into a disclosure hierarchy consisting of three levels as shown below:
Level 1 - quoted prices in active markets for identical investments
Level 2 - other significant observable inputs (including quoted prices for similar investments, interest rates, prepayment speeds, etc.)
Level 3 - unobservable inputs (including the Fund's own assumptions based on the best information available)
Changes in valuation techniques may result in transfers in or out of an assigned level within the disclosure hierarchy. The aggregate value of investments by input level, as of December 31, 2011, as well as a roll forward of Level 3 securities, is included at the end of the Fund's Schedule of Investments. Valuation techniques used to value the Fund's investments by major category are as follows:
Equity securities, including restricted securities, for which market quotations are readily available, are valued at the last reported sale price or official closing price as reported by an independent pricing service on the primary market or exchange on which they are traded and are categorized as Level 1 in the hierarchy. In the event there were no sales during the day or closing prices are not available, securities are valued at the last quoted bid price or may be valued using the last available price and are generally categorized as Level 2 in the hierarchy. For foreign equity securities, when significant market or security specific events arise, comparisons to the valuation of American Depositary Receipts (ADRs), futures contracts, Exchange-traded funds (ETFs) and certain indexes as well as quoted prices for similar securities are used and are categorized as Level 2 in the hierarchy in these
Annual Report
Notes to Financial Statements - continued
3. Significant Accounting Policies - continued
Security Valuation - continued
circumstances. Utilizing these techniques may result in transfers between Level 1 and Level 2. For restricted equity securities and private placements where observable inputs are limited, assumptions about market activity and risk are used and are categorized as Level 3 in the hierarchy.
Debt securities, including restricted securities, are valued based on evaluated prices received from independent pricing services or from dealers who make markets in such securities. For corporate bonds, pricing services utilize matrix pricing which considers yield or price of bonds of comparable quality, coupon, maturity and type as well as dealer supplied prices and are generally categorized as Level 2 in the hierarchy. When independent prices are unavailable or unreliable, debt securities may be valued utilizing pricing matrices which consider similar factors that would be used by independent pricing services. These are generally categorized as Level 2 in the hierarchy but may be Level 3 depending on the circumstances.
Investments in open-end mutual funds, including the Fidelity Central Funds, are valued at their closing net asset value each business day and are categorized as Level 1 in the hierarchy.
New Accounting Pronouncements. In May 2011, the Financial Accounting Standards Board issued Accounting Standard Update No. 2011-04, Fair Value Measurement (Topic 820) - Amendments to Achieve Common Fair Value Measurement and Disclosure Requirements in U.S. GAAP and IFRSs. The update is effective during interim and annual periods beginning after December 15, 2011 and will result in additional disclosure for transfers between levels as well as expanded disclosure for securities categorized as Level 3 under the fair value hierarchy.
In December 2011, the Financial Accounting Standards Board issued Accounting Standard Update No. 2011-11, Disclosures about Offsetting Assets and Liabilities. The update creates new disclosure requirements requiring entities to disclose both gross and net information for derivatives and other financial instruments that are either offset in the Statement of Assets and Liabilities or subject to an enforceable master netting arrangement or similar agreement. The disclosure requirements are effective for annual reporting periods beginning on or after January 1, 2013. Management is currently evaluating the impact of the update's adoption on the Fund's financial statement disclosures.
Foreign Currency. The Fund may use foreign currency contracts to facilitate transactions in foreign-denominated securities. Gains and losses from these transactions may arise from changes in the value of the foreign currency or if the counterparties do not perform under the contracts' terms.
Foreign-denominated assets, including investment securities, and liabilities are translated into U.S. dollars at the exchange rate at period end. Purchases and sales of investment securities, income and dividends received and expenses denominated in foreign currencies are translated into U.S. dollars at the exchange rate in effect on the transaction date.
The effects of exchange rate fluctuations on investments are included with the net realized and unrealized gain (loss) on investment securities. Other foreign currency transactions resulting in realized and unrealized gain (loss) are disclosed separately.
Investment Transactions and Income. For financial reporting purposes, the Fund's investment holdings and NAV include trades executed through the end of the last business day of the period. The NAV per share for processing shareholder transactions is calculated as of the close of business of the New York Stock Exchange (NYSE), normally 4:00 p.m. Eastern time and includes trades executed through the end of the prior business day. Gains and losses on securities sold are determined on the basis of identified cost and may include proceeds received from litigation. Dividend income is recorded on the ex-dividend date, except for certain dividends from foreign securities where the ex-dividend date may have passed, which are recorded as soon as the Fund is informed of the ex-dividend date. Non-cash dividends included in dividend income, if any, are recorded at the fair market value of the securities received. Distributions received on securities that represent a return of capital or capital gain are recorded as a reduction of cost of investments and/or as a realized gain. The Fund estimates the components of distributions received that may be considered return of capital distributions or capital gain distributions. Interest income and distributions from the Fidelity Central Funds are accrued as earned. Interest income includes coupon interest and amortization of premium and accretion of discount on debt securities. Investment income is recorded net of foreign taxes withheld where recovery of such taxes is uncertain.
Expenses. Expenses directly attributable to a fund are charged to that fund. Expenses attributable to more than one fund are allocated among the respective funds on the basis of relative net assets or other appropriate methods. Expense estimates are accrued in the period to which they relate and adjustments are made when actual amounts are known.
Income Tax Information and Distributions to Shareholders. Each year, the Fund intends to qualify as a regulated investment company, including distributing substantially all of its taxable income and realized gains under Subchapter M of the Internal Revenue Code. As a result, no provision for income taxes is required. As of December 31, 2011, the Fund did not have any unrecognized tax benefits in the financial statements; nor is the Fund aware of any tax positions for which it is reasonably possible that the total amounts of unrecognized tax benefits will significantly change in the next twelve months. The Fund files a U.S. federal tax return, in addition to state and local tax returns as required. A fund's tax returns are subject to examination by the Internal Revenue Service (IRS) for a period of three fiscal years. State and local tax returns may be subject to examination for an
Annual Report
3. Significant Accounting Policies - continued
Income Tax Information and Distributions to Shareholders - continued
additional fiscal year depending on the jurisdiction. Foreign taxes are provided for based on the Fund's understanding of the tax rules and rates that exist in the foreign markets in which it invests.
Distributions are declared and recorded on the ex-dividend date. Income dividends and capital gain distributions are declared separately for each class. Income and capital gain distributions are determined in accordance with income tax regulations, which may differ from GAAP.
Capital accounts within the financial statements are adjusted for permanent book-tax differences. These adjustments have no impact on net assets or the results of operations. Temporary book-tax differences will reverse in a subsequent period.
Book-tax differences are primarily due to foreign currency transactions, market discount, net operating losses and losses deferred due to wash sales and excise tax regulations.
The federal tax cost of investment securities and unrealized appreciation (depreciation) as of period end were as follows:
Gross unrealized appreciation | $ 26,138,262 |
Gross unrealized depreciation | (16,529,245) |
Net unrealized appreciation (depreciation) on securities and other investments | $ 9,609,017 |
| |
Tax Cost | $ 142,858,628 |
The tax-based components of distributable earnings as of period end were as follows:
Undistributed long-term capital gain | $ 17,364,248 |
Net unrealized appreciation (depreciation) | $ 9,608,905 |
The fund intends to elect to defer to its fiscal year ending December 31, 2012 approximately $3,000,295 of losses recognized during the period November 1, 2011 to December 31, 2011.
The tax character of distributions paid was as follows:
| December 31, 2011 | December 31, 2010 |
Ordinary Income | $ 3,025,655 | $ - |
Long-term Capital Gains | 3,496,825 | - |
Total | $ 6,522,480 | $ - |
Trading (Redemption) Fees. Shares held by investors less than 60 days are subject to a redemption fee equal to 1% of the net asset value of shares redeemed. All redemption fees, which reduce the proceeds of the shareholder redemption, are retained by the Fund and accounted for as an addition to paid in capital.
4. Operating Policies.
Restricted Securities. The Fund may invest in securities that are subject to legal or contractual restrictions on resale. These securities generally may be resold in transactions exempt from registration or to the public if the securities are registered. Disposal of these securities may involve time-consuming negotiations and expense, and prompt sale at an acceptable price may be difficult. Information regarding restricted securities is included at the end of the Fund's Schedule of Investments.
5. Purchases and Sales of Investments.
Purchases and sales of securities, other than short-term securities, aggregated $281,696,575 and $311,271,316, respectively.
6. Fees and Other Transactions with Affiliates.
Management Fee. FMR and its affiliates provide the Fund with investment management related services for which the Fund pays a monthly management fee. The management fee is the sum of an individual fund fee rate that is based on an annual rate of .30% of the Fund's average net assets and an annualized group fee rate that averaged .26% during the period. The group fee rate is based upon the average net assets of all the mutual funds advised by FMR. The group fee rate decreases as assets under management increase and increases as assets under management decrease. For the period, the total annual management fee rate was .56% of the Fund's average net assets.
Annual Report
Notes to Financial Statements - continued
6. Fees and Other Transactions with Affiliates - continued
Transfer Agent Fees. Fidelity Investments Institutional Operations Company, Inc. (FIIOC), an affiliate of FMR, is the Fund's transfer, dividend disbursing, and shareholder servicing agent. FIIOC receives an asset-based fee with respect to each class. Each class (with the exception of Investor Class) pays a transfer agent fee, excluding out of pocket expenses, equal to an annual rate of .07% of average net assets. Investor Class pays a monthly asset-based transfer agent fee of .15% of average net assets. In addition, FIIOC receives an asset-based fee of .0045% of average net assets for typesetting, printing and mailing of shareholder reports, except proxy statements. FIIOC voluntarily agreed to waive this fee for the period August 1, 2011 through December 31, 2011 (see Expense Reductions note). For the period, transfer agent fees for each class, including printing and out of pocket expenses, were as follows:
Initial Class | $ 69,836 |
Investor Class | 152,598 |
| $ 222,434 |
Accounting and Security Lending Fees. Fidelity Service Company, Inc. (FSC), an affiliate of FMR, maintains the Fund's accounting records. The accounting fee is based on the level of average net assets for the month. Under a separate contract, FSC administers the security lending program. The security lending fee is based on the number and duration of lending transactions.
Brokerage Commissions. The Fund placed a portion of its portfolio transactions with brokerage firms which are affiliates of the investment adviser. The commissions paid to these affiliated firms were $12,426 for the period.
Interfund Lending Program. Pursuant to an Exemptive Order issued by the SEC, the Fund, along with other registered investment companies having management contracts with FMR, may participate in an interfund lending program. This program provides an alternative credit facility allowing the funds to borrow from, or lend money to, other participating affiliated funds. At period end, there were no interfund loans outstanding. The Fund's activity in this program during the period for which loans were outstanding was as follows:
Borrower or Lender | Average
Loan Balance | Weighted Average
Interest Rate | Interest
Expense |
Borrower | $ 3,630,571 | .40% | $ 283 |
7. Committed Line of Credit.
The Fund participates with other funds managed by FMR or an affiliate in a $4.0 billion credit facility (the "line of credit") to be utilized for temporary or emergency purposes to fund shareholder redemptions or for other short-term liquidity purposes. The Fund has agreed to pay commitment fees on its pro-rata portion of the line of credit, which amounted to $585 and is reflected in Miscellaneous expenses on the Statement of Operations. During the period, there were no borrowings on this line of credit.
8. Security Lending.
The Fund lends portfolio securities through a lending agent from time to time in order to earn additional income. For equity securities, a lending agent is used and may loan securities to certain qualified borrowers, including Fidelity Capital Markets (FCM), a broker-dealer affiliated with the Fund. On the settlement date of the loan, the Fund receives collateral (in the form of U.S. Treasury obligations, letters of credit and/or cash) against the loaned securities and maintains collateral in an amount not less than 100% of the market value of the loaned securities during the period of the loan. The market value of the loaned securities is determined at the close of business of the Fund and any additional required collateral is delivered to the Fund on the next business day. If the borrower defaults on its obligation to return the securities loaned because of insolvency or other reasons, a fund could experience delays and costs in recovering the securities loaned or in gaining access to the collateral. Any cash collateral received is invested in the Fidelity Securities Lending Cash Central Fund. The value of loaned securities and cash collateral at period end are disclosed on the Fund's Statement of Assets and Liabilities. The value of securities loaned to FCM at period end was $111,600. Security lending income represents the income earned on investing cash collateral, less rebates paid to borrowers and any lending agent fees associated with the loan, plus any premium payments received for lending certain types of securities. Security lending income is presented in the Statement of Operations as a component of income from Fidelity Central Funds, and includes $1,133 from securities loaned to FCM.
9. Expense Reductions.
FMR or its affiliates agreed to waive certain fees during the period as noted in the table below.
Initial Class | $ 1,443 |
Investor Class | 1,501 |
| $ 2,944 |
Annual Report
9. Expense Reductions - continued
In addition, many of the brokers with whom FMR places trades on behalf of the Fund provided services to the Fund in addition to trade execution. These services included payments of certain expenses on behalf of the Fund totaling $28,059 for the period.
10. Distributions to Shareholders.
Distributions to shareholders of each class were as follows:
Years ended December 31, | 2011 | 2010 |
From net realized gain | | |
Initial Class | $ 3,282,832 | $ - |
Investor Class | 3,239,648 | - |
Total | $ 6,522,480 | $ - |
11. Share Transactions.
Transactions for each class of shares were as follows:
| Shares | Dollars |
Years ended December 31, | 2011 | 2010 | 2011 | 2010 |
Initial Class | | | | |
Shares sold | 2,185,236 | 2,243,164 | $ 25,288,744 | $ 22,111,972 |
Reinvestment of distributions | 303,115 | - | 3,282,832 | - |
Shares redeemed | (4,301,667) | (3,290,097) | (47,332,197) | (29,026,956) |
Net increase (decrease) | (1,813,316) | (1,046,933) | $ (18,760,621) | $ (6,914,984) |
Investor Class | | | | |
Shares sold | 3,258,054 | 3,459,301 | $ 36,973,751 | $ 34,104,347 |
Reinvestment of distributions | 302,243 | - | 3,239,648 | - |
Shares redeemed | (3,783,807) | (2,557,328) | (41,016,714) | (22,648,539) |
Net increase (decrease) | (223,510) | 901,973 | $ (803,315) | $ 11,455,808 |
12. Other.
The Fund's organizational documents provide former and current trustees and officers with a limited indemnification against liabilities arising in connection with the performance of their duties to the Fund. In the normal course of business, the Fund may also enter into contracts that provide general indemnifications. The Fund's maximum exposure under these arrangements is unknown as this would be dependent on future claims that may be made against the Fund. The risk of material loss from such claims is considered remote.
At the end of the period, FMR or its affiliates were the owners of record of 100% of the total outstanding shares of the Fund.
Annual Report
Report of Independent Registered Public Accounting Firm
To the Trustees of Variable Insurance Products Fund IV and the Shareholders of VIP Technology Portfolio:
In our opinion, the accompanying statement of assets and liabilities, including the schedule of investments, and the related statements of operations and of changes in net assets and the financial highlights present fairly, in all material respects, the financial position of VIP Technology Portfolio (a fund of Variable Insurance Products Fund IV) at December 31, 2011, the results of its operations for the year then ended, the changes in its net assets for each of the two years in the period then ended and the financial highlights for each of the five years in the period then ended, in conformity with accounting principles generally accepted in the United States of America. These financial statements and financial highlights (hereafter referred to as "financial statements") are the responsibility of the VIP Technology Portfolio's management. Our responsibility is to express an opinion on these financial statements based on our audits. We conducted our audits of these financial statements in accordance with the standards of the Public Company Accounting Oversight Board (United States). Those standards require that we plan and perform the audit to obtain reasonable assurance about whether the financial statements are free of material misstatement. An audit includes examining, on a test basis, evidence supporting the amounts and disclosures in the financial statements, assessing the accounting principles used and significant estimates made by management, and evaluating the overall financial statement presentation. We believe that our audits, which included confirmation of securities at December 31, 2011 by correspondence with the custodian and brokers, provide a reasonable basis for our opinion.
/s/ PricewaterhouseCoopers LLP
PricewaterhouseCoopers LLP
Boston, Massachusetts
February 14, 2012
Annual Report
The Trustees, Members of the Advisory Board, and executive officers of the trust and fund, as applicable, are listed below. The Board of Trustees governs the fund and is responsible for protecting the interests of shareholders. The Trustees are experienced executives who meet periodically throughout the year to oversee the fund's activities, review contractual arrangements with companies that provide services to the fund, oversee management of the risks associated with such activities and contractual arrangements, and review the fund's performance. Except for James C. Curvey, each of the Trustees oversees 226 funds advised by FMR or an affiliate. Mr. Curvey oversees 429 funds advised by FMR or an affiliate.
The Trustees hold office without limit in time except that (a) any Trustee may resign; (b) any Trustee may be removed by written instrument, signed by at least two-thirds of the number of Trustees prior to such removal; (c) any Trustee who requests to be retired or who has become incapacitated by illness or injury may be retired by written instrument signed by a majority of the other Trustees; and (d) any Trustee may be removed at any special meeting of shareholders by a two-thirds vote of the outstanding voting securities of the trust. Each Trustee who is not an interested person (as defined in the 1940 Act) (Independent Trustee), shall retire not later than the last day of the calendar year in which his or her 75th birthday occurs. The Independent Trustees may waive this mandatory retirement age policy with respect to individual Trustees. The executive officers and Advisory Board Members hold office without limit in time, except that any officer and Advisory Board Member may resign or may be removed by a vote of a majority of the Trustees at any regular meeting or any special meeting of the Trustees. Except as indicated, each individual has held the office shown or other offices in the same company for the past five years.
Experience, Skills, Attributes, and Qualifications of the Fund's Trustees. The Governance and Nominating Committee has adopted a statement of policy that describes the experience, qualifications, attributes, and skills that are necessary and desirable for potential Independent Trustee candidates (Statement of Policy). The Board believes that each Trustee satisfied at the time he or she was initially elected or appointed a Trustee, and continues to satisfy, the standards contemplated by the Statement of Policy. The Governance and Nominating Committee also engages professional search firms to help identify potential Independent Trustee candidates who have the experience, qualifications, attributes, and skills consistent with the Statement of Policy. From time to time, additional criteria based on the composition and skills of the current Independent Trustees, as well as experience or skills that may be appropriate in light of future changes to board composition, business conditions, and regulatory or other developments, have also been considered by the professional search firms and the Governance and Nominating Committee. In addition, the Board takes into account the Trustees' commitment and participation in Board and committee meetings, as well as their leadership of standing and ad hoc committees throughout their tenure.
In determining that a particular Trustee was and continues to be qualified to serve as a Trustee, the Board has considered a variety of criteria, none of which, in isolation, was controlling. The Board believes that, collectively, the Trustees have balanced and diverse experience, qualifications, attributes, and skills, which allow the Board to operate effectively in governing the fund and protecting the interests of shareholders. Information about the specific experience, skills, attributes, and qualifications of each Trustee, which in each case led to the Board's conclusion that the Trustee should serve (or continue to serve) as a trustee of the fund, is provided below.
Board Structure and Oversight Function. James C. Curvey is an interested person (as defined in the 1940 Act) and currently serves as Acting Chairman. The Trustees have determined that an interested Chairman is appropriate and benefits shareholders because an interested Chairman has a personal and professional stake in the quality and continuity of services provided to the fund. Independent Trustees exercise their informed business judgment to appoint an individual of their choosing to serve as Chairman, regardless of whether the Trustee happens to be independent or a member of management. The Independent Trustees have determined that they can act independently and effectively without having an Independent Trustee serve as Chairman and that a key structural component for assuring that they are in a position to do so is for the Independent Trustees to constitute a substantial majority for the Board. The Independent Trustees also regularly meet in executive session. Ned C. Lautenbach serves as Chairman of the Independent Trustees and as such (i) acts as a liaison between the Independent Trustees and management with respect to matters important to the Independent Trustees and (ii) with management prepares agendas for Board meetings.
Fidelity funds are overseen by different Boards of Trustees. The fund's Board oversees Fidelity's equity and high income funds and another Board oversees Fidelity's investment-grade bond, money market, and asset allocation funds. The asset allocation funds may invest in Fidelity funds overseen by the fund's Board. The use of separate Boards, each with its own committee structure, allows the Trustees of each group of Fidelity funds to focus on the unique issues of the funds they oversee, including common research, investment, and operational issues. On occasion, the separate Boards establish joint committees to address issues of overlapping consequences for the Fidelity funds overseen by each Board.
The Trustees operate using a system of committees to facilitate the timely and efficient consideration of all matters of importance to the Trustees, the fund, and fund shareholders and to facilitate compliance with legal and regulatory requirements and oversight of the fund's activities and associated risks. The Board, acting through its committees, has charged FMR and its affiliates with (i) identifying events or circumstances the occurrence of which could have demonstrably adverse effects on the fund's business and/or reputation; (ii) implementing processes and controls to lessen the possibility that such events or circumstances occur or to mitigate the effects of such events or circumstances if they do occur; and (iii) creating and maintaining a system designed to evaluate continuously business and market conditions in order to facilitate the identification and implementation processes described in (i) and (ii) above. Because the day-to-day operations and activities of the fund are carried out by or through FMR, its affiliates and other service providers, the fund's exposure to risks is mitigated but not eliminated by the processes overseen by the Trustees. While each of the Board's committees has responsibility for overseeing different aspects of the fund's activities, oversight is exercised primarily through the Operations, Audit, and Compliance Committees. In addition, the Independent Trustees have worked with FMR to enhance the Board's oversight of investment and financial risks, legal and regulatory risks, technology risks, and operational risks, including the development of additional risk reporting to the Board. For example, a working group comprised of Independent Trustees and FMR has worked and continues to work to review the Fidelity funds' valuation-related activities, reporting and risk management. Appropriate personnel, including but not limited to the fund's Chief Compliance Officer (CCO), FMR's internal auditor, the independent accountants, the fund's Treasurer and portfolio management personnel, make periodic reports to the Board's committees, as appropriate, including an annual review of FMR's risk management program for the Fidelity funds. The responsibilities of each standing committee, including their oversight responsibilities, are described further under "Standing Committees of the Fund's Trustees."
Annual Report
The fund's Statement of Additional Information (SAI) includes more information about the Trustees. To request a free copy, call Fidelity at 1-877-208-0098.
Interested Trustees*:
Correspondence intended for each Trustee who is an interested person may be sent to Fidelity Investments, 82 Devonshire Street, Boston, Massachusetts 02109.
Name, Age; Principal Occupations and Other Relevant Experience+ |
James C. Curvey (76) |
| Year of Election or Appointment: 2007 Mr. Curvey is Trustee and Acting Chairman of the Board of Trustees of certain Trusts. Mr. Curvey also serves as Trustee (2007-present) of other investment companies advised by FMR. Mr. Curvey is a Director of Fidelity Investments Money Management, Inc. (2009-present), Director of Fidelity Research & Analysis Co. (2009-present) and Director of FMR and FMR Co., Inc. (2007-present). Mr. Curvey is also Vice Chairman (2007-present) and Director of FMR LLC. In addition, Mr. Curvey serves as an Overseer for the Boston Symphony Orchestra and a member of the Trustees of Villanova University. Previously, Mr. Curvey was the Vice Chairman (2006-2007) and Director (2000-2007) of FMR Corp. |
Ronald P. O'Hanley (54) |
| Year of Election or Appointment: 2011 Mr. O'Hanley is Director of FMR Co., Inc. (2010-present), Director of Fidelity Investments Money Management, Inc. (2010-present), Director of Fidelity Research & Analysis Company (2010-present), President of Fidelity Asset Management and Corporate Services and a member of Fidelity's Executive Committee (2010-present). Previously, Mr. O'Hanley served as President and Chief Executive Officer of BNY Mellon Asset Management (2007-2010). Mr. O'Hanley also served as Vice Chairman of Bank New York Mellon Corp. and a member of that firm's Executive Committee. Prior to the 2007 merger of The Bank of New York and Mellon Financial Corporation, he was Vice Chairman of Mellon Financial Corporation and President and Chief Executive Officer of Mellon Asset Management. He joined Mellon in February 1997. Mr. O'Hanley currently serves as Chairman of the Boston Public Library Foundation Board of Directors and sits on the Board of Directors of Beth Israel Deaconess Medical Center, the Board of Trustees of the Marine Biological Laboratory and the Advisory Board of the Maxwell School of Citizenship and Public Administration at Syracuse University. Mr. O'Hanley also chairs the Council on Asset Management for the Financial Services Roundtable and is a member of the Board of Directors of Institutional Investor's U.S. Institute. |
* Trustees have been determined to be "Interested Trustees" by virtue of, among other things, their affiliation with the trust or various entities under common control with FMR.
+ The information above includes each Trustee's principal occupation during the last five years and other information relating to the experience, attributes, and skills relevant to each Trustee's qualifications to serve as a Trustee, which led to the conclusion that each Trustee should serve as a Trustee for each fund.
Independent Trustees:
Correspondence intended for each Independent Trustee (that is, the Trustees other than the Interested Trustees) may be sent to Fidelity Investments, P.O. Box 55235, Boston, Massachusetts 02205-5235.
Name, Age; Principal Occupations and Other Relevant Experience+ |
Dennis J. Dirks (63) |
| Year of Election or Appointment: 2005 Prior to his retirement in May 2003, Mr. Dirks was Chief Operating Officer and a member of the Board of The Depository Trust & Clearing Corporation (DTCC). He also served as President, Chief Operating Officer, and Board member of The Depository Trust Company (DTC) and President and Board member of the National Securities Clearing Corporation (NSCC). In addition, Mr. Dirks served as Chief Executive Officer and Board member of the Government Securities Clearing Corporation, Chief Executive Officer and Board member of the Mortgage-Backed Securities Clearing Corporation, as a Trustee and a member of the Finance Committee of Manhattan College (2005-2008), and as a Trustee and a member of the Finance Committee of AHRC of Nassau County (2006-2008). Mr. Dirks is a member of the Independent Directors Council (IDC) Governing Council (2010-present) and Board of Directors for The Brookville Center for Children's Services, Inc. (2009-present). |
Alan J. Lacy (58) |
| Year of Election or Appointment: 2008 Mr. Lacy serves as Senior Adviser (2007-present) of Oak Hill Capital Partners, L.P. (private equity). Mr. Lacy also served as Chief Executive Officer (2000-2005) and Vice Chairman (2005-2006) of Sears Holdings Corporation and Sears, Roebuck and Co. (retail). In addition, Mr. Lacy serves as a member of the Board of Directors of Dave & Buster's, Inc. (restaurant and entertainment complexes, 2010-present), The Hillman Companies, Inc. (hardware wholesalers, 2010-present), and Bristol-Myers Squibb Company (global pharmaceuticals, 2007-present). Mr. Lacy is a member of the Board of Trustees of The National Parks Conservation Association (2006-present). Previously, Mr. Lacy served as Chairman of the Board of Trustees of the National Parks Conservation Association (2008-2011) and as a member of the Board of Directors for the Western Union Company (global money transfer, 2006-2011). |
Ned C. Lautenbach (67) |
| Year of Election or Appointment: 2000 Mr. Lautenbach is Chairman of the Independent Trustees of the Equity and High Income Funds (2006-present). Mr. Lautenbach currently serves as the Lead Director of the Eaton Corporation Board of Directors (diversified industrial, 1997-present). Mr. Lautenbach is also a member of the Board of Directors of the Philharmonic Center for the Arts in Naples, Florida (1999-present); a member of the Board of Trustees of Fairfield University (2005-present); and a member of the Council on Foreign Relations (1994-present). Previously, Mr. Lautenbach was a Partner/Advisory Partner at Clayton, Dubilier & Rice, LLC (private equity investment, 1998-2010), as well as a Director of Sony Corporation (2006-2007). |
Joseph Mauriello (67) |
| Year of Election or Appointment: 2008 Prior to his retirement in January 2006, Mr. Mauriello served in numerous senior management positions including Deputy Chairman and Chief Operating Officer (2004-2005), and Vice Chairman of Financial Services (2002-2004) of KPMG LLP US (professional services, 1965-2005). Mr. Mauriello currently serves as a member of the Board of Directors of XL Group plc. (global insurance and re-insurance, 2006-present) and of Arcadia Resources Inc. (health care services and products, 2007-present). Previously, Mr. Mauriello served as a Director of the Hamilton Funds of the Bank of New York (2006-2007). |
Robert W. Selander (61) |
| Year of Election or Appointment: 2011 Previously, Mr. Selander served as a Member of the Advisory Board of Fidelity's Equity and High Income Funds (2011), Executive Vice Chairman (2010), Chief Executive Officer (2009-2010), and President and Chief Executive Officer (1997-2009) of Mastercard, Inc. |
Cornelia M. Small (67) |
| Year of Election or Appointment: 2005 Ms. Small is a member of the Board of Directors of the Teagle Foundation (2009-present). Ms. Small is also a member of the Investment Committee, and Chair (2008-present) and a member of the Board of Trustees of Smith College. In addition, Ms. Small serves on the Investment Committee of the Berkshire Taconic Community Foundation (2008-present). Previously, Ms. Small served as Chairperson of the Investment Committee (2002-2008) of Smith College. In addition, Ms. Small served as Chief Investment Officer, Director of Global Equity Investments, and a member of the Board of Directors of Scudder, Stevens & Clark and Scudder Kemper Investments. |
William S. Stavropoulos (72) |
| Year of Election or Appointment: 2001 Mr. Stavropoulos is Vice Chairman of the Independent Trustees of the Equity and High Income Funds (2006-present). Mr. Stavropoulos serves as President and Founder of the Michigan Baseball Foundation, the Great Lakes Loons (2007-present). Mr. Stavropoulos is Chairman Emeritus of the Board of Directors of The Dow Chemical Company, where he previously served in numerous senior management positions, including President, CEO (1995-2000; 2002-2004), Chairman of the Executive Committee (2000-2006), and as a member of the Board of Directors (1990-2006). Currently, Mr. Stavropoulos is Chairman of Univar (global distributor of commodity and specialty chemicals, 2010-present), a Director of Teradata Corporation (data warehousing and technology solutions, 2008-present), Chemical Financial Corporation, Maersk Inc. (industrial conglomerate), Tyco International, Inc. (multinational manufacturing and services, 2007-present), and a member of the Advisory Board for Metalmark Capital (private equity investment, 2005-present). Mr. Stavropoulos is a special advisor to Clayton, Dubilier & Rice, LLC (private equity investment). In addition, Mr. Stavropoulos is a member of the University of Notre Dame Advisory Council for the College of Science. |
David M. Thomas (62) |
| Year of Election or Appointment: 2008 Previously, Mr. Thomas served as Executive Chairman (2005-2006) and Chairman and Chief Executive Officer (2000-2005) of IMS Health, Inc. (pharmaceutical and healthcare information solutions). In addition, Mr. Thomas serves as a member of the Board of Directors of Fortune Brands, Inc. (consumer products), and Interpublic Group of Companies, Inc. (marketing communication, 2004-present). |
Michael E. Wiley (61) |
| Year of Election or Appointment: 2008 Mr. Wiley also serves as a Director of Asia Pacific Exploration Consolidated (international oil and gas exploration and production, 2008-present). Mr. Wiley serves as a Director of Tesoro Corporation (independent oil refiner and marketer, 2005-present), and a Director of Bill Barrett Corporation (exploration and production, 2005-present). In addition, Mr. Wiley also serves as a Director of Post Oak Bank (privately-held bank, 2004-present). Previously, Mr. Wiley served as a member of the Board of Trustees of the University of Tulsa (2000-2006; 2007-2010), as a Senior Energy Advisor of Katzenbach Partners, LLC (consulting, 2006-2007), as an Advisory Director of Riverstone Holdings (private investment), Chairman, President, and CEO of Baker Hughes, Inc. (oilfield services, 2000-2004), and as Director of Spinnaker Exploration Company (exploration and production, 2001-2005). |
+ The information above includes each Trustee's principal occupation during the last five years and other information relating to the experience, attributes, and skills relevant to each Trustee's qualifications to serve as a Trustee, which led to the conclusion that each Trustee should serve as a Trustee for each fund.
Advisory Board Members and Executive Officers:
Correspondence intended for each executive officer, Edward C. Johnson 3d, and Peter S. Lynch may be sent to Fidelity Investments, 82 Devonshire Street, Boston, Massachusetts 02109.
Name, Age; Principal Occupation |
Edward C. Johnson 3d (81) |
| Year of Election or Appointment: 2011 Member of the Advisory Board of Fidelity's Equity and High Income Funds. Mr. Johnson serves as Chief Executive Officer, Chairman, and a Director of FMR LLC, and also serves as Chairman and Director of FIL Limited. Previously, Mr. Johnson served as a Trustee and Chairman of the Board of certain Fidelity Trusts, Chairman and a Director of FMR, Chairman and a Director of FMR Co., Inc., and President of FMR LLC (2006-2007). |
Peter S. Lynch (67) |
| Year of Election or Appointment: 2003 Member of the Advisory Board of Fidelity's Equity and High Income Funds. Mr. Lynch is Vice Chairman and a Director of FMR and FMR Co., Inc. In addition, Mr. Lynch serves as a Trustee of Boston College and as the Chairman of the Inner-City Scholarship Fund. Previously, Mr. Lynch served on the Special Olympics International Board of Directors (1997-2006). |
Kenneth B. Robins (42) |
| Year of Election or Appointment: 2008 President and Treasurer of Fidelity's Equity and High Income Funds. Mr. Robins also serves as President and Treasurer (2010-present) and Assistant Treasurer (2009-present) of other Fidelity funds and is an employee of Fidelity Investments (2004-present). Previously, Mr. Robins served as Deputy Treasurer of the Fidelity funds (2005-2008) and Treasurer and Chief Financial Officer of The North Carolina Capital Management Trust: Cash and Term Portfolios (2006-2008). |
Brian B. Hogan (47) |
| Year of Election or Appointment: 2009 Vice President of Equity and High Income Funds. Mr. Hogan also serves as President of FMR's Equity Division (2009-present). Previously, Mr. Hogan served as Senior Vice President, Equity Research of FMR (2006-2009) and as a portfolio manager. |
Christopher S. Bartel (40) |
| Year of Election or Appointment: 2009 Vice President of Fidelity's Sector and Real Estate Equity Funds. Mr. Bartel also serves as Senior Vice President of Equity Research (2009-present). Previously, Mr. Bartel served as Managing Director of Research (2006-2009) and an analyst and portfolio manager (2000-2006). |
Scott C. Goebel (43) |
| Year of Election or Appointment: 2008 Secretary and Chief Legal Officer (CLO) of the Fidelity funds. Mr. Goebel also serves as Secretary of Fidelity Investments Money Management, Inc. (FIMM) (2010-present) and Fidelity Research and Analysis Company (FRAC) (2010-present); Secretary and CLO of The North Carolina Capital Management Trust: Cash and Term Portfolios (2008-present); General Counsel, Secretary, and Senior Vice President of FMR (2008-present) and FMR Co., Inc. (2008-present); employed by FMR LLC or an affiliate (2001-present); Chief Legal Officer of Fidelity Management & Research (Hong Kong) Limited (2008-present) and Assistant Secretary of Fidelity Management & Research (Japan) Inc. (2008-present), and Fidelity Management & Research (U.K.) Inc. (2008-present). Previously, Mr. Goebel served as Assistant Secretary of FIMM (2008-2010), FRAC (2008-2010), and the Funds (2007-2008) and as Vice President and Secretary of Fidelity Distributors Corporation (FDC) (2005-2007). |
William C. Coffey (42) |
| Year of Election or Appointment: 2009 Assistant Secretary of Fidelity's Equity and High Income Funds. Mr. Coffey also serves as Senior Vice President and Deputy General Counsel of FMR LLC (2010-present), and is an employee of Fidelity Investments. Previously, Mr. Coffey served as Vice President and Associate General Counsel of FMR LLC (2005-2009). |
Holly C. Laurent (57) |
| Year of Election or Appointment: 2008 Anti-Money Laundering (AML) Officer of the Fidelity funds. Ms. Laurent also serves as AML Officer of The North Carolina Capital Management Trust: Cash and Term Portfolios (2008-present) and is an employee of Fidelity Investments. Previously, Ms. Laurent was Senior Vice President and Head of Legal for Fidelity Business Services India Pvt. Ltd. (2006-2008), and Senior Vice President, Deputy General Counsel and Group Head for FMR LLC (2005-2006). |
Christine Reynolds (53) |
| Year of Election or Appointment: 2008 Chief Financial Officer of the Fidelity funds. Ms. Reynolds became President of Fidelity Pricing and Cash Management Services (FPCMS) in August 2008. Ms. Reynolds served as Chief Operating Officer of FPCMS (2007-2008). Previously, Ms. Reynolds served as President, Treasurer, and Anti-Money Laundering officer of the Fidelity funds (2004-2007). |
Kenneth A. Rathgeber (64) |
| Year of Election or Appointment: 2004 Chief Compliance Officer of Fidelity's Equity and High Income Funds. Mr. Rathgeber is Chief Compliance Officer of Fidelity Management & Research (Hong Kong) Limited (2008-present), Fidelity Management & Research (Japan) Inc. (2008-present), FMR (2005-present), FMR Co., Inc. (2005-present), Fidelity Management & Research (U.K.) Inc. (2005-present), Fidelity Research & Analysis Company (2005-present), Fidelity Investments Money Management, Inc. (2005-present), Pyramis Global Advisors, LLC (2005-present), and Strategic Advisers, Inc. (2005-present). |
Jeffrey S. Christian (50) |
| Year of Election or Appointment: 2009 Deputy Treasurer of the Fidelity funds. Mr. Christian is an employee of Fidelity Investments. Previously, Mr. Christian served as Chief Financial Officer (2008-2009) of certain Fidelity funds and Senior Vice President of Fidelity Pricing and Cash Management Services (FPCMS) (2004-2009). |
Joseph F. Zambello (54) |
| Year of Election or Appointment: 2011 Deputy Treasurer of the Fidelity funds. Mr. Zambello is an employee of Fidelity Investments. Previously, Mr. Zambello served as Vice President of FMR's Program Management Group (2009-2011) and Vice President of the Transfer Agent Oversight Group (2005-2009). |
Adrien E. Deberghes (44) |
| Year of Election or Appointment: 2008 Deputy Treasurer of Fidelity's Equity and High Income Funds. Mr. Deberghes also serves as Vice President and Assistant Treasurer of Fidelity Rutland Square Trust II and Fidelity Commonwealth Trust II (2011-present), Assistant Treasurer of other Fidelity funds (2010-present), and is an employee of Fidelity Investments (2008-present). Previously, Mr. Deberghes served as Senior Vice President of Mutual Fund Administration at State Street Corporation (2007-2008), Senior Director of Mutual Fund Administration at Investors Bank & Trust (2005-2007), and Director of Finance for Dunkin' Brands (2000-2005). |
Stephanie J. Dorsey (42) |
| Year of Election or Appointment: 2010 Assistant Treasurer of Fidelity's Equity and High Income Funds. Ms. Dorsey also serves as Deputy Treasurer of other Fidelity funds (2008-present) and is an employee of Fidelity Investments (2008-present). Previously, Ms. Dorsey served as Treasurer (2004-2008) of the JPMorgan Mutual Funds and Vice President (2004-2008) of JPMorgan Chase Bank. |
John R. Hebble (53) |
| Year of Election or Appointment: 2009 Assistant Treasurer of Fidelity's Equity and High Income Funds. Mr. Hebble also serves as President (2011-present), Treasurer, and Chief Financial Officer of The North Carolina Capital Management Trust: Cash and Term Portfolios (2008-present), President and Treasurer of other Fidelity funds (2008-present) and is an employee of Fidelity Investments. |
Gary W. Ryan (53) |
| Year of Election or Appointment: 2005 Assistant Treasurer of the Fidelity funds. Mr. Ryan is an employee of Fidelity Investments. Previously, Mr. Ryan served as Vice President of Fund Reporting in Fidelity Pricing and Cash Management Services (FPCMS) (1999-2005). |
Jonathan Davis (43) |
| Year of Election or Appointment: 2010 Assistant Treasurer of the Fidelity funds. Mr. Davis is also Assistant Treasurer of Fidelity Rutland Square Trust II and Fidelity Commonwealth Trust II. Mr. Davis is an employee of Fidelity Investments. Previously, Mr. Davis served as Vice President and Associate General Counsel of FMR LLC (2003-2010). |
Annual Report
The Board of Trustees of VIP Technology Portfolio voted to pay to shareholders of record at the opening of business on record date, the following distributions per share derived from capital gains realized from sales of portfolio securities:
| Pay Date | Record Date | Capital Gains |
Initial Class | 02/03/2012 | 02/03/2012 | $1.152 |
Investor Class | 02/03/2012 | 02/03/2012 | $1.152 |
The fund herby designates as a capital gain dividend with respect to the taxable year ended December 2011, $17,453,110, or, if subsequently determined to be different, the net capital gain of such year.
Initial Class designates 14% and Investor Class designates 14% of the dividends distributed in December 2011, during the fiscal year as qualifying for the dividends-received deduction for corporate shareholders.
Annual Report
Board Approval of Investment Advisory Contracts and Management Fees
VIP Technology Portfolio
Each year, the Board of Trustees, including the Independent Trustees (together, the Board), votes on the renewal of the management contract and sub-advisory agreements (together, the Advisory Contracts) for the fund. The Board, assisted by the advice of fund counsel and Independent Trustees' counsel, requests and considers a broad range of information relevant to the renewal of the Advisory Contracts throughout the year.
The Board meets regularly and considers at each of its meetings factors that are relevant to its annual consideration of the renewal of the fund's Advisory Contracts, including the services and support provided to the fund and its shareholders. The Board has established various standing committees, each composed of Independent Trustees with varying backgrounds, to which the Board has assigned specific subject matter responsibilities in order to enhance effective decision-making by the Board. The Board, acting directly and through its Committees, requests and receives information concerning the annual consideration of the renewal of the fund's Advisory Contracts. The Board also meets as needed to consider matters specifically related to the Board's annual consideration of the renewal of Advisory Contracts. Members of the Board may also meet with trustees of other Fidelity funds through ad hoc joint committees to discuss certain matters relevant to the Fidelity funds.
At its July 2011 meeting, the Board of Trustees, including the Independent Trustees, unanimously determined to renew the fund's Advisory Contracts. In reaching its determination, the Board considered all factors it believed relevant, including (i) the nature, extent, and quality of the services to be provided to the fund and its shareholders (including the investment performance of the fund); (ii) the competitiveness of the fund's management fee and total expense ratio; (iii) the total costs of the services to be provided by and the profits to be realized by Fidelity from its relationship with the fund; (iv) the extent to which economies of scale would be realized as the fund grows; and (v) whether fee levels reflect these economies of scale, if any, for the benefit of fund shareholders.
In considering whether to renew the Advisory Contracts for the fund, the Board reached a determination, with the assistance of fund counsel and Independent Trustees' counsel and through the exercise of its business judgment, that the renewal of the Advisory Contracts is in the best interests of the fund and its shareholders and that the compensation payable under the Advisory Contracts is fair and reasonable. The Board's decision to renew the Advisory Contracts was not based on any single factor, but rather was based on a comprehensive consideration of all the information provided to the Board at its meetings throughout the year. The Board, in reaching its determination to renew the Advisory Contracts, is aware that shareholders in the fund have a broad range of investment choices available to them, including a wide choice among mutual funds offered by Fidelity's competitors, and that the fund's shareholders, who have the opportunity to review and weigh the disclosure provided by the fund in its prospectus and other public disclosures, have chosen to invest in this fund, managed by Fidelity.
Nature, Extent, and Quality of Services Provided. The Board considered the staffing within the investment adviser, FMR, and the sub-advisers (together, the Investment Advisers), including the backgrounds of the fund's investment personnel and the fund's investment objective and discipline. The Independent Trustees also had discussions with senior management of Fidelity's investment operations and investment groups. The Board considered the structure of the portfolio manager compensation program and whether this structure provides appropriate incentives to act in the best interests of the fund.
Resources Dedicated to Investment Management and Support Services. The Board and the Fund Oversight and Research Committees reviewed the general qualifications and capabilities of the Investment Advisers' investment staff, including its size, education, experience, and resources, as well as the Investment Advisers' approach to recruiting, training, managing, and compensating investment personnel. The Board also noted that FMR has devoted increased resources to non-U.S. offices. The Board noted that Fidelity's analysts have extensive resources, tools and capabilities which allow them to conduct sophisticated quantitative and fundamental analysis, as well as credit analysis of issuers, counterparties and enhancers. The Board also believes that Fidelity's investment professionals have sufficient access to global information and data so as to provide competitive investment results over time, and that those professionals also have access to sophisticated tools which permit them to assess portfolio construction and risk and performance attribution characteristics continuously, as well as to transmit new information and research conclusions rapidly around the world. Additionally, in their deliberations, the Board considered the Investment Advisers' trading capabilities and resources which are an integral part of the investment management process.
Shareholder and Administrative Services. The Board considered (i) the nature, extent, quality, and cost of advisory, administrative, and shareholder services performed by the Investment Advisers and their affiliates under the Advisory Contracts and under separate agreements covering transfer agency, pricing and bookkeeping, and securities lending services for the fund; (ii) the nature and extent of the investment adviser's supervision of third party service providers, principally custodians and subcustodians; and (iii) the resources devoted to, and the record of compliance with, the fund's compliance policies and procedures. The Board also reviewed the allocation of fund brokerage, including allocations to brokers affiliated with the Investment Advisers, the use of brokerage commissions to pay fund expenses, and the use of "soft" commission dollars to pay for research services.
The Board noted that the growth of fund assets over time across the complex allows Fidelity to reinvest in the development of services designed to enhance the value or convenience of the Fidelity funds as investment vehicles. These services include 24-hour access to account information and market information through telephone representatives and over the Internet, investor education materials and asset allocation tools, and the expanded availability of Fidelity Investor Centers, with 35 new branches opening since 2010.
Annual Report
Board Approval of Investment Advisory Contracts and Management Fees - continued
Investment in a Large Fund Family. The Board considered the benefits to shareholders of investing in a Fidelity fund, including the benefits of investing in a fund that is part of a large family of funds offering a variety of investment disciplines and providing a large variety of mutual fund investor services. The Board noted that Fidelity had taken, or had made recommendations that resulted in the Fidelity funds taking, a number of actions over the previous year that benefited particular funds, including (i) continuing to dedicate additional resources to investment research and support of the senior management team that oversees asset management; (ii) rationalizing product lines through the mergers of six funds into other funds; (iii) continuing to migrate the Freedom Funds to dedicated lower cost underlying funds; (iv) obtaining shareholder approval to broaden the investment strategies for Fidelity Consumer Finance Portfolio, Fidelity Emerging Asia Fund, and Fidelity Environment and Alternative Energy Portfolio; (v) contractually agreeing to reduce the management fees and impose other expense limitations on Spartan 500 Index Fund and U.S. Bond Index Fund in connection with launching new institutional classes of these funds; (vi) changing the name, primary and supplemental benchmarks, and investment policies of Fidelity Global Strategies Fund to support the fund's flexible investment mandate and global orientation; and (vii) reducing the transfer agency account fee rates on certain accounts.
Investment Performance. The Board considered whether the fund has operated in accordance with its investment objective, as well as its record of compliance with its investment restrictions. It also reviewed the fund's absolute investment performance for each class, as well as the fund's relative investment performance for each class measured over multiple periods against a third-party-sponsored index that reflects the market sector in which the fund invests. The Board noted that FMR does not believe that a meaningful peer group exists against which to compare the fund's performance. The following charts considered by the Board show, over the one-, three-, and five-year periods ended December 31, 2010, the cumulative total returns of Initial Class and Investor Class of the fund and the cumulative total returns of a third-party-sponsored index ("benchmark").
VIP Technology Portfolio
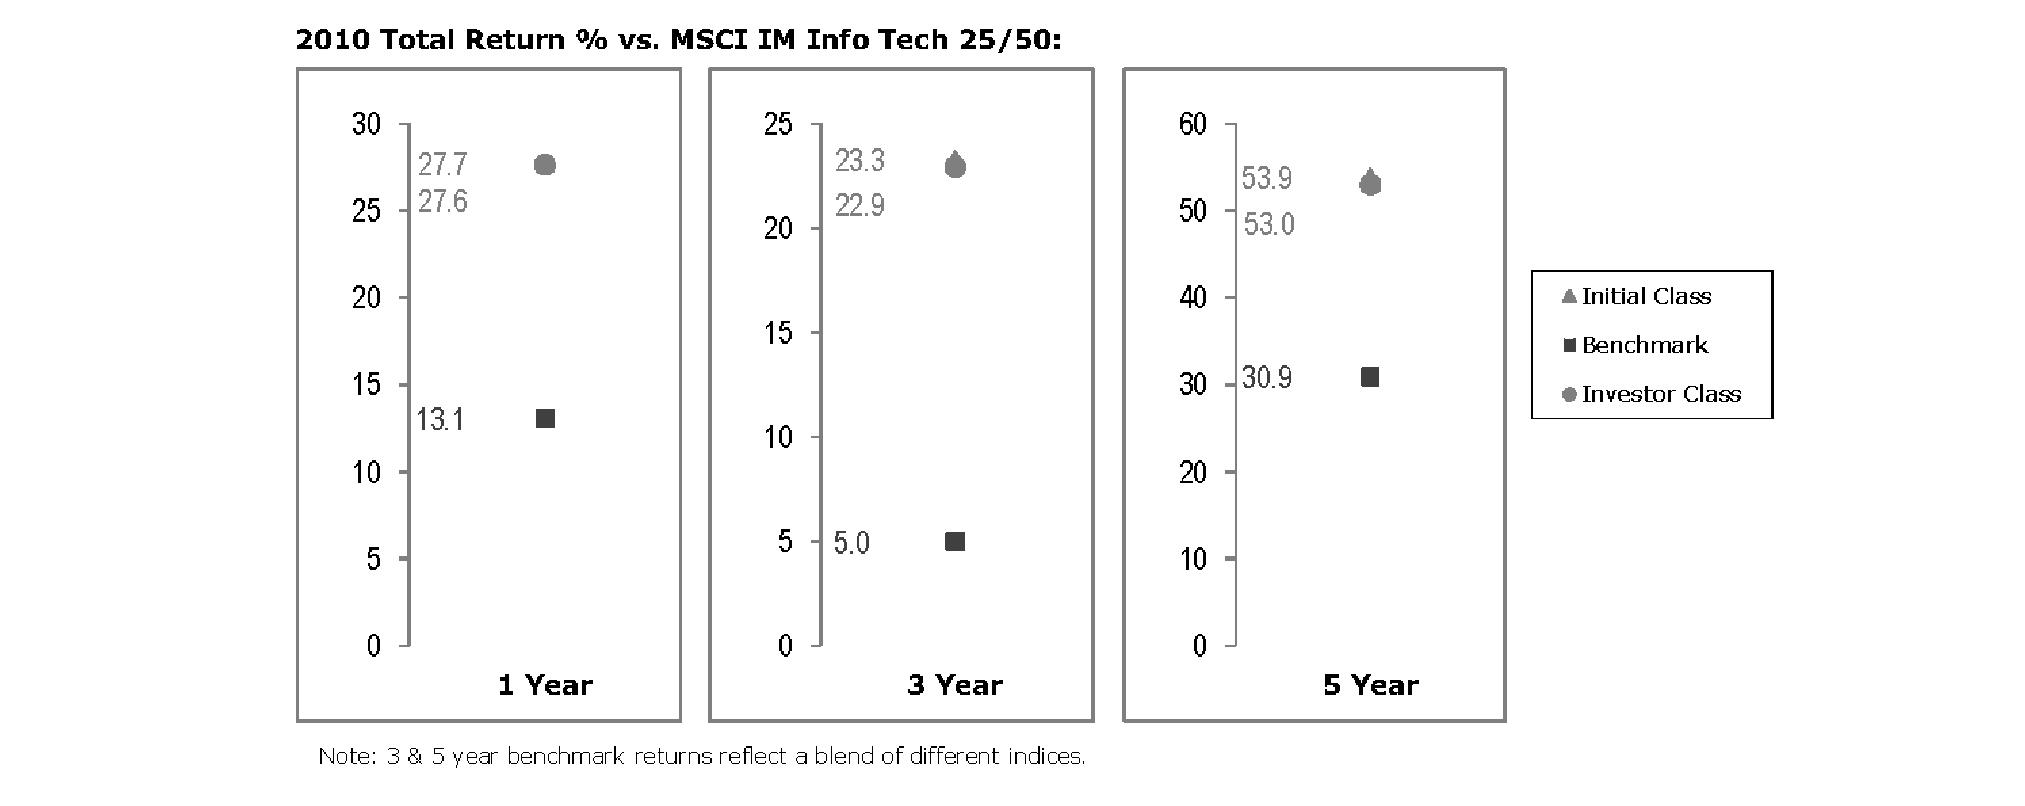
The Board noted that the investment performance of Initial Class of the fund compared favorably to its benchmark for all the periods shown. The Board considered that the variations in performance between the fund's classes reflect the variations in class expenses, which result in lower performance for the higher expense class. The Board also reviewed the fund's performance since inception as well as performance in the current year.
Based on its review, the Board concluded that the nature, extent, and quality of services provided to the fund under the Advisory Contracts should benefit the fund's shareholders.
Competitiveness of Management Fee and Total Expense Ratio. The Board considered the fund's management fee and total expense ratio compared to "mapped groups" of competitive funds and classes. Fidelity creates "mapped groups" by combining similar Lipper investment objective categories that have comparable management fee characteristics. Combining Lipper investment objective categories aids the Board's management fee and total expense ratio comparisons by broadening the competitive group used for comparison and by reducing the number of universes to which various Fidelity funds are compared.
Management Fee. The Board considered two proprietary management fee comparisons for the 12-month periods shown in the chart below. The group of Lipper funds used by the Board for management fee comparisons is referred to below as the "Total Mapped Group." The Total Mapped Group comparison focuses on a fund's standing relative to the total universe of comparable funds available to investors in terms of gross management fees before expense reimbursements or caps. "TMG %" represents the percentage of funds in the Total Mapped Group that had management fees that were lower than the fund's. For example, a TMG % of 2% means that 98% of the funds in the Total Mapped Group had higher management fees than the fund. The "Asset-Size Peer Group" (ASPG) comparison focuses on a fund's standing relative to non-Fidelity funds similar in size to the fund within the Total Mapped Group. The ASPG represents at least 15% of the funds in the Total Mapped Group with comparable asset size and management fee characteristics, subject to a minimum of 50 funds (or all funds in the Total Mapped Group if fewer than 50). Additional information, such as the ASPG quartile in which the fund's management fee ranked, is also included in the chart and considered by the Board.
Annual Report
VIP Technology Portfolio
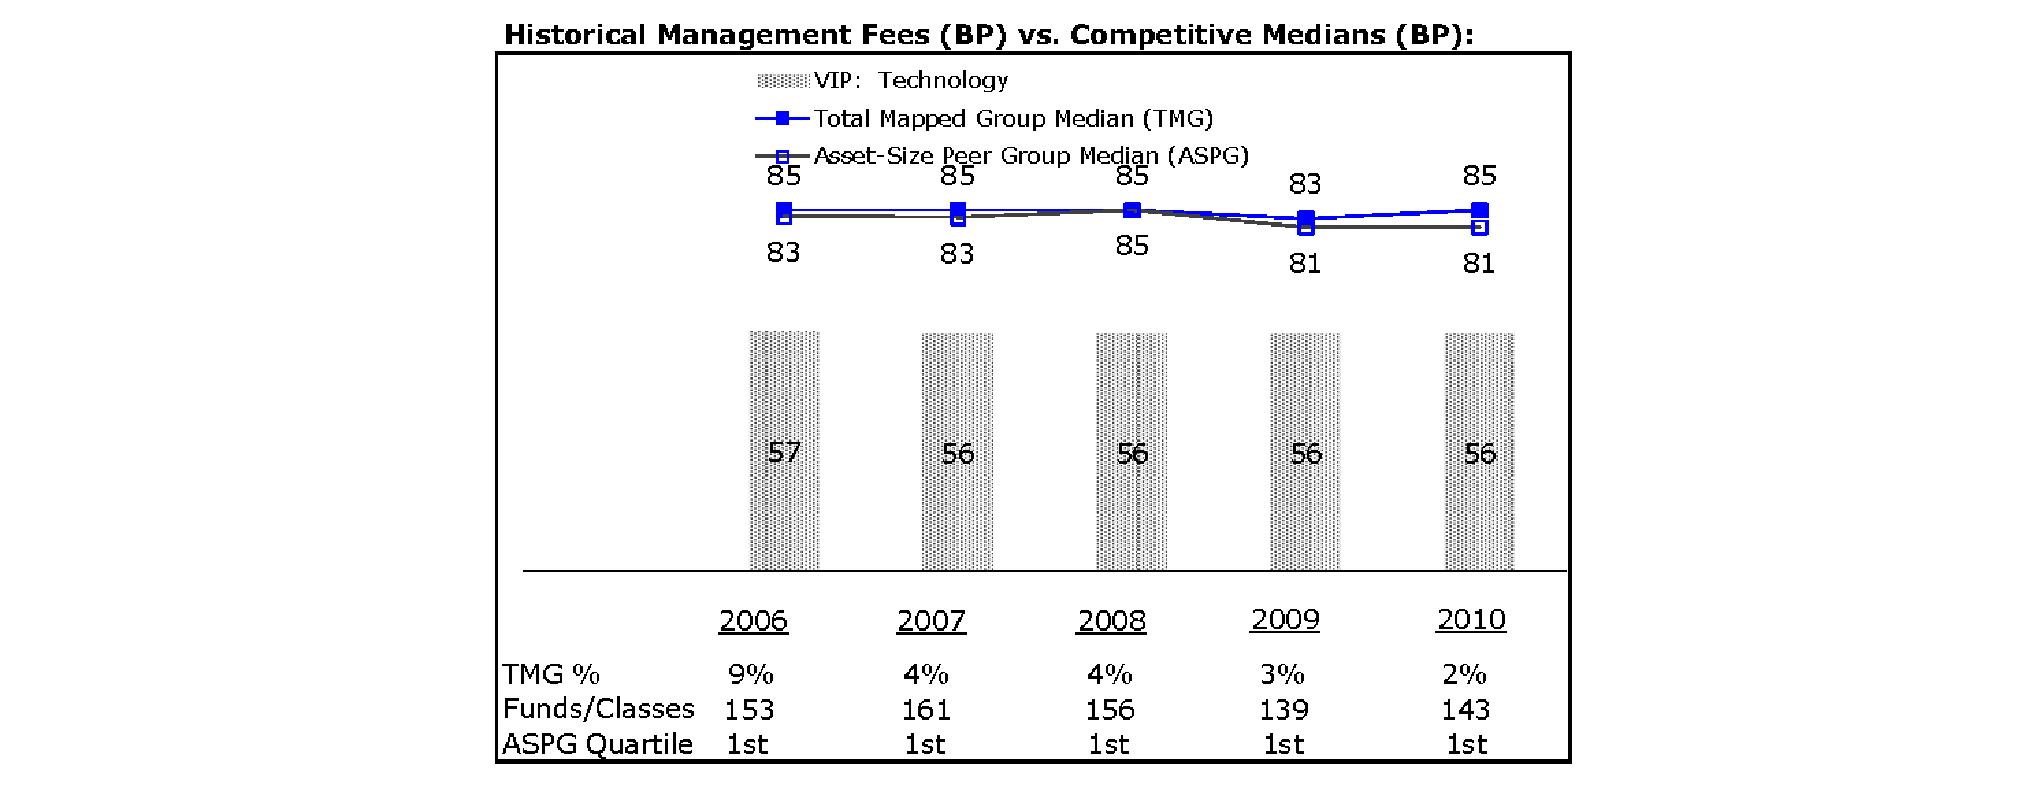
The Board noted that the fund's management fee ranked below the median of its Total Mapped Group and below the median of its ASPG for 2010.
Based on its review, the Board concluded that the fund's management fee is fair and reasonable in light of the services that the fund receives and the other factors considered.
Total Expense Ratio. In its review of each class's total expense ratio, the Board considered the fund's management fee as well as other fund or class expenses, as applicable, such as transfer agent fees, pricing and bookkeeping fees, and custodial, legal, and audit fees. The Board also noted the effects of any waivers and reimbursements on fees and expenses. As part of its review, the Board also considered the current and historical total expense ratios of each class of the fund compared to competitive fund median expenses. Each class of the fund is compared to those funds and classes in the Total Mapped Group (used by the Board for management fee comparisons) that have a similar sales load structure.
The Board noted that the total expense ratio of each class ranked below its competitive median for 2010. The Board considered that various factors, including 12b-1 fees, positive or negative performance adjustments, and relatively higher other expenses in the case of small fund size, can affect total expense ratios. The Board also noted that Investor Class has higher transfer agent fees than traditional variable annuity classes because it is designed for lower cost annuity products, where the majority of servicing costs are incorporated into the funds' total expense ratios rather than being paid at the annuity level.
Fees Charged to Other Fidelity Clients. The Board also considered Fidelity fee structures and other information with respect to clients of FMR and its affiliates, such as other mutual funds advised or subadvised by FMR or its affiliates, pension plan clients, and other institutional clients. In March 2010, the Board created an ad hoc joint committee with the board of other Fidelity funds (the Committee) to review and compare Fidelity's institutional investment advisory business with its business of providing services to the Fidelity funds, including the differences in services provided, fees charged, and costs incurred, as well as competition in their respective marketplaces.
Based on its review of total expense ratios and fees charged to other Fidelity clients, the Board concluded that the total expense ratio of each class of the fund was reasonable in light of the services that the fund and its shareholders receive and the other factors considered, including the findings of the Committee.
Costs of the Services and Profitability. The Board considered the revenues earned and the expenses incurred by Fidelity in conducting the business of developing, marketing, distributing, managing, administering and servicing the fund and its shareholders. The Board also considered the level of Fidelity's profits in respect of all the Fidelity funds.
On an annual basis, FMR presents to the Board Fidelity's profitability for the fund. Fidelity calculates the profitability for each fund, as well as aggregate profitability for groups of Fidelity funds and all Fidelity funds, using a series of detailed revenue and cost allocation methodologies which originate with the books and records of Fidelity on which Fidelity's audited financial statements are based. The Audit Committee of the Board reviews any significant changes from the prior year's methodologies.
Annual Report
Board Approval of Investment Advisory Contracts and Management Fees - continued
PricewaterhouseCoopers LLP (PwC), independent registered public accounting firm and auditor to Fidelity and certain Fidelity funds, has been engaged annually by the Board as part of the Board's assessment of Fidelity's profitability analysis. PwC's engagement includes the review and assessment of Fidelity's methodologies used in determining the revenues and expenses attributable to Fidelity's mutual fund business, and completion of agreed-upon procedures surrounding the mathematical accuracy of fund profitability and its conformity to allocation methodologies. After considering PwC's reports issued under the engagement and information provided by Fidelity, the Board concluded that while other allocation methods may also be reasonable, Fidelity's profitability methodologies are reasonable in all material respects.
The Board also reviewed Fidelity's non-fund businesses and fall-out benefits related to the mutual fund business as well as cases where Fidelity's affiliates may benefit from or be related to the fund's business.
The Board considered the costs of the services provided by and the profits realized by Fidelity in connection with the operation of the fund and was satisfied that the profitability was not excessive in the circumstances.
Economies of Scale. The Board considered whether there have been economies of scale in respect of the management of the Fidelity funds, whether the Fidelity funds (including the fund) have appropriately benefited from any such economies of scale, and whether there is potential for realization of any further economies of scale. The Board considered the extent to which the fund will benefit from economies of scale through increased services to the fund, through waivers or reimbursements, or through fee or expense reductions. The Board also noted that in 2009, it and the board of other Fidelity funds created an ad hoc committee (the Economies of Scale Committee) to analyze whether FMR attains economies of scale in respect of the management and servicing of the Fidelity funds, whether the Fidelity funds have appropriately benefited from such economies of scale, and whether there is potential for realization of any further economies of scale.
The Board recognized that the fund's management contract incorporates a "group fee" structure, which provides for lower group fee rates as total fund assets under FMR's management increase, and for higher group fee rates as total fund assets under FMR's management decrease. FMR calculates the group fee rates based on a tiered asset "breakpoint" schedule that varies based on asset class. The Board considered that the group fee is designed to deliver the benefits of economies of scale to fund shareholders when total Fidelity fund assets increase, even if assets of any particular fund are unchanged or have declined, because some portion of Fidelity's costs are attributable to services provided to all Fidelity funds, and all funds benefit if those costs can be allocated among more assets. The Board concluded that, given the group fee structure, fund shareholders will benefit from lower management fees as assets under FMR's management increase at the fund complex level, regardless of whether Fidelity achieves any such economies of scale.
The Board concluded, taking into account the analysis of the Economies of Scale Committee, that any potential economies of scale are being appropriately shared between fund shareholders and Fidelity.
Additional Information Requested by the Board. In order to develop fully the factual basis for consideration of the Fidelity funds' Advisory Contracts, the Board requested and received additional information on certain topics, including (i) fund performance trends, actions to be taken by FMR to improve certain funds' overall performance, and Fidelity's long-term strategies for certain funds; (ii) portfolio manager changes that have occurred during the past year and length of portfolio manager tenure for different categories of funds over time; (iii) Fidelity's compensation structure for portfolio managers and other key personnel and strategies for attracting and retaining non-investment personnel; (iv) the amount of the investment that each portfolio manager has made in the Fidelity fund(s) that he or she manages; (v) historical trends in Fidelity's realization of fall-out benefits; (vi) Fidelity's group fee structures and the rationale for the individual fee rates of certain funds; (vii) fund profitability methodology and the impact of certain factors on fund profitability results; (viii) trends regarding industry use of performance fee structures and Fidelity's compliance practices with respect to performance adjustment calculations; (ix) the fee structures in place for certain other Fidelity clients; and (x) explanations regarding the relative total expense ratios of certain funds and classes, total expense competitive trends, and actions that might be taken by FMR to reduce total expense ratios for certain funds and classes.
Based on its evaluation of all of the conclusions noted above, and after considering all factors it believed relevant, the Board ultimately concluded that the advisory fee structures are fair and reasonable, and that the fund's Advisory Contracts should be renewed.
Annual Report
Investment Adviser
Fidelity Management & Research Company
Boston, MA
Investment Sub-Advisers
FMR Co., Inc.
Fidelity Management & Research (U.K.) Inc.
Fidelity Management & Research (Hong Kong) Limited
Fidelity Management & Research (Japan) Inc.
General Distributor
Fidelity Distributors Corporation
Boston, MA
Transfer and Service Agents
Fidelity Investments Institutional Operations Company, Inc.
Boston, MA
Fidelity Service Company, Inc.
Boston, MA
Custodian
JPMorgan Chase Bank
New York, NY
VTECIC-ANN-0212
1.817385.106
Fidelity® Variable Insurance Products:
Telecommunications Portfolio
Annual Report
December 31, 2011
Contents
Performance | (Click Here) | How the fund has done over time. |
Management's Discussion of Fund Performance | (Click Here) | The Portfolio Manager's review of fund performance and strategy. |
Shareholder Expense Example | (Click Here) | An example of shareholder expenses. |
Investment Changes | (Click Here) | A summary of major shifts in the fund's investments over the past six months. |
Investments | (Click Here) | A complete list of the fund's investments with their market values. |
Financial Statements | (Click Here) | Statements of assets and liabilities, operations, and changes in net assets, as well as financial highlights. |
Notes | (Click Here) | Notes to the financial statements. |
Report of Independent Registered Public Accounting Firm | (Click Here) | |
Trustees and Officers | (Click Here) | |
Distributions | (Click Here) | |
Board Approval of Investment Advisory Contracts and Management Fees | (Click Here) | |
To view a fund's proxy voting guidelines and proxy voting record for the 12-month period ended June 30, visit http://www.fidelity.com/proxyvotingresults or visit the Securities and Exchange Commission's (SEC) web site at http://www.sec.gov. You may also call 1-877-208-0098 to request a free copy of the proxy voting guidelines.
Fidelity® Variable Insurance Products are separate account options which are purchased through a variable insurance contract.
Standard & Poor's, S&P and S&P 500 are registered service marks of The McGraw-Hill Companies, Inc. and have been licensed for use by Fidelity Distributors Corporation.
Other third party marks appearing herein are the property of their respective owners.
All other marks appearing herein are registered or unregistered trademarks or service marks of FMR LLC or an affiliated company.
This report and the financial statements contained herein are submitted for the general information of the shareholders of the fund. This report is not authorized for distribution to prospective investors in the fund unless preceded or accompanied by an effective prospectus.
A fund files its complete schedule of portfolio holdings with the SEC for the first and third quarters of each fiscal year on Form N-Q. Forms N-Q are available on the SEC's web site at http://www.sec.gov. A fund's Forms N-Q may be reviewed and copied at the SEC's Public Reference Room in Washington, DC. Information regarding the operation of the SEC's Public Reference Room may be obtained by calling 1-800-SEC-0330. For a complete list of a fund's portfolio holdings, view the most recent holdings listing, semiannual report, or annual report on Fidelity's web site at http://www.fidelity.com, http://www.advisor.fidelity.com, or http://www.401k.com, as applicable.
NOT FDIC INSURED • MAY LOSE VALUE • NO BANK GUARANTEE
Neither the fund nor Fidelity Distributors Corporation is a bank.
Annual Report
Average annual total return reflects the change in the value of an investment, assuming reinvestment of the class' distributions from dividend income and capital gains (the profits earned upon the sale of securities that have grown in value, if any) and assuming a constant rate of performance each year. During periods of reimbursement by Fidelity, a fund's total return will be greater than it would be had the reimbursement not occurred. Performance numbers are net of all underlying fund operating expenses, but do not include any insurance charges imposed by your insurance company's separate account. If performance information included the effect of these additional charges, the total returns would have been lower. How a fund did yesterday is no guarantee of how it will do tomorrow.
Average Annual Total Returns
Periods ended December 31, 2011 | Past 1
year | Life of
fundA |
VIP Telecommunications Portfolio - Initial Class | -2.00% | -2.55% |
VIP Telecommunications Portfolio - Investor Class | -2.03% | -2.63% |
A From April 24, 2007.
$10,000 Over Life of Fund
Let's say hypothetically that $10,000 was invested in VIP Telecommunications Portfolio - Initial Class on April 24, 2007, when the fund started. The chart shows how the value of your investment would have changed, and also shows how the S&P 500® Index performed over the same period.
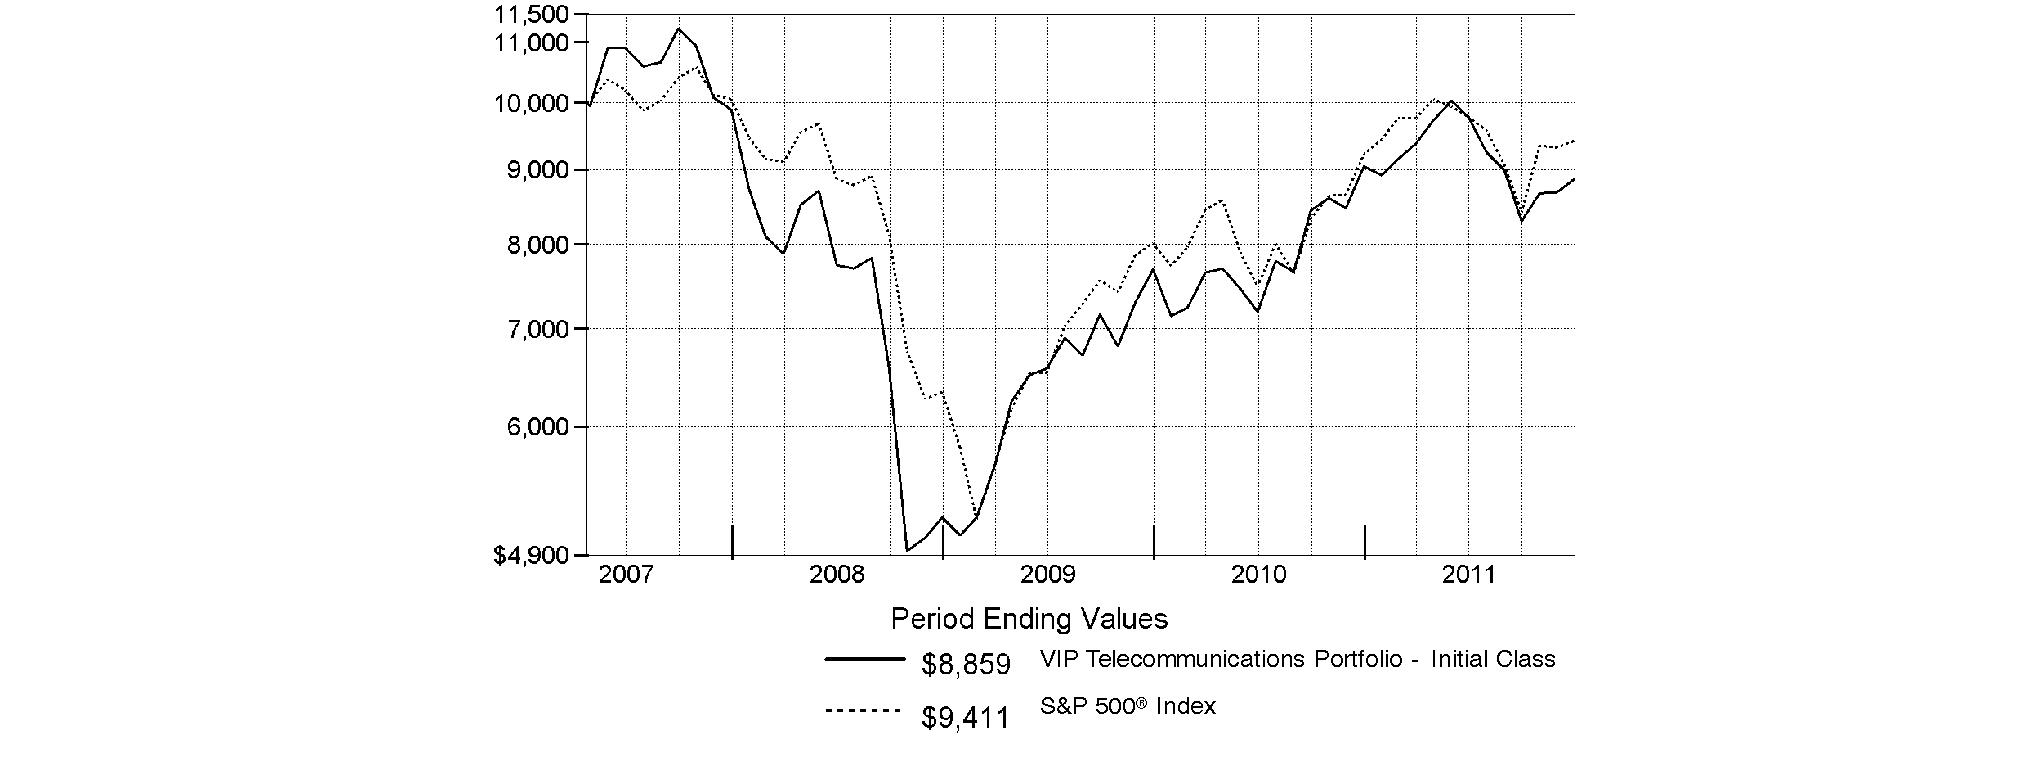
Annual Report
Market Recap: Extreme market volatility took center stage during the 12 months ending December 31, 2011, stealing the spotlight from signs of progress in the global economy. Early in the year, aggressive monetary stimulus by the U.S. federal government, improving credit-market conditions and solid corporate earnings buoyed most major asset classes. As the period progressed, however, fresh worries about sovereign debt in Europe, inflation in China, gridlock over raising the debt ceiling in the U.S. - along with Standard & Poor's early-August downgrade of the nation's long-term sovereign credit rating - and a dimmed outlook for global growth punctured investor confidence and ignited market instability. Domestic equities, as measured by the broad-based S&P 500® Index, gained 2.11%, easily outpacing the 13.61% decline of MSCI® ACWI® (All Country World Index) ex USA Index, a proxy for foreign stocks. Within the MSCI index, emerging markets declined the most (-18%), with investments here generally held back by a stronger U.S. dollar. The U.K. (-3%) fared better than the rest of Europe (-15%), which was the second-worst-performing index component. Bolstered by periodic flights to quality, U.S. investment-grade bonds posted a 7.84% advance, as reflected by the Barclays Capital® U.S. Aggregate Bond Index, outperforming the 4.37% gain of high-yield securities, as represented by The BofA Merrill LynchSM US High Yield Constrained Index. Hampered by financial woes in Europe, the sovereign debt of major developed markets outside the U.S. rose 4.86%, according to the Citigroup® Non-USD Group-of-Seven (G7) Equal Weighted Index, while the JPMorgan Emerging Markets Bond Index Global (EMBI Global) advanced 8.46%, despite the currency head wind.
Comments from Kristina Salen, Portfolio Manager of VIP Telecommunications Portfolio: For the one-year period ending December 31, 2011, the fund's share classes performed about in line with the -2.09% result of the MSCI® U.S. IM Telecommunications Services 25/50 Index, but lagged the broad-market S&P 500®. (For specific portfolio results, please refer to the performance section of this report.) Versus the MSCI index, large underweightings in telecom giants Verizon Communications and AT&T, which together comprised about 46% of the sector benchmark, hurt. Generally speaking, when the market experiences volatility such as we saw in the second half of the period, large integrated telecom stocks tend to outperform, bolstered by their more-defensive characteristics. Verizon was the fund's biggest relative detractor. Untimely ownership of Vonage Holdings, a leading Voice over Internet Protocol (VoIP) provider, was detrimental. The fund was underweighted in the stock earlier in the period as it benefited from investor optimism about its technology, then overweighted later on when its shares began to decline after software giant Microsoft announced plans to acquire Skype Technologies, another major player in the VoIP space. Cable provider NII Holdings faced a number of challenges in the third quarter, along with adverse currency exposure to emerging markets. General concern about the broader Chinese stock market, alleged fraud at Chinese IT services company Longtop Financial Technologies and rising wage costs hurt many stocks in that country, including AsiaInfo-Linkage, an out-of-benchmark holding the fund did not own at period end. The firm provides telecom software solutions and tech products and services. Conversely, a scant stake in - then ultimately selling - Frontier Communications was the biggest relative contributor. The stock of the integrated telecom firm declined steadily during the period, as the company struggled to integrate an acquisition and missed fourth- and second-quarter earnings and revenue estimates. Avoiding Alaska Communications Systems Group, a regional integrated telecom firm, was another good call, as the company missed earnings estimates for much of the year. Additionally, stocks of companies with exposure to the state are often influenced by oil prices, which were volatile during the period. Elsewhere, a large overweighting in American Tower was a plus. The stock converted to a property real estate investment trust (REIT) late in the period in this sizable index component. Favorable positioning in pre-paid wireless provider Leap Wireless International helped given this stock's volatility. The company's services predominately appeal to more-price-sensitive consumers, and its stock is often among the first to be affected by macroeconomic concerns.
The views expressed above reflect those of the portfolio manager(s) only through the end of the period as stated on the cover of this report and do not necessarily represent the views of Fidelity or any other person in the Fidelity organization. Any such views are subject to change at any time based upon market or other conditions and Fidelity disclaims any responsibility to update such views. These views may not be relied on as investment advice and, because investment decisions for a Fidelity fund are based on numerous factors, may not be relied on as an indication of trading intent on behalf of any Fidelity fund.
Annual Report
As a shareholder of the Fund, you incur two types of costs: (1) transaction costs, including redemption fees, and (2) ongoing costs, including management fees and other Fund expenses. This Example is intended to help you understand your ongoing costs (in dollars) of investing in the Fund and to compare these costs with the ongoing costs of investing in other mutual funds.
The Example is based on an investment of $1,000 invested at the beginning of the period and held for the entire period (July 1, 2011 to December 31, 2011).
Actual Expenses
The first line of the accompanying table for each class of the Fund provides information about actual account values and actual expenses. You may use the information in this line, together with the amount you invested, to estimate the expenses that you paid over the period. Simply divide your account value by $1,000.00 (for example, an $8,600 account value divided by $1,000.00 = 8.6), then multiply the result by the number in the first line for a class of the Fund under the heading entitled "Expenses Paid During Period" to estimate the expenses you paid on your account during this period. The estimate of expenses does not include any fees or other expenses of any variable annuity or variable life insurance product. If they were, the estimate of expenses you paid during the period would be higher, and your ending account value would be lower. In addition, the Fund, as a shareholder in the underlying Fidelity Central Funds, will indirectly bear its pro-rata share of the fees and expenses incurred by the underlying Fidelity Central Funds. These fees and expenses are not included in the Fund's annualized expense ratio used to calculate the expense estimate in the table below.
Hypothetical Example for Comparison Purposes
The second line of the accompanying table for each class of the Fund provides information about hypothetical account values and hypothetical expenses based on a Class' actual expense ratio and an assumed rate of return of 5% per year before expenses, which is not the Class' actual return. The hypothetical account values and expenses may not be used to estimate the actual ending account balance or expenses you paid for the period. You may use this information to compare the ongoing costs of investing in the Fund and other funds. To do so, compare this 5% hypothetical example with the 5% hypothetical examples that appear in the shareholder reports of the other funds. The estimate of expenses does not include any fees or other expenses of any variable annuity or variable life insurance product. If they were, the estimate of expenses you paid during the period would be higher, and your ending account value would be lower. In addition, the Fund, as a shareholder in the underlying Fidelity Central Funds, will indirectly bear its pro-rata share of the fees and expenses incurred by the underlying Fidelity Central Funds. These fees and expenses are not included in the Fund's annualized expense ratio used to calculate the expense estimate in the table below.
Please note that the expenses shown in the table are meant to highlight your ongoing costs only and do not reflect any transaction costs. Therefore, the second line of the table is useful in comparing ongoing costs only, and will not help you determine the relative total costs of owning different funds. In addition, if these transactional costs were included, your costs would have been higher.
| Annualized
Expense Ratio | Beginning
Account Value
July 1, 2011 | Ending
Account Value
December 31, 2011 | Expenses Paid
During Period*
July 1, 2011 to
December 31, 2011 |
Initial Class | 1.00% | | | |
Actual | | $ 1,000.00 | $ 906.20 | $ 4.80 |
Hypothetical A | | $ 1,000.00 | $ 1,020.16 | $ 5.09 |
Investor Class | 1.08% | | | |
Actual | | $ 1,000.00 | $ 905.60 | $ 5.19 |
Hypothetical A | | $ 1,000.00 | $ 1,019.76 | $ 5.50 |
A 5% return per year before expenses
* Expenses are equal to each Class' annualized expense ratio, multiplied by the average account value over the period, multiplied by 184/365 (to reflect the one-half year period).
Annual Report
Investment Changes (Unaudited)
Top Ten Stocks as of December 31, 2011 |
| % of fund's
net assets | % of fund's net assets
6 months ago |
AT&T, Inc. | 17.5 | 19.1 |
Verizon Communications, Inc. | 15.6 | 16.1 |
CenturyLink, Inc. | 9.3 | 6.7 |
Crown Castle International Corp. | 5.6 | 3.7 |
SBA Communications Corp.
Class A | 4.9 | 2.5 |
American Tower Corp. Class A | 4.9 | 5.0 |
Cogent Communications Group, Inc. | 4.3 | 2.9 |
tw telecom, inc. | 4.1 | 2.9 |
AboveNet, Inc. | 3.3 | 1.7 |
NII Holdings, Inc. | 2.7 | 2.7 |
| 72.2 | |
Top Industries (% of fund's net assets) |
As of December 31, 2011 |
| Diversified Telecommunication Services | 65.7% | |
| Wireless Telecommunication Services | 26.6% | |
| Media | 2.0% | |
| Construction & Engineering | 0.8% | |
| Software | 0.8% | |
| All Others* | 4.1% | |

As of June 30, 2011 |
| Diversified Telecommunication Services | 62.8% | |
| Wireless Telecommunication Services | 25.5% | |
| Media | 3.9% | |
| Communications Equipment | 2.3% | |
| Internet Software & Services | 1.3% | |
| All Others* | 4.2% | |

* Includes short-term investments and net other assets. |
Annual Report
Investments December 31, 2011
Showing Percentage of Net Assets
Common Stocks - 96.2% |
| Shares | | Value |
COMMUNICATIONS EQUIPMENT - 0.0% |
Communications Equipment - 0.0% |
Nortel Networks Corp. (a) | 100 | | $ 0 |
CONSTRUCTION & ENGINEERING - 0.8% |
Construction & Engineering - 0.8% |
PT Tower Bersama Infrastructure Tbk | 304,000 | | 79,625 |
DIVERSIFIED FINANCIAL SERVICES - 0.3% |
Other Diversified Financial Services - 0.3% |
SREI Infrastructure Finance Ltd. | 64,694 | | 29,836 |
DIVERSIFIED TELECOMMUNICATION SERVICES - 65.7% |
Alternative Carriers - 14.5% |
AboveNet, Inc. | 4,800 | | 312,048 |
Cogent Communications Group, Inc. (a) | 24,106 | | 407,150 |
Level 3 Communications, Inc. (a) | 6,306 | | 107,139 |
tw telecom, inc. (a) | 19,833 | | 384,364 |
Vonage Holdings Corp. (a) | 60,500 | | 148,225 |
| | 1,358,926 |
Integrated Telecommunication Services - 51.2% |
AT&T, Inc. | 54,183 | | 1,638,494 |
Cbeyond, Inc. (a) | 9,450 | | 75,695 |
CenturyLink, Inc. | 23,488 | | 873,754 |
China Telecom Corp. Ltd. sponsored ADR | 1,000 | | 57,130 |
China Unicom (Hong Kong) Ltd. sponsored ADR | 3,300 | | 69,729 |
General Communications, Inc.
Class A (a) | 23,800 | | 233,002 |
Koninklijke KPN NV | 3,958 | | 47,364 |
Telefonica Brasil SA sponsored ADR | 4,550 | | 124,352 |
Telenor ASA sponsored ADR | 1,910 | | 93,151 |
Verizon Communications, Inc. | 36,428 | | 1,461,491 |
Windstream Corp. | 10,672 | | 125,289 |
| | 4,799,451 |
TOTAL DIVERSIFIED TELECOMMUNICATION SERVICES | | 6,158,377 |
|
| Shares | | Value |
MEDIA - 2.0% |
Cable & Satellite - 2.0% |
Comcast Corp. Class A | 2,000 | | $ 47,420 |
Time Warner Cable, Inc. | 800 | | 50,856 |
Virgin Media, Inc. | 4,300 | | 91,934 |
| | 190,210 |
SOFTWARE - 0.8% |
Application Software - 0.8% |
Synchronoss Technologies, Inc. (a) | 2,401 | | 72,534 |
WIRELESS TELECOMMUNICATION SERVICES - 26.6% |
Wireless Telecommunication Services - 26.6% |
American Tower Corp. Class A | 7,600 | | 456,076 |
Clearwire Corp. Class A (a) | 54,221 | | 105,189 |
Crown Castle International Corp. (a) | 11,817 | | 529,402 |
Leap Wireless International, Inc. (a) | 16,000 | | 148,640 |
MetroPCS Communications, Inc. (a) | 23,978 | | 208,129 |
NII Holdings, Inc. (a) | 11,781 | | 250,935 |
SBA Communications Corp. Class A (a) | 10,718 | | 460,445 |
Sprint Nextel Corp. (a) | 106,668 | | 249,603 |
Turkcell Iletisim Hizmet A/S | 6,000 | | 28,408 |
VimpelCom Ltd. sponsored ADR | 5,700 | | 53,979 |
| | 2,490,806 |
TOTAL INVESTMENT PORTFOLIO - 96.2% (Cost $9,155,735) | | 9,021,388 |
NET OTHER ASSETS (LIABILITIES) - 3.8% | | 358,050 |
NET ASSETS - 100% | $ 9,379,438 |
Legend |
(a) Non-income producing |
Affiliated Central Funds |
Information regarding fiscal year to date income earned by the Fund from investments in Fidelity Central Funds is as follows: |
Fund | Income earned |
Fidelity Cash Central Fund | $ 366 |
Other Information |
The following is a summary of the inputs used, as of December 31, 2011, involving the Fund's assets and liabilities carried at fair value. The inputs or methodology used for valuing securities may not be an indication of the risk associated with investing in those securities. For more information on valuation inputs, and their aggregation into the levels used in the table below, please refer to the Security Valuation section in the accompanying Notes to Financial Statements. |
Valuation Inputs at Reporting Date: |
Description | Total | Level 1 | Level 2 | Level 3 |
Investments in Securities: | | | | |
Common Stocks | $ 9,021,388 | $ 8,992,980 | $ 28,408 | $ - |
See accompanying notes which are an integral part of the financial statements.
Annual Report
Statement of Assets and Liabilities
| December 31, 2011 |
Assets | | |
Investment in securities, at value - See accompanying schedule: Unaffiliated issuers (cost $9,155,735) | | $ 9,021,388 |
Receivable for investments sold | | 442,572 |
Receivable for fund shares sold | | 14,654 |
Dividends receivable | | 4,218 |
Distributions receivable from Fidelity Central Funds | | 24 |
Prepaid expenses | | 57 |
Receivable from investment adviser for expense reductions | | 1,613 |
Other receivables | | 1,671 |
Total assets | | 9,486,197 |
| | |
Liabilities | | |
Payable to custodian bank | $ 48,879 | |
Payable for fund shares redeemed | 18,163 | |
Accrued management fee | 4,470 | |
Other affiliated payables | 1,297 | |
Other payables and accrued expenses | 33,950 | |
Total liabilities | | 106,759 |
| | |
Net Assets | | $ 9,379,438 |
Net Assets consist of: | | |
Paid in capital | | $ 11,506,342 |
Distributions in excess of net investment income | | (544) |
Accumulated undistributed net realized gain (loss) on investments and foreign currency transactions | | (1,991,732) |
Net unrealized appreciation (depreciation) on investments and assets and liabilities in foreign currencies | | (134,628) |
Net Assets | | $ 9,379,438 |
Statement of Assets and Liabilities - continued
| December 31, 2011 |
Initial Class:
Net Asset Value, offering price and redemption price per share ($3,062,417 ÷ 392,143 shares) | | $ 7.81 |
| | |
Investor Class:
Net Asset Value, offering price and redemption price per share ($6,317,021 ÷ 812,374 shares) | | $ 7.78 |
See accompanying notes which are an integral part of the financial statements.
Annual Report
Financial Statements - continued
Statement of Operations
| Year ended December 31, 2011 |
Investment Income | | |
Dividends | | $ 290,207 |
Interest | | 1 |
Income from Fidelity Central Funds | | 366 |
Total income | | 290,574 |
| | |
Expenses | | |
Management fee | $ 63,211 | |
Transfer agent fees | 19,275 | |
Accounting fees and expenses | 4,411 | |
Custodian fees and expenses | 11,137 | |
Independent trustees' compensation | 65 | |
Audit | 40,139 | |
Legal | 39 | |
Miscellaneous | 92 | |
Total expenses before reductions | 138,369 | |
Expense reductions | (21,639) | 116,730 |
Net investment income (loss) | | 173,844 |
Realized and Unrealized Gain (Loss) Net realized gain (loss) on: | | |
Investment securities: | | |
Unaffiliated issuers | 205,748 | |
Foreign currency transactions | (2,711) | |
Total net realized gain (loss) | | 203,037 |
Change in net unrealized appreciation (depreciation) on: Investment securities | (1,291,821) | |
Assets and liabilities in foreign currencies | (158) | |
Total change in net unrealized appreciation (depreciation) | | (1,291,979) |
Net gain (loss) | | (1,088,942) |
Net increase (decrease) in net assets resulting from operations | | $ (915,098) |
Statement of Changes in Net Assets
| Year ended
December 31, 2011 | Year ended
December 31, 2010 |
Increase (Decrease) in Net Assets | | |
Operations | | |
Net investment income (loss) | $ 173,844 | $ 113,039 |
Net realized gain (loss) | 203,037 | 380,162 |
Change in net unrealized appreciation (depreciation) | (1,291,979) | 797,145 |
Net increase (decrease) in net assets resulting from operations | (915,098) | 1,290,346 |
Distributions to shareholders from net investment income | (152,583) | (157,959) |
Share transactions - net increase (decrease) | 946,061 | 1,086,899 |
Redemption fees | 17,467 | 9,541 |
Total increase (decrease) in net assets | (104,153) | 2,228,827 |
| | |
Net Assets | | |
Beginning of period | 9,483,591 | 7,254,764 |
End of period (including distributions in excess of net investment income of $544 and distributions in excess of net investment income of $25,023, respectively) | $ 9,379,438 | $ 9,483,591 |
See accompanying notes which are an integral part of the financial statements.
Annual Report
Financial Highlights - Initial Class
Years ended December 31, | 2011 | 2010 | 2009 | 2008 | 2007 H |
Selected Per-Share Data | | | | | |
Net asset value, beginning of period | $ 8.10 | $ 7.01 | $ 4.81 | $ 9.36 | $ 10.00 |
Income from Investment Operations | | | | | |
Net investment income (loss) E | .13 | .11 | .09 | .09 | .05 |
Net realized and unrealized gain (loss) | (.31) | 1.10 | 2.21 | (4.53) | (.17) |
Total from investment operations | (.18) | 1.21 | 2.30 | (4.44) | (.12) |
Distributions from net investment income | (.12) | (.13) | (.11) | (.11) | (.05) |
Distributions from net realized gain | - | - | - | - | (.48) |
Total distributions | (.12) | (.13) | (.11) | (.11) | (.53) |
Redemption fees added to paid in capital E | .01 | .01 | .01 | - J | .01 |
Net asset value, end of period | $ 7.81 | $ 8.10 | $ 7.01 | $ 4.81 | $ 9.36 |
Total Return B,C,D | (2.00)% | 17.54% | 48.00% | (47.41)% | (1.18)% |
Ratios to Average Net Assets F,I | | | | | |
Expenses before reductions | 1.18% | 1.55% | 1.70% | 2.07% | 1.37% A |
Expenses net of fee waivers, if any | 1.00% | 1.00% | 1.00% | 1.00% | 1.00% A |
Expenses net of all reductions | .98% | .98% | .98% | .99% | 1.00% A |
Net investment income (loss) | 1.58% | 1.57% | 1.55% | 1.32% | .63% A |
Supplemental Data | | | | | |
Net assets, end of period (000 omitted) | $ 3,062 | $ 3,823 | $ 3,626 | $ 1,549 | $ 3,956 |
Portfolio turnover rate G | 115% | 93% | 167% | 203% | 160% A |
A Annualized B Total returns for periods of less than one year are not annualized. C Total returns do not reflect charges attributable to your insurance company's separate account. Inclusion of these charges would reduce the total returns shown. D Total returns would have been lower if certain expenses had not been reduced during the applicable periods shown. E Calculated based on average shares outstanding during the period. F Fees and expenses of any underlying Fidelity Central Funds are not included in the Fund's expense ratio. The Fund indirectly bears its proportionate share of the expenses of any underlying Fidelity Central Funds. G Amount does not include the portfolio activity of any underlying Fidelity Central Funds. H For the period April 24, 2007 (commencement of operations) to December 31, 2007. I Expense ratios reflect operating expenses of the class. Expenses before reductions do not reflect amounts reimbursed by the investment adviser or reductions from brokerage service arrangements or reductions from other expense offset arrangements and do not represent the amount paid by the class during periods when reimbursements or reductions occur. Expense ratios before reductions for start-up periods may not be representative of longer-term operating periods. Expenses net of fee waivers reflect expenses after reimbursement by the investment adviser but prior to reductions from brokerage service arrangements or other expense offset arrangements. Expenses net of all reductions represent the net expenses paid by the class. J Amount represents less than $.01 per share. |
Financial Highlights - Investor Class
Years ended December 31, | 2011 | 2010 | 2009 | 2008 | 2007 H |
Selected Per-Share Data | | | | | |
Net asset value, beginning of period | $ 8.07 | $ 6.99 | $ 4.80 | $ 9.35 | $ 10.00 |
Income from Investment Operations | | | | | |
Net investment income (loss) E | .12 | .11 | .09 | .09 | .04 |
Net realized and unrealized gain (loss) | (.30) | 1.09 | 2.20 | (4.53) | (.17) |
Total from investment operations | (.18) | 1.20 | 2.29 | (4.44) | (.13) |
Distributions from net investment income | (.12) | (.13) | (.11) | (.11) | (.05) |
Distributions from net realized gain | - | - | - | - | (.48) |
Total distributions | (.12) | (.13) | (.11) | (.11) | (.53) |
Redemption fees added to paid in capital E | .01 | .01 | .01 | - J | .01 |
Net asset value, end of period | $ 7.78 | $ 8.07 | $ 6.99 | $ 4.80 | $ 9.35 |
Total Return B,C,D | (2.03)% | 17.45% | 47.90% | (47.46)% | (1.28)% |
Ratios to Average Net Assets F,I | | | | | |
Expenses before reductions | 1.24% | 1.61% | 1.78% | 2.15% | 1.50% A |
Expenses net of fee waivers, if any | 1.08% | 1.08% | 1.08% | 1.09% | 1.15% A |
Expenses net of all reductions | 1.06% | 1.07% | 1.07% | 1.08% | 1.15% A |
Net investment income (loss) | 1.50% | 1.49% | 1.47% | 1.23% | .48% A |
Supplemental Data | | | | | |
Net assets, end of period (000 omitted) | $ 6,317 | $ 5,661 | $ 3,629 | $ 1,632 | $ 4,298 |
Portfolio turnover rate G | 115% | 93% | 167% | 203% | 160% A |
A Annualized B Total returns for periods of less than one year are not annualized. C Total returns do not reflect charges attributable to your insurance company's separate account. Inclusion of these charges would reduce the total returns shown. D Total returns would have been lower if certain expenses had not been reduced during the applicable periods shown. E Calculated based on average shares outstanding during the period. F Fees and expenses of any underlying Fidelity Central Funds are not included in the Fund's expense ratio. The Fund indirectly bears its proportionate share of the expenses of any underlying Fidelity Central Funds. G Amount does not include the portfolio activity of any underlying Fidelity Central Funds. H For the period April 24, 2007 (commencement of operations) to December 31, 2007. I Expense ratios reflect operating expenses of the class. Expenses before reductions do not reflect amounts reimbursed by the investment adviser or reductions from brokerage service arrangements or reductions from other expense offset arrangements and do not represent the amount paid by the class during periods when reimbursements or reductions occur. Expense ratios before reductions for start-up periods may not be representative of longer-term operating periods. Expenses net of fee waivers reflect expenses after reimbursement by the investment adviser but prior to reductions from brokerage service arrangements or other expense offset arrangements. Expenses net of all reductions represent the net expenses paid by the class. J Amount represents less than $.01 per share. |
See accompanying notes which are an integral part of the financial statements.
Annual Report
Notes to Financial Statements
For the period ended December 31, 2011
1. Organization.
VIP Telecommunications Portfolio (the Fund) is a non-diversified fund of Variable Insurance Products Fund IV (the Trust) and is authorized to issue an unlimited number of shares. The Trust is registered under the Investment Company Act of 1940, as amended (the 1940 Act), as an open-end management investment company organized as a Massachusetts business trust. Shares of the Fund may only be purchased by insurance companies for the purpose of funding variable annuity or variable life insurance contracts. The Fund offers the following classes of shares: Initial Class shares and Investor Class shares. All classes have equal rights and voting privileges, except for matters affecting a single class. Investment income, realized and unrealized capital gains and losses, the common expenses of the Fund, and certain fund-level expense reductions, if any, are allocated on a pro-rata basis to each class based on the relative net assets of each class to the total net assets of the Fund. Each class differs with respect to transfer agent fees incurred. Certain expense reductions may also differ by class.
2. Investments in Fidelity Central Funds.
The Fund may invest in Fidelity Central Funds, which are open-end investment companies available only to other investment companies and accounts managed by Fidelity Management & Research Company (FMR) and its affiliates. The Fund's Schedule of Investments lists each of the Fidelity Central Funds held as of period end, if any, as an investment of the Fund, but do not include the underlying holdings of each Fidelity Central Fund. As an Investing Fund, the Fund indirectly bears its proportionate share of the expenses of the underlying Fidelity Central Funds.
The Money Market Central Funds seek preservation of capital and current income and are managed by Fidelity Investments Money Management, Inc. (FIMM), an affiliate of FMR.
A complete unaudited list of holdings for each Fidelity Central Fund is available upon request or at the Securities and Exchange Commission (the SEC) web site at www.sec.gov. In addition, the financial statements of the Fidelity Central Funds, which are not covered by the Fund's Report of Independent Registered Public Accounting Firm, are available on the SEC web site or upon request.
3. Significant Accounting Policies.
The financial statements have been prepared in conformity with accounting principles generally accepted in the United States of America (GAAP), which require management to make certain estimates and assumptions at the date of the financial statements. Actual results could differ from those estimates. Subsequent events, if any, through the date that the financial statements were issued have been evaluated in the preparation of the financial statements. The following summarizes the significant accounting policies of the Fund:
Security Valuation. Investments are valued as of 4:00 p.m. Eastern time on the last calendar day of the period. The Fund uses independent pricing services approved by the Board of Trustees to value its investments. When current market prices or quotations are not readily available or reliable, valuations may be determined in good faith in accordance with procedures adopted by the Board of Trustees. Factors used in determining value may include market or security specific events. The frequency with which these procedures are used cannot be predicted and they may be utilized to a significant extent. The value used for net asset value (NAV) calculation under these procedures may differ from published prices for the same securities.
The Fund categorizes the inputs to valuation techniques used to value its investments into a disclosure hierarchy consisting of three levels as shown below:
Level 1 - quoted prices in active markets for identical investments
Level 2 - other significant observable inputs (including quoted prices for similar investments, interest rates, prepayment speeds, etc.)
Level 3 - unobservable inputs (including the Fund's own assumptions based on the best information available)
Changes in valuation techniques may result in transfers in or out of an assigned level within the disclosure hierarchy. The aggregate value of investments by input level, as of December 31, 2011, is included at the end of the Fund's Schedule of Investments. Valuation techniques used to value the Fund's investments by major category are as follows:
Equity securities, including restricted securities, for which market quotations are readily available, are valued at the last reported sale price or official closing price as reported by an independent pricing service on the primary market or exchange on which they are traded and are categorized as Level 1 in the hierarchy. In the event there were no sales during the day or closing prices are not available, securities are valued at the last quoted bid price or may be valued using the last available price and are generally categorized as Level 2 in the hierarchy. For foreign equity securities, when significant market or security specific events arise, comparisons to the valuation of American Depositary Receipts (ADRs), futures contracts, Exchange-traded funds (ETFs) and certain indexes as well as quoted prices for similar securities are used and are categorized as Level 2 in the hierarchy in these circumstances. Utilizing these techniques may result in transfers between Level 1 and Level 2. For restricted equity securities and private placements where observable inputs are limited, assumptions about market activity and risk are used and are categorized as Level 3 in the hierarchy.
Annual Report
3. Significant Accounting Policies - continued
New Accounting Pronouncements. In May 2011, the Financial Accounting Standards Board issued Accounting Standard Update No. 2011-04, Fair Value Measurement (Topic 820) - Amendments to Achieve Common Fair Value Measurement and Disclosure Requirements in U.S. GAAP and IFRSs. The update is effective during interim and annual periods beginning after December 15, 2011 and will result in additional disclosure for transfers between levels as well as expanded disclosure for securities categorized as Level 3 under the fair value hierarchy.
In December 2011, the Financial Accounting Standards Board issued Accounting Standard Update No. 2011-11, Disclosures about Offsetting Assets and Liabilities. The update creates new disclosure requirements requiring entities to disclose both gross and net information for derivatives and other financial instruments that are either offset in the Statement of Assets and Liabilities or subject to an enforceable master netting arrangement or similar agreement. The disclosure requirements are effective for annual reporting periods beginning on or after January 1, 2013. Management is currently evaluating the impact of the update's adoption on the Fund's financial statement disclosures.
Foreign Currency. The Fund may use foreign currency contracts to facilitate transactions in foreign-denominated securities. Gains and losses from these transactions may arise from changes in the value of the foreign currency or if the counterparties do not perform under the contracts' terms.
Foreign-denominated assets, including investment securities, and liabilities are translated into U.S. dollars at the exchange rate at period end. Purchases and sales of investment securities, income and dividends received and expenses denominated in foreign currencies are translated into U.S. dollars at the exchange rate in effect on the transaction date.
The effects of exchange rate fluctuations on investments are included with the net realized and unrealized gain (loss) on investment securities. Other foreign currency transactions resulting in realized and unrealized gain (loss) are disclosed separately.
Investment Transactions and Income. For financial reporting purposes, the Fund's investment holdings and NAV include trades executed through the end of the last business day of the period. The NAV per share for processing shareholder transactions is calculated as of the close of business of the New York Stock Exchange (NYSE), normally 4:00 p.m. Eastern time and includes trades executed through the end of the prior business day. Gains and losses on securities sold are determined on the basis of identified cost and may include proceeds received from litigation. Dividend income is recorded on the ex-dividend date, except for certain dividends from foreign securities where the ex-dividend date may have passed, which are recorded as soon as the Fund is informed of the ex-dividend date. Non-cash dividends included in dividend income, if any, are recorded at the fair market value of the securities received. Distributions received on securities that represent a return of capital or capital gain are recorded as a reduction of cost of investments and/or as a realized gain. The Fund estimates the components of distributions received that may be considered return of capital distributions or capital gain distributions. Interest income and distributions from the Fidelity Central Funds are accrued as earned. Interest income includes coupon interest and amortization of premium and accretion of discount on debt securities. Investment income is recorded net of foreign taxes withheld where recovery of such taxes is uncertain.
Expenses. Expenses directly attributable to a fund are charged to that fund. Expenses attributable to more than one fund are allocated among the respective funds on the basis of relative net assets or other appropriate methods. Expense estimates are accrued in the period to which they relate and adjustments are made when actual amounts are known.
Income Tax Information and Distributions to Shareholders. Each year, the Fund intends to qualify as a regulated investment company, including distributing substantially all of its taxable income and realized gains under Subchapter M of the Internal Revenue Code. As a result, no provision for income taxes is required. As of December 31, 2011, the Fund did not have any unrecognized tax benefits in the financial statements; nor is the Fund aware of any tax positions for which it is reasonably possible that the total amounts of unrecognized tax benefits will significantly change in the next twelve months. The Fund files a U.S. federal tax return, in addition to state and local tax returns as required. A fund's tax returns are subject to examination by the Internal Revenue Service (IRS) for a period of three fiscal years. State and local tax returns may be subject to examination for an additional fiscal year depending on the jurisdiction. Foreign taxes are provided for based on the Fund's understanding of the tax rules and rates that exist in the foreign markets in which it invests.
Distributions are declared and recorded on the ex-dividend date. Income dividends and capital gain distributions are declared separately for each class. Income and capital gain distributions are determined in accordance with income tax regulations, which may differ from GAAP.
Capital accounts within the financial statements are adjusted for permanent book-tax differences. These adjustments have no impact on net assets or the results of operations. Temporary book-tax differences will reverse in a subsequent period.
Book-tax differences are primarily due to foreign currency transactions, capital loss carryforwards and losses deferred due to wash sales and excise tax regulations.
Annual Report
Notes to Financial Statements - continued
3. Significant Accounting Policies - continued
Income Tax Information and Distributions to Shareholders - continued
The federal tax cost of investment securities and unrealized appreciation (depreciation) as of period end were as follows:
Gross unrealized appreciation | $ 1,100,536 |
Gross unrealized depreciation | (1,483,399) |
Net unrealized appreciation (depreciation) on securities and other investments | $ (382,863) |
| |
Tax Cost | $ 9,404,251 |
The tax-based components of distributable earnings as of period end were as follows:
Capital loss carryforward | $ (1,743,216) |
Net unrealized appreciation (depreciation) | $ (383,144) |
Capital loss carryforwards are only available to offset future capital gains of the Fund to the extent provided by regulations and may be limited. Under the Regulated Investment Company Modernization Act of 2010 (the Act), the Fund is permitted to carry forward capital losses incurred in taxable years beginning after December 22, 2010 for an unlimited period and such capital losses are required to be used prior to any losses that expire. Capital loss carryforwards were as follows:
Fiscal year of expiration | |
2016 | $ (1,385,036) |
2017 | (358,180) |
Total with expiration | $ (1,743,216) |
The tax character of distributions paid was as follows:
| December 31, 2011 | December 31, 2010 |
Ordinary Income | $ 152,583 | $ 157,959 |
Trading (Redemption) Fees. Shares held by investors less than 60 days are subject to a redemption fee equal to 1% of the net asset value of shares redeemed. All redemption fees, which reduce the proceeds of the shareholder redemption, are retained by the Fund and accounted for as an addition to paid in capital.
4. Purchases and Sales of Investments.
Purchases and sales of securities, other than short-term securities, aggregated $13,456,498 and $12,727,646, respectively.
5. Fees and Other Transactions with Affiliates.
Management Fee. FMR and its affiliates provide the Fund with investment management related services for which the Fund pays a monthly management fee. The management fee is the sum of an individual fund fee rate that is based on an annual rate of .30% of the Fund's average net assets and an annualized group fee rate that averaged .26% during the period. The group fee rate is based upon the average net assets of all the mutual funds advised by FMR. The group fee rate decreases as assets under management increase and increases as assets under management decrease. For the period, the total annual management fee rate was .56% of the Fund's average net assets.
Transfer Agent Fees. Fidelity Investments Institutional Operations Company, Inc. (FIIOC), an affiliate of FMR, is the Fund's transfer, dividend disbursing, and shareholder servicing agent. FIIOC receives an asset-based fee with respect to each class. Each class (with the exception of Investor Class) pays a transfer agent fee, excluding out of pocket expenses, equal to an annual rate of .07% of average net assets. Investor Class pays a monthly asset-based transfer agent fee of .15% of average net assets. In addition, FIIOC receives an asset-based fee of .0045% of average net assets for typesetting, printing and mailing of shareholder reports, except proxy statements. FIIOC voluntarily agreed to waive this fee for the period August 1, 2011 through December 31, 2011 (see Expense Reductions note). For the period, transfer agent fees for each class, including printing and out of pocket expenses, were as follows:
Initial Class | $ 5,586 |
Investor Class | 13,689 |
| $ 19,275 |
Annual Report
5. Fees and Other Transactions with Affiliates - continued
Accounting Fees. Fidelity Service Company, Inc.(FSC), an affiliate of FMR, maintains the Fund's accounting records. The fee is based on the level of average net assets for the month.
Brokerage Commissions. The Fund placed a portion of its portfolio transactions with brokerage firms which are affiliates of the investment adviser. The commissions paid to these affiliated firms were $1,826 for the period.
6. Committed Line of Credit.
The Fund participates with other funds managed by FMR or an affiliate in a $4.0 billion credit facility (the "line of credit") to be utilized for temporary or emergency purposes to fund shareholder redemptions or for other short-term liquidity purposes. The Fund has agreed to pay commitment fees on its pro-rata portion of the line of credit, which amounted to $34 and is reflected in Miscellaneous expenses on the Statement of Operations. During the period, there were no borrowings on this line of credit.
7. Expense Reductions.
In addition to FIIOC waiving a portion of its transfer agent fees, FMR voluntarily agreed to reimburse each class to the extent annual operating expenses exceeded certain levels of average net assets as noted in the table below. Some expenses, for example interest expense, including commitment fees, are excluded from this reimbursement.
Expenses were reimbursed and/or waived for the following classes during the period:
| Expense
Limitations | Reimbursement/
waiver |
Initial Class | 1.00% | $ 7,363 |
Investor Class | 1.08% | 11,652 |
| | $ 19,015 |
Many of the brokers with whom FMR places trades on behalf of the Fund provided services to the Fund in addition to trade execution. These services included payments of certain expenses on behalf of the Fund totaling $2,624 for the period.
8. Distributions to Shareholders.
Distributions to shareholders of each class were as follows:
Years ended December 31, | 2011 | 2010 |
From net investment income | | |
Initial Class | $ 48,353 | $ 70,546 |
Investor Class | 104,230 | 87,413 |
Total | $ 152,583 | $ 157,959 |
9. Share Transactions.
Transactions for each class of shares were as follows:
| Shares | Dollars |
Years ended December 31, | 2011 | 2010 | 2011 | 2010 |
Initial Class | | | | |
Shares sold | 486,625 | 394,184 | $ 4,123,652 | $ 2,812,772 |
Reinvestment of distributions | 6,387 | 9,174 | 48,353 | 70,546 |
Shares redeemed | (572,921) | (448,829) | (4,548,877) | (3,234,790) |
Net increase (decrease) | (79,909) | (45,471) | $ (376,872) | $ (351,472) |
Investor Class | | | | |
Shares sold | 924,092 | 501,711 | $ 7,744,763 | $ 3,672,849 |
Reinvestment of distributions | 13,824 | 11,365 | 104,230 | 87,413 |
Shares redeemed | (827,210) | (330,817) | (6,526,060) | (2,321,891) |
Net increase (decrease) | 110,706 | 182,259 | $ 1,322,933 | $ 1,438,371 |
Annual Report
Notes to Financial Statements - continued
10. Other.
The Fund's organizational documents provide former and current trustees and officers with a limited indemnification against liabilities arising in connection with the performance of their duties to the Fund. In the normal course of business, the Fund may also enter into contracts that provide general indemnifications. The Fund's maximum exposure under these arrangements is unknown as this would be dependent on future claims that may be made against the Fund. The risk of material loss from such claims is considered remote.
At the end of the period, FMR or its affiliates were the owners of record of 100% of the total outstanding shares of the Fund.
Annual Report
Report of Independent Registered Public Accounting Firm
To the Trustees of Variable Insurance Products Fund IV and the Shareholders of VIP Telecommunications Portfolio:
In our opinion, the accompanying statement of assets and liabilities, including the schedule of investments, and the related statements of operations and of changes in net assets and the financial highlights present fairly, in all material respects, the financial position of VIP Telecommunications Portfolio (a fund of Variable Insurance Products Fund IV) at December 31, 2011, the results of its operations for the year then ended, the changes in its net assets for each of the two years in the period then ended and the financial highlights for each of the periods indicated, in conformity with accounting principles generally accepted in the United States of America. These financial statements and financial highlights (hereafter referred to as "financial statements") are the responsibility of the VIP Telecommunications Portfolio's management. Our responsibility is to express an opinion on these financial statements based on our audits. We conducted our audits of these financial statements in accordance with the standards of the Public Company Accounting Oversight Board (United States). Those standards require that we plan and perform the audit to obtain reasonable assurance about whether the financial statements are free of material misstatement. An audit includes examining, on a test basis, evidence supporting the amounts and disclosures in the financial statements, assessing the accounting principles used and significant estimates made by management, and evaluating the overall financial statement presentation. We believe that our audits, which included confirmation of securities at December 31, 2011 by correspondence with the custodian and brokers, provide a reasonable basis for our opinion.
/s/ PricewaterhouseCoopers LLP
PricewaterhouseCoopers LLP
Boston, Massachusetts
February 14, 2012
Annual Report
The Trustees, Members of the Advisory Board, and executive officers of the trust and fund, as applicable, are listed below. The Board of Trustees governs the fund and is responsible for protecting the interests of shareholders. The Trustees are experienced executives who meet periodically throughout the year to oversee the fund's activities, review contractual arrangements with companies that provide services to the fund, oversee management of the risks associated with such activities and contractual arrangements, and review the fund's performance. Except for James C. Curvey, each of the Trustees oversees 226 funds advised by FMR or an affiliate. Mr. Curvey oversees 429 funds advised by FMR or an affiliate.
The Trustees hold office without limit in time except that (a) any Trustee may resign; (b) any Trustee may be removed by written instrument, signed by at least two-thirds of the number of Trustees prior to such removal; (c) any Trustee who requests to be retired or who has become incapacitated by illness or injury may be retired by written instrument signed by a majority of the other Trustees; and (d) any Trustee may be removed at any special meeting of shareholders by a two-thirds vote of the outstanding voting securities of the trust. Each Trustee who is not an interested person (as defined in the 1940 Act) (Independent Trustee), shall retire not later than the last day of the calendar year in which his or her 75th birthday occurs. The Independent Trustees may waive this mandatory retirement age policy with respect to individual Trustees. The executive officers and Advisory Board Members hold office without limit in time, except that any officer and Advisory Board Member may resign or may be removed by a vote of a majority of the Trustees at any regular meeting or any special meeting of the Trustees. Except as indicated, each individual has held the office shown or other offices in the same company for the past five years.
Experience, Skills, Attributes, and Qualifications of the Fund's Trustees. The Governance and Nominating Committee has adopted a statement of policy that describes the experience, qualifications, attributes, and skills that are necessary and desirable for potential Independent Trustee candidates (Statement of Policy). The Board believes that each Trustee satisfied at the time he or she was initially elected or appointed a Trustee, and continues to satisfy, the standards contemplated by the Statement of Policy. The Governance and Nominating Committee also engages professional search firms to help identify potential Independent Trustee candidates who have the experience, qualifications, attributes, and skills consistent with the Statement of Policy. From time to time, additional criteria based on the composition and skills of the current Independent Trustees, as well as experience or skills that may be appropriate in light of future changes to board composition, business conditions, and regulatory or other developments, have also been considered by the professional search firms and the Governance and Nominating Committee. In addition, the Board takes into account the Trustees' commitment and participation in Board and committee meetings, as well as their leadership of standing and ad hoc committees throughout their tenure.
In determining that a particular Trustee was and continues to be qualified to serve as a Trustee, the Board has considered a variety of criteria, none of which, in isolation, was controlling. The Board believes that, collectively, the Trustees have balanced and diverse experience, qualifications, attributes, and skills, which allow the Board to operate effectively in governing the fund and protecting the interests of shareholders. Information about the specific experience, skills, attributes, and qualifications of each Trustee, which in each case led to the Board's conclusion that the Trustee should serve (or continue to serve) as a trustee of the fund, is provided below.
Board Structure and Oversight Function. James C. Curvey is an interested person (as defined in the 1940 Act) and currently serves as Acting Chairman. The Trustees have determined that an interested Chairman is appropriate and benefits shareholders because an interested Chairman has a personal and professional stake in the quality and continuity of services provided to the fund. Independent Trustees exercise their informed business judgment to appoint an individual of their choosing to serve as Chairman, regardless of whether the Trustee happens to be independent or a member of management. The Independent Trustees have determined that they can act independently and effectively without having an Independent Trustee serve as Chairman and that a key structural component for assuring that they are in a position to do so is for the Independent Trustees to constitute a substantial majority for the Board. The Independent Trustees also regularly meet in executive session. Ned C. Lautenbach serves as Chairman of the Independent Trustees and as such (i) acts as a liaison between the Independent Trustees and management with respect to matters important to the Independent Trustees and (ii) with management prepares agendas for Board meetings.
Fidelity funds are overseen by different Boards of Trustees. The fund's Board oversees Fidelity's equity and high income funds and another Board oversees Fidelity's investment-grade bond, money market, and asset allocation funds. The asset allocation funds may invest in Fidelity funds overseen by the fund's Board. The use of separate Boards, each with its own committee structure, allows the Trustees of each group of Fidelity funds to focus on the unique issues of the funds they oversee, including common research, investment, and operational issues. On occasion, the separate Boards establish joint committees to address issues of overlapping consequences for the Fidelity funds overseen by each Board.
The Trustees operate using a system of committees to facilitate the timely and efficient consideration of all matters of importance to the Trustees, the fund, and fund shareholders and to facilitate compliance with legal and regulatory requirements and oversight of the fund's activities and associated risks. The Board, acting through its committees, has charged FMR and its affiliates with (i) identifying events or circumstances the occurrence of which could have demonstrably adverse effects on the fund's business and/or reputation; (ii) implementing processes and controls to lessen the possibility that such events or circumstances occur or to mitigate the effects of such events or circumstances if they do occur; and (iii) creating and maintaining a system designed to evaluate continuously business and market conditions in order to facilitate the identification and implementation processes described in (i) and (ii) above. Because the day-to-day operations and activities of the fund are carried out by or through FMR, its affiliates and other service providers, the fund's exposure to risks is mitigated but not eliminated by the processes overseen by the Trustees. While each of the Board's committees has responsibility for overseeing different aspects of the fund's activities, oversight is exercised primarily through the Operations, Audit, and Compliance Committees. In addition, the Independent Trustees have worked with FMR to enhance the Board's oversight of investment and financial risks, legal and regulatory risks, technology risks, and operational risks, including the development of additional risk reporting to the Board. For example, a working group comprised of Independent Trustees and FMR has worked and continues to work to review the Fidelity funds' valuation-related activities, reporting and risk management. Appropriate personnel, including but not limited to the fund's Chief Compliance Officer (CCO), FMR's internal auditor, the independent accountants, the fund's Treasurer and portfolio management personnel, make periodic reports to the Board's committees, as appropriate, including an annual review of FMR's risk management program for the Fidelity funds. The responsibilities of each standing committee, including their oversight responsibilities, are described further under "Standing Committees of the Fund's Trustees."
Annual Report
The fund's Statement of Additional Information (SAI) includes more information about the Trustees. To request a free copy, call Fidelity at 1-877-208-0098.
Interested Trustees*:
Correspondence intended for each Trustee who is an interested person may be sent to Fidelity Investments, 82 Devonshire Street, Boston, Massachusetts 02109.
Name, Age; Principal Occupations and Other Relevant Experience+ |
James C. Curvey (76) |
| Year of Election or Appointment: 2007 Mr. Curvey is Trustee and Acting Chairman of the Board of Trustees of certain Trusts. Mr. Curvey also serves as Trustee (2007-present) of other investment companies advised by FMR. Mr. Curvey is a Director of Fidelity Investments Money Management, Inc. (2009-present), Director of Fidelity Research & Analysis Co. (2009-present) and Director of FMR and FMR Co., Inc. (2007-present). Mr. Curvey is also Vice Chairman (2007-present) and Director of FMR LLC. In addition, Mr. Curvey serves as an Overseer for the Boston Symphony Orchestra and a member of the Trustees of Villanova University. Previously, Mr. Curvey was the Vice Chairman (2006-2007) and Director (2000-2007) of FMR Corp. |
Ronald P. O'Hanley (54) |
| Year of Election or Appointment: 2011 Mr. O'Hanley is Director of FMR Co., Inc. (2010-present), Director of Fidelity Investments Money Management, Inc. (2010-present), Director of Fidelity Research & Analysis Company (2010-present), President of Fidelity Asset Management and Corporate Services and a member of Fidelity's Executive Committee (2010-present). Previously, Mr. O'Hanley served as President and Chief Executive Officer of BNY Mellon Asset Management (2007-2010). Mr. O'Hanley also served as Vice Chairman of Bank New York Mellon Corp. and a member of that firm's Executive Committee. Prior to the 2007 merger of The Bank of New York and Mellon Financial Corporation, he was Vice Chairman of Mellon Financial Corporation and President and Chief Executive Officer of Mellon Asset Management. He joined Mellon in February 1997. Mr. O'Hanley currently serves as Chairman of the Boston Public Library Foundation Board of Directors and sits on the Board of Directors of Beth Israel Deaconess Medical Center, the Board of Trustees of the Marine Biological Laboratory and the Advisory Board of the Maxwell School of Citizenship and Public Administration at Syracuse University. Mr. O'Hanley also chairs the Council on Asset Management for the Financial Services Roundtable and is a member of the Board of Directors of Institutional Investor's U.S. Institute. |
* Trustees have been determined to be "Interested Trustees" by virtue of, among other things, their affiliation with the trust or various entities under common control with FMR.
+ The information above includes each Trustee's principal occupation during the last five years and other information relating to the experience, attributes, and skills relevant to each Trustee's qualifications to serve as a Trustee, which led to the conclusion that each Trustee should serve as a Trustee for the fund.
Independent Trustees:
Correspondence intended for each Independent Trustee (that is, the Trustees other than the Interested Trustees) may be sent to Fidelity Investments, P.O. Box 55235, Boston, Massachusetts 02205-5235.
Name, Age; Principal Occupations and Other Relevant Experience+ |
Dennis J. Dirks (63) |
| Year of Election or Appointment: 2005 Prior to his retirement in May 2003, Mr. Dirks was Chief Operating Officer and a member of the Board of The Depository Trust & Clearing Corporation (DTCC). He also served as President, Chief Operating Officer, and Board member of The Depository Trust Company (DTC) and President and Board member of the National Securities Clearing Corporation (NSCC). In addition, Mr. Dirks served as Chief Executive Officer and Board member of the Government Securities Clearing Corporation, Chief Executive Officer and Board member of the Mortgage-Backed Securities Clearing Corporation, as a Trustee and a member of the Finance Committee of Manhattan College (2005-2008), and as a Trustee and a member of the Finance Committee of AHRC of Nassau County (2006-2008). Mr. Dirks is a member of the Independent Directors Council (IDC) Governing Council (2010-present) and Board of Directors for The Brookville Center for Children's Services, Inc. (2009-present). |
Alan J. Lacy (58) |
| Year of Election or Appointment: 2008 Mr. Lacy serves as Senior Adviser (2007-present) of Oak Hill Capital Partners, L.P. (private equity). Mr. Lacy also served as Chief Executive Officer (2000-2005) and Vice Chairman (2005-2006) of Sears Holdings Corporation and Sears, Roebuck and Co. (retail). In addition, Mr. Lacy serves as a member of the Board of Directors of Dave & Buster's, Inc. (restaurant and entertainment complexes, 2010-present), The Hillman Companies, Inc. (hardware wholesalers, 2010-present), and Bristol-Myers Squibb Company (global pharmaceuticals, 2007-present). Mr. Lacy is a member of the Board of Trustees of The National Parks Conservation Association (2006-present). Previously, Mr. Lacy served as Chairman of the Board of Trustees of the National Parks Conservation Association (2008-2011) and as a member of the Board of Directors for the Western Union Company (global money transfer, 2006-2011). |
Ned C. Lautenbach (67) |
| Year of Election or Appointment: 2000 Mr. Lautenbach is Chairman of the Independent Trustees of the Equity and High Income Funds (2006-present). Mr. Lautenbach currently serves as the Lead Director of the Eaton Corporation Board of Directors (diversified industrial, 1997-present). Mr. Lautenbach is also a member of the Board of Directors of the Philharmonic Center for the Arts in Naples, Florida (1999-present); a member of the Board of Trustees of Fairfield University (2005-present); and a member of the Council on Foreign Relations (1994-present). Previously, Mr. Lautenbach was a Partner/Advisory Partner at Clayton, Dubilier & Rice, LLC (private equity investment, 1998-2010), as well as a Director of Sony Corporation (2006-2007). |
Joseph Mauriello (67) |
| Year of Election or Appointment: 2008 Prior to his retirement in January 2006, Mr. Mauriello served in numerous senior management positions including Deputy Chairman and Chief Operating Officer (2004-2005), and Vice Chairman of Financial Services (2002-2004) of KPMG LLP US (professional services, 1965-2005). Mr. Mauriello currently serves as a member of the Board of Directors of XL Group plc. (global insurance and re-insurance, 2006-present) and of Arcadia Resources Inc. (health care services and products, 2007-present). Previously, Mr. Mauriello served as a Director of the Hamilton Funds of the Bank of New York (2006-2007). |
Robert W. Selander (61) |
| Year of Election or Appointment: 2011 Previously, Mr. Selander served as a Member of the Advisory Board of Fidelity's Equity and High Income Funds (2011), Executive Vice Chairman (2010), Chief Executive Officer (2009-2010), and President and Chief Executive Officer (1997-2009) of Mastercard, Inc. |
Cornelia M. Small (67) |
| Year of Election or Appointment: 2005 Ms. Small is a member of the Board of Directors of the Teagle Foundation (2009-present). Ms. Small is also a member of the Investment Committee, and Chair (2008-present) and a member of the Board of Trustees of Smith College. In addition, Ms. Small serves on the Investment Committee of the Berkshire Taconic Community Foundation (2008-present). Previously, Ms. Small served as Chairperson of the Investment Committee (2002-2008) of Smith College. In addition, Ms. Small served as Chief Investment Officer, Director of Global Equity Investments, and a member of the Board of Directors of Scudder, Stevens & Clark and Scudder Kemper Investments. |
William S. Stavropoulos (72) |
| Year of Election or Appointment: 2001 Mr. Stavropoulos is Vice Chairman of the Independent Trustees of the Equity and High Income Funds (2006-present). Mr. Stavropoulos serves as President and Founder of the Michigan Baseball Foundation, the Great Lakes Loons (2007-present). Mr. Stavropoulos is Chairman Emeritus of the Board of Directors of The Dow Chemical Company, where he previously served in numerous senior management positions, including President, CEO (1995-2000; 2002-2004), Chairman of the Executive Committee (2000-2006), and as a member of the Board of Directors (1990-2006). Currently, Mr. Stavropoulos is Chairman of Univar (global distributor of commodity and specialty chemicals, 2010-present), a Director of Teradata Corporation (data warehousing and technology solutions, 2008-present), Chemical Financial Corporation, Maersk Inc. (industrial conglomerate), Tyco International, Inc. (multinational manufacturing and services, 2007-present), and a member of the Advisory Board for Metalmark Capital (private equity investment, 2005-present). Mr. Stavropoulos is a special advisor to Clayton, Dubilier & Rice, LLC (private equity investment). In addition, Mr. Stavropoulos is a member of the University of Notre Dame Advisory Council for the College of Science. |
David M. Thomas (62) |
| Year of Election or Appointment: 2008 Previously, Mr. Thomas served as Executive Chairman (2005-2006) and Chairman and Chief Executive Officer (2000-2005) of IMS Health, Inc. (pharmaceutical and healthcare information solutions). In addition, Mr. Thomas serves as a member of the Board of Directors of Fortune Brands, Inc. (consumer products), and Interpublic Group of Companies, Inc. (marketing communication, 2004-present). |
Michael E. Wiley (61) |
| Year of Election or Appointment: 2008 Mr. Wiley also serves as a Director of Asia Pacific Exploration Consolidated (international oil and gas exploration and production, 2008-present). Mr. Wiley serves as a Director of Tesoro Corporation (independent oil refiner and marketer, 2005-present), and a Director of Bill Barrett Corporation (exploration and production, 2005-present). In addition, Mr. Wiley also serves as a Director of Post Oak Bank (privately-held bank, 2004-present). Previously, Mr. Wiley served as a member of the Board of Trustees of the University of Tulsa (2000-2006; 2007-2010), as a Senior Energy Advisor of Katzenbach Partners, LLC (consulting, 2006-2007), as an Advisory Director of Riverstone Holdings (private investment), Chairman, President, and CEO of Baker Hughes, Inc. (oilfield services, 2000-2004), and as Director of Spinnaker Exploration Company (exploration and production, 2001-2005). |
+ The information above includes each Trustee's principal occupation during the last five years and other information relating to the experience, attributes, and skills relevant to each Trustee's qualifications to serve as a Trustee, which led to the conclusion that each Trustee should serve as a Trustee for the fund.
Advisory Board Members and Executive Officers:
Correspondence intended for each executive officer, Edward C. Johnson 3d, and Peter S. Lynch may be sent to Fidelity Investments, 82 Devonshire Street, Boston, Massachusetts 02109.
Name, Age; Principal Occupation |
Edward C. Johnson 3d (81) |
| Year of Election or Appointment: 2011 Member of the Advisory Board of Fidelity's Equity and High Income Funds. Mr. Johnson serves as Chief Executive Officer, Chairman, and a Director of FMR LLC, and also serves as Chairman and Director of FIL Limited. Previously, Mr. Johnson served as a Trustee and Chairman of the Board of certain Fidelity Trusts, Chairman and a Director of FMR, Chairman and a Director of FMR Co., Inc., and President of FMR LLC (2006-2007). |
Peter S. Lynch (67) |
| Year of Election or Appointment: 2003 Member of the Advisory Board of Fidelity's Equity and High Income Funds. Mr. Lynch is Vice Chairman and a Director of FMR and FMR Co., Inc. In addition, Mr. Lynch serves as a Trustee of Boston College and as the Chairman of the Inner-City Scholarship Fund. Previously, Mr. Lynch served on the Special Olympics International Board of Directors (1997-2006). |
Kenneth B. Robins (42) |
| Year of Election or Appointment: 2008 President and Treasurer of Fidelity's Equity and High Income Funds. Mr. Robins also serves as President and Treasurer (2010-present) and Assistant Treasurer (2009-present) of other Fidelity funds and is an employee of Fidelity Investments (2004-present). Previously, Mr. Robins served as Deputy Treasurer of the Fidelity funds (2005-2008) and Treasurer and Chief Financial Officer of The North Carolina Capital Management Trust: Cash and Term Portfolios (2006-2008). |
Brian B. Hogan (47) |
| Year of Election or Appointment: 2009 Vice President of Equity and High Income Funds. Mr. Hogan also serves as President of FMR's Equity Division (2009-present). Previously, Mr. Hogan served as Senior Vice President, Equity Research of FMR (2006-2009) and as a portfolio manager. |
Christopher S. Bartel (40) |
| Year of Election or Appointment: 2009 Vice President of Fidelity's Sector and Real Estate Equity Funds. Mr. Bartel also serves as Senior Vice President of Equity Research (2009-present). Previously, Mr. Bartel served as Managing Director of Research (2006-2009) and an analyst and portfolio manager (2000-2006). |
Scott C. Goebel (43) |
| Year of Election or Appointment: 2008 Secretary and Chief Legal Officer (CLO) of the Fidelity funds. Mr. Goebel also serves as Secretary of Fidelity Investments Money Management, Inc. (FIMM) (2010-present) and Fidelity Research and Analysis Company (FRAC) (2010-present); Secretary and CLO of The North Carolina Capital Management Trust: Cash and Term Portfolios (2008-present); General Counsel, Secretary, and Senior Vice President of FMR (2008-present) and FMR Co., Inc. (2008-present); employed by FMR LLC or an affiliate (2001-present); Chief Legal Officer of Fidelity Management & Research (Hong Kong) Limited (2008-present) and Assistant Secretary of Fidelity Management & Research (Japan) Inc. (2008-present), and Fidelity Management & Research (U.K.) Inc. (2008-present). Previously, Mr. Goebel served as Assistant Secretary of FIMM (2008-2010), FRAC (2008-2010), and the Funds (2007-2008) and as Vice President and Secretary of Fidelity Distributors Corporation (FDC) (2005-2007). |
William C. Coffey (42) |
| Year of Election or Appointment: 2009 Assistant Secretary of Fidelity's Equity and High Income Funds. Mr. Coffey also serves as Senior Vice President and Deputy General Counsel of FMR LLC (2010-present), and is an employee of Fidelity Investments. Previously, Mr. Coffey served as Vice President and Associate General Counsel of FMR LLC (2005-2009). |
Holly C. Laurent (57) |
| Year of Election or Appointment: 2008 Anti-Money Laundering (AML) Officer of the Fidelity funds. Ms. Laurent also serves as AML Officer of The North Carolina Capital Management Trust: Cash and Term Portfolios (2008-present) and is an employee of Fidelity Investments. Previously, Ms. Laurent was Senior Vice President and Head of Legal for Fidelity Business Services India Pvt. Ltd. (2006-2008), and Senior Vice President, Deputy General Counsel and Group Head for FMR LLC (2005-2006). |
Christine Reynolds (53) |
| Year of Election or Appointment: 2008 Chief Financial Officer of the Fidelity funds. Ms. Reynolds became President of Fidelity Pricing and Cash Management Services (FPCMS) in August 2008. Ms. Reynolds served as Chief Operating Officer of FPCMS (2007-2008). Previously, Ms. Reynolds served as President, Treasurer, and Anti-Money Laundering officer of the Fidelity funds (2004-2007). |
Kenneth A. Rathgeber (64) |
| Year of Election or Appointment: 2004 Chief Compliance Officer of Fidelity's Equity and High Income Funds. Mr. Rathgeber is Chief Compliance Officer of Fidelity Management & Research (Hong Kong) Limited (2008-present), Fidelity Management & Research (Japan) Inc. (2008-present), FMR (2005-present), FMR Co., Inc. (2005-present), Fidelity Management & Research (U.K.) Inc. (2005-present), Fidelity Research & Analysis Company (2005-present), Fidelity Investments Money Management, Inc. (2005-present), Pyramis Global Advisors, LLC (2005-present), and Strategic Advisers, Inc. (2005-present). |
Jeffrey S. Christian (50) |
| Year of Election or Appointment: 2009 Deputy Treasurer of the Fidelity funds. Mr. Christian is an employee of Fidelity Investments. Previously, Mr. Christian served as Chief Financial Officer (2008-2009) of certain Fidelity funds and Senior Vice President of Fidelity Pricing and Cash Management Services (FPCMS) (2004-2009). |
Joseph F. Zambello (54) |
| Year of Election or Appointment: 2011 Deputy Treasurer of the Fidelity funds. Mr. Zambello is an employee of Fidelity Investments. Previously, Mr. Zambello served as Vice President of FMR's Program Management Group (2009-2011) and Vice President of the Transfer Agent Oversight Group (2005-2009). |
Adrien E. Deberghes (44) |
| Year of Election or Appointment: 2008 Deputy Treasurer of Fidelity's Equity and High Income Funds. Mr. Deberghes also serves as Vice President and Assistant Treasurer of Fidelity Rutland Square Trust II and Fidelity Commonwealth Trust II (2011-present), Assistant Treasurer of other Fidelity funds (2010-present), and is an employee of Fidelity Investments (2008-present). Previously, Mr. Deberghes served as Senior Vice President of Mutual Fund Administration at State Street Corporation (2007-2008), Senior Director of Mutual Fund Administration at Investors Bank & Trust (2005-2007), and Director of Finance for Dunkin' Brands (2000-2005). |
Stephanie J. Dorsey (42) |
| Year of Election or Appointment: 2010 Assistant Treasurer of Fidelity's Equity and High Income Funds. Ms. Dorsey also serves as Deputy Treasurer of other Fidelity funds (2008-present) and is an employee of Fidelity Investments (2008-present). Previously, Ms. Dorsey served as Treasurer (2004-2008) of the JPMorgan Mutual Funds and Vice President (2004-2008) of JPMorgan Chase Bank. |
John R. Hebble (53) |
| Year of Election or Appointment: 2009 Assistant Treasurer of Fidelity's Equity and High Income Funds. Mr. Hebble also serves as President (2011-present), Treasurer, and Chief Financial Officer of The North Carolina Capital Management Trust: Cash and Term Portfolios (2008-present), President and Treasurer of other Fidelity funds (2008-present) and is an employee of Fidelity Investments. |
Gary W. Ryan (53) |
| Year of Election or Appointment: 2005 Assistant Treasurer of the Fidelity funds. Mr. Ryan is an employee of Fidelity Investments. Previously, Mr. Ryan served as Vice President of Fund Reporting in Fidelity Pricing and Cash Management Services (FPCMS) (1999-2005). |
Jonathan Davis (43) |
| Year of Election or Appointment: 2010 Assistant Treasurer of the Fidelity funds. Mr. Davis is also Assistant Treasurer of Fidelity Rutland Square Trust II and Fidelity Commonwealth Trust II. Mr. Davis is an employee of Fidelity Investments. Previously, Mr. Davis served as Vice President and Associate General Counsel of FMR LLC (2003-2010). |
Annual Report
Initial Class and Investors Class each designate 100% of each dividend distributed in December 2011, during the fiscal year as qualifying for the dividends-received deduction for corporate shareholders.
Annual Report
Board Approval of Investment Advisory Contracts and Management Fees
VIP Telecommunications Portfolio
Each year, the Board of Trustees, including the Independent Trustees (together, the Board), votes on the renewal of the management contract and sub-advisory agreements (together, the Advisory Contracts) for the fund. The Board, assisted by the advice of fund counsel and Independent Trustees' counsel, requests and considers a broad range of information relevant to the renewal of the Advisory Contracts throughout the year.
The Board meets regularly and considers at each of its meetings factors that are relevant to its annual consideration of the renewal of the fund's Advisory Contracts, including the services and support provided to the fund and its shareholders. The Board has established various standing committees, each composed of Independent Trustees with varying backgrounds, to which the Board has assigned specific subject matter responsibilities in order to enhance effective decision-making by the Board. The Board, acting directly and through its Committees, requests and receives information concerning the annual consideration of the renewal of the fund's Advisory Contracts. The Board also meets as needed to consider matters specifically related to the Board's annual consideration of the renewal of Advisory Contracts. Members of the Board may also meet with trustees of other Fidelity funds through ad hoc joint committees to discuss certain matters relevant to the Fidelity funds.
At its July 2011 meeting, the Board of Trustees, including the Independent Trustees, unanimously determined to renew the fund's Advisory Contracts. In reaching its determination, the Board considered all factors it believed relevant, including (i) the nature, extent, and quality of the services to be provided to the fund and its shareholders (including the investment performance of the fund); (ii) the competitiveness of the fund's management fee and total expense ratio; (iii) the total costs of the services to be provided by and the profits to be realized by Fidelity from its relationship with the fund; (iv) the extent to which economies of scale would be realized as the fund grows; and (v) whether fee levels reflect these economies of scale, if any, for the benefit of fund shareholders.
In considering whether to renew the Advisory Contracts for the fund, the Board reached a determination, with the assistance of fund counsel and Independent Trustees' counsel and through the exercise of its business judgment, that the renewal of the Advisory Contracts is in the best interests of the fund and its shareholders and that the compensation payable under the Advisory Contracts is fair and reasonable. The Board's decision to renew the Advisory Contracts was not based on any single factor, but rather was based on a comprehensive consideration of all the information provided to the Board at its meetings throughout the year. The Board, in reaching its determination to renew the Advisory Contracts, is aware that shareholders in the fund have a broad range of investment choices available to them, including a wide choice among mutual funds offered by Fidelity's competitors, and that the fund's shareholders, who have the opportunity to review and weigh the disclosure provided by the fund in its prospectus and other public disclosures, have chosen to invest in this fund, managed by Fidelity.
Nature, Extent, and Quality of Services Provided. The Board considered the staffing within the investment adviser, FMR, and the sub-advisers (together, the Investment Advisers), including the backgrounds of the fund's investment personnel and the fund's investment objective and discipline. The Independent Trustees also had discussions with senior management of Fidelity's investment operations and investment groups. The Board considered the structure of the portfolio manager compensation program and whether this structure provides appropriate incentives to act in the best interests of the fund.
Resources Dedicated to Investment Management and Support Services. The Board and the Fund Oversight and Research Committees reviewed the general qualifications and capabilities of the Investment Advisers' investment staff, including its size, education, experience, and resources, as well as the Investment Advisers' approach to recruiting, training, managing, and compensating investment personnel. The Board also noted that FMR has devoted increased resources to non-U.S. offices. The Board noted that Fidelity's analysts have extensive resources, tools and capabilities which allow them to conduct sophisticated quantitative and fundamental analysis, as well as credit analysis of issuers, counterparties and enhancers. The Board also believes that Fidelity's investment professionals have sufficient access to global information and data so as to provide competitive investment results over time, and that those professionals also have access to sophisticated tools which permit them to assess portfolio construction and risk and performance attribution characteristics continuously, as well as to transmit new information and research conclusions rapidly around the world. Additionally, in their deliberations, the Board considered the Investment Advisers' trading capabilities and resources which are an integral part of the investment management process.
Shareholder and Administrative Services. The Board considered (i) the nature, extent, quality, and cost of advisory, administrative, and shareholder services performed by the Investment Advisers and their affiliates under the Advisory Contracts and under separate agreements covering transfer agency, pricing and bookkeeping, and securities lending services for the fund; (ii) the nature and extent of the investment adviser's supervision of third party service providers, principally custodians and subcustodians; and (iii) the resources devoted to, and the record of compliance with, the fund's compliance policies and procedures. The Board also reviewed the allocation of fund brokerage, including allocations to brokers affiliated with the Investment Advisers, the use of brokerage commissions to pay fund expenses, and the use of "soft" commission dollars to pay for research services.
The Board noted that the growth of fund assets over time across the complex allows Fidelity to reinvest in the development of services designed to enhance the value or convenience of the Fidelity funds as investment vehicles. These services include 24-hour access to account information and market information through telephone representatives and over the Internet, investor education materials and asset allocation tools, and the expanded availability of Fidelity Investor Centers, with 35 new branches opening since 2010.
Annual Report
Board Approval of Investment Advisory Contracts and Management Fees - continued
Investment in a Large Fund Family. The Board considered the benefits to shareholders of investing in a Fidelity fund, including the benefits of investing in a fund that is part of a large family of funds offering a variety of investment disciplines and providing a large variety of mutual fund investor services. The Board noted that Fidelity had taken, or had made recommendations that resulted in the Fidelity funds taking, a number of actions over the previous year that benefited particular funds, including (i) continuing to dedicate additional resources to investment research and support of the senior management team that oversees asset management; (ii) rationalizing product lines through the mergers of six funds into other funds; (iii) continuing to migrate the Freedom Funds to dedicated lower cost underlying funds; (iv) obtaining shareholder approval to broaden the investment strategies for Fidelity Consumer Finance Portfolio, Fidelity Emerging Asia Fund, and Fidelity Environment and Alternative Energy Portfolio; (v) contractually agreeing to reduce the management fees and impose other expense limitations on Spartan 500 Index Fund and U.S. Bond Index Fund in connection with launching new institutional classes of these funds; (vi) changing the name, primary and supplemental benchmarks, and investment policies of Fidelity Global Strategies Fund to support the fund's flexible investment mandate and global orientation; and (vii) reducing the transfer agency account fee rates on certain accounts.
Investment Performance. The Board considered whether the fund has operated in accordance with its investment objective, as well as its record of compliance with its investment restrictions. It also reviewed the fund's absolute investment performance for each class, as well as the fund's relative investment performance for each class measured over multiple periods against a third-party-sponsored index that reflects the market sector in which the fund invests. The Board noted that FMR does not believe that a meaningful peer group exists against which to compare the fund's performance. Because the fund had been in existence less than five calendar years, the following charts considered by the Board show, over the one- and three-year periods ended December 31, 2010, the cumulative total returns of Initial Class and Investor Class of the fund and the cumulative total returns of a third-party-sponsored index ("benchmark").
VIP Telecommunications Portfolio
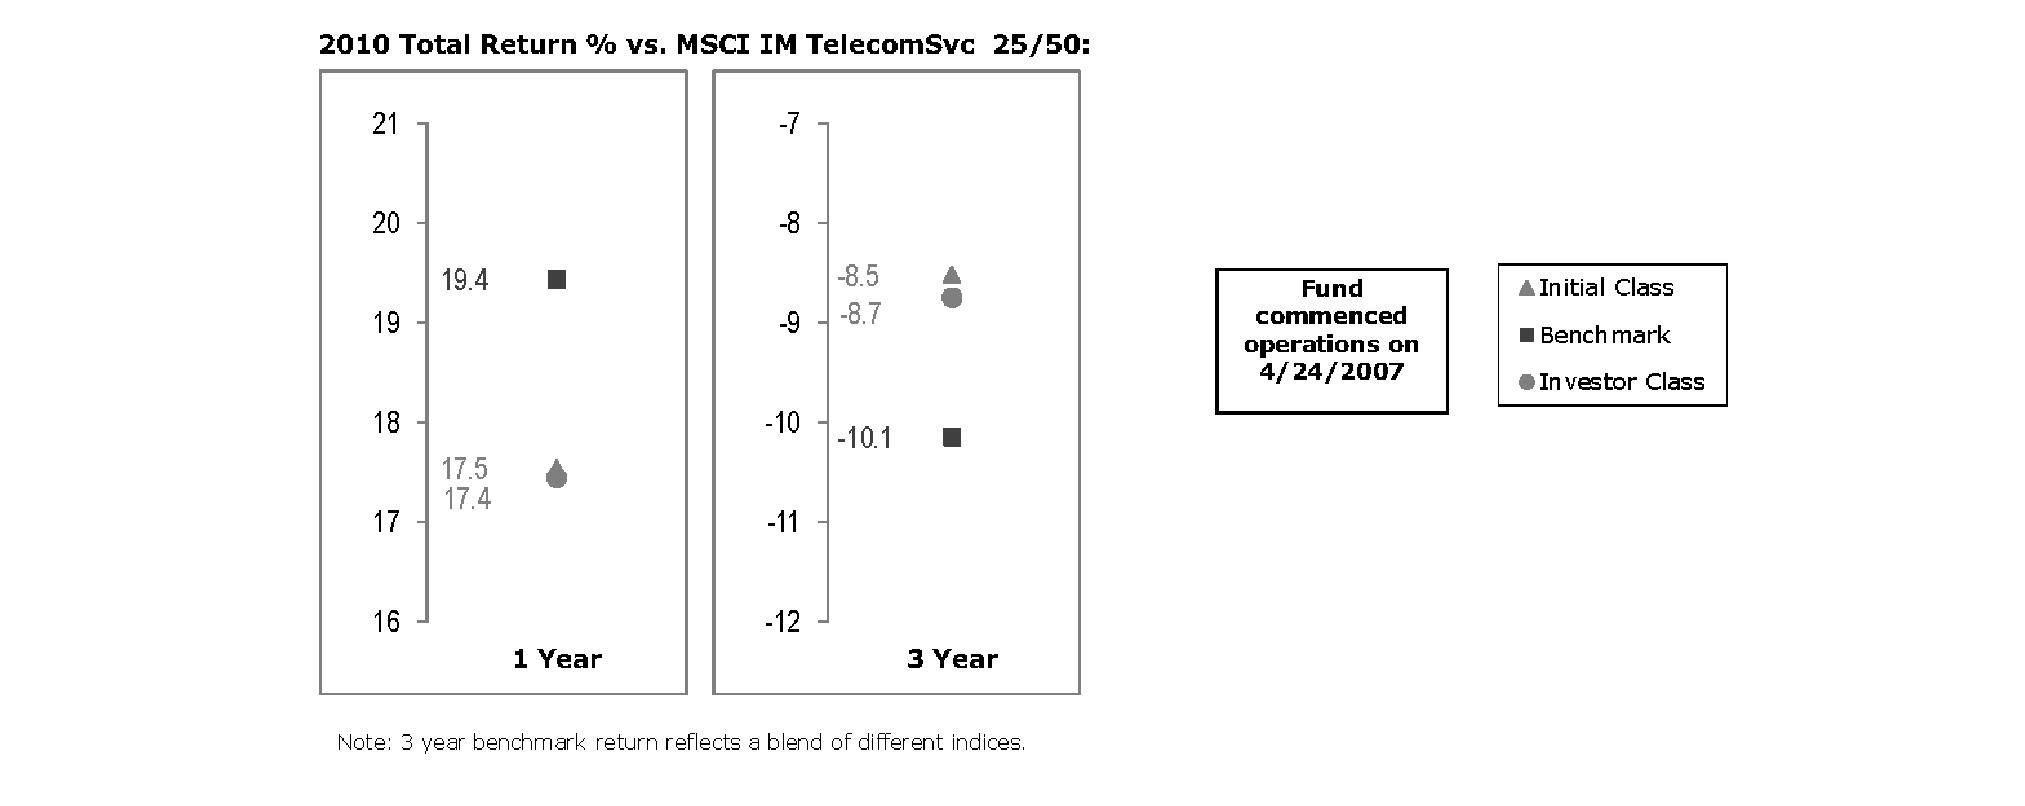
The Board noted that the investment performance of Initial Class of the fund compared favorably to its benchmark for the three-year period, although the fund's one-year total return was lower than its benchmark. The Board considered that the variations in performance between the fund's classes reflect the variations in class expenses, which result in lower performance for the higher expense class. The Board also reviewed the fund's performance since inception as well as performance in the current year.
Based on its review, the Board concluded that the nature, extent, and quality of services provided to the fund under the Advisory Contracts should benefit the fund's shareholders.
Competitiveness of Management Fee and Total Expense Ratio. The Board considered the fund's management fee and total expense ratio compared to "mapped groups" of competitive funds and classes. Fidelity creates "mapped groups" by combining similar Lipper investment objective categories that have comparable management fee characteristics. Combining Lipper investment objective categories aids the Board's management fee and total expense ratio comparisons by broadening the competitive group used for comparison and by reducing the number of universes to which various Fidelity funds are compared.
Management Fee. The Board considered two proprietary management fee comparisons for the 12-month (or shorter) periods shown in the chart below. The group of Lipper funds used by the Board for management fee comparisons is referred to below as the "Total Mapped Group." The Total Mapped Group comparison focuses on a fund's standing relative to the total universe of comparable funds available to investors in terms of gross management fees before expense reimbursements or caps. "TMG %" represents the percentage of funds in the Total Mapped Group that had management fees that were lower than the fund's. For example, a TMG % of 2% means that 98% of the funds in the Total Mapped Group had higher management fees than the fund. The "Asset-Size Peer Group" (ASPG) comparison focuses on a fund's standing relative to non-Fidelity funds similar in size to the fund within the Total Mapped Group. The ASPG represents at least 15% of the funds in the Total Mapped Group with comparable asset size and management fee characteristics, subject to a minimum of 50 funds (or all funds in the Total Mapped Group if fewer than 50). Additional information, such as the ASPG quartile in which the fund's management fee ranked, is also included in the chart and considered by the Board.
Annual Report
VIP Telecommunications Portfolio
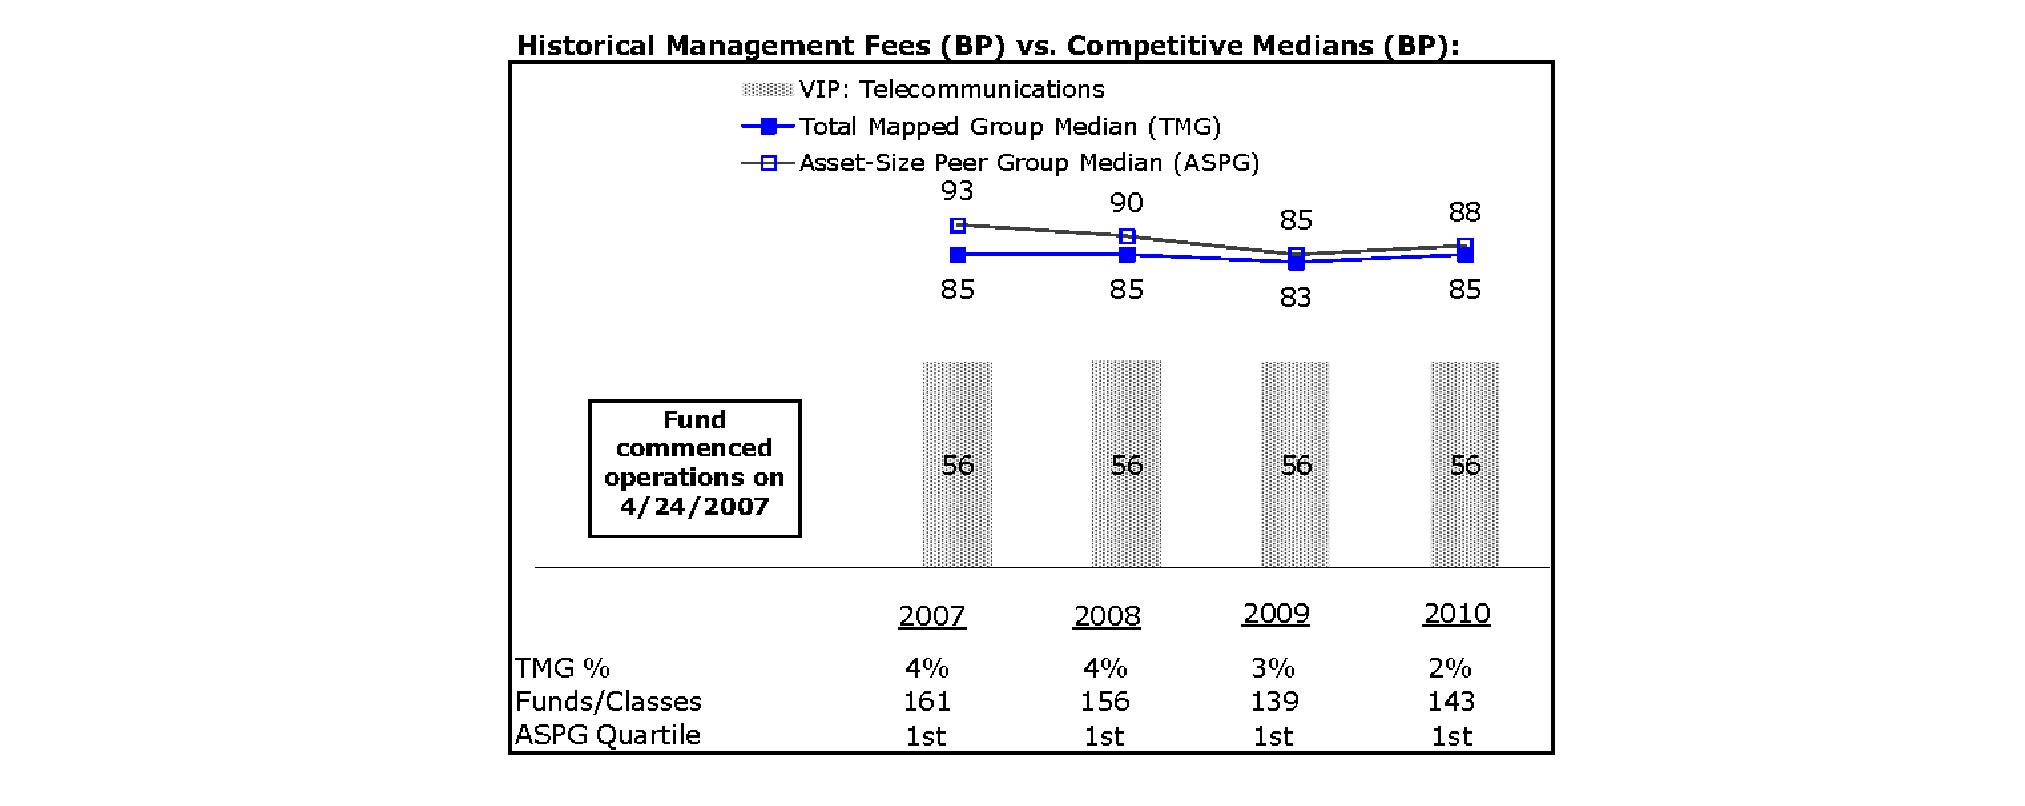
The Board noted that the fund's management fee ranked below the median of its Total Mapped Group and below the median of its ASPG for 2010.
Based on its review, the Board concluded that the fund's management fee is fair and reasonable in light of the services that the fund receives and the other factors considered.
Total Expense Ratio. In its review of each class's total expense ratio, the Board considered the fund's management fee as well as other fund or class expenses, as applicable, such as transfer agent fees, pricing and bookkeeping fees, and custodial, legal, and audit fees. The Board also noted the effects of any waivers and reimbursements on fees and expenses. As part of its review, the Board also considered the current and historical total expense ratios of each class of the fund compared to competitive fund median expenses. Each class of the fund is compared to those funds and classes in the Total Mapped Group (used by the Board for management fee comparisons) that have a similar sales load structure.
The Board noted that the total expense ratio of each class ranked below its competitive median for 2010. The Board considered that various factors, including 12b-1 fees, positive or negative performance adjustments, and relatively higher other expenses in the case of small fund size, can affect total expense ratios. The Board also noted that Investor Class has higher transfer agent fees than traditional variable annuity classes because it is designed for lower cost annuity products, where the majority of servicing costs are incorporated into the funds' total expense ratios rather than being paid at the annuity level.
Fees Charged to Other Fidelity Clients. The Board also considered Fidelity fee structures and other information with respect to clients of FMR and its affiliates, such as other mutual funds advised or subadvised by FMR or its affiliates, pension plan clients, and other institutional clients. In March 2010, the Board created an ad hoc joint committee with the board of other Fidelity funds (the Committee) to review and compare Fidelity's institutional investment advisory business with its business of providing services to the Fidelity funds, including the differences in services provided, fees charged, and costs incurred, as well as competition in their respective marketplaces.
Based on its review of total expense ratios and fees charged to other Fidelity clients, the Board concluded that the total expense ratio of each class of the fund was reasonable in light of the services that the fund and its shareholders receive and the other factors considered, including the findings of the Committee.
Costs of the Services and Profitability. The Board considered the revenues earned and the expenses incurred by Fidelity in conducting the business of developing, marketing, distributing, managing, administering and servicing the fund and its shareholders. The Board also considered the level of Fidelity's profits in respect of all the Fidelity funds.
Annual Report
Board Approval of Investment Advisory Contracts and Management Fees - continued
On an annual basis, FMR presents to the Board Fidelity's profitability for the fund. Fidelity calculates the profitability for each fund, as well as aggregate profitability for groups of Fidelity funds and all Fidelity funds, using a series of detailed revenue and cost allocation methodologies which originate with the books and records of Fidelity on which Fidelity's audited financial statements are based. The Audit Committee of the Board reviews any significant changes from the prior year's methodologies.
PricewaterhouseCoopers LLP (PwC), independent registered public accounting firm and auditor to Fidelity and certain Fidelity funds, has been engaged annually by the Board as part of the Board's assessment of Fidelity's profitability analysis. PwC's engagement includes the review and assessment of Fidelity's methodologies used in determining the revenues and expenses attributable to Fidelity's mutual fund business, and completion of agreed-upon procedures surrounding the mathematical accuracy of fund profitability and its conformity to allocation methodologies. After considering PwC's reports issued under the engagement and information provided by Fidelity, the Board concluded that while other allocation methods may also be reasonable, Fidelity's profitability methodologies are reasonable in all material respects.
The Board also reviewed Fidelity's non-fund businesses and fall-out benefits related to the mutual fund business as well as cases where Fidelity's affiliates may benefit from or be related to the fund's business.
The Board considered the costs of the services provided by and the profits realized by Fidelity in connection with the operation of the fund and was satisfied that the profitability was not excessive in the circumstances.
Economies of Scale. The Board considered whether there have been economies of scale in respect of the management of the Fidelity funds, whether the Fidelity funds (including the fund) have appropriately benefited from any such economies of scale, and whether there is potential for realization of any further economies of scale. The Board considered the extent to which the fund will benefit from economies of scale through increased services to the fund, through waivers or reimbursements, or through fee or expense reductions. The Board also noted that in 2009, it and the board of other Fidelity funds created an ad hoc committee (the Economies of Scale Committee) to analyze whether FMR attains economies of scale in respect of the management and servicing of the Fidelity funds, whether the Fidelity funds have appropriately benefited from such economies of scale, and whether there is potential for realization of any further economies of scale.
The Board recognized that the fund's management contract incorporates a "group fee" structure, which provides for lower group fee rates as total fund assets under FMR's management increase, and for higher group fee rates as total fund assets under FMR's management decrease. FMR calculates the group fee rates based on a tiered asset "breakpoint" schedule that varies based on asset class. The Board considered that the group fee is designed to deliver the benefits of economies of scale to fund shareholders when total Fidelity fund assets increase, even if assets of any particular fund are unchanged or have declined, because some portion of Fidelity's costs are attributable to services provided to all Fidelity funds, and all funds benefit if those costs can be allocated among more assets. The Board concluded that, given the group fee structure, fund shareholders will benefit from lower management fees as assets under FMR's management increase at the fund complex level, regardless of whether Fidelity achieves any such economies of scale.
The Board concluded, taking into account the analysis of the Economies of Scale Committee, that any potential economies of scale are being appropriately shared between fund shareholders and Fidelity.
Additional Information Requested by the Board. In order to develop fully the factual basis for consideration of the Fidelity funds' Advisory Contracts, the Board requested and received additional information on certain topics, including (i) fund performance trends, actions to be taken by FMR to improve certain funds' overall performance, and Fidelity's long-term strategies for certain funds; (ii) portfolio manager changes that have occurred during the past year and length of portfolio manager tenure for different categories of funds over time; (iii) Fidelity's compensation structure for portfolio managers and other key personnel and strategies for attracting and retaining non-investment personnel; (iv) the amount of the investment that each portfolio manager has made in the Fidelity fund(s) that he or she manages; (v) historical trends in Fidelity's realization of fall-out benefits; (vi) Fidelity's group fee structures and the rationale for the individual fee rates of certain funds; (vii) fund profitability methodology and the impact of certain factors on fund profitability results; (viii) trends regarding industry use of performance fee structures and Fidelity's compliance practices with respect to performance adjustment calculations; (ix) the fee structures in place for certain other Fidelity clients; and (x) explanations regarding the relative total expense ratios of certain funds and classes, total expense competitive trends, and actions that might be taken by FMR to reduce total expense ratios for certain funds and classes.
Based on its evaluation of all of the conclusions noted above, and after considering all factors it believed relevant, the Board ultimately concluded that the advisory fee structures are fair and reasonable, and that the fund's Advisory Contracts should be renewed.
Annual Report
Investment Adviser
Fidelity Management & Research Company
Boston, MA
Investment Sub-Advisers
FMR Co., Inc.
Fidelity Management & Research (U.K.) Inc.
Fidelity Management & Research (Hong Kong)
Limited
Fidelity Management & Research (Japan) Inc.
General Distributor
Fidelity Distributors Corporation
Boston, MA
Transfer and Service Agents
Fidelity Investments Institutional Operations Company, Inc.
Boston, MA
Fidelity Service Company, Inc.
Boston, MA
Custodian
State Street Bank and Trust Company
Quincy, MA
VTELP-ANN-0212
1.851004.104
Fidelity® Variable Insurance Products:
Utilities Portfolio
Annual Report
December 31, 2011
Contents
Performance | (Click Here) | How the fund has done over time. |
Management's Discussion of Fund Performance | (Click Here) | The Portfolio Manager's review of fund performance and strategy. |
Shareholder Expense Example | (Click Here) | An example of shareholder expenses. |
Investment Changes | (Click Here) | A summary of major shifts in the fund's investments over the past six months. |
Investments | (Click Here) | A complete list of the fund's investments with their market values. |
Financial Statements | (Click Here) | Statements of assets and liabilities, operations, and changes in net assets, as well as financial highlights. |
Notes | (Click Here) | Notes to the financial statements. |
Report of Independent Registered Public Accounting Firm | (Click Here) | |
Trustees and Officers | (Click Here) | |
Distributions | (Click Here) | |
Board Approval of Investment Advisory Contracts and Management Fees | (Click Here) | |
To view a fund's proxy voting guidelines and proxy voting record for the 12-month period ended June 30, visit http://www.fidelity.com/proxyvotingresults or visit the Securities and Exchange Commission's (SEC) web site at http://www.sec.gov. You may also call 1-877-208-0098 to request a free copy of the proxy voting guidelines.
Fidelity Variable Insurance Products are separate account options which are purchased through a variable insurance contract.
Standard & Poor's, S&P and S&P 500 are registered service marks of The McGraw-Hill Companies, Inc. and have been licensed for use by Fidelity Distributors Corporation.
Other third party marks appearing herein are the property of their respective owners.
All other marks appearing herein are registered or unregistered trademarks or service marks of FMR LLC or an affiliated company.
This report and the financial statements contained herein are submitted for the general information of the shareholders of the fund. This report is not authorized for distribution to prospective investors in the fund unless preceded or accompanied by an effective prospectus.
A fund files its complete schedule of portfolio holdings with the SEC for the first and third quarters of each fiscal year on Form N-Q. Forms N-Q are available on the SEC's web site at http://www.sec.gov. A fund's Forms N-Q may be reviewed and copied at the SEC's Public Reference Room in Washington, DC. Information regarding the operation of the SEC's Public Reference Room may be obtained by calling 1-800-SEC-0330. For a complete list of the fund's portfolio holdings, view the most recent holdings listing, semiannual report, or annual report on Fidelity's web site at http://www.fidelity.com, http://www.advisor.fidelity.com, or http://www.401k.com, as applicable.
NOT FDIC INSURED • MAY LOSE VALUE • NO BANK GUARANTEE
Neither the fund nor Fidelity Distributors Corporation is a bank.
Annual Report
Average annual total return reflects the change in the value of an investment, assuming reinvestment of the class' distributions from dividend income and capital gains (the profits earned upon the sale of securities that have grown in value, if any) and assuming a constant rate of performance each year. During periods of reimbursement by Fidelity, a fund's total return will be greater than it would be had the reimbursement not occurred. Performance numbers are net of all underlying fund operating expenses, but do not include any insurance charges imposed by your insurance company's separate account. If performance information included the effect of these additional charges, the total returns would have been lower. How a fund did yesterday is no guarantee of how it will do tomorrow.
Average Annual Total Returns
Periods ended December 31, 2011 | Past 1
year | Past 5
years | Past 10
years |
VIP Utilities Portfolio - Initial Class B | 13.20% | 2.46% | 6.03% |
VIP Utilities Portfolio - Investor ClassA,B | 13.11% | 2.34% | 5.95% |
A The initial offering of Investor Class shares took place on July 21, 2005. Returns prior to July 21, 2005 are those of Initial Class. Had Investor Class's transfer agent fee been reflected, returns prior to July 21, 2005, would have been lower.
B Prior to October 1, 2006, VIP Utilities Portfolio operated under certain different investment policies. The historical performance for the fund may not represent its current investment policies.
$10,000 Over 10 Years
Let's say hypothetically that $10,000 was invested in VIP Utilities Portfolio - Initial Class on December 31, 2001. The chart shows how the value of your investment would have changed, and also shows how the S&P 500® Index performed over the same period.
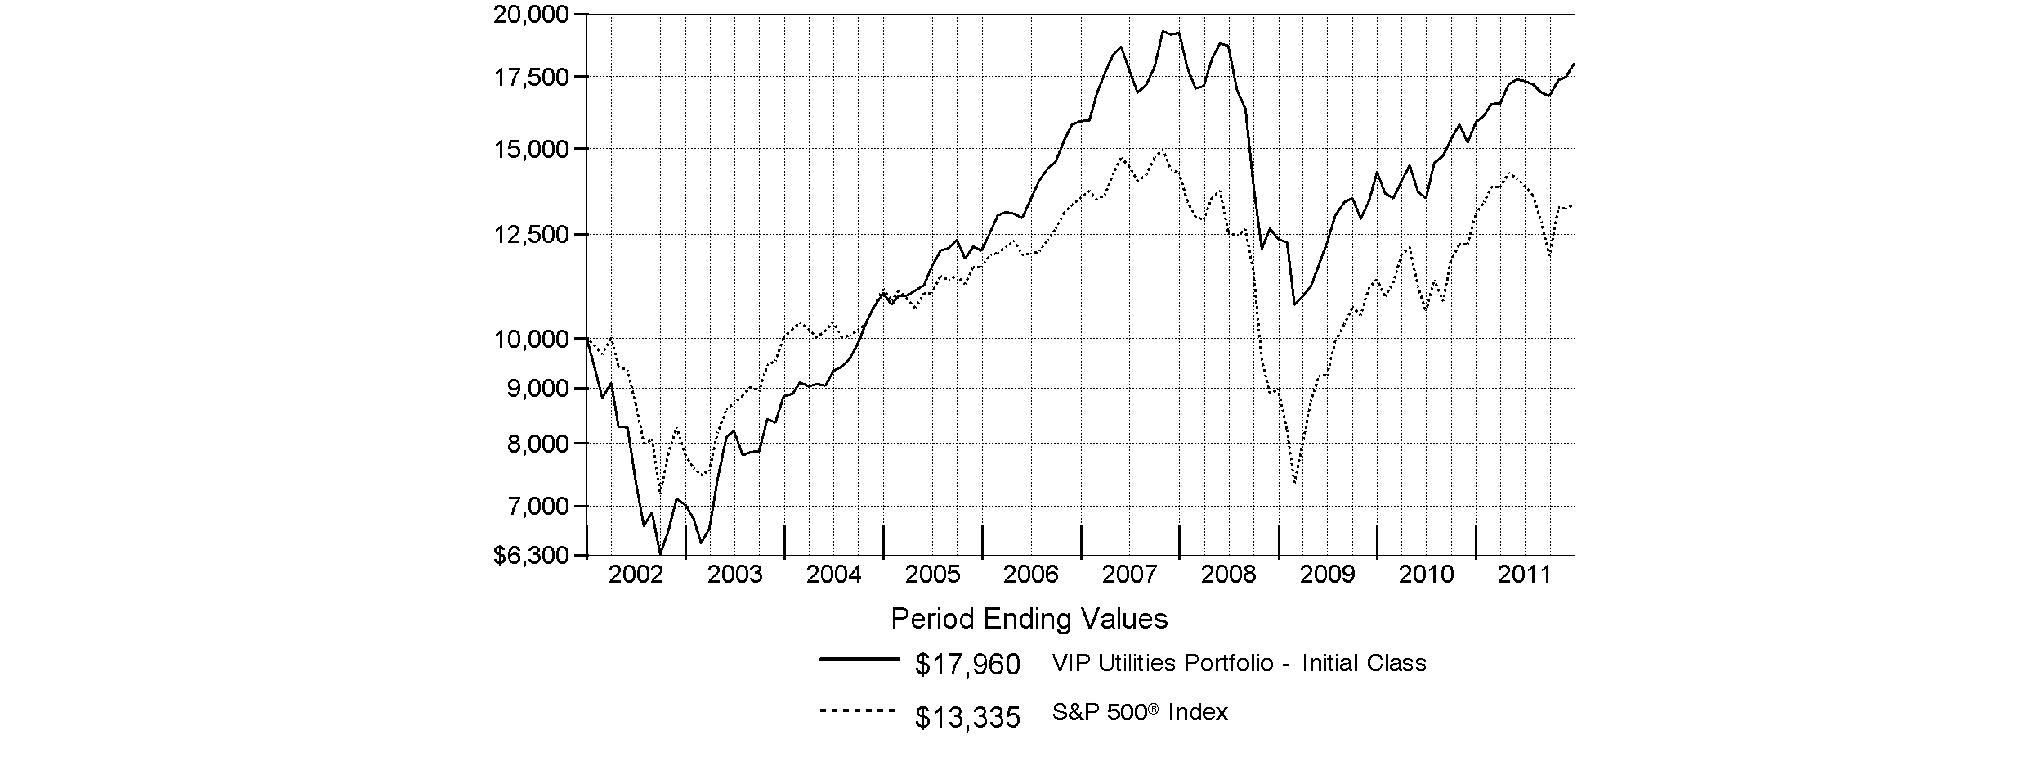
Annual Report
Market Recap: Extreme market volatility took center stage during the 12 months ending December 31, 2011, stealing the spotlight from signs of progress in the global economy. Early in the year, aggressive monetary stimulus by the U.S. federal government, improving credit-market conditions and solid corporate earnings buoyed most major asset classes. As the period progressed, however, fresh worries about sovereign debt in Europe, inflation in China, gridlock over raising the debt ceiling in the U.S. - along with Standard & Poor's early-August downgrade of the nation's long-term sovereign credit rating - and a dimmed outlook for global growth punctured investor confidence and ignited market instability. Domestic equities, as measured by the broad-based S&P 500® Index, gained 2.11%, easily outpacing the 13.61% decline of MSCI® ACWI® (All Country World Index) ex USA Index, a proxy for foreign stocks. Within the MSCI index, emerging markets declined the most (-18%), with investments here generally held back by a stronger U.S. dollar. The U.K. (-3%) fared better than the rest of Europe (-15%), which was the second-worst-performing index component. Bolstered by periodic flights to quality, U.S. investment-grade bonds posted a 7.84% advance, as reflected by the Barclays Capital® U.S. Aggregate Bond Index, outperforming the 4.37% gain of high-yield securities, as represented by The BofA Merrill LynchSM US High Yield Constrained Index. Hampered by financial woes in Europe, the sovereign debt of major developed markets outside the U.S. rose 4.86%, according to the Citigroup® Non-USD Group-of-Seven (G7) Equal Weighted Index, while the JPMorgan Emerging Markets Bond Index Global (EMBI Global) advanced 8.46%, despite the currency head wind.
Comments from Douglas Simmons, Portfolio Manager of VIP Utilities Portfolio: For the year, the fund's share classes significantly underperformed the 19.12% return of the MSCI® U.S. IM Utilities 25/50 Index, but handily topped the S&P 500®. (For specific portfolio results, please refer to the performance section of this report.) Versus the MSCI index, the fund was hurt the most by stock selection in electric utilities and by an overweighting in independent power/energy trade, although the latter was somewhat offset by good security selection here. Below-index returns from our multi-utilities holdings also meaningfully hampered results. Notable individual detractors included an untimely overweighting of Ohio-based electric utility FirstEnergy; a small, short-lived, out-of-benchmark investment in Tokyo Electric Power, not held at period end; international power infrastructure provider AES, with headquarters in Virginia; and untimely ownership of Pennsylvania electric utility PPL, which was sold from the fund before period end. Conversely, the fund was helped by positive positioning in gas utilities, with Oklahoma-based gas utility and pipeline company ONEOK the top individual contributor. ONEOK was sold from the fund before period end. Overweighting high-voltage transmission company ITC Holdings also boosted performance, while the share price of Maryland-based independent power producer Constellation Energy Group rose in response to the April announcement of its still-pending acquisition by Exelon, also a fund holding.
The views expressed above reflect those of the portfolio manager(s) only through the end of the period as stated on the cover of this report and do not necessarily represent the views of Fidelity or any other person in the Fidelity organization. Any such views are subject to change at any time based upon market or other conditions and Fidelity disclaims any responsibility to update such views. These views may not be relied on as investment advice and, because investment decisions for a Fidelity fund are based on numerous factors, may not be relied on as an indication of trading intent on behalf of any Fidelity fund.
Annual Report
As a shareholder of the Fund, you incur two types of costs: (1) transaction costs, including redemption fees, and (2) ongoing costs, including management fees and other Fund expenses. This Example is intended to help you understand your ongoing costs (in dollars) of investing in the Fund and to compare these costs with the ongoing costs of investing in other mutual funds.
The Example is based on an investment of $1,000 invested at the beginning of the period and held for the entire period (July 1, 2011 to December 31, 2011).
Actual Expenses
The first line of the accompanying table for each class of the Fund provides information about actual account values and actual expenses. You may use the information in this line, together with the amount you invested, to estimate the expenses that you paid over the period. Simply divide your account value by $1,000.00 (for example, an $8,600 account value divided by $1,000.00 = 8.6), then multiply the result by the number in the first line for a class of the Fund under the heading entitled "Expenses Paid During Period" to estimate the expenses you paid on your account during this period. The estimate of expenses does not include any fees or other expenses of any variable annuity or variable life insurance product. If they were, the estimate of expenses you paid during the period would be higher, and your ending account value would be lower. In addition, the Fund, as a shareholder in the underlying Fidelity Central Funds, will indirectly bear its pro-rata share of the fees and expenses incurred by the underlying Fidelity Central Funds. These fees and expenses are not included in the Fund's annualized expense ratio used to calculate the expense estimate in the table below.
Hypothetical Example for Comparison Purposes
The second line of the accompanying table for each class of the Fund provides information about hypothetical account values and hypothetical expenses based on a Class' actual expense ratio and an assumed rate of return of 5% per year before expenses, which is not the Class' actual return. The hypothetical account values and expenses may not be used to estimate the actual ending account balance or expenses you paid for the period. You may use this information to compare the ongoing costs of investing in the Fund and other funds. To do so, compare this 5% hypothetical example with the 5% hypothetical examples that appear in the shareholder reports of the other funds. The estimate of expenses does not include any fees or other expenses of any variable annuity or variable life insurance product. If they were, the estimate of expenses you paid during the period would be higher, and your ending account value would be lower. In addition, the Fund, as a shareholder in the underlying Fidelity Central Funds, will indirectly bear its pro-rata share of the fees and expenses incurred by the underlying Fidelity Central Funds. These fees and expenses are not included in the Fund's annualized expense ratio used to calculate the expense estimate in the table below.
Please note that the expenses shown in the table are meant to highlight your ongoing costs only and do not reflect any transaction costs. Therefore, the second line of the table is useful in comparing ongoing costs only, and will not help you determine the relative total costs of owning different funds. In addition, if these transactional costs were included, your costs would have been higher.
| Annualized
Expense Ratio | Beginning
Account Value
July 1, 2011 | Ending
Account Value
December 31, 2011 | Expenses Paid
During Period*
July 1, 2011 to
December 31, 2011 |
Initial Class | .77% | | | |
Actual | | $ 1,000.00 | $ 1,037.20 | $ 3.95 |
Hypothetical A | | $ 1,000.00 | $ 1,021.32 | $ 3.92 |
Investor Class | .86% | | | |
Actual | | $ 1,000.00 | $ 1,037.00 | $ 4.42 |
Hypothetical A | | $ 1,000.00 | $ 1,020.87 | $ 4.38 |
A 5% return per year before expenses
* Expenses are equal to each Class' annualized expense ratio, multiplied by the average account value over the period, multiplied by 184/365 (to reflect the one-half year period).
Annual Report
Investment Changes (Unaudited)
Top Ten Stocks as of December 31, 2011 |
| % of fund's
net assets | % of fund's net assets
6 months ago |
Duke Energy Corp. | 10.5 | 0.0 |
Dominion Resources, Inc. | 10.0 | 0.0 |
FirstEnergy Corp. | 7.8 | 6.7 |
Edison International | 7.5 | 6.9 |
Sempra Energy | 5.3 | 4.6 |
Exelon Corp. | 5.0 | 11.4 |
Southern Co. | 4.5 | 0.0 |
Progress Energy, Inc. | 4.5 | 0.0 |
Constellation Energy Group, Inc. | 4.5 | 4.8 |
NiSource, Inc. | 4.3 | 0.3 |
| 63.9 | |
Top Industries (% of fund's net assets) |
As of December 31, 2011 |
| Electric Utilities | 45.1% | |
| Multi-Utilities | 31.8% | |
| Independent Power Producers & Energy Traders | 11.6% | |
| Oil, Gas & Consumable Fuels | 3.3% | |
| Gas Utilities | 1.2% | |
| All Others* | 7.0% | |

As of June 30, 2011 |
| Electric Utilities | 49.4% | |
| Multi-Utilities | 22.0% | |
| Independent Power Producers & Energy Traders | 19.6% | |
| Gas Utilities | 5.8% | |
| Oil, Gas & Consumable Fuels | 1.7% | |
| All Others* | 1.5% | |

* Includes short-term investments and net other assets. |
Annual Report
Investments December 31, 2011
Showing Percentage of Net Assets
Common Stocks - 93.0% |
| Shares | | Value |
ELECTRIC UTILITIES - 45.1% |
Electric Utilities - 45.1% |
Duke Energy Corp. | 361,742 | | $ 7,958,322 |
Edison International | 136,538 | | 5,652,673 |
Entergy Corp. | 17,100 | | 1,249,155 |
Exelon Corp. | 87,584 | | 3,798,518 |
FirstEnergy Corp. | 133,245 | | 5,902,754 |
ITC Holdings Corp. | 15,406 | | 1,169,007 |
NextEra Energy, Inc. | 27,109 | | 1,650,396 |
Progress Energy, Inc. | 60,800 | | 3,406,016 |
Southern Co. | 73,956 | | 3,423,423 |
| | 34,210,264 |
GAS UTILITIES - 1.2% |
Gas Utilities - 1.2% |
National Fuel Gas Co. | 16,507 | | 917,459 |
INDEPENDENT POWER PRODUCERS & ENERGY TRADERS - 11.6% |
Independent Power Producers & Energy Traders - 11.6% |
Calpine Corp. (a) | 136,833 | | 2,234,483 |
Constellation Energy Group, Inc. | 85,253 | | 3,381,987 |
GenOn Energy, Inc. (a) | 94,724 | | 247,230 |
The AES Corp. (a) | 245,865 | | 2,911,042 |
| | 8,774,742 |
MULTI-UTILITIES - 31.8% |
Multi-Utilities - 31.8% |
Ameren Corp. | 21,889 | | 725,183 |
CenterPoint Energy, Inc. | 161,417 | | 3,242,868 |
Dominion Resources, Inc. | 142,664 | | 7,572,605 |
NiSource, Inc. | 137,400 | | 3,271,494 |
OGE Energy Corp. | 38,997 | | 2,211,520 |
PG&E Corp. | 21,700 | | 894,474 |
Public Service Enterprise Group, Inc. | 64,938 | | 2,143,603 |
Sempra Energy | 73,041 | | 4,017,255 |
| | 24,079,002 |
|
| Shares | | Value |
OIL, GAS & CONSUMABLE FUELS - 3.3% |
Oil & Gas Refining & Marketing - 0.9% |
Sunoco, Inc. | 17,700 | | $ 726,054 |
Oil & Gas Storage & Transport - 2.4% |
El Paso Corp. | 43,168 | | 1,146,974 |
Williams Companies, Inc. | 20,300 | | 670,306 |
| | 1,817,280 |
TOTAL OIL, GAS & CONSUMABLE FUELS | | 2,543,334 |
TOTAL COMMON STOCKS (Cost $64,752,123) |
70,524,801
|
Money Market Funds - 5.7% |
| | | |
Fidelity Cash Central Fund, 0.11% (b)
(Cost $4,315,890) | 4,315,890 | |
4,315,890
|
TOTAL INVESTMENT PORTFOLIO - 98.7% (Cost $69,068,013) | | 74,840,691 |
NET OTHER ASSETS (LIABILITIES) - 1.3% | | 978,490 |
NET ASSETS - 100% | $ 75,819,181 |
Legend |
(a) Non-income producing |
(b) Affiliated fund that is available only to investment companies and other accounts managed by Fidelity Investments. The rate quoted is the annualized seven-day yield of the fund at period end. A complete unaudited listing of the fund's holdings as of its most recent quarter end is available upon request. In addition, each Fidelity Central Fund's financial statements, which are not covered by the Fund's Report of Independent Registered Public Accounting Firm, are available on the SEC's website or upon request. |
Affiliated Central Funds |
Information regarding fiscal year to date income earned by the Fund from investments in Fidelity Central Funds is as follows: |
Fund | Income earned |
Fidelity Cash Central Fund | $ 1,493 |
Fidelity Securities Lending Cash Central Fund | 2,556 |
Total | $ 4,049 |
Other Information |
All investments are categorized as Level 1 under the Fair Value Hierarchy. The inputs or methodology used for valuing securities may not be an indication of the risk associated with investing in those securities. For more information on valuation inputs, please refer to the Security Valuation section in the accompanying Notes to Financial Statements. |
See accompanying notes which are an integral part of the financial statements.
Annual Report
Statement of Assets and Liabilities
| December 31, 2011 |
Assets | | |
Investment in securities, at value - See accompanying schedule: Unaffiliated issuers (cost $64,752,123) | $ 70,524,801 | |
Fidelity Central Funds (cost $4,315,890) | 4,315,890 | |
Total Investments (cost $69,068,013) | | $ 74,840,691 |
Receivable for fund shares sold | | 920,495 |
Dividends receivable | | 130,064 |
Distributions receivable from Fidelity Central Funds | | 591 |
Prepaid expenses | | 136 |
Other receivables | | 978 |
Total assets | | 75,892,955 |
| | |
Liabilities | | |
Payable for fund shares redeemed | $ 2 | |
Accrued management fee | 32,313 | |
Transfer agent fee payable | 6,799 | |
Other affiliated payables | 2,247 | |
Other payables and accrued expenses | 32,413 | |
Total liabilities | | 73,774 |
| | |
Net Assets | | $ 75,819,181 |
Net Assets consist of: | | |
Paid in capital | | $ 79,316,687 |
Undistributed net investment income | | 13,726 |
Accumulated undistributed net realized gain (loss) on investments and foreign currency transactions | | (9,283,910) |
Net unrealized appreciation (depreciation) on investments | | 5,772,678 |
Net Assets | | $ 75,819,181 |
Statement of Assets and Liabilities - continued
| December 31, 2011 |
Initial Class:
Net Asset Value, offering price and redemption price per share ($28,859,162 ÷ 2,641,223 shares) | | $ 10.93 |
| | |
Investor Class:
Net Asset Value, offering price and redemption price per share ($46,960,019 ÷ 4,315,885 shares) | | $ 10.88 |
See accompanying notes which are an integral part of the financial statements.
Annual Report
Financial Statements - continued
Statement of Operations
| Year ended December 31, 2011 |
Investment Income | | |
Dividends | | $ 1,688,971 |
Income from Fidelity Central Funds | | 4,049 |
Total income | | 1,693,020 |
| | |
Expenses | | |
Management fee | $ 270,343 | |
Transfer agent fees | 63,380 | |
Accounting and security lending fees | 18,927 | |
Custodian fees and expenses | 10,309 | |
Independent trustees' compensation | 264 | |
Audit | 44,200 | |
Legal | 150 | |
Miscellaneous | 400 | |
Total expenses before reductions | 407,973 | |
Expense reductions | (11,409) | 396,564 |
Net investment income (loss) | | 1,296,456 |
Realized and Unrealized Gain (Loss) Net realized gain (loss) on: | | |
Investment securities: | | |
Unaffiliated issuers | 2,080,093 | |
Foreign currency transactions | (1,474) | |
Total net realized gain (loss) | | 2,078,619 |
Change in net unrealized appreciation (depreciation) on: Investment securities | 3,031,967 | |
Assets and liabilities in foreign currencies | (246) | |
Total change in net unrealized appreciation (depreciation) | | 3,031,721 |
Net gain (loss) | | 5,110,340 |
Net increase (decrease) in net assets resulting from operations | | $ 6,406,796 |
Statement of Changes in Net Assets
| Year ended
December 31, 2011 | Year ended
December 31, 2010 |
Increase (Decrease) in Net Assets | | |
Operations | | |
Net investment income (loss) | $ 1,296,456 | $ 1,033,539 |
Net realized gain (loss) | 2,078,619 | 3,586,017 |
Change in net unrealized appreciation (depreciation) | 3,031,721 | (708,115) |
Net increase (decrease) in net assets resulting from operations | 6,406,796 | 3,911,441 |
Distributions to shareholders from net investment income | (1,279,431) | (1,110,975) |
Share transactions - net increase (decrease) | 29,796,788 | (2,560,920) |
Redemption fees | 13,254 | 31,911 |
Total increase (decrease) in net assets | 34,937,407 | 271,457 |
| | |
Net Assets | | |
Beginning of period | 40,881,774 | 40,610,317 |
End of period (including undistributed net investment income of $13,726 and distributions in excess of net investment income of $1,826, respectively) | $ 75,819,181 | $ 40,881,774 |
See accompanying notes which are an integral part of the financial statements.
Annual Report
Financial Highlights - Initial Class
Years ended December 31, | 2011 | 2010 | 2009 | 2008 | 2007 |
Selected Per-Share Data | | | | | |
Net asset value, beginning of period | $ 9.84 | $ 9.10 | $ 8.14 | $ 13.09 | $ 11.29 |
Income from Investment Operations | | | | | |
Net investment income (loss) C | .28 | .26 | .25 | .20 | .21 |
Net realized and unrealized gain (loss) | 1.01 | .75 | 1.01 | (4.86) | 2.12 |
Total from investment operations | 1.29 | 1.01 | 1.26 | (4.66) | 2.33 |
Distributions from net investment income | (.20) | (.28) | (.30) | (.26) | (.25) |
Distributions from net realized gain | - | - | - | (.03) | (.29) |
Total distributions | (.20) | (.28) | (.30) | (.29) | (.54) |
Redemption fees added to paid in capital C | - G | .01 | - G | - G | .01 |
Net asset value, end of period | $ 10.93 | $ 9.84 | $ 9.10 | $ 8.14 | $ 13.09 |
Total Return A,B | 13.20% | 11.20% | 15.42% | (35.61)% | 20.67% |
Ratios to Average Net Assets D,F | | | | | |
Expenses before reductions | .80% | .82% | .81% | .75% | .73% |
Expenses net of fee waivers, if any | .79% | .81% | .81% | .75% | .73% |
Expenses net of all reductions | .77% | .78% | .79% | .74% | .73% |
Net investment income (loss) | 2.72% | 2.75% | 3.13% | 1.81% | 1.65% |
Supplemental Data | | | | | |
Net assets, end of period (000 omitted) | $ 28,859 | $ 21,142 | $ 24,159 | $ 31,760 | $ 84,105 |
Portfolio turnover rate E | 174% | 249% | 219% | 112% | 90% |
A Total returns do not reflect charges attributable to your insurance company's separate account. Inclusion of these charges would reduce the total returns shown.
B Total returns would have been lower if certain expenses had not been reduced during the applicable periods shown.
C Calculated based on average shares outstanding during the period.
D Fees and expenses of any underlying Fidelity Central Funds are not included in the Fund's expense ratio. The Fund indirectly bears its proportionate share of the expenses of any underlying Fidelity Central Funds.
E Amount does not include the portfolio activity of any underlying Fidelity Central Funds.
F Expense ratios reflect operating expenses of the class. Expenses before reductions do not reflect amounts reimbursed by the investment adviser or reductions from brokerage service arrangements or reductions from other expense offset arrangements and do not represent the amount paid by the class during periods when reimbursements or reductions occur. Expenses net of fee waivers reflect expenses after reimbursement by the investment adviser but prior to reductions from brokerage service arrangements or other expense offset arrangements. Expenses net of all reductions represent the net expenses paid by the class.
G Amount represents less than $.01 per share.
Financial Highlights - Investor Class
Years ended December 31, | 2011 | 2010 | 2009 | 2008 | 2007 |
Selected Per-Share Data | | | | | |
Net asset value, beginning of period | $ 9.80 | $ 9.07 | $ 8.12 | $ 13.05 | $ 11.26 |
Income from Investment Operations | | | | | |
Net investment income (loss) C | .27 | .25 | .25 | .19 | .19 |
Net realized and unrealized gain (loss) | 1.01 | .74 | .99 | (4.84) | 2.12 |
Total from investment operations | 1.28 | .99 | 1.24 | (4.65) | 2.31 |
Distributions from net investment income | (.20) | (.27) | (.29) | (.25) | (.24) |
Distributions from net realized gain | - | - | - | (.03) | (.29) |
Total distributions | (.20) | (.27) | (.29) | (.28) | (.53) |
Redemption fees added to paid in capital C | - G | .01 | - G | - G | .01 |
Net asset value, end of period | $ 10.88 | $ 9.80 | $ 9.07 | $ 8.12 | $ 13.05 |
Total Return A,B | 13.11% | 11.04% | 15.24% | (35.65)% | 20.53% |
Ratios to Average Net Assets D,F | | | | | |
Expenses before reductions | .88% | .91% | .92% | .84% | .84% |
Expenses net of fee waivers, if any | .88% | .90% | .92% | .84% | .84% |
Expenses net of all reductions | .85% | .87% | .90% | .84% | .84% |
Net investment income (loss) | 2.64% | 2.66% | 3.02% | 1.72% | 1.53% |
Supplemental Data | | | | | |
Net assets, end of period (000 omitted) | $ 46,960 | $ 19,740 | $ 16,452 | $ 18,518 | $ 42,196 |
Portfolio turnover rate E | 174% | 249% | 219% | 112% | 90% |
A Total returns do not reflect charges attributable to your insurance company's separate account. Inclusion of these charges would reduce the total returns shown.
B Total returns would have been lower if certain expenses had not been reduced during the applicable periods shown.
C Calculated based on average shares outstanding during the period.
D Fees and expenses of any underlying Fidelity Central Funds are not included in the Fund's expense ratio. The Fund indirectly bears its proportionate share of the expenses of any underlying Fidelity Central Funds.
E Amount does not include the portfolio activity of any underlying Fidelity Central Funds.
F Expense ratios reflect operating expenses of the class. Expenses before reductions do not reflect amounts reimbursed by the investment adviser or reductions from brokerage service arrangements or reductions from other expense offset arrangements and do not represent the amount paid by the class during periods when reimbursements or reductions occur. Expenses net of fee waivers reflect expenses after reimbursement by the investment adviser but prior to reductions from brokerage service arrangements or other expense offset arrangements. Expenses net of all reductions represent the net expenses paid by the class.
G Amount represents less than $.01 per share.
See accompanying notes which are an integral part of the financial statements.
Annual Report
Notes to Financial Statements
For the period ended December 31, 2011
1. Organization.
VIP Utilities Portfolio (the Fund) is a non-diversified fund of Variable Insurance Products Fund IV (the Trust) and is authorized to issue an unlimited number of shares. The Trust is registered under the Investment Company Act of 1940, as amended (the 1940 Act), as an open-end management investment company organized as a Massachusetts business trust. Shares of the Fund may only be purchased by insurance companies for the purpose of funding variable annuity or variable life insurance contracts. The Fund offers the following classes of shares: Initial Class shares and Investor Class. All classes have equal rights and voting privileges, except for matters affecting a single class. Investment income, realized and unrealized capital gains and losses, the common expenses of the Fund, and certain fund-level expense reductions, if any, are allocated on a pro-rata basis to each class based on the relative net assets of each class to the total net assets of the Fund. Each class differs with respect to transfer agent fees incurred. Certain expense reductions may also differ by class.
2. Investments in Fidelity Central Funds.
The Fund invests in Fidelity Central Funds, which are open-end investment companies available only to other investment companies and accounts managed by Fidelity Management & Research Company (FMR) and its affiliates. The Fund's Schedule of Investments lists each of the Fidelity Central Funds held as of period end, if any, as an investment of the Fund, but do not include the underlying holdings of each Fidelity Central Fund. As an Investing Fund, the Fund indirectly bears its proportionate share of the expenses of the underlying Fidelity Central Funds.
The Money Market Central Funds seek preservation of capital and current income and are managed by Fidelity Investments Money Management, Inc. (FIMM), an affiliate of FMR.
A complete unaudited list of holdings for each Fidelity Central Fund is available upon request or at the Securities and Exchange Commission (the SEC) web site at www.sec.gov. In addition, the financial statements of the Fidelity Central Funds, which are not covered by the Fund's Report of Independent Registered Public Accounting Firm, are available on the SEC web site or upon request.
3. Significant Accounting Policies.
The financial statements have been prepared in conformity with accounting principles generally accepted in the United States of America (GAAP), which require management to make certain estimates and assumptions at the date of the financial statements. Actual results could differ from those estimates. Subsequent events, if any, through the date that the financial statements were issued have been evaluated in the preparation of the financial statements. The following summarizes the significant accounting policies of the Fund:
Security Valuation. Investments are valued as of 4:00 p.m. Eastern time on the last calendar day of the period. The Fund uses independent pricing services approved by the Board of Trustees to value its investments. When current market prices or quotations are not readily available or reliable, valuations may be determined in good faith in accordance with procedures adopted by the Board of Trustees. Factors used in determining value may include market or security specific events. The frequency with which these procedures are used cannot be predicted and they may be utilized to a significant extent. The value used for net asset value (NAV) calculation under these procedures may differ from published prices for the same securities.
The Fund categorizes the inputs to valuation techniques used to value its investments into a disclosure hierarchy consisting of three levels as shown below:
Level 1 - quoted prices in active markets for identical investments
Level 2 - other significant observable inputs (including quoted prices for similar investments, interest rates, prepayment speeds, etc.)
Level 3 - unobservable inputs (including the Fund's own assumptions based on the best information available)
Changes in valuation techniques may result in transfers in or out of an assigned level within the disclosure hierarchy. Valuation techniques used to value the Fund's investments by major category are as follows:
Equity securities, including restricted securities, for which market quotations are readily available, are valued at the last reported sale price or official closing price as reported by an independent pricing service on the primary market or exchange on which they are traded and are categorized as Level 1 in the hierarchy. In the event there were no sales during the day or closing prices are not available, securities are valued at the last quoted bid price or may be valued using the last available price and are generally categorized as Level 2 in the hierarchy. For foreign equity securities, when significant market or security specific events arise, comparisons to the valuation of American Depositary Receipts (ADRs), futures contracts, Exchange-traded funds (ETFs) and certain indexes as well as quoted prices for similar securities are used and are categorized as Level 2 in the hierarchy in these circumstances. Utilizing these techniques may result in transfers between Level 1 and Level 2. For restricted equity securities and private placements where observable inputs are limited, assumptions about market activity and risk are used and are categorized as Level 3 in the hierarchy.
Annual Report
3. Significant Accounting Policies - continued
Security Valuation - continued
Investments in open-end mutual funds, including the Fidelity Central Funds, are valued at their closing net asset value each business day and are categorized as Level 1 in the hierarchy.
New Accounting Pronouncements. In May 2011, the Financial Accounting Standards Board issued Accounting Standard Update No. 2011-04, Fair Value Measurement (Topic 820) - Amendments to Achieve Common Fair Value Measurement and Disclosure Requirements in U.S. GAAP and IFRSs. The update is effective during interim and annual periods beginning after December 15, 2011 and will result in additional disclosure for transfers between levels as well as expanded disclosure for securities categorized as Level 3 under the fair value hierarchy.
In December 2011, the Financial Accounting Standards Board issued Accounting Standard Update No. 2011-11, Disclosures about Offsetting Assets and Liabilities. The update creates new disclosure requirements requiring entities to disclose both gross and net information for derivatives and other financial instruments that are either offset in the Statement of Assets and Liabilities or subject to an enforceable master netting arrangement or similar agreement. The disclosure requirements are effective for annual reporting periods beginning on or after January 1, 2013. Management is currently evaluating the impact of the update's adoption on the Fund's financial statement disclosures.
Foreign Currency. The Fund may use foreign currency contracts to facilitate transactions in foreign-denominated securities. Gains and losses from these transactions may arise from changes in the value of the foreign currency or if the counterparties do not perform under the contracts' terms.
Foreign-denominated assets, including investment securities, and liabilities are translated into U.S. dollars at the exchange rate at period end. Purchases and sales of investment securities, income and dividends received and expenses denominated in foreign currencies are translated into U.S. dollars at the exchange rate in effect on the transaction date.
The effects of exchange rate fluctuations on investments are included with the net realized and unrealized gain (loss) on investment securities. Other foreign currency transactions resulting in realized and unrealized gain (loss) are disclosed separately.
Investment Transactions and Income. For financial reporting purposes, the Fund's investment holdings and NAV include trades executed through the end of the last business day of the period. The NAV per share for processing shareholder transactions is calculated as of the close of business of the New York Stock Exchange (NYSE), normally 4:00 p.m. Eastern time and includes trades executed through the end of the prior business day. Gains and losses on securities sold are determined on the basis of identified cost and may include proceeds received from litigation. Dividend income is recorded on the ex-dividend date, except for certain dividends from foreign securities where the ex-dividend date may have passed, which are recorded as soon as the Fund is informed of the ex-dividend date. Non-cash dividends included in dividend income, if any, are recorded at the fair market value of the securities received. Distributions received on securities that represent a return of capital or capital gain are recorded as a reduction of cost of investments and/or as a realized gain. The Fund estimates the components of distributions received that may be considered return of capital distributions or capital gain distributions. Interest income and distributions from the Fidelity Central Funds are accrued as earned. Interest income includes coupon interest and amortization of premium and accretion of discount on debt securities. Investment income is recorded net of foreign taxes withheld where recovery of such taxes is uncertain.
Expenses. Expenses directly attributable to a fund are charged to that fund. Expenses attributable to more than one fund are allocated among the respective funds on the basis of relative net assets or other appropriate methods. Expense estimates are accrued in the period to which they relate and adjustments are made when actual amounts are known.
Income Tax Information and Distributions to Shareholders. Each year, the Fund intends to qualify as a regulated investment company, including distributing substantially all of its taxable income and realized gains under Subchapter M of the Internal Revenue Code. As a result, no provision for income taxes is required. As of December 31, 2011, the Fund did not have any unrecognized tax benefits in the financial statements; nor is the Fund aware of any tax positions for which it is reasonably possible that the total amounts of unrecognized tax benefits will significantly change in the next twelve months. The Fund files a U.S. federal tax return, in addition to state and local tax returns as required. A fund's tax returns are subject to examination by the Internal Revenue Service (IRS) for a period of three fiscal years. State and local tax returns may be subject to examination for an additional fiscal year depending on the jurisdiction. Foreign taxes are provided for based on the Fund's understanding of the tax rules and rates that exist in the foreign markets in which it invests.
Distributions are declared and recorded on the ex-dividend date. Income dividends and capital gain distributions are declared separately for each class. Income and capital gain distributions are determined in accordance with income tax regulations, which may differ from GAAP.
Capital accounts within the financial statements are adjusted for permanent book-tax differences. These adjustments have no impact on net assets or the results of operations. Temporary book-tax differences will reverse in a subsequent period.
Book-tax differences are primarily due to foreign currency transactions, capital loss carryforwards and losses deferred due to wash sales and excise tax regulations.
Annual Report
Notes to Financial Statements - continued
3. Significant Accounting Policies - continued
Income Tax Information and Distributions to Shareholders - continued
The federal tax cost of investment securities and unrealized appreciation (depreciation) as of period end were as follows:
Gross unrealized appreciation | $ 5,682,413 |
Gross unrealized depreciation | (150,228) |
Net unrealized appreciation (depreciation) on securities and other investments | $ 5,532,185 |
| |
Tax Cost | $ 69,308,506 |
The tax-based components of distributable earnings as of period end were as follows:
Undistributed ordinary income | $ 13,726 |
Capital loss carryforward | $ (9,043,416) |
Net unrealized appreciation (depreciation) | $ 5,532,185 |
Capital loss carryforwards are only available to offset future capital gains of the Fund to the extent provided by regulations and may be limited. Under the Regulated Investment Company Modernization Act of 2010 (the Act), the Fund is permitted to carry forward capital losses incurred in taxable years beginning after December 22, 2010 for an unlimited period and such capital losses are required to be used prior to any losses that expire. Capital loss carryforwards were as follows:
Fiscal year of expiration | |
2017 | $ (9,043,416) |
The tax character of distributions paid was as follows:
| December 31, 2011 | December 31, 2010 |
Ordinary Income | $ 1,279,431 | $ 1,110,975 |
Trading (Redemption) Fees. Shares held by investors less than 60 days are subject to a redemption fee equal to 1% of the net asset value of shares redeemed. All redemption fees, which reduce the proceeds of the shareholder redemption, are retained by the Fund and accounted for as an addition to paid in capital.
4. Purchases and Sales of Investments.
Purchases and sales of securities, other than short-term securities, aggregated $109,287,088 and $84,685,596, respectively.
5. Fees and Other Transactions with Affiliates.
Management Fee. FMR and its affiliates provide the Fund with investment management related services for which the Fund pays a monthly management fee. The management fee is the sum of an individual fund fee rate that is based on an annual rate of .30% of the Fund's average net assets and an annualized group fee rate that averaged .26% during the period. The group fee rate is based upon the average net assets of all the mutual funds advised by FMR. The group fee rate decreases as assets under management increase and increases as assets under management decrease. For the period, the total annual management fee rate was .56% of the Fund's average net assets.
Transfer Agent Fees. Fidelity Investments Institutional Operations Company, Inc. (FIIOC), an affiliate of FMR, is the Fund's transfer, dividend disbursing, and shareholder servicing agent. FIIOC receives an asset-based fee with respect to each class. Each class (with the exception of Investor Class) pays a transfer agent fee, excluding out of pocket expenses, equal to an annual rate of .07% of average net assets. Investor Class pays a monthly asset-based transfer agent fee of .15% of average net assets. In addition, FIIOC receives an asset-based fee of .0045% of average net assets for typesetting, printing and mailing of shareholder reports, except proxy statements. FIIOC voluntarily agreed to waive this fee for the period August 1, 2011 through December 31, 2011 (see Expense Reductions note). For the period, transfer agent fees for each class, including printing and out of pocket expenses, were as follows:
Initial Class | $ 18,753 |
Investor Class | 44,627 |
| $ 63,380 |
Annual Report
5. Fees and Other Transactions with Affiliates - continued
Accounting and Security Lending Fees. Fidelity Service Company, Inc. (FSC), an affiliate of FMR, maintains the Fund's accounting records. The accounting fee is based on the level of average net assets for the month. Under a separate contract, FSC administers the security lending program. The security lending fee is based on the number and duration of lending transactions.
Brokerage Commissions. The Fund placed a portion of its portfolio transactions with brokerage firms which are affiliates of the investment adviser. The commissions paid to these affiliated firms were $3,244 for the period.
6. Committed Line of Credit.
The Fund participates with other funds managed by FMR or an affiliate in a $4.0 billion credit facility (the "line of credit") to be utilized for temporary or emergency purposes to fund shareholder redemptions or for other short-term liquidity purposes. The Fund has agreed to pay commitment fees on its pro-rata portion of the line of credit, which amounted to $130 and is reflected in Miscellaneous expenses on the Statement of Operations. During the period, there were no borrowings on this line of credit.
7. Security Lending.
The Fund lends portfolio securities through a lending agent from time to time in order to earn additional income. For equity securities, a lending agent is used and may loan securities to certain qualified borrowers, including Fidelity Capital Markets (FCM), a broker-dealer affiliated with the Fund. On the settlement date of the loan, the Fund receives collateral (in the form of U.S. Treasury obligations, letters of credit and/or cash) against the loaned securities and maintains collateral in an amount not less than 100% of the market value of the loaned securities during the period of the loan. The market value of the loaned securities is determined at the close of business of the Fund and any additional required collateral is delivered to the Fund on the next business day. If the borrower defaults on its obligation to return the securities loaned because of insolvency or other reasons, a fund could experience delays and costs in recovering the securities loaned or in gaining access to the collateral. Any cash collateral received is invested in the Fidelity Securities Lending Cash Central Fund. At period end, there were no security loans outstanding. Security lending income represents the income earned on investing cash collateral, less rebates paid to borrowers and any lending agent fees associated with the loan, plus any premium payments received for lending certain types of securities. Security lending income is presented in the Statement of Operations as a component of income from Fidelity Central Funds. Total security lending income during the period amounted to $2,556. During the period, there were no securities loaned to FCM.
8. Expense Reductions.
FMR or its affiliates agreed to waive certain fees during the period as noted in the table below.
Initial Class | $ 479 |
Investor Class | 582 |
| $ 1,061 |
Many of the brokers with whom FMR places trades on behalf of the Fund provided services to the Fund in addition to trade execution. These services included payments of certain expenses on behalf of the Fund totaling $10,348 for the period.
9. Distributions to Shareholders.
Distributions to shareholders of each class were as follows:
Years ended December 31, | 2011 | 2010 |
From net investment income | | |
Initial Class | $ 495,790 | $ 585,861 |
Investor Class | 783,641 | 525,114 |
Total | $ 1,279,431 | $ 1,110,975 |
Annual Report
Notes to Financial Statements - continued
10. Share Transactions.
Transactions for each class of shares were as follows:
| Shares | Dollars |
Years ended December 31, | 2011 | 2010 | 2011 | 2010 |
Initial Class | | | | |
Shares sold | 969,414 | 227,625 | $ 10,288,297 | $ 2,170,873 |
Reinvestment of distributions | 47,218 | 60,212 | 495,790 | 585,861 |
Shares redeemed | (524,069) | (794,278) | (5,406,656) | (7,319,333) |
Net increase (decrease) | 492,563 | (506,441) | $ 5,377,431 | $ (4,562,599) |
Investor Class | | | | |
Shares sold | 2,732,463 | 896,575 | $ 28,737,360 | $ 8,491,867 |
Reinvestment of distributions | 74,990 | 54,135 | 783,641 | 525,114 |
Shares redeemed | (505,141) | (751,317) | (5,101,644) | (7,015,302) |
Net increase (decrease) | 2,302,312 | 199,393 | $ 24,419,357 | $ 2,001,679 |
11. Other.
The Fund's organizational documents provide former and current trustees and officers with a limited indemnification against liabilities arising in connection with the performance of their duties to the Fund. In the normal course of business, the Fund may also enter into contracts that provide general indemnifications. The Fund's maximum exposure under these arrangements is unknown as this would be dependent on future claims that may be made against the Fund. The risk of material loss from such claims is considered remote.
At the end of the period, FMR or its affiliates were owners of record of 100% of the total outstanding shares of the Fund.
Annual Report
Report of Independent Registered Public Accounting Firm
To the Trustees of Variable Insurance Products Fund IV and the Shareholders of VIP Utilities Portfolio:
In our opinion, the accompanying statement of assets and liabilities, including the schedule of investments, and the related statements of operations and of changes in net assets and the financial highlights present fairly, in all material respects, the financial position of VIP Utilities Portfolio (a fund of Variable Insurance Products Fund IV) at December 31, 2011, the results of its operations for the year then ended, the changes in its net assets for each of the two years in the period then ended and the financial highlights for each of the five years in the period then ended, in conformity with accounting principles generally accepted in the United States of America. These financial statements and financial highlights (hereafter referred to as "financial statements") are the responsibility of the VIP Utilities Portfolio's management. Our responsibility is to express an opinion on these financial statements based on our audits. We conducted our audits of these financial statements in accordance with the standards of the Public Company Accounting Oversight Board (United States). Those standards require that we plan and perform the audit to obtain reasonable assurance about whether the financial statements are free of material misstatement. An audit includes examining, on a test basis, evidence supporting the amounts and disclosures in the financial statements, assessing the accounting principles used and significant estimates made by management, and evaluating the overall financial statement presentation. We believe that our audits, which included confirmation of securities at December 31, 2011 by correspondence with the custodian and brokers, provide a reasonable basis for our opinion.
/s/ PricewaterhouseCoopers LLP
PricewaterhouseCoopers LLP
Boston, Massachusetts
February 14, 2012
Annual Report
The Trustees, Members of the Advisory Board, and executive officers of the trust and fund, as applicable, are listed below. The Board of Trustees governs the fund and is responsible for protecting the interests of shareholders. The Trustees are experienced executives who meet periodically throughout the year to oversee the fund's activities, review contractual arrangements with companies that provide services to the fund, oversee management of the risks associated with such activities and contractual arrangements, and review the fund's performance. Except for James C. Curvey, each of the Trustees oversees 226 funds advised by FMR or an affiliate. Mr. Curvey oversees 429 funds advised by FMR or an affiliate.
The Trustees hold office without limit in time except that (a) any Trustee may resign; (b) any Trustee may be removed by written instrument, signed by at least two-thirds of the number of Trustees prior to such removal; (c) any Trustee who requests to be retired or who has become incapacitated by illness or injury may be retired by written instrument signed by a majority of the other Trustees; and (d) any Trustee may be removed at any special meeting of shareholders by a two-thirds vote of the outstanding voting securities of the trust. Each Trustee who is not an interested person (as defined in the 1940 Act) (Independent Trustee), shall retire not later than the last day of the calendar year in which his or her 75th birthday occurs. The Independent Trustees may waive this mandatory retirement age policy with respect to individual Trustees. The executive officers and Advisory Board Members hold office without limit in time, except that any officer and Advisory Board Member may resign or may be removed by a vote of a majority of the Trustees at any regular meeting or any special meeting of the Trustees. Except as indicated, each individual has held the office shown or other offices in the same company for the past five years.
Experience, Skills, Attributes, and Qualifications of the Fund's Trustees. The Governance and Nominating Committee has adopted a statement of policy that describes the experience, qualifications, attributes, and skills that are necessary and desirable for potential Independent Trustee candidates (Statement of Policy). The Board believes that each Trustee satisfied at the time he or she was initially elected or appointed a Trustee, and continues to satisfy, the standards contemplated by the Statement of Policy. The Governance and Nominating Committee also engages professional search firms to help identify potential Independent Trustee candidates who have the experience, qualifications, attributes, and skills consistent with the Statement of Policy. From time to time, additional criteria based on the composition and skills of the current Independent Trustees, as well as experience or skills that may be appropriate in light of future changes to board composition, business conditions, and regulatory or other developments, have also been considered by the professional search firms and the Governance and Nominating Committee. In addition, the Board takes into account the Trustees' commitment and participation in Board and committee meetings, as well as their leadership of standing and ad hoc committees throughout their tenure.
In determining that a particular Trustee was and continues to be qualified to serve as a Trustee, the Board has considered a variety of criteria, none of which, in isolation, was controlling. The Board believes that, collectively, the Trustees have balanced and diverse experience, qualifications, attributes, and skills, which allow the Board to operate effectively in governing the fund and protecting the interests of shareholders. Information about the specific experience, skills, attributes, and qualifications of each Trustee, which in each case led to the Board's conclusion that the Trustee should serve (or continue to serve) as a trustee of the fund, is provided below.
Board Structure and Oversight Function. James C. Curvey is an interested person (as defined in the 1940 Act) and currently serves as Acting Chairman. The Trustees have determined that an interested Chairman is appropriate and benefits shareholders because an interested Chairman has a personal and professional stake in the quality and continuity of services provided to the fund. Independent Trustees exercise their informed business judgment to appoint an individual of their choosing to serve as Chairman, regardless of whether the Trustee happens to be independent or a member of management. The Independent Trustees have determined that they can act independently and effectively without having an Independent Trustee serve as Chairman and that a key structural component for assuring that they are in a position to do so is for the Independent Trustees to constitute a substantial majority for the Board. The Independent Trustees also regularly meet in executive session. Ned C. Lautenbach serves as Chairman of the Independent Trustees and as such (i) acts as a liaison between the Independent Trustees and management with respect to matters important to the Independent Trustees and (ii) with management prepares agendas for Board meetings.
Fidelity funds are overseen by different Boards of Trustees. The fund's Board oversees Fidelity's equity and high income funds and another Board oversees Fidelity's investment-grade bond, money market, and asset allocation funds. The asset allocation funds may invest in Fidelity funds overseen by the fund's Board. The use of separate Boards, each with its own committee structure, allows the Trustees of each group of Fidelity funds to focus on the unique issues of the funds they oversee, including common research, investment, and operational issues. On occasion, the separate Boards establish joint committees to address issues of overlapping consequences for the Fidelity funds overseen by each Board.
The Trustees operate using a system of committees to facilitate the timely and efficient consideration of all matters of importance to the Trustees, the fund, and fund shareholders and to facilitate compliance with legal and regulatory requirements and oversight of the fund's activities and associated risks. The Board, acting through its committees, has charged FMR and its affiliates with (i) identifying events or circumstances the occurrence of which could have demonstrably adverse effects on the fund's business and/or reputation; (ii) implementing processes and controls to lessen the possibility that such events or circumstances occur or to mitigate the effects of such events or circumstances if they do occur; and (iii) creating and maintaining a system designed to evaluate continuously business and market conditions in order to facilitate the identification and implementation processes described in (i) and (ii) above. Because the day-to-day operations and activities of the fund are carried out by or through FMR, its affiliates and other service providers, the fund's exposure to risks is mitigated but not eliminated by the processes overseen by the Trustees. While each of the Board's committees has responsibility for overseeing different aspects of the fund's activities, oversight is exercised primarily through the Operations, Audit, and Compliance Committees. In addition, the Independent Trustees have worked with FMR to enhance the Board's oversight of investment and financial risks, legal and regulatory risks, technology risks, and operational risks, including the development of additional risk reporting to the Board. For example, a working group comprised of Independent Trustees and FMR has worked and continues to work to review the Fidelity funds' valuation-related activities, reporting and risk management. Appropriate personnel, including but not limited to the fund's Chief Compliance Officer (CCO), FMR's internal auditor, the independent accountants, the fund's Treasurer and portfolio management personnel, make periodic reports to the Board's committees, as appropriate, including an annual review of FMR's risk management program for the Fidelity funds. The responsibilities of each standing committee, including their oversight responsibilities, are described further under "Standing Committees of the Fund's Trustees."
Annual Report
Trustees and Officers - continued
The fund's Statement of Additional Information (SAI) includes more information about the Trustees. To request a free copy, call Fidelity at 1-877-208-0098.
Interested Trustees*:
Correspondence intended for each Trustee who is an interested person may be sent to Fidelity Investments, 82 Devonshire Street, Boston, Massachusetts 02109.
Name, Age; Principal Occupations and Other Relevant Experience+ |
James C. Curvey (76) |
| Year of Election or Appointment: 2007 Mr. Curvey is Trustee and Acting Chairman of the Board of Trustees of certain Trusts. Mr. Curvey also serves as Trustee (2007-present) of other investment companies advised by FMR. Mr. Curvey is a Director of Fidelity Investments Money Management, Inc. (2009-present), Director of Fidelity Research & Analysis Co. (2009-present) and Director of FMR and FMR Co., Inc. (2007-present). Mr. Curvey is also Vice Chairman (2007-present) and Director of FMR LLC. In addition, Mr. Curvey serves as an Overseer for the Boston Symphony Orchestra and a member of the Trustees of Villanova University. Previously, Mr. Curvey was the Vice Chairman (2006-2007) and Director (2000-2007) of FMR Corp. |
Ronald P. O'Hanley (54) |
| Year of Election or Appointment: 2011 Mr. O'Hanley is Director of FMR Co., Inc. (2010-present), Director of Fidelity Investments Money Management, Inc. (2010-present), Director of Fidelity Research & Analysis Company (2010-present), President of Fidelity Asset Management and Corporate Services and a member of Fidelity's Executive Committee (2010-present). Previously, Mr. O'Hanley served as President and Chief Executive Officer of BNY Mellon Asset Management (2007-2010). Mr. O'Hanley also served as Vice Chairman of Bank New York Mellon Corp. and a member of that firm's Executive Committee. Prior to the 2007 merger of The Bank of New York and Mellon Financial Corporation, he was Vice Chairman of Mellon Financial Corporation and President and Chief Executive Officer of Mellon Asset Management. He joined Mellon in February 1997. Mr. O'Hanley currently serves as Chairman of the Boston Public Library Foundation Board of Directors and sits on the Board of Directors of Beth Israel Deaconess Medical Center, the Board of Trustees of the Marine Biological Laboratory and the Advisory Board of the Maxwell School of Citizenship and Public Administration at Syracuse University. Mr. O'Hanley also chairs the Council on Asset Management for the Financial Services Roundtable and is a member of the Board of Directors of Institutional Investor's U.S. Institute. |
* Trustees have been determined to be "Interested Trustees" by virtue of, among other things, their affiliation with the trust or various entities under common control with FMR.
+ The information above includes each Trustee's principal occupation during the last five years and other information relating to the experience, attributes, and skills relevant to each Trustee's qualifications to serve as a Trustee, which led to the conclusion that each Trustee should serve as a Trustee for the fund.
Independent Trustees:
Correspondence intended for each Independent Trustee (that is, the Trustees other than the Interested Trustees) may be sent to Fidelity Investments, P.O. Box 55235, Boston, Massachusetts 02205-5235.
Name, Age; Principal Occupations and Other Relevant Experience+ |
Dennis J. Dirks (63) |
| Year of Election or Appointment: 2005 Prior to his retirement in May 2003, Mr. Dirks was Chief Operating Officer and a member of the Board of The Depository Trust & Clearing Corporation (DTCC). He also served as President, Chief Operating Officer, and Board member of The Depository Trust Company (DTC) and President and Board member of the National Securities Clearing Corporation (NSCC). In addition, Mr. Dirks served as Chief Executive Officer and Board member of the Government Securities Clearing Corporation, Chief Executive Officer and Board member of the Mortgage-Backed Securities Clearing Corporation, as a Trustee and a member of the Finance Committee of Manhattan College (2005-2008), and as a Trustee and a member of the Finance Committee of AHRC of Nassau County (2006-2008). Mr. Dirks is a member of the Independent Directors Council (IDC) Governing Council (2010-present) and Board of Directors for The Brookville Center for Children's Services, Inc. (2009-present). |
Alan J. Lacy (58) |
| Year of Election or Appointment: 2008 Mr. Lacy serves as Senior Adviser (2007-present) of Oak Hill Capital Partners, L.P. (private equity). Mr. Lacy also served as Chief Executive Officer (2000-2005) and Vice Chairman (2005-2006) of Sears Holdings Corporation and Sears, Roebuck and Co. (retail). In addition, Mr. Lacy serves as a member of the Board of Directors of Dave & Buster's, Inc. (restaurant and entertainment complexes, 2010-present), The Hillman Companies, Inc. (hardware wholesalers, 2010-present), and Bristol-Myers Squibb Company (global pharmaceuticals, 2007-present). Mr. Lacy is a member of the Board of Trustees of The National Parks Conservation Association (2006-present). Previously, Mr. Lacy served as Chairman of the Board of Trustees of the National Parks Conservation Association (2008-2011) and as a member of the Board of Directors for the Western Union Company (global money transfer, 2006-2011). |
Ned C. Lautenbach (67) |
| Year of Election or Appointment: 2000 Mr. Lautenbach is Chairman of the Independent Trustees of the Equity and High Income Funds (2006-present). Mr. Lautenbach currently serves as the Lead Director of the Eaton Corporation Board of Directors (diversified industrial, 1997-present). Mr. Lautenbach is also a member of the Board of Directors of the Philharmonic Center for the Arts in Naples, Florida (1999-present); a member of the Board of Trustees of Fairfield University (2005-present); and a member of the Council on Foreign Relations (1994-present). Previously, Mr. Lautenbach was a Partner/Advisory Partner at Clayton, Dubilier & Rice, LLC (private equity investment, 1998-2010), as well as a Director of Sony Corporation (2006-2007). |
Joseph Mauriello (67) |
| Year of Election or Appointment: 2008 Prior to his retirement in January 2006, Mr. Mauriello served in numerous senior management positions including Deputy Chairman and Chief Operating Officer (2004-2005), and Vice Chairman of Financial Services (2002-2004) of KPMG LLP US (professional services, 1965-2005). Mr. Mauriello currently serves as a member of the Board of Directors of XL Group plc. (global insurance and re-insurance, 2006-present) and of Arcadia Resources Inc. (health care services and products, 2007-present). Previously, Mr. Mauriello served as a Director of the Hamilton Funds of the Bank of New York (2006-2007). |
Robert W. Selander (61) |
| Year of Election or Appointment: 2011 Previously, Mr. Selander served as a Member of the Advisory Board of Fidelity's Equity and High Income Funds (2011), Executive Vice Chairman (2010), Chief Executive Officer (2009-2010), and President and Chief Executive Officer (1997-2009) of Mastercard, Inc. |
Cornelia M. Small (67) |
| Year of Election or Appointment: 2005 Ms. Small is a member of the Board of Directors of the Teagle Foundation (2009-present). Ms. Small is also a member of the Investment Committee, and Chair (2008-present) and a member of the Board of Trustees of Smith College. In addition, Ms. Small serves on the Investment Committee of the Berkshire Taconic Community Foundation (2008-present). Previously, Ms. Small served as Chairperson of the Investment Committee (2002-2008) of Smith College. In addition, Ms. Small served as Chief Investment Officer, Director of Global Equity Investments, and a member of the Board of Directors of Scudder, Stevens & Clark and Scudder Kemper Investments. |
William S. Stavropoulos (72) |
| Year of Election or Appointment: 2001 Mr. Stavropoulos is Vice Chairman of the Independent Trustees of the Equity and High Income Funds (2006-present). Mr. Stavropoulos serves as President and Founder of the Michigan Baseball Foundation, the Great Lakes Loons (2007-present). Mr. Stavropoulos is Chairman Emeritus of the Board of Directors of The Dow Chemical Company, where he previously served in numerous senior management positions, including President, CEO (1995-2000; 2002-2004), Chairman of the Executive Committee (2000-2006), and as a member of the Board of Directors (1990-2006). Currently, Mr. Stavropoulos is Chairman of Univar (global distributor of commodity and specialty chemicals, 2010-present), a Director of Teradata Corporation (data warehousing and technology solutions, 2008-present), Chemical Financial Corporation, Maersk Inc. (industrial conglomerate), Tyco International, Inc. (multinational manufacturing and services, 2007-present), and a member of the Advisory Board for Metalmark Capital (private equity investment, 2005-present). Mr. Stavropoulos is a special advisor to Clayton, Dubilier & Rice, LLC (private equity investment). In addition, Mr. Stavropoulos is a member of the University of Notre Dame Advisory Council for the College of Science. |
David M. Thomas (62) |
| Year of Election or Appointment: 2008 Previously, Mr. Thomas served as Executive Chairman (2005-2006) and Chairman and Chief Executive Officer (2000-2005) of IMS Health, Inc. (pharmaceutical and healthcare information solutions). In addition, Mr. Thomas serves as a member of the Board of Directors of Fortune Brands, Inc. (consumer products), and Interpublic Group of Companies, Inc. (marketing communication, 2004-present). |
Michael E. Wiley (61) |
| Year of Election or Appointment: 2008 Mr. Wiley also serves as a Director of Asia Pacific Exploration Consolidated (international oil and gas exploration and production, 2008-present). Mr. Wiley serves as a Director of Tesoro Corporation (independent oil refiner and marketer, 2005-present), and a Director of Bill Barrett Corporation (exploration and production, 2005-present). In addition, Mr. Wiley also serves as a Director of Post Oak Bank (privately-held bank, 2004-present). Previously, Mr. Wiley served as a member of the Board of Trustees of the University of Tulsa (2000-2006; 2007-2010), as a Senior Energy Advisor of Katzenbach Partners, LLC (consulting, 2006-2007), as an Advisory Director of Riverstone Holdings (private investment), Chairman, President, and CEO of Baker Hughes, Inc. (oilfield services, 2000-2004), and as Director of Spinnaker Exploration Company (exploration and production, 2001-2005). |
+ The information above includes each Trustee's principal occupation during the last five years and other information relating to the experience, attributes, and skills relevant to each Trustee's qualifications to serve as a Trustee, which led to the conclusion that each Trustee should serve as a Trustee for the fund.
Advisory Board Members and Executive Officers:
Correspondence intended for each executive officer, Edward C. Johnson 3d, and Peter S. Lynch may be sent to Fidelity Investments, 82 Devonshire Street, Boston, Massachusetts 02109.
Name, Age; Principal Occupation |
Edward C. Johnson 3d (81) |
| Year of Election or Appointment: 2011 Member of the Advisory Board of Fidelity's Equity and High Income Funds. Mr. Johnson serves as Chief Executive Officer, Chairman, and a Director of FMR LLC, and also serves as Chairman and Director of FIL Limited. Previously, Mr. Johnson served as a Trustee and Chairman of the Board of certain Fidelity Trusts, Chairman and a Director of FMR, Chairman and a Director of FMR Co., Inc., and President of FMR LLC (2006-2007). |
Peter S. Lynch (67) |
| Year of Election or Appointment: 2003 Member of the Advisory Board of Fidelity's Equity and High Income Funds. Mr. Lynch is Vice Chairman and a Director of FMR and FMR Co., Inc. In addition, Mr. Lynch serves as a Trustee of Boston College and as the Chairman of the Inner-City Scholarship Fund. Previously, Mr. Lynch served on the Special Olympics International Board of Directors (1997-2006). |
Kenneth B. Robins (42) |
| Year of Election or Appointment: 2008 President and Treasurer of Fidelity's Equity and High Income Funds. Mr. Robins also serves as President and Treasurer (2010-present) and Assistant Treasurer (2009-present) of other Fidelity funds and is an employee of Fidelity Investments (2004-present). Previously, Mr. Robins served as Deputy Treasurer of the Fidelity funds (2005-2008) and Treasurer and Chief Financial Officer of The North Carolina Capital Management Trust: Cash and Term Portfolios (2006-2008). |
Brian B. Hogan (47) |
| Year of Election or Appointment: 2009 Vice President of Equity and High Income Funds. Mr. Hogan also serves as President of FMR's Equity Division (2009-present). Previously, Mr. Hogan served as Senior Vice President, Equity Research of FMR (2006-2009) and as a portfolio manager. |
Christopher S. Bartel (40) |
| Year of Election or Appointment: 2009 Vice President of Fidelity's Sector and Real Estate Equity Funds. Mr. Bartel also serves as Senior Vice President of Equity Research (2009-present). Previously, Mr. Bartel served as Managing Director of Research (2006-2009) and an analyst and portfolio manager (2000-2006). |
Scott C. Goebel (43) |
| Year of Election or Appointment: 2008 Secretary and Chief Legal Officer (CLO) of the Fidelity funds. Mr. Goebel also serves as Secretary of Fidelity Investments Money Management, Inc. (FIMM) (2010-present) and Fidelity Research and Analysis Company (FRAC) (2010-present); Secretary and CLO of The North Carolina Capital Management Trust: Cash and Term Portfolios (2008-present); General Counsel, Secretary, and Senior Vice President of FMR (2008-present) and FMR Co., Inc. (2008-present); employed by FMR LLC or an affiliate (2001-present); Chief Legal Officer of Fidelity Management & Research (Hong Kong) Limited (2008-present) and Assistant Secretary of Fidelity Management & Research (Japan) Inc. (2008-present), and Fidelity Management & Research (U.K.) Inc. (2008-present). Previously, Mr. Goebel served as Assistant Secretary of FIMM (2008-2010), FRAC (2008-2010), and the Funds (2007-2008) and as Vice President and Secretary of Fidelity Distributors Corporation (FDC) (2005-2007). |
William C. Coffey (42) |
| Year of Election or Appointment: 2009 Assistant Secretary of Fidelity's Equity and High Income Funds. Mr. Coffey also serves as Senior Vice President and Deputy General Counsel of FMR LLC (2010-present), and is an employee of Fidelity Investments. Previously, Mr. Coffey served as Vice President and Associate General Counsel of FMR LLC (2005-2009). |
Holly C. Laurent (57) |
| Year of Election or Appointment: 2008 Anti-Money Laundering (AML) Officer of the Fidelity funds. Ms. Laurent also serves as AML Officer of The North Carolina Capital Management Trust: Cash and Term Portfolios (2008-present) and is an employee of Fidelity Investments. Previously, Ms. Laurent was Senior Vice President and Head of Legal for Fidelity Business Services India Pvt. Ltd. (2006-2008), and Senior Vice President, Deputy General Counsel and Group Head for FMR LLC (2005-2006). |
Christine Reynolds (53) |
| Year of Election or Appointment: 2008 Chief Financial Officer of the Fidelity funds. Ms. Reynolds became President of Fidelity Pricing and Cash Management Services (FPCMS) in August 2008. Ms. Reynolds served as Chief Operating Officer of FPCMS (2007-2008). Previously, Ms. Reynolds served as President, Treasurer, and Anti-Money Laundering officer of the Fidelity funds (2004-2007). |
Kenneth A. Rathgeber (64) |
| Year of Election or Appointment: 2004 Chief Compliance Officer of Fidelity's Equity and High Income Funds. Mr. Rathgeber is Chief Compliance Officer of Fidelity Management & Research (Hong Kong) Limited (2008-present), Fidelity Management & Research (Japan) Inc. (2008-present), FMR (2005-present), FMR Co., Inc. (2005-present), Fidelity Management & Research (U.K.) Inc. (2005-present), Fidelity Research & Analysis Company (2005-present), Fidelity Investments Money Management, Inc. (2005-present), Pyramis Global Advisors, LLC (2005-present), and Strategic Advisers, Inc. (2005-present). |
Jeffrey S. Christian (50) |
| Year of Election or Appointment: 2009 Deputy Treasurer of the Fidelity funds. Mr. Christian is an employee of Fidelity Investments. Previously, Mr. Christian served as Chief Financial Officer (2008-2009) of certain Fidelity funds and Senior Vice President of Fidelity Pricing and Cash Management Services (FPCMS) (2004-2009). |
Joseph F. Zambello (54) |
| Year of Election or Appointment: 2011 Deputy Treasurer of the Fidelity funds. Mr. Zambello is an employee of Fidelity Investments. Previously, Mr. Zambello served as Vice President of FMR's Program Management Group (2009-2011) and Vice President of the Transfer Agent Oversight Group (2005-2009). |
Adrien E. Deberghes (44) |
| Year of Election or Appointment: 2008 Deputy Treasurer of Fidelity's Equity and High Income Funds. Mr. Deberghes also serves as Vice President and Assistant Treasurer of Fidelity Rutland Square Trust II and Fidelity Commonwealth Trust II (2011-present), Assistant Treasurer of other Fidelity funds (2010-present), and is an employee of Fidelity Investments (2008-present). Previously, Mr. Deberghes served as Senior Vice President of Mutual Fund Administration at State Street Corporation (2007-2008), Senior Director of Mutual Fund Administration at Investors Bank & Trust (2005-2007), and Director of Finance for Dunkin' Brands (2000-2005). |
Stephanie J. Dorsey (42) |
| Year of Election or Appointment: 2010 Assistant Treasurer of Fidelity's Equity and High Income Funds. Ms. Dorsey also serves as Deputy Treasurer of other Fidelity funds (2008-present) and is an employee of Fidelity Investments (2008-present). Previously, Ms. Dorsey served as Treasurer (2004-2008) of the JPMorgan Mutual Funds and Vice President (2004-2008) of JPMorgan Chase Bank. |
John R. Hebble (53) |
| Year of Election or Appointment: 2009 Assistant Treasurer of Fidelity's Equity and High Income Funds. Mr. Hebble also serves as President (2011-present), Treasurer, and Chief Financial Officer of The North Carolina Capital Management Trust: Cash and Term Portfolios (2008-present), President and Treasurer of other Fidelity funds (2008-present) and is an employee of Fidelity Investments. |
Gary W. Ryan (53) |
| Year of Election or Appointment: 2005 Assistant Treasurer of the Fidelity funds. Mr. Ryan is an employee of Fidelity Investments. Previously, Mr. Ryan served as Vice President of Fund Reporting in Fidelity Pricing and Cash Management Services (FPCMS) (1999-2005). |
Jonathan Davis (43) |
| Year of Election or Appointment: 2010 Assistant Treasurer of the Fidelity funds. Mr. Davis is also Assistant Treasurer of Fidelity Rutland Square Trust II and Fidelity Commonwealth Trust II. Mr. Davis is an employee of Fidelity Investments. Previously, Mr. Davis served as Vice President and Associate General Counsel of FMR LLC (2003-2010). |
Annual Report
Initial Class and Investor Class designate 100% of the dividends distributed in December 2011, as qualifying for the dividends-received deduction for corporate shareholders.
Annual Report
Board Approval of Investment Advisory Contracts and Management Fees
VIP Utilities Portfolio
Each year, the Board of Trustees, including the Independent Trustees (together, the Board), votes on the renewal of the management contract and sub-advisory agreements (together, the Advisory Contracts) for the fund. The Board, assisted by the advice of fund counsel and Independent Trustees' counsel, requests and considers a broad range of information relevant to the renewal of the Advisory Contracts throughout the year.
The Board meets regularly and considers at each of its meetings factors that are relevant to its annual consideration of the renewal of the fund's Advisory Contracts, including the services and support provided to the fund and its shareholders. The Board has established various standing committees, each composed of Independent Trustees with varying backgrounds, to which the Board has assigned specific subject matter responsibilities in order to enhance effective decision-making by the Board. The Board, acting directly and through its Committees, requests and receives information concerning the annual consideration of the renewal of the fund's Advisory Contracts. The Board also meets as needed to consider matters specifically related to the Board's annual consideration of the renewal of Advisory Contracts. Members of the Board may also meet with trustees of other Fidelity funds through ad hoc joint committees to discuss certain matters relevant to the Fidelity funds.
At its July 2011 meeting, the Board of Trustees, including the Independent Trustees, unanimously determined to renew the fund's Advisory Contracts. In reaching its determination, the Board considered all factors it believed relevant, including (i) the nature, extent, and quality of the services to be provided to the fund and its shareholders (including the investment performance of the fund); (ii) the competitiveness of the fund's management fee and total expense ratio; (iii) the total costs of the services to be provided by and the profits to be realized by Fidelity from its relationship with the fund; (iv) the extent to which economies of scale would be realized as the fund grows; and (v) whether fee levels reflect these economies of scale, if any, for the benefit of fund shareholders.
In considering whether to renew the Advisory Contracts for the fund, the Board reached a determination, with the assistance of fund counsel and Independent Trustees' counsel and through the exercise of its business judgment, that the renewal of the Advisory Contracts is in the best interests of the fund and its shareholders and that the compensation payable under the Advisory Contracts is fair and reasonable. The Board's decision to renew the Advisory Contracts was not based on any single factor, but rather was based on a comprehensive consideration of all the information provided to the Board at its meetings throughout the year. The Board, in reaching its determination to renew the Advisory Contracts, is aware that shareholders in the fund have a broad range of investment choices available to them, including a wide choice among mutual funds offered by Fidelity's competitors, and that the fund's shareholders, who have the opportunity to review and weigh the disclosure provided by the fund in its prospectus and other public disclosures, have chosen to invest in this fund, managed by Fidelity.
Nature, Extent, and Quality of Services Provided. The Board considered the staffing within the investment adviser, FMR, and the sub-advisers (together, the Investment Advisers), including the backgrounds of the fund's investment personnel and the fund's investment objective and discipline. The Independent Trustees also had discussions with senior management of Fidelity's investment operations and investment groups. The Board considered the structure of the portfolio manager compensation program and whether this structure provides appropriate incentives to act in the best interests of the fund.
Resources Dedicated to Investment Management and Support Services. The Board and the Fund Oversight and Research Committees reviewed the general qualifications and capabilities of the Investment Advisers' investment staff, including its size, education, experience, and resources, as well as the Investment Advisers' approach to recruiting, training, managing, and compensating investment personnel. The Board also noted that FMR has devoted increased resources to non-U.S. offices. The Board noted that Fidelity's analysts have extensive resources, tools and capabilities which allow them to conduct sophisticated quantitative and fundamental analysis, as well as credit analysis of issuers, counterparties and enhancers. The Board also believes that Fidelity's investment professionals have sufficient access to global information and data so as to provide competitive investment results over time, and that those professionals also have access to sophisticated tools which permit them to assess portfolio construction and risk and performance attribution characteristics continuously, as well as to transmit new information and research conclusions rapidly around the world. Additionally, in their deliberations, the Board considered the Investment Advisers' trading capabilities and resources which are an integral part of the investment management process.
Shareholder and Administrative Services. The Board considered (i) the nature, extent, quality, and cost of advisory, administrative, and shareholder services performed by the Investment Advisers and their affiliates under the Advisory Contracts and under separate agreements covering transfer agency, pricing and bookkeeping, and securities lending services for the fund; (ii) the nature and extent of the investment adviser's supervision of third party service providers, principally custodians and subcustodians; and (iii) the resources devoted to, and the record of compliance with, the fund's compliance policies and procedures. The Board also reviewed the allocation of fund brokerage, including allocations to brokers affiliated with the Investment Advisers, the use of brokerage commissions to pay fund expenses, and the use of "soft" commission dollars to pay for research services.
The Board noted that the growth of fund assets over time across the complex allows Fidelity to reinvest in the development of services designed to enhance the value or convenience of the Fidelity funds as investment vehicles. These services include 24-hour access to account information and market information through telephone representatives and over the Internet, investor education materials and asset allocation tools, and the expanded availability of Fidelity Investor Centers, with 35 new branches opening since 2010.
Annual Report
Investment in a Large Fund Family. The Board considered the benefits to shareholders of investing in a Fidelity fund, including the benefits of investing in a fund that is part of a large family of funds offering a variety of investment disciplines and providing a large variety of mutual fund investor services. The Board noted that Fidelity had taken, or had made recommendations that resulted in the Fidelity funds taking, a number of actions over the previous year that benefited particular funds, including (i) continuing to dedicate additional resources to investment research and support of the senior management team that oversees asset management; (ii) rationalizing product lines through the mergers of six funds into other funds; (iii) continuing to migrate the Freedom Funds to dedicated lower cost underlying funds; (iv) obtaining shareholder approval to broaden the investment strategies for Fidelity Consumer Finance Portfolio, Fidelity Emerging Asia Fund, and Fidelity Environment and Alternative Energy Portfolio; (v) contractually agreeing to reduce the management fees and impose other expense limitations on Spartan 500 Index Fund and U.S. Bond Index Fund in connection with launching new institutional classes of these funds; (vi) changing the name, primary and supplemental benchmarks, and investment policies of Fidelity Global Strategies Fund to support the fund's flexible investment mandate and global orientation; and (vii) reducing the transfer agency account fee rates on certain accounts.
Investment Performance. The Board considered whether the fund has operated in accordance with its investment objective, as well as its record of compliance with its investment restrictions. It also reviewed the fund's absolute investment performance for each class, as well as the fund's relative investment performance for each class measured over multiple periods against a third-party-sponsored index that reflects the market sector in which the fund invests. The Board noted that FMR does not believe that a meaningful peer group exists against which to compare the fund's performance. The following charts considered by the Board show, over the one-, three-, and five-year periods ended December 31, 2010, the cumulative total returns of Initial Class and Investor Class of the fund and the cumulative total returns of a third-party-sponsored index ("benchmark").
VIP Utilities Portfolio
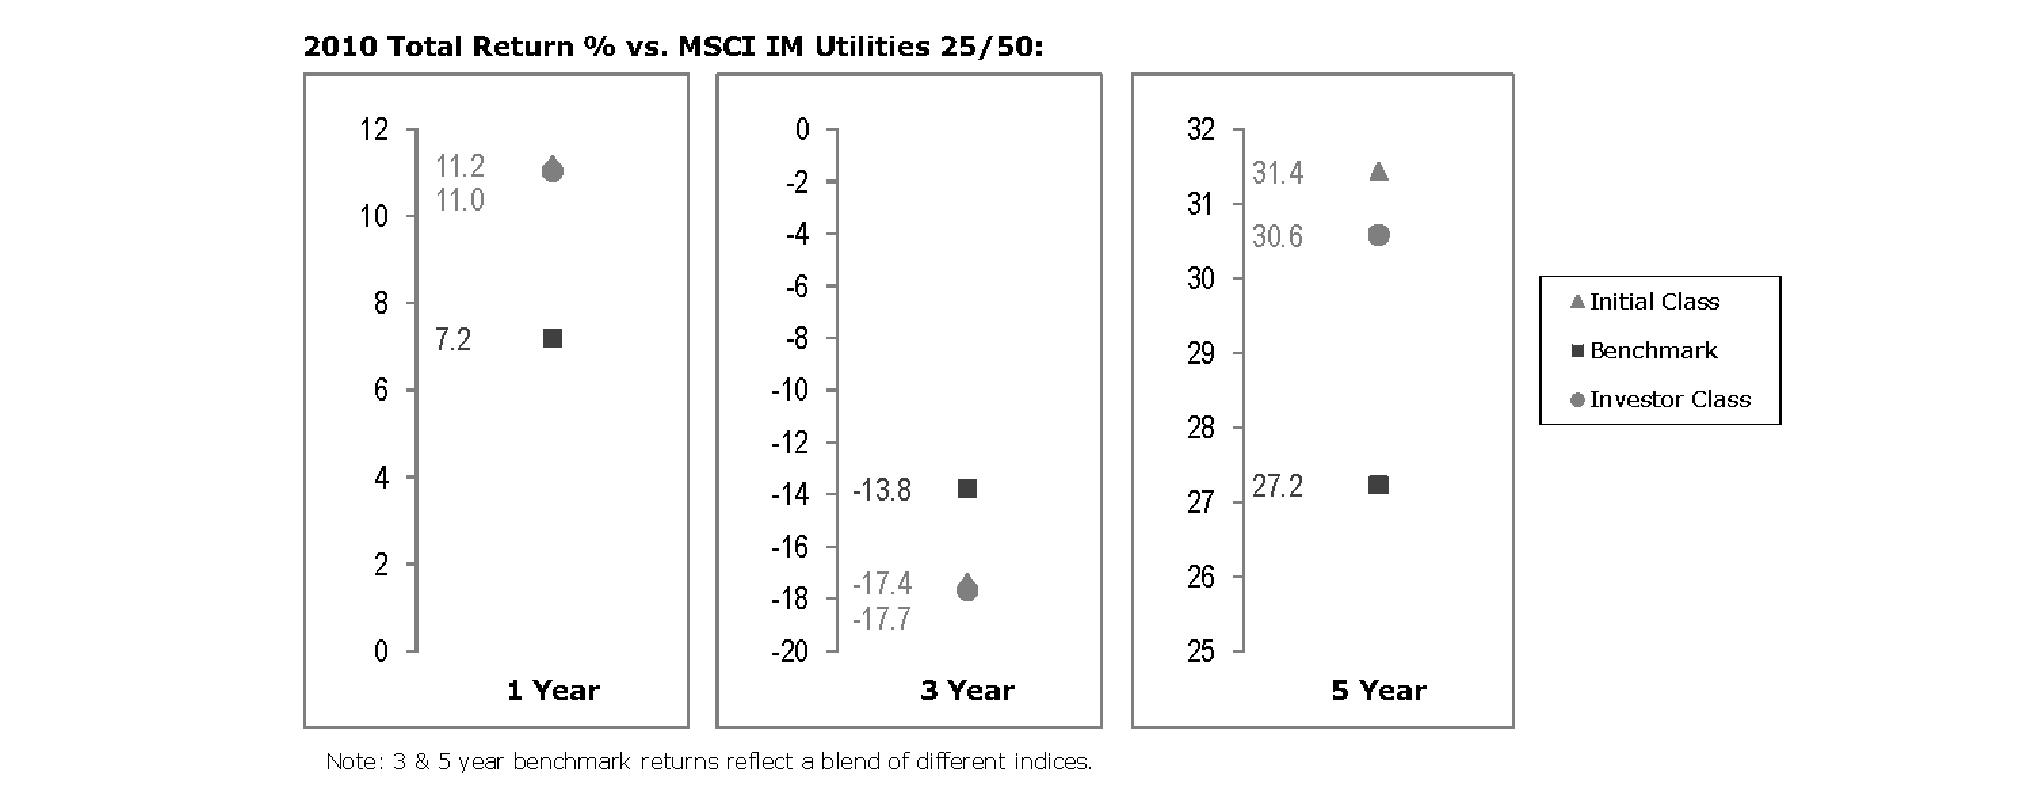
The Board noted that the investment performance of Initial Class of the fund compared favorably to its benchmark for the one- and five-year periods, although the fund's three-year cumulative total return was lower than its benchmark. The Board considered that the variations in performance between the fund's classes reflect the variations in class expenses, which result in lower performance for the higher expense class. The Board also reviewed the fund's performance since inception as well as performance in the current year.
Based on its review, the Board concluded that the nature, extent, and quality of services provided to the fund under the Advisory Contracts should benefit the fund's shareholders.
Competitiveness of Management Fee and Total Expense Ratio. The Board considered the fund's management fee and total expense ratio compared to "mapped groups" of competitive funds and classes. Fidelity creates "mapped groups" by combining similar Lipper investment objective categories that have comparable management fee characteristics. Combining Lipper investment objective categories aids the Board's management fee and total expense ratio comparisons by broadening the competitive group used for comparison and by reducing the number of universes to which various Fidelity funds are compared.
Management Fee. The Board considered two proprietary management fee comparisons for the 12-month periods shown in the chart below. The group of Lipper funds used by the Board for management fee comparisons is referred to below as the "Total Mapped Group." The Total Mapped Group comparison focuses on a fund's standing relative to the total universe of comparable funds available to investors in terms of gross management fees before expense reimbursements or caps. "TMG %" represents the percentage of funds in the Total Mapped Group that had management fees that were lower than the fund's. For example, a TMG % of 2% means that 98% of the funds in the Total Mapped Group had higher management fees than the fund. The "Asset-Size Peer Group" (ASPG) comparison focuses on a fund's standing relative to non-Fidelity funds similar in size to the fund within the Total Mapped Group. The ASPG represents at least 15% of the funds in the Total Mapped Group with comparable asset size and management fee characteristics, subject to a minimum of 50 funds (or all funds in the Total Mapped Group if fewer than 50). Additional information, such as the ASPG quartile in which the fund's management fee ranked, is also included in the chart and considered by the Board.
Annual Report
Board Approval of Investment Advisory Contracts and Management Fees - continued
VIP Utilities Portfolio

The Board noted that the fund's management fee ranked below the median of its Total Mapped Group and below the median of its ASPG for 2010.
Based on its review, the Board concluded that the fund's management fee is fair and reasonable in light of the services that the fund receives and the other factors considered.
Total Expense Ratio. In its review of each class's total expense ratio, the Board considered the fund's management fee as well as other fund or class expenses, as applicable, such as transfer agent fees, pricing and bookkeeping fees, and custodial, legal, and audit fees. The Board also noted the effects of any waivers and reimbursements on fees and expenses. As part of its review, the Board also considered the current and historical total expense ratios of each class of the fund compared to competitive fund median expenses. Each class of the fund is compared to those funds and classes in the Total Mapped Group (used by the Board for management fee comparisons) that have a similar sales load structure.
The Board noted that the total expense ratio of each class ranked below its competitive median for 2010. The Board considered that various factors, including 12b-1 fees, positive or negative performance adjustments, and relatively higher other expenses in the case of small fund size, can affect total expense ratios. The Board also noted that Investor Class has higher transfer agent fees than traditional variable annuity classes because it is designed for lower cost annuity products, where the majority of servicing costs are incorporated into the funds' total expense ratios rather than being paid at the annuity level.
Fees Charged to Other Fidelity Clients. The Board also considered Fidelity fee structures and other information with respect to clients of FMR and its affiliates, such as other mutual funds advised or subadvised by FMR or its affiliates, pension plan clients, and other institutional clients. In March 2010, the Board created an ad hoc joint committee with the board of other Fidelity funds (the Committee) to review and compare Fidelity's institutional investment advisory business with its business of providing services to the Fidelity funds, including the differences in services provided, fees charged, and costs incurred, as well as competition in their respective marketplaces.
Based on its review of total expense ratios and fees charged to other Fidelity clients, the Board concluded that the total expense ratio of each class of the fund was reasonable in light of the services that the fund and its shareholders receive and the other factors considered, including the findings of the Committee.
Costs of the Services and Profitability. The Board considered the revenues earned and the expenses incurred by Fidelity in conducting the business of developing, marketing, distributing, managing, administering and servicing the fund and its shareholders. The Board also considered the level of Fidelity's profits in respect of all the Fidelity funds.
On an annual basis, FMR presents to the Board Fidelity's profitability for the fund. Fidelity calculates the profitability for each fund, as well as aggregate profitability for groups of Fidelity funds and all Fidelity funds, using a series of detailed revenue and cost allocation methodologies which originate with the books and records of Fidelity on which Fidelity's audited financial statements are based. The Audit Committee of the Board reviews any significant changes from the prior year's methodologies.
Annual Report
PricewaterhouseCoopers LLP (PwC), independent registered public accounting firm and auditor to Fidelity and certain Fidelity funds, has been engaged annually by the Board as part of the Board's assessment of Fidelity's profitability analysis. PwC's engagement includes the review and assessment of Fidelity's methodologies used in determining the revenues and expenses attributable to Fidelity's mutual fund business, and completion of agreed-upon procedures surrounding the mathematical accuracy of fund profitability and its conformity to allocation methodologies. After considering PwC's reports issued under the engagement and information provided by Fidelity, the Board concluded that while other allocation methods may also be reasonable, Fidelity's profitability methodologies are reasonable in all material respects.
The Board also reviewed Fidelity's non-fund businesses and fall-out benefits related to the mutual fund business as well as cases where Fidelity's affiliates may benefit from or be related to the fund's business.
The Board considered the costs of the services provided by and the profits realized by Fidelity in connection with the operation of the fund and was satisfied that the profitability was not excessive in the circumstances.
Economies of Scale. The Board considered whether there have been economies of scale in respect of the management of the Fidelity funds, whether the Fidelity funds (including the fund) have appropriately benefited from any such economies of scale, and whether there is potential for realization of any further economies of scale. The Board considered the extent to which the fund will benefit from economies of scale through increased services to the fund, through waivers or reimbursements, or through fee or expense reductions. The Board also noted that in 2009, it and the board of other Fidelity funds created an ad hoc committee (the Economies of Scale Committee) to analyze whether FMR attains economies of scale in respect of the management and servicing of the Fidelity funds, whether the Fidelity funds have appropriately benefited from such economies of scale, and whether there is potential for realization of any further economies of scale.
The Board recognized that the fund's management contract incorporates a "group fee" structure, which provides for lower group fee rates as total fund assets under FMR's management increase, and for higher group fee rates as total fund assets under FMR's management decrease. FMR calculates the group fee rates based on a tiered asset "breakpoint" schedule that varies based on asset class. The Board considered that the group fee is designed to deliver the benefits of economies of scale to fund shareholders when total Fidelity fund assets increase, even if assets of any particular fund are unchanged or have declined, because some portion of Fidelity's costs are attributable to services provided to all Fidelity funds, and all funds benefit if those costs can be allocated among more assets. The Board concluded that, given the group fee structure, fund shareholders will benefit from lower management fees as assets under FMR's management increase at the fund complex level, regardless of whether Fidelity achieves any such economies of scale.
The Board concluded, taking into account the analysis of the Economies of Scale Committee, that any potential economies of scale are being appropriately shared between fund shareholders and Fidelity.
Additional Information Requested by the Board. In order to develop fully the factual basis for consideration of the Fidelity funds' Advisory Contracts, the Board requested and received additional information on certain topics, including (i) fund performance trends, actions to be taken by FMR to improve certain funds' overall performance, and Fidelity's long-term strategies for certain funds; (ii) portfolio manager changes that have occurred during the past year and length of portfolio manager tenure for different categories of funds over time; (iii) Fidelity's compensation structure for portfolio managers and other key personnel and strategies for attracting and retaining non-investment personnel; (iv) the amount of the investment that each portfolio manager has made in the Fidelity fund(s) that he or she manages; (v) historical trends in Fidelity's realization of fall-out benefits; (vi) Fidelity's group fee structures and the rationale for the individual fee rates of certain funds; (vii) fund profitability methodology and the impact of certain factors on fund profitability results; (viii) trends regarding industry use of performance fee structures and Fidelity's compliance practices with respect to performance adjustment calculations; (ix) the fee structures in place for certain other Fidelity clients; and (x) explanations regarding the relative total expense ratios of certain funds and classes, total expense competitive trends, and actions that might be taken by FMR to reduce total expense ratios for certain funds and classes.
Based on its evaluation of all of the conclusions noted above, and after considering all factors it believed relevant, the Board ultimately concluded that the advisory fee structures are fair and reasonable, and that the fund's Advisory Contracts should be renewed.
Annual Report
Investment Adviser
Fidelity Management & Research Company
Boston, MA
Investment Sub-Advisers
FMR Co., Inc.
Fidelity Management & Research (U.K.) Inc.
Fidelity Management & Research (Hong Kong) Limited
Fidelity Management & Research (Japan) Inc.
General Distributor
Fidelity Distributors Corporation
Boston, MA
Transfer and Service Agents
Fidelity Investments Institutional Operations Company, Inc.
Boston, MA
Fidelity Service Company, Inc.
Boston, MA
Custodian
JPMorgan Chase Bank
New York, NY
VTELIC-ANN-0212
1.817391.106
Fidelity® Variable Insurance Products:
Value Leaders Portfolio
Annual Report
December 31, 2011
Contents
Performance | (Click Here) | How the fund has done over time. |
Management's Discussion of Fund Performance | (Click Here) | The Portfolio Manager's review of fund performance and strategy. |
Shareholder Expense Example | (Click Here) | An example of shareholder expenses. |
Investment Changes | (Click Here) | A summary of major shifts in the fund's investments over the past six months. |
Investments | (Click Here) | A complete list of the fund's investments with their market values. |
Financial Statements | (Click Here) | Statements of assets and liabilities, operations, and changes in net assets, as well as financial highlights. |
Notes | (Click Here) | Notes to the financial statements. |
Report of Independent Registered Public Accounting Firm | (Click Here) | |
Trustees and Officers | (Click Here) | |
Distributions | (Click Here) | |
Board Approval of Investment Advisory Contracts and Management Fees | (Click Here) | |
To view a fund's proxy voting guidelines and proxy voting record for the 12-month period ended June 30, visit http://www.fidelity.com/proxyvotingresults or visit the Securities and Exchange Commission's (SEC) web site at http://www.sec.gov. You may also call 1-877-208-0098 to request a free copy of the proxy voting guidelines.
Fidelity Variable Insurance Products are separate account options which are purchased through a variable insurance contract.
Standard & Poor's, S&P and S&P 500 are registered service marks of The McGraw-Hill Companies, Inc. and have been licensed for use by Fidelity Distributors Corporation.
Other third party marks appearing herein are the property of their respective owners.
All other marks appearing herein are registered or unregistered trademarks or service marks of FMR Corp. or an affiliated company.
This report and the financial statements contained herein are submitted for the general information of the shareholders of the fund. This report is not authorized for distribution to prospective investors in the fund unless preceded or accompanied by an effective prospectus.
A fund files its complete schedule of portfolio holdings with the SEC for the first and third quarters of each fiscal year on Form N-Q. Forms N-Q are available on the SEC's web site at http://www.sec.gov. A fund's Forms N-Q may be reviewed and copied at the SEC's Public Reference Room in Washington, DC. Information regarding the operation of the SEC's Public Reference Room may be obtained by calling 1-800-SEC-0330. For a complete list of a fund's portfolio holdings, view the most recent holdings listing, semiannual report, or annual report on Fidelity's web site at http://www.fidelity.com, http://www.advisor.fidelity.com, or http://www.401k.com, as applicable.
NOT FDIC INSURED • MAY LOSE VALUE • NO BANK GUARANTEE
Neither the fund nor Fidelity Distributors Corporation is a bank.
Annual Report
Average annual total return reflects the change in the value of an investment, assuming reinvestment of the class' distributions from dividend income and capital gains (the profits earned upon the sale of securities that have grown in value, if any) and assuming a constant rate of performance each year. During periods of reimbursement by Fidelity, a fund's total return will be greater than it would be had the reimbursement not occurred. Performance numbers are net of all underlying fund operating expenses, but do not include any insurance charges imposed by your insurance company's separate account. If performance information included the effect of these additional charges, the total returns would have been lower. How a fund did yesterday is no guarantee of how it will do tomorrow.
Average Annual Total Returns
Periods ended December 31, 2011 | Past 1
year | Past 5
years | Life of
fund A |
VIP Value Leaders Portfolio - Initial Class | -8.00% | -5.59% | 2.48% |
VIP Value Leaders Portfolio - Service Class | -8.03% | -5.67% | 2.40% |
VIP Value Leaders Portfolio - Service Class 2 | -8.20% | -5.82% | 2.23% |
VIP Value Leaders Portfolio - Investor Class B | -8.00% | -5.66% | 2.42% |
A From June 17, 2003.
B The initial offering of Investor Class shares took place on July 21, 2005. Returns prior to July 21, 2005 are those of Initial Class. Had Investor Class's transfer agent fee been reflected, returns prior to July 21, 2005, would have been lower.
$10,000 Over Life of Fund
Let's say hypothetically that $10,000 was invested in VIP Value Leaders Portfolio - Initial Class on June 17, 2003, when the fund started. The chart shows how the value of your investment would have changed, and also shows how the Russell 1000® Value Index performed over the same period.
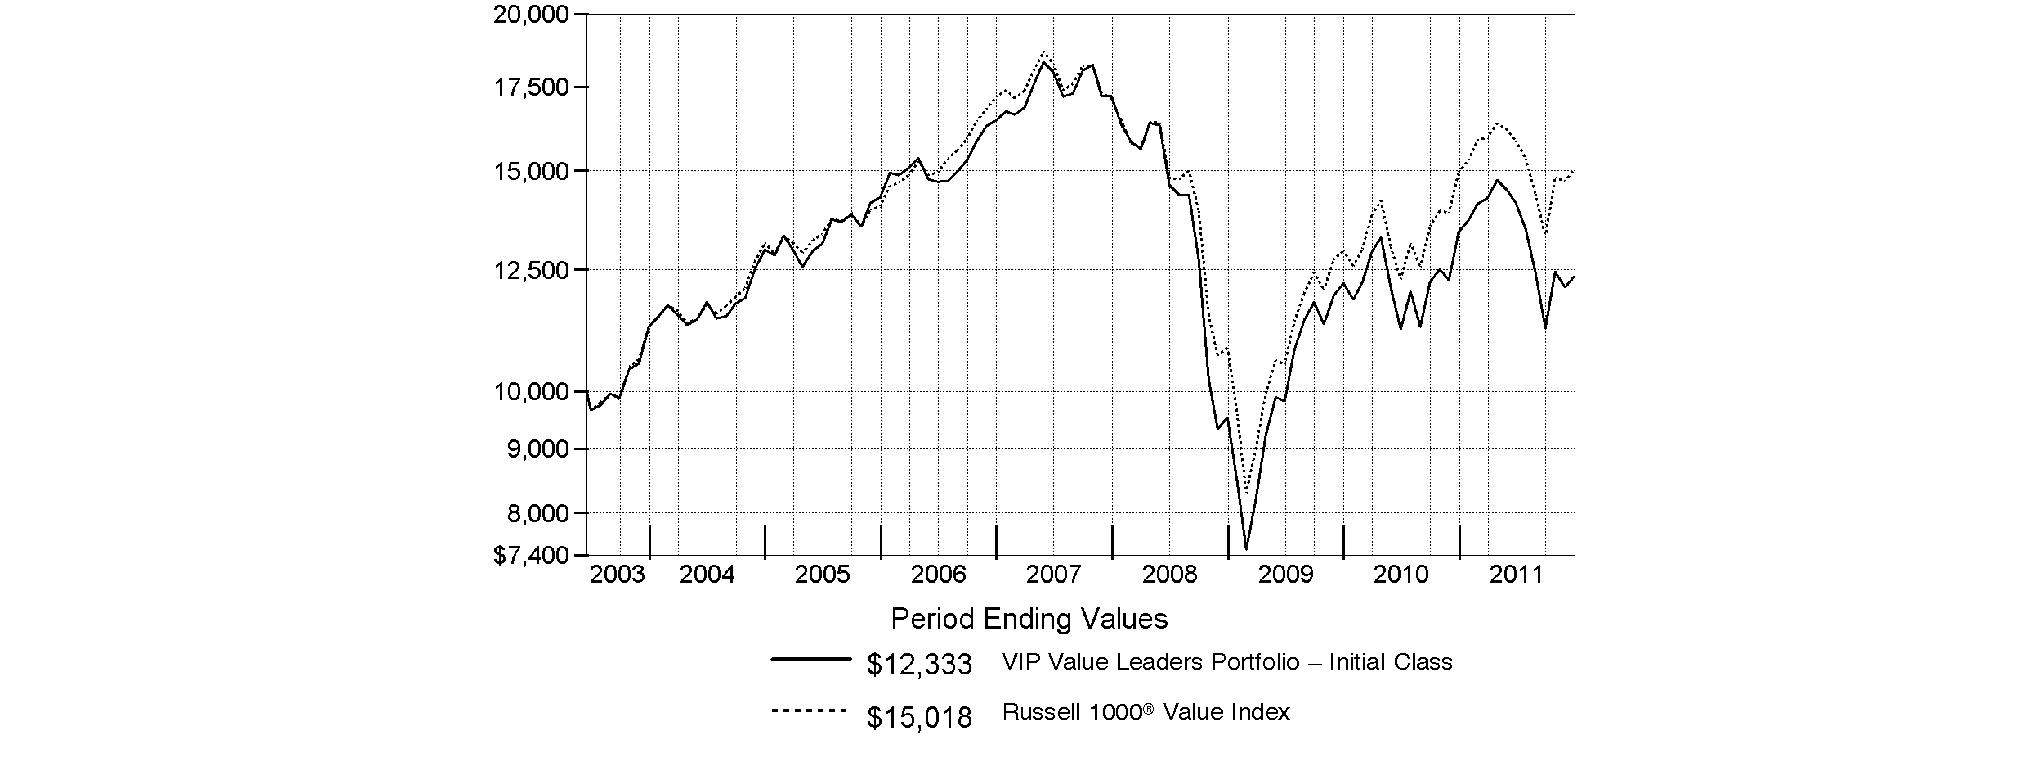
Annual Report
Market Recap: Extreme market volatility took center stage during the 12 months ending December 31, 2011, stealing the spotlight from signs of progress in the global economy. Early in the year, aggressive monetary stimulus by the U.S. federal government, improving credit-market conditions and solid corporate earnings buoyed most major asset classes. As the period progressed, however, fresh worries about sovereign debt in Europe, inflation in China, gridlock over raising the debt ceiling in the U.S. - along with Standard & Poor's early-August downgrade of the nation's long-term sovereign credit rating - and a dimmed outlook for global growth punctured investor confidence and ignited market instability. Domestic equities, as measured by the broad-based S&P 500® Index, gained 2.11%, easily outpacing the 13.61% decline of MSCI® ACWI® (All Country World Index) ex USA Index, a proxy for foreign stocks. Within the MSCI index, emerging markets declined the most (-18%), with investments here generally held back by a stronger U.S. dollar. The U.K. (-3%) fared better than the rest of Europe (-15%), which was the second-worst-performing index component. Bolstered by periodic flights to quality, U.S. investment-grade bonds posted a 7.84% advance, as reflected by the Barclays Capital® U.S. Aggregate Bond Index, outperforming the 4.37% gain of high-yield securities, as represented by The BofA Merrill LynchSM US High Yield Constrained Index. Hampered by financial woes in Europe, the sovereign debt of major developed markets outside the U.S. rose 4.86%, according to the Citigroup® Non-USD Group-of-Seven (G7) Equal Weighted Index, while the JPMorgan Emerging Markets Bond Index Global (EMBI Global) advanced 8.46%, despite the currency head wind.
Comments from Michael Chren, Portfolio Manager of VIP Value Leaders Portfolio: For the year, the fund's share classes underperformed the 0.39% advance of the Russell 1000® Value Index. (For specific portfolio results, please refer to the performance section of this report.) Two out-of-index European stocks, France-based telecommunications equipment manufacturer Alcatel-Lucent and Swiss specialty chemicals maker Clariant, accounted for much of the fund's disappointing performance and were two of the fund's biggest individual detractors. Both companies represented turnaround plays where investors became increasingly frustrated with management's lack of execution and credibility, and both stocks fell sharply. The fund's overweighting and weak security selection in diversified financials was costly, with our stakes in Citigroup and Goldman Sachs Group hurting performance when a lack of transparency regarding their European market exposure worried investors. Online stock trading and investment firm E*TRADE Financial was another disappointment here, when an effort to sell the company failed. The fund also had weak results in semiconductors and suffered from underweighting utilities. On the positive side, positioning in consumer discretionary provided the biggest boost to relative performance, including the portfolio's top individual contributor, Swiss navigation products manufacturer Garmin. Positioning in health care, including holdings in drug manufacturers Pfizer, Merck and Eli Lilly, helped. The consumer staples sector also was additive, including an out-of-index stake in Mexican brewer Grupo Modelo.
The views expressed above reflect those of the portfolio manager(s) only through the end of the period as stated on the cover of this report and do not necessarily represent the views of Fidelity or any other person in the Fidelity organization. Any such views are subject to change at any time based upon market or other conditions and Fidelity disclaims any responsibility to update such views. These views may not be relied on as investment advice and, because investment decisions for a Fidelity fund are based on numerous factors, may not be relied on as an indication of trading intent on behalf of any Fidelity fund.
Annual Report
As a shareholder of the Fund, you incur two types of costs: (1) transaction costs, and (2) ongoing costs, including management fees, distribution and/or service (12b-1) fees and other Fund expenses. This Example is intended to help you understand your ongoing costs (in dollars) of investing in the Fund and to compare these costs with the ongoing costs of investing in other mutual funds.
The Example is based on an investment of $1,000 invested at the beginning of the period and held for the entire period (July 1, 2011 to December 31, 2011).
Actual Expenses
The first line of the accompanying table for each class of the Fund provides information about actual account values and actual expenses. You may use the information in this line, together with the amount you invested, to estimate the expenses that you paid over the period. Simply divide your account value by $1,000.00 (for example, an $8,600 account value divided by $1,000.00 = 8.6), then multiply the result by the number in the first line for a class of the Fund under the heading entitled "Expenses Paid During Period" to estimate the expenses you paid on your account during this period. The estimate of expenses does not include any fees or other expenses of any variable annuity or variable life insurance product. If they were, the estimate of expenses you paid during the period would be higher, and your ending account value would be lower. In addition, the Fund, as a shareholder in the underlying Fidelity Central Funds, will indirectly bear its pro-rata share of the fees and expenses incurred by the underlying Fidelity Central Funds. These fees and expenses are not included in the Fund's annualized expense ratio used to calculate the expense estimate in the table below.
Hypothetical Example for Comparison Purposes
The second line of the accompanying table for each class of the Fund provides information about hypothetical account values and hypothetical expenses based on a Class' actual expense ratio and an assumed rate of return of 5% per year before expenses, which is not the Class' actual return. The hypothetical account values and expenses may not be used to estimate the actual ending account balance or expenses you paid for the period. You may use this information to compare the ongoing costs of investing in the Fund and other funds. To do so, compare this 5% hypothetical example with the 5% hypothetical examples that appear in the shareholder reports of the other funds. The estimate of expenses does not include any fees or other expenses of any variable annuity or variable life insurance product. If they were, the estimate of expenses you paid during the period would be higher, and your ending account value would be lower. In addition, the Fund, as a shareholder in the underlying Fidelity Central Funds, will indirectly bear its pro-rata share of the fees and expenses incurred by the underlying Fidelity Central Funds. These fees and expenses are not included in the Fund's annualized expense ratio used to calculate the expense estimate in the table below.
Please note that the expenses shown in the table are meant to highlight your ongoing costs only and do not reflect any transaction costs. Therefore, the second line of the table is useful in comparing ongoing costs only, and will not help you determine the relative total costs of owning different funds.
| Annualized
Expense Ratio | Beginning
Account Value
July 1, 2011 | Ending
Account Value
December 31, 2011 | Expenses Paid
During Period*
July 1, 2011 to
December 31, 2011 |
Initial Class | .85% | | | |
Actual | | $ 1,000.00 | $ 873.10 | $ 4.01 |
HypotheticalA | | $ 1,000.00 | $ 1,020.92 | $ 4.33 |
Service Class | .95% | | | |
Actual | | $ 1,000.00 | $ 873.60 | $ 4.49 |
HypotheticalA | | $ 1,000.00 | $ 1,020.42 | $ 4.84 |
Service Class 2 | 1.10% | | | |
Actual | | $ 1,000.00 | $ 872.60 | $ 5.19 |
HypotheticalA | | $ 1,000.00 | $ 1,019.66 | $ 5.60 |
Investor Class | .93% | | | |
Actual | | $ 1,000.00 | $ 873.80 | $ 4.39 |
HypotheticalA | | $ 1,000.00 | $ 1,020.52 | $ 4.74 |
A 5% return per year before expenses
* Expenses are equal to each Class' annualized expense ratio, multiplied by the average account value over the period, multiplied by 184/365 (to reflect the one-half year period).
Annual Report
Investment Changes (Unaudited)
Top Ten Stocks as of December 31, 2011 |
| % of fund's
net assets | % of fund's net assets
6 months ago |
Grupo Modelo SAB de CV Series C | 5.2 | 4.6 |
Garmin Ltd. | 4.6 | 3.9 |
Citigroup, Inc. | 4.2 | 5.0 |
Pfizer, Inc. | 4.2 | 4.5 |
Johnson & Johnson | 4.1 | 2.7 |
Merck & Co., Inc. | 3.9 | 2.9 |
General Electric Co. | 3.8 | 3.3 |
Procter & Gamble Co. | 3.7 | 0.0 |
Chevron Corp. | 3.3 | 2.9 |
Alcatel-Lucent SA sponsored ADR | 2.7 | 4.8 |
| 39.7 | |
Top Five Market Sectors as of December 31, 2011 |
| % of fund's
net assets | % of fund's net assets
6 months ago |
Financials | 23.2 | 26.0 |
Health Care | 16.7 | 13.8 |
Consumer Staples | 13.2 | 9.1 |
Information Technology | 11.9 | 14.9 |
Consumer Discretionary | 10.7 | 9.7 |
Asset Allocation (% of fund's net assets) |
As of December 31, 2011* | As of June 30, 2011** |
| Stocks 97.3% | | | Stocks 98.3% | |
| Short-Term
Investments and
Net Other Assets 2.7% | | | Short-Term
Investments and
Net Other Assets 1.7% | |
* Foreign investments | 22.7% | | ** Foreign investments | 23.8% | |

Annual Report
Investments December 31, 2011
Showing Percentage of Net Assets
Common Stocks - 97.3% |
| Shares | | Value |
CONSUMER DISCRETIONARY - 10.7% |
Automobiles - 0.7% |
Honda Motor Co. Ltd. | 4,800 | | $ 146,222 |
Household Durables - 5.2% |
D.R. Horton, Inc. | 10,400 | | 131,144 |
Garmin Ltd. (d) | 24,180 | | 962,606 |
| | 1,093,750 |
Media - 2.0% |
Time Warner, Inc. | 5,300 | | 191,542 |
Washington Post Co. Class B | 593 | | 223,448 |
| | 414,990 |
Multiline Retail - 2.8% |
JCPenney Co., Inc. (d) | 13,460 | | 473,119 |
Target Corp. | 2,366 | | 121,187 |
| | 594,306 |
TOTAL CONSUMER DISCRETIONARY | | 2,249,268 |
CONSUMER STAPLES - 13.2% |
Beverages - 5.2% |
Grupo Modelo SAB de CV Series C | 170,800 | | 1,083,082 |
Food & Staples Retailing - 1.7% |
CVS Caremark Corp. | 1,590 | | 64,840 |
Wal-Mart Stores, Inc. | 4,752 | | 283,980 |
| | 348,820 |
Food Products - 2.3% |
Kraft Foods, Inc. Class A | 12,761 | | 476,751 |
Household Products - 3.7% |
Procter & Gamble Co. | 11,792 | | 786,644 |
Tobacco - 0.3% |
Lorillard, Inc. | 662 | | 75,468 |
TOTAL CONSUMER STAPLES | | 2,770,765 |
ENERGY - 10.2% |
Energy Equipment & Services - 0.8% |
Weatherford International Ltd. (a) | 11,752 | | 172,049 |
Oil, Gas & Consumable Fuels - 9.4% |
Alpha Natural Resources, Inc. (a) | 7,192 | | 146,933 |
Anadarko Petroleum Corp. | 3,328 | | 254,026 |
Apache Corp. | 1,000 | | 90,580 |
BP PLC sponsored ADR | 2,409 | | 102,961 |
Chevron Corp. | 6,400 | | 680,960 |
Marathon Petroleum Corp. | 7,777 | | 258,896 |
Occidental Petroleum Corp. | 4,556 | | 426,897 |
| | 1,961,253 |
TOTAL ENERGY | | 2,133,302 |
FINANCIALS - 23.2% |
Capital Markets - 3.7% |
Bank of New York Mellon Corp. | 7,300 | | 145,343 |
|
| Shares | | Value |
E*TRADE Financial Corp. (a) | 41,969 | | $ 334,073 |
Goldman Sachs Group, Inc. | 961 | | 86,903 |
Morgan Stanley | 5,211 | | 78,842 |
State Street Corp. | 2,900 | | 116,899 |
| | 762,060 |
Commercial Banks - 7.1% |
Aozora Bank Ltd. | 165,000 | | 454,492 |
KeyCorp | 41,200 | | 316,828 |
U.S. Bancorp | 7,913 | | 214,047 |
Wells Fargo & Co. | 18,455 | | 508,620 |
| | 1,493,987 |
Diversified Financial Services - 6.8% |
Bank of America Corp. | 25,112 | | 139,623 |
Citigroup, Inc. | 33,882 | | 891,435 |
JPMorgan Chase & Co. | 11,796 | | 392,217 |
| | 1,423,275 |
Insurance - 4.4% |
Assurant, Inc. | 1,519 | | 62,370 |
Berkshire Hathaway, Inc. Class B (a) | 771 | | 58,827 |
MetLife, Inc. | 9,500 | | 296,210 |
RenaissanceRe Holdings Ltd. | 1,251 | | 93,037 |
The Chubb Corp. | 2,600 | | 179,972 |
XL Group PLC Class A | 11,658 | | 230,479 |
| | 920,895 |
Real Estate Investment Trusts - 1.0% |
Weyerhaeuser Co. | 10,927 | | 204,007 |
Thrifts & Mortgage Finance - 0.2% |
Radian Group, Inc. | 17,700 | | 41,418 |
TOTAL FINANCIALS | | 4,845,642 |
HEALTH CARE - 16.7% |
Biotechnology - 1.0% |
Amgen, Inc. | 3,200 | | 205,472 |
Health Care Equipment & Supplies - 0.6% |
CareFusion Corp. (a) | 4,835 | | 122,857 |
Pharmaceuticals - 15.1% |
Eli Lilly & Co. | 3,567 | | 148,245 |
Johnson & Johnson | 12,966 | | 850,310 |
Merck & Co., Inc. | 21,770 | | 820,729 |
Pfizer, Inc. | 40,967 | | 886,526 |
Sanofi-aventis sponsored ADR | 12,360 | | 451,634 |
| | 3,157,444 |
TOTAL HEALTH CARE | | 3,485,773 |
INDUSTRIALS - 4.6% |
Aerospace & Defense - 0.2% |
United Technologies Corp. | 587 | | 42,904 |
Construction & Engineering - 0.6% |
Jacobs Engineering Group, Inc. (a) | 3,083 | | 125,108 |
Common Stocks - continued |
| Shares | | Value |
INDUSTRIALS - continued |
Industrial Conglomerates - 3.8% |
General Electric Co. | 44,102 | | $ 789,867 |
TOTAL INDUSTRIALS | | 957,879 |
INFORMATION TECHNOLOGY - 11.9% |
Communications Equipment - 6.9% |
Alcatel-Lucent SA sponsored ADR (a)(d) | 369,193 | | 575,941 |
Cisco Systems, Inc. | 19,346 | | 349,776 |
Comverse Technology, Inc. (a) | 75,500 | | 517,930 |
| | 1,443,647 |
Electronic Equipment & Components - 1.6% |
Corning, Inc. | 25,115 | | 325,993 |
Office Electronics - 0.5% |
Xerox Corp. | 13,086 | | 104,165 |
Semiconductors & Semiconductor Equipment - 2.4% |
Advanced Micro Devices, Inc. (a) | 94,689 | | 511,321 |
Software - 0.5% |
Microsoft Corp. | 3,910 | | 101,504 |
TOTAL INFORMATION TECHNOLOGY | | 2,486,630 |
MATERIALS - 2.5% |
Chemicals - 1.7% |
Clariant AG (Reg.) (a) | 37,068 | | 365,884 |
Metals & Mining - 0.8% |
Newmont Mining Corp. | 2,674 | | 160,467 |
TOTAL MATERIALS | | 526,351 |
TELECOMMUNICATION SERVICES - 1.0% |
Diversified Telecommunication Services - 0.4% |
CenturyLink, Inc. | 2,424 | | 90,173 |
Wireless Telecommunication Services - 0.6% |
Vodafone Group PLC sponsored ADR | 4,000 | | 112,120 |
TOTAL TELECOMMUNICATION SERVICES | | 202,293 |
|
| Shares | | Value |
UTILITIES - 3.3% |
Electric Utilities - 3.3% |
Exelon Corp. | 4,100 | | $ 177,817 |
FirstEnergy Corp. | 5,144 | | 227,879 |
NextEra Energy, Inc. | 4,831 | | 294,111 |
| | 699,807 |
TOTAL COMMON STOCKS (Cost $22,542,579) |
20,357,710
|
Money Market Funds - 8.6% |
| | | |
Fidelity Cash Central Fund, 0.11% (b) | 481,258 | | 481,258 |
Fidelity Securities Lending Cash Central Fund, 0.13% (b)(c) | 1,327,150 | | 1,327,150 |
TOTAL MONEY MARKET FUNDS (Cost $1,808,408) |
1,808,408
|
TOTAL INVESTMENT
PORTFOLIO - 105.9% (Cost $24,350,987) | | 22,166,118 |
NET OTHER ASSETS (LIABILITIES) - (5.9)% | | (1,242,292) |
NET ASSETS - 100% | $ 20,923,826 |
Legend |
(a) Non-income producing |
(b) Affiliated fund that is available only to investment companies and other accounts managed by Fidelity Investments. The rate quoted is the annualized seven-day yield of the fund at period end. A complete unaudited listing of the fund's holdings as of its most recent quarter end is available upon request. In addition, each Fidelity Central Fund's financial statements, which are not covered by the Fund's Report of Independent Registered Public Accounting Firm, are available on the SEC's website or upon request. |
(c) Investment made with cash collateral received from securities on loan. |
(d) Security or a portion of the security is on loan at period end. |
Affiliated Central Funds |
Information regarding fiscal year to date income earned by the Fund from investments in Fidelity Central Funds is as follows: |
Fund | Income earned |
Fidelity Cash Central Fund | $ 657 |
Fidelity Securities Lending Cash Central Fund | 26,008 |
Total | $ 26,665 |
Other Information |
The following is a summary of the inputs used, as of December 31, 2011, involving the Fund's assets and liabilities carried at fair value. The inputs or methodology used for valuing securities may not be an indication of the risk associated with investing in those securities. For more information on valuation inputs, and their aggregation into the levels used in the table below, please refer to the Security Valuation section in the accompanying Notes to Financial Statements. |
Valuation Inputs at Reporting Date: |
Description | Total | Level 1 | Level 2 | Level 3 |
Investments in Securities: | | | | |
Equities: | | | | |
Consumer Discretionary | $ 2,249,268 | $ 2,103,046 | $ 146,222 | $ - |
Consumer Staples | 2,770,765 | 2,770,765 | - | - |
Energy | 2,133,302 | 2,133,302 | - | - |
Financials | 4,845,642 | 4,845,642 | - | - |
Health Care | 3,485,773 | 3,485,773 | - | - |
Industrials | 957,879 | 957,879 | - | - |
Information Technology | 2,486,630 | 2,486,630 | - | - |
Materials | 526,351 | 526,351 | - | - |
Telecommunication Services | 202,293 | 202,293 | - | - |
Utilities | 699,807 | 699,807 | - | - |
Money Market Funds | 1,808,408 | 1,808,408 | - | - |
Total Investments in Securities: | $ 22,166,118 | $ 22,019,896 | $ 146,222 | $ - |
Distribution of investments by country of issue, as a percentage of total net assets, is as follows: (Unaudited) |
United States of America | 77.3% |
Switzerland | 7.1% |
Mexico | 5.2% |
France | 4.9% |
Japan | 2.9% |
Ireland | 1.1% |
United Kingdom | 1.1% |
Others (Individually Less Than 1%) | 0.4% |
| 100.0% |
See accompanying notes which are an integral part of the financial statements.
Annual Report
Statement of Assets and Liabilities
| December 31, 2011 |
| | |
Assets | | |
Investment in securities, at value (including securities loaned of $1,272,106) - See accompanying schedule: Unaffiliated issuers (cost $22,542,579) | $ 20,357,710 | |
Fidelity Central Funds (cost $1,808,408) | 1,808,408 | |
Total Investments (cost $24,350,987) | | $ 22,166,118 |
Cash | | 12,152 |
Receivable for investments sold | | 123,572 |
Receivable for fund shares sold | | 993 |
Dividends receivable | | 32,066 |
Distributions receivable from Fidelity Central Funds | | 930 |
Prepaid expenses | | 57 |
Receivable from investment adviser for expense reductions | | 4,161 |
Other receivables | | 3,981 |
Total assets | | 22,344,030 |
| | |
Liabilities | | |
Payable for fund shares redeemed | $ 38,243 | |
Accrued management fee | 9,750 | |
Distribution and service plan fees payable | 300 | |
Other affiliated payables | 2,742 | |
Other payables and accrued expenses | 42,019 | |
Collateral on securities loaned, at value | 1,327,150 | |
Total liabilities | | 1,420,204 |
| | |
Net Assets | | $ 20,923,826 |
Net Assets consist of: | | |
Paid in capital | | $ 47,549,038 |
Distributions in excess of et investment income | | (112) |
Accumulated undistributed net realized gain (loss) on investments and foreign currency transactions | | (24,440,240) |
Net unrealized appreciation (depreciation) on investments and assets and liabilities in foreign currencies | | (2,184,860) |
Net Assets | | $ 20,923,826 |
Statement of Assets and Liabilities - continued
| December 31, 2011 |
| | |
Initial Class: Net Asset Value, offering price and redemption price per share ($6,275,368 ÷ 677,345 shares) | | $ 9.26 |
| | |
Service Class: Net Asset Value, offering price and redemption price per share ($269,526 ÷ 29,085 shares) | | $ 9.27 |
| | |
Service Class 2: Net Asset Value, offering price and redemption price per share ($1,338,786 ÷ 144,895 shares) | | $ 9.24 |
| | |
Investor Class: Net Asset Value, offering price and redemption price per share ($13,040,146 ÷ 1,410,430 shares) | | $ 9.25 |
See accompanying notes which are an integral part of the financial statements.
Annual Report
Financial Statements - continued
Statement of Operations
| Year ended December 31, 2011 |
| | |
Investment Income | | |
Dividends | | $ 548,533 |
Income from Fidelity Central Funds | | 26,665 |
Total income | | 575,198 |
| | |
Expenses | | |
Management fee | $ 140,462 | |
Transfer agent fees | 36,314 | |
Distribution and service plan fees | 4,263 | |
Accounting and security lending fees | 10,198 | |
Custodian fees and expenses | 34,064 | |
Independent trustees' compensation | 145 | |
Audit | 48,292 | |
Legal | 228 | |
Miscellaneous | 281 | |
Total expenses before reductions | 274,247 | |
Expense reductions | (47,733) | 226,514 |
Net investment income (loss) | | 348,684 |
Realized and Unrealized Gain (Loss) Net realized gain (loss) on: | | |
Investment securities: | | |
Unaffiliated issuers | 625,962 | |
Foreign currency transactions | 40 | |
Total net realized gain (loss) | | 626,002 |
Change in net unrealized appreciation (depreciation) on: Investment securities | (2,681,923) | |
Assets and liabilities in foreign currencies | (155) | |
Total change in net unrealized appreciation (depreciation) | | (2,682,078) |
Net gain (loss) | | (2,056,076) |
Net increase (decrease) in net assets resulting from operations | | $ (1,707,392) |
Statement of Changes in Net Assets
| Year ended
December 31,
2011 | Year ended
December 31,
2010 |
Increase (Decrease) in Net Assets | | |
Operations | | |
Net investment income (loss) | $ 348,684 | $ 306,676 |
Net realized gain (loss) | 626,002 | (277,696) |
Change in net unrealized appreciation (depreciation) | (2,682,078) | 2,710,098 |
Net increase (decrease) in net assets resulting from operations | (1,707,392) | 2,739,078 |
Distributions to shareholders from net investment income | (331,450) | (362,992) |
Share transactions - net increase (decrease) | (5,959,726) | (7,962,055) |
Total increase (decrease) in net assets | (7,998,568) | (5,585,969) |
| | |
Net Assets | | |
Beginning of period | 28,922,394 | 34,508,363 |
End of period (including distributions in excess of net investment income of $112 and distributions in excess of net investment income of $27,180, respectively) | $ 20,923,826 | $ 28,922,394 |
See accompanying notes which are an integral part of the financial statements.
Annual Report
Financial Highlights - Initial Class
Years ended December 31, | 2011 | 2010 | 2009 | 2008 | 2007 |
Selected Per-Share Data | | | | | |
Net asset value, beginning of period | $ 10.23 | $ 9.42 | $ 7.49 | $ 13.89 | $ 14.82 |
Income from Investment Operations | | | | | |
Net investment income (loss) C | .15 | .10 | .12 | .20 | .20 |
Net realized and unrealized gain (loss) | (.97) | .84 | 1.97 | (6.39) | .48 |
Total from investment operations | (.82) | .94 | 2.09 | (6.19) | .68 |
Distributions from net investment income | (.15) | (.13) | (.16) | (.19) | (.21) |
Distributions from net realized gain | - | - | - | (.02) | (1.40) |
Total distributions | (.15) | (.13) | (.16) | (.21) | (1.61) |
Net asset value, end of period | $ 9.26 | $ 10.23 | $ 9.42 | $ 7.49 | $ 13.89 |
Total Return A, B | (8.00)% | 10.04% | 27.91% | (44.61)% | 4.56% |
Ratios to Average Net Assets D, F | | | | | |
Expenses before reductions | 1.04% | .90% | .89% | .81% | .80% |
Expenses net of fee waivers, if any | .85% | .85% | .85% | .81% | .80% |
Expenses net of all reductions | .84% | .85% | .85% | .81% | .80% |
Net investment income (loss) | 1.45% | 1.05% | 1.48% | 1.79% | 1.27% |
Supplemental Data | | | | | |
Net assets, end of period (000 omitted) | $ 6,275 | $ 9,855 | $ 12,826 | $ 18,847 | $ 30,300 |
Portfolio turnover rate E | 95% | 109% | 58% | 95% | 98% |
A Total returns do not reflect charges attributable to your insurance company's separate account. Inclusion of these charges would reduce the total returns shown.
B Total returns would have been lower if certain expenses had not been reduced during the applicable periods shown.
C Calculated based on average shares outstanding during the period.
D Fees and expenses of any underlying Fidelity Central Funds are not included in the Fund's expense ratio. The Fund indirectly bears its proportionate share of the expenses of any underlying Fidelity Central Funds.
E Amount does not include the portfolio activity of any underlying Fidelity Central Funds.
F Expense ratios reflect operating expenses of the class. Expenses before reductions do not reflect amounts reimbursed by the investment adviser or reductions from brokerage service arrangements or reductions from other expense offset arrangements and do not represent the amount paid by the class during periods when reimbursements or reductions occur. Expenses net of fee waivers reflect expenses after reimbursement by the investment adviser but prior to reductions from brokerage service arrangements or other expense offset arrangements. Expenses net of all reductions represent the net expenses paid by the class.
Financial Highlights - Service Class
Years ended December 31, | 2011 | 2010 | 2009 | 2008 | 2007 |
Selected Per-Share Data | | | | | |
Net asset value, beginning of period | $ 10.23 | $ 9.41 | $ 7.48 | $ 13.86 | $ 14.80 |
Income from Investment Operations | | | | | |
Net investment income (loss) C | .14 | .09 | .11 | .19 | .18 |
Net realized and unrealized gain (loss) | (.97) | .85 | 1.96 | (6.38) | .48 |
Total from investment operations | (.83) | .94 | 2.07 | (6.19) | .66 |
Distributions from net investment income | (.13) | (.12) | (.14) | (.17) | (.20) |
Distributions from net realized gain | - | - | - | (.02) | (1.40) |
Total distributions | (.13) | (.12) | (.14) | (.19) | (1.60) |
Net asset value, end of period | $ 9.27 | $ 10.23 | $ 9.41 | $ 7.48 | $ 13.86 |
Total Return A, B | (8.03)% | 10.01% | 27.80% | (44.69)% | 4.43% |
Ratios to Average Net Assets D, F | | | | | |
Expenses before reductions | 1.11% | .98% | .97% | .90% | .89% |
Expenses net of fee waivers, if any | .95% | .95% | .95% | .90% | .89% |
Expenses net of all reductions | .93% | .95% | .95% | .90% | .89% |
Net investment income (loss) | 1.35% | .95% | 1.38% | 1.70% | 1.18% |
Supplemental Data | | | | | |
Net assets, end of period (000 omitted) | $ 270 | $ 430 | $ 677 | $ 956 | $ 2,577 |
Portfolio turnover rate E | 95% | 109% | 58% | 95% | 98% |
A Total returns do not reflect charges attributable to your insurance company's separate account. Inclusion of these charges would reduce the total returns shown.
B Total returns would have been lower if certain expenses had not been reduced during the applicable periods shown.
C Calculated based on average shares outstanding during the period.
D Fees and expenses of any underlying Fidelity Central Funds are not included in the Fund's expense ratio. The Fund indirectly bears its proportionate share of the expenses of any underlying Fidelity Central Funds.
E Amount does not include the portfolio activity of any underlying Fidelity Central Funds.
F Expense ratios reflect operating expenses of the class. Expenses before reductions do not reflect amounts reimbursed by the investment adviser or reductions from brokerage service arrangements or reductions from other expense offset arrangements and do not represent the amount paid by the class during periods when reimbursements or reductions occur. Expenses net of fee waivers reflect expenses after reimbursement by the investment adviser but prior to reductions from brokerage service arrangements or other expense offset arrangements. Expenses net of all reductions represent the net expenses paid by the class.
See accompanying notes which are an integral part of the financial statements.
Annual Report
Financial Highlights - Service Class 2
Years ended December 31, | 2011 | 2010 | 2009 | 2008 | 2007 |
Selected Per-Share Data | | | | | |
Net asset value, beginning of period | $ 10.20 | $ 9.39 | $ 7.46 | $ 13.80 | $ 14.75 |
Income from Investment Operations | | | | | |
Net investment income (loss) C | .12 | .08 | .10 | .18 | .15 |
Net realized and unrealized gain (loss) | (.96) | .84 | 1.96 | (6.35) | .48 |
Total from investment operations | (.84) | .92 | 2.06 | (6.17) | .63 |
Distributions from net investment income | (.12) | (.11) | (.13) | (.15) | (.18) |
Distributions from net realized gain | - | - | - | (.02) | (1.40) |
Total distributions | (.12) | (.11) | (.13) | (.17) | (1.58) |
Net asset value, end of period | $ 9.24 | $ 10.20 | $ 9.39 | $ 7.46 | $ 13.80 |
Total Return A, B | (8.20)% | 9.81% | 27.70% | (44.77)% | 4.22% |
Ratios to Average Net Assets D, F | | | | | |
Expenses before reductions | 1.25% | 1.12% | 1.12% | 1.05% | 1.07% |
Expenses net of fee waivers, if any | 1.10% | 1.10% | 1.10% | 1.05% | 1.07% |
Expenses net of all reductions | 1.09% | 1.10% | 1.10% | 1.05% | 1.06% |
Net investment income (loss) | 1.20% | .80% | 1.23% | 1.55% | 1.01% |
Supplemental Data | | | | | |
Net assets, end of period (000 omitted) | $ 1,339 | $ 1,779 | $ 1,756 | $ 2,001 | $ 5,724 |
Portfolio turnover rate E | 95% | 109% | 58% | 95% | 98% |
A Total returns do not reflect charges attributable to your insurance company's separate account. Inclusion of these charges would reduce the total returns shown.
B Total returns would have been lower if certain expenses had not been reduced during the applicable periods shown.
C Calculated based on average shares outstanding during the period.
D Fees and expenses of any underlying Fidelity Central Funds are not included in the Fund's expense ratio. The Fund indirectly bears its proportionate share of the expenses of any underlying Fidelity Central Funds.
E Amount does not include the portfolio activity of any underlying Fidelity Central Funds.
F Expense ratios reflect operating expenses of the class. Expenses before reductions do not reflect amounts reimbursed by the investment adviser or reductions from brokerage service arrangements or reductions from other expense offset arrangements and do not represent the amount paid by the class during periods when reimbursements or reductions occur. Expenses net of fee waivers reflect expenses after reimbursement by the investment adviser but prior to reductions from brokerage service arrangements or other expense offset arrangements. Expenses net of all reductions represent the net expenses paid by the class.
Financial Highlights - Investor Class
Years ended December 31, | 2011 | 2010 | 2009 | 2008 | 2007 |
Selected Per-Share Data | | | | | �� |
Net asset value, beginning of period | $ 10.22 | $ 9.40 | $ 7.48 | $ 13.87 | $ 14.81 |
Income from Investment Operations | | | | | |
Net investment income (loss) C | .14 | .09 | .11 | .19 | .18 |
Net realized and unrealized gain (loss) | (.96) | .85 | 1.96 | (6.38) | .48 |
Total from investment operations | (.82) | .94 | 2.07 | (6.19) | .66 |
Distributions from net investment income | (.15) | (.12) | (.15) | (.18) | (.20) |
Distributions from net realized gain | - | - | - | (.02) | (1.40) |
Total distributions | (.15) | (.12) | (.15) | (.20) | (1.60) |
Net asset value, end of period | $ 9.25 | $ 10.22 | $ 9.40 | $ 7.48 | $ 13.87 |
Total Return A, B | (8.00)% | 10.08% | 27.72% | (44.67)% | 4.41% |
Ratios to Average Net Assets D, F | | | | | |
Expenses before reductions | 1.10% | .96% | .97% | .90% | .91% |
Expenses net of fee waivers, if any | .93% | .93% | .93% | .90% | .91% |
Expenses net of all reductions | .92% | .93% | .93% | .90% | .91% |
Net investment income (loss) | 1.37% | .97% | 1.40% | 1.71% | 1.16% |
Supplemental Data | | | | | |
Net assets, end of period (000 omitted) | $ 13,040 | $ 16,858 | $ 19,249 | $ 23,606 | $ 39,614 |
Portfolio turnover rate E | 95% | 109% | 58% | 95% | 98% |
A Total returns do not reflect charges attributable to your insurance company's separate account. Inclusion of these charges would reduce the total returns shown.
B Total returns would have been lower if certain expenses had not been reduced during the applicable periods shown.
C Calculated based on average shares outstanding during the period.
D Fees and expenses of any underlying Fidelity Central Funds are not included in the Fund's expense ratio. The Fund indirectly bears its proportionate share of the expenses of any underlying Fidelity Central Funds.
E Amount does not include the portfolio activity of any underlying Fidelity Central Funds.
F Expense ratios reflect operating expenses of the class. Expenses before reductions do not reflect amounts reimbursed by the investment adviser or reductions from brokerage service arrangements or reductions from other expense offset arrangements and do not represent the amount paid by the class during periods when reimbursements or reductions occur. Expenses net of fee waivers reflect expenses after reimbursement by the investment adviser but prior to reductions from brokerage service arrangements or other expense offset arrangements. Expenses net of all reductions represent the net expenses paid by the class.
See accompanying notes which are an integral part of the financial statements.
Annual Report
Notes to Financial Statements
For the period ended December 31, 2011
1. Organization.
VIP Value Leaders Portfolio (the Fund) is a fund of Variable Insurance Products Fund IV (the Trust) and is authorized to issue an unlimited number of shares. The Trust is registered under the Investment Company Act of 1940, as amended (the 1940 Act), as an open-end management investment company organized as a Massachusetts business trust. Shares of the Fund may only be purchased by insurance companies for the purpose of funding variable annuity or variable life insurance contracts. The Fund offers the following classes of shares: Initial Class shares, Service Class shares, Service Class 2 shares and Investor Class shares. All classes have equal rights and voting privileges, except for matters affecting a single class. Investment income, realized and unrealized capital gains and losses, the common expenses of the Fund, and certain fund-level expense reductions, if any, are allocated on a pro-rata basis to each class based on the relative net assets of each class to the total net assets of the Fund. Each class differs with respect to transfer agent and distribution and service plan fees incurred. Certain expense reductions may also differ by class.
2. Investments in Fidelity Central Funds.
The Fund invests in Fidelity Central Funds, which are open-end investment companies available only to other investment companies and accounts managed by Fidelity Management & Research Company (FMR) and its affiliates. The Fund's Schedule of Investments lists each of the Fidelity Central Funds held as of period end, if any, as an investment of the Fund, but do not include the underlying holdings of each Fidelity Central Fund. As an Investing Fund, the Fund indirectly bears its proportionate share of the expenses of the underlying Fidelity Central Funds.
The Money Market Central Funds seek preservation of capital and current income and are managed by Fidelity Investments Money Management, Inc. (FIMM), an affiliate of FMR.
A complete unaudited list of holdings for each Fidelity Central Fund is available upon request or at the Securities and Exchange Commission (the SEC) web site at www.sec.gov. In addition, the financial statements of the Fidelity Central Funds, which are not covered by the Fund's Report of Independent Registered Public Accounting Firm, are available on the SEC web site or upon request.
3. Significant Accounting Policies.
The financial statements have been prepared in conformity with accounting principles generally accepted in the United States of America (GAAP), which require management to make certain estimates and assumptions at the date of the financial statements. Actual results could differ from those estimates. Subsequent events, if any, through the date that the financial statements were issued have been evaluated in the preparation of the financial statements. The following summarizes the significant accounting policies of the Fund:
Security Valuation. Investments are valued as of 4:00 p.m. Eastern time on the last calendar day of the period. The Fund uses independent pricing services approved by the Board of Trustees to value its investments. When current market prices or quotations are not readily available or reliable, valuations may be determined in good faith in accordance with procedures adopted by the Board of Trustees. Factors used in determining value may include market or security specific events. The frequency with which these procedures are used cannot be predicted and they may be utilized to a significant extent. The value used for net asset value (NAV) calculation under these procedures may differ from published prices for the same securities.
The Fund categorizes the inputs to valuation techniques used to value its investments into a disclosure hierarchy consisting of three levels as shown below:
Level 1 - quoted prices in active markets for identical investments
Level 2 - other significant observable inputs (including quoted prices for similar investments, interest rates, prepayment speeds, etc.)
Level 3 - unobservable inputs (including the Fund's own assumptions based on the best information available)
Changes in valuation techniques may result in transfers in or out of an assigned level within the disclosure hierarchy. The aggregate value of investments by input level, as of December 31, 2011, is included at the end of the Fund's Schedule of Investments. Valuation techniques used to value the Fund's investments by major category are as follows:
Equity securities, including restricted securities, for which market quotations are readily available, are valued at the last reported sale price or official closing price as reported by an independent pricing service on the primary market or exchange on which they are traded and are categorized as Level 1 in the hierarchy. In the event there were no sales during the day or closing prices are not available, securities are valued at the last quoted bid price or may be valued using the last available price and are generally categorized as Level 2 in the hierarchy. For foreign equity securities, when significant market or security specific events arise, comparisons to the valuation of American Depositary Receipts (ADRs), futures contracts, Exchange-traded funds (ETFs) and certain indexes as well as quoted prices for similar securities are used and are categorized as Level 2 in the hierarchy in these circumstances. Utilizing these techniques may result in transfers between Level 1 and Level 2. For restricted equity securities and private placements where observable inputs are limited, assumptions about market activity and risk are used and are categorized as Level 3 in the hierarchy.
Annual Report
Notes to Financial Statements - continued
3. Significant Accounting Policies - continued
Security Valuation - continued
Investments in open-end mutual funds,including the Fidelity Central Funds, are valued at their closing net asset value each business day and are categorized as Level 1 in the hierarchy.
New Accounting Pronouncements. In May 2011, the Financial Accounting Standards Board issued Accounting Standard Update No. 2011-04, Fair Value Measurement (Topic 820) - Amendments to Achieve Common Fair Value Measurement and Disclosure Requirements in U.S. GAAP and IFRSs. The update is effective during interim and annual periods beginning after December 15, 2011 and will result in additional disclosure for transfers between levels as well as expanded disclosure for securities categorized as Level 3 under the fair value hierarchy.
In December 2011, the Financial Accounting Standards Board issued Accounting Standard Update No. 2011-11, Disclosures about Offsetting Assets and Liabilities. The update creates new disclosure requirements requiring entities to disclose both gross and net information for derivatives and other financial instruments that are either offset in the Statement of Assets and Liabilities or subject to an enforceable master netting arrangement or similar agreement. The disclosure requirements are effective for annual reporting periods beginning on or after January 1, 2013. Management is currently evaluating the impact of the update's adoption on the Fund's financial statement disclosures.
Foreign Currency. The Fund may use foreign currency contracts to facilitate transactions in foreign-denominated securities. Gains and losses from these transactions may arise from changes in the value of the foreign currency or if the counterparties do not perform under the contracts' terms.
Foreign-denominated assets, including investment securities, and liabilities are translated into U.S. dollars at the exchange rate at period end. Purchases and sales of investment securities, income and dividends received and expenses denominated in foreign currencies are translated into U.S. dollars at the exchange rate in effect on the transaction date.
The effects of exchange rate fluctuations on investments are included with the net realized and unrealized gain (loss) on investment securities. Other foreign currency transactions resulting in realized and unrealized gain (loss) are disclosed separately.
Investment Transactions and Income. For financial reporting purposes, the Fund's investment holdings and NAV include trades executed through the end of the last business day of the period. The NAV per share for processing shareholder transactions is calculated as of the close of business of the New York Stock Exchange (NYSE), normally 4:00 p.m. Eastern time and includes trades executed through the end of the prior business day. Gains and losses on securities sold are determined on the basis of identified cost and may include proceeds received from litigation. Dividend income is recorded on the ex-dividend date, except for certain dividends from foreign securities where the ex-dividend date may have passed, which are recorded as soon as the Fund is informed of the ex-dividend date. Non-cash dividends included in dividend income, if any, are recorded at the fair market value of the securities received. Distributions received on securities that represent a return of capital or capital gain are recorded as a reduction of cost of investments and/or as a realized gain. The Fund estimates the components of distributions received that may be considered return of capital distributions or capital gain distributions. Interest income and distributions from the Fidelity Central Funds are accrued as earned. Interest income includes coupon interest and amortization of premium and accretion of discount on debt securities. Investment income is recorded net of foreign taxes withheld where recovery of such taxes is uncertain.
Expenses. Expenses directly attributable to a fund are charged to that fund. Expenses attributable to more than one fund are allocated among the respective funds on the basis of relative net assets or other appropriate methods. Expense estimates are accrued in the period to which they relate and adjustments are made when actual amounts are known.
Income Tax Information and Distributions to Shareholders. Each year, the Fund intends to qualify as a regulated investment company, including distributing substantially all of its taxable income and realized gains under Subchapter M of the Internal Revenue Code. As a result, no provision for income taxes is required. As of December 31, 2011, the Fund did not have any unrecognized tax benefits in the financial statements; nor is the Fund aware of any tax positions for which it is reasonably possible that the total amounts of unrecognized tax benefits will significantly change in the next twelve months. The Fund files a U.S. federal tax return, in addition to state and local tax returns as required. A fund's tax returns are subject to examination by the Internal Revenue Service (IRS) for a period of three fiscal years. State and local tax returns may be subject to examination for an additional fiscal year depending on the jurisdiction. Foreign taxes are provided for based on the Fund's understanding of the tax rules and rates that exist in the foreign markets in which it invests.
Distributions are declared and recorded on the ex-dividend date. Income dividends and capital gain distributions are declared separately for each class. Income and capital gain distributions are determined in accordance with income tax regulations, which may differ from GAAP.
Capital accounts within the financial statements are adjusted for permanent book-tax differences. These adjustments have no impact on net assets or the results of operations. Temporary book-tax differences will reverse in a subsequent period.
Book-tax differences are primarily due to foreign currency transactions, capital loss carryforwards and losses deferred due to wash sales and excise tax regulations.
Annual Report
3. Significant Accounting Policies - continued
Income Tax Information and Distributions to Shareholders - continued
The federal tax cost of investment securities and unrealized appreciation (depreciation) as of period end were as follows:
Gross unrealized appreciation | $ 1,747,176 |
Gross unrealized depreciation | (4,525,495) |
Net unrealized appreciation (depreciation) on securities and other investments | $ (2,778,319) |
| |
Tax Cost | $ 24,944,437 |
The tax-based components of distributable earnings as of period end were as follows:
Capital loss carryforward | $ (23,846,790) |
Net unrealized appreciation (depreciation) | $ (2,778,310) |
Capital loss carryforwards are only available to offset future capital gains of the Fund to the extent provided by regulations and may be limited. Under the Regulated Investment Company Modernization Act of 2010 (the Act), the Fund is permitted to carry forward capital losses incurred in taxable years beginning after December 22, 2010 for an unlimited period and such capital losses are required to be used prior to any losses that expire. Capital loss carryforwards were as follows:
Fiscal year of expiration | |
2016 | $ (11,669,055) |
2017 | (11,445,222) |
Total with expiration | (23,114,277) |
No expiration | |
Long-term | (732,513) |
Total capital loss carryforward | $ (23,846,790) |
The tax character of distributions paid was as follows:
| December 31, 2011 | December 31, 2010 |
Ordinary Income | $ 331,450 | $ 362,992 |
4. Purchases and Sales of Investments.
Purchases and sales of securities, other than short-term securities, aggregated $23,660,886 and $29,497,048, respectively.
5. Fees and Other Transactions with Affiliates.
Management Fee. FMR and its affiliates provide the Fund with investment management related services for which the Fund pays a monthly management fee. The management fee is the sum of an individual fund fee rate that is based on an annual rate of .30% of the Fund's average net assets and an annualized group fee rate that averaged .26% during the period. The group fee rate is based upon the average net assets of all the mutual funds advised by FMR. The group fee rate decreases as assets under management increase and increases as assets under management decrease. For the period, the total annual management fee rate was .56% of the Fund's average net assets.
Distribution and Service Plan Fees. In accordance with Rule 12b-1 of the 1940 Act, the Fund has adopted separate 12b-1 Plans for each Service Class of shares. Each Service Class pays Fidelity Distributors Corporation (FDC), an affiliate of FMR, a service fee. For the period, the service fee is based on an annual rate of .10% of Service Class' average net assets and .25% of Service Class 2's average net assets.
For the period, total fees, all of which were re-allowed to insurance companies for the distribution of shares and providing shareholder support services were as follows:
Service Class | $ 350 |
Service Class 2 | 3,913 |
| $ 4,263 |
Transfer Agent Fees. Fidelity Investments Institutional Operations Company, Inc. (FIIOC), an affiliate of FMR, is the Fund's transfer, dividend disbursing, and shareholder servicing agent. FIIOC receives an asset-based fee with respect to each class. Each class (with the exception of Investor
Annual Report
Notes to Financial Statements - continued
5. Fees and Other Transactions with Affiliates - continued
Transfer Agent Fees - continued
Class) pays a transfer agent fee, excluding out of pocket expenses, equal to an annual rate of .07% of average net assets. Investor Class pays a monthly asset-based transfer agent fee of .15% of average net assets. In addition, FIIOC receives an asset-based fee of .0045% of average net assets for typesetting, printing and mailing of shareholder reports, except proxy statements. FIIOC voluntarily agreed to waive this fee for the period August 1, 2011 through December 31, 2011 (see Expense Reductions note). For the period, transfer agent fees for each class, including printing and out of pocket expenses, were as follows:
Initial Class | $ 8,892 |
Service Class | 303 |
Service Class 2 | 1,138 |
Investor Class | 25,981 |
| $ 36,314 |
Accounting and Security Lending Fees. Fidelity Service Company, Inc. (FSC), an affiliate of FMR, maintains the Fund's accounting records. The accounting fee is based on the level of average net assets for the month. Under a separate contract, FSC administers the security lending program. The security lending fee is based on the number and duration of lending transactions.
Brokerage Commissions. The Fund placed a portion of its portfolio transactions with brokerage firms which are affiliates of the investment adviser. The commissions paid to these affiliated firms were $1,782 for the period.
6. Committed Line of Credit.
The Fund participates with other funds managed by FMR or an affiliate in a $4.0 billion credit facility (the "line of credit") to be utilized for temporary or emergency purposes to fund shareholder redemptions or for other short-term liquidity purposes. The Fund has agreed to pay commitment fees on its pro-rata portion of the line of credit, which amounted to $83 and is reflected in Miscellaneous expenses on the Statement of Operations. During the period, there were no borrowings on this line of credit.
7. Security Lending.
The Fund lends portfolio securities through a lending agent from time to time in order to earn additional income. For equity securities, a lending agent is used and may loan securities to certain qualified borrowers, including Fidelity Capital Markets (FCM), a broker-dealer affiliated with the Fund. On the settlement date of the loan, the Fund receives collateral (in the form of U.S. Treasury obligations, letters of credit and/or cash) against the loaned securities and maintains collateral in an amount not less than 100% of the market value of the loaned securities during the period of the loan. The market value of the loaned securities is determined at the close of business of the Fund and any additional required collateral is delivered to the Fund on the next business day. If the borrower defaults on its obligation to return the securities loaned because of insolvency or other reasons, a fund could experience delays and costs in recovering the securities loaned or in gaining access to the collateral. Any cash collateral received is invested in the Fidelity Securities Lending Cash Central Fund. The value of loaned securities and cash collateral at period end are disclosed on the Fund's Statement of Assets and Liabilities. Security lending income represents the income earned on investing cash collateral, less rebates paid to borrowers and any lending agent fees associated with the loan, plus any premium payments received for lending certain types of securities. Security lending income is presented in the Statement of Operations as a component of income from Fidelity Central Funds. Total security lending income during the period amounted to $26,008. During the period, there were no securities loaned to FCM.
8. Expense Reductions.
In addition to FIIOC waiving a portion of its transfer agent fees, FMR voluntarily agreed to reimburse each class to the extent annual operating expenses exceeded certain levels of average net assets as noted in the table below. Some expenses, for example interest expense, including commitment fees, are excluded from this reimbursement.
Expenses were reimbursed and/or waived for the following classes during the period:
| Expense
Limitations | Reimbursement
from adviser |
Initial Class | .85% | $ 15,203 |
Service Class | .95% | 565 |
Service Class 2 | 1.10% | 2,362 |
Investor Class | .93% | 25,755 |
| | $ 43,885 |
Annual Report
8. Expense Reductions - continued
Many of the brokers with whom FMR places trades on behalf of the Fund provided services to the Fund in addition to trade execution. These services included payments of certain expenses on behalf of the Fund totaling $3,848 for the period.
9. Distributions to Shareholders.
Distributions to shareholders of each class were as follows:
Years ended December 31, | 2011 | 2010 |
From net investment income | | |
Initial Class | $ 99,535 | $ 130,937 |
Service Class | 3,840 | 5,302 |
Service Class 2 | 17,228 | 18,862 |
Investor Class | 210,847 | 207,891 |
Total | $ 331,450 | $ 362,992 |
10. Share Transactions.
Transactions for each class of shares were as follows:
| Shares | Dollars |
Years ended December 31, | 2011 | 2010 | 2011 | 2010 |
Initial Class | | | | |
Shares sold | 67,644 | 106,286 | $ 658,893 | $ 1,020,513 |
Reinvestment of distributions | 11,121 | 13,140 | 99,535 | 130,937 |
Shares redeemed | (364,424) | (518,502) | (3,700,171) | (4,946,649) |
Net increase (decrease) | (285,659) | (399,076) | $ (2,941,743) | $ (3,795,199) |
Service Class | | | | |
Shares sold | - | - | - | - |
Reinvestment of distributions | 429 | 533 | 3,840 | 5,302 |
Shares redeemed | (13,370) | (30,453) | (133,345) | (288,127) |
Net increase (decrease) | (12,941) | (29,920) | $ (129,505) | $ (282,825) |
Service Class 2 | | | | |
Shares sold | 28,489 | 42,974 | $ 291,665 | $ 405,896 |
Reinvestment of distributions | 1,931 | 1,899 | 17,228 | 18,862 |
Shares redeemed | (59,928) | (57,569) | (617,328) | (536,974) |
Net increase (decrease) | (29,508) | (12,696) | $ (308,435) | $ (112,216) |
Investor Class | | | | |
Shares sold | 384,886 | 328,691 | $ 3,848,967 | $ 3,157,179 |
Reinvestment of distributions | 23,611 | 20,878 | 210,847 | 207,891 |
Shares redeemed | (647,446) | (746,921) | (6,639,857) | (7,136,885) |
Net increase (decrease) | (238,949) | (397,352) | $ (2,580,043) | $ (3,771,815) |
11. Other.
The Fund's organizational documents provide former and current trustees and officers with a limited indemnification against liabilities arising in connection with the performance of their duties to the Fund. In the normal course of business, the Fund may also enter into contracts that provide general indemnifications. The Fund's maximum exposure under these arrangements is unknown as this would be dependent on future claims that may be made against the Fund. The risk of material loss from such claims is considered remote.
At the end of the period, FMR or its affiliates were the owners of record of 93% of the total outstanding shares of the Fund.
Annual Report
Report of Independent Registered Public Accounting Firm
To the Trustees of Variable Insurance Products Fund IV and the Shareholders of VIP Value Leaders Portfolio:
In our opinion, the accompanying statement of assets and liabilities, including the schedule of investments, and the related statements of operations and of changes in net assets and the financial highlights present fairly, in all material respects, the financial position of VIP Value Leaders Portfolio (a fund of Variable Insurance Products Fund IV) at December 31, 2011, the results of its operations for the year then ended, the changes in its net assets for each of the two years in the period then ended and the financial highlights for each of the five years in the period then ended, in conformity with accounting principles generally accepted in the United States of America. These financial statements and financial highlights (hereafter referred to as "financial statements") are the responsibility of the VIP Value Leaders Portfolio's management. Our responsibility is to express an opinion on these financial statements based on our audits. We conducted our audits of these financial statements in accordance with the standards of the Public Company Accounting Oversight Board (United States). Those standards require that we plan and perform the audit to obtain reasonable assurance about whether the financial statements are free of material misstatement. An audit includes examining, on a test basis, evidence supporting the amounts and disclosures in the financial statements, assessing the accounting principles used and significant estimates made by management, and evaluating the overall financial statement presentation. We believe that our audits, which included confirmation of securities at December 31, 2011 by correspondence with the custodian and brokers, provide a reasonable basis for our opinion.
/s/ PricewaterhouseCoopers LLP
PricewaterhouseCoopers LLP
Boston, Massachusetts
February 14, 2012
Annual Report
The Trustees, Members of the Advisory Board, and executive officers of the trust and fund, as applicable, are listed below. The Board of Trustees governs the fund and is responsible for protecting the interests of shareholders. The Trustees are experienced executives who meet periodically throughout the year to oversee the fund's activities, review contractual arrangements with companies that provide services to the fund, oversee management of the risks associated with such activities and contractual arrangements, and review the fund's performance. Except for James C. Curvey, each of the Trustees oversees 226 funds advised by FMR or an affiliate. Mr. Curvey oversees 429 funds advised by FMR or an affiliate.
The Trustees hold office without limit in time except that (a) any Trustee may resign; (b) any Trustee may be removed by written instrument, signed by at least two-thirds of the number of Trustees prior to such removal; (c) any Trustee who requests to be retired or who has become incapacitated by illness or injury may be retired by written instrument signed by a majority of the other Trustees; and (d) any Trustee may be removed at any special meeting of shareholders by a two-thirds vote of the outstanding voting securities of the trust. Each Trustee who is not an interested person (as defined in the 1940 Act) (Independent Trustee), shall retire not later than the last day of the calendar year in which his or her 75th birthday occurs. The Independent Trustees may waive this mandatory retirement age policy with respect to individual Trustees. The executive officers and Advisory Board Members hold office without limit in time, except that any officer and Advisory Board Member may resign or may be removed by a vote of a majority of the Trustees at any regular meeting or any special meeting of the Trustees. Except as indicated, each individual has held the office shown or other offices in the same company for the past five years.
Experience, Skills, Attributes, and Qualifications of the Fund's Trustees. The Governance and Nominating Committee has adopted a statement of policy that describes the experience, qualifications, attributes, and skills that are necessary and desirable for potential Independent Trustee candidates (Statement of Policy). The Board believes that each Trustee satisfied at the time he or she was initially elected or appointed a Trustee, and continues to satisfy, the standards contemplated by the Statement of Policy. The Governance and Nominating Committee also engages professional search firms to help identify potential Independent Trustee candidates who have the experience, qualifications, attributes, and skills consistent with the Statement of Policy. From time to time, additional criteria based on the composition and skills of the current Independent Trustees, as well as experience or skills that may be appropriate in light of future changes to board composition, business conditions, and regulatory or other developments, have also been considered by the professional search firms and the Governance and Nominating Committee. In addition, the Board takes into account the Trustees' commitment and participation in Board and committee meetings, as well as their leadership of standing and ad hoc committees throughout their tenure.
In determining that a particular Trustee was and continues to be qualified to serve as a Trustee, the Board has considered a variety of criteria, none of which, in isolation, was controlling. The Board believes that, collectively, the Trustees have balanced and diverse experience, qualifications, attributes, and skills, which allow the Board to operate effectively in governing the fund and protecting the interests of shareholders. Information about the specific experience, skills, attributes, and qualifications of each Trustee, which in each case led to the Board's conclusion that the Trustee should serve (or continue to serve) as a trustee of the fund, is provided below.
Board Structure and Oversight Function. James C. Curvey is an interested person (as defined in the 1940 Act) and currently serves as Acting Chairman. The Trustees have determined that an interested Chairman is appropriate and benefits shareholders because an interested Chairman has a personal and professional stake in the quality and continuity of services provided to the fund. Independent Trustees exercise their informed business judgment to appoint an individual of their choosing to serve as Chairman, regardless of whether the Trustee happens to be independent or a member of management. The Independent Trustees have determined that they can act independently and effectively without having an Independent Trustee serve as Chairman and that a key structural component for assuring that they are in a position to do so is for the Independent Trustees to constitute a substantial majority for the Board. The Independent Trustees also regularly meet in executive session. Ned C. Lautenbach serves as Chairman of the Independent Trustees and as such (i) acts as a liaison between the Independent Trustees and management with respect to matters important to the Independent Trustees and (ii) with management prepares agendas for Board meetings.
Fidelity funds are overseen by different Boards of Trustees. The fund's Board oversees Fidelity's equity and high income funds and another Board oversees Fidelity's investment-grade bond, money market, and asset allocation funds. The asset allocation funds may invest in Fidelity funds overseen by the fund's Board. The use of separate Boards, each with its own committee structure, allows the Trustees of each group of Fidelity funds to focus on the unique issues of the funds they oversee, including common research, investment, and operational issues. On occasion, the separate Boards establish joint committees to address issues of overlapping consequences for the Fidelity funds overseen by each Board.
The Trustees operate using a system of committees to facilitate the timely and efficient consideration of all matters of importance to the Trustees, the fund, and fund shareholders and to facilitate compliance with legal and regulatory requirements and oversight of the fund's activities and associated risks. The Board, acting through its committees, has charged FMR and its affiliates with (i) identifying events or circumstances the occurrence of which could have demonstrably adverse effects on the fund's business and/or reputation; (ii) implementing processes and controls to lessen the possibility that such events or circumstances occur or to mitigate the effects of such events or circumstances if they do occur; and (iii) creating and maintaining a system designed to evaluate continuously business and market conditions in order to facilitate the identification and implementation processes described in (i) and (ii) above. Because the day-to-day operations and activities of the fund are carried out by or through FMR, its affiliates and other service providers, the fund's exposure to risks is mitigated but not eliminated by the processes overseen by the Trustees. While each of the Board's committees has responsibility for overseeing different aspects of the fund's activities, oversight is exercised primarily through the Operations, Audit, and Compliance Committees. In addition, the Independent Trustees have worked with FMR to enhance the Board's oversight of investment and financial risks, legal and regulatory risks, technology risks, and operational risks, including the development of additional risk reporting to the Board. For example, a working group comprised of Independent Trustees and FMR has worked and continues to work to review the Fidelity funds' valuation-related activities, reporting and risk management. Appropriate personnel, including but not limited to the fund's Chief Compliance Officer (CCO), FMR's internal auditor, the independent accountants, the fund's Treasurer and portfolio management personnel, make periodic reports to the Board's committees, as appropriate, including an annual review of FMR's risk management program for the Fidelity funds. The responsibilities of each standing committee, including their oversight responsibilities, are described further under "Standing Committees of the Fund's Trustees."
Annual Report
The fund's Statement of Additional Information (SAI) includes more information about the Trustees. To request a free copy, call Fidelity at 1-800-208-0098.
Interested Trustees*:
Correspondence intended for each Trustee who is an interested person may be sent to Fidelity Investments, 82 Devonshire Street, Boston, Massachusetts 02109.
Name, Age; Principal Occupations and Other Relevant Experience+ |
James C. Curvey (76) |
| Year of Election or Appointment: 2007 Mr. Curvey is Trustee and Acting Chairman of the Board of Trustees of certain Trusts. Mr. Curvey also serves as Trustee (2007-present) of other investment companies advised by FMR. Mr. Curvey is a Director of Fidelity Investments Money Management, Inc. (2009-present), Director of Fidelity Research & Analysis Co. (2009-present) and Director of FMR and FMR Co., Inc. (2007-present). Mr. Curvey is also Vice Chairman (2007-present) and Director of FMR LLC. In addition, Mr. Curvey serves as an Overseer for the Boston Symphony Orchestra and a member of the Trustees of Villanova University. Previously, Mr. Curvey was the Vice Chairman (2006-2007) and Director (2000-2007) of FMR Corp. |
Ronald P. O'Hanley (54) |
| Year of Election or Appointment: 2011 Mr. O'Hanley is Director of FMR Co., Inc. (2010-present), Director of Fidelity Investments Money Management, Inc. (2010-present), Director of Fidelity Research & Analysis Company (2010-present), President of Fidelity Asset Management and Corporate Services and a member of Fidelity's Executive Committee (2010-present). Previously, Mr. O'Hanley served as President and Chief Executive Officer of BNY Mellon Asset Management (2007-2010). Mr. O'Hanley also served as Vice Chairman of Bank New York Mellon Corp. and a member of that firm's Executive Committee. Prior to the 2007 merger of The Bank of New York and Mellon Financial Corporation, he was Vice Chairman of Mellon Financial Corporation and President and Chief Executive Officer of Mellon Asset Management. He joined Mellon in February 1997. Mr. O'Hanley currently serves as Chairman of the Boston Public Library Foundation Board of Directors and sits on the Board of Directors of Beth Israel Deaconess Medical Center, the Board of Trustees of the Marine Biological Laboratory and the Advisory Board of the Maxwell School of Citizenship and Public Administration at Syracuse University. Mr. O'Hanley also chairs the Council on Asset Management for the Financial Services Roundtable and is a member of the Board of Directors of Institutional Investor's U.S. Institute. |
* Trustees have been determined to be "Interested Trustees" by virtue of, among other things, their affiliation with the trust or various entities under common control with FMR.
+ The information above includes each Trustee's principal occupation during the last five years and other information relating to the experience, attributes, and skills relevant to each Trustee's qualifications to serve as a Trustee, which led to the conclusion that each Trustee should serve as a Trustee for the fund.
Independent Trustees:
Correspondence intended for each Independent Trustee (that is, the Trustees other than the Interested Trustees) may be sent to Fidelity Investments, P.O. Box 55235, Boston, Massachusetts 02205-5235.
Name, Age; Principal Occupations and Other Relevant Experience+ |
Dennis J. Dirks (63) |
| Year of Election or Appointment: 2005 Prior to his retirement in May 2003, Mr. Dirks was Chief Operating Officer and a member of the Board of The Depository Trust & Clearing Corporation (DTCC). He also served as President, Chief Operating Officer, and Board member of The Depository Trust Company (DTC) and President and Board member of the National Securities Clearing Corporation (NSCC). In addition, Mr. Dirks served as Chief Executive Officer and Board member of the Government Securities Clearing Corporation, Chief Executive Officer and Board member of the Mortgage-Backed Securities Clearing Corporation, as a Trustee and a member of the Finance Committee of Manhattan College (2005-2008), and as a Trustee and a member of the Finance Committee of AHRC of Nassau County (2006-2008). Mr. Dirks is a member of the Independent Directors Council (IDC) Governing Council (2010-present) and Board of Directors for The Brookville Center for Children's Services, Inc. (2009-present). |
Alan J. Lacy (58) |
| Year of Election or Appointment: 2008 Mr. Lacy serves as Senior Adviser (2007-present) of Oak Hill Capital Partners, L.P. (private equity). Mr. Lacy also served as Chief Executive Officer (2000-2005) and Vice Chairman (2005-2006) of Sears Holdings Corporation and Sears, Roebuck and Co. (retail). In addition, Mr. Lacy serves as a member of the Board of Directors of Dave & Buster's, Inc. (restaurant and entertainment complexes, 2010-present), The Hillman Companies, Inc. (hardware wholesalers, 2010-present), and Bristol-Myers Squibb Company (global pharmaceuticals, 2007-present). Mr. Lacy is a member of the Board of Trustees of The National Parks Conservation Association (2006-present). Previously, Mr. Lacy served as Chairman of the Board of Trustees of the National Parks Conservation Association (2008-2011) and as a member of the Board of Directors for the Western Union Company (global money transfer, 2006-2011). |
Ned C. Lautenbach (67) |
| Year of Election or Appointment: 2000 Mr. Lautenbach is Chairman of the Independent Trustees of the Equity and High Income Funds (2006-present). Mr. Lautenbach currently serves as the Lead Director of the Eaton Corporation Board of Directors (diversified industrial, 1997-present). Mr. Lautenbach is also a member of the Board of Directors of the Philharmonic Center for the Arts in Naples, Florida (1999-present); a member of the Board of Trustees of Fairfield University (2005-present); and a member of the Council on Foreign Relations (1994-present). Previously, Mr. Lautenbach was a Partner/Advisory Partner at Clayton, Dubilier & Rice, LLC (private equity investment, 1998-2010), as well as a Director of Sony Corporation (2006-2007). |
Joseph Mauriello (67) |
| Year of Election or Appointment: 2008 Prior to his retirement in January 2006, Mr. Mauriello served in numerous senior management positions including Deputy Chairman and Chief Operating Officer (2004-2005), and Vice Chairman of Financial Services (2002-2004) of KPMG LLP US (professional services, 1965-2005). Mr. Mauriello currently serves as a member of the Board of Directors of XL Group plc. (global insurance and re-insurance, 2006-present) and of Arcadia Resources Inc. (health care services and products, 2007-present). Previously, Mr. Mauriello served as a Director of the Hamilton Funds of the Bank of New York (2006-2007). |
Robert W. Selander (61) |
| Year of Election or Appointment: 2011 Previously, Mr. Selander served as a Member of the Advisory Board of Fidelity's Equity and High Income Funds (2011), Executive Vice Chairman (2010), Chief Executive Officer (2009-2010), and President and Chief Executive Officer (1997-2009) of Mastercard, Inc. |
Cornelia M. Small (67) |
| Year of Election or Appointment: 2005 Ms. Small is a member of the Board of Directors of the Teagle Foundation (2009-present). Ms. Small is also a member of the Investment Committee, and Chair (2008-present) and a member of the Board of Trustees of Smith College. In addition, Ms. Small serves on the Investment Committee of the Berkshire Taconic Community Foundation (2008-present). Previously, Ms. Small served as Chairperson of the Investment Committee (2002-2008) of Smith College. In addition, Ms. Small served as Chief Investment Officer, Director of Global Equity Investments, and a member of the Board of Directors of Scudder, Stevens & Clark and Scudder Kemper Investments. |
William S. Stavropoulos (72) |
| Year of Election or Appointment: 2001 Mr. Stavropoulos is Vice Chairman of the Independent Trustees of the Equity and High Income Funds (2006-present). Mr. Stavropoulos serves as President and Founder of the Michigan Baseball Foundation, the Great Lakes Loons (2007-present). Mr. Stavropoulos is Chairman Emeritus of the Board of Directors of The Dow Chemical Company, where he previously served in numerous senior management positions, including President, CEO (1995-2000; 2002-2004), Chairman of the Executive Committee (2000-2006), and as a member of the Board of Directors (1990-2006). Currently, Mr. Stavropoulos is Chairman of Univar (global distributor of commodity and specialty chemicals, 2010-present), a Director of Teradata Corporation (data warehousing and technology solutions, 2008-present), Chemical Financial Corporation, Maersk Inc. (industrial conglomerate), Tyco International, Inc. (multinational manufacturing and services, 2007-present), and a member of the Advisory Board for Metalmark Capital (private equity investment, 2005-present). Mr. Stavropoulos is a special advisor to Clayton, Dubilier & Rice, LLC (private equity investment). In addition, Mr. Stavropoulos is a member of the University of Notre Dame Advisory Council for the College of Science. |
David M. Thomas (62) |
| Year of Election or Appointment: 2008 Previously, Mr. Thomas served as Executive Chairman (2005-2006) and Chairman and Chief Executive Officer (2000-2005) of IMS Health, Inc. (pharmaceutical and healthcare information solutions). In addition, Mr. Thomas serves as a member of the Board of Directors of Fortune Brands, Inc. (consumer products), and Interpublic Group of Companies, Inc. (marketing communication, 2004-present). |
Michael E. Wiley (61) |
| Year of Election or Appointment: 2008 Mr. Wiley also serves as a Director of Asia Pacific Exploration Consolidated (international oil and gas exploration and production, 2008-present). Mr. Wiley serves as a Director of Tesoro Corporation (independent oil refiner and marketer, 2005-present), and a Director of Bill Barrett Corporation (exploration and production, 2005-present). In addition, Mr. Wiley also serves as a Director of Post Oak Bank (privately-held bank, 2004-present). Previously, Mr. Wiley served as a member of the Board of Trustees of the University of Tulsa (2000-2006; 2007-2010), as a Senior Energy Advisor of Katzenbach Partners, LLC (consulting, 2006-2007), as an Advisory Director of Riverstone Holdings (private investment), Chairman, President, and CEO of Baker Hughes, Inc. (oilfield services, 2000-2004), and as Director of Spinnaker Exploration Company (exploration and production, 2001-2005). |
+ The information above includes each Trustee's principal occupation during the last five years and other information relating to the experience, attributes, and skills relevant to each Trustee's qualifications to serve as a Trustee, which led to the conclusion that each Trustee should serve as a Trustee for the fund.
Advisory Board Members and Executive Officers:
Correspondence intended for each executive officer, Edward C. Johnson 3d, and Peter S. Lynch may be sent to Fidelity Investments, 82 Devonshire Street, Boston, Massachusetts 02109.
Name, Age; Principal Occupation |
Edward C. Johnson 3d (81) |
| Year of Election or Appointment: 2011 Member of the Advisory Board of Fidelity's Equity and High Income Funds. Mr. Johnson serves as Chief Executive Officer, Chairman, and a Director of FMR LLC, and also serves as Chairman and Director of FIL Limited. Previously, Mr. Johnson served as a Trustee and Chairman of the Board of certain Fidelity Trusts, Chairman and a Director of FMR, Chairman and a Director of FMR Co., Inc., and President of FMR LLC (2006-2007). |
Peter S. Lynch (67) |
| Year of Election or Appointment: 2003 Member of the Advisory Board of Fidelity's Equity and High Income Funds. Mr. Lynch is Vice Chairman and a Director of FMR and FMR Co., Inc. In addition, Mr. Lynch serves as a Trustee of Boston College and as the Chairman of the Inner-City Scholarship Fund. Previously, Mr. Lynch served on the Special Olympics International Board of Directors (1997-2006). |
Kenneth B. Robins (42) |
| Year of Election or Appointment: 2008 President and Treasurer of Fidelity's Equity and High Income Funds. Mr. Robins also serves as President and Treasurer (2010-present) and Assistant Treasurer (2009-present) of other Fidelity funds and is an employee of Fidelity Investments (2004-present). Previously, Mr. Robins served as Deputy Treasurer of the Fidelity funds (2005-2008) and Treasurer and Chief Financial Officer of The North Carolina Capital Management Trust: Cash and Term Portfolios (2006-2008). |
Brian B. Hogan (47) |
| Year of Election or Appointment: 2009 Vice President of Equity and High Income Funds. Mr. Hogan also serves as President of FMR's Equity Division (2009-present). Previously, Mr. Hogan served as Senior Vice President, Equity Research of FMR (2006-2009) and as a portfolio manager. |
Thomas C. Hense (47) |
| Year of Election or Appointment: 2008 or 2010 Vice President of Fidelity's High Income (2008), Small Cap (2008), and Value (2010) Funds. Previously, Mr. Hense served as a portfolio manager for Fidelity's Institutional Money Management Group (Pyramis) (2003-2008). |
Scott C. Goebel (43) |
| Year of Election or Appointment: 2008 Secretary and Chief Legal Officer (CLO) of the Fidelity funds. Mr. Goebel also serves as Secretary of Fidelity Investments Money Management, Inc. (FIMM) (2010-present) and Fidelity Research and Analysis Company (FRAC) (2010-present); Secretary and CLO of The North Carolina Capital Management Trust: Cash and Term Portfolios (2008-present); General Counsel, Secretary, and Senior Vice President of FMR (2008-present) and FMR Co., Inc. (2008-present); employed by FMR LLC or an affiliate (2001-present); Chief Legal Officer of Fidelity Management & Research (Hong Kong) Limited (2008-present) and Assistant Secretary of Fidelity Management & Research (Japan) Inc. (2008-present), and Fidelity Management & Research (U.K.) Inc. (2008-present). Previously, Mr. Goebel served as Assistant Secretary of FIMM (2008-2010), FRAC (2008-2010), and the Funds (2007-2008) and as Vice President and Secretary of Fidelity Distributors Corporation (FDC) (2005-2007). |
William C. Coffey (42) |
| Year of Election or Appointment: 2009 Assistant Secretary of Fidelity's Equity and High Income Funds. Mr. Coffey also serves as Senior Vice President and Deputy General Counsel of FMR LLC (2010-present), and is an employee of Fidelity Investments. Previously, Mr. Coffey served as Vice President and Associate General Counsel of FMR LLC (2005-2009). |
Holly C. Laurent (57) |
| Year of Election or Appointment: 2008 Anti-Money Laundering (AML) Officer of the Fidelity funds. Ms. Laurent also serves as AML Officer of The North Carolina Capital Management Trust: Cash and Term Portfolios (2008-present) and is an employee of Fidelity Investments. Previously, Ms. Laurent was Senior Vice President and Head of Legal for Fidelity Business Services India Pvt. Ltd. (2006-2008), and Senior Vice President, Deputy General Counsel and Group Head for FMR LLC (2005-2006). |
Christine Reynolds (53) |
| Year of Election or Appointment: 2008 Chief Financial Officer of the Fidelity funds. Ms. Reynolds became President of Fidelity Pricing and Cash Management Services (FPCMS) in August 2008. Ms. Reynolds served as Chief Operating Officer of FPCMS (2007-2008). Previously, Ms. Reynolds served as President, Treasurer, and Anti-Money Laundering officer of the Fidelity funds (2004-2007). |
Kenneth A. Rathgeber (64) |
| Year of Election or Appointment: 2004 Chief Compliance Officer of Fidelity's Equity and High Income Funds. Mr. Rathgeber is Chief Compliance Officer of Fidelity Management & Research (Hong Kong) Limited (2008-present), Fidelity Management & Research (Japan) Inc. (2008-present), FMR (2005-present), FMR Co., Inc. (2005-present), Fidelity Management & Research (U.K.) Inc. (2005-present), Fidelity Research & Analysis Company (2005-present), Fidelity Investments Money Management, Inc. (2005-present), Pyramis Global Advisors, LLC (2005-present), and Strategic Advisers, Inc. (2005-present). |
Jeffrey S. Christian (50) |
| Year of Election or Appointment: 2009 Deputy Treasurer of the Fidelity funds. Mr. Christian is an employee of Fidelity Investments. Previously, Mr. Christian served as Chief Financial Officer (2008-2009) of certain Fidelity funds and Senior Vice President of Fidelity Pricing and Cash Management Services (FPCMS) (2004-2009). |
Joseph F. Zambello (54) |
| Year of Election or Appointment: 2011 Deputy Treasurer of the Fidelity funds. Mr. Zambello is an employee of Fidelity Investments. Previously, Mr. Zambello served as Vice President of FMR's Program Management Group (2009-2011) and Vice President of the Transfer Agent Oversight Group (2005-2009). |
Adrien E. Deberghes (44) |
| Year of Election or Appointment: 2008 Deputy Treasurer of Fidelity's Equity and High Income Funds. Mr. Deberghes also serves as Vice President and Assistant Treasurer of Fidelity Rutland Square Trust II and Fidelity Commonwealth Trust II (2011-present), Assistant Treasurer of other Fidelity funds (2010-present), and is an employee of Fidelity Investments (2008-present). Previously, Mr. Deberghes served as Senior Vice President of Mutual Fund Administration at State Street Corporation (2007-2008), Senior Director of Mutual Fund Administration at Investors Bank & Trust (2005-2007), and Director of Finance for Dunkin' Brands (2000-2005). |
Stephanie J. Dorsey (42) |
| Year of Election or Appointment: 2010 Assistant Treasurer of Fidelity's Equity and High Income Funds. Ms. Dorsey also serves as Deputy Treasurer of other Fidelity funds (2008-present) and is an employee of Fidelity Investments (2008-present). Previously, Ms. Dorsey served as Treasurer (2004-2008) of the JPMorgan Mutual Funds and Vice President (2004-2008) of JPMorgan Chase Bank. |
John R. Hebble (53) |
| Year of Election or Appointment: 2009 Assistant Treasurer of Fidelity's Equity and High Income Funds. Mr. Hebble also serves as President (2011-present), Treasurer, and Chief Financial Officer of The North Carolina Capital Management Trust: Cash and Term Portfolios (2008-present), President and Treasurer of other Fidelity funds (2008-present) and is an employee of Fidelity Investments. |
Gary W. Ryan (53) |
| Year of Election or Appointment: 2005 Assistant Treasurer of the Fidelity funds. Mr. Ryan is an employee of Fidelity Investments. Previously, Mr. Ryan served as Vice President of Fund Reporting in Fidelity Pricing and Cash Management Services (FPCMS) (1999-2005). |
Jonathan Davis (43) |
| Year of Election or Appointment: 2010 Assistant Treasurer of the Fidelity funds. Mr. Davis is also Assistant Treasurer of Fidelity Rutland Square Trust II and Fidelity Commonwealth Trust II. Mr. Davis is an employee of Fidelity Investments. Previously, Mr. Davis served as Vice President and Associate General Counsel of FMR LLC (2003-2010). |
Annual Report
Initial Class designates 100%; Service Class designates 100%; Service Class 2 designates 100%; and Investor Class designates 100% of the dividends distributed in December 2011, during the fiscal year as qualifying for the dividends-received deduction for corporate shareholders.
Annual Report
Board Approval of Investment Advisory Contracts and Management Fees
VIP Value Leaders Portfolio
Each year, the Board of Trustees, including the Independent Trustees (together, the Board), votes on the renewal of the management contract and sub-advisory agreements (together, the Advisory Contracts) for the fund. The Board, assisted by the advice of fund counsel and Independent Trustees' counsel, requests and considers a broad range of information relevant to the renewal of the Advisory Contracts throughout the year.
The Board meets regularly and considers at each of its meetings factors that are relevant to its annual consideration of the renewal of the fund's Advisory Contracts, including the services and support provided to the fund and its shareholders. The Board has established various standing committees, each composed of Independent Trustees with varying backgrounds, to which the Board has assigned specific subject matter responsibilities in order to enhance effective decision-making by the Board. The Board, acting directly and through its Committees, requests and receives information concerning the annual consideration of the renewal of the fund's Advisory Contracts. The Board also meets as needed to consider matters specifically related to the Board's annual consideration of the renewal of Advisory Contracts. Members of the Board may also meet with trustees of other Fidelity funds through ad hoc joint committees to discuss certain matters relevant to the Fidelity funds.
At its July 2011 meeting, the Board of Trustees, including the Independent Trustees, unanimously determined to renew the fund's Advisory Contracts. In reaching its determination, the Board considered all factors it believed relevant, including (i) the nature, extent, and quality of the services to be provided to the fund and its shareholders (including the investment performance of the fund); (ii) the competitiveness of the fund's management fee and total expense ratio; (iii) the total costs of the services to be provided by and the profits to be realized by Fidelity from its relationship with the fund; (iv) the extent to which economies of scale would be realized as the fund grows; and (v) whether fee levels reflect these economies of scale, if any, for the benefit of fund shareholders.
In considering whether to renew the Advisory Contracts for the fund, the Board reached a determination, with the assistance of fund counsel and Independent Trustees' counsel and through the exercise of its business judgment, that the renewal of the Advisory Contracts is in the best interests of the fund and its shareholders and that the compensation payable under the Advisory Contracts is fair and reasonable. The Board's decision to renew the Advisory Contracts was not based on any single factor, but rather was based on a comprehensive consideration of all the information provided to the Board at its meetings throughout the year. The Board, in reaching its determination to renew the Advisory Contracts, is aware that shareholders in the fund have a broad range of investment choices available to them, including a wide choice among mutual funds offered by Fidelity's competitors, and that the fund's shareholders, who have the opportunity to review and weigh the disclosure provided by the fund in its prospectus and other public disclosures, have chosen to invest in this fund, managed by Fidelity.
Nature, Extent, and Quality of Services Provided. The Board considered the staffing within the investment adviser, FMR, and the sub-advisers (together, the Investment Advisers), including the backgrounds of the fund's investment personnel and the fund's investment objective and discipline. The Independent Trustees also had discussions with senior management of Fidelity's investment operations and investment groups. The Board considered the structure of the portfolio manager compensation program and whether this structure provides appropriate incentives to act in the best interests of the fund.
Resources Dedicated to Investment Management and Support Services. The Board and the Fund Oversight and Research Committees reviewed the general qualifications and capabilities of the Investment Advisers' investment staff, including its size, education, experience, and resources, as well as the Investment Advisers' approach to recruiting, training, managing, and compensating investment personnel. The Board also noted that FMR has devoted increased resources to non-U.S. offices. The Board noted that Fidelity's analysts have extensive resources, tools and capabilities which allow them to conduct sophisticated quantitative and fundamental analysis, as well as credit analysis of issuers, counterparties and enhancers. The Board also believes that Fidelity's investment professionals have sufficient access to global information and data so as to provide competitive investment results over time, and that those professionals also have access to sophisticated tools which permit them to assess portfolio construction and risk and performance attribution characteristics continuously, as well as to transmit new information and research conclusions rapidly around the world. Additionally, in their deliberations, the Board considered the Investment Advisers' trading capabilities and resources which are an integral part of the investment management process.
Shareholder and Administrative Services. The Board considered (i) the nature, extent, quality, and cost of advisory, administrative, and shareholder services performed by the Investment Advisers and their affiliates under the Advisory Contracts and under separate agreements covering transfer agency, pricing and bookkeeping, and securities lending services for the fund; (ii) the nature and extent of the investment adviser's supervision of third party service providers, principally custodians and subcustodians; and (iii) the resources devoted to, and the record of compliance with, the fund's compliance policies and procedures. The Board also reviewed the allocation of fund brokerage, including allocations to brokers affiliated with the Investment Advisers, the use of brokerage commissions to pay fund expenses, and the use of "soft" commission dollars to pay for research services.
The Board noted that the growth of fund assets over time across the complex allows Fidelity to reinvest in the development of services designed to enhance the value or convenience of the Fidelity funds as investment vehicles. These services include 24-hour access to account information and market information through telephone representatives and over the Internet, investor education materials and asset allocation tools, and the expanded availability of Fidelity Investor Centers, with 35 new branches opening since 2010.
Annual Report
Board Approval of Investment Advisory Contracts and Management Fees - continued
Investment in a Large Fund Family. The Board considered the benefits to shareholders of investing in a Fidelity fund, including the benefits of investing in a fund that is part of a large family of funds offering a variety of investment disciplines and providing a large variety of mutual fund investor services. The Board noted that Fidelity had taken, or had made recommendations that resulted in the Fidelity funds taking, a number of actions over the previous year that benefited particular funds, including (i) continuing to dedicate additional resources to investment research and support of the senior management team that oversees asset management; (ii) rationalizing product lines through the mergers of six funds into other funds; (iii) continuing to migrate the Freedom Funds to dedicated lower cost underlying funds; (iv) obtaining shareholder approval to broaden the investment strategies for Fidelity Consumer Finance Portfolio, Fidelity Emerging Asia Fund, and Fidelity Environment and Alternative Energy Portfolio; (v) contractually agreeing to reduce the management fees and impose other expense limitations on Spartan 500 Index Fund and U.S. Bond Index Fund in connection with launching new institutional classes of these funds; (vi) changing the name, primary and supplemental benchmarks, and investment policies of Fidelity Global Strategies Fund to support the fund's flexible investment mandate and global orientation; and (vii) reducing the transfer agency account fee rates on certain accounts.
Investment Performance. The Board considered whether the fund has operated in accordance with its investment objective, as well as its record of compliance with its investment restrictions. It also reviewed the fund's absolute investment performance for each class, as well as the fund's relative investment performance for each class measured over multiple periods against (i) a broad-based securities market index, and (ii) a peer group of mutual funds deemed appropriate by Fidelity and reviewed by the Board. The following charts considered by the Board show, over the one-, three-, and five-year periods ended December 31, 2010, the cumulative total returns of Initial Class and Service Class 2 of the fund, the cumulative total returns of a broad-based securities market index ("benchmark"), and a range of cumulative total returns of a peer group of mutual funds identified by Morningstar, Inc. as having an investment style similar to that of the fund based on underlying portfolio holdings. The returns of Initial Class and Service Class 2 show the performance of the highest and lowest performing classes, respectively (based on five-year performance). The box within each chart shows the 25th percentile return (bottom of box) and the 75th percentile return (top of box) of the peer group. Returns shown above the box are in the first quartile and returns shown below the box are in the fourth quartile. The percentage beaten numbers noted below each chart correspond to the percentile box and represent the percentage of funds in the peer group whose performance was equal to or lower than that of the class indicated.
VIP Value Leaders Portfolio
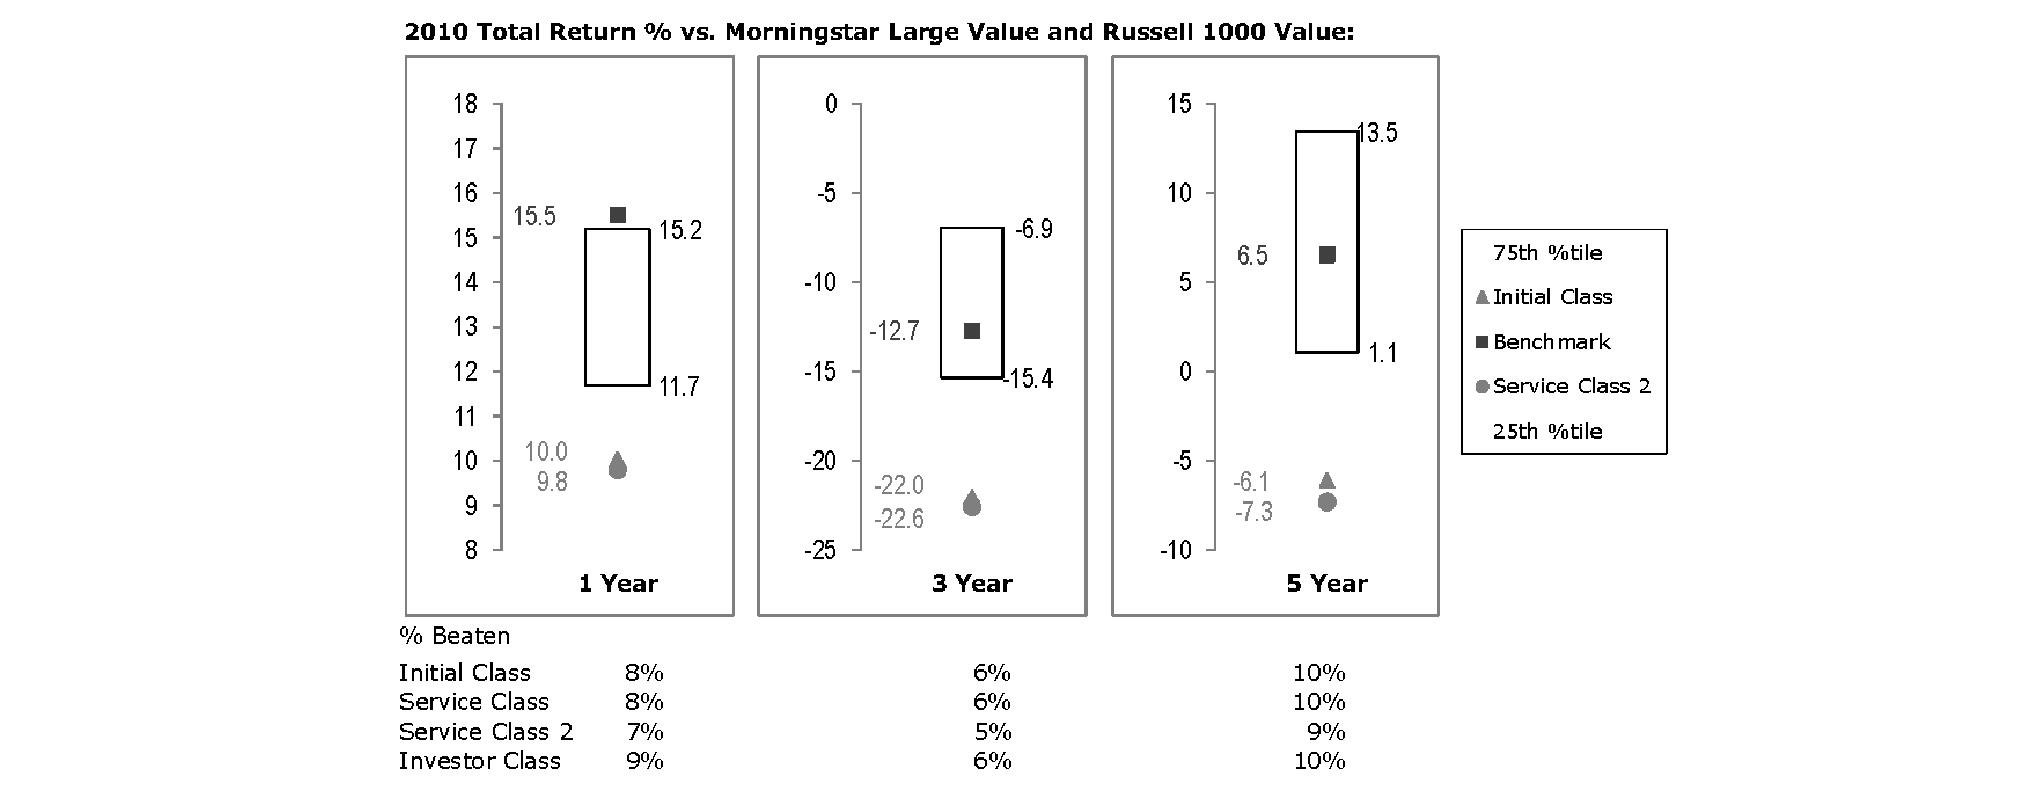
The Board reviewed the fund's relative investment performance against its peer group and noted that the performance of Initial Class of the fund was in the fourth quartile for all the periods shown. The Board also noted that the investment performance of the fund was lower than its benchmark for all the periods shown. The Board considered that the variations in performance among the fund's classes reflect the variations in class expenses, which result in lower performance for higher expense classes. The Board discussed with FMR actions that have been taken by FMR to improve the fund's disappointing performance relative to its peer group and benchmark. The Board also reviewed the fund's performance since inception as well as performance in the current year. The Board will continue to closely monitor the performance of the fund in the coming year and discuss with FMR other appropriate actions to address the performance of the fund.
Based on its review, the Board concluded that the nature, extent, and quality of services provided to the fund under the Advisory Contracts should benefit the fund's shareholders.
Competitiveness of Management Fee and Total Expense Ratio. The Board considered the fund's management fee and total expense ratio compared to "mapped groups" of competitive funds and classes. Fidelity creates "mapped groups" by combining similar Lipper investment objective categories that have comparable management fee characteristics. Combining Lipper investment objective categories aids the Board's management fee and total expense ratio comparisons by broadening the competitive group used for comparison and by reducing the number of universes to which various Fidelity funds are compared.
Annual Report
Management Fee. The Board considered two proprietary management fee comparisons for the 12-month periods shown in the chart below. The group of Lipper funds used by the Board for management fee comparisons is referred to below as the "Total Mapped Group." The Total Mapped Group comparison focuses on a fund's standing relative to the total universe of comparable funds available to investors in terms of gross management fees before expense reimbursements or caps. "TMG %" represents the percentage of funds in the Total Mapped Group that had management fees that were lower than the fund's. For example, a TMG % of 10% means that 90% of the funds in the Total Mapped Group had higher management fees than the fund. The "Asset-Size Peer Group" (ASPG) comparison focuses on a fund's standing relative to non-Fidelity funds similar in size to the fund within the Total Mapped Group. The ASPG represents at least 15% of the funds in the Total Mapped Group with comparable asset size and management fee characteristics, subject to a minimum of 50 funds (or all funds in the Total Mapped Group if fewer than 50). Additional information, such as the ASPG quartile in which the fund's management fee ranked, is also included in the chart and considered by the Board.
VIP Value Leaders Portfolio
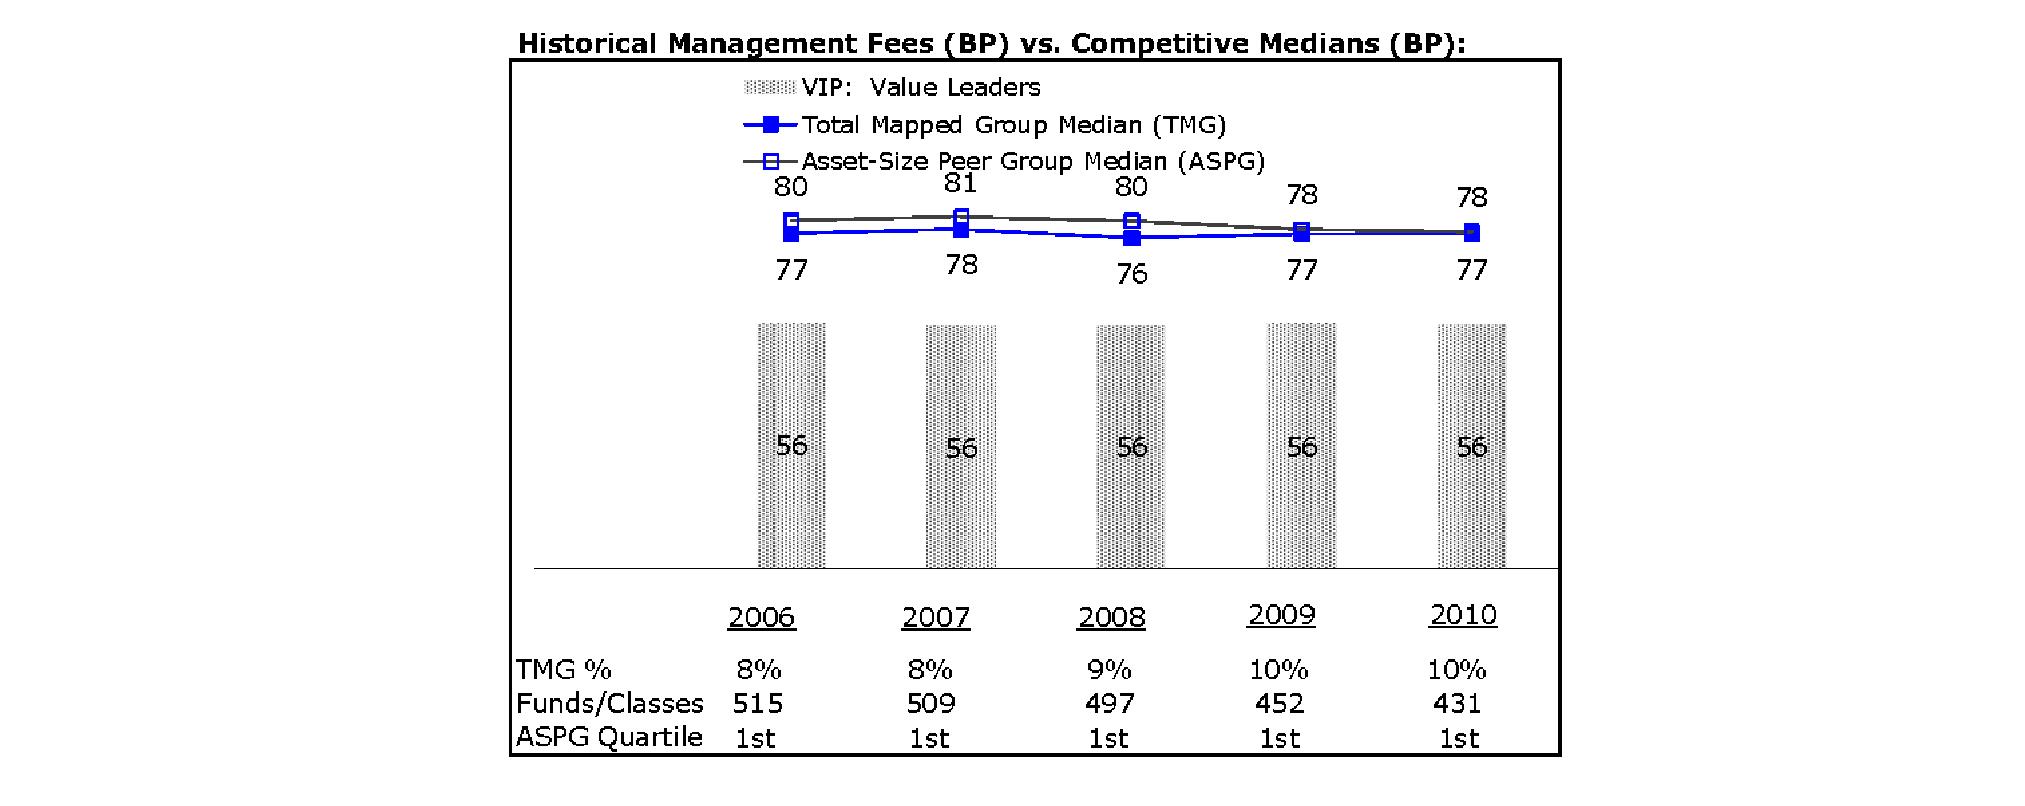
The Board noted that the fund's management fee ranked below the median of its Total Mapped Group and below the median of its ASPG for 2010.
Based on its review, the Board concluded that the fund's management fee is fair and reasonable in light of the services that the fund receives and the other factors considered.
Total Expense Ratio. In its review of each class's total expense ratio, the Board considered the fund's management fee as well as other fund or class expenses, as applicable, such as transfer agent fees, pricing and bookkeeping fees, fund-paid 12b-1 fees, and custodial, legal, and audit fees. The Board also noted the effects of any waivers and reimbursements on fees and expenses. As part of its review, the Board also considered the current and historical total expense ratios of each class of the fund compared to competitive fund median expenses. Each class of the fund is compared to those funds and classes in the Total Mapped Group (used by the Board for management fee comparisons) that have a similar sales load structure.
The Board noted that the total expense ratio of each of Initial Class and Investor Class ranked below its competitive median for 2010 and the total expense ratio of each of Service Class and Service Class 2 ranked above its competitive median for 2010. The Board considered that various factors, including 12b-1 fees, positive or negative performance adjustments, and relatively higher other expenses in the case of small fund size, can affect total expense ratios. The Board also noted that Investor Class has higher transfer agent fees than traditional variable annuity classes because it is designed for lower cost annuity products, where the majority of servicing costs are incorporated into the funds' total expense ratios rather than being paid at the annuity level. The Board noted that the fund offers multiple classes, each of which has a different 12b-1 fee structure, and that the multiple structures are intended to offer a range of pricing options for the intermediary market. The Board also noted that the total expense ratios of the classes vary primarily by the level of their 12b-1 fees, although differences in transfer agent fees may also cause expenses to vary from class to class.
Fees Charged to Other Fidelity Clients. The Board also considered Fidelity fee structures and other information with respect to clients of FMR and its affiliates, such as other mutual funds advised or subadvised by FMR or its affiliates, pension plan clients, and other institutional clients. In March 2010, the Board created an ad hoc joint committee with the board of other Fidelity funds (the Committee) to review and compare Fidelity's institutional investment advisory business with its business of providing services to the Fidelity funds, including the differences in services provided, fees charged, and costs incurred, as well as competition in their respective marketplaces.
Annual Report
Board Approval of Investment Advisory Contracts and Management Fees - continued
Based on its review of total expense ratios and fees charged to other Fidelity clients, the Board concluded that the total expense ratio of each class of the fund was reasonable, although in some cases above the median of the universe presented for comparison, in light of the services that the fund and its shareholders receive and the other factors considered, including the findings of the Committee.
Costs of the Services and Profitability. The Board considered the revenues earned and the expenses incurred by Fidelity in conducting the business of developing, marketing, distributing, managing, administering and servicing the fund and its shareholders. The Board also considered the level of Fidelity's profits in respect of all the Fidelity funds.
On an annual basis, FMR presents to the Board Fidelity's profitability for the fund. Fidelity calculates the profitability for each fund, as well as aggregate profitability for groups of Fidelity funds and all Fidelity funds, using a series of detailed revenue and cost allocation methodologies which originate with the books and records of Fidelity on which Fidelity's audited financial statements are based. The Audit Committee of the Board reviews any significant changes from the prior year's methodologies.
PricewaterhouseCoopers LLP (PwC), independent registered public accounting firm and auditor to Fidelity and certain Fidelity funds, has been engaged annually by the Board as part of the Board's assessment of Fidelity's profitability analysis. PwC's engagement includes the review and assessment of Fidelity's methodologies used in determining the revenues and expenses attributable to Fidelity's mutual fund business, and completion of agreed-upon procedures surrounding the mathematical accuracy of fund profitability and its conformity to allocation methodologies. After considering PwC's reports issued under the engagement and information provided by Fidelity, the Board concluded that while other allocation methods may also be reasonable, Fidelity's profitability methodologies are reasonable in all material respects.
The Board also reviewed Fidelity's non-fund businesses and fall-out benefits related to the mutual fund business as well as cases where Fidelity's affiliates may benefit from or be related to the fund's business.
The Board considered the costs of the services provided by and the profits realized by Fidelity in connection with the operation of the fund and was satisfied that the profitability was not excessive in the circumstances.
Economies of Scale. The Board considered whether there have been economies of scale in respect of the management of the Fidelity funds, whether the Fidelity funds (including the fund) have appropriately benefited from any such economies of scale, and whether there is potential for realization of any further economies of scale. The Board considered the extent to which the fund will benefit from economies of scale through increased services to the fund, through waivers or reimbursements, or through fee or expense reductions. The Board also noted that in 2009, it and the board of other Fidelity funds created an ad hoc committee (the Economies of Scale Committee) to analyze whether FMR attains economies of scale in respect of the management and servicing of the Fidelity funds, whether the Fidelity funds have appropriately benefited from such economies of scale, and whether there is potential for realization of any further economies of scale.
The Board recognized that the fund's management contract incorporates a "group fee" structure, which provides for lower group fee rates as total fund assets under FMR's management increase, and for higher group fee rates as total fund assets under FMR's management decrease. FMR calculates the group fee rates based on a tiered asset "breakpoint" schedule that varies based on asset class. The Board considered that the group fee is designed to deliver the benefits of economies of scale to fund shareholders when total Fidelity fund assets increase, even if assets of any particular fund are unchanged or have declined, because some portion of Fidelity's costs are attributable to services provided to all Fidelity funds, and all funds benefit if those costs can be allocated among more assets. The Board concluded that, given the group fee structure, fund shareholders will benefit from lower management fees as assets under FMR's management increase at the fund complex level, regardless of whether Fidelity achieves any such economies of scale.
The Board concluded, taking into account the analysis of the Economies of Scale Committee, that any potential economies of scale are being appropriately shared between fund shareholders and Fidelity.
Additional Information Requested by the Board. In order to develop fully the factual basis for consideration of the Fidelity funds' Advisory Contracts, the Board requested and received additional information on certain topics, including (i) fund performance trends, actions to be taken by FMR to improve certain funds' overall performance, and Fidelity's long-term strategies for certain funds; (ii) portfolio manager changes that have occurred during the past year and length of portfolio manager tenure for different categories of funds over time; (iii) Fidelity's compensation structure for portfolio managers and other key personnel and strategies for attracting and retaining non-investment personnel; (iv) the amount of the investment that each portfolio manager has made in the Fidelity fund(s) that he or she manages; (v) historical trends in Fidelity's realization of fall-out benefits; (vi) Fidelity's group fee structures and the rationale for the individual fee rates of certain funds; (vii) fund profitability methodology and the impact of certain factors on fund profitability results; (viii) trends regarding industry use of performance fee structures and Fidelity's compliance practices with respect to performance adjustment calculations; (ix) the fee structures in place for certain other Fidelity clients; and (x) explanations regarding the relative total expense ratios of certain funds and classes, total expense competitive trends, and actions that might be taken by FMR to reduce total expense ratios for certain funds and classes.
Annual Report
Based on its evaluation of all of the conclusions noted above, and after considering all factors it believed relevant, the Board ultimately concluded that the advisory fee structures are fair and reasonable, and that the fund's Advisory Contracts should be renewed.
Annual Report
Investment Adviser
Fidelity Management & Research Company
Boston, MA
Investment Sub-Advisers
FMR Co., Inc.
Fidelity Management & Research (U.K.) Inc.
Fidelity Management & Research (Hong Kong) Limited
Fidelity Management & Research (Japan) Inc.
General Distributor
Fidelity Distributors Corporation
Boston, MA
Transfer and Service Agents
Fidelity Investments Institutional Operations Company, Inc.
Boston, MA
Fidelity Service Company, Inc.
Boston, MA
Custodian
Brown Brothers Harriman & Co.
Boston, MA
VVL-ANN-0212
1.796594.108
Item 2. Code of Ethics
As of the end of the period, December 31, 2011, Variable Insurance Products Fund IV (the trust) has adopted a code of ethics, as defined in Item 2 of Form N-CSR, that applies to its President and Treasurer and its Chief Financial Officer. A copy of the code of ethics is filed as an exhibit to this Form N-CSR.
Item 3. Audit Committee Financial Expert
The Board of Trustees of the trust has determined that Joseph Mauriello is an audit committee financial expert, as defined in Item 3 of Form N-CSR. Mr. Mauriello is independent for purposes of Item 3 of Form N-CSR.
Item 4. Principal Accountant Fees and Services
Fees and Services
The following table presents fees billed by Deloitte & Touche LLP, the member firms of Deloitte Touche Tohmatsu, and their respective affiliates (collectively, "Deloitte Entities") in each of the last two fiscal years for services rendered to Emerging Markets Portfolio (the "Fund"):
Services Billed by Deloitte Entities
December 31, 2011 FeesA
| Audit Fees | Audit-Related Fees | Tax Fees | All Other Fees |
Emerging Markets Portfolio | $48,000 | $- | $5,700 | $300 |
December 31, 2010 FeesA
| Audit Fees | Audit-Related Fees | Tax Fees | All Other Fees |
Emerging Markets Portfolio | $49,000 | $- | $5,600 | $- |
A Amounts may reflect rounding.
The following table presents fees billed by PricewaterhouseCoopers LLP ("PwC") in each of the last two fiscal years for services rendered to Consumer Discretionary Portfolio, Consumer Staples Portfolio, Energy Portfolio, Financial Services Portfolio, Growth Stock Portfolio, Health Care Portfolio, Industrials Portfolio, International Capital Appreciation Portfolio, Materials Portfolio, Real Estate Portfolio, Technology Portfolio, Telecommunications Portfolio, Utilities Portfolio, and Value Leaders Portfolio (the "Funds"):
Services Billed by PwC
December 31, 2011 FeesA
| Audit Fees | Audit-Related Fees | Tax Fees | All Other Fees |
Consumer Discretionary Portfolio | $37,000 | $- | $2,500 | $1,600 |
Consumer Staples Portfolio | $37,000 | $- | $2,500 | $1,600 |
Energy Portfolio | $37,000 | $- | $2,500 | $1,800 |
Financial Services Portfolio | $37,000 | $- | $2,500 | $1,600 |
Growth Stock Portfolio | $44,000 | $- | $3,100 | $1,600 |
Health Care Portfolio | $39,000 | $- | $2,500 | $1,600 |
Industrials Portfolio | $37,000 | $- | $2,500 | $1,600 |
International Capital Appreciation Portfolio | $48,000 | $- | $5,100 | $1,600 |
Materials Portfolio | $37,000 | $- | $2,500 | $1,600 |
Real Estate Portfolio | $44,000 | $- | $3,500 | $1,700 |
Technology Portfolio | $36,000 | $- | $2,500 | $1,700 |
Telecommunications Portfolio | $37,000 | $- | $2,500 | $1,600 |
Utilities Portfolio | $36,000 | $- | $2,500 | $1,600 |
Value Leaders Portfolio | $43,000 | $- | $3,100 | $1,600 |
December 31, 2010 FeesA
| Audit Fees | Audit-Related Fees | Tax Fees | All Other Fees |
Consumer Discretionary Portfolio | $37,000 | $- | $2,400 | $2,000 |
Consumer Staples Portfolio | $37,000 | $- | $2,400 | $2,000 |
Energy Portfolio | $36,000 | $- | $2,400 | $2,100 |
Financial Services Portfolio | $37,000 | $- | $2,400 | $2,000 |
Growth Stock Portfolio | $44,000 | $- | $3,000 | $2,000 |
Health Care Portfolio | $39,000 | $- | $2,400 | $2,000 |
Industrials Portfolio | $37,000 | $- | $2,400 | $2,000 |
International Capital Appreciation Portfolio | $46,000 | $- | $4,900 | $2,000 |
Materials Portfolio | $37,000 | $- | $2,400 | $2,000 |
Real Estate Portfolio | $43,000 | $- | $3,400 | $2,000 |
Technology Portfolio | $36,000 | $- | $2,400 | $2,000 |
Telecommunications Portfolio | $37,000 | $- | $2,400 | $2,000 |
Utilities Portfolio | $35,000 | $- | $2,400 | $2,000 |
Value Leaders Portfolio | $42,000 | $- | $3,000 | $2,000 |
A Amounts may reflect rounding.
The following table presents fees billed by PwC and Deloitte Entities that were required to be approved by the Audit Committee for services that relate directly to the operations and financial reporting of the Funds and that are rendered on behalf of Fidelity Management & Research Company ("FMR") and entities controlling, controlled by, or under common control with FMR (not including any sub-adviser whose role is primarily portfolio management and is subcontracted with or overseen by another investment adviser) that provide ongoing services to the Funds ("Fund Service Providers"):
Services Billed by Deloitte Entities
| December 31, 2011A | December 31, 2010A |
Audit-Related Fees | $610,000 | $645,000 |
Tax Fees | $- | $- |
All Other Fees | $430,000 | $840,000 |
A Amounts may reflect rounding.
Services Billed by PwC
| December 31, 2011A | December 31, 2010A |
Audit-Related Fees | $3,845,000 | $2,505,000 |
Tax Fees | $- | $- |
All Other Fees | $- | $510,000 |
A Amounts may reflect rounding.
"Audit-Related Fees" represent fees billed for assurance and related services that are reasonably related to the performance of the fund audit or the review of the fund's financial statements and that are not reported under Audit Fees.
"Tax Fees" represent fees billed for tax compliance, tax advice or tax planning that relate directly to the operations and financial reporting of the fund.
"All Other Fees" represent fees billed for services provided to the fund or Fund Service Provider, a significant portion of which are assurance related, that relate directly to the operations and financial reporting of the fund, excluding those services that are reported under Audit Fees, Audit-Related Fees or Tax Fees.
Assurance services must be performed by an independent public accountant.
* * *
The aggregate non-audit fees billed by PwC and Deloitte Entities for services rendered to the Funds, FMR (not including any sub-adviser whose role is primarily portfolio management and is subcontracted with or overseen by another investment adviser), and any Fund Service Provider for each of the last two fiscal years of the Funds are as follows:
Billed By | December 31, 2011 A | December 31, 2010 A |
PwC | $5,115,000 | $5,075,000 |
Deloitte Entities | $1,140,000 | $1,585,000 |
A Amounts may reflect rounding.
The trust's Audit Committee has considered non-audit services that were not pre-approved that were provided by PwC and Deloitte Entities to Fund Service Providers to be compatible with maintaining the independence of PwC and Deloitte Entities in their audits of the Funds, taking into account representations from PwC and Deloitte Entities, in accordance with Public Company Accounting Oversight Board rules, regarding their independence from the Funds and their related entities and FMR's review of the appropriateness and permissibility under applicable law of such non-audit services prior to their provision to the Fund Service Providers.
Audit Committee Pre-Approval Policies and Procedures
The trust's Audit Committee must pre-approve all audit and non-audit services provided by a fund's independent registered public accounting firm relating to the operations or financial reporting of the fund. Prior to the commencement of any audit or non-audit services to a fund, the Audit Committee reviews the services to determine whether they are appropriate and permissible under applicable law.
The Audit Committee has adopted policies and procedures to, among other purposes, provide a framework for the Committee's consideration of non-audit services by the audit firms that audit the Fidelity funds. The policies and procedures require that any non-audit service provided by a fund audit firm to a Fidelity fund and any non-audit service provided by a fund auditor to a Fund Service Provider that relates directly to the operations and financial reporting of a Fidelity fund ("Covered Service") are subject to approval by the Audit Committee before such service is provided.
All Covered Services must be approved in advance of provision of the service either: (i) by formal resolution of the Audit Committee, or (ii) by oral or written approval of the service by the Chair of the Audit Committee (or if the Chair is unavailable, such other member of the Audit Committee as may be designated by the Chair to act in the Chair's absence). The approval contemplated by (ii) above is permitted where the Treasurer determines that action on such an engagement is necessary before the next meeting of the Audit Committee.
Non-audit services provided by a fund audit firm to a Fund Service Provider that do not relate directly to the operations and financial reporting of a Fidelity fund are reported to the Audit Committee on a periodic basis.
Non-Audit Services Approved Pursuant to Rule 2-01(c)(7)(i)(C) and (ii) of Regulation S-X ("De Minimis Exception")
There were no non-audit services approved or required to be approved by the Audit Committee pursuant to the De Minimis Exception during the Funds' last two fiscal years relating to services provided to (i) the Funds or (ii) any Fund Service Provider that relate directly to the operations and financial reporting of the Funds.
Item 5. Audit Committee of Listed Registrants
Not applicable.
Item 6. Investments
(a) Not applicable.
(b) Not applicable
Item 7. Disclosure of Proxy Voting Policies and Procedures for Closed-End Management Investment Companies
Not applicable.
Item 8. Portfolio Managers of Closed-End Management Investment Companies
Not applicable.
Item 9. Purchase of Equity Securities by Closed-End Management Investment Company and Affiliated Purchasers
Not applicable.
Item 10. Submission of Matters to a Vote of Security Holders
There were no material changes to the procedures by which shareholders may recommend nominees to the trust's Board of Trustees.
Item 11. Controls and Procedures
(a)(i) The President and Treasurer and the Chief Financial Officer have concluded that the trust's disclosure controls and procedures (as defined in Rule 30a-3(c) under the Investment Company Act) provide reasonable assurances that material information relating to the trust is made known to them by the appropriate persons, based on their evaluation of these controls and procedures as of a date within 90 days of the filing date of this report.
(a)(ii) There was no change in the trust's internal control over financial reporting (as defined in Rule 30a-3(d) under the Investment Company Act) that occurred during the second fiscal quarter of the period covered by this report that has materially affected, or is reasonably likely to materially affect, the trust's internal control over financial reporting.
Item 12. Exhibits
(a) | (1) | Code of Ethics pursuant to Item 2 of Form N-CSR is filed and attached hereto as EX-99.CODE ETH. |
(a) | (2) | Certification pursuant to Rule 30a-2(a) under the Investment Company Act of 1940 (17 CFR 270.30a-2(a)) is filed and attached hereto as Exhibit 99.CERT. |
(a) | (3) | Not applicable. |
(b) | | Certification pursuant to Rule 30a-2(b) under the Investment Company Act of 1940 (17 CFR 270.30a-2(b)) is furnished and attached hereto as Exhibit 99.906CERT. |
SIGNATURES
Pursuant to the requirements of the Securities Exchange Act of 1934 and the Investment Company Act of 1940, the registrant has duly caused this report to be signed on its behalf by the undersigned, thereunto duly authorized.
Variable Insurance Products Fund IV
By: | /s/Kenneth B. Robins |
| Kenneth B. Robins |
| President and Treasurer |
| |
Date: | February 24, 2012 |
Pursuant to the requirements of the Securities Exchange Act of 1934 and the Investment Company Act of 1940, this report has been signed below by the following persons on behalf of the registrant and in the capacities and on the dates indicated.
By: | /s/Kenneth B. Robins |
| Kenneth B. Robins |
| President and Treasurer |
| |
Date: | February 24, 2012 |
By: | /s/Christine Reynolds |
| Christine Reynolds |
| Chief Financial Officer |
| |
Date: | February 24, 2012 |