UNITED STATES
SECURITIES AND EXCHANGE COMMISSION
Washington, D.C. 20549
FORM N-CSR
CERTIFIED SHAREHOLDER REPORT OF REGISTERED
MANAGEMENT INVESTMENT COMPANIES
Investment Company Act file number 811-3759
Variable Insurance Products Fund IV
(Exact name of registrant as specified in charter)
82 Devonshire St., Boston, Massachusetts 02109
(Address of principal executive offices) (Zip code)
Scott C. Goebel, Secretary
82 Devonshire St.
Boston, Massachusetts 02109
(Name and address of agent for service)
Registrant's telephone number, including area code: 617-563-7000
Date of fiscal year end: | December 31 |
| |
Date of reporting period: | December 31, 2009 |
Item 1. Reports to Stockholders
Fidelity® Variable Insurance Products:
Consumer Discretionary Portfolio
Annual Report
December 31, 2009
(2_fidelity_logos) (Registered_Trademark)
Contents
Performance | <Click Here> | How the fund has done over time. |
Management's Discussion | <Click Here> | The manager's review of fund performance, strategy and outlook. |
Shareholder Expense Example | <Click Here> | An example of shareholder expenses. |
Investment Changes | <Click Here> | A summary of major shifts in the fund's investments over the past six months. |
Investments | <Click Here> | A complete list of the fund's investments with their market values. |
Financial Statements | <Click Here> | Statements of assets and liabilities, operations, and changes in net assets, as well as financial highlights. |
Notes | <Click Here> | Notes to the financial statements. |
Report of Independent Registered Public Accounting Firm | <Click Here> | |
Trustees and Officers | <Click Here> | |
Distributions | <Click Here> | |
Board Approval of Investment Advisory Contracts and Management Fees | <Click Here> | |
To view a fund's proxy voting guidelines and proxy voting record for the 12-month period ended June 30, visit http://www.fidelity.com/proxyvotingresults or visit the Securities and Exchange Commission's (SEC) web site at http://www.sec.gov. You may also call 1-877-208-0098 to request a free copy of the proxy voting guidelines.
Fidelity Variable Insurance Products are separate account options which are purchased through a variable insurance contract.
Standard & Poor's, S&P and S&P 500 are registered service marks of The McGraw-Hill Companies, Inc. and have been licensed for use by Fidelity Distributors Corporation.
Other third party marks appearing herein are the property of their respective owners.
All other marks appearing herein are registered or unregistered trademarks or service marks of FMR LLC or an affiliated company.
This report and the financial statements contained herein are submitted for the general information of the shareholders of the fund. This report is not authorized for distribution to prospective investors in the fund unless preceded or accompanied by an effective prospectus.
A fund files its complete schedule of portfolio holdings with the SEC for the first and third quarters of each fiscal year on Form N-Q. Forms N-Q are available on the SEC's web site at http://www.sec.gov. A fund's Forms N-Q may be reviewed and copied at the SEC's Public Reference Room in Washington, DC. Information regarding the operation of the SEC's Public Reference Room may be obtained by calling 1-800-SEC-0330. For a complete list of a fund's portfolio holdings, view the most recent holdings listings, semiannual report, or annual report on Fidelity's web site at http://www.fidelity.com or http://www.advisor.fidelity.com, as applicable.
NOT FDIC INSURED · MAY LOSE VALUE · NO BANK GUARANTEE
Neither the fund nor Fidelity Distributors Corporation is a bank.
Annual Report
Average annual total return reflects the change in the value of an investment, assuming reinvestment of the class' dividend income and capital gains (the profits earned upon the sale of securities that have grown in value, if any) and assuming a constant rate of performance each year. During periods of reimbursement by Fidelity, a fund's total return will be greater than it would be had the reimbursement not occurred. Performance numbers are net of all underlying fund operating expenses, but do not include any insurance charges imposed by your insurance company's separate account. If performance information included the effect of these additional charges, the total returns would have been lower. How a fund did yesterday is no guarantee of how it will do tomorrow.
Average Annual Total Returns
Periods ended December 31, 2009 | Past 1
year | Past 5
years | Life of
fundA |
VIP Consumer Discretionary - Initial Class C | 38.32% | -0.59% | 0.92% |
VIP Consumer Discretionary - Investor Class B, C | 38.17% | -0.66% | 0.88% |
A From July 18, 2001.
B The initial offering of Investor Class shares took place on July 21, 2005. Returns prior to July 21, 2005 are those of Initial Class. Had Investor Class's transfer agent fee been reflected, returns prior to July 21, 2005 would have been lower.
C Prior to October 1, 2006, VIP Consumer Discretionary Portfolio operated under certain different investment policies. The historical performance for the fund may not represent its current investment policies.
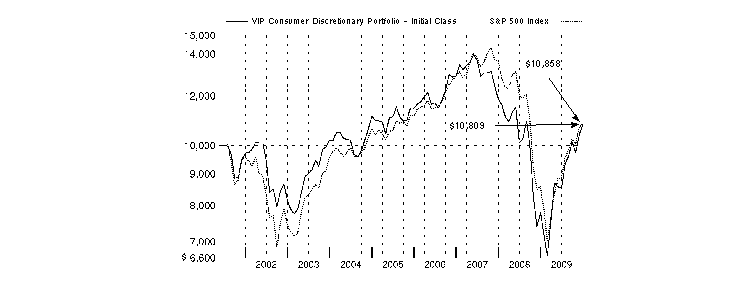
$10,000 Over Life of Fund
Let's say hypothetically that $10,000 was invested in VIP Consumer Discretionary Portfolio - Initial Class on July 18, 2001, when the fund started. The chart shows how the value of your investment would have changed, and also shows how the Standard & Poor's 500SM Index (S&P 500®) performed over the same period.
Annual Report
Market Recap: In 2009, most global markets saw both crippling lows and considerable highs. After a dismal start, the economy began to show signs of improvement, suggesting that a recovery was on the horizon. Credit markets began to heal as fiscal and monetary stimulus efforts around the world started to take effect, and corporate earnings staged an impressive rebound, fueled in large part by massive cost cutting. As a result, the flight to quality that marked most of 2008 and early 2009 shifted in March as investors flocked to riskier asset categories. The U.S. equity market, as measured by the bellwether Standard & Poor's 500SM Index and the blue-chip proxy Dow Jones Industrial AverageSM, reflected this changing environment, gaining 26.46% and 22.68%, respectively. Meanwhile, the technology-laden Nasdaq Composite® Index rose 45.32%. Foreign stocks also produced strong gains, as illustrated by the 31.93% jump of the MSCI® EAFE® Index (Europe, Australasia, Far East), a gauge of developed stock markets outside the U.S. and Canada. Emerging-markets stocks, which suffered their worst calendar-year performance ever in 2008, posted record returns this past year, with the MSCI Emerging Markets Index soaring 79.02%. A depreciating U.S. dollar helped bolster returns for U.S. investors in foreign equities.
Comments from John Harris, Portfolio Manager of VIP Consumer Discretionary Portfolio: For the year ending December 31, 2009, the fund's shares underperformed the 46.75% return of its sector benchmark, the MSCI® U.S. Investable Market Consumer Discretionary Index, but outperformed the S&P 500®. (For specific portfolio results, please refer to the performance section of this report.) The top detractor to the fund's performance relative to the MSCI index was its underweighting in automaker Ford Motor, which performed very strongly as the only one of the ´Big Three' automakers to avoid government assistance. Weak stock selection in restaurants also hampered results, with stakes in fast-food chains Burger King Holdings, which I sold during the period, and Sonic lagging, while an underweighted position in strong-performing coffee giant Starbucks hurt as well. An overweighting in home improvement retailer Lowe's - the fund's largest position - and a non-benchmark position in discount retail giant Costco further detracted. On the positive side, an out-of-index stake in Hong Kong-based global sourcing agent Li & Fung led the way, benefiting from strong relationships with high-quality, value-oriented retailers looking for exclusive brands with more cachet than their own store-label names. Elsewhere, the fund's stake in casino operator Las Vegas Sands was a winner when the company was able to restructure its Macau, China, property credit facility, while an out-of-index position in search engine and online advertising leader Google further boosted returns.
Note to shareholders: In January 2010, Fidelity adopted capped benchmarks for most of its sector and industry funds, including the VIP sector portfolios. The capped benchmarks, which limit the weightings of individual issuers, better represent the investment opportunities available to the funds and will provide shareholders with more-meaningful performance comparisons. These changes do not affect the investment policies of any of the funds, and the primary benchmark for all of the funds remains the Standard & Poor's 500 Index.
The views expressed above reflect those of the portfolio manager(s) only through the end of the period as stated on the cover of this report and do not necessarily represent the views of Fidelity or any other person in the Fidelity organization. Any such views are subject to change at any time based upon market or other conditions and Fidelity disclaims any responsibility to update such views. These views may not be relied on as investment advice and, because investment decisions for a Fidelity fund are based on numerous factors, may not be relied on as an indication of trading intent on behalf of any Fidelity fund.
Annual Report
As a shareholder of the Fund, you incur two types of costs: (1) transaction costs, including redemption fees, and (2) ongoing costs, including management fees and other Fund expenses. This Example is intended to help you understand your ongoing costs (in dollars) of investing in the Fund and to compare these costs with the ongoing costs of investing in other mutual funds.
The Example is based on an investment of $1,000 invested at the beginning of the period and held for the entire period (July 1, 2009 to December 31, 2009).
Actual Expenses
The first line of the accompanying table for each class of the Fund provides information about actual account values and actual expenses. You may use the information in this line, together with the amount you invested, to estimate the expenses that you paid over the period. Simply divide your account value by $1,000.00 (for example, an $8,600 account value divided by $1,000.00 = 8.6), then multiply the result by the number in the first line for a class of the Fund under the heading entitled "Expenses Paid During Period" to estimate the expenses you paid on your account during this period. The estimate of expenses does not include any fees or other expenses of any variable annuity or variable life insurance product. If they were, the estimate of expenses you paid during the period would be higher, and your ending account value would be lower. In addition, the Fund, as a shareholder in the underlying Fidelity Central Funds, will indirectly bear its pro-rata share of the fees and expenses incurred by the underlying Fidelity Central Funds. These fees and expenses are not included in the Fund's annualized expense ratio used to calculate the expense estimate in the table below.
Hypothetical Example for Comparison Purposes
The second line of the accompanying table for each class of the Fund provides information about hypothetical account values and hypothetical expenses based on a Class' actual expense ratio and an assumed rate of return of 5% per year before expenses, which is not the Class' actual return. The hypothetical account values and expenses may not be used to estimate the actual ending account balance or expenses you paid for the period. You may use this information to compare the ongoing costs of investing in the Fund and other funds. To do so, compare this 5% hypothetical example with the 5% hypothetical examples that appear in the shareholder reports of the other funds. The estimate of expenses does not include any fees or other expenses of any variable annuity or variable life insurance product. If they were, the estimate of expenses you paid during the period would be higher, and your ending account value would be lower. In addition, the Fund, as a shareholder in the underlying Fidelity Central Funds, will indirectly bear its pro-rata share of the fees and expenses incurred by the underlying Fidelity Central Funds. These fees and expenses are not included in the Fund's annualized expense ratio used to calculate the expense estimate in the table below.
Please note that the expenses shown in the table are meant to highlight your ongoing costs only and do not reflect any transaction costs. Therefore, the second line of the table is useful in comparing ongoing costs only, and will not help you determine the relative total costs of owning different funds. In addition, if these transactional costs were included, your costs would have been higher.
| Annualized
Expense Ratio | Beginning
Account Value
July 1, 2009 | Ending
Account Value
December 31, 2009 | Expenses Paid
During Period*
July 1, 2009 to
December 31, 2009 |
Initial Class | 1.00% | | | |
Actual | | $ 1,000.00 | $ 1,266.50 | $ 5.71 |
Hypothetical A | | $ 1,000.00 | $ 1,020.16 | $ 5.09 |
Investor Class | 1.08% | | | |
Actual | | $ 1,000.00 | $ 1,265.20 | $ 6.17 |
Hypothetical A | | $ 1,000.00 | $ 1,019.76 | $ 5.50 |
A 5% return per year before expenses
* Expenses are equal to each Class' annualized expense ratio, multiplied by the average account value over the period, multiplied by 184/365 (to reflect the one-half year period).
Annual Report
Investment Changes (Unaudited)
Top Ten Stocks as of December 31, 2009 |
| % of fund's
net assets | % of fund's net assets
6 months ago |
Lowe's Companies, Inc. | 6.0 | 7.4 |
Target Corp. | 5.8 | 6.8 |
The Walt Disney Co. | 5.6 | 5.5 |
McDonald's Corp. | 4.9 | 7.1 |
Amazon.com, Inc. | 3.9 | 2.4 |
Staples, Inc. | 2.7 | 2.9 |
Advance Auto Parts, Inc. | 2.3 | 2.6 |
Ford Motor Co. | 2.3 | 0.0 |
Comcast Corp. Class A | 2.2 | 3.8 |
Wyndham Worldwide Corp. | 2.0 | 1.0 |
| 37.7 | |
Top Industries (% of fund's net assets) |
As of December 31, 2009 |
 | Specialty Retail | 22.2% | |
 | Media | 20.8% | |
 | Hotels, Restaurants & Leisure | 20.2% | |
 | Multiline Retail | 8.1% | |
 | Internet & Catalog Retail | 5.3% | |
 | All Others* | 23.4% | |

|
As of June 30, 2009 |
| Specialty Retail | 27.2% | |
| Hotels, Restaurants & Leisure | 20.3% | |
| Media | 19.8% | |
| Multiline Retail | 7.2% | |
| Textiles, Apparel & Luxury Goods | 5.6% | |
| All Others* | 19.9% | |

* Includes short-term investments and net other assets. |
Annual Report
Investments December 31, 2009
Showing Percentage of Net Assets
Common Stocks - 99.0% |
| Shares | | Value |
AUTO COMPONENTS - 2.6% |
Auto Parts & Equipment - 2.6% |
BorgWarner, Inc. | 2,100 | | $ 69,762 |
Johnson Controls, Inc. | 5,500 | | 149,820 |
| | 219,582 |
AUTOMOBILES - 3.0% |
Automobile Manufacturers - 2.3% |
Ford Motor Co. (a) | 18,900 | | 189,000 |
Motorcycle Manufacturers - 0.7% |
Harley-Davidson, Inc. | 2,400 | | 60,480 |
TOTAL AUTOMOBILES | | 249,480 |
DISTRIBUTORS - 0.5% |
Distributors - 0.5% |
Li & Fung Ltd. | 10,000 | | 41,343 |
DIVERSIFIED CONSUMER SERVICES - 3.4% |
Education Services - 2.2% |
Apollo Group, Inc. Class A (non-vtg.) (a) | 1,060 | | 64,215 |
DeVry, Inc. | 900 | | 51,057 |
Navitas Ltd. | 3,559 | | 13,107 |
Strayer Education, Inc. | 275 | | 58,435 |
| | 186,814 |
Specialized Consumer Services - 1.2% |
Coinstar, Inc. (a) | 900 | | 25,002 |
Sotheby's Class A (ltd. vtg.) | 2,101 | | 47,230 |
Steiner Leisure Ltd. (a) | 700 | | 27,832 |
| | 100,064 |
TOTAL DIVERSIFIED CONSUMER SERVICES | | 286,878 |
FOOD & STAPLES RETAILING - 2.3% |
Food Retail - 0.6% |
Susser Holdings Corp. (a) | 6,000 | | 51,540 |
Hypermarkets & Super Centers - 1.7% |
BJ's Wholesale Club, Inc. (a) | 400 | | 13,084 |
Costco Wholesale Corp. | 2,100 | | 124,257 |
| | 137,341 |
TOTAL FOOD & STAPLES RETAILING | | 188,881 |
HOTELS, RESTAURANTS & LEISURE - 20.2% |
Casinos & Gaming - 3.9% |
Bally Technologies, Inc. (a) | 700 | | 28,903 |
International Game Technology | 900 | | 16,893 |
Las Vegas Sands Corp. unit | 363 | | 92,881 |
MGM Mirage, Inc. (a) | 6,100 | | 55,632 |
Sands China Ltd. | 6,400 | | 7,723 |
WMS Industries, Inc. (a) | 2,750 | | 110,000 |
Wynn Macau Ltd. | 10,800 | | 13,156 |
| | 325,188 |
|
| Shares | | Value |
Hotels, Resorts & Cruise Lines - 4.7% |
Carnival Corp. unit | 3,600 | | $ 114,084 |
Starwood Hotels & Resorts Worldwide, Inc. | 3,100 | | 113,367 |
Wyndham Worldwide Corp. | 8,100 | | 163,377 |
| | 390,828 |
Leisure Facilities - 0.4% |
Vail Resorts, Inc. (a) | 1,000 | | 37,800 |
Restaurants - 11.2% |
BJ's Restaurants, Inc. (a) | 2,116 | | 39,823 |
Darden Restaurants, Inc. | 3,300 | | 115,731 |
Jack in the Box, Inc. (a) | 1,400 | | 27,538 |
McDonald's Corp. | 6,560 | | 409,606 |
P.F. Chang's China Bistro, Inc. (a) | 1,413 | | 53,567 |
Sonic Corp. (a) | 3,410 | | 34,339 |
Starbucks Corp. (a) | 6,800 | | 156,808 |
Texas Roadhouse, Inc. Class A (a) | 3,800 | | 42,674 |
Yum! Brands, Inc. | 1,400 | | 48,958 |
| | 929,044 |
TOTAL HOTELS, RESTAURANTS & LEISURE | | 1,682,860 |
HOUSEHOLD DURABLES - 4.6% |
Home Furnishings - 1.2% |
Mohawk Industries, Inc. (a) | 1,300 | | 61,880 |
Tempur-Pedic International, Inc. (a) | 1,500 | | 35,445 |
| | 97,325 |
Homebuilding - 1.9% |
Lennar Corp. Class A | 3,300 | | 42,141 |
M.D.C. Holdings, Inc. | 300 | | 9,312 |
Meritage Homes Corp. (a) | 1,000 | | 19,330 |
Pulte Homes, Inc. | 6,055 | | 60,550 |
Toll Brothers, Inc. (a) | 1,500 | | 28,215 |
| | 159,548 |
Household Appliances - 0.9% |
Whirlpool Corp. | 929 | | 74,933 |
Housewares & Specialties - 0.6% |
Newell Rubbermaid, Inc. | 3,300 | | 49,533 |
TOTAL HOUSEHOLD DURABLES | | 381,339 |
INTERNET & CATALOG RETAIL - 5.3% |
Catalog Retail - 0.3% |
Liberty Media Corp. Interactive
Series A (a) | 2,400 | | 26,016 |
Internet Retail - 5.0% |
Amazon.com, Inc. (a) | 2,440 | | 328,229 |
Blue Nile, Inc. (a) | 473 | | 29,955 |
Expedia, Inc. (a) | 2,100 | | 53,991 |
| | 412,175 |
TOTAL INTERNET & CATALOG RETAIL | | 438,191 |
Common Stocks - continued |
| Shares | | Value |
INTERNET SOFTWARE & SERVICES - 1.6% |
Internet Software & Services - 1.6% |
Google, Inc. Class A (a) | 173 | | $ 107,257 |
GREE, Inc. | 100 | | 6,186 |
NetEase.com, Inc. sponsored ADR (a) | 200 | | 7,522 |
Tencent Holdings Ltd. | 400 | | 8,651 |
| | 129,616 |
LEISURE EQUIPMENT & PRODUCTS - 0.4% |
Leisure Products - 0.4% |
Polaris Industries, Inc. | 800 | | 34,904 |
MEDIA - 20.8% |
Advertising - 2.0% |
Interpublic Group of Companies, Inc. (a) | 12,417 | | 91,637 |
Lamar Advertising Co. Class A (a) | 1,482 | | 46,075 |
National CineMedia, Inc. | 1,400 | | 23,198 |
| | 160,910 |
Cable & Satellite - 7.6% |
Cablevision Systems Corp. - NY Group Class A | 2,300 | | 59,386 |
Comcast Corp. Class A | 10,755 | | 181,329 |
DIRECTV (a) | 4,300 | | 143,405 |
DISH Network Corp. Class A | 2,000 | | 41,540 |
Liberty Media Corp. Starz Series A (a) | 280 | | 12,922 |
Time Warner Cable, Inc. | 3,382 | | 139,981 |
Virgin Media, Inc. | 3,300 | | 55,539 |
| | 634,102 |
Movies & Entertainment - 10.1% |
DreamWorks Animation SKG, Inc.
Class A (a) | 617 | | 24,649 |
News Corp.: | | | |
Class A | 3,000 | | 41,070 |
Class B | 2,900 | | 46,168 |
The Walt Disney Co. | 14,400 | | 464,400 |
Time Warner, Inc. | 3,909 | | 113,908 |
Viacom, Inc. Class B (non-vtg.) (a) | 5,100 | | 151,623 |
| | 841,818 |
Publishing - 1.1% |
McGraw-Hill Companies, Inc. | 2,700 | | 90,477 |
TOTAL MEDIA | | 1,727,307 |
MULTILINE RETAIL - 8.1% |
Department Stores - 2.3% |
Kohl's Corp. (a) | 2,000 | | 107,860 |
Nordstrom, Inc. | 2,218 | | 83,352 |
| | 191,212 |
|
| Shares | | Value |
General Merchandise Stores - 5.8% |
Target Corp. | 10,000 | | $ 483,700 |
TOTAL MULTILINE RETAIL | | 674,912 |
PROFESSIONAL SERVICES - 0.2% |
Human Resource & Employment Services - 0.2% |
Monster Worldwide, Inc. (a) | 1,000 | | 17,400 |
SPECIALTY RETAIL - 22.2% |
Apparel Retail - 4.7% |
American Eagle Outfitters, Inc. | 1,800 | | 30,564 |
Citi Trends, Inc. (a) | 3,147 | | 86,920 |
Gymboree Corp. (a) | 2,105 | | 91,546 |
Ross Stores, Inc. | 1,800 | | 76,878 |
Urban Outfitters, Inc. (a) | 2,000 | | 69,980 |
Zumiez, Inc. (a) | 2,555 | | 32,500 |
| | 388,388 |
Automotive Retail - 2.9% |
Advance Auto Parts, Inc. | 4,670 | | 189,042 |
O'Reilly Automotive, Inc. (a) | 1,400 | | 53,368 |
| | 242,410 |
Computer & Electronics Retail - 1.7% |
Best Buy Co., Inc. | 1,500 | | 59,190 |
Conn's, Inc. (a) | 2,400 | | 14,016 |
hhgregg, Inc. (a) | 1,800 | | 39,654 |
RadioShack Corp. | 1,652 | | 32,214 |
| | 145,074 |
Home Improvement Retail - 8.1% |
Home Depot, Inc. | 3,649 | | 105,566 |
Lowe's Companies, Inc. | 21,305 | | 498,323 |
Lumber Liquidators, Inc. (a) | 2,800 | | 75,040 |
| | 678,929 |
Homefurnishing Retail - 0.4% |
Williams-Sonoma, Inc. | 1,500 | | 31,170 |
Specialty Stores - 4.4% |
Big 5 Sporting Goods Corp. | 2,400 | | 41,232 |
Cabela's, Inc. Class A (a) | 1,200 | | 17,112 |
OfficeMax, Inc. (a) | 2,600 | | 32,994 |
Signet Jewelers Ltd. (a) | 300 | | 8,016 |
Staples, Inc. | 9,086 | | 223,425 |
Vitamin Shoppe, Inc. | 1,100 | | 24,464 |
Zale Corp. (a) | 6,833 | | 18,586 |
| | 365,829 |
TOTAL SPECIALTY RETAIL | | 1,851,800 |
TEXTILES, APPAREL & LUXURY GOODS - 3.8% |
Apparel, Accessories & Luxury Goods - 1.1% |
G-III Apparel Group Ltd. (a) | 1,800 | | 39,006 |
Phillips-Van Heusen Corp. | 200 | | 8,136 |
VF Corp. | 620 | | 45,409 |
| | 92,551 |
Common Stocks - continued |
| Shares | | Value |
TEXTILES, APPAREL & LUXURY GOODS - CONTINUED |
Footwear - 2.7% |
Deckers Outdoor Corp. (a) | 500 | | $ 50,860 |
Iconix Brand Group, Inc. (a) | 2,100 | | 26,565 |
NIKE, Inc. Class B | 2,200 | | 145,354 |
| | 222,779 |
TOTAL TEXTILES, APPAREL & LUXURY GOODS | | 315,330 |
TOTAL COMMON STOCKS (Cost $7,437,564) | 8,239,823 |
Money Market Funds - 0.6% |
| | | |
Fidelity Cash Central Fund, 0.16% (b)
(Cost $53,323) | 53,323 | | 53,323 |
Cash Equivalents - 0.4% |
| Maturity Amount | | Value |
Investments in repurchase agreements in a joint trading account at 0.01%, dated 12/31/09 due 1/4/10 (Collateralized by U.S. Government Obligations) #
(Cost $31,000) | $ 31,000 | | $ 31,000 |
TOTAL INVESTMENT PORTFOLIO - 100.0% (Cost $7,521,887) | | 8,324,146 |
NET OTHER ASSETS - 0.0% | | (2,151) |
NET ASSETS - 100% | $ 8,321,995 |
Legend |
(a) Non-income producing |
(b) Affiliated fund that is available only to investment companies and other accounts managed by Fidelity Investments. The rate quoted is the annualized seven-day yield of the fund at period end. A complete unaudited listing of the fund's holdings as of its most recent quarter end is available upon request. |
# Additional information on each counterparty to the repurchase agreement is as follows: |
Repurchase Agreement / Counterparty | Value |
$31,000 due 1/04/10 at 0.01% |
BNP Paribas Securities Corp. | $ 2,675 |
Mizuho Securities USA, Inc. | 28,325 |
| $ 31,000 |
Affiliated Central Funds |
Information regarding fiscal year to date income earned by the Fund from investments in Fidelity Central Funds is as follows: |
Fund | Income earned |
Fidelity Cash Central Fund | $ 576 |
Other Information |
The following is a summary of the inputs used, as of December 31, 2009, involving the Fund's assets and liabilities carried at value. The inputs or methodology used for valuing securities may not be an indication of the risk associated with investing in those securities. For more information on valuation inputs, and their aggregation into the levels used in the tables below, please refer to the Security Valuation section in the accompanying Notes to Financial Statements. |
Valuation Inputs at Reporting Date: |
Description | Total | Level 1 | Level 2 | Level 3 |
Investments in Securities: | | | | |
Common Stocks | $ 8,239,823 | $ 8,069,883 | $ 169,940 | $ - |
Money Market Funds | 53,323 | 53,323 | - | - |
Cash Equivalents | 31,000 | - | 31,000 | - |
Total Investments in Securities: | $ 8,324,146 | $ 8,123,206 | $ 200,940 | $ - |
The following is a reconciliation of Investments in Securities for which Level 3 inputs were used in determining value: |
Investments in Securities: | |
Beginning Balance | $ 31,050 |
Total Realized Gain (Loss) | 30,406 |
Total Unrealized Gain (Loss) | 52,331 |
Cost of Purchases | 23,200 |
Proceeds of Sales | (44,106) |
Amortization/Accretion | - |
Transfers in/out of Level 3 | (92,881) |
Ending Balance | $ - |
The change in unrealized gain (loss) for the period attributable to Level 3 securities held at December 31, 2009 | $ - |
The information used in the above reconciliation represents fiscal year to date activity for any Investments in Securities identified as using Level 3 inputs at either the beginning or the end of the current fiscal period. Transfers in or out of Level 3 represents either the beginning value (for transfers in), or the ending value (for transfers out) of any Security or Instrument where a change in the pricing level occurred from the beginning to the end of the period. Realized and unrealized gains (losses) disclosed in the reconciliation are included in Net Gain (Loss) on the Fund's Statement of Operations. |
Income Tax Information |
At December 31, 2009, the fund had a capital loss carryforward of approximately $2,054,868 of which $966,651 and $1,088,217 will expire on December 31, 2016 and 2017, respectively. |
See accompanying notes which are an integral part of the financial statements.
Annual Report
Statement of Assets and Liabilities
| December 31, 2009 |
| | |
Assets | | |
Investment in securities, at value (including repurchase agreements of $31,000) - See accompanying schedule: Unaffiliated issuers (cost $7,468,564) | $ 8,270,823 | |
Fidelity Central Funds (cost $53,323) | 53,323 | |
Total Investments (cost $7,521,887) | | $ 8,324,146 |
Cash | | 685 |
Receivable for investments sold | | 146,223 |
Dividends receivable | | 9,016 |
Distributions receivable from Fidelity Central Funds | | 4 |
Prepaid expenses | | 36 |
Receivable from investment adviser for expense reductions | | 2,644 |
Other receivables | | 233 |
Total assets | | 8,482,987 |
| | |
Liabilities | | |
Payable for investments purchased | $ 121,802 | |
Payable for fund shares redeemed | 128 | |
Accrued management fee | 3,946 | |
Other affiliated payables | 1,043 | |
Other payables and accrued expenses | 34,073 | |
Total liabilities | | 160,992 |
| | |
Net Assets | | $ 8,321,995 |
Net Assets consist of: | | |
Paid in capital | | $ 9,760,242 |
Accumulated undistributed net realized gain (loss) on investments and foreign currency transactions | | (2,240,504) |
Net unrealized appreciation (depreciation) on investments and assets and liabilities in foreign currencies | | 802,257 |
Net Assets | | $ 8,321,995 |
Statement of Assets and Liabilities - continued
| December 31, 2009 |
| | |
Initial Class:
Net Asset Value, offering price and redemption price per share ($4,097,617 ÷ 427,610 shares) | | $ 9.58 |
| | |
Investor Class:
Net Asset Value, offering price and redemption price per share ($4,224,378 ÷ 441,354 shares) | | $ 9.57 |
See accompanying notes which are an integral part of the financial statements.
Annual Report
Financial Statements - continued
Statement of Operations
| Year ended December 31, 2009 |
| | |
Investment Income | | |
Dividends | | $ 108,524 |
Interest | | 9 |
Income from Fidelity Central Funds | | 576 |
Total income | | 109,109 |
| | |
Expenses | | |
Management fee | $ 39,291 | |
Transfer agent fees | 14,681 | |
Accounting fees and expenses | 2,722 | |
Custodian fees and expenses | 12,447 | |
Independent trustees' compensation | 46 | |
Audit | 33,105 | |
Legal | 40 | |
Miscellaneous | 530 | |
Total expenses before reductions | 102,862 | |
Expense reductions | (30,748) | 72,114 |
Net investment income (loss) | | 36,995 |
Realized and Unrealized Gain (Loss) Net realized gain (loss) on: | | |
Investment securities: | | |
Unaffiliated issuers | (649,497) | |
Foreign currency transactions | 35 | |
Total net realized gain (loss) | | (649,462) |
Change in net unrealized appreciation (depreciation) on: Investment securities | 2,832,343 | |
Assets and liabilities in foreign currencies | (1) | |
Total change in net unrealized appreciation (depreciation) | | 2,832,342 |
Net gain (loss) | | 2,182,880 |
Net increase (decrease) in net assets resulting from operations | | $ 2,219,875 |
Statement of Changes in Net Assets
| Year ended
December 31, 2009 | Year ended
December 31, 2008 |
Increase (Decrease) in Net Assets | | |
Operations | | |
Net investment income (loss) | $ 36,995 | $ 33,831 |
Net realized gain (loss) | (649,462) | (1,541,532) |
Change in net unrealized appreciation (depreciation) | 2,832,342 | (1,650,912) |
Net increase (decrease) in net assets resulting from operations | 2,219,875 | (3,158,613) |
Distributions to shareholders from net investment income | (39,751) | (30,645) |
Distributions to shareholders from net realized gain | - | (72,042) |
Total distributions | (39,751) | (102,687) |
Share transactions - net increase (decrease) | 1,609,010 | (1,561,450) |
Redemption fees | 8,313 | 5,640 |
Total increase (decrease) in net assets | 3,797,447 | (4,817,110) |
| | |
Net Assets | | |
Beginning of period | 4,524,548 | 9,341,658 |
End of period (including undistributed net investment income of $0 and $671, respectively) | $ 8,321,995 | $ 4,524,548 |
See accompanying notes which are an integral part of the financial statements.
Annual Report
Financial Highlights - Initial Class
Years ended December 31, | 2009 | 2008 | 2007 | 2006 | 2005 |
Selected Per-Share Data | | | | | |
Net asset value, beginning of period | $ 6.96 | $ 10.72 | $ 12.84 | $ 11.45 | $ 11.12 |
Income from Investment Operations | | | | | |
Net investment income (loss) C | .04 | .04 | (.01) | .11 F | (.02) |
Net realized and unrealized gain (loss) | 2.62 | (3.68) | (1.02) | 1.33 | .35 |
Total from investment operations | 2.66 | (3.64) | (1.03) | 1.44 | .33 |
Distributions from net investment income | (.05) | (.05) | (.02) | (.06) | - |
Distributions from net realized gain | - | (.09) | (1.08) | - | - |
Total distributions | (.05) | (.13) I | (1.10) | (.06) | - |
Redemption fees added to paid in capital C | .01 | .01 | .01 | .01 | - H |
Net asset value, end of period | $ 9.58 | $ 6.96 | $ 10.72 | $ 12.84 | $ 11.45 |
Total Return A,B | 38.32% | (34.10)% | (8.14)% | 12.63% | 2.97% |
Ratios to Average Net Assets D,G | | | | | |
Expenses before reductions | 1.43% | 1.40% | 1.10% | 1.20% | 1.19% |
Expenses net of fee waivers, if any | 1.00% | 1.00% | 1.01% | 1.15% | 1.14% |
Expenses net of all reductions | .99% | 1.00% | 1.01% | 1.14% | 1.12% |
Net investment income (loss) | .57% | .48% | (.07)% | .90% F | (.19)% |
Supplemental Data | | | | | |
Net assets, end of period (000 omitted) | $ 4,098 | $ 3,212 | $ 6,989 | $ 13,866 | $ 9,616 |
Portfolio turnover rate E | 166% | 81% | 114% | 189% | 74% |
A Total returns do not reflect charges attributable to your insurance company's separate account. Inclusion of these charges would reduce the total returns shown. B Total returns would have been lower had certain expenses not been reduced during the periods shown. C Calculated based on average shares outstanding during the period. D Fees and expenses of the underlying Fidelity Central Funds are not included in the Fund's expense ratio. The Fund indirectly bears its proportionate share of the expenses of any underlying Fidelity Central Funds. E Amount does not include the portfolio activity of any underlying Fidelity Central Funds. F Investment income per share reflects special dividends which amounted to $.09 per share. Excluding these special dividends, the ratio of net investment income (loss) to average net assets would have been .13%. G Expense ratios reflect operating expenses of the class. Expenses before reductions do not reflect amounts reimbursed by the investment ad-viser or reductions from brokerage service arrangements or reductions from other expense offset arrangements and do not represent the amount paid by the class during periods when reimbursements or reductions occur. Expenses net of fee waivers reflect expenses after reimbursement by the investment adviser but prior to reductions from brokerage service arrangements or other expense offset arrangements. Expenses net of all reductions represent the net expenses paid by the class. H Amount represents less than $.01 per share. I Total distributions of $.13 per share is comprised of distributions from net investment income of $.046 and distributions from net realized gain of $.085 per share. |
Financial Highlights - Investor Class
Years ended December 31, | 2009 | 2008 | 2007 | 2006 | 2005 I |
Selected Per-Share Data | | | | | |
Net asset value, beginning of period | $ 6.96 | $ 10.72 | $ 12.83 | $ 11.44 | $ 11.49 |
Income from Investment Operations | | | | | |
Net investment income (loss) E | .04 | .04 | (.03) | .10 H | (.01) |
Net realized and unrealized gain (loss) | 2.61 | (3.68) | (1.02) | 1.33 | (.04) |
Total from investment operations | 2.65 | (3.64) | (1.05) | 1.43 | (.05) |
Distributions from net investment income | (.05) | (.05) | (.02) | (.05) | - |
Distributions from net realized gain | - | (.09) | (1.05) | - | - |
Total distributions | (.05) | (.13) L | (1.07) | (.05) | - |
Redemption fees added to paid in capital E | .01 | .01 | .01 | .01 | - K |
Net asset value, end of period | $ 9.57 | $ 6.96 | $ 10.72 | $ 12.83 | $ 11.44 |
Total Return B,C,D | 38.17% | (34.10)% | (8.29)% | 12.62% | (.44)% |
Ratios to Average Net Assets F,J | | | | | |
Expenses before reductions | 1.51% | 1.54% | 1.24% | 1.41% | 1.61% A |
Expenses net of fee waivers, if any | 1.08% | 1.09% | 1.15% | 1.25% | 1.25% A |
Expenses net of all reductions | 1.08% | 1.09% | 1.15% | 1.24% | 1.23% A |
Net investment income (loss) | .48% | .39% | (.21)% | .80% H | (.20)% A |
Supplemental Data | | | | | |
Net assets, end of period (000 omitted) | $ 4,224 | $ 1,313 | $ 2,352 | $ 4,256 | $ 339 |
Portfolio turnover rate G | 166% | 81% | 114% | 189% | 74% |
A Annualized B Total returns for periods of less than one year are not annualized. C Total returns do not reflect charges attributable to your insurance company's separate account. Inclusion of these charges would reduce the total returns shown. D Total returns would have been lower had certain expenses not been reduced during the periods shown. E Calculated based on average shares outstanding during the period. F Fees and expenses of the underlying Fidelity Central Funds are not included in the Fund's expense ratio. The Fund indirectly bears its proportionate share of the expenses of any underlying Fidelity Central Funds. G Amount does not include the portfolio activity of any underlying Fidelity Central Funds. H Investment income per share reflects special dividends which amounted to $.09 per share. Excluding these special dividends, the ratio of net investment income (loss) to average net assets would have been .03%. I For the period July 21, 2005 (commencement of sale of shares) to December 31, 2005. J Expense ratios reflect operating expenses of the class. Expenses before reductions do not reflect amounts reimbursed by the investment adviser or reductions from brokerage service arrangements or reductions from other expense offset arrangements and do not represent the amount paid by the class during periods when reimbursements or reductions occur. Expense ratios before reductions for start-up periods may not be representative of longer-term operating periods. Expenses net of fee waivers reflect expenses after reimbursement by the investment adviser but prior to reductions from brokerage service arrangements or other expense offset arrangements. Expenses net of all reductions represent the net expenses paid by the class. K Amount represents less than $.01 per share. L Total distributions of $.13 per share is comprised of distributions from net investment income of $.046 and distributions from net realized gain of $.085 per share. |
See accompanying notes which are an integral part of the financial statements.
Annual Report
Notes to Financial Statements
For the period ended December 31, 2009
1. Organization.
VIP Consumer Discretionary Portfolio (the Fund) is a non-diversified fund of Variable Insurance Products Fund IV (the trust) and is authorized to issue an unlimited number of shares. The trust is registered under the Investment Company Act of 1940, as amended (the 1940 Act), as an open-end management investment company organized as a Massachusetts business trust. Shares of the Fund may only be purchased by insurance companies for the purpose of funding variable annuity or variable life insurance contracts. The Fund offers the following classes of shares: Initial Class shares and Investor Class shares. All classes have equal rights and voting privileges, except for matters affecting a single class. Investment income, realized and unrealized capital gains and losses, the common expenses of the Fund, and certain fund-level expense reductions, if any, are allocated on a pro-rata basis to each class based on the relative net assets of each class to the total net assets of the Fund. Each class differs with respect to transfer agent fees incurred. Certain expense reductions also differ by class.
2. Investments in Fidelity Central Funds.
The Fund may invest in Fidelity Central Funds, which are open-end investment companies available only to other investment companies and accounts managed by Fidelity Management & Research Company (FMR) and its affiliates. The Fund's Schedule of Investments lists each of the Fidelity Central Funds held as of period end, if any, as an investment of the Fund, but does not include the underlying holdings of each Fidelity Central Fund. As an Investing Fund, the Fund indirectly bears its proportionate share of the expenses of the underlying Fidelity Central Funds.
The Money Market Central Funds seek preservation of capital and current income and are managed by Fidelity Investments Money Management, Inc. (FIMM), an affiliate of FMR.
A complete unaudited list of holdings for each Fidelity Central Fund is available upon request or at the Securities and Exchange Commission (the SEC) web site at www.sec.gov. In addition, the financial statements of the Fidelity Central Funds, which are not covered by the Fund's Report of Independent Registered Public Accounting Firm, are available on the SEC web site or upon request.
3. Significant Accounting Policies.
The financial statements have been prepared in conformity with accounting principles generally accepted in the United States of America, which require management to make certain estimates and assumptions at the date of the financial statements. Actual results could differ from those estimates. Events or transactions occurring after period end through the date that the financial statements were issued, February 12, 2010, have been evaluated in the preparation of the financial statements. The following summarizes the significant accounting policies of the Fund:
Security Valuation. Investments are valued as of 4:00 p.m. Eastern time on the last calendar day of the period. The Fund uses independent pricing services approved by the Board of Trustees to value its investments. When current market prices or quotations are not readily available or reliable, valuations may be determined in good faith in accordance with procedures adopted by the Board of Trustees. Factors used in determining value may include significant market or security specific events. The frequency with which these procedures are used cannot be predicted and may be utilized to a significant extent. The value used for net asset value (NAV) calculation under these procedures may differ from published prices for the same securities.
The Fund categorizes the inputs to valuation techniques used to value its investments into a disclosure hierarchy consisting of three levels as shown below.
Level 1 - quoted prices in active markets for identical investments
Level 2 - other significant observable inputs (including quoted prices for similar investments, interest rates, prepayment speeds, etc.)
Level 3 - unobservable inputs (including the fund's own assumptions based on the best information available)
Changes in valuation techniques may result in transfers in or out of an assigned level within the disclosure hierarchy. The aggregate value of investments by input level, as of December 31, 2009, as well as a roll forward of Level 3 securities, is included at the end of the Fund's Schedule of Investments. Valuation techniques used to value the Fund's investments by major category are as follows.
Equity securities, including restricted securities, for which market quotations are readily available, are valued at the last reported sale price or official closing price as reported by an independent pricing service on the primary market or exchange on which they are traded and are categorized as level 1 in the hierarchy. In the event there were no sales during the day or closing prices are not available, securities are valued at the last quoted bid price or may be valued using the last available price and categorized as Level 2 in the hierarchy. For foreign equity securities, when significant market or security events arise, comparisons to the valuation of American Depository Receipts (ADRs), futures contracts, exchange-traded funds (ETFs) and certain indexes as well as quoted prices for similar securities are used and are categorized as Level 2 in the hierarchy in these circumstances. For restricted securities and private placements where observable inputs are limited, assumptions about market activity and risk are used and are categorized as level 3 in the hierarchy.
Annual Report
3. Significant Accounting Policies - continued
Security Valuation - continued
Investments in open-end mutual funds including the Fidelity Money Market Central Funds are valued at their closing net asset value each business day and are categorized as Level 1 in the hierarchy. Short-term securities with remaining maturities of sixty days or less for which quotations are not readily available are valued at amortized cost, which approximates value and are categorized as level 2 in the hierarchy.
Foreign Currency. The Fund uses foreign currency contracts to facilitate transactions in foreign-denominated securities. Losses from these transactions may arise from changes in the value of the foreign currency or if the counterparties do not perform under the contracts' terms.
Foreign-denominated assets, including investment securities, and liabilities are translated into U.S. dollars at the exchange rate at period end. Purchases and sales of investment securities, income and dividends received and expenses denominated in foreign currencies are translated into U.S. dollars at the exchange rate in effect on the transaction date.
The effects of exchange rate fluctuations on investments are included with the net realized and unrealized gain (loss) on investment securities. Other foreign currency transactions resulting in realized and unrealized gain (loss) are disclosed separately.
Investment Transactions and Income. For financial reporting purposes, the Fund's investment holdings and NAV include trades executed through the end of the last business day of the period. The NAV per share for processing shareholder transactions is calculated as of the close of business of the New York Stock Exchange (NYSE), normally 4:00 p.m. Eastern time and includes trades executed through the end of the prior business day. Gains and losses on securities sold are determined on the basis of identified cost and may include proceeds received from litigation. Dividend income is recorded on the ex-dividend date, except for certain dividends from foreign securities where the ex-dividend date may have passed, which are recorded as soon as the Fund is informed of the ex-dividend date. Non-cash dividends included in dividend income, if any, are recorded at the fair market value of the securities received. Distributions received on securities that represent a return of capital or capital gain are recorded as a reduction of cost of investments and/or as a realized gain. The Fund estimates the components of distributions received that may be considered return of capital distributions or capital gain distributions. Interest income and distributions from the Fidelity Central Funds are accrued as earned. Interest income includes coupon interest and amortization of premium and accretion of discount on debt securities. Investment income is recorded net of foreign taxes withheld where recovery of such taxes is uncertain.
Expenses. Most expenses of the trust can be directly attributed to a fund. Expenses which cannot be directly attributed are apportioned among each Fund in the trust. Expense estimates are accrued in the period to which they relate and adjustments are made when actual amounts are known.
Income Tax Information and Distributions to Shareholders. Each year, the Fund intends to qualify as a regulated investment company by distributing substantially all of its taxable income and realized gains under Subchapter M of the Internal Revenue Code and filing its U.S. federal tax return. As a result, no provision for income taxes is required. As of December 31, 2009, the Fund did not have any unrecognized tax benefits in the accompanying financial statements. A Fund's federal tax return is subject to examination by the Internal Revenue Service (IRS) for a period of three years. Foreign taxes are provided for based on the Fund's understanding of the tax rules and rates that exist in the foreign markets in which it invests.
Distributions are recorded on the ex-dividend date. Income dividends and capital gain distributions are declared separately for each class. Income and capital gain distributions are determined in accordance with income tax regulations, which may differ from generally accepted accounting principles.
Capital accounts within the financial statements are adjusted for permanent book-tax differences. These adjustments have no impact on net assets or the results of operations. Temporary book-tax differences will reverse in a subsequent period.
Book-tax differences are primarily due to foreign currency transactions, capital loss carryforwards, and losses deferred due to wash sales and excise tax regulations.
The federal tax cost of investment securities and unrealized appreciation (depreciation) as of period end were as follows:
Gross unrealized appreciation | $ 1,290,200 |
Gross unrealized depreciation | (659,039) |
Net unrealized appreciation (depreciation) | $ 631,161 |
| |
Tax Cost | $ 7,692,985 |
The tax-based components of distributable earnings as of period end were as follows:
Capital loss carryforward | $ (2,054,868) |
Net unrealized appreciation (depreciation) | $ 631,160 |
Annual Report
Notes to Financial Statements - continued
3. Significant Accounting Policies - continued
Income Tax Information and Distributions to Shareholders - continued
The tax character of distributions paid was as follows:
| December 31, 2009 | December 31, 2008 |
Ordinary Income | $ 39,751 | $ 51,833 |
Long-term Capital Gains | - | 50,854 |
Total | $ 39,751 | $ 102,687 |
Trading (Redemption) Fees. Shares held less than 60 days are subject to a redemption fee equal to 1% of the proceeds of the redeemed shares. All redemption fees, including any estimated redemption fees paid by FMR, are retained by the Fund and accounted for as an addition to paid in capital.
Repurchase Agreements. FMR has received an Exemptive Order from the SEC which permits the Fund and other affiliated entities of FMR to transfer uninvested cash balances into joint trading accounts which are then invested in repurchase agreements. The Fund may also invest directly with institutions in repurchase agreements. Repurchase agreements are collateralized by government or non-government securities. Upon settlement date, collateral is held in segregated accounts with custodian banks and may be obtained in the event of a default of the counterparty. The Fund monitors, on a daily basis, the value of the collateral to ensure it is at least equal to the principal amount of the repurchase agreement (including accrued interest). In the event of a default by the counterparty, realization of the collateral proceeds could be delayed, during which time the value of the collateral may decline.
4. Purchases and Sales of Investments.
Purchases and sales of securities, other than short-term securities, aggregated $12,910,584 and $11,321,526, respectively.
5. Fees and Other Transactions with Affiliates.
Management Fee. FMR and its affiliates provide the Fund with investment management related services for which the Fund pays a monthly management fee. The management fee is the sum of an individual fund fee rate that is based on an annual rate of .30% of the Fund's average net assets and a group fee rate that averaged .26% during the period. The group fee rate is based upon the average net assets of all the mutual funds advised by FMR. The group fee rate decreases as assets under management increase and increases as assets under management decrease. For the period, the total annual management fee rate was .56% of the Fund's average net assets.
Transfer Agent Fees. Fidelity Investments Institutional Operations Company, Inc. (FIIOC), an affiliate of FMR, is the Fund's transfer, dividend disbursing, and shareholder servicing agent. FIIOC receives an asset-based fee with respect to each class. Each class (with the exception of Investor Class) pays a transfer agent fee, excluding out of pocket expenses, equal to an annual rate of .07% of average net assets. Investor Class pays a monthly asset-based transfer agent fee of .15% of average net assets. The total transfer agent fees paid by each class to FIIOC, including out of pocket expenses, were as follows:
Initial Class | $ 6,672 |
Investor Class | 8,009 |
| $ 14,681 |
Accounting Fees. Fidelity Service Company, Inc. (FSC), an affiliate of FMR, maintains the Fund's accounting records. The fee is based on the level of average net assets for the month.
Brokerage Commissions. The Fund placed a portion of its portfolio transactions with brokerage firms which are affiliates of the investment adviser. The commissions paid to these affiliated firms were $1,396 for the period.
6. Committed Line of Credit.
The Fund participates with other funds managed by FMR in a $3.5 billion credit facility (the "line of credit") to be utilized for temporary or emergency purposes to fund shareholder redemptions or for other short-term liquidity purposes. The Fund has agreed to pay commitment fees on its pro-rata portion of the line of credit, which amounted to $31 and is reflected in Miscellaneous Expense on the Statement of Operations. During the period, there were no borrowings on this line of credit.
Annual Report
7. Expense Reductions.
FMR voluntarily agreed to reimburse each class to the extent annual operating expenses exceeded certain levels of average net assets as noted in the table below. Some expenses, for example interest expense, including commitment fees, are excluded from this reimbursement.
The following classes were in reimbursement during the period:
| Expense
Limitations | Reimbursement
from adviser |
Initial Class | 1.00% | $ 16,829 |
Investor Class | 1.08% | 13,402 |
| | $ 30,231 |
Many of the brokers with whom FMR places trades on behalf of the Fund provided services to the Fund in addition to trade execution. These services included payments of certain expenses on behalf of the Fund totaling $517 for the period.
8. Distributions to Shareholders.
Distributions to shareholders of each class were as follows:
Years ended December 31, | 2009 | 2008 |
From net investment income | | |
Initial Class | $ 19,436 | $ 22,246 |
Investor Class | 20,315 | 8,399 |
Total | $ 39,751 | $ 30,645 |
From net realized gain | | |
Initial Class | $ - | $ 53,286 |
Investor Class | - | 18,756 |
Total | $ - | $ 72,042 |
9. Share Transactions.
Transactions for each class of shares were as follows:
| Shares | Dollars |
Years ended December 31, | 2009 | 2008 | 2009 | 2008 |
Initial Class | | | | |
Shares sold | 387,558 | 200,837 | $ 2,878,099 | $ 1,839,241 |
Reinvestment of distributions | 2,071 | 8,451 | 19,436 | 75,532 |
Shares redeemed | (423,292) | (400,279) | (3,190,755) | (3,312,456) |
Net increase (decrease) | (33,663) | (190,991) | $ (293,220) | $ (1,397,683) |
Investor Class | | | | |
Shares sold | 573,242 | 124,737 | $ 4,445,239 | $ 1,182,888 |
Reinvestment of distributions | 2,151 | 3,058 | 20,315 | 27,155 |
Shares redeemed | (322,598) | (158,673) | (2,563,324) | (1,373,810) |
Net increase (decrease) | 252,795 | (30,878) | $ 1,902,230 | $ (163,767) |
10. Other.
The Fund's organizational documents provide former and current trustees and officers with a limited indemnification against liabilities arising in connection with the performance of their duties to the Fund. In the normal course of business, the Fund may also enter into contracts that provide general indemnifications. The Fund's maximum exposure under these arrangements is unknown as this would be dependent on future claims that may be made against the Fund. The risk of material loss from such claims is considered remote.
At the end of the period, FMR or its affiliates were the owners of record of 100% of the total outstanding shares of the Fund.
Annual Report
Report of Independent Registered Public Accounting Firm
To the Trustees of Variable Insurance Products Fund IV and the Shareholders of VIP Consumer Discretionary Portfolio:
In our opinion, the accompanying statement of assets and liabilities, including the schedule of investments, and the related statements of operations and of changes in net assets and the financial highlights present fairly, in all material respects, the financial position of VIP Consumer Discretionary Portfolio (a fund of Variable Insurance Products Fund IV) at December 31, 2009, the results of its operations for the year then ended, the changes in its net assets for each of the two years in the period then ended and the financial highlights for each of the periods indicated, in conformity with accounting principles generally accepted in the United States of America. These financial statements and financial highlights (hereafter referred to as "financial statements") are the responsibility of the VIP Consumer Discretionary Portfolio's management. Our responsibility is to express an opinion on these financial statements based on our audits. We conducted our audits of these financial statements in accordance with the standards of the Public Company Accounting Oversight Board (United States). Those standards require that we plan and perform the audit to obtain reasonable assurance about whether the financial statements are free of material misstatement. An audit includes examining, on a test basis, evidence supporting the amounts and disclosures in the financial statements, assessing the accounting principles used and significant estimates made by management, and evaluating the overall financial statement presentation. We believe that our audits, which included confirmation of securities at December 31, 2009 by correspondence with the custodian and brokers, provide a reasonable basis for our opinion.
/s/ PricewaterhouseCoopers LLP
PricewaterhouseCoopers LLP
Boston, Massachusetts
February 12, 2010
Annual Report
The Trustees, Member of the Advisory Board, and executive officers of the trust and fund, as applicable, are listed below. The Board of Trustees governs the fund and is responsible for protecting the interests of shareholders. The Trustees are experienced executives who meet periodically throughout the year to oversee the fund's activities, review contractual arrangements with companies that provide services to the fund, and review the fund's performance. Except for James C. Curvey, each of the Trustees oversees 222 funds advised by FMR or an affiliate. Mr. Curvey oversees 410 funds advised by FMR or an affiliate.
The Trustees hold office without limit in time except that (a) any Trustee may resign; (b) any Trustee may be removed by written instrument, signed by at least two-thirds of the number of Trustees prior to such removal; (c) any Trustee who requests to be retired or who has become incapacitated by illness or injury may be retired by written instrument signed by a majority of the other Trustees; and (d) any Trustee may be removed at any special meeting of shareholders by a two-thirds vote of the outstanding voting securities of the trust. Each Trustee who is not an interested person (as defined in the 1940 Act) (Independent Trustee), shall retire not later than the last day of the calendar year in which his or her 72nd birthday occurs. The Independent Trustees may waive this mandatory retirement age policy with respect to individual Trustees. The executive officers and Advisory Board Member hold office without limit in time, except that any officer and Advisory Board Member may resign or may be removed by a vote of a majority of the Trustees at any regular meeting or any special meeting of the Trustees. Except as indicated, each individual has held the office shown or other offices in the same company for the past five years.
The fund's Statement of Additional Information (SAI) includes more information about the Trustees. To request a free copy, call Fidelity at 1-877-208-0098.
Interested Trustees*:
Correspondence intended for each Trustee who is an interested person may be sent to Fidelity Investments, 82 Devonshire Street, Boston, Massachusetts 02109.
Name, Age; Principal Occupation |
Edward C. Johnson 3d (79) |
| Year of Election or Appointment: 1983 Mr. Johnson is Trustee and Chairman of the Board of Trustees of certain Trusts. Mr. Johnson serves as Chief Executive Officer, Chairman, and a Director of FMR LLC; Chairman and a Director of FMR; Chairman and a Director of Fidelity Research & Analysis Company (FRAC); Chairman and a Director of Fidelity Investments Money Management, Inc.; and Chairman and a Director of FMR Co., Inc. In addition, Mr. Johnson serves as Chairman and Director of FIL Limited. Previously, Mr. Johnson served as President of FMR LLC (2006-2007). |
James C. Curvey (74) |
| Year of Election or Appointment: 2007 Mr. Curvey also serves as Trustee (2007-present) of other investment companies advised by FMR. Mr. Curvey is a Director of FMR and FMR Co., Inc. (2007-present). Mr. Curvey is also Vice Chairman (2006-present) and Director of FMR LLC. In addition, Mr. Curvey serves as an Overseer for the Boston Symphony Orchestra and a member of the Trustees of Villanova University. |
* Trustees have been determined to be "Interested Trustees" by virtue of, among other things, their affiliation with the trust or various entities under common control with FMR.
Independent Trustees:
Correspondence intended for each Independent Trustee (that is, the Trustees other than the Interested Trustees) may be sent to Fidelity Investments, P.O. Box 55235, Boston, Massachusetts 02205-5235.
Name, Age; Principal Occupation |
Dennis J. Dirks (61) |
| Year of Election or Appointment: 2005 Prior to his retirement in May 2003, Mr. Dirks was Chief Operating Officer and a member of the Board of The Depository Trust & Clearing Corporation (DTCC). He also served as President, Chief Operating Officer, and Board member of The Depository Trust Company (DTC) and President and Board member of the National Securities Clearing Corporation (NSCC). In addition, Mr. Dirks served as Chief Executive Officer and Board member of the Government Securities Clearing Corporation, Chief Executive Officer and Board member of the Mortgage-Backed Securities Clearing Corporation, as a Trustee and a member of the Finance Committee of Manhattan College (2005-2008), and as a Trustee and a member of the Finance Committee of AHRC of Nassau County (2006-2008). Currently, Mr. Dirks serves as a member of the Board of Directors for The Brookville Center for Children's Services, Inc. (2009-present). |
Alan J. Lacy (56) |
| Year of Election or Appointment: 2008 Mr. Lacy serves as Senior Adviser (2007-present) of Oak Hill Capital Partners, L.P. (private equity). Mr. Lacy also served as Chief Executive Officer (2000-2005) and Vice Chairman (2005-2006) of Sears Holdings Corporation and Sears, Roebuck and Co. (retail). In addition, Mr. Lacy serves as a member of the Board of Directors of The Western Union Company (global money transfer, 2006-present) and Bristol-Myers Squibb Company (global pharmaceuticals, 2007-present). Mr. Lacy is Chairman (2008-present) and a member (2006-present) of the Board of Trustees of The National Parks Conservation Association. |
Ned C. Lautenbach (65) |
| Year of Election or Appointment: 2000 Mr. Lautenbach is Chairman of the Independent Trustees of the Equity and High Income Funds (2006-present). Mr. Lautenbach is an Advisory Partner of Clayton, Dubilier & Rice, Inc. (private equity investment). Previously, Mr. Lautenbach was with the International Business Machines Corporation (IBM) from 1968 until his retirement in 1998. Mr. Lautenbach serves as a Director of Eaton Corporation (diversified industrial) as well as the Philharmonic Center for the Arts in Naples, Florida. Mr. Lautenbach is also a member of the Board of Trustees of Fairfield University (2005-present), as well as a member of the Council on Foreign Relations. Previously, Mr. Lautenbach served as a Director of Sony Corporation (2006-2007). |
Joseph Mauriello (65) |
| Year of Election or Appointment: 2008 Prior to his retirement in January 2006, Mr. Mauriello served in numerous senior management positions including Deputy Chairman and Chief Operating Officer (2004-2005), and Vice Chairman of Financial Services (2002-2004) of KPMG LLP US (professional services, 1965-2005). Mr. Mauriello currently serves as a member of the Board of Directors of XL Capital Ltd. (global insurance and re-insurance, 2006-present) and of Arcadia Resources Inc. (health care services and products, 2007-present). Previously, Mr. Mauriello served as a Director of the Hamilton Funds of the Bank of New York (2006-2007). |
Cornelia M. Small (65) |
| Year of Election or Appointment: 2005 Ms. Small is a member of the Board of Directors of the Teagle Foundation (2009-present). Ms. Small is also a member of the Investment Committee, and Chair (2008-present) and a member of the Board of Trustees of Smith College. In addition, Ms. Small serves on the Investment Committee of the Berkshire Taconic Community Foundation (2008-present). Previously, Ms. Small served as Chairperson of the Investment Committee (2002-2008) of Smith College. In addition, Ms. Small served as Chief Investment Officer, Director of Global Equity Investments, and a member of the Board of Directors of Scudder, Stevens & Clark and Scudder Kemper Investments. |
William S. Stavropoulos (70) |
| Year of Election or Appointment: 2001 Mr. Stavropoulos serves as President and Founder of the Michigan Baseball Foundation, the Great Lakes Loons (2007-present). Mr. Stavropoulos is Chairman Emeritus of the Board of Directors of The Dow Chemical Company, where he previously served in numerous senior management positions, including President, CEO (1995-2000; 2002-2004), Chairman of the Executive Committee (2000-2006), and as a member of the Board of Directors (1990-2006). Currently, Mr. Stavropoulos is a Director of Teradata Corporation (data warehousing and technology solutions, 2008-present), Chemical Financial Corporation, Maersk Inc. (industrial conglomerate), Tyco International, Inc. (multinational manufacturing and services, 2007-present), and a member of the Advisory Board for Metalmark Capital (private equity investment, 2005-present). Mr. Stavropoulos is a special advisor to Clayton, Dubilier & Rice, Inc. (private equity investment). In addition, Mr. Stavropoulos is a member of the University of Notre Dame Advisory Council for the College of Science. |
David M. Thomas (60) |
| Year of Election or Appointment: 2008 Previously, Mr. Thomas served as Executive Chairman (2005-2006) and Chairman and Chief Executive Officer (2000-2005) of IMS Health, Inc. (pharmaceutical and healthcare information solutions). In addition, Mr. Thomas serves as a member of the Board of Directors of Fortune Brands, Inc. (consumer products), and Interpublic Group of Companies, Inc. (marketing communication, 2004-present). |
Michael E. Wiley (59) |
| Year of Election or Appointment: 2008 Mr. Wiley also serves as a Director of Asia Pacific Exploration Consolidated (international oil and gas exploration and production, 2008-present), and as a member of the Board of Trustees of the University of Tulsa (2000-2006; 2007-present). Mr. Wiley serves as a Director of Tesoro Corporation (independent oil refiner and marketer, 2005-present), and a Director of Bill Barrett Corporation (exploration and production, 2005-present). In addition, Mr. Wiley also serves as a Director of Post Oak Bank (privately-held bank, 2004-present). Previously, Mr. Wiley served as a Sr. Energy Advisor of Katzenbach Partners, LLC (consulting, 2006-2007), as an Advisory Director of Riverstone Holdings (private investment), Chairman, President, and CEO of Baker Hughes, Inc. (oilfield services, 2000-2004), and as Director of Spinnaker Exploration Company (exploration and production, 2001-2005). |
Annual Report
Trustees and Officers - continued
Advisory Board Member and Executive Officers:
Correspondence intended for each executive officer and Peter S. Lynch may be sent to Fidelity Investments, 82 Devonshire Street, Boston, Massachusetts 02109.
Name, Age; Principal Occupation |
Peter S. Lynch (65) |
| Year of Election or Appointment: 2003 Member of the Advisory Board of Fidelity's Equity and High Income Funds. Mr. Lynch is Vice Chairman and a Director of FMR and FMR Co., Inc. In addition, Mr. Lynch serves as a Trustee of Boston College and as the Chairman of the Inner-City Scholarship Fund. Previously, Mr. Lynch served on the Special Olympics International Board of Directors (1997-2006). |
Kenneth B. Robins (40) |
| Year of Election or Appointment: 2008 President and Treasurer of Fidelity's Equity and High Income Funds. Mr. Robins also serves as Assistant Treasurer of other Fidelity funds (2009-present) and is an employee of Fidelity Investments (2004-present). Before joining Fidelity Investments, Mr. Robins worked at KPMG LLP, where he was a partner in KPMG's department of professional practice (2002-2004). |
Brian B. Hogan (45) |
| Year of Election or Appointment: 2009 Vice President of certain Equity Funds and Vice President of Sector Funds. Mr. Hogan also serves as Senior Vice President, Equity Research of FMR (2006-present) and President of FMR's Equity Division (2009-present). Previously, Mr. Hogan served as a portfolio manager. |
Christopher S. Bartel (38) |
| Year of Election or Appointment: 2009 Vice President of Fidelity's Sector and Real Estate Equity Funds. Mr. Bartel also serves as Senior Vice President of Equity Research (2009-present). Previously, Mr. Bartel served as Managing Director of Research (2006-2009) and an analyst and portfolio manager (2000-2006). |
Scott C. Goebel (41) |
| Year of Election or Appointment: 2008 Secretary and Chief Legal Officer (CLO) of the Fidelity funds. Mr. Goebel also serves as General Counsel, Secretary, and Senior Vice President of FMR (2008-present) and FMR Co., Inc. (2008-present); Deputy General Counsel of FMR LLC; Chief Legal Officer of Fidelity Management & Research (Hong Kong) Limited (2008-present) and Assistant Secretary of Fidelity Management & Research (Japan) Inc. (2008-present), Fidelity Investments Money Management, Inc. (2008-present), Fidelity Management & Research (U.K.) Inc. (2008-present), and Fidelity Research and Analysis Company (2008-present). Previously, Mr. Goebel served as Assistant Secretary of the Funds (2007-2008) and as Vice President and Secretary of Fidelity Distributors Corporation (FDC) (2005-2007). |
William C. Coffey (40) |
| Year of Election or Appointment: 2009 Assistant Secretary of Fidelity's Equity and High Income Funds. Mr. Coffey also serves as Vice President and Associate General Counsel of FMR LLC (2005-present), and is an employee of Fidelity Investments. |
Holly C. Laurent (55) |
| Year of Election or Appointment: 2008 Anti-Money Laundering (AML) Officer of the Fidelity funds. Ms. Laurent is an employee of Fidelity Investments. Previously, Ms. Laurent was Senior Vice President and Head of Legal for Fidelity Business Services India Pvt. Ltd. (2006-2008), and Senior Vice President, Deputy General Counsel and Group Head for FMR LLC (2005-2006). |
Christine Reynolds (51) |
| Year of Election or Appointment: 2008 Chief Financial Officer of the Fidelity funds. Ms. Reynolds became President of Fidelity Pricing and Cash Management Services (FPCMS) in August 2008. Ms. Reynolds served as Chief Operating Officer of FPCMS (2007-2008). Previously, Ms. Reynolds served as President, Treasurer, and Anti-Money Laundering officer of the Fidelity funds (2004-2007). |
Kenneth A. Rathgeber (62) |
| Year of Election or Appointment: 2004 Chief Compliance Officer of Fidelity's Equity and High Income Funds. Mr. Rathgeber is Chief Compliance Officer of Fidelity Management & Research (Hong Kong) Limited (2008-present), Fidelity Management & Research (Japan) Inc. (2008-present), FMR (2005-present), FMR Co., Inc. (2005-present), Fidelity Management & Research (U.K.) Inc. (2005-present), Fidelity Research & Analysis Company (2005-present), Fidelity Investments Money Management, Inc. (2005-present), Pyramis Global Advisors, LLC (2005-present), and Strategic Advisers, Inc. (2005-present). |
Jeffrey S. Christian (48) |
| Year of Election or Appointment: 2009 Deputy Treasurer of the Fidelity funds. Mr. Christian is an employee of Fidelity Investments. Previously, Mr. Christian served as Chief Financial Officer (2008-2009) of certain Fidelity funds, Senior Vice President of Fidelity Pricing and Cash Management Services (FPCMS) (2004-2009), and as Vice President of Business Analysis (2003-2004). |
Bryan A. Mehrmann (48) |
| Year of Election or Appointment: 2005 Deputy Treasurer of the Fidelity funds. Mr. Mehrmann is an employee of Fidelity Investments. Previously, Mr. Mehrmann served as Vice President of Fidelity Investments Institutional Services Group (FIIS)/Fidelity Investments Institutional Operations Company, Inc. (FIIOC) Client Services (1998-2004). |
Adrien E. Deberghes (42) |
| Year of Election or Appointment: 2008 Deputy Treasurer of Fidelity's Equity and High Income Funds. Mr. Deberghes is an employee of Fidelity Investments (2008-present). Previously, Mr. Deberghes served as Senior Vice President of Mutual Fund Administration at State Street Corporation (2007-2008), Senior Director of Mutual Fund Administration at Investors Bank & Trust (2005-2007), and Director of Finance for Dunkin' Brands (2000-2005). |
John R. Hebble (51) |
| Year of Election or Appointment: 2009 Assistant Treasurer of Fidelity's Equity and High Income Funds. Mr. Hebble also serves as President and Treasurer of other Fidelity funds (2008-present) and is an employee of Fidelity Investments. |
Paul M. Murphy (62) |
| Year of Election or Appointment: 2007 Assistant Treasurer of the Fidelity funds. Mr. Murphy is an employee of Fidelity Investments. Previously, Mr. Murphy served as Chief Financial Officer of the Fidelity funds (2005-2006), Vice President and Associate General Counsel of FMR (2007), and Senior Vice President of Fidelity Pricing and Cash Management Services (FPCMS) (1994-2007). |
Gary W. Ryan (51) |
| Year of Election or Appointment: 2005 Assistant Treasurer of the Fidelity funds. Mr. Ryan is an employee of Fidelity Investments. Previously, Mr. Ryan served as Vice President of Fund Reporting in Fidelity Pricing and Cash Management Services (FPCMS) (1999-2005). |
Annual Report
Initial Class and Investor Class designate 100% of the dividends distributed during the fiscal year as qualifying for the dividends-received deduction for corporate shareholders.
The fund will notify shareholders in January 2010 of amounts for use in preparing 2009 income tax returns.
Annual Report
Board Approval of Investment Advisory Contracts and Management Fees
VIP Consumer Discretionary Portfolio
Each year, the Board of Trustees, including the Independent Trustees (together, the Board), votes on the renewal of the management contract and sub-advisory agreements (together, the Advisory Contracts) for the fund. The Board, assisted by the advice of fund counsel and Independent Trustees' counsel, requests and considers a broad range of information throughout the year.
The Board meets regularly and, acting directly and through its separate committees, requests and receives information concerning, and considers at each of its meetings factors that are relevant to, its annual consideration of the renewal of the fund's Advisory Contracts, including the services and support provided to the fund and its shareholders. The Board has established various standing committees, each composed of Independent Trustees with varying backgrounds, to which the Board has assigned specific subject matter responsibilities in order to enhance effective decision-making by the Board. Each committee has a written charter outlining the structure and purposes of the committee. The Board also meets as needed to consider matters specifically related to the Board's annual consideration of the renewal of Advisory Contracts.
At its July 2009 meeting, the Board of Trustees, including the Independent Trustees, unanimously determined to renew the fund's Advisory Contracts. In reaching its determination, the Board considered all factors it believed relevant, including (i) the nature, extent, and quality of the services to be provided to the fund and its shareholders (including the investment performance of the fund); (ii) the competitiveness of the fund's management fee and total expenses; (iii) the total costs of the services to be provided by and the profits to be realized by Fidelity from its relationship with the fund; (iv) the extent to which economies of scale would be realized as the fund grows; and (v) whether fee levels reflect these economies of scale, if any, for the benefit of fund shareholders.
In considering whether to renew the Advisory Contracts for the fund, the Board ultimately reached a determination, with the assistance of fund counsel and Independent Trustees' counsel and through the exercise of its business judgment, that the renewal of the Advisory Contracts and the compensation to be received by Fidelity under the management contract is consistent with Fidelity's fiduciary duty under applicable law. The Board's decision to renew the Advisory Contracts was not based on any single factor noted above, but rather was based on a comprehensive consideration of all the information provided to the Board at its meetings throughout the year. The Board, in reaching its determination to renew the Advisory Contracts, is aware that shareholders in the fund have a broad range of investment choices available to them, including a wide choice among mutual funds offered by competitors to Fidelity, and that the fund's shareholders, with the opportunity to review and weigh the disclosure provided by the fund in its prospectus and other public disclosures, have chosen to invest in this fund, managed by Fidelity.
Nature, Extent, and Quality of Services Provided. The Board considered staffing within the investment adviser, FMR, and the sub-advisers (together, the Investment Advisers), including the backgrounds of the fund's investment personnel and the fund's investment objective and discipline. The Independent Trustees also had discussions with senior management of Fidelity's investment operations and investment groups. The Board considered the structure of the portfolio manager compensation program and whether this structure provides appropriate incentives.
Resources Dedicated to Investment Management and Support Services. The Board reviewed the size, education, and experience of the Investment Advisers' investment staff, their use of technology, and the Investment Advisers' approach to recruiting, training, and retaining portfolio managers and other research, advisory, and management personnel. In response to last year's financial crisis, FMR took a number of actions intended to cut costs and improve efficiency without weakening the investment teams or resources. The Board noted that Fidelity's analysts have access to a variety of technological tools and market and securities data that enable them to perform both fundamental and quantitative analysis and to specialize in various disciplines. The Board considered Fidelity's extensive global research capabilities that enable the Investment Advisers to aggregate data from various sources in an effort to produce positive investment results. The Board also considered that Fidelity's portfolio managers and analysts have access to daily portfolio attribution that allows for monitoring of a fund's portfolio, as well as an electronic communication system that provides immediate real-time access to research concerning issuers and credit enhancers.
Shareholder and Administrative Services. The Board considered (i) the nature, extent, quality, and cost of advisory, administrative, distribution, and shareholder services performed by the Investment Advisers and their affiliates under the Advisory Contracts and under separate agreements covering transfer agency, pricing and bookkeeping, and securities lending services for the fund; (ii) the nature and extent of the Investment Advisers' supervision of third party service providers, principally custodians and subcustodians; and (iii) the resources devoted to, and the record of compliance with, the fund's compliance policies and procedures. The Board also reviewed the allocation of fund brokerage, including allocations to brokers affiliated with the Investment Advisers, the use of brokerage commissions to pay fund expenses, and the use of "soft" commission dollars to pay for research services.
The Board noted that the growth of fund assets across the complex allows Fidelity to reinvest in the development of services designed to enhance the value or convenience of the Fidelity funds as investment vehicles. These services include 24-hour access to account information and market information through phone representatives and over the Internet, and investor education materials and asset allocation tools.
Investment in a Large Fund Family. The Board considered the benefits to shareholders of investing in a Fidelity fund, including the benefits of investing in a fund that is part of a large family of funds offering a variety of investment disciplines and providing for a large variety of mutual fund investor services. The Board noted that Fidelity has taken a number of actions over the previous year that benefited particular funds, including (i) dedicating additional resources to investment research and to restructure and broaden the focus of the investment research teams; (ii) bolstering the senior management team that oversees asset management; (iii) contractually agreeing to reduce the management fee on Fidelity U.S. Bond Index Fund; and (iv) expanding Class A and Class T load waiver categories to increase rollover retention opportunities and create consistent policies across the classes.
Annual Report
Board Approval of Investment Advisory Contracts and Management Fees - continued
Investment Performance. The Board considered whether the fund has operated within its investment objective, as well as its record of compliance with its investment restrictions. It also reviewed the fund's absolute investment performance for each class, as well as the fund's relative investment performance for each class measured against a third-party-sponsored index that reflects the market sector in which the fund invests over multiple periods. The Board noted that FMR does not believe that a meaningful peer group exists against which to compare the fund's performance. The following charts considered by the Board show, over the one-, three-, and five-year periods ended December 31, 2008, as available, the cumulative total returns of Initial Class and Investor Class of the fund and the cumulative total returns of a third-party-sponsored index ("benchmark").
VIP Consumer Discretionary Portfolio
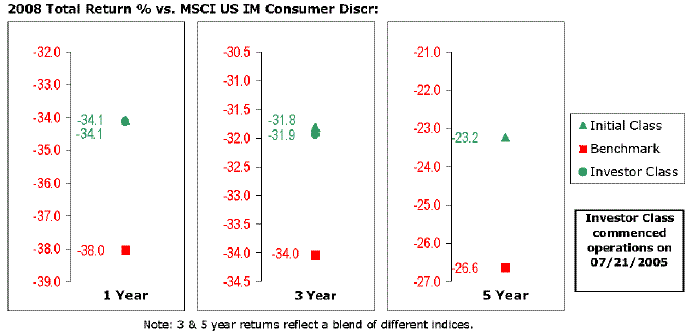
The Board stated that the investment performance of Initial Class of the fund compared favorably to its benchmark for all the periods shown. The Board considered that the variations in performance between the fund's classes reflect the variations in class expenses, which result in lower performance for the higher expense class.
The Board considered that FMR has taken steps to refocus and strengthen equity research, equity portfolio management, and compliance. The Board reviewed the year-to-date performance of Initial Class through May 31, 2009 and stated that it was lower than the fund's benchmark.
Based on its review, and giving particular weight to the nature and quality of the resources dedicated by the Investment Advisers to maintain and improve relative performance and factoring in the unprecedented market events in 2008, the Board concluded that the nature, extent, and quality of the services provided to the fund will benefit the fund's shareholders, particularly in light of the Board's view that the fund's shareholders benefit from investing in a fund that is part of a large family of funds offering a variety of investment disciplines and services.
Competitiveness of Management Fee and Total Fund Expenses. The Board considered the fund's management fee and total expenses compared to "mapped groups" of competitive funds and classes. Fidelity creates "mapped groups" by combining similar Lipper investment objective categories that have comparable management fee characteristics. Combining Lipper investment objective categories aids the Board's management fee and total expense comparisons by broadening the competitive group used for comparison and by reducing the number of universes to which various Fidelity funds are compared.
The Board considered two proprietary management fee comparisons for the 12-month periods shown in the chart below. The group of Lipper funds used by the Board for management fee comparisons is referred to below as the "Total Mapped Group." The Total Mapped Group comparison focuses on a fund's standing relative to the total universe of comparable funds available to investors, in terms of gross management fees before expense reimbursements or caps. "TMG %" represents the percentage of funds in the Total Mapped Group that had management fees that were lower than the fund's. For example, a TMG % of 4% means that 96% of the funds in the Total Mapped Group had higher management fees than the fund. The "Asset-Size Peer Group" (ASPG) comparison focuses on a fund's standing relative to non-Fidelity funds similar in size to the fund within the Total Mapped Group. The ASPG represents at least 15% of the funds in the Total Mapped Group with comparable asset size and management fee characteristics, subject to a minimum of 50 funds (or all funds in the Total Mapped Group if fewer than 50). Additional information, such as the ASPG quartile in which the fund's management fee ranked, is also included in the chart and considered by the Board.
Annual Report
VIP Consumer Discretionary Portfolio
The Board noted that the fund's management fee ranked below the median of its Total Mapped Group and below the median of its ASPG for 2008.
Based on its review, the Board concluded that the fund's management fee was fair and reasonable in light of the services that the fund receives and the other factors considered.
In its review of each class's total expenses, the Board considered the fund's management fee as well as other fund or class expenses, as applicable, such as transfer agent fees, pricing and bookkeeping fees, and custodial, legal, and audit fees. The Board also noted the effects of any waivers and reimbursements on fees and expenses. As part of its review, the Board also considered current and historical total expenses of each class of the fund compared to competitive fund median expenses. Each class of the fund is compared to those funds and classes in the Total Mapped Group (used by the Board for management fee comparisons) that have a similar sales load structure.
The Board noted that the total expenses of each class ranked below its competitive median for 2008.
In its review of total expenses, the Board also considered Fidelity fee structures and other information on clients that FMR and its affiliates service in other competitive markets, such as other mutual funds advised or subadvised by FMR or its affiliates, pension plan clients, and other institutional clients.
Based on its review, the Board concluded that the total expenses of each class of the fund were reasonable in light of the services that the fund and its shareholders receive and the other factors considered.
Costs of the Services and Profitability. The Board considered the revenues earned and the expenses incurred by Fidelity in conducting the business of developing, marketing, distributing, managing, administering and servicing the fund and its shareholders. The Board also considered the level of Fidelity's profits in respect of all the Fidelity funds.
On an annual basis, FMR presents to the Board Fidelity's profitability for the fund. Fidelity calculates the profitability for each fund, as well as aggregate profitability for groups of Fidelity funds and all Fidelity funds, using a series of detailed revenue and cost allocation methodologies which originate with the audited books and records of Fidelity. The Audit Committee of the Board reviews any significant changes from the prior year's methodologies.
PricewaterhouseCoopers LLP (PwC), independent registered public accounting firm and auditor to Fidelity and certain Fidelity funds, has been engaged annually by the Board as part of the Board's assessment of Fidelity's profitability analysis. PwC's engagement includes the review and assessment of Fidelity's methodologies used in determining the revenues and expenses attributable to Fidelity's mutual fund business, and completion of agreed-upon procedures surrounding the mathematical accuracy of fund profitability and its conformity to allocation methodologies. After considering PwC's reports issued under the engagement and information provided by Fidelity, the Board believes that while other allocation methods may also be reasonable, Fidelity's profitability methodologies are reasonable in all material respects.
The Board has also reviewed Fidelity's non-fund businesses and any fall-out benefits related to the mutual fund business as well as cases where Fidelity's affiliates may benefit from or be related to the fund's business.
The Board considered the costs of the services provided by and the profits realized by Fidelity in connection with the operation of the fund and determined that the amount of profit is a fair entrepreneurial profit for the management of the fund.
Annual Report
Board Approval of Investment Advisory Contracts and Management Fees - continued
Economies of Scale. The Board considered whether there have been economies of scale in respect of the management of the Fidelity funds, whether the Fidelity funds (including the fund) have appropriately benefited from any such economies of scale, and whether there is potential for realization of any further economies of scale. The Board considered the extent to which the fund will benefit from economies of scale through increased services to the fund, through waivers or reimbursements, or through fee or expense reductions.
In February 2009, the Board created an Ad Hoc Committee (the "Committee") to analyze economies of scale. The Committee was formed to consider whether FMR attains economies of scale in respect of the management and servicing of the Fidelity funds, whether the Fidelity funds have appropriately benefited from such economies of scale, and whether there is potential for realization of any further economies of scale.
The Board recognized that the fund's management contract incorporates a "group fee" structure, which provides for lower group fee rates as total fund assets under FMR's management increase, and for higher group fee rates as total fund assets under FMR's management decrease. FMR determines the group fee rates based on a tiered asset "breakpoint" schedule. The Board considered that the group fee is designed to deliver the benefits of economies of scale to fund shareholders when total fund assets increase, even if assets of any particular fund are unchanged or have declined, because some portion of Fidelity's costs are attributable to services provided to all Fidelity funds, and all funds benefit if those costs can be allocated among more assets. The Board concluded that, given the group fee structure, fund shareholders will achieve a certain level of economies of scale as assets under FMR's management increase at the fund complex level, regardless of whether Fidelity achieves any such economies of scale.
The Board concluded, considering the findings of the Committee, that any potential economies of scale are being shared between fund shareholders and Fidelity in an appropriate manner.
Additional Information Requested by the Board. In order to develop fully the factual basis for consideration of the Fidelity funds' Advisory Contracts, the Board requested and received additional information on certain topics, including (i) fund performance trends, actions to be taken by FMR to improve certain funds' overall performance and Fidelity's long-term strategies for certain funds; (ii) portfolio manager changes that have occurred during the past year; (iii) Fidelity's compensation structure for portfolio managers and key personnel, including performance benchmarks used by Fidelity in evaluating incentive compensation for portfolio managers and research analysts; (iv) the structure and process of equity research and actions taken by FMR to improve the quality of research; (v) the selection of and compensation paid by FMR to fund sub-advisers; (vi) Fidelity's fee structures and rationale for recommending different fees among categories of funds; (vii) the rationale for any differences between fund fee structures and fee structures in place for other Fidelity clients; (viii) Fidelity's rationale for recommending which funds should have a performance adjustment component as part of their management fees; and (ix) explanations for the relative total expenses borne by certain funds and classes, total expense competitive trends, and actions that might be taken by FMR to reduce total expenses for certain funds and classes.
Based on its evaluation of all of the conclusions noted above, and after considering all material factors, the Board ultimately concluded that the advisory fee structures are fair and reasonable, and that the fund's Advisory Contracts should be renewed.
Annual Report
Investment Adviser
Fidelity Management & Research Company
Boston, MA
Investment Sub-Advisers
FMR Co., Inc.
Fidelity Management & Research (U.K.) Inc.
Fidelity Research & Analysis Company
FIL Investments (Japan) Limited
FIL Investment Advisors
FIL Investment Advisors (U.K.) Ltd.
Fidelity Management & Research (Hong Kong) Limited
Fidelity Management & Research (Japan) Inc.
General Distributor
Fidelity Distributors Corporation
Boston, MA
Transfer and Service Agents
Fidelity Investments Institutional Operations Company, Inc.
Boston, MA
Fidelity Service Company, Inc.
Boston, MA
Custodian
JPMorgan Chase Bank
New York, NY
VCONIC-ANN-0210
1.817355.104
Fidelity® Variable Insurance Products:
Consumer Staples Portfolio
Annual Report
December 31, 2009
(2_fidelity_logos) (Registered_Trademark)
Contents
Performance | <Click Here> | How the fund has done over time. |
Management's Discussion | <Click Here> | The manager's review of fund performance, strategy and outlook. |
Shareholder Expense Example | <Click Here> | An example of shareholder expenses. |
Investment Changes | <Click Here> | A summary of major shifts in the fund's investments over the past six months. |
Investments | <Click Here> | A complete list of the fund's investments with their market values. |
Financial Statements | <Click Here> | Statements of assets and liabilities, operations, and changes in net assets, as well as financial highlights. |
Notes | <Click Here> | Notes to the financial statements. |
Report of Independent Registered Public Accounting Firm | <Click Here> | |
Trustees and Officers | <Click Here> | |
Distributions | <Click Here> | |
Board Approval of Investment Advisory Contracts and Management Fees | <Click Here> | |
To view a fund's proxy voting guidelines and proxy voting record for the 12-month period ended June 30, visit http://www.fidelity.com/proxyvotingresults or visit the Securities and Exchange Commission's (SEC) web site at http://www.sec.gov. You may also call 1-877-208-0098 to request a free copy of the proxy voting guidelines.
Fidelity Variable Insurance Products are separate account options which are purchased through a variable insurance contract.
Standard & Poor's, S&P and S&P 500 are registered service marks of The McGraw-Hill Companies, Inc. and have been licensed for use by Fidelity Distributors Corporation.
Other third party marks appearing herein are the property of their respective owners.
All other marks appearing herein are registered or unregistered trademarks or service marks of FMR LLC or an affiliated company.
This report and the financial statements contained herein are submitted for the general information of the shareholders of the fund. This report is not authorized for distribution to prospective investors in the fund unless preceded or accompanied by an effective prospectus.
A fund files its complete schedule of portfolio holdings with the SEC for the first and third quarters of each fiscal year on Form N-Q. Forms N-Q are available on the SEC's web site at http://www.sec.gov. A fund's Forms N-Q may be reviewed and copied at the SEC's Public Reference Room in Washington, DC. Information regarding the operation of the SEC's Public Reference Room may be obtained by calling 1-800-SEC-0330. For a complete list of a fund's portfolio holdings, view the most recent holdings listing, semiannual report, or annual report on Fidelity's web site at http://www.fidelity.com or http://www.advisor.fidelity.com, as applicable.
NOT FDIC INSURED · MAY LOSE VALUE · NO BANK GUARANTEE
Neither the fund nor Fidelity Distributors Corporation is a bank.
Annual Report
Average annual total return reflects the change in the value of an investment, assuming reinvestment of the class' dividend income and capital gains (the profits earned upon the sale of securities that have grown in value, if any) and assuming a constant rate of performance each year. During periods of reimbursement by Fidelity, a fund's total return will be greater than it would be had the reimbursement not occurred. Performance numbers are net of all underlying fund operating expenses, but do not include any insurance charges imposed by your insurance company's separate account. If performance information included the effect of these additional charges, the total returns would have been lower. How a fund did yesterday is no guarantee of how it will do tomorrow.
Average Annual Total Returns
Periods ended December 31, 2009 | Past 1
year | Life of
fundA |
VIP Consumer Staples - Initial Class | 20.73% | 2.29% |
VIP Consumer Staples - Investor Class | 20.68% | 2.21% |
A From April 24, 2007.
$10,000 Over Life of Fund
Let's say hypothetically that $10,000 was invested in VIP Consumer Staples Portfolio - Initial Class on April 24, 2007, when the fund started. The chart shows how the value of your investment would have changed, and also shows how the Standard & Poor's 500SM Index (S&P 500®) performed over the same period.
Annual Report
Market Recap: In 2009, most global markets saw both crippling lows and considerable highs. After a dismal start, the economy began to show signs of improvement, suggesting that a recovery was on the horizon. Credit markets began to heal as fiscal and monetary stimulus efforts around the world started to take effect, and corporate earnings staged an impressive rebound, fueled in large part by massive cost cutting. As a result, the flight to quality that marked most of 2008 and early 2009 shifted in March as investors flocked to riskier asset categories. The U.S. equity market, as measured by the bellwether Standard & Poor's 500SM Index and the blue-chip proxy Dow Jones Industrial AverageSM, reflected this changing environment, gaining 26.46% and 22.68%, respectively. Meanwhile, the technology-laden Nasdaq Composite® Index rose 45.32%. Foreign stocks also produced strong gains, as illustrated by the 31.93% jump of the MSCI® EAFE® Index (Europe, Australasia, Far East), a gauge of developed stock markets outside the U.S. and Canada. Emerging-markets stocks, which suffered their worst calendar-year performance ever in 2008, posted record returns this past year, with the MSCI Emerging Markets Index soaring 79.02%. A depreciating U.S. dollar helped bolster returns for U.S. investors in foreign equities.
Comments from Robert Lee, Portfolio Manager of VIP Consumer Staples Portfolio: During the past year, the fund solidly outperformed the MSCI U.S. Investable Market Consumer Staples Index, which returned 15.56%. (For specific portfolio results, please refer to the performance section of this report.) Leading the way was strong stock picking within brewers, including an out-of-index stake in Belgian brewer Anheuser-Busch InBev, which posted solid gains in response to a successful merger between two major brewers. Security selection in the soft drinks area also helped, such as stakes in bottlers Coca-Cola Enterprises and Turkey's Coca-Cola Icecek AS, as well as Canada's private-label manufacturer Cott. Stock picks within packaged food and meats were significant contributors, including an out-of-index holding in Anglo-Dutch Unilever and Switzerland's Nestle. Underweighting the hypermarket and super center space - most notably major index component Wal-Mart Stores - was a positive as well. On the negative side, an overweighting and weak stock selection within food retailing detracted, including stakes in grocery chains Safeway and Kroger. Underweighting the strong-performing tobacco group - including index components Altria Group and Lorillard - hurt as well. Lorillard was sold prior to period end. Lastly, overweighting the distillers and vintners industry detracted, including a position in Constellation Brands.
Note to shareholders: In January 2010, Fidelity adopted capped benchmarks for most of its sector and industry funds, including the VIP sector portfolios. The capped benchmarks, which limit the weightings of individual issuers, better represent the investment opportunities available to the funds and will provide shareholders with more-meaningful performance comparisons. These changes do not affect the investment policies of any of the funds, and the primary benchmark for all of the funds remains the Standard & Poor's 500 Index.
The views expressed above reflect those of the portfolio manager(s) only through the end of the period as stated on the cover of this report and do not necessarily represent the views of Fidelity or any other person in the Fidelity organization. Any such views are subject to change at any time based upon market or other conditions and Fidelity disclaims any responsibility to update such views. These views may not be relied on as investment advice and, because investment decisions for a Fidelity fund are based on numerous factors, may not be relied on as an indication of trading intent on behalf of any Fidelity fund.
Annual Report
Shareholder Expense Example
As a shareholder of the Fund, you incur two types of costs: (1) transaction costs, including redemption fees, and (2) ongoing costs, including management fees and other Fund expenses. This Example is intended to help you understand your ongoing costs (in dollars) of investing in the Fund and to compare these costs with the ongoing costs of investing in other mutual funds.
The Example is based on an investment of $1,000 invested at the beginning of the period and held for the entire period (July 1, 2009 to December 31, 2009).
Actual Expenses
The first line of the accompanying table for each class of the Fund provides information about actual account values and actual expenses. You may use the information in this line, together with the amount you invested, to estimate the expenses that you paid over the period. Simply divide your account value by $1,000.00 (for example, an $8,600 account value divided by $1,000.00 = 8.6), then multiply the result by the number in the first line for a class of the Fund under the heading entitled "Expenses Paid During Period" to estimate the expenses you paid on your account during this period. The estimate of expenses does not include any fees or other expenses of any variable annuity or variable life insurance product. If they were, the estimate of expenses you paid during the period would be higher, and your ending account value would be lower. In addition, the Fund, as a shareholder in the underlying Fidelity Central Funds, will indirectly bear its pro-rata share of the fees and expenses incurred by the underlying Fidelity Central Funds. These fees and expenses are not included in the Fund's annualized expense ratio used to calculate the expense estimate in the table below.
Hypothetical Example for Comparison Purposes
The second line of the accompanying table for each class of the Fund provides information about hypothetical account values and hypothetical expenses based on a Class' actual expense ratio and an assumed rate of return of 5% per year before expenses, which is not the Class' actual return. The hypothetical account values and expenses may not be used to estimate the actual ending account balance or expenses you paid for the period. You may use this information to compare the ongoing costs of investing in the Fund and other funds. To do so, compare this 5% hypothetical example with the 5% hypothetical examples that appear in the shareholder reports of the other funds. The estimate of expenses does not include any fees or other expenses of any variable annuity or variable life insurance product. If they were, the estimate of expenses you paid during the period would be higher, and your ending account value would be lower. In addition, the Fund, as a shareholder in the underlying Fidelity Central Funds, will indirectly bear its pro-rata share of the fees and expenses incurred by the underlying Fidelity Central Funds. These fees and expenses are not included in the Fund's annualized expense ratio used to calculate the expense estimate in the table below.
Please note that the expenses shown in the table are meant to highlight your ongoing costs only and do not reflect any transaction costs. Therefore, the second line of the table is useful in comparing ongoing costs only, and will not help you determine the relative total costs of owning different funds. In addition, if these transactional costs were included, your costs would have been higher.
| Annualized Expense Ratio | Beginning
Account Value
July 1, 2009 | Ending
Account Value
December 31, 2009 | Expenses Paid
During Period*
July 1, 2009 to December 31, 2009 |
Initial Class | 1.00% | | | |
Actual | | $ 1,000.00 | $ 1,177.20 | $ 5.49 |
Hypothetical A | | $ 1,000.00 | $ 1,020.16 | $ 5.09 |
Investor Class | 1.08% | | | |
Actual | | $ 1,000.00 | $ 1,176.60 | $ 5.93 |
Hypothetical A | | $ 1,000.00 | $ 1,019.76 | $ 5.50 |
A 5% return per year before expenses
* Expenses are equal to each Class' annualized expense ratio, multiplied by the average account value over the period, multiplied by 184/365 (to reflect the one-half year period).
Annual Report
Investment Changes (Unaudited)
Top Ten Stocks as of December 31, 2009 |
| % of fund's
net assets | % of fund's net assets
6 months ago |
Procter & Gamble Co. | 14.4 | 12.6 |
CVS Caremark Corp. | 6.8 | 8.0 |
The Coca-Cola Co. | 6.7 | 7.4 |
PepsiCo, Inc. | 6.0 | 6.2 |
Wal-Mart Stores, Inc. | 5.4 | 5.1 |
British American Tobacco PLC sponsored ADR | 5.1 | 4.8 |
Walgreen Co. | 3.9 | 1.0 |
Altria Group, Inc. | 3.6 | 2.2 |
Avon Products, Inc. | 3.4 | 3.0 |
Nestle SA (Reg.) | 3.1 | 4.1 |
| 58.4 | |
Top Industries (% of fund's net assets) |
As of December 31, 2009 |
 | Beverages | 26.8% | |
 | Food & Staples Retailing | 22.2% | |
 | Household Products | 17.2% | |
 | Food Products | 12.3% | |
 | Tobacco | 12.0% | |
 | All Others* | 9.5% | |

|
As of June 30, 2009 |
| Beverages | 30.1% | |
| Food & Staples Retailing | 19.2% | |
| Household Products | 17.3% | |
| Food Products | 16.2% | |
| Tobacco | 9.6% | |
| All Others* | 7.6% | |

* Includes short-term investments and net other assets. |
Annual Report
Investments December 31, 2009
Showing Percentage of Net Assets
Common Stocks - 97.2% |
| Shares | | Value |
BEVERAGES - 26.8% |
Brewers - 6.0% |
Anadolu Efes Biracilik ve Malt Sanyii AS | 4,700 | | $ 52,774 |
Anheuser-Busch InBev SA NV | 7,768 | | 404,751 |
Companhia de Bebidas das Americas (AmBev) (PN) sponsored ADR | 930 | | 94,014 |
Molson Coors Brewing Co. Class B | 12,955 | | 585,048 |
| | 1,136,587 |
Distillers & Vintners - 4.0% |
Brown-Forman Corp. Class B (non-vtg.) | 900 | | 48,213 |
Constellation Brands, Inc. Class A
(sub. vtg.) (a) | 30,489 | | 485,690 |
Diageo PLC sponsored ADR | 3,215 | | 223,153 |
| | 757,056 |
Soft Drinks - 16.8% |
Coca-Cola Enterprises, Inc. | 12,388 | | 262,626 |
Coca-Cola FEMSA SAB de CV sponsored ADR | 1,420 | | 93,322 |
Coca-Cola Icecek AS | 5,450 | | 54,638 |
Cott Corp. (a) | 100 | | 824 |
Dr Pepper Snapple Group, Inc. | 8,003 | | 226,485 |
Embotelladora Andina SA sponsored ADR | 4,500 | | 91,800 |
Fomento Economico Mexicano SAB de CV sponsored ADR | 985 | | 47,162 |
Pepsi Bottling Group, Inc. | 150 | | 5,625 |
PepsiCo, Inc. | 18,863 | | 1,146,870 |
The Coca-Cola Co. | 22,150 | | 1,262,550 |
| | 3,191,902 |
TOTAL BEVERAGES | | 5,085,545 |
FOOD & STAPLES RETAILING - 22.2% |
Drug Retail - 10.7% |
CVS Caremark Corp. | 40,012 | | 1,288,787 |
Walgreen Co. | 19,850 | | 728,892 |
| | 2,017,679 |
Food Retail - 4.9% |
Kroger Co. | 20,364 | | 418,073 |
Safeway, Inc. | 22,240 | | 473,490 |
Susser Holdings Corp. (a) | 1,100 | | 9,449 |
The Pantry, Inc. (a) | 2,291 | | 31,135 |
| | 932,147 |
Hypermarkets & Super Centers - 6.6% |
BJ's Wholesale Club, Inc. (a) | 7,130 | | 233,222 |
Wal-Mart Stores, Inc. | 19,100 | | 1,020,895 |
| | 1,254,117 |
TOTAL FOOD & STAPLES RETAILING | | 4,203,943 |
|
| Shares | | Value |
FOOD PRODUCTS - 12.3% |
Agricultural Products - 3.3% |
Archer Daniels Midland Co. | 9,010 | | $ 282,103 |
Bunge Ltd. | 2,805 | | 179,043 |
Corn Products International, Inc. | 2,748 | | 80,324 |
SLC Agricola SA | 5,100 | | 47,694 |
Viterra, Inc. (a) | 4,900 | | 46,032 |
| | 635,196 |
Packaged Foods & Meats - 9.0% |
Ausnutria Dairy Hunan Co. Ltd. Class H | 58,000 | | 47,569 |
Brasil Foods SA | 100 | | 2,579 |
Cadbury PLC sponsored ADR | 59 | | 3,032 |
Cermaq ASA (a) | 4,600 | | 44,445 |
Cosan Ltd. Class A (a) | 1,300 | | 11,310 |
Danone | 1,254 | | 76,892 |
Dean Foods Co. (a) | 12,000 | | 216,480 |
General Mills, Inc. | 2,141 | | 151,604 |
Lindt & Spruengli AG | 2 | | 49,070 |
Nestle SA (Reg.) | 12,210 | | 591,957 |
Tyson Foods, Inc. Class A | 6,686 | | 82,037 |
Unilever NV (NY Shares) | 13,125 | | 424,331 |
| | 1,701,306 |
TOTAL FOOD PRODUCTS | | 2,336,502 |
HOUSEHOLD PRODUCTS - 17.2% |
Household Products - 17.2% |
Colgate-Palmolive Co. | 2,692 | | 221,148 |
Energizer Holdings, Inc. (a) | 4,795 | | 293,838 |
Procter & Gamble Co. | 45,217 | | 2,741,507 |
| | 3,256,493 |
PERSONAL PRODUCTS - 3.7% |
Personal Products - 3.7% |
Avon Products, Inc. | 20,192 | | 636,048 |
Mead Johnson Nutrition Co. Class A | 600 | | 26,220 |
Natura Cosmeticos SA | 2,200 | | 46,512 |
| | 708,780 |
PHARMACEUTICALS - 3.0% |
Pharmaceuticals - 3.0% |
Johnson & Johnson | 8,838 | | 569,256 |
Perrigo Co. | 53 | | 2,112 |
| | 571,368 |
TOBACCO - 12.0% |
Tobacco - 12.0% |
Altria Group, Inc. | 35,180 | | 690,583 |
British American Tobacco PLC sponsored ADR | 14,820 | | 958,261 |
KT&G Corp. | 756 | | 41,752 |
Common Stocks - continued |
| Shares | | Value |
TOBACCO - CONTINUED |
Tobacco - continued |
Philip Morris International, Inc. | 11,370 | | $ 547,920 |
Souza Cruz Industria Comerico | 1,400 | | 47,068 |
| | 2,285,584 |
TOTAL COMMON STOCKS (Cost $18,795,947) | 18,448,215 |
Money Market Funds - 3.6% |
| | | |
Fidelity Cash Central Fund, 0.16% (b)
(Cost $681,800) | 681,800 | | 681,800 |
TOTAL INVESTMENT PORTFOLIO - 100.8% (Cost $19,477,747) | | 19,130,015 |
NET OTHER ASSETS - (0.8)% | | (152,428) |
NET ASSETS - 100% | $ 18,977,587 |
Legend |
(a) Non-income producing |
(b) Affiliated fund that is available only to investment companies and other accounts managed by Fidelity Investments. The rate quoted is the annualized seven-day yield of the fund at period end. A complete unaudited listing of the fund's holdings as of its most recent quarter end is available upon request. |
Affiliated Central Funds |
Information regarding fiscal year to date income earned by the Fund from investments in Fidelity Central Funds is as follows: |
Fund | Income earned |
Fidelity Cash Central Fund | $ 1,353 |
Total | $ 1,353 |
Other Information |
The following is a summary of the inputs used, as of December 31, 2009, involving the Fund's assets and liabilities carried at value. The inputs or methodology used for valuing securities may not be an indication of the risk associated with investing in those securities. For more information on valuation inputs, and their aggregation into the levels used in the table below, please refer to the Security Valuation section in the accompanying Notes to Financial Statements. |
Valuation Inputs at Reporting Date: |
Description | Total | Level 1 | Level 2 | Level 3 |
Investments in Securities: | | | | |
Common Stocks | $ 18,448,215 | $ 18,400,646 | $ 47,569 | $ - |
Money Market Funds | 681,800 | 681,800 | - | - |
Total Investments in Securities: | $ 19,130,015 | $ 19,082,446 | $ 47,569 | $ - |
Distribution of investments by country of issue, as a percentage of total net assets, is as follows: (Unaudited) |
United States of America | 80.7% |
United Kingdom | 6.3% |
Switzerland | 3.4% |
Netherlands | 2.2% |
Belgium | 2.1% |
Brazil | 1.2% |
Bermuda | 1.0% |
Others (individually less than 1%) | 3.1% |
| 100.0% |
Income Tax Information |
At December 31, 2009, the Fund had a capital loss carryforward of approximately $1,107,172, of which $176,480 and $930,692 will expire on December 31, 2016 and 2017, respectively. |
See accompanying notes which are an integral part of the financial statements.
Annual Report
Financial Statements
Statement of Assets and Liabilities
| December 31, 2009 |
| | |
Assets | | |
Investment in securities, at value - See accompanying schedule: Unaffiliated issuers (cost $18,795,947) | $ 18,448,215 | |
Fidelity Central Funds (cost $681,800) | 681,800 | |
Total Investments (cost $19,477,747) | | $ 19,130,015 |
Receivable for investments sold | | 21,330 |
Dividends receivable | | 44,774 |
Distributions receivable from Fidelity Central Funds | | 144 |
Prepaid expenses | | 76 |
Receivable from investment adviser for expense reductions | | 2,434 |
Other receivables | | 37 |
Total assets | | 19,198,810 |
| | |
Liabilities | | |
Payable for investments purchased | $ 125,161 | |
Payable for fund shares redeemed | 46,651 | |
Accrued management fee | 8,635 | |
Other affiliated payables | 2,326 | |
Other payables and accrued expenses | 38,450 | |
Total liabilities | | 221,223 |
| | |
Net Assets | | $ 18,977,587 |
Net Assets consist of: | | |
Paid in capital | | $ 20,623,704 |
Accumulated undistributed net realized gain (loss) on investments and foreign currency transactions | | (1,298,359) |
Net unrealized appreciation (depreciation) on investments and assets and liabilities in foreign currencies | | (347,758) |
Net Assets | | $ 18,977,587 |
Statement of Assets and Liabilities - continued
| December 31, 2009 |
| |
Initial Class:
Net Asset Value, offering price and redemption price per share ($8,531,508 ÷ 834,514 shares) | | $ 10.22 |
| | |
Investor Class:
Net Asset Value, offering price and redemption price per share ($10,446,079 ÷ 1,023,049 shares) | | $ 10.21 |
See accompanying notes which are an integral part of the financial statements.
Annual Report
Statement of Operations
| Year ended December 31, 2009 |
| | |
Investment Income | | |
Dividends | | $ 465,955 |
Interest | | 7 |
Income from Fidelity Central Funds | | 1,353 |
Total income | | 467,315 |
| | |
Expenses | | |
Management fee | $ 98,588 | |
Transfer agent fees | 30,080 | |
Accounting fees and expenses | 6,817 | |
Custodian fees and expenses | 35,465 | |
Independent trustees' compensation | 128 | |
Audit | 32,265 | |
Legal | 322 | |
Miscellaneous | 1,494 | |
Total expenses before reductions | 205,159 | |
Expense reductions | (22,823) | 182,336 |
Net investment income (loss) | | 284,979 |
Realized and Unrealized Gain (Loss) Net realized gain (loss) on: | | |
Investment securities: | | |
Unaffiliated issuers | (814,723) | |
Foreign currency transactions | (1,041) | |
Total net realized gain (loss) | | (815,764) |
Change in net unrealized appreciation (depreciation) on: Investment securities | 3,023,140 | |
Assets and liabilities in foreign currencies | 473 | |
Total change in net unrealized appreciation (depreciation) | | 3,023,613 |
Net gain (loss) | | 2,207,849 |
Net increase (decrease) in net assets resulting from operations | | $ 2,492,828 |
Statement of Changes in Net Assets
| Year ended
December 31, 2009 | Year ended
December 31, 2008 |
Increase (Decrease) in Net Assets | | |
Operations | | |
Net investment income (loss) | $ 284,979 | $ 278,021 |
Net realized gain (loss) | (815,764) | (472,434) |
Change in net unrealized appreciation (depreciation) | 3,023,613 | (4,299,638) |
Net increase (decrease) in net assets resulting from operations | 2,492,828 | (4,494,051) |
Distributions to shareholders from net investment income | (282,510) | (286,028) |
Share transactions - net increase (decrease) | (6,462,234) | 12,995,494 |
Redemption fees | 5,770 | 25,741 |
Total increase (decrease) in net assets | (4,246,146) | 8,241,156 |
| | |
Net Assets | | |
Beginning of period | 23,223,733 | 14,982,577 |
End of period (including undistributed net investment income of $0 and distributions in excess of net investment income of $5,678, respectively) | $ 18,977,587 | $ 23,223,733 |
See accompanying notes which are an integral part of the financial statements.
Annual Report
Financial Highlights - Initial Class
Years ended December 31, | 2009 | 2008 | 2007 H |
Selected Per-Share Data | | | |
Net asset value, beginning of period | $ 8.60 | $ 11.08 | $ 10.00 |
Income from Investment Operations | | | |
Net investment income (loss) E | .15 | .15 | .08 |
Net realized and unrealized gain (loss) | 1.63 | (2.53) | 1.11 |
Total from investment operations | 1.78 | (2.38) | 1.19 |
Distributions from net investment income | (.16) | (.11) | (.04) |
Distributions from net realized gain | - | - | (.07) |
Total distributions | (.16) | (.11) | (.11) |
Redemption fees added to paid in capital E | - J | .01 | - J |
Net asset value, end of period | $ 10.22 | $ 8.60 | $ 11.08 |
Total Return B,C,D | 20.73% | (21.35)% | 11.92% |
Ratios to Average Net Assets F,I | | | |
Expenses before reductions | 1.12% | 1.12% | 1.66% A |
Expenses net of fee waivers, if any | 1.00% | 1.00% | 1.00% A |
Expenses net of all reductions | 1.00% | 1.00% | 1.00% A |
Net investment income (loss) | 1.68% | 1.47% | 1.05% A |
Supplemental Data | | | |
Net assets, end of period (000 omitted) | $ 8,532 | $ 9,706 | $ 7,964 |
Portfolio turnover rate G | 71% | 91% | 35% A |
A Annualized B Total returns for periods of less than one year are not annualized. C Total returns do not reflect charges attributable to your insurance company's separate account. Inclusion of these charges would reduce the total returns shown. D Total returns would have been lower had certain expenses not been reduced during the periods shown. E Calculated based on average shares outstanding during the period. F Fees and expenses of the underlying Fidelity Central Funds are not included in the Fund's expense ratio. The Fund indirectly bears its proportionate share of the expenses of any underlying Fidelity Central Funds. G Amount does not include the portfolio activity of any underlying Fidelity Central Funds. H For the period April 24, 2007 (commencement of operations) to December 31, 2007. I Expense ratios reflect operating expenses of the class. Expenses before reductions do not reflect amounts reimbursed by the investment adviser or reductions from brokerage service arrangements or reductions from other expense offset arrangements and do not represent the amount paid by the class during periods when reimbursements or reductions occur. Expense ratios before reductions for start-up periods may not be representative of longer-term operating periods. Expenses net of fee waivers reflect expenses after reimbursement by the investment adviser but prior to reductions from brokerage service arrangements or other expense offset arrangements. Expenses net of all reductions represent the net expenses paid by the class. J Amount represents less than $.01 per share. |
Financial Highlights - Investor Class
Years ended December 31, | 2009 | 2008 | 2007 H |
Selected Per-Share Data | | | |
Net asset value, beginning of period | $ 8.59 | $ 11.07 | $ 10.00 |
Income from Investment Operations | | | |
Net investment income (loss) E | .14 | .14 | .07 |
Net realized and unrealized gain (loss) | 1.63 | (2.52) | 1.11 |
Total from investment operations | 1.77 | (2.38) | 1.18 |
Distributions from net investment income | (.15) | (.11) | (.04) |
Distributions from net realized gain | - | - | (.07) |
Total distributions | (.15) | (.11) | (.11) |
Redemption fees added to paid in capital E | - J | .01 | - J |
Net asset value, end of period | $ 10.21 | $ 8.59 | $ 11.07 |
Total Return B,C,D | 20.68% | (21.41)% | 11.82% |
Ratios to Average Net Assets F,I | | | |
Expenses before reductions | 1.22% | 1.22% | 1.79% A |
Expenses net of fee waivers, if any | 1.08% | 1.08% | 1.15% A |
Expenses net of all reductions | 1.08% | 1.08% | 1.15% A |
Net investment income (loss) | 1.60% | 1.39% | .90% A |
Supplemental Data | | | |
Net assets, end of period (000 omitted) | $ 10,446 | $ 13,518 | $ 7,018 |
Portfolio turnover rate G | 71% | 91% | 35% A |
A Annualized B Total returns for periods of less than one year are not annualized. C Total returns do not reflect charges attributable to your insurance company's separate account. Inclusion of these charges would reduce the total returns shown. D Total returns would have been lower had certain expenses not been reduced during the periods shown. E Calculated based on average shares outstanding during the period. F Fees and expenses of the underlying Fidelity Central Funds are not included in the Fund's expense ratio. The Fund indirectly bears its proportionate share of the expenses of any underlying Fidelity Central Funds. G Amount does not include the portfolio activity of any underlying Fidelity Central Funds. H For the period April 24, 2007 (commencement of operations) to December 31, 2007. I Expense ratios reflect operating expenses of the class. Expenses before reductions do not reflect amounts reimbursed by the investment adviser or reductions from brokerage service arrangements or reductions from other expense offset arrangements and do not represent the amount paid by the class during periods when reimbursements or reductions occur. Expense ratios before reductions for start-up periods may not be representative of longer-term operating periods. Expenses net of fee waivers reflect expenses after reimbursement by the investment adviser but prior to reductions from brokerage service arrangements or other expense offset arrangements. Expenses net of all reductions represent the net expenses paid by the class. J Amount represents less than $.01 per share. |
See accompanying notes which are an integral part of the financial statements.
Annual Report
Notes to Financial Statements
For the period ended December 31, 2009
1. Organization.
VIP Consumer Staples Portfolio (the Fund) is a non-diversified fund of Variable Insurance Products Fund IV (the trust) and is authorized to issue an unlimited number of shares. The trust is registered under the Investment Company Act of 1940, as amended (the 1940 Act), as an open-end management investment company organized as a Massachusetts business trust. Shares of the Fund may only be purchased by insurance companies for the purpose of funding variable annuity or variable life insurance contracts. The Fund offers the following classes of shares: Initial Class shares and Investor Class shares. All classes have equal rights and voting privileges, except for matters affecting a single class. Investment income, realized and unrealized capital gains and losses, the common expenses of the Fund, and certain fund-level expense reductions, if any, are allocated on a pro-rata basis to each class based on the relative net assets of each class to the total net assets of the Fund. Each class differs with respect to transfer agent fees incurred. Certain expense reductions also differ by class.
2. Investments in Fidelity Central Funds.
The Fund may invest in Fidelity Central Funds, which are open-end investment companies available only to other investment companies and accounts managed by Fidelity Management & Research Company (FMR) and its affiliates. The Fund's Schedule of Investments lists each of the Fidelity Central Funds held as of period end, if any, as an investment of the Fund, but does not include the underlying holdings of each Fidelity Central Fund. As an Investing Fund, the Fund indirectly bears its proportionate share of the expenses of the underlying Fidelity Central Funds.
The Money Market Central Funds seek preservation of capital and current income and are managed by Fidelity Investments Money Management, Inc. (FIMM), an affiliate of FMR.
A complete unaudited list of holdings for each Fidelity Central Fund is available upon request or at the Securities and Exchange Commission (the SEC) web site at www.sec.gov. In addition, the financial statements of the Fidelity Central Funds, which are not covered by the Fund's Report of Independent Registered Public Accounting Firm, are available on the SEC web site or upon request.
3. Significant Accounting Policies.
The financial statements have been prepared in conformity with accounting principles generally accepted in the United States of America, which require management to make certain estimates and assumptions at the date of the financial statements. Actual results could differ from those estimates. Events or transactions occurring after period end through the date that the financial statements were issued, February 12, 2010, have been evaluated in the preparation of the financial statements. The following summarizes the significant accounting policies of the Fund:
Security Valuation. Investments are valued as of 4:00 p.m. Eastern time on the last calendar day of the period. The Fund uses independent pricing services approved by the Board of Trustees to value its investments. When current market prices or quotations are not readily available or reliable, valuations may be determined in good faith in accordance with procedures adopted by the Board of Trustees. Factors used in determining value may include significant market or security specific events. The frequency with which these procedures are used cannot be predicted and may be utilized to a significant extent. The value used for net asset value (NAV) calculation under these procedures may differ from published prices for the same securities.
The Fund categorizes the inputs to valuation techniques used to value its investments into a disclosure hierarchy consisting of three levels as shown below.
Level 1 - quoted prices in active markets for identical investments
Level 2 - other significant observable inputs (including quoted prices for similar investments, interest rates, prepayment speeds, etc.)
Level 3 - unobservable inputs (including the fund's own assumptions based on the best information available)
Changes in valuation techniques may result in transfers in or out of an assigned level within the disclosure hierarchy. The aggregate value of investments by input level, as of December 31, 2009 is included at the end of the Fund's Schedule of Investments. Valuation techniques used to value the Fund's investments by major category are as follows.
Equity securities, including restricted securities, for which market quotations are readily available, are valued at the last reported sale price or official closing price as reported by an independent pricing service on the primary market or exchange on which they are traded and are categorized as level 1 in the hierarchy. In the event there were no sales during the day or closing prices are not available, securities are valued at the last quoted bid price or may be valued using the last available price and categorized as Level 2 in the hierarchy. For foreign equity securities, when significant market or security events arise, comparisons to the valuation of American Depository Receipts (ADRs), futures contracts, exchange-traded funds (ETFs) and certain indexes as well as quoted prices for similar securities are used and are categorized as Level 2 in the hierarchy in these circumstances. For restricted securities and private placements where observable inputs are limited, assumptions about market activity and risk are used and are categorized as level 3 in the hierarchy.
Annual Report
3. Significant Accounting Policies - continued
Security Valuation - continued
Investments in open-end mutual funds, including the Fidelity Money Market Central Funds, are valued at their closing net asset value each business day and are categorized as Level 1 in the hierarchy. Short-term securities with remaining maturities of sixty days or less for which quotations are not readily available are valued at amortized cost, which approximates value and are categorized as level 2 in the hierarchy.
Foreign Currency. The Fund uses foreign currency contracts to facilitate transactions in foreign-denominated securities. Losses from these transactions may arise from changes in the value of the foreign currency or if the counterparties do not perform under the contracts' terms.
Foreign-denominated assets, including investment securities, and liabilities are translated into U.S. dollars at the exchange rate at period end. Purchases and sales of investment securities, income and dividends received and expenses denominated in foreign currencies are translated into U.S. dollars at the exchange rate in effect on the transaction date.
The effects of exchange rate fluctuations on investments are included with the net realized and unrealized gain (loss) on investment securities. Other foreign currency transactions resulting in realized and unrealized gain (loss) are disclosed separately.
Investment Transactions and Income. For financial reporting purposes, the Fund's investment holdings and NAV include trades executed through the end of the last business day of the period. The NAV per share for processing shareholder transactions is calculated as of the close of business of the New York Stock Exchange (NYSE), normally 4:00 p.m. Eastern time and includes trades executed through the end of the prior business day. Gains and losses on securities sold are determined on the basis of identified cost. Dividend income is recorded on the ex-dividend date, except for certain dividends from foreign securities where the ex-dividend date may have passed, which are recorded as soon as the Fund is informed of the ex-dividend date. Non-cash dividends included in dividend income, if any, are recorded at the fair market value of the securities received. Interest income and distributions from the Fidelity Central Funds are accrued as earned. Interest income includes coupon interest and amortization of premium and accretion of discount on debt securities. Investment income is recorded net of foreign taxes withheld where recovery of such taxes is uncertain.
Expenses. Most expenses of the trust can be directly attributed to a fund. Expenses which cannot be directly attributed are apportioned among each Fund in the trust. Expense estimates are accrued in the period to which they relate and adjustments are made when actual amounts are known.
Income Tax Information and Distributions to Shareholders. Each year, the Fund intends to qualify as a regulated investment company by distributing substantially all of its taxable income and realized gains under Subchapter M of the Internal Revenue Code and filing its U.S. federal tax return. As a result, no provision for income taxes is required. As of December 31, 2009, the Fund did not have any unrecognized tax benefits in the accompanying financial statements. A Fund's federal tax return is subject to examination by the Internal Revenue Service (IRS) for a period of three years. Foreign taxes are provided for based on the Fund's understanding of the tax rules and rates that exist in the foreign markets in which it invests.
Distributions are recorded on the ex-dividend date. Income dividends and capital gain distributions are declared separately for each class. Income and capital gain distributions are determined in accordance with income tax regulations, which may differ from generally accepted accounting principles.
Capital accounts within the financial statements are adjusted for permanent book-tax differences. These adjustments have no impact on net assets or the results of operations. Temporary book-tax differences will reverse in a subsequent period.
Book-tax differences are primarily due to foreign currency transactions, capital loss carryforwards and losses deferred due to wash sales and excise tax regulations.
The federal tax cost of investment securities and unrealized appreciation (depreciation) as of period end were as follows:
Gross unrealized appreciation | $ 1,108,916 |
Gross unrealized depreciation | (1,647,835) |
Net unrealized appreciation (depreciation) | $ (538,919) |
| |
Tax Cost | $ 19,668,934 |
The tax-based components of distributable earnings as of period end were as follows:
Capital loss carryforward | $ (1,107,172) |
Net unrealized appreciation (depreciation) | $ (538,945) |
The tax character of distributions paid was as follows:
| December 31, 2009 | December 31, 2008 |
Ordinary Income | $ 282,510 | $ 286,028 |
Annual Report
Notes to Financial Statements - continued
3. Significant Accounting Policies - continued
Trading (Redemption) Fees. Shares held less than 60 days are subject to a redemption fee equal to 1% of the proceeds of the redeemed shares. All redemption fees, including any estimated redemption fees paid by FMR, are retained by the Fund and accounted for as an addition to paid in capital.
4. Purchases and Sales of Investments.
Purchases and sales of securities, other than short-term securities, aggregated $12,267,130 and $18,431,041, respectively.
5. Fees and Other Transactions with Affiliates.
Management Fee. FMR and its affiliates provide the Fund with investment management related services for which the Fund pays a monthly management fee. The management fee is the sum of an individual fund fee rate that is based on an annual rate of .30% of the Fund's average net assets and a group fee rate that averaged .26% during the period. The group fee rate is based upon the average net assets of all the mutual funds advised by FMR. The group fee rate decreases as assets under management increase and increases as assets under management decrease. For the period, the total annual management fee rate was .56% of the Fund's average net assets.
Transfer Agent Fees. Fidelity Investments Institutional Operations Company, Inc. (FIIOC), an affiliate of FMR, is the Fund's transfer, dividend disbursing, and shareholder servicing agent. FIIOC receives an asset-based fee with respect to each class. Each class (with the exception of Investor Class) pays a transfer agent fee, excluding out of pocket expenses, equal to an annual rate of .07% of average net assets. Investor Class pays a monthly asset-based transfer agent fee of .15% of average net assets. The total transfer agent fees paid by each class to FIIOC, including out of pocket expenses, were as follows:
Initial Class | $ 9,269 |
Investor Class | 20,811 |
| $ 30,080 |
Accounting Fees. Fidelity Service Company, Inc. (FSC), an affiliate of FMR, maintains the Fund's accounting records. The fee is based on the level of average net assets for the month.
Brokerage Commissions. The Fund placed a portion of its portfolio transactions with brokerage firms which are affiliates of the investment adviser. The commissions paid to these affiliated firms were $386 for the period.
6. Committed Line of Credit.
The Fund participates with other funds managed by FMR in a $3.5 billion credit facility (the "line of credit") to be utilized for temporary or emergency purposes to fund shareholder redemptions or for other short-term liquidity purposes. The Fund has agreed to pay commitment fees on its pro-rata portion of the line of credit, which amounted to $98 and is reflected in Miscellaneous Expense on the Statement of Operations. During the period, there were no borrowings on this line of credit.
7. Expense Reductions.
FMR voluntarily agreed to reimburse each class to the extent annual operating expenses exceeded certain levels of average net assets as noted in the table below. Some expenses, for example interest expense, including commitment fees, are excluded from this reimbursement.
The following classes were in reimbursement during the period:
| Expense
Limitations | Reimbursement
from adviser |
Initial Class | 1.00% | $ 8,921 |
Investor Class | 1.08% | 13,486 |
| | $ 22,407 |
Many of the brokers with whom FMR places trades on behalf of the Fund provided services to the Fund in addition to trade execution. These services included payments of certain expenses on behalf of the Fund totaling $416 for the period.
Annual Report
8. Distributions to Shareholders.
Distributions to shareholders of each class were as follows:
Years ended December 31, | 2009 | 2008 |
From net investment income | | |
Initial Class | $ 131,298 | $ 121,735 |
Investor Class | 151,212 | 164,293 |
Total | $ 282,510 | $ 286,028 |
9. Share Transactions.
Transactions for each class of shares were as follows:
| Shares | Dollars |
Years ended December 31, | 2009 | 2008 | 2009 | 2008 |
Initial Class | | | | |
Shares sold | 438,229 | 1,195,732 | $ 4,041,941 | $ 11,605,548 |
Reinvestment of distributions | 13,013 | 14,597 | 131,298 | 121,735 |
Shares redeemed | (745,202) | (800,693) | (6,159,466) | (7,779,005) |
Net increase (decrease) | (293,960) | 409,636 | $ (1,986,227) | $ 3,948,278 |
Investor Class | | | | |
Shares sold | 562,478 | 1,623,656 | $ 5,117,088 | $ 15,815,233 |
Reinvestment of distributions | 15,001 | 19,723 | 151,212 | 164,293 |
Shares redeemed | (1,127,994) | (703,808) | (9,744,307) | (6,932,310) |
Net increase (decrease) | (550,515) | 939,571 | $ (4,476,007) | $ 9,047,216 |
10. Other.
The Fund's organizational documents provide former and current trustees and officers with a limited indemnification against liabilities arising in connection with the performance of their duties to the Fund. In the normal course of business, the Fund may also enter into contracts that provide general indemnifications. The Fund's maximum exposure under these arrangements is unknown as this would be dependent on future claims that may be made against the Fund. The risk of material loss from such claims is considered remote.
At the end of the period, FMR or its affiliates were the owners of record of 100% of the total outstanding shares of the Fund.
Annual Report
Report of Independent Registered Public Accounting Firm
To the Trustees of Variable Insurance Products Fund IV and the Shareholders of VIP Consumer Staples Portfolio:
In our opinion, the accompanying statement of assets and liabilities, including the schedule of investments, and the related statements of operations and of changes in net assets and the financial highlights present fairly, in all material respects, the financial position of VIP Consumer Staples Portfolio (a fund of Variable Insurance Products Fund IV) at December 31, 2009, the results of its operations for the year then ended, the changes in its net assets for each of the periods indicated and the financial highlights for each of the periods indicated, in conformity with accounting principles generally accepted in the United States of America. These financial statements and financial highlights (hereafter referred to as "financial statements") are the responsibility of the VIP Consumer Staples Portfolio's management. Our responsibility is to express an opinion on these financial statements based on our audits. We conducted our audits of these financial statements in accordance with the standards of the Public Company Accounting Oversight Board (United States). Those standards require that we plan and perform the audit to obtain reasonable assurance about whether the financial statements are free of material misstatement. An audit includes examining, on a test basis, evidence supporting the amounts and disclosures in the financial statements, assessing the accounting principles used and significant estimates made by management, and evaluating the overall financial statement presentation. We believe that our audits, which included confirmation of securities at December 31, 2009 by correspondence with the custodian and brokers, provide a reasonable basis for our opinion.
/s/ PricewaterhouseCoopers LLP
PricewaterhouseCoopers LLP
Boston, Massachusetts
February 12, 2010
Annual Report
The Trustees, Member of the Advisory Board, and executive officers of the trust and fund, as applicable, are listed below. The Board of Trustees governs the fund and is responsible for protecting the interests of shareholders. The Trustees are experienced executives who meet periodically throughout the year to oversee the fund's activities, review contractual arrangements with companies that provide services to the fund, and review the fund's performance. Except for James C. Curvey, each of the Trustees oversees 222 funds advised by FMR or an affiliate. Mr. Curvey oversees 410 funds advised by FMR or an affiliate.
The Trustees hold office without limit in time except that (a) any Trustee may resign; (b) any Trustee may be removed by written instrument, signed by at least two-thirds of the number of Trustees prior to such removal; (c) any Trustee who requests to be retired or who has become incapacitated by illness or injury may be retired by written instrument signed by a majority of the other Trustees; and (d) any Trustee may be removed at any special meeting of shareholders by a two-thirds vote of the outstanding voting securities of the trust. Each Trustee who is not an interested person (as defined in the 1940 Act) (Independent Trustee), shall retire not later than the last day of the calendar year in which his or her 72nd birthday occurs. The Independent Trustees may waive this mandatory retirement age policy with respect to individual Trustees. The executive officers and Advisory Board Member hold office without limit in time, except that any officer and Advisory Board Member may resign or may be removed by a vote of a majority of the Trustees at any regular meeting or any special meeting of the Trustees. Except as indicated, each individual has held the office shown or other offices in the same company for the past five years.
The fund's Statement of Additional Information (SAI) includes more information about the Trustees. To request a free copy, call Fidelity at 1-877-208-0098.
Interested Trustees*:
Correspondence intended for each Trustee who is an interested person may be sent to Fidelity Investments, 82 Devonshire Street, Boston, Massachusetts 02109.
Name, Age; Principal Occupation |
Edward C. Johnson 3d (79) |
| Year of Election or Appointment: 1983 Mr. Johnson is Trustee and Chairman of the Board of Trustees of certain Trusts. Mr. Johnson serves as Chief Executive Officer, Chairman, and a Director of FMR LLC; Chairman and a Director of FMR; Chairman and a Director of Fidelity Research & Analysis Company (FRAC); Chairman and a Director of Fidelity Investments Money Management, Inc.; and Chairman and a Director of FMR Co., Inc. In addition, Mr. Johnson serves as Chairman and Director of FIL Limited. Previously, Mr. Johnson served as President of FMR LLC (2006-2007). |
James C. Curvey (74) |
| Year of Election or Appointment: 2007 Mr. Curvey also serves as Trustee (2007-present) of other investment companies advised by FMR. Mr. Curvey is a Director of FMR and FMR Co., Inc. (2007-present). Mr. Curvey is also Vice Chairman (2006-present) and Director of FMR LLC. In addition, Mr. Curvey serves as an Overseer for the Boston Symphony Orchestra and a member of the Trustees of Villanova University. |
* Trustees have been determined to be "Interested Trustees" by virtue of, among other things, their affiliation with the trust or various entities under common control with FMR.
Independent Trustees:
Correspondence intended for each Independent Trustee (that is, the Trustees other than the Interested Trustees) may be sent to Fidelity Investments, P.O. Box 55235, Boston, Massachusetts 02205-5235.
Name, Age; Principal Occupation |
Dennis J. Dirks (61) |
| Year of Election or Appointment: 2005 Prior to his retirement in May 2003, Mr. Dirks was Chief Operating Officer and a member of the Board of The Depository Trust & Clearing Corporation (DTCC). He also served as President, Chief Operating Officer, and Board member of The Depository Trust Company (DTC) and President and Board member of the National Securities Clearing Corporation (NSCC). In addition, Mr. Dirks served as Chief Executive Officer and Board member of the Government Securities Clearing Corporation, Chief Executive Officer and Board member of the Mortgage-Backed Securities Clearing Corporation, as a Trustee and a member of the Finance Committee of Manhattan College (2005-2008), and as a Trustee and a member of the Finance Committee of AHRC of Nassau County (2006-2008). Currently, Mr. Dirks serves as a member of the Board of Directors for The Brookville Center for Children's Services, Inc. (2009-present). |
Alan J. Lacy (56) |
| Year of Election or Appointment: 2008 Mr. Lacy serves as Senior Adviser (2007-present) of Oak Hill Capital Partners, L.P. (private equity). Mr. Lacy also served as Chief Executive Officer (2000-2005) and Vice Chairman (2005-2006) of Sears Holdings Corporation and Sears, Roebuck and Co. (retail). In addition, Mr. Lacy serves as a member of the Board of Directors of The Western Union Company (global money transfer, 2006-present) and Bristol-Myers Squibb Company (global pharmaceuticals, 2007-present). Mr. Lacy is Chairman (2008-present) and a member (2006-present) of the Board of Trustees of The National Parks Conservation Association. |
Ned C. Lautenbach (65) |
| Year of Election or Appointment: 2000 Mr. Lautenbach is Chairman of the Independent Trustees of the Equity and High Income Funds (2006-present). Mr. Lautenbach is an Advisory Partner of Clayton, Dubilier & Rice, Inc. (private equity investment). Previously, Mr. Lautenbach was with the International Business Machines Corporation (IBM) from 1968 until his retirement in 1998. Mr. Lautenbach serves as a Director of Eaton Corporation (diversified industrial) as well as the Philharmonic Center for the Arts in Naples, Florida. Mr. Lautenbach is also a member of the Board of Trustees of Fairfield University (2005-present), as well as a member of the Council on Foreign Relations. Previously, Mr. Lautenbach served as a Director of Sony Corporation (2006-2007). |
Joseph Mauriello (65) |
| Year of Election or Appointment: 2008 Prior to his retirement in January 2006, Mr. Mauriello served in numerous senior management positions including Deputy Chairman and Chief Operating Officer (2004-2005), and Vice Chairman of Financial Services (2002-2004) of KPMG LLP US (professional services, 1965-2005). Mr. Mauriello currently serves as a member of the Board of Directors of XL Capital Ltd. (global insurance and re-insurance, 2006-present) and of Arcadia Resources Inc. (health care services and products, 2007-present). Previously, Mr. Mauriello served as a Director of the Hamilton Funds of the Bank of New York (2006-2007). |
Cornelia M. Small (65) |
| Year of Election or Appointment: 2005 Ms. Small is a member of the Board of Directors of the Teagle Foundation (2009-present). Ms. Small is also a member of the Investment Committee, and Chair (2008-present) and a member of the Board of Trustees of Smith College. In addition, Ms. Small serves on the Investment Committee of the Berkshire Taconic Community Foundation (2008-present). Previously, Ms. Small served as Chairperson of the Investment Committee (2002-2008) of Smith College. In addition, Ms. Small served as Chief Investment Officer, Director of Global Equity Investments, and a member of the Board of Directors of Scudder, Stevens & Clark and Scudder Kemper Investments. |
William S. Stavropoulos (70) |
| Year of Election or Appointment: 2001 Mr. Stavropoulos serves as President and Founder of the Michigan Baseball Foundation, the Great Lakes Loons (2007-present). Mr. Stavropoulos is Chairman Emeritus of the Board of Directors of The Dow Chemical Company, where he previously served in numerous senior management positions, including President, CEO (1995-2000; 2002-2004), Chairman of the Executive Committee (2000-2006), and as a member of the Board of Directors (1990-2006). Currently, Mr. Stavropoulos is a Director of Teradata Corporation (data warehousing and technology solutions, 2008-present), Chemical Financial Corporation, Maersk Inc. (industrial conglomerate), Tyco International, Inc. (multinational manufacturing and services, 2007-present), and a member of the Advisory Board for Metalmark Capital (private equity investment, 2005-present). Mr. Stavropoulos is a special advisor to Clayton, Dubilier & Rice, Inc. (private equity investment). In addition, Mr. Stavropoulos is a member of the University of Notre Dame Advisory Council for the College of Science. |
David M. Thomas (60) |
| Year of Election or Appointment: 2008 Previously, Mr. Thomas served as Executive Chairman (2005-2006) and Chairman and Chief Executive Officer (2000-2005) of IMS Health, Inc. (pharmaceutical and healthcare information solutions). In addition, Mr. Thomas serves as a member of the Board of Directors of Fortune Brands, Inc. (consumer products), and Interpublic Group of Companies, Inc. (marketing communication, 2004-present). |
Michael E. Wiley (59) |
| Year of Election or Appointment: 2008 Mr. Wiley also serves as a Director of Asia Pacific Exploration Consolidated (international oil and gas exploration and production, 2008-present), and as a member of the Board of Trustees of the University of Tulsa (2000-2006; 2007-present). Mr. Wiley serves as a Director of Tesoro Corporation (independent oil refiner and marketer, 2005-present), and a Director of Bill Barrett Corporation (exploration and production, 2005-present). In addition, Mr. Wiley also serves as a Director of Post Oak Bank (privately-held bank, 2004-present). Previously, Mr. Wiley served as a Sr. Energy Advisor of Katzenbach Partners, LLC (consulting, 2006-2007), as an Advisory Director of Riverstone Holdings (private investment), Chairman, President, and CEO of Baker Hughes, Inc. (oilfield services, 2000-2004), and as Director of Spinnaker Exploration Company (exploration and production, 2001-2005). |
Annual Report
Trustees and Officers - continued
Advisory Board Member and Executive Officers:
Correspondence intended for each executive officer and Peter S. Lynch may be sent to Fidelity Investments, 82 Devonshire Street, Boston, Massachusetts 02109.
Name, Age; Principal Occupation |
Peter S. Lynch (65) |
| Year of Election or Appointment: 2003 Member of the Advisory Board of Fidelity's Equity and High Income Funds. Mr. Lynch is Vice Chairman and a Director of FMR and FMR Co., Inc. In addition, Mr. Lynch serves as a Trustee of Boston College and as the Chairman of the Inner-City Scholarship Fund. Previously, Mr. Lynch served on the Special Olympics International Board of Directors (1997-2006). |
Kenneth B. Robins (40) |
| Year of Election or Appointment: 2008 President and Treasurer of Fidelity's Equity and High Income Funds. Mr. Robins also serves as Assistant Treasurer of other Fidelity funds (2009-present) and is an employee of Fidelity Investments (2004-present). Before joining Fidelity Investments, Mr. Robins worked at KPMG LLP, where he was a partner in KPMG's department of professional practice (2002-2004). |
Brian B. Hogan (45) |
| Year of Election or Appointment: 2009 Vice President of certain Equity Funds and Vice President of Sector Funds. Mr. Hogan also serves as Senior Vice President, Equity Research of FMR (2006-present) and President of FMR's Equity Division (2009-present). Previously, Mr. Hogan served as a portfolio manager. |
Christopher S. Bartel (38) |
| Year of Election or Appointment: 2009 Vice President of Fidelity's Sector and Real Estate Equity Funds. Mr. Bartel also serves as Senior Vice President of Equity Research (2009-present). Previously, Mr. Bartel served as Managing Director of Research (2006-2009) and an analyst and portfolio manager (2000-2006). |
Scott C. Goebel (41) |
| Year of Election or Appointment: 2008 Secretary and Chief Legal Officer (CLO) of the Fidelity funds. Mr. Goebel also serves as General Counsel, Secretary, and Senior Vice President of FMR (2008-present) and FMR Co., Inc. (2008-present); Deputy General Counsel of FMR LLC; Chief Legal Officer of Fidelity Management & Research (Hong Kong) Limited (2008-present) and Assistant Secretary of Fidelity Management & Research (Japan) Inc. (2008-present), Fidelity Investments Money Management, Inc. (2008-present), Fidelity Management & Research (U.K.) Inc. (2008-present), and Fidelity Research and Analysis Company (2008-present). Previously, Mr. Goebel served as Assistant Secretary of the Funds (2007-2008) and as Vice President and Secretary of Fidelity Distributors Corporation (FDC) (2005-2007). |
William C. Coffey (40) |
| Year of Election or Appointment: 2009 Assistant Secretary of Fidelity's Equity and High Income Funds. Mr. Coffey also serves as Vice President and Associate General Counsel of FMR LLC (2005-present), and is an employee of Fidelity Investments. |
Holly C. Laurent (55) |
| Year of Election or Appointment: 2008 Anti-Money Laundering (AML) Officer of the Fidelity funds. Ms. Laurent is an employee of Fidelity Investments. Previously, Ms. Laurent was Senior Vice President and Head of Legal for Fidelity Business Services India Pvt. Ltd. (2006-2008), and Senior Vice President, Deputy General Counsel and Group Head for FMR LLC (2005-2006). |
Christine Reynolds (51) |
| Year of Election or Appointment: 2008 Chief Financial Officer of the Fidelity funds. Ms. Reynolds became President of Fidelity Pricing and Cash Management Services (FPCMS) in August 2008. Ms. Reynolds served as Chief Operating Officer of FPCMS (2007-2008). Previously, Ms. Reynolds served as President, Treasurer, and Anti-Money Laundering officer of the Fidelity funds (2004-2007). |
Kenneth A. Rathgeber (62) |
| Year of Election or Appointment: 2004 Chief Compliance Officer of Fidelity's Equity and High Income Funds. Mr. Rathgeber is Chief Compliance Officer of Fidelity Management & Research (Hong Kong) Limited (2008-present), Fidelity Management & Research (Japan) Inc. (2008-present), FMR (2005-present), FMR Co., Inc. (2005-present), Fidelity Management & Research (U.K.) Inc. (2005-present), Fidelity Research & Analysis Company (2005-present), Fidelity Investments Money Management, Inc. (2005-present), Pyramis Global Advisors, LLC (2005-present), and Strategic Advisers, Inc. (2005-present). |
Jeffrey S. Christian (48) |
| Year of Election or Appointment: 2009 Deputy Treasurer of the Fidelity funds. Mr. Christian is an employee of Fidelity Investments. Previously, Mr. Christian served as Chief Financial Officer (2008-2009) of certain Fidelity funds, Senior Vice President of Fidelity Pricing and Cash Management Services (FPCMS) (2004-2009), and as Vice President of Business Analysis (2003-2004). |
Bryan A. Mehrmann (48) |
| Year of Election or Appointment: 2005 Deputy Treasurer of the Fidelity funds. Mr. Mehrmann is an employee of Fidelity Investments. Previously, Mr. Mehrmann served as Vice President of Fidelity Investments Institutional Services Group (FIIS)/Fidelity Investments Institutional Operations Company, Inc. (FIIOC) Client Services (1998-2004). |
Adrien E. Deberghes (42) |
| Year of Election or Appointment: 2008 Deputy Treasurer of Fidelity's Equity and High Income Funds. Mr. Deberghes is an employee of Fidelity Investments (2008-present). Previously, Mr. Deberghes served as Senior Vice President of Mutual Fund Administration at State Street Corporation (2007-2008), Senior Director of Mutual Fund Administration at Investors Bank & Trust (2005-2007), and Director of Finance for Dunkin' Brands (2000-2005). |
John R. Hebble (51) |
| Year of Election or Appointment: 2009 Assistant Treasurer of Fidelity's Equity and High Income Funds. Mr. Hebble also serves as President and Treasurer of other Fidelity funds (2008-present) and is an employee of Fidelity Investments. |
Paul M. Murphy (62) |
| Year of Election or Appointment: 2007 Assistant Treasurer of the Fidelity funds. Mr. Murphy is an employee of Fidelity Investments. Previously, Mr. Murphy served as Chief Financial Officer of the Fidelity funds (2005-2006), Vice President and Associate General Counsel of FMR (2007), and Senior Vice President of Fidelity Pricing and Cash Management Services (FPCMS) (1994-2007). |
Gary W. Ryan (51) |
| Year of Election or Appointment: 2005 Assistant Treasurer of the Fidelity funds. Mr. Ryan is an employee of Fidelity Investments. Previously, Mr. Ryan served as Vice President of Fund Reporting in Fidelity Pricing and Cash Management Services (FPCMS) (1999-2005). |
Annual Report
Initial Class and Investor Class designate 100% of the dividends distributed in December 2009, during the fiscal year as qualifying for the dividends-received deduction for corporate shareholders.
The fund will notify shareholders in January 2010 of amounts for use in preparing 2009 income tax returns.
Annual Report
Board Approval of Investment Advisory Contracts and Management Fees
VIP Consumer Staples Portfolio
Each year, the Board of Trustees, including the Independent Trustees (together, the Board), votes on the renewal of the management contract and sub-advisory agreements (together, the Advisory Contracts) for the fund. The Board, assisted by the advice of fund counsel and Independent Trustees' counsel, requests and considers a broad range of information throughout the year.
The Board meets regularly and, acting directly and through its separate committees, requests and receives information concerning, and considers at each of its meetings factors that are relevant to, its annual consideration of the renewal of the fund's Advisory Contracts, including the services and support provided to the fund and its shareholders. The Board has established various standing committees, each composed of Independent Trustees with varying backgrounds, to which the Board has assigned specific subject matter responsibilities in order to enhance effective decision-making by the Board. Each committee has a written charter outlining the structure and purposes of the committee. The Board also meets as needed to consider matters specifically related to the Board's annual consideration of the renewal of Advisory Contracts.
At its July 2009 meeting, the Board of Trustees, including the Independent Trustees, unanimously determined to renew the fund's Advisory Contracts. In reaching its determination, the Board considered all factors it believed relevant, including (i) the nature, extent, and quality of the services to be provided to the fund and its shareholders (including the investment performance of the fund); (ii) the competitiveness of the fund's management fee and total expenses; (iii) the total costs of the services to be provided by and the profits to be realized by Fidelity from its relationship with the fund; (iv) the extent to which economies of scale would be realized as the fund grows; and (v) whether fee levels reflect these economies of scale, if any, for the benefit of fund shareholders.
In considering whether to renew the Advisory Contracts for the fund, the Board ultimately reached a determination, with the assistance of fund counsel and Independent Trustees' counsel and through the exercise of its business judgment, that the renewal of the Advisory Contracts and the compensation to be received by Fidelity under the management contract is consistent with Fidelity's fiduciary duty under applicable law. The Board's decision to renew the Advisory Contracts was not based on any single factor noted above, but rather was based on a comprehensive consideration of all the information provided to the Board at its meetings throughout the year. The Board, in reaching its determination to renew the Advisory Contracts, is aware that shareholders in the fund have a broad range of investment choices available to them, including a wide choice among mutual funds offered by competitors to Fidelity, and that the fund's shareholders, with the opportunity to review and weigh the disclosure provided by the fund in its prospectus and other public disclosures, have chosen to invest in this fund, managed by Fidelity.
Nature, Extent, and Quality of Services Provided. The Board considered staffing within the investment adviser, FMR, and the sub-advisers (together, the Investment Advisers), including the backgrounds of the fund's investment personnel and the fund's investment objective and discipline. The Independent Trustees also had discussions with senior management of Fidelity's investment operations and investment groups. The Board considered the structure of the portfolio manager compensation program and whether this structure provides appropriate incentives.
Resources Dedicated to Investment Management and Support Services. The Board reviewed the size, education, and experience of the Investment Advisers' investment staff, their use of technology, and the Investment Advisers' approach to recruiting, training, and retaining portfolio managers and other research, advisory, and management personnel. In response to last year's financial crisis, FMR took a number of actions intended to cut costs and improve efficiency without weakening the investment teams or resources. The Board noted that Fidelity's analysts have access to a variety of technological tools and market and securities data that enable them to perform both fundamental and quantitative analysis and to specialize in various disciplines. The Board considered Fidelity's extensive global research capabilities that enable the Investment Advisers to aggregate data from various sources in an effort to produce positive investment results. The Board also considered that Fidelity's portfolio managers and analysts have access to daily portfolio attribution that allows for monitoring of a fund's portfolio, as well as an electronic communication system that provides immediate real-time access to research concerning issuers and credit enhancers.
Shareholder and Administrative Services. The Board considered (i) the nature, extent, quality, and cost of advisory, administrative, distribution, and shareholder services performed by the Investment Advisers and their affiliates under the Advisory Contracts and under separate agreements covering transfer agency, pricing and bookkeeping, and securities lending services for the fund; (ii) the nature and extent of the Investment Advisers' supervision of third party service providers, principally custodians and subcustodians; and (iii) the resources devoted to, and the record of compliance with, the fund's compliance policies and procedures. The Board also reviewed the allocation of fund brokerage, including allocations to brokers affiliated with the Investment Advisers, the use of brokerage commissions to pay fund expenses, and the use of "soft" commission dollars to pay for research services.
The Board noted that the growth of fund assets across the complex allows Fidelity to reinvest in the development of services designed to enhance the value or convenience of the Fidelity funds as investment vehicles. These services include 24-hour access to account information and market information through phone representatives and over the Internet, and investor education materials and asset allocation tools.
Investment in a Large Fund Family. The Board considered the benefits to shareholders of investing in a Fidelity fund, including the benefits of investing in a fund that is part of a large family of funds offering a variety of investment disciplines and providing for a large variety of mutual fund investor services. The Board noted that Fidelity has taken a number of actions over the previous year that benefited particular funds, including (i) dedicating additional resources to investment research and to restructure and broaden the focus of the investment research teams; (ii) bolstering the senior management team that oversees asset management; (iii)��contractually agreeing to reduce the management fee on Fidelity U.S. Bond Index Fund; and (iv) expanding Class A and Class T load waiver categories to increase rollover retention opportunities and create consistent policies across the classes.
Annual Report
Board Approval of Investment Advisory Contracts and Management Fees - continued
Investment Performance. The Board considered whether the fund has operated within its investment objective, as well as its record of compliance with its investment restrictions. It also reviewed the fund's absolute investment performance for each class, as well as the fund's relative investment performance for each class measured against a third-party-sponsored index that reflects the market sector in which the fund invests. The Board noted that FMR does not believe that a meaningful peer group exists against which to compare the fund's performance. Because the fund had been in existence less than three calendar years, the following chart considered by the Board shows, for the one-year period ended December 31, 2008, the total returns of Initial Class and Investor Class of the fund and the total return of a third-party-sponsored index ("benchmark").
VIP Consumer Staples Portfolio
The Board stated that the investment performance of the fund was lower than its benchmark for the period shown. The Board considered that the variations in performance between the fund's classes reflect the variations in class expenses, which result in lower performance for the higher expense class. The Board stated that it is difficult to evaluate in any comprehensive fashion the performance of the fund, in light of its relatively recent commencement of operations.
The Board considered that FMR has taken steps to refocus and strengthen equity research, equity portfolio management, and compliance. The Board reviewed the year-to-date performance of Initial Class through May 31, 2009 and stated that it exceeded the fund's benchmark.
Based on its review, and giving particular weight to the nature and quality of the resources dedicated by the Investment Advisers to maintain and improve relative performance and factoring in the unprecedented market events in 2008, the Board concluded that the nature, extent, and quality of the services provided to the fund will benefit the fund's shareholders, particularly in light of the Board's view that the fund's shareholders benefit from investing in a fund that is part of a large family of funds offering a variety of investment disciplines and services.
Competitiveness of Management Fee and Total Fund Expenses. The Board considered the fund's management fee and total expenses compared to "mapped groups" of competitive funds and classes. Fidelity creates "mapped groups" by combining similar Lipper investment objective categories that have comparable management fee characteristics. Combining Lipper investment objective categories aids the Board's management fee and total expense comparisons by broadening the competitive group used for comparison and by reducing the number of universes to which various Fidelity funds are compared.
The Board considered two proprietary management fee comparisons for the 12-month (or shorter) periods shown in the chart below. The group of Lipper funds used by the Board for management fee comparisons is referred to below as the "Total Mapped Group." The Total Mapped Group comparison focuses on a fund's standing relative to the total universe of comparable funds available to investors, in terms of gross management fees before expense reimbursements or caps. "TMG %" represents the percentage of funds in the Total Mapped Group that had management fees that were lower than the fund's. For example, a TMG % of 4% means that 96% of the funds in the Total Mapped Group had higher management fees than the fund. The "Asset-Size Peer Group" (ASPG) comparison focuses on a fund's standing relative to non-Fidelity funds similar in size to the fund within the Total Mapped Group. The ASPG represents at least 15% of the funds in the Total Mapped Group with comparable asset size and management fee characteristics, subject to a minimum of 50 funds (or all funds in the Total Mapped Group if fewer than 50). Additional information, such as the ASPG quartile in which the fund's management fee ranked, is also included in the chart and considered by the Board.
Annual Report
VIP Consumer Staples Portfolio
The Board noted that the fund's management fee ranked below the median of its Total Mapped Group and below the median of its ASPG for 2008.
Based on its review, the Board concluded that the fund's management fee was fair and reasonable in light of the services that the fund receives and the other factors considered.
In its review of each class's total expenses, the Board considered the fund's management fee as well as other fund or class expenses, as applicable, such as transfer agent fees, pricing and bookkeeping fees, and custodial, legal, and audit fees. The Board also noted the effects of any waivers and reimbursements on fees and expenses. As part of its review, the Board also considered current and historical total expenses of each class of the fund compared to competitive fund median expenses. Each class of the fund is compared to those funds and classes in the Total Mapped Group (used by the Board for management fee comparisons) that have a similar sales load structure.
The Board noted that the total expenses of each class ranked below its competitive median for 2008.
In its review of total expenses, the Board also considered Fidelity fee structures and other information on clients that FMR and its affiliates service in other competitive markets, such as other mutual funds advised or subadvised by FMR or its affiliates, pension plan clients, and other institutional clients.
Based on its review, the Board concluded that the total expenses of each class of the fund were reasonable in light of the services that the fund and its shareholders receive and the other factors considered.
Costs of the Services and Profitability. The Board considered the revenues earned and the expenses incurred by Fidelity in conducting the business of developing, marketing, distributing, managing, administering and servicing the fund and its shareholders. The Board also considered the level of Fidelity's profits in respect of all the Fidelity funds.
On an annual basis, FMR presents to the Board Fidelity's profitability for the fund. Fidelity calculates the profitability for each fund, as well as aggregate profitability for groups of Fidelity funds and all Fidelity funds, using a series of detailed revenue and cost allocation methodologies which originate with the audited books and records of Fidelity. The Audit Committee of the Board reviews any significant changes from the prior year's methodologies.
PricewaterhouseCoopers LLP (PwC), independent registered public accounting firm and auditor to Fidelity and certain Fidelity funds, has been engaged annually by the Board as part of the Board's assessment of Fidelity's profitability analysis. PwC's engagement includes the review and assessment of Fidelity's methodologies used in determining the revenues and expenses attributable to Fidelity's mutual fund business, and completion of agreed-upon procedures surrounding the mathematical accuracy of fund profitability and its conformity to allocation methodologies. After considering PwC's reports issued under the engagement and information provided by Fidelity, the Board believes that while other allocation methods may also be reasonable, Fidelity's profitability methodologies are reasonable in all material respects.
The Board has also reviewed Fidelity's non-fund businesses and any fall-out benefits related to the mutual fund business as well as cases where Fidelity's affiliates may benefit from or be related to the fund's business.
Annual Report
Board Approval of Investment Advisory Contracts and Management Fees - continued
The Board considered the costs of the services provided by and the profits realized by Fidelity in connection with the operation of the fund and determined that the amount of profit is a fair entrepreneurial profit for the management of the fund.
Economies of Scale. The Board considered whether there have been economies of scale in respect of the management of the Fidelity funds, whether the Fidelity funds (including the fund) have appropriately benefited from any such economies of scale, and whether there is potential for realization of any further economies of scale. The Board considered the extent to which the fund will benefit from economies of scale through increased services to the fund, through waivers or reimbursements, or through fee or expense reductions.
In February 2009, the Board created an Ad Hoc Committee (the "Committee") to analyze economies of scale. The Committee was formed to consider whether FMR attains economies of scale in respect of the management and servicing of the Fidelity funds, whether the Fidelity funds have appropriately benefited from such economies of scale, and whether there is potential for realization of any further economies of scale.
The Board recognized that the fund's management contract incorporates a "group fee" structure, which provides for lower group fee rates as total fund assets under FMR's management increase, and for higher group fee rates as total fund assets under FMR's management decrease. FMR determines the group fee rates based on a tiered asset "breakpoint" schedule. The Board considered that the group fee is designed to deliver the benefits of economies of scale to fund shareholders when total fund assets increase, even if assets of any particular fund are unchanged or have declined, because some portion of Fidelity's costs are attributable to services provided to all Fidelity funds, and all funds benefit if those costs can be allocated among more assets. The Board concluded that, given the group fee structure, fund shareholders will achieve a certain level of economies of scale as assets under FMR's management increase at the fund complex level, regardless of whether Fidelity achieves any such economies of scale.
The Board concluded, considering the findings of the Committee, that any potential economies of scale are being shared between fund shareholders and Fidelity in an appropriate manner.
Additional Information Requested by the Board. In order to develop fully the factual basis for consideration of the Fidelity funds' Advisory Contracts, the Board requested and received additional information on certain topics, including (i) fund performance trends, actions to be taken by FMR to improve certain funds' overall performance and Fidelity's long-term strategies for certain funds; (ii) portfolio manager changes that have occurred during the past year; (iii) Fidelity's compensation structure for portfolio managers and key personnel, including performance benchmarks used by Fidelity in evaluating incentive compensation for portfolio managers and research analysts; (iv) the structure and process of equity research and actions taken by FMR to improve the quality of research; (v) the selection of and compensation paid by FMR to fund sub-advisers; (vi) Fidelity's fee structures and rationale for recommending different fees among categories of funds; (vii) the rationale for any differences between fund fee structures and fee structures in place for other Fidelity clients; (viii) Fidelity's rationale for recommending which funds should have a performance adjustment component as part of their management fees; and (ix) explanations for the relative total expenses borne by certain funds and classes, total expense competitive trends, and actions that might be taken by FMR to reduce total expenses for certain funds and classes.
Based on its evaluation of all of the conclusions noted above, and after considering all material factors, the Board ultimately concluded that the advisory fee structures are fair and reasonable, and that the fund's Advisory Contracts should be renewed.
Annual Report
Investment Adviser
Fidelity Management & Research Company
Boston, MA
Investment Sub-Advisers
FMR Co., Inc.
Fidelity Management & Research (U.K.) Inc.
Fidelity Research & Analysis Company
FIL Investments (Japan) Limited
FIL Investment Advisors
FIL Investment Advisors (U.K.) Ltd.
Fidelity Management & Research (Hong Kong) Limited
Fidelity Management & Research (Japan) Inc.
General Distributor
Fidelity Distributors Corporation
Boston, MA
Transfer and Service Agents
Fidelity Investments Institutional Operations Company, Inc.
Boston, MA
Fidelity Service Company, Inc.
Boston, MA
Custodian
State Street Bank and Trust Company
Quincy, MA
VCSP-ANN-0210
1.850994.102
Fidelity® Variable Insurance Products:
Emerging Markets Portfolio
Annual Report
December 31, 2009
(2_fidelity_logos) (Registered_Trademark)
Contents
Performance | <Click Here> | How the fund has done over time. |
Management's Discussion | <Click Here> | The manager's review of fund performance, strategy and outlook. |
Shareholder Expense Example | <Click Here> | An example of shareholder expenses. |
Investment Changes | <Click Here> | A summary of major shifts in the fund's investments over the past six months. |
Investments | <Click Here> | A complete list of the fund's investments with their market values. |
Financial Statements | <Click Here> | Statements of assets and liabilities, operations, and changes in net assets, as well as financial highlights. |
Notes | <Click Here> | Notes to the financial statements. |
Report of Independent Registered Public Accounting Firm | <Click Here> | |
Trustees and Officers | <Click Here> | |
Distributions | <Click Here> | |
Board Approval of Investment Advisory Contracts and Management Fees | <Click Here> | |
To view a fund's proxy voting guidelines and proxy voting record for the 12-month period ended June 30, visit http://www.fidelity.com/proxyvotingresults or visit the Securities and Exchange Commission's (SEC) web site at http://www.sec.gov. You may also call 1-877-208-0098 to request a free copy of the proxy voting guidelines.
Fidelity Variable Insurance Products are separate account options which are purchased through a variable insurance contract.
Standard & Poor's, S&P and S&P 500 are registered service marks of The McGraw-Hill Companies, Inc. and have been licensed for use by Fidelity Distributors Corporation.
Other third party marks appearing herein are the property of their respective owners.
All other marks appearing herein are registered or unregistered trademarks or service marks of FMR LLC or an affiliated company.
This report and the financial statements contained herein are submitted for the general information of the shareholders of the fund. This report is not authorized for distribution to prospective investors in the fund unless preceded or accompanied by an effective prospectus.
A fund files its complete schedule of portfolio holdings with the SEC for the first and third quarters of each fiscal year on Form N-Q. Forms N-Q are available on the SEC's web site at http://www.sec.gov. A fund's Forms N-Q may be reviewed and copied at the SEC's Public Reference Room in Washington, DC. Information regarding the operation of the SEC's Public Reference Room may be obtained by calling 1-800-SEC-0330. For a complete list of a fund's portfolio holdings, view the most recent holdings listing, semiannual report, or annual report on Fidelity's web site at http://www.fidelity.com or http://www.advisor.fidelity.com, as applicable.
NOT FDIC INSURED · MAY LOSE VALUE · NO BANK GUARANTEE
Neither the fund nor Fidelity Distributors Corporation is a bank.
Annual Report
Average annual total return reflects the change in the value of an investment, assuming reinvestment of the class' dividend income and capital gains (the profits earned upon the sale of securities that have grown in value, if any) and assuming a constant rate of performance each year. During periods of reimbursement by Fidelity, a fund's total return will be greater than it would be had the reimbursement not occurred. Performance numbers are net of all underlying fund operating expenses, but do not include any insurance charges imposed by your insurance company's separate account. If performance information included the effect of these additional charges, the total returns would have been lower. How a fund did yesterday is no guarantee of how it will do tomorrow.
Average Annual Total Returns
Periods ended December 31, 2009 | Past 1
year | Life of
fund A |
VIP Emerging Markets - Initial Class | 75.40% | -6.97% |
VIP Emerging Markets - Service Class B | 75.49% | -7.03% |
VIP Emerging Markets - Service Class 2 C | 75.41% | -7.17% |
A From January 23, 2008.
B Performance of Service Class shares reflects an asset-based service fee (12b-1 fee).
C Performance of Service Class 2 shares reflects an asset-based service fee (12b-1 fee).
$10,000 Over Life of Fund
Let's say hypothetically that $10,000 was invested in VIP Emerging Markets Portfolio - Initial Class on January 23, 2008, when the fund started. The chart shows how the value of your investment would have changed, and also shows how the MSCI® Emerging Markets Index performed over the same period.
Annual Report
Market Recap: In 2009, most global markets saw both crippling lows and considerable highs. After a dismal start, the economy began to show signs of improvement, suggesting that a recovery was on the horizon. Credit markets began to heal as fiscal and monetary stimulus efforts around the world started to take effect, and corporate earnings staged an impressive rebound, fueled in large part by massive cost cutting. As a result, the flight to quality that marked most of 2008 and early 2009 shifted in March as investors flocked to riskier asset categories. The U.S. equity market, as measured by the bellwether Standard & Poor's 500SM Index and the blue-chip proxy Dow Jones Industrial AverageSM, reflected this changing environment, gaining 26.46% and 22.68%, respectively. Meanwhile, the technology-laden Nasdaq Composite® Index rose 45.32%. Foreign stocks also produced strong gains, as illustrated by the 31.93% jump of the MSCI® EAFE® Index (Europe, Australasia, Far East), a gauge of developed stock markets outside the U.S. and Canada. Emerging-markets stocks, which suffered their worst calendar-year performance ever in 2008, posted record returns this past year, with the MSCI Emerging Markets Index soaring 79.02%. A depreciating U.S. dollar helped bolster returns for U.S. investors in foreign equities.
Comments from Robert von Rekowsky, Portfolio Manager of VIP Emerging Markets Portfolio: During the past year, the fund modestly lagged the MSCI Emerging Markets Index. (For specific portfolio results, please refer to the performance section of this report.) Versus that benchmark, the fund's gains were dampened by its cash position. Beyond that, unrewarding stock selection and an underweighting in information technology hurt, as did weak picks in financials, industrials and utilities. From a country standpoint, stock selection in South Korea, India and Taiwan worked against us. Mexican bank Grupo Financiero Banorte performed poorly early in the period and was the fund's largest relative detractor. A small out-of-index position in IT services provider Rolta India also detracted, and I sold the stock. Meanwhile, CEZ, an electric utility based in the Czech Republic, performed well but lagged the huge gain of the broader market. Modestly underweighting major index component Samsung Electronics worked against us, as the Korean electronics giant's stock price rallied in response to prospects for improving demand for cellular handsets and DRAM computer memory, among other products. In the case of China's Ping An Insurance, our position delivered solid results, but underweighting the stock early in the period hurt performance. Another detractor, Korean steel maker POSCO, was sold around the middle of the period, which, in retrospect, was too early. Positive sector influences included stock selection and an overweighting in consumer discretionary, as well as solid picks in telecommunication services and energy. Geographically, favorable stock picks and overweightings in Indonesia and Turkey were beneficial. CNPC is a Hong Kong-based crude oil and natural gas exploration/production company with properties in China, Kazakhstan and Thailand, among other locations. An attractive valuation to start the period and rising oil prices aided the stock. Also contributing were Astra International, a conglomerate that's a good proxy for the Indonesian economy, and two Turkish stocks: Turk Hava Yollari, also known as Turkish Airlines, and Turkiye Garanti Bankasi, a bank. Hungary's OTP Bank and China's Geely Automobile Holdings also added value.
The views expressed above reflect those of the portfolio manager(s) only through the end of the period as stated on the cover of this report and do not necessarily represent the views of Fidelity or any other person in the Fidelity organization. Any such views are subject to change at any time based upon market or other conditions and Fidelity disclaims any responsibility to update such views. These views may not be relied on as investment advice and, because investment decisions for a Fidelity fund are based on numerous factors, may not be relied on as an indication of trading intent on behalf of any Fidelity fund.
Annual Report
As a shareholder of the Fund, you incur two types of costs: (1) transaction costs, including redemption fees, and (2) ongoing costs, including management fees, distribution and/or service (12b-1) fees and other Fund expenses. This Example is intended to help you understand your ongoing costs (in dollars) of investing in the Fund and to compare these costs with the ongoing costs of investing in other mutual funds.
The Example is based on an investment of $1,000 invested at the beginning of the period and held for the entire period (July 1, 2009 to December 31, 2009).
Actual Expenses
The first line of the accompanying table for each class of the Fund provides information about actual account values and actual expenses. You may use the information in this line, together with the amount you invested, to estimate the expenses that you paid over the period. Simply divide your account value by $1,000.00 (for example, an $8,600 account value divided by $1,000.00 = 8.6), then multiply the result by the number in the first line for a class of the Fund under the heading entitled "Expenses Paid During Period" to estimate the expenses you paid on your account during this period. The estimate of expenses does not include any fees or other expenses of any variable annuity or variable life insurance product. If they were, the estimate of expenses you paid during the period would be higher, and your ending account value would be lower. In addition, the Fund, as a shareholder in the underlying Fidelity Central Funds, will indirectly bear its pro-rata share of the fees and expenses incurred by the underlying Fidelity Central Funds. These fees and expenses are not included in the Fund's annualized expense ratio used to calculate the expense estimate in the table below.
Hypothetical Example for Comparison Purposes
The second line of the accompanying table for each class of the Fund provides information about hypothetical account values and hypothetical expenses based on a Class' actual expense ratio and an assumed rate of return of 5% per year before expenses, which is not the Class' actual return. The hypothetical account values and expenses may not be used to estimate the actual ending account balance or expenses you paid for the period. You may use this information to compare the ongoing costs of investing in the Fund and other funds. To do so, compare this 5% hypothetical example with the 5% hypothetical examples that appear in the shareholder reports of the other funds. The estimate of expenses does not include any fees or other expenses of any variable annuity or variable life insurance product. If they were, the estimate of expenses you paid during the period would be higher, and your ending account value would be lower. In addition, the Fund, as a shareholder in the underlying Fidelity Central Funds, will indirectly bear its pro-rata share of the fees and expenses incurred by the underlying Fidelity Central Funds. These fees and expenses are not included in the Fund's annualized expense ratio used to calculate the expense estimate in the table below.
Please note that the expenses shown in the table are meant to highlight your ongoing costs only and do not reflect any transaction costs. Therefore, the second line of the table is useful in comparing ongoing costs only, and will not help you determine the relative total costs of owning different funds. In addition, if these transactional costs were included, your costs would have been higher.
|
Annualized
Expense Ratio
|
Beginning
Account Value
July 1, 2009
|
Ending
Account Value
December 31, 2009
| Expenses Paid
During Period*
July 1, 2009 to
December 31, 2009 |
Initial Class | 1.10% | | | |
Actual | | $ 1,000.00 | $ 1,329.10 | $ 6.46 |
Hypothetical A | | $ 1,000.00 | $ 1,019.66 | $ 5.60 |
Service Class | 1.20% | | | |
Actual | | $ 1,000.00 | $ 1,329.80 | $ 7.05 |
Hypothetical A | | $ 1,000.00 | $ 1,019.16 | $ 6.11 |
Service Class 2 | 1.35% | | | |
Actual | | $ 1,000.00 | $ 1,327.10 | $ 7.92 |
Hypothetical A | | $ 1,000.00 | $ 1,018.40 | $ 6.87 |
Initial Class R | 1.10% | | | |
Actual | | $ 1,000.00 | $ 1,329.10 | $ 6.46 |
Hypothetical A | | $ 1,000.00 | $ 1,019.66 | $ 5.60 |
Service Class 2R | 1.35% | | | |
Actual | | $ 1,000.00 | $ 1,327.10 | $ 7.92 |
Hypothetical A | | $ 1,000.00 | $ 1,018.40 | $ 6.87 |
Investor Class R | 1.18% | | | |
Actual | | $ 1,000.00 | $ 1,329.70 | $ 6.93 |
Hypothetical A | | $ 1,000.00 | $ 1,019.26 | $ 6.01 |
A 5% return per year before expenses
* Expenses are equal to each Class' annualized expense ratio, multiplied by the average account value over the period, multiplied by 184/365 (to reflect the one-half year period).
Annual Report
Investment Changes (Unaudited)
Geographic Diversification (% of fund's net assets) |
As of December 31, 2009 |
 | Brazil | 15.5% | |
 | Korea (South) | 10.0% | |
 | China | 9.3% | |
 | Russia | 9.2% | |
 | Taiwan | 7.9% | |
 | India | 7.2% | |
 | United States of America | 6.4% | |
 | South Africa | 5.3% | |
 | Hong Kong | 5.0% | |
 | Other | 24.2% | |

Percentages are adjusted for the effect of futures contracts, if applicable. |
As of June 30, 2009 |
| Brazil | 12.2% | |
| United States of America | 10.9% | |
| China | 9.9% | |
| Korea (South) | 8.8% | |
| India | 8.1% | |
| Russia | 7.3% | |
| Taiwan | 7.1% | |
| Hong Kong | 6.0% | |
| South Africa | 5.7% | |
| Other | 24.0% | |

Percentages are adjusted for the effect of futures contracts, if applicable. |
Asset Allocation |
| % of fund's
net assets | % of fund's net assets
6 months ago |
Stocks and Investment Companies | 94.4 | 91.9 |
Short-Term Investments and Net Other Assets | 5.6 | 8.1 |
Top Ten Stocks as of December 31, 2009 |
| % of fund's
net assets | % of fund's net assets
6 months ago |
Petroleo Brasileiro SA - Petrobras (PN) (Brazil, Oil, Gas & Consumable Fuels) | 3.8 | 3.3 |
Vale SA (PN-A) sponsored ADR (Brazil, Metals & Mining) | 3.2 | 2.1 |
Samsung Electronics Co. Ltd. (Korea (South), Semiconductors & Semiconductor Equipment) | 3.1 | 1.7 |
OAO Gazprom (Russia, Oil, Gas & Consumable Fuels) | 2.2 | 2.4 |
Itau Unibanco Banco Multiplo SA ADR (Brazil, Commercial Banks) | 2.1 | 0.0 |
America Movil SAB de CV Series L sponsored ADR (Mexico, Wireless Telecommunication Services) | 1.7 | 1.8 |
Hon Hai Precision Industry Co. Ltd. (Foxconn) (Taiwan, Electronic Equipment & Components) | 1.6 | 1.3 |
Industrial & Commercial Bank of China Ltd. (H Shares) (China, Commercial Banks) | 1.6 | 1.9 |
China Construction Bank Corp. (H Shares) (China, Commercial Banks) | 1.5 | 1.8 |
Reliance Industries Ltd. (India, Oil, Gas & Consumable Fuels) | 1.2 | 1.2 |
| 22.0 | |
Market Sectors as of December 31, 2009 |
| % of fund's
net assets | % of fund's net assets
6 months ago |
Financials | 24.1 | 23.0 |
Energy | 14.7 | 15.3 |
Materials | 14.2 | 12.5 |
Information Technology | 14.2 | 10.4 |
Telecommunication Services | 8.2 | 8.9 |
Consumer Discretionary | 7.3 | 7.7 |
Industrials | 3.8 | 5.7 |
Consumer Staples | 3.7 | 2.7 |
Utilities | 2.3 | 2.4 |
Health Care | 1.9 | 1.7 |
Annual Report
Investments December 31, 2009
Showing Percentage of Net Assets
Common Stocks - 94.4% |
| Shares | | Value |
Argentina - 0.2% |
Banco Macro SA sponsored ADR | 3,600 | | $ 107,136 |
BAILIWICK OF JERSEY - 0.4% |
Randgold Resources Ltd. sponsored ADR | 3,400 | | 269,008 |
Bermuda - 0.6% |
Aquarius Platinum Ltd.: | | | |
(Australia) (a) | 59,369 | | 391,962 |
(United Kingdom) (a) | 1,666 | | 10,959 |
TOTAL BERMUDA | | 402,921 |
Brazil - 15.5% |
Anhanguera Educacional Participacoes SA unit (a) | 4,337 | | 60,837 |
Banco Bradesco SA (PN) sponsored ADR | 9,900 | | 216,513 |
BM&F BOVESPA SA | 42,400 | | 299,938 |
Centrais Eletricas Brasileiras SA (Electrobras): | | | |
(PN-B) sponsored ADR | 13,300 | | 248,710 |
sponsored ADR | 6,400 | | 134,976 |
Companhia Energetica de Minas Gerais (CEMIG) (PN) sponsored ADR (non-vtg.) | 75 | | 1,355 |
Companhia Siderurgica Nacional SA (CSN) sponsored ADR | 18,000 | | 574,740 |
Fibria Celulose SA sponsored ADR (a) | 12,513 | | 285,797 |
Gerdau SA sponsored ADR | 33,900 | | 577,317 |
Itau Unibanco Banco Multiplo SA ADR | 65,170 | | 1,488,483 |
Localiza Rent A Car SA | 7,500 | | 82,186 |
Net Servicos de Comunicacao SA sponsored ADR | 25,400 | | 343,662 |
OGX Petroleo e Gas Participacoes SA | 40,000 | | 388,985 |
PDG Realty S.A. Empreendimentos e Participacoes | 26,500 | | 263,936 |
Petroleo Brasileiro SA - Petrobras: | | | |
(PN) (non-vtg.) | 46,100 | | 966,434 |
(PN) sponsored ADR (non-vtg.) | 42,000 | | 1,780,380 |
sponsored ADR | 7,500 | | 357,600 |
Tele Norte Leste Participacoes SA sponsored ADR (non-vtg.) | 20,500 | | 439,110 |
Vale SA (PN-A) sponsored ADR | 92,179 | | 2,287,883 |
Vivo Participacoes SA sponsored ADR | 12,300 | | 381,300 |
TOTAL BRAZIL | | 11,180,142 |
Canada - 1.1% |
Eldorado Gold Corp. (a) | 5,300 | | 75,264 |
Eldorado Gold Corp. unit (a) | 7,594 | | 106,208 |
First Quantum Minerals Ltd. | 3,900 | | 297,924 |
Niko Resources Ltd. | 700 | | 65,559 |
Sherritt International Corp. | 7,700 | | 48,150 |
Sino-Forest Corp. (a) | 7,200 | | 132,809 |
Uranium One, Inc. (a) | 18,100 | | 52,027 |
TOTAL CANADA | | 777,941 |
|
| Shares | | Value |
Cayman Islands - 1.8% |
BaWang International (Group) Holding Ltd. | 108,000 | | $ 74,784 |
China Shanshui Cement Group Ltd. | 108,000 | | 78,396 |
Daphne International Holdings Ltd. | 158,000 | | 126,882 |
Eurasia Drilling Co. Ltd. GDR (Reg. S) | 7,100 | | 120,700 |
Geely Automobile Holdings Ltd. | 695,000 | | 379,311 |
Hidili Industry International Development Ltd. (a) | 163,000 | | 202,777 |
Integra Group Holdings unit (a) | 31,600 | | 94,800 |
Mindray Medical International Ltd. sponsored ADR | 4,957 | | 168,141 |
PCD Stores Group Ltd. | 210,000 | | 80,626 |
TOTAL CAYMAN ISLANDS | | 1,326,417 |
China - 9.3% |
Baidu.com, Inc. sponsored ADR (a) | 600 | | 246,738 |
China Citic Bank Corp. Ltd. Class H | 182,000 | | 154,051 |
China Construction Bank Corp. (H Shares) | 1,286,000 | | 1,098,389 |
China Mengniu Dairy Co. Ltd. (a) | 83,000 | | 295,038 |
China Merchants Bank Co. Ltd. (H Shares) | 190,050 | | 494,472 |
China Shenhua Energy Co. Ltd. (H Shares) | 130,500 | | 633,463 |
China Yurun Food Group Ltd. | 77,000 | | 228,489 |
Golden Eagle Retail Group Ltd. (H Shares) | 139,000 | | 281,937 |
Industrial & Commercial Bank of China Ltd. (H Shares) | 1,364,000 | | 1,123,297 |
Maanshan Iron & Steel Co. Ltd. (H Shares) (a) | 122,000 | | 88,386 |
Minth Group Ltd. | 89,000 | | 130,645 |
PICC Property & Casualty Co. Ltd. (H Shares) (a) | 178,000 | | 159,276 |
Ping An Insurance (Group) Co. of China, Ltd. (H Shares) | 68,500 | | 595,596 |
Sina Corp. (a) | 1,600 | | 72,288 |
Tencent Holdings Ltd. | 35,800 | | 774,242 |
Yantai Changyu Pioneer Wine Co. (B Shares) | 11,400 | | 101,404 |
ZTE Corp. (H Shares) | 32,600 | | 200,423 |
TOTAL CHINA | | 6,678,134 |
Cyprus - 0.1% |
Bank of Cyprus Public Co. Ltd. | 10,000 | | 70,580 |
XXI Century Investments Public Ltd. (a) | 600 | | 145 |
TOTAL CYPRUS | | 70,725 |
Czech Republic - 1.1% |
Ceske Energeticke Zavody AS | 8,400 | | 393,750 |
Komercni Banka AS | 1,800 | | 383,691 |
TOTAL CZECH REPUBLIC | | 777,441 |
Common Stocks - continued |
| Shares | | Value |
Egypt - 0.4% |
Commercial International Bank Ltd. sponsored GDR | 30,149 | | $ 301,490 |
Hong Kong - 5.0% |
China Agri-Industries Holding Ltd. | 217,000 | | 283,501 |
China Mobile (Hong Kong) Ltd. | 86,000 | | 800,157 |
China Overseas Land & Investment Ltd. | 154,000 | | 322,662 |
CNOOC Ltd. | 514,000 | | 800,751 |
CNPC (Hong Kong) Ltd. | 330,000 | | 435,170 |
Hong Kong Exchange & Clearing Ltd. | 11,600 | | 206,384 |
Shanghai Industrial Holdings Ltd. | 73,000 | | 370,259 |
Sino-Ocean Land Holdings Ltd. | 275,500 | | 252,949 |
Texwinca Holdings Ltd. | 110,000 | | 102,235 |
TOTAL HONG KONG | | 3,574,068 |
Hungary - 0.6% |
OTP Bank Ltd. (a) | 15,500 | | 447,462 |
India - 7.2% |
Bank of Baroda | 11,392 | | 126,156 |
Bharat Heavy Electricals Ltd. | 7,742 | | 400,912 |
DLF Ltd. | 12,596 | | 98,032 |
Housing Development and Infrastructure Ltd. (a) | 18,016 | | 140,079 |
Housing Development Finance Corp. Ltd. | 10,070 | | 580,593 |
Indiabulls Real Estate Ltd. (a) | 21,565 | | 105,804 |
Infosys Technologies Ltd. sponsored ADR | 15,670 | | 866,081 |
Jain Irrigation Systems Ltd. | 6,816 | | 128,118 |
JSW Steel Ltd. | 17,657 | | 385,479 |
Mahindra & Mahindra Ltd. | 15,000 | | 349,337 |
Patni Computer Systems Ltd. sponsored ADR | 3,400 | | 69,530 |
Power Finance Corp. Ltd. | 2,989 | | 16,838 |
Reliance Industries Ltd. | 37,096 | | 871,688 |
Rural Electrification Corp. Ltd. (a) | 18,356 | | 96,032 |
Tata Consultancy Services Ltd. | 26,011 | | 420,486 |
Tata Power Co. Ltd. | 7,388 | | 219,913 |
Tata Steel Ltd. | 21,219 | | 282,417 |
Ultratech Cement Ltd. | 1,378 | | 27,144 |
TOTAL INDIA | | 5,184,639 |
Indonesia - 4.3% |
Delta Dunia Petroindo Tbk PT (a) | 670,500 | | 120,228 |
Gudang Garam PT Perusahaan | 53,000 | | 121,183 |
PT Astra International Tbk | 115,000 | | 423,396 |
PT Bank Mandiri Persero Tbk | 642,000 | | 320,149 |
PT Bank Rakyat Indonesia Tbk | 475,000 | | 385,545 |
PT Bumi Resources Tbk | 692,500 | | 178,177 |
PT Indocement Tunggal Prakarsa Tbk | 221,000 | | 321,242 |
PT Indofood Sukses Makmur Tbk | 725,500 | | 273,266 |
PT Perusahaan Gas Negara Tbk Series B | 977,300 | | 404,401 |
PT Telkomunikasi Indonesia Tbk Series B | 516,000 | | 517,370 |
TOTAL INDONESIA | | 3,064,957 |
|
| Shares | | Value |
Ireland - 0.1% |
Dragon Oil PLC (a) | 14,809 | | $ 92,982 |
Israel - 1.9% |
Check Point Software Technologies Ltd. (a) | 6,000 | | 203,280 |
Israel Chemicals Ltd. | 15,203 | | 200,435 |
Partner Communications Co. Ltd. ADR | 8,931 | | 181,746 |
Teva Pharmaceutical Industries Ltd. sponsored ADR | 14,500 | | 814,610 |
TOTAL ISRAEL | | 1,400,071 |
Kazakhstan - 0.7% |
JSC Halyk Bank of Kazakhstan unit (a) | 30,566 | | 290,377 |
KazMunaiGas Exploration & Production JSC (Reg. S) GDR | 8,000 | | 199,200 |
TOTAL KAZAKHSTAN | | 489,577 |
Korea (South) - 10.0% |
Hynix Semiconductor, Inc. (a) | 23,370 | | 463,963 |
Hyundai Engineering & Construction Co. Ltd. | 5,833 | | 354,660 |
Hyundai Industrial Development & Construction Co. | 8,600 | | 278,413 |
Hyundai Mobis | 3,340 | | 489,797 |
Hyundai Motor Co. | 7,153 | | 742,245 |
Industrial Bank of Korea (a) | 26,060 | | 312,879 |
KB Financial Group, Inc. (a) | 13,130 | | 672,222 |
Korea Exchange Bank | 33,200 | | 412,838 |
Korean Air Lines Co. Ltd. (a) | 2,120 | | 99,812 |
LG Innotek Co. Ltd. | 2,050 | | 174,221 |
Lumens Co. Ltd. (a) | 17,855 | | 136,737 |
Samsung Electronics Co. Ltd. | 3,287 | | 2,252,268 |
Samsung SDI Co. Ltd. | 1,692 | | 215,477 |
Shinhan Financial Group Co. Ltd. (a) | 16,850 | | 622,663 |
TOTAL KOREA (SOUTH) | | 7,228,195 |
Luxembourg - 1.1% |
ArcelorMittal SA (NY Shares) Class A | 6,400 | | 292,800 |
Evraz Group SA GDR | 13,184 | | 372,448 |
Ternium SA sponsored ADR (a) | 4,000 | | 141,680 |
TOTAL LUXEMBOURG | | 806,928 |
Mexico - 3.4% |
America Movil SAB de CV Series L sponsored ADR | 25,600 | | 1,202,688 |
Banco Compartamos SA de CV | 17,600 | | 90,897 |
Corporacion Geo SA de CV Series B (a) | 69,500 | | 184,678 |
Fomento Economico Mexicano SAB de CV sponsored ADR | 9,400 | | 450,072 |
Grupo Financiero Banorte SAB de CV Series O | 83,100 | | 303,996 |
Telmex Internacional SAB de CV Series L ADR | 13,800 | | 244,950 |
TOTAL MEXICO | | 2,477,281 |
Common Stocks - continued |
| Shares | | Value |
Nigeria - 0.1% |
Guaranty Trust Bank PLC GDR (Reg. S) | 14,400 | | $ 86,400 |
Norway - 0.1% |
Det Norske Oljeselskap ASA (DNO) (A Shares) (a) | 56,000 | | 48,986 |
Panama - 0.2% |
Copa Holdings SA Class A | 2,600 | | 141,622 |
Papua New Guinea - 0.1% |
Oil Search Ltd. | 9,716 | | 53,499 |
Peru - 0.4% |
Compania de Minas Buenaventura SA sponsored ADR | 9,590 | | 320,977 |
Philippines - 0.6% |
Megaworld Corp. | 3,210,000 | | 102,168 |
Philippine Long Distance Telephone Co. sponsored ADR | 5,400 | | 306,018 |
TOTAL PHILIPPINES | | 408,186 |
Poland - 1.0% |
Bank Polska Kasa Opieki SA (a) | 7,100 | | 400,331 |
Bank Zachodni WBK SA (a) | 5,014 | | 332,192 |
TOTAL POLAND | | 732,523 |
Russia - 9.2% |
Cherkizovo Group OJSC GDR (a) | 3,000 | | 31,500 |
Magnit OJSC GDR (Reg. S) | 19,200 | | 304,320 |
Mechel Steel Group OAO sponsored ADR | 12,900 | | 242,778 |
Novorossiysk Commercial Sea Port JSC (a) | 86,500 | | 14,273 |
Novorossiysk Commercial Sea Port JSC GDR (Reg. S) | 700 | | 8,057 |
OAO Gazprom | 8,900 | | 54,317 |
OAO Gazprom sponsored ADR | 60,442 | | 1,514,072 |
OAO NOVATEK GDR | 6,622 | | 437,052 |
OAO Tatneft sponsored ADR | 13,503 | | 393,477 |
OGK-2 JSC (a) | 423,500 | | 13,171 |
OGK-6 JSC (a) | 261,400 | | 6,666 |
OJSC MMC Norilsk Nickel sponsored ADR (a) | 41,744 | | 599,026 |
OJSC Oil Company Rosneft GDR (Reg. S) | 74,500 | | 640,700 |
Polymetal JSC GDR (Reg. S) (a) | 20,800 | | 190,736 |
RusHydro JSC sponsored ADR (a) | 49,344 | | 188,988 |
Sberbank (Savings Bank of the Russian Federation) | 232,600 | | 653,373 |
Sberbank (Savings Bank of the Russian Federation) GDR | 1,350 | | 378,815 |
Sistema JSFC sponsored GDR (a) | 14,675 | | 308,175 |
Vimpel Communications sponsored ADR | 24,000 | | 446,160 |
VTB Bank JSC unit | 37,700 | | 177,944 |
TOTAL RUSSIA | | 6,603,600 |
Singapore - 0.3% |
Straits Asia Resources Ltd. | 124,000 | | 230,332 |
|
| Shares | | Value |
South Africa - 5.3% |
African Bank Investments Ltd. | 71,500 | | $ 287,544 |
AngloGold Ashanti Ltd. | 6,000 | | 248,008 |
Aspen Pharmacare Holdings Ltd. (a) | 32,464 | | 322,449 |
Aveng Ltd. | 53,500 | | 288,077 |
Clicks Group Ltd. | 69,561 | | 255,808 |
Illovo Sugar Ltd. | 17,116 | | 73,707 |
Mr. Price Group Ltd. | 48,000 | | 226,721 |
MTN Group Ltd. | 46,008 | | 732,030 |
Mvelaphanda Resources Ltd. (a) | 39,874 | | 263,674 |
Raubex Group Ltd. | 47,496 | | 153,769 |
Shoprite Holdings Ltd. | 26,988 | | 237,538 |
Standard Bank Group Ltd. | 38,800 | | 534,089 |
Steinhoff International Holdings Ltd. | 76,422 | | 214,208 |
TOTAL SOUTH AFRICA | | 3,837,622 |
Taiwan - 7.9% |
Advanced Semiconductor Engineering, Inc. sponsored ADR | 40,200 | | 178,086 |
Asia Cement Corp. | 253,200 | | 273,858 |
AU Optronics Corp. sponsored ADR | 30,900 | | 370,491 |
Cathay Financial Holding Co. Ltd. (a) | 171,000 | | 319,122 |
Epistar Corp. | 27,000 | | 101,282 |
First Financial Holding Co. Ltd. | 564,657 | | 350,373 |
Formosa Epitaxy, Inc. | 114,000 | | 190,653 |
Fubon Financial Holding Co. Ltd. (a) | 265,000 | | 325,555 |
Hon Hai Precision Industry Co. Ltd. (Foxconn) | 239,232 | | 1,132,968 |
Macronix International Co. Ltd. | 400,506 | | 229,111 |
MediaTek, Inc. | 39,032 | | 680,833 |
Siliconware Precision Industries Co. Ltd. | 208,560 | | 282,622 |
Taiwan Mobile Co. Ltd. | 167,000 | | 325,752 |
Taiwan Semiconductor Manufacturing Co. Ltd. | 244,609 | | 493,194 |
Taiwan Semiconductor Manufacturing Co. Ltd. sponsored ADR | 36,064 | | 412,572 |
TOTAL TAIWAN | | 5,666,472 |
Thailand - 0.7% |
Advanced Info Service PCL (For. Reg.) | 65,000 | | 168,087 |
Siam Commercial Bank PCL (For. Reg.) | 125,200 | | 324,697 |
Total Access Communication PCL (For. Reg.) | 400 | | 428 |
TOTAL THAILAND | | 493,212 |
Turkey - 2.2% |
Hurriyet Gazetecilik ve Matbaacilik AS (a) | 85,656 | | 107,056 |
Koc Holding AS | 16,000 | | 47,266 |
Tofas Turk Otomobil Fabrikasi AS | 84,924 | | 267,906 |
Turk Hava Yollari AO | 89,000 | | 339,059 |
Turkiye Garanti Bankasi AS | 106,000 | | 449,873 |
Turkiye Is Bankasi AS Series C | 88,929 | | 374,450 |
TOTAL TURKEY | | 1,585,610 |
Common Stocks - continued |
| Shares | | Value |
United Kingdom - 0.7% |
Hikma Pharmaceuticals PLC | 10,646 | | $ 87,748 |
Tullow Oil PLC | 2,458 | | 51,841 |
Xstrata PLC (a) | 21,851 | | 395,875 |
TOTAL UNITED KINGDOM | | 535,464 |
United States of America - 0.8% |
Central European Distribution Corp. (a) | 7,300 | | 207,393 |
Freeport-McMoRan Copper & Gold, Inc. | 4,800 | | 385,392 |
TOTAL UNITED STATES OF AMERICA | | 592,785 |
TOTAL COMMON STOCKS (Cost $56,170,306) | 67,994,805 |
Money Market Funds - 5.7% |
| Shares | | Value |
Fidelity Cash Central Fund, 0.16% (b)
(Cost $4,086,573) | 4,086,573 | | $ 4,086,573 |
TOTAL INVESTMENT PORTFOLIO - 100.1% (Cost $60,256,879) | 72,081,378 |
NET OTHER ASSETS - (0.1)% | | (94,894) |
NET ASSETS - 100% | $ 71,986,484 |
Legend |
(a) Non-income producing |
(b) Affiliated fund that is available only to investment companies and other accounts managed by Fidelity Investments. The rate quoted is the annualized seven-day yield of the fund at period end. A complete unaudited listing of the fund's holdings as of its most recent quarter end is available upon request. |
Affiliated Central Funds |
Information regarding fiscal year to date income earned by the Fund from investments in Fidelity Central Funds is as follows: |
Fund | Income earned |
Fidelity Cash Central Fund | $ 6,019 |
Other Information |
The following is a summary of the inputs used, as of December 31, 2009, involving the Fund's assets and liabilities carried at value. The inputs or methodology used for valuing securities may not be an indication of the risk associated with investing in those securities. For more information on valuation inputs, and their aggregation into the levels used in the table below, please refer to the Security Valuation section in the accompanying Notes to Financial Statements. |
Valuation Inputs at Reporting Date: |
Description | Total | Level 1 | Level 2 | Level 3 |
Investments in Securities: | | | | |
Equities: | | | | |
Brazil | $ 11,180,142 | $ 11,180,142 | $ - | $ - |
Korea (South) | 7,228,195 | 6,605,532 | 622,663 | - |
China | 6,678,134 | 420,430 | 6,257,704 | - |
Russia | 6,603,600 | 6,603,600 | - | - |
Taiwan | 5,666,472 | 5,666,472 | - | - |
India | 5,184,639 | 5,184,639 | - | - |
South Africa | 3,837,622 | 3,837,622 | - | - |
Hong Kong | 3,574,068 | - | 3,574,068 | - |
Indonesia | 3,064,957 | 3,064,957 | - | - |
Other | 14,976,976 | 14,034,200 | 942,776 | - |
Money Market Funds | 4,086,573 | 4,086,573 | - | - |
Total Investments in Securities: | $ 72,081,378 | $ 60,684,167 | $ 11,397,211 | $ - |
Income Tax Information |
At December 31, 2009, the fund had a capital loss carryforward of approximately $4,615,107 of which $1,790,850 and $2,824,257 will expire on December 31, 2016 and 2017, respectively. |
See accompanying notes which are an integral part of the financial statements.
Annual Report
Statement of Assets and Liabilities
| December 31, 2009 |
| | |
Assets | | |
Investment in securities, at value - See accompanying schedule: Unaffiliated issuers (cost $56,170,306) | $ 67,994,805 | |
Fidelity Central Funds (cost $4,086,573) | 4,086,573 | |
Total Investments (cost $60,256,879) | | $ 72,081,378 |
Cash | | 14,570 |
Foreign currency held at value (cost $11,026) | | 11,024 |
Receivable for investments sold | | 153,440 |
Receivable for fund shares sold | | 141,014 |
Dividends receivable | | 57,976 |
Distributions receivable from Fidelity Central Funds | | 424 |
Prepaid expenses | | 188 |
Receivable from investment adviser for expense reductions | | 16,691 |
Other receivables | | 9,423 |
Total assets | | 72,486,128 |
| | |
Liabilities | | |
Payable for investments purchased | $ 268,099 | |
Accrued management fee | 45,808 | |
Distribution fees payable | 60 | |
Other affiliated payables | 9,289 | |
Other payables and accrued expenses | 176,388 | |
Total liabilities | | 499,644 |
| | |
Net Assets | | $ 71,986,484 |
Net Assets consist of: | | |
Paid in capital | | $ 65,695,206 |
Accumulated undistributed net realized gain (loss) on investments and foreign currency transactions | | (5,436,095) |
Net unrealized appreciation (depreciation) on investments and assets and liabilities in foreign currencies | | 11,727,373 |
Net Assets | | $ 71,986,484 |
Statement of Assets and Liabilities - continued
| December 31, 2009 |
| | |
Initial Class:
Net Asset Value, offering price and redemption price per share ($250,351 ÷ 29,409.4 shares) | | $ 8.51 |
| | |
Service Class:
Net Asset Value, offering price and redemption price per share ($117,551 ÷ 13,772.1 shares) | | $ 8.54 |
| | |
Service Class 2:
Net Asset Value, offering price and redemption price per share ($117,439 ÷ 13,727.5 shares) | | $ 8.56 |
| | |
Initial Class R:
Net Asset Value, offering price and redemption price per share ($31,314,149 ÷ 3,678,469.9 shares) | | $ 8.51 |
| | |
Service Class 2R:
Net Asset Value, offering price and redemption price per share ($117,439 ÷ 13,727.5 shares) | | $ 8.56 |
| | |
Investor Class R:
Net Asset Value, offering price and redemption price per share ($40,069,555 ÷ 4,714,242.0 shares) | | $ 8.50 |
See accompanying notes which are an integral part of the financial statements.
Annual Report
Financial Statements - continued
Statement of Operations
| Year ended December 31, 2009 |
| | |
Investment Income | | |
Dividends | | $ 552,011 |
Interest | | 9 |
Income from Fidelity Central Funds | | 6,019 |
| | 558,039 |
Less foreign taxes withheld | | (55,709) |
Total income | | 502,330 |
| | |
Expenses | | |
Management fee | $ 250,829 | |
Transfer agent fees | 41,743 | |
Distribution fees | 2,093 | |
Accounting fees and expenses | 16,032 | |
Custodian fees and expenses | 245,770 | |
Independent trustees' compensation | 163 | |
Audit | 93,877 | |
Legal | 110 | |
Miscellaneous | 1,753 | |
Total expenses before reductions | 652,370 | |
Expense reductions | (320,749) | 331,621 |
Net investment income (loss) | | 170,709 |
Realized and Unrealized Gain (Loss) Net realized gain (loss) on: | | |
Investment securities: | | |
Unaffiliated issuers | (1,720,774) | |
Foreign currency transactions | (55,463) | |
Total net realized gain (loss) | | (1,776,237) |
Change in net unrealized appreciation (depreciation) on: Investment securities (net of increase in deferred foreign taxes of $97,033) | 16,723,971 | |
Assets and liabilities in foreign currencies | (167) | |
Total change in net unrealized appreciation (depreciation) | | 16,723,804 |
Net gain (loss) | | 14,947,567 |
Net increase (decrease) in net assets resulting from operations | | $ 15,118,276 |
Statement of Changes in Net Assets
| Year ended
December 31,
2009 | For the period
January 23, 2008
(commencement of operations) to
December 31,
2008 |
Increase (Decrease) in Net Assets | | |
Operations | | |
Net investment income (loss) | $ 170,709 | $ 120,318 |
Net realized gain (loss) | (1,776,237) | (3,448,972) |
Change in net unrealized appreciation (depreciation) | 16,723,804 | (4,996,431) |
Net increase (decrease) in net assets resulting from operations | 15,118,276 | (8,325,085) |
Distributions to shareholders from net investment income | (171,137) | (118,460) |
Distributions to shareholders from net realized gain | (219,436) | - |
Total distributions | (390,573) | (118,460) |
Share transactions - net increase (decrease) | 48,999,079 | 16,664,085 |
Redemption fees | 22,594 | 16,568 |
Total increase (decrease) in net assets | 63,749,376 | 8,237,108 |
| | |
Net Assets | | |
Beginning of period | 8,237,108 | - |
End of period | $ 71,986,484 | $ 8,237,108 |
See accompanying notes which are an integral part of the financial statements.
Annual Report
Financial Highlights - Initial Class
Years ended December 31, | 2009 | 2008 H |
Selected Per-Share Data | | |
Net asset value, beginning of period | $ 4.88 | $ 10.00 |
Income from Investment Operations | | |
Net investment income (loss) E | .04 | .13 |
Net realized and unrealized gain (loss) | 3.64 | (5.19) |
Total from investment operations | 3.68 | (5.06) |
Distributions from net investment income | (.02) | (.08) |
Distributions from net realized gain | (.03) | - |
Total distributions | (.05) | (.08) |
Redemption fees added to paid in capital E | - J | .02 |
Net asset value, end of period | $ 8.51 | $ 4.88 |
Total Return B, C, D | 75.40% | (50.45)% |
Ratios to Average Net Assets F, I | | |
Expenses before reductions | 2.85% | 3.92% A |
Expenses net of fee waivers, if any | 1.10% | 1.10% A |
Expenses net of all reductions | 1.02% | 1.02% A |
Net investment income (loss) | .60% | 1.54% A |
Supplemental Data | | |
Net assets, end of period (000 omitted) | $ 250 | $ 516 |
Portfolio turnover rate G | 70% | 79% |
A Annualized
B Total returns for periods of less than one year are not annualized.
C Total returns do not reflect charges attributable to your insurance company's separate account. Inclusion of these charges would reduce the total returns shown.
D Total returns would have been lower had certain expenses not been reduced during the periods shown.
E Calculated based on average shares outstanding during the period.
F Fees and expenses of the underlying Fidelity Central Funds are not included in the Fund's expense ratio. The Fund indirectly bears its proportionate share of the expenses of any underlying Fidelity Central Funds.
G Amount does not include the portfolio activity of any underlying Fidelity Central Funds.
H For the period January 23, 2008 (commencement of operations) to December 31, 2008.
I Expense ratios reflect operating expenses of the class. Expenses before reductions do not reflect amounts reimbursed by the investment adviser or reductions from brokerage service arrangements or reductions from other expense offset arrangements and do not represent the amount paid by the class during periods when reimbursements or reductions occur. Expense ratios before reductions for start-up periods may not be representative of longer-term operating periods. Expenses net of fee waivers reflect expenses after reimbursement by the investment adviser but prior to reductions from brokerage service arrangements or other expense offset arrangements. Expenses net of all reductions represent the net expenses paid by the class.
J Amount represents less than $.01 per share.
Financial Highlights - Service Class
Years ended December 31, | 2009 | 2008 H |
Selected Per-Share Data | | |
Net asset value, beginning of period | $ 4.88 | $ 10.00 |
Income from Investment Operations | | |
Net investment income (loss) E | .03 | .12 |
Net realized and unrealized gain (loss) | 3.65 | (5.19) |
Total from investment operations | 3.68 | (5.07) |
Distributions from net investment income | - J | (.07) |
Distributions from net realized gain | (.02) | - |
Total distributions | (.02) | (.07) |
Redemption fees added to paid in capital E | - J | .02 |
Net asset value, end of period | $ 8.54 | $ 4.88 |
Total Return B, C, D | 75.49% | (50.53)% |
Ratios to Average Net Assets F, I | | |
Expenses before reductions | 3.02% | 4.02% A |
Expenses net of fee waivers, if any | 1.20% | 1.20% A |
Expenses net of all reductions | 1.12% | 1.12% A |
Net investment income (loss) | .50% | 1.44% A |
Supplemental Data | | |
Net assets, end of period (000 omitted) | $ 118 | $ 396 |
Portfolio turnover rate G | 70% | 79% |
A Annualized
B Total returns for periods of less than one year are not annualized.
C Total returns do not reflect charges attributable to your insurance company's separate account. Inclusion of these charges would reduce the total returns shown.
D Total returns would have been lower had certain expenses not been reduced during the periods shown.
E Calculated based on average shares outstanding during the period.
F Fees and expenses of the underlying Fidelity Central Funds are not included in the Fund's expense ratio. The Fund indirectly bears its proportionate share of the expenses of any underlying Fidelity Central Funds.
G Amount does not include the portfolio activity of any underlying Fidelity Central Funds.
H For the period January 23, 2008 (commencement of operations) to December 31, 2008.
I Expense ratios reflect operating expenses of the class. Expenses before reductions do not reflect amounts reimbursed by the investment adviser or reductions from brokerage service arrangements or reductions from other expense offset arrangements and do not represent the amount paid by the class during periods when reimbursements or reductions occur. Expense ratios before reductions for start-up periods may not be representative of longer-term operating periods. Expenses net of fee waivers reflect expenses after reimbursement by the investment adviser but prior to reductions from brokerage service arrangements or other expense offset arrangements. Expenses net of all reductions represent the net expenses paid by the class.
J Amount represents less than $.01 per share.
See accompanying notes which are an integral part of the financial statements.
Annual Report
Financial Highlights - Service Class 2
Years ended December 31, | 2009 | 2008 H |
Selected Per-Share Data | | |
Net asset value, beginning of period | $ 4.88 | $ 10.00 |
Income from Investment Operations | | |
Net investment income (loss) E | .02 | .11 |
Net realized and unrealized gain (loss) | 3.66 | (5.19) |
Total from investment operations | 3.68 | (5.08) |
Distributions from net investment income | - | (.06) |
Redemption fees added to paid in capital E | - J | .02 |
Net asset value, end of period | $ 8.56 | $ 4.88 |
Total Return B, C, D | 75.41% | (50.65)% |
Ratios to Average Net Assets F, I | | |
Expenses before reductions | 3.17% | 4.17% A |
Expenses net of fee waivers, if any | 1.35% | 1.35% A |
Expenses net of all reductions | 1.27% | 1.27% A |
Net investment income (loss) | .35% | 1.29% A |
Supplemental Data | | |
Net assets, end of period (000 omitted) | $ 117 | $ 395 |
Portfolio turnover rate G | 70% | 79% |
A Annualized
B Total returns for periods of less than one year are not annualized.
C Total returns do not reflect charges attributable to your insurance company's separate account. Inclusion of these charges would reduce the total returns shown.
D Total returns would have been lower had certain expenses not been reduced during the periods shown.
E Calculated based on average shares outstanding during the period.
F Fees and expenses of the underlying Fidelity Central Funds are not included in the Fund's expense ratio. The Fund indirectly bears its proportionate share of the expenses of any underlying Fidelity Central Funds.
G Amount does not include the portfolio activity of any underlying Fidelity Central Funds.
H For the period January 23, 2008 (commencement of operations) to December 31, 2008.
I Expense ratios reflect operating expenses of the class. Expenses before reductions do not reflect amounts reimbursed by the investment adviser or reductions from brokerage service arrangements or reductions from other expense offset arrangements and do not represent the amount paid by the class during periods when reimbursements or reductions occur. Expense ratios before reductions for start-up periods may not be representative of longer-term operating periods. Expenses net of fee waivers reflect expenses after reimbursement by the investment adviser but prior to reductions from brokerage service arrangements or other expense offset arrangements. Expenses net of all reductions represent the net expenses paid by the class.
J Amount represents less than $.01 per share.
Financial Highlights - Initial Class R
Years ended December 31, | 2009 | 2008 H |
Selected Per-Share Data | | |
Net asset value, beginning of period | $ 4.88 | $ 10.00 |
Income from Investment Operations | | |
Net investment income (loss) E | .04 | .11 |
Net realized and unrealized gain (loss) | 3.63 | (5.16) |
Total from investment operations | 3.67 | (5.05) |
Distributions from net investment income | (.02) | (.08) |
Distributions from net realized gain | (.03) | - |
Total distributions | (.05) | (.08) |
Redemption fees added to paid in capital E | .01 | .01 |
Net asset value, end of period | $ 8.51 | $ 4.88 |
Total Return B, C, D | 75.40% | (50.45)% |
Ratios to Average Net Assets F, I | | |
Expenses before reductions | 2.03% | 3.71% A |
Expenses net of fee waivers, if any | 1.10% | 1.10% A |
Expenses net of all reductions | 1.02% | 1.02% A |
Net investment income (loss) | .60% | 1.54% A |
Supplemental Data | | |
Net assets, end of period (000 omitted) | $ 31,314 | $ 3,158 |
Portfolio turnover rate G | 70% | 79% |
A Annualized
B Total returns for periods of less than one year are not annualized.
C Total returns do not reflect charges attributable to your insurance company's separate account. Inclusion of these charges would reduce the total returns shown.
D Total returns would have been lower had certain expenses not been reduced during the periods shown.
E Calculated based on average shares outstanding during the period.
F Fees and expenses of the underlying Fidelity Central Funds are not included in the Fund's expense ratio. The Fund indirectly bears its proportionate share of the expenses of any underlying Fidelity Central Funds.
G Amount does not include the portfolio activity of any underlying Fidelity Central Funds.
H For the period January 23, 2008 (commencement of operations) to December 31, 2008.
I Expense ratios reflect operating expenses of the class. Expenses before reductions do not reflect amounts reimbursed by the investment adviser or reductions from brokerage service arrangements or reductions from other expense offset arrangements and do not represent the amount paid by the class during periods when reimbursements or reductions occur. Expense ratios before reductions for start-up periods may not be representative of longer-term operating periods. Expenses net of fee waivers reflect expenses after reimbursement by the investment adviser but prior to reductions from brokerage service arrangements or other expense offset arrangements. Expenses net of all reductions represent the net expenses paid by the class.
See accompanying notes which are an integral part of the financial statements.
Annual Report
Financial Highlights - Service Class 2R
Years ended December 31, | 2009 | 2008 H |
Selected Per-Share Data | | |
Net asset value, beginning of period | $ 4.88 | $ 10.00 |
Income from Investment Operations | | |
Net investment income (loss) E | .02 | .11 |
Net realized and unrealized gain (loss) | 3.66 | (5.19) |
Total from investment operations | 3.68 | (5.08) |
Distributions from net investment income | - | (.06) |
Redemption fees added to paid in capital E | - J | .02 |
Net asset value, end of period | $ 8.56 | $ 4.88 |
Total Return B, C, D | 75.41% | (50.65)% |
Ratios to Average Net Assets F, I | | |
Expenses before reductions | 3.17% | 4.17% A |
Expenses net of fee waivers, if any | 1.35% | 1.35% A |
Expenses net of all reductions | 1.27% | 1.27% A |
Net investment income (loss) | .35% | 1.29% A |
Supplemental Data | | |
Net assets, end of period (000 omitted) | $ 117 | $ 395 |
Portfolio turnover rate G | 70% | 79% |
A Annualized
B Total returns for periods of less than one year are not annualized.
C Total returns do not reflect charges attributable to your insurance company's separate account. Inclusion of these charges would reduce the total returns shown.
D Total returns would have been lower had certain expenses not been reduced during the periods shown.
E Calculated based on average shares outstanding during the period.
F Fees and expenses of the underlying Fidelity Central Funds are not included in the Fund's expense ratio. The Fund indirectly bears its proportionate share of the expenses of any underlying Fidelity Central Funds.
G Amount does not include the portfolio activity of any underlying Fidelity Central Funds.
H For the period January 23, 2008 (commencement of operations) to December 31, 2008.
I Expense ratios reflect operating expenses of the class. Expenses before reductions do not reflect amounts reimbursed by the investment adviser or reductions from brokerage service arrangements or reductions from other expense offset arrangements and do not represent the amount paid by the class during periods when reimbursements or reductions occur. Expense ratios before reductions for start-up periods may not be representative of longer-term operating periods. Expenses net of fee waivers reflect expenses after reimbursement by the investment adviser but prior to reductions from brokerage service arrangements or other expense offset arrangements. Expenses net of all reductions represent the net expenses paid by the class.
J Amount represents less than $.01 per share.
Financial Highlights - Investor Class R
Years ended December 31, | 2009 | 2008 H |
Selected Per-Share Data | | |
Net asset value, beginning of period | $ 4.87 | $ 10.00 |
Income from Investment Operations | | |
Net investment income (loss) E | .04 | .10 |
Net realized and unrealized gain (loss) | 3.63 | (5.16) |
Total from investment operations | 3.67 | (5.06) |
Distributions from net investment income | (.02) | (.08) |
Distributions from net realized gain | (.03) | - |
Total distributions | (.05) | (.08) |
Redemption fees added to paid in capital E | .01 | .01 |
Net asset value, end of period | $ 8.50 | $ 4.87 |
Total Return B, C, D | 75.56% | (50.55)% |
Ratios to Average Net Assets F, I | | |
Expenses before reductions | 2.07% | 3.81% A |
Expenses net of fee waivers, if any | 1.18% | 1.18% A |
Expenses net of all reductions | 1.10% | 1.10% A |
Net investment income (loss) | .52% | 1.46% A |
Supplemental Data | | |
Net assets, end of period (000 omitted) | $ 40,070 | $ 3,377 |
Portfolio turnover rate G | 70% | 79% |
A Annualized
B Total returns for periods of less than one year are not annualized.
C Total returns do not reflect charges attributable to your insurance company's separate account. Inclusion of these charges would reduce the total returns shown.
D Total returns would have been lower had certain expenses not been reduced during the periods shown.
E Calculated based on average shares outstanding during the period.
F Fees and expenses of the underlying Fidelity Central Funds are not included in the Fund's expense ratio. The Fund indirectly bears its proportionate share of the expenses of any underlying Fidelity Central Funds.
G Amount does not include the portfolio activity of any underlying Fidelity Central Funds.
H For the period January 23, 2008 (commencement of operations) to December 31, 2008.
I Expense ratios reflect operating expenses of the class. Expenses before reductions do not reflect amounts reimbursed by the investment adviser or reductions from brokerage service arrangements or reductions from other expense offset arrangements and do not represent the amount paid by the class during periods when reimbursements or reductions occur. Expense ratios before reductions for start-up periods may not be representative of longer-term operating periods. Expenses net of fee waivers reflect expenses after reimbursement by the investment adviser but prior to reductions from brokerage service arrangements or other expense offset arrangements. Expenses net of all reductions represent the net expenses paid by the class.
See accompanying notes which are an integral part of the financial statements.
Annual Report
Notes to Financial Statements
For the period ended December 31, 2009
1. Organization.
VIP Emerging Markets Portfolio (the Fund) is a fund of Variable Insurance Products Fund IV (the trust) and is authorized to issue an unlimited number of shares. The trust is registered under the Investment Company Act of 1940, as amended (the 1940 Act), as an open-end management investment company organized as a Massachusetts business trust. Shares of the Fund may only be purchased by insurance companies for the purpose of funding variable annuity or variable life insurance contracts. The Fund offers the following classes of shares: Initial Class shares, Service Class shares, Service Class 2 shares, Initial Class R shares, Service Class 2R shares and Investor Class R shares. All classes have equal rights and voting privileges, except for matters affecting a single class. Investment income, realized and unrealized capital gains and losses, the common expenses of the Fund, and certain fund-level expense reductions, if any, are allocated on a pro-rata basis to each class based on the relative net assets of each class to the total net assets of the Fund. Each class differs with respect to transfer agent and distribution and service plan fees incurred. Certain expense reductions also differ by class. The Fund's investments in emerging markets can be subject to social, economic, regulatory, and political uncertainties and can be extremely volatile.
2. Investments in Fidelity Central Funds.
The Fund may invest in Fidelity Central Funds, which are open-end investment companies available only to other investment companies and accounts managed by Fidelity Management & Research Company (FMR) and its affiliates. The Fund's Schedule of Investments lists each of the Fidelity Central Funds held as of period end, if any, as an investment of the Fund, but does not include the underlying holdings of each Fidelity Central Fund. As an Investing Fund, the Fund indirectly bears its proportionate share of the expenses of the underlying Fidelity Central Funds.
The Money Market Central Funds seek preservation of capital and current income and are managed by Fidelity Investments Money Management, Inc. (FIMM), an affiliate of FMR.
A complete unaudited list of holdings for each Fidelity Central Fund is available upon request or at the Securities and Exchange Commission (the SEC) web site at www.sec.gov. In addition, the financial statements of the Fidelity Central Funds, which are not covered by the Fund's Report of Independent Registered Public Accounting Firm, are available on the SEC web site or upon request.
3. Significant Accounting Policies.
The financial statements have been prepared in conformity with accounting principles generally accepted in the United States of America, which require management to make certain estimates and assumptions at the date of the financial statements. Actual results could differ from those estimates. Events or transactions occurring after period end through the date that the financial statements were issued, February 16, 2010, have been evaluated in the preparation of the financial statements. The following summarizes the significant accounting policies of the Fund:
Security Valuation. Investments are valued as of 4:00 p.m. Eastern time on the last calendar day of the period. The Fund uses independent pricing services approved by the Board of Trustees to value its investments. When current market prices or quotations are not readily available or reliable, valuations may be determined in good faith in accordance with procedures adopted by the Board of Trustees. Factors used in determining value may include significant market or security specific events. The frequency with which these procedures are used cannot be predicted and may be utilized to a significant extent. The value used for net asset value (NAV) calculation under these procedures may differ from published prices for the same securities.
The Fund categorizes the inputs to valuation techniques used to value its investments into a disclosure hierarchy consisting of three levels as shown below.
Level 1 - quoted prices in active markets for identical investments
Level 2 - other significant observable inputs (including quoted prices for similar investments, interest rates, prepayment speeds, etc.)
Level 3 - unobservable inputs (including the fund's own assumptions based on the best information available)
Changes in valuation techniques may result in transfers in or out of an assigned level within the disclosure hierarchy. The aggregate value of investments by input level, as of December 31, 2009, is included at the end of the Fund's Schedule of Investments. Valuation techniques used to value the Fund's investments by major category are as follows.
Equity securities, including restricted securities, for which market quotations are readily available, are valued at the last reported sale price or official closing price as reported by an independent pricing service on the primary market or exchange on which they are traded and are categorized as Level 1 in the hierarchy. In the event there were no sales during the day or closing prices are not available, securities are valued at the last quoted bid price or may be valued using the last available price and categorized as Level 2 in the hierarchy. For foreign equity securities, when significant market or security events arise, comparisons to the valuation of American Depository Receipts (ADRs), futures contracts, and certain indexes as well as quoted prices for similar securities are used and are categorized as Level 2 in the hierarchy in these circumstances. For restricted securities and private placements where observable inputs are limited, assumptions about market activity and risk are used and are categorized as Level 3 in the hierarchy.
Annual Report
3. Significant Accounting Policies - continued
Security Valuation - continued
Investments in open-end mutual funds including the Fidelity Central Funds are valued at their closing net asset value each business day and are categorized as Level 1 in the hierarchy. Short-term securities with remaining maturities of sixty days or less for which quotations are not readily available are valued at amortized cost, which approximates value and are categorized as Level 2 in the hierarchy.
Foreign Currency. The Fund uses foreign currency contracts to facilitate transactions in foreign-denominated securities. Losses from these transactions may arise from changes in the value of the foreign currency or if the counterparties do not perform under the contracts' terms.
Foreign-denominated assets, including investment securities, and liabilities are translated into U.S. dollars at the exchange rate at period end. Purchases and sales of investment securities, income and dividends received and expenses denominated in foreign currencies are translated into U.S. dollars at the exchange rate in effect on the transaction date.
The effects of exchange rate fluctuations on investments are included with the net realized and unrealized gain (loss) on investment securities. Other foreign currency transactions resulting in realized and unrealized gain (loss) are disclosed separately.
Investment Transactions and Income. For financial reporting purposes, the Fund's investment holdings and NAV include trades executed through the end of the last business day of the period. The NAV per share for processing shareholder transactions is calculated as of the close of business of the New York Stock Exchange (NYSE), normally 4:00 p.m. Eastern time and includes trades executed through the end of the prior business day. Gains and losses on securities sold are determined on the basis of identified cost. Dividend income is recorded on the ex-dividend date, except for certain dividends from foreign securities where the ex-dividend date may have passed, which are recorded as soon as the Fund is informed of the ex-dividend date. Non-cash dividends included in dividend income, if any, are recorded at the fair market value of the securities received. Interest income and distributions from the Fidelity Central Funds are accrued as earned. Interest income includes coupon interest and amortization of premium and accretion of discount on debt securities. Investment income is recorded net of foreign taxes withheld where recovery of such taxes is uncertain.
Expenses. Most expenses of the trust can be directly attributed to a fund. Expenses which cannot be directly attributed are apportioned among each Fund in the trust. Expense estimates are accrued in the period to which they relate and adjustments are made when actual amounts are known.
Income Tax Information and Distributions to Shareholders. Each year, the Fund intends to qualify as a regulated investment company by distributing substantially all of its taxable income and realized gains under Subchapter M of the Internal Revenue Code and filing its U.S. federal tax return. As a result, no provision for income taxes is required. As of December 31, 2009, the Fund did not have any unrecognized tax benefits in the accompanying financial statements. A Fund's federal tax return is subject to examination by the Internal Revenue Service (IRS) for a period of three years. Foreign taxes are provided for based on the Fund's understanding of the tax rules and rates that exist in the foreign markets in which it invests. The Fund is subject to a tax imposed on short term capital gains on securities of certain issuers domiciled in India. The Fund records an estimated deferred tax liability included in Other payables and accrued expenses in the accompanying Statement of Assets & Liabilities for net unrealized gains on these securities in an amount that would be payable if the securities were disposed of at period end.
Distributions are recorded on the ex-dividend date. Income dividends and capital gain distributions are declared separately for each class. Income and capital gain distributions are determined in accordance with income tax regulations, which may differ from generally accepted accounting principles.
Capital accounts within the financial statements are adjusted for permanent book-tax differences. These adjustments have no impact on net assets or the results of operations. Temporary book-tax differences will reverse in a subsequent period.
Book-tax differences are primarily due to foreign currency transactions, passive foreign investment companies (PFIC), capital loss carryforwards and losses deferred due to wash sales and excise tax regulations.
The federal tax cost of investment securities and unrealized appreciation (depreciation) as of period end were as follows:
Gross unrealized appreciation | $ 12,407,172 |
Gross unrealized depreciation | (1,349,306) |
Net unrealized appreciation (depreciation) | $ 11,057,866 |
| |
Tax Cost | $ 61,023,512 |
The tax-based components of distributable earnings as of period end were as follows:
Undistributed ordinary income | $ 25,253 |
Capital loss carryforward | $ (4,615,107) |
Net unrealized appreciation (depreciation) | $ 11,057,772 |
Annual Report
Notes to Financial Statements - continued
3. Significant Accounting Policies - continued
Income Tax Information and Distributions to Shareholders - continued
The tax character of distributions paid was as follows:
| December 31, 2009 | December 31, 2008 |
Ordinary Income | $ 390,573 | $ 118,460 |
Trading (Redemption) Fees. Initial Class R shares, Service Class 2R shares and Investor Class R shares held less than 60 days are subject to a redemption fee equal to 1% of the proceeds of the redeemed shares. All redemption fees, including any estimated redemption fees paid by FMR, are retained by the Fund and accounted for as an addition to paid in capital.
4. Purchases and Sales of Investments.
Purchases and sales of securities, other than short-term securities, aggregated $66,246,826 and $20,858,501, respectively.
5. Fees and Other Transactions with Affiliates.
Management Fee. FMR and its affiliates provide the Fund with investment management related services for which the Fund pays a monthly management fee. The management fee is the sum of an individual fund fee rate that is based on an annual rate of .55% of the Fund's average net assets and a group fee rate that averaged .26% during the period. The group fee rate is based upon the average net assets of all the mutual funds advised by FMR. The group fee rate decreases as assets under management increase and increases as assets under management decrease. For the period, the total annual management fee rate was .81% of the Fund's average net assets.
Distribution and Service Plan. In accordance with Rule 12b-1 of the 1940 Act, the Fund has adopted separate 12b-1 Plans for each Service Class of shares. Each Service Class pays Fidelity Distributors Corporation (FDC), an affiliate of FMR, a service fee. For the period, the service fee is based on an annual rate of .10% of Service Class' average net assets and .25% of Service Class 2's and Service Class 2R's average net assets.
For the period, each class paid FDC the following amounts, all of which were re-allowed to insurance companies for the distribution of shares and providing shareholder support services:
Service Class | $ 349 |
Service Class 2 | 872 |
Service Class 2R | 872 |
| $ 2,093 |
Transfer Agent Fees. Fidelity Investments Institutional Operations Company, Inc. (FIIOC), an affiliate of FMR, is the Fund's transfer, dividend disbursing, and shareholder servicing agent. FIIOC receives an asset-based fee with respect to each class. Each class (with the exception of Investor Class R) pays a transfer agent fee, excluding out of pocket expenses, equal to an annual rate of .07% of average net assets. Investor Class R pays a monthly asset-based transfer agent fee of .15% of average net assets. The total transfer agent fees paid by each class to FIIOC, including out of pocket expenses, were as follows:
Initial Class | $ 496 |
Service Class | 362 |
Service Class 2 | 362 |
Initial Class R | 12,367 |
Service Class 2R | 362 |
Investor Class R | 27,794 |
| $ 41,743 |
Accounting Fees. Fidelity Service Company, Inc. (FSC), an affiliate of FMR, maintains the Fund's accounting records. The fee is based on the level of average net assets for the month.
Brokerage Commissions. The Fund placed a portion of its portfolio transactions with brokerage firms which are affiliates of the investment adviser. The commissions paid to these affiliated firms were $697 for the period.
Annual Report
6. Committed Line of Credit.
The Fund participates with other funds managed by FMR in a $3.5 billion credit facility (the "line of credit") to be utilized for temporary or emergency purposes to fund shareholder redemptions or for other short-term liquidity purposes. The Fund has agreed to pay commitment fees on its pro-rata portion of the line of credit, which amounted to $81 and is reflected in Miscellaneous Expense on the Statement of Operations. During the period, there were no borrowings on this line of credit.
7. Expense Reductions.
FMR voluntarily agreed to reimburse each class to the extent annual operating expenses exceeded certain levels of average net assets as noted in the table below. Some expenses, for example interest expense, including commitment fees, are excluded from this reimbursement.
The following classes were in reimbursement during the period:
| Expense
Limitations | Reimbursement
from adviser |
| | |
Initial Class | 1.10% | $ 8,520 |
Service Class | 1.20% | 6,385 |
Service Class 2 | 1.35% | 6,373 |
Initial Class R | 1.10% | 129,562 |
Service Class 2R | 1.35% | 6,373 |
Investor Class R | 1.18% | 138,186 |
| | $ 295,399 |
Many of the brokers with whom FMR places trades on behalf of the Fund provided services to the Fund in addition to trade execution. These services included payments of certain expenses on behalf of the Fund totaling $25,350 for the period.
8. Distributions to Shareholders.
Distributions to shareholders of each class were as follows:
Years ended December 31, | 2009 | 2008 A |
From net investment income | | |
Initial Class | $ 596 | $ 7,875 |
Service Class | 41 | 5,365 |
Service Class 2 | - | 4,404 |
Initial Class R | 75,536 | 46,484 |
Service Class 2R | - | 4,404 |
Investor Class R | 94,964 | 49,928 |
Total | $ 171,137 | $ 118,460 |
From net realized gain | | |
Initial Class | $ 762 | $ - |
Service Class | 275 | - |
Service Class 2 | - | - |
Initial Class R | 96,805 | - |
Service Class 2 R | - | - |
Investor Class R | 121,594 | - |
Total | $ 219,436 | $ - |
A For the period January 23, 2008 (commencement of operations) to December 31, 2008.
Annual Report
Notes to Financial Statements - continued
9. Share Transactions.
Transactions for each class of shares were as follows:
| Shares | Dollars |
Years ended December 31, | 2009 | 2008 A | 2009 | 2008 A |
Initial Class | | | | |
Shares sold | 16,945 | 107,445 | $ 120,071 | $ 1,068,509 |
Reinvestment of distributions | 165 | 1,615 | 1,358 | 7,875 |
Shares redeemed | (93,578) | (3,183) | (691,714) | (22,468) |
Net increase (decrease) | (76,468) | 105,877 | $ (570,285) | $ 1,053,916 |
Service Class | | | | |
Shares sold | - | 80,001 | $ - | $ 800,010 |
Reinvestment of distributions | 38 | 1,098 | 316 | 5,365 |
Shares redeemed | (67,365) | - | (502,507) | - |
Net increase (decrease) | (67,327) | 81,099 | $ (502,191) | $ 805,375 |
Service Class 2 | | | | |
Shares sold | - | 80,001 | $ - | $ 800,010 |
Reinvestment of distributions | - | 902 | - | 4,404 |
Shares redeemed | (67,175) | - | (501,199) | - |
Net increase (decrease) | (67,175) | 80,903 | $ (501,199) | $ 804,414 |
Initial Class R | | | | |
Shares sold | 3,509,051 | 856,743 | $ 24,423,527 | $ 8,037,340 |
Reinvestment of distributions | 20,952 | 9,532 | 172,342 | 46,484 |
Shares redeemed | (499,141) | (218,667) | (3,003,566) | (1,627,362) |
Net increase (decrease) | 3,030,862 | 647,608 | $ 21,592,303 | $ 6,456,462 |
Service Class 2R | | | | |
Shares sold | - | 80,001 | $ - | $ 800,010 |
Reinvestment of distributions | - | 902 | - | 4,404 |
Shares redeemed | (67,175) | - | (501,199) | - |
Net increase (decrease) | (67,175) | 80,903 | $ (501,199) | $ 804,414 |
Investor Class R | | | | |
Shares sold | 4,321,090 | 938,957 | $ 31,280,354 | $ 8,629,449 |
Reinvestment of distributions | 26,389 | 10,240 | 216,557 | 49,928 |
Shares redeemed | (326,280) | (256,154) | (2,015,261) | (1,939,873) |
Net increase (decrease) | 4,021,199 | 693,043 | $ 29,481,650 | $ 6,739,504 |
A For the period January 23, 2008 (commencement of operations) to December 31, 2008.
10. Other.
The Fund's organizational documents provide former and current trustees and officers with a limited indemnification against liabilities arising in connection with the performance of their duties to the Fund. In the normal course of business, the Fund may also enter into contracts that provide general indemnifications. The Fund's maximum exposure under these arrangements is unknown as this would be dependent on future claims that may be made against the Fund. The risk of material loss from such claims is considered remote.
At the end of the period, FMR or its affiliates were the owners of record of approximately 100% of the total outstanding shares of the Fund.
Annual Report
Report of Independent Registered Public Accounting Firm
To the Trustees of Variable Insurance Products Fund IV and Shareholders of VIP Emerging Markets Portfolio:
We have audited the accompanying statement of assets and liabilities of VIP Emerging Markets Portfolio (the Fund), a fund of Variable Insurance Products Fund IV, including the schedule of investments, as of December 31, 2009, and the related statement of operations for the year then ended, and the statements of changes in net assets and the financial highlights for the year ended December 31, 2009 and for the period from January 23, 2008 (commencement of operations) to December 31, 2008. These financial statements and financial highlights are the responsibility of the Fund's management. Our responsibility is to express an opinion on these financial statements and financial highlights based on our audits.
We conducted our audits in accordance with standards of the Public Company Accounting Oversight Board (United States). Those standards require that we plan and perform the audit to obtain reasonable assurance about whether the financial statements and financial highlights are free of material misstatement. The Fund is not required to have, nor were we engaged to perform, an audit of its internal control over financial reporting. Our audits included consideration of internal control over financial reporting as a basis for designing audit procedures that are appropriate in the circumstances, but not for the purpose of expressing an opinion on the effectiveness of the Fund's internal control over financial reporting. Accordingly, we express no such opinion. An audit also includes examining, on a test basis, evidence supporting the amounts and disclosures in the financial statements, assessing the accounting principles used and significant estimates made by management, as well as evaluating the overall financial statement presentation. Our procedures included confirmation of securities owned as of December 31, 2009, by correspondence with the custodians and brokers; where replies were not received from brokers, we performed other auditing procedures. We believe that our audits provide a reasonable basis for our opinion.
In our opinion, the financial statements and financial highlights referred to above present fairly, in all material respects, the financial position of VIP Emerging Markets Portfolio as of December 31, 2009, the results of its operations for the year then ended, and the statements of changes in net assets and the financial highlights for the year ended December 31, 2009 and for the period from January 23, 2008 (commencement of operations) to December 31, 2008, in conformity with accounting principles generally accepted in the United States of America.
/s/ Deloitte & Touche LLP
DELOITTE & TOUCHE LLP
Boston, Massachusetts
February 16, 2010
Annual Report
The Trustees, Member of the Advisory Board, and executive officers of the trust and fund, as applicable, are listed below. The Board of Trustees governs the fund and is responsible for protecting the interests of shareholders. The Trustees are experienced executives who meet periodically throughout the year to oversee the fund's activities, review contractual arrangements with companies that provide services to the fund, and review the fund's performance. Except for James C. Curvey, each of the Trustees oversees 222 funds advised by FMR or an affiliate. Mr. Curvey oversees 410 funds advised by FMR or an affiliate.
The Trustees hold office without limit in time except that (a) any Trustee may resign; (b) any Trustee may be removed by written instrument, signed by at least two-thirds of the number of Trustees prior to such removal; (c) any Trustee who requests to be retired or who has become incapacitated by illness or injury may be retired by written instrument signed by a majority of the other Trustees; and (d) any Trustee may be removed at any special meeting of shareholders by a two-thirds vote of the outstanding voting securities of the trust. Each Trustee who is not an interested person (as defined in the 1940 Act) (Independent Trustee), shall retire not later than the last day of the calendar year in which his or her 72nd birthday occurs. The Independent Trustees may waive this mandatory retirement age policy with respect to individual Trustees. The executive officers and Advisory Board Member hold office without limit in time, except that any officer and Advisory Board Member may resign or may be removed by a vote of a majority of the Trustees at any regular meeting or any special meeting of the Trustees. Except as indicated, each individual has held the office shown or other offices in the same company for the past five years.
The fund's Statement of Additional Information (SAI) includes more information about the Trustees. To request a free copy, call Fidelity at 1-877-208-0098.
Interested Trustees*:
Correspondence intended for each Trustee who is an interested person may be sent to Fidelity Investments, 82 Devonshire Street, Boston, Massachusetts 02109.
Name, Age; Principal Occupation |
Edward C. Johnson 3d (79) |
| Year of Election or Appointment: 1983 Mr. Johnson is Trustee and Chairman of the Board of Trustees of certain Trusts. Mr. Johnson serves as Chief Executive Officer, Chairman, and a Director of FMR LLC; Chairman and a Director of FMR; Chairman and a Director of Fidelity Research & Analysis Company (FRAC); Chairman and a Director of Fidelity Investments Money Management, Inc.; and Chairman and a Director of FMR Co., Inc. In addition, Mr. Johnson serves as Chairman and Director of FIL Limited. Previously, Mr. Johnson served as President of FMR LLC (2006-2007). |
James C. Curvey (74) |
| Year of Election or Appointment: 2007 Mr. Curvey also serves as Trustee (2007-present) of other investment companies advised by FMR. Mr. Curvey is a Director of FMR and FMR Co., Inc. (2007-present). Mr. Curvey is also Vice Chairman (2006-present) and Director of FMR LLC. In addition, Mr. Curvey serves as an Overseer for the Boston Symphony Orchestra and a member of the Trustees of Villanova University. |
* Trustees have been determined to be "Interested Trustees" by virtue of, among other things, their affiliation with the trust or various entities under common control with FMR.
Independent Trustees:
Correspondence intended for each Independent Trustee (that is, the Trustees other than the Interested Trustees) may be sent to Fidelity Investments, P.O. Box 55235, Boston, Massachusetts 02205-5235.
Name, Age; Principal Occupation |
Dennis J. Dirks (61) |
| Year of Election or Appointment: 2005 Prior to his retirement in May 2003, Mr. Dirks was Chief Operating Officer and a member of the Board of The Depository Trust & Clearing Corporation (DTCC). He also served as President, Chief Operating Officer, and Board member of The Depository Trust Company (DTC) and President and Board member of the National Securities Clearing Corporation (NSCC). In addition, Mr. Dirks served as Chief Executive Officer and Board member of the Government Securities Clearing Corporation, Chief Executive Officer and Board member of the Mortgage-Backed Securities Clearing Corporation, as a Trustee and a member of the Finance Committee of Manhattan College (2005-2008), and as a Trustee and a member of the Finance Committee of AHRC of Nassau County (2006-2008). Currently, Mr. Dirks serves as a member of the Board of Directors for The Brookville Center for Children's Services, Inc. (2009-present). |
Alan J. Lacy (56) |
| Year of Election or Appointment: 2008 Mr. Lacy serves as Senior Adviser (2007-present) of Oak Hill Capital Partners, L.P. (private equity). Mr. Lacy also served as Chief Executive Officer (2000-2005) and Vice Chairman (2005-2006) of Sears Holdings Corporation and Sears, Roebuck and Co. (retail). In addition, Mr. Lacy serves as a member of the Board of Directors of The Western Union Company (global money transfer, 2006-present) and Bristol-Myers Squibb Company (global pharmaceuticals, 2007-present). Mr. Lacy is Chairman (2008-present) and a member (2006-present) of the Board of Trustees of The National Parks Conservation Association. |
Ned C. Lautenbach (65) |
| Year of Election or Appointment: 2000 Mr. Lautenbach is Chairman of the Independent Trustees of the Equity and High Income Funds (2006-present). Mr. Lautenbach is an Advisory Partner of Clayton, Dubilier & Rice, Inc. (private equity investment). Previously, Mr. Lautenbach was with the International Business Machines Corporation (IBM) from 1968 until his retirement in 1998. Mr. Lautenbach serves as a Director of Eaton Corporation (diversified industrial) as well as the Philharmonic Center for the Arts in Naples, Florida. Mr. Lautenbach is also a member of the Board of Trustees of Fairfield University (2005-present), as well as a member of the Council on Foreign Relations. Previously, Mr. Lautenbach served as a Director of Sony Corporation (2006-2007). |
Joseph Mauriello (65) |
| Year of Election or Appointment: 2008 Prior to his retirement in January 2006, Mr. Mauriello served in numerous senior management positions including Deputy Chairman and Chief Operating Officer (2004-2005), and Vice Chairman of Financial Services (2002-2004) of KPMG LLP US (professional services, 1965-2005). Mr. Mauriello currently serves as a member of the Board of Directors of XL Capital Ltd. (global insurance and re-insurance, 2006-present) and of Arcadia Resources Inc. (health care services and products, 2007-present). Previously, Mr. Mauriello served as a Director of the Hamilton Funds of the Bank of New York (2006-2007). |
Cornelia M. Small (65) |
| Year of Election or Appointment: 2005 Ms. Small is a member of the Board of Directors of the Teagle Foundation (2009-present). Ms. Small is also a member of the Investment Committee, and Chair (2008-present) and a member of the Board of Trustees of Smith College. In addition, Ms. Small serves on the Investment Committee of the Berkshire Taconic Community Foundation (2008-present). Previously, Ms. Small served as Chairperson of the Investment Committee (2002-2008) of Smith College. In addition, Ms. Small served as Chief Investment Officer, Director of Global Equity Investments, and a member of the Board of Directors of Scudder, Stevens & Clark and Scudder Kemper Investments. |
William S. Stavropoulos (70) |
| Year of Election or Appointment: 2001 Mr. Stavropoulos serves as President and Founder of the Michigan Baseball Foundation, the Great Lakes Loons (2007-present). Mr. Stavropoulos is Chairman Emeritus of the Board of Directors of The Dow Chemical Company, where he previously served in numerous senior management positions, including President, CEO (1995-2000; 2002-2004), Chairman of the Executive Committee (2000-2006), and as a member of the Board of Directors (1990-2006). Currently, Mr. Stavropoulos is a Director of Teradata Corporation (data warehousing and technology solutions, 2008-present), Chemical Financial Corporation, Maersk Inc. (industrial conglomerate), Tyco International, Inc. (multinational manufacturing and services, 2007-present), and a member of the Advisory Board for Metalmark Capital (private equity investment, 2005-present). Mr. Stavropoulos is a special advisor to Clayton, Dubilier & Rice, Inc. (private equity investment). In addition, Mr. Stavropoulos is a member of the University of Notre Dame Advisory Council for the College of Science. |
David M. Thomas (60) |
| Year of Election or Appointment: 2008 Previously, Mr. Thomas served as Executive Chairman (2005-2006) and Chairman and Chief Executive Officer (2000-2005) of IMS Health, Inc. (pharmaceutical and healthcare information solutions). In addition, Mr. Thomas serves as a member of the Board of Directors of Fortune Brands, Inc. (consumer products), and Interpublic Group of Companies, Inc. (marketing communication, 2004-present). |
Michael E. Wiley (59) |
| Year of Election or Appointment: 2008 Mr. Wiley also serves as a Director of Asia Pacific Exploration Consolidated (international oil and gas exploration and production, 2008-present), and as a member of the Board of Trustees of the University of Tulsa (2000-2006; 2007-present). Mr. Wiley serves as a Director of Tesoro Corporation (independent oil refiner and marketer, 2005-present), and a Director of Bill Barrett Corporation (exploration and production, 2005-present). In addition, Mr. Wiley also serves as a Director of Post Oak Bank (privately-held bank, 2004-present). Previously, Mr. Wiley served as a Sr. Energy Advisor of Katzenbach Partners, LLC (consulting, 2006-2007), as an Advisory Director of Riverstone Holdings (private investment), Chairman, President, and CEO of Baker Hughes, Inc. (oilfield services, 2000-2004), and as Director of Spinnaker Exploration Company (exploration and production, 2001-2005). |
Annual Report
Trustees and Officers - continued
Advisory Board Member and Executive Officers:
Correspondence intended for each executive officer and Peter S. Lynch may be sent to Fidelity Investments, 82 Devonshire Street, Boston, Massachusetts 02109.
Name, Age; Principal Occupation |
Peter S. Lynch (65) |
| Year of Election or Appointment: 2003 Member of the Advisory Board of Fidelity's Equity and High Income Funds. Mr. Lynch is Vice Chairman and a Director of FMR and FMR Co., Inc. In addition, Mr. Lynch serves as a Trustee of Boston College and as the Chairman of the Inner-City Scholarship Fund. Previously, Mr. Lynch served on the Special Olympics International Board of Directors (1997-2006). |
Kenneth B. Robins (40) |
| Year of Election or Appointment: 2008 President and Treasurer of Fidelity's Equity and High Income Funds. Mr. Robins also serves as Assistant Treasurer of other Fidelity funds (2009-present) and is an employee of Fidelity Investments (2004-present). Before joining Fidelity Investments, Mr. Robins worked at KPMG LLP, where he was a partner in KPMG's department of professional practice (2002-2004). |
Brian B. Hogan (45) |
| Year of Election or Appointment: 2009 Vice President of certain Equity Funds and Vice President of Sector Funds. Mr. Hogan also serves as Senior Vice President, Equity Research of FMR (2006-present) and President of FMR's Equity Division (2009-present). Previously, Mr. Hogan served as a portfolio manager. |
Eric M. Wetlaufer (47) |
| Year of Election or Appointment: 2006 Vice President of Fidelity's International Equity Funds. Mr. Wetlaufer also serves as Group Chief Investment Officer of FMR. Mr. Wetlaufer is a Director (2007-present), Chairman, Chief Executive Officer, and President of Fidelity Management & Research (Hong Kong) Limited (2008-present); Chairman, Chief Executive Officer, President, and a Director of Fidelity Management & Research (Japan) Inc. (2008-present); Chairman and Chief Executive Officer (2007-present) and President and a Director (2006-present) of Fidelity Management & Research (U.K.) Inc. and President and a Director of Fidelity Research & Analysis Company (2006-present). Before joining Fidelity Investments in 2005, Mr. Wetlaufer was a partner in Oxhead Capital Management (2004-2005). |
Scott C. Goebel (41) |
| Year of Election or Appointment: 2008 Secretary and Chief Legal Officer (CLO) of the Fidelity funds. Mr. Goebel also serves as General Counsel, Secretary, and Senior Vice President of FMR (2008-present) and FMR Co., Inc. (2008-present); Deputy General Counsel of FMR LLC; Chief Legal Officer of Fidelity Management & Research (Hong Kong) Limited (2008-present) and Assistant Secretary of Fidelity Management & Research (Japan) Inc. (2008-present), Fidelity Investments Money Management, Inc. (2008-present), Fidelity Management & Research (U.K.) Inc. (2008-present), and Fidelity Research and Analysis Company (2008-present). Previously, Mr. Goebel served as Assistant Secretary of the Funds (2007-2008) and as Vice President and Secretary of Fidelity Distributors Corporation (FDC) (2005-2007). |
William C. Coffey (40) |
| Year of Election or Appointment: 2009 Assistant Secretary of Fidelity's Equity and High Income Funds. Mr. Coffey also serves as Vice President and Associate General Counsel of FMR LLC (2005-present), and is an employee of Fidelity Investments. |
Holly C. Laurent (55) |
| Year of Election or Appointment: 2008 Anti-Money Laundering (AML) Officer of the Fidelity funds. Ms. Laurent is an employee of Fidelity Investments. Previously, Ms. Laurent was Senior Vice President and Head of Legal for Fidelity Business Services India Pvt. Ltd. (2006-2008), and Senior Vice President, Deputy General Counsel and Group Head for FMR LLC (2005-2006). |
Christine Reynolds (51) |
| Year of Election or Appointment: 2008 Chief Financial Officer of the Fidelity funds. Ms. Reynolds became President of Fidelity Pricing and Cash Management Services (FPCMS) in August 2008. Ms. Reynolds served as Chief Operating Officer of FPCMS (2007-2008). Previously, Ms. Reynolds served as President, Treasurer, and Anti-Money Laundering officer of the Fidelity funds (2004-2007). |
Kenneth A. Rathgeber (62) |
| Year of Election or Appointment: 2004 Chief Compliance Officer of Fidelity's Equity and High Income Funds. Mr. Rathgeber is Chief Compliance Officer of Fidelity Management & Research (Hong Kong) Limited (2008-present), Fidelity Management & Research (Japan) Inc. (2008-present), FMR (2005-present), FMR Co., Inc. (2005-present), Fidelity Management & Research (U.K.) Inc. (2005-present), Fidelity Research & Analysis Company (2005-present), Fidelity Investments Money Management, Inc. (2005-present), Pyramis Global Advisors, LLC (2005-present), and Strategic Advisers, Inc. (2005-present). |
Jeffrey S. Christian (48) |
| Year of Election or Appointment: 2009 Deputy Treasurer of the Fidelity funds. Mr. Christian is an employee of Fidelity Investments. Previously, Mr. Christian served as Chief Financial Officer (2008-2009) of certain Fidelity funds, Senior Vice President of Fidelity Pricing and Cash Management Services (FPCMS) (2004-2009), and as Vice President of Business Analysis (2003-2004). |
Bryan A. Mehrmann (48) |
| Year of Election or Appointment: 2005 Deputy Treasurer of the Fidelity funds. Mr. Mehrmann is an employee of Fidelity Investments. Previously, Mr. Mehrmann served as Vice President of Fidelity Investments Institutional Services Group (FIIS)/Fidelity Investments Institutional Operations Company, Inc. (FIIOC) Client Services (1998-2004). |
Adrien E. Deberghes (42) |
| Year of Election or Appointment: 2008 Deputy Treasurer of Fidelity's Equity and High Income Funds. Mr. Deberghes is an employee of Fidelity Investments (2008-present). Previously, Mr. Deberghes served as Senior Vice President of Mutual Fund Administration at State Street Corporation (2007-2008), Senior Director of Mutual Fund Administration at Investors Bank & Trust (2005-2007), and Director of Finance for Dunkin' Brands (2000-2005). |
John R. Hebble (51) |
| Year of Election or Appointment: 2009 Assistant Treasurer of Fidelity's Equity and High Income Funds. Mr. Hebble also serves as President and Treasurer of other Fidelity funds (2008-present) and is an employee of Fidelity Investments. |
Paul M. Murphy (62) |
| Year of Election or Appointment: 2007 Assistant Treasurer of the Fidelity funds. Mr. Murphy is an employee of Fidelity Investments. Previously, Mr. Murphy served as Chief Financial Officer of the Fidelity funds (2005-2006), Vice President and Associate General Counsel of FMR (2007), and Senior Vice President of Fidelity Pricing and Cash Management Services (FPCMS) (1994-2007). |
Gary W. Ryan (51) |
| Year of Election or Appointment: 2005 Assistant Treasurer of the Fidelity funds. Mr. Ryan is an employee of Fidelity Investments. Previously, Mr. Ryan served as Vice President of Fund Reporting in Fidelity Pricing and Cash Management Services (FPCMS) (1999-2005). |
Annual Report
The Board of Trustees of Fidelity VIP Emerging Markets Portfolio voted to pay to shareholders of record at the opening of business on record date, the following distributions per share derived from capital gains realized from sales of portfolio securities:
| Pay Date | Record Date | Capital Gains |
Initial Class | 02/05/10 | 02/05/10 | $.003 |
Service Class | 02/05/10 | 02/05/10 | $.003 |
Service Class 2 | 02/05/10 | 02/05/10 | $.003 |
The amounts per share which represent income derived from sources within, and taxes paid to, foreign countries or possessions of the United States are as follows:
| Pay Date | Income | Taxes |
Initial Class | 12/18/2009 | $0.051 | $0.006 |
| 12/30/2009 | $0.003 | $- |
Service Class | 12/18/2009 | $0.026 | $0.006 |
| 12/30/2009 | $0.003 | $- |
Service Class 2 | 12/18/2009 | $- | $- |
| 12/30/2009 | $- | $- |
The fund will notify shareholders in January 2010 of amounts for use in preparing 2009 income tax returns.
Annual Report
Board Approval of Investment Advisory Contracts and Management Fees
VIP Emerging Markets Portfolio
Each year, the Board of Trustees, including the Independent Trustees (together, the Board), votes on the renewal of the management contract and sub-advisory agreements (together, the Advisory Contracts) for the fund. The Board, assisted by the advice of fund counsel and Independent Trustees' counsel, requests and considers a broad range of information throughout the year.
The Board meets regularly and, acting directly and through its separate committees, requests and receives information concerning, and considers at each of its meetings factors that are relevant to, its annual consideration of the renewal of the fund's Advisory Contracts, including the services and support provided to the fund and its shareholders. The Board has established various standing committees, each composed of Independent Trustees with varying backgrounds, to which the Board has assigned specific subject matter responsibilities in order to enhance effective decision-making by the Board. Each committee has a written charter outlining the structure and purposes of the committee. The Board also meets as needed to consider matters specifically related to the Board's annual consideration of the renewal of Advisory Contracts.
At its July 2009 meeting, the Board of Trustees, including the Independent Trustees, unanimously determined to renew the fund's Advisory Contracts. In reaching its determination, the Board considered all factors it believed relevant, including (i) the nature, extent, and quality of the services to be provided to the fund and its shareholders (including the investment performance of the fund); (ii) the competitiveness of the fund's management fee and total expenses; (iii) the total costs of the services to be provided by and the profits to be realized by Fidelity from its relationship with the fund; (iv) the extent to which economies of scale would be realized as the fund grows; and (v) whether fee levels reflect these economies of scale, if any, for the benefit of fund shareholders.
In considering whether to renew the Advisory Contracts for the fund, the Board ultimately reached a determination, with the assistance of fund counsel and Independent Trustees' counsel and through the exercise of its business judgment, that the renewal of the Advisory Contracts and the compensation to be received by Fidelity under the management contract is consistent with Fidelity's fiduciary duty under applicable law. The Board's decision to renew the Advisory Contracts was not based on any single factor noted above, but rather was based on a comprehensive consideration of all the information provided to the Board at its meetings throughout the year. The Board, in reaching its determination to renew the Advisory Contracts, is aware that shareholders in the fund have a broad range of investment choices available to them, including a wide choice among mutual funds offered by competitors to Fidelity, and that the fund's shareholders, with the opportunity to review and weigh the disclosure provided by the fund in its prospectus and other public disclosures, have chosen to invest in this fund, managed by Fidelity.
Nature, Extent, and Quality of Services Provided. The Board considered staffing within the investment adviser, FMR, and the sub-advisers (together, the Investment Advisers), including the backgrounds of the fund's investment personnel and the fund's investment objective and discipline. The Independent Trustees also had discussions with senior management of Fidelity's investment operations and investment groups. The Board considered the structure of the portfolio manager compensation program and whether this structure provides appropriate incentives.
Resources Dedicated to Investment Management and Support Services. The Board reviewed the size, education, and experience of the Investment Advisers' investment staff, their use of technology, and the Investment Advisers' approach to recruiting, training, and retaining portfolio managers and other research, advisory, and management personnel. In response to last year's financial crisis, FMR took a number of actions intended to cut costs and improve efficiency without weakening the investment teams or resources. The Board noted that Fidelity's analysts have access to a variety of technological tools and market and securities data that enable them to perform both fundamental and quantitative analysis and to specialize in various disciplines. The Board considered Fidelity's extensive global research capabilities that enable the Investment Advisers to aggregate data from various sources in an effort to produce positive investment results. The Board also considered that Fidelity's portfolio managers and analysts have access to daily portfolio attribution that allows for monitoring of a fund's portfolio, as well as an electronic communication system that provides immediate real-time access to research concerning issuers and credit enhancers.
Shareholder and Administrative Services. The Board considered (i) the nature, extent, quality, and cost of advisory, administrative, distribution, and shareholder services performed by the Investment Advisers and their affiliates under the Advisory Contracts and under separate agreements covering transfer agency, pricing and bookkeeping, and securities lending services for the fund; (ii) the nature and extent of the Investment Advisers' supervision of third party service providers, principally custodians and subcustodians; and (iii) the resources devoted to, and the record of compliance with, the fund's compliance policies and procedures. The Board also reviewed the allocation of fund brokerage, including allocations to brokers affiliated with the Investment Advisers, the use of brokerage commissions to pay fund expenses, and the use of "soft" commission dollars to pay for research services.
The Board noted that the growth of fund assets across the complex allows Fidelity to reinvest in the development of services designed to enhance the value or convenience of the Fidelity funds as investment vehicles. These services include 24-hour access to account information and market information through phone representatives and over the Internet, and investor education materials and asset allocation tools.
Investment in a Large Fund Family. The Board considered the benefits to shareholders of investing in a Fidelity fund, including the benefits of investing in a fund that is part of a large family of funds offering a variety of investment disciplines and providing for a large variety of mutual fund investor services. The Board noted that Fidelity has taken a number of actions over the previous year that benefited particular funds, including (i) dedicating additional resources to investment research and to restructure and broaden the focus of the investment research teams; (ii) bolstering the senior management team that oversees asset management; (iii) contractually agreeing to reduce the management fee on Fidelity U.S. Bond Index Fund; and (iv) expanding Class A and Class T load waiver categories to increase rollover retention opportunities and create consistent policies across the classes.
Annual Report
Board Approval of Investment Advisory Contracts and Management Fees - continued
Investment Performance. The Board considered whether the fund has operated within its investment objective, as well as its record of compliance with its investment restrictions. The Board noted that it is not possible to evaluate performance in any comprehensive fashion because the fund had been in operation for less than one calendar year. Once the fund has been in operation for at least one calendar year, the Board will review the fund's absolute investment performance for each class, as well as the fund's relative investment performance for each class measured against a broad-based securities market index and, if a meaningful peer group exists, a peer group of mutual funds.
Based on its review, and giving particular weight to the nature and quality of the resources dedicated by the Investment Advisers to maintain and improve relative performance and factoring in the unprecedented market events in 2008, the Board concluded that the nature, extent, and quality of the services provided to the fund will benefit the fund's shareholders, particularly in light of the Board's view that the fund's shareholders benefit from investing in a fund that is part of a large family of funds offering a variety of investment disciplines and services.
Competitiveness of Management Fee and Total Fund Expenses. The Board considered the fund's management fee and total expenses compared to "mapped groups" of competitive funds and classes. Fidelity creates "mapped groups" by combining similar Lipper investment objective categories that have comparable management fee characteristics. Combining Lipper investment objective categories aids the Board's management fee and total expense comparisons by broadening the competitive group used for comparison and by reducing the number of universes to which various Fidelity funds are compared.
The Board considered two proprietary management fee comparisons for the period of the fund's operations shown in the chart below. The group of Lipper funds used by the Board for management fee comparisons is referred to below as the "Total Mapped Group." The Total Mapped Group comparison focuses on a fund's standing relative to the total universe of comparable funds available to investors, in terms of gross management fees before expense reimbursements or caps. "TMG %" represents the percentage of funds in the Total Mapped Group that had management fees that were lower than the fund's. For example, a TMG % of 36% means that 64% of the funds in the Total Mapped Group had higher management fees than the fund. The "Asset-Size Peer Group" (ASPG) comparison focuses on a fund's standing relative to non-Fidelity funds similar in size to the fund within the Total Mapped Group. The ASPG represents at least 15% of the funds in the Total Mapped Group with comparable asset size and management fee characteristics, subject to a minimum of 50 funds (or all funds in the Total Mapped Group if fewer than 50). Additional information, such as the ASPG quartile in which the fund's management fee ranked, is also included in the chart and considered by the Board.
VIP Emerging Markets Portfolio
The Board noted that the fund's management fee ranked below the median of its Total Mapped Group and below the median of its ASPG for the period.
Based on its review, the Board concluded that the fund's management fee was fair and reasonable in light of the services that the fund receives and the other factors considered.
In its review of each class's total expenses, the Board considered the fund's management fee as well as other fund or class expenses, as applicable, such as transfer agent fees, pricing and bookkeeping fees, fund-paid 12b-1 fees, and custodial, legal, and audit fees. The Board also noted the effects of any waivers and reimbursements on fees and expenses. As part of its review, the Board also considered current and historical total expenses of each class of the fund compared to competitive fund median expenses. Each class of the fund is compared to those funds and classes in the Total Mapped Group (used by the Board for management fee comparisons) that have a similar sales load structure.
Annual Report
The Board noted that the total expenses of each of Initial Class and Initial Class R ranked equal to its competitive median for the period and the total expenses of each of Investor Class R, Service Class, Service Class 2, and Service Class 2 R ranked above its competitive median for the period. The Board considered that the total expenses of Investor Class R were above the median primarily due to its higher transfer agent fee. The Board noted that the fund offers multiple classes, each of which has a different 12b-1 fee structure, and that the multiple structures are intended to offer a range of pricing options for the intermediary market. The Board also noted that the total expenses of the classes vary primarily by the level of their 12b-1 fees, although differences in transfer agent fees may also cause expenses to vary from class to class.
In its review of total expenses, the Board also considered Fidelity fee structures and other information on clients that FMR and its affiliates service in other competitive markets, such as other mutual funds advised or subadvised by FMR or its affiliates, pension plan clients, and other institutional clients.
Based on its review, the Board concluded that the total expenses of each class of the fund were reasonable, although in some cases above the median of the universe presented for comparison, in light of the services that the fund and its shareholders receive and the other factors considered.
Costs of the Services and Profitability. The Board considered the revenues earned and the expenses incurred by Fidelity in conducting the business of developing, marketing, distributing, managing, administering and servicing the fund and its shareholders. The Board also considered the level of Fidelity's profits in respect of all the Fidelity funds.
On an annual basis, FMR presents to the Board Fidelity's profitability for the fund. Fidelity calculates the profitability for each fund, as well as aggregate profitability for groups of Fidelity funds and all Fidelity funds, using a series of detailed revenue and cost allocation methodologies which originate with the audited books and records of Fidelity. The Audit Committee of the Board reviews any significant changes from the prior year's methodologies.
PricewaterhouseCoopers LLP (PwC), independent registered public accounting firm and auditor to Fidelity and certain Fidelity funds, has been engaged annually by the Board as part of the Board's assessment of Fidelity's profitability analysis. PwC's engagement includes the review and assessment of Fidelity's methodologies used in determining the revenues and expenses attributable to Fidelity's mutual fund business, and completion of agreed-upon procedures surrounding the mathematical accuracy of fund profitability and its conformity to allocation methodologies. After considering PwC's reports issued under the engagement and information provided by Fidelity, the Board believes that while other allocation methods may also be reasonable, Fidelity's profitability methodologies are reasonable in all material respects.
The Board has also reviewed Fidelity's non-fund businesses and any fall-out benefits related to the mutual fund business as well as cases where Fidelity's affiliates may benefit from or be related to the fund's business.
The Board considered the costs of the services provided by and the profits realized by Fidelity in connection with the operation of the fund and determined that the amount of profit is a fair entrepreneurial profit for the management of the fund.
Economies of Scale. The Board considered whether there have been economies of scale in respect of the management of the Fidelity funds, whether the Fidelity funds (including the fund) have appropriately benefited from any such economies of scale, and whether there is potential for realization of any further economies of scale. The Board considered the extent to which the fund will benefit from economies of scale through increased services to the fund, through waivers or reimbursements, or through fee or expense reductions.
In February 2009, the Board created an Ad Hoc Committee (the "Committee") to analyze economies of scale. The Committee was formed to consider whether FMR attains economies of scale in respect of the management and servicing of the Fidelity funds, whether the Fidelity funds have appropriately benefited from such economies of scale, and whether there is potential for realization of any further economies of scale.
The Board recognized that the fund's management contract incorporates a "group fee" structure, which provides for lower group fee rates as total fund assets under FMR's management increase, and for higher group fee rates as total fund assets under FMR's management decrease. FMR determines the group fee rates based on a tiered asset "breakpoint" schedule. The Board considered that the group fee is designed to deliver the benefits of economies of scale to fund shareholders when total fund assets increase, even if assets of any particular fund are unchanged or have declined, because some portion of Fidelity's costs are attributable to services provided to all Fidelity funds, and all funds benefit if those costs can be allocated among more assets. The Board concluded that, given the group fee structure, fund shareholders will achieve a certain level of economies of scale as assets under FMR's management increase at the fund complex level, regardless of whether Fidelity achieves any such economies of scale.
The Board concluded, considering the findings of the Committee, that any potential economies of scale are being shared between fund shareholders and Fidelity in an appropriate manner.
Additional Information Requested by the Board. In order to develop fully the factual basis for consideration of the Fidelity funds' Advisory Contracts, the Board requested and received additional information on certain topics, including (i) fund performance trends, actions to be taken by FMR to improve certain funds' overall performance and Fidelity's long-term strategies for certain funds; (ii) portfolio manager changes that have occurred during the past year; (iii) Fidelity's compensation structure for portfolio managers and key personnel, including performance benchmarks used by Fidelity in evaluating incentive compensation for portfolio managers and research analysts; (iv) the structure and process of equity research and actions taken by FMR to improve the quality of research; (v) the selection of and compensation paid by FMR to fund sub-advisers; (vi) Fidelity's fee structures and rationale for recommending different fees among categories of funds; (vii) the rationale for any differences between fund fee structures and fee structures in place for other Fidelity clients; (viii) Fidelity's rationale for recommending which funds should have a performance adjustment component as part of their management fees; and (ix) explanations for the relative total expenses borne by certain funds and classes, total expense competitive trends, and actions that might be taken by FMR to reduce total expenses for certain funds and classes.
Annual Report
Board Approval of Investment Advisory Contracts and Management Fees - continued
Based on its evaluation of all of the conclusions noted above, and after considering all material factors, the Board ultimately concluded that the advisory fee structures are fair and reasonable, and that the fund's Advisory Contracts should be renewed.
Annual Report
Investment Adviser
Fidelity Management & Research Company
Boston, MA
Investment Sub-Advisers
FMR Co., Inc.
Fidelity Management & Research (U.K.) Inc.
Fidelity Management & Research (Hong Kong) Limited
Fidelity Management & Research (Japan) Inc.
Fidelity Research & Analysis Company
FIL Investment Advisors
FIL Investment Advisors (U.K.) Ltd.
FIL Investments (Japan) Limited
General Distributor
Fidelity Distributors Corporation
Boston, MA
Transfer and Service Agents
Fidelity Investments Institutional Operations Company, Inc.
Boston, MA
Fidelity Service Company, Inc.
Boston, MA
Custodian
State Street Bank and Trust Company
Quincy, MA
VIPEM-ANN-0210
1.858135.101
Fidelity® Variable Insurance Products:
Emerging Markets Portfolio - Class R
Annual Report
December 31, 2009
(2_fidelity_logos) (Registered_Trademark)
Contents
Performance | <Click Here> | How the fund has done over time. |
Management's Discussion | <Click Here> | The manager's review of fund performance, strategy and outlook. |
Shareholder Expense Example | <Click Here> | An example of shareholder expenses. |
Investment Changes | <Click Here> | A summary of major shifts in the fund's investments over the past six months. |
Investments | <Click Here> | A complete list of the fund's investments with their market values. |
Financial Statements | <Click Here> | Statements of assets and liabilities, operations, and changes in net assets, as well as financial highlights. |
Notes | <Click Here> | Notes to the financial statements. |
Report of Independent Registered Public Accounting Firm | <Click Here> | |
Trustees and Officers | <Click Here> | |
Distributions | <Click Here> | |
Board Approval of Investment Advisory Contracts and Management Fees | <Click Here> | |
To view a fund's proxy voting guidelines and proxy voting record for the 12-month period ended June 30, visit http://www.fidelity.com/proxyvotingresults or visit the Securities and Exchange Commission's (SEC) web site at http://www.sec.gov. You may also call 1-877-208-0098 to request a free copy of the proxy voting guidelines.
Fidelity Variable Insurance Products are separate account options which are purchased through a variable insurance contract.
Standard & Poor's, S&P and S&P 500 are registered service marks of The McGraw-Hill Companies, Inc. and have been licensed for use by Fidelity Distributors Corporation.
Other third party marks appearing herein are the property of their respective owners.
All other marks appearing herein are registered or unregistered trademarks or service marks of FMR LLC or an affiliated company.
This report and the financial statements contained herein are submitted for the general information of the shareholders of the fund. This report is not authorized for distribution to prospective investors in the fund unless preceded or accompanied by an effective prospectus.
A fund files its complete schedule of portfolio holdings with the SEC for the first and third quarters of each fiscal year on Form N-Q. Forms N-Q are available on the SEC's web site at http://www.sec.gov. A fund's Forms N-Q may be reviewed and copied at the SEC's Public Reference Room in Washington, DC. Information regarding the operation of the SEC's Public Reference Room may be obtained by calling 1-800-SEC-0330. For a complete list of a fund's portfolio holdings, view the most recent holdings listing, semiannual report, or annual report on Fidelity's web site at http://www.fidelity.com or http://www.advisor.fidelity.com, as applicable.
NOT FDIC INSURED · MAY LOSE VALUE · NO BANK GUARANTEE
Neither the fund nor Fidelity Distributors Corporation is a bank.
Annual Report
Average annual total return reflects the change in the value of an investment, assuming reinvestment of the class' dividend income and capital gains (the profits earned upon the sale of securities that have grown in value, if any) and assuming a constant rate of performance each year. During periods of reimbursement by Fidelity, a fund's total return will be greater than it would be had the reimbursement not occurred. Performance numbers are net of all underlying fund operating expenses, but do not include any insurance charges imposed by your insurance company's separate account. If performance information included the effect of these additional charges, the total returns would have been lower. How a fund did yesterday is no guarantee of how it will do tomorrow.
Average Annual Total Returns
Periods ended December 31, 2009 | Past 1
year | Life of
fund A |
VIP Emerging Markets - Initial Class R | 75.40% | -6.97% |
VIP Emerging Markets - Service Class 2 R B | 75.41% | -7.17% |
VIP Emerging Markets - Investor Class R | 75.56% | -7.03% |
A From January 23, 2008.
B Performance of Service Class 2 R shares reflects an asset-based service fee (12b-1 fee).
$10,000 Over Life of Fund
Let's say hypothetically that $10,000 was invested in VIP Emerging Markets Portfolio - Initial Class R on January 23, 2008, when the fund started. The chart shows how the value of your investment would have changed, and also shows how the MSCI® Emerging Markets Index performed over the same period.
Annual Report
Market Recap: In 2009, most global markets saw both crippling lows and considerable highs. After a dismal start, the economy began to show signs of improvement, suggesting that a recovery was on the horizon. Credit markets began to heal as fiscal and monetary stimulus efforts around the world started to take effect, and corporate earnings staged an impressive rebound, fueled in large part by massive cost cutting. As a result, the flight to quality that marked most of 2008 and early 2009 shifted in March as investors flocked to riskier asset categories. The U.S. equity market, as measured by the bellwether Standard & Poor's 500SM Index and the blue-chip proxy Dow Jones Industrial AverageSM, reflected this changing environment, gaining 26.46% and 22.68%, respectively. Meanwhile, the technology-laden Nasdaq Composite® Index rose 45.32%. Foreign stocks also produced strong gains, as illustrated by the 31.93% jump of the MSCI® EAFE® Index (Europe, Australasia, Far East), a gauge of developed stock markets outside the U.S. and Canada. Emerging-markets stocks, which suffered their worst calendar-year performance ever in 2008, posted record returns this past year, with the MSCI Emerging Markets Index soaring 79.02%. A depreciating U.S. dollar helped bolster returns for U.S. investors in foreign equities.
Comments from Robert von Rekowsky, Portfolio Manager of VIP Emerging Markets Portfolio: During the past year, the fund modestly lagged the MSCI Emerging Markets Index. (For specific portfolio results, please refer to the performance section of this report.) Versus that benchmark, the fund's gains were dampened by its cash position. Beyond that, unrewarding stock selection and an underweighting in information technology hurt, as did weak picks in financials, industrials and utilities. From a country standpoint, stock selection in South Korea, India and Taiwan worked against us. Mexican bank Grupo Financiero Banorte performed poorly early in the period and was the fund's largest relative detractor. A small out-of-index position in IT services provider Rolta India also detracted, and I sold the stock. Meanwhile, CEZ, an electric utility based in the Czech Republic, performed well but lagged the huge gain of the broader market. Modestly underweighting major index component Samsung Electronics worked against us, as the Korean electronics giant's stock price rallied in response to prospects for improving demand for cellular handsets and DRAM computer memory, among other products. In the case of China's Ping An Insurance, our position delivered solid results, but underweighting the stock early in the period hurt performance. Another detractor, Korean steel maker POSCO, was sold around the middle of the period, which, in retrospect, was too early. Positive sector influences included stock selection and an overweighting in consumer discretionary, as well as solid picks in telecommunication services and energy. Geographically, favorable stock picks and overweightings in Indonesia and Turkey were beneficial. CNPC is a Hong Kong-based crude oil and natural gas exploration/production company with properties in China, Kazakhstan and Thailand, among other locations. An attractive valuation to start the period and rising oil prices aided the stock. Also contributing were Astra International, a conglomerate that's a good proxy for the Indonesian economy, and two Turkish stocks: Turk Hava Yollari, also known as Turkish Airlines, and Turkiye Garanti Bankasi, a bank. Hungary's OTP Bank and China's Geely Automobile Holdings also added value.
The views expressed above reflect those of the portfolio manager(s) only through the end of the period as stated on the cover of this report and do not necessarily represent the views of Fidelity or any other person in the Fidelity organization. Any such views are subject to change at any time based upon market or other conditions and Fidelity disclaims any responsibility to update such views. These views may not be relied on as investment advice and, because investment decisions for a Fidelity fund are based on numerous factors, may not be relied on as an indication of trading intent on behalf of any Fidelity fund.
Annual Report
As a shareholder of the Fund, you incur two types of costs: (1) transaction costs, including redemption fees, and (2) ongoing costs, including management fees, distribution and/or service (12b-1) fees and other Fund expenses. This Example is intended to help you understand your ongoing costs (in dollars) of investing in the Fund and to compare these costs with the ongoing costs of investing in other mutual funds.
The Example is based on an investment of $1,000 invested at the beginning of the period and held for the entire period (July 1, 2009 to December 31, 2009).
Actual Expenses
The first line of the accompanying table for each class of the Fund provides information about actual account values and actual expenses. You may use the information in this line, together with the amount you invested, to estimate the expenses that you paid over the period. Simply divide your account value by $1,000.00 (for example, an $8,600 account value divided by $1,000.00 = 8.6), then multiply the result by the number in the first line for a class of the Fund under the heading entitled "Expenses Paid During Period" to estimate the expenses you paid on your account during this period. The estimate of expenses does not include any fees or other expenses of any variable annuity or variable life insurance product. If they were, the estimate of expenses you paid during the period would be higher, and your ending account value would be lower. In addition, the Fund, as a shareholder in the underlying Fidelity Central Funds, will indirectly bear its pro-rata share of the fees and expenses incurred by the underlying Fidelity Central Funds. These fees and expenses are not included in the Fund's annualized expense ratio used to calculate the expense estimate in the table below.
Hypothetical Example for Comparison Purposes
The second line of the accompanying table for each class of the Fund provides information about hypothetical account values and hypothetical expenses based on a Class' actual expense ratio and an assumed rate of return of 5% per year before expenses, which is not the Class' actual return. The hypothetical account values and expenses may not be used to estimate the actual ending account balance or expenses you paid for the period. You may use this information to compare the ongoing costs of investing in the Fund and other funds. To do so, compare this 5% hypothetical example with the 5% hypothetical examples that appear in the shareholder reports of the other funds. The estimate of expenses does not include any fees or other expenses of any variable annuity or variable life insurance product. If they were, the estimate of expenses you paid during the period would be higher, and your ending account value would be lower. In addition, the Fund, as a shareholder in the underlying Fidelity Central Funds, will indirectly bear its pro-rata share of the fees and expenses incurred by the underlying Fidelity Central Funds. These fees and expenses are not included in the Fund's annualized expense ratio used to calculate the expense estimate in the table below.
Please note that the expenses shown in the table are meant to highlight your ongoing costs only and do not reflect any transaction costs. Therefore, the second line of the table is useful in comparing ongoing costs only, and will not help you determine the relative total costs of owning different funds. In addition, if these transactional costs were included, your costs would have been higher.
|
Annualized
Expense Ratio
|
Beginning
Account Value
July 1, 2009
|
Ending
Account Value
December 31, 2009
| Expenses Paid
During Period*
July 1, 2009 to
December 31, 2009 |
Initial Class | 1.10% | | | |
Actual | | $ 1,000.00 | $ 1,329.10 | $ 6.46 |
Hypothetical A | | $ 1,000.00 | $ 1,019.66 | $ 5.60 |
Service Class | 1.20% | | | |
Actual | | $ 1,000.00 | $ 1,329.80 | $ 7.05 |
Hypothetical A | | $ 1,000.00 | $ 1,019.16 | $ 6.11 |
Service Class 2 | 1.35% | | | |
Actual | | $ 1,000.00 | $ 1,327.10 | $ 7.92 |
Hypothetical A | | $ 1,000.00 | $ 1,018.40 | $ 6.87 |
Initial Class R | 1.10% | | | |
Actual | | $ 1,000.00 | $ 1,329.10 | $ 6.46 |
Hypothetical A | | $ 1,000.00 | $ 1,019.66 | $ 5.60 |
Service Class 2R | 1.35% | | | |
Actual | | $ 1,000.00 | $ 1,327.10 | $ 7.92 |
Hypothetical A | | $ 1,000.00 | $ 1,018.40 | $ 6.87 |
Investor Class R | 1.18% | | | |
Actual | | $ 1,000.00 | $ 1,329.70 | $ 6.93 |
Hypothetical A | | $ 1,000.00 | $ 1,019.26 | $ 6.01 |
A 5% return per year before expenses
* Expenses are equal to each Class' annualized expense ratio, multiplied by the average account value over the period, multiplied by 184/365 (to reflect the one-half year period).
Annual Report
Investment Changes (Unaudited)
Geographic Diversification (% of fund's net assets) |
As of December 31, 2009 |
| Brazil | 15.5% | |
| Korea (South) | 10.0% | |
| China | 9.3% | |
| Russia | 9.2% | |
| Taiwan | 7.9% | |
| India | 7.2% | |
| United States of America | 6.4% | |
| South Africa | 5.3% | |
| Hong Kong | 5.0% | |
| Other | 24.2% | |

Percentages are adjusted for the effect of futures contracts, if applicable. |
As of June 30, 2009 |
| Brazil | 12.2% | |
| United States of America | 10.9% | |
| China | 9.9% | |
| Korea (South) | 8.8% | |
| India | 8.1% | |
| Russia | 7.3% | |
| Taiwan | 7.1% | |
| Hong Kong | 6.0% | |
| South Africa | 5.7% | |
| Other | 24.0% | |
Percentages are adjusted for the effect of futures contracts, if applicable. |
Asset Allocation |
| % of fund's
net assets | % of fund's net assets
6 months ago |
Stocks and Investment Companies | 94.4 | 91.9 |
Short-Term Investments and Net Other Assets | 5.6 | 8.1 |
Top Ten Stocks as of December 31, 2009 |
| % of fund's
net assets | % of fund's net assets
6 months ago |
Petroleo Brasileiro SA - Petrobras (PN) (Brazil, Oil, Gas & Consumable Fuels) | 3.8 | 3.3 |
Vale SA (PN-A) sponsored ADR (Brazil, Metals & Mining) | 3.2 | 2.1 |
Samsung Electronics Co. Ltd. (Korea (South), Semiconductors & Semiconductor Equipment) | 3.1 | 1.7 |
OAO Gazprom (Russia, Oil, Gas & Consumable Fuels) | 2.2 | 2.4 |
Itau Unibanco Banco Multiplo SA ADR (Brazil, Commercial Banks) | 2.1 | 0.0 |
America Movil SAB de CV Series L sponsored ADR (Mexico, Wireless Telecommunication Services) | 1.7 | 1.8 |
Hon Hai Precision Industry Co. Ltd. (Foxconn) (Taiwan, Electronic Equipment & Components) | 1.6 | 1.3 |
Industrial & Commercial Bank of China Ltd. (H Shares) (China, Commercial Banks) | 1.6 | 1.9 |
China Construction Bank Corp. (H Shares) (China, Commercial Banks) | 1.5 | 1.8 |
Reliance Industries Ltd. (India, Oil, Gas & Consumable Fuels) | 1.2 | 1.2 |
| 22.0 | |
Market Sectors as of December 31, 2009 |
| % of fund's
net assets | % of fund's net assets
6 months ago |
Financials | 24.1 | 23.0 |
Energy | 14.7 | 15.3 |
Materials | 14.2 | 12.5 |
Information Technology | 14.2 | 10.4 |
Telecommunication Services | 8.2 | 8.9 |
Consumer Discretionary | 7.3 | 7.7 |
Industrials | 3.8 | 5.7 |
Consumer Staples | 3.7 | 2.7 |
Utilities | 2.3 | 2.4 |
Health Care | 1.9 | 1.7 |
Annual Report
Investments December 31, 2009
Showing Percentage of Net Assets
Common Stocks - 94.4% |
| Shares | | Value |
Argentina - 0.2% |
Banco Macro SA sponsored ADR | 3,600 | | $ 107,136 |
BAILIWICK OF JERSEY - 0.4% |
Randgold Resources Ltd. sponsored ADR | 3,400 | | 269,008 |
Bermuda - 0.6% |
Aquarius Platinum Ltd.: | | | |
(Australia) (a) | 59,369 | | 391,962 |
(United Kingdom) (a) | 1,666 | | 10,959 |
TOTAL BERMUDA | | 402,921 |
Brazil - 15.5% |
Anhanguera Educacional Participacoes SA unit (a) | 4,337 | | 60,837 |
Banco Bradesco SA (PN) sponsored ADR | 9,900 | | 216,513 |
BM&F BOVESPA SA | 42,400 | | 299,938 |
Centrais Eletricas Brasileiras SA (Electrobras): | | | |
(PN-B) sponsored ADR | 13,300 | | 248,710 |
sponsored ADR | 6,400 | | 134,976 |
Companhia Energetica de Minas Gerais (CEMIG) (PN) sponsored ADR (non-vtg.) | 75 | | 1,355 |
Companhia Siderurgica Nacional SA (CSN) sponsored ADR | 18,000 | | 574,740 |
Fibria Celulose SA sponsored ADR (a) | 12,513 | | 285,797 |
Gerdau SA sponsored ADR | 33,900 | | 577,317 |
Itau Unibanco Banco Multiplo SA ADR | 65,170 | | 1,488,483 |
Localiza Rent A Car SA | 7,500 | | 82,186 |
Net Servicos de Comunicacao SA sponsored ADR | 25,400 | | 343,662 |
OGX Petroleo e Gas Participacoes SA | 40,000 | | 388,985 |
PDG Realty S.A. Empreendimentos e Participacoes | 26,500 | | 263,936 |
Petroleo Brasileiro SA - Petrobras: | | | |
(PN) (non-vtg.) | 46,100 | | 966,434 |
(PN) sponsored ADR (non-vtg.) | 42,000 | | 1,780,380 |
sponsored ADR | 7,500 | | 357,600 |
Tele Norte Leste Participacoes SA sponsored ADR (non-vtg.) | 20,500 | | 439,110 |
Vale SA (PN-A) sponsored ADR | 92,179 | | 2,287,883 |
Vivo Participacoes SA sponsored ADR | 12,300 | | 381,300 |
TOTAL BRAZIL | | 11,180,142 |
Canada - 1.1% |
Eldorado Gold Corp. (a) | 5,300 | | 75,264 |
Eldorado Gold Corp. unit (a) | 7,594 | | 106,208 |
First Quantum Minerals Ltd. | 3,900 | | 297,924 |
Niko Resources Ltd. | 700 | | 65,559 |
Sherritt International Corp. | 7,700 | | 48,150 |
Sino-Forest Corp. (a) | 7,200 | | 132,809 |
Uranium One, Inc. (a) | 18,100 | | 52,027 |
TOTAL CANADA | | 777,941 |
|
| Shares | | Value |
Cayman Islands - 1.8% |
BaWang International (Group) Holding Ltd. | 108,000 | | $ 74,784 |
China Shanshui Cement Group Ltd. | 108,000 | | 78,396 |
Daphne International Holdings Ltd. | 158,000 | | 126,882 |
Eurasia Drilling Co. Ltd. GDR (Reg. S) | 7,100 | | 120,700 |
Geely Automobile Holdings Ltd. | 695,000 | | 379,311 |
Hidili Industry International Development Ltd. (a) | 163,000 | | 202,777 |
Integra Group Holdings unit (a) | 31,600 | | 94,800 |
Mindray Medical International Ltd. sponsored ADR | 4,957 | | 168,141 |
PCD Stores Group Ltd. | 210,000 | | 80,626 |
TOTAL CAYMAN ISLANDS | | 1,326,417 |
China - 9.3% |
Baidu.com, Inc. sponsored ADR (a) | 600 | | 246,738 |
China Citic Bank Corp. Ltd. Class H | 182,000 | | 154,051 |
China Construction Bank Corp. (H Shares) | 1,286,000 | | 1,098,389 |
China Mengniu Dairy Co. Ltd. (a) | 83,000 | | 295,038 |
China Merchants Bank Co. Ltd. (H Shares) | 190,050 | | 494,472 |
China Shenhua Energy Co. Ltd. (H Shares) | 130,500 | | 633,463 |
China Yurun Food Group Ltd. | 77,000 | | 228,489 |
Golden Eagle Retail Group Ltd. (H Shares) | 139,000 | | 281,937 |
Industrial & Commercial Bank of China Ltd. (H Shares) | 1,364,000 | | 1,123,297 |
Maanshan Iron & Steel Co. Ltd. (H Shares) (a) | 122,000 | | 88,386 |
Minth Group Ltd. | 89,000 | | 130,645 |
PICC Property & Casualty Co. Ltd. (H Shares) (a) | 178,000 | | 159,276 |
Ping An Insurance (Group) Co. of China, Ltd. (H Shares) | 68,500 | | 595,596 |
Sina Corp. (a) | 1,600 | | 72,288 |
Tencent Holdings Ltd. | 35,800 | | 774,242 |
Yantai Changyu Pioneer Wine Co. (B Shares) | 11,400 | | 101,404 |
ZTE Corp. (H Shares) | 32,600 | | 200,423 |
TOTAL CHINA | | 6,678,134 |
Cyprus - 0.1% |
Bank of Cyprus Public Co. Ltd. | 10,000 | | 70,580 |
XXI Century Investments Public Ltd. (a) | 600 | | 145 |
TOTAL CYPRUS | | 70,725 |
Czech Republic - 1.1% |
Ceske Energeticke Zavody AS | 8,400 | | 393,750 |
Komercni Banka AS | 1,800 | | 383,691 |
TOTAL CZECH REPUBLIC | | 777,441 |
Common Stocks - continued |
| Shares | | Value |
Egypt - 0.4% |
Commercial International Bank Ltd. sponsored GDR | 30,149 | | $ 301,490 |
Hong Kong - 5.0% |
China Agri-Industries Holding Ltd. | 217,000 | | 283,501 |
China Mobile (Hong Kong) Ltd. | 86,000 | | 800,157 |
China Overseas Land & Investment Ltd. | 154,000 | | 322,662 |
CNOOC Ltd. | 514,000 | | 800,751 |
CNPC (Hong Kong) Ltd. | 330,000 | | 435,170 |
Hong Kong Exchange & Clearing Ltd. | 11,600 | | 206,384 |
Shanghai Industrial Holdings Ltd. | 73,000 | | 370,259 |
Sino-Ocean Land Holdings Ltd. | 275,500 | | 252,949 |
Texwinca Holdings Ltd. | 110,000 | | 102,235 |
TOTAL HONG KONG | | 3,574,068 |
Hungary - 0.6% |
OTP Bank Ltd. (a) | 15,500 | | 447,462 |
India - 7.2% |
Bank of Baroda | 11,392 | | 126,156 |
Bharat Heavy Electricals Ltd. | 7,742 | | 400,912 |
DLF Ltd. | 12,596 | | 98,032 |
Housing Development and Infrastructure Ltd. (a) | 18,016 | | 140,079 |
Housing Development Finance Corp. Ltd. | 10,070 | | 580,593 |
Indiabulls Real Estate Ltd. (a) | 21,565 | | 105,804 |
Infosys Technologies Ltd. sponsored ADR | 15,670 | | 866,081 |
Jain Irrigation Systems Ltd. | 6,816 | | 128,118 |
JSW Steel Ltd. | 17,657 | | 385,479 |
Mahindra & Mahindra Ltd. | 15,000 | | 349,337 |
Patni Computer Systems Ltd. sponsored ADR | 3,400 | | 69,530 |
Power Finance Corp. Ltd. | 2,989 | | 16,838 |
Reliance Industries Ltd. | 37,096 | | 871,688 |
Rural Electrification Corp. Ltd. (a) | 18,356 | | 96,032 |
Tata Consultancy Services Ltd. | 26,011 | | 420,486 |
Tata Power Co. Ltd. | 7,388 | | 219,913 |
Tata Steel Ltd. | 21,219 | | 282,417 |
Ultratech Cement Ltd. | 1,378 | | 27,144 |
TOTAL INDIA | | 5,184,639 |
Indonesia - 4.3% |
Delta Dunia Petroindo Tbk PT (a) | 670,500 | | 120,228 |
Gudang Garam PT Perusahaan | 53,000 | | 121,183 |
PT Astra International Tbk | 115,000 | | 423,396 |
PT Bank Mandiri Persero Tbk | 642,000 | | 320,149 |
PT Bank Rakyat Indonesia Tbk | 475,000 | | 385,545 |
PT Bumi Resources Tbk | 692,500 | | 178,177 |
PT Indocement Tunggal Prakarsa Tbk | 221,000 | | 321,242 |
PT Indofood Sukses Makmur Tbk | 725,500 | | 273,266 |
PT Perusahaan Gas Negara Tbk Series B | 977,300 | | 404,401 |
PT Telkomunikasi Indonesia Tbk Series B | 516,000 | | 517,370 |
TOTAL INDONESIA | | 3,064,957 |
|
| Shares | | Value |
Ireland - 0.1% |
Dragon Oil PLC (a) | 14,809 | | $ 92,982 |
Israel - 1.9% |
Check Point Software Technologies Ltd. (a) | 6,000 | | 203,280 |
Israel Chemicals Ltd. | 15,203 | | 200,435 |
Partner Communications Co. Ltd. ADR | 8,931 | | 181,746 |
Teva Pharmaceutical Industries Ltd. sponsored ADR | 14,500 | | 814,610 |
TOTAL ISRAEL | | 1,400,071 |
Kazakhstan - 0.7% |
JSC Halyk Bank of Kazakhstan unit (a) | 30,566 | | 290,377 |
KazMunaiGas Exploration & Production JSC (Reg. S) GDR | 8,000 | | 199,200 |
TOTAL KAZAKHSTAN | | 489,577 |
Korea (South) - 10.0% |
Hynix Semiconductor, Inc. (a) | 23,370 | | 463,963 |
Hyundai Engineering & Construction Co. Ltd. | 5,833 | | 354,660 |
Hyundai Industrial Development & Construction Co. | 8,600 | | 278,413 |
Hyundai Mobis | 3,340 | | 489,797 |
Hyundai Motor Co. | 7,153 | | 742,245 |
Industrial Bank of Korea (a) | 26,060 | | 312,879 |
KB Financial Group, Inc. (a) | 13,130 | | 672,222 |
Korea Exchange Bank | 33,200 | | 412,838 |
Korean Air Lines Co. Ltd. (a) | 2,120 | | 99,812 |
LG Innotek Co. Ltd. | 2,050 | | 174,221 |
Lumens Co. Ltd. (a) | 17,855 | | 136,737 |
Samsung Electronics Co. Ltd. | 3,287 | | 2,252,268 |
Samsung SDI Co. Ltd. | 1,692 | | 215,477 |
Shinhan Financial Group Co. Ltd. (a) | 16,850 | | 622,663 |
TOTAL KOREA (SOUTH) | | 7,228,195 |
Luxembourg - 1.1% |
ArcelorMittal SA (NY Shares) Class A | 6,400 | | 292,800 |
Evraz Group SA GDR | 13,184 | | 372,448 |
Ternium SA sponsored ADR (a) | 4,000 | | 141,680 |
TOTAL LUXEMBOURG | | 806,928 |
Mexico - 3.4% |
America Movil SAB de CV Series L sponsored ADR | 25,600 | | 1,202,688 |
Banco Compartamos SA de CV | 17,600 | | 90,897 |
Corporacion Geo SA de CV Series B (a) | 69,500 | | 184,678 |
Fomento Economico Mexicano SAB de CV sponsored ADR | 9,400 | | 450,072 |
Grupo Financiero Banorte SAB de CV Series O | 83,100 | | 303,996 |
Telmex Internacional SAB de CV Series L ADR | 13,800 | | 244,950 |
TOTAL MEXICO | | 2,477,281 |
Common Stocks - continued |
| Shares | | Value |
Nigeria - 0.1% |
Guaranty Trust Bank PLC GDR (Reg. S) | 14,400 | | $ 86,400 |
Norway - 0.1% |
Det Norske Oljeselskap ASA (DNO) (A Shares) (a) | 56,000 | | 48,986 |
Panama - 0.2% |
Copa Holdings SA Class A | 2,600 | | 141,622 |
Papua New Guinea - 0.1% |
Oil Search Ltd. | 9,716 | | 53,499 |
Peru - 0.4% |
Compania de Minas Buenaventura SA sponsored ADR | 9,590 | | 320,977 |
Philippines - 0.6% |
Megaworld Corp. | 3,210,000 | | 102,168 |
Philippine Long Distance Telephone Co. sponsored ADR | 5,400 | | 306,018 |
TOTAL PHILIPPINES | | 408,186 |
Poland - 1.0% |
Bank Polska Kasa Opieki SA (a) | 7,100 | | 400,331 |
Bank Zachodni WBK SA (a) | 5,014 | | 332,192 |
TOTAL POLAND | | 732,523 |
Russia - 9.2% |
Cherkizovo Group OJSC GDR (a) | 3,000 | | 31,500 |
Magnit OJSC GDR (Reg. S) | 19,200 | | 304,320 |
Mechel Steel Group OAO sponsored ADR | 12,900 | | 242,778 |
Novorossiysk Commercial Sea Port JSC (a) | 86,500 | | 14,273 |
Novorossiysk Commercial Sea Port JSC GDR (Reg. S) | 700 | | 8,057 |
OAO Gazprom | 8,900 | | 54,317 |
OAO Gazprom sponsored ADR | 60,442 | | 1,514,072 |
OAO NOVATEK GDR | 6,622 | | 437,052 |
OAO Tatneft sponsored ADR | 13,503 | | 393,477 |
OGK-2 JSC (a) | 423,500 | | 13,171 |
OGK-6 JSC (a) | 261,400 | | 6,666 |
OJSC MMC Norilsk Nickel sponsored ADR (a) | 41,744 | | 599,026 |
OJSC Oil Company Rosneft GDR (Reg. S) | 74,500 | | 640,700 |
Polymetal JSC GDR (Reg. S) (a) | 20,800 | | 190,736 |
RusHydro JSC sponsored ADR (a) | 49,344 | | 188,988 |
Sberbank (Savings Bank of the Russian Federation) | 232,600 | | 653,373 |
Sberbank (Savings Bank of the Russian Federation) GDR | 1,350 | | 378,815 |
Sistema JSFC sponsored GDR (a) | 14,675 | | 308,175 |
Vimpel Communications sponsored ADR | 24,000 | | 446,160 |
VTB Bank JSC unit | 37,700 | | 177,944 |
TOTAL RUSSIA | | 6,603,600 |
Singapore - 0.3% |
Straits Asia Resources Ltd. | 124,000 | | 230,332 |
|
| Shares | | Value |
South Africa - 5.3% |
African Bank Investments Ltd. | 71,500 | | $ 287,544 |
AngloGold Ashanti Ltd. | 6,000 | | 248,008 |
Aspen Pharmacare Holdings Ltd. (a) | 32,464 | | 322,449 |
Aveng Ltd. | 53,500 | | 288,077 |
Clicks Group Ltd. | 69,561 | | 255,808 |
Illovo Sugar Ltd. | 17,116 | | 73,707 |
Mr. Price Group Ltd. | 48,000 | | 226,721 |
MTN Group Ltd. | 46,008 | | 732,030 |
Mvelaphanda Resources Ltd. (a) | 39,874 | | 263,674 |
Raubex Group Ltd. | 47,496 | | 153,769 |
Shoprite Holdings Ltd. | 26,988 | | 237,538 |
Standard Bank Group Ltd. | 38,800 | | 534,089 |
Steinhoff International Holdings Ltd. | 76,422 | | 214,208 |
TOTAL SOUTH AFRICA | | 3,837,622 |
Taiwan - 7.9% |
Advanced Semiconductor Engineering, Inc. sponsored ADR | 40,200 | | 178,086 |
Asia Cement Corp. | 253,200 | | 273,858 |
AU Optronics Corp. sponsored ADR | 30,900 | | 370,491 |
Cathay Financial Holding Co. Ltd. (a) | 171,000 | | 319,122 |
Epistar Corp. | 27,000 | | 101,282 |
First Financial Holding Co. Ltd. | 564,657 | | 350,373 |
Formosa Epitaxy, Inc. | 114,000 | | 190,653 |
Fubon Financial Holding Co. Ltd. (a) | 265,000 | | 325,555 |
Hon Hai Precision Industry Co. Ltd. (Foxconn) | 239,232 | | 1,132,968 |
Macronix International Co. Ltd. | 400,506 | | 229,111 |
MediaTek, Inc. | 39,032 | | 680,833 |
Siliconware Precision Industries Co. Ltd. | 208,560 | | 282,622 |
Taiwan Mobile Co. Ltd. | 167,000 | | 325,752 |
Taiwan Semiconductor Manufacturing Co. Ltd. | 244,609 | | 493,194 |
Taiwan Semiconductor Manufacturing Co. Ltd. sponsored ADR | 36,064 | | 412,572 |
TOTAL TAIWAN | | 5,666,472 |
Thailand - 0.7% |
Advanced Info Service PCL (For. Reg.) | 65,000 | | 168,087 |
Siam Commercial Bank PCL (For. Reg.) | 125,200 | | 324,697 |
Total Access Communication PCL (For. Reg.) | 400 | | 428 |
TOTAL THAILAND | | 493,212 |
Turkey - 2.2% |
Hurriyet Gazetecilik ve Matbaacilik AS (a) | 85,656 | | 107,056 |
Koc Holding AS | 16,000 | | 47,266 |
Tofas Turk Otomobil Fabrikasi AS | 84,924 | | 267,906 |
Turk Hava Yollari AO | 89,000 | | 339,059 |
Turkiye Garanti Bankasi AS | 106,000 | | 449,873 |
Turkiye Is Bankasi AS Series C | 88,929 | | 374,450 |
TOTAL TURKEY | | 1,585,610 |
Common Stocks - continued |
| Shares | | Value |
United Kingdom - 0.7% |
Hikma Pharmaceuticals PLC | 10,646 | | $ 87,748 |
Tullow Oil PLC | 2,458 | | 51,841 |
Xstrata PLC (a) | 21,851 | | 395,875 |
TOTAL UNITED KINGDOM | | 535,464 |
United States of America - 0.8% |
Central European Distribution Corp. (a) | 7,300 | | 207,393 |
Freeport-McMoRan Copper & Gold, Inc. | 4,800 | | 385,392 |
TOTAL UNITED STATES OF AMERICA | | 592,785 |
TOTAL COMMON STOCKS (Cost $56,170,306) | 67,994,805 |
Money Market Funds - 5.7% |
| Shares | | Value |
Fidelity Cash Central Fund, 0.16% (b)
(Cost $4,086,573) | 4,086,573 | | $ 4,086,573 |
TOTAL INVESTMENT PORTFOLIO - 100.1% (Cost $60,256,879) | 72,081,378 |
NET OTHER ASSETS - (0.1)% | | (94,894) |
NET ASSETS - 100% | $ 71,986,484 |
Legend |
(a) Non-income producing |
(b) Affiliated fund that is available only to investment companies and other accounts managed by Fidelity Investments. The rate quoted is the annualized seven-day yield of the fund at period end. A complete unaudited listing of the fund's holdings as of its most recent quarter end is available upon request. |
Affiliated Central Funds |
Information regarding fiscal year to date income earned by the Fund from investments in Fidelity Central Funds is as follows: |
Fund | Income earned |
Fidelity Cash Central Fund | $ 6,019 |
Other Information |
The following is a summary of the inputs used, as of December 31, 2009, involving the Fund's assets and liabilities carried at value. The inputs or methodology used for valuing securities may not be an indication of the risk associated with investing in those securities. For more information on valuation inputs, and their aggregation into the levels used in the table below, please refer to the Security Valuation section in the accompanying Notes to Financial Statements. |
Valuation Inputs at Reporting Date: |
Description | Total | Level 1 | Level 2 | Level 3 |
Investments in Securities: | | | | |
Equities: | | | | |
Brazil | $ 11,180,142 | $ 11,180,142 | $ - | $ - |
Korea (South) | 7,228,195 | 6,605,532 | 622,663 | - |
China | 6,678,134 | 420,430 | 6,257,704 | - |
Russia | 6,603,600 | 6,603,600 | - | - |
Taiwan | 5,666,472 | 5,666,472 | - | - |
India | 5,184,639 | 5,184,639 | - | - |
South Africa | 3,837,622 | 3,837,622 | - | - |
Hong Kong | 3,574,068 | - | 3,574,068 | - |
Indonesia | 3,064,957 | 3,064,957 | - | - |
Other | 14,976,976 | 14,034,200 | 942,776 | - |
Money Market Funds | 4,086,573 | 4,086,573 | - | - |
Total Investments in Securities: | $ 72,081,378 | $ 60,684,167 | $ 11,397,211 | $ - |
Income Tax Information |
At December 31, 2009, the fund had a capital loss carryforward of approximately $4,615,107 of which $1,790,850 and $2,824,257 will expire on December 31, 2016 and 2017, respectively. |
See accompanying notes which are an integral part of the financial statements.
Annual Report
Statement of Assets and Liabilities
| December 31, 2009 |
| | |
Assets | | |
Investment in securities, at value - See accompanying schedule: Unaffiliated issuers (cost $56,170,306) | $ 67,994,805 | |
Fidelity Central Funds (cost $4,086,573) | 4,086,573 | |
Total Investments (cost $60,256,879) | | $ 72,081,378 |
Cash | | 14,570 |
Foreign currency held at value (cost $11,026) | | 11,024 |
Receivable for investments sold | | 153,440 |
Receivable for fund shares sold | | 141,014 |
Dividends receivable | | 57,976 |
Distributions receivable from Fidelity Central Funds | | 424 |
Prepaid expenses | | 188 |
Receivable from investment adviser for expense reductions | | 16,691 |
Other receivables | | 9,423 |
Total assets | | 72,486,128 |
| | |
Liabilities | | |
Payable for investments purchased | $ 268,099 | |
Accrued management fee | 45,808 | |
Distribution fees payable | 60 | |
Other affiliated payables | 9,289 | |
Other payables and accrued expenses | 176,388 | |
Total liabilities | | 499,644 |
| | |
Net Assets | | $ 71,986,484 |
Net Assets consist of: | | |
Paid in capital | | $ 65,695,206 |
Accumulated undistributed net realized gain (loss) on investments and foreign currency transactions | | (5,436,095) |
Net unrealized appreciation (depreciation) on investments and assets and liabilities in foreign currencies | | 11,727,373 |
Net Assets | | $ 71,986,484 |
Statement of Assets and Liabilities - continued
| December 31, 2009 |
| | |
Initial Class:
Net Asset Value, offering price and redemption price per share ($250,351 ÷ 29,409.4 shares) | | $ 8.51 |
| | |
Service Class:
Net Asset Value, offering price and redemption price per share ($117,551 ÷ 13,772.1 shares) | | $ 8.54 |
| | |
Service Class 2:
Net Asset Value, offering price and redemption price per share ($117,439 ÷ 13,727.5 shares) | | $ 8.56 |
| | |
Initial Class R:
Net Asset Value, offering price and redemption price per share ($31,314,149 ÷ 3,678,469.9 shares) | | $ 8.51 |
| | |
Service Class 2R:
Net Asset Value, offering price and redemption price per share ($117,439 ÷ 13,727.5 shares) | | $ 8.56 |
| | |
Investor Class R:
Net Asset Value, offering price and redemption price per share ($40,069,555 ÷ 4,714,242.0 shares) | | $ 8.50 |
See accompanying notes which are an integral part of the financial statements.
Annual Report
Financial Statements - continued
Statement of Operations
| Year ended December 31, 2009 |
| | |
Investment Income | | |
Dividends | | $ 552,011 |
Interest | | 9 |
Income from Fidelity Central Funds | | 6,019 |
| | 558,039 |
Less foreign taxes withheld | | (55,709) |
Total income | | 502,330 |
| | |
Expenses | | |
Management fee | $ 250,829 | |
Transfer agent fees | 41,743 | |
Distribution fees | 2,093 | |
Accounting fees and expenses | 16,032 | |
Custodian fees and expenses | 245,770 | |
Independent trustees' compensation | 163 | |
Audit | 93,877 | |
Legal | 110 | |
Miscellaneous | 1,753 | |
Total expenses before reductions | 652,370 | |
Expense reductions | (320,749) | 331,621 |
Net investment income (loss) | | 170,709 |
Realized and Unrealized Gain (Loss) Net realized gain (loss) on: | | |
Investment securities: | | |
Unaffiliated issuers | (1,720,774) | |
Foreign currency transactions | (55,463) | |
Total net realized gain (loss) | | (1,776,237) |
Change in net unrealized appreciation (depreciation) on: Investment securities (net of increase in deferred foreign taxes of $97,033) | 16,723,971 | |
Assets and liabilities in foreign currencies | (167) | |
Total change in net unrealized appreciation (depreciation) | | 16,723,804 |
Net gain (loss) | | 14,947,567 |
Net increase (decrease) in net assets resulting from operations | | $ 15,118,276 |
Statement of Changes in Net Assets
| Year ended
December 31,
2009 | For the period
January 23, 2008
(commencement of operations) to
December 31,
2008 |
Increase (Decrease) in Net Assets | | |
Operations | | |
Net investment income (loss) | $ 170,709 | $ 120,318 |
Net realized gain (loss) | (1,776,237) | (3,448,972) |
Change in net unrealized appreciation (depreciation) | 16,723,804 | (4,996,431) |
Net increase (decrease) in net assets resulting from operations | 15,118,276 | (8,325,085) |
Distributions to shareholders from net investment income | (171,137) | (118,460) |
Distributions to shareholders from net realized gain | (219,436) | - |
Total distributions | (390,573) | (118,460) |
Share transactions - net increase (decrease) | 48,999,079 | 16,664,085 |
Redemption fees | 22,594 | 16,568 |
Total increase (decrease) in net assets | 63,749,376 | 8,237,108 |
| | |
Net Assets | | |
Beginning of period | 8,237,108 | - |
End of period | $ 71,986,484 | $ 8,237,108 |
See accompanying notes which are an integral part of the financial statements.
Annual Report
Financial Highlights - Initial Class
Years ended December 31, | 2009 | 2008 H |
Selected Per-Share Data | | |
Net asset value, beginning of period | $ 4.88 | $ 10.00 |
Income from Investment Operations | | |
Net investment income (loss) E | .04 | .13 |
Net realized and unrealized gain (loss) | 3.64 | (5.19) |
Total from investment operations | 3.68 | (5.06) |
Distributions from net investment income | (.02) | (.08) |
Distributions from net realized gain | (.03) | - |
Total distributions | (.05) | (.08) |
Redemption fees added to paid in capital E | - J | .02 |
Net asset value, end of period | $ 8.51 | $ 4.88 |
Total Return B, C, D | 75.40% | (50.45)% |
Ratios to Average Net Assets F, I | | |
Expenses before reductions | 2.85% | 3.92% A |
Expenses net of fee waivers, if any | 1.10% | 1.10% A |
Expenses net of all reductions | 1.02% | 1.02% A |
Net investment income (loss) | .60% | 1.54% A |
Supplemental Data | | |
Net assets, end of period (000 omitted) | $ 250 | $ 516 |
Portfolio turnover rate G | 70% | 79% |
A Annualized
B Total returns for periods of less than one year are not annualized.
C Total returns do not reflect charges attributable to your insurance company's separate account. Inclusion of these charges would reduce the total returns shown.
D Total returns would have been lower had certain expenses not been reduced during the periods shown.
E Calculated based on average shares outstanding during the period.
F Fees and expenses of the underlying Fidelity Central Funds are not included in the Fund's expense ratio. The Fund indirectly bears its proportionate share of the expenses of any underlying Fidelity Central Funds.
G Amount does not include the portfolio activity of any underlying Fidelity Central Funds.
H For the period January 23, 2008 (commencement of operations) to December 31, 2008.
I Expense ratios reflect operating expenses of the class. Expenses before reductions do not reflect amounts reimbursed by the investment adviser or reductions from brokerage service arrangements or reductions from other expense offset arrangements and do not represent the amount paid by the class during periods when reimbursements or reductions occur. Expense ratios before reductions for start-up periods may not be representative of longer-term operating periods. Expenses net of fee waivers reflect expenses after reimbursement by the investment adviser but prior to reductions from brokerage service arrangements or other expense offset arrangements. Expenses net of all reductions represent the net expenses paid by the class.
J Amount represents less than $.01 per share.
Financial Highlights - Service Class
Years ended December 31, | 2009 | 2008 H |
Selected Per-Share Data | | |
Net asset value, beginning of period | $ 4.88 | $ 10.00 |
Income from Investment Operations | | |
Net investment income (loss) E | .03 | .12 |
Net realized and unrealized gain (loss) | 3.65 | (5.19) |
Total from investment operations | 3.68 | (5.07) |
Distributions from net investment income | - J | (.07) |
Distributions from net realized gain | (.02) | - |
Total distributions | (.02) | (.07) |
Redemption fees added to paid in capital E | - J | .02 |
Net asset value, end of period | $ 8.54 | $ 4.88 |
Total Return B, C, D | 75.49% | (50.53)% |
Ratios to Average Net Assets F, I | | |
Expenses before reductions | 3.02% | 4.02% A |
Expenses net of fee waivers, if any | 1.20% | 1.20% A |
Expenses net of all reductions | 1.12% | 1.12% A |
Net investment income (loss) | .50% | 1.44% A |
Supplemental Data | | |
Net assets, end of period (000 omitted) | $ 118 | $ 396 |
Portfolio turnover rate G | 70% | 79% |
A Annualized
B Total returns for periods of less than one year are not annualized.
C Total returns do not reflect charges attributable to your insurance company's separate account. Inclusion of these charges would reduce the total returns shown.
D Total returns would have been lower had certain expenses not been reduced during the periods shown.
E Calculated based on average shares outstanding during the period.
F Fees and expenses of the underlying Fidelity Central Funds are not included in the Fund's expense ratio. The Fund indirectly bears its proportionate share of the expenses of any underlying Fidelity Central Funds.
G Amount does not include the portfolio activity of any underlying Fidelity Central Funds.
H For the period January 23, 2008 (commencement of operations) to December 31, 2008.
I Expense ratios reflect operating expenses of the class. Expenses before reductions do not reflect amounts reimbursed by the investment adviser or reductions from brokerage service arrangements or reductions from other expense offset arrangements and do not represent the amount paid by the class during periods when reimbursements or reductions occur. Expense ratios before reductions for start-up periods may not be representative of longer-term operating periods. Expenses net of fee waivers reflect expenses after reimbursement by the investment adviser but prior to reductions from brokerage service arrangements or other expense offset arrangements. Expenses net of all reductions represent the net expenses paid by the class.
J Amount represents less than $.01 per share.
See accompanying notes which are an integral part of the financial statements.
Annual Report
Financial Highlights - Service Class 2
Years ended December 31, | 2009 | 2008 H |
Selected Per-Share Data | | |
Net asset value, beginning of period | $ 4.88 | $ 10.00 |
Income from Investment Operations | | |
Net investment income (loss) E | .02 | .11 |
Net realized and unrealized gain (loss) | 3.66 | (5.19) |
Total from investment operations | 3.68 | (5.08) |
Distributions from net investment income | - | (.06) |
Redemption fees added to paid in capital E | - J | .02 |
Net asset value, end of period | $ 8.56 | $ 4.88 |
Total Return B, C, D | 75.41% | (50.65)% |
Ratios to Average Net Assets F, I | | |
Expenses before reductions | 3.17% | 4.17% A |
Expenses net of fee waivers, if any | 1.35% | 1.35% A |
Expenses net of all reductions | 1.27% | 1.27% A |
Net investment income (loss) | .35% | 1.29% A |
Supplemental Data | | |
Net assets, end of period (000 omitted) | $ 117 | $ 395 |
Portfolio turnover rate G | 70% | 79% |
A Annualized
B Total returns for periods of less than one year are not annualized.
C Total returns do not reflect charges attributable to your insurance company's separate account. Inclusion of these charges would reduce the total returns shown.
D Total returns would have been lower had certain expenses not been reduced during the periods shown.
E Calculated based on average shares outstanding during the period.
F Fees and expenses of the underlying Fidelity Central Funds are not included in the Fund's expense ratio. The Fund indirectly bears its proportionate share of the expenses of any underlying Fidelity Central Funds.
G Amount does not include the portfolio activity of any underlying Fidelity Central Funds.
H For the period January 23, 2008 (commencement of operations) to December 31, 2008.
I Expense ratios reflect operating expenses of the class. Expenses before reductions do not reflect amounts reimbursed by the investment adviser or reductions from brokerage service arrangements or reductions from other expense offset arrangements and do not represent the amount paid by the class during periods when reimbursements or reductions occur. Expense ratios before reductions for start-up periods may not be representative of longer-term operating periods. Expenses net of fee waivers reflect expenses after reimbursement by the investment adviser but prior to reductions from brokerage service arrangements or other expense offset arrangements. Expenses net of all reductions represent the net expenses paid by the class.
J Amount represents less than $.01 per share.
Financial Highlights - Initial Class R
Years ended December 31, | 2009 | 2008 H |
Selected Per-Share Data | | |
Net asset value, beginning of period | $ 4.88 | $ 10.00 |
Income from Investment Operations | | |
Net investment income (loss) E | .04 | .11 |
Net realized and unrealized gain (loss) | 3.63 | (5.16) |
Total from investment operations | 3.67 | (5.05) |
Distributions from net investment income | (.02) | (.08) |
Distributions from net realized gain | (.03) | - |
Total distributions | (.05) | (.08) |
Redemption fees added to paid in capital E | .01 | .01 |
Net asset value, end of period | $ 8.51 | $ 4.88 |
Total Return B, C, D | 75.40% | (50.45)% |
Ratios to Average Net Assets F, I | | |
Expenses before reductions | 2.03% | 3.71% A |
Expenses net of fee waivers, if any | 1.10% | 1.10% A |
Expenses net of all reductions | 1.02% | 1.02% A |
Net investment income (loss) | .60% | 1.54% A |
Supplemental Data | | |
Net assets, end of period (000 omitted) | $ 31,314 | $ 3,158 |
Portfolio turnover rate G | 70% | 79% |
A Annualized
B Total returns for periods of less than one year are not annualized.
C Total returns do not reflect charges attributable to your insurance company's separate account. Inclusion of these charges would reduce the total returns shown.
D Total returns would have been lower had certain expenses not been reduced during the periods shown.
E Calculated based on average shares outstanding during the period.
F Fees and expenses of the underlying Fidelity Central Funds are not included in the Fund's expense ratio. The Fund indirectly bears its proportionate share of the expenses of any underlying Fidelity Central Funds.
G Amount does not include the portfolio activity of any underlying Fidelity Central Funds.
H For the period January 23, 2008 (commencement of operations) to December 31, 2008.
I Expense ratios reflect operating expenses of the class. Expenses before reductions do not reflect amounts reimbursed by the investment adviser or reductions from brokerage service arrangements or reductions from other expense offset arrangements and do not represent the amount paid by the class during periods when reimbursements or reductions occur. Expense ratios before reductions for start-up periods may not be representative of longer-term operating periods. Expenses net of fee waivers reflect expenses after reimbursement by the investment adviser but prior to reductions from brokerage service arrangements or other expense offset arrangements. Expenses net of all reductions represent the net expenses paid by the class.
See accompanying notes which are an integral part of the financial statements.
Annual Report
Financial Highlights - Service Class 2R
Years ended December 31, | 2009 | 2008 H |
Selected Per-Share Data | | |
Net asset value, beginning of period | $ 4.88 | $ 10.00 |
Income from Investment Operations | | |
Net investment income (loss) E | .02 | .11 |
Net realized and unrealized gain (loss) | 3.66 | (5.19) |
Total from investment operations | 3.68 | (5.08) |
Distributions from net investment income | - | (.06) |
Redemption fees added to paid in capital E | - J | .02 |
Net asset value, end of period | $ 8.56 | $ 4.88 |
Total Return B, C, D | 75.41% | (50.65)% |
Ratios to Average Net Assets F, I | | |
Expenses before reductions | 3.17% | 4.17% A |
Expenses net of fee waivers, if any | 1.35% | 1.35% A |
Expenses net of all reductions | 1.27% | 1.27% A |
Net investment income (loss) | .35% | 1.29% A |
Supplemental Data | | |
Net assets, end of period (000 omitted) | $ 117 | $ 395 |
Portfolio turnover rate G | 70% | 79% |
A Annualized
B Total returns for periods of less than one year are not annualized.
C Total returns do not reflect charges attributable to your insurance company's separate account. Inclusion of these charges would reduce the total returns shown.
D Total returns would have been lower had certain expenses not been reduced during the periods shown.
E Calculated based on average shares outstanding during the period.
F Fees and expenses of the underlying Fidelity Central Funds are not included in the Fund's expense ratio. The Fund indirectly bears its proportionate share of the expenses of any underlying Fidelity Central Funds.
G Amount does not include the portfolio activity of any underlying Fidelity Central Funds.
H For the period January 23, 2008 (commencement of operations) to December 31, 2008.
I Expense ratios reflect operating expenses of the class. Expenses before reductions do not reflect amounts reimbursed by the investment adviser or reductions from brokerage service arrangements or reductions from other expense offset arrangements and do not represent the amount paid by the class during periods when reimbursements or reductions occur. Expense ratios before reductions for start-up periods may not be representative of longer-term operating periods. Expenses net of fee waivers reflect expenses after reimbursement by the investment adviser but prior to reductions from brokerage service arrangements or other expense offset arrangements. Expenses net of all reductions represent the net expenses paid by the class.
J Amount represents less than $.01 per share.
Financial Highlights - Investor Class R
Years ended December 31, | 2009 | 2008 H |
Selected Per-Share Data | | |
Net asset value, beginning of period | $ 4.87 | $ 10.00 |
Income from Investment Operations | | |
Net investment income (loss) E | .04 | .10 |
Net realized and unrealized gain (loss) | 3.63 | (5.16) |
Total from investment operations | 3.67 | (5.06) |
Distributions from net investment income | (.02) | (.08) |
Distributions from net realized gain | (.03) | - |
Total distributions | (.05) | (.08) |
Redemption fees added to paid in capital E | .01 | .01 |
Net asset value, end of period | $ 8.50 | $ 4.87 |
Total Return B, C, D | 75.56% | (50.55)% |
Ratios to Average Net Assets F, I | | |
Expenses before reductions | 2.07% | 3.81% A |
Expenses net of fee waivers, if any | 1.18% | 1.18% A |
Expenses net of all reductions | 1.10% | 1.10% A |
Net investment income (loss) | .52% | 1.46% A |
Supplemental Data | | |
Net assets, end of period (000 omitted) | $ 40,070 | $ 3,377 |
Portfolio turnover rate G | 70% | 79% |
A Annualized
B Total returns for periods of less than one year are not annualized.
C Total returns do not reflect charges attributable to your insurance company's separate account. Inclusion of these charges would reduce the total returns shown.
D Total returns would have been lower had certain expenses not been reduced during the periods shown.
E Calculated based on average shares outstanding during the period.
F Fees and expenses of the underlying Fidelity Central Funds are not included in the Fund's expense ratio. The Fund indirectly bears its proportionate share of the expenses of any underlying Fidelity Central Funds.
G Amount does not include the portfolio activity of any underlying Fidelity Central Funds.
H For the period January 23, 2008 (commencement of operations) to December 31, 2008.
I Expense ratios reflect operating expenses of the class. Expenses before reductions do not reflect amounts reimbursed by the investment adviser or reductions from brokerage service arrangements or reductions from other expense offset arrangements and do not represent the amount paid by the class during periods when reimbursements or reductions occur. Expense ratios before reductions for start-up periods may not be representative of longer-term operating periods. Expenses net of fee waivers reflect expenses after reimbursement by the investment adviser but prior to reductions from brokerage service arrangements or other expense offset arrangements. Expenses net of all reductions represent the net expenses paid by the class.
See accompanying notes which are an integral part of the financial statements.
Annual Report
Notes to Financial Statements
For the period ended December 31, 2009
1. Organization.
VIP Emerging Markets Portfolio (the Fund) is a fund of Variable Insurance Products Fund IV (the trust) and is authorized to issue an unlimited number of shares. The trust is registered under the Investment Company Act of 1940, as amended (the 1940 Act), as an open-end management investment company organized as a Massachusetts business trust. Shares of the Fund may only be purchased by insurance companies for the purpose of funding variable annuity or variable life insurance contracts. The Fund offers the following classes of shares: Initial Class shares, Service Class shares, Service Class 2 shares, Initial Class R shares, Service Class 2R shares and Investor Class R shares. All classes have equal rights and voting privileges, except for matters affecting a single class. Investment income, realized and unrealized capital gains and losses, the common expenses of the Fund, and certain fund-level expense reductions, if any, are allocated on a pro-rata basis to each class based on the relative net assets of each class to the total net assets of the Fund. Each class differs with respect to transfer agent and distribution and service plan fees incurred. Certain expense reductions also differ by class. The Fund's investments in emerging markets can be subject to social, economic, regulatory, and political uncertainties and can be extremely volatile.
2. Investments in Fidelity Central Funds.
The Fund may invest in Fidelity Central Funds, which are open-end investment companies available only to other investment companies and accounts managed by Fidelity Management & Research Company (FMR) and its affiliates. The Fund's Schedule of Investments lists each of the Fidelity Central Funds held as of period end, if any, as an investment of the Fund, but does not include the underlying holdings of each Fidelity Central Fund. As an Investing Fund, the Fund indirectly bears its proportionate share of the expenses of the underlying Fidelity Central Funds.
The Money Market Central Funds seek preservation of capital and current income and are managed by Fidelity Investments Money Management, Inc. (FIMM), an affiliate of FMR.
A complete unaudited list of holdings for each Fidelity Central Fund is available upon request or at the Securities and Exchange Commission (the SEC) web site at www.sec.gov. In addition, the financial statements of the Fidelity Central Funds, which are not covered by the Fund's Report of Independent Registered Public Accounting Firm, are available on the SEC web site or upon request.
3. Significant Accounting Policies.
The financial statements have been prepared in conformity with accounting principles generally accepted in the United States of America, which require management to make certain estimates and assumptions at the date of the financial statements. Actual results could differ from those estimates. Events or transactions occurring after period end through the date that the financial statements were issued, February 16, 2010, have been evaluated in the preparation of the financial statements. The following summarizes the significant accounting policies of the Fund:
Security Valuation. Investments are valued as of 4:00 p.m. Eastern time on the last calendar day of the period. The Fund uses independent pricing services approved by the Board of Trustees to value its investments. When current market prices or quotations are not readily available or reliable, valuations may be determined in good faith in accordance with procedures adopted by the Board of Trustees. Factors used in determining value may include significant market or security specific events. The frequency with which these procedures are used cannot be predicted and may be utilized to a significant extent. The value used for net asset value (NAV) calculation under these procedures may differ from published prices for the same securities.
The Fund categorizes the inputs to valuation techniques used to value its investments into a disclosure hierarchy consisting of three levels as shown below.
Level 1 - quoted prices in active markets for identical investments
Level 2 - other significant observable inputs (including quoted prices for similar investments, interest rates, prepayment speeds, etc.)
Level 3 - unobservable inputs (including the fund's own assumptions based on the best information available)
Changes in valuation techniques may result in transfers in or out of an assigned level within the disclosure hierarchy. The aggregate value of investments by input level, as of December 31, 2009, is included at the end of the Fund's Schedule of Investments. Valuation techniques used to value the Fund's investments by major category are as follows.
Equity securities, including restricted securities, for which market quotations are readily available, are valued at the last reported sale price or official closing price as reported by an independent pricing service on the primary market or exchange on which they are traded and are categorized as Level 1 in the hierarchy. In the event there were no sales during the day or closing prices are not available, securities are valued at the last quoted bid price or may be valued using the last available price and categorized as Level 2 in the hierarchy. For foreign equity securities, when significant market or security events arise, comparisons to the valuation of American Depository Receipts (ADRs), futures contracts, and certain indexes as well as quoted prices for similar securities are used and are categorized as Level 2 in the hierarchy in these circumstances. For restricted securities and private placements where observable inputs are limited, assumptions about market activity and risk are used and are categorized as Level 3 in the hierarchy.
Annual Report
3. Significant Accounting Policies - continued
Security Valuation - continued
Investments in open-end mutual funds including the Fidelity Central Funds are valued at their closing net asset value each business day and are categorized as Level 1 in the hierarchy. Short-term securities with remaining maturities of sixty days or less for which quotations are not readily available are valued at amortized cost, which approximates value and are categorized as Level 2 in the hierarchy.
Foreign Currency. The Fund uses foreign currency contracts to facilitate transactions in foreign-denominated securities. Losses from these transactions may arise from changes in the value of the foreign currency or if the counterparties do not perform under the contracts' terms.
Foreign-denominated assets, including investment securities, and liabilities are translated into U.S. dollars at the exchange rate at period end. Purchases and sales of investment securities, income and dividends received and expenses denominated in foreign currencies are translated into U.S. dollars at the exchange rate in effect on the transaction date.
The effects of exchange rate fluctuations on investments are included with the net realized and unrealized gain (loss) on investment securities. Other foreign currency transactions resulting in realized and unrealized gain (loss) are disclosed separately.
Investment Transactions and Income. For financial reporting purposes, the Fund's investment holdings and NAV include trades executed through the end of the last business day of the period. The NAV per share for processing shareholder transactions is calculated as of the close of business of the New York Stock Exchange (NYSE), normally 4:00 p.m. Eastern time and includes trades executed through the end of the prior business day. Gains and losses on securities sold are determined on the basis of identified cost. Dividend income is recorded on the ex-dividend date, except for certain dividends from foreign securities where the ex-dividend date may have passed, which are recorded as soon as the Fund is informed of the ex-dividend date. Non-cash dividends included in dividend income, if any, are recorded at the fair market value of the securities received. Interest income and distributions from the Fidelity Central Funds are accrued as earned. Interest income includes coupon interest and amortization of premium and accretion of discount on debt securities. Investment income is recorded net of foreign taxes withheld where recovery of such taxes is uncertain.
Expenses. Most expenses of the trust can be directly attributed to a fund. Expenses which cannot be directly attributed are apportioned among each Fund in the trust. Expense estimates are accrued in the period to which they relate and adjustments are made when actual amounts are known.
Income Tax Information and Distributions to Shareholders. Each year, the Fund intends to qualify as a regulated investment company by distributing substantially all of its taxable income and realized gains under Subchapter M of the Internal Revenue Code and filing its U.S. federal tax return. As a result, no provision for income taxes is required. As of December 31, 2009, the Fund did not have any unrecognized tax benefits in the accompanying financial statements. A Fund's federal tax return is subject to examination by the Internal Revenue Service (IRS) for a period of three years. Foreign taxes are provided for based on the Fund's understanding of the tax rules and rates that exist in the foreign markets in which it invests. The Fund is subject to a tax imposed on short term capital gains on securities of certain issuers domiciled in India. The Fund records an estimated deferred tax liability included in Other payables and accrued expenses in the accompanying Statement of Assets & Liabilities for net unrealized gains on these securities in an amount that would be payable if the securities were disposed of at period end.
Distributions are recorded on the ex-dividend date. Income dividends and capital gain distributions are declared separately for each class. Income and capital gain distributions are determined in accordance with income tax regulations, which may differ from generally accepted accounting principles.
Capital accounts within the financial statements are adjusted for permanent book-tax differences. These adjustments have no impact on net assets or the results of operations. Temporary book-tax differences will reverse in a subsequent period.
Book-tax differences are primarily due to foreign currency transactions, passive foreign investment companies (PFIC), capital loss carryforwards and losses deferred due to wash sales and excise tax regulations.
The federal tax cost of investment securities and unrealized appreciation (depreciation) as of period end were as follows:
Gross unrealized appreciation | $ 12,407,172 |
Gross unrealized depreciation | (1,349,306) |
Net unrealized appreciation (depreciation) | $ 11,057,866 |
| |
Tax Cost | $ 61,023,512 |
The tax-based components of distributable earnings as of period end were as follows:
Undistributed ordinary income | $ 25,253 |
Capital loss carryforward | $ (4,615,107) |
Net unrealized appreciation (depreciation) | $ 11,057,772 |
Annual Report
Notes to Financial Statements - continued
3. Significant Accounting Policies - continued
Income Tax Information and Distributions to Shareholders - continued
The tax character of distributions paid was as follows:
| December 31, 2009 | December 31, 2008 |
Ordinary Income | $ 390,573 | $ 118,460 |
Trading (Redemption) Fees. Initial Class R shares, Service Class 2R shares and Investor Class R shares held less than 60 days are subject to a redemption fee equal to 1% of the proceeds of the redeemed shares. All redemption fees, including any estimated redemption fees paid by FMR, are retained by the Fund and accounted for as an addition to paid in capital.
4. Purchases and Sales of Investments.
Purchases and sales of securities, other than short-term securities, aggregated $66,246,826 and $20,858,501, respectively.
5. Fees and Other Transactions with Affiliates.
Management Fee. FMR and its affiliates provide the Fund with investment management related services for which the Fund pays a monthly management fee. The management fee is the sum of an individual fund fee rate that is based on an annual rate of .55% of the Fund's average net assets and a group fee rate that averaged .26% during the period. The group fee rate is based upon the average net assets of all the mutual funds advised by FMR. The group fee rate decreases as assets under management increase and increases as assets under management decrease. For the period, the total annual management fee rate was .81% of the Fund's average net assets.
Distribution and Service Plan. In accordance with Rule 12b-1 of the 1940 Act, the Fund has adopted separate 12b-1 Plans for each Service Class of shares. Each Service Class pays Fidelity Distributors Corporation (FDC), an affiliate of FMR, a service fee. For the period, the service fee is based on an annual rate of .10% of Service Class' average net assets and .25% of Service Class 2's and Service Class 2R's average net assets.
For the period, each class paid FDC the following amounts, all of which were re-allowed to insurance companies for the distribution of shares and providing shareholder support services:
Service Class | $ 349 |
Service Class 2 | 872 |
Service Class 2R | 872 |
| $ 2,093 |
Transfer Agent Fees. Fidelity Investments Institutional Operations Company, Inc. (FIIOC), an affiliate of FMR, is the Fund's transfer, dividend disbursing, and shareholder servicing agent. FIIOC receives an asset-based fee with respect to each class. Each class (with the exception of Investor Class R) pays a transfer agent fee, excluding out of pocket expenses, equal to an annual rate of .07% of average net assets. Investor Class R pays a monthly asset-based transfer agent fee of .15% of average net assets. The total transfer agent fees paid by each class to FIIOC, including out of pocket expenses, were as follows:
Initial Class | $ 496 |
Service Class | 362 |
Service Class 2 | 362 |
Initial Class R | 12,367 |
Service Class 2R | 362 |
Investor Class R | 27,794 |
| $ 41,743 |
Accounting Fees. Fidelity Service Company, Inc. (FSC), an affiliate of FMR, maintains the Fund's accounting records. The fee is based on the level of average net assets for the month.
Brokerage Commissions. The Fund placed a portion of its portfolio transactions with brokerage firms which are affiliates of the investment adviser. The commissions paid to these affiliated firms were $697 for the period.
Annual Report
6. Committed Line of Credit.
The Fund participates with other funds managed by FMR in a $3.5 billion credit facility (the "line of credit") to be utilized for temporary or emergency purposes to fund shareholder redemptions or for other short-term liquidity purposes. The Fund has agreed to pay commitment fees on its pro-rata portion of the line of credit, which amounted to $81 and is reflected in Miscellaneous Expense on the Statement of Operations. During the period, there were no borrowings on this line of credit.
7. Expense Reductions.
FMR voluntarily agreed to reimburse each class to the extent annual operating expenses exceeded certain levels of average net assets as noted in the table below. Some expenses, for example interest expense, including commitment fees, are excluded from this reimbursement.
The following classes were in reimbursement during the period:
| Expense
Limitations | Reimbursement
from adviser |
| | |
Initial Class | 1.10% | $ 8,520 |
Service Class | 1.20% | 6,385 |
Service Class 2 | 1.35% | 6,373 |
Initial Class R | 1.10% | 129,562 |
Service Class 2R | 1.35% | 6,373 |
Investor Class R | 1.18% | 138,186 |
| | $ 295,399 |
Many of the brokers with whom FMR places trades on behalf of the Fund provided services to the Fund in addition to trade execution. These services included payments of certain expenses on behalf of the Fund totaling $25,350 for the period.
8. Distributions to Shareholders.
Distributions to shareholders of each class were as follows:
Years ended December 31, | 2009 | 2008 A |
From net investment income | | |
Initial Class | $ 596 | $ 7,875 |
Service Class | 41 | 5,365 |
Service Class 2 | - | 4,404 |
Initial Class R | 75,536 | 46,484 |
Service Class 2R | - | 4,404 |
Investor Class R | 94,964 | 49,928 |
Total | $ 171,137 | $ 118,460 |
From net realized gain | | |
Initial Class | $ 762 | $ - |
Service Class | 275 | - |
Service Class 2 | - | - |
Initial Class R | 96,805 | - |
Service Class 2 R | - | - |
Investor Class R | 121,594 | - |
Total | $ 219,436 | $ - |
A For the period January 23, 2008 (commencement of operations) to December 31, 2008.
Annual Report
Notes to Financial Statements - continued
9. Share Transactions.
Transactions for each class of shares were as follows:
| Shares | Dollars |
Years ended December 31, | 2009 | 2008 A | 2009 | 2008 A |
Initial Class | | | | |
Shares sold | 16,945 | 107,445 | $ 120,071 | $ 1,068,509 |
Reinvestment of distributions | 165 | 1,615 | 1,358 | 7,875 |
Shares redeemed | (93,578) | (3,183) | (691,714) | (22,468) |
Net increase (decrease) | (76,468) | 105,877 | $ (570,285) | $ 1,053,916 |
Service Class | | | | |
Shares sold | - | 80,001 | $ - | $ 800,010 |
Reinvestment of distributions | 38 | 1,098 | 316 | 5,365 |
Shares redeemed | (67,365) | - | (502,507) | - |
Net increase (decrease) | (67,327) | 81,099 | $ (502,191) | $ 805,375 |
Service Class 2 | | | | |
Shares sold | - | 80,001 | $ - | $ 800,010 |
Reinvestment of distributions | - | 902 | - | 4,404 |
Shares redeemed | (67,175) | - | (501,199) | - |
Net increase (decrease) | (67,175) | 80,903 | $ (501,199) | $ 804,414 |
Initial Class R | | | | |
Shares sold | 3,509,051 | 856,743 | $ 24,423,527 | $ 8,037,340 |
Reinvestment of distributions | 20,952 | 9,532 | 172,342 | 46,484 |
Shares redeemed | (499,141) | (218,667) | (3,003,566) | (1,627,362) |
Net increase (decrease) | 3,030,862 | 647,608 | $ 21,592,303 | $ 6,456,462 |
Service Class 2R | | | | |
Shares sold | - | 80,001 | $ - | $ 800,010 |
Reinvestment of distributions | - | 902 | - | 4,404 |
Shares redeemed | (67,175) | - | (501,199) | - |
Net increase (decrease) | (67,175) | 80,903 | $ (501,199) | $ 804,414 |
Investor Class R | | | | |
Shares sold | 4,321,090 | 938,957 | $ 31,280,354 | $ 8,629,449 |
Reinvestment of distributions | 26,389 | 10,240 | 216,557 | 49,928 |
Shares redeemed | (326,280) | (256,154) | (2,015,261) | (1,939,873) |
Net increase (decrease) | 4,021,199 | 693,043 | $ 29,481,650 | $ 6,739,504 |
A For the period January 23, 2008 (commencement of operations) to December 31, 2008.
10. Other.
The Fund's organizational documents provide former and current trustees and officers with a limited indemnification against liabilities arising in connection with the performance of their duties to the Fund. In the normal course of business, the Fund may also enter into contracts that provide general indemnifications. The Fund's maximum exposure under these arrangements is unknown as this would be dependent on future claims that may be made against the Fund. The risk of material loss from such claims is considered remote.
At the end of the period, FMR or its affiliates were the owners of record of approximately 100% of the total outstanding shares of the Fund.
Annual Report
Report of Independent Registered Public Accounting Firm
To the Trustees of Variable Insurance Products Fund IV and Shareholders of VIP Emerging Markets Portfolio:
We have audited the accompanying statement of assets and liabilities of VIP Emerging Markets Portfolio (the Fund), a fund of Variable Insurance Products Fund IV, including the schedule of investments, as of December 31, 2009, and the related statement of operations for the year then ended, and the statements of changes in net assets and the financial highlights for the year ended December 31, 2009 and for the period from January 23, 2008 (commencement of operations) to December 31, 2008. These financial statements and financial highlights are the responsibility of the Fund's management. Our responsibility is to express an opinion on these financial statements and financial highlights based on our audits.
We conducted our audits in accordance with standards of the Public Company Accounting Oversight Board (United States). Those standards require that we plan and perform the audit to obtain reasonable assurance about whether the financial statements and financial highlights are free of material misstatement. The Fund is not required to have, nor were we engaged to perform, an audit of its internal control over financial reporting. Our audits included consideration of internal control over financial reporting as a basis for designing audit procedures that are appropriate in the circumstances, but not for the purpose of expressing an opinion on the effectiveness of the Fund's internal control over financial reporting. Accordingly, we express no such opinion. An audit also includes examining, on a test basis, evidence supporting the amounts and disclosures in the financial statements, assessing the accounting principles used and significant estimates made by management, as well as evaluating the overall financial statement presentation. Our procedures included confirmation of securities owned as of December 31, 2009, by correspondence with the custodians and brokers; where replies were not received from brokers, we performed other auditing procedures. We believe that our audits provide a reasonable basis for our opinion.
In our opinion, the financial statements and financial highlights referred to above present fairly, in all material respects, the financial position of VIP Emerging Markets Portfolio as of December 31, 2009, the results of its operations for the year then ended, and the statements of changes in net assets and the financial highlights for the year ended December 31, 2009 and for the period from January 23, 2008 (commencement of operations) to December 31, 2008, in conformity with accounting principles generally accepted in the United States of America.
/s/ Deloitte & Touche LLP
DELOITTE & TOUCHE LLP
Boston, Massachusetts
February 16, 2010
Annual Report
The Trustees, Member of the Advisory Board, and executive officers of the trust and fund, as applicable, are listed below. The Board of Trustees governs the fund and is responsible for protecting the interests of shareholders. The Trustees are experienced executives who meet periodically throughout the year to oversee the fund's activities, review contractual arrangements with companies that provide services to the fund, and review the fund's performance. Except for James C. Curvey, each of the Trustees oversees 222 funds advised by FMR or an affiliate. Mr. Curvey oversees 410 funds advised by FMR or an affiliate.
The Trustees hold office without limit in time except that (a) any Trustee may resign; (b) any Trustee may be removed by written instrument, signed by at least two-thirds of the number of Trustees prior to such removal; (c) any Trustee who requests to be retired or who has become incapacitated by illness or injury may be retired by written instrument signed by a majority of the other Trustees; and (d) any Trustee may be removed at any special meeting of shareholders by a two-thirds vote of the outstanding voting securities of the trust. Each Trustee who is not an interested person (as defined in the 1940 Act) (Independent Trustee), shall retire not later than the last day of the calendar year in which his or her 72nd birthday occurs. The Independent Trustees may waive this mandatory retirement age policy with respect to individual Trustees. The executive officers and Advisory Board Member hold office without limit in time, except that any officer and Advisory Board Member may resign or may be removed by a vote of a majority of the Trustees at any regular meeting or any special meeting of the Trustees. Except as indicated, each individual has held the office shown or other offices in the same company for the past five years.
The fund's Statement of Additional Information (SAI) includes more information about the Trustees. To request a free copy, call Fidelity at 1-877-208-0098.
Interested Trustees*:
Correspondence intended for each Trustee who is an interested person may be sent to Fidelity Investments, 82 Devonshire Street, Boston, Massachusetts 02109.
Name, Age; Principal Occupation |
Edward C. Johnson 3d (79) |
| Year of Election or Appointment: 1983 Mr. Johnson is Trustee and Chairman of the Board of Trustees of certain Trusts. Mr. Johnson serves as Chief Executive Officer, Chairman, and a Director of FMR LLC; Chairman and a Director of FMR; Chairman and a Director of Fidelity Research & Analysis Company (FRAC); Chairman and a Director of Fidelity Investments Money Management, Inc.; and Chairman and a Director of FMR Co., Inc. In addition, Mr. Johnson serves as Chairman and Director of FIL Limited. Previously, Mr. Johnson served as President of FMR LLC (2006-2007). |
James C. Curvey (74) |
| Year of Election or Appointment: 2007 Mr. Curvey also serves as Trustee (2007-present) of other investment companies advised by FMR. Mr. Curvey is a Director of FMR and FMR Co., Inc. (2007-present). Mr. Curvey is also Vice Chairman (2006-present) and Director of FMR LLC. In addition, Mr. Curvey serves as an Overseer for the Boston Symphony Orchestra and a member of the Trustees of Villanova University. |
* Trustees have been determined to be "Interested Trustees" by virtue of, among other things, their affiliation with the trust or various entities under common control with FMR.
Independent Trustees:
Correspondence intended for each Independent Trustee (that is, the Trustees other than the Interested Trustees) may be sent to Fidelity Investments, P.O. Box 55235, Boston, Massachusetts 02205-5235.
Name, Age; Principal Occupation |
Dennis J. Dirks (61) |
| Year of Election or Appointment: 2005 Prior to his retirement in May 2003, Mr. Dirks was Chief Operating Officer and a member of the Board of The Depository Trust & Clearing Corporation (DTCC). He also served as President, Chief Operating Officer, and Board member of The Depository Trust Company (DTC) and President and Board member of the National Securities Clearing Corporation (NSCC). In addition, Mr. Dirks served as Chief Executive Officer and Board member of the Government Securities Clearing Corporation, Chief Executive Officer and Board member of the Mortgage-Backed Securities Clearing Corporation, as a Trustee and a member of the Finance Committee of Manhattan College (2005-2008), and as a Trustee and a member of the Finance Committee of AHRC of Nassau County (2006-2008). Currently, Mr. Dirks serves as a member of the Board of Directors for The Brookville Center for Children's Services, Inc. (2009-present). |
Alan J. Lacy (56) |
| Year of Election or Appointment: 2008 Mr. Lacy serves as Senior Adviser (2007-present) of Oak Hill Capital Partners, L.P. (private equity). Mr. Lacy also served as Chief Executive Officer (2000-2005) and Vice Chairman (2005-2006) of Sears Holdings Corporation and Sears, Roebuck and Co. (retail). In addition, Mr. Lacy serves as a member of the Board of Directors of The Western Union Company (global money transfer, 2006-present) and Bristol-Myers Squibb Company (global pharmaceuticals, 2007-present). Mr. Lacy is Chairman (2008-present) and a member (2006-present) of the Board of Trustees of The National Parks Conservation Association. |
Ned C. Lautenbach (65) |
| Year of Election or Appointment: 2000 Mr. Lautenbach is Chairman of the Independent Trustees of the Equity and High Income Funds (2006-present). Mr. Lautenbach is an Advisory Partner of Clayton, Dubilier & Rice, Inc. (private equity investment). Previously, Mr. Lautenbach was with the International Business Machines Corporation (IBM) from 1968 until his retirement in 1998. Mr. Lautenbach serves as a Director of Eaton Corporation (diversified industrial) as well as the Philharmonic Center for the Arts in Naples, Florida. Mr. Lautenbach is also a member of the Board of Trustees of Fairfield University (2005-present), as well as a member of the Council on Foreign Relations. Previously, Mr. Lautenbach served as a Director of Sony Corporation (2006-2007). |
Joseph Mauriello (65) |
| Year of Election or Appointment: 2008 Prior to his retirement in January 2006, Mr. Mauriello served in numerous senior management positions including Deputy Chairman and Chief Operating Officer (2004-2005), and Vice Chairman of Financial Services (2002-2004) of KPMG LLP US (professional services, 1965-2005). Mr. Mauriello currently serves as a member of the Board of Directors of XL Capital Ltd. (global insurance and re-insurance, 2006-present) and of Arcadia Resources Inc. (health care services and products, 2007-present). Previously, Mr. Mauriello served as a Director of the Hamilton Funds of the Bank of New York (2006-2007). |
Cornelia M. Small (65) |
| Year of Election or Appointment: 2005 Ms. Small is a member of the Board of Directors of the Teagle Foundation (2009-present). Ms. Small is also a member of the Investment Committee, and Chair (2008-present) and a member of the Board of Trustees of Smith College. In addition, Ms. Small serves on the Investment Committee of the Berkshire Taconic Community Foundation (2008-present). Previously, Ms. Small served as Chairperson of the Investment Committee (2002-2008) of Smith College. In addition, Ms. Small served as Chief Investment Officer, Director of Global Equity Investments, and a member of the Board of Directors of Scudder, Stevens & Clark and Scudder Kemper Investments. |
William S. Stavropoulos (70) |
| Year of Election or Appointment: 2001 Mr. Stavropoulos serves as President and Founder of the Michigan Baseball Foundation, the Great Lakes Loons (2007-present). Mr. Stavropoulos is Chairman Emeritus of the Board of Directors of The Dow Chemical Company, where he previously served in numerous senior management positions, including President, CEO (1995-2000; 2002-2004), Chairman of the Executive Committee (2000-2006), and as a member of the Board of Directors (1990-2006). Currently, Mr. Stavropoulos is a Director of Teradata Corporation (data warehousing and technology solutions, 2008-present), Chemical Financial Corporation, Maersk Inc. (industrial conglomerate), Tyco International, Inc. (multinational manufacturing and services, 2007-present), and a member of the Advisory Board for Metalmark Capital (private equity investment, 2005-present). Mr. Stavropoulos is a special advisor to Clayton, Dubilier & Rice, Inc. (private equity investment). In addition, Mr. Stavropoulos is a member of the University of Notre Dame Advisory Council for the College of Science. |
David M. Thomas (60) |
| Year of Election or Appointment: 2008 Previously, Mr. Thomas served as Executive Chairman (2005-2006) and Chairman and Chief Executive Officer (2000-2005) of IMS Health, Inc. (pharmaceutical and healthcare information solutions). In addition, Mr. Thomas serves as a member of the Board of Directors of Fortune Brands, Inc. (consumer products), and Interpublic Group of Companies, Inc. (marketing communication, 2004-present). |
Michael E. Wiley (59) |
| Year of Election or Appointment: 2008 Mr. Wiley also serves as a Director of Asia Pacific Exploration Consolidated (international oil and gas exploration and production, 2008-present), and as a member of the Board of Trustees of the University of Tulsa (2000-2006; 2007-present). Mr. Wiley serves as a Director of Tesoro Corporation (independent oil refiner and marketer, 2005-present), and a Director of Bill Barrett Corporation (exploration and production, 2005-present). In addition, Mr. Wiley also serves as a Director of Post Oak Bank (privately-held bank, 2004-present). Previously, Mr. Wiley served as a Sr. Energy Advisor of Katzenbach Partners, LLC (consulting, 2006-2007), as an Advisory Director of Riverstone Holdings (private investment), Chairman, President, and CEO of Baker Hughes, Inc. (oilfield services, 2000-2004), and as Director of Spinnaker Exploration Company (exploration and production, 2001-2005). |
Annual Report
Trustees and Officers - continued
Advisory Board Member and Executive Officers:
Correspondence intended for each executive officer and Peter S. Lynch may be sent to Fidelity Investments, 82 Devonshire Street, Boston, Massachusetts 02109.
Name, Age; Principal Occupation |
Peter S. Lynch (65) |
| Year of Election or Appointment: 2003 Member of the Advisory Board of Fidelity's Equity and High Income Funds. Mr. Lynch is Vice Chairman and a Director of FMR and FMR Co., Inc. In addition, Mr. Lynch serves as a Trustee of Boston College and as the Chairman of the Inner-City Scholarship Fund. Previously, Mr. Lynch served on the Special Olympics International Board of Directors (1997-2006). |
Kenneth B. Robins (40) |
| Year of Election or Appointment: 2008 President and Treasurer of Fidelity's Equity and High Income Funds. Mr. Robins also serves as Assistant Treasurer of other Fidelity funds (2009-present) and is an employee of Fidelity Investments (2004-present). Before joining Fidelity Investments, Mr. Robins worked at KPMG LLP, where he was a partner in KPMG's department of professional practice (2002-2004). |
Brian B. Hogan (45) |
| Year of Election or Appointment: 2009 Vice President of certain Equity Funds and Vice President of Sector Funds. Mr. Hogan also serves as Senior Vice President, Equity Research of FMR (2006-present) and President of FMR's Equity Division (2009-present). Previously, Mr. Hogan served as a portfolio manager. |
Eric M. Wetlaufer (47) |
| Year of Election or Appointment: 2006 Vice President of Fidelity's International Equity Funds. Mr. Wetlaufer also serves as Group Chief Investment Officer of FMR. Mr. Wetlaufer is a Director (2007-present), Chairman, Chief Executive Officer, and President of Fidelity Management & Research (Hong Kong) Limited (2008-present); Chairman, Chief Executive Officer, President, and a Director of Fidelity Management & Research (Japan) Inc. (2008-present); Chairman and Chief Executive Officer (2007-present) and President and a Director (2006-present) of Fidelity Management & Research (U.K.) Inc. and President and a Director of Fidelity Research & Analysis Company (2006-present). Before joining Fidelity Investments in 2005, Mr. Wetlaufer was a partner in Oxhead Capital Management (2004-2005). |
Scott C. Goebel (41) |
| Year of Election or Appointment: 2008 Secretary and Chief Legal Officer (CLO) of the Fidelity funds. Mr. Goebel also serves as General Counsel, Secretary, and Senior Vice President of FMR (2008-present) and FMR Co., Inc. (2008-present); Deputy General Counsel of FMR LLC; Chief Legal Officer of Fidelity Management & Research (Hong Kong) Limited (2008-present) and Assistant Secretary of Fidelity Management & Research (Japan) Inc. (2008-present), Fidelity Investments Money Management, Inc. (2008-present), Fidelity Management & Research (U.K.) Inc. (2008-present), and Fidelity Research and Analysis Company (2008-present). Previously, Mr. Goebel served as Assistant Secretary of the Funds (2007-2008) and as Vice President and Secretary of Fidelity Distributors Corporation (FDC) (2005-2007). |
William C. Coffey (40) |
| Year of Election or Appointment: 2009 Assistant Secretary of Fidelity's Equity and High Income Funds. Mr. Coffey also serves as Vice President and Associate General Counsel of FMR LLC (2005-present), and is an employee of Fidelity Investments. |
Holly C. Laurent (55) |
| Year of Election or Appointment: 2008 Anti-Money Laundering (AML) Officer of the Fidelity funds. Ms. Laurent is an employee of Fidelity Investments. Previously, Ms. Laurent was Senior Vice President and Head of Legal for Fidelity Business Services India Pvt. Ltd. (2006-2008), and Senior Vice President, Deputy General Counsel and Group Head for FMR LLC (2005-2006). |
Christine Reynolds (51) |
| Year of Election or Appointment: 2008 Chief Financial Officer of the Fidelity funds. Ms. Reynolds became President of Fidelity Pricing and Cash Management Services (FPCMS) in August 2008. Ms. Reynolds served as Chief Operating Officer of FPCMS (2007-2008). Previously, Ms. Reynolds served as President, Treasurer, and Anti-Money Laundering officer of the Fidelity funds (2004-2007). |
Kenneth A. Rathgeber (62) |
| Year of Election or Appointment: 2004 Chief Compliance Officer of Fidelity's Equity and High Income Funds. Mr. Rathgeber is Chief Compliance Officer of Fidelity Management & Research (Hong Kong) Limited (2008-present), Fidelity Management & Research (Japan) Inc. (2008-present), FMR (2005-present), FMR Co., Inc. (2005-present), Fidelity Management & Research (U.K.) Inc. (2005-present), Fidelity Research & Analysis Company (2005-present), Fidelity Investments Money Management, Inc. (2005-present), Pyramis Global Advisors, LLC (2005-present), and Strategic Advisers, Inc. (2005-present). |
Jeffrey S. Christian (48) |
| Year of Election or Appointment: 2009 Deputy Treasurer of the Fidelity funds. Mr. Christian is an employee of Fidelity Investments. Previously, Mr. Christian served as Chief Financial Officer (2008-2009) of certain Fidelity funds, Senior Vice President of Fidelity Pricing and Cash Management Services (FPCMS) (2004-2009), and as Vice President of Business Analysis (2003-2004). |
Bryan A. Mehrmann (48) |
| Year of Election or Appointment: 2005 Deputy Treasurer of the Fidelity funds. Mr. Mehrmann is an employee of Fidelity Investments. Previously, Mr. Mehrmann served as Vice President of Fidelity Investments Institutional Services Group (FIIS)/Fidelity Investments Institutional Operations Company, Inc. (FIIOC) Client Services (1998-2004). |
Adrien E. Deberghes (42) |
| Year of Election or Appointment: 2008 Deputy Treasurer of Fidelity's Equity and High Income Funds. Mr. Deberghes is an employee of Fidelity Investments (2008-present). Previously, Mr. Deberghes served as Senior Vice President of Mutual Fund Administration at State Street Corporation (2007-2008), Senior Director of Mutual Fund Administration at Investors Bank & Trust (2005-2007), and Director of Finance for Dunkin' Brands (2000-2005). |
John R. Hebble (51) |
| Year of Election or Appointment: 2009 Assistant Treasurer of Fidelity's Equity and High Income Funds. Mr. Hebble also serves as President and Treasurer of other Fidelity funds (2008-present) and is an employee of Fidelity Investments. |
Paul M. Murphy (62) |
| Year of Election or Appointment: 2007 Assistant Treasurer of the Fidelity funds. Mr. Murphy is an employee of Fidelity Investments. Previously, Mr. Murphy served as Chief Financial Officer of the Fidelity funds (2005-2006), Vice President and Associate General Counsel of FMR (2007), and Senior Vice President of Fidelity Pricing and Cash Management Services (FPCMS) (1994-2007). |
Gary W. Ryan (51) |
| Year of Election or Appointment: 2005 Assistant Treasurer of the Fidelity funds. Mr. Ryan is an employee of Fidelity Investments. Previously, Mr. Ryan served as Vice President of Fund Reporting in Fidelity Pricing and Cash Management Services (FPCMS) (1999-2005). |
Annual Report
The Board of Trustees of VIP Emerging Markets Portfolio voted to pay to shareholders of record at the opening of business on record date, the following distributions per share derived from capital gains realized from sales of portfolio securities:
| Pay Date | Record Date | Capital Gains |
Initial Class R | 02/05/10 | 02/05/10 | $.003 |
Investor Class R | 02/05/10 | 02/05/10 | $.003 |
Service Class 2 R | 02/05/10 | 02/05/10 | $.003 |
The amounts per share which represent income derived from sources within, and taxes paid to, foreign countries or possessions of the United States are as follows:
| Pay Date | Income | Taxes |
Initial Class R | 12/18/2009 | $0.051 | $0.006 |
| 12/30/2009 | $0.003 | $- |
Investor Class R | 12/18/2009 | $0.051 | $0.006 |
| 12/30/2009 | $0.003 | $- |
Service Class 2 R | 12/18/2009 | $- | $- |
| 12/30/2009 | $- | $- |
The fund will notify shareholders in January 2010 of amounts for use in preparing 2009 income tax returns.
Annual Report
Board Approval of Investment Advisory Contracts and Management Fees
VIP Emerging Markets Portfolio
Each year, the Board of Trustees, including the Independent Trustees (together, the Board), votes on the renewal of the management contract and sub-advisory agreements (together, the Advisory Contracts) for the fund. The Board, assisted by the advice of fund counsel and Independent Trustees' counsel, requests and considers a broad range of information throughout the year.
The Board meets regularly and, acting directly and through its separate committees, requests and receives information concerning, and considers at each of its meetings factors that are relevant to, its annual consideration of the renewal of the fund's Advisory Contracts, including the services and support provided to the fund and its shareholders. The Board has established various standing committees, each composed of Independent Trustees with varying backgrounds, to which the Board has assigned specific subject matter responsibilities in order to enhance effective decision-making by the Board. Each committee has a written charter outlining the structure and purposes of the committee. The Board also meets as needed to consider matters specifically related to the Board's annual consideration of the renewal of Advisory Contracts.
At its July 2009 meeting, the Board of Trustees, including the Independent Trustees, unanimously determined to renew the fund's Advisory Contracts. In reaching its determination, the Board considered all factors it believed relevant, including (i) the nature, extent, and quality of the services to be provided to the fund and its shareholders (including the investment performance of the fund); (ii) the competitiveness of the fund's management fee and total expenses; (iii) the total costs of the services to be provided by and the profits to be realized by Fidelity from its relationship with the fund; (iv) the extent to which economies of scale would be realized as the fund grows; and (v) whether fee levels reflect these economies of scale, if any, for the benefit of fund shareholders.
In considering whether to renew the Advisory Contracts for the fund, the Board ultimately reached a determination, with the assistance of fund counsel and Independent Trustees' counsel and through the exercise of its business judgment, that the renewal of the Advisory Contracts and the compensation to be received by Fidelity under the management contract is consistent with Fidelity's fiduciary duty under applicable law. The Board's decision to renew the Advisory Contracts was not based on any single factor noted above, but rather was based on a comprehensive consideration of all the information provided to the Board at its meetings throughout the year. The Board, in reaching its determination to renew the Advisory Contracts, is aware that shareholders in the fund have a broad range of investment choices available to them, including a wide choice among mutual funds offered by competitors to Fidelity, and that the fund's shareholders, with the opportunity to review and weigh the disclosure provided by the fund in its prospectus and other public disclosures, have chosen to invest in this fund, managed by Fidelity.
Nature, Extent, and Quality of Services Provided. The Board considered staffing within the investment adviser, FMR, and the sub-advisers (together, the Investment Advisers), including the backgrounds of the fund's investment personnel and the fund's investment objective and discipline. The Independent Trustees also had discussions with senior management of Fidelity's investment operations and investment groups. The Board considered the structure of the portfolio manager compensation program and whether this structure provides appropriate incentives.
Resources Dedicated to Investment Management and Support Services. The Board reviewed the size, education, and experience of the Investment Advisers' investment staff, their use of technology, and the Investment Advisers' approach to recruiting, training, and retaining portfolio managers and other research, advisory, and management personnel. In response to last year's financial crisis, FMR took a number of actions intended to cut costs and improve efficiency without weakening the investment teams or resources. The Board noted that Fidelity's analysts have access to a variety of technological tools and market and securities data that enable them to perform both fundamental and quantitative analysis and to specialize in various disciplines. The Board considered Fidelity's extensive global research capabilities that enable the Investment Advisers to aggregate data from various sources in an effort to produce positive investment results. The Board also considered that Fidelity's portfolio managers and analysts have access to daily portfolio attribution that allows for monitoring of a fund's portfolio, as well as an electronic communication system that provides immediate real-time access to research concerning issuers and credit enhancers.
Shareholder and Administrative Services. The Board considered (i) the nature, extent, quality, and cost of advisory, administrative, distribution, and shareholder services performed by the Investment Advisers and their affiliates under the Advisory Contracts and under separate agreements covering transfer agency, pricing and bookkeeping, and securities lending services for the fund; (ii) the nature and extent of the Investment Advisers' supervision of third party service providers, principally custodians and subcustodians; and (iii) the resources devoted to, and the record of compliance with, the fund's compliance policies and procedures. The Board also reviewed the allocation of fund brokerage, including allocations to brokers affiliated with the Investment Advisers, the use of brokerage commissions to pay fund expenses, and the use of "soft" commission dollars to pay for research services.
The Board noted that the growth of fund assets across the complex allows Fidelity to reinvest in the development of services designed to enhance the value or convenience of the Fidelity funds as investment vehicles. These services include 24-hour access to account information and market information through phone representatives and over the Internet, and investor education materials and asset allocation tools.
Investment in a Large Fund Family. The Board considered the benefits to shareholders of investing in a Fidelity fund, including the benefits of investing in a fund that is part of a large family of funds offering a variety of investment disciplines and providing for a large variety of mutual fund investor services. The Board noted that Fidelity has taken a number of actions over the previous year that benefited particular funds, including (i) dedicating additional resources to investment research and to restructure and broaden the focus of the investment research teams; (ii) bolstering the senior management team that oversees asset management; (iii) contractually agreeing to reduce the management fee on Fidelity U.S. Bond Index Fund; and (iv) expanding Class A and Class T load waiver categories to increase rollover retention opportunities and create consistent policies across the classes.
Annual Report
Board Approval of Investment Advisory Contracts and Management Fees - continued
Investment Performance. The Board considered whether the fund has operated within its investment objective, as well as its record of compliance with its investment restrictions. The Board noted that it is not possible to evaluate performance in any comprehensive fashion because the fund had been in operation for less than one calendar year. Once the fund has been in operation for at least one calendar year, the Board will review the fund's absolute investment performance for each class, as well as the fund's relative investment performance for each class measured against a broad-based securities market index and, if a meaningful peer group exists, a peer group of mutual funds.
Based on its review, and giving particular weight to the nature and quality of the resources dedicated by the Investment Advisers to maintain and improve relative performance and factoring in the unprecedented market events in 2008, the Board concluded that the nature, extent, and quality of the services provided to the fund will benefit the fund's shareholders, particularly in light of the Board's view that the fund's shareholders benefit from investing in a fund that is part of a large family of funds offering a variety of investment disciplines and services.
Competitiveness of Management Fee and Total Fund Expenses. The Board considered the fund's management fee and total expenses compared to "mapped groups" of competitive funds and classes. Fidelity creates "mapped groups" by combining similar Lipper investment objective categories that have comparable management fee characteristics. Combining Lipper investment objective categories aids the Board's management fee and total expense comparisons by broadening the competitive group used for comparison and by reducing the number of universes to which various Fidelity funds are compared.
The Board considered two proprietary management fee comparisons for the period of the fund's operations shown in the chart below. The group of Lipper funds used by the Board for management fee comparisons is referred to below as the "Total Mapped Group." The Total Mapped Group comparison focuses on a fund's standing relative to the total universe of comparable funds available to investors, in terms of gross management fees before expense reimbursements or caps. "TMG %" represents the percentage of funds in the Total Mapped Group that had management fees that were lower than the fund's. For example, a TMG % of 36% means that 64% of the funds in the Total Mapped Group had higher management fees than the fund. The "Asset-Size Peer Group" (ASPG) comparison focuses on a fund's standing relative to non-Fidelity funds similar in size to the fund within the Total Mapped Group. The ASPG represents at least 15% of the funds in the Total Mapped Group with comparable asset size and management fee characteristics, subject to a minimum of 50 funds (or all funds in the Total Mapped Group if fewer than 50). Additional information, such as the ASPG quartile in which the fund's management fee ranked, is also included in the chart and considered by the Board.
VIP Emerging Markets Portfolio
The Board noted that the fund's management fee ranked below the median of its Total Mapped Group and below the median of its ASPG for the period.
Based on its review, the Board concluded that the fund's management fee was fair and reasonable in light of the services that the fund receives and the other factors considered.
In its review of each class's total expenses, the Board considered the fund's management fee as well as other fund or class expenses, as applicable, such as transfer agent fees, pricing and bookkeeping fees, fund-paid 12b-1 fees, and custodial, legal, and audit fees. The Board also noted the effects of any waivers and reimbursements on fees and expenses. As part of its review, the Board also considered current and historical total expenses of each class of the fund compared to competitive fund median expenses. Each class of the fund is compared to those funds and classes in the Total Mapped Group (used by the Board for management fee comparisons) that have a similar sales load structure.
Annual Report
The Board noted that the total expenses of each of Initial Class and Initial Class R ranked equal to its competitive median for the period and the total expenses of each of Investor Class R, Service Class, Service Class 2, and Service Class 2 R ranked above its competitive median for the period. The Board considered that the total expenses of Investor Class R were above the median primarily due to its higher transfer agent fee. The Board noted that the fund offers multiple classes, each of which has a different 12b-1 fee structure, and that the multiple structures are intended to offer a range of pricing options for the intermediary market. The Board also noted that the total expenses of the classes vary primarily by the level of their 12b-1 fees, although differences in transfer agent fees may also cause expenses to vary from class to class.
In its review of total expenses, the Board also considered Fidelity fee structures and other information on clients that FMR and its affiliates service in other competitive markets, such as other mutual funds advised or subadvised by FMR or its affiliates, pension plan clients, and other institutional clients.
Based on its review, the Board concluded that the total expenses of each class of the fund were reasonable, although in some cases above the median of the universe presented for comparison, in light of the services that the fund and its shareholders receive and the other factors considered.
Costs of the Services and Profitability. The Board considered the revenues earned and the expenses incurred by Fidelity in conducting the business of developing, marketing, distributing, managing, administering and servicing the fund and its shareholders. The Board also considered the level of Fidelity's profits in respect of all the Fidelity funds.
On an annual basis, FMR presents to the Board Fidelity's profitability for the fund. Fidelity calculates the profitability for each fund, as well as aggregate profitability for groups of Fidelity funds and all Fidelity funds, using a series of detailed revenue and cost allocation methodologies which originate with the audited books and records of Fidelity. The Audit Committee of the Board reviews any significant changes from the prior year's methodologies.
PricewaterhouseCoopers LLP (PwC), independent registered public accounting firm and auditor to Fidelity and certain Fidelity funds, has been engaged annually by the Board as part of the Board's assessment of Fidelity's profitability analysis. PwC's engagement includes the review and assessment of Fidelity's methodologies used in determining the revenues and expenses attributable to Fidelity's mutual fund business, and completion of agreed-upon procedures surrounding the mathematical accuracy of fund profitability and its conformity to allocation methodologies. After considering PwC's reports issued under the engagement and information provided by Fidelity, the Board believes that while other allocation methods may also be reasonable, Fidelity's profitability methodologies are reasonable in all material respects.
The Board has also reviewed Fidelity's non-fund businesses and any fall-out benefits related to the mutual fund business as well as cases where Fidelity's affiliates may benefit from or be related to the fund's business.
The Board considered the costs of the services provided by and the profits realized by Fidelity in connection with the operation of the fund and determined that the amount of profit is a fair entrepreneurial profit for the management of the fund.
Economies of Scale. The Board considered whether there have been economies of scale in respect of the management of the Fidelity funds, whether the Fidelity funds (including the fund) have appropriately benefited from any such economies of scale, and whether there is potential for realization of any further economies of scale. The Board considered the extent to which the fund will benefit from economies of scale through increased services to the fund, through waivers or reimbursements, or through fee or expense reductions.
In February 2009, the Board created an Ad Hoc Committee (the "Committee") to analyze economies of scale. The Committee was formed to consider whether FMR attains economies of scale in respect of the management and servicing of the Fidelity funds, whether the Fidelity funds have appropriately benefited from such economies of scale, and whether there is potential for realization of any further economies of scale.
The Board recognized that the fund's management contract incorporates a "group fee" structure, which provides for lower group fee rates as total fund assets under FMR's management increase, and for higher group fee rates as total fund assets under FMR's management decrease. FMR determines the group fee rates based on a tiered asset "breakpoint" schedule. The Board considered that the group fee is designed to deliver the benefits of economies of scale to fund shareholders when total fund assets increase, even if assets of any particular fund are unchanged or have declined, because some portion of Fidelity's costs are attributable to services provided to all Fidelity funds, and all funds benefit if those costs can be allocated among more assets. The Board concluded that, given the group fee structure, fund shareholders will achieve a certain level of economies of scale as assets under FMR's management increase at the fund complex level, regardless of whether Fidelity achieves any such economies of scale.
The Board concluded, considering the findings of the Committee, that any potential economies of scale are being shared between fund shareholders and Fidelity in an appropriate manner.
Additional Information Requested by the Board. In order to develop fully the factual basis for consideration of the Fidelity funds' Advisory Contracts, the Board requested and received additional information on certain topics, including (i) fund performance trends, actions to be taken by FMR to improve certain funds' overall performance and Fidelity's long-term strategies for certain funds; (ii) portfolio manager changes that have occurred during the past year; (iii) Fidelity's compensation structure for portfolio managers and key personnel, including performance benchmarks used by Fidelity in evaluating incentive compensation for portfolio managers and research analysts; (iv) the structure and process of equity research and actions taken by FMR to improve the quality of research; (v) the selection of and compensation paid by FMR to fund sub-advisers; (vi) Fidelity's fee structures and rationale for recommending different fees among categories of funds; (vii) the rationale for any differences between fund fee structures and fee structures in place for other Fidelity clients; (viii) Fidelity's rationale for recommending which funds should have a performance adjustment component as part of their management fees; and (ix) explanations for the relative total expenses borne by certain funds and classes, total expense competitive trends, and actions that might be taken by FMR to reduce total expenses for certain funds and classes.
Annual Report
Board Approval of Investment Advisory Contracts and Management Fees - continued
Based on its evaluation of all of the conclusions noted above, and after considering all material factors, the Board ultimately concluded that the advisory fee structures are fair and reasonable, and that the fund's Advisory Contracts should be renewed.
Annual Report
Investment Adviser
Fidelity Management & Research Company
Boston, MA
Investment Sub-Advisers
FMR Co., Inc.
Fidelity Management & Research (U.K.) Inc.
Fidelity Management & Research (Hong Kong) Limited
Fidelity Management & Research (Japan) Inc.
Fidelity Research & Analysis Company
FIL Investment Advisors
FIL Investment Advisors (U.K.) Ltd.
FIL Investments (Japan) Limited
General Distributor
Fidelity Distributors Corporation
Boston, MA
Transfer and Service Agents
Fidelity Investments Institutional Operations Company, Inc.
Boston, MA
Fidelity Service Company, Inc.
Boston, MA
Custodian
State Street Bank and Trust Company
Quincy, MA
VIPEMR-ANN-0210
1.888698.101
Fidelity® Variable Insurance Products:
Energy Portfolio
Annual Report
December 31, 2009
(2_fidelity_logos) (Registered_Trademark)
Contents
Performance | <Click Here> | How the fund has done over time. |
Management's Discussion | <Click Here> | The manager's review of fund performance, strategy and outlook. |
Shareholder Expense Example | <Click Here> | An example of shareholder expenses. |
Investment Changes | <Click Here> | A summary of major shifts in the fund's investments over the past six months. |
Investments | <Click Here> | A complete list of the fund's investments with their market values. |
Financial Statements | <Click Here> | Statements of assets and liabilities, operations, and changes in net assets, as well as financial highlights. |
Notes | <Click Here> | Notes to the financial statements. |
Report of Independent Registered Public Accounting Firm | <Click Here> | |
Trustees and Officers | <Click Here> | |
Distributions | <Click Here> | |
Board Approval of Investment Advisory Contracts and Management Fees | <Click Here> | |
To view a fund's proxy voting guidelines and proxy voting record for the 12-month period ended June 30, visit http://www.fidelity.com/proxyvotingresults or visit the Securities and Exchange Commission's (SEC) web site at http://www.sec.gov. You may also call 1-877-208-0098 to request a free copy of the proxy voting guidelines.
Fidelity Variable Insurance Products are separate account options which are purchased through a variable insurance contract.
Standard & Poor's, S&P and S&P 500 are registered service marks of The McGraw-Hill Companies, Inc. and have been licensed for use by Fidelity Distributors Corporation.
Other third party marks appearing herein are the property of their respective owners.
All other marks appearing herein are registered or unregistered trademarks or service marks of FMR LLC or an affiliated company.
This report and the financial statements contained herein are submitted for the general information of the shareholders of the fund. This report is not authorized for distribution to prospective investors in the fund unless preceded or accompanied by an effective prospectus.
A fund files its complete schedule of portfolio holdings with the SEC for the first and third quarters of each fiscal year on Form N-Q. Forms N-Q are available on the SEC's web site at http://www.sec.gov. A fund's Forms N-Q may be reviewed and copied at the SEC's Public Reference Room in Washington, DC. Information regarding the operation of the SEC's Public Reference Room may be obtained by calling 1-800-SEC-0330. For a complete list of the fund's portfolio holdings, view the most recent holdings listing, semiannual report, or annual report on Fidelity's web site at http://www.fidelity.com or http://www.advisor.fidelity.com, as applicable.
NOT FDIC INSURED · MAY LOSE VALUE · NO BANK GUARANTEE
Neither the fund nor Fidelity Distributors Corporation is a bank.
Annual Report
Average annual total return reflects the change in the value of an investment, assuming reinvestment of the class' dividend income and capital gains (the profits earned upon the sale of securities that have grown in value, if any) and assuming a constant rate of performance each year. During periods of reimbursement by Fidelity, a fund's total return will be greater than it would be had the reimbursement not occurred. Performance numbers are net of all underlying fund operating expenses, but do not include any insurance charges imposed by your insurance company's separate account. If performance information included the effect of these additional charges, the total returns would have been lower. How a fund did yesterday is no guarantee of how it will do tomorrow.
Average Annual Total Returns
Periods ended December 31, 2009 | Past 1
year | Past 5
years | Life of
fundA |
VIP Energy Portfolio - Initial Class C | 47.90% | 11.05% | 10.59% |
VIP Energy Portfolio - Investor ClassB, C | 47.79% | 10.94% | 10.53% |
A From July 19, 2001.
B The initial offering of Investor Class took place on July 21, 2005. Returns prior to July 21, 2005 are those of Initial Class. If Investor Class's transfer agent fee had been reflected, returns prior to July 21, 2005 would have been lower.
C Prior to October 1, 2006, VIP Energy Portfolio operated under certain different investment policies. The historical performance for the fund may not represent its current investment policies.
$10,000 Over Life of Fund
Let's say hypothetically that $10,000 was invested in VIP Energy Portfolio - Initial Class on July 19, 2001, when the fund started. The chart shows how the value of your investment would have changed, and also shows how the Standard & Poor's 500SM Index (S&P 500®) performed over the same period.

Annual Report
Market Recap: In 2009, most global markets saw both crippling lows and considerable highs. After a dismal start, the economy began to show signs of improvement, suggesting that a recovery was on the horizon. Credit markets began to heal as fiscal and monetary stimulus efforts around the world started to take effect, and corporate earnings staged an impressive rebound, fueled in large part by massive cost cutting. As a result, the flight to quality that marked most of 2008 and early 2009 shifted in March as investors flocked to riskier asset categories. The U.S. equity market, as measured by the bellwether Standard & Poor's 500SM Index and the blue-chip proxy Dow Jones Industrial AverageSM, reflected this changing environment, gaining 26.46% and 22.68%, respectively. Meanwhile, the technology-laden Nasdaq Composite® Index rose 45.32%. Foreign stocks also produced strong gains, as illustrated by the 31.93% jump of the MSCI® EAFE® Index (Europe, Australasia, Far East), a gauge of developed stock markets outside the U.S. and Canada. Emerging-markets stocks, which suffered their worst calendar-year performance ever in 2008, posted record returns this past year, with the MSCI Emerging Markets Index soaring 79.02%. A depreciating U.S. dollar helped bolster returns for U.S. investors in foreign equities.
Comments from John Dowd, Portfolio Manager of VIP Energy Portfolio: The fund solidly outperformed the 19.44% gain of the MSCI U.S. Investable Market Energy Index, as well as the S&P 500®. (For specific portfolio performance results, please refer to the performance section of this report.) Despite an overweighting in oil and gas refining/marketing stocks, which underperformed other energy segments, and a couple of individual stock miscalculations, superior security selection and beneficial industry positioning propelled the fund's return past that of the MSCI benchmark. Our underweighting in weak-performing integrated oil companies, notably Exxon Mobil and Chevron, provided the biggest boost, as did overweighting more-volatile energy services stocks. In particular, large positions in low-cost natural gas exploration and production firms Southwestern Energy and Cabot Oil & Gas both generated strong returns. Additionally, surging coal prices led our overweighted stakes in coal producers Massey Energy and Foundation Coal to become key contributors. Foundation Coal was acquired by Alpha Natural Resources during the period. Disappointments included oil refiners Sunoco and Valero Energy, natural gas exploration and production firm Comstock Resources and an underweighting in strong-performing oil-services giant Schlumberger.
Note to shareholders: In January 2010, Fidelity adopted capped benchmarks for most of its sector and industry funds, including the VIP sector portfolios. The capped benchmarks, which limit the weightings of individual issuers, better represent the investment opportunities available to the funds and will provide shareholders with more-meaningful performance comparisons. These changes do not affect the investment policies of any of the funds, and the primary benchmark for all of the funds remains the Standard & Poor's 500 Index.
The views expressed above reflect those of the portfolio manager(s) only through the end of the period as stated on the cover of this report and do not necessarily represent the views of Fidelity or any other person in the Fidelity organization. Any such views are subject to change at any time based upon market or other conditions and Fidelity disclaims any responsibility to update such views. These views may not be relied on as investment advice and, because investment decisions for a Fidelity fund are based on numerous factors, may not be relied on as an indication of trading intent on behalf of any Fidelity fund.
Annual Report
As a shareholder of the Fund, you incur two types of costs: (1) transaction costs, including redemption fees, and (2) ongoing costs, including management fees, distribution and/or service (12b-1) fees and other Fund expenses. This Example is intended to help you understand your ongoing costs (in dollars) of investing in the Fund and to compare these costs with the ongoing costs of investing in other mutual funds.
The Example is based on an investment of $1,000 invested at the beginning of the period and held for the entire period (July 1, 2009 to December 31, 2009).
Actual Expenses
The first line of the accompanying table for each class of the Fund provides information about actual account values and actual expenses. You may use the information in this line, together with the amount you invested, to estimate the expenses that you paid over the period. Simply divide your account value by $1,000.00 (for example, an $8,600 account value divided by $1,000.00 = 8.6), then multiply the result by the number in the first line for a class of the Fund under the heading entitled "Expenses Paid During Period" to estimate the expenses you paid on your account during this period. The estimate of expenses does not include any fees or other expenses of any variable annuity or variable life insurance product. If they were, the estimate of expenses you paid during the period would be higher, and your ending account value would be lower. In addition, the Fund, as a shareholder in the underlying Fidelity Central Funds, will indirectly bear its pro-rata share of the fees and expenses incurred by the underlying Fidelity Central Funds. These fees and expenses are not included in the Fund's annualized expense ratio used to calculate the expense estimate in the table below.
Hypothetical Example for Comparison Purposes
The second line of the accompanying table for each class of the Fund provides information about hypothetical account values and hypothetical expenses based on a Class' actual expense ratio and an assumed rate of return of 5% per year before expenses, which is not the Class' actual return. The hypothetical account values and expenses may not be used to estimate the actual ending account balance or expenses you paid for the period. You may use this information to compare the ongoing costs of investing in the Fund and other funds. To do so, compare this 5% hypothetical example with the 5% hypothetical examples that appear in the shareholder reports of the other funds. The estimate of expenses does not include any fees or other expenses of any variable annuity or variable life insurance product. If they were, the estimate of expenses you paid during the period would be higher, and your ending account value would be lower. In addition, the Fund, as a shareholder in the underlying Fidelity Central Funds, will indirectly bear its pro-rata share of the fees and expenses incurred by the underlying Fidelity Central Funds. These fees and expenses are not included in the Fund's annualized expense ratio used to calculate the expense estimate in the table below.
Please note that the expenses shown in the table are meant to highlight your ongoing costs only and do not reflect any transaction costs. Therefore, the second line of the table is useful in comparing ongoing costs only, and will not help you determine the relative total costs of owning different funds. In addition, if these transactional costs were included, your costs would have been higher.
|
Annualized
Expense Ratio
|
Beginning
Account Value
July 1, 2009
|
Ending
Account Value
December 31, 2009
| Expenses Paid
During Period*
July 1, 2009 to
December 31, 2009 |
Initial Class | .70% | | | |
Actual | | $ 1,000.00 | $ 1,275.30 | $ 4.01 |
HypotheticalA | | $ 1,000.00 | $ 1,021.68 | $ 3.57 |
Service Class 2 | .95% | | | |
Actual | | $ 1,000.00 | $ 1,272.60 | $ 5.44 |
HypotheticalA | | $ 1,000.00 | $ 1,020.42 | $ 4.84 |
Investor Class | .79% | | | |
Actual | | $ 1,000.00 | $ 1,274.10 | $ 4.53 |
HypotheticalA | | $ 1,000.00 | $ 1,021.22 | $ 4.02 |
A 5% return per year before expenses
* Expenses are equal to each Class' annualized expense ratio, multiplied by the average account value over the period, multiplied by 184/365 (to reflect the one-half year period).
Annual Report
Investment Changes (Unaudited)
Top Ten Stocks as of December 31, 2009 |
| % of fund's
net assets | % of fund's net assets
6 months ago |
Schlumberger Ltd. | 6.7 | 3.7 |
Southwestern Energy Co. | 6.0 | 4.9 |
Occidental Petroleum Corp. | 5.9 | 5.3 |
XTO Energy, Inc. | 5.0 | 0.0 |
Petrohawk Energy Corp. | 3.7 | 3.4 |
BJ Services Co. | 3.5 | 2.3 |
Massey Energy Co. | 3.5 | 2.2 |
BP PLC sponsored ADR | 3.5 | 0.0 |
Alpha Natural Resources, Inc. | 3.3 | 1.8 |
Transocean Ltd. | 3.3 | 3.8 |
| 44.4 | |
Top Industries (% of fund's net assets) |
As of December 31, 2009 |
| Oil, Gas & Consumable Fuels | 59.1% | |
| Energy Equipment & Services | 36.0% | |
| Electrical Equipment | 2.9% | |
| Construction & Engineering | 0.7% | |
| Gas Utilities | 0.6% | |
| All Others* | 0.7% | |

As of June 30, 2009 |
| Oil, Gas & Consumable Fuels | 58.8% | |
| Energy Equipment & Services | 35.3% | |
| Electrical Equipment | 3.3% | |
| Gas Utilities | 1.1% | |
| Construction & Engineering | 0.5% | |
| All Others* | 1.0% | |

* Includes short-term investments and net other assets. |
Annual Report
Investments December 31, 2009
Showing Percentage of Net Assets
Common Stocks - 99.8% |
| Shares | | Value |
CONSTRUCTION & ENGINEERING - 0.7% |
Construction & Engineering - 0.7% |
Jacobs Engineering Group, Inc. (a) | 68,400 | | $ 2,572,524 |
ELECTRICAL EQUIPMENT - 2.8% |
Electrical Components & Equipment - 2.7% |
centrotherm photovoltaics AG (a) | 14,099 | | 851,800 |
Energy Conversion Devices, Inc. (a)(c) | 57,327 | | 605,946 |
Evergreen Solar, Inc. (a)(c) | 141,706 | | 213,976 |
First Solar, Inc. (a)(c) | 26,857 | | 3,636,438 |
JA Solar Holdings Co. Ltd. ADR (a)(c) | 504,307 | | 2,874,550 |
SunPower Corp.: | | | |
Class A (a) | 12,500 | | 296,000 |
Class B (a) | 63,500 | | 1,330,325 |
| | 9,809,035 |
Heavy Electrical Equipment - 0.1% |
Vestas Wind Systems AS (a) | 7,383 | | 450,248 |
TOTAL ELECTRICAL EQUIPMENT | | 10,259,283 |
ELECTRONIC EQUIPMENT & COMPONENTS - 0.3% |
Electronic Equipment & Instruments - 0.3% |
Itron, Inc. (a) | 14,278 | | 964,764 |
ENERGY EQUIPMENT & SERVICES - 36.0% |
Oil & Gas Drilling - 12.2% |
Atwood Oceanics, Inc. (a) | 37,270 | | 1,336,130 |
Ensco International Ltd. ADR | 48,300 | | 1,929,102 |
Helmerich & Payne, Inc. | 127,451 | | 5,082,746 |
Hercules Offshore, Inc. (a) | 91,780 | | 438,708 |
Nabors Industries Ltd. (a) | 372,994 | | 8,164,839 |
Noble Corp. | 285,720 | | 11,628,804 |
Northern Offshore Ltd. (a) | 587,000 | | 962,137 |
Patterson-UTI Energy, Inc. | 64,014 | | 982,615 |
Pride International, Inc. (a) | 69,313 | | 2,211,778 |
Transocean Ltd. (a) | 147,047 | | 12,175,492 |
| | 44,912,351 |
Oil & Gas Equipment & Services - 23.8% |
Baker Hughes, Inc. | 20,900 | | 846,032 |
Basic Energy Services, Inc. (a) | 22,860 | | 203,454 |
BJ Services Co. | 690,860 | | 12,849,996 |
Cameron International Corp. (a) | 11,600 | | 484,880 |
Complete Production Services, Inc. (a) | 24,100 | | 313,300 |
Core Laboratories NV | 12,500 | | 1,476,500 |
Dresser-Rand Group, Inc. (a) | 20,400 | | 644,844 |
Exterran Holdings, Inc. (a) | 46,243 | | 991,912 |
Global Industries Ltd. (a) | 172,034 | | 1,226,602 |
Halliburton Co. | 210,774 | | 6,342,190 |
Helix Energy Solutions Group, Inc. (a) | 38,900 | | 457,075 |
Key Energy Services, Inc. (a) | 31,200 | | 274,248 |
National Oilwell Varco, Inc. | 266,478 | | 11,749,015 |
Newpark Resources, Inc. (a) | 10,993 | | 46,500 |
Oceaneering International, Inc. (a) | 46,234 | | 2,705,614 |
|
| Shares | | Value |
Oil States International, Inc. (a) | 14,100 | | $ 553,989 |
Schlumberger Ltd. | 379,142 | | 24,678,353 |
Smith International, Inc. | 185,857 | | 5,049,735 |
Superior Energy Services, Inc. (a) | 102,154 | | 2,481,321 |
Superior Well Services, Inc. (a) | 4,800 | | 68,448 |
TSC Offshore Group Ltd. (a) | 746,000 | | 267,382 |
Weatherford International Ltd. (a) | 673,366 | | 12,059,985 |
Willbros Group, Inc. (a) | 108,033 | | 1,822,517 |
| | 87,593,892 |
TOTAL ENERGY EQUIPMENT & SERVICES | | 132,506,243 |
GAS UTILITIES - 0.6% |
Gas Utilities - 0.6% |
Questar Corp. | 43,800 | | 1,820,766 |
Zhongyu Gas Holdings Ltd. (a) | 3,884,000 | | 384,291 |
| | 2,205,057 |
METALS & MINING - 0.3% |
Diversified Metals & Mining - 0.3% |
Teck Resources Ltd. Class B (sub. vtg.) (a) | 35,700 | | 1,251,106 |
OIL, GAS & CONSUMABLE FUELS - 59.1% |
Coal & Consumable Fuels - 10.9% |
Alpha Natural Resources, Inc. (a) | 284,383 | | 12,336,535 |
Arch Coal, Inc. | 357,250 | | 7,948,813 |
Centennial Coal Co. Ltd. | 125,698 | | 451,633 |
Cloud Peak Energy, Inc. | 40,000 | | 582,400 |
CONSOL Energy, Inc. | 112,821 | | 5,618,486 |
Massey Energy Co. | 304,352 | | 12,785,828 |
PT Bumi Resources Tbk | 1,598,000 | | 411,157 |
| | 40,134,852 |
Integrated Oil & Gas - 13.6% |
BG Group PLC | 58,861 | | 1,067,338 |
BP PLC sponsored ADR | 219,600 | | 12,730,212 |
Chevron Corp. | 9,876 | | 760,353 |
ConocoPhillips | 1,036 | | 52,909 |
Hess Corp. | 700 | | 42,350 |
Marathon Oil Corp. | 369,821 | | 11,545,812 |
Occidental Petroleum Corp. | 267,683 | | 21,776,012 |
Royal Dutch Shell PLC Class A sponsored ADR | 30,800 | | 1,851,388 |
| | 49,826,374 |
Oil & Gas Exploration & Production - 33.1% |
Anadarko Petroleum Corp. | 192,051 | | 11,987,823 |
Apache Corp. | 62,100 | | 6,406,857 |
Arena Resources, Inc. (a) | 51,700 | | 2,229,304 |
Brigham Exploration Co. (a) | 64,900 | | 879,395 |
Cabot Oil & Gas Corp. | 239,218 | | 10,427,513 |
Canadian Natural Resources Ltd. | 48,500 | | 3,508,304 |
Comstock Resources, Inc. (a) | 94,920 | | 3,850,904 |
Denbury Resources, Inc. (a) | 71,700 | | 1,061,160 |
EOG Resources, Inc. | 36,200 | | 3,522,260 |
EXCO Resources, Inc. | 369,423 | | 7,842,850 |
Common Stocks - continued |
| Shares | | Value |
OIL, GAS & CONSUMABLE FUELS - CONTINUED |
Oil & Gas Exploration & Production - continued |
Newfield Exploration Co. (a) | 78,224 | | $ 3,772,744 |
Niko Resources Ltd. | 9,100 | | 852,272 |
OPTI Canada, Inc. (a) | 80,500 | | 155,537 |
Painted Pony Petroleum Ltd. Class A (a) | 67,000 | | 369,866 |
Petrobank Energy & Resources Ltd. (a) | 14,200 | | 692,126 |
Petrohawk Energy Corp. (a) | 561,869 | | 13,479,237 |
Pioneer Natural Resources Co. | 8,000 | | 385,360 |
Range Resources Corp. | 43,263 | | 2,156,661 |
Southwestern Energy Co. (a) | 457,412 | | 22,047,258 |
Ultra Petroleum Corp. (a) | 57,700 | | 2,876,922 |
Whiting Petroleum Corp. (a) | 67,483 | | 4,821,660 |
XTO Energy, Inc. | 392,346 | | 18,255,859 |
| | 121,581,872 |
Oil & Gas Refining & Marketing - 1.5% |
Frontier Oil Corp. | 220,081 | | 2,649,775 |
Tesoro Corp. (c) | 23,800 | | 322,490 |
Valero Energy Corp. | 92,857 | | 1,555,355 |
World Fuel Services Corp. (c) | 35,600 | | 953,724 |
| | 5,481,344 |
Oil & Gas Storage & Transport - 0.0% |
Williams Companies, Inc. | 1,950 | | 41,106 |
TOTAL OIL, GAS & CONSUMABLE FUELS | | 217,065,548 |
TOTAL COMMON STOCKS (Cost $341,858,716) | 366,824,525 |
Convertible Bonds - 0.1% |
| Principal Amount | | Value |
ELECTRICAL EQUIPMENT - 0.1% |
Electrical Components & Equipment - 0.1% |
SunPower Corp. 4.75% 4/15/14
(Cost $180,000) | | $ 180,000 | | $ 204,084 |
Money Market Funds - 2.3% |
| Shares | | |
Fidelity Cash Central Fund, 0.16% (d) | 1,249,124 | | 1,249,124 |
Fidelity Securities Lending Cash Central Fund, 0.15% (b)(d) | 7,275,800 | | 7,275,800 |
TOTAL MONEY MARKET FUNDS (Cost $8,524,924) | 8,524,924 |
TOTAL INVESTMENT PORTFOLIO - 102.2% (Cost $350,563,640) | 375,553,533 |
NET OTHER ASSETS - (2.2)% | | (7,935,676) |
NET ASSETS - 100% | $ 367,617,857 |
Legend |
(a) Non-income producing |
(b) Investment made with cash collateral received from securities on loan. |
(c) Security or a portion of the security is on loan at period end. |
(d) Affiliated fund that is available only to investment companies and other accounts managed by Fidelity Investments. The rate quoted is the annualized seven-day yield of the fund at period end. A complete unaudited listing of the fund's holdings as of its most recent quarter end is available upon request. |
Affiliated Central Funds |
Information regarding fiscal year to date income earned by the Fund from investments in Fidelity Central Funds is as follows: |
Fund | Income earned |
Fidelity Cash Central Fund | $ 11,089 |
Fidelity Securities Lending Cash Central Fund | 91,251 |
Total | $ 102,340 |
Other Information |
The following is a summary of the inputs used, as of December 31, 2009, involving the Fund's assets and liabilities carried at value. The inputs or methodology used for valuing securities may not be an indication of the risk associated with investing in those securities. For more information on valuation inputs, and their aggregation into the levels used in the table below, please refer to the Security Valuation section in the accompanying Notes to Financial Statements. |
Valuation Inputs at Reporting Date: |
Description | Total | Level 1 | Level 2 | Level 3 |
Investments in Securities: | | | | |
Common Stocks | $ 366,824,525 | $ 366,172,852 | $ 651,673 | $ - |
Convertible Bonds | 204,084 | - | 204,084 | - |
Money Market Funds | 8,524,924 | 8,524,924 | - | - |
Total Investments in Securities: | $ 375,553,533 | $ 374,697,776 | $ 855,757 | $ - |
Distribution of investments by country of issue, as a percentage of total net assets, is as follows: (Unaudited) |
United States of America | 74.0% |
Switzerland | 9.8% |
Netherlands Antilles | 6.7% |
United Kingdom | 4.8% |
Canada | 2.6% |
Cayman Islands | 1.0% |
Others (individually less than 1%) | 1.1% |
| 100.0% |
Income Tax Information |
At December 31, 2009, the fund had a capital loss carryforward of approximately $53,390,490 all of which will expire on December 31, 2017. |
The fund intends to elect to defer to its fiscal year ending December 31, 2010 approximately $6,746,004 of losses recognized during the period November 1, 2009 to December 31, 2009. |
See accompanying notes which are an integral part of the financial statements.
Annual Report
Statement of Assets and Liabilities
| December 31, 2009 |
Assets | | |
Investment in securities, at value (including securities loaned of $6,976,900) - See accompanying schedule: Unaffiliated issuers (cost $342,038,716) | $ 367,028,609 | |
Fidelity Central Funds (cost $8,524,924) | 8,524,924 | |
Total Investments (cost $350,563,640) | | $ 375,553,533 |
Foreign currency held at value (cost $264) | | 264 |
Receivable for investments sold | | 18,613 |
Receivable for fund shares sold | | 74,538 |
Dividends receivable | | 297,167 |
Interest receivable | | 1,809 |
Distributions receivable from Fidelity Central Funds | | 12,040 |
Prepaid expenses | | 1,535 |
Other receivables | | 5,021 |
Total assets | | 375,964,520 |
| | |
Liabilities | | |
Payable for investments purchased | $ 3,002 | |
Payable for fund shares redeemed | 789,791 | |
Accrued management fee | 168,164 | |
Distribution fees payable | 25,635 | |
Other affiliated payables | 37,693 | |
Other payables and accrued expenses | 46,580 | |
Collateral on securities loaned, at value | 7,275,800 | |
Total liabilities | | 8,346,665 |
| | |
Net Assets | | $ 367,617,855 |
Net Assets consist of: | | |
Paid in capital | | $ 409,767,096 |
Accumulated undistributed net realized gain (loss) on investments and foreign currency transactions | | (67,138,007) |
Net unrealized appreciation (depreciation) on investments and assets and liabilities in foreign currencies | | 24,988,766 |
Net Assets | | $ 367,617,855 |
Statement of Assets and Liabilities - continued
| December 31, 2009 |
Initial Class:
Net Asset Value, offering price and redemption price per share ($152,028,085 ÷ 9,007,753 shares) | | $ 16.88 |
| | |
Service Class 2:
Net Asset Value, offering price and redemption price per share ($125,668,857 ÷ 7,483,624 shares) | | $ 16.79 |
| | |
Investor Class:
Net Asset Value, offering price and redemption price per share ($89,920,913 ÷ 5,337,748 shares) | | $ 16.85 |
See accompanying notes which are an integral part of the financial statements.
Annual Report
Financial Statements - continued
Statement of Operations
| Year ended December 31, 2009 |
Investment Income | | |
Dividends | | $ 3,600,772 |
Interest | | 5,664 |
Income from Fidelity Central Funds | | 102,340 |
Total income | | 3,708,776 |
| | |
Expenses | | |
Management fee | $ 1,774,478 | |
Transfer agent fees | 320,243 | |
Distribution fees | 266,327 | |
Accounting and security lending fees | 124,927 | |
Custodian fees and expenses | 14,812 | |
Independent trustees' compensation | 2,184 | |
Registration fees | 123 | |
Audit | 41,945 | |
Legal | 1,863 | |
Miscellaneous | 29,151 | |
Total expenses before reductions | 2,576,053 | |
Expense reductions | (15,112) | 2,560,941 |
Net investment income (loss) | | 1,147,835 |
Realized and Unrealized Gain (Loss) Net realized gain (loss) on: | | |
Investment securities: | | |
Unaffiliated issuers | (28,865,515) | |
Foreign currency transactions | (79,207) | |
Total net realized gain (loss) | | (28,944,722) |
Change in net unrealized appreciation (depreciation) on: Investment securities | 147,681,525 | |
Assets and liabilities in foreign currencies | (468) | |
Total change in net unrealized appreciation (depreciation) | | 147,681,057 |
Net gain (loss) | | 118,736,335 |
Net increase (decrease) in net assets resulting from operations | | $ 119,884,170 |
Statement of Changes in Net Assets
| Year ended
December 31, 2009 | Year ended
December 31, 2008 |
Increase (Decrease) in Net Assets | | |
Operations | | |
Net investment income (loss) | $ 1,147,835 | $ 197,135 |
Net realized gain (loss) | (28,944,722) | (26,219,761) |
Change in net unrealized appreciation (depreciation) | 147,681,057 | (343,580,729) |
Net increase (decrease) in net assets resulting from operations | 119,884,170 | (369,603,355) |
Distributions to shareholders from net investment income | (1,156,325) | (275,275) |
Distributions to shareholders from net realized gain | - | (18,707,189) |
Total distributions | (1,156,325) | (18,982,464) |
Share transactions - net increase (decrease) | (14,569,173) | (29,506,360) |
Redemption fees | 154,874 | 458,118 |
Total increase (decrease) in net assets | 104,313,546 | (417,634,061) |
| | |
Net Assets | | |
Beginning of period | 263,304,309 | 680,938,370 |
End of period | $ 367,617,855 | $ 263,304,309 |
See accompanying notes which are an integral part of the financial statements.
Annual Report
Financial Highlights - Initial Class
Years ended December 31, | 2009 | 2008 | 2007 | 2006 | 2005 |
Selected Per-Share Data | | | | | |
Net asset value, beginning of period | $ 11.46 | $ 26.55 | $ 19.04 | $ 18.92 | $ 13.62 |
Income from Investment Operations | | | | | |
Net investment income (loss) C | .07 | .03 | .07 | .09 | .10 |
Net realized and unrealized gain (loss) | 5.41 | (14.31) | 8.62 | 3.09 | 6.20 |
Total from investment operations | 5.48 | (14.28) | 8.69 | 3.18 | 6.30 |
Distributions from net investment income | (.07) | (.03) | (.06) | (.16) | (.08) |
Distributions from net realized gain | - | (.80) | (1.13) | (2.91) | (.94) |
Total distributions | (.07) | (.83) | (1.19) | (3.07) | (1.02) |
Redemption fees added to paid in capital C | .01 | .02 | .01 | .01 | .02 |
Net asset value, end of period | $ 16.88 | $ 11.46 | $ 26.55 | $ 19.04 | $ 18.92 |
Total Return A, B | 47.90% | (54.26)% | 45.97% | 16.91% | 46.31% |
Ratios to Average Net Assets D, F | | | | | |
Expenses before reductions | .71% | .70% | .70% | .71% | .72% |
Expenses net of fee waivers, if any | .71% | .70% | .70% | .71% | .72% |
Expenses net of all reductions | .70% | .69% | .70% | .70% | .66% |
Net investment income (loss) | .47% | .13% | .31% | .43% | .56% |
Supplemental Data | | | | | |
Net assets, end of period (000 omitted) | $ 152,028 | $ 117,940 | $ 355,854 | $ 280,537 | $ 334,368 |
Portfolio turnover rate E | 113% | 130% | 61% | 151% | 107% |
A Total returns do not reflect charges attributable to your insurance company's separate account. Inclusion of these charges would reduce the total returns shown.
B Total returns would have been lower had certain expenses not been reduced during the periods shown.
C Calculated based on average shares outstanding during the period.
D Fees and expenses of the underlying Fidelity Central Funds are not included in the Fund's expense ratio. The Fund indirectly bears its proportionate share of the expenses of any underlying Fidelity Central Funds.
E Amount does not include the portfolio activity of any underlying Fidelity Central Funds.
F Expense ratios reflect operating expenses of the class. Expenses before reductions do not reflect amounts reimbursed by the investment adviser or reductions from brokerage service arrangements or reductions from other expense offset arrangements and do not represent the amount paid by the class during periods when reimbursements or reductions occur. Expenses net of fee waivers reflect expenses after reimbursement by the investment adviser but prior to reductions from brokerage service arrangements or other expense offset arrangements. Expenses net of all reductions represent the net expenses paid by the class.
Financial Highlights - Service Class 2
Years ended December 31, | 2009 | 2008 | 2007 | 2006 | 2005 H |
Selected Per-Share Data | | | | | |
Net asset value, beginning of period | $ 11.40 | $ 26.44 | $ 18.98 | $ 18.90 | $ 15.80 |
Income from Investment Operations | | | | | |
Net investment income (loss) E | .03 | (.03) | .02 | .04 | .04 |
Net realized and unrealized gain (loss) | 5.38 | (14.23) | 8.58 | 3.07 | 4.04 |
Total from investment operations | 5.41 | (14.26) | 8.60 | 3.11 | 4.08 |
Distributions from net investment income | (.03) | - | (.02) | (.13) | (.07) |
Distributions from net realized gain | - | (.80) | (1.13) | (2.91) | (.92) |
Total distributions | (.03) | (.80) | (1.15) | (3.04) | (.99) |
Redemption fees added to paid in capital E | .01 | .02 | .01 | .01 | .01 |
Net asset value, end of period | $ 16.79 | $ 11.40 | $ 26.44 | $ 18.98 | $ 18.90 |
Total Return B, C, D | 47.57% | (54.40)% | 45.64% | 16.55% | 25.80% |
Ratios to Average Net Assets F, I | | | | | |
Expenses before reductions | .96% | .95% | .95% | .96% | .97% A |
Expenses net of fee waivers, if any | .96% | .95% | .95% | .96% | .97% A |
Expenses net of all reductions | .95% | .94% | .94% | .95% | .91% A |
Net investment income (loss) | .22% | (.12)% | .07% | .18% | .31% A |
Supplemental Data | | | | | |
Net assets, end of period (000 omitted) | $ 125,669 | $ 90,109 | $ 193,887 | $ 70,305 | $ 20,211 |
Portfolio turnover rate G | 113% | 130% | 61% | 151% | 107% |
A Annualized
B Total returns for periods of less than one year are not annualized.
C Total returns do not reflect charges attributable to your insurance company's separate account. Inclusion of these charges would reduce the total returns shown.
D Total returns would have been lower had certain expenses not been reduced during the periods shown.
E Calculated based on average shares outstanding during the period.
F Fees and expenses of the underlying Fidelity Central Funds are not included in the Fund's expense ratio. The Fund indirectly bears its proportionate share of the expenses of any underlying Fidelity Central Funds.
G Amount does not include the portfolio activity of any underlying Fidelity Central Funds.
H For the period April 6, 2005 (commencement of sale of shares) to December 31, 2005.
I Expense ratios reflect operating expenses of the class. Expenses before reductions do not reflect amounts reimbursed by the investment adviser or reductions from brokerage service arrangements or reductions from other expense offset arrangements and do not represent the amount paid by the class during periods when reimbursements or reductions occur. Expense ratios before reductions for start-up periods may not be representative of longer-term operating periods. Expenses net of fee waivers reflect expenses after reimbursement by the investment adviser but prior to reductions from brokerage service arrangements or other expense offset arrangements. Expenses net of all reductions represent the net expenses paid by the class.
See accompanying notes which are an integral part of the financial statements.
Annual Report
Financial Highlights - Investor Class
Years ended December 31, | 2009 | 2008 | 2007 | 2006 | 2005 H |
Selected Per-Share Data | | | | | |
Net asset value, beginning of period | $ 11.44 | $ 26.49 | $ 19.00 | $ 18.91 | $ 16.76 |
Income from Investment Operations | | | | | |
Net investment income (loss) E | .05 | .01 | .05 | .06 | .03 |
Net realized and unrealized gain (loss) | 5.41 | (14.28) | 8.61 | 3.08 | 3.11 |
Total from investment operations | 5.46 | (14.27) | 8.66 | 3.14 | 3.14 |
Distributions from net investment income | (.06) | - J | (.05) | (.15) | (.08) |
Distributions from net realized gain | - | (.80) | (1.13) | (2.91) | (.92) |
Total distributions | (.06) | (.80) | (1.18) | (3.06) | (1.00) |
Redemption fees added to paid in capital E | .01 | .02 | .01 | .01 | .01 |
Net asset value, end of period | $ 16.85 | $ 11.44 | $ 26.49 | $ 19.00 | $ 18.91 |
Total Return B, C, D | 47.79% | (54.32)% | 45.88% | 16.69% | 18.73% |
Ratios to Average Net Assets F, I | | | | | |
Expenses before reductions | .81% | .79% | .81% | .84% | .91% A |
Expenses net of fee waivers, if any | .81% | .79% | .81% | .84% | .91% A |
Expenses net of all reductions | .80% | .78% | .81% | .82% | .85% A |
Net investment income (loss) | .37% | .04% | .20% | .31% | .37% A |
Supplemental Data | | | | | |
Net assets, end of period (000 omitted) | $ 89,921 | $ 55,256 | $ 131,198 | $ 51,436 | $ 16,402 |
Portfolio turnover rate G | 113% | 130% | 61% | 151% | 107% |
A Annualized
B Total returns for periods of less than one year are not annualized.
C Total returns do not reflect charges attributable to your insurance company's separate account. Inclusion of these charges would reduce the total returns shown.
D Total returns would have been lower had certain expenses not been reduced during the periods shown.
E Calculated based on average shares outstanding during the period.
F Fees and expenses of the underlying Fidelity Central Funds are not included in the Fund's expense ratio. The Fund indirectly bears its proportionate share of the expenses of any underlying Fidelity Central Funds.
G Amount does not include the portfolio activity of any underlying Fidelity Central Funds.
H For the period July 21, 2005 (commencement of sale of shares) to December 31, 2005.
I Expense ratios reflect operating expenses of the class. Expenses before reductions do not reflect amounts reimbursed by the investment adviser or reductions from brokerage service arrangements or reductions from other expense offset arrangements and do not represent the amount paid by the class during periods when reimbursements or reductions occur. Expense ratios before reductions for start-up periods may not be representative of longer-term operating periods. Expenses net of fee waivers reflect expenses after reimbursement by the investment adviser but prior to reductions from brokerage service arrangements or other expense offset arrangements. Expenses net of all reductions represent the net expenses paid by the class.
J Amount represents less than $.01 per share.
See accompanying notes which are an integral part of the financial statements.
Annual Report
Notes to Financial Statements
For the period ended December 31, 2009
1. Organization.
VIP Energy Portfolio (the Fund) is a fund of Variable Insurance Products Fund IV (the trust) and is authorized to issue an unlimited number of shares. The trust is registered under the Investment Company Act of 1940, as amended (the 1940 Act), as an open-end management investment company organized as a Massachusetts business trust. Shares of the Fund may only be purchased by insurance companies for the purpose of funding variable annuity or variable life insurance contracts. The Fund offers the following classes of shares: Initial Class shares, Service Class 2 shares and Investor Class shares. All classes have equal rights and voting privileges, except for matters affecting a single class. Investment income, realized and unrealized capital gains and losses, the common expenses of the Fund, and certain fund-level expense reductions, if any, are allocated on a pro-rata basis to each class based on the relative net assets of each class to the total net assets of the Fund. Each class differs with respect to transfer agent and distribution and service plan fees incurred. Certain expense reductions also differ by class.
2. Investments in Fidelity Central Funds.
The Fund may invest in Fidelity Central Funds, which are open-end investment companies available only to other investment companies and accounts managed by Fidelity Management & Research Company (FMR) and its affiliates. The Fund's Schedule of Investments lists each of the Fidelity Central Funds held as of period end, if any, as an investment of the Fund, but does not include the underlying holdings of each Fidelity Central Fund. As an Investing Fund, the Fund indirectly bears its proportionate share of the expenses of the underlying Fidelity Central Funds.
The Money Market Central Funds seek preservation of capital and current income and are managed by Fidelity Investments Money Management, Inc. (FIMM), an affiliate of FMR.
A complete unaudited list of holdings for each Fidelity Central Fund is available upon request or at the Securities and Exchange Commission (the SEC) web site at www.sec.gov. In addition, the financial statements of the Fidelity Central Funds, which are not covered by the Fund's Report of Independent Registered Public Accounting Firm, are available on the SEC web site or upon request.
3. Significant Accounting Policies.
The financial statements have been prepared in conformity with accounting principles generally accepted in the United States of America, which require management to make certain estimates and assumptions at the date of the financial statements. Actual results could differ from those estimates. Events or transactions occurring after period end through the date that the financial statements were issued, February 12, 2010, have been evaluated in the preparation of the financial statements. The following summarizes the significant accounting policies of the Fund:
Security Valuation. Investments are valued as of 4:00 p.m. Eastern time on the last calendar day of the period. The Fund uses independent pricing services approved by the Board of Trustees to value its investments. When current market prices or quotations are not readily available or reliable, valuations may be determined in good faith in accordance with procedures adopted by the Board of Trustees. Factors used in determining value may include significant market or security specific events, changes in interest rates and credit quality. The frequency with which these procedures are used cannot be predicted and may be utilized to a significant extent. The value used for net asset value (NAV) calculation under these procedures may differ from published prices for the same securities.
The Fund categorizes the inputs to valuation techniques used to value its investments into a disclosure hierarchy consisting of three levels as shown below.
Level 1 - quoted prices in active markets for identical investments
Level 2 - other significant observable inputs (including quoted prices for similar investments, interest rates, prepayment speeds, etc.)
Level 3 - unobservable inputs (including the fund's own assumptions based on the best information available)
Changes in valuation techniques may result in transfers in or out of an assigned level within the disclosure hierarchy. The aggregate value of investments by input level, as of December 31, 2009 is included at the end of the Fund's Schedule of Investments. Valuation techniques used to value the Fund's investments by major category are as follows.
Equity securities, including restricted securities, for which market quotations are readily available, are valued at the last reported sale price or official closing price as reported by an independent pricing service on the primary market or exchange on which they are traded and are categorized as level 1 in the hierarchy. In the event there were no sales during the day or closing prices are not available, securities are valued at the last quoted bid price or may be valued using the last available price and categorized as Level 2 in the hierarchy. For foreign equity securities, when significant market or security events arise, comparisons to the valuation of American Depository Receipts (ADRs), futures contracts, exchange-traded funds (ETFs) and certain indexes as well as quoted prices for similar securities are used and are categorized as Level 2 in the hierarchy in these circumstances. For restricted securities and private placements where observable inputs are limited, assumptions about market activity and risk are used and are categorized as level 3 in the hierarchy.
Annual Report
3. Significant Accounting Policies - continued
Security Valuation - continued
Debt securities, including restricted securities, are valued based on evaluated quotations received from independent pricing services or from dealers who make markets in such securities. For corporate bonds, pricing services utilize matrix pricing which considers yield or price of bonds of comparable quality, coupon, maturity and type as well as dealer supplied prices and are generally categorized as Level 2 in the hierarchy. Investments in open-end mutual funds, including the Fidelity Money Market Central Funds, are valued at their closing net asset value each business day and are categorized as Level 1 in the hierarchy. Short-term securities with remaining maturities of sixty days or less for which quotations are not readily available are valued at amortized cost, which approximates value and are categorized as level 2 in the hierarchy.
When independent prices are unavailable or unreliable, debt securities may be valued utilizing pricing matrices which consider similar factors that would be used by independent pricing services. These are generally categorized as Level 2 in the hierarchy but may be Level 3 depending on the circumstances.
Foreign Currency. The Fund uses foreign currency contracts to facilitate transactions in foreign-denominated securities. Losses from these transactions may arise from changes in the value of the foreign currency or if the counterparties do not perform under the contracts' terms.
Foreign-denominated assets, including investment securities, and liabilities are translated into U.S. dollars at the exchange rate at period end. Purchases and sales of investment securities, income and dividends received and expenses denominated in foreign currencies are translated into U.S. dollars at the exchange rate in effect on the transaction date.
The effects of exchange rate fluctuations on investments are included with the net realized and unrealized gain (loss) on investment securities. Other foreign currency transactions resulting in realized and unrealized gain (loss) are disclosed separately.
Investment Transactions and Income. For financial reporting purposes, the Fund's investment holdings and NAV include trades executed through the end of the last business day of the period. The NAV per share for processing shareholder transactions is calculated as of the close of business of the New York Stock Exchange (NYSE), normally 4:00 p.m. Eastern time and includes trades executed through the end of the prior business day. Gains and losses on securities sold are determined on the basis of identified cost and may include proceeds received from litigation. Dividend income is recorded on the ex-dividend date, except for certain dividends from foreign securities where the ex-dividend date may have passed, which are recorded as soon as the Fund is informed of the ex-dividend date. Non-cash dividends included in dividend income, if any, are recorded at the fair market value of the securities received. Distributions received on securities that represent a return of capital or capital gain are recorded as a reduction of cost of investments and/or as a realized gain. The Fund estimates the components of distributions received that may be considered return of capital distributions or capital gain distributions. Interest income and distributions from the Fidelity Central Funds are accrued as earned. Interest income includes coupon interest and amortization of premium and accretion of discount on debt securities. Investment income is recorded net of foreign taxes withheld where recovery of such taxes is uncertain.
Expenses. Most expenses of the trust can be directly attributed to a fund. Expenses which cannot be directly attributed are apportioned among each Fund in the trust. Expense estimates are accrued in the period to which they relate and adjustments are made when actual amounts are known.
Income Tax Information and Distributions to Shareholders. Each year, the Fund intends to qualify as a regulated investment company by distributing substantially all of its taxable income and realized gains under Subchapter M of the Internal Revenue Code and filing its U.S. federal tax return. As a result, no provision for income taxes is required. As of December 31, 2009, the Fund did not have any unrecognized tax benefits in the accompanying financial statements. A Fund's federal tax return is subject to examination by the Internal Revenue Service (IRS) for a period of three years. Foreign taxes are provided for based on the Fund's understanding of the tax rules and rates that exist in the foreign markets in which it invests.
Distributions are recorded on the ex-dividend date. Income dividends and capital gain distributions are declared separately for each class. Income and capital gain distributions are determined in accordance with income tax regulations, which may differ from generally accepted accounting principles.
Capital accounts within the financial statements are adjusted for permanent book-tax differences. These adjustments have no impact on net assets or the results of operations. Temporary book-tax differences will reverse in a subsequent period.
Book-tax differences are primarily due to the short-term gain distributions from the Fidelity Central Funds, foreign currency transactions, passive foreign investment companies (PFIC), capital loss carryforwards and losses deferred to wash sales and excise tax regulations.
The federal tax cost of investment securities and unrealized appreciation (depreciation) as of period end were as follows:
Gross unrealized appreciation | $ 70,597,312 |
Gross unrealized depreciation | (52,608,932) |
Net unrealized appreciation (depreciation) | $ 17,988,380 |
| |
Tax Cost | $ 357,565,153 |
Annual Report
Notes to Financial Statements - continued
3. Significant Accounting Policies - continued
Income Tax Information and Distributions to Shareholders - continued
The tax-based components of distributable earnings as of period end were as follows:
Capital loss carryforward | $ (53,390,490) |
Net unrealized appreciation (depreciation) | $ 17,987,253 |
The tax character of distributions paid was as follows:
| December 31, 2009 | December 31, 2008 |
Ordinary Income | $ 1,156,325 | $ 2,562,622 |
Long-term Capital Gains | - | 16,419,842 |
Total | $ 1,156,325 | $ 18,982,464 |
Trading (Redemption) Fees. Shares held less than 60 days are subject to a redemption fee equal to 1% of the proceeds of the redeemed shares. All redemption fees, including any estimated redemption fees paid by FMR, are retained by the Fund and accounted for as an addition to paid in capital.
4. Purchases and Sales of Investments.
Purchases and sales of securities, other than short-term securities, aggregated $347,708,014 and $356,645,998, respectively.
5. Fees and Other Transactions with Affiliates.
Management Fee. FMR and its affiliates provide the Fund with investment management related services for which the Fund pays a monthly management fee. The management fee is the sum of an individual fund fee rate that is based on an annual rate of .30% of the Fund's average net assets and a group fee rate that averaged .26% during the period. The group fee rate is based upon the average net assets of all the mutual funds advised by FMR. The group fee rate decreases as assets under management increase and increases as assets under management decrease. For the period, the total annual management fee rate was .56% of the Fund's average net assets.
Distribution and Service Plan. In accordance with Rule 12b-1 of the 1940 Act, the Fund has adopted a separate 12b-1 Plan for Service Class 2 shares. Service Class 2 pays Fidelity Distributors Corporation (FDC), an affiliate of FMR, a service fee. For the period, the service fee is based on an annual rate of .25% of Service Class 2's average net assets.
For the period, Service Class 2 paid FDC $266,327, all of which was re-allowed to insurance companies for the distribution of shares and providing shareholder support services.
Transfer Agent Fees. Fidelity Investments Institutional Operations Company, Inc. (FIIOC), an affiliate of FMR, is the Fund's transfer, dividend disbursing, and shareholder servicing agent. FIIOC receives an asset-based fee with respect to each class. Each class (with the exception of Investor Class) pays a transfer agent fee, excluding out of pocket expenses, equal to an annual rate of .07% of average net assets. Investor Class pays a monthly asset-based transfer agent fee of .15% of average net assets. The total transfer agent fees paid by each class to FIIOC, including out of pocket expenses, were as follows:
Initial Class | $ 109,902 |
Service Class 2 | 82,533 |
Investor Class | 127,808 |
| $ 320,243 |
Accounting and Security Lending Fees. Fidelity Service Company, Inc. (FSC), an affiliate of FMR, maintains the Fund's accounting records. The accounting fee is based on the level of average net assets for the month. Under a separate contract, FSC administers the security lending program. The security lending fee is based on the number and duration of lending transactions.
Brokerage Commissions. The Fund placed a portion of its portfolio transactions with brokerage firms which are affiliates of the investment adviser. The commissions paid to these affiliated firms were $2,329 for the period.
6. Committed Line of Credit.
The Fund participates with other funds managed by FMR in a $3.5 billion credit facility (the "line of credit") to be utilized for temporary or emergency purposes to fund shareholder redemptions or for other short-term liquidity purposes. The Fund has agreed to pay commitment fees on its pro-rata portion of the line of credit, which amounted to $1,529 and is reflected in Miscellaneous Expense on the Statement of Operations. During the period, there were no borrowings on this line of credit.
Annual Report
7. Security Lending.
The Fund lends portfolio securities from time to time in order to earn additional income. On the settlement date of the loan, the Fund receives collateral (in the form of U.S. Treasury obligations, letters of credit and/or cash) against the loaned securities and maintains collateral in an amount not less than 100% of the market value of the loaned securities during the period of the loan. The market value of the loaned securities is determined at the close of business of the Fund and any additional required collateral is delivered to the Fund on the next business day. If the borrower defaults on its obligation to return the securities loaned because of insolvency or other reasons, a fund could experience delays and costs in recovering the securities loaned or in gaining access to the collateral. Any cash collateral received is invested in the Fidelity Securities Lending Cash Central Fund. The value of loaned securities and cash collateral at period end are disclosed on the Fund's Statement of Assets and Liabilities. Security lending income represents the income earned on investing cash collateral, less fees and expenses associated with the loan, plus any premium payments that may be received on the loan of certain types of securities. Security lending income is presented in the Statement of Operations as a component of income from Fidelity Central Funds. Net income from lending portfolio securities during the period amounted to $91,251.
8. Expense Reductions.
Many of the brokers with whom FMR places trades on behalf of the Fund provided services to the Fund in addition to trade execution. These services included payments of certain expenses on behalf of the Fund totaling $15,112 for the period.
9. Distributions to Shareholders.
Distributions to shareholders of each class were as follows:
Years ended December 31, | 2009 | 2008 |
From net investment income | | |
Initial Class | $ 612,974 | $ 256,873 |
Service Class 2 | 245,394 | - |
Investor Class | 297,957 | 18,402 |
Total | $ 1,156,325 | $ 275,275 |
From net realized gain | | |
Initial Class | $ - | $ 8,939,423 |
Service Class 2 | - | 6,049,173 |
Investor Class | - | 3,718,593 |
Total | $ - | $ 18,707,189 |
10. Share Transactions.
Transactions for each class of shares were as follows:
| Shares | Dollars |
Years ended December 31, | 2009 | 2008 | 2009 | 2008 |
Initial Class | | | | |
Shares sold | 1,204,844 | 1,984,359 | $ 16,607,740 | $ 49,227,554 |
Reinvestment of distributions | 36,815 | 627,226 | 612,974 | 9,196,296 |
Shares redeemed | (2,529,302) | (5,719,043) | (35,099,465) | (116,160,558) |
Net increase (decrease) | (1,287,643) | (3,107,458) | $ (17,878,751) | $ (57,736,708) |
Service Class 2 | | | | |
Shares sold | 1,896,791 | 3,461,499 | $ 25,683,905 | $ 81,684,684 |
Reinvestment of distributions | 14,810 | 428,438 | 245,394 | 6,049,173 |
Shares redeemed | (2,330,582) | (3,320,478) | (30,821,580) | (66,620,993) |
Net increase (decrease) | (418,981) | 569,459 | $ (4,892,281) | $ 21,112,864 |
Investor Class | | | | |
Shares sold | 1,690,015 | 2,051,429 | $ 23,990,831 | $ 52,822,887 |
Reinvestment of distributions | 17,928 | 264,475 | 297,957 | 3,736,995 |
Shares redeemed | (1,201,221) | (2,438,344) | (16,086,929) | (49,442,398) |
Net increase (decrease) | 506,722 | (122,440) | $ 8,201,859 | $ 7,117,484 |
Annual Report
Notes to Financial Statements - continued
11. Other.
The Fund's organizational documents provide former and current trustees and officers with a limited indemnification against liabilities arising in connection with the performance of their duties to the Fund. In the normal course of business, the Fund may also enter into contracts that provide general indemnifications. The Fund's maximum exposure under these arrangements is unknown as this would be dependent on future claims that may be made against the Fund. The risk of material loss from such claims is considered remote.
At the end of the period, FMR or its affiliates were the owners of record of 66% of the total outstanding shares of the Fund and one otherwise unaffiliated shareholder was the owner of record of 34% of the total outstanding shares of the Fund.
Annual Report
Report of Independent Registered Public Accounting Firm
To the Trustees of Variable Insurance Products Fund IV and the Shareholders of VIP Energy Portfolio:
In our opinion, the accompanying statement of assets and liabilities, including the schedule of investments, and the related statements of operations and of changes in net assets and the financial highlights present fairly, in all material respects, the financial position of VIP Energy Portfolio (a fund of Variable Insurance Products Fund IV) at December 31, 2009, the results of its operations for the year then ended, the changes in its net assets for each of the two years in the period then ended and the financial highlights for each of the periods indicated, in conformity with accounting principles generally accepted in the United States of America. These financial statements and financial highlights (hereafter referred to as "financial statements") are the responsibility of the VIP Energy Portfolio's management. Our responsibility is to express an opinion on these financial statements based on our audits. We conducted our audits of these financial statements in accordance with the standards of the Public Company Accounting Oversight Board (United States). Those standards require that we plan and perform the audit to obtain reasonable assurance about whether the financial statements are free of material misstatement. An audit includes examining, on a test basis, evidence supporting the amounts and disclosures in the financial statements, assessing the accounting principles used and significant estimates made by management, and evaluating the overall financial statement presentation. We believe that our audits, which included confirmation of securities at December 31, 2009 by correspondence with the custodian and brokers, provide a reasonable basis for our opinion.
/s/ PricewaterhouseCoopers LLP
PricewaterhouseCoopers LLP
Boston, Massachusetts
February 12, 2010
Annual Report
The Trustees, Member of the Advisory Board, and executive officers of the trust and fund, as applicable, are listed below. The Board of Trustees governs the fund and is responsible for protecting the interests of shareholders. The Trustees are experienced executives who meet periodically throughout the year to oversee the fund's activities, review contractual arrangements with companies that provide services to the fund, and review the fund's performance. Except for James C. Curvey, each of the Trustees oversees 222 funds advised by FMR or an affiliate. Mr. Curvey oversees 410 funds advised by FMR or an affiliate.
The Trustees hold office without limit in time except that (a) any Trustee may resign; (b) any Trustee may be removed by written instrument, signed by at least two-thirds of the number of Trustees prior to such removal; (c) any Trustee who requests to be retired or who has become incapacitated by illness or injury may be retired by written instrument signed by a majority of the other Trustees; and (d) any Trustee may be removed at any special meeting of shareholders by a two-thirds vote of the outstanding voting securities of the trust. Each Trustee who is not an interested person (as defined in the 1940 Act) (Independent Trustee), shall retire not later than the last day of the calendar year in which his or her 72nd birthday occurs. The Independent Trustees may waive this mandatory retirement age policy with respect to individual Trustees. The executive officers and Advisory Board Member hold office without limit in time, except that any officer and Advisory Board Member may resign or may be removed by a vote of a majority of the Trustees at any regular meeting or any special meeting of the Trustees. Except as indicated, each individual has held the office shown or other offices in the same company for the past five years.
The fund's Statement of Additional Information (SAI) includes more information about the Trustees. To request a free copy, call Fidelity at 1-877-208-0098.
Interested Trustees*:
Correspondence intended for each Trustee who is an interested person may be sent to Fidelity Investments, 82 Devonshire Street, Boston, Massachusetts 02109.
Name, Age; Principal Occupation |
Edward C. Johnson 3d (79) |
| Year of Election or Appointment: 1983 Mr. Johnson is Trustee and Chairman of the Board of Trustees of certain Trusts. Mr. Johnson serves as Chief Executive Officer, Chairman, and a Director of FMR LLC; Chairman and a Director of FMR; Chairman and a Director of Fidelity Research & Analysis Company (FRAC); Chairman and a Director of Fidelity Investments Money Management, Inc.; and Chairman and a Director of FMR Co., Inc. In addition, Mr. Johnson serves as Chairman and Director of FIL Limited. Previously, Mr. Johnson served as President of FMR LLC (2006-2007). |
James C. Curvey (74) |
| Year of Election or Appointment: 2007 Mr. Curvey also serves as Trustee (2007-present) of other investment companies advised by FMR. Mr. Curvey is a Director of FMR and FMR Co., Inc. (2007-present). Mr. Curvey is also Vice Chairman (2006-present) and Director of FMR LLC. In addition, Mr. Curvey serves as an Overseer for the Boston Symphony Orchestra and a member of the Trustees of Villanova University. |
* Trustees have been determined to be "Interested Trustees" by virtue of, among other things, their affiliation with the trust or various entities under common control with FMR.
Independent Trustees:
Correspondence intended for each Independent Trustee (that is, the Trustees other than the Interested Trustees) may be sent to Fidelity Investments, P.O. Box 55235, Boston, Massachusetts 02205-5235.
Name, Age; Principal Occupation |
Dennis J. Dirks (61) |
| Year of Election or Appointment: 2005 Prior to his retirement in May 2003, Mr. Dirks was Chief Operating Officer and a member of the Board of The Depository Trust & Clearing Corporation (DTCC). He also served as President, Chief Operating Officer, and Board member of The Depository Trust Company (DTC) and President and Board member of the National Securities Clearing Corporation (NSCC). In addition, Mr. Dirks served as Chief Executive Officer and Board member of the Government Securities Clearing Corporation, Chief Executive Officer and Board member of the Mortgage-Backed Securities Clearing Corporation, as a Trustee and a member of the Finance Committee of Manhattan College (2005-2008), and as a Trustee and a member of the Finance Committee of AHRC of Nassau County (2006-2008). Currently, Mr. Dirks serves as a member of the Board of Directors for The Brookville Center for Children's Services, Inc. (2009-present). |
Alan J. Lacy (56) |
| Year of Election or Appointment: 2008 Mr. Lacy serves as Senior Adviser (2007-present) of Oak Hill Capital Partners, L.P. (private equity). Mr. Lacy also served as Chief Executive Officer (2000-2005) and Vice Chairman (2005-2006) of Sears Holdings Corporation and Sears, Roebuck and Co. (retail). In addition, Mr. Lacy serves as a member of the Board of Directors of The Western Union Company (global money transfer, 2006-present) and Bristol-Myers Squibb Company (global pharmaceuticals, 2007-present). Mr. Lacy is Chairman (2008-present) and a member (2006-present) of the Board of Trustees of The National Parks Conservation Association. |
Ned C. Lautenbach (65) |
| Year of Election or Appointment: 2000 Mr. Lautenbach is Chairman of the Independent Trustees of the Equity and High Income Funds (2006-present). Mr. Lautenbach is an Advisory Partner of Clayton, Dubilier & Rice, Inc. (private equity investment). Previously, Mr. Lautenbach was with the International Business Machines Corporation (IBM) from 1968 until his retirement in 1998. Mr. Lautenbach serves as a Director of Eaton Corporation (diversified industrial) as well as the Philharmonic Center for the Arts in Naples, Florida. Mr. Lautenbach is also a member of the Board of Trustees of Fairfield University (2005-present), as well as a member of the Council on Foreign Relations. Previously, Mr. Lautenbach served as a Director of Sony Corporation (2006-2007). |
Joseph Mauriello (65) |
| Year of Election or Appointment: 2008 Prior to his retirement in January 2006, Mr. Mauriello served in numerous senior management positions including Deputy Chairman and Chief Operating Officer (2004-2005), and Vice Chairman of Financial Services (2002-2004) of KPMG LLP US (professional services, 1965-2005). Mr. Mauriello currently serves as a member of the Board of Directors of XL Capital Ltd. (global insurance and re-insurance, 2006-present) and of Arcadia Resources Inc. (health care services and products, 2007-present). Previously, Mr. Mauriello served as a Director of the Hamilton Funds of the Bank of New York (2006-2007). |
Cornelia M. Small (65) |
| Year of Election or Appointment: 2005 Ms. Small is a member of the Board of Directors of the Teagle Foundation (2009-present). Ms. Small is also a member of the Investment Committee, and Chair (2008-present) and a member of the Board of Trustees of Smith College. In addition, Ms. Small serves on the Investment Committee of the Berkshire Taconic Community Foundation (2008-present). Previously, Ms. Small served as Chairperson of the Investment Committee (2002-2008) of Smith College. In addition, Ms. Small served as Chief Investment Officer, Director of Global Equity Investments, and a member of the Board of Directors of Scudder, Stevens & Clark and Scudder Kemper Investments. |
William S. Stavropoulos (70) |
| Year of Election or Appointment: 2001 Mr. Stavropoulos serves as President and Founder of the Michigan Baseball Foundation, the Great Lakes Loons (2007-present). Mr. Stavropoulos is Chairman Emeritus of the Board of Directors of The Dow Chemical Company, where he previously served in numerous senior management positions, including President, CEO (1995-2000; 2002-2004), Chairman of the Executive Committee (2000-2006), and as a member of the Board of Directors (1990-2006). Currently, Mr. Stavropoulos is a Director of Teradata Corporation (data warehousing and technology solutions, 2008-present), Chemical Financial Corporation, Maersk Inc. (industrial conglomerate), Tyco International, Inc. (multinational manufacturing and services, 2007-present), and a member of the Advisory Board for Metalmark Capital (private equity investment, 2005-present). Mr. Stavropoulos is a special advisor to Clayton, Dubilier & Rice, Inc. (private equity investment). In addition, Mr. Stavropoulos is a member of the University of Notre Dame Advisory Council for the College of Science. |
David M. Thomas (60) |
| Year of Election or Appointment: 2008 Previously, Mr. Thomas served as Executive Chairman (2005-2006) and Chairman and Chief Executive Officer (2000-2005) of IMS Health, Inc. (pharmaceutical and healthcare information solutions). In addition, Mr. Thomas serves as a member of the Board of Directors of Fortune Brands, Inc. (consumer products), and Interpublic Group of Companies, Inc. (marketing communication, 2004-present). |
Michael E. Wiley (59) |
| Year of Election or Appointment: 2008 Mr. Wiley also serves as a Director of Asia Pacific Exploration Consolidated (international oil and gas exploration and production, 2008-present), and as a member of the Board of Trustees of the University of Tulsa (2000-2006; 2007-present). Mr. Wiley serves as a Director of Tesoro Corporation (independent oil refiner and marketer, 2005-present), and a Director of Bill Barrett Corporation (exploration and production, 2005-present). In addition, Mr. Wiley also serves as a Director of Post Oak Bank (privately-held bank, 2004-present). Previously, Mr. Wiley served as a Sr. Energy Advisor of Katzenbach Partners, LLC (consulting, 2006-2007), as an Advisory Director of Riverstone Holdings (private investment), Chairman, President, and CEO of Baker Hughes, Inc. (oilfield services, 2000-2004), and as Director of Spinnaker Exploration Company (exploration and production, 2001-2005). |
Annual Report
Advisory Board Member and Executive Officers:
Correspondence intended for each executive officer and Peter S. Lynch may be sent to Fidelity Investments, 82 Devonshire Street, Boston, Massachusetts 02109.
Name, Age; Principal Occupation |
Peter S. Lynch (65) |
| Year of Election or Appointment: 2003 Member of the Advisory Board of Fidelity's Equity and High Income Funds. Mr. Lynch is Vice Chairman and a Director of FMR and FMR Co., Inc. In addition, Mr. Lynch serves as a Trustee of Boston College and as the Chairman of the Inner-City Scholarship Fund. Previously, Mr. Lynch served on the Special Olympics International Board of Directors (1997-2006). |
Kenneth B. Robins (40) |
| Year of Election or Appointment: 2008 President and Treasurer of Fidelity's Equity and High Income Funds. Mr. Robins also serves as Assistant Treasurer of other Fidelity funds (2009-present) and is an employee of Fidelity Investments (2004-present). Before joining Fidelity Investments, Mr. Robins worked at KPMG LLP, where he was a partner in KPMG's department of professional practice (2002-2004). |
Brian B. Hogan (45) |
| Year of Election or Appointment: 2009 Vice President of certain Equity Funds and Vice President of Sector Funds. Mr. Hogan also serves as Senior Vice President, Equity Research of FMR (2006-present) and President of FMR's Equity Division (2009-present). Previously, Mr. Hogan served as a portfolio manager. |
Christopher S. Bartel (38) |
| Year of Election or Appointment: 2009 Vice President of Fidelity's Sector and Real Estate Equity Funds. Mr. Bartel also serves as Senior Vice President of Equity Research (2009-present). Previously, Mr. Bartel served as Managing Director of Research (2006-2009) and an analyst and portfolio manager (2000-2006). |
Scott C. Goebel (41) |
| Year of Election or Appointment: 2008 Secretary and Chief Legal Officer (CLO) of the Fidelity funds. Mr. Goebel also serves as General Counsel, Secretary, and Senior Vice President of FMR (2008-present) and FMR Co., Inc. (2008-present); Deputy General Counsel of FMR LLC; Chief Legal Officer of Fidelity Management & Research (Hong Kong) Limited (2008-present) and Assistant Secretary of Fidelity Management & Research (Japan) Inc. (2008-present), Fidelity Investments Money Management, Inc. (2008-present), Fidelity Management & Research (U.K.) Inc. (2008-present), and Fidelity Research and Analysis Company (2008-present). Previously, Mr. Goebel served as Assistant Secretary of the Funds (2007-2008) and as Vice President and Secretary of Fidelity Distributors Corporation (FDC) (2005-2007). |
William C. Coffey (40) |
| Year of Election or Appointment: 2009 Assistant Secretary of Fidelity's Equity and High Income Funds. Mr. Coffey also serves as Vice President and Associate General Counsel of FMR LLC (2005-present), and is an employee of Fidelity Investments. |
Holly C. Laurent (55) |
| Year of Election or Appointment: 2008 Anti-Money Laundering (AML) Officer of the Fidelity funds. Ms. Laurent is an employee of Fidelity Investments. Previously, Ms. Laurent was Senior Vice President and Head of Legal for Fidelity Business Services India Pvt. Ltd. (2006-2008), and Senior Vice President, Deputy General Counsel and Group Head for FMR LLC (2005-2006). |
Christine Reynolds (51) |
| Year of Election or Appointment: 2008 Chief Financial Officer of the Fidelity funds. Ms. Reynolds became President of Fidelity Pricing and Cash Management Services (FPCMS) in August 2008. Ms. Reynolds served as Chief Operating Officer of FPCMS (2007-2008). Previously, Ms. Reynolds served as President, Treasurer, and Anti-Money Laundering officer of the Fidelity funds (2004-2007). |
Kenneth A. Rathgeber (62) |
| Year of Election or Appointment: 2004 Chief Compliance Officer of Fidelity's Equity and High Income Funds. Mr. Rathgeber is Chief Compliance Officer of Fidelity Management & Research (Hong Kong) Limited (2008-present), Fidelity Management & Research (Japan) Inc. (2008-present), FMR (2005-present), FMR Co., Inc. (2005-present), Fidelity Management & Research (U.K.) Inc. (2005-present), Fidelity Research & Analysis Company (2005-present), Fidelity Investments Money Management, Inc. (2005-present), Pyramis Global Advisors, LLC (2005-present), and Strategic Advisers, Inc. (2005-present). |
Jeffrey S. Christian (48) |
| Year of Election or Appointment: 2009 Deputy Treasurer of the Fidelity funds. Mr. Christian is an employee of Fidelity Investments. Previously, Mr. Christian served as Chief Financial Officer (2008-2009) of certain Fidelity funds, Senior Vice President of Fidelity Pricing and Cash Management Services (FPCMS) (2004-2009), and as Vice President of Business Analysis (2003-2004). |
Bryan A. Mehrmann (48) |
| Year of Election or Appointment: 2005 Deputy Treasurer of the Fidelity funds. Mr. Mehrmann is an employee of Fidelity Investments. Previously, Mr. Mehrmann served as Vice President of Fidelity Investments Institutional Services Group (FIIS)/Fidelity Investments Institutional Operations Company, Inc. (FIIOC) Client Services (1998-2004). |
Adrien E. Deberghes (42) |
| Year of Election or Appointment: 2008 Deputy Treasurer of Fidelity's Equity and High Income Funds. Mr. Deberghes is an employee of Fidelity Investments (2008-present). Previously, Mr. Deberghes served as Senior Vice President of Mutual Fund Administration at State Street Corporation (2007-2008), Senior Director of Mutual Fund Administration at Investors Bank & Trust (2005-2007), and Director of Finance for Dunkin' Brands (2000-2005). |
John R. Hebble (51) |
| Year of Election or Appointment: 2009 Assistant Treasurer of Fidelity's Equity and High Income Funds. Mr. Hebble also serves as President and Treasurer of other Fidelity funds (2008-present) and is an employee of Fidelity Investments. |
Paul M. Murphy (62) |
| Year of Election or Appointment: 2007 Assistant Treasurer of the Fidelity funds. Mr. Murphy is an employee of Fidelity Investments. Previously, Mr. Murphy served as Chief Financial Officer of the Fidelity funds (2005-2006), Vice President and Associate General Counsel of FMR (2007), and Senior Vice President of Fidelity Pricing and Cash Management Services (FPCMS) (1994-2007). |
Gary W. Ryan (51) |
| Year of Election or Appointment: 2005 Assistant Treasurer of the Fidelity funds. Mr. Ryan is an employee of Fidelity Investments. Previously, Mr. Ryan served as Vice President of Fund Reporting in Fidelity Pricing and Cash Management Services (FPCMS) (1999-2005). |
Annual Report
Initial Class and Investor Class designate 100% of the dividends distributed during the fiscal year as qualifying for the dividends-received deduction for corporate shareholders.
The fund will notify shareholders in January 2010 of amounts for use in preparing 2009 income tax returns.
Annual Report
Board Approval of Investment Advisory Contracts and Management Fees
VIP Energy Portfolio
Each year, the Board of Trustees, including the Independent Trustees (together, the Board), votes on the renewal of the management contract and sub-advisory agreements (together, the Advisory Contracts) for the fund. The Board, assisted by the advice of fund counsel and Independent Trustees' counsel, requests and considers a broad range of information throughout the year.
The Board meets regularly and, acting directly and through its separate committees, requests and receives information concerning, and considers at each of its meetings factors that are relevant to, its annual consideration of the renewal of the fund's Advisory Contracts, including the services and support provided to the fund and its shareholders. The Board has established various standing committees, each composed of Independent Trustees with varying backgrounds, to which the Board has assigned specific subject matter responsibilities in order to enhance effective decision-making by the Board. Each committee has a written charter outlining the structure and purposes of the committee. The Board also meets as needed to consider matters specifically related to the Board's annual consideration of the renewal of Advisory Contracts.
At its July 2009 meeting, the Board of Trustees, including the Independent Trustees, unanimously determined to renew the fund's Advisory Contracts. In reaching its determination, the Board considered all factors it believed relevant, including (i) the nature, extent, and quality of the services to be provided to the fund and its shareholders (including the investment performance of the fund); (ii) the competitiveness of the fund's management fee and total expenses; (iii) the total costs of the services to be provided by and the profits to be realized by Fidelity from its relationship with the fund; (iv) the extent to which economies of scale would be realized as the fund grows; and (v) whether fee levels reflect these economies of scale, if any, for the benefit of fund shareholders.
In considering whether to renew the Advisory Contracts for the fund, the Board ultimately reached a determination, with the assistance of fund counsel and Independent Trustees' counsel and through the exercise of its business judgment, that the renewal of the Advisory Contracts and the compensation to be received by Fidelity under the management contract is consistent with Fidelity's fiduciary duty under applicable law. The Board's decision to renew the Advisory Contracts was not based on any single factor noted above, but rather was based on a comprehensive consideration of all the information provided to the Board at its meetings throughout the year. The Board, in reaching its determination to renew the Advisory Contracts, is aware that shareholders in the fund have a broad range of investment choices available to them, including a wide choice among mutual funds offered by competitors to Fidelity, and that the fund's shareholders, with the opportunity to review and weigh the disclosure provided by the fund in its prospectus and other public disclosures, have chosen to invest in this fund, managed by Fidelity.
Nature, Extent, and Quality of Services Provided. The Board considered staffing within the investment adviser, FMR, and the sub-advisers (together, the Investment Advisers), including the backgrounds of the fund's investment personnel and the fund's investment objective and discipline. The Independent Trustees also had discussions with senior management of Fidelity's investment operations and investment groups. The Board considered the structure of the portfolio manager compensation program and whether this structure provides appropriate incentives.
Resources Dedicated to Investment Management and Support Services. The Board reviewed the size, education, and experience of the Investment Advisers' investment staff, their use of technology, and the Investment Advisers' approach to recruiting, training, and retaining portfolio managers and other research, advisory, and management personnel. In response to last year's financial crisis, FMR took a number of actions intended to cut costs and improve efficiency without weakening the investment teams or resources. The Board noted that Fidelity's analysts have access to a variety of technological tools and market and securities data that enable them to perform both fundamental and quantitative analysis and to specialize in various disciplines. The Board considered Fidelity's extensive global research capabilities that enable the Investment Advisers to aggregate data from various sources in an effort to produce positive investment results. The Board also considered that Fidelity's portfolio managers and analysts have access to daily portfolio attribution that allows for monitoring of a fund's portfolio, as well as an electronic communication system that provides immediate real-time access to research concerning issuers and credit enhancers.
Shareholder and Administrative Services. The Board considered (i) the nature, extent, quality, and cost of advisory, administrative, distribution, and shareholder services performed by the Investment Advisers and their affiliates under the Advisory Contracts and under separate agreements covering transfer agency, pricing and bookkeeping, and securities lending services for the fund; (ii) the nature and extent of the Investment Advisers' supervision of third party service providers, principally custodians and subcustodians; and (iii) the resources devoted to, and the record of compliance with, the fund's compliance policies and procedures. The Board also reviewed the allocation of fund brokerage, including allocations to brokers affiliated with the Investment Advisers, the use of brokerage commissions to pay fund expenses, and the use of "soft" commission dollars to pay for research services.
The Board noted that the growth of fund assets across the complex allows Fidelity to reinvest in the development of services designed to enhance the value or convenience of the Fidelity funds as investment vehicles. These services include 24-hour access to account information and market information through phone representatives and over the Internet, and investor education materials and asset allocation tools.
Investment in a Large Fund Family. The Board considered the benefits to shareholders of investing in a Fidelity fund, including the benefits of investing in a fund that is part of a large family of funds offering a variety of investment disciplines and providing for a large variety of mutual fund investor services. The Board noted that Fidelity has taken a number of actions over the previous year that benefited particular funds, including (i) dedicating additional resources to investment research and to restructure and broaden the focus of the investment research teams; (ii) bolstering the senior management team that oversees asset management; (iii) contractually agreeing to reduce the management fee on Fidelity U.S. Bond Index Fund; and (iv) expanding Class A and Class T load waiver categories to increase rollover retention opportunities and create consistent policies across the classes.
Annual Report
Investment Performance. The Board considered whether the fund has operated within its investment objective, as well as its record of compliance with its investment restrictions. It also reviewed the fund's absolute investment performance for each class, as well as the fund's relative investment performance for each class measured against a third-party-sponsored index that reflects the market sector in which the fund invests over multiple periods. The Board noted that FMR does not believe that a meaningful peer group exists against which to compare the fund's performance. The following charts considered by the Board show, over the one-, three-, and five-year periods ended December 31, 2008, as available, the cumulative total returns of Initial Class and Service Class 2 of the fund and the cumulative total returns of a third-party-sponsored index ("benchmark"). The returns of Initial Class and Service Class 2 show the performance of the highest performing class (based on five-year performance) and the lowest performing class (based on three-year performance), respectively.
VIP Energy Portfolio
The Board stated that the investment performance of the fund was lower than its benchmark for all the periods shown. The Board discussed with FMR actions that have been taken by FMR to improve the fund's below-benchmark performance. The Board will continue to closely monitor the performance of the fund in the coming year and discuss with FMR other appropriate actions to address the performance of the fund. The Board considered that the variations in performance among the fund's classes reflect the variations in class expenses, which result in lower performance for higher expense classes.
The Board considered that FMR has taken steps to refocus and strengthen equity research, equity portfolio management, and compliance. The Board reviewed the year-to-date performance of Initial Class through May 31, 2009 and stated that it exceeded the fund's benchmark.
Based on its review, and giving particular weight to the nature and quality of the resources dedicated by the Investment Advisers to maintain and improve relative performance and factoring in the unprecedented market events in 2008, the Board concluded that the nature, extent, and quality of the services provided to the fund will benefit the fund's shareholders, particularly in light of the Board's view that the fund's shareholders benefit from investing in a fund that is part of a large family of funds offering a variety of investment disciplines and services.
Competitiveness of Management Fee and Total Fund Expenses. The Board considered the fund's management fee and total expenses compared to "mapped groups" of competitive funds and classes. Fidelity creates "mapped groups" by combining similar Lipper investment objective categories that have comparable management fee characteristics. Combining Lipper investment objective categories aids the Board's management fee and total expense comparisons by broadening the competitive group used for comparison and by reducing the number of universes to which various Fidelity funds are compared.
The Board considered two proprietary management fee comparisons for the 12-month periods shown in the chart below. The group of Lipper funds used by the Board for management fee comparisons is referred to below as the "Total Mapped Group." The Total Mapped Group comparison focuses on a fund's standing relative to the total universe of comparable funds available to investors, in terms of gross management fees before expense reimbursements or caps. "TMG %" represents the percentage of funds in the Total Mapped Group that had management fees that were lower than the fund's. For example, a TMG % of 4% means that 96% of the funds in the Total Mapped Group had higher management fees than the fund. The "Asset-Size Peer Group" (ASPG) comparison focuses on a fund's standing relative to non-Fidelity funds similar in size to the fund within the Total Mapped Group. The ASPG represents at least 15% of the funds in the Total Mapped Group with comparable asset size and management fee characteristics, subject to a minimum of 50 funds (or all funds in the Total Mapped Group if fewer than 50). Additional information, such as the ASPG quartile in which the fund's management fee ranked, is also included in the chart and considered by the Board.
Annual Report
Board Approval of Investment Advisory Contracts and Management Fees - continued
VIP Energy Portfolio
The Board noted that the fund's management fee ranked below the median of its Total Mapped Group and below the median of its ASPG for 2008.
Based on its review, the Board concluded that the fund's management fee was fair and reasonable in light of the services that the fund receives and the other factors considered.
In its review of each class's total expenses, the Board considered the fund's management fee as well as other fund or class expenses, as applicable, such as transfer agent fees, pricing and bookkeeping fees, fund-paid 12b-1 fees, and custodial, legal, and audit fees. The Board also noted the effects of any waivers and reimbursements on fees and expenses. As part of its review, the Board also considered current and historical total expenses of each class of the fund compared to competitive fund median expenses. Each class of the fund is compared to those funds and classes in the Total Mapped Group (used by the Board for management fee comparisons) that have a similar sales load structure.
The Board noted that the total expenses of each class ranked below its competitive median for 2008.
In its review of total expenses, the Board also considered Fidelity fee structures and other information on clients that FMR and its affiliates service in other competitive markets, such as other mutual funds advised or subadvised by FMR or its affiliates, pension plan clients, and other institutional clients.
Based on its review, the Board concluded that the total expenses of each class of the fund were reasonable in light of the services that the fund and its shareholders receive and the other factors considered.
Costs of the Services and Profitability. The Board considered the revenues earned and the expenses incurred by Fidelity in conducting the business of developing, marketing, distributing, managing, administering and servicing the fund and its shareholders. The Board also considered the level of Fidelity's profits in respect of all the Fidelity funds.
On an annual basis, FMR presents to the Board Fidelity's profitability for the fund. Fidelity calculates the profitability for each fund, as well as aggregate profitability for groups of Fidelity funds and all Fidelity funds, using a series of detailed revenue and cost allocation methodologies which originate with the audited books and records of Fidelity. The Audit Committee of the Board reviews any significant changes from the prior year's methodologies.
PricewaterhouseCoopers LLP (PwC), independent registered public accounting firm and auditor to Fidelity and certain Fidelity funds, has been engaged annually by the Board as part of the Board's assessment of Fidelity's profitability analysis. PwC's engagement includes the review and assessment of Fidelity's methodologies used in determining the revenues and expenses attributable to Fidelity's mutual fund business, and completion of agreed-upon procedures surrounding the mathematical accuracy of fund profitability and its conformity to allocation methodologies. After considering PwC's reports issued under the engagement and information provided by Fidelity, the Board believes that while other allocation methods may also be reasonable, Fidelity's profitability methodologies are reasonable in all material respects.
Annual Report
The Board has also reviewed Fidelity's non-fund businesses and any fall-out benefits related to the mutual fund business as well as cases where Fidelity's affiliates may benefit from or be related to the fund's business.
The Board considered the costs of the services provided by and the profits realized by Fidelity in connection with the operation of the fund and determined that the amount of profit is a fair entrepreneurial profit for the management of the fund.
Economies of Scale. The Board considered whether there have been economies of scale in respect of the management of the Fidelity funds, whether the Fidelity funds (including the fund) have appropriately benefited from any such economies of scale, and whether there is potential for realization of any further economies of scale. The Board considered the extent to which the fund will benefit from economies of scale through increased services to the fund, through waivers or reimbursements, or through fee or expense reductions.
In February 2009, the Board created an Ad Hoc Committee (the "Committee") to analyze economies of scale. The Committee was formed to consider whether FMR attains economies of scale in respect of the management and servicing of the Fidelity funds, whether the Fidelity funds have appropriately benefited from such economies of scale, and whether there is potential for realization of any further economies of scale.
The Board recognized that the fund's management contract incorporates a "group fee" structure, which provides for lower group fee rates as total fund assets under FMR's management increase, and for higher group fee rates as total fund assets under FMR's management decrease. FMR determines the group fee rates based on a tiered asset "breakpoint" schedule. The Board considered that the group fee is designed to deliver the benefits of economies of scale to fund shareholders when total fund assets increase, even if assets of any particular fund are unchanged or have declined, because some portion of Fidelity's costs are attributable to services provided to all Fidelity funds, and all funds benefit if those costs can be allocated among more assets. The Board concluded that, given the group fee structure, fund shareholders will achieve a certain level of economies of scale as assets under FMR's management increase at the fund complex level, regardless of whether Fidelity achieves any such economies of scale.
The Board concluded, considering the findings of the Committee, that any potential economies of scale are being shared between fund shareholders and Fidelity in an appropriate manner.
Additional Information Requested by the Board. In order to develop fully the factual basis for consideration of the Fidelity funds' Advisory Contracts, the Board requested and received additional information on certain topics, including (i) fund performance trends, actions to be taken by FMR to improve certain funds' overall performance and Fidelity's long-term strategies for certain funds; (ii) portfolio manager changes that have occurred during the past year; (iii) Fidelity's compensation structure for portfolio managers and key personnel, including performance benchmarks used by Fidelity in evaluating incentive compensation for portfolio managers and research analysts; (iv) the structure and process of equity research and actions taken by FMR to improve the quality of research; (v) the selection of and compensation paid by FMR to fund sub-advisers; (vi) Fidelity's fee structures and rationale for recommending different fees among categories of funds; (vii) the rationale for any differences between fund fee structures and fee structures in place for other Fidelity clients; (viii) Fidelity's rationale for recommending which funds should have a performance adjustment component as part of their management fees; and (ix) explanations for the relative total expenses borne by certain funds and classes, total expense competitive trends, and actions that might be taken by FMR to reduce total expenses for certain funds and classes.
Based on its evaluation of all of the conclusions noted above, and after considering all material factors, the Board ultimately concluded that the advisory fee structures are fair and reasonable, and that the fund's Advisory Contracts should be renewed.
Annual Report
Investment Adviser
Fidelity Management & Research Company
Boston, MA
Investment Sub-Advisers
FMR Co., Inc.
Fidelity Management & Research (U.K.) Inc.
Fidelity Research & Analysis Company
FIL Investments (Japan) Limited
FIL Investment Advisors
FIL Investment Advisors (U.K.) Ltd.
Fidelity Management & Research (Hong Kong) Limited
Fidelity Management & Research (Japan) Inc.
General Distributor
Fidelity Distributors Corporation
Boston, MA
Transfer and Service Agents
Fidelity Investments Institutional Operations Company, Inc.
Boston, MA
Fidelity Service Company, Inc.
Boston, MA
Custodian
State Street Bank & Trust Co.
Quincy, MA
VNRIC-ANN-0210
1.817379.104
Fidelity® Variable Insurance Products:
Energy Portfolio: Service Class 2
Annual Report
December 31, 2009
(2_fidelity_logos) (Registered_Trademark)
Contents
Performance | <Click Here> | How the fund has done over time. |
Management's Discussion | <Click Here> | The manager's review of fund performance, strategy and outlook. |
Shareholder Expense Example | <Click Here> | An example of shareholder expenses. |
Investment Changes | <Click Here> | A summary of major shifts in the fund's investments over the past six months. |
Investments | <Click Here> | A complete list of the fund's investments with their market values. |
Financial Statements | <Click Here> | Statements of assets and liabilities, operations, and changes in net assets, as well as financial highlights. |
Notes | <Click Here> | Notes to the financial statements. |
Report of Independent Registered Public Accounting Firm | <Click Here> | |
Trustees and Officers | <Click Here> | |
Distributions | <Click Here> | |
Board Approval of Investment Advisory Contracts and Management Fees | <Click Here> | |
To view a fund's proxy voting guidelines and proxy voting record for the 12-month period ended June 30, visit http://www.fidelity.com/proxyvotingresults or visit the Securities and Exchange Commission's (SEC) web site at http://www.sec.gov. You may also call 1-877-208-0098 to request a free copy of the proxy voting guidelines.
Fidelity Variable Insurance Products are separate account options which are purchased through a variable insurance contract.
Standard & Poor's, S&P and S&P 500 are registered service marks of The McGraw-Hill Companies, Inc. and have been licensed for use by Fidelity Distributors Corporation.
Other third party marks appearing herein are the property of their respective owners.
All other marks appearing herein are registered or unregistered trademarks or service marks of FMR LLC or an affiliated company.
This report and the financial statements contained herein are submitted for the general information of the shareholders of the fund. This report is not authorized for distribution to prospective investors in the fund unless preceded or accompanied by an effective prospectus.
A fund files its complete schedule of portfolio holdings with the SEC for the first and third quarters of each fiscal year on Form N-Q. Forms N-Q are available on the SEC's web site at http://www.sec.gov. A fund's Forms N-Q may be reviewed and copied at the SEC's Public Reference Room in Washington, DC. Information regarding the operation of the SEC's Public Reference Room may be obtained by calling 1-800-SEC-0330. For a complete list of the fund's portfolio holdings, view the most recent holdings listing, semiannual report, or annual report on Fidelity's web site at http://www.fidelity.com or http://www.advisor.fidelity.com, as applicable.
NOT FDIC INSURED · MAY LOSE VALUE · NO BANK GUARANTEE
Neither the fund nor Fidelity Distributors Corporation is a bank.
Annual Report
Average annual total return reflects the change in the value of an investment, assuming reinvestment of the class' dividend income and capital gains (the profits earned upon the sale of securities that have grown in value, if any) and assuming a constant rate of performance each year. During periods of reimbursement by Fidelity, a fund's total return will be greater than it would be had the reimbursement not occurred. Performance numbers are net of all underlying fund operating expenses, but do not include any insurance charges imposed by your insurance company's separate account. If performance information included the effect of these additional charges, the total returns would have been lower. How a fund did yesterday is no guarantee of how it will do tomorrow.
Average Annual Total Returns
Periods ended December 31, 2009 | Past 1
year | Past 5
years | Life of
fundA |
VIP Energy Portfolio - Service Class 2 B, C | 47.57% | 10.78% | 10.43% |
A From July 19, 2001.
B The initial offering of Service Class 2 shares took place on April 6, 2005. Performance for Service Class 2 shares reflects an asset-based service fee (12b-1 fee). Returns prior to April 6, 2005 are those of Initial Class and do not include the effects of Service Class 2's 12b-1 fee. Had Service Class 2's 12b-1 fee been reflected, returns prior to April 6, 2005 would have been lower.
C Prior to October 1, 2006, VIP Energy Portfolio operated under certain different investment policies. The historical performance for the fund may not represent its current investment policies.
$10,000 Over Life of Fund
Let's say hypothetically that $10,000 was invested in VIP Energy Portfolio - Service Class 2 on July 19, 2001, when the fund started. The chart shows how the value of your investment would have changed, and also shows how the Standard & Poor's 500SM Index (S&P 500®) performed over the same period. The initial offering of Service Class 2 took place on April 6, 2005. See above for additional information regarding the performance of Service Class 2.
Annual Report
Market Recap: In 2009, most global markets saw both crippling lows and considerable highs. After a dismal start, the economy began to show signs of improvement, suggesting that a recovery was on the horizon. Credit markets began to heal as fiscal and monetary stimulus efforts around the world started to take effect, and corporate earnings staged an impressive rebound, fueled in large part by massive cost cutting. As a result, the flight to quality that marked most of 2008 and early 2009 shifted in March as investors flocked to riskier asset categories. The U.S. equity market, as measured by the bellwether Standard & Poor's 500SM Index and the blue-chip proxy Dow Jones Industrial AverageSM, reflected this changing environment, gaining 26.46% and 22.68%, respectively. Meanwhile, the technology-laden Nasdaq Composite® Index rose 45.32%. Foreign stocks also produced strong gains, as illustrated by the 31.93% jump of the MSCI® EAFE® Index (Europe, Australasia, Far East), a gauge of developed stock markets outside the U.S. and Canada. Emerging-markets stocks, which suffered their worst calendar-year performance ever in 2008, posted record returns this past year, with the MSCI Emerging Markets Index soaring 79.02%. A depreciating U.S. dollar helped bolster returns for U.S. investors in foreign equities.
Comments from John Dowd, Portfolio Manager of VIP Energy Portfolio: The fund solidly outperformed the 19.44% gain of the MSCI U.S. Investable Market Energy Index, as well as the S&P 500®. (For specific portfolio performance results, please refer to the performance section of this report.) Despite an overweighting in oil and gas refining/marketing stocks, which underperformed other energy segments, and a couple of individual stock miscalculations, superior security selection and beneficial industry positioning propelled the fund's return past that of the MSCI benchmark. Our underweighting in weak-performing integrated oil companies, notably Exxon Mobil and Chevron, provided the biggest boost, as did overweighting more-volatile energy services stocks. In particular, large positions in low-cost natural gas exploration and production firms Southwestern Energy and Cabot Oil & Gas both generated strong returns. Additionally, surging coal prices led our overweighted stakes in coal producers Massey Energy and Foundation Coal to become key contributors. Foundation Coal was acquired by Alpha Natural Resources during the period. Disappointments included oil refiners Sunoco and Valero Energy, natural gas exploration and production firm Comstock Resources and an underweighting in strong-performing oil-services giant Schlumberger.
Note to shareholders: In January 2010, Fidelity adopted capped benchmarks for most of its sector and industry funds, including the VIP sector portfolios. The capped benchmarks, which limit the weightings of individual issuers, better represent the investment opportunities available to the funds and will provide shareholders with more-meaningful performance comparisons. These changes do not affect the investment policies of any of the funds, and the primary benchmark for all of the funds remains the Standard & Poor's 500 Index.
The views expressed above reflect those of the portfolio manager(s) only through the end of the period as stated on the cover of this report and do not necessarily represent the views of Fidelity or any other person in the Fidelity organization. Any such views are subject to change at any time based upon market or other conditions and Fidelity disclaims any responsibility to update such views. These views may not be relied on as investment advice and, because investment decisions for a Fidelity fund are based on numerous factors, may not be relied on as an indication of trading intent on behalf of any Fidelity fund.
Annual Report
As a shareholder of the Fund, you incur two types of costs: (1) transaction costs, including redemption fees, and (2) ongoing costs, including management fees, distribution and/or service (12b-1) fees and other Fund expenses. This Example is intended to help you understand your ongoing costs (in dollars) of investing in the Fund and to compare these costs with the ongoing costs of investing in other mutual funds.
The Example is based on an investment of $1,000 invested at the beginning of the period and held for the entire period (July 1, 2009 to December 31, 2009).
Actual Expenses
The first line of the accompanying table for each class of the Fund provides information about actual account values and actual expenses. You may use the information in this line, together with the amount you invested, to estimate the expenses that you paid over the period. Simply divide your account value by $1,000.00 (for example, an $8,600 account value divided by $1,000.00 = 8.6), then multiply the result by the number in the first line for a class of the Fund under the heading entitled "Expenses Paid During Period" to estimate the expenses you paid on your account during this period. The estimate of expenses does not include any fees or other expenses of any variable annuity or variable life insurance product. If they were, the estimate of expenses you paid during the period would be higher, and your ending account value would be lower. In addition, the Fund, as a shareholder in the underlying Fidelity Central Funds, will indirectly bear its pro-rata share of the fees and expenses incurred by the underlying Fidelity Central Funds. These fees and expenses are not included in the Fund's annualized expense ratio used to calculate the expense estimate in the table below.
Hypothetical Example for Comparison Purposes
The second line of the accompanying table for each class of the Fund provides information about hypothetical account values and hypothetical expenses based on a Class' actual expense ratio and an assumed rate of return of 5% per year before expenses, which is not the Class' actual return. The hypothetical account values and expenses may not be used to estimate the actual ending account balance or expenses you paid for the period. You may use this information to compare the ongoing costs of investing in the Fund and other funds. To do so, compare this 5% hypothetical example with the 5% hypothetical examples that appear in the shareholder reports of the other funds. The estimate of expenses does not include any fees or other expenses of any variable annuity or variable life insurance product. If they were, the estimate of expenses you paid during the period would be higher, and your ending account value would be lower. In addition, the Fund, as a shareholder in the underlying Fidelity Central Funds, will indirectly bear its pro-rata share of the fees and expenses incurred by the underlying Fidelity Central Funds. These fees and expenses are not included in the Fund's annualized expense ratio used to calculate the expense estimate in the table below.
Please note that the expenses shown in the table are meant to highlight your ongoing costs only and do not reflect any transaction costs. Therefore, the second line of the table is useful in comparing ongoing costs only, and will not help you determine the relative total costs of owning different funds. In addition, if these transactional costs were included, your costs would have been higher.
|
Annualized
Expense Ratio
|
Beginning
Account Value
July 1, 2009
|
Ending
Account Value
December 31, 2009
| Expenses Paid
During Period*
July 1, 2009 to
December 31, 2009 |
Initial Class | .70% | | | |
Actual | | $ 1,000.00 | $ 1,275.30 | $ 4.01 |
HypotheticalA | | $ 1,000.00 | $ 1,021.68 | $ 3.57 |
Service Class 2 | .95% | | | |
Actual | | $ 1,000.00 | $ 1,272.60 | $ 5.44 |
HypotheticalA | | $ 1,000.00 | $ 1,020.42 | $ 4.84 |
Investor Class | .79% | | | |
Actual | | $ 1,000.00 | $ 1,274.10 | $ 4.53 |
HypotheticalA | | $ 1,000.00 | $ 1,021.22 | $ 4.02 |
A 5% return per year before expenses
* Expenses are equal to each Class' annualized expense ratio, multiplied by the average account value over the period, multiplied by 184/365 (to reflect the one-half year period).
Annual Report
Investment Changes (Unaudited)
Top Ten Stocks as of December 31, 2009 |
| % of fund's
net assets | % of fund's net assets
6 months ago |
Schlumberger Ltd. | 6.7 | 3.7 |
Southwestern Energy Co. | 6.0 | 4.9 |
Occidental Petroleum Corp. | 5.9 | 5.3 |
XTO Energy, Inc. | 5.0 | 0.0 |
Petrohawk Energy Corp. | 3.7 | 3.4 |
BJ Services Co. | 3.5 | 2.3 |
Massey Energy Co. | 3.5 | 2.2 |
BP PLC sponsored ADR | 3.5 | 0.0 |
Alpha Natural Resources, Inc. | 3.3 | 1.8 |
Transocean Ltd. | 3.3 | 3.8 |
| 44.4 | |
Top Industries (% of fund's net assets) |
As of December 31, 2009 |
| Oil, Gas & Consumable Fuels | 59.1% | |
| Energy Equipment & Services | 36.0% | |
| Electrical Equipment | 2.9% | |
| Construction & Engineering | 0.7% | |
| Gas Utilities | 0.6% | |
| All Others* | 0.7% | |

As of June 30, 2009 |
| Oil, Gas & Consumable Fuels | 58.8% | |
| Energy Equipment & Services | 35.3% | |
| Electrical Equipment | 3.3% | |
| Gas Utilities | 1.1% | |
| Construction & Engineering | 0.5% | |
| All Others* | 1.0% | |
* Includes short-term investments and net other assets. |
Annual Report
Investments December 31, 2009
Showing Percentage of Net Assets
Common Stocks - 99.8% |
| Shares | | Value |
CONSTRUCTION & ENGINEERING - 0.7% |
Construction & Engineering - 0.7% |
Jacobs Engineering Group, Inc. (a) | 68,400 | | $ 2,572,524 |
ELECTRICAL EQUIPMENT - 2.8% |
Electrical Components & Equipment - 2.7% |
centrotherm photovoltaics AG (a) | 14,099 | | 851,800 |
Energy Conversion Devices, Inc. (a)(c) | 57,327 | | 605,946 |
Evergreen Solar, Inc. (a)(c) | 141,706 | | 213,976 |
First Solar, Inc. (a)(c) | 26,857 | | 3,636,438 |
JA Solar Holdings Co. Ltd. ADR (a)(c) | 504,307 | | 2,874,550 |
SunPower Corp.: | | | |
Class A (a) | 12,500 | | 296,000 |
Class B (a) | 63,500 | | 1,330,325 |
| | 9,809,035 |
Heavy Electrical Equipment - 0.1% |
Vestas Wind Systems AS (a) | 7,383 | | 450,248 |
TOTAL ELECTRICAL EQUIPMENT | | 10,259,283 |
ELECTRONIC EQUIPMENT & COMPONENTS - 0.3% |
Electronic Equipment & Instruments - 0.3% |
Itron, Inc. (a) | 14,278 | | 964,764 |
ENERGY EQUIPMENT & SERVICES - 36.0% |
Oil & Gas Drilling - 12.2% |
Atwood Oceanics, Inc. (a) | 37,270 | | 1,336,130 |
Ensco International Ltd. ADR | 48,300 | | 1,929,102 |
Helmerich & Payne, Inc. | 127,451 | | 5,082,746 |
Hercules Offshore, Inc. (a) | 91,780 | | 438,708 |
Nabors Industries Ltd. (a) | 372,994 | | 8,164,839 |
Noble Corp. | 285,720 | | 11,628,804 |
Northern Offshore Ltd. (a) | 587,000 | | 962,137 |
Patterson-UTI Energy, Inc. | 64,014 | | 982,615 |
Pride International, Inc. (a) | 69,313 | | 2,211,778 |
Transocean Ltd. (a) | 147,047 | | 12,175,492 |
| | 44,912,351 |
Oil & Gas Equipment & Services - 23.8% |
Baker Hughes, Inc. | 20,900 | | 846,032 |
Basic Energy Services, Inc. (a) | 22,860 | | 203,454 |
BJ Services Co. | 690,860 | | 12,849,996 |
Cameron International Corp. (a) | 11,600 | | 484,880 |
Complete Production Services, Inc. (a) | 24,100 | | 313,300 |
Core Laboratories NV | 12,500 | | 1,476,500 |
Dresser-Rand Group, Inc. (a) | 20,400 | | 644,844 |
Exterran Holdings, Inc. (a) | 46,243 | | 991,912 |
Global Industries Ltd. (a) | 172,034 | | 1,226,602 |
Halliburton Co. | 210,774 | | 6,342,190 |
Helix Energy Solutions Group, Inc. (a) | 38,900 | | 457,075 |
Key Energy Services, Inc. (a) | 31,200 | | 274,248 |
National Oilwell Varco, Inc. | 266,478 | | 11,749,015 |
Newpark Resources, Inc. (a) | 10,993 | | 46,500 |
Oceaneering International, Inc. (a) | 46,234 | | 2,705,614 |
|
| Shares | | Value |
Oil States International, Inc. (a) | 14,100 | | $ 553,989 |
Schlumberger Ltd. | 379,142 | | 24,678,353 |
Smith International, Inc. | 185,857 | | 5,049,735 |
Superior Energy Services, Inc. (a) | 102,154 | | 2,481,321 |
Superior Well Services, Inc. (a) | 4,800 | | 68,448 |
TSC Offshore Group Ltd. (a) | 746,000 | | 267,382 |
Weatherford International Ltd. (a) | 673,366 | | 12,059,985 |
Willbros Group, Inc. (a) | 108,033 | | 1,822,517 |
| | 87,593,892 |
TOTAL ENERGY EQUIPMENT & SERVICES | | 132,506,243 |
GAS UTILITIES - 0.6% |
Gas Utilities - 0.6% |
Questar Corp. | 43,800 | | 1,820,766 |
Zhongyu Gas Holdings Ltd. (a) | 3,884,000 | | 384,291 |
| | 2,205,057 |
METALS & MINING - 0.3% |
Diversified Metals & Mining - 0.3% |
Teck Resources Ltd. Class B (sub. vtg.) (a) | 35,700 | | 1,251,106 |
OIL, GAS & CONSUMABLE FUELS - 59.1% |
Coal & Consumable Fuels - 10.9% |
Alpha Natural Resources, Inc. (a) | 284,383 | | 12,336,535 |
Arch Coal, Inc. | 357,250 | | 7,948,813 |
Centennial Coal Co. Ltd. | 125,698 | | 451,633 |
Cloud Peak Energy, Inc. | 40,000 | | 582,400 |
CONSOL Energy, Inc. | 112,821 | | 5,618,486 |
Massey Energy Co. | 304,352 | | 12,785,828 |
PT Bumi Resources Tbk | 1,598,000 | | 411,157 |
| | 40,134,852 |
Integrated Oil & Gas - 13.6% |
BG Group PLC | 58,861 | | 1,067,338 |
BP PLC sponsored ADR | 219,600 | | 12,730,212 |
Chevron Corp. | 9,876 | | 760,353 |
ConocoPhillips | 1,036 | | 52,909 |
Hess Corp. | 700 | | 42,350 |
Marathon Oil Corp. | 369,821 | | 11,545,812 |
Occidental Petroleum Corp. | 267,683 | | 21,776,012 |
Royal Dutch Shell PLC Class A sponsored ADR | 30,800 | | 1,851,388 |
| | 49,826,374 |
Oil & Gas Exploration & Production - 33.1% |
Anadarko Petroleum Corp. | 192,051 | | 11,987,823 |
Apache Corp. | 62,100 | | 6,406,857 |
Arena Resources, Inc. (a) | 51,700 | | 2,229,304 |
Brigham Exploration Co. (a) | 64,900 | | 879,395 |
Cabot Oil & Gas Corp. | 239,218 | | 10,427,513 |
Canadian Natural Resources Ltd. | 48,500 | | 3,508,304 |
Comstock Resources, Inc. (a) | 94,920 | | 3,850,904 |
Denbury Resources, Inc. (a) | 71,700 | | 1,061,160 |
EOG Resources, Inc. | 36,200 | | 3,522,260 |
EXCO Resources, Inc. | 369,423 | | 7,842,850 |
Common Stocks - continued |
| Shares | | Value |
OIL, GAS & CONSUMABLE FUELS - CONTINUED |
Oil & Gas Exploration & Production - continued |
Newfield Exploration Co. (a) | 78,224 | | $ 3,772,744 |
Niko Resources Ltd. | 9,100 | | 852,272 |
OPTI Canada, Inc. (a) | 80,500 | | 155,537 |
Painted Pony Petroleum Ltd. Class A (a) | 67,000 | | 369,866 |
Petrobank Energy & Resources Ltd. (a) | 14,200 | | 692,126 |
Petrohawk Energy Corp. (a) | 561,869 | | 13,479,237 |
Pioneer Natural Resources Co. | 8,000 | | 385,360 |
Range Resources Corp. | 43,263 | | 2,156,661 |
Southwestern Energy Co. (a) | 457,412 | | 22,047,258 |
Ultra Petroleum Corp. (a) | 57,700 | | 2,876,922 |
Whiting Petroleum Corp. (a) | 67,483 | | 4,821,660 |
XTO Energy, Inc. | 392,346 | | 18,255,859 |
| | 121,581,872 |
Oil & Gas Refining & Marketing - 1.5% |
Frontier Oil Corp. | 220,081 | | 2,649,775 |
Tesoro Corp. (c) | 23,800 | | 322,490 |
Valero Energy Corp. | 92,857 | | 1,555,355 |
World Fuel Services Corp. (c) | 35,600 | | 953,724 |
| | 5,481,344 |
Oil & Gas Storage & Transport - 0.0% |
Williams Companies, Inc. | 1,950 | | 41,106 |
TOTAL OIL, GAS & CONSUMABLE FUELS | | 217,065,548 |
TOTAL COMMON STOCKS (Cost $341,858,716) | 366,824,525 |
Convertible Bonds - 0.1% |
| Principal Amount | | Value |
ELECTRICAL EQUIPMENT - 0.1% |
Electrical Components & Equipment - 0.1% |
SunPower Corp. 4.75% 4/15/14
(Cost $180,000) | | $ 180,000 | | $ 204,084 |
Money Market Funds - 2.3% |
| Shares | | |
Fidelity Cash Central Fund, 0.16% (d) | 1,249,124 | | 1,249,124 |
Fidelity Securities Lending Cash Central Fund, 0.15% (b)(d) | 7,275,800 | | 7,275,800 |
TOTAL MONEY MARKET FUNDS (Cost $8,524,924) | 8,524,924 |
TOTAL INVESTMENT PORTFOLIO - 102.2% (Cost $350,563,640) | 375,553,533 |
NET OTHER ASSETS - (2.2)% | | (7,935,676) |
NET ASSETS - 100% | $ 367,617,857 |
Legend |
(a) Non-income producing |
(b) Investment made with cash collateral received from securities on loan. |
(c) Security or a portion of the security is on loan at period end. |
(d) Affiliated fund that is available only to investment companies and other accounts managed by Fidelity Investments. The rate quoted is the annualized seven-day yield of the fund at period end. A complete unaudited listing of the fund's holdings as of its most recent quarter end is available upon request. |
Affiliated Central Funds |
Information regarding fiscal year to date income earned by the Fund from investments in Fidelity Central Funds is as follows: |
Fund | Income earned |
Fidelity Cash Central Fund | $ 11,089 |
Fidelity Securities Lending Cash Central Fund | 91,251 |
Total | $ 102,340 |
Other Information |
The following is a summary of the inputs used, as of December 31, 2009, involving the Fund's assets and liabilities carried at value. The inputs or methodology used for valuing securities may not be an indication of the risk associated with investing in those securities. For more information on valuation inputs, and their aggregation into the levels used in the table below, please refer to the Security Valuation section in the accompanying Notes to Financial Statements. |
Valuation Inputs at Reporting Date: |
Description | Total | Level 1 | Level 2 | Level 3 |
Investments in Securities: | | | | |
Common Stocks | $ 366,824,525 | $ 366,172,852 | $ 651,673 | $ - |
Convertible Bonds | 204,084 | - | 204,084 | - |
Money Market Funds | 8,524,924 | 8,524,924 | - | - |
Total Investments in Securities: | $ 375,553,533 | $ 374,697,776 | $ 855,757 | $ - |
Distribution of investments by country of issue, as a percentage of total net assets, is as follows: (Unaudited) |
United States of America | 74.0% |
Switzerland | 9.8% |
Netherlands Antilles | 6.7% |
United Kingdom | 4.8% |
Canada | 2.6% |
Cayman Islands | 1.0% |
Others (individually less than 1%) | 1.1% |
| 100.0% |
Income Tax Information |
At December 31, 2009, the fund had a capital loss carryforward of approximately $53,390,490 all of which will expire on December 31, 2017. |
The fund intends to elect to defer to its fiscal year ending December 31, 2010 approximately $6,746,004 of losses recognized during the period November 1, 2009 to December 31, 2009. |
See accompanying notes which are an integral part of the financial statements.
Annual Report
Statement of Assets and Liabilities
| December 31, 2009 |
Assets | | |
Investment in securities, at value (including securities loaned of $6,976,900) - See accompanying schedule: Unaffiliated issuers (cost $342,038,716) | $ 367,028,609 | |
Fidelity Central Funds (cost $8,524,924) | 8,524,924 | |
Total Investments (cost $350,563,640) | | $ 375,553,533 |
Foreign currency held at value (cost $264) | | 264 |
Receivable for investments sold | | 18,613 |
Receivable for fund shares sold | | 74,538 |
Dividends receivable | | 297,167 |
Interest receivable | | 1,809 |
Distributions receivable from Fidelity Central Funds | | 12,040 |
Prepaid expenses | | 1,535 |
Other receivables | | 5,021 |
Total assets | | 375,964,520 |
| | |
Liabilities | | |
Payable for investments purchased | $ 3,002 | |
Payable for fund shares redeemed | 789,791 | |
Accrued management fee | 168,164 | |
Distribution fees payable | 25,635 | |
Other affiliated payables | 37,693 | |
Other payables and accrued expenses | 46,580 | |
Collateral on securities loaned, at value | 7,275,800 | |
Total liabilities | | 8,346,665 |
| | |
Net Assets | | $ 367,617,855 |
Net Assets consist of: | | |
Paid in capital | | $ 409,767,096 |
Accumulated undistributed net realized gain (loss) on investments and foreign currency transactions | | (67,138,007) |
Net unrealized appreciation (depreciation) on investments and assets and liabilities in foreign currencies | | 24,988,766 |
Net Assets | | $ 367,617,855 |
Statement of Assets and Liabilities - continued
| December 31, 2009 |
Initial Class:
Net Asset Value, offering price and redemption price per share ($152,028,085 ÷ 9,007,753 shares) | | $ 16.88 |
| | |
Service Class 2:
Net Asset Value, offering price and redemption price per share ($125,668,857 ÷ 7,483,624 shares) | | $ 16.79 |
| | |
Investor Class:
Net Asset Value, offering price and redemption price per share ($89,920,913 ÷ 5,337,748 shares) | | $ 16.85 |
See accompanying notes which are an integral part of the financial statements.
Annual Report
Financial Statements - continued
Statement of Operations
| Year ended December 31, 2009 |
Investment Income | | |
Dividends | | $ 3,600,772 |
Interest | | 5,664 |
Income from Fidelity Central Funds | | 102,340 |
Total income | | 3,708,776 |
| | |
Expenses | | |
Management fee | $ 1,774,478 | |
Transfer agent fees | 320,243 | |
Distribution fees | 266,327 | |
Accounting and security lending fees | 124,927 | |
Custodian fees and expenses | 14,812 | |
Independent trustees' compensation | 2,184 | |
Registration fees | 123 | |
Audit | 41,945 | |
Legal | 1,863 | |
Miscellaneous | 29,151 | |
Total expenses before reductions | 2,576,053 | |
Expense reductions | (15,112) | 2,560,941 |
Net investment income (loss) | | 1,147,835 |
Realized and Unrealized Gain (Loss) Net realized gain (loss) on: | | |
Investment securities: | | |
Unaffiliated issuers | (28,865,515) | |
Foreign currency transactions | (79,207) | |
Total net realized gain (loss) | | (28,944,722) |
Change in net unrealized appreciation (depreciation) on: Investment securities | 147,681,525 | |
Assets and liabilities in foreign currencies | (468) | |
Total change in net unrealized appreciation (depreciation) | | 147,681,057 |
Net gain (loss) | | 118,736,335 |
Net increase (decrease) in net assets resulting from operations | | $ 119,884,170 |
Statement of Changes in Net Assets
| Year ended
December 31, 2009 | Year ended
December 31, 2008 |
Increase (Decrease) in Net Assets | | |
Operations | | |
Net investment income (loss) | $ 1,147,835 | $ 197,135 |
Net realized gain (loss) | (28,944,722) | (26,219,761) |
Change in net unrealized appreciation (depreciation) | 147,681,057 | (343,580,729) |
Net increase (decrease) in net assets resulting from operations | 119,884,170 | (369,603,355) |
Distributions to shareholders from net investment income | (1,156,325) | (275,275) |
Distributions to shareholders from net realized gain | - | (18,707,189) |
Total distributions | (1,156,325) | (18,982,464) |
Share transactions - net increase (decrease) | (14,569,173) | (29,506,360) |
Redemption fees | 154,874 | 458,118 |
Total increase (decrease) in net assets | 104,313,546 | (417,634,061) |
| | |
Net Assets | | |
Beginning of period | 263,304,309 | 680,938,370 |
End of period | $ 367,617,855 | $ 263,304,309 |
See accompanying notes which are an integral part of the financial statements.
Annual Report
Financial Highlights - Initial Class
Years ended December 31, | 2009 | 2008 | 2007 | 2006 | 2005 |
Selected Per-Share Data | | | | | |
Net asset value, beginning of period | $ 11.46 | $ 26.55 | $ 19.04 | $ 18.92 | $ 13.62 |
Income from Investment Operations | | | | | |
Net investment income (loss) C | .07 | .03 | .07 | .09 | .10 |
Net realized and unrealized gain (loss) | 5.41 | (14.31) | 8.62 | 3.09 | 6.20 |
Total from investment operations | 5.48 | (14.28) | 8.69 | 3.18 | 6.30 |
Distributions from net investment income | (.07) | (.03) | (.06) | (.16) | (.08) |
Distributions from net realized gain | - | (.80) | (1.13) | (2.91) | (.94) |
Total distributions | (.07) | (.83) | (1.19) | (3.07) | (1.02) |
Redemption fees added to paid in capital C | .01 | .02 | .01 | .01 | .02 |
Net asset value, end of period | $ 16.88 | $ 11.46 | $ 26.55 | $ 19.04 | $ 18.92 |
Total Return A, B | 47.90% | (54.26)% | 45.97% | 16.91% | 46.31% |
Ratios to Average Net Assets D, F | | | | | |
Expenses before reductions | .71% | .70% | .70% | .71% | .72% |
Expenses net of fee waivers, if any | .71% | .70% | .70% | .71% | .72% |
Expenses net of all reductions | .70% | .69% | .70% | .70% | .66% |
Net investment income (loss) | .47% | .13% | .31% | .43% | .56% |
Supplemental Data | | | | | |
Net assets, end of period (000 omitted) | $ 152,028 | $ 117,940 | $ 355,854 | $ 280,537 | $ 334,368 |
Portfolio turnover rate E | 113% | 130% | 61% | 151% | 107% |
A Total returns do not reflect charges attributable to your insurance company's separate account. Inclusion of these charges would reduce the total returns shown.
B Total returns would have been lower had certain expenses not been reduced during the periods shown.
C Calculated based on average shares outstanding during the period.
D Fees and expenses of the underlying Fidelity Central Funds are not included in the Fund's expense ratio. The Fund indirectly bears its proportionate share of the expenses of any underlying Fidelity Central Funds.
E Amount does not include the portfolio activity of any underlying Fidelity Central Funds.
F Expense ratios reflect operating expenses of the class. Expenses before reductions do not reflect amounts reimbursed by the investment adviser or reductions from brokerage service arrangements or reductions from other expense offset arrangements and do not represent the amount paid by the class during periods when reimbursements or reductions occur. Expenses net of fee waivers reflect expenses after reimbursement by the investment adviser but prior to reductions from brokerage service arrangements or other expense offset arrangements. Expenses net of all reductions represent the net expenses paid by the class.
Financial Highlights - Service Class 2
Years ended December 31, | 2009 | 2008 | 2007 | 2006 | 2005 H |
Selected Per-Share Data | | | | | |
Net asset value, beginning of period | $ 11.40 | $ 26.44 | $ 18.98 | $ 18.90 | $ 15.80 |
Income from Investment Operations | | | | | |
Net investment income (loss) E | .03 | (.03) | .02 | .04 | .04 |
Net realized and unrealized gain (loss) | 5.38 | (14.23) | 8.58 | 3.07 | 4.04 |
Total from investment operations | 5.41 | (14.26) | 8.60 | 3.11 | 4.08 |
Distributions from net investment income | (.03) | - | (.02) | (.13) | (.07) |
Distributions from net realized gain | - | (.80) | (1.13) | (2.91) | (.92) |
Total distributions | (.03) | (.80) | (1.15) | (3.04) | (.99) |
Redemption fees added to paid in capital E | .01 | .02 | .01 | .01 | .01 |
Net asset value, end of period | $ 16.79 | $ 11.40 | $ 26.44 | $ 18.98 | $ 18.90 |
Total Return B, C, D | 47.57% | (54.40)% | 45.64% | 16.55% | 25.80% |
Ratios to Average Net Assets F, I | | | | | |
Expenses before reductions | .96% | .95% | .95% | .96% | .97% A |
Expenses net of fee waivers, if any | .96% | .95% | .95% | .96% | .97% A |
Expenses net of all reductions | .95% | .94% | .94% | .95% | .91% A |
Net investment income (loss) | .22% | (.12)% | .07% | .18% | .31% A |
Supplemental Data | | | | | |
Net assets, end of period (000 omitted) | $ 125,669 | $ 90,109 | $ 193,887 | $ 70,305 | $ 20,211 |
Portfolio turnover rate G | 113% | 130% | 61% | 151% | 107% |
A Annualized
B Total returns for periods of less than one year are not annualized.
C Total returns do not reflect charges attributable to your insurance company's separate account. Inclusion of these charges would reduce the total returns shown.
D Total returns would have been lower had certain expenses not been reduced during the periods shown.
E Calculated based on average shares outstanding during the period.
F Fees and expenses of the underlying Fidelity Central Funds are not included in the Fund's expense ratio. The Fund indirectly bears its proportionate share of the expenses of any underlying Fidelity Central Funds.
G Amount does not include the portfolio activity of any underlying Fidelity Central Funds.
H For the period April 6, 2005 (commencement of sale of shares) to December 31, 2005.
I Expense ratios reflect operating expenses of the class. Expenses before reductions do not reflect amounts reimbursed by the investment adviser or reductions from brokerage service arrangements or reductions from other expense offset arrangements and do not represent the amount paid by the class during periods when reimbursements or reductions occur. Expense ratios before reductions for start-up periods may not be representative of longer-term operating periods. Expenses net of fee waivers reflect expenses after reimbursement by the investment adviser but prior to reductions from brokerage service arrangements or other expense offset arrangements. Expenses net of all reductions represent the net expenses paid by the class.
See accompanying notes which are an integral part of the financial statements.
Annual Report
Financial Highlights - Investor Class
Years ended December 31, | 2009 | 2008 | 2007 | 2006 | 2005 H |
Selected Per-Share Data | | | | | |
Net asset value, beginning of period | $ 11.44 | $ 26.49 | $ 19.00 | $ 18.91 | $ 16.76 |
Income from Investment Operations | | | | | |
Net investment income (loss) E | .05 | .01 | .05 | .06 | .03 |
Net realized and unrealized gain (loss) | 5.41 | (14.28) | 8.61 | 3.08 | 3.11 |
Total from investment operations | 5.46 | (14.27) | 8.66 | 3.14 | 3.14 |
Distributions from net investment income | (.06) | - J | (.05) | (.15) | (.08) |
Distributions from net realized gain | - | (.80) | (1.13) | (2.91) | (.92) |
Total distributions | (.06) | (.80) | (1.18) | (3.06) | (1.00) |
Redemption fees added to paid in capital E | .01 | .02 | .01 | .01 | .01 |
Net asset value, end of period | $ 16.85 | $ 11.44 | $ 26.49 | $ 19.00 | $ 18.91 |
Total Return B, C, D | 47.79% | (54.32)% | 45.88% | 16.69% | 18.73% |
Ratios to Average Net Assets F, I | | | | | |
Expenses before reductions | .81% | .79% | .81% | .84% | .91% A |
Expenses net of fee waivers, if any | .81% | .79% | .81% | .84% | .91% A |
Expenses net of all reductions | .80% | .78% | .81% | .82% | .85% A |
Net investment income (loss) | .37% | .04% | .20% | .31% | .37% A |
Supplemental Data | | | | | |
Net assets, end of period (000 omitted) | $ 89,921 | $ 55,256 | $ 131,198 | $ 51,436 | $ 16,402 |
Portfolio turnover rate G | 113% | 130% | 61% | 151% | 107% |
A Annualized
B Total returns for periods of less than one year are not annualized.
C Total returns do not reflect charges attributable to your insurance company's separate account. Inclusion of these charges would reduce the total returns shown.
D Total returns would have been lower had certain expenses not been reduced during the periods shown.
E Calculated based on average shares outstanding during the period.
F Fees and expenses of the underlying Fidelity Central Funds are not included in the Fund's expense ratio. The Fund indirectly bears its proportionate share of the expenses of any underlying Fidelity Central Funds.
G Amount does not include the portfolio activity of any underlying Fidelity Central Funds.
H For the period July 21, 2005 (commencement of sale of shares) to December 31, 2005.
I Expense ratios reflect operating expenses of the class. Expenses before reductions do not reflect amounts reimbursed by the investment adviser or reductions from brokerage service arrangements or reductions from other expense offset arrangements and do not represent the amount paid by the class during periods when reimbursements or reductions occur. Expense ratios before reductions for start-up periods may not be representative of longer-term operating periods. Expenses net of fee waivers reflect expenses after reimbursement by the investment adviser but prior to reductions from brokerage service arrangements or other expense offset arrangements. Expenses net of all reductions represent the net expenses paid by the class.
J Amount represents less than $.01 per share.
See accompanying notes which are an integral part of the financial statements.
Annual Report
Notes to Financial Statements
For the period ended December 31, 2009
1. Organization.
VIP Energy Portfolio (the Fund) is a fund of Variable Insurance Products Fund IV (the trust) and is authorized to issue an unlimited number of shares. The trust is registered under the Investment Company Act of 1940, as amended (the 1940 Act), as an open-end management investment company organized as a Massachusetts business trust. Shares of the Fund may only be purchased by insurance companies for the purpose of funding variable annuity or variable life insurance contracts. The Fund offers the following classes of shares: Initial Class shares, Service Class 2 shares and Investor Class shares. All classes have equal rights and voting privileges, except for matters affecting a single class. Investment income, realized and unrealized capital gains and losses, the common expenses of the Fund, and certain fund-level expense reductions, if any, are allocated on a pro-rata basis to each class based on the relative net assets of each class to the total net assets of the Fund. Each class differs with respect to transfer agent and distribution and service plan fees incurred. Certain expense reductions also differ by class.
2. Investments in Fidelity Central Funds.
The Fund may invest in Fidelity Central Funds, which are open-end investment companies available only to other investment companies and accounts managed by Fidelity Management & Research Company (FMR) and its affiliates. The Fund's Schedule of Investments lists each of the Fidelity Central Funds held as of period end, if any, as an investment of the Fund, but does not include the underlying holdings of each Fidelity Central Fund. As an Investing Fund, the Fund indirectly bears its proportionate share of the expenses of the underlying Fidelity Central Funds.
The Money Market Central Funds seek preservation of capital and current income and are managed by Fidelity Investments Money Management, Inc. (FIMM), an affiliate of FMR.
A complete unaudited list of holdings for each Fidelity Central Fund is available upon request or at the Securities and Exchange Commission (the SEC) web site at www.sec.gov. In addition, the financial statements of the Fidelity Central Funds, which are not covered by the Fund's Report of Independent Registered Public Accounting Firm, are available on the SEC web site or upon request.
3. Significant Accounting Policies.
The financial statements have been prepared in conformity with accounting principles generally accepted in the United States of America, which require management to make certain estimates and assumptions at the date of the financial statements. Actual results could differ from those estimates. Events or transactions occurring after period end through the date that the financial statements were issued, February 12, 2010, have been evaluated in the preparation of the financial statements. The following summarizes the significant accounting policies of the Fund:
Security Valuation. Investments are valued as of 4:00 p.m. Eastern time on the last calendar day of the period. The Fund uses independent pricing services approved by the Board of Trustees to value its investments. When current market prices or quotations are not readily available or reliable, valuations may be determined in good faith in accordance with procedures adopted by the Board of Trustees. Factors used in determining value may include significant market or security specific events, changes in interest rates and credit quality. The frequency with which these procedures are used cannot be predicted and may be utilized to a significant extent. The value used for net asset value (NAV) calculation under these procedures may differ from published prices for the same securities.
The Fund categorizes the inputs to valuation techniques used to value its investments into a disclosure hierarchy consisting of three levels as shown below.
Level 1 - quoted prices in active markets for identical investments
Level 2 - other significant observable inputs (including quoted prices for similar investments, interest rates, prepayment speeds, etc.)
Level 3 - unobservable inputs (including the fund's own assumptions based on the best information available)
Changes in valuation techniques may result in transfers in or out of an assigned level within the disclosure hierarchy. The aggregate value of investments by input level, as of December 31, 2009 is included at the end of the Fund's Schedule of Investments. Valuation techniques used to value the Fund's investments by major category are as follows.
Equity securities, including restricted securities, for which market quotations are readily available, are valued at the last reported sale price or official closing price as reported by an independent pricing service on the primary market or exchange on which they are traded and are categorized as level 1 in the hierarchy. In the event there were no sales during the day or closing prices are not available, securities are valued at the last quoted bid price or may be valued using the last available price and categorized as Level 2 in the hierarchy. For foreign equity securities, when significant market or security events arise, comparisons to the valuation of American Depository Receipts (ADRs), futures contracts, exchange-traded funds (ETFs) and certain indexes as well as quoted prices for similar securities are used and are categorized as Level 2 in the hierarchy in these circumstances. For restricted securities and private placements where observable inputs are limited, assumptions about market activity and risk are used and are categorized as level 3 in the hierarchy.
Annual Report
3. Significant Accounting Policies - continued
Security Valuation - continued
Debt securities, including restricted securities, are valued based on evaluated quotations received from independent pricing services or from dealers who make markets in such securities. For corporate bonds, pricing services utilize matrix pricing which considers yield or price of bonds of comparable quality, coupon, maturity and type as well as dealer supplied prices and are generally categorized as Level 2 in the hierarchy. Investments in open-end mutual funds, including the Fidelity Money Market Central Funds, are valued at their closing net asset value each business day and are categorized as Level 1 in the hierarchy. Short-term securities with remaining maturities of sixty days or less for which quotations are not readily available are valued at amortized cost, which approximates value and are categorized as level 2 in the hierarchy.
When independent prices are unavailable or unreliable, debt securities may be valued utilizing pricing matrices which consider similar factors that would be used by independent pricing services. These are generally categorized as Level 2 in the hierarchy but may be Level 3 depending on the circumstances.
Foreign Currency. The Fund uses foreign currency contracts to facilitate transactions in foreign-denominated securities. Losses from these transactions may arise from changes in the value of the foreign currency or if the counterparties do not perform under the contracts' terms.
Foreign-denominated assets, including investment securities, and liabilities are translated into U.S. dollars at the exchange rate at period end. Purchases and sales of investment securities, income and dividends received and expenses denominated in foreign currencies are translated into U.S. dollars at the exchange rate in effect on the transaction date.
The effects of exchange rate fluctuations on investments are included with the net realized and unrealized gain (loss) on investment securities. Other foreign currency transactions resulting in realized and unrealized gain (loss) are disclosed separately.
Investment Transactions and Income. For financial reporting purposes, the Fund's investment holdings and NAV include trades executed through the end of the last business day of the period. The NAV per share for processing shareholder transactions is calculated as of the close of business of the New York Stock Exchange (NYSE), normally 4:00 p.m. Eastern time and includes trades executed through the end of the prior business day. Gains and losses on securities sold are determined on the basis of identified cost and may include proceeds received from litigation. Dividend income is recorded on the ex-dividend date, except for certain dividends from foreign securities where the ex-dividend date may have passed, which are recorded as soon as the Fund is informed of the ex-dividend date. Non-cash dividends included in dividend income, if any, are recorded at the fair market value of the securities received. Distributions received on securities that represent a return of capital or capital gain are recorded as a reduction of cost of investments and/or as a realized gain. The Fund estimates the components of distributions received that may be considered return of capital distributions or capital gain distributions. Interest income and distributions from the Fidelity Central Funds are accrued as earned. Interest income includes coupon interest and amortization of premium and accretion of discount on debt securities. Investment income is recorded net of foreign taxes withheld where recovery of such taxes is uncertain.
Expenses. Most expenses of the trust can be directly attributed to a fund. Expenses which cannot be directly attributed are apportioned among each Fund in the trust. Expense estimates are accrued in the period to which they relate and adjustments are made when actual amounts are known.
Income Tax Information and Distributions to Shareholders. Each year, the Fund intends to qualify as a regulated investment company by distributing substantially all of its taxable income and realized gains under Subchapter M of the Internal Revenue Code and filing its U.S. federal tax return. As a result, no provision for income taxes is required. As of December 31, 2009, the Fund did not have any unrecognized tax benefits in the accompanying financial statements. A Fund's federal tax return is subject to examination by the Internal Revenue Service (IRS) for a period of three years. Foreign taxes are provided for based on the Fund's understanding of the tax rules and rates that exist in the foreign markets in which it invests.
Distributions are recorded on the ex-dividend date. Income dividends and capital gain distributions are declared separately for each class. Income and capital gain distributions are determined in accordance with income tax regulations, which may differ from generally accepted accounting principles.
Capital accounts within the financial statements are adjusted for permanent book-tax differences. These adjustments have no impact on net assets or the results of operations. Temporary book-tax differences will reverse in a subsequent period.
Book-tax differences are primarily due to the short-term gain distributions from the Fidelity Central Funds, foreign currency transactions, passive foreign investment companies (PFIC), capital loss carryforwards and losses deferred to wash sales and excise tax regulations.
The federal tax cost of investment securities and unrealized appreciation (depreciation) as of period end were as follows:
Gross unrealized appreciation | $ 70,597,312 |
Gross unrealized depreciation | (52,608,932) |
Net unrealized appreciation (depreciation) | $ 17,988,380 |
| |
Tax Cost | $ 357,565,153 |
Annual Report
Notes to Financial Statements - continued
3. Significant Accounting Policies - continued
Income Tax Information and Distributions to Shareholders - continued
The tax-based components of distributable earnings as of period end were as follows:
Capital loss carryforward | $ (53,390,490) |
Net unrealized appreciation (depreciation) | $ 17,987,253 |
The tax character of distributions paid was as follows:
| December 31, 2009 | December 31, 2008 |
Ordinary Income | $ 1,156,325 | $ 2,562,622 |
Long-term Capital Gains | - | 16,419,842 |
Total | $ 1,156,325 | $ 18,982,464 |
Trading (Redemption) Fees. Shares held less than 60 days are subject to a redemption fee equal to 1% of the proceeds of the redeemed shares. All redemption fees, including any estimated redemption fees paid by FMR, are retained by the Fund and accounted for as an addition to paid in capital.
4. Purchases and Sales of Investments.
Purchases and sales of securities, other than short-term securities, aggregated $347,708,014 and $356,645,998, respectively.
5. Fees and Other Transactions with Affiliates.
Management Fee. FMR and its affiliates provide the Fund with investment management related services for which the Fund pays a monthly management fee. The management fee is the sum of an individual fund fee rate that is based on an annual rate of .30% of the Fund's average net assets and a group fee rate that averaged .26% during the period. The group fee rate is based upon the average net assets of all the mutual funds advised by FMR. The group fee rate decreases as assets under management increase and increases as assets under management decrease. For the period, the total annual management fee rate was .56% of the Fund's average net assets.
Distribution and Service Plan. In accordance with Rule 12b-1 of the 1940 Act, the Fund has adopted a separate 12b-1 Plan for Service Class 2 shares. Service Class 2 pays Fidelity Distributors Corporation (FDC), an affiliate of FMR, a service fee. For the period, the service fee is based on an annual rate of .25% of Service Class 2's average net assets.
For the period, Service Class 2 paid FDC $266,327, all of which was re-allowed to insurance companies for the distribution of shares and providing shareholder support services.
Transfer Agent Fees. Fidelity Investments Institutional Operations Company, Inc. (FIIOC), an affiliate of FMR, is the Fund's transfer, dividend disbursing, and shareholder servicing agent. FIIOC receives an asset-based fee with respect to each class. Each class (with the exception of Investor Class) pays a transfer agent fee, excluding out of pocket expenses, equal to an annual rate of .07% of average net assets. Investor Class pays a monthly asset-based transfer agent fee of .15% of average net assets. The total transfer agent fees paid by each class to FIIOC, including out of pocket expenses, were as follows:
Initial Class | $ 109,902 |
Service Class 2 | 82,533 |
Investor Class | 127,808 |
| $ 320,243 |
Accounting and Security Lending Fees. Fidelity Service Company, Inc. (FSC), an affiliate of FMR, maintains the Fund's accounting records. The accounting fee is based on the level of average net assets for the month. Under a separate contract, FSC administers the security lending program. The security lending fee is based on the number and duration of lending transactions.
Brokerage Commissions. The Fund placed a portion of its portfolio transactions with brokerage firms which are affiliates of the investment adviser. The commissions paid to these affiliated firms were $2,329 for the period.
6. Committed Line of Credit.
The Fund participates with other funds managed by FMR in a $3.5 billion credit facility (the "line of credit") to be utilized for temporary or emergency purposes to fund shareholder redemptions or for other short-term liquidity purposes. The Fund has agreed to pay commitment fees on its pro-rata portion of the line of credit, which amounted to $1,529 and is reflected in Miscellaneous Expense on the Statement of Operations. During the period, there were no borrowings on this line of credit.
Annual Report
7. Security Lending.
The Fund lends portfolio securities from time to time in order to earn additional income. On the settlement date of the loan, the Fund receives collateral (in the form of U.S. Treasury obligations, letters of credit and/or cash) against the loaned securities and maintains collateral in an amount not less than 100% of the market value of the loaned securities during the period of the loan. The market value of the loaned securities is determined at the close of business of the Fund and any additional required collateral is delivered to the Fund on the next business day. If the borrower defaults on its obligation to return the securities loaned because of insolvency or other reasons, a fund could experience delays and costs in recovering the securities loaned or in gaining access to the collateral. Any cash collateral received is invested in the Fidelity Securities Lending Cash Central Fund. The value of loaned securities and cash collateral at period end are disclosed on the Fund's Statement of Assets and Liabilities. Security lending income represents the income earned on investing cash collateral, less fees and expenses associated with the loan, plus any premium payments that may be received on the loan of certain types of securities. Security lending income is presented in the Statement of Operations as a component of income from Fidelity Central Funds. Net income from lending portfolio securities during the period amounted to $91,251.
8. Expense Reductions.
Many of the brokers with whom FMR places trades on behalf of the Fund provided services to the Fund in addition to trade execution. These services included payments of certain expenses on behalf of the Fund totaling $15,112 for the period.
9. Distributions to Shareholders.
Distributions to shareholders of each class were as follows:
Years ended December 31, | 2009 | 2008 |
From net investment income | | |
Initial Class | $ 612,974 | $ 256,873 |
Service Class 2 | 245,394 | - |
Investor Class | 297,957 | 18,402 |
Total | $ 1,156,325 | $ 275,275 |
From net realized gain | | |
Initial Class | $ - | $ 8,939,423 |
Service Class 2 | - | 6,049,173 |
Investor Class | - | 3,718,593 |
Total | $ - | $ 18,707,189 |
10. Share Transactions.
Transactions for each class of shares were as follows:
| Shares | Dollars |
Years ended December 31, | 2009 | 2008 | 2009 | 2008 |
Initial Class | | | | |
Shares sold | 1,204,844 | 1,984,359 | $ 16,607,740 | $ 49,227,554 |
Reinvestment of distributions | 36,815 | 627,226 | 612,974 | 9,196,296 |
Shares redeemed | (2,529,302) | (5,719,043) | (35,099,465) | (116,160,558) |
Net increase (decrease) | (1,287,643) | (3,107,458) | $ (17,878,751) | $ (57,736,708) |
Service Class 2 | | | | |
Shares sold | 1,896,791 | 3,461,499 | $ 25,683,905 | $ 81,684,684 |
Reinvestment of distributions | 14,810 | 428,438 | 245,394 | 6,049,173 |
Shares redeemed | (2,330,582) | (3,320,478) | (30,821,580) | (66,620,993) |
Net increase (decrease) | (418,981) | 569,459 | $ (4,892,281) | $ 21,112,864 |
Investor Class | | | | |
Shares sold | 1,690,015 | 2,051,429 | $ 23,990,831 | $ 52,822,887 |
Reinvestment of distributions | 17,928 | 264,475 | 297,957 | 3,736,995 |
Shares redeemed | (1,201,221) | (2,438,344) | (16,086,929) | (49,442,398) |
Net increase (decrease) | 506,722 | (122,440) | $ 8,201,859 | $ 7,117,484 |
Annual Report
Notes to Financial Statements - continued
11. Other.
The Fund's organizational documents provide former and current trustees and officers with a limited indemnification against liabilities arising in connection with the performance of their duties to the Fund. In the normal course of business, the Fund may also enter into contracts that provide general indemnifications. The Fund's maximum exposure under these arrangements is unknown as this would be dependent on future claims that may be made against the Fund. The risk of material loss from such claims is considered remote.
At the end of the period, FMR or its affiliates were the owners of record of 66% of the total outstanding shares of the Fund and one otherwise unaffiliated shareholder was the owner of record of 34% of the total outstanding shares of the Fund.
Annual Report
Report of Independent Registered Public Accounting Firm
To the Trustees of Variable Insurance Products Fund IV and the Shareholders of VIP Energy Portfolio:
In our opinion, the accompanying statement of assets and liabilities, including the schedule of investments, and the related statements of operations and of changes in net assets and the financial highlights present fairly, in all material respects, the financial position of VIP Energy Portfolio (a fund of Variable Insurance Products Fund IV) at December 31, 2009, the results of its operations for the year then ended, the changes in its net assets for each of the two years in the period then ended and the financial highlights for each of the periods indicated, in conformity with accounting principles generally accepted in the United States of America. These financial statements and financial highlights (hereafter referred to as "financial statements") are the responsibility of the VIP Energy Portfolio's management. Our responsibility is to express an opinion on these financial statements based on our audits. We conducted our audits of these financial statements in accordance with the standards of the Public Company Accounting Oversight Board (United States). Those standards require that we plan and perform the audit to obtain reasonable assurance about whether the financial statements are free of material misstatement. An audit includes examining, on a test basis, evidence supporting the amounts and disclosures in the financial statements, assessing the accounting principles used and significant estimates made by management, and evaluating the overall financial statement presentation. We believe that our audits, which included confirmation of securities at December 31, 2009 by correspondence with the custodian and brokers, provide a reasonable basis for our opinion.
/s/ PricewaterhouseCoopers LLP
PricewaterhouseCoopers LLP
Boston, Massachusetts
February 12, 2010
Annual Report
The Trustees, Member of the Advisory Board, and executive officers of the trust and fund, as applicable, are listed below. The Board of Trustees governs the fund and is responsible for protecting the interests of shareholders. The Trustees are experienced executives who meet periodically throughout the year to oversee the fund's activities, review contractual arrangements with companies that provide services to the fund, and review the fund's performance. Except for James C. Curvey, each of the Trustees oversees 222 funds advised by FMR or an affiliate. Mr. Curvey oversees 410 funds advised by FMR or an affiliate.
The Trustees hold office without limit in time except that (a) any Trustee may resign; (b) any Trustee may be removed by written instrument, signed by at least two-thirds of the number of Trustees prior to such removal; (c) any Trustee who requests to be retired or who has become incapacitated by illness or injury may be retired by written instrument signed by a majority of the other Trustees; and (d) any Trustee may be removed at any special meeting of shareholders by a two-thirds vote of the outstanding voting securities of the trust. Each Trustee who is not an interested person (as defined in the 1940 Act) (Independent Trustee), shall retire not later than the last day of the calendar year in which his or her 72nd birthday occurs. The Independent Trustees may waive this mandatory retirement age policy with respect to individual Trustees. The executive officers and Advisory Board Member hold office without limit in time, except that any officer and Advisory Board Member may resign or may be removed by a vote of a majority of the Trustees at any regular meeting or any special meeting of the Trustees. Except as indicated, each individual has held the office shown or other offices in the same company for the past five years.
The fund's Statement of Additional Information (SAI) includes more information about the Trustees. To request a free copy, call Fidelity at 1-877-208-0098.
Interested Trustees*:
Correspondence intended for each Trustee who is an interested person may be sent to Fidelity Investments, 82 Devonshire Street, Boston, Massachusetts 02109.
Name, Age; Principal Occupation |
Edward C. Johnson 3d (79) |
| Year of Election or Appointment: 1983 Mr. Johnson is Trustee and Chairman of the Board of Trustees of certain Trusts. Mr. Johnson serves as Chief Executive Officer, Chairman, and a Director of FMR LLC; Chairman and a Director of FMR; Chairman and a Director of Fidelity Research & Analysis Company (FRAC); Chairman and a Director of Fidelity Investments Money Management, Inc.; and Chairman and a Director of FMR Co., Inc. In addition, Mr. Johnson serves as Chairman and Director of FIL Limited. Previously, Mr. Johnson served as President of FMR LLC (2006-2007). |
James C. Curvey (74) |
| Year of Election or Appointment: 2007 Mr. Curvey also serves as Trustee (2007-present) of other investment companies advised by FMR. Mr. Curvey is a Director of FMR and FMR Co., Inc. (2007-present). Mr. Curvey is also Vice Chairman (2006-present) and Director of FMR LLC. In addition, Mr. Curvey serves as an Overseer for the Boston Symphony Orchestra and a member of the Trustees of Villanova University. |
* Trustees have been determined to be "Interested Trustees" by virtue of, among other things, their affiliation with the trust or various entities under common control with FMR.
Independent Trustees:
Correspondence intended for each Independent Trustee (that is, the Trustees other than the Interested Trustees) may be sent to Fidelity Investments, P.O. Box 55235, Boston, Massachusetts 02205-5235.
Name, Age; Principal Occupation |
Dennis J. Dirks (61) |
| Year of Election or Appointment: 2005 Prior to his retirement in May 2003, Mr. Dirks was Chief Operating Officer and a member of the Board of The Depository Trust & Clearing Corporation (DTCC). He also served as President, Chief Operating Officer, and Board member of The Depository Trust Company (DTC) and President and Board member of the National Securities Clearing Corporation (NSCC). In addition, Mr. Dirks served as Chief Executive Officer and Board member of the Government Securities Clearing Corporation, Chief Executive Officer and Board member of the Mortgage-Backed Securities Clearing Corporation, as a Trustee and a member of the Finance Committee of Manhattan College (2005-2008), and as a Trustee and a member of the Finance Committee of AHRC of Nassau County (2006-2008). Currently, Mr. Dirks serves as a member of the Board of Directors for The Brookville Center for Children's Services, Inc. (2009-present). |
Alan J. Lacy (56) |
| Year of Election or Appointment: 2008 Mr. Lacy serves as Senior Adviser (2007-present) of Oak Hill Capital Partners, L.P. (private equity). Mr. Lacy also served as Chief Executive Officer (2000-2005) and Vice Chairman (2005-2006) of Sears Holdings Corporation and Sears, Roebuck and Co. (retail). In addition, Mr. Lacy serves as a member of the Board of Directors of The Western Union Company (global money transfer, 2006-present) and Bristol-Myers Squibb Company (global pharmaceuticals, 2007-present). Mr. Lacy is Chairman (2008-present) and a member (2006-present) of the Board of Trustees of The National Parks Conservation Association. |
Ned C. Lautenbach (65) |
| Year of Election or Appointment: 2000 Mr. Lautenbach is Chairman of the Independent Trustees of the Equity and High Income Funds (2006-present). Mr. Lautenbach is an Advisory Partner of Clayton, Dubilier & Rice, Inc. (private equity investment). Previously, Mr. Lautenbach was with the International Business Machines Corporation (IBM) from 1968 until his retirement in 1998. Mr. Lautenbach serves as a Director of Eaton Corporation (diversified industrial) as well as the Philharmonic Center for the Arts in Naples, Florida. Mr. Lautenbach is also a member of the Board of Trustees of Fairfield University (2005-present), as well as a member of the Council on Foreign Relations. Previously, Mr. Lautenbach served as a Director of Sony Corporation (2006-2007). |
Joseph Mauriello (65) |
| Year of Election or Appointment: 2008 Prior to his retirement in January 2006, Mr. Mauriello served in numerous senior management positions including Deputy Chairman and Chief Operating Officer (2004-2005), and Vice Chairman of Financial Services (2002-2004) of KPMG LLP US (professional services, 1965-2005). Mr. Mauriello currently serves as a member of the Board of Directors of XL Capital Ltd. (global insurance and re-insurance, 2006-present) and of Arcadia Resources Inc. (health care services and products, 2007-present). Previously, Mr. Mauriello served as a Director of the Hamilton Funds of the Bank of New York (2006-2007). |
Cornelia M. Small (65) |
| Year of Election or Appointment: 2005 Ms. Small is a member of the Board of Directors of the Teagle Foundation (2009-present). Ms. Small is also a member of the Investment Committee, and Chair (2008-present) and a member of the Board of Trustees of Smith College. In addition, Ms. Small serves on the Investment Committee of the Berkshire Taconic Community Foundation (2008-present). Previously, Ms. Small served as Chairperson of the Investment Committee (2002-2008) of Smith College. In addition, Ms. Small served as Chief Investment Officer, Director of Global Equity Investments, and a member of the Board of Directors of Scudder, Stevens & Clark and Scudder Kemper Investments. |
William S. Stavropoulos (70) |
| Year of Election or Appointment: 2001 Mr. Stavropoulos serves as President and Founder of the Michigan Baseball Foundation, the Great Lakes Loons (2007-present). Mr. Stavropoulos is Chairman Emeritus of the Board of Directors of The Dow Chemical Company, where he previously served in numerous senior management positions, including President, CEO (1995-2000; 2002-2004), Chairman of the Executive Committee (2000-2006), and as a member of the Board of Directors (1990-2006). Currently, Mr. Stavropoulos is a Director of Teradata Corporation (data warehousing and technology solutions, 2008-present), Chemical Financial Corporation, Maersk Inc. (industrial conglomerate), Tyco International, Inc. (multinational manufacturing and services, 2007-present), and a member of the Advisory Board for Metalmark Capital (private equity investment, 2005-present). Mr. Stavropoulos is a special advisor to Clayton, Dubilier & Rice, Inc. (private equity investment). In addition, Mr. Stavropoulos is a member of the University of Notre Dame Advisory Council for the College of Science. |
David M. Thomas (60) |
| Year of Election or Appointment: 2008 Previously, Mr. Thomas served as Executive Chairman (2005-2006) and Chairman and Chief Executive Officer (2000-2005) of IMS Health, Inc. (pharmaceutical and healthcare information solutions). In addition, Mr. Thomas serves as a member of the Board of Directors of Fortune Brands, Inc. (consumer products), and Interpublic Group of Companies, Inc. (marketing communication, 2004-present). |
Michael E. Wiley (59) |
| Year of Election or Appointment: 2008 Mr. Wiley also serves as a Director of Asia Pacific Exploration Consolidated (international oil and gas exploration and production, 2008-present), and as a member of the Board of Trustees of the University of Tulsa (2000-2006; 2007-present). Mr. Wiley serves as a Director of Tesoro Corporation (independent oil refiner and marketer, 2005-present), and a Director of Bill Barrett Corporation (exploration and production, 2005-present). In addition, Mr. Wiley also serves as a Director of Post Oak Bank (privately-held bank, 2004-present). Previously, Mr. Wiley served as a Sr. Energy Advisor of Katzenbach Partners, LLC (consulting, 2006-2007), as an Advisory Director of Riverstone Holdings (private investment), Chairman, President, and CEO of Baker Hughes, Inc. (oilfield services, 2000-2004), and as Director of Spinnaker Exploration Company (exploration and production, 2001-2005). |
Annual Report
Advisory Board Member and Executive Officers:
Correspondence intended for each executive officer and Peter S. Lynch may be sent to Fidelity Investments, 82 Devonshire Street, Boston, Massachusetts 02109.
Name, Age; Principal Occupation |
Peter S. Lynch (65) |
| Year of Election or Appointment: 2003 Member of the Advisory Board of Fidelity's Equity and High Income Funds. Mr. Lynch is Vice Chairman and a Director of FMR and FMR Co., Inc. In addition, Mr. Lynch serves as a Trustee of Boston College and as the Chairman of the Inner-City Scholarship Fund. Previously, Mr. Lynch served on the Special Olympics International Board of Directors (1997-2006). |
Kenneth B. Robins (40) |
| Year of Election or Appointment: 2008 President and Treasurer of Fidelity's Equity and High Income Funds. Mr. Robins also serves as Assistant Treasurer of other Fidelity funds (2009-present) and is an employee of Fidelity Investments (2004-present). Before joining Fidelity Investments, Mr. Robins worked at KPMG LLP, where he was a partner in KPMG's department of professional practice (2002-2004). |
Brian B. Hogan (45) |
| Year of Election or Appointment: 2009 Vice President of certain Equity Funds and Vice President of Sector Funds. Mr. Hogan also serves as Senior Vice President, Equity Research of FMR (2006-present) and President of FMR's Equity Division (2009-present). Previously, Mr. Hogan served as a portfolio manager. |
Christopher S. Bartel (38) |
| Year of Election or Appointment: 2009 Vice President of Fidelity's Sector and Real Estate Equity Funds. Mr. Bartel also serves as Senior Vice President of Equity Research (2009-present). Previously, Mr. Bartel served as Managing Director of Research (2006-2009) and an analyst and portfolio manager (2000-2006). |
Scott C. Goebel (41) |
| Year of Election or Appointment: 2008 Secretary and Chief Legal Officer (CLO) of the Fidelity funds. Mr. Goebel also serves as General Counsel, Secretary, and Senior Vice President of FMR (2008-present) and FMR Co., Inc. (2008-present); Deputy General Counsel of FMR LLC; Chief Legal Officer of Fidelity Management & Research (Hong Kong) Limited (2008-present) and Assistant Secretary of Fidelity Management & Research (Japan) Inc. (2008-present), Fidelity Investments Money Management, Inc. (2008-present), Fidelity Management & Research (U.K.) Inc. (2008-present), and Fidelity Research and Analysis Company (2008-present). Previously, Mr. Goebel served as Assistant Secretary of the Funds (2007-2008) and as Vice President and Secretary of Fidelity Distributors Corporation (FDC) (2005-2007). |
William C. Coffey (40) |
| Year of Election or Appointment: 2009 Assistant Secretary of Fidelity's Equity and High Income Funds. Mr. Coffey also serves as Vice President and Associate General Counsel of FMR LLC (2005-present), and is an employee of Fidelity Investments. |
Holly C. Laurent (55) |
| Year of Election or Appointment: 2008 Anti-Money Laundering (AML) Officer of the Fidelity funds. Ms. Laurent is an employee of Fidelity Investments. Previously, Ms. Laurent was Senior Vice President and Head of Legal for Fidelity Business Services India Pvt. Ltd. (2006-2008), and Senior Vice President, Deputy General Counsel and Group Head for FMR LLC (2005-2006). |
Christine Reynolds (51) |
| Year of Election or Appointment: 2008 Chief Financial Officer of the Fidelity funds. Ms. Reynolds became President of Fidelity Pricing and Cash Management Services (FPCMS) in August 2008. Ms. Reynolds served as Chief Operating Officer of FPCMS (2007-2008). Previously, Ms. Reynolds served as President, Treasurer, and Anti-Money Laundering officer of the Fidelity funds (2004-2007). |
Kenneth A. Rathgeber (62) |
| Year of Election or Appointment: 2004 Chief Compliance Officer of Fidelity's Equity and High Income Funds. Mr. Rathgeber is Chief Compliance Officer of Fidelity Management & Research (Hong Kong) Limited (2008-present), Fidelity Management & Research (Japan) Inc. (2008-present), FMR (2005-present), FMR Co., Inc. (2005-present), Fidelity Management & Research (U.K.) Inc. (2005-present), Fidelity Research & Analysis Company (2005-present), Fidelity Investments Money Management, Inc. (2005-present), Pyramis Global Advisors, LLC (2005-present), and Strategic Advisers, Inc. (2005-present). |
Jeffrey S. Christian (48) |
| Year of Election or Appointment: 2009 Deputy Treasurer of the Fidelity funds. Mr. Christian is an employee of Fidelity Investments. Previously, Mr. Christian served as Chief Financial Officer (2008-2009) of certain Fidelity funds, Senior Vice President of Fidelity Pricing and Cash Management Services (FPCMS) (2004-2009), and as Vice President of Business Analysis (2003-2004). |
Bryan A. Mehrmann (48) |
| Year of Election or Appointment: 2005 Deputy Treasurer of the Fidelity funds. Mr. Mehrmann is an employee of Fidelity Investments. Previously, Mr. Mehrmann served as Vice President of Fidelity Investments Institutional Services Group (FIIS)/Fidelity Investments Institutional Operations Company, Inc. (FIIOC) Client Services (1998-2004). |
Adrien E. Deberghes (42) |
| Year of Election or Appointment: 2008 Deputy Treasurer of Fidelity's Equity and High Income Funds. Mr. Deberghes is an employee of Fidelity Investments (2008-present). Previously, Mr. Deberghes served as Senior Vice President of Mutual Fund Administration at State Street Corporation (2007-2008), Senior Director of Mutual Fund Administration at Investors Bank & Trust (2005-2007), and Director of Finance for Dunkin' Brands (2000-2005). |
John R. Hebble (51) |
| Year of Election or Appointment: 2009 Assistant Treasurer of Fidelity's Equity and High Income Funds. Mr. Hebble also serves as President and Treasurer of other Fidelity funds (2008-present) and is an employee of Fidelity Investments. |
Paul M. Murphy (62) |
| Year of Election or Appointment: 2007 Assistant Treasurer of the Fidelity funds. Mr. Murphy is an employee of Fidelity Investments. Previously, Mr. Murphy served as Chief Financial Officer of the Fidelity funds (2005-2006), Vice President and Associate General Counsel of FMR (2007), and Senior Vice President of Fidelity Pricing and Cash Management Services (FPCMS) (1994-2007). |
Gary W. Ryan (51) |
| Year of Election or Appointment: 2005 Assistant Treasurer of the Fidelity funds. Mr. Ryan is an employee of Fidelity Investments. Previously, Mr. Ryan served as Vice President of Fund Reporting in Fidelity Pricing and Cash Management Services (FPCMS) (1999-2005). |
Annual Report
Service Class 2 designates 100% of the dividends distributed during the fiscal year as qualifying for the dividends-received deduction for corporate shareholders.
The fund will notify shareholders in January 2010 of amounts for use in preparing 2009 income tax returns.
Annual Report
Board Approval of Investment Advisory Contracts and Management Fees
VIP Energy Portfolio
Each year, the Board of Trustees, including the Independent Trustees (together, the Board), votes on the renewal of the management contract and sub-advisory agreements (together, the Advisory Contracts) for the fund. The Board, assisted by the advice of fund counsel and Independent Trustees' counsel, requests and considers a broad range of information throughout the year.
The Board meets regularly and, acting directly and through its separate committees, requests and receives information concerning, and considers at each of its meetings factors that are relevant to, its annual consideration of the renewal of the fund's Advisory Contracts, including the services and support provided to the fund and its shareholders. The Board has established various standing committees, each composed of Independent Trustees with varying backgrounds, to which the Board has assigned specific subject matter responsibilities in order to enhance effective decision-making by the Board. Each committee has a written charter outlining the structure and purposes of the committee. The Board also meets as needed to consider matters specifically related to the Board's annual consideration of the renewal of Advisory Contracts.
At its July 2009 meeting, the Board of Trustees, including the Independent Trustees, unanimously determined to renew the fund's Advisory Contracts. In reaching its determination, the Board considered all factors it believed relevant, including (i) the nature, extent, and quality of the services to be provided to the fund and its shareholders (including the investment performance of the fund); (ii) the competitiveness of the fund's management fee and total expenses; (iii) the total costs of the services to be provided by and the profits to be realized by Fidelity from its relationship with the fund; (iv) the extent to which economies of scale would be realized as the fund grows; and (v) whether fee levels reflect these economies of scale, if any, for the benefit of fund shareholders.
In considering whether to renew the Advisory Contracts for the fund, the Board ultimately reached a determination, with the assistance of fund counsel and Independent Trustees' counsel and through the exercise of its business judgment, that the renewal of the Advisory Contracts and the compensation to be received by Fidelity under the management contract is consistent with Fidelity's fiduciary duty under applicable law. The Board's decision to renew the Advisory Contracts was not based on any single factor noted above, but rather was based on a comprehensive consideration of all the information provided to the Board at its meetings throughout the year. The Board, in reaching its determination to renew the Advisory Contracts, is aware that shareholders in the fund have a broad range of investment choices available to them, including a wide choice among mutual funds offered by competitors to Fidelity, and that the fund's shareholders, with the opportunity to review and weigh the disclosure provided by the fund in its prospectus and other public disclosures, have chosen to invest in this fund, managed by Fidelity.
Nature, Extent, and Quality of Services Provided. The Board considered staffing within the investment adviser, FMR, and the sub-advisers (together, the Investment Advisers), including the backgrounds of the fund's investment personnel and the fund's investment objective and discipline. The Independent Trustees also had discussions with senior management of Fidelity's investment operations and investment groups. The Board considered the structure of the portfolio manager compensation program and whether this structure provides appropriate incentives.
Resources Dedicated to Investment Management and Support Services. The Board reviewed the size, education, and experience of the Investment Advisers' investment staff, their use of technology, and the Investment Advisers' approach to recruiting, training, and retaining portfolio managers and other research, advisory, and management personnel. In response to last year's financial crisis, FMR took a number of actions intended to cut costs and improve efficiency without weakening the investment teams or resources. The Board noted that Fidelity's analysts have access to a variety of technological tools and market and securities data that enable them to perform both fundamental and quantitative analysis and to specialize in various disciplines. The Board considered Fidelity's extensive global research capabilities that enable the Investment Advisers to aggregate data from various sources in an effort to produce positive investment results. The Board also considered that Fidelity's portfolio managers and analysts have access to daily portfolio attribution that allows for monitoring of a fund's portfolio, as well as an electronic communication system that provides immediate real-time access to research concerning issuers and credit enhancers.
Shareholder and Administrative Services. The Board considered (i) the nature, extent, quality, and cost of advisory, administrative, distribution, and shareholder services performed by the Investment Advisers and their affiliates under the Advisory Contracts and under separate agreements covering transfer agency, pricing and bookkeeping, and securities lending services for the fund; (ii) the nature and extent of the Investment Advisers' supervision of third party service providers, principally custodians and subcustodians; and (iii) the resources devoted to, and the record of compliance with, the fund's compliance policies and procedures. The Board also reviewed the allocation of fund brokerage, including allocations to brokers affiliated with the Investment Advisers, the use of brokerage commissions to pay fund expenses, and the use of "soft" commission dollars to pay for research services.
The Board noted that the growth of fund assets across the complex allows Fidelity to reinvest in the development of services designed to enhance the value or convenience of the Fidelity funds as investment vehicles. These services include 24-hour access to account information and market information through phone representatives and over the Internet, and investor education materials and asset allocation tools.
Investment in a Large Fund Family. The Board considered the benefits to shareholders of investing in a Fidelity fund, including the benefits of investing in a fund that is part of a large family of funds offering a variety of investment disciplines and providing for a large variety of mutual fund investor services. The Board noted that Fidelity has taken a number of actions over the previous year that benefited particular funds, including (i) dedicating additional resources to investment research and to restructure and broaden the focus of the investment research teams; (ii) bolstering the senior management team that oversees asset management; (iii) contractually agreeing to reduce the management fee on Fidelity U.S. Bond Index Fund; and (iv) expanding Class A and Class T load waiver categories to increase rollover retention opportunities and create consistent policies across the classes.
Annual Report
Investment Performance. The Board considered whether the fund has operated within its investment objective, as well as its record of compliance with its investment restrictions. It also reviewed the fund's absolute investment performance for each class, as well as the fund's relative investment performance for each class measured against a third-party-sponsored index that reflects the market sector in which the fund invests over multiple periods. The Board noted that FMR does not believe that a meaningful peer group exists against which to compare the fund's performance. The following charts considered by the Board show, over the one-, three-, and five-year periods ended December 31, 2008, as available, the cumulative total returns of Initial Class and Service Class 2 of the fund and the cumulative total returns of a third-party-sponsored index ("benchmark"). The returns of Initial Class and Service Class 2 show the performance of the highest performing class (based on five-year performance) and the lowest performing class (based on three-year performance), respectively.
VIP Energy Portfolio
The Board stated that the investment performance of the fund was lower than its benchmark for all the periods shown. The Board discussed with FMR actions that have been taken by FMR to improve the fund's below-benchmark performance. The Board will continue to closely monitor the performance of the fund in the coming year and discuss with FMR other appropriate actions to address the performance of the fund. The Board considered that the variations in performance among the fund's classes reflect the variations in class expenses, which result in lower performance for higher expense classes.
The Board considered that FMR has taken steps to refocus and strengthen equity research, equity portfolio management, and compliance. The Board reviewed the year-to-date performance of Initial Class through May 31, 2009 and stated that it exceeded the fund's benchmark.
Based on its review, and giving particular weight to the nature and quality of the resources dedicated by the Investment Advisers to maintain and improve relative performance and factoring in the unprecedented market events in 2008, the Board concluded that the nature, extent, and quality of the services provided to the fund will benefit the fund's shareholders, particularly in light of the Board's view that the fund's shareholders benefit from investing in a fund that is part of a large family of funds offering a variety of investment disciplines and services.
Competitiveness of Management Fee and Total Fund Expenses. The Board considered the fund's management fee and total expenses compared to "mapped groups" of competitive funds and classes. Fidelity creates "mapped groups" by combining similar Lipper investment objective categories that have comparable management fee characteristics. Combining Lipper investment objective categories aids the Board's management fee and total expense comparisons by broadening the competitive group used for comparison and by reducing the number of universes to which various Fidelity funds are compared.
The Board considered two proprietary management fee comparisons for the 12-month periods shown in the chart below. The group of Lipper funds used by the Board for management fee comparisons is referred to below as the "Total Mapped Group." The Total Mapped Group comparison focuses on a fund's standing relative to the total universe of comparable funds available to investors, in terms of gross management fees before expense reimbursements or caps. "TMG %" represents the percentage of funds in the Total Mapped Group that had management fees that were lower than the fund's. For example, a TMG % of 4% means that 96% of the funds in the Total Mapped Group had higher management fees than the fund. The "Asset-Size Peer Group" (ASPG) comparison focuses on a fund's standing relative to non-Fidelity funds similar in size to the fund within the Total Mapped Group. The ASPG represents at least 15% of the funds in the Total Mapped Group with comparable asset size and management fee characteristics, subject to a minimum of 50 funds (or all funds in the Total Mapped Group if fewer than 50). Additional information, such as the ASPG quartile in which the fund's management fee ranked, is also included in the chart and considered by the Board.
Annual Report
Board Approval of Investment Advisory Contracts and Management Fees - continued
VIP Energy Portfolio
The Board noted that the fund's management fee ranked below the median of its Total Mapped Group and below the median of its ASPG for 2008.
Based on its review, the Board concluded that the fund's management fee was fair and reasonable in light of the services that the fund receives and the other factors considered.
In its review of each class's total expenses, the Board considered the fund's management fee as well as other fund or class expenses, as applicable, such as transfer agent fees, pricing and bookkeeping fees, fund-paid 12b-1 fees, and custodial, legal, and audit fees. The Board also noted the effects of any waivers and reimbursements on fees and expenses. As part of its review, the Board also considered current and historical total expenses of each class of the fund compared to competitive fund median expenses. Each class of the fund is compared to those funds and classes in the Total Mapped Group (used by the Board for management fee comparisons) that have a similar sales load structure.
The Board noted that the total expenses of each class ranked below its competitive median for 2008.
In its review of total expenses, the Board also considered Fidelity fee structures and other information on clients that FMR and its affiliates service in other competitive markets, such as other mutual funds advised or subadvised by FMR or its affiliates, pension plan clients, and other institutional clients.
Based on its review, the Board concluded that the total expenses of each class of the fund were reasonable in light of the services that the fund and its shareholders receive and the other factors considered.
Costs of the Services and Profitability. The Board considered the revenues earned and the expenses incurred by Fidelity in conducting the business of developing, marketing, distributing, managing, administering and servicing the fund and its shareholders. The Board also considered the level of Fidelity's profits in respect of all the Fidelity funds.
On an annual basis, FMR presents to the Board Fidelity's profitability for the fund. Fidelity calculates the profitability for each fund, as well as aggregate profitability for groups of Fidelity funds and all Fidelity funds, using a series of detailed revenue and cost allocation methodologies which originate with the audited books and records of Fidelity. The Audit Committee of the Board reviews any significant changes from the prior year's methodologies.
PricewaterhouseCoopers LLP (PwC), independent registered public accounting firm and auditor to Fidelity and certain Fidelity funds, has been engaged annually by the Board as part of the Board's assessment of Fidelity's profitability analysis. PwC's engagement includes the review and assessment of Fidelity's methodologies used in determining the revenues and expenses attributable to Fidelity's mutual fund business, and completion of agreed-upon procedures surrounding the mathematical accuracy of fund profitability and its conformity to allocation methodologies. After considering PwC's reports issued under the engagement and information provided by Fidelity, the Board believes that while other allocation methods may also be reasonable, Fidelity's profitability methodologies are reasonable in all material respects.
Annual Report
The Board has also reviewed Fidelity's non-fund businesses and any fall-out benefits related to the mutual fund business as well as cases where Fidelity's affiliates may benefit from or be related to the fund's business.
The Board considered the costs of the services provided by and the profits realized by Fidelity in connection with the operation of the fund and determined that the amount of profit is a fair entrepreneurial profit for the management of the fund.
Economies of Scale. The Board considered whether there have been economies of scale in respect of the management of the Fidelity funds, whether the Fidelity funds (including the fund) have appropriately benefited from any such economies of scale, and whether there is potential for realization of any further economies of scale. The Board considered the extent to which the fund will benefit from economies of scale through increased services to the fund, through waivers or reimbursements, or through fee or expense reductions.
In February 2009, the Board created an Ad Hoc Committee (the "Committee") to analyze economies of scale. The Committee was formed to consider whether FMR attains economies of scale in respect of the management and servicing of the Fidelity funds, whether the Fidelity funds have appropriately benefited from such economies of scale, and whether there is potential for realization of any further economies of scale.
The Board recognized that the fund's management contract incorporates a "group fee" structure, which provides for lower group fee rates as total fund assets under FMR's management increase, and for higher group fee rates as total fund assets under FMR's management decrease. FMR determines the group fee rates based on a tiered asset "breakpoint" schedule. The Board considered that the group fee is designed to deliver the benefits of economies of scale to fund shareholders when total fund assets increase, even if assets of any particular fund are unchanged or have declined, because some portion of Fidelity's costs are attributable to services provided to all Fidelity funds, and all funds benefit if those costs can be allocated among more assets. The Board concluded that, given the group fee structure, fund shareholders will achieve a certain level of economies of scale as assets under FMR's management increase at the fund complex level, regardless of whether Fidelity achieves any such economies of scale.
The Board concluded, considering the findings of the Committee, that any potential economies of scale are being shared between fund shareholders and Fidelity in an appropriate manner.
Additional Information Requested by the Board. In order to develop fully the factual basis for consideration of the Fidelity funds' Advisory Contracts, the Board requested and received additional information on certain topics, including (i) fund performance trends, actions to be taken by FMR to improve certain funds' overall performance and Fidelity's long-term strategies for certain funds; (ii) portfolio manager changes that have occurred during the past year; (iii) Fidelity's compensation structure for portfolio managers and key personnel, including performance benchmarks used by Fidelity in evaluating incentive compensation for portfolio managers and research analysts; (iv) the structure and process of equity research and actions taken by FMR to improve the quality of research; (v) the selection of and compensation paid by FMR to fund sub-advisers; (vi) Fidelity's fee structures and rationale for recommending different fees among categories of funds; (vii) the rationale for any differences between fund fee structures and fee structures in place for other Fidelity clients; (viii) Fidelity's rationale for recommending which funds should have a performance adjustment component as part of their management fees; and (ix) explanations for the relative total expenses borne by certain funds and classes, total expense competitive trends, and actions that might be taken by FMR to reduce total expenses for certain funds and classes.
Based on its evaluation of all of the conclusions noted above, and after considering all material factors, the Board ultimately concluded that the advisory fee structures are fair and reasonable, and that the fund's Advisory Contracts should be renewed.
Annual Report
Investment Adviser
Fidelity Management & Research Company
Boston, MA
Investment Sub-Advisers
FMR Co., Inc.
Fidelity Management & Research (U.K.) Inc.
Fidelity Research & Analysis Company
FIL Investments (Japan) Limited
FIL Investment Advisors
FIL Investment Advisors (U.K.) Ltd.
Fidelity Management & Research (Hong Kong) Limited
Fidelity Management & Research (Japan) Inc.
General Distributor
Fidelity Distributors Corporation
Boston, MA
Transfer and Service Agents
Fidelity Investments Institutional Operations Company, Inc.
Boston, MA
Fidelity Service Company, Inc.
Boston, MA
Custodian
State Street Bank & Trust Co.
Quincy, MA
VNR2-ANN-0210
1.826359.105
Fidelity® Variable Insurance Products:
Financial Services Portfolio
Annual Report
December 31, 2009
(2_fidelity_logos) (Registered_Trademark)
Contents
Performance | <Click Here> | How the fund has done over time. |
Management's Discussion | <Click Here> | The manager's review of fund performance, strategy andoutlook. |
Shareholder Expense Example | <Click Here> | An example of shareholder expenses. |
Investment Changes | <Click Here> | A summary of major shifts in the fund's investments over the past six months. |
Investments | <Click Here> | A complete list of the fund's investments with their market values. |
Financial Statements | <Click Here> | Statements of assets and liabilities, operations, and changes in net assets, as well as financial highlights. |
Notes | <Click Here> | Notes to the financial statements. |
Report of Independent Registered Public Accounting Firm | <Click Here> | |
Trustees and Officers | <Click Here> | |
Distributions | <Click Here> | |
Board Approval of Investment Advisory Contracts and Management Fees | <Click Here> | |
To view a fund's proxy voting guidelines and proxy voting record for the 12-month period ended June 30, visit http://www.fidelity.com/proxyvotingresults or visit the Securities and Exchange Commission's (SEC) web site at http://www.sec.gov. You may also call 1-877-208-0098 to request a free copy of the proxy voting guidelines.
Fidelity Variable Insurance Products are separate account options which are purchased through a variable insurance contract.
Standard & Poor's, S&P and S&P 500 are registered service marks of The McGraw-Hill Companies, Inc. and have been licensed for use by Fidelity Distributors Corporation.
Other third party marks appearing herein are the property of their respective owners.
All other marks appearing herein are registered or unregistered trademarks or service marks of FMR LLC or an affiliated company.
This report and the financial statements contained herein are submitted for the general information of the shareholders of the fund. This report is not authorized for distribution to prospective investors in the fund unless preceded or accompanied by an effective prospectus.
A fund files its complete schedule of portfolio holdings with the SEC for the first and third quarters of each fiscal year on Form N-Q. Forms N-Q are available on the SEC's web site at http://www.sec.gov. A fund's Forms N-Q may be reviewed and copied at the SEC's Public Reference Room in Washington, DC. Information regarding the operation of the SEC's Public Reference Room may be obtained by calling 1-800-SEC-0330. For a complete list of the fund's portfolio holdings, view the most recent holdings listing, semiannual report, or annual report on Fidelity's web site at http://www.fidelity.com or http://www.advisor.fidelity.com, as applicable.
NOT FDIC INSURED · MAY LOSE VALUE · NO BANK GUARANTEE
Neither the fund nor Fidelity Distributors Corporation is a bank.
Annual Report
Average annual total return reflects the change in the value of an investment, assuming reinvestment of the class' dividend income and capital gains (the profits earned upon the sale of securities that have grown in value, if any) and assuming a constant rate of performance each year. During periods of reimbursement by Fidelity, a fund's total return will be greater than it would be had the reimbursement not occurred. Performance numbers are net of all underlying fund operating expenses, but do not include any insurance charges imposed by your insurance company's separate account. If performance information included the effect of these additional charges, the total returns would have been lower. How a fund did yesterday is no guarantee of how it will do tomorrow.
Average Annual Total Returns
Periods ended December 31, 2009 | Past 1
year | Past 5
years | Life of fund A |
VIP Financial Services - Initial Class | 27.30% | -7.18% | -1.76% |
VIP Financial Services - Investor Class B | 27.30% | -7.28% | -1.82% |
A From July 18, 2001.
B The initial offering of Investor Class shares took place on July 21, 2005. Returns prior to July 21, 2005 are those of Initial Class. Had Investor Class's transfer agent fee been reflected, returns prior to July 21, 2005 would have been lower.
$10,000 Over Life of Fund
Let's say hypothetically that $10,000 was invested in VIP Financial Services Portfolio - Initial Class on July 18, 2001, when the fund started. The chart shows how the value of your investment would have changed, and also shows how the Standard & Poor's 500SM Index (S&P 500®) performed over the same period.
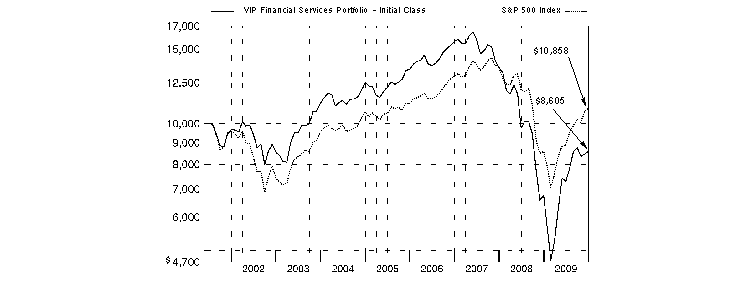
Annual Report
Market Recap: In 2009, most global markets saw both crippling lows and considerable highs. After a dismal start, the economy began to show signs of improvement, suggesting that a recovery was on the horizon. Credit markets began to heal as fiscal and monetary stimulus efforts around the world started to take effect, and corporate earnings staged an impressive rebound, fueled in large part by massive cost cutting. As a result, the flight to quality that marked most of 2008 and early 2009 shifted in March as investors flocked to riskier asset categories. The U.S. equity market, as measured by the bellwether Standard & Poor's 500SM Index and the blue-chip proxy Dow Jones Industrial AverageSM, reflected this changing environment, gaining 26.46% and 22.68%, respectively. Meanwhile, the technology-laden Nasdaq Composite® Index rose 45.32%. Foreign stocks also produced strong gains, as illustrated by the 31.93% jump of the MSCI® EAFE® Index (Europe, Australasia, Far East), a gauge of developed stock markets outside the U.S. and Canada. Emerging-markets stocks, which suffered their worst calendar-year performance ever in 2008, posted record returns this past year, with the MSCI Emerging Markets Index soaring 79.02%. A depreciating U.S. dollar helped bolster returns for U.S. investors in foreign equities.
Comments from Benjamin Hesse, Portfolio Manager of VIP Financial Services Portfolio: For the 12 months ending December 31, 2009, the fund significantly outperformed the 14.38% return of its sector benchmark, the MSCI® U.S. Investable Market Financials Index, and came out slightly ahead of the S&P 500®. (For specific portfolio results, please refer to the performance section of this report.) Stock selection was the strongest contributor to results, although industry weightings were also helpful, particularly in investment banking/brokerage, life/health insurance, regional banks and property/casualty insurance. Conversely, the fund lost ground in other diversified financial services and real estate development. Stock selection was weak among investment banking/brokerage and regional banks, but largely offset by favorable industry weightings. My focus remained on stocks with attractive valuations and shifts in earnings that could predict a turnaround. Top performers included Genworth Financial, a multi-line insurer that benefited from not having to raise capital, as well as BM&F BOVESPA, a Brazilian stock and futures exchange that is not in the MSCI index, and CME Group, which runs the Chicago Mercantile Exchange. Both exchanges did well as trading volumes picked up, leading me to take profits and sell CME. In addition, Principal Financial, a life insurer, gained as the rising stock market boosted the value of its investment portfolio. The fund was hurt by an underweighting in Bank of America - within other diversified financial services - as the stock rallied. In addition, KeyCorp, a Midwest regional bank, fell sharply following a poorly executed capital raise. Cash holdings also hindered results in a strong up market.
Note to shareholders: In January 2010, Fidelity adopted capped benchmarks for most of its sector and industry funds, including the VIP sector portfolios. The capped benchmarks, which limit the weightings of individual issuers, better represent the investment opportunities available to the fund and will provide shareholders with more-meaningful performance comparisons. These changes do not affect the investment policies of any of the funds, and the primary benchmark for all of the funds remains the Standard & Poor's 500 index.
The views expressed above reflect those of the portfolio manager(s) only through the end of the period as stated on the cover of this report and do not necessarily represent the views of Fidelity or any other person in the Fidelity organization. Any such views are subject to change at any time based upon market or other conditions and Fidelity disclaims any responsibility to update such views. These views may not be relied on as investment advice and, because investment decisions for a Fidelity fund are based on numerous factors, may not be relied on as an indication of trading intent on behalf of any Fidelity fund.
Annual Report
As a shareholder of the Fund, you incur two types of costs: (1) transaction costs, including redemption fees, and (2) ongoing costs, including management fees and other Fund expenses. This Example is intended to help you understand your ongoing costs (in dollars) of investing in the Fund and to compare these costs with the ongoing costs of investing in other mutual funds.
The Example is based on an investment of $1,000 invested at the beginning of the period and held for the entire period (July 1, 2009 to December 31, 2009).
Actual Expenses
The first line of the accompanying table for each class of the Fund provides information about actual account values and actual expenses. You may use the information in this line, together with the amount you invested, to estimate the expenses that you paid over the period. Simply divide your account value by $1,000.00 (for example, an $8,600 account value divided by $1,000.00 = 8.6), then multiply the result by the number in the first line for a class of the Fund under the heading entitled "Expenses Paid During Period" to estimate the expenses you paid on your account during this period. The estimate of expenses does not include any fees or other expenses of any variable annuity or variable life insurance product. If they were, the estimate of expenses you paid during the period would be higher, and your ending account value would be lower. In addition, the Fund, as a shareholder in the underlying Fidelity Central Funds, will indirectly bear its pro-rata share of the fees and expenses incurred by the underlying Fidelity Central Funds. These fees and expenses are not included in the Fund's annualized expense ratio used to calculate the expense estimate in the table below.
Hypothetical Example for Comparison Purposes
The second line of the accompanying table for each class of the Fund provides information about hypothetical account values and hypothetical expenses based on a Class' actual expense ratio and an assumed rate of return of 5% per year before expenses, which is not the Class' actual return. The hypothetical account values and expenses may not be used to estimate the actual ending account balance or expenses you paid for the period. You may use this information to compare the ongoing costs of investing in the Fund and other funds. To do so, compare this 5% hypothetical example with the 5% hypothetical examples that appear in the shareholder reports of the other funds. The estimate of expenses does not include any fees or other expenses of any variable annuity or variable life insurance product. If they were, the estimate of expenses you paid during the period would be higher, and your ending account value would be lower. In addition, the Fund, as a shareholder in the underlying Fidelity Central Funds, will indirectly bear its pro-rata share of the fees and expenses incurred by the underlying Fidelity Central Funds. These fees and expenses are not included in the Fund's annualized expense ratio used to calculate the expense estimate in the table below.
Please note that the expenses shown in the table are meant to highlight your ongoing costs only and do not reflect any transaction costs. Therefore, the second line of the table is useful in comparing ongoing costs only, and will not help you determine the relative total costs of owning different funds. In addition, if these transactional costs were included, your costs would have been higher.
|
Annualized
Expense Ratio
|
Beginning
Account Value
July 1, 2009
|
Ending
Account Value
December 31, 2009
| Expenses Paid
During Period*
July 1, 2009 to
December 31, 2009 |
Initial Class | .88% | | | |
Actual | | $ 1,000.00 | $ 1,180.40 | $ 4.84 |
HypotheticalA | | $ 1,000.00 | $ 1,020.77 | $ 4.48 |
Investor Class | .98% | | | |
Actual | | $ 1,000.00 | $ 1,180.10 | $ 5.39 |
HypotheticalA | | $ 1,000.00 | $ 1,020.27 | $ 4.99 |
A 5% return per year before expenses
* Expenses are equal to each Class' annualized expense ratio, multiplied by the average account value over the period, multiplied by 184/365 (to reflect the one-half year period).
Annual Report
Investment Changes (Unaudited)
Top Ten Stocks as of December 31, 2009 |
| % of fund's
net assets | % of fund's net assets
6 months ago |
Citigroup, Inc. | 5.2 | 0.4 |
Morgan Stanley | 5.1 | 5.0 |
Charles Schwab Corp. | 5.0 | 0.0 |
McGraw-Hill Companies, Inc. | 4.3 | 2.1 |
Bank of America Corp. | 4.3 | 3.8 |
JPMorgan Chase & Co. | 4.1 | 3.8 |
Bank of New York Mellon Corp. | 3.8 | 0.0 |
State Street Corp. | 3.7 | 0.0 |
Moody's Corp. | 3.4 | 0.0 |
Wells Fargo & Co. | 3.2 | 1.6 |
| 42.1 | |
Top Industries (% of fund's net assets) |
As of December 31, 2009 |
| Capital Markets | 34.7% | |
| Commercial Banks | 20.9% | |
| Diversified Financial Services | 17.9% | |
| Insurance | 8.2% | |
| IT Services | 6.4% | |
| All Others* | 11.9% | |

As of June 30, 2009 |
| Capital Markets | 27.6% | |
| Insurance | 18.6% | |
| Diversified Financial Services | 15.7% | |
| Commercial Banks | 15.2% | |
| IT Services | 6.3% | |
| All Others* | 16.6% | |

* Includes short-term investments and net other assets. |
Annual Report
Investments December 31, 2009
Showing Percentage of Net Assets
Common Stocks - 98.9% |
| Shares | | Value |
CAPITAL MARKETS - 34.7% |
Asset Management & Custody Banks - 15.5% |
AllianceBernstein Holding LP | 17,400 | | $ 488,940 |
Bank of New York Mellon Corp. | 49,745 | | 1,391,368 |
Bank Sarasin & Co. Ltd. Series B (Reg.) | 11,070 | | 418,018 |
EFG International | 45,068 | | 622,408 |
Franklin Resources, Inc. | 4,174 | | 439,731 |
GLG Partners, Inc. (a) | 4,700 | | 15,134 |
Janus Capital Group, Inc. | 9,800 | | 131,810 |
Legg Mason, Inc. | 13,962 | | 421,094 |
State Street Corp. | 31,200 | | 1,358,448 |
The Blackstone Group LP | 26,000 | | 341,120 |
U.S. Global Investments, Inc. Class A | 7,800 | | 96,018 |
| | 5,724,089 |
Investment Banking & Brokerage - 19.2% |
Broadpoint Gleacher Securities Group, Inc. (a) | 164,201 | | 732,336 |
Charles Schwab Corp. | 97,442 | | 1,833,858 |
Evercore Partners, Inc. Class A | 12,426 | | 377,750 |
GFI Group, Inc. | 103,839 | | 474,544 |
Jefferies Group, Inc. (a) | 20,550 | | 487,652 |
Lazard Ltd. Class A | 7,400 | | 280,978 |
MF Global Ltd. (a) | 129,647 | | 901,047 |
Morgan Stanley | 63,750 | | 1,887,000 |
TD Ameritrade Holding Corp. (a) | 5,300 | | 102,714 |
| | 7,077,879 |
TOTAL CAPITAL MARKETS | | 12,801,968 |
COMMERCIAL BANKS - 20.9% |
Diversified Banks - 13.4% |
Banco Macro SA sponsored ADR (c) | 25,100 | | 746,976 |
Barclays PLC Sponsored ADR (c) | 65,400 | | 1,151,040 |
BBVA Banco Frances SA sponsored ADR | 19,068 | | 119,938 |
China Citic Bank Corp. Ltd. Class H | 1,173,000 | | 992,865 |
China Merchants Bank Co. Ltd. (H Shares) | 30,500 | | 79,355 |
Comerica, Inc. | 7,900 | | 233,603 |
Mizuho Financial Group, Inc. | 75,400 | | 135,658 |
U.S. Bancorp, Delaware | 15,300 | | 344,403 |
Wells Fargo & Co. | 43,012 | | 1,160,894 |
| | 4,964,732 |
Regional Banks - 7.5% |
Fifth Third Bancorp | 12,000 | | 117,000 |
Glacier Bancorp, Inc. (c) | 21,060 | | 288,943 |
Huntington Bancshares, Inc. | 22,400 | | 81,760 |
KeyCorp | 131,700 | | 730,935 |
Nara Bancorp, Inc. | 8,916 | | 101,107 |
PNC Financial Services Group, Inc. | 497 | | 26,237 |
Regions Financial Corp. | 17,500 | | 92,575 |
SVB Financial Group (a) | 10,488 | | 437,245 |
|
| Shares | | Value |
Umpqua Holdings Corp. | 25,467 | | $ 341,512 |
Wintrust Financial Corp. | 17,504 | | 538,948 |
| | 2,756,262 |
TOTAL COMMERCIAL BANKS | | 7,720,994 |
CONSUMER FINANCE - 0.1% |
Consumer Finance - 0.1% |
Promise Co. Ltd. (c) | 5,850 | | 44,922 |
DIVERSIFIED CONSUMER SERVICES - 1.3% |
Specialized Consumer Services - 1.3% |
Sotheby's Class A (ltd. vtg.) (c) | 20,796 | | 467,494 |
DIVERSIFIED FINANCIAL SERVICES - 17.2% |
Other Diversified Financial Services - 13.6% |
Bank of America Corp. (c) | 104,700 | | 1,576,782 |
Citigroup, Inc. | 575,600 | | 1,905,239 |
JPMorgan Chase & Co. | 36,538 | | 1,522,538 |
| | 5,004,559 |
Specialized Finance - 3.6% |
BM&F BOVESPA SA | 3,000 | | 21,222 |
JSE Ltd. | 5,300 | | 43,115 |
Moody's Corp. (c) | 47,247 | | 1,266,220 |
| | 1,330,557 |
TOTAL DIVERSIFIED FINANCIAL SERVICES | | 6,335,116 |
HOTELS, RESTAURANTS & LEISURE - 0.2% |
Casinos & Gaming - 0.2% |
Wynn Macau Ltd. | 63,200 | | 76,985 |
INSURANCE - 8.2% |
Insurance Brokers - 0.3% |
Aon Corp. | 2,700 | | 103,518 |
Life & Health Insurance - 0.2% |
Principal Financial Group, Inc. | 3,642 | | 87,554 |
Multi-Line Insurance - 3.7% |
Assurant, Inc. | 6,700 | | 197,516 |
Genworth Financial, Inc. Class A (a) | 78,995 | | 896,593 |
Hartford Financial Services Group, Inc. | 12,360 | | 287,494 |
| | 1,381,603 |
Property & Casualty Insurance - 2.4% |
CNA Financial Corp. (a) | 18,904 | | 453,696 |
XL Capital Ltd. Class A | 22,500 | | 412,425 |
| | 866,121 |
Reinsurance - 1.6% |
Everest Re Group Ltd. | 4,918 | | 421,374 |
Transatlantic Holdings, Inc. | 500 | | 26,055 |
Validus Holdings Ltd. | 4,682 | | 126,133 |
| | 573,562 |
TOTAL INSURANCE | | 3,012,358 |
Common Stocks - continued |
| Shares | | Value |
INTERNET SOFTWARE & SERVICES - 0.9% |
Internet Software & Services - 0.9% |
China Finance Online Co. Ltd. ADR (a)(c) | 45,847 | | $ 334,683 |
IT SERVICES - 6.4% |
Data Processing & Outsourced Services - 5.9% |
Euronet Worldwide, Inc. (a) | 45,591 | | 1,000,722 |
MasterCard, Inc. Class A | 2,600 | | 665,548 |
MoneyGram International, Inc. (a) | 116,068 | | 334,276 |
Visa, Inc. Class A | 1,957 | | 171,159 |
| | 2,171,705 |
IT Consulting & Other Services - 0.5% |
Cognizant Technology Solutions Corp. Class A (a) | 3,200 | | 144,960 |
Satyam Computer Services Ltd. sponsored ADR (a) | 10,700 | | 49,327 |
| | 194,287 |
TOTAL IT SERVICES | | 2,365,992 |
MEDIA - 4.7% |
Advertising - 0.4% |
SearchMedia Holdings Ltd. (a) | 21,200 | | 154,972 |
Publishing - 4.3% |
McGraw-Hill Companies, Inc. | 47,204 | | 1,581,806 |
TOTAL MEDIA | | 1,736,778 |
REAL ESTATE INVESTMENT TRUSTS - 0.4% |
Residential REITs - 0.4% |
UDR, Inc. | 9,075 | | 149,193 |
REAL ESTATE MANAGEMENT & DEVELOPMENT - 2.9% |
Diversified Real Estate Activities - 0.4% |
Mitsubishi Estate Co. Ltd. | 9,000 | | 143,762 |
Real Estate Development - 2.5% |
Central China Real Estate Ltd. | 491,000 | | 139,947 |
Xinyuan Real Estate Co. Ltd. ADR (a)(c) | 173,786 | | 776,823 |
| | 916,770 |
TOTAL REAL ESTATE MANAGEMENT & DEVELOPMENT | | 1,060,532 |
ROAD & RAIL - 0.6% |
Trucking - 0.6% |
Arkansas Best Corp. | 5,967 | | 175,609 |
Dollar Thrifty Automotive Group, Inc. (a)(c) | 2,207 | | 56,521 |
| | 232,130 |
|
| Shares | | Value |
SPECIALTY RETAIL - 0.1% |
Home Improvement Retail - 0.1% |
Home Depot, Inc. | 1,360 | | $ 39,345 |
THRIFTS & MORTGAGE FINANCE - 0.3% |
Thrifts & Mortgage Finance - 0.3% |
Washington Federal, Inc. | 6,214 | | 120,179 |
Washington Mutual, Inc. (a) | 16,757 | | 2,337 |
| | 122,516 |
TOTAL COMMON STOCKS (Cost $33,872,806) | 36,501,006 |
Convertible Preferred Stocks - 0.7% |
| | | |
DIVERSIFIED FINANCIAL SERVICES - 0.7% |
Other Diversified Financial Services - 0.7% |
Bank of America Corp.
(Cost $262,500) | 17,500 | | 261,100 |
Money Market Funds - 13.4% |
| | | |
Fidelity Cash Central Fund, 0.16% (d) | 124,592 | | 124,592 |
Fidelity Securities Lending Cash Central Fund, 0.15% (b)(d) | 4,832,200 | | 4,832,200 |
TOTAL MONEY MARKET FUNDS (Cost $4,956,792) | 4,956,792 |
TOTAL INVESTMENT PORTFOLIO - 113.0% (Cost $39,092,098) | | 41,718,898 |
NET OTHER ASSETS - (13.0)% | | (4,809,689) |
NET ASSETS - 100% | $ 36,909,209 |
Legend |
(a) Non-income producing |
(b) Investment made with cash collateral received from securities on loan. |
(c) Security or a portion of the security is on loan at period end. |
(d) Affiliated fund that is available only to investment companies and other accounts managed by Fidelity Investments. The rate quoted is the annualized seven-day yield of the fund at period end. A complete unaudited listing of the fund's holdings as of its most recent quarter end is available upon request. |
Affiliated Central Funds |
Information regarding fiscal year to date income earned by the Fund from investments in Fidelity Central Funds is as follows: |
Fund | Income earned |
Fidelity Cash Central Fund | $ 5,150 |
Fidelity Securities Lending Cash Central Fund | 185,726 |
Total | $ 190,876 |
Other Information |
The following is a summary of the inputs used, as of December 31, 2009, involving the Fund's assets and liabilities carried at value. The inputs or methodology used for valuing securities may not be an indication of the risk associated with investing in those securities. For more information on valuation inputs, and their aggregation into the levels used in the table below, please refer to the Security Valuation section in the accompanying Notes to Financial Statements. |
Valuation Inputs at Reporting Date: |
Description | Total | Level 1 | Level 2 | Level 3 |
Investments in Securities: | | | | |
Common Stocks | $ 36,501,006 | $ 34,887,512 | $ 1,613,494 | $ - |
Convertible Preferred Stocks | 261,100 | 261,100 | - | - |
Money Market Funds | 4,956,792 | 4,956,792 | - | - |
Total Investments in Securities: | $ 41,718,898 | $ 40,105,404 | $ 1,613,494 | $ - |
Distribution of investments by country of issue, as a percentage of total net assets, is as follows: (Unaudited) |
United States of America | 79.0% |
Bermuda | 4.7% |
China | 3.8% |
United Kingdom | 3.1% |
Cayman Islands | 3.1% |
Switzerland | 2.8% |
Argentina | 2.3% |
Others (individually less than 1%) | 1.2% |
| 100.0% |
Income Tax Information |
At December 31, 2009, the fund had a capital loss carryforward of approximately $13,962,996 of which $5,800,488 and $8,162,508 will expire on December 31, 2016 and 2017, respectively. |
See accompanying notes which are an integral part of the financial statements.
Annual Report
Statement of Assets and Liabilities
| December 31, 2009 |
| | |
Assets | | |
Investment in securities, at value (including securities loaned of $4,695,488) - See accompanying schedule: Unaffiliated issuers (cost $34,135,306) | $ 36,762,106 | |
Fidelity Central Funds (cost $4,956,792) | 4,956,792 | |
Total Investments (cost $39,092,098) | | $ 41,718,898 |
Receivable for investments sold | | 1,466,814 |
Receivable for fund shares sold | | 8,805 |
Dividends receivable | | 10,712 |
Distributions receivable from Fidelity Central Funds | | 2,093 |
Prepaid expenses | | 201 |
Other receivables | | 3,866 |
Total assets | | 43,211,389 |
| | |
Liabilities | | |
Payable to custodian bank | $ 710,550 | |
Payable for investments purchased | 611,289 | |
Payable for fund shares redeemed | 88,402 | |
Accrued management fee | 17,769 | |
Other affiliated payables | 4,539 | |
Other payables and accrued expenses | 37,431 | |
Collateral on securities loaned, at value | 4,832,200 | |
Total liabilities | | 6,302,180 |
| | |
Net Assets | | $ 36,909,209 |
Net Assets consist of: | | |
Paid in capital | | $ 49,541,104 |
Undistributed net investment income | | 11,496 |
Accumulated undistributed net realized gain (loss) on investments and foreign currency transactions | | (15,270,191) |
Net unrealized appreciation (depreciation) on investments | | 2,626,800 |
Net Assets | | $ 36,909,209 |
Statement of Assets and Liabilities - continued
| December 31, 2009 |
| | |
Initial Class:
Net Asset Value, offering price and redemption price per share ($20,155,382 ÷ 3,075,354 shares) | | $ 6.55 |
| | |
Investor Class:
Net Asset Value, offering price and redemption price per share ($16,753,827 ÷ 2,563,778 shares) | | $ 6.53 |
See accompanying notes which are an integral part of the financial statements.
Annual Report
Statement of Operations
| Year ended December 31, 2009 |
| | |
Investment Income | | |
Dividends | | $ 537,376 |
Interest | | 65 |
Income from Fidelity Central Funds (including $185,726 from security lending) | | 190,876 |
Total income | | 728,317 |
| | |
Expenses | | |
Management fee | $ 207,813 | |
Transfer agent fees | 51,114 | |
Accounting and security lending fees | 15,123 | |
Custodian fees and expenses | 38,372 | |
Independent trustees' compensation | 251 | |
Audit | 37,566 | |
Legal | 215 | |
Interest | 127 | |
Miscellaneous | 3,253 | |
Total expenses before reductions | 353,834 | |
Expense reductions | (14,500) | 339,334 |
Net investment income (loss) | | 388,983 |
Realized and Unrealized Gain (Loss) Net realized gain (loss) on: | | |
Investment securities: | | |
Unaffiliated issuers | (1,579,372) | |
Foreign currency transactions | 511 | |
Total net realized gain (loss) | | (1,578,861) |
Change in net unrealized appreciation (depreciation) on: Investment securities | 12,561,571 | |
Assets and liabilities in foreign currencies | 83 | |
Total change in net unrealized appreciation (depreciation) | | 12,561,654 |
Net gain (loss) | | 10,982,793 |
Net increase (decrease) in net assets resulting from operations | | $ 11,371,776 |
Statement of Changes in Net Assets
| Year ended
December 31, 2009 | Year ended
December 31, 2008 |
Increase (Decrease) in Net Assets | | |
Operations | | |
Net investment income (loss) | $ 388,983 | $ 898,088 |
Net realized gain (loss) | (1,578,861) | (13,298,599) |
Change in net unrealized appreciation (depreciation) | 12,561,654 | (12,685,138) |
Net increase (decrease) in net assets resulting from operations | 11,371,776 | (25,085,649) |
Distributions to shareholders from net investment income | (480,612) | (802,048) |
Distributions to shareholders from net realized gain | - | (2,471,464) |
Total distributions | (480,612) | (3,273,512) |
Share transactions - net increase (decrease) | (3,476,603) | 23,585,553 |
Redemption fees | 47,529 | 59,484 |
Total increase (decrease) in net assets | 7,462,090 | (4,714,124) |
| | |
Net Assets | | |
Beginning of period | 29,447,119 | 34,161,243 |
End of period (including undistributed net investment income of $11,496 and undistributed net investment income of $78,528, respectively) | $ 36,909,209 | $ 29,447,119 |
See accompanying notes which are an integral part of the financial statements.
Annual Report
Financial Highlights - Initial Class
Years ended December 31, | 2009 | 2008 | 2007 | 2006 | 2005 |
Selected Per-Share Data | | | | | |
Net asset value, beginning of period | $ 5.22 | $ 11.57 | $ 14.60 | $ 12.98 | $ 12.19 |
Income from Investment Operations | | | | | |
Net investment income (loss) C | .06 | .21 | .20 | .18 | .16 |
Net realized and unrealized gain (loss) | 1.35 | (5.68) | (2.02) | 1.86 | .77 |
Total from investment operations | 1.41 | (5.47) | (1.82) | 2.04 | .93 |
Distributions from net investment income | (.09) | (.15) | (.36) | (.16) | (.14) |
Distributions from net realized gain | - | (.74) | (.86) | (.27) | - |
Total distributions | (.09) | (.89) | (1.22) | (.43) | (.14) |
Redemption fees added to paid in capital C | .01 | .01 | .01 | .01 | - G |
Net asset value, end of period | $ 6.55 | $ 5.22 | $ 11.57 | $ 14.60 | $ 12.98 |
Total Return A, B | 27.30% | (50.08)% | (13.43)% | 16.29% | 7.71% |
Ratios to Average Net Assets D, F | | | | | |
Expenses before reductions | .91% | .84% | .87% | .86% | .86% |
Expenses net of fee waivers, if any | .91% | .84% | .87% | .86% | .86% |
Expenses net of all reductions | .87% | .84% | .87% | .85% | .85% |
Net investment income (loss) | 1.09% | 2.64% | 1.48% | 1.36% | 1.31% |
Supplemental Data | | | | | |
Net assets, end of period (000 omitted) | $ 20,155 | $ 17,436 | $ 23,631 | $ 44,781 | $ 32,776 |
Portfolio turnover rate E | 336% | 100% | 48% | 68% | 59% |
A Total returns do not reflect charges attributable to your insurance company's separate account. Inclusion of these charges would reduce the total returns shown.
B Total returns would have been lower had certain expenses not been reduced during the periods shown.
C Calculated based on average shares outstanding during the period.
D Fees and expenses of the underlying Fidelity Central Funds are not included in the Fund's expense ratio. The Fund indirectly bears its proportionate share of the expenses of any underlying Fidelity Central Funds.
E Amount does not include the portfolio activity of any underlying Fidelity Central Funds.
F Expense ratios reflect operating expenses of the class. Expenses before reductions do not reflect amounts reimbursed by the investment adviser or reductions from brokerage service arrangements or reductions from other expense offset arrangements and do not represent the amount paid by the class during periods when reimbursements or reductions occur. Expenses net of fee waivers reflect expenses after reimbursement by the investment adviser but prior to reductions from brokerage service arrangements or other expense offset arrangements. Expenses net of all reductions represent the net expenses paid by the class.
G Amount represents less than $.01 per share.
Financial Highlights - Investor Class
Years ended December 31, | 2009 | 2008 | 2007 | 2006 | 2005 H |
Selected Per-Share Data | | | | | |
Net asset value, beginning of period | $ 5.20 | $ 11.54 | $ 14.57 | $ 12.98 | $ 12.07 |
Income from Investment Operations | | | | | |
Net investment income (loss) E | .06 | .20 | .18 | .16 | .05 |
Net realized and unrealized gain (loss) | 1.34 | (5.67) | (2.02) | 1.86 | .86 |
Total from investment operations | 1.40 | (5.47) | (1.84) | 2.02 | .91 |
Distributions from net investment income | (.08) | (.14) | (.34) | (.17) | - |
Distributions from net realized gain | - | (.74) | (.86) | (.27) | - |
Total distributions | (.08) | (.88) | (1.20) | (.44) | - |
Redemption fees added to paid in capital E | .01 | .01 | .01 | .01 | - J |
Net asset value, end of period | $ 6.53 | $ 5.20 | $ 11.54 | $ 14.57 | $ 12.98 |
Total Return B, C, D | 27.30% | (50.18)% | (13.60)% | 16.12% | 7.54% |
Ratios to Average Net Assets F, I | | | | | |
Expenses before reductions | 1.01% | .94% | .99% | 1.00% | 1.18% A |
Expenses net of fee waivers, if any | 1.01% | .94% | .99% | 1.00% | 1.18% A |
Expenses net of all reductions | .97% | .94% | .99% | .99% | 1.16% A |
Net investment income (loss) | .99% | 2.54% | 1.36% | 1.22% | .95% A |
Supplemental Data | | | | | |
Net assets, end of period (000 omitted) | $ 16,754 | $ 12,012 | $ 10,530 | $ 13,030 | $ 2,133 |
Portfolio turnover rate G | 336% | 100% | 48% | 68% | 59% |
A Annualized
B Total returns for periods of less than one year are not annualized.
C Total returns do not reflect charges attributable to your insurance company's separate account. Inclusion of these charges would reduce the total returns shown.
D Total returns would have been lower had certain expenses not been reduced during the periods shown.
E Calculated based on average shares outstanding during the period.
F Fees and expenses of the underlying Fidelity Central Funds are not included in the Fund's expense ratio. The Fund indirectly bears its proportionate share of the expenses of any underlying Fidelity Central Funds.
G Amount does not include the portfolio activity of any underlying Fidelity Central Funds.
H For the period July 21, 2005 (commencement of sale of shares) to December 31, 2005.
I Expense ratios reflect operating expenses of the class. Expenses before reductions do not reflect amounts reimbursed by the investment adviser or reductions from brokerage service arrangements or reductions from other expense offset arrangements and do not represent the amount paid by the class during periods when reimbursements or reductions occur. Expense ratios before reductions for start-up periods may not be representative of longer-term operating periods. Expenses net of fee waivers reflect expenses after reimbursement by the investment adviser but prior to reductions from brokerage service arrangements or other expense offset arrangements. Expenses net of all reductions represent the net expenses paid by the class.
J Amount represents less than $.01 per share.
See accompanying notes which are an integral part of the financial statements.
Annual Report
Notes to Financial Statements
For the period ended December 31, 2009
1. Organization.
VIP Financial Services Portfolio (the Fund) is a fund of Variable Insurance Products Fund IV (the trust) and is authorized to issue an unlimited number of shares. The trust is registered under the Investment Company Act of 1940, as amended (the 1940 Act), as an open-end management investment company organized as a Massachusetts business trust. Shares of the Fund may only be purchased by insurance companies for the purpose of funding variable annuity or variable life insurance contracts. The Fund offers the following classes of shares: Initial Class shares and Investor Class shares. All classes have equal rights and voting privileges, except for matters affecting a single class. Investment income, realized and unrealized capital gains and losses, the common expenses of the Fund, and certain fund-level expense reductions, if any, are allocated on a pro-rata basis to each class based on the relative net assets of each class to the total net assets of the Fund. Each class differs with respect to transfer agent fees incurred. Certain expense reductions also differ by class. The Fund's investments in emerging markets can be subject to social, economic, regulatory, and political uncertainties and can be extremely volatile.
2. Investments in Fidelity Central Funds.
The Fund may invest in Fidelity Central Funds, which are open-end investment companies available only to other investment companies and accounts managed by Fidelity Management & Research Company (FMR) and its affiliates. The Fund's Schedule of Investments lists each of the Fidelity Central Funds held as of period end, if any, as an investment of the Fund, but does not include the underlying holdings of each Fidelity Central Fund. As an Investing Fund, the Fund indirectly bears its proportionate share of the expenses of the underlying Fidelity Central Funds.
The Money Market Central Funds seek preservation of capital and current income and are managed by Fidelity Investments Money Management, Inc. (FIMM), an affiliate of FMR.
A complete unaudited list of holdings for each Fidelity Central Fund is available upon request or at the Securities and Exchange Commission (the SEC) web site at www.sec.gov. In addition, the financial statements of the Fidelity Central Funds, which are not covered by the Fund's Report of Independent Registered Public Accounting Firm, are available on the SEC web site or upon request.
3. Significant Accounting Policies.
The financial statements have been prepared in conformity with accounting principles generally accepted in the United States of America, which require management to make certain estimates and assumptions at the date of the financial statements. Actual results could differ from those estimates. Events or transactions occurring after period end through the date that the financial statements were issued, February 12, 2010, have been evaluated in the preparation of the financial statements. The following summarizes the significant accounting policies of the Fund:
Security Valuation. Investments are valued as of 4:00 p.m. Eastern time on the last calendar day of the period. The Fund uses independent pricing services approved by the Board of Trustees to value its investments. When current market prices or quotations are not readily available or reliable, valuations may be determined in good faith in accordance with procedures adopted by the Board of Trustees. Factors used in determining value may include significant market or security specific events. The frequency with which these procedures are used cannot be predicted and may be utilized to a significant extent. The value used for net asset value (NAV) calculation under these procedures may differ from published prices for the same securities.
The Fund categorizes the inputs to valuation techniques used to value its investments into a disclosure hierarchy consisting of three levels as shown below.
Level 1 - quoted prices in active markets for identical investments
Level 2 - other significant observable inputs (including quoted prices for similar investments, interest rates, prepayment speeds, etc.)
Level 3 - unobservable inputs (including the fund's own assumptions based on the best information available)
Changes in valuation techniques may result in transfers in or out of an assigned level within the disclosure hierarchy. The aggregate value of investments by input level, as of December 31, 2009 is included at the end of the Fund's Schedule of Investments. Valuation techniques used to value the Fund's investments by major category are as follows.
Equity securities, including restricted securities, for which market quotations are readily available, are valued at the last reported sale price or official closing price as reported by an independent pricing service on the primary market or exchange on which they are traded and are categorized as level 1 in the hierarchy. In the event there were no sales during the day or closing prices are not available, securities are valued at the last quoted bid price or may be valued using the last available price and categorized as Level 2 in the hierarchy. For foreign equity securities, when significant market or security events arise, comparisons to the valuation of American Depository Receipts (ADRs), futures contracts, exchange-traded funds (ETFs) and certain indexes as well as quoted prices for similar securities are used and are categorized as Level 2 in the hierarchy in these circumstances. For restricted securities and private placements where observable inputs are limited, assumptions about market activity and risk are used and are categorized as level 3 in the hierarchy.
Annual Report
3. Significant Accounting Policies - continued
Security Valuation - continued
Investments in open-end mutual funds including the Fidelity Money Market Central Funds are valued at their closing net asset value each business day and are categorized as Level 1 in the hierarchy. Short-term securities with remaining maturities of sixty days or less for which quotations are not readily available are valued at amortized cost, which approximates value and are categorized as level 2 in the hierarchy.
Foreign Currency. The Fund uses foreign currency contracts to facilitate transactions in foreign-denominated securities. Losses from these transactions may arise from changes in the value of the foreign currency or if the counterparties do not perform under the contracts' terms.
Foreign-denominated assets, including investment securities, and liabilities are translated into U.S. dollars at the exchange rate at period end. Purchases and sales of investment securities, income and dividends received and expenses denominated in foreign currencies are translated into U.S. dollars at the exchange rate in effect on the transaction date.
The effects of exchange rate fluctuations on investments are included with the net realized and unrealized gain (loss) on investment securities. Other foreign currency transactions resulting in realized and unrealized gain (loss) are disclosed separately.
Investment Transactions and Income. For financial reporting purposes, the Fund's investment holdings and NAV include trades executed through the end of the last business day of the period. The NAV per share for processing shareholder transactions is calculated as of the close of business of the New York Stock Exchange (NYSE), normally 4:00 p.m. Eastern time and includes trades executed through the end of the prior business day. Gains and losses on securities sold are determined on the basis of identified cost and may include proceeds received from litigation. Dividend income is recorded on the ex-dividend date, except for certain dividends from foreign securities where the ex-dividend date may have passed, which are recorded as soon as the Fund is informed of the ex-dividend date. Non-cash dividends included in dividend income, if any, are recorded at the fair market value of the securities received. Distributions received on securities that represent a return of capital or capital gain are recorded as a reduction of cost of investments and/or as a realized gain. The Fund estimates the components of distributions received that may be considered return of capital distributions or capital gain distributions. Interest income and distributions from the Fidelity Central Funds are accrued as earned. Interest income includes coupon interest and amortization of premium and accretion of discount on debt securities. Investment income is recorded net of foreign taxes withheld where recovery of such taxes is uncertain.
Expenses. Most expenses of the trust can be directly attributed to a fund. Expenses which cannot be directly attributed are apportioned among each Fund in the trust. Expense estimates are accrued in the period to which they relate and adjustments are made when actual amounts are known.
Income Tax Information and Distributions to Shareholders. Each year, the Fund intends to qualify as a regulated investment company by distributing substantially all of its taxable income and realized gains under Subchapter M of the Internal Revenue Code and filing its U.S. federal tax return. As a result, no provision for income taxes is required. As of December 31, 2009, the Fund did not have any unrecognized tax benefits in the accompanying financial statements. A Fund's federal tax return is subject to examination by the Internal Revenue Service (IRS) for a period of three years. Foreign taxes are provided for based on the Fund's understanding of the tax rules and rates that exist in the foreign markets in which it invests.
Distributions are recorded on the ex-dividend date. Income dividends and capital gain distributions are declared separately for each class. Income and capital gain distributions are determined in accordance with income tax regulations, which may differ from generally accepted accounting principles.
Capital accounts within the financial statements are adjusted for permanent book-tax differences. These adjustments have no impact on net assets or the results of operations. Temporary book-tax differences will reverse in a subsequent period.
Book-tax differences are primarily due to the short-term gain distributions from the Fidelity Central Funds, foreign currency transactions, passive foreign investment companies (PFIC), partnerships, capital loss carryforwards and losses deferred due to wash sales and excise tax regulations.
The federal tax cost of investment securities and unrealized appreciation (depreciation) as of period end were as follows:
Gross unrealized appreciation | $ 5,080,298 |
Gross unrealized depreciation | (3,760,693) |
Net unrealized appreciation (depreciation) | $ 1,319,605 |
| |
Tax Cost | $ 40,399,293 |
Annual Report
Notes to Financial Statements - continued
3. Significant Accounting Policies - continued
Income Tax Information and Distributions to Shareholders - continued
The tax-based components of distributable earnings as of period end were as follows:
Undistributed ordinary income | $ 11,496 |
Capital loss carryforward | $ (13,962,996) |
Net unrealized appreciation (depreciation) | $ 1,319,605 |
The tax character of distributions paid was as follows:
| December 31, 2009 | December 31, 2008 |
Ordinary Income | $ 480,612 | $ 1,436,613 |
Long-term Capital Gains | - | 1,836,899 |
Total | $ 480,612 | $ 3,273,512 |
Trading (Redemption) Fees. Shares held less than 60 days are subject to a redemption fee equal to 1% of the proceeds of the redeemed shares. All redemption fees, including any estimated redemption fees paid by FMR, are retained by the Fund and accounted for as an addition to paid in capital.
4. Purchases and Sales of Investments.
Purchases and sales of securities, other than short-term securities, aggregated $119,911,075 and $120,948,911, respectively.
5. Fees and Other Transactions with Affiliates.
Management Fee. FMR and its affiliates provide the Fund with investment management related services for which the Fund pays a monthly management fee. The management fee is the sum of an individual fund fee rate that is based on an annual rate of .30% of the Fund's average net assets and a group fee rate that averaged .26% during the period. The group fee rate is based upon the average net assets of all the mutual funds advised by FMR. The group fee rate decreases as assets under management increase and increases as assets under management decrease. For the period, the total annual management fee rate was .56% of the Fund's average net assets.
Transfer Agent Fees. Fidelity Investments Institutional Operations Company, Inc. (FIIOC), an affiliate of FMR, is the Fund's transfer, dividend disbursing, and shareholder servicing agent. FIIOC receives an asset-based fee with respect to each class. Each class (with the exception of Investor Class) pays a transfer agent fee, excluding out of pocket expenses, equal to an annual rate of .07% of average net assets. Investor Class pays a monthly asset-based transfer agent fee of .15% of average net assets. The total transfer agent fees paid by each class to FIIOC, including out of pocket expenses, were as follows:
Initial Class | $ 19,981 |
Investor Class | 31,133 |
| $ 51,114 |
Accounting and Security Lending Fees. Fidelity Service Company, Inc. (FSC), an affiliate of FMR, maintains the Fund's accounting records. The accounting fee is based on the level of average net assets for the month. Under a separate contract, FSC administers the security lending program. The security lending fee is based on the number and duration of lending transactions.
Brokerage Commissions. The Fund placed a portion of its portfolio transactions with brokerage firms which are affiliates of the investment. The commissions paid to these affiliated firms were $13,228 for the period.
6. Committed Line of Credit.
The Fund participates with other funds managed by FMR in a $3.5 billion credit facility (the "line of credit") to be utilized for temporary or emergency purposes to fund shareholder redemptions or for other short-term liquidity purposes. The Fund has agreed to pay commitment fees on its pro-rata portion of the line of credit, which amounted to $173 and is reflected in Miscellaneous Expense on the Statement of Operations. During the period, there were no borrowings on this line of credit.
Annual Report
7. Security Lending.
The Fund lends portfolio securities from time to time in order to earn additional income. On the settlement date of the loan, the Fund receives collateral (in the form of U.S. Treasury obligations, letters of credit and/or cash) against the loaned securities and maintains collateral in an amount not less than 100% of the market value of the loaned securities during the period of the loan. The market value of the loaned securities is determined at the close of business of the Fund and any additional required collateral is delivered to the Fund on the next business day. If the borrower defaults on its obligation to return the securities loaned because of insolvency or other reasons, a fund could experience delays and costs in recovering the securities loaned or in gaining access to the collateral. Any cash collateral received is invested in the Fidelity Securities Lending Cash Central Fund. The value of loaned securities and cash collateral at period end are disclosed on the Fund's Statement of Assets and Liabilities. Security lending income represents the income earned on investing cash collateral, less fees and expenses associated with the loan, plus any premium payments that may be received on the loan of certain types of securities. Security lending income is presented in the Statement of Operations as a component of income from Fidelity Central Funds.
8. Bank Borrowings.
The Fund is permitted to have bank borrowings for temporary or emergency purposes to fund shareholder redemptions. The Fund has established borrowing arrangements with certain banks. The interest rate on the borrowings is the bank's base rate, as revised from time to time. The average daily loan balance during the period for which loans were outstanding amounted to $6,102,000. The weighted average interest rate was .75%. The interest expense amounted to $127 under the bank borrowing program. At period end, there were no bank borrowings outstanding.
9. Expense Reductions.
Many of the brokers with whom FMR places trades on behalf of the Fund provided services to the Fund in addition to trade execution. These services included payments of certain expenses on behalf of the Fund totaling $14,500 for the period.
10. Distributions to Shareholders.
Distributions to shareholders of each class were as follows:
Years ended December 31, | 2009 | 2008 |
From net investment income | | |
Initial Class | $ 274,450 | $ 479,656 |
Investor Class | 206,162 | 322,392 |
Total | $ 480,612 | $ 802,048 |
From net realized gain | | |
Initial Class | $ - | $ 1,682,600 |
Investor Class | - | 788,864 |
Total | $ - | $ 2,471,464 |
11. Share Transactions.
Transactions for each class of shares were as follows:
| Shares | Dollars |
Years ended December 31, | 2009 | 2008 | 2009 | 2008 |
Initial Class | | | | |
Shares sold | 2,435,099 | 2,382,491 | $ 12,296,639 | $ 19,887,411 |
Reinvestment of distributions | 46,301 | 265,220 | 274,450 | 2,162,256 |
Shares redeemed | (2,748,859) | (1,347,360) | (15,895,754) | (10,403,989) |
Net increase (decrease) | (267,459) | 1,300,351 | $ (3,324,665) | $ 11,645,678 |
Investor Class | | | | |
Shares sold | 2,429,823 | 1,944,613 | $ 12,249,127 | $ 15,854,880 |
Reinvestment of distributions | 34,612 | 143,835 | 206,162 | 1,111,256 |
Shares redeemed | (2,209,743) | (691,630) | (12,607,227) | (5,026,261) |
Net increase (decrease) | 254,692 | 1,396,818 | $ (151,938) | $ 11,939,875 |
Annual Report
Notes to Financial Statements - continued
12. Other.
The Fund's organizational documents provide former and current trustees and officers with a limited indemnification against liabilities arising in connection with the performance of their duties to the Fund. In the normal course of business, the Fund may also enter into contracts that provide general indemnifications. The Fund's maximum exposure under these arrangements is unknown as this would be dependent on future claims that may be made against the Fund. The risk of material loss from such claims is considered remote.
At the end of the period, FMR or its affiliates were the owners of record of 100% of the total outstanding shares of the Fund.
Annual Report
Report of Independent Registered Public Accounting Firm
To the Trustees of Variable Insurance Products Fund IV and the Shareholders of VIP Financial Services Portfolio:
In our opinion, the accompanying statement of assets and liabilities, including the schedule of investments, and the related statements of operations and of changes in net assets and the financial highlights present fairly, in all material respects, the financial position of VIP Financial Services Portfolio (a fund of Variable Insurance Products Fund IV) at December 31, 2009, the results of its operations for the year then ended, the changes in its net assets for each of the two years in the period then ended and the financial highlights for each of the periods indicated, in conformity with accounting principles generally accepted in the United States of America. These financial statements and financial highlights (hereafter referred to as "financial statements") are the responsibility of the VIP Financial Services Portfolio's management. Our responsibility is to express an opinion on these financial statements based on our audits. We conducted our audits of these financial statements in accordance with the standards of the Public Company Accounting Oversight Board (United States). Those standards require that we plan and perform the audit to obtain reasonable assurance about whether the financial statements are free of material misstatement. An audit includes examining, on a test basis, evidence supporting the amounts and disclosures in the financial statements, assessing the accounting principles used and significant estimates made by management, and evaluating the overall financial statement presentation. We believe that our audits, which included confirmation of securities at December 31, 2009 by correspondence with the custodian and brokers, provide a reasonable basis for our opinion.
/s/ PricewaterhouseCoopers LLP
PricewaterhouseCoopers LLP
Boston, Massachusetts
February 12, 2010
Annual Report
The Trustees, Member of the Advisory Board, and executive officers of the trust and fund, as applicable, are listed below. The Board of Trustees governs the fund and is responsible for protecting the interests of shareholders. The Trustees are experienced executives who meet periodically throughout the year to oversee the fund's activities, review contractual arrangements with companies that provide services to the fund, and review the fund's performance. Except for James C. Curvey, each of the Trustees oversees 222 funds advised by FMR or an affiliate. Mr. Curvey oversees 410 funds advised by FMR or an affiliate.
The Trustees hold office without limit in time except that (a) any Trustee may resign; (b) any Trustee may be removed by written instrument, signed by at least two-thirds of the number of Trustees prior to such removal; (c) any Trustee who requests to be retired or who has become incapacitated by illness or injury may be retired by written instrument signed by a majority of the other Trustees; and (d) any Trustee may be removed at any special meeting of shareholders by a two-thirds vote of the outstanding voting securities of the trust. Each Trustee who is not an interested person (as defined in the 1940 Act) (Independent Trustee), shall retire not later than the last day of the calendar year in which his or her 72nd birthday occurs. The Independent Trustees may waive this mandatory retirement age policy with respect to individual Trustees. The executive officers and Advisory Board Member hold office without limit in time, except that any officer and Advisory Board Member may resign or may be removed by a vote of a majority of the Trustees at any regular meeting or any special meeting of the Trustees. Except as indicated, each individual has held the office shown or other offices in the same company for the past five years.
The fund's Statement of Additional Information (SAI) includes more information about the Trustees. To request a free copy, call Fidelity at 1-877-208-0098.
Interested Trustees*:
Correspondence intended for each Trustee who is an interested person may be sent to Fidelity Investments, 82 Devonshire Street, Boston, Massachusetts 02109.
Name, Age; Principal Occupation |
Edward C. Johnson 3d (79) |
| Year of Election or Appointment: 1983 Mr. Johnson is Trustee and Chairman of the Board of Trustees of certain Trusts. Mr. Johnson serves as Chief Executive Officer, Chairman, and a Director of FMR LLC; Chairman and a Director of FMR; Chairman and a Director of Fidelity Research & Analysis Company (FRAC); Chairman and a Director of Fidelity Investments Money Management, Inc.; and Chairman and a Director of FMR Co., Inc. In addition, Mr. Johnson serves as Chairman and Director of FIL Limited. Previously, Mr. Johnson served as President of FMR LLC (2006-2007). |
James C. Curvey (74) |
| Year of Election or Appointment: 2007 Mr. Curvey also serves as Trustee (2007-present) of other investment companies advised by FMR. Mr. Curvey is a Director of FMR and FMR Co., Inc. (2007-present). Mr. Curvey is also Vice Chairman (2006-present) and Director of FMR LLC. In addition, Mr. Curvey serves as an Overseer for the Boston Symphony Orchestra and a member of the Trustees of Villanova University. |
* Trustees have been determined to be "Interested Trustees" by virtue of, among other things, their affiliation with the trust or various entities under common control with FMR.
Independent Trustees:
Correspondence intended for each Independent Trustee (that is, the Trustees other than the Interested Trustees) may be sent to Fidelity Investments, P.O. Box 55235, Boston, Massachusetts 02205-5235.
Name, Age; Principal Occupation |
Dennis J. Dirks (61) |
| Year of Election or Appointment: 2005 Prior to his retirement in May 2003, Mr. Dirks was Chief Operating Officer and a member of the Board of The Depository Trust & Clearing Corporation (DTCC). He also served as President, Chief Operating Officer, and Board member of The Depository Trust Company (DTC) and President and Board member of the National Securities Clearing Corporation (NSCC). In addition, Mr. Dirks served as Chief Executive Officer and Board member of the Government Securities Clearing Corporation, Chief Executive Officer and Board member of the Mortgage-Backed Securities Clearing Corporation, as a Trustee and a member of the Finance Committee of Manhattan College (2005-2008), and as a Trustee and a member of the Finance Committee of AHRC of Nassau County (2006-2008). Currently, Mr. Dirks serves as a member of the Board of Directors for The Brookville Center for Children's Services, Inc. (2009-present). |
Alan J. Lacy (56) |
| Year of Election or Appointment: 2008 Mr. Lacy serves as Senior Adviser (2007-present) of Oak Hill Capital Partners, L.P. (private equity). Mr. Lacy also served as Chief Executive Officer (2000-2005) and Vice Chairman (2005-2006) of Sears Holdings Corporation and Sears, Roebuck and Co. (retail). In addition, Mr. Lacy serves as a member of the Board of Directors of The Western Union Company (global money transfer, 2006-present) and Bristol-Myers Squibb Company (global pharmaceuticals, 2007-present). Mr. Lacy is Chairman (2008-present) and a member (2006-present) of the Board of Trustees of The National Parks Conservation Association. |
Ned C. Lautenbach (65) |
| Year of Election or Appointment: 2000 Mr. Lautenbach is Chairman of the Independent Trustees of the Equity and High Income Funds (2006-present). Mr. Lautenbach is an Advisory Partner of Clayton, Dubilier & Rice, Inc. (private equity investment). Previously, Mr. Lautenbach was with the International Business Machines Corporation (IBM) from 1968 until his retirement in 1998. Mr. Lautenbach serves as a Director of Eaton Corporation (diversified industrial) as well as the Philharmonic Center for the Arts in Naples, Florida. Mr. Lautenbach is also a member of the Board of Trustees of Fairfield University (2005-present), as well as a member of the Council on Foreign Relations. Previously, Mr. Lautenbach served as a Director of Sony Corporation (2006-2007). |
Joseph Mauriello (65) |
| Year of Election or Appointment: 2008 Prior to his retirement in January 2006, Mr. Mauriello served in numerous senior management positions including Deputy Chairman and Chief Operating Officer (2004-2005), and Vice Chairman of Financial Services (2002-2004) of KPMG LLP US (professional services, 1965-2005). Mr. Mauriello currently serves as a member of the Board of Directors of XL Capital Ltd. (global insurance and re-insurance, 2006-present) and of Arcadia Resources Inc. (health care services and products, 2007-present). Previously, Mr. Mauriello served as a Director of the Hamilton Funds of the Bank of New York (2006-2007). |
Cornelia M. Small (65) |
| Year of Election or Appointment: 2005 Ms. Small is a member of the Board of Directors of the Teagle Foundation (2009-present). Ms. Small is also a member of the Investment Committee, and Chair (2008-present) and a member of the Board of Trustees of Smith College. In addition, Ms. Small serves on the Investment Committee of the Berkshire Taconic Community Foundation (2008-present). Previously, Ms. Small served as Chairperson of the Investment Committee (2002-2008) of Smith College. In addition, Ms. Small served as Chief Investment Officer, Director of Global Equity Investments, and a member of the Board of Directors of Scudder, Stevens & Clark and Scudder Kemper Investments. |
William S. Stavropoulos (70) |
| Year of Election or Appointment: 2001 Mr. Stavropoulos serves as President and Founder of the Michigan Baseball Foundation, the Great Lakes Loons (2007-present). Mr. Stavropoulos is Chairman Emeritus of the Board of Directors of The Dow Chemical Company, where he previously served in numerous senior management positions, including President, CEO (1995-2000; 2002-2004), Chairman of the Executive Committee (2000-2006), and as a member of the Board of Directors (1990-2006). Currently, Mr. Stavropoulos is a Director of Teradata Corporation (data warehousing and technology solutions, 2008-present), Chemical Financial Corporation, Maersk Inc. (industrial conglomerate), Tyco International, Inc. (multinational manufacturing and services, 2007-present), and a member of the Advisory Board for Metalmark Capital (private equity investment, 2005-present). Mr. Stavropoulos is a special advisor to Clayton, Dubilier & Rice, Inc. (private equity investment). In addition, Mr. Stavropoulos is a member of the University of Notre Dame Advisory Council for the College of Science. |
David M. Thomas (60) |
| Year of Election or Appointment: 2008 Previously, Mr. Thomas served as Executive Chairman (2005-2006) and Chairman and Chief Executive Officer (2000-2005) of IMS Health, Inc. (pharmaceutical and healthcare information solutions). In addition, Mr. Thomas serves as a member of the Board of Directors of Fortune Brands, Inc. (consumer products), and Interpublic Group of Companies, Inc. (marketing communication, 2004-present). |
Michael E. Wiley (59) |
| Year of Election or Appointment: 2008 Mr. Wiley also serves as a Director of Asia Pacific Exploration Consolidated (international oil and gas exploration and production, 2008-present), and as a member of the Board of Trustees of the University of Tulsa (2000-2006; 2007-present). Mr. Wiley serves as a Director of Tesoro Corporation (independent oil refiner and marketer, 2005-present), and a Director of Bill Barrett Corporation (exploration and production, 2005-present). In addition, Mr. Wiley also serves as a Director of Post Oak Bank (privately-held bank, 2004-present). Previously, Mr. Wiley served as a Sr. Energy Advisor of Katzenbach Partners, LLC (consulting, 2006-2007), as an Advisory Director of Riverstone Holdings (private investment), Chairman, President, and CEO of Baker Hughes, Inc. (oilfield services, 2000-2004), and as Director of Spinnaker Exploration Company (exploration and production, 2001-2005). |
Annual Report
Advisory Board Member and Executive Officers:
Correspondence intended for each executive officer and Peter S. Lynch may be sent to Fidelity Investments, 82 Devonshire Street, Boston, Massachusetts 02109.
Name, Age; Principal Occupation |
Peter S. Lynch (65) |
| Year of Election or Appointment: 2003 Member of the Advisory Board of Fidelity's Equity and High Income Funds. Mr. Lynch is Vice Chairman and a Director of FMR and FMR Co., Inc. In addition, Mr. Lynch serves as a Trustee of Boston College and as the Chairman of the Inner-City Scholarship Fund. Previously, Mr. Lynch served on the Special Olympics International Board of Directors (1997-2006). |
Kenneth B. Robins (40) |
| Year of Election or Appointment: 2008 President and Treasurer of Fidelity's Equity and High Income Funds. Mr. Robins also serves as Assistant Treasurer of other Fidelity funds (2009-present) and is an employee of Fidelity Investments (2004-present). Before joining Fidelity Investments, Mr. Robins worked at KPMG LLP, where he was a partner in KPMG's department of professional practice (2002-2004). |
Brian B. Hogan (45) |
| Year of Election or Appointment: 2009 Vice President of certain Equity Funds and Vice President of Sector Funds. Mr. Hogan also serves as Senior Vice President, Equity Research of FMR (2006-present) and President of FMR's Equity Division (2009-present). Previously, Mr. Hogan served as a portfolio manager. |
Christopher S. Bartel (38) |
| Year of Election or Appointment: 2009 Vice President of Fidelity's Sector and Real Estate Equity Funds. Mr. Bartel also serves as Senior Vice President of Equity Research (2009-present). Previously, Mr. Bartel served as Managing Director of Research (2006-2009) and an analyst and portfolio manager (2000-2006). |
Scott C. Goebel (41) |
| Year of Election or Appointment: 2008 Secretary and Chief Legal Officer (CLO) of the Fidelity funds. Mr. Goebel also serves as General Counsel, Secretary, and Senior Vice President of FMR (2008-present) and FMR Co., Inc. (2008-present); Deputy General Counsel of FMR LLC; Chief Legal Officer of Fidelity Management & Research (Hong Kong) Limited (2008-present) and Assistant Secretary of Fidelity Management & Research (Japan) Inc. (2008-present), Fidelity Investments Money Management, Inc. (2008-present), Fidelity Management & Research (U.K.) Inc. (2008-present), and Fidelity Research and Analysis Company (2008-present). Previously, Mr. Goebel served as Assistant Secretary of the Funds (2007-2008) and as Vice President and Secretary of Fidelity Distributors Corporation (FDC) (2005-2007). |
William C. Coffey (40) |
| Year of Election or Appointment: 2009 Assistant Secretary of Fidelity's Equity and High Income Funds. Mr. Coffey also serves as Vice President and Associate General Counsel of FMR LLC (2005-present), and is an employee of Fidelity Investments. |
Holly C. Laurent (55) |
| Year of Election or Appointment: 2008 Anti-Money Laundering (AML) Officer of the Fidelity funds. Ms. Laurent is an employee of Fidelity Investments. Previously, Ms. Laurent was Senior Vice President and Head of Legal for Fidelity Business Services India Pvt. Ltd. (2006-2008), and Senior Vice President, Deputy General Counsel and Group Head for FMR LLC (2005-2006). |
Christine Reynolds (51) |
| Year of Election or Appointment: 2008 Chief Financial Officer of the Fidelity funds. Ms. Reynolds became President of Fidelity Pricing and Cash Management Services (FPCMS) in August 2008. Ms. Reynolds served as Chief Operating Officer of FPCMS (2007-2008). Previously, Ms. Reynolds served as President, Treasurer, and Anti-Money Laundering officer of the Fidelity funds (2004-2007). |
Kenneth A. Rathgeber (62) |
| Year of Election or Appointment: 2004 Chief Compliance Officer of Fidelity's Equity and High Income Funds. Mr. Rathgeber is Chief Compliance Officer of Fidelity Management & Research (Hong Kong) Limited (2008-present), Fidelity Management & Research (Japan) Inc. (2008-present), FMR (2005-present), FMR Co., Inc. (2005-present), Fidelity Management & Research (U.K.) Inc. (2005-present), Fidelity Research & Analysis Company (2005-present), Fidelity Investments Money Management, Inc. (2005-present), Pyramis Global Advisors, LLC (2005-present), and Strategic Advisers, Inc. (2005-present). |
Jeffrey S. Christian (48) |
| Year of Election or Appointment: 2009 Deputy Treasurer of the Fidelity funds. Mr. Christian is an employee of Fidelity Investments. Previously, Mr. Christian served as Chief Financial Officer (2008-2009) of certain Fidelity funds, Senior Vice President of Fidelity Pricing and Cash Management Services (FPCMS) (2004-2009), and as Vice President of Business Analysis (2003-2004). |
Bryan A. Mehrmann (48) |
| Year of Election or Appointment: 2005 Deputy Treasurer of the Fidelity funds. Mr. Mehrmann is an employee of Fidelity Investments. Previously, Mr. Mehrmann served as Vice President of Fidelity Investments Institutional Services Group (FIIS)/Fidelity Investments Institutional Operations Company, Inc. (FIIOC) Client Services (1998-2004). |
Adrien E. Deberghes (42) |
| Year of Election or Appointment: 2008 Deputy Treasurer of Fidelity's Equity and High Income Funds. Mr. Deberghes is an employee of Fidelity Investments (2008-present). Previously, Mr. Deberghes served as Senior Vice President of Mutual Fund Administration at State Street Corporation (2007-2008), Senior Director of Mutual Fund Administration at Investors Bank & Trust (2005-2007), and Director of Finance for Dunkin' Brands (2000-2005). |
John R. Hebble (51) |
| Year of Election or Appointment: 2009 Assistant Treasurer of Fidelity's Equity and High Income Funds. Mr. Hebble also serves as President and Treasurer of other Fidelity funds (2008-present) and is an employee of Fidelity Investments. |
Paul M. Murphy (62) |
| Year of Election or Appointment: 2007 Assistant Treasurer of the Fidelity funds. Mr. Murphy is an employee of Fidelity Investments. Previously, Mr. Murphy served as Chief Financial Officer of the Fidelity funds (2005-2006), Vice President and Associate General Counsel of FMR (2007), and Senior Vice President of Fidelity Pricing and Cash Management Services (FPCMS) (1994-2007). |
Gary W. Ryan (51) |
| Year of Election or Appointment: 2005 Assistant Treasurer of the Fidelity funds. Mr. Ryan is an employee of Fidelity Investments. Previously, Mr. Ryan served as Vice President of Fund Reporting in Fidelity Pricing and Cash Management Services (FPCMS) (1999-2005). |
Annual Report
Initial Class designates 75% and Investor Class designates 81% of the dividends distributed in December 2009 as qualifying for the dividends-received deduction for corporate shareholders.
The fund will notify shareholders in January 2010 of amounts for use in preparing 2009 income tax returns.
Annual Report
Board Approval of Investment Advisory Contracts and Management Fees
VIP Financial Services Portfolio
Each year, the Board of Trustees, including the Independent Trustees (together, the Board), votes on the renewal of the management contract and sub-advisory agreements (together, the Advisory Contracts) for the fund. The Board, assisted by the advice of fund counsel and Independent Trustees' counsel, requests and considers a broad range of information throughout the year.
The Board meets regularly and, acting directly and through its separate committees, requests and receives information concerning, and considers at each of its meetings factors that are relevant to, its annual consideration of the renewal of the fund's Advisory Contracts, including the services and support provided to the fund and its shareholders. The Board has established various standing committees, each composed of Independent Trustees with varying backgrounds, to which the Board has assigned specific subject matter responsibilities in order to enhance effective decision-making by the Board. Each committee has a written charter outlining the structure and purposes of the committee. The Board also meets as needed to consider matters specifically related to the Board's annual consideration of the renewal of Advisory Contracts.
At its July 2009 meeting, the Board of Trustees, including the Independent Trustees, unanimously determined to renew the fund's Advisory Contracts. In reaching its determination, the Board considered all factors it believed relevant, including (i) the nature, extent, and quality of the services to be provided to the fund and its shareholders (including the investment performance of the fund); (ii) the competitiveness of the fund's management fee and total expenses; (iii) the total costs of the services to be provided by and the profits to be realized by Fidelity from its relationship with the fund; (iv) the extent to which economies of scale would be realized as the fund grows; and (v) whether fee levels reflect these economies of scale, if any, for the benefit of fund shareholders.
In considering whether to renew the Advisory Contracts for the fund, the Board ultimately reached a determination, with the assistance of fund counsel and Independent Trustees' counsel and through the exercise of its business judgment, that the renewal of the Advisory Contracts and the compensation to be received by Fidelity under the management contract is consistent with Fidelity's fiduciary duty under applicable law. The Board's decision to renew the Advisory Contracts was not based on any single factor noted above, but rather was based on a comprehensive consideration of all the information provided to the Board at its meetings throughout the year. The Board, in reaching its determination to renew the Advisory Contracts, is aware that shareholders in the fund have a broad range of investment choices available to them, including a wide choice among mutual funds offered by competitors to Fidelity, and that the fund's shareholders, with the opportunity to review and weigh the disclosure provided by the fund in its prospectus and other public disclosures, have chosen to invest in this fund, managed by Fidelity.
Nature, Extent, and Quality of Services Provided. The Board considered staffing within the investment adviser, FMR, and the sub-advisers (together, the Investment Advisers), including the backgrounds of the fund's investment personnel and the fund's investment objective and discipline. The Independent Trustees also had discussions with senior management of Fidelity's investment operations and investment groups. The Board considered the structure of the portfolio manager compensation program and whether this structure provides appropriate incentives.
Resources Dedicated to Investment Management and Support Services. The Board reviewed the size, education, and experience of the Investment Advisers' investment staff, their use of technology, and the Investment Advisers' approach to recruiting, training, and retaining portfolio managers and other research, advisory, and management personnel. In response to last year's financial crisis, FMR took a number of actions intended to cut costs and improve efficiency without weakening the investment teams or resources. The Board noted that Fidelity's analysts have access to a variety of technological tools and market and securities data that enable them to perform both fundamental and quantitative analysis and to specialize in various disciplines. The Board considered Fidelity's extensive global research capabilities that enable the Investment Advisers to aggregate data from various sources in an effort to produce positive investment results. The Board also considered that Fidelity's portfolio managers and analysts have access to daily portfolio attribution that allows for monitoring of a fund's portfolio, as well as an electronic communication system that provides immediate real-time access to research concerning issuers and credit enhancers.
Shareholder and Administrative Services. The Board considered (i) the nature, extent, quality, and cost of advisory, administrative, distribution, and shareholder services performed by the Investment Advisers and their affiliates under the Advisory Contracts and under separate agreements covering transfer agency, pricing and bookkeeping, and securities lending services for the fund; (ii) the nature and extent of the Investment Advisers' supervision of third party service providers, principally custodians and subcustodians; and (iii) the resources devoted to, and the record of compliance with, the fund's compliance policies and procedures. The Board also reviewed the allocation of fund brokerage, including allocations to brokers affiliated with the Investment Advisers, the use of brokerage commissions to pay fund expenses, and the use of "soft" commission dollars to pay for research services.
The Board noted that the growth of fund assets across the complex allows Fidelity to reinvest in the development of services designed to enhance the value or convenience of the Fidelity funds as investment vehicles. These services include 24-hour access to account information and market information through phone representatives and over the Internet, and investor education materials and asset allocation tools.
Investment in a Large Fund Family. The Board considered the benefits to shareholders of investing in a Fidelity fund, including the benefits of investing in a fund that is part of a large family of funds offering a variety of investment disciplines and providing for a large variety of mutual fund investor services. The Board noted that Fidelity has taken a number of actions over the previous year that benefited particular funds, including (i) dedicating additional resources to investment research and to restructure and broaden the focus of the investment research teams; (ii) bolstering the senior management team that oversees asset management; (iii) contractually agreeing to reduce the management fee on Fidelity U.S. Bond Index Fund; and (iv) expanding Class A and Class T load waiver categories to increase rollover retention opportunities and create consistent policies across the classes.
Annual Report
Investment Performance. The Board considered whether the fund has operated within its investment objective, as well as its record of compliance with its investment restrictions. It also reviewed the fund's absolute investment performance for each class, as well as the fund's relative investment performance for each class measured against a third-party-sponsored index that reflects the market sector in which the fund invests over multiple periods. The Board noted that FMR does not believe that a meaningful peer group exists against which to compare the fund's performance. The following charts considered by the Board show, over the one-, three-, and five-year periods ended December 31, 2008, as available, the cumulative total returns of Initial Class and Investor Class of the fund and the cumulative total returns of a third-party-sponsored index ("benchmark").
VIP Financial Services Portfolio
The Board stated that the investment performance of the fund was lower than its benchmark for the one- and five-year periods, although the three-year cumulative total return of Initial Class compared favorably to its benchmark. The Board considered that the variations in performance between the fund's classes reflect the variations in class expenses, which result in lower performance for the higher expense class.
The Board considered that FMR has taken steps to refocus and strengthen equity research, equity portfolio management, and compliance. The Board reviewed the year-to-date performance of Initial Class through May 31, 2009 and stated that it exceeded the fund's benchmark.
Based on its review, and giving particular weight to the nature and quality of the resources dedicated by the Investment Advisers to maintain and improve relative performance and factoring in the unprecedented market events in 2008, the Board concluded that the nature, extent, and quality of the services provided to the fund will benefit the fund's shareholders, particularly in light of the Board's view that the fund's shareholders benefit from investing in a fund that is part of a large family of funds offering a variety of investment disciplines and services.
Competitiveness of Management Fee and Total Fund Expenses. The Board considered the fund's management fee and total expenses compared to "mapped groups" of competitive funds and classes. Fidelity creates "mapped groups" by combining similar Lipper investment objective categories that have comparable management fee characteristics. Combining Lipper investment objective categories aids the Board's management fee and total expense comparisons by broadening the competitive group used for comparison and by reducing the number of universes to which various Fidelity funds are compared.
The Board considered two proprietary management fee comparisons for the 12-month periods shown in the chart below. The group of Lipper funds used by the Board for management fee comparisons is referred to below as the "Total Mapped Group." The Total Mapped Group comparison focuses on a fund's standing relative to the total universe of comparable funds available to investors, in terms of gross management fees before expense reimbursements or caps. "TMG %" represents the percentage of funds in the Total Mapped Group that had management fees that were lower than the fund's. For example, a TMG % of 4% means that 96% of the funds in the Total Mapped Group had higher management fees than the fund. The "Asset-Size Peer Group" (ASPG) comparison focuses on a fund's standing relative to non-Fidelity funds similar in size to the fund within the Total Mapped Group. The ASPG represents at least 15% of the funds in the Total Mapped Group with comparable asset size and management fee characteristics, subject to a minimum of 50 funds (or all funds in the Total Mapped Group if fewer than 50). Additional information, such as the ASPG quartile in which the fund's management fee ranked, is also included in the chart and considered by the Board.
Annual Report
Board Approval of Investment Advisory Contracts and Management Fees - continued
VIP Financial Services Portfolio
The Board noted that the fund's management fee ranked below the median of its Total Mapped Group and below the median of its ASPG for 2008.
Based on its review, the Board concluded that the fund's management fee was fair and reasonable in light of the services that the fund receives and the other factors considered.
In its review of each class's total expenses, the Board considered the fund's management fee as well as other fund or class expenses, as applicable, such as transfer agent fees, pricing and bookkeeping fees, and custodial, legal, and audit fees. The Board also noted the effects of any waivers and reimbursements on fees and expenses. As part of its review, the Board also considered current and historical total expenses of each class of the fund compared to competitive fund median expenses. Each class of the fund is compared to those funds and classes in the Total Mapped Group (used by the Board for management fee comparisons) that have a similar sales load structure.
The Board noted that the total expenses of each class ranked below its competitive median for 2008.
In its review of total expenses, the Board also considered Fidelity fee structures and other information on clients that FMR and its affiliates service in other competitive markets, such as other mutual funds advised or subadvised by FMR or its affiliates, pension plan clients, and other institutional clients.
Based on its review, the Board concluded that the total expenses of each class of the fund were reasonable in light of the services that the fund and its shareholders receive and the other factors considered.
Costs of the Services and Profitability. The Board considered the revenues earned and the expenses incurred by Fidelity in conducting the business of developing, marketing, distributing, managing, administering and servicing the fund and its shareholders. The Board also considered the level of Fidelity's profits in respect of all the Fidelity funds.
On an annual basis, FMR presents to the Board Fidelity's profitability for the fund. Fidelity calculates the profitability for each fund, as well as aggregate profitability for groups of Fidelity funds and all Fidelity funds, using a series of detailed revenue and cost allocation methodologies which originate with the audited books and records of Fidelity. The Audit Committee of the Board reviews any significant changes from the prior year's methodologies.
PricewaterhouseCoopers LLP (PwC), independent registered public accounting firm and auditor to Fidelity and certain Fidelity funds, has been engaged annually by the Board as part of the Board's assessment of Fidelity's profitability analysis. PwC's engagement includes the review and assessment of Fidelity's methodologies used in determining the revenues and expenses attributable to Fidelity's mutual fund business, and completion of agreed-upon procedures surrounding the mathematical accuracy of fund profitability and its conformity to allocation methodologies. After considering PwC's reports issued under the engagement and information provided by Fidelity, the Board believes that while other allocation methods may also be reasonable, Fidelity's profitability methodologies are reasonable in all material respects.
The Board has also reviewed Fidelity's non-fund businesses and any fall-out benefits related to the mutual fund business as well as cases where Fidelity's affiliates may benefit from or be related to the fund's business.
The Board considered the costs of the services provided by and the profits realized by Fidelity in connection with the operation of the fund and determined that the amount of profit is a fair entrepreneurial profit for the management of the fund.
Annual Report
Economies of Scale. The Board considered whether there have been economies of scale in respect of the management of the Fidelity funds, whether the Fidelity funds (including the fund) have appropriately benefited from any such economies of scale, and whether there is potential for realization of any further economies of scale. The Board considered the extent to which the fund will benefit from economies of scale through increased services to the fund, through waivers or reimbursements, or through fee or expense reductions.
In February 2009, the Board created an Ad Hoc Committee (the "Committee") to analyze economies of scale. The Committee was formed to consider whether FMR attains economies of scale in respect of the management and servicing of the Fidelity funds, whether the Fidelity funds have appropriately benefited from such economies of scale, and whether there is potential for realization of any further economies of scale.
The Board recognized that the fund's management contract incorporates a "group fee" structure, which provides for lower group fee rates as total fund assets under FMR's management increase, and for higher group fee rates as total fund assets under FMR's management decrease. FMR determines the group fee rates based on a tiered asset "breakpoint" schedule. The Board considered that the group fee is designed to deliver the benefits of economies of scale to fund shareholders when total fund assets increase, even if assets of any particular fund are unchanged or have declined, because some portion of Fidelity's costs are attributable to services provided to all Fidelity funds, and all funds benefit if those costs can be allocated among more assets. The Board concluded that, given the group fee structure, fund shareholders will achieve a certain level of economies of scale as assets under FMR's management increase at the fund complex level, regardless of whether Fidelity achieves any such economies of scale.
The Board concluded, considering the findings of the Committee, that any potential economies of scale are being shared between fund shareholders and Fidelity in an appropriate manner.
Additional Information Requested by the Board. In order to develop fully the factual basis for consideration of the Fidelity funds' Advisory Contracts, the Board requested and received additional information on certain topics, including (i) fund performance trends, actions to be taken by FMR to improve certain funds' overall performance and Fidelity's long-term strategies for certain funds; (ii) portfolio manager changes that have occurred during the past year; (iii) Fidelity's compensation structure for portfolio managers and key personnel, including performance benchmarks used by Fidelity in evaluating incentive compensation for portfolio managers and research analysts; (iv) the structure and process of equity research and actions taken by FMR to improve the quality of research; (v) the selection of and compensation paid by FMR to fund sub-advisers; (vi) Fidelity's fee structures and rationale for recommending different fees among categories of funds; (vii) the rationale for any differences between fund fee structures and fee structures in place for other Fidelity clients; (viii) Fidelity's rationale for recommending which funds should have a performance adjustment component as part of their management fees; and (ix) explanations for the relative total expenses borne by certain funds and classes, total expense competitive trends, and actions that might be taken by FMR to reduce total expenses for certain funds and classes.
Based on its evaluation of all of the conclusions noted above, and after considering all material factors, the Board ultimately concluded that the advisory fee structures are fair and reasonable, and that the fund's Advisory Contracts should be renewed.
Annual Report
Investment Adviser
Fidelity Management & Research Company
Boston, MA
Investment Sub-Advisers
FMR Co., Inc.
Fidelity Management & Research (U.K.) Inc.
Fidelity Research & Analysis Company
FIL Investments (Japan) Limited
FIL Investment Advisors
FIL Investment Advisors (U.K.) Ltd.
Fidelity Management and Research (Hong Kong) Limited
Fidelity Management and Research (Japan) Inc.
General Distributor
Fidelity Distributors Corporation
Boston, MA
Transfer and Service Agents
Fidelity Investments Institutional Operations Company, Inc.
Boston, MA
Fidelity Service Company, Inc.
Boston, MA
Custodian
JPMorgan Chase Bank
New York, NY
VFSIC-ANN-0210
1.817367.105
Fidelity® Variable Insurance Products:
Growth Stock Portfolio
Annual Report
December 31, 2009
(2_fidelity_logos) (Registered_Trademark)
Contents
Performance | <Click Here> | How the fund has done over time. |
Management's Discussion | <Click Here> | The manager's review of fund performance, strategy and outlook. |
Shareholder Expense Example | <Click Here> | An example of shareholder expenses. |
Investment Changes | <Click Here> | A summary of major shifts in the fund's investments over the past six months. |
Investments | <Click Here> | A complete list of the fund's investments with their market values. |
Financial Statements | <Click Here> | Statements of assets and liabilities, operations, and changes in net assets, as well as financial highlights. |
Notes | <Click Here> | Notes to the financial statements. |
Report of Independent Registered Public Accounting Firm | <Click Here> | |
Trustees and Officers | <Click Here> | |
Distributions | <Click Here> | |
Board Approval of Investment Advisory Contracts and Management Fees | <Click Here> | |
To view a fund's proxy voting guidelines and proxy voting record for the 12-month period ended June 30, visit http://www.fidelity.com/proxyvotingresults or visit the Securities and Exchange Commission's (SEC) web site at http://www.sec.gov. You may also call 1-877-208-0098 to request a free copy of the proxy voting guidelines.
Fidelity Variable Insurance Products are separate account options which are purchased through a variable insurance contract.
Standard & Poor's, S&P and S&P 500 are registered service marks of The McGraw-Hill Companies, Inc. and have been licensed for use by Fidelity Distributors Corporation.
Other third party marks appearing herein are the property of their respective owners.
All other marks appearing herein are registered or unregistered trademarks or service marks of FMR LLC or an affiliated company.
This report and the financial statements contained herein are submitted for the general information of the shareholders of the fund. This report is not authorized for distribution to prospective investors in the fund unless preceded or accompanied by an effective prospectus.
A fund files its complete schedule of portfolio holdings with the SEC for the first and third quarters of each fiscal year on Form N-Q. Forms N-Q are available on the SEC's web site at http://www.sec.gov. A fund's Forms N-Q may be reviewed and copied at the SEC's Public Reference Room in Washington, DC. Information regarding the operation of the SEC's Public Reference Room may be obtained by calling 1-800-SEC-0330. For a complete list of a fund's portfolio holdings, view the most recent holdings listing, semiannual report, or annual report on Fidelity's web site at http://www.fidelity.com or http://www.advisor.fidelity.com, as applicable.
NOT FDIC INSURED · MAY LOSE VALUE · NO BANK GUARANTEE
Neither the fund nor Fidelity Distributors Corporation is a bank.
Annual Report
Average annual total return reflects the change in the value of an investment, assuming reinvestment of the class' dividend income and capital gains (the profits earned upon the sale of securities that have grown in value, if any) and assuming a constant rate of performance each year. During periods of reimbursement by Fidelity, a fund's total return will be greater than it would be had the reimbursement not occurred. Performance numbers are net of all underlying fund operating expenses, but do not include any insurance charges imposed by your insurance company's separate account. If performance information included the effect of these additional charges, the total returns would have been lower. How a fund did yesterday is no guarantee of how it will do tomorrow.
Average Annual Total Returns
Periods ended December 31, 2009 | Past 1
year | Past 5
years | Life of
fund A |
VIP Growth Stock - Initial Class | 44.86% | 1.35% | 4.53% |
VIP Growth Stock - Service Class B | 44.61% | 1.24% | 4.42% |
VIP Growth Stock - Service Class 2 C | 44.42% | 1.10% | 4.27% |
VIP Growth Stock - Investor Class D | 44.64% | 1.25% | 4.45% |
A From December 11, 2002
B Performance for Service Class shares reflects an asset-based service fee (12b-1 fee).
C Performance for Service Class 2 shares reflects an asset-based service fee (12b-1 fee).
D The initial offering of Investor Class shares took place on July 21, 2005. Returns prior to July 21, 2005 are those of Initial Class. Had Investor Class's transfer agent fee been reflected, returns prior to July 21, 2005 would have been lower.
$10,000 Over Life of Fund
Let's say hypothetically that $10,000 was invested in VIP Growth Stock Portfolio - Initial Class on December 11, 2002, when the fund started. The chart shows how the value of your investment would have changed, and also shows how the Russell 1000® Growth Index performed over the same period.
Annual Report
Market Recap: In 2009, most global markets saw both crippling lows and considerable highs. After a dismal start, the economy began to show signs of improvement, suggesting that a recovery was on the horizon. Credit markets began to heal as fiscal and monetary stimulus efforts around the world started to take effect, and corporate earnings staged an impressive rebound, fueled in large part by massive cost cutting. As a result, the flight to quality that marked most of 2008 and early 2009 shifted in March as investors flocked to riskier asset categories. The U.S. equity market, as measured by the bellwether Standard & Poor's 500SM Index and the blue-chip proxy Dow Jones Industrial AverageSM, reflected this changing environment, gaining 26.46% and 22.68%, respectively. Meanwhile, the technology-laden Nasdaq Composite® Index rose 45.32%. Foreign stocks also produced strong gains, as illustrated by the 31.93% jump of the MSCI® EAFE® Index (Europe, Australasia, Far East), a gauge of developed stock markets outside the U.S. and Canada. Emerging-markets stocks, which suffered their worst calendar-year performance ever in 2008, posted record returns this past year, with the MSCI Emerging Markets Index soaring 79.02%. A depreciating U.S. dollar helped bolster returns for U.S. investors in foreign equities.
Comments from Jeffrey Feingold, Portfolio Manager of VIP Growth Stock Portfolio: For the 12 months ending December 31, 2009, the fund handily beat the 37.21% return of its benchmark, the Russell 1000® Growth Index. (For specific portfolio results, please refer to the performance section of this report.) Stock selection drove performance, with especially strong results in the consumer discretionary, information technology (IT), financials and health care sectors. My focus remained on companies with the potential to grow earnings faster than the market over the long term. Top performers included non-index holding Tempur-Pedic International, a premium bedding company that benefited from aggressive cost cutting, and Inverness Medical Innovations, a medical diagnostics company with steady revenue growth and good expense discipline. Other standouts were Apple, which saw strong sales of its iPhone, iPod and iTouch products, and Cognizant Technology Solutions, an offshore IT services provider that gained as more corporations turned to outsourcing. The fund lost ground versus the index from an overweighting in financials and modestly disappointing performance from our stock picks in consumer staples. Detractors included Delta Air, which was pressured by reduced travel budgets. We cut our losses and sold the position. An underweighting in technology leader International Business Machines (IBM) further hindered results, as the company's cost cutting, diversified product line and stock buybacks drove the share price higher. I later sold IBM.
The views expressed above reflect those of the portfolio manager(s) only through the end of the period as stated on the cover of this report and do not necessarily represent the views of Fidelity or any other person in the Fidelity organization. Any such views are subject to change at any time based upon market or other conditions and Fidelity disclaims any responsibility to update such views. These views may not be relied on as investment advice and, because investment decisions for a Fidelity fund are based on numerous factors, may not be relied on as an indication of trading intent on behalf of any Fidelity fund.
Annual Report
As a shareholder of the Fund, you incur two types of costs: (1) transaction costs, and (2) ongoing costs, including management fees, distribution and/or service (12b-1) fees and other Fund expenses. This Example is intended to help you understand your ongoing costs (in dollars) of investing in the Fund and to compare these costs with the ongoing costs of investing in other mutual funds.
The Example is based on an investment of $1,000 invested at the beginning of the period and held for the entire period (July 1, 2009 to December 31, 2009).
Actual Expenses
The first line of the accompanying table for each class of the Fund provides information about actual account values and actual expenses. You may use the information in this line, together with the amount you invested, to estimate the expenses that you paid over the period. Simply divide your account value by $1,000.00 (for example, an $8,600 account value divided by $1,000.00 = 8.6), then multiply the result by the number in the first line for a class of the Fund under the heading entitled "Expenses Paid During Period" to estimate the expenses you paid on your account during this period. The estimate of expenses does not include any fees or other expenses of any variable annuity or variable life insurance product. If they were, the estimate of expenses you paid during the period would be higher, and your ending account value would be lower. In addition, the Fund, as a shareholder in the underlying Fidelity Central Funds, will indirectly bear its pro-rata share of the fees and expenses incurred by the underlying Fidelity Central Funds. These fees and expenses are not included in the Fund's annualized expense ratio used to calculate the expense estimate in the table below.
Hypothetical Example for Comparison Purposes
The second line of the accompanying table for each class of the Fund provides information about hypothetical account values and hypothetical expenses based on a Class' actual expense ratio and an assumed rate of return of 5% per year before expenses, which is not the Class' actual return. The hypothetical account values and expenses may not be used to estimate the actual ending account balance or expenses you paid for the period. You may use this information to compare the ongoing costs of investing in the Fund and other funds. To do so, compare this 5% hypothetical example with the 5% hypothetical examples that appear in the shareholder reports of the other funds. The estimate of expenses does not include any fees or other expenses of any variable annuity or variable life insurance product. If they were, the estimate of expenses you paid during the period would be higher, and your ending account value would be lower. In addition, the Fund, as a shareholder in the underlying Fidelity Central Funds, will indirectly bear its pro-rata share of the fees and expenses incurred by the underlying Fidelity Central Funds. These fees and expenses are not included in the Fund's annualized expense ratio used to calculate the expense estimate in the table below.
Please note that the expenses shown in the table are meant to highlight your ongoing costs only and do not reflect any transaction costs. Therefore, the second line of the table is useful in comparing ongoing costs only, and will not help you determine the relative total costs of owning different funds.
|
Annualized
Expense Ratio
|
Beginning
Account Value
July 1, 2009
|
Ending
Account Value
December 31, 2009
| Expenses Paid
During Period*
July 1, 2009 to
December 31, 2009 |
Initial Class | .85% | | | |
Actual | | $ 1,000.00 | $ 1,266.00 | $ 4.85 |
HypotheticalA | | $ 1,000.00 | $ 1,020.92 | $ 4.33 |
Service Class | .95% | | | |
Actual | | $ 1,000.00 | $ 1,266.20 | $ 5.43 |
HypotheticalA | | $ 1,000.00 | $ 1,020.42 | $ 4.84 |
Service Class 2 | 1.10% | | | |
Actual | | $ 1,000.00 | $ 1,265.40 | $ 6.28 |
HypotheticalA | | $ 1,000.00 | $ 1,019.66 | $ 5.60 |
Investor Class | .93% | | | |
Actual | | $ 1,000.00 | $ 1,266.40 | $ 5.31 |
HypotheticalA | | $ 1,000.00 | $ 1,020.52 | $ 4.74 |
A 5% return per year before expenses
* Expenses are equal to each Class' annualized expense ratio, multiplied by the average account value over the period, multiplied by 184/365 (to reflect the one-half year period).
Annual Report
Top Ten Stocks as of December 31, 2009 |
| % of fund's net assets | % of fund's net assets
6 months ago |
Apple, Inc. | 4.7 | 3.2 |
Google, Inc. Class A | 4.4 | 3.5 |
Microsoft Corp. | 4.2 | 4.3 |
Cisco Systems, Inc. | 2.1 | 2.4 |
Procter & Gamble Co. | 2.1 | 2.7 |
Amazon.com, Inc. | 2.1 | 1.1 |
Tempur-Pedic International, Inc. | 1.9 | 0.9 |
QUALCOMM, Inc. | 1.8 | 1.8 |
Wal-Mart Stores, Inc. | 1.8 | 2.3 |
United Technologies Corp. | 1.6 | 1.1 |
| 26.7 | |
Top Five Market Sectors as of December 31, 2009 |
| % of fund's net assets | % of fund's net assets
6 months ago |
Information Technology | 34.7 | 31.6 |
Health Care | 14.0 | 16.6 |
Consumer Staples | 13.1 | 13.9 |
Consumer Discretionary | 10.7 | 11.4 |
Industrials | 9.6 | 9.4 |
Asset Allocation (% of fund's net assets) |
As of December 31, 2009* | As of June 30, 2009** |
 | Stocks 96.3% | | | Stocks 99.2% | |
 | Short-Term
Investments and
Net Other Assets 3.7% | | | Short-Term
Investments and
Net Other Assets 0.8% | |
* Foreign investments | 10.1% | | ** Foreign investments | 8.6% | |

Annual Report
Showing Percentage of Net Assets
Common Stocks - 96.3% |
| Shares | | Value |
CONSUMER DISCRETIONARY - 10.7% |
Auto Components - 0.6% |
Johnson Controls, Inc. | 3,200 | | $ 87,168 |
Diversified Consumer Services - 0.6% |
Strayer Education, Inc. | 400 | | 84,996 |
Hotels, Restaurants & Leisure - 1.9% |
McDonald's Corp. | 2,000 | | 124,880 |
Starbucks Corp. (a) | 4,800 | | 110,688 |
Wyndham Worldwide Corp. | 2,400 | | 48,408 |
| | 283,976 |
Household Durables - 2.1% |
iRobot Corp. (a) | 1,600 | | 28,160 |
Tempur-Pedic International, Inc. (a) | 12,500 | | 295,375 |
| | 323,535 |
Internet & Catalog Retail - 2.1% |
Amazon.com, Inc. (a) | 2,310 | | 310,741 |
Specialty Retail - 0.9% |
Best Buy Co., Inc. | 900 | | 35,514 |
Sally Beauty Holdings, Inc. (a) | 5,800 | | 44,370 |
Staples, Inc. | 2,100 | | 51,639 |
| | 131,523 |
Textiles, Apparel & Luxury Goods - 2.5% |
Deckers Outdoor Corp. (a) | 1,800 | | 183,096 |
Phillips-Van Heusen Corp. | 1,700 | | 69,156 |
Polo Ralph Lauren Corp. Class A | 1,600 | | 129,568 |
| | 381,820 |
TOTAL CONSUMER DISCRETIONARY | | 1,603,759 |
CONSUMER STAPLES - 13.1% |
Beverages - 2.7% |
Anheuser-Busch InBev SA NV | 1,616 | | 84,202 |
PepsiCo, Inc. | 1,500 | | 91,200 |
The Coca-Cola Co. | 3,950 | | 225,150 |
| | 400,552 |
Food & Staples Retailing - 4.3% |
Costco Wholesale Corp. | 2,200 | | 130,174 |
Wal-Mart Stores, Inc. | 5,000 | | 267,250 |
Walgreen Co. | 4,600 | | 168,912 |
Whole Foods Market, Inc. (a)(c) | 2,800 | | 76,860 |
| | 643,196 |
Food Products - 3.2% |
Bunge Ltd. | 1,600 | | 102,128 |
Danone | 1,510 | | 92,590 |
Nestle SA sponsored ADR | 2,000 | | 96,700 |
The J.M. Smucker Co. | 2,700 | | 166,725 |
Tingyi (Cayman Island) Holding Corp. | 8,000 | | 19,795 |
| | 477,938 |
Household Products - 2.1% |
Procter & Gamble Co. | 5,200 | | 315,276 |
|
| Shares | | Value |
Personal Products - 0.8% |
Avon Products, Inc. | 2,600 | | $ 81,900 |
BaWang International (Group) Holding Ltd. | 11,000 | | 7,617 |
Hengan International Group Co. Ltd. | 3,000 | | 22,212 |
| | 111,729 |
TOTAL CONSUMER STAPLES | | 1,948,691 |
ENERGY - 4.1% |
Energy Equipment & Services - 1.0% |
Schlumberger Ltd. | 2,190 | | 142,547 |
Oil, Gas & Consumable Fuels - 3.1% |
Arch Coal, Inc. | 1,300 | | 28,925 |
Chesapeake Energy Corp. | 1,900 | | 49,172 |
Exxon Mobil Corp. | 1,990 | | 135,698 |
Massey Energy Co. | 1,200 | | 50,412 |
Occidental Petroleum Corp. | 1,900 | | 154,565 |
Range Resources Corp. | 1,000 | | 49,850 |
| | 468,622 |
TOTAL ENERGY | | 611,169 |
FINANCIALS - 5.4% |
Capital Markets - 1.2% |
Bank of New York Mellon Corp. | 600 | | 16,782 |
Goldman Sachs Group, Inc. | 200 | | 33,768 |
Morgan Stanley | 3,100 | | 91,760 |
Northern Trust Corp. | 800 | | 41,920 |
| | 184,230 |
Commercial Banks - 0.9% |
PNC Financial Services Group, Inc. | 700 | | 36,953 |
Wells Fargo & Co. | 3,400 | | 91,766 |
| | 128,719 |
Consumer Finance - 0.5% |
American Express Co. | 2,000 | | 81,040 |
Diversified Financial Services - 1.8% |
Bank of America Corp. | 4,500 | | 67,770 |
CME Group, Inc. | 400 | | 134,380 |
JPMorgan Chase & Co. | 1,600 | | 66,672 |
| | 268,822 |
Real Estate Management & Development - 1.0% |
Henderson Land Development Co. Ltd. | 2,000 | | 14,945 |
Jones Lang LaSalle, Inc. | 2,000 | | 120,800 |
Yanlord Land Group Ltd. | 8,000 | | 12,355 |
| | 148,100 |
TOTAL FINANCIALS | | 810,911 |
HEALTH CARE - 14.0% |
Biotechnology - 2.6% |
Alexion Pharmaceuticals, Inc. (a) | 1,300 | | 63,466 |
Common Stocks - continued |
| Shares | | Value |
HEALTH CARE - continued |
Biotechnology - continued |
Amgen, Inc. (a) | 2,300 | | $ 130,111 |
Biogen Idec, Inc. (a) | 2,100 | | 112,350 |
Dendreon Corp. (a) | 1,100 | | 28,908 |
United Therapeutics Corp. (a) | 1,100 | | 57,915 |
| | 392,750 |
Health Care Equipment & Supplies - 2.8% |
Covidien PLC | 4,800 | | 229,872 |
ev3, Inc. (a) | 1,100 | | 14,674 |
Inverness Medical Innovations, Inc. (a) | 3,525 | | 146,323 |
Mako Surgical Corp. (a) | 800 | | 8,880 |
NuVasive, Inc. (a) | 500 | | 15,990 |
| | 415,739 |
Health Care Providers & Services - 2.8% |
CIGNA Corp. | 2,000 | | 70,540 |
Express Scripts, Inc. (a) | 1,200 | | 103,740 |
Medco Health Solutions, Inc. (a) | 3,300 | | 210,903 |
UnitedHealth Group, Inc. | 1,100 | | 33,528 |
| | 418,711 |
Health Care Technology - 1.5% |
Cerner Corp. (a) | 2,800 | | 230,832 |
Life Sciences Tools & Services - 0.5% |
QIAGEN NV (a) | 3,100 | | 69,192 |
Pharmaceuticals - 3.8% |
Allergan, Inc. | 3,000 | | 189,030 |
Cadence Pharmaceuticals, Inc. (a) | 2,200 | | 21,274 |
Johnson & Johnson | 1,900 | | 122,379 |
King Pharmaceuticals, Inc. (a) | 3,200 | | 39,264 |
Merck & Co., Inc. | 800 | | 29,232 |
Teva Pharmaceutical Industries Ltd. sponsored ADR | 2,500 | | 140,450 |
ViroPharma, Inc. (a) | 2,200 | | 18,458 |
| | 560,087 |
TOTAL HEALTH CARE | | 2,087,311 |
INDUSTRIALS - 9.6% |
Aerospace & Defense - 4.1% |
Alliant Techsystems, Inc. (a) | 900 | | 79,443 |
Honeywell International, Inc. | 2,200 | | 86,240 |
Precision Castparts Corp. | 1,300 | | 143,455 |
Raytheon Co. | 1,300 | | 66,976 |
United Technologies Corp. | 3,500 | | 242,935 |
| | 619,049 |
Airlines - 0.5% |
Southwest Airlines Co. | 6,800 | | 77,724 |
Building Products - 0.3% |
Masco Corp. | 2,900 | | 40,049 |
Electrical Equipment - 0.7% |
American Superconductor Corp. (a) | 900 | | 36,810 |
|
| Shares | | Value |
First Solar, Inc. (a) | 400 | | $ 54,160 |
Rockwell Automation, Inc. | 400 | | 18,792 |
| | 109,762 |
Machinery - 1.9% |
Caterpillar, Inc. | 1,300 | | 74,087 |
Cummins, Inc. | 1,200 | | 55,032 |
Danaher Corp. | 1,000 | | 75,200 |
Ingersoll-Rand Co. Ltd. | 2,000 | | 71,480 |
| | 275,799 |
Professional Services - 0.6% |
Robert Half International, Inc. | 3,100 | | 82,863 |
Road & Rail - 1.5% |
CSX Corp. | 1,900 | | 92,131 |
Union Pacific Corp. | 2,000 | | 127,800 |
| | 219,931 |
TOTAL INDUSTRIALS | | 1,425,177 |
INFORMATION TECHNOLOGY - 34.7% |
Communications Equipment - 5.3% |
Cisco Systems, Inc. (a) | 13,300 | | 318,402 |
Juniper Networks, Inc. (a) | 6,800 | | 181,356 |
Palm, Inc. (a) | 2,400 | | 24,096 |
QUALCOMM, Inc. | 5,800 | | 268,308 |
| | 792,162 |
Computers & Peripherals - 6.8% |
Apple, Inc. (a) | 3,340 | | 704,271 |
Hewlett-Packard Co. | 4,300 | | 221,493 |
Seagate Technology | 2,400 | | 43,656 |
Western Digital Corp. (a) | 1,100 | | 48,565 |
| | 1,017,985 |
Electronic Equipment & Components - 0.9% |
Agilent Technologies, Inc. (a) | 2,100 | | 65,247 |
Ingram Micro, Inc. Class A (a) | 4,000 | | 69,800 |
| | 135,047 |
Internet Software & Services - 6.0% |
Baidu.com, Inc. sponsored ADR (a) | 100 | | 41,123 |
eBay, Inc. (a) | 5,000 | | 117,700 |
Google, Inc. Class A (a) | 1,050 | | 650,979 |
NetEase.com, Inc. sponsored ADR (a) | 900 | | 33,849 |
Tencent Holdings Ltd. | 2,000 | | 43,254 |
| | 886,905 |
IT Services - 2.6% |
Alliance Data Systems Corp. (a) | 2,400 | | 155,016 |
Cognizant Technology Solutions Corp. Class A (a) | 4,060 | | 183,918 |
MasterCard, Inc. Class A | 200 | | 51,196 |
| | 390,130 |
Semiconductors & Semiconductor Equipment - 3.8% |
ASML Holding NV (NY Shares) | 1,100 | | 37,499 |
Intel Corp. | 9,500 | | 193,800 |
Common Stocks - continued |
| Shares | | Value |
INFORMATION TECHNOLOGY - continued |
Semiconductors & Semiconductor Equipment - continued |
KLA-Tencor Corp. | 1,100 | | $ 39,776 |
Lam Research Corp. (a) | 1,200 | | 47,052 |
Marvell Technology Group Ltd. (a) | 3,100 | | 64,325 |
NVIDIA Corp. (a) | 5,700 | | 106,476 |
Omnivision Technologies, Inc. (a) | 1,700 | | 24,701 |
Taiwan Semiconductor Manufacturing Co. Ltd. sponsored ADR | 4,418 | | 50,542 |
| | 564,171 |
Software - 9.3% |
Activision Blizzard, Inc. (a) | 600 | | 6,666 |
Adobe Systems, Inc. (a) | 2,400 | | 88,272 |
BMC Software, Inc. (a) | 2,400 | | 96,240 |
Citrix Systems, Inc. (a) | 2,200 | | 91,542 |
Informatica Corp. (a) | 1,200 | | 31,032 |
MICROS Systems, Inc. (a) | 2,500 | | 77,575 |
Microsoft Corp. | 20,300 | | 618,947 |
Nuance Communications, Inc. (a) | 5,100 | | 79,254 |
Red Hat, Inc. (a) | 2,000 | | 61,800 |
Sourcefire, Inc. (a) | 2,300 | | 61,525 |
Sybase, Inc. (a) | 4,100 | | 177,940 |
| | 1,390,793 |
TOTAL INFORMATION TECHNOLOGY | | 5,177,193 |
MATERIALS - 3.8% |
Chemicals - 2.4% |
Air Products & Chemicals, Inc. | 900 | | 72,954 |
Albemarle Corp. | 1,500 | | 54,555 |
Dow Chemical Co. | 4,000 | | 110,520 |
The Mosaic Co. | 2,100 | | 125,433 |
| | 363,462 |
Metals & Mining - 1.4% |
AngloGold Ashanti Ltd. sponsored ADR | 1,300 | | 52,234 |
|
| Shares | | Value |
Freeport-McMoRan Copper & Gold, Inc. | 600 | | $ 48,174 |
Newmont Mining Corp. | 2,100 | | 99,351 |
| | 199,759 |
TOTAL MATERIALS | | 563,221 |
TELECOMMUNICATION SERVICES - 0.8% |
Wireless Telecommunication Services - 0.8% |
American Tower Corp. Class A (a) | 2,900 | | 125,309 |
UTILITIES - 0.1% |
Independent Power Producers & Energy Traders - 0.1% |
AES Corp. | 1,500 | | 19,965 |
TOTAL COMMON STOCKS (Cost $12,623,348) | 14,372,706 |
Money Market Funds - 6.0% |
| | | |
Fidelity Cash Central Fund, 0.16% (d) | 835,963 | | 835,963 |
Fidelity Securities Lending Cash Central Fund, 0.15% (b)(d) | 57,000 | | 57,000 |
TOTAL MONEY MARKET FUNDS (Cost $892,963) | 892,963 |
TOTAL INVESTMENT PORTFOLIO - 102.3% (Cost $13,516,311) | 15,265,669 |
NET OTHER ASSETS - (2.3)% | | (340,854) |
NET ASSETS - 100% | $ 14,924,815 |
Legend |
(a) Non-income producing |
(b) Investment made with cash collateral received from securities on loan. |
(c) Security or a portion of the security is on loan at period end. |
(d) Affiliated fund that is available only to investment companies and other accounts managed by Fidelity Investments. The rate quoted is the annualized seven-day yield of the fund at period end. A complete unaudited listing of the fund's holdings as of its most recent quarter end is available upon request. |
Affiliated Central Funds |
Information regarding fiscal year to date income earned by the Fund from investments in Fidelity Central Funds is as follows: |
Fund | Income earned |
Fidelity Cash Central Fund | $ 956 |
Fidelity Securities Lending Cash Central Fund | 1,220 |
Total | $ 2,176 |
Other Information |
The following is a summary of the inputs used, as of December 31, 2009, involving the Fund's assets and liabilities carried at value. The inputs or methodology used for valuing securities may not be an indication of the risk associated with investing in those securities. For more information on valuation inputs, and their aggregation into the levels used in the tables below, please refer to the Security Valuation section in the accompanying Notes to Financial Statements. |
Valuation Inputs at Reporting Date: |
Description | Total | Level 1 | Level 2 | Level 3 |
Investments in Securities: | | | | |
Equities: | | | | |
Consumer Discretionary | $ 1,603,759 | $ 1,603,759 | $ - | $ - |
Consumer Staples | 1,948,691 | 1,899,067 | 49,624 | - |
Energy | 611,169 | 611,169 | - | - |
Financials | 810,911 | 795,966 | 14,945 | - |
Health Care | 2,087,311 | 2,087,311 | - | - |
Industrials | 1,425,177 | 1,425,177 | - | - |
Information Technology | 5,177,193 | 5,133,939 | 43,254 | - |
Materials | 563,221 | 563,221 | - | - |
Telecommunication Services | 125,309 | 125,309 | - | - |
Utilities | 19,965 | 19,965 | - | - |
Money Market Funds | 892,963 | 892,963 | - | - |
Total Investments in Securities: | $ 15,265,669 | $ 15,157,846 | $ 107,823 | $ - |
The following is a reconciliation of Investments in Securities for which Level 3 inputs were used in determining value: |
Investments in Securities: | |
Beginning Balance | $ 15,525 |
Total Realized Gain (Loss) | (2,552) |
Total Unrealized Gain (Loss) | (525) |
Cost of Purchases | - |
Proceeds of Sales | (12,448) |
Amortization/Accretion | - |
Transfers in/out of Level 3 | - |
Ending Balance | $ - |
The change in unrealized gain (loss) for the period attributable to Level 3 securities held at December 31, 2009 | $ - |
The information used in the above reconciliation represents fiscal year to date activity for any Investments in Securities identified as using Level 3 inputs at either the beginning or the end of the current fiscal period. Transfers in or out of Level 3 represents either the beginning value (for transfers in), or the ending value (for transfers out) of any Security or Instrument where a change in the pricing level occurred from the beginning to the end of the period. Realized and unrealized gains (losses) disclosed in the reconciliation are included in Net Gain (Loss) on the Fund's Statement of Operations. |
Distribution of investments by country of issue, as a percentage of total net assets, is as follows: (Unaudited) |
United States of America | 89.9% |
Ireland | 2.0% |
Bermuda | 1.1% |
Netherlands Antilles | 1.0% |
Others (individually less than 1%) | 6.0% |
| 100.0% |
Income Tax Information |
At December 31, 2009, the fund had a capital loss carryforward of approximately $4,641,736 of which $2,310,685 and $2,331,051 will expire on December 31, 2016 and 2017, respectively. |
See accompanying notes which are an integral part of the financial statements.
Annual Report
Statement of Assets and Liabilities
| December 31, 2009 |
Assets | | |
Investment in securities, at value (including securities loaned of $54,900) - See accompanying schedule: Unaffiliated issuers (cost $12,623,348) | $ 14,372,706 | |
Fidelity Central Funds (cost $892,963) | 892,963 | |
Total Investments (cost $13,516,311) | | $ 15,265,669 |
Cash | | 3,215 |
Receivable for investments sold | | 37,362 |
Receivable for fund shares sold | | 145,052 |
Dividends receivable | | 6,736 |
Distributions receivable from Fidelity Central Funds | | 140 |
Prepaid expenses | | 62 |
Receivable from investment adviser for expense reductions | | 3,822 |
Other receivables | | 378 |
Total assets | | 15,462,436 |
| | |
Liabilities | | |
Payable for investments purchased | $ 429,727 | |
Payable for fund shares redeemed | 107 | |
Accrued management fee | 6,393 | |
Distribution fees payable | 426 | |
Other affiliated payables | 1,644 | |
Other payables and accrued expenses | 42,324 | |
Collateral on securities loaned, at value | 57,000 | |
Total liabilities | | 537,621 |
| | |
Net Assets | | $ 14,924,815 |
Net Assets consist of: | | |
Paid in capital | | $ 18,021,219 |
Accumulated undistributed net realized gain (loss) on investments and foreign currency transactions | | (4,845,701) |
Net unrealized appreciation (depreciation) on investments and assets and liabilities in foreign currencies | | 1,749,297 |
Net Assets | | $ 14,924,815 |
Statement of Assets and Liabilities - continued
| December 31, 2009 |
Initial Class:
Net Asset Value, offering price and redemption price per share ($5,373,857 ÷ 476,824 shares) | | $ 11.27 |
| | |
Service Class:
Net Asset Value, offering price and redemption price per share ($822,636 ÷ 73,323 shares) | | $ 11.22 |
| | |
Service Class 2:
Net Asset Value, offering price and redemption price per share ($1,684,312 ÷ 151,378 shares) | | $ 11.13 |
| | |
Investor Class:
Net Asset Value, offering price and redemption price per share ($7,044,010 ÷ 628,362 shares) | | $ 11.21 |
See accompanying notes which are an integral part of the financial statements.
Annual Report
Financial Statements - continued
Statement of Operations
| Year ended December 31, 2009 |
Investment Income | | |
Dividends | | $ 146,776 |
Interest | | 12 |
Income from Fidelity Central Funds | | 2,176 |
Total income | | 148,964 |
Expenses | | |
Management fee | $ 67,492 | |
Transfer agent fees | 22,220 | |
Distribution fees | 5,523 | |
Accounting and security lending fees | 4,680 | |
Custodian fees and expenses | 24,872 | |
Independent trustees' compensation | 83 | |
Audit | 47,164 | |
Legal | 72 | |
Miscellaneous | 1,022 | |
Total expenses before reductions | 173,128 | |
Expense reductions | (61,724) | 111,404 |
Net investment income (loss) | | 37,560 |
Realized and Unrealized Gain (Loss) Net realized gain (loss) on: | | |
Investment securities: | | |
Unaffiliated issuers | (948,330) | |
Foreign currency transactions | (678) | |
Total net realized gain (loss) | | (949,008) |
Change in net unrealized appreciation (depreciation) on: Investment securities | 5,507,187 | |
Assets and liabilities in foreign currencies | (49) | |
Total change in net unrealized appreciation (depreciation) | | 5,507,138 |
Net gain (loss) | | 4,558,130 |
Net increase (decrease) in net assets resulting from operations | | $ 4,595,690 |
Statement of Changes in Net Assets
| Year ended
December 31,
2009 | Year ended
December 31,
2008 |
Increase (Decrease) in Net Assets | | |
Operations | | |
Net investment income (loss) | $ 37,560 | $ 23,446 |
Net realized gain (loss) | (949,008) | (3,782,197) |
Change in net unrealized appreciation (depreciation) | 5,507,138 | (7,520,377) |
Net increase (decrease) in net assets resulting from operations | 4,595,690 | (11,279,128) |
Distributions to shareholders from net investment income | (44,030) | (17,221) |
Share transactions - net increase (decrease) | 385,195 | (9,270,016) |
Total increase (decrease) in net assets | 4,936,855 | (20,566,365) |
| | |
Net Assets | | |
Beginning of period | 9,987,960 | 30,554,325 |
End of period (including undistributed net investment income of $0 and $3,524, respectively) | $ 14,924,815 | $ 9,987,960 |
See accompanying notes which are an integral part of the financial statements.
Annual Report
Financial Highlights - Initial Class
Years ended December 31, | 2009 | 2008 | 2007 | 2006 | 2005 |
Selected Per-Share Data | | | | | |
Net asset value, beginning of period | $ 7.81 | $ 14.15 | $ 12.07 | $ 11.94 | $ 11.14 |
Income from Investment Operations | | | | | |
Net investment income (loss) C | .04 | .02 | - H | - H | .01 |
Net realized and unrealized gain (loss) | 3.46 | (6.34) | 2.74 | .13 | .83 |
Total from investment operations | 3.50 | (6.32) | 2.74 | .13 | .84 |
Distributions from net investment income | (.04) | (.02) | - | - H | (.01) |
Distributions from net realized gain | - | - | (.66) | - | (.04) |
Total distributions | (.04) | (.02) | (.66) | - H | (.04) I |
Net asset value, end of period | $ 11.27 | $ 7.81 | $ 14.15 | $ 12.07 | $ 11.94 |
Total Return A,B | 44.86% | (44.67)% | 22.67% | 1.12% | 7.57% |
Ratios to Average Net Assets D,G | | | | | |
Expenses before reductions | 1.35% | 1.16% | 1.10% | .98% | 1.01% |
Expenses net of fee waivers, if any | .85% | .85% | .85% | .86% | .85% |
Expenses net of all reductions | .84% | .85% | .84% | .86% | .81% |
Net investment income (loss) | .39% | .19% | -% F | .03% | .12% |
Supplemental Data | | | | | |
Net assets, end of period (000 omitted) | $ 5,374 | $ 3,368 | $ 13,752 | $ 7,414 | $ 22,750 |
Portfolio turnover rate E | 173% | 137% | 167% | 93% | 91% |
A Total returns do not reflect charges attributable to your insurance company's separate account. Inclusion of these charges would reduce the total returns shown.
B Total returns would have been lower had certain expenses not been reduced during the periods shown.
C Calculated based on average shares outstanding during the period.
D Fees and expenses of the underlying Fidelity Central Funds are not included in the Fund's expense ratio. The Fund indirectly bears its proportionate share of the expenses of any underlying Fidelity Central Funds.
E Amount does not include the portfolio activity of any underlying Fidelity Central Funds.
F Amount represents less than .01%.
G Expense ratios reflect operating expenses of the class. Expenses before reductions do not reflect amounts reimbursed by the investment adviser or reductions from brokerage service arrangements or reductions from other expense offset arrangements and do not represent the amount paid by the class during periods when reimbursements or reductions occur. Expenses net of fee waivers reflect expenses after reimbursement by the investment adviser but prior to reductions from brokerage service arrangements or other expense offset arrangements. Expenses net of all reductions represent the net expenses paid by the class.
H Amount represents less than $.01 per share.
I Total distributions of $.040 per share is comprised of distributions from net investment income of $.005 and distributions from net realized gain of $.035 per share.
Financial Highlights - Service Class
Years ended December 31, | 2009 | 2008 | 2007 | 2006 | 2005 |
Selected Per-Share Data | | | | | |
Net asset value, beginning of period | $ 7.78 | $ 14.08 | $ 12.02 | $ 11.90 | $ 11.12 |
Income from Investment Operations | | | | | |
Net investment income (loss) C | .03 | .01 | (.01) | (.01) | - H |
Net realized and unrealized gain (loss) | 3.44 | (6.30) | 2.73 | .13 | .82 |
Total from investment operations | 3.47 | (6.29) | 2.72 | .12 | .82 |
Distributions from net investment income | (.03) | (.01) | - | - | (.01) |
Distributions from net realized gain | - | - | (.66) | - | (.04) |
Total distributions | (.03) | (.01) | (.66) | - | (.04) I |
Net asset value, end of period | $ 11.22 | $ 7.78 | $ 14.08 | $ 12.02 | $ 11.90 |
Total Return A,B | 44.61% | (44.71)% | 22.60% | 1.01% | 7.41% |
Ratios to Average Net Assets D,G | | | | | |
Expenses before reductions | 1.42% | 1.22% | 1.17% | 1.16% | 1.36% |
Expenses net of fee waivers, if any | .95% | .95% | .95% | .96% | .97% |
Expenses net of all reductions | .94% | .95% | .95% | .95% | .92% |
Net investment income (loss) | .30% | .09% | (.10)% | (.07)% | -% F |
Supplemental Data | | | | | |
Net assets, end of period (000 omitted) | $ 823 | $ 1,021 | $ 2,545 | $ 2,077 | $ 2,056 |
Portfolio turnover rate E | 173% | 137% | 167% | 93% | 91% |
A Total returns do not reflect charges attributable to your insurance company's separate account. Inclusion of these charges would reduce the total returns shown.
B Total returns would have been lower had certain expenses not been reduced during the periods shown.
C Calculated based on average shares outstanding during the period.
D Fees and expenses of the underlying Fidelity Central Funds are not included in the Fund's expense ratio. The Fund indirectly bears its proportionate share of the expenses of any underlying Fidelity Central Funds.
E Amount does not include the portfolio activity of any underlying Fidelity Central Funds.
F Amount represents less than .01%.
G Expense ratios reflect operating expenses of the class. Expenses before reductions do not reflect amounts reimbursed by the investment adviser or reductions from brokerage service arrangements or reductions from other expense offset arrangements and do not represent the amount paid by the class during periods when reimbursements or reductions occur. Expenses net of fee waivers reflect expenses after reimbursement by the investment adviser but prior to reductions from brokerage service arrangements or other expense offset arrangements. Expenses net of all reductions represent the net expenses paid by the class.
H Amount represents less than $.01 per share.
I Total distributions of $.040 per share is comprised of distributions from net investment income of $.005 and distributions from net realized gain of $.035 per share.
See accompanying notes which are an integral part of the financial statements.
Annual Report
Financial Highlights - Service Class 2
Years ended December 31, | 2009 | 2008 | 2007 | 2006 | 2005 |
Selected Per-Share Data | | | | | |
Net asset value, beginning of period | $ 7.71 | $ 13.96 | $ 11.95 | $ 11.84 | $ 11.08 |
Income from Investment Operations | | | | | |
Net investment income (loss) C | .01 | (.01) | (.03) | (.03) | (.02) |
Net realized and unrealized gain (loss) | 3.42 | (6.24) | 2.70 | .14 | .82 |
Total from investment operations | 3.43 | (6.25) | 2.67 | .11 | .80 |
Distributions from net investment income | (.01) | - | - | - | (.01) |
Distributions from net realized gain | - | - | (.66) | - | (.04) |
Total distributions | (.01) | - | (.66) | - | (.04) G |
Net asset value, end of period | $ 11.13 | $ 7.71 | $ 13.96 | $ 11.95 | $ 11.84 |
Total Return A,B | 44.42% | (44.77)% | 22.31% | .93% | 7.25% |
Ratios to Average Net Assets D,F | | | | | |
Expenses before reductions | 1.67% | 1.42% | 1.38% | 1.35% | 1.51% |
Expenses net of fee waivers, if any | 1.10% | 1.10% | 1.10% | 1.11% | 1.12% |
Expenses net of all reductions | 1.09% | 1.10% | 1.09% | 1.10% | 1.07% |
Net investment income (loss) | .15% | (.06)% | (.25)% | (.22)% | (.15)% |
Supplemental Data | | | | | |
Net assets, end of period (000 omitted) | $ 1,684 | $ 2,183 | $ 5,116 | $ 3,220 | $ 2,729 |
Portfolio turnover rate E | 173% | 137% | 167% | 93% | 91% |
A Total returns do not reflect charges attributable to your insurance company's separate account. Inclusion of these charges would reduce the total returns shown.
B Total returns would have been lower had certain expenses not been reduced during the periods shown.
C Calculated based on average shares outstanding during the period.
D Fees and expenses of the underlying Fidelity Central Funds are not included in the Fund's expense ratio. The Fund indirectly bears its proportionate share of the expenses of any underlying Fidelity Central Funds.
E Amount does not include the portfolio activity of any underlying Fidelity Central Funds.
F Expense ratios reflect operating expenses of the class. Expenses before reductions do not reflect amounts reimbursed by the investment adviser or reductions from brokerage service arrangements or reductions from other expense offset arrangements and do not represent the amount paid by the class during periods when reimbursements or reductions occur. Expenses net of fee waivers reflect expenses after reimbursement by the investment adviser but prior to reductions from brokerage service arrangements or other expense offset arrangements. Expenses net of all reductions represent the net expenses paid by the class.
G Total distributions of $.040 per share is comprised of distributions from net investment income of $.005 and distributions from net realized gain of $.035 per share.
Financial Highlights - Investor Class
Years ended December 31, | 2009 | 2008 | 2007 | 2006 | 2005 H |
Selected Per-Share Data | | | | | |
Net asset value, beginning of period | $ 7.78 | $ 14.10 | $ 12.05 | $ 11.94 | $ 11.64 |
Income from Investment Operations | | | | | |
Net investment income (loss) E | .03 | .01 | (.02) | (.01) | - J |
Net realized and unrealized gain (loss) | 3.44 | (6.31) | 2.73 | .12 | .30 |
Total from investment operations | 3.47 | (6.30) | 2.71 | .11 | .30 |
Distributions from net investment income | (.04) | (.02) | - | - J | - |
Distributions from net realized gain | - | - | (.66) | - | - |
Total distributions | (.04) | (.02) | (.66) | - J | - |
Net asset value, end of period | $ 11.21 | $ 7.78 | $ 14.10 | $ 12.05 | $ 11.94 |
Total Return B,C,D | 44.64% | (44.69)% | 22.45% | .95% | 2.58% |
Ratios to Average Net Assets F,I | | | | | |
Expenses before reductions | 1.43% | 1.25% | 1.22% | 1.21% | 1.16% A |
Expenses net of fee waivers, if any | .93% | .93% | 1.00% | 1.01% | 1.00% A |
Expenses net of all reductions | .93% | .93% | .99% | 1.01% | .96% A |
Net investment income (loss) | .31% | .11% | (.15)% | (.12)% | (.03)% A |
Supplemental Data | | | | | |
Net assets, end of period (000 omitted) | $ 7,044 | $ 3,416 | $ 9,142 | $ 3,849 | $ 2,209 |
Portfolio turnover rate G | 173% | 137% | 167% | 93% | 91% |
A Annualized
B Total returns for periods of less than one year are not annualized.
C Total returns do not reflect charges attributable to your insurance company's separate account. Inclusion of these charges would reduce the total returns shown.
D Total returns would have been lower had certain expenses not been reduced during the periods shown.
E Calculated based on average shares outstanding during the period.
F Fees and expenses of the underlying Fidelity Central Funds are not included in the Fund's expense ratio. The Fund indirectly bears its proportionate share of the expenses of any underlying Fidelity Central Funds.
G Amount does not include the portfolio activity of any underlying Fidelity Central Funds.
H For the period July 21, 2005 (commencement of sale of shares) to December 31, 2005.
I Expense ratios reflect operating expenses of the class. Expenses before reductions do not reflect amounts reimbursed by the investment adviser or reductions from brokerage service arrangements or reductions from other expense offset arrangements and do not represent the amount paid by the class during periods when reimbursements or reductions occur. Expense ratios before reductions for start-up periods may not be representative of longer-term operating periods. Expenses net of fee waivers reflect expenses after reimbursement by the investment adviser but prior to reductions from brokerage service arrangements or other expense offset arrangements. Expenses net of all reductions represent the net expenses paid by the class.
J Amount represents less than $.01 per share.
See accompanying notes which are an integral part of the financial statements.
Annual Report
Notes to Financial Statements
For the period ended December 31, 2009
1. Organization.
VIP Growth Stock Portfolio (the Fund) is a fund of Variable Insurance Products Fund IV (the trust) and is authorized to issue an unlimited number of shares. The trust is registered under the Investment Company Act of 1940, as amended (the 1940 Act), as an open-end management investment company organized as a Massachusetts business trust. Shares of the Fund may only be purchased by insurance companies for the purpose of funding variable annuity or variable life insurance contracts. The Fund offers the following classes of shares: Initial Class shares, Service Class shares, Service Class 2 shares and Investor Class shares. All classes have equal rights and voting privileges, except for matters affecting a single class. Investment income, realized and unrealized capital gains and losses, the common expenses of the Fund, and certain fund-level expense reductions, if any, are allocated on a pro-rata basis to each class based on the relative net assets of each class to the total net assets of the Fund. Each class differs with respect to transfer agent and distribution and service plan fees incurred. Certain expense reductions also differ by class.
2. Investments in Fidelity Central Funds.
The Fund may invest in Fidelity Central Funds, which are open-end investment companies available only to other investment companies and accounts managed by Fidelity Management & Research Company (FMR) and its affiliates. The Fund's Schedule of Investments lists each of the Fidelity Central Funds held as of period end, if any, as an investment of the Fund, but does not include the underlying holdings of each Fidelity Central Fund. As an Investing Fund, the Fund indirectly bears its proportionate share of the expenses of the underlying Fidelity Central Funds.
The Money Market Central Funds seek preservation of capital and current income and are managed by Fidelity Investments Money Management, Inc. (FIMM), an affiliate of FMR.
A complete unaudited list of holdings for each Fidelity Central Fund is available upon request or at the Securities and Exchange Commission (the SEC) web site at www.sec.gov. In addition, the financial statements of the Fidelity Central Funds, which are not covered by the Fund's Report of Independent Registered Public Accounting Firm, are available on the SEC web site or upon request.
3. Significant Accounting Policies.
The financial statements have been prepared in conformity with accounting principles generally accepted in the United States of America, which require management to make certain estimates and assumptions at the date of the financial statements. Actual results could differ from those estimates. Events or transactions occurring after period end through the date that the financial statements were issued, February 12, 2010, have been evaluated in the preparation of the financial statements. The following summarizes the significant accounting policies of the Fund:
Security Valuation. Investments are valued as of 4:00 p.m. Eastern time on the last calendar day of the period. The Fund uses independent pricing services approved by the Board of Trustees to value its investments. When current market prices or quotations are not readily available or reliable, valuations may be determined in good faith in accordance with procedures adopted by the Board of Trustees. Factors used in determining value may include significant market or security specific events. The frequency with which these procedures are used cannot be predicted and may be utilized to a significant extent. The value used for net asset value (NAV) calculation under these procedures may differ from published prices for the same securities.
The Fund categorizes the inputs to valuation techniques used to value its investments into a disclosure hierarchy consisting of three levels as shown below.
Level 1 - quoted prices in active markets for identical investments
Level 2 - other significant observable inputs (including quoted prices for similar investments, interest rates, prepayment speeds, etc.)
Level 3 - unobservable inputs (including the fund's own assumptions based on the best information available)
Changes in valuation techniques may result in transfers in or out of an assigned level within the disclosure hierarchy. The aggregate value of investments by input level, as of December 31, 2009, as well as a roll forward of Level 3 securities, is included at the end of the Fund's Schedule of Investments. Valuation techniques used to value the Fund's investments by major category are as follows.
Equity securities, including restricted securities, for which market quotations are readily available, are valued at the last reported sale price or official closing price as reported by an independent pricing service on the primary market or exchange on which they are traded and are categorized as level 1 in the hierarchy. In the event there were no sales during the day or closing prices are not available, securities are valued at the last quoted bid price or may be valued using the last available price and categorized as Level 2 in the hierarchy. For foreign equity securities, when significant market or security events arise, comparisons to the valuation of American Depository Receipts (ADRs), futures contracts, exchange-traded funds (ETFs) and certain indexes as well as quoted prices for similar securities are used and are categorized as Level 2 in the hierarchy in these circumstances. For restricted securities and private placements where observable inputs are limited, assumptions about market activity and risk are used and are categorized as level 3 in the hierarchy.
Annual Report
Notes to Financial Statements - continued
3. Significant Accounting Policies - continued
Security Valuation - continued
Investments in open-end mutual funds including the Fidelity Money Market Central Funds are valued at their closing net asset value each business day and are categorized as Level 1 in the hierarchy. Short-term securities with remaining maturities of sixty days or less for which quotations are not readily available are valued at amortized cost, which approximates value and are categorized as level 2 in the hierarchy.
Foreign Currency. The Fund uses foreign currency contracts to facilitate transactions in foreign-denominated securities. Losses from these transactions may arise from changes in the value of the foreign currency or if the counterparties do not perform under the contracts' terms.
Foreign-denominated assets, including investment securities, and liabilities are translated into U.S. dollars at the exchange rate at period end. Purchases and sales of investment securities, income and dividends received and expenses denominated in foreign currencies are translated into U.S. dollars at the exchange rate in effect on the transaction date.
The effects of exchange rate fluctuations on investments are included with the net realized and unrealized gain (loss) on investment securities. Other foreign currency transactions resulting in realized and unrealized gain (loss) are disclosed separately.
Investment Transactions and Income. For financial reporting purposes, the Fund's investment holdings and NAV include trades executed through the end of the last business day of the period. The NAV per share for processing shareholder transactions is calculated as of the close of business of the New York Stock Exchange (NYSE), normally 4:00 p.m. Eastern time and includes trades executed through the end of the prior business day. Gains and losses on securities sold are determined on the basis of identified cost and may include proceeds received from litigation. Dividend income is recorded on the ex-dividend date, except for certain dividends from foreign securities where the ex-dividend date may have passed, which are recorded as soon as the Fund is informed of the ex-dividend date. Non-cash dividends included in dividend income, if any, are recorded at the fair market value of the securities received. Distributions received on securities that represent a return of capital or capital gain are recorded as a reduction of cost of investments and/or as a realized gain. The Fund estimates the components of distributions received that may be considered return of capital distributions or capital gain distributions. Interest income and distributions from the Fidelity Central Funds are accrued as earned. Interest income includes coupon interest and amortization of premium and accretion of discount on debt securities. Investment income is recorded net of foreign taxes withheld where recovery of such taxes is uncertain.
Expenses. Most expenses of the trust can be directly attributed to a fund. Expenses which cannot be directly attributed are apportioned among each Fund in the trust. Expense estimates are accrued in the period to which they relate and adjustments are made when actual amounts are known.
Income Tax Information and Distributions to Shareholders. Each year, the Fund intends to qualify as a regulated investment company by distributing substantially all of its taxable income and realized gains under Subchapter M of the Internal Revenue Code and filing its U.S. federal tax return. As a result, no provision for income taxes is required. As of December 31, 2009, the Fund did not have any unrecognized tax benefits in the accompanying financial statements. A Fund's federal tax return is subject to examination by the Internal Revenue Service (IRS) for a period of three years. Foreign taxes are provided for based on the Fund's understanding of the tax rules and rates that exist in the foreign markets in which it invests.
Distributions are recorded on the ex-dividend date. Income dividends and capital gain distributions are declared separately for each class. Income and capital gain distributions are determined in accordance with income tax regulations, which may differ from generally accepted accounting principles.
Capital accounts within the financial statements are adjusted for permanent book-tax differences. These adjustments have no impact on net assets or the results of operations. Temporary book-tax differences will reverse in a subsequent period.
Book-tax differences are primarily due to the short-term gain distributions from the Fidelity Central Funds, foreign currency transactions, certain foreign taxes, capital loss carryforwards and losses deferred due to wash sales and excise tax regulations.
The federal tax cost of investment securities and unrealized appreciation (depreciation) as of period end were as follows:
Gross unrealized appreciation | $ 2,056,138 |
Gross unrealized depreciation | (479,199) |
Net unrealized appreciation (depreciation) | $ 1,576,939 |
| |
Tax Cost | $ 13,688,730 |
The tax-based components of distributable earnings as of period end were as follows:
Capital loss carryforward | $ (4,641,736) |
Net unrealized appreciation (depreciation) | $ 1,576,878 |
Annual Report
3. Significant Accounting Policies - continued
Income Tax Information and Distributions to Shareholders - continued
The tax character of distributions paid was as follows:
| December 31, 2009 | December 31, 2008 |
Ordinary Income | $ 44,030 | $ 17,221 |
4. Purchases and Sales of Investments.
Purchases and sales of securities, other than short-term securities, aggregated $20,344,345 and $20,527,884, respectively.
5. Fees and Other Transactions with Affiliates.
Management Fee. FMR and its affiliates provide the Fund with investment management related services for which the Fund pays a monthly management fee. The management fee is the sum of an individual fund fee rate that is based on an annual rate of .30% of the Fund's average net assets and a group fee rate that averaged .26% during the period. The group fee rate is based upon the average net assets of all the mutual funds advised by FMR. The group fee rate decreases as assets under management increase and increases as assets under management decrease. For the period, the total annual management fee rate was .56% of the Fund's average net assets.
Distribution and Service Plan. In accordance with Rule 12b-1 of the 1940 Act, the Fund has adopted separate 12b-1 Plans for each Service Class of shares. Each Service Class pays Fidelity Distributors Corporation (FDC), an affiliate of FMR, a service fee. For the period, the service fee is based on an annual rate of .10% of Service Class' average net assets and .25% of Service Class 2's average net assets.
For the period, each class paid FDC the following amounts, all of which were re-allowed to insurance companies for the distribution of shares and providing shareholder support services:
Service Class | $ 891 |
Service Class 2 | 4,632 |
| $ 5,523 |
Transfer Agent Fees. Fidelity Investments Institutional Operations Company, Inc. (FIIOC), an affiliate of FMR, is the Fund's transfer, dividend disbursing, and shareholder servicing agent. FIIOC receives an asset-based fee with respect to each class. Each class (with the exception of Investor Class) pays a transfer agent fee, excluding out of pocket expenses, equal to an annual rate of .07% of average net assets. Investor Class pays a monthly asset-based transfer agent fee of .15% of average net assets. The total transfer agent fees paid by each class to FIIOC, including out of pocket expenses, were as follows:
Initial Class | $ 6,012 |
Service Class | 808 |
Service Class 2 | 3,498 |
Investor Class | 11,902 |
| $ 22,220 |
Accounting and Security Lending Fees. Fidelity Service Company, Inc. (FSC), an affiliate of FMR, maintains the Fund's accounting records. The accounting fee is based on the level of average net assets for the month. Under a separate contract, FSC administers the security lending program. The security lending fee is based on the number and duration of lending transactions.
Brokerage Commissions. The Fund placed a portion of its portfolio transactions with brokerage firms which are affiliates of the investment adviser. The commissions paid to these affiliated firms were $992 for the period.
6. Committed Line of Credit.
The Fund participates with other funds managed by FMR in a $3.5 billion credit facility (the "line of credit") to be utilized for temporary or emergency purposes to fund shareholder redemptions or for other short-term liquidity purposes. The Fund has agreed to pay commitment fees on its pro-rata portion of the line of credit, which amounted to $60 and is reflected in Miscellaneous Expense on the Statement of Operations. During the period, there were no borrowings on this line of credit.
Annual Report
Notes to Financial Statements - continued
7. Security Lending.
The Fund lends portfolio securities from time to time in order to earn additional income. On the settlement date of the loan, the Fund receives collateral (in the form of U.S. Treasury obligations, letters of credit and/or cash) against the loaned securities and maintains collateral in an amount not less than 100% of the market value of the loaned securities during the period of the loan. The market value of the loaned securities is determined at the close of business of the Fund and any additional required collateral is delivered to the Fund on the next business day. If the borrower defaults on its obligation to return the securities loaned because of insolvency or other reasons, a fund could experience delays and costs in recovering the securities loaned or in gaining access to the collateral. Any cash collateral received is invested in the Fidelity Securities Lending Cash Central Fund. The value of loaned securities and cash collateral at period end are disclosed on the Fund's Statement of Assets and Liabilities. Security lending income represents the income earned on investing cash collateral, less fees and expenses associated with the loan, plus any premium payments that may be received on the loan of certain types of securities. Security lending income is presented in the Statement of Operations as a component of income from Fidelity Central Funds. Net income from lending portfolio securities during the period amounted to $1,220.
8. Expense Reductions.
FMR voluntarily agreed to reimburse each class to the extent annual operating expenses exceeded certain levels of average net assets as noted in the table below. Some expenses, for example interest expense, including commitment fees, are excluded from this reimbursement.
The following classes were in reimbursement during the period:
| Expense
Limitations | Reimbursement
from adviser |
| | |
Initial Class | .85% | $ 20,636 |
Service Class | .95% | 4,182 |
Service Class 2 | 1.10% | 10,560 |
Investor Class | .93% | 25,747 |
| | $ 61,125 |
Many of the brokers with whom FMR places trades on behalf of the Fund provided services to the Fund in addition to trade execution. These services included payments of certain expenses on behalf of the Fund totaling $599 for the period.
9. Distributions to Shareholders.
Distributions to shareholders of each class were as follows:
Years ended December 31, | 2009 | 2008 |
From net investment income | | |
Initial Class | $ 17,544 | $ 8,154 |
Service Class | 2,306 | 656 |
Service Class 2 | 753 | - |
Investor Class | 23,427 | 8,411 |
Total | $ 44,030 | $ 17,221 |
Annual Report
10. Share Transactions.
Transactions for each class of shares were as follows:
| Shares | Dollars |
Years ended December 31, | 2009 | 2008 | 2009 | 2008 |
Initial Class | | | | |
Shares sold | 340,858 | 180,482 | $ 3,163,323 | $ 2,074,455 |
Reinvestment of distributions | 1,690 | 1,060 | 17,544 | 8,154 |
Shares redeemed | (296,785) | (722,244) | (2,715,001) | (8,341,769) |
Net increase (decrease) | 45,763 | (540,702) | $ 465,866 | $ (6,259,160) |
Service Class | | | | |
Shares sold | - | - | $ - | $ - |
Reinvestment of distributions | 236 | 86 | 2,306 | 656 |
Shares redeemed | (58,153) | (49,669) | (518,410) | (519,049) |
Net increase (decrease) | (57,917) | (49,583) | $ (516,104) | $ (518,393) |
Service Class 2 | | | | |
Shares sold | 33,227 | 79,695 | $ 276,521 | $ 920,792 |
Reinvestment of distributions | 69 | - | 753 | - |
Shares redeemed | (165,102) | (162,963) | (1,439,354) | (1,660,933) |
Net increase (decrease) | (131,806) | (83,268) | $ (1,162,080) | $ (740,141) |
Investor Class | | | | |
Shares sold | 557,764 | 281,169 | $ 5,149,675 | $ 3,422,986 |
Reinvestment of distributions | 2,257 | 1,099 | 23,427 | 8,411 |
Shares redeemed | (370,786) | (491,415) | (3,575,589) | (5,183,719) |
Net increase (decrease) | 189,235 | (209,147) | $ 1,597,513 | $ (1,752,322) |
11. Other.
The Fund's organizational documents provide former and current trustees and officers with a limited indemnification against liabilities arising in connection with the performance of their duties to the Fund. In the normal course of business, the Fund may also enter into contracts that provide general indemnifications. The Fund's maximum exposure under these arrangements is unknown as this would be dependent on future claims that may be made against the Fund. The risk of material loss from such claims is considered remote.
At the end of the period, FMR or its affiliates were the owners of record of 88% of the total outstanding shares of the Fund and one otherwise unaffiliated shareholder was the owner of record of 11% of the total outstanding shares of the Fund.
Annual Report
Report of Independent Registered Public Accounting Firm
To the Trustees of Variable Insurance Products Fund IV and the Shareholders of VIP Growth Stock Portfolio:
In our opinion, the accompanying statement of assets and liabilities, including the schedule of investments, and the related statements of operations and of changes in net assets and the financial highlights present fairly, in all material respects, the financial position of VIP Growth Stock Portfolio (a fund of Variable Insurance Products Fund IV) at December 31, 2009, the results of its operations for the year then ended, the changes in its net assets for each of the two years in the period then ended and the financial highlights for each of the periods indicated, in conformity with accounting principles generally accepted in the United States of America. These financial statements and financial highlights (hereafter referred to as "financial statements") are the responsibility of the VIP Growth Stock Portfolio's management. Our responsibility is to express an opinion on these financial statements based on our audits. We conducted our audits of these financial statements in accordance with the standards of the Public Company Accounting Oversight Board (United States). Those standards require that we plan and perform the audit to obtain reasonable assurance about whether the financial statements are free of material misstatement. An audit includes examining, on a test basis, evidence supporting the amounts and disclosures in the financial statements, assessing the accounting principles used and significant estimates made by management, and evaluating the overall financial statement presentation. We believe that our audits, which included confirmation of securities at December 31, 2009 by correspondence with the custodian and brokers, provide a reasonable basis for our opinion.
/s/ PricewaterhouseCoopers LLP
PricewaterhouseCoopers LLP
Boston, Massachusetts
February 12, 2010
Annual Report
The Trustees, Member of the Advisory Board, and executive officers of the trust and fund, as applicable, are listed below. The Board of Trustees governs the fund and is responsible for protecting the interests of shareholders. The Trustees are experienced executives who meet periodically throughout the year to oversee the fund's activities, review contractual arrangements with companies that provide services to the fund, and review the fund's performance. Except for James C. Curvey, each of the Trustees oversees 222 funds advised by FMR or an affiliate. Mr. Curvey oversees 410 funds advised by FMR or an affiliate.
The Trustees hold office without limit in time except that (a) any Trustee may resign; (b) any Trustee may be removed by written instrument, signed by at least two-thirds of the number of Trustees prior to such removal; (c) any Trustee who requests to be retired or who has become incapacitated by illness or injury may be retired by written instrument signed by a majority of the other Trustees; and (d) any Trustee may be removed at any special meeting of shareholders by a two-thirds vote of the outstanding voting securities of the trust. Each Trustee who is not an interested person (as defined in the 1940 Act) (Independent Trustee), shall retire not later than the last day of the calendar year in which his or her 72nd birthday occurs. The Independent Trustees may waive this mandatory retirement age policy with respect to individual Trustees. The executive officers and Advisory Board Member hold office without limit in time, except that any officer and Advisory Board Member may resign or may be removed by a vote of a majority of the Trustees at any regular meeting or any special meeting of the Trustees. Except as indicated, each individual has held the office shown or other offices in the same company for the past five years.
The fund's Statement of Additional Information (SAI) includes more information about the Trustees. To request a free copy, call Fidelity at 1-877-208-0098.
Interested Trustees*:
Correspondence intended for each Trustee who is an interested person may be sent to Fidelity Investments, 82 Devonshire Street, Boston, Massachusetts 02109.
Name, Age; Principal Occupation |
Edward C. Johnson 3d (79) |
| Year of Election or Appointment: 1983 Mr. Johnson is Trustee and Chairman of the Board of Trustees of certain Trusts. Mr. Johnson serves as Chief Executive Officer, Chairman, and a Director of FMR LLC; Chairman and a Director of FMR; Chairman and a Director of Fidelity Research & Analysis Company (FRAC); Chairman and a Director of Fidelity Investments Money Management, Inc.; and Chairman and a Director of FMR Co., Inc. In addition, Mr. Johnson serves as Chairman and Director of FIL Limited. Previously, Mr. Johnson served as President of FMR LLC (2006-2007). |
James C. Curvey (74) |
| Year of Election or Appointment: 2007 Mr. Curvey also serves as Trustee (2007-present) of other investment companies advised by FMR. Mr. Curvey is a Director of FMR and FMR Co., Inc. (2007-present). Mr. Curvey is also Vice Chairman (2006-present) and Director of FMR LLC. In addition, Mr. Curvey serves as an Overseer for the Boston Symphony Orchestra and a member of the Trustees of Villanova University. |
* Trustees have been determined to be "Interested Trustees" by virtue of, among other things, their affiliation with the trust or various entities under common control with FMR.
Independent Trustees:
Correspondence intended for each Independent Trustee (that is, the Trustees other than the Interested Trustees) may be sent to Fidelity Investments, P.O. Box 55235, Boston, Massachusetts 02205-5235.
Name, Age; Principal Occupation |
Dennis J. Dirks (61) |
| Year of Election or Appointment: 2005 Prior to his retirement in May 2003, Mr. Dirks was Chief Operating Officer and a member of the Board of The Depository Trust & Clearing Corporation (DTCC). He also served as President, Chief Operating Officer, and Board member of The Depository Trust Company (DTC) and President and Board member of the National Securities Clearing Corporation (NSCC). In addition, Mr. Dirks served as Chief Executive Officer and Board member of the Government Securities Clearing Corporation, Chief Executive Officer and Board member of the Mortgage-Backed Securities Clearing Corporation, as a Trustee and a member of the Finance Committee of Manhattan College (2005-2008), and as a Trustee and a member of the Finance Committee of AHRC of Nassau County (2006-2008). Currently, Mr. Dirks serves as a member of the Board of Directors for The Brookville Center for Children's Services, Inc. (2009-present). |
Alan J. Lacy (56) |
| Year of Election or Appointment: 2008 Mr. Lacy serves as Senior Adviser (2007-present) of Oak Hill Capital Partners, L.P. (private equity). Mr. Lacy also served as Chief Executive Officer (2000-2005) and Vice Chairman (2005-2006) of Sears Holdings Corporation and Sears, Roebuck and Co. (retail). In addition, Mr. Lacy serves as a member of the Board of Directors of The Western Union Company (global money transfer, 2006-present) and Bristol-Myers Squibb Company (global pharmaceuticals, 2007-present). Mr. Lacy is Chairman (2008-present) and a member (2006-present) of the Board of Trustees of The National Parks Conservation Association. |
Ned C. Lautenbach (65) |
| Year of Election or Appointment: 2000 Mr. Lautenbach is Chairman of the Independent Trustees of the Equity and High Income Funds (2006-present). Mr. Lautenbach is an Advisory Partner of Clayton, Dubilier & Rice, Inc. (private equity investment). Previously, Mr. Lautenbach was with the International Business Machines Corporation (IBM) from 1968 until his retirement in 1998. Mr. Lautenbach serves as a Director of Eaton Corporation (diversified industrial) as well as the Philharmonic Center for the Arts in Naples, Florida. Mr. Lautenbach is also a member of the Board of Trustees of Fairfield University (2005-present), as well as a member of the Council on Foreign Relations. Previously, Mr. Lautenbach served as a Director of Sony Corporation (2006-2007). |
Joseph Mauriello (65) |
| Year of Election or Appointment: 2008 Prior to his retirement in January 2006, Mr. Mauriello served in numerous senior management positions including Deputy Chairman and Chief Operating Officer (2004-2005), and Vice Chairman of Financial Services (2002-2004) of KPMG LLP US (professional services, 1965-2005). Mr. Mauriello currently serves as a member of the Board of Directors of XL Capital Ltd. (global insurance and re-insurance, 2006-present) and of Arcadia Resources Inc. (health care services and products, 2007-present). Previously, Mr. Mauriello served as a Director of the Hamilton Funds of the Bank of New York (2006-2007). |
Cornelia M. Small (65) |
| Year of Election or Appointment: 2005 Ms. Small is a member of the Board of Directors of the Teagle Foundation (2009-present). Ms. Small is also a member of the Investment Committee, and Chair (2008-present) and a member of the Board of Trustees of Smith College. In addition, Ms. Small serves on the Investment Committee of the Berkshire Taconic Community Foundation (2008-present). Previously, Ms. Small served as Chairperson of the Investment Committee (2002-2008) of Smith College. In addition, Ms. Small served as Chief Investment Officer, Director of Global Equity Investments, and a member of the Board of Directors of Scudder, Stevens & Clark and Scudder Kemper Investments. |
William S. Stavropoulos (70) |
| Year of Election or Appointment: 2001 Mr. Stavropoulos serves as President and Founder of the Michigan Baseball Foundation, the Great Lakes Loons (2007-present). Mr. Stavropoulos is Chairman Emeritus of the Board of Directors of The Dow Chemical Company, where he previously served in numerous senior management positions, including President, CEO (1995-2000; 2002-2004), Chairman of the Executive Committee (2000-2006), and as a member of the Board of Directors (1990-2006). Currently, Mr. Stavropoulos is a Director of Teradata Corporation (data warehousing and technology solutions, 2008-present), Chemical Financial Corporation, Maersk Inc. (industrial conglomerate), Tyco International, Inc. (multinational manufacturing and services, 2007-present), and a member of the Advisory Board for Metalmark Capital (private equity investment, 2005-present). Mr. Stavropoulos is a special advisor to Clayton, Dubilier & Rice, Inc. (private equity investment). In addition, Mr. Stavropoulos is a member of the University of Notre Dame Advisory Council for the College of Science. |
David M. Thomas (60) |
| Year of Election or Appointment: 2008 Previously, Mr. Thomas served as Executive Chairman (2005-2006) and Chairman and Chief Executive Officer (2000-2005) of IMS Health, Inc. (pharmaceutical and healthcare information solutions). In addition, Mr. Thomas serves as a member of the Board of Directors of Fortune Brands, Inc. (consumer products), and Interpublic Group of Companies, Inc. (marketing communication, 2004-present). |
Michael E. Wiley (59) |
| Year of Election or Appointment: 2008 Mr. Wiley also serves as a Director of Asia Pacific Exploration Consolidated (international oil and gas exploration and production, 2008-present), and as a member of the Board of Trustees of the University of Tulsa (2000-2006; 2007-present). Mr. Wiley serves as a Director of Tesoro Corporation (independent oil refiner and marketer, 2005-present), and a Director of Bill Barrett Corporation (exploration and production, 2005-present). In addition, Mr. Wiley also serves as a Director of Post Oak Bank (privately-held bank, 2004-present). Previously, Mr. Wiley served as a Sr. Energy Advisor of Katzenbach Partners, LLC (consulting, 2006-2007), as an Advisory Director of Riverstone Holdings (private investment), Chairman, President, and CEO of Baker Hughes, Inc. (oilfield services, 2000-2004), and as Director of Spinnaker Exploration Company (exploration and production, 2001-2005). |
Annual Report
Trustees and Officers - continued
Advisory Board Member and Executive Officers:
Correspondence intended for each executive officer and Peter S. Lynch may be sent to Fidelity Investments, 82 Devonshire Street, Boston, Massachusetts 02109.
Name, Age; Principal Occupation |
Peter S. Lynch (65) |
| Year of Election or Appointment: 2003 Member of the Advisory Board of Fidelity's Equity and High Income Funds. Mr. Lynch is Vice Chairman and a Director of FMR and FMR Co., Inc. In addition, Mr. Lynch serves as a Trustee of Boston College and as the Chairman of the Inner-City Scholarship Fund. Previously, Mr. Lynch served on the Special Olympics International Board of Directors (1997-2006). |
Kenneth B. Robins (40) |
| Year of Election or Appointment: 2008 President and Treasurer of Fidelity's Equity and High Income Funds. Mr. Robins also serves as Assistant Treasurer of other Fidelity funds (2009-present) and is an employee of Fidelity Investments (2004-present). Before joining Fidelity Investments, Mr. Robins worked at KPMG LLP, where he was a partner in KPMG's department of professional practice (2002-2004). |
Bruce T. Herring (44) |
| Year of Election or Appointment: 2006 Vice President of certain Equity Funds. Mr. Herring also serves as Group Chief Investments Officer of FMR. Previously, Mr. Herring served as a portfolio manager for Fidelity U.S. Equity Funds. |
Brian B. Hogan (45) |
| Year of Election or Appointment: 2009 Vice President of certain Equity Funds and Vice President of Sector Funds. Mr. Hogan also serves as Senior Vice President, Equity Research of FMR (2006-present) and President of FMR's Equity Division (2009-present). Previously, Mr. Hogan served as a portfolio manager. |
Scott C. Goebel (41) |
| Year of Election or Appointment: 2008 Secretary and Chief Legal Officer (CLO) of the Fidelity funds. Mr. Goebel also serves as General Counsel, Secretary, and Senior Vice President of FMR (2008-present) and FMR Co., Inc. (2008-present); Deputy General Counsel of FMR LLC; Chief Legal Officer of Fidelity Management & Research (Hong Kong) Limited (2008-present) and Assistant Secretary of Fidelity Management & Research (Japan) Inc. (2008-present), Fidelity Investments Money Management, Inc. (2008-present), Fidelity Management & Research (U.K.) Inc. (2008-present), and Fidelity Research and Analysis Company (2008-present). Previously, Mr. Goebel served as Assistant Secretary of the Funds (2007-2008) and as Vice President and Secretary of Fidelity Distributors Corporation (FDC) (2005-2007). |
William C. Coffey (40) |
| Year of Election or Appointment: 2009 Assistant Secretary of Fidelity's Equity and High Income Funds. Mr. Coffey also serves as Vice President and Associate General Counsel of FMR LLC (2005-present), and is an employee of Fidelity Investments. |
Holly C. Laurent (55) |
| Year of Election or Appointment: 2008 Anti-Money Laundering (AML) Officer of the Fidelity funds. Ms. Laurent is an employee of Fidelity Investments. Previously, Ms. Laurent was Senior Vice President and Head of Legal for Fidelity Business Services India Pvt. Ltd. (2006-2008), and Senior Vice President, Deputy General Counsel and Group Head for FMR LLC (2005-2006). |
Christine Reynolds (51) |
| Year of Election or Appointment: 2008 Chief Financial Officer of the Fidelity funds. Ms. Reynolds became President of Fidelity Pricing and Cash Management Services (FPCMS) in August 2008. Ms. Reynolds served as Chief Operating Officer of FPCMS (2007-2008). Previously, Ms. Reynolds served as President, Treasurer, and Anti-Money Laundering officer of the Fidelity funds (2004-2007). |
Kenneth A. Rathgeber (62) |
| Year of Election or Appointment: 2004 Chief Compliance Officer of Fidelity's Equity and High Income Funds. Mr. Rathgeber is Chief Compliance Officer of Fidelity Management & Research (Hong Kong) Limited (2008-present), Fidelity Management & Research (Japan) Inc. (2008-present), FMR (2005-present), FMR Co., Inc. (2005-present), Fidelity Management & Research (U.K.) Inc. (2005-present), Fidelity Research & Analysis Company (2005-present), Fidelity Investments Money Management, Inc. (2005-present), Pyramis Global Advisors, LLC (2005-present), and Strategic Advisers, Inc. (2005-present). |
Jeffrey S. Christian (48) |
| Year of Election or Appointment: 2009 Deputy Treasurer of the Fidelity funds. Mr. Christian is an employee of Fidelity Investments. Previously, Mr. Christian served as Chief Financial Officer (2008-2009) of certain Fidelity funds, Senior Vice President of Fidelity Pricing and Cash Management Services (FPCMS) (2004-2009), and as Vice President of Business Analysis (2003-2004). |
Bryan A. Mehrmann (48) |
| Year of Election or Appointment: 2005 Deputy Treasurer of the Fidelity funds. Mr. Mehrmann is an employee of Fidelity Investments. Previously, Mr. Mehrmann served as Vice President of Fidelity Investments Institutional Services Group (FIIS)/Fidelity Investments Institutional Operations Company, Inc. (FIIOC) Client Services (1998-2004). |
Adrien E. Deberghes (42) |
| Year of Election or Appointment: 2008 Deputy Treasurer of Fidelity's Equity and High Income Funds. Mr. Deberghes is an employee of Fidelity Investments (2008-present). Previously, Mr. Deberghes served as Senior Vice President of Mutual Fund Administration at State Street Corporation (2007-2008), Senior Director of Mutual Fund Administration at Investors Bank & Trust (2005-2007), and Director of Finance for Dunkin' Brands (2000-2005). |
John R. Hebble (51) |
| Year of Election or Appointment: 2009 Assistant Treasurer of Fidelity's Equity and High Income Funds. Mr. Hebble also serves as President and Treasurer of other Fidelity funds (2008-present) and is an employee of Fidelity Investments. |
Paul M. Murphy (62) |
| Year of Election or Appointment: 2007 Assistant Treasurer of the Fidelity funds. Mr. Murphy is an employee of Fidelity Investments. Previously, Mr. Murphy served as Chief Financial Officer of the Fidelity funds (2005-2006), Vice President and Associate General Counsel of FMR (2007), and Senior Vice President of Fidelity Pricing and Cash Management Services (FPCMS) (1994-2007). |
Gary W. Ryan (51) |
| Year of Election or Appointment: 2005 Assistant Treasurer of the Fidelity funds. Mr. Ryan is an employee of Fidelity Investments. Previously, Mr. Ryan served as Vice President of Fund Reporting in Fidelity Pricing and Cash Management Services (FPCMS) (1999-2005). |
Annual Report
Initial Class, Service Class, Service Class 2, and Investor Class designates 100% of the dividends distributed in February and December 2009, respectively during the fiscal year as qualifying for the dividends-received deduction for corporate shareholders.
The fund will notify shareholders in January 2010 of amounts for use in preparing 2009 income tax returns.
Annual Report
Board Approval of Investment Advisory Contracts and Management Fees
VIP Growth Stock Portfolio
Each year, the Board of Trustees, including the Independent Trustees (together, the Board), votes on the renewal of the management contract and sub-advisory agreements (together, the Advisory Contracts) for the fund. The Board, assisted by the advice of fund counsel and Independent Trustees' counsel, requests and considers a broad range of information throughout the year.
The Board meets regularly and, acting directly and through its separate committees, requests and receives information concerning, and considers at each of its meetings factors that are relevant to, its annual consideration of the renewal of the fund's Advisory Contracts, including the services and support provided to the fund and its shareholders. The Board has established various standing committees, each composed of Independent Trustees with varying backgrounds, to which the Board has assigned specific subject matter responsibilities in order to enhance effective decision-making by the Board. Each committee has a written charter outlining the structure and purposes of the committee. The Board also meets as needed to consider matters specifically related to the Board's annual consideration of the renewal of Advisory Contracts.
At its July 2009 meeting, the Board of Trustees, including the Independent Trustees, unanimously determined to renew the fund's Advisory Contracts. In reaching its determination, the Board considered all factors it believed relevant, including (i) the nature, extent, and quality of the services to be provided to the fund and its shareholders (including the investment performance of the fund); (ii) the competitiveness of the fund's management fee and total expenses; (iii) the total costs of the services to be provided by and the profits to be realized by Fidelity from its relationship with the fund; (iv) the extent to which economies of scale would be realized as the fund grows; and (v) whether fee levels reflect these economies of scale, if any, for the benefit of fund shareholders.
In considering whether to renew the Advisory Contracts for the fund, the Board ultimately reached a determination, with the assistance of fund counsel and Independent Trustees' counsel and through the exercise of its business judgment, that the renewal of the Advisory Contracts and the compensation to be received by Fidelity under the management contract is consistent with Fidelity's fiduciary duty under applicable law. The Board's decision to renew the Advisory Contracts was not based on any single factor noted above, but rather was based on a comprehensive consideration of all the information provided to the Board at its meetings throughout the year. The Board, in reaching its determination to renew the Advisory Contracts, is aware that shareholders in the fund have a broad range of investment choices available to them, including a wide choice among mutual funds offered by competitors to Fidelity, and that the fund's shareholders, with the opportunity to review and weigh the disclosure provided by the fund in its prospectus and other public disclosures, have chosen to invest in this fund, managed by Fidelity.
Nature, Extent, and Quality of Services Provided. The Board considered staffing within the investment adviser, FMR, and the sub-advisers (together, the Investment Advisers), including the backgrounds of the fund's investment personnel and the fund's investment objective and discipline. The Independent Trustees also had discussions with senior management of Fidelity's investment operations and investment groups. The Board considered the structure of the portfolio manager compensation program and whether this structure provides appropriate incentives.
Resources Dedicated to Investment Management and Support Services. The Board reviewed the size, education, and experience of the Investment Advisers' investment staff, their use of technology, and the Investment Advisers' approach to recruiting, training, and retaining portfolio managers and other research, advisory, and management personnel. In response to last year's financial crisis, FMR took a number of actions intended to cut costs and improve efficiency without weakening the investment teams or resources. The Board noted that Fidelity's analysts have access to a variety of technological tools and market and securities data that enable them to perform both fundamental and quantitative analysis and to specialize in various disciplines. The Board considered Fidelity's extensive global research capabilities that enable the Investment Advisers to aggregate data from various sources in an effort to produce positive investment results. The Board also considered that Fidelity's portfolio managers and analysts have access to daily portfolio attribution that allows for monitoring of a fund's portfolio, as well as an electronic communication system that provides immediate real-time access to research concerning issuers and credit enhancers.
Shareholder and Administrative Services. The Board considered (i) the nature, extent, quality, and cost of advisory, administrative, distribution, and shareholder services performed by the Investment Advisers and their affiliates under the Advisory Contracts and under separate agreements covering transfer agency, pricing and bookkeeping, and securities lending services for the fund; (ii) the nature and extent of the Investment Advisers' supervision of third party service providers, principally custodians and subcustodians; and (iii) the resources devoted to, and the record of compliance with, the fund's compliance policies and procedures. The Board also reviewed the allocation of fund brokerage, including allocations to brokers affiliated with the Investment Advisers, the use of brokerage commissions to pay fund expenses, and the use of "soft" commission dollars to pay for research services.
The Board noted that the growth of fund assets across the complex allows Fidelity to reinvest in the development of services designed to enhance the value or convenience of the Fidelity funds as investment vehicles. These services include 24-hour access to account information and market information through phone representatives and over the Internet, and investor education materials and asset allocation tools.
Investment in a Large Fund Family. The Board considered the benefits to shareholders of investing in a Fidelity fund, including the benefits of investing in a fund that is part of a large family of funds offering a variety of investment disciplines and providing for a large variety of mutual fund investor services. The Board noted that Fidelity has taken a number of actions over the previous year that benefited particular funds, including (i) dedicating additional resources to investment research and to restructure and broaden the focus of the investment research teams; (ii) bolstering the senior management team that oversees asset management; (iii) contractually agreeing to reduce the management fee on Fidelity U.S. Bond Index Fund; and (iv) expanding Class A and Class T load waiver categories to increase rollover retention opportunities and create consistent policies across the classes.
Annual Report
Board Approval of Investment Advisory Contracts and Management Fees - continued
Investment Performance. The Board considered whether the fund has operated within its investment objective, as well as its record of compliance with its investment restrictions. It also reviewed the fund's absolute investment performance for each class, as well as the fund's relative investment performance for each class measured against (i) a broad-based securities market index, and (ii) a peer group of mutual funds deemed appropriate by the Board over multiple periods. The following charts considered by the Board show, over the one-, three-, and five-year periods ended December 31, 2008, the cumulative total returns of Initial Class and Service Class 2 of the fund, the cumulative total returns of a broad-based securities market index ("benchmark"), and a range of cumulative total returns of a peer group of mutual funds identified by Morningstar, Inc. as having an investment style similar to that of the fund based on underlying portfolio holdings. The returns of Initial Class and Service Class 2 show the performance of the highest and lowest performing classes, respectively (based on five-year performance). The box within each chart shows the 25th percentile return (bottom of box) and the 75th percentile return (top of box) of the peer group. Returns shown above the box are in the first quartile and returns shown below the box are in the fourth quartile. The percentage beaten numbers noted below each chart correspond to the percentile box and represent the percentage of funds in the peer group whose performance was equal to or lower than that of the class indicated.
VIP Growth Stock Portfolio
The Board reviewed the fund's relative investment performance against its peer group and stated that the performance of Initial Class of the fund was in the fourth quartile for the one- and five-year periods and the third quartile for the three-year period. The Board also stated that the investment performance of the fund was lower than its benchmark for all the periods shown. The Board considered that the variations in performance among the fund's classes reflect the variations in class expenses, which result in lower performance for higher expense classes. The Board discussed with FMR actions that have been taken by FMR to improve the fund's disappointing performance relative to its peer group and benchmark. The Board will continue to closely monitor the performance of the fund in the coming year and discuss with FMR other appropriate actions to address the performance of the fund.
The Board considered that FMR has taken steps to refocus and strengthen equity research, equity portfolio management, and compliance. The Board reviewed the year-to-date performance of Initial Class through May 31, 2009 and stated that it exceeded the fund's benchmark.
Based on its review, and giving particular weight to the nature and quality of the resources dedicated by the Investment Advisers to maintain and improve relative performance and factoring in the unprecedented market events in 2008, the Board concluded that the nature, extent, and quality of the services provided to the fund will benefit the fund's shareholders, particularly in light of the Board's view that the fund's shareholders benefit from investing in a fund that is part of a large family of funds offering a variety of investment disciplines and services.
Competitiveness of Management Fee and Total Fund Expenses. The Board considered the fund's management fee and total expenses compared to "mapped groups" of competitive funds and classes. Fidelity creates "mapped groups" by combining similar Lipper investment objective categories that have comparable management fee characteristics. Combining Lipper investment objective categories aids the Board's management fee and total expense comparisons by broadening the competitive group used for comparison and by reducing the number of universes to which various Fidelity funds are compared.
Annual Report
The Board considered two proprietary management fee comparisons for the 12-month periods shown in the chart below. The group of Lipper funds used by the Board for management fee comparisons is referred to below as the "Total Mapped Group." The Total Mapped Group comparison focuses on a fund's standing relative to the total universe of comparable funds available to investors, in terms of gross management fees before expense reimbursements or caps. "TMG %" represents the percentage of funds in the Total Mapped Group that had management fees that were lower than the fund's. For example, a TMG % of 9% means that 91% of the funds in the Total Mapped Group had higher management fees than the fund. The "Asset-Size Peer Group" (ASPG) comparison focuses on a fund's standing relative to non-Fidelity funds similar in size to the fund within the Total Mapped Group. The ASPG represents at least 15% of the funds in the Total Mapped Group with comparable asset size and management fee characteristics, subject to a minimum of 50 funds (or all funds in the Total Mapped Group if fewer than 50). Additional information, such as the ASPG quartile in which the fund's management fee ranked, is also included in the chart and considered by the Board.
VIP Growth Stock Portfolio
The Board noted that the fund's management fee ranked below the median of its Total Mapped Group and below the median of its ASPG for 2008.
Based on its review, the Board concluded that the fund's management fee was fair and reasonable in light of the services that the fund receives and the other factors considered.
In its review of each class's total expenses, the Board considered the fund's management fee as well as other fund or class expenses, as applicable, such as transfer agent fees, pricing and bookkeeping fees, fund-paid 12b-1 fees, and custodial, legal, and audit fees. The Board also noted the effects of any waivers and reimbursements on fees and expenses. As part of its review, the Board also considered current and historical total expenses of each class of the fund compared to competitive fund median expenses. Each class of the fund is compared to those funds and classes in the Total Mapped Group (used by the Board for management fee comparisons) that have a similar sales load structure.
The Board noted that the total expenses of Initial Class ranked below its competitive median for 2008, the total expenses of Investor Class ranked equal to its competitive median for 2008, and the total expenses of each of Service Class and Service Class 2 ranked above its competitive median for 2008. The Board noted that the fund offers multiple classes, each of which has a different 12b-1 fee structure, and that the multiple structures are intended to offer a range of pricing options for the intermediary market. The Board also noted that the total expenses of the classes vary primarily by the level of their 12b-1 fees, although differences in transfer agent fees may also cause expenses to vary from class to class.
In its review of total expenses, the Board also considered Fidelity fee structures and other information on clients that FMR and its affiliates service in other competitive markets, such as other mutual funds advised or subadvised by FMR or its affiliates, pension plan clients, and other institutional clients.
Based on its review, the Board concluded that the total expenses of each class of the fund were reasonable, although in some cases above the median of the universe presented for comparison, in light of the services that the fund and its shareholders receive and the other factors considered.
Costs of the Services and Profitability. The Board considered the revenues earned and the expenses incurred by Fidelity in conducting the business of developing, marketing, distributing, managing, administering and servicing the fund and its shareholders. The Board also considered the level of Fidelity's profits in respect of all the Fidelity funds.
Annual Report
Board Approval of Investment Advisory Contracts and Management Fees - continued
On an annual basis, FMR presents to the Board Fidelity's profitability for the fund. Fidelity calculates the profitability for each fund, as well as aggregate profitability for groups of Fidelity funds and all Fidelity funds, using a series of detailed revenue and cost allocation methodologies which originate with the audited books and records of Fidelity. The Audit Committee of the Board reviews any significant changes from the prior year's methodologies.
PricewaterhouseCoopers LLP (PwC), independent registered public accounting firm and auditor to Fidelity and certain Fidelity funds, has been engaged annually by the Board as part of the Board's assessment of Fidelity's profitability analysis. PwC's engagement includes the review and assessment of Fidelity's methodologies used in determining the revenues and expenses attributable to Fidelity's mutual fund business, and completion of agreed-upon procedures surrounding the mathematical accuracy of fund profitability and its conformity to allocation methodologies. After considering PwC's reports issued under the engagement and information provided by Fidelity, the Board believes that while other allocation methods may also be reasonable, Fidelity's profitability methodologies are reasonable in all material respects.
The Board has also reviewed Fidelity's non-fund businesses and any fall-out benefits related to the mutual fund business as well as cases where Fidelity's affiliates may benefit from or be related to the fund's business.
The Board considered the costs of the services provided by and the profits realized by Fidelity in connection with the operation of the fund and determined that the amount of profit is a fair entrepreneurial profit for the management of the fund.
Economies of Scale. The Board considered whether there have been economies of scale in respect of the management of the Fidelity funds, whether the Fidelity funds (including the fund) have appropriately benefited from any such economies of scale, and whether there is potential for realization of any further economies of scale. The Board considered the extent to which the fund will benefit from economies of scale through increased services to the fund, through waivers or reimbursements, or through fee or expense reductions.
In February 2009, the Board created an Ad Hoc Committee (the "Committee") to analyze economies of scale. The Committee was formed to consider whether FMR attains economies of scale in respect of the management and servicing of the Fidelity funds, whether the Fidelity funds have appropriately benefited from such economies of scale, and whether there is potential for realization of any further economies of scale.
The Board recognized that the fund's management contract incorporates a "group fee" structure, which provides for lower group fee rates as total fund assets under FMR's management increase, and for higher group fee rates as total fund assets under FMR's management decrease. FMR determines the group fee rates based on a tiered asset "breakpoint" schedule. The Board considered that the group fee is designed to deliver the benefits of economies of scale to fund shareholders when total fund assets increase, even if assets of any particular fund are unchanged or have declined, because some portion of Fidelity's costs are attributable to services provided to all Fidelity funds, and all funds benefit if those costs can be allocated among more assets. The Board concluded that, given the group fee structure, fund shareholders will achieve a certain level of economies of scale as assets under FMR's management increase at the fund complex level, regardless of whether Fidelity achieves any such economies of scale.
The Board concluded, considering the findings of the Committee, that any potential economies of scale are being shared between fund shareholders and Fidelity in an appropriate manner.
Additional Information Requested by the Board. In order to develop fully the factual basis for consideration of the Fidelity funds' Advisory Contracts, the Board requested and received additional information on certain topics, including (i) fund performance trends, actions to be taken by FMR to improve certain funds' overall performance and Fidelity's long-term strategies for certain funds; (ii) portfolio manager changes that have occurred during the past year; (iii) Fidelity's compensation structure for portfolio managers and key personnel, including performance benchmarks used by Fidelity in evaluating incentive compensation for portfolio managers and research analysts; (iv) the structure and process of equity research and actions taken by FMR to improve the quality of research; (v) the selection of and compensation paid by FMR to fund sub-advisers; (vi) Fidelity's fee structures and rationale for recommending different fees among categories of funds; (vii) the rationale for any differences between fund fee structures and fee structures in place for other Fidelity clients; (viii) Fidelity's rationale for recommending which funds should have a performance adjustment component as part of their management fees; and (ix) explanations for the relative total expenses borne by certain funds and classes, total expense competitive trends, and actions that might be taken by FMR to reduce total expenses for certain funds and classes.
Based on its evaluation of all of the conclusions noted above, and after considering all material factors, the Board ultimately concluded that the advisory fee structures are fair and reasonable, and that the fund's Advisory Contracts should be renewed.
Annual Report
Investment Adviser
Fidelity Management & Research Company
Boston, MA
Investment Sub-Advisers
FMR Co., Inc.
Fidelity Management & Research (U.K.) Inc.
Fidelity Research & Analysis Company
FIL Investments (Japan) Limited
FIL Investment Advisors
FIL Investment Advisors (U.K.) Ltd.
Fidelity Management & Research (Hong Kong) Limited
Fidelity Management & Research (Japan) Inc.
General Distributor
Fidelity Distributors Corporation
Boston, MA
Transfer and Service Agents
Fidelity Investments Institutional Operations Company, Inc.
Boston, MA
Fidelity Service Company, Inc.
Boston, MA
Custodian
Mellon Bank, N.A.
Pittsburgh, PA
VIPGR-ANN-0210
1.781993.107
Fidelity® Variable Insurance Products:
Health Care Portfolio
Annual Report
December 31, 2009
(2_fidelity_logos) (Registered_Trademark)
Contents
Performance | <Click Here> | How the fund has done over time. |
Management's Discussion | <Click Here> | The manager's review of fund performance, strategy and outlook. |
Shareholder Expense Example | <Click Here> | An example of shareholder expenses. |
Investment Changes | <Click Here> | A summary of major shifts in the fund's investments over the past six months. |
Investments | <Click Here> | A complete list of the fund's investments with their market values. |
Financial Statements | <Click Here> | Statements of assets and liabilities, operations, and changes in net assets, as well as financial highlights. |
Notes | <Click Here> | Notes to the financial statements. |
Report of Independent Registered Public Accounting Firm | <Click Here> | |
Trustees and Officers | <Click Here> | |
Distributions | <Click Here> | |
Board Approval of Investment Advisory Contracts and Management Fees | <Click Here> | |
To view a fund's proxy voting guidelines and proxy voting record for the 12-month period ended June 30, visit http://www.fidelity.com/proxyvotingresults or visit the Securities and Exchange Commission's (SEC) web site at http://www.sec.gov. You may also call 1-877-208-0098 to request a free copy of the proxy voting guidelines.
Fidelity Variable Insurance Products are separate account options which are purchased through a variable insurance contract.
Standard & Poor's, S&P and S&P 500 are registered service marks of The McGraw-Hill Companies, Inc. and have been licensed for use by Fidelity Distributors Corporation.
Other third party marks appearing herein are the property of their respective owners.
All other marks appearing herein are registered or unregistered trademarks or service marks of FMR LLC or an affiliated company.
This report and the financial statements contained herein are submitted for the general information of the shareholders of the fund. This report is not authorized for distribution to prospective investors in the fund unless preceded or accompanied by an effective prospectus.
The fund files its complete schedule of portfolio holdings with the SEC for the first and third quarters of each fiscal year on Form N-Q. Forms N-Q are available on the SEC's web site at http://www.sec.gov. The fund's Forms N-Q may be reviewed and copied at the SEC's Public Reference Room in Washington, DC. Information regarding the operation of the SEC's Public Reference Room may be obtained by calling 1-800-SEC-0330. For a complete list of the fund's portfolio holdings, view the most recent holdings listing, semiannual report, or annual report on Fidelity's web site at http://www.fidelity.com or http://www.advisor.fidelity.com, as applicable.
NOT FDIC INSURED · MAY LOSE VALUE · NO BANK GUARANTEE
Neither the fund nor Fidelity Distributors Corporation is a bank.
Annual Report
Average annual total return reflects the change in the value of an investment, assuming reinvestment of the class' dividend income and capital gains (the profits earned upon the sale of securities that have grown in value, if any) and assuming a constant rate of performance each year. During periods of reimbursement by Fidelity, a fund's total return will be greater than it would be had the reimbursement not occurred. Performance numbers are net of all underlying fund operating expenses, but do not include any insurance charges imposed by your insurance company's separate account. If performance information included the effect of these additional charges, the total returns would have been lower. How a fund did yesterday is no guarantee of how it will do tomorrow.
Average Annual Total Returns
Periods ended December 31, 2009 | Past 1
year | Past 5
years | Life of fund A |
VIP Health Care - Initial Class | 32.80% | 4.28% | 3.35% |
VIP Health Care - Investor Class B | 32.53% | 4.16% | 3.28% |
A From July 18, 2001.
B The initial offering of Investor Class took place on July 21, 2005. Returns prior to July 21, 2005 are those of Initial Class. Had Investor Class's transfer agent fee been reflected, returns prior to July 21, 2005 would have been lower.
$10,000 Over Life of Fund
Let's say hypothetically that $10,000 was invested in VIP Health Care Portfolio - Initial Class on July 18, 2001, when the fund started. The chart shows how the value of your investment would have changed, and also shows how the Standard & Poor's 500SM Index (S&P 500®) performed over the same period.
Annual Report
Market Recap: In 2009, most global markets saw both crippling lows and considerable highs. After a dismal start, the economy began to show signs of improvement, suggesting that a recovery was on the horizon. Credit markets began to heal as fiscal and monetary stimulus efforts around the world started to take effect, and corporate earnings staged an impressive rebound, fueled in large part by massive cost cutting. As a result, the flight to quality that marked most of 2008 and early 2009 shifted in March as investors flocked to riskier asset categories. The U.S. equity market, as measured by the bellwether Standard & Poor's 500SM Index and the blue-chip proxy Dow Jones Industrial AverageSM, reflected this changing environment, gaining 26.46% and 22.68%, respectively. Meanwhile, the technology-laden Nasdaq Composite® Index rose 45.32%. Foreign stocks also produced strong gains, as illustrated by the 31.93% jump of the MSCI® EAFE® Index (Europe, Australasia, Far East), a gauge of developed stock markets outside the U.S. and Canada. Emerging-markets stocks, which suffered their worst calendar-year performance ever in 2008, posted record returns this past year, with the MSCI Emerging Markets Index soaring 79.02%. A depreciating U.S. dollar helped bolster returns for U.S. investors in foreign equities.
Comments from Edward Yoon, Portfolio Manager of VIP Health Care Portfolio: For the 12 months ending December 31, 2009, the fund decisively outperformed the 22.24% return of the MSCI® U.S. Investable Market Health Care Index. (For specific portfolio results, please refer to the performance section of this report.) A sizable boost came from strong stock picking in pharmaceuticals, health care supplies, managed health care, biotechnology and health care services, while favorable industry positioning contributed as well. On the other hand, our bias in favor of quality growth-oriented companies meant we did not own certain health care equipment stocks that rallied during the year. In terms of individual contributors, Inverness Medical Innovations, which produces diagnostic tests, helped the most. Among large drug stocks, we underweighted Johnson & Johnson and Eli Lilly, where growth was slow, and early in the period overweighted Wyeth and Schering-Plough, which agreed to be acquired at attractive prices. Pharmacy benefits managers Medco Health Solutions and Express Scripts and Botox maker Allergan also helped. On the other hand, overweightings in Illumina, which develops gene-sequencing technology, and C. R. Bard, a medical technology company, detracted from relative performance. Myriad Genetics, which makes a genetic test for breast cancer, also hurt. Due to our underweighting in Medtronic, the fund did not benefit when this medical equipment stock rallied. Some of the above stocks were no longer held at period end.
Note to shareholders: In January 2010, Fidelity adopted capped benchmarks for most of its sector and industry funds, including the VIP sector portfolios. The capped benchmarks, which limit the weightings of individual issuers, better represent the investment opportunities available to the funds and will provide shareholders with more-meaningful performance comparisons. These changes do not affect the investment policies of any of the funds, and the primary benchmark for all of the funds remains the Standard & Poor's 500 Index.
The views expressed above reflect those of the portfolio manager(s) only through the end of the period as stated on the cover of this report and do not necessarily represent the views of Fidelity or any other person in the Fidelity organization. Any such views are subject to change at any time based upon market or other conditions and Fidelity disclaims any responsibility to update such views. These views may not be relied on as investment advice and, because investment decisions for a Fidelity fund are based on numerous factors, may not be relied on as an indication of trading intent on behalf of any Fidelity fund.
Annual Report
Shareholder Expense Example
As a shareholder of the Fund, you incur two types of costs: (1) transaction costs, including redemption fees, and (2) ongoing costs, including management fees and other Fund expenses. This Example is intended to help you understand your ongoing costs (in dollars) of investing in the Fund and to compare these costs with the ongoing costs of investing in other mutual funds.
The Example is based on an investment of $1,000 invested at the beginning of the period and held for the entire period (July 1, 2009 to December 31, 2009).
Actual Expenses
The first line of the accompanying table for each class of the Fund provides information about actual account values and actual expenses. You may use the information in this line, together with the amount you invested, to estimate the expenses that you paid over the period. Simply divide your account value by $1,000.00 (for example, an $8,600 account value divided by $1,000.00 = 8.6), then multiply the result by the number in the first line for a class of the Fund under the heading entitled "Expenses Paid During Period" to estimate the expenses you paid on your account during this period. The estimate of expenses does not include any fees or other expenses of any variable annuity or variable life insurance product. If they were, the estimate of expenses you paid during the period would be higher, and your ending account value would be lower. In addition, the Fund, as a shareholder in the underlying Fidelity Central Funds, will indirectly bear its pro-rata share of the fees and expenses incurred by the underlying Fidelity Central Funds. These fees and expenses are not included in the Fund's annualized expense ratio used to calculate the expense estimate in the table below.
Hypothetical Example for Comparison Purposes
The second line of the accompanying table for each class of the Fund provides information about hypothetical account values and hypothetical expenses based on a Class' actual expense ratio and an assumed rate of return of 5% per year before expenses, which is not the Class' actual return. The hypothetical account values and expenses may not be used to estimate the actual ending account balance or expenses you paid for the period. You may use this information to compare the ongoing costs of investing in the Fund and other funds. To do so, compare this 5% hypothetical example with the 5% hypothetical examples that appear in the shareholder reports of the other funds. The estimate of expenses does not include any fees or other expenses of any variable annuity or variable life insurance product. If they were, the estimate of expenses you paid during the period would be higher, and your ending account value would be lower. In addition, the Fund, as a shareholder in the underlying Fidelity Central Funds, will indirectly bear its pro-rata share of the fees and expenses incurred by the underlying Fidelity Central Funds. These fees and expenses are not included in the Fund's annualized expense ratio used to calculate the expense estimate in the table below.
Please note that the expenses shown in the table are meant to highlight your ongoing costs only and do not reflect any transaction costs. Therefore, the second line of the table is useful in comparing ongoing costs only, and will not help you determine the relative total costs of owning different funds. In addition, if these transactional costs were included, your costs would have been higher.
| Annualized
Expense Ratio | Beginning
Account Value
July 1, 2009 | Ending
Account Value
December 31, 2009 | Expenses Paid
During Period*
July 1, 2009 to
December 31, 2009 |
Initial Class | .80% | | | |
Actual | | $ 1,000.00 | $ 1,202.60 | $ 4.44 |
Hypothetical A | | $ 1,000.00 | $ 1,021.17 | $ 4.08 |
Investor Class | .90% | | | |
Actual | | $ 1,000.00 | $ 1,201.20 | $ 4.99 |
Hypothetical A | | $ 1,000.00 | $ 1,020.67 | $ 4.58 |
A 5% return per year before expenses
* Expenses are equal to each Class' annualized expense ratio, multiplied by the average account value over the period, multiplied by 184/365 (to reflect the one-half year period).
Annual Report
Investment Changes (Unaudited)
Top Ten Stocks as of December 31, 2009 |
| % of fund's
net assets | % of fund's net assets
6 months ago |
Pfizer, Inc. | 8.7 | 5.7 |
Covidien PLC | 5.9 | 5.9 |
Medco Health Solutions, Inc. | 4.7 | 5.2 |
Allergan, Inc. | 4.6 | 4.7 |
Express Scripts, Inc. | 4.4 | 4.0 |
Merck & Co., Inc. | 4.1 | 4.6 |
Biogen Idec, Inc. | 3.5 | 2.1 |
Illumina, Inc. | 3.0 | 3.2 |
C. R. Bard, Inc. | 2.9 | 2.8 |
CIGNA Corp. | 2.3 | 2.6 |
| 44.1 | |
Top Industries (% of fund's net assets) |
As of December 31, 2009 |
| Pharmaceuticals | 26.5% | |
| Health Care Providers & Services | 22.0% | |
| Health Care Equipment & Supplies | 20.3% | |
| Biotechnology | 14.2% | |
| Life Sciences Tools & Services | 8.6% | |
| All Others* | 8.4% | |
|
As of June 30, 2009 |
| Health Care Equipment & Supplies | 25.4% | |
| Pharmaceuticals | 24.5% | |
| Health Care Providers & Services | 20.6% | |
| Biotechnology | 13.3% | |
| Life Sciences Tools & Services | 11.7% | |
| All Others* | 4.5% | |
* Includes short-term investments and net other assets. |
Annual Report
Investments December 31, 2009
Showing Percentage of Net Assets
Common Stocks - 98.7% |
| Shares | | Value |
BIOTECHNOLOGY - 14.2% |
Biotechnology - 14.2% |
Acorda Therapeutics, Inc. (a) | 10,400 | | $ 262,288 |
Affymax, Inc. (a) | 6,300 | | 155,862 |
Alexion Pharmaceuticals, Inc. (a) | 11,405 | | 556,792 |
Alnylam Pharmaceuticals, Inc. (a)(c) | 8,200 | | 144,484 |
Amgen, Inc. (a) | 17,340 | | 980,924 |
Biogen Idec, Inc. (a) | 40,700 | | 2,177,450 |
BioMarin Pharmaceutical, Inc. (a) | 34,277 | | 644,750 |
Dendreon Corp. (a)(c) | 5,800 | | 152,424 |
Genzyme Corp. (a) | 4,863 | | 238,336 |
Gilead Sciences, Inc. (a) | 9,769 | | 422,802 |
Human Genome Sciences, Inc. (a) | 7,200 | | 220,320 |
Incyte Corp. (a) | 45,200 | | 411,772 |
Micromet, Inc. (a) | 7,900 | | 52,614 |
Myriad Genetics, Inc. (a) | 11,910 | | 310,851 |
OSI Pharmaceuticals, Inc. (a) | 10,800 | | 335,124 |
PDL BioPharma, Inc. | 45,548 | | 312,459 |
Protalix BioTherapeutics, Inc. (a)(c) | 23,800 | | 157,556 |
Targacept, Inc. (a) | 11,133 | | 232,902 |
Theravance, Inc. (a) | 8,512 | | 111,252 |
United Therapeutics Corp. (a) | 18,600 | | 979,290 |
| | 8,860,252 |
CHEMICALS - 0.8% |
Fertilizers & Agricultural Chemicals - 0.8% |
Monsanto Co. | 6,050 | | 494,588 |
DIVERSIFIED CONSUMER SERVICES - 0.4% |
Specialized Consumer Services - 0.4% |
Carriage Services, Inc. (a) | 37,339 | | 146,742 |
Stewart Enterprises, Inc. Class A | 25,532 | | 131,490 |
| | 278,232 |
ELECTRONIC EQUIPMENT & COMPONENTS - 1.9% |
Electronic Equipment & Instruments - 1.9% |
Agilent Technologies, Inc. (a) | 38,100 | | 1,183,767 |
FOOD & STAPLES RETAILING - 1.6% |
Drug Retail - 1.6% |
Walgreen Co. | 26,900 | | 987,768 |
HEALTH CARE EQUIPMENT & SUPPLIES - 20.3% |
Health Care Equipment - 17.6% |
Abiomed, Inc. (a) | 19,037 | | 166,383 |
ArthroCare Corp. (a) | 10,716 | | 253,969 |
Baxter International, Inc. | 11,610 | | 681,275 |
C. R. Bard, Inc. | 22,987 | | 1,790,687 |
CareFusion Corp. (a) | 15,200 | | 380,152 |
Conceptus, Inc. (a) | 14,900 | | 279,524 |
Covidien PLC | 76,688 | | 3,672,588 |
Edwards Lifesciences Corp. (a) | 11,805 | | 1,025,264 |
ev3, Inc. (a) | 25,083 | | 334,607 |
HeartWare International, Inc. (a) | 4,227 | | 149,932 |
HeartWare International, Inc. CDI (a) | 95,695 | | 96,703 |
|
| Shares | | Value |
Micrus Endovascular Corp. (a) | 23,595 | | $ 354,161 |
Nobel Biocare Holding AG (Switzerland) | 13,432 | | 451,171 |
NuVasive, Inc. (a)(c) | 10,300 | | 329,394 |
Orthofix International NV (a) | 7,110 | | 220,197 |
Orthovita, Inc. (a) | 45,300 | | 159,003 |
Osmetech PLC (a) | 1,638,024 | | 49,769 |
William Demant Holding AS (a) | 2,299 | | 173,595 |
Wright Medical Group, Inc. (a) | 20,933 | | 396,680 |
| | 10,965,054 |
Health Care Supplies - 2.7% |
AGA Medical Holdings, Inc. | 6,800 | | 100,436 |
Cooper Companies, Inc. | 14,470 | | 551,596 |
InfuSystems Holdings, Inc. (a) | 52,900 | | 116,380 |
InfuSystems Holdings, Inc. warrants 4/11/11 (a) | 4,900 | | 294 |
Inverness Medical Innovations, Inc. (a)(c) | 17,685 | | 734,104 |
RTI Biologics, Inc. (a) | 35,400 | | 135,936 |
| | 1,638,746 |
TOTAL HEALTH CARE EQUIPMENT & SUPPLIES | | 12,603,800 |
HEALTH CARE PROVIDERS & SERVICES - 22.0% |
Health Care Distributors & Services - 2.1% |
Henry Schein, Inc. (a) | 18,126 | | 953,428 |
Profarma Distribuidora de Produtos Farmaceuticos SA | 23,200 | | 226,143 |
Sinopharm Group Co. Ltd. Class H | 34,400 | | 120,884 |
| | 1,300,455 |
Health Care Facilities - 2.5% |
Emeritus Corp. (a)(c) | 13,261 | | 248,644 |
Hanger Orthopedic Group, Inc. (a) | 26,090 | | 360,825 |
Health Management Associates, Inc. Class A (a) | 52,600 | | 382,402 |
Sunrise Senior Living, Inc. (a) | 37,195 | | 119,768 |
Universal Health Services, Inc. Class B | 15,182 | | 463,051 |
| | 1,574,690 |
Health Care Services - 10.6% |
Clarient, Inc. (a) | 36,400 | | 96,460 |
Emergency Medical Services Corp.
Class A (a) | 3,800 | | 205,770 |
Express Scripts, Inc. (a) | 31,484 | | 2,721,792 |
Genoptix, Inc. (a) | 3,300 | | 117,249 |
Health Grades, Inc. (a) | 37,266 | | 159,871 |
LHC Group, Inc. (a) | 6,300 | | 211,743 |
Medco Health Solutions, Inc. (a) | 46,070 | | 2,944,334 |
RehabCare Group, Inc. (a) | 3,800 | | 115,634 |
| | 6,572,853 |
Managed Health Care - 6.8% |
Aetna, Inc. | 28,800 | | 912,960 |
CIGNA Corp. | 40,332 | | 1,422,510 |
Health Net, Inc. (a) | 16,920 | | 394,067 |
Common Stocks - continued |
| Shares | | Value |
HEALTH CARE PROVIDERS & SERVICES - CONTINUED |
Managed Health Care - continued |
Humana, Inc. (a) | 3,707 | | $ 162,700 |
WellPoint, Inc. (a) | 23,608 | | 1,376,110 |
| | 4,268,347 |
TOTAL HEALTH CARE PROVIDERS & SERVICES | | 13,716,345 |
HEALTH CARE TECHNOLOGY - 1.9% |
Health Care Technology - 1.9% |
Allscripts-Misys Healthcare Solutions, Inc. (a) | 16,889 | | 341,664 |
Cerner Corp. (a) | 8,300 | | 684,252 |
Computer Programs & Systems, Inc. | 3,599 | | 165,734 |
| | 1,191,650 |
INTERNET SOFTWARE & SERVICES - 0.5% |
Internet Software & Services - 0.5% |
WebMD Health Corp. (a) | 7,600 | | 292,524 |
LIFE SCIENCES TOOLS & SERVICES - 8.6% |
Life Sciences Tools & Services - 8.6% |
Bruker BioSciences Corp. (a) | 18,097 | | 218,250 |
Covance, Inc. (a) | 9,000 | | 491,130 |
ICON PLC sponsored ADR (a) | 12,310 | | 267,496 |
Illumina, Inc. (a)(c) | 61,403 | | 1,882,002 |
Life Technologies Corp. (a) | 22,858 | | 1,193,873 |
PerkinElmer, Inc. | 16,800 | | 345,912 |
QIAGEN NV (a)(c) | 41,824 | | 933,512 |
| | 5,332,175 |
PHARMACEUTICALS - 26.5% |
Pharmaceuticals - 26.5% |
Abbott Laboratories | 19,202 | | 1,036,716 |
Allergan, Inc. | 45,882 | | 2,891,025 |
Ardea Biosciences, Inc. (a) | 14,771 | | 206,794 |
Auxilium Pharmaceuticals, Inc. (a)(c) | 3,500 | | 104,930 |
Cadence Pharmaceuticals, Inc. (a)(c) | 22,845 | | 220,911 |
Endo Pharmaceuticals Holdings, Inc. (a) | 14,300 | | 293,293 |
Hikma Pharmaceuticals PLC | 15,823 | | 130,419 |
|
| Shares | | Value |
King Pharmaceuticals, Inc. (a) | 64,800 | | $ 795,096 |
Merck & Co., Inc. | 69,100 | | 2,524,914 |
Mitsubishi Tanabe Pharma Corp. | 1,000 | | 12,484 |
Optimer Pharmaceuticals, Inc. (a)(c) | 11,867 | | 133,860 |
Pfizer, Inc. | 299,250 | | 5,443,357 |
Piramal Healthcare Ltd. | 11,607 | | 93,286 |
Pronova BioPharma ASA (a) | 51,900 | | 157,600 |
Shire PLC sponsored ADR | 17,100 | | 1,003,770 |
Teva Pharmaceutical Industries Ltd. sponsored ADR | 14,021 | | 787,700 |
ViroPharma, Inc. (a) | 40,727 | | 341,700 |
Warner Chilcott PLC (a) | 10,500 | | 298,935 |
| | 16,476,790 |
TOTAL COMMON STOCKS (Cost $53,288,038) | 61,417,891 |
Money Market Funds - 9.0% |
| | | |
Fidelity Cash Central Fund, 0.16% (d) | 1,692,543 | | 1,692,543 |
Fidelity Securities Lending Cash Central Fund, 0.15% (b)(d) | 3,924,525 | | 3,924,525 |
TOTAL MONEY MARKET FUNDS (Cost $5,617,068) | 5,617,068 |
TOTAL INVESTMENT PORTFOLIO - 107.7% (Cost $58,905,106) | | 67,034,959 |
NET OTHER ASSETS - (7.7)% | | (4,799,184) |
NET ASSETS - 100% | $ 62,235,775 |
Legend |
(a) Non-income producing |
(b) Investment made with cash collateral received from securities on loan. |
(c) Security or a portion of the security is on loan at period end. |
(d) Affiliated fund that is available only to investment companies and other accounts managed by Fidelity Investments. The rate quoted is the annualized seven-day yield of the fund at period end. A complete unaudited listing of the fund's holdings as of its most recent quarter end is available upon request. |
Affiliated Central Funds |
Information regarding fiscal year to date income earned by the Fund from investments in Fidelity Central Funds is as follows: |
Fund | Income earned |
Fidelity Cash Central Fund | $ 4,515 |
Fidelity Securities Lending Cash Central Fund | 15,166 |
Total | $ 19,681 |
Other Information |
The following is a summary of the inputs used, as of December 31, 2009, involving the Fund's assets and liabilities carried at value. The inputs or methodology used for valuing securities may not be an indication of the risk associated with investing in those securities. For more information on valuation inputs, and their aggregation into the levels used in the table below, please refer to the Security Valuation section in the accompanying Notes to Financial Statements. |
Valuation Inputs at Reporting Date: |
Description | Total | Level 1 | Level 2 | Level 3 |
Investments in Securities: | | | | |
Common Stocks | $ 61,417,891 | $ 61,284,523 | $ 133,368 | $ - |
Money Market Funds | 5,617,068 | 5,617,068 | - | - |
Total Investments in Securities: | $ 67,034,959 | $ 66,901,591 | $ 133,368 | $ - |
Distribution of investments by country of issue, as a percentage of total net assets, is as follows: (Unaudited) |
United States of America | 86.5% |
Ireland | 6.8% |
Bailiwick of Jersey | 1.6% |
Netherlands | 1.5% |
Israel | 1.3% |
Others (individually less than 1%) | 2.3% |
| 100.0% |
Income Tax Information |
At December 31, 2009, the Fund had a capital loss carryforward of approximately $8,943,455, of which $3,482,538 and $5,460,917 will expire on December 31, 2016 and 2017, respectively. |
See accompanying notes which are an integral part of the financial statements.
Annual Report
Financial Statements
Statement of Assets and Liabilities
| December 31, 2009 |
| | |
Assets | | |
Investment in securities, at value (including securities loaned of $3,805,968) - See accompanying schedule: Unaffiliated issuers (cost $53,288,038) | $ 61,417,891 | |
Fidelity Central Funds (cost $5,617,068) | 5,617,068 | |
Total Investments (cost $58,905,106) | | $ 67,034,959 |
Cash | | 3,975 |
Receivable for investments sold | | 35,148 |
Receivable for fund shares sold | | 33,328 |
Dividends receivable | | 34,328 |
Distributions receivable from Fidelity Central Funds | | 679 |
Prepaid expenses | | 275 |
Other receivables | | 6,263 |
Total assets | | 67,148,955 |
| | |
Liabilities | | |
Payable for investments purchased | $ 914,281 | |
Payable for fund shares redeemed | 20 | |
Accrued management fee | 28,333 | |
Other affiliated payables | 6,978 | |
Other payables and accrued expenses | 39,043 | |
Collateral on securities loaned, at value | 3,924,525 | |
Total liabilities | | 4,913,180 |
| | |
Net Assets | | $ 62,235,775 |
Net Assets consist of: | | |
Paid in capital | | $ 63,978,460 |
Accumulated undistributed net realized gain (loss) on investments and foreign currency transactions | | (9,872,194) |
Net unrealized appreciation (depreciation) on investments and assets and liabilities in foreign currencies | | 8,129,509 |
Net Assets | | $ 62,235,775 |
Statement of Assets and Liabilities - continued
| December 31, 2009 |
| | |
Initial Class:
Net Asset Value, offering price and redemption price per share ($37,787,346 ÷ 3,502,684 shares) | | $ 10.79 |
| | |
Investor Class:
Net Asset Value, offering price and redemption price per share ($24,448,429 ÷ 2,274,423 shares) | | $ 10.75 |
See accompanying notes which are an integral part of the financial statements.
Annual Report
Statement of Operations
| Year ended December 31, 2009 |
| | |
Investment Income | | |
Dividends | | $ 619,254 |
Interest | | 19,531 |
Income from Fidelity Central Funds | | 19,681 |
Total income | | 658,466 |
| | |
Expenses | | |
Management fee | $ 329,014 | |
Transfer agent fees | 74,479 | |
Accounting and security lending fees | 23,162 | |
Custodian fees and expenses | 31,986 | |
Independent trustees' compensation | 415 | |
Audit | 44,489 | |
Legal | 374 | |
Miscellaneous | 5,277 | |
Total expenses before reductions | 509,196 | |
Expense reductions | (4,275) | 504,921 |
Net investment income (loss) | | 153,545 |
Realized and Unrealized Gain (Loss) Net realized gain (loss) on: | | |
Investment securities: | | |
Unaffiliated issuers | (1,213,854) | |
Foreign currency transactions | 3,378 | |
Total net realized gain (loss) | | (1,210,476) |
Change in net unrealized appreciation (depreciation) on: Investment securities (net of increase in deferred foreign taxes of $796) | 16,940,196 | |
Assets and liabilities in foreign currencies | 357 | |
Total change in net unrealized appreciation (depreciation) | | 16,940,553 |
Net gain (loss) | | 15,730,077 |
Net increase (decrease) in net assets resulting from operations | | $ 15,883,622 |
Statement of Changes in Net Assets
| Year ended
December 31, 2009 | Year ended
December 31, 2008 |
Increase (Decrease) in Net Assets | | |
Operations | | |
Net investment income (loss) | $ 153,545 | $ 231,435 |
Net realized gain (loss) | (1,210,476) | (8,428,451) |
Change in net unrealized appreciation (depreciation) | 16,940,553 | (21,596,246) |
Net increase (decrease) in net assets resulting from operations | 15,883,622 | (29,793,262) |
Distributions to shareholders from net investment income | (167,209) | (250,509) |
Distributions to shareholders from net realized gain | - | (9,280,105) |
Total distributions | (167,209) | (9,530,614) |
Share transactions - net increase (decrease) | (13,364,216) | 16,530,814 |
Redemption fees | 22,083 | 31,180 |
Total increase (decrease) in net assets | 2,374,280 | (22,761,882) |
| | |
Net Assets | | |
Beginning of period | 59,861,495 | 82,623,377 |
End of period (including undistributed net investment income of $0 and distributions in excess of net investment income of $1,064, respectively) | $ 62,235,775 | $ 59,861,495 |
See accompanying notes which are an integral part of the financial statements.
Annual Report
Financial Highlights - Initial Class
Years ended December 31, | 2009 | 2008 | 2007 | 2006 | 2005 |
Selected Per-Share Data | | | | | |
Net asset value, beginning of period | $ 8.15 | $ 13.57 | $ 13.17 | $ 12.39 | $ 10.61 |
Income from Investment Operations | | | | | |
Net investment income (loss) C | .03 | .04 | .03 | .04 | .01 |
Net realized and unrealized gain (loss) | 2.64 | (4.05) | 1.25 | .75 | 1.80 |
Total from investment operations | 2.67 | (4.01) | 1.28 | .79 | 1.81 |
Distributions from net investment income | (.03) | (.04) | (.07) | (.01) | (.03) |
Distributions from net realized gain | - | (1.37) | (.81) | - | - |
Total distributions | (.03) | (1.41) | (.88) | (.01) | (.03) |
Redemption fees added to paid in capital C,G | - | - | - | - | - |
Net asset value, end of period | $ 10.79 | $ 8.15 | $ 13.57 | $ 13.17 | $ 12.39 |
Total Return A,B | 32.80% | (32.31)% | 10.21% | 6.34% | 17.05% |
Ratios to Average Net Assets D,F | | | | | |
Expenses before reductions | .83% | .84% | .81% | .77% | .75% |
Expenses net of fee waivers, if any | .83% | .84% | .81% | .77% | .75% |
Expenses net of all reductions | .82% | .84% | .80% | .76% | .70% |
Net investment income (loss) | .30% | .36% | .23% | .33% | .06% |
Supplemental Data | | | | | |
Net assets, end of period (000 omitted) | $ 37,787 | $ 37,961 | $ 55,676 | $ 69,418 | $ 118,928 |
Portfolio turnover rate E | 132% | 189% | 128% | 106% | 122% |
A Total returns do not reflect charges attributable to your insurance company's separate account. Inclusion of these charges would reduce the total returns shown.
B Total returns would have been lower had certain expenses not been reduced during the periods shown.
C Calculated based on average shares outstanding during the period.
D Fees and expenses of the underlying Fidelity Central Funds are not included in the Fund's expense ratio. The Fund indirectly bears its proportionate share of the expenses of any underlying Fidelity Central Funds.
E Amount does not include the portfolio activity of any underlying Fidelity Central Funds.
F Expense ratios reflect operating expenses of the class. Expenses before reductions do not reflect amounts reimbursed by the investment adviser or reductions from brokerage service arrangements or reductions from other expense offset arrangements and do not represent the amount paid by the class during periods when reimbursements or reductions occur. Expenses net of fee waivers reflect expenses after reimbursement by the investment adviser but prior to reductions from brokerage service arrangements or other expense offset arrangements. Expenses net of all reductions represent the net expenses paid by the class.
G Amount represents less than $.01 per share.
Financial Highlights - Investor Class
Years ended December 31, | 2009 | 2008 | 2007 | 2006 | 2005 H |
Selected Per-Share Data | | | | | |
Net asset value, beginning of period | $ 8.13 | $ 13.53 | $ 13.14 | $ 12.37 | $ 11.64 |
Income from Investment Operations | | | | | |
Net investment income (loss) E | .02 | .03 | .01 | .03 | (.01) |
Net realized and unrealized gain (loss) | 2.62 | (4.03) | 1.24 | .75 | .74 |
Total from investment operations | 2.64 | (4.00) | 1.25 | .78 | .73 |
Distributions from net investment income | (.02) | (.03) | (.05) | (.01) | - |
Distributions from net realized gain | - | (1.37) | (.81) | - | - |
Total distributions | (.02) | (1.40) | (.86) | (.01) | - |
Redemption fees added to paid in capital E,J | - | - | - | - | - |
Net asset value, end of period | $ 10.75 | $ 8.13 | $ 13.53 | $ 13.14 | $ 12.37 |
Total Return B,C,D | 32.53% | (32.31)% | 10.01% | 6.30% | 6.27% |
Ratios to Average Net Assets F,I | | | | | |
Expenses before reductions | .94% | .94% | .93% | .90% | .93% A |
Expenses net of fee waivers, if any | .94% | .94% | .93% | .90% | .93% A |
Expenses net of all reductions | .93% | .93% | .92% | .89% | .89% A |
Net investment income (loss) | .20% | .26% | .11% | .20% | (.25)% A |
Supplemental Data | | | | | |
Net assets, end of period (000 omitted) | $ 24,448 | $ 21,901 | $ 26,948 | $ 16,229 | $ 7,360 |
Portfolio turnover rate G | 132% | 189% | 128% | 106% | 122% |
A Annualized
B Total returns for periods of less than one year are not annualized.
C Total returns do not reflect charges attributable to your insurance company's separate account. Inclusion of these charges would reduce the total returns shown.
D Total returns would have been lower had certain expenses not been reduced during the periods shown.
E Calculated based on average shares outstanding during the period.
F Fees and expenses of the underlying Fidelity Central Funds are not included in the Fund's expense ratio. The Fund indirectly bears its proportionate share of the expenses of any underlying Fidelity Central Funds.
G Amount does not include the portfolio activity of any underlying Fidelity Central Funds.
H For the period July 21, 2005 (commencement of sale of shares) to December 31, 2005.
I Expense ratios reflect operating expenses of the class. Expenses before reductions do not reflect amounts reimbursed by the investment adviser or reductions from brokerage service arrangements or reductions from other expense offset arrangements and do not represent the amount paid by the class during periods when reimbursements or reductions occur. Expense ratios before reductions for start-up periods may not be representative of longer-term operating periods. Expenses net of fee waivers reflect expenses after reimbursement by the investment adviser but prior to reductions from brokerage service arrangements or other expense offset arrangements. Expenses net of all reductions represent the net expenses paid by the class.
J Amount represents less than $.01 per share.
See accompanying notes which are an integral part of the financial statements.
Annual Report
Notes to Financial Statements
For the period ended December 31, 2009
1. Organization.
VIP Health Care Portfolio (the Fund) is a non-diversified fund of Variable Insurance Products Fund IV (the trust) and is authorized to issue an unlimited number of shares. The trust is registered under the Investment Company Act of 1940, as amended (the 1940 Act), as an open-end management investment company organized as a Massachusetts business trust. Shares of the Fund may only be purchased by insurance companies for the purpose of funding variable annuity or variable life insurance contracts. The Fund offers the following classes of shares: Initial Class shares and Investor Class shares. All classes have equal rights and voting privileges, except for matters affecting a single class. Investment income, realized and unrealized capital gains and losses, the common expenses of the Fund, and certain fund-level expense reductions, if any, are allocated on a pro-rata basis to each class based on the relative net assets of each class to the total net assets of the Fund. Each class differs with respect to transfer agent fees incurred. Certain expense reductions also differ by class.
2. Investments in Fidelity Central Funds.
The Fund may invest in Fidelity Central Funds, which are open-end investment companies available only to other investment companies and accounts managed by Fidelity Management & Research Company (FMR) and its affiliates. The Fund's Schedule of Investments lists each of the Fidelity Central Funds held as of period end, if any, as an investment of the Fund, but does not include the underlying holdings of each Fidelity Central Fund. As an Investing Fund, the Fund indirectly bears its proportionate share of the expenses of the underlying Fidelity Central Funds.
The Money Market Central Funds seek preservation of capital and current income and are managed by Fidelity Investments Money Management, Inc. (FIMM), an affiliate of FMR.
A complete unaudited list of holdings for each Fidelity Central Fund is available upon request or at the Securities and Exchange Commission (the SEC) web site at www.sec.gov. In addition, the financial statements of the Fidelity Central Funds, which are not covered by the Fund's Report of Independent Registered Public Accounting Firm, are available on the SEC web site or upon request.
3. Significant Accounting Policies.
The financial statements have been prepared in conformity with accounting principles generally accepted in the United States of America, which require management to make certain estimates and assumptions at the date of the financial statements. Actual results could differ from those estimates. Events or transactions occurring after period end through the date that the financial statements were issued, February 12, 2010, have been evaluated in the preparation of the financial statements. The following summarizes the significant accounting policies of the Fund:
Security Valuation. Investments are valued as of 4:00 p.m. Eastern time on the last calendar day of the period. The Fund uses independent pricing services approved by the Board of Trustees to value its investments. When current market prices or quotations are not readily available or reliable, valuations may be determined in good faith in accordance with procedures adopted by the Board of Trustees. Factors used in determining value may include significant market or security specific events. The frequency with which these procedures are used cannot be predicted and may be utilized to a significant extent. The value used for net asset value (NAV) calculation under these procedures may differ from published prices for the same securities.
The Fund categorizes the inputs to valuation techniques used to value its investments into a disclosure hierarchy consisting of three levels as shown below.
Level 1 - quoted prices in active markets for identical investments
Level 2 - other significant observable inputs (including quoted prices for similar investments, interest rates, prepayment speeds, etc.)
Level 3 - unobservable inputs (including the fund's own assumptions based on the best information available)
Changes in valuation techniques may result in transfers in or out of an assigned level within the disclosure hierarchy. The aggregate value of investments by input level, as of December 31, 2009 is included at the end of the Fund's Schedule of Investments. Valuation techniques used to value the Fund's investments by major category are as follows.
Equity securities, including restricted securities, for which market quotations are readily available, are valued at the last reported sale price or official closing price as reported by an independent pricing service on the primary market or exchange on which they are traded and are categorized as level 1 in the hierarchy. In the event there were no sales during the day or closing prices are not available, securities are valued at the last quoted bid price or may be valued using the last available price and categorized as Level 2 in the hierarchy. For foreign equity securities, when significant market or security events arise, comparisons to the valuation of American Depository Receipts (ADRs), futures contracts, exchange-traded funds (ETFs) and certain indexes as well as quoted prices for similar securities are used and are categorized as Level 2 in the hierarchy in these circumstances. For restricted securities and private placements where observable inputs are limited, assumptions about market activity and risk are used and are categorized as level 3 in the hierarchy.
Annual Report
3. Significant Accounting Policies - continued
Security Valuation - continued
Investments in open-end mutual funds, including the Fidelity Money Market Central Funds, are valued at their closing net asset value each business day and are categorized as Level 1 in the hierarchy. Short-term securities with remaining maturities of sixty days or less for which quotations are not readily available are valued at amortized cost, which approximates value and are categorized as level 2 in the hierarchy.
Foreign Currency. The Fund uses foreign currency contracts to facilitate transactions in foreign-denominated securities. Losses from these transactions may arise from changes in the value of the foreign currency or if the counterparties do not perform under the contracts' terms.
Foreign-denominated assets, including investment securities, and liabilities are translated into U.S. dollars at the exchange rate at period end. Purchases and sales of investment securities, income and dividends received and expenses denominated in foreign currencies are translated into U.S. dollars at the exchange rate in effect on the transaction date.
The effects of exchange rate fluctuations on investments are included with the net realized and unrealized gain (loss) on investment securities. Other foreign currency transactions resulting in realized and unrealized gain (loss) are disclosed separately.
Investment Transactions and Income. For financial reporting purposes, the Fund's investment holdings and NAV include trades executed through the end of the last business day of the period. The NAV per share for processing shareholder transactions is calculated as of the close of business of the New York Stock Exchange (NYSE), normally 4:00 p.m. Eastern time and includes trades executed through the end of the prior business day. Gains and losses on securities sold are determined on the basis of identified cost and may include proceeds received from litigation. Dividend income is recorded on the ex-dividend date, except for certain dividends from foreign securities where the ex-dividend date may have passed, which are recorded as soon as the Fund is informed of the ex-dividend date. Non-cash dividends included in dividend income, if any, are recorded at the fair market value of the securities received. Distributions received on securities that represent a return of capital or capital gain are recorded as a reduction of cost of investments and/or as a realized gain. The Fund estimates the components of distributions received that may be considered return of capital distributions or capital gain distributions. Interest income and distributions from the Fidelity Central Funds are accrued as earned. Interest income includes coupon interest and amortization of premium and accretion of discount on debt securities. Investment income is recorded net of foreign taxes withheld where recovery of such taxes is uncertain.
Expenses. Most expenses of the trust can be directly attributed to a fund. Expenses which cannot be directly attributed are apportioned among each Fund in the trust. Expense estimates are accrued in the period to which they relate and adjustments are made when actual amounts are known.
Income Tax Information and Distributions to Shareholders. Each year, the Fund intends to qualify as a regulated investment company by distributing substantially all of its taxable income and realized gains under Subchapter M of the Internal Revenue Code and filing its U.S. federal tax return. As a result, no provision for income taxes is required. As of December 31, 2009, the Fund did not have any unrecognized tax benefits in the accompanying financial statements. A Fund's federal tax return is subject to examination by the Internal Revenue Service (IRS) for a period of three years. Foreign taxes are provided for based on the Fund's understanding of the tax rules and rates that exist in the foreign markets in which it invests.
Distributions are recorded on the ex-dividend date. Income dividends and capital gain distributions are declared separately for each class. Income and capital gain distributions are determined in accordance with income tax regulations, which may differ from generally accepted accounting principles.
Capital accounts within the financial statements are adjusted for permanent book-tax differences. These adjustments have no impact on net assets or the results of operations. Temporary book-tax differences will reverse in a subsequent period.
Book-tax differences are primarily due to the short-term gain distributions from the Fidelity Central Funds, foreign currency transactions, market discount, capital loss carryforwards and losses deferred due to wash sales and excise tax regulations.
The federal tax cost of investment securities and unrealized appreciation (depreciation) as of period end were as follows:
Gross unrealized appreciation | $ 10,227,518 |
Gross unrealized depreciation | (2,872,898) |
Net unrealized appreciation (depreciation) | $ 7,354,620 |
| |
Tax Cost | $ 59,680,339 |
The tax-based components of distributable earnings as of period end were as follows:
Capital loss carryforward | $ (8,943,455) |
Net unrealized appreciation (depreciation) | $ 7,354,276 |
Annual Report
Notes to Financial Statements - continued
3. Significant Accounting Policies - continued
Income Tax Information and Distributions to Shareholders - continued
The tax character of distributions paid was as follows:
| December 31, 2009 | December 31, 2008 |
Ordinary Income | $ 167,209 | $ 2,756,815 |
Long-term Capital Gains | - | 6,773,799 |
Total | $ 167,209 | $ 9,530,614 |
Trading (Redemption) Fees. Shares held less than 60 days are subject to a redemption fee equal to 1% of the proceeds of the redeemed shares. All redemption fees, including any estimated redemption fees paid by FMR, are retained by the Fund and accounted for as an addition to paid in capital.
4. Purchases and Sales of Investments.
Purchases and sales of securities, other than short-term securities, aggregated $76,219,268 and $88,361,238, respectively.
5. Fees and Other Transactions with Affiliates.
Management Fee. FMR and its affiliates provide the Fund with investment management related services for which the Fund pays a monthly management fee. The management fee is the sum of an individual fund fee rate that is based on an annual rate of .30% of the Fund's average net assets and a group fee rate that averaged .26% during the period. The group fee rate is based upon the average net assets of all the mutual funds advised by FMR. The group fee rate decreases as assets under management increase and increases as assets under management decrease. For the period, the total annual management fee rate was .56% of the Fund's average net assets.
Transfer Agent Fees. Fidelity Investments Institutional Operations Company, Inc. (FIIOC), an affiliate of FMR, is the Fund's transfer, dividend disbursing, and shareholder servicing agent. FIIOC receives an asset-based fee with respect to each class. Each class (with the exception of Investor Class) pays a transfer agent fee, excluding out of pocket expenses, equal to an annual rate of .07% of average net assets. Investor Class pays a monthly asset-based transfer agent fee of .15% of average net assets. The total transfer agent fees paid by each class to FIIOC, including out of pocket expenses, were as follows:
Initial Class | $ 31,986 |
Investor Class | 42,493 |
| $ 74,479 |
Accounting and Security Lending Fees. Fidelity Service Company, Inc. (FSC), an affiliate of FMR, maintains the Fund's accounting records. The accounting fee is based on the level of average net assets for the month. Under a separate contract, FSC administers the security lending program. The security lending fee is based on the number and duration of lending transactions.
Brokerage Commissions. The Fund placed a portion of its portfolio transactions with brokerage firms which are affiliates of the investment adviser. The commissions paid to these affiliated firms were $1,710 for the period.
6. Committed Line of Credit.
The Fund participates with other funds managed by FMR in a $3.5 billion credit facility (the "line of credit") to be utilized for temporary or emergency purposes to fund shareholder redemptions or for other short-term liquidity purposes. The Fund has agreed to pay commitment fees on its pro-rata portion of the line of credit, which amounted to $309 and is reflected in Miscellaneous Expense on the Statement of Operations. During the period, there were no borrowings on this line of credit.
7. Security Lending.
The Fund lends portfolio securities from time to time in order to earn additional income. On the settlement date of the loan, the Fund receives collateral (in the form of U.S. Treasury obligations, letters of credit and/or cash) against the loaned securities and maintains collateral in an amount not less than 100% of the market value of the loaned securities during the period of the loan. The market value of the loaned securities is determined at the close of business of the Fund and any additional required collateral is delivered to the Fund on the next business day. If the borrower defaults on its obligation to return the securities loaned because of insolvency or other reasons, a fund could experience delays and costs in recovering the securities loaned or in gaining access to the collateral. Any cash collateral received is invested in the Fidelity Securities Lending Cash Central Fund. The value of loaned securities and cash collateral at period end are disclosed on the Fund's Statement of Assets and Liabilities. Security lending income represents the income earned on investing cash collateral, less fees and expenses associated with the loan, plus any premium payments that may be received on
Annual Report
7. Security Lending - continued
the loan of certain types of securities. Security lending income is presented in the Statement of Operations as a component of income from Fidelity Central Funds. Net income from lending portfolio securities during the period amounted to $15,166.
8. Expense Reductions.
Many of the brokers with whom FMR places trades on behalf of the Fund provided services to the Fund in addition to trade execution. These services included payments of certain expenses on behalf of the Fund totaling $4,275 for the period.
9. Distributions to Shareholders.
Distributions to shareholders of each class were as follows:
Years ended December 31, | 2009 | 2008 |
From net investment income | | |
Initial Class | $ 113,510 | $ 172,478 |
Investor Class | 53,699 | 78,031 |
Total | $ 167,209 | $ 250,509 |
From net realized gain | | |
Initial Class | $ - | $ 5,962,891 |
Investor Class | - | 3,317,214 |
Total | $ - | $ 9,280,105 |
10. Share Transactions.
Transactions for each class of shares were as follows:
| Shares | Dollars |
Years ended December 31, | 2009 | 2008 | 2009 | 2008 |
Initial Class | | | | |
Shares sold | 415,891 | 1,463,398 | $ 3,763,009 | $ 16,106,016 |
Reinvestment of distributions | 10,708 | 552,267 | 113,510 | 6,135,369 |
Shares redeemed | (1,578,813) | (1,462,500) | (13,902,294) | (14,698,975) |
Net increase (decrease) | (1,152,214) | 553,165 | $ (10,025,775) | $ 7,542,410 |
Investor Class | | | | |
Shares sold | 787,867 | 1,451,367 | $ 7,051,378 | $ 16,188,341 |
Reinvestment of distributions | 5,085 | 306,096 | 53,699 | 3,395,245 |
Shares redeemed | (1,213,276) | (1,053,962) | (10,443,518) | (10,595,182) |
Net increase (decrease) | (420,324) | 703,501 | $ (3,338,441) | $ 8,988,404 |
11. Other.
The Fund's organizational documents provide former and current trustees and officers with a limited indemnification against liabilities arising in connection with the performance of their duties to the Fund. In the normal course of business, the Fund may also enter into contracts that provide general indemnifications. The Fund's maximum exposure under these arrangements is unknown as this would be dependent on future claims that may be made against the Fund. The risk of material loss from such claims is considered remote.
At the end of the period, FMR or its affiliates were the owners of record of 100% of the total outstanding shares of the Fund.
Annual Report
Report of Independent Registered Public Accounting Firm
To the Trustees of Variable Insurance Products Fund IV and the Shareholders of VIP Health Care Portfolio:
In our opinion, the accompanying statement of assets and liabilities, including the schedule of investments, and the related statements of operations and of changes in net assets and the financial highlights present fairly, in all material respects, the financial position of VIP Health Care Portfolio (a fund of Variable Insurance Products Fund IV) at December 31, 2009, the results of its operations for the year then ended, the changes in its net assets for each of the two years in the period then ended and the financial highlights for each of the periods indicated, in conformity with accounting principles generally accepted in the United States of America. These financial statements and financial highlights (hereafter referred to as "financial statements") are the responsibility of the VIP Health Care Portfolio's management. Our responsibility is to express an opinion on these financial statements based on our audits. We conducted our audits of these financial statements in accordance with the standards of the Public Company Accounting Oversight Board (United States). Those standards require that we plan and perform the audit to obtain reasonable assurance about whether the financial statements are free of material misstatement. An audit includes examining, on a test basis, evidence supporting the amounts and disclosures in the financial statements, assessing the accounting principles used and significant estimates made by management, and evaluating the overall financial statement presentation. We believe that our audits, which included confirmation of securities at December 31, 2009 by correspondence with the custodian and brokers, provide a reasonable basis for our opinion.
/s/ PricewaterhouseCoopers LLP
PricewaterhouseCoopers LLP
Boston, Massachusetts
February 12, 2010
Annual Report
Trustees and Officers
The Trustees, Member of the Advisory Board, and executive officers of the trust and fund, as applicable, are listed below. The Board of Trustees governs the fund and is responsible for protecting the interests of shareholders. The Trustees are experienced executives who meet periodically throughout the year to oversee the fund's activities, review contractual arrangements with companies that provide services to the fund, and review the fund's performance. Except for James C. Curvey, each of the Trustees oversees 222 funds advised by FMR or an affiliate. Mr. Curvey oversees 410 funds advised by FMR or an affiliate.
The Trustees hold office without limit in time except that (a) any Trustee may resign; (b) any Trustee may be removed by written instrument, signed by at least two-thirds of the number of Trustees prior to such removal; (c) any Trustee who requests to be retired or who has become incapacitated by illness or injury may be retired by written instrument signed by a majority of the other Trustees; and (d) any Trustee may be removed at any special meeting of shareholders by a two-thirds vote of the outstanding voting securities of the trust. Each Trustee who is not an interested person (as defined in the 1940 Act) (Independent Trustee), shall retire not later than the last day of the calendar year in which his or her 72nd birthday occurs. The Independent Trustees may waive this mandatory retirement age policy with respect to individual Trustees. The executive officers and Advisory Board Member hold office without limit in time, except that any officer and Advisory Board Member may resign or may be removed by a vote of a majority of the Trustees at any regular meeting or any special meeting of the Trustees. Except as indicated, each individual has held the office shown or other offices in the same company for the past five years.
The fund's Statement of Additional Information (SAI) includes more information about the Trustees. To request a free copy, call Fidelity at 1-877-208-0098.
Interested Trustees*:
Correspondence intended for each Trustee who is an interested person may be sent to Fidelity Investments, 82 Devonshire Street, Boston, Massachusetts 02109.
Name, Age; Principal Occupation |
Edward C. Johnson 3d (79) |
| Year of Election or Appointment: 1983 Mr. Johnson is Trustee and Chairman of the Board of Trustees of certain Trusts. Mr. Johnson serves as Chief Executive Officer, Chairman, and a Director of FMR LLC; Chairman and a Director of FMR; Chairman and a Director of Fidelity Research & Analysis Company (FRAC); Chairman and a Director of Fidelity Investments Money Management, Inc.; and Chairman and a Director of FMR Co., Inc. In addition, Mr. Johnson serves as Chairman and Director of FIL Limited. Previously, Mr. Johnson served as President of FMR LLC (2006-2007). |
James C. Curvey (74) |
| Year of Election or Appointment: 2007 Mr. Curvey also serves as Trustee (2007-present) of other investment companies advised by FMR. Mr. Curvey is a Director of FMR and FMR Co., Inc. (2007-present). Mr. Curvey is also Vice Chairman (2006-present) and Director of FMR LLC. In addition, Mr. Curvey serves as an Overseer for the Boston Symphony Orchestra and a member of the Trustees of Villanova University. |
* Trustees have been determined to be "Interested Trustees" by virtue of, among other things, their affiliation with the trust or various entities under common control with FMR.
Independent Trustees:
Correspondence intended for each Independent Trustee (that is, the Trustees other than the Interested Trustees) may be sent to Fidelity Investments, P.O. Box 55235, Boston, Massachusetts 02205-5235.
Name, Age; Principal Occupation |
Dennis J. Dirks (61) |
| Year of Election or Appointment: 2005 Prior to his retirement in May 2003, Mr. Dirks was Chief Operating Officer and a member of the Board of The Depository Trust & Clearing Corporation (DTCC). He also served as President, Chief Operating Officer, and Board member of The Depository Trust Company (DTC) and President and Board member of the National Securities Clearing Corporation (NSCC). In addition, Mr. Dirks served as Chief Executive Officer and Board member of the Government Securities Clearing Corporation, Chief Executive Officer and Board member of the Mortgage-Backed Securities Clearing Corporation, as a Trustee and a member of the Finance Committee of Manhattan College (2005-2008), and as a Trustee and a member of the Finance Committee of AHRC of Nassau County (2006-2008). Currently, Mr. Dirks serves as a member of the Board of Directors for The Brookville Center for Children's Services, Inc. (2009-present). |
Alan J. Lacy (56) |
| Year of Election or Appointment: 2008 Mr. Lacy serves as Senior Adviser (2007-present) of Oak Hill Capital Partners, L.P. (private equity). Mr. Lacy also served as Chief Executive Officer (2000-2005) and Vice Chairman (2005-2006) of Sears Holdings Corporation and Sears, Roebuck and Co. (retail). In addition, Mr. Lacy serves as a member of the Board of Directors of The Western Union Company (global money transfer, 2006-present) and Bristol-Myers Squibb Company (global pharmaceuticals, 2007-present). Mr. Lacy is Chairman (2008-present) and a member (2006-present) of the Board of Trustees of The National Parks Conservation Association. |
Ned C. Lautenbach (65) |
| Year of Election or Appointment: 2000 Mr. Lautenbach is Chairman of the Independent Trustees of the Equity and High Income Funds (2006-present). Mr. Lautenbach is an Advisory Partner of Clayton, Dubilier & Rice, Inc. (private equity investment). Previously, Mr. Lautenbach was with the International Business Machines Corporation (IBM) from 1968 until his retirement in 1998. Mr. Lautenbach serves as a Director of Eaton Corporation (diversified industrial) as well as the Philharmonic Center for the Arts in Naples, Florida. Mr. Lautenbach is also a member of the Board of Trustees of Fairfield University (2005-present), as well as a member of the Council on Foreign Relations. Previously, Mr. Lautenbach served as a Director of Sony Corporation (2006-2007). |
Joseph Mauriello (65) |
| Year of Election or Appointment: 2008 Prior to his retirement in January 2006, Mr. Mauriello served in numerous senior management positions including Deputy Chairman and Chief Operating Officer (2004-2005), and Vice Chairman of Financial Services (2002-2004) of KPMG LLP US (professional services, 1965-2005). Mr. Mauriello currently serves as a member of the Board of Directors of XL Capital Ltd. (global insurance and re-insurance, 2006-present) and of Arcadia Resources Inc. (health care services and products, 2007-present). Previously, Mr. Mauriello served as a Director of the Hamilton Funds of the Bank of New York (2006-2007). |
Cornelia M. Small (65) |
| Year of Election or Appointment: 2005 Ms. Small is a member of the Board of Directors of the Teagle Foundation (2009-present). Ms. Small is also a member of the Investment Committee, and Chair (2008-present) and a member of the Board of Trustees of Smith College. In addition, Ms. Small serves on the Investment Committee of the Berkshire Taconic Community Foundation (2008-present). Previously, Ms. Small served as Chairperson of the Investment Committee (2002-2008) of Smith College. In addition, Ms. Small served as Chief Investment Officer, Director of Global Equity Investments, and a member of the Board of Directors of Scudder, Stevens & Clark and Scudder Kemper Investments. |
William S. Stavropoulos (70) |
| Year of Election or Appointment: 2001 Mr. Stavropoulos serves as President and Founder of the Michigan Baseball Foundation, the Great Lakes Loons (2007-present). Mr. Stavropoulos is Chairman Emeritus of the Board of Directors of The Dow Chemical Company, where he previously served in numerous senior management positions, including President, CEO (1995-2000; 2002-2004), Chairman of the Executive Committee (2000-2006), and as a member of the Board of Directors (1990-2006). Currently, Mr. Stavropoulos is a Director of Teradata Corporation (data warehousing and technology solutions, 2008-present), Chemical Financial Corporation, Maersk Inc. (industrial conglomerate), Tyco International, Inc. (multinational manufacturing and services, 2007-present), and a member of the Advisory Board for Metalmark Capital (private equity investment, 2005-present). Mr. Stavropoulos is a special advisor to Clayton, Dubilier & Rice, Inc. (private equity investment). In addition, Mr. Stavropoulos is a member of the University of Notre Dame Advisory Council for the College of Science. |
David M. Thomas (60) |
| Year of Election or Appointment: 2008 Previously, Mr. Thomas served as Executive Chairman (2005-2006) and Chairman and Chief Executive Officer (2000-2005) of IMS Health, Inc. (pharmaceutical and healthcare information solutions). In addition, Mr. Thomas serves as a member of the Board of Directors of Fortune Brands, Inc. (consumer products), and Interpublic Group of Companies, Inc. (marketing communication, 2004-present). |
Michael E. Wiley (59) |
| Year of Election or Appointment: 2008 Mr. Wiley also serves as a Director of Asia Pacific Exploration Consolidated (international oil and gas exploration and production, 2008-present), and as a member of the Board of Trustees of the University of Tulsa (2000-2006; 2007-present). Mr. Wiley serves as a Director of Tesoro Corporation (independent oil refiner and marketer, 2005-present), and a Director of Bill Barrett Corporation (exploration and production, 2005-present). In addition, Mr. Wiley also serves as a Director of Post Oak Bank (privately-held bank, 2004-present). Previously, Mr. Wiley served as a Sr. Energy Advisor of Katzenbach Partners, LLC (consulting, 2006-2007), as an Advisory Director of Riverstone Holdings (private investment), Chairman, President, and CEO of Baker Hughes, Inc. (oilfield services, 2000-2004), and as Director of Spinnaker Exploration Company (exploration and production, 2001-2005). |
Annual Report
Trustees and Officers - continued
Advisory Board Member and Executive Officers:
Correspondence intended for each executive officer and Peter S. Lynch may be sent to Fidelity Investments, 82 Devonshire Street, Boston, Massachusetts 02109.
Name, Age; Principal Occupation |
Peter S. Lynch (65) |
| Year of Election or Appointment: 2003 Member of the Advisory Board of Fidelity's Equity and High Income Funds. Mr. Lynch is Vice Chairman and a Director of FMR and FMR Co., Inc. In addition, Mr. Lynch serves as a Trustee of Boston College and as the Chairman of the Inner-City Scholarship Fund. Previously, Mr. Lynch served on the Special Olympics International Board of Directors (1997-2006). |
Kenneth B. Robins (40) |
| Year of Election or Appointment: 2008 President and Treasurer of Fidelity's Equity and High Income Funds. Mr. Robins also serves as Assistant Treasurer of other Fidelity funds (2009-present) and is an employee of Fidelity Investments (2004-present). Before joining Fidelity Investments, Mr. Robins worked at KPMG LLP, where he was a partner in KPMG's department of professional practice (2002-2004). |
Brian B. Hogan (45) |
| Year of Election or Appointment: 2009 Vice President of certain Equity Funds and Vice President of Sector Funds. Mr. Hogan also serves as Senior Vice President, Equity Research of FMR (2006-present) and President of FMR's Equity Division (2009-present). Previously, Mr. Hogan served as a portfolio manager. |
Christopher S. Bartel (38) |
| Year of Election or Appointment: 2009 Vice President of Fidelity's Sector and Real Estate Equity Funds. Mr. Bartel also serves as Senior Vice President of Equity Research (2009-present). Previously, Mr. Bartel served as Managing Director of Research (2006-2009) and an analyst and portfolio manager (2000-2006). |
Scott C. Goebel (41) |
| Year of Election or Appointment: 2008 Secretary and Chief Legal Officer (CLO) of the Fidelity funds. Mr. Goebel also serves as General Counsel, Secretary, and Senior Vice President of FMR (2008-present) and FMR Co., Inc. (2008-present); Deputy General Counsel of FMR LLC; Chief Legal Officer of Fidelity Management & Research (Hong Kong) Limited (2008-present) and Assistant Secretary of Fidelity Management & Research (Japan) Inc. (2008-present), Fidelity Investments Money Management, Inc. (2008-present), Fidelity Management & Research (U.K.) Inc. (2008-present), and Fidelity Research and Analysis Company (2008-present). Previously, Mr. Goebel served as Assistant Secretary of the Funds (2007-2008) and as Vice President and Secretary of Fidelity Distributors Corporation (FDC) (2005-2007). |
William C. Coffey (40) |
| Year of Election or Appointment: 2009 Assistant Secretary of Fidelity's Equity and High Income Funds. Mr. Coffey also serves as Vice President and Associate General Counsel of FMR LLC (2005-present), and is an employee of Fidelity Investments. |
Holly C. Laurent (55) |
| Year of Election or Appointment: 2008 Anti-Money Laundering (AML) Officer of the Fidelity funds. Ms. Laurent is an employee of Fidelity Investments. Previously, Ms. Laurent was Senior Vice President and Head of Legal for Fidelity Business Services India Pvt. Ltd. (2006-2008), and Senior Vice President, Deputy General Counsel and Group Head for FMR LLC (2005-2006). |
Christine Reynolds (51) |
| Year of Election or Appointment: 2008 Chief Financial Officer of the Fidelity funds. Ms. Reynolds became President of Fidelity Pricing and Cash Management Services (FPCMS) in August 2008. Ms. Reynolds served as Chief Operating Officer of FPCMS (2007-2008). Previously, Ms. Reynolds served as President, Treasurer, and Anti-Money Laundering officer of the Fidelity funds (2004-2007). |
Kenneth A. Rathgeber (62) |
| Year of Election or Appointment: 2004 Chief Compliance Officer of Fidelity's Equity and High Income Funds. Mr. Rathgeber is Chief Compliance Officer of Fidelity Management & Research (Hong Kong) Limited (2008-present), Fidelity Management & Research (Japan) Inc. (2008-present), FMR (2005-present), FMR Co., Inc. (2005-present), Fidelity Management & Research (U.K.) Inc. (2005-present), Fidelity Research & Analysis Company (2005-present), Fidelity Investments Money Management, Inc. (2005-present), Pyramis Global Advisors, LLC (2005-present), and Strategic Advisers, Inc. (2005-present). |
Jeffrey S. Christian (48) |
| Year of Election or Appointment: 2009 Deputy Treasurer of the Fidelity funds. Mr. Christian is an employee of Fidelity Investments. Previously, Mr. Christian served as Chief Financial Officer (2008-2009) of certain Fidelity funds, Senior Vice President of Fidelity Pricing and Cash Management Services (FPCMS) (2004-2009), and as Vice President of Business Analysis (2003-2004). |
Bryan A. Mehrmann (48) |
| Year of Election or Appointment: 2005 Deputy Treasurer of the Fidelity funds. Mr. Mehrmann is an employee of Fidelity Investments. Previously, Mr. Mehrmann served as Vice President of Fidelity Investments Institutional Services Group (FIIS)/Fidelity Investments Institutional Operations Company, Inc. (FIIOC) Client Services (1998-2004). |
Adrien E. Deberghes (42) |
| Year of Election or Appointment: 2008 Deputy Treasurer of Fidelity's Equity and High Income Funds. Mr. Deberghes is an employee of Fidelity Investments (2008-present). Previously, Mr. Deberghes served as Senior Vice President of Mutual Fund Administration at State Street Corporation (2007-2008), Senior Director of Mutual Fund Administration at Investors Bank & Trust (2005-2007), and Director of Finance for Dunkin' Brands (2000-2005). |
John R. Hebble (51) |
| Year of Election or Appointment: 2009 Assistant Treasurer of Fidelity's Equity and High Income Funds. Mr. Hebble also serves as President and Treasurer of other Fidelity funds (2008-present) and is an employee of Fidelity Investments. |
Paul M. Murphy (62) |
| Year of Election or Appointment: 2007 Assistant Treasurer of the Fidelity funds. Mr. Murphy is an employee of Fidelity Investments. Previously, Mr. Murphy served as Chief Financial Officer of the Fidelity funds (2005-2006), Vice President and Associate General Counsel of FMR (2007), and Senior Vice President of Fidelity Pricing and Cash Management Services (FPCMS) (1994-2007). |
Gary W. Ryan (51) |
| Year of Election or Appointment: 2005 Assistant Treasurer of the Fidelity funds. Mr. Ryan is an employee of Fidelity Investments. Previously, Mr. Ryan served as Vice President of Fund Reporting in Fidelity Pricing and Cash Management Services (FPCMS) (1999-2005). |
Annual Report
Distributions (Unaudited)
Initial Class and Investor Class designate 100% of the dividends distributed in December 2009, as qualifying for the dividends-received deduction for corporate shareholders.
The fund will notify shareholders in January 2010 of amounts for use in preparing 2009 income tax returns.
Annual Report
Board Approval of Investment Advisory Contracts and Management Fees
VIP Health Care Portfolio
Each year, the Board of Trustees, including the Independent Trustees (together, the Board), votes on the renewal of the management contract and sub-advisory agreements (together, the Advisory Contracts) for the fund. The Board, assisted by the advice of fund counsel and Independent Trustees' counsel, requests and considers a broad range of information throughout the year.
The Board meets regularly and, acting directly and through its separate committees, requests and receives information concerning, and considers at each of its meetings factors that are relevant to, its annual consideration of the renewal of the fund's Advisory Contracts, including the services and support provided to the fund and its shareholders. The Board has established various standing committees, each composed of Independent Trustees with varying backgrounds, to which the Board has assigned specific subject matter responsibilities in order to enhance effective decision-making by the Board. Each committee has a written charter outlining the structure and purposes of the committee. The Board also meets as needed to consider matters specifically related to the Board's annual consideration of the renewal of Advisory Contracts.
At its July 2009 meeting, the Board of Trustees, including the Independent Trustees, unanimously determined to renew the fund's Advisory Contracts. In reaching its determination, the Board considered all factors it believed relevant, including (i) the nature, extent, and quality of the services to be provided to the fund and its shareholders (including the investment performance of the fund); (ii) the competitiveness of the fund's management fee and total expenses; (iii) the total costs of the services to be provided by and the profits to be realized by Fidelity from its relationship with the fund; (iv) the extent to which economies of scale would be realized as the fund grows; and (v) whether fee levels reflect these economies of scale, if any, for the benefit of fund shareholders.
In considering whether to renew the Advisory Contracts for the fund, the Board ultimately reached a determination, with the assistance of fund counsel and Independent Trustees' counsel and through the exercise of its business judgment, that the renewal of the Advisory Contracts and the compensation to be received by Fidelity under the management contract is consistent with Fidelity's fiduciary duty under applicable law. The Board's decision to renew the Advisory Contracts was not based on any single factor noted above, but rather was based on a comprehensive consideration of all the information provided to the Board at its meetings throughout the year. The Board, in reaching its determination to renew the Advisory Contracts, is aware that shareholders in the fund have a broad range of investment choices available to them, including a wide choice among mutual funds offered by competitors to Fidelity, and that the fund's shareholders, with the opportunity to review and weigh the disclosure provided by the fund in its prospectus and other public disclosures, have chosen to invest in this fund, managed by Fidelity.
Nature, Extent, and Quality of Services Provided. The Board considered staffing within the investment adviser, FMR, and the sub-advisers (together, the Investment Advisers), including the backgrounds of the fund's investment personnel and the fund's investment objective and discipline. The Independent Trustees also had discussions with senior management of Fidelity's investment operations and investment groups. The Board considered the structure of the portfolio manager compensation program and whether this structure provides appropriate incentives.
Resources Dedicated to Investment Management and Support Services. The Board reviewed the size, education, and experience of the Investment Advisers' investment staff, their use of technology, and the Investment Advisers' approach to recruiting, training, and retaining portfolio managers and other research, advisory, and management personnel. In response to last year's financial crisis, FMR took a number of actions intended to cut costs and improve efficiency without weakening the investment teams or resources. The Board noted that Fidelity's analysts have access to a variety of technological tools and market and securities data that enable them to perform both fundamental and quantitative analysis and to specialize in various disciplines. The Board considered Fidelity's extensive global research capabilities that enable the Investment Advisers to aggregate data from various sources in an effort to produce positive investment results. The Board also considered that Fidelity's portfolio managers and analysts have access to daily portfolio attribution that allows for monitoring of a fund's portfolio, as well as an electronic communication system that provides immediate real-time access to research concerning issuers and credit enhancers.
Shareholder and Administrative Services. The Board considered (i) the nature, extent, quality, and cost of advisory, administrative, distribution, and shareholder services performed by the Investment Advisers and their affiliates under the Advisory Contracts and under separate agreements covering transfer agency, pricing and bookkeeping, and securities lending services for the fund; (ii) the nature and extent of the Investment Advisers' supervision of third party service providers, principally custodians and subcustodians; and (iii) the resources devoted to, and the record of compliance with, the fund's compliance policies and procedures. The Board also reviewed the allocation of fund brokerage, including allocations to brokers affiliated with the Investment Advisers, the use of brokerage commissions to pay fund expenses, and the use of "soft" commission dollars to pay for research services.
The Board noted that the growth of fund assets across the complex allows Fidelity to reinvest in the development of services designed to enhance the value or convenience of the Fidelity funds as investment vehicles. These services include 24-hour access to account information and market information through phone representatives and over the Internet, and investor education materials and asset allocation tools.
Investment in a Large Fund Family. The Board considered the benefits to shareholders of investing in a Fidelity fund, including the benefits of investing in a fund that is part of a large family of funds offering a variety of investment disciplines and providing for a large variety of mutual fund investor services. The Board noted that Fidelity has taken a number of actions over the previous year that benefited particular funds, including (i) dedicating additional resources to investment research and to restructure and broaden the focus of the investment research teams; (ii) bolstering the senior management team that oversees asset management; (iii) contractually agreeing to reduce the management fee on Fidelity U.S. Bond Index Fund; and (iv) expanding Class A and Class T load waiver categories to increase rollover retention opportunities and create consistent policies across the classes.
Annual Report
Board Approval of Investment Advisory Contracts and Management Fees - continued
Investment Performance. The Board considered whether the fund has operated within its investment objective, as well as its record of compliance with its investment restrictions. It also reviewed the fund's absolute investment performance for each class, as well as the fund's relative investment performance for each class measured against a third-party-sponsored index that reflects the market sector in which the fund invests over multiple periods. The Board noted that FMR does not believe that a meaningful peer group exists against which to compare the fund's performance. The following charts considered by the Board show, over the one-, three-, and five-year periods ended December 31, 2008, as available, the cumulative total returns of Initial Class and Investor Class of the fund and the cumulative total returns of a third-party-sponsored index ("benchmark").
VIP Health Care Portfolio
The Board stated that the investment performance of the fund was lower than its benchmark for all the periods shown. The Board discussed with FMR actions that have been taken by FMR to improve the fund's below-benchmark performance. The Board will continue to closely monitor the performance of the fund in the coming year and discuss with FMR other appropriate actions to address the performance of the fund. The Board considered that the variations in performance between the fund's classes reflect the variations in class expenses, which result in lower performance for the higher expense class.
The Board considered that FMR has taken steps to refocus and strengthen equity research, equity portfolio management, and compliance. The Board reviewed the year-to-date performance of Initial Class through May 31, 2009 and stated that it exceeded the fund's benchmark.
Based on its review, and giving particular weight to the nature and quality of the resources dedicated by the Investment Advisers to maintain and improve relative performance and factoring in the unprecedented market events in 2008, the Board concluded that the nature, extent, and quality of the services provided to the fund will benefit the fund's shareholders, particularly in light of the Board's view that the fund's shareholders benefit from investing in a fund that is part of a large family of funds offering a variety of investment disciplines and services.
Competitiveness of Management Fee and Total Fund Expenses. The Board considered the fund's management fee and total expenses compared to "mapped groups" of competitive funds and classes. Fidelity creates "mapped groups" by combining similar Lipper investment objective categories that have comparable management fee characteristics. Combining Lipper investment objective categories aids the Board's management fee and total expense comparisons by broadening the competitive group used for comparison and by reducing the number of universes to which various Fidelity funds are compared.
The Board considered two proprietary management fee comparisons for the 12-month periods shown in the chart below. The group of Lipper funds used by the Board for management fee comparisons is referred to below as the "Total Mapped Group." The Total Mapped Group comparison focuses on a fund's standing relative to the total universe of comparable funds available to investors, in terms of gross management fees before expense reimbursements or caps. "TMG %" represents the percentage of funds in the Total Mapped Group that had management fees that were lower than the fund's. For example, a TMG % of 4% means that 96% of the funds in the Total Mapped Group had higher management fees than the fund. The "Asset-Size Peer Group" (ASPG) comparison focuses on a fund's standing relative to non-Fidelity funds similar in size to the fund within the Total Mapped Group. The ASPG represents at least 15% of the funds in the Total Mapped Group with comparable asset size and management fee characteristics, subject to a minimum of 50 funds (or all funds in the Total Mapped Group if fewer than 50). Additional information, such as the ASPG quartile in which the fund's management fee ranked, is also included in the chart and considered by the Board.
Annual Report
VIP Health Care Portfolio

The Board noted that the fund's management fee ranked below the median of its Total Mapped Group and below the median of its ASPG for 2008.
Based on its review, the Board concluded that the fund's management fee was fair and reasonable in light of the services that the fund receives and the other factors considered.
In its review of each class's total expenses, the Board considered the fund's management fee as well as other fund or class expenses, as applicable, such as transfer agent fees, pricing and bookkeeping fees, and custodial, legal, and audit fees. The Board also noted the effects of any waivers and reimbursements on fees and expenses. As part of its review, the Board also considered current and historical total expenses of each class of the fund compared to competitive fund median expenses. Each class of the fund is compared to those funds and classes in the Total Mapped Group (used by the Board for management fee comparisons) that have a similar sales load structure.
The Board noted that the total expenses of each class ranked below its competitive median for 2008.
In its review of total expenses, the Board also considered Fidelity fee structures and other information on clients that FMR and its affiliates service in other competitive markets, such as other mutual funds advised or subadvised by FMR or its affiliates, pension plan clients, and other institutional clients.
Based on its review, the Board concluded that the total expenses of each class of the fund were reasonable in light of the services that the fund and its shareholders receive and the other factors considered.
Costs of the Services and Profitability. The Board considered the revenues earned and the expenses incurred by Fidelity in conducting the business of developing, marketing, distributing, managing, administering and servicing the fund and its shareholders. The Board also considered the level of Fidelity's profits in respect of all the Fidelity funds.
On an annual basis, FMR presents to the Board Fidelity's profitability for the fund. Fidelity calculates the profitability for each fund, as well as aggregate profitability for groups of Fidelity funds and all Fidelity funds, using a series of detailed revenue and cost allocation methodologies which originate with the audited books and records of Fidelity. The Audit Committee of the Board reviews any significant changes from the prior year's methodologies.
PricewaterhouseCoopers LLP (PwC), independent registered public accounting firm and auditor to Fidelity and certain Fidelity funds, has been engaged annually by the Board as part of the Board's assessment of Fidelity's profitability analysis. PwC's engagement includes the review and assessment of Fidelity's methodologies used in determining the revenues and expenses attributable to Fidelity's mutual fund business, and completion of agreed-upon procedures surrounding the mathematical accuracy of fund profitability and its conformity to allocation methodologies. After considering PwC's reports issued under the engagement and information provided by Fidelity, the Board believes that while other allocation methods may also be reasonable, Fidelity's profitability methodologies are reasonable in all material respects.
The Board has also reviewed Fidelity's non-fund businesses and any fall-out benefits related to the mutual fund business as well as cases where Fidelity's affiliates may benefit from or be related to the fund's business.
Annual Report
Board Approval of Investment Advisory Contracts and Management Fees - continued
The Board considered the costs of the services provided by and the profits realized by Fidelity in connection with the operation of the fund and determined that the amount of profit is a fair entrepreneurial profit for the management of the fund.
Economies of Scale. The Board considered whether there have been economies of scale in respect of the management of the Fidelity funds, whether the Fidelity funds (including the fund) have appropriately benefited from any such economies of scale, and whether there is potential for realization of any further economies of scale. The Board considered the extent to which the fund will benefit from economies of scale through increased services to the fund, through waivers or reimbursements, or through fee or expense reductions.
In February 2009, the Board created an Ad Hoc Committee (the "Committee") to analyze economies of scale. The Committee was formed to consider whether FMR attains economies of scale in respect of the management and servicing of the Fidelity funds, whether the Fidelity funds have appropriately benefited from such economies of scale, and whether there is potential for realization of any further economies of scale.
The Board recognized that the fund's management contract incorporates a "group fee" structure, which provides for lower group fee rates as total fund assets under FMR's management increase, and for higher group fee rates as total fund assets under FMR's management decrease. FMR determines the group fee rates based on a tiered asset "breakpoint" schedule. The Board considered that the group fee is designed to deliver the benefits of economies of scale to fund shareholders when total fund assets increase, even if assets of any particular fund are unchanged or have declined, because some portion of Fidelity's costs are attributable to services provided to all Fidelity funds, and all funds benefit if those costs can be allocated among more assets. The Board concluded that, given the group fee structure, fund shareholders will achieve a certain level of economies of scale as assets under FMR's management increase at the fund complex level, regardless of whether Fidelity achieves any such economies of scale.
The Board concluded, considering the findings of the Committee, that any potential economies of scale are being shared between fund shareholders and Fidelity in an appropriate manner.
Additional Information Requested by the Board. In order to develop fully the factual basis for consideration of the Fidelity funds' Advisory Contracts, the Board requested and received additional information on certain topics, including (i) fund performance trends, actions to be taken by FMR to improve certain funds' overall performance and Fidelity's long-term strategies for certain funds; (ii) portfolio manager changes that have occurred during the past year; (iii) Fidelity's compensation structure for portfolio managers and key personnel, including performance benchmarks used by Fidelity in evaluating incentive compensation for portfolio managers and research analysts; (iv) the structure and process of equity research and actions taken by FMR to improve the quality of research; (v) the selection of and compensation paid by FMR to fund sub-advisers; (vi) Fidelity's fee structures and rationale for recommending different fees among categories of funds; (vii) the rationale for any differences between fund fee structures and fee structures in place for other Fidelity clients; (viii) Fidelity's rationale for recommending which funds should have a performance adjustment component as part of their management fees; and (ix) explanations for the relative total expenses borne by certain funds and classes, total expense competitive trends, and actions that might be taken by FMR to reduce total expenses for certain funds and classes.
Based on its evaluation of all of the conclusions noted above, and after considering all material factors, the Board ultimately concluded that the advisory fee structures are fair and reasonable, and that the fund's Advisory Contracts should be renewed.
Annual Report
Investment Adviser
Fidelity Management & Research Company
Boston, MA
Investment Sub-Advisers
FMR Co., Inc.
Fidelity Management & Research (U.K.) Inc.
Fidelity Research & Analysis Company
FIL Investments (Japan) Limited
FIL Investment Advisors
FIL Investment Advisors (U.K.) Ltd.
Fidelity Management & Research (Hong Kong) Limited
Fidelity Management & Research (Japan) Inc.
General Distributor
Fidelity Distributors Corporation
Boston, MA
Transfer and Service Agents
Fidelity Investments Institutional Operations Company, Inc.
Boston, MA
Fidelity Service Company, Inc.
Boston, MA
Custodian
JPMorgan Chase Bank
New York, NY
VHCIC-ANN-0210
1.817373.104
Fidelity® Variable Insurance Products:
Industrials Portfolio
Annual Report
December 31, 2009
(2_fidelity_logos) (Registered_Trademark)
Contents
Performance | <Click Here> | How the fund has done over time. |
Management's Discussion | <Click Here> | The manager's review of fund performance, strategy and outlook. |
Shareholder Expense Example | <Click Here> | An example of shareholder expenses. |
Investment Changes | <Click Here> | A summary of major shifts in the fund's investments over the past six months. |
Investments | <Click Here> | A complete list of the fund's investments with their market values. |
Financial Statements | <Click Here> | Statements of assets and liabilities, operations, and changes in net assets, as well as financial highlights. |
Notes | <Click Here> | Notes to the financial statements. |
Report of Independent Registered Public Accounting Firm | <Click Here> | |
Trustees and Officers | <Click Here> | |
Distributions | <Click Here> | |
Board Approval of Investment Advisory Contracts and Management Fees | <Click Here> | |
To view a fund's proxy voting guidelines and proxy voting record for the 12-month period ended June 30, visit http://www.fidelity.com/proxyvotingresults or visit the Securities and Exchange Commission's (SEC) web site at http://www.sec.gov. You may also call 1-877-208-0098 to request a free copy of the proxy voting guidelines.
Fidelity Variable Insurance Products are separate account options which are purchased through a variable insurance contract.
Standard & Poor's, S&P and S&P 500 are registered service marks of The McGraw-Hill Companies, Inc. and have been licensed for use by Fidelity Distributors Corporation.
Other third party marks appearing herein are the property of their respective owners.
All other marks appearing herein are registered or unregistered trademarks or service marks of FMR LLC or an affiliated company.
This report and the financial statements contained herein are submitted for the general information of the shareholders of the fund. This report is not authorized for distribution to prospective investors in the fund unless preceded or accompanied by an effective prospectus.
A fund files its complete schedule of portfolio holdings with the SEC for the first and third quarters of each fiscal year on Form N-Q. Forms N-Q are available on the SEC's web site at http://www.sec.gov. A fund's Forms N-Q may be reviewed and copied at the SEC's Public Reference Room in Washington, DC. Information regarding the operation of the SEC's Public Reference Room may be obtained by calling 1-800-SEC-0330. For a complete list of the fund's portfolio holdings, view the most recent holdings listing, semiannual report, or annual report on Fidelity's web site at http://www.fidelity.com or http://www.advisor.fidelity.com, as applicable.
NOT FDIC INSURED · MAY LOSE VALUE · NO BANK GUARANTEE
Neither the fund nor Fidelity Distributors Corporation is a bank.
Annual Report
Average annual total return reflects the change in the value of an investment, assuming reinvestment of the class' dividend income and capital gains (the profits earned upon the sale of securities that have grown in value, if any) and assuming a constant rate of performance each year. During periods of reimbursement by Fidelity, a fund's total return will be greater than it would be had the reimbursement not occurred. Performance numbers are net of all underlying fund operating expenses, but do not include any insurance charges imposed by your insurance company's separate account. If performance information included the effect of these additional charges, the total returns would have been lower. How a fund did yesterday is no guarantee of how it will do tomorrow.
Average Annual Total Returns
Periods ended December 31, 2009 | Past 1
year | Past 5
years | Life of fund A |
VIP Industrials - Initial Class C | 40.22% | 5.43% | 7.26% |
VIP Industrials - Investor Class B,C | 39.97% | 5.32% | 7.19% |
A From July 18, 2001.
B The initial offering of Investor Class shares took place on July 21, 2005. Returns prior to July 21, 2005, are those of Initial Class. Had Investor Class's transfer agent fee been reflected, returns prior to July 21, 2005 would have been lower.
C Prior to October 1, 2006, VIP Industrials Portfolio operated under certain different investment policies. The historical performance for the fund may not represent its current investment policies.
$10,000 Over Life of Fund
Let's say hypothetically that $10,000 was invested in VIP Industrials Portfolio - Initial Class on July 18, 2001, when the fund started. The chart shows how the value of your investment would have changed, and also shows how the Standard & Poor's 500SM Index (S&P 500®) performed over the same period.
Annual Report
Market Recap: In 2009, most global markets saw both crippling lows and considerable highs. After a dismal start, the economy began to show signs of improvement, suggesting that a recovery was on the horizon. Credit markets began to heal as fiscal and monetary stimulus efforts around the world started to take effect, and corporate earnings staged an impressive rebound, fueled in large part by massive cost cutting. As a result, the flight to quality that marked most of 2008 and early 2009 shifted in March as investors flocked to riskier asset categories. The U.S. equity market, as measured by the bellwether Standard & Poor's 500SM Index and the blue-chip proxy Dow Jones Industrial AverageSM, reflected this changing environment, gaining 26.46% and 22.68%, respectively. Meanwhile, the technology-laden Nasdaq Composite® Index rose 45.32%. Foreign stocks also produced strong gains, as illustrated by the 31.93% jump of the MSCI® EAFE® Index (Europe, Australasia, Far East), a gauge of developed stock markets outside the U.S. and Canada. Emerging-markets stocks, which suffered their worst calendar-year performance ever in 2008, posted record returns this past year, with the MSCI Emerging Markets Index soaring 79.02%. A depreciating U.S. dollar helped bolster returns for U.S. investors in foreign equities.
Comments from Tobias Welo, Portfolio Manager of VIP Industrials Portfolio: During the past year, the fund soundly beat the S&P 500® and almost doubled the 22.54% return of the MSCI U.S. Investable Market Industrials Index. (For specific portfolio results, please refer to the performance section of this report.) Versus our sector benchmark, a significant underweighting and favorable stock picking in industrial conglomerates added the most to our relative performance. Stock selection in tires and rubber, specialty chemicals, aerospace and defense, and industrial machinery also bolstered our results, as did underweighting construction/engineering and overweighting construction and farm machinery/heavy trucks. The top contributor was industrial conglomerate General Electric, which helped fund performance on a relative basis because the stock was a laggard and we carried a significant underweighting in it. Also boosting performance were Goodyear Tire & Rubber, Cummins and Navistar International, which are involved in the production of heavy trucks or truck engines, and specialty chemicals maker W.R. Grace & Co. Goodyear and W.R. Grace were out-of-index positions. Negative factors, which had a very limited impact on performance, included weak stock selection in heavy electrical equipment and in security and alarm services. At the stock level, not owning industrial conglomerate and major index component 3M worked against us when the market was falling. Another detractor, Manitowoc, builds cranes and provides refrigeration equipment. My growing concern over potential further deterioration in the company's earnings if it was forced to do a secondary equity offering led me to sell the stock at a loss. I also missed most of the substantial gains in mining equipment makers and index components Joy Global and Bucyrus International.
Note to shareholders: In January 2010, Fidelity adopted capped benchmarks for most of its sector and industry funds, including the VIP sector portfolios. The capped benchmarks, which limit the weightings of individual issuers, better represent the investment opportunities available to the funds and will provide shareholders with more-meaningful performance comparisons. These changes do not affect the investment policies of any of the funds, and the primary benchmark for all of the funds remains the Standard & Poor's 500 Index.
The views expressed above reflect those of the portfolio manager(s) only through the end of the period as stated on the cover of this report and do not necessarily represent the views of Fidelity or any other person in the Fidelity organization. Any such views are subject to change at any time based upon market or other conditions and Fidelity disclaims any responsibility to update such views. These views may not be relied on as investment advice and, because investment decisions for a Fidelity fund are based on numerous factors, may not be relied on as an indication of trading intent on behalf of any Fidelity fund.
Annual Report
Shareholder Expense Example
As a shareholder of the Fund, you incur two types of costs: (1) transaction costs, including redemption fees, and (2) ongoing costs, including management fees and other Fund expenses. This Example is intended to help you understand your ongoing costs (in dollars) of investing in the Fund and to compare these costs with the ongoing costs of investing in other mutual funds.
The Example is based on an investment of $1,000 invested at the beginning of the period and held for the entire period (July 1, 2009 to December 31, 2009).
Actual Expenses
The first line of the accompanying table for each class of the Fund provides information about actual account values and actual expenses. You may use the information in this line, together with the amount you invested, to estimate the expenses that you paid over the period. Simply divide your account value by $1,000.00 (for example, an $8,600 account value divided by $1,000.00 = 8.6), then multiply the result by the number in the first line for a class of the Fund under the heading entitled "Expenses Paid During Period" to estimate the expenses you paid on your account during this period. The estimate of expenses does not include any fees or other expenses of any variable annuity or variable life insurance product. If they were, the estimate of expenses you paid during the period would be higher, and your ending account value would be lower. In addition, the Fund, as a shareholder in the underlying Fidelity Central Funds, will indirectly bear its pro-rata share of the fees and expenses incurred by the underlying Fidelity Central Funds. These fees and expenses are not included in the Fund's annualized expense ratio used to calculate the expense estimate in the table below.
Hypothetical Example for Comparison Purposes
The second line of the accompanying table for each class of the Fund provides information about hypothetical account values and hypothetical expenses based on a Class' actual expense ratio and an assumed rate of return of 5% per year before expenses, which is not the Class' actual return. The hypothetical account values and expenses may not be used to estimate the actual ending account balance or expenses you paid for the period. You may use this information to compare the ongoing costs of investing in the Fund and other funds. To do so, compare this 5% hypothetical example with the 5% hypothetical examples that appear in the shareholder reports of the other funds. The estimate of expenses does not include any fees or other expenses of any variable annuity or variable life insurance product. If they were, the estimate of expenses you paid during the period would be higher, and your ending account value would be lower. In addition, the Fund, as a shareholder in the underlying Fidelity Central Funds, will indirectly bear its pro-rata share of the fees and expenses incurred by the underlying Fidelity Central Funds. These fees and expenses are not included in the Fund's annualized expense ratio used to calculate the expense estimate in the table below.
Please note that the expenses shown in the table are meant to highlight your ongoing costs only and do not reflect any transaction costs. Therefore, the second line of the table is useful in comparing ongoing costs only, and will not help you determine the relative total costs of owning different funds. In addition, if these transactional costs were included, your costs would have been higher.
| Annualized
Expense Ratio | Beginning
Account Value
July 1, 2009 | Ending
Account Value
December 31, 2009 | Expenses Paid
During Period*
July 1, 2009 to
December 31, 2009 |
Initial Class | .80% | | | |
Actual | | $ 1,000.00 | $ 1,327.70 | $ 4.69 |
Hypothetical A | | $ 1,000.00 | $ 1,021.17 | $ 4.08 |
Investor Class | .89% | | | |
Actual | | $ 1,000.00 | $ 1,326.60 | $ 5.22 |
Hypothetical A | | $ 1,000.00 | $ 1,020.72 | $ 4.53 |
A 5% return per year before expenses
* Expenses are equal to each Class' annualized expense ratio, multiplied by the average account value over the period, multiplied by 184/365 (to reflect the one-half year period).
Annual Report
Investment Changes (Unaudited)
Top Ten Stocks as of December 31, 2009 |
| % of fund's
net assets | % of fund's net assets
6 months ago |
United Technologies Corp. | 6.8 | 5.8 |
3M Co. | 4.6 | 3.4 |
Union Pacific Corp. | 4.3 | 5.3 |
Honeywell International, Inc. | 3.5 | 4.6 |
Danaher Corp. | 3.3 | 3.6 |
Ingersoll-Rand Co. Ltd. | 3.3 | 1.7 |
Cummins, Inc. | 3.3 | 4.0 |
General Electric Co. | 2.8 | 4.3 |
Deere & Co. | 2.5 | 2.1 |
Raytheon Co. | 2.4 | 2.0 |
| 36.8 | |
Top Industries (% of fund's net assets) |
As of December 31, 2009 |
| Machinery | 21.6% | |
| Aerospace & Defense | 19.8% | |
| Road & Rail | 13.2% | |
| Industrial Conglomerates | 10.4% | |
| Electrical Equipment | 5.3% | |
| All Others* | 29.7% | |

As of June 30, 2009 |
| Machinery | 19.4% | |
| Aerospace & Defense | 18.6% | |
| Road & Rail | 13.8% | |
| Industrial Conglomerates | 10.6% | |
| Electrical Equipment | 10.5% | |
| All Others* | 27.1% | |

* Includes short-term investments and net other assets. |
Annual Report
Investments December 31, 2009
Showing Percentage of Net Assets
Common Stocks - 99.2% |
| Shares | | Value |
AEROSPACE & DEFENSE - 19.8% |
Aerospace & Defense - 19.8% |
BE Aerospace, Inc. (a) | 20,781 | | $ 488,354 |
Honeywell International, Inc. | 52,000 | | 2,038,400 |
Lockheed Martin Corp. | 18,200 | | 1,371,370 |
Precision Castparts Corp. | 11,700 | | 1,291,095 |
Raytheon Co. | 27,025 | | 1,392,328 |
Spirit AeroSystems Holdings, Inc. Class A (a) | 20,900 | | 415,074 |
The Boeing Co. | 10,600 | | 573,778 |
United Technologies Corp. | 56,499 | | 3,921,593 |
| | 11,491,992 |
AIR FREIGHT & LOGISTICS - 2.2% |
Air Freight & Logistics - 2.2% |
United Parcel Service, Inc. Class B | 21,700 | | 1,244,929 |
AUTO COMPONENTS - 3.6% |
Auto Parts & Equipment - 2.6% |
BorgWarner, Inc. | 13,600 | | 451,792 |
Exide Technologies (a) | 13,405 | | 95,310 |
Johnson Controls, Inc. | 31,800 | | 866,232 |
Stoneridge, Inc. (a) | 13,340 | | 120,193 |
| | 1,533,527 |
Tires & Rubber - 1.0% |
The Goodyear Tire & Rubber Co. (a) | 39,880 | | 562,308 |
TOTAL AUTO COMPONENTS | | 2,095,835 |
BEVERAGES - 0.3% |
Soft Drinks - 0.3% |
Heckmann Corp. (a) | 36,700 | | 183,133 |
BUILDING PRODUCTS - 4.3% |
Building Products - 4.3% |
AAON, Inc. | 10,400 | | 202,696 |
Armstrong World Industries, Inc. (a) | 7,300 | | 284,189 |
Lennox International, Inc. | 5,000 | | 195,200 |
Masco Corp. | 90,820 | | 1,254,224 |
Owens Corning (a) | 22,000 | | 564,080 |
| | 2,500,389 |
CHEMICALS - 0.5% |
Specialty Chemicals - 0.5% |
W.R. Grace & Co. (a) | 11,879 | | 301,133 |
COMMERCIAL SERVICES & SUPPLIES - 4.9% |
Commercial Printing - 0.8% |
R.R. Donnelley & Sons Co. | 22,500 | | 501,075 |
Diversified Support Services - 0.7% |
Cintas Corp. | 15,100 | | 393,355 |
Environmental & Facility Services - 2.2% |
Casella Waste Systems, Inc. Class A (a) | 59,411 | | 238,832 |
Clean Harbors, Inc. (a) | 5,800 | | 345,738 |
|
| Shares | | Value |
Republic Services, Inc. | 18,644 | | $ 527,812 |
RINO International Corp. (a)(c) | 5,300 | | 146,545 |
| | 1,258,927 |
Office Services & Supplies - 0.6% |
United Stationers, Inc. (a) | 6,268 | | 356,336 |
Security & Alarm Services - 0.6% |
The Brink's Co. | 13,700 | | 333,458 |
TOTAL COMMERCIAL SERVICES & SUPPLIES | | 2,843,151 |
CONSTRUCTION & ENGINEERING - 3.1% |
Construction & Engineering - 3.1% |
AECOM Technology Corp. (a) | 6,300 | | 173,250 |
Fluor Corp. | 17,257 | | 777,255 |
Jacobs Engineering Group, Inc. (a) | 17,200 | | 646,892 |
MasTec, Inc. (a) | 17,400 | | 217,500 |
| | 1,814,897 |
DIVERSIFIED CONSUMER SERVICES - 0.4% |
Specialized Consumer Services - 0.4% |
Brinks Home Security Holdings, Inc. (a) | 7,625 | | 248,880 |
ELECTRICAL EQUIPMENT - 5.3% |
Electrical Components & Equipment - 5.3% |
Acuity Brands, Inc. (c) | 15,458 | | 550,923 |
AMETEK, Inc. | 19,050 | | 728,472 |
Cooper Industries PLC Class A | 19,300 | | 822,952 |
General Cable Corp. (a) | 11,600 | | 341,272 |
Regal-Beloit Corp. | 11,966 | | 621,514 |
| | 3,065,133 |
ELECTRONIC EQUIPMENT & COMPONENTS - 1.3% |
Electronic Equipment & Instruments - 0.8% |
FLIR Systems, Inc. (a) | 14,598 | | 477,647 |
Technology Distributors - 0.5% |
Anixter International, Inc. (a) | 6,400 | | 301,440 |
TOTAL ELECTRONIC EQUIPMENT & COMPONENTS | | 779,087 |
HOUSEHOLD DURABLES - 2.2% |
Homebuilding - 0.7% |
PDG Realty S.A. Empreendimentos e Participacoes | 26,800 | | 266,924 |
Pulte Homes, Inc. | 12,090 | | 120,900 |
| | 387,824 |
Household Appliances - 1.5% |
Black & Decker Corp. | 13,700 | | 888,171 |
TOTAL HOUSEHOLD DURABLES | | 1,275,995 |
INDUSTRIAL CONGLOMERATES - 10.4% |
Industrial Conglomerates - 10.4% |
3M Co. | 32,600 | | 2,695,042 |
Carlisle Companies, Inc. | 10,900 | | 373,434 |
General Electric Co. | 106,034 | | 1,604,294 |
Common Stocks - continued |
| Shares | | Value |
INDUSTRIAL CONGLOMERATES - CONTINUED |
Industrial Conglomerates - continued |
Koninklijke Philips Electronics NV | 10,800 | | $ 318,818 |
Textron, Inc. | 40,000 | | 752,400 |
Tyco International Ltd. | 7,481 | | 266,922 |
| | 6,010,910 |
MACHINERY - 21.6% |
Construction & Farm Machinery & Heavy Trucks - 10.5% |
Bucyrus International, Inc. Class A | 3,500 | | 197,295 |
Cummins, Inc. | 41,080 | | 1,883,929 |
Deere & Co. | 27,000 | | 1,460,430 |
Joy Global, Inc. | 5,000 | | 257,950 |
Navistar International Corp. (a) | 23,886 | | 923,194 |
Oshkosh Co. | 6,700 | | 248,101 |
PACCAR, Inc. | 28,800 | | 1,044,576 |
Sany Heavy Equipment International Holdings Co. Ltd. | 48,000 | | 60,062 |
| | 6,075,537 |
Industrial Machinery - 11.1% |
Actuant Corp. Class A | 12,000 | | 222,360 |
Altra Holdings, Inc. (a) | 20,989 | | 259,214 |
Barnes Group, Inc. | 8,075 | | 136,468 |
Blount International, Inc. (a) | 14,499 | | 146,440 |
Danaher Corp. | 25,600 | | 1,925,120 |
Ingersoll-Rand Co. Ltd. | 53,300 | | 1,904,942 |
Kennametal, Inc. | 17,100 | | 443,232 |
Parker Hannifin Corp. | 9,800 | | 528,024 |
Timken Co. | 15,600 | | 369,876 |
TriMas Corp. (a) | 37,829 | | 256,102 |
Weg SA | 26,500 | | 278,987 |
| | 6,470,765 |
TOTAL MACHINERY | | 12,546,302 |
MARINE - 0.3% |
Marine - 0.3% |
Ultrapetrol (Bahamas) Ltd. (a) | 29,902 | | 142,334 |
OIL, GAS & CONSUMABLE FUELS - 0.5% |
Coal & Consumable Fuels - 0.5% |
Peabody Energy Corp. | 6,800 | | 307,428 |
PROFESSIONAL SERVICES - 2.0% |
Human Resource & Employment Services - 0.8% |
Manpower, Inc. | 8,620 | | 470,480 |
Research & Consulting Services - 1.2% |
Equifax, Inc. | 15,900 | | 491,151 |
ICF International, Inc. (a) | 7,500 | | 201,000 |
| | 692,151 |
TOTAL PROFESSIONAL SERVICES | | 1,162,631 |
|
| Shares | | Value |
ROAD & RAIL - 13.2% |
Railroads - 9.7% |
America Latina Logistica SA unit | 29,500 | | $ 272,490 |
CSX Corp. | 23,061 | | 1,118,228 |
Genesee & Wyoming, Inc. Class A (a) | 8,000 | | 261,120 |
Kansas City Southern (a) | 10,700 | | 356,203 |
Norfolk Southern Corp. | 21,490 | | 1,126,506 |
Union Pacific Corp. | 39,300 | | 2,511,270 |
| | 5,645,817 |
Trucking - 3.5% |
Arkansas Best Corp. | 10,000 | | 294,300 |
Avis Budget Group, Inc. (a) | 68,184 | | 894,574 |
Con-way, Inc. | 5,200 | | 181,532 |
Hertz Global Holdings, Inc. (a)(c) | 36,800 | | 438,656 |
Saia, Inc. (a) | 15,600 | | 231,192 |
| | 2,040,254 |
TOTAL ROAD & RAIL | | 7,686,071 |
SOFTWARE - 0.2% |
Application Software - 0.2% |
Solera Holdings, Inc. | 3,901 | | 140,475 |
TRADING COMPANIES & DISTRIBUTORS - 3.1% |
Trading Companies & Distributors - 3.1% |
Interline Brands, Inc. (a) | 33,100 | | 571,637 |
Rush Enterprises, Inc. Class A (a) | 84,149 | | 1,000,532 |
United Rentals, Inc. (a) | 20,200 | | 198,162 |
| | 1,770,331 |
TOTAL COMMON STOCKS (Cost $51,297,391) | 57,611,036 |
Money Market Funds - 3.2% |
| | | |
Fidelity Cash Central Fund, 0.16% (d) | 654,203 | | 654,203 |
Fidelity Securities Lending Cash Central Fund, 0.15% (b)(d) | 1,163,600 | | 1,163,600 |
TOTAL MONEY MARKET FUNDS (Cost $1,817,803) | 1,817,803 |
TOTAL INVESTMENT PORTFOLIO - 102.4% (Cost $53,115,194) | | 59,428,839 |
NET OTHER ASSETS - (2.4)% | | (1,366,025) |
NET ASSETS - 100% | $ 58,062,814 |
Legend |
(a) Non-income producing |
(b) Investment made with cash collateral received from securities on loan. |
(c) Security or a portion of the security is on loan at period end. |
(d) Affiliated fund that is available only to investment companies and other accounts managed by Fidelity Investments. The rate quoted is the annualized seven-day yield of the fund at period end. A complete unaudited listing of the fund's holdings as of its most recent quarter end is available upon request. |
Affiliated Central Funds |
Information regarding fiscal year to date income earned by the Fund from investments in Fidelity Central Funds is as follows: |
Fund | Income earned |
Fidelity Cash Central Fund | $ 4,913 |
Fidelity Securities Lending Cash Central Fund | 21,392 |
Total | $ 26,305 |
Other Information |
The following is a summary of the inputs used, as of December 31, 2009, involving the Fund's assets and liabilities carried at value. The inputs or methodology used for valuing securities may not be an indication of the risk associated with investing in those securities. For more information on valuation inputs, and their aggregation into the levels used in the table below, please refer to the Security Valuation section in the accompanying Notes to Financial Statements. |
Valuation Inputs at Reporting Date: |
Description | Total | Level 1 | Level 2 | Level 3 |
Investments in Securities: | | | | |
Common Stocks | $ 57,611,036 | $ 57,232,156 | $ 378,880 | $ - |
Money Market Funds | 1,817,803 | 1,817,803 | - | - |
Total Investments in Securities: | $ 59,428,839 | $ 59,049,959 | $ 378,880 | $ - |
Income Tax Information |
At December 31, 2009, the fund had a capital loss carryforward of approximately $14,293,917 of which $5,257,797 and $9,036,120 will expire on December 31, 2016 and 2017, respectively. |
The fund intends to elect to defer to its fiscal year ending December 31, 2010 approximately $5,984 of currency losses recognized during the period November 1, 2009 to December 31, 2009. |
See accompanying notes which are an integral part of the financial statements.
Annual Report
Statement of Assets and Liabilities
| December 31, 2009 |
| | |
Assets | | |
Investment in securities, at value (including securities loaned of $1,115,083) - See accompanying schedule: Unaffiliated issuers (cost $51,297,391) | $ 57,611,036 | |
Fidelity Central Funds (cost $1,817,803) | 1,817,803 | |
Total Investments (cost $53,115,194) | | $ 59,428,839 |
Receivable for investments sold | | 197,120 |
Receivable for fund shares sold | | 17,275 |
Dividends receivable | | 57,945 |
Distributions receivable from Fidelity Central Funds | | 1,275 |
Prepaid expenses | | 252 |
Other receivables | | 1,263 |
Total assets | | 59,703,969 |
| | |
Liabilities | | |
Payable for investments purchased | $ 406,383 | |
Payable for fund shares redeemed | 1,243 | |
Accrued management fee | 26,957 | |
Other affiliated payables | 6,861 | |
Other payables and accrued expenses | 36,111 | |
Collateral on securities loaned, at value | 1,163,600 | |
Total liabilities | | 1,641,155 |
| | |
Net Assets | | $ 58,062,814 |
Net Assets consist of: | | |
Paid in capital | | $ 66,780,876 |
Distributions in excess of net investment income | | (5,985) |
Accumulated undistributed net realized gain (loss) on investments and foreign currency transactions | | (15,025,655) |
Net unrealized appreciation (depreciation) on investments and assets and liabilities in foreign currencies | | 6,313,578 |
Net Assets | | $ 58,062,814 |
Statement of Assets and Liabilities - continued
| December 31, 2009 |
| | |
Initial Class:
Net Asset Value, offering price and redemption price per share ($32,183,376 ÷ 2,767,817 shares) | | $ 11.63 |
| | |
Investor Class:
Net Asset Value, offering price and redemption price per share ($25,879,438 ÷ 2,233,810 shares) | | $ 11.59 |
See accompanying notes which are an integral part of the financial statements.
Annual Report
Financial Statements - continued
Statement of Operations
| Year ended December 31, 2009 |
| | |
Investment Income | | |
Dividends | | $ 864,735 |
Interest | | 4 |
Income from Fidelity Central Funds | | 26,305 |
Total income | | 891,044 |
| | |
Expenses | | |
Management fee | $ 262,965 | |
Transfer agent fees | 62,668 | |
Accounting and security lending fees | 18,430 | |
Custodian fees and expenses | 11,226 | |
Independent trustees' compensation | 316 | |
Audit | 38,867 | |
Legal | 252 | |
Miscellaneous | 4,160 | |
Total expenses before reductions | 398,884 | |
Expense reductions | (2,017) | 396,867 |
Net investment income (loss) | | 494,177 |
Realized and Unrealized Gain (Loss) Net realized gain (loss) on: | | |
Investment securities: | | |
Unaffiliated issuers | (3,156,400) | |
Foreign currency transactions | (13,637) | |
Total net realized gain (loss) | | (3,170,037) |
Change in net unrealized appreciation (depreciation) on: Investment securities | 18,874,662 | |
Assets and liabilities in foreign currencies | 319 | |
Total change in net unrealized appreciation (depreciation) | | 18,874,981 |
Net gain (loss) | | 15,704,944 |
Net increase (decrease) in net assets resulting from operations | | $ 16,199,121 |
Statement of Changes in Net Assets
| Year ended
December 31, 2009 | Year ended
December 31, 2008 |
Increase (Decrease) in Net Assets | | |
Operations | | |
Net investment income (loss) | $ 494,177 | $ 628,154 |
Net realized gain (loss) | (3,170,037) | (11,758,944) |
Change in net unrealized appreciation (depreciation) | 18,874,981 | (20,071,036) |
Net increase (decrease) in net assets resulting from operations | 16,199,121 | (31,201,826) |
Distributions to shareholders from net investment income | (506,005) | (647,391) |
Distributions to shareholders from net realized gain | - | (1,349,574) |
Total distributions | (506,005) | (1,996,965) |
Share transactions - net increase (decrease) | 1,252,954 | (2,375,514) |
Redemption fees | 11,631 | 30,102 |
Total increase (decrease) in net assets | 16,957,701 | (35,544,203) |
| | |
Net Assets | | |
Beginning of period | 41,105,113 | 76,649,316 |
End of period (including distributions in excess of net investment income of $5,985 and undistributed net investment income of $0, respectively) | $ 58,062,814 | $ 41,105,113 |
See accompanying notes which are an integral part of the financial statements.
Annual Report
Financial Highlights - Initial Class
Years ended December 31, | 2009 | 2008 | 2007 | 2006 | 2005 |
Selected Per-Share Data | | | | | |
Net asset value, beginning of period | $ 8.37 | $ 14.43 | $ 13.90 | $ 14.20 | $ 13.81 |
Income from Investment Operations | | | | | |
Net investment income (loss) C | .10 | .12 | .10 | .14 | .08 |
Net realized and unrealized gain (loss) | 3.27 | (5.79) | 2.43 | 2.02 | 1.70 |
Total from investment operations | 3.37 | (5.67) | 2.53 | 2.16 | 1.78 |
Distributions from net investment income | (.11) | (.14) | (.09) | (.15) | (.10) |
Distributions from net realized gain | - | (.26) | (1.91) | (2.33) | (1.30) |
Total distributions | (.11) | (.40) | (2.00) | (2.47) H | (1.40) |
Redemption fees added to paid in capital C | - G | .01 | - G | .01 | .01 |
Net asset value, end of period | $ 11.63 | $ 8.37 | $ 14.43 | $ 13.90 | $ 14.20 |
Total Return A,B | 40.22% | (39.84)% | 18.21% | 15.71% | 12.88% |
Ratios to Average Net Assets D,F | | | | | |
Expenses before reductions | .81% | .78% | .78% | .79% | .81% |
Expenses net of fee waivers, if any | .81% | .78% | .78% | .79% | .81% |
Expenses net of all reductions | .80% | .78% | .78% | .78% | .76% |
Net investment income (loss) | 1.10% | 1.02% | .64% | .95% | .53% |
Supplemental Data | | | | | |
Net assets, end of period (000 omitted) | $ 32,183 | $ 23,747 | $ 50,586 | $ 51,332 | $ 50,332 |
Portfolio turnover rate E | 117% | 138% | 122% | 137% | 160% |
A Total returns do not reflect charges attributable to your insurance company's separate account. Inclusion of these charges would reduce the total returns shown. B Total returns would have been lower had certain expenses not been reduced during the periods shown. C Calculated based on average shares outstanding during the period. D Fees and expenses of the underlying Fidelity Central Funds are not included in the Fund's expense ratio. The Fund indirectly bears its proportionate share of the expenses of any underlying Fidelity Central Funds. E Amount does not include the portfolio activity of any underlying Fidelity Central Funds. F Expense ratios reflect operating expenses of the class. Expenses before reductions do not reflect amounts reimbursed by the investment adviser or reductions from brokerage service arrangements or reductions from other expense offset arrangements and do not represent the amount paid by the class during periods when reimbursements or reductions occur. Expense ratios before reductions for start-up periods may not be representative of longer-term operating periods. Expenses net of fee waivers reflect expenses after reimbursement by the investment adviser but prior to reductions from brokerage service arrangements or other expense offset arrangements. Expenses net of all reductions represent the net expenses paid by the class. G Amount represents less than $.01 per share. H Total distributions of $2.47 per share is comprised of distributions from net investment income of $.147 and distributions from net realized gain of $2.325 per share. |
Financial Highlights - Investor Class
Years ended December 31, | 2009 | 2008 | 2007 | 2006 | 2005 H |
Selected Per-Share Data | | | | | |
Net asset value, beginning of period | $ 8.35 | $ 14.38 | $ 13.86 | $ 14.19 | $ 14.55 |
Income from Investment Operations | | | | | |
Net investment income (loss) E | .09 | .11 | .08 | .12 | .02 |
Net realized and unrealized gain (loss) | 3.25 | (5.76) | 2.43 | 2.00 | .96 |
Total from investment operations | 3.34 | (5.65) | 2.51 | 2.12 | .98 |
Distributions from net investment income | (.10) | (.13) | (.08) | (.14) | (.09) |
Distributions from net realized gain | - | (.26) | (1.91) | (2.33) | (1.25) |
Total distributions | (.10) | (.39) | (1.99) | (2.46) K | (1.34) |
Redemption fees added to paid in capital E | - J | .01 | - J | .01 | - J |
Net asset value, end of period | $ 11.59 | $ 8.35 | $ 14.38 | $ 13.86 | $ 14.19 |
Total Return B,C,D | 39.97% | (39.84)% | 18.12% | 15.43% | 6.65% |
Ratios to Average Net Assets F,I | | | | | |
Expenses before reductions | .91% | .88% | .90% | .92% | 1.08% A |
Expenses net of fee waivers, if any | .91% | .88% | .90% | .92% | 1.08% A |
Expenses net of all reductions | .90% | .87% | .90% | .92% | 1.03% A |
Net investment income (loss) | 1.00% | .92% | .52% | .81% | .31% A |
Supplemental Data | | | | | |
Net assets, end of period (000 omitted) | $ 25,879 | $ 17,359 | $ 26,063 | $ 12,758 | $ 1,936 |
Portfolio turnover rate G | 117% | 138% | 122% | 137% | 160% |
A Annualized B Total returns for periods of less than one year are not annualized. C Total returns do not reflect charges attributable to your insurance company's separate account. Inclusion of these charges would reduce the total returns shown. D Total returns would have been lower had certain expenses not been reduced during the periods shown. E Calculated based on average shares outstanding during the period. F Fees and expenses of the underlying Fidelity Central Funds are not included in the Fund's expense ratio. The Fund indirectly bears its proportionate share of the expenses of any underlying Fidelity Central Funds. G Amount does not include the portfolio activity of any underlying Fidelity Central Funds. H For the period July 21, 2005 (commencement of sale of shares) to December 31, 2005. I Expense ratios reflect operating expenses of the class. Expenses before reductions do not reflect amounts reimbursed by the investment adviser or reductions from brokerage service arrangements or reductions from other expense offset arrangements and do not represent the amount paid by the class during periods when reimbursements or reductions occur. Expense ratios before reductions for start-up periods may not be representative of longer-term operating periods. Expenses net of fee waivers reflect expenses after reimbursement by the investment adviser but prior to reductions from brokerage service arrangements or other expense offset arrangements. Expenses net of all reductions represent the net expenses paid by the class. J Amount represents less than $.01 per share. K Total distributions of $2.46 per share is comprised of distributions from net investment income of $.138 and distributions from net realized gain of $2.325 per share. |
See accompanying notes which are an integral part of the financial statements.
Annual Report
Notes to Financial Statements
For the period ended December 31, 2009
1. Organization.
VIP Industrials Portfolio (the Fund) is a non-diversified fund of Variable Insurance Products Fund IV (the trust) and is authorized to issue an unlimited number of shares. The trust is registered under the Investment Company Act of 1940, as amended (the 1940 Act), as an open-end management investment company organized as a Massachusetts business trust. Shares of the Fund may only be purchased by insurance companies for the purpose of funding variable annuity or variable life insurance contracts. The Fund offers the following classes of shares: Initial Class shares and Investor Class shares. All classes have equal rights and voting privileges, except for matters affecting a single class. Investment income, realized and unrealized capital gains and losses, the common expenses of the Fund, and certain fund-level expense reductions, if any, are allocated on a pro-rata basis to each class based on the relative net assets of each class to the total net assets of the Fund. Each class differs with respect to transfer agent fees incurred. Certain expense reductions also differ by class.
2. Investments in Fidelity Central Funds.
The Fund may invest in Fidelity Central Funds, which are open-end investment companies available only to other investment companies and accounts managed by Fidelity Management & Research Company (FMR) and its affiliates. The Fund's Schedule of Investments lists each of the Fidelity Central Funds held as of period end, if any, as an investment of the Fund, but does not include the underlying holdings of each Fidelity Central Fund. As an Investing Fund, the Fund indirectly bears its proportionate share of the expenses of the underlying Fidelity Central Funds.
The Money Market Central Funds seek preservation of capital and current income and are managed by Fidelity Investments Money Management, Inc. (FIMM), an affiliate of FMR.
A complete unaudited list of holdings for each Fidelity Central Fund is available upon request or at the Securities and Exchange Commission (the SEC) web site at www.sec.gov. In addition, the financial statements of the Fidelity Central Funds, which are not covered by the Fund's Report of Independent Registered Public Accounting Firm, are available on the SEC web site or upon request.
3. Significant Accounting Policies.
The financial statements have been prepared in conformity with accounting principles generally accepted in the United States of America, which require management to make certain estimates and assumptions at the date of the financial statements. Actual results could differ from those estimates. Events or transactions occurring after period end through the date that the financial statements were issued, February 12, 2010, have been evaluated in the preparation of the financial statements. The following summarizes the significant accounting policies of the Fund:
Security Valuation. Investments are valued as of 4:00 p.m. Eastern time on the last calendar day of the period. The Fund uses independent pricing services approved by the Board of Trustees to value its investments. When current market prices or quotations are not readily available or reliable, valuations may be determined in good faith in accordance with procedures adopted by the Board of Trustees. Factors used in determining value may include significant market or security specific events. The frequency with which these procedures are used cannot be predicted and may be utilized to a significant extent. The value used for net asset value (NAV) calculation under these procedures may differ from published prices for the same securities.
The Fund categorizes the inputs to valuation techniques used to value its investments into a disclosure hierarchy consisting of three levels as shown below.
Level 1 - quoted prices in active markets for identical investments
Level 2 - other significant observable inputs (including quoted prices for similar investments, interest rates, prepayment speeds, etc.)
Level 3 - unobservable inputs (including the fund's own assumptions based on the best information available)
Changes in valuation techniques may result in transfers in or out of an assigned level within the disclosure hierarchy. The aggregate value of investments by input level, as of December 31, 2009 is included at the end of the Fund's Schedule of Investments. Valuation techniques used to value the Fund's investments by major category are as follows.
Equity securities, including restricted securities, for which market quotations are readily available, are valued at the last reported sale price or official closing price as reported by an independent pricing service on the primary market or exchange on which they are traded and are categorized as level 1 in the hierarchy. In the event there were no sales during the day or closing prices are not available, securities are valued at the last quoted bid price or may be valued using the last available price and categorized as Level 2 in the hierarchy. For foreign equity securities, when significant market or security events arise, comparisons to the valuation of American Depository Receipts (ADRs), futures contracts, exchange-traded funds (ETFs) and certain indexes as well as quoted prices for similar securities are used and are categorized as Level 2 in the hierarchy in these circumstances. For restricted securities and private placements where observable inputs are limited, assumptions about market activity and risk are used and are categorized as level 3 in the hierarchy.
Annual Report
3. Significant Accounting Policies - continued
Security Valuation - continued
Investments in open-end mutual funds, including the Fidelity Money Market Central Funds, are valued at their closing net asset value each business day and are categorized as Level 1 in the hierarchy. Short-term securities with remaining maturities of sixty days or less for which quotations are not readily available are valued at amortized cost, which approximates value and are categorized as level 2 in the hierarchy.
Foreign Currency. The Fund uses foreign currency contracts to facilitate transactions in foreign-denominated securities. Losses from these transactions may arise from changes in the value of the foreign currency or if the counterparties do not perform under the contracts' terms.
Foreign-denominated assets, including investment securities, and liabilities are translated into U.S. dollars at the exchange rate at period end. Purchases and sales of investment securities, income and dividends received and expenses denominated in foreign currencies are translated into U.S. dollars at the exchange rate in effect on the transaction date.
The effects of exchange rate fluctuations on investments are included with the net realized and unrealized gain (loss) on investment securities. Other foreign currency transactions resulting in realized and unrealized gain (loss) are disclosed separately.
Investment Transactions and Income. For financial reporting purposes, the Fund's investment holdings and NAV include trades executed through the end of the last business day of the period. The NAV per share for processing shareholder transactions is calculated as of the close of business of the New York Stock Exchange (NYSE), normally 4:00 p.m. Eastern time and includes trades executed through the end of the prior business day. Gains and losses on securities sold are determined on the basis of identified cost and may include proceeds received from litigation. Dividend income is recorded on the ex-dividend date, except for certain dividends from foreign securities where the ex-dividend date may have passed, which are recorded as soon as the Fund is informed of the ex-dividend date. Non-cash dividends included in dividend income, if any, are recorded at the fair market value of the securities received. Distributions received on securities that represent a return of capital or capital gain are recorded as a reduction of cost of investments and/or as a realized gain. The Fund estimates the components of distributions received that may be considered return of capital distributions or capital gain distributions. Interest income and distributions from the Fidelity Central Funds are accrued as earned. Interest income includes coupon interest and amortization of premium and accretion of discount on debt securities. Investment income is recorded net of foreign taxes withheld where recovery of such taxes is uncertain.
Expenses. Most expenses of the trust can be directly attributed to a fund. Expenses which cannot be directly attributed are apportioned among each Fund in the trust. Expense estimates are accrued in the period to which they relate and adjustments are made when actual amounts are known.
Income Tax Information and Distributions to Shareholders. Each year, the Fund intends to qualify as a regulated investment company by distributing substantially all of its taxable income and realized gains under Subchapter M of the Internal Revenue Code and filing its U.S. federal tax return. As a result, no provision for income taxes is required. As of December 31, 2009, the Fund did not have any unrecognized tax benefits in the accompanying financial statements. A Fund's federal tax return is subject to examination by the Internal Revenue Service (IRS) for a period of three years. Foreign taxes are provided for based on the Fund's understanding of the tax rules and rates that exist in the foreign markets in which it invests.
Distributions are recorded on the ex-dividend date. Income dividends and capital gain distributions are declared separately for each class. Income and capital gain distributions are determined in accordance with income tax regulations, which may differ from generally accepted accounting principles.
Capital accounts within the financial statements are adjusted for permanent book-tax differences. These adjustments have no impact on net assets or the results of operations. Temporary book-tax differences will reverse in a subsequent period.
Book-tax differences are primarily due to short-term gain distributions from the Fidelity Central Funds, foreign currency transactions, capital loss carryforwards and losses deferred due to wash sales and excise tax regulations.
The federal tax cost of investment securities and unrealized appreciation (depreciation) as of period end were as follows:
Gross unrealized appreciation | $ 9,548,518 |
Gross unrealized depreciation | (3,983,191) |
Net unrealized appreciation (depreciation) | $ 5,565,327 |
| |
Tax Cost | $ 53,863,512 |
Annual Report
Notes to Financial Statements - continued
3. Significant Accounting Policies - continued
Income Tax Information and Distributions to Shareholders - continued
The tax-based components of distributable earnings as of period end were as follows:
Capital loss carryforward | $ (14,293,917) |
Net unrealized appreciation (depreciation) | $ 5,565,260 |
The tax character of distributions paid was as follows:
| December 31, 2009 | December 31, 2008 |
Ordinary Income | $ 506,005 | $ 1,374,085 |
Long-term Capital Gains | - | 622,880 |
Total | $ 506,005 | $ 1,996,965 |
Trading (Redemption) Fees. Shares held less than 60 days are subject to a redemption fee equal to 1% of the proceeds of the redeemed shares. All redemption fees, including any estimated redemption fees paid by FMR, are retained by the Fund and accounted for as an addition to paid in capital.
4. Purchases and Sales of Investments.
Purchases and sales of securities, other than short-term securities, aggregated $55,019,140 and $52,979,446, respectively.
5. Fees and Other Transactions with Affiliates.
Management Fee. FMR and its affiliates provide the Fund with investment management related services for which the Fund pays a monthly management fee. The management fee is the sum of an individual fund fee rate that is based on an annual rate of .30% of the Fund's average net assets and a group fee rate that averaged .26% during the period. The group fee rate is based upon the average net assets of all the mutual funds advised by FMR. The group fee rate decreases as assets under management increase and increases as assets under management decrease. For the period, the total annual management fee rate was .56% of the Fund's average net assets.
Transfer Agent Fees. Fidelity Investments Institutional Operations Company, Inc. (FIIOC), an affiliate of FMR, is the Fund's transfer, dividend disbursing, and shareholder servicing agent. FIIOC receives an asset-based fee with respect to each class. Each class (with the exception of Investor Class) pays a transfer agent fee, excluding out of pocket expenses, equal to an annual rate of .07% of average net assets. Investor Class pays a monthly asset-based transfer agent fee of .15% of average net assets. The total transfer agent fees paid by each class to FIIOC, including out of pocket expenses, were as follows:
Initial Class | $ 23,564 |
Investor Class | 39,104 |
| $ 62,668 |
Accounting and Security Lending Fees. Fidelity Service Company, Inc. (FSC), an affiliate of FMR, maintains the Fund's accounting records. The accounting fee is based on the level of average net assets for the month. Under a separate contract, FSC administers the security lending program. The security lending fee is based on the number and duration of lending transactions.
Brokerage Commissions. The Fund placed a portion of its portfolio transactions with brokerage firms which are affiliates of the investment adviser. The commissions paid to these affiliated firms were $2,069 the period.
6. Committed Line of Credit.
The Fund participates with other funds managed by FMR in a $3.5 billion credit facility (the "line of credit") to be utilized for temporary or emergency purposes to fund shareholder redemptions or for other short-term liquidity purposes. The Fund has agreed to pay commitment fees on its pro-rata portion of the line of credit, which amounted to $224 and is reflected in Miscellaneous Expense on the Statement of Operations. During the period, there were no borrowings on this line of credit.
7. Security Lending.
The Fund lends portfolio securities from time to time in order to earn additional income. On the settlement date of the loan, the Fund receives collateral (in the form of U.S. Treasury obligations, letters of credit and/or cash) against the loaned securities and maintains collateral in an amount not less than 100% of the market value of the loaned securities during the period of the loan. The market value of the loaned securities is determined at the
Annual Report
7. Security Lending - continued
close of business of the Fund and any additional required collateral is delivered to the Fund on the next business day. If the borrower defaults on its obligation to return the securities loaned because of insolvency or other reasons, a fund could experience delays and costs in recovering the securities loaned or in gaining access to the collateral. Any cash collateral received is invested in the Fidelity Securities Lending Cash Central Fund. The value of loaned securities and cash collateral at period end are disclosed on the Fund's Statement of Assets and Liabilities. Security lending income represents the income earned on investing cash collateral, less fees and expenses associated with the loan, plus any premium payments that may be received on the loan of certain types of securities. Security lending income is presented in the Statement of Operations as a component of income from Fidelity Central Funds. Net income from lending portfolio securities during the period amounted to $21,392.
8. Expense Reductions.
Many of the brokers with whom FMR places trades on behalf of the Fund provided services to the Fund in addition to trade execution. These services included payments of certain expenses on behalf of the Fund totaling $2,017 for the period.
9. Distributions to Shareholders.
Distributions to shareholders of each class were as follows:
Years ended December 31, | 2009 | 2008 |
From net investment income | | |
Initial Class | $ 290,831 | $ 385,462 |
Investor Class | 215,174 | 261,929 |
Total | $ 506,005 | $ 647,391 |
From net realized gain | | |
Initial Class | $ - | $ 885,620 |
Investor Class | - | 463,954 |
Total | $ - | $ 1,349,574 |
10. Share Transactions.
Transactions for each class of shares were as follows:
| Shares | Dollars |
Years ended December 31, | 2009 | 2008 | 2009 | 2008 |
Initial Class | | | | |
Shares sold | 744,452 | 842,161 | $ 6,739,371 | $ 10,739,604 |
Reinvestment of distributions | 25,158 | 115,154 | 290,831 | 1,271,082 |
Shares redeemed | (837,301) | (1,628,549) | (7,230,622) | (19,451,472) |
Net increase (decrease) | (67,691) | (671,234) | $ (200,420) | $ (7,440,786) |
Investor Class | | | | |
Shares sold | 812,669 | 1,277,670 | $ 7,438,900 | $ 16,291,692 |
Reinvestment of distributions | 18,678 | 67,934 | 215,174 | 725,883 |
Shares redeemed | (677,276) | (1,078,868) | (6,200,700) | (11,952,303) |
Net increase (decrease) | 154,071 | 266,736 | $ 1,453,374 | $ 5,065,272 |
11. Other.
The Fund's organizational documents provide former and current trustees and officers with a limited indemnification against liabilities arising in connection with the performance of their duties to the Fund. In the normal course of business, the Fund may also enter into contracts that provide general indemnifications. The Fund's maximum exposure under these arrangements is unknown as this would be dependent on future claims that may be made against the Fund. The risk of material loss from such claims is considered remote.
At the end of the period, FMR or its affiliates were the owners of record of 100% of the total outstanding shares of the Fund.
Annual Report
Report of Independent Registered Public Accounting Firm
To the Trustees of Variable Insurance Products Fund IV and the Shareholders of VIP Industrials Portfolio:
In our opinion, the accompanying statement of assets and liabilities, including the schedule of investments, and the related statements of operations and of changes in net assets and the financial highlights present fairly, in all material respects, the financial position of VIP Industrials Portfolio (a fund of Variable Insurance Products Fund IV) at December 31, 2009, the results of its operations for the year then ended the changes in its net assets for each of the two years in the period then ended and the financial highlights for each of the periods indicated, in conformity with accounting principles generally accepted in the United States of America. These financial statements and financial highlights (hereafter referred to as "financial statements") are the responsibility of the VIP Industrials Portfolio's management. Our responsibility is to express an opinion on these financial statements based on our audits. We conducted our audits of these financial statements in accordance with the standards of the Public Company Accounting Oversight Board (United States). Those standards require that we plan and perform the audit to obtain reasonable assurance about whether the financial statements are free of material misstatement. An audit includes examining, on a test basis, evidence supporting the amounts and disclosures in the financial statements, assessing the accounting principles used and significant estimates made by management, and evaluating the overall financial statement presentation. We believe that our audits, which included confirmation of securities at December 31, 2009 by correspondence with the custodian and brokers, provide a reasonable basis for our opinion.
/s/ PricewaterhouseCoopers LLP
PricewaterhouseCoopers LLP
Boston, Massachusetts
February 12, 2010
Annual Report
The Trustees, Member of the Advisory Board, and executive officers of the trust and fund, as applicable, are listed below. The Board of Trustees governs the fund and is responsible for protecting the interests of shareholders. The Trustees are experienced executives who meet periodically throughout the year to oversee the fund's activities, review contractual arrangements with companies that provide services to the fund, and review the fund's performance. Except for James C. Curvey, each of the Trustees oversees 222 funds advised by FMR or an affiliate. Mr. Curvey oversees 410 funds advised by FMR or an affiliate.
The Trustees hold office without limit in time except that (a) any Trustee may resign; (b) any Trustee may be removed by written instrument, signed by at least two-thirds of the number of Trustees prior to such removal; (c) any Trustee who requests to be retired or who has become incapacitated by illness or injury may be retired by written instrument signed by a majority of the other Trustees; and (d) any Trustee may be removed at any special meeting of shareholders by a two-thirds vote of the outstanding voting securities of the trust. Each Trustee who is not an interested person (as defined in the 1940 Act) (Independent Trustee), shall retire not later than the last day of the calendar year in which his or her 72nd birthday occurs. The Independent Trustees may waive this mandatory retirement age policy with respect to individual Trustees. The executive officers and Advisory Board Member hold office without limit in time, except that any officer and Advisory Board Member may resign or may be removed by a vote of a majority of the Trustees at any regular meeting or any special meeting of the Trustees. Except as indicated, each individual has held the office shown or other offices in the same company for the past five years.
The fund's Statement of Additional Information (SAI) includes more information about the Trustees. To request a free copy, call Fidelity at 1-877-208-0098.
Interested Trustees*:
Correspondence intended for each Trustee who is an interested person may be sent to Fidelity Investments, 82 Devonshire Street, Boston, Massachusetts 02109.
Name, Age; Principal Occupation |
Edward C. Johnson 3d (79) |
| Year of Election or Appointment: 1983 Mr. Johnson is Trustee and Chairman of the Board of Trustees of certain Trusts. Mr. Johnson serves as Chief Executive Officer, Chairman, and a Director of FMR LLC; Chairman and a Director of FMR; Chairman and a Director of Fidelity Research & Analysis Company (FRAC); Chairman and a Director of Fidelity Investments Money Management, Inc.; and Chairman and a Director of FMR Co., Inc. In addition, Mr. Johnson serves as Chairman and Director of FIL Limited. Previously, Mr. Johnson served as President of FMR LLC (2006-2007). |
James C. Curvey (74) |
| Year of Election or Appointment: 2007 Mr. Curvey also serves as Trustee (2007-present) of other investment companies advised by FMR. Mr. Curvey is a Director of FMR and FMR Co., Inc. (2007-present). Mr. Curvey is also Vice Chairman (2006-present) and Director of FMR LLC. In addition, Mr. Curvey serves as an Overseer for the Boston Symphony Orchestra and a member of the Trustees of Villanova University. |
* Trustees have been determined to be "Interested Trustees" by virtue of, among other things, their affiliation with the trust or various entities under common control with FMR.
Independent Trustees:
Correspondence intended for each Independent Trustee (that is, the Trustees other than the Interested Trustees) may be sent to Fidelity Investments, P.O. Box 55235, Boston, Massachusetts 02205-5235.
Name, Age; Principal Occupation |
Dennis J. Dirks (61) |
| Year of Election or Appointment: 2005 Prior to his retirement in May 2003, Mr. Dirks was Chief Operating Officer and a member of the Board of The Depository Trust & Clearing Corporation (DTCC). He also served as President, Chief Operating Officer, and Board member of The Depository Trust Company (DTC) and President and Board member of the National Securities Clearing Corporation (NSCC). In addition, Mr. Dirks served as Chief Executive Officer and Board member of the Government Securities Clearing Corporation, Chief Executive Officer and Board member of the Mortgage-Backed Securities Clearing Corporation, as a Trustee and a member of the Finance Committee of Manhattan College (2005-2008), and as a Trustee and a member of the Finance Committee of AHRC of Nassau County (2006-2008). Currently, Mr. Dirks serves as a member of the Board of Directors for The Brookville Center for Children's Services, Inc. (2009-present). |
Alan J. Lacy (56) |
| Year of Election or Appointment: 2008 Mr. Lacy serves as Senior Adviser (2007-present) of Oak Hill Capital Partners, L.P. (private equity). Mr. Lacy also served as Chief Executive Officer (2000-2005) and Vice Chairman (2005-2006) of Sears Holdings Corporation and Sears, Roebuck and Co. (retail). In addition, Mr. Lacy serves as a member of the Board of Directors of The Western Union Company (global money transfer, 2006-present) and Bristol-Myers Squibb Company (global pharmaceuticals, 2007-present). Mr. Lacy is Chairman (2008-present) and a member (2006-present) of the Board of Trustees of The National Parks Conservation Association. |
Ned C. Lautenbach (65) |
| Year of Election or Appointment: 2000 Mr. Lautenbach is Chairman of the Independent Trustees of the Equity and High Income Funds (2006-present). Mr. Lautenbach is an Advisory Partner of Clayton, Dubilier & Rice, Inc. (private equity investment). Previously, Mr. Lautenbach was with the International Business Machines Corporation (IBM) from 1968 until his retirement in 1998. Mr. Lautenbach serves as a Director of Eaton Corporation (diversified industrial) as well as the Philharmonic Center for the Arts in Naples, Florida. Mr. Lautenbach is also a member of the Board of Trustees of Fairfield University (2005-present), as well as a member of the Council on Foreign Relations. Previously, Mr. Lautenbach served as a Director of Sony Corporation (2006-2007). |
Joseph Mauriello (65) |
| Year of Election or Appointment: 2008 Prior to his retirement in January 2006, Mr. Mauriello served in numerous senior management positions including Deputy Chairman and Chief Operating Officer (2004-2005), and Vice Chairman of Financial Services (2002-2004) of KPMG LLP US (professional services, 1965-2005). Mr. Mauriello currently serves as a member of the Board of Directors of XL Capital Ltd. (global insurance and re-insurance, 2006-present) and of Arcadia Resources Inc. (health care services and products, 2007-present). Previously, Mr. Mauriello served as a Director of the Hamilton Funds of the Bank of New York (2006-2007). |
Cornelia M. Small (65) |
| Year of Election or Appointment: 2005 Ms. Small is a member of the Board of Directors of the Teagle Foundation (2009-present). Ms. Small is also a member of the Investment Committee, and Chair (2008-present) and a member of the Board of Trustees of Smith College. In addition, Ms. Small serves on the Investment Committee of the Berkshire Taconic Community Foundation (2008-present). Previously, Ms. Small served as Chairperson of the Investment Committee (2002-2008) of Smith College. In addition, Ms. Small served as Chief Investment Officer, Director of Global Equity Investments, and a member of the Board of Directors of Scudder, Stevens & Clark and Scudder Kemper Investments. |
William S. Stavropoulos (70) |
| Year of Election or Appointment: 2001 Mr. Stavropoulos serves as President and Founder of the Michigan Baseball Foundation, the Great Lakes Loons (2007-present). Mr. Stavropoulos is Chairman Emeritus of the Board of Directors of The Dow Chemical Company, where he previously served in numerous senior management positions, including President, CEO (1995-2000; 2002-2004), Chairman of the Executive Committee (2000-2006), and as a member of the Board of Directors (1990-2006). Currently, Mr. Stavropoulos is a Director of Teradata Corporation (data warehousing and technology solutions, 2008-present), Chemical Financial Corporation, Maersk Inc. (industrial conglomerate), Tyco International, Inc. (multinational manufacturing and services, 2007-present), and a member of the Advisory Board for Metalmark Capital (private equity investment, 2005-present). Mr. Stavropoulos is a special advisor to Clayton, Dubilier & Rice, Inc. (private equity investment). In addition, Mr. Stavropoulos is a member of the University of Notre Dame Advisory Council for the College of Science. |
David M. Thomas (60) |
| Year of Election or Appointment: 2008 Previously, Mr. Thomas served as Executive Chairman (2005-2006) and Chairman and Chief Executive Officer (2000-2005) of IMS Health, Inc. (pharmaceutical and healthcare information solutions). In addition, Mr. Thomas serves as a member of the Board of Directors of Fortune Brands, Inc. (consumer products), and Interpublic Group of Companies, Inc. (marketing communication, 2004-present). |
Michael E. Wiley (59) |
| Year of Election or Appointment: 2008 Mr. Wiley also serves as a Director of Asia Pacific Exploration Consolidated (international oil and gas exploration and production, 2008-present), and as a member of the Board of Trustees of the University of Tulsa (2000-2006; 2007-present). Mr. Wiley serves as a Director of Tesoro Corporation (independent oil refiner and marketer, 2005-present), and a Director of Bill Barrett Corporation (exploration and production, 2005-present). In addition, Mr. Wiley also serves as a Director of Post Oak Bank (privately-held bank, 2004-present). Previously, Mr. Wiley served as a Sr. Energy Advisor of Katzenbach Partners, LLC (consulting, 2006-2007), as an Advisory Director of Riverstone Holdings (private investment), Chairman, President, and CEO of Baker Hughes, Inc. (oilfield services, 2000-2004), and as Director of Spinnaker Exploration Company (exploration and production, 2001-2005). |
Annual Report
Advisory Board Member and Executive Officers:
Correspondence intended for each executive officer and Peter S. Lynch may be sent to Fidelity Investments, 82 Devonshire Street, Boston, Massachusetts 02109.
Name, Age; Principal Occupation |
Peter S. Lynch (65) |
| Year of Election or Appointment: 2003 Member of the Advisory Board of Fidelity's Equity and High Income Funds. Mr. Lynch is Vice Chairman and a Director of FMR and FMR Co., Inc. In addition, Mr. Lynch serves as a Trustee of Boston College and as the Chairman of the Inner-City Scholarship Fund. Previously, Mr. Lynch served on the Special Olympics International Board of Directors (1997-2006). |
Kenneth B. Robins (40) |
| Year of Election or Appointment: 2008 President and Treasurer of Fidelity's Equity and High Income Funds. Mr. Robins also serves as Assistant Treasurer of other Fidelity funds (2009-present) and is an employee of Fidelity Investments (2004-present). Before joining Fidelity Investments, Mr. Robins worked at KPMG LLP, where he was a partner in KPMG's department of professional practice (2002-2004). |
Brian B. Hogan (45) |
| Year of Election or Appointment: 2009 Vice President of certain Equity Funds and Vice President of Sector Funds. Mr. Hogan also serves as Senior Vice President, Equity Research of FMR (2006-present) and President of FMR's Equity Division (2009-present). Previously, Mr. Hogan served as a portfolio manager. |
Christopher S. Bartel (38) |
| Year of Election or Appointment: 2009 Vice President of Fidelity's Sector and Real Estate Equity Funds. Mr. Bartel also serves as Senior Vice President of Equity Research (2009-present). Previously, Mr. Bartel served as Managing Director of Research (2006-2009) and an analyst and portfolio manager (2000-2006). |
Scott C. Goebel (41) |
| Year of Election or Appointment: 2008 Secretary and Chief Legal Officer (CLO) of the Fidelity funds. Mr. Goebel also serves as General Counsel, Secretary, and Senior Vice President of FMR (2008-present) and FMR Co., Inc. (2008-present); Deputy General Counsel of FMR LLC; Chief Legal Officer of Fidelity Management & Research (Hong Kong) Limited (2008-present) and Assistant Secretary of Fidelity Management & Research (Japan) Inc. (2008-present), Fidelity Investments Money Management, Inc. (2008-present), Fidelity Management & Research (U.K.) Inc. (2008-present), and Fidelity Research and Analysis Company (2008-present). Previously, Mr. Goebel served as Assistant Secretary of the Funds (2007-2008) and as Vice President and Secretary of Fidelity Distributors Corporation (FDC) (2005-2007). |
William C. Coffey (40) |
| Year of Election or Appointment: 2009 Assistant Secretary of Fidelity's Equity and High Income Funds. Mr. Coffey also serves as Vice President and Associate General Counsel of FMR LLC (2005-present), and is an employee of Fidelity Investments. |
Holly C. Laurent (55) |
| Year of Election or Appointment: 2008 Anti-Money Laundering (AML) Officer of the Fidelity funds. Ms. Laurent is an employee of Fidelity Investments. Previously, Ms. Laurent was Senior Vice President and Head of Legal for Fidelity Business Services India Pvt. Ltd. (2006-2008), and Senior Vice President, Deputy General Counsel and Group Head for FMR LLC (2005-2006). |
Christine Reynolds (51) |
| Year of Election or Appointment: 2008 Chief Financial Officer of the Fidelity funds. Ms. Reynolds became President of Fidelity Pricing and Cash Management Services (FPCMS) in August 2008. Ms. Reynolds served as Chief Operating Officer of FPCMS (2007-2008). Previously, Ms. Reynolds served as President, Treasurer, and Anti-Money Laundering officer of the Fidelity funds (2004-2007). |
Kenneth A. Rathgeber (62) |
| Year of Election or Appointment: 2004 Chief Compliance Officer of Fidelity's Equity and High Income Funds. Mr. Rathgeber is Chief Compliance Officer of Fidelity Management & Research (Hong Kong) Limited (2008-present), Fidelity Management & Research (Japan) Inc. (2008-present), FMR (2005-present), FMR Co., Inc. (2005-present), Fidelity Management & Research (U.K.) Inc. (2005-present), Fidelity Research & Analysis Company (2005-present), Fidelity Investments Money Management, Inc. (2005-present), Pyramis Global Advisors, LLC (2005-present), and Strategic Advisers, Inc. (2005-present). |
Jeffrey S. Christian (48) |
| Year of Election or Appointment: 2009 Deputy Treasurer of the Fidelity funds. Mr. Christian is an employee of Fidelity Investments. Previously, Mr. Christian served as Chief Financial Officer (2008-2009) of certain Fidelity funds, Senior Vice President of Fidelity Pricing and Cash Management Services (FPCMS) (2004-2009), and as Vice President of Business Analysis (2003-2004). |
Bryan A. Mehrmann (48) |
| Year of Election or Appointment: 2005 Deputy Treasurer of the Fidelity funds. Mr. Mehrmann is an employee of Fidelity Investments. Previously, Mr. Mehrmann served as Vice President of Fidelity Investments Institutional Services Group (FIIS)/Fidelity Investments Institutional Operations Company, Inc. (FIIOC) Client Services (1998-2004). |
Adrien E. Deberghes (42) |
| Year of Election or Appointment: 2008 Deputy Treasurer of Fidelity's Equity and High Income Funds. Mr. Deberghes is an employee of Fidelity Investments (2008-present). Previously, Mr. Deberghes served as Senior Vice President of Mutual Fund Administration at State Street Corporation (2007-2008), Senior Director of Mutual Fund Administration at Investors Bank & Trust (2005-2007), and Director of Finance for Dunkin' Brands (2000-2005). |
John R. Hebble (51) |
| Year of Election or Appointment: 2009 Assistant Treasurer of Fidelity's Equity and High Income Funds. Mr. Hebble also serves as President and Treasurer of other Fidelity funds (2008-present) and is an employee of Fidelity Investments. |
Paul M. Murphy (62) |
| Year of Election or Appointment: 2007 Assistant Treasurer of the Fidelity funds. Mr. Murphy is an employee of Fidelity Investments. Previously, Mr. Murphy served as Chief Financial Officer of the Fidelity funds (2005-2006), Vice President and Associate General Counsel of FMR (2007), and Senior Vice President of Fidelity Pricing and Cash Management Services (FPCMS) (1994-2007). |
Gary W. Ryan (51) |
| Year of Election or Appointment: 2005 Assistant Treasurer of the Fidelity funds. Mr. Ryan is an employee of Fidelity Investments. Previously, Mr. Ryan served as Vice President of Fund Reporting in Fidelity Pricing and Cash Management Services (FPCMS) (1999-2005). |
Annual Report
Initial Class and Investor Class designate 100% of the dividends distributed during the fiscal year as qualifying for the dividends-received deduction for corporate shareholders.
The fund will notify shareholders in January 2010 of amounts for use in preparing 2009 income tax returns.
Annual Report
Board Approval of Investment Advisory Contracts and Management Fees
VIP Industrials Portfolio
Each year, the Board of Trustees, including the Independent Trustees (together, the Board), votes on the renewal of the management contract and sub-advisory agreements (together, the Advisory Contracts) for the fund. The Board, assisted by the advice of fund counsel and Independent Trustees' counsel, requests and considers a broad range of information throughout the year.
The Board meets regularly and, acting directly and through its separate committees, requests and receives information concerning, and considers at each of its meetings factors that are relevant to, its annual consideration of the renewal of the fund's Advisory Contracts, including the services and support provided to the fund and its shareholders. The Board has established various standing committees, each composed of Independent Trustees with varying backgrounds, to which the Board has assigned specific subject matter responsibilities in order to enhance effective decision-making by the Board. Each committee has a written charter outlining the structure and purposes of the committee. The Board also meets as needed to consider matters specifically related to the Board's annual consideration of the renewal of Advisory Contracts.
At its July 2009 meeting, the Board of Trustees, including the Independent Trustees, unanimously determined to renew the fund's Advisory Contracts. In reaching its determination, the Board considered all factors it believed relevant, including (i) the nature, extent, and quality of the services to be provided to the fund and its shareholders (including the investment performance of the fund); (ii) the competitiveness of the fund's management fee and total expenses; (iii) the total costs of the services to be provided by and the profits to be realized by Fidelity from its relationship with the fund; (iv) the extent to which economies of scale would be realized as the fund grows; and (v) whether fee levels reflect these economies of scale, if any, for the benefit of fund shareholders.
In considering whether to renew the Advisory Contracts for the fund, the Board ultimately reached a determination, with the assistance of fund counsel and Independent Trustees' counsel and through the exercise of its business judgment, that the renewal of the Advisory Contracts and the compensation to be received by Fidelity under the management contract is consistent with Fidelity's fiduciary duty under applicable law. The Board's decision to renew the Advisory Contracts was not based on any single factor noted above, but rather was based on a comprehensive consideration of all the information provided to the Board at its meetings throughout the year. The Board, in reaching its determination to renew the Advisory Contracts, is aware that shareholders in the fund have a broad range of investment choices available to them, including a wide choice among mutual funds offered by competitors to Fidelity, and that the fund's shareholders, with the opportunity to review and weigh the disclosure provided by the fund in its prospectus and other public disclosures, have chosen to invest in this fund, managed by Fidelity.
Nature, Extent, and Quality of Services Provided. The Board considered staffing within the investment adviser, FMR, and the sub-advisers (together, the Investment Advisers), including the backgrounds of the fund's investment personnel and the fund's investment objective and discipline. The Independent Trustees also had discussions with senior management of Fidelity's investment operations and investment groups. The Board considered the structure of the portfolio manager compensation program and whether this structure provides appropriate incentives.
Resources Dedicated to Investment Management and Support Services. The Board reviewed the size, education, and experience of the Investment Advisers' investment staff, their use of technology, and the Investment Advisers' approach to recruiting, training, and retaining portfolio managers and other research, advisory, and management personnel. In response to last year's financial crisis, FMR took a number of actions intended to cut costs and improve efficiency without weakening the investment teams or resources. The Board noted that Fidelity's analysts have access to a variety of technological tools and market and securities data that enable them to perform both fundamental and quantitative analysis and to specialize in various disciplines. The Board considered Fidelity's extensive global research capabilities that enable the Investment Advisers to aggregate data from various sources in an effort to produce positive investment results. The Board also considered that Fidelity's portfolio managers and analysts have access to daily portfolio attribution that allows for monitoring of a fund's portfolio, as well as an electronic communication system that provides immediate real-time access to research concerning issuers and credit enhancers.
Shareholder and Administrative Services. The Board considered (i) the nature, extent, quality, and cost of advisory, administrative, distribution, and shareholder services performed by the Investment Advisers and their affiliates under the Advisory Contracts and under separate agreements covering transfer agency, pricing and bookkeeping, and securities lending services for the fund; (ii) the nature and extent of the Investment Advisers' supervision of third party service providers, principally custodians and subcustodians; and (iii) the resources devoted to, and the record of compliance with, the fund's compliance policies and procedures. The Board also reviewed the allocation of fund brokerage, including allocations to brokers affiliated with the Investment Advisers, the use of brokerage commissions to pay fund expenses, and the use of "soft" commission dollars to pay for research services.
The Board noted that the growth of fund assets across the complex allows Fidelity to reinvest in the development of services designed to enhance the value or convenience of the Fidelity funds as investment vehicles. These services include 24-hour access to account information and market information through phone representatives and over the Internet, and investor education materials and asset allocation tools.
Investment in a Large Fund Family. The Board considered the benefits to shareholders of investing in a Fidelity fund, including the benefits of investing in a fund that is part of a large family of funds offering a variety of investment disciplines and providing for a large variety of mutual fund investor services. The Board noted that Fidelity has taken a number of actions over the previous year that benefited particular funds, including (i) dedicating additional resources to investment research and to restructure and broaden the focus of the investment research teams; (ii) bolstering the senior management team that oversees asset management; (iii) contractually agreeing to reduce the management fee on Fidelity U.S. Bond Index Fund; and (iv) expanding Class A and Class T load waiver categories to increase rollover retention opportunities and create consistent policies across the classes.
Annual Report
Investment Performance. The Board considered whether the fund has operated within its investment objective, as well as its record of compliance with its investment restrictions. It also reviewed the fund's absolute investment performance for each class, as well as the fund's relative investment performance for each class measured against a third-party-sponsored index that reflects the market sector in which the fund invests over multiple periods. The Board noted that FMR does not believe that a meaningful peer group exists against which to compare the fund's performance. The following charts considered by the Board show, over the one-, three-, and five-year periods ended December 31, 2008, as available, the cumulative total returns of Initial Class and Investor Class of the fund and the cumulative total returns of a third-party-sponsored index ("benchmark").
VIP Industrials Portfolio
The Board stated that the investment performance of Initial Class of the fund compared favorably to its benchmark for all the periods shown. The Board considered that the variations in performance between the fund's classes reflect the variations in class expenses, which result in lower performance for the higher expense class.
The Board considered that FMR has taken steps to refocus and strengthen equity research, equity portfolio management, and compliance. The Board reviewed the year-to-date performance of Initial Class through May 31, 2009 and stated that it exceeded the fund's benchmark.
Based on its review, and giving particular weight to the nature and quality of the resources dedicated by the Investment Advisers to maintain and improve relative performance and factoring in the unprecedented market events in 2008, the Board concluded that the nature, extent, and quality of the services provided to the fund will benefit the fund's shareholders, particularly in light of the Board's view that the fund's shareholders benefit from investing in a fund that is part of a large family of funds offering a variety of investment disciplines and services.
Competitiveness of Management Fee and Total Fund Expenses. The Board considered the fund's management fee and total expenses compared to "mapped groups" of competitive funds and classes. Fidelity creates "mapped groups" by combining similar Lipper investment objective categories that have comparable management fee characteristics. Combining Lipper investment objective categories aids the Board's management fee and total expense comparisons by broadening the competitive group used for comparison and by reducing the number of universes to which various Fidelity funds are compared.
The Board considered two proprietary management fee comparisons for the 12-month periods shown in the chart below. The group of Lipper funds used by the Board for management fee comparisons is referred to below as the "Total Mapped Group." The Total Mapped Group comparison focuses on a fund's standing relative to the total universe of comparable funds available to investors, in terms of gross management fees before expense reimbursements or caps. "TMG %" represents the percentage of funds in the Total Mapped Group that had management fees that were lower than the fund's. For example, a TMG % of 4% means that 96% of the funds in the Total Mapped Group had higher management fees than the fund. The "Asset-Size Peer Group" (ASPG) comparison focuses on a fund's standing relative to non-Fidelity funds similar in size to the fund within the Total Mapped Group. The ASPG represents at least 15% of the funds in the Total Mapped Group with comparable asset size and management fee characteristics, subject to a minimum of 50 funds (or all funds in the Total Mapped Group if fewer than 50). Additional information, such as the ASPG quartile in which the fund's management fee ranked, is also included in the chart and considered by the Board.
Annual Report
Board Approval of Investment Advisory Contracts and Management Fees - continued
VIP Industrials Portfolio
The Board noted that the fund's management fee ranked below the median of its Total Mapped Group and below the median of its ASPG for 2008.
Based on its review, the Board concluded that the fund's management fee was fair and reasonable in light of the services that the fund receives and the other factors considered.
In its review of each class's total expenses, the Board considered the fund's management fee as well as other fund or class expenses, as applicable, such as transfer agent fees, pricing and bookkeeping fees, and custodial, legal, and audit fees. The Board also noted the effects of any waivers and reimbursements on fees and expenses. As part of its review, the Board also considered current and historical total expenses of each class of the fund compared to competitive fund median expenses. Each class of the fund is compared to those funds and classes in the Total Mapped Group (used by the Board for management fee comparisons) that have a similar sales load structure.
The Board noted that the total expenses of each class ranked below its competitive median for 2008.
In its review of total expenses, the Board also considered Fidelity fee structures and other information on clients that FMR and its affiliates service in other competitive markets, such as other mutual funds advised or subadvised by FMR or its affiliates, pension plan clients, and other institutional clients.
Based on its review, the Board concluded that the total expenses of each class of the fund were reasonable in light of the services that the fund and its shareholders receive and the other factors considered.
Costs of the Services and Profitability. The Board considered the revenues earned and the expenses incurred by Fidelity in conducting the business of developing, marketing, distributing, managing, administering and servicing the fund and its shareholders. The Board also considered the level of Fidelity's profits in respect of all the Fidelity funds.
On an annual basis, FMR presents to the Board Fidelity's profitability for the fund. Fidelity calculates the profitability for each fund, as well as aggregate profitability for groups of Fidelity funds and all Fidelity funds, using a series of detailed revenue and cost allocation methodologies which originate with the audited books and records of Fidelity. The Audit Committee of the Board reviews any significant changes from the prior year's methodologies.
PricewaterhouseCoopers LLP (PwC), independent registered public accounting firm and auditor to Fidelity and certain Fidelity funds, has been engaged annually by the Board as part of the Board's assessment of Fidelity's profitability analysis. PwC's engagement includes the review and assessment of Fidelity's methodologies used in determining the revenues and expenses attributable to Fidelity's mutual fund business, and completion of agreed-upon procedures surrounding the mathematical accuracy of fund profitability and its conformity to allocation methodologies. After considering PwC's reports issued under the engagement and information provided by Fidelity, the Board believes that while other allocation methods may also be reasonable, Fidelity's profitability methodologies are reasonable in all material respects.
The Board has also reviewed Fidelity's non-fund businesses and any fall-out benefits related to the mutual fund business as well as cases where Fidelity's affiliates may benefit from or be related to the fund's business.
The Board considered the costs of the services provided by and the profits realized by Fidelity in connection with the operation of the fund and determined that the amount of profit is a fair entrepreneurial profit for the management of the fund.
Annual Report
Economies of Scale. The Board considered whether there have been economies of scale in respect of the management of the Fidelity funds, whether the Fidelity funds (including the fund) have appropriately benefited from any such economies of scale, and whether there is potential for realization of any further economies of scale. The Board considered the extent to which the fund will benefit from economies of scale through increased services to the fund, through waivers or reimbursements, or through fee or expense reductions.
In February 2009, the Board created an Ad Hoc Committee (the "Committee") to analyze economies of scale. The Committee was formed to consider whether FMR attains economies of scale in respect of the management and servicing of the Fidelity funds, whether the Fidelity funds have appropriately benefited from such economies of scale, and whether there is potential for realization of any further economies of scale.
The Board recognized that the fund's management contract incorporates a "group fee" structure, which provides for lower group fee rates as total fund assets under FMR's management increase, and for higher group fee rates as total fund assets under FMR's management decrease. FMR determines the group fee rates based on a tiered asset "breakpoint" schedule. The Board considered that the group fee is designed to deliver the benefits of economies of scale to fund shareholders when total fund assets increase, even if assets of any particular fund are unchanged or have declined, because some portion of Fidelity's costs are attributable to services provided to all Fidelity funds, and all funds benefit if those costs can be allocated among more assets. The Board concluded that, given the group fee structure, fund shareholders will achieve a certain level of economies of scale as assets under FMR's management increase at the fund complex level, regardless of whether Fidelity achieves any such economies of scale.
The Board concluded, considering the findings of the Committee, that any potential economies of scale are being shared between fund shareholders and Fidelity in an appropriate manner.
Additional Information Requested by the Board. In order to develop fully the factual basis for consideration of the Fidelity funds' Advisory Contracts, the Board requested and received additional information on certain topics, including (i) fund performance trends, actions to be taken by FMR to improve certain funds' overall performance and Fidelity's long-term strategies for certain funds; (ii) portfolio manager changes that have occurred during the past year; (iii) Fidelity's compensation structure for portfolio managers and key personnel, including performance benchmarks used by Fidelity in evaluating incentive compensation for portfolio managers and research analysts; (iv) the structure and process of equity research and actions taken by FMR to improve the quality of research; (v) the selection of and compensation paid by FMR to fund sub-advisers; (vi) Fidelity's fee structures and rationale for recommending different fees among categories of funds; (vii) the rationale for any differences between fund fee structures and fee structures in place for other Fidelity clients; (viii) Fidelity's rationale for recommending which funds should have a performance adjustment component as part of their management fees; and (ix) explanations for the relative total expenses borne by certain funds and classes, total expense competitive trends, and actions that might be taken by FMR to reduce total expenses for certain funds and classes.
Based on its evaluation of all of the conclusions noted above, and after considering all material factors, the Board ultimately concluded that the advisory fee structures are fair and reasonable, and that the fund's Advisory Contracts should be renewed.
Annual Report
Investment Adviser
Fidelity Management & Research Company
Boston, MA
Investment Sub-Advisers
FMR Co., Inc.
Fidelity Management & Research (U.K.) Inc.
Fidelity Research & Analysis Company
FIL Investments (Japan) Limited
FIL Investment Advisors
FIL Investment Advisors (U.K.) Ltd.
Fidelity Management & Research (Hong Kong) Limited
Fidelity Management & Research (Japan) Inc.
General Distributor
Fidelity Distributors Corporation
Boston, MA
Transfer and Service Agents
Fidelity Investments Institutional Operations Company, Inc.
Boston, MA
Fidelity Service Company, Inc.
Boston, MA
Custodian
JPMorgan Chase Bank
New York, NY
VCYLIC-ANN-0210
1.817361.104
Fidelity® Variable Insurance Products:
International Capital Appreciation Portfolio
Annual Report
December 31, 2009
(2_fidelity_logos) (Registered_Trademark)
Contents
Performance | <Click Here> | How the fund has done over time. |
Management's Discussion | <Click Here> | The manager's review of fund performance, strategy and outlook. |
Shareholder Expense Example | <Click Here> | An example of shareholder expenses. |
Investment Changes | <Click Here> | A summary of major shifts in the fund's investments over the past six months. |
Investments | <Click Here> | A complete list of the fund's investments with their market values. |
Financial Statements | <Click Here> | Statements of assets and liabilities, operations, and changes in net assets, as well as financial highlights. |
Notes | <Click Here> | Notes to the financial statements. |
Report of Independent Registered Public Accounting Firm | <Click Here> | |
Trustees and Officers | <Click Here> | |
Distributions | <Click Here> | |
Board Approval of Investment Advisory Contracts and Management Fees | <Click Here> | |
To view a fund's proxy voting guidelines and proxy voting record for the 12-month period ended June 30, visit http://www.fidelity.com/proxyvotingresults or visit the Securities and Exchange Commission's (SEC) web site at http://www.sec.gov. You may also call 1-877-208-0098 to request a free copy of the proxy voting guidelines.
Fidelity Variable Insurance Products are separate account options which are purchased through a variable insurance contract.
Standard & Poor's, S&P and S&P 500 are registered service marks of The McGraw-Hill Companies, Inc. and have been licensed for use by Fidelity Distributors Corporation.
Other third party marks appearing herein are the property of their respective owners.
All other marks appearing herein are registered or unregistered trademarks or service marks of FMR LLC or an affiliated company.
This report and the financial statements contained herein are submitted for the general information of the shareholders of the fund. This report is not authorized for distribution to prospective investors in the fund unless preceded or accompanied by an effective prospectus.
A fund files its complete schedule of portfolio holdings with the SEC for the first and third quarters of each fiscal year on Form N-Q. Forms N-Q are available on the SEC's web site at http://www.sec.gov. A fund's Forms N-Q may be reviewed and copied at the SEC's Public Reference Room in Washington, DC. Information regarding the operation of the SEC's Public Reference Room may be obtained by calling 1-800-SEC-0330. For a complete list of a fund's portfolio holdings, view the most recent holdings listing, semiannual report, or annual report on Fidelity's web site at http://www.fidelity.com or http://www.advisor.fidelity.com, as applicable.
NOT FDIC INSURED · MAY LOSE VALUE · NO BANK GUARANTEE
Neither the fund nor Fidelity Distributors Corporation is a bank.
Annual Report
Average annual total return reflects the change in the value of an investment, assuming reinvestment of the class' dividend income and capital gains (the profits earned upon the sale of securities that have grown in value, if any) and assuming a constant rate of performance each year. During periods of reimbursement by Fidelity, a fund's total return will be greater than it would be had the reimbursement not occurred. Performance numbers are net of all underlying fund operating expenses, but do not include any insurance charges imposed by your insurance company's separate account. If performance information included the effect of these additional charges, the total returns would have been lower. How a fund did yesterday is no guarantee of how it will do tomorrow.
Average Annual Total Returns
Periods ended December 31, 2009 | Past 1
Year | Past 5
Years | Life of
fundA |
VIP International Capital Appreciation - Initial Class | 56.04% | 0.81% | 1.28% |
VIP International Capital Appreciation - Service Class | 55.52% | 0.69% | 1.16% |
VIP International Capital Appreciation - Service Class 2 | 55.44% | 0.55% | 1.03% |
VIP International Capital Appreciation - Initial Class R | 55.76% | 0.81% | 1.28% |
VIP International Capital Appreciation - Service Class R | 55.52% | 0.69% | 1.16% |
VIP International Capital Appreciation - Service Class 2R | 55.36% | 0.55% | 1.02% |
VIP International Capital Appreciation - Investor Class R B | 55.61% | 0.70% | 1.18% |
A From December 22, 2004.
B The initial offering of Investor Class R shares took place on July 21, 2005. Returns prior to July 21, 2005 are those of Initial Class R. Had Investor Class R's transfer agent fee had been reflected, returns prior to July 21, 2005 would have been lower.
$10,000 Over Life of Fund
Let's say hypothetically that $10,000 was invested in VIP International Capital Appreciation Portfolio - Initial Class on December 22, 2004, when the fund started. The chart shows how the value of your investment would have changed, and also shows how the MSCI® ACWI (All Country World Index) ex USA Index performed over the same period.
Annual Report
Market Recap: In 2009, most global markets saw both crippling lows and considerable highs. After a dismal start, the economy began to show signs of improvement, suggesting that a recovery was on the horizon. Credit markets began to heal as fiscal and monetary stimulus efforts around the world started to take effect, and corporate earnings staged an impressive rebound, fueled in large part by massive cost cutting. As a result, the flight to quality that marked most of 2008 and early 2009 shifted in March as investors flocked to riskier asset categories. The U.S. equity market, as measured by the bellwether Standard & Poor's 500SM Index and the blue-chip proxy Dow Jones Industrial AverageSM, reflected this changing environment, gaining 26.46% and 22.68%, respectively. Meanwhile, the technology-laden Nasdaq Composite® Index rose 45.32%. Foreign stocks also produced strong gains, as illustrated by the 31.93% jump of the MSCI® EAFE® Index (Europe, Australasia, Far East), a gauge of developed stock markets outside the U.S. and Canada. Emerging-markets stocks, which suffered their worst calendar-year performance ever in 2008, posted record returns this past year, with the MSCI Emerging Markets Index soaring 79.02%. A depreciating U.S. dollar helped bolster returns for U.S. investors in foreign equities.
Comments from Sammy Simnegar, Portfolio Manager of VIP International Capital Appreciation Portfolio: During the past year, the fund handily beat the 41.60% return of its benchmark, the MSCI ACWI (All Country World Index) ex USA Index. (For specific portfolio results, please refer to the performance section of this report.) Stock selection in materials - where I focused on producers of industrial and precious metals such as copper, steel and platinum - accounted for more than a third of the fund's edge over its benchmark. The fund also benefited from favorable stock picks in energy, information technology, consumer discretionary and financials, among other sectors. In fact, nine out of 10 market sectors contributed to performance. Our top relative contributor was Germany-based Aixtron, a manufacturer of machines that make LED (light-emitting diode) lights, a rapidly growing market. Three notable contributors from the diversified financials segment of the financials sector were American firms Morgan Stanley, Goldman Sachs and Bank of America. To varying degrees, all three were pressured by balance sheet concerns until assistance from the federal government calmed investors nerves and triggered a rebound in the financial markets that lasted from March through the end of the year. Three other contributors were from the metals and mining industry: Canada's Consolidated Thompson Iron Mines, Russian steel producer Evraz Group and Swiss copper and coal miner Xstrata, all of which benefited from rising prices for their respective commodities. All the contributors I mentioned, except for Xstrata, were out-of-index positions. The fund did not hold Goldman Sachs or Evraz Group at period end. Conversely, the industrials sector detracted modestly because of lackluster stock picking. Additionally, within financials, which had a positive overall impact on our relative results, stock selection in the insurance group dampened the fund's gains. A small cash position also was counterproductive in a strongly rising market. Among individual holdings, French insurer AXA, Swiss diversified financial services provider UBS and U.S. commercial bank Citigroup detracted - mostly due to poor timing. First Uranium, a Canadian developer of uranium- and gold-mining projects in South Africa, was hurt by an inability to secure funding and other operational problems. Neither First Uranium nor Citigroup was a component of the index.
The views expressed above reflect those of the portfolio manager(s) only through the end of the period as stated on the cover of this report and do not necessarily represent the views of Fidelity or any other person in the Fidelity organization. Any such views are subject to change at any time based upon market or other conditions and Fidelity disclaims any responsibility to update such views. These views may not be relied on as investment advice and, because investment decisions for a Fidelity fund are based on numerous factors, may not be relied on as an indication of trading intent on behalf of any Fidelity fund.
Annual Report
Shareholder Expense Example
As a shareholder of the Fund, you incur two types of costs: (1) transaction costs, including redemption fees, and (2) ongoing costs, including management fees, distribution and/or service (12b-1) fees and other Fund expenses. This Example is intended to help you understand your ongoing costs (in dollars) of investing in the Fund and to compare these costs with the ongoing costs of investing in other mutual funds.
The Example is based on an investment of $1,000 invested at the beginning of the period and held for the entire period (July 1, 2009 to December 31, 2009).
Actual Expenses
The first line of the accompanying table for each class of the Fund provides information about actual account values and actual expenses. You may use the information in this line, together with the amount you invested, to estimate the expenses that you paid over the period. Simply divide your account value by $1,000.00 (for example, an $8,600 account value divided by $1,000.00 = 8.6), then multiply the result by the number in the first line for a class of the Fund under the heading entitled "Expenses Paid During Period" to estimate the expenses you paid on your account during this period. The estimate of expenses does not include any fees or other expenses of any variable annuity or variable life insurance product. If they were, the estimate of expenses you paid during the period would be higher, and your ending account value would be lower. In addition, the Fund, as a shareholder in the underlying Fidelity Central Funds, will indirectly bear its pro-rata share of the fees and expenses incurred by the underlying Fidelity Central Funds. These fees and expenses are not included in the Fund's annualized expense ratio used to calculate the expense estimate in the table below.
Hypothetical Example for Comparison Purposes
The second line of the accompanying table for each class of the Fund provides information about hypothetical account values and hypothetical expenses based on a Class' actual expense ratio and an assumed rate of return of 5% per year before expenses, which is not the Class' actual return. The hypothetical account values and expenses may not be used to estimate the actual ending account balance or expenses you paid for the period. You may use this information to compare the ongoing costs of investing in the Fund and other funds. To do so, compare this 5% hypothetical example with the 5% hypothetical examples that appear in the shareholder reports of the other funds. The estimate of expenses does not include any fees or other expenses of any variable annuity or variable life insurance product. If they were, the estimate of expenses you paid during the period would be higher, and your ending account value would be lower. In addition, the Fund, as a shareholder in the underlying Fidelity Central Funds, will indirectly bear its pro-rata share of the fees and expenses incurred by the underlying Fidelity Central Funds. These fees and expenses are not included in the Fund's annualized expense ratio used to calculate the expense estimate in the table below.
Please note that the expenses shown in the table are meant to highlight your ongoing costs only and do not reflect any transaction costs. Therefore, the second line of the table is useful in comparing ongoing costs only, and will not help you determine the relative total costs of owning different funds. In addition, if these transactional costs were included, your costs would have been higher.
| Annualized
Expense Ratio | Beginning
Account Value
July 1, 2009 | Ending
Account Value
December 31, 2009 | Expenses Paid
During Period*
July 1, 2009 to
December 31, 2009 |
Initial Class | 1.10% | | | |
Actual | | $ 1,000.00 | $ 1,254.10 | $ 6.25 |
HypotheticalA | | $ 1,000.00 | $ 1,019.66 | $ 5.60 |
Service Class | 1.20% | | | |
Actual | | $ 1,000.00 | $ 1,251.80 | $ 6.81 |
HypotheticalA | | $ 1,000.00 | $ 1,019.16 | $ 6.11 |
Service Class 2 | 1.35% | | | |
Actual | | $ 1,000.00 | $ 1,252.40 | $ 7.66 |
HypotheticalA | | $ 1,000.00 | $ 1,018.40 | $ 6.87 |
Initial Class R | 1.10% | | | |
Actual | | $ 1,000.00 | $ 1,254.10 | $ 6.25 |
HypotheticalA | | $ 1,000.00 | $ 1,019.66 | $ 5.60 |
Service Class R | 1.20% | | | |
Actual | | $ 1,000.00 | $ 1,251.80 | $ 6.81 |
HypotheticalA | | $ 1,000.00 | $ 1,019.16 | $ 6.11 |
Service Class 2R | 1.35% | | | |
Actual | | $ 1,000.00 | $ 1,251.80 | $ 7.66 |
HypotheticalA | | $ 1,000.00 | $ 1,018.40 | $ 6.87 |
Investor Class R | 1.18% | | | |
Actual | | $ 1,000.00 | $ 1,253.80 | $ 6.70 |
HypotheticalA | | $ 1,000.00 | $ 1,019.26 | $ 6.01 |
A 5% return per year before expenses
* Expenses are equal to each Class' annualized expense ratio, multiplied by the average account value over the period, multiplied by 184/365 (to reflect the one-half year period).
Annual Report
Investment Changes (Unaudited)
Geographic Diversification (% of fund's net assets) |
As of December 31, 2009 |
| Japan | 14.9% | |
| United Kingdom | 11.8% | |
| United States of America | 8.0% | |
| France | 7.9% | |
| Canada | 7.0% | |
| Australia | 4.9% | |
| Russia | 4.2% | |
| India | 3.6% | |
| Korea (South) | 3.5% | |
| Other | 34.2% | |

Percentages are adjusted for the effect of futures contracts, if applicable. |
As of June 30, 2009 |
| Japan | 17.1% | |
| United Kingdom | 13.2% | |
| United States of America | 11.9% | |
| France | 8.7% | |
| Canada | 7.6% | |
| Germany | 3.1% | |
| Spain | 3.0% | |
| India | 3.0% | |
| Russia | 2.9% | |
| Other | 29.5% | |

Percentages are adjusted for the effect of futures contracts, if applicable. |
Asset Allocation |
| % of fund's
net assets | % of fund's net assets
6 months ago |
Stocks | 99.5 | 98.1 |
Bonds | 0.5 | 0.0 |
Short-Term Investments and Net Other Assets | 0.0 | 1.9 |
Top Ten Stocks as of December 31, 2009 |
| % of fund's
net assets | % of fund's net assets
6 months ago |
HSBC Holdings PLC sponsored ADR (United Kingdom, Commercial Banks) | 1.8 | 0.0 |
Royal Dutch Shell PLC Class B (United Kingdom, Oil, Gas & Consumable Fuels) | 1.7 | 1.8 |
Barclays PLC Sponsored ADR (United Kingdom, Commercial Banks) | 1.3 | 1.2 |
ING Groep NV sponsored ADR (Netherlands, Diversified Financial Services) | 1.2 | 0.0 |
Rio Tinto PLC (Reg.) (United Kingdom, Metals & Mining) | 1.1 | 0.8 |
UBS AG (NY Shares) (Switzerland, Capital Markets) | 1.1 | 0.0 |
Sanofi-Aventis sponsored ADR (France, Pharmaceuticals) | 1.1 | 0.0 |
Centrais Electricas Brasileiras SA (Electrobras) ADR (Brazil, Electric Utilities) | 1.1 | 0.0 |
Samsung Electronics Co. Ltd. (Korea (South), Semiconductors & Semiconductor Equipment) | 1.0 | 1.0 |
Mitsubishi UFJ Financial Group, Inc. sponsored ADR (Japan, Commercial Banks) | 1.0 | 1.1 |
| 12.4 | |
Market Sectors as of December 31, 2009 |
| % of fund's
net assets | % of fund's net assets
6 months ago |
Financials | 27.0 | 24.4 |
Materials | 14.2 | 10.2 |
Consumer Discretionary | 10.4 | 12.2 |
Energy | 10.4 | 10.0 |
Information Technology | 9.8 | 8.8 |
Industrials | 8.3 | 10.0 |
Consumer Staples | 6.5 | 5.3 |
Utilities | 4.8 | 4.1 |
Health Care | 4.7 | 5.3 |
Telecommunication Services | 3.9 | 7.8 |
Annual Report
Investments December 31, 2009
Showing Percentage of Net Assets
Common Stocks - 98.9% |
| Shares | | Value |
Australia - 4.9% |
Fortescue Metals Group Ltd. (a) | 62,588 | | $ 249,615 |
JB Hi-Fi Ltd. | 11,156 | | 226,472 |
MacArthur Coal Ltd. | 26,983 | | 272,672 |
Macquarie Group Ltd. | 6,688 | | 290,763 |
Origin Energy Ltd. | 18,185 | | 274,749 |
Wesfarmers Ltd. | 11,786 | | 331,048 |
Westfield Group unit | 27,118 | | 305,459 |
Woolworths Ltd. | 12,463 | | 313,457 |
TOTAL AUSTRALIA | | 2,264,235 |
Bailiwick of Guernsey - 0.6% |
Raven Russia Ltd. | 305,500 | | 222,180 |
Tetragon Financial Group Ltd. | 12,200 | | 47,702 |
TOTAL BAILIWICK OF GUERNSEY | | 269,882 |
Belgium - 1.6% |
Anheuser-Busch InBev SA NV | 6,956 | | 362,442 |
Fortis (a) | 100,775 | | 378,432 |
TOTAL BELGIUM | | 740,874 |
Bermuda - 2.0% |
Aquarius Platinum Ltd. (United Kingdom) (a) | 37,700 | | 247,980 |
Dufry South America Ltd. unit | 10,003 | | 204,881 |
Huabao International Holdings Ltd. | 223,000 | | 239,785 |
Northern Offshore Ltd. (a)(c) | 136,000 | | 222,914 |
TOTAL BERMUDA | | 915,560 |
Brazil - 3.3% |
Banco Santander (Brasil) SA ADR | 19,500 | | 271,830 |
Centrais Eletricas Brasileiras SA (Electrobras) sponsored ADR | 23,000 | | 485,070 |
MRV Engenharia e Participacoes SA | 31,800 | | 252,685 |
OGX Petroleo e Gas Participacoes SA | 26,200 | | 254,785 |
PDG Realty S.A. Empreendimentos e Participacoes | 25,100 | | 249,992 |
TOTAL BRAZIL | | 1,514,362 |
Canada - 7.0% |
Canadian Imperial Bank of Commerce | 4,700 | | 304,864 |
Consolidated Thompson Iron Mines Ltd. (a) | 40,700 | | 261,868 |
First Quantum Minerals Ltd. | 3,700 | | 282,646 |
First Uranium Corp. (a) | 112,000 | | 245,182 |
Grande Cache Coal Corp. (a) | 43,700 | | 222,940 |
InterOil Corp. (a) | 3,100 | | 238,111 |
Niko Resources Ltd. | 2,600 | | 243,506 |
OPTI Canada, Inc. (a)(c) | 143,400 | | 277,068 |
Petrobank Energy & Resources Ltd. (a) | 5,200 | | 253,455 |
Quadra Mining Ltd. (a) | 17,100 | | 236,160 |
Suncor Energy, Inc. | 11,000 | | 389,578 |
Teck Resources Ltd. Class B (sub. vtg.) (a) | 8,200 | | 287,369 |
TOTAL CANADA | | 3,242,747 |
|
| Shares | | Value |
Cayman Islands - 1.9% |
Hengdeli Holdings Ltd. | 612,000 | | $ 231,076 |
JA Solar Holdings Co. Ltd. ADR (a) | 36,300 | | 206,910 |
Peak Sport Products Co. Ltd. | 442,000 | | 242,425 |
Trina Solar Ltd. ADR (a)(c) | 4,000 | | 215,880 |
TOTAL CAYMAN ISLANDS | | 896,291 |
China - 1.6% |
China Construction Bank Corp. (H Shares) | 423,000 | | 361,290 |
China Life Insurance Co. Ltd. ADR (c) | 4,700 | | 344,745 |
Digital China Holdings Ltd. (H Shares) | 44,000 | | 58,574 |
TOTAL CHINA | | 764,609 |
Cyprus - 0.5% |
Mirland Development Corp. PLC (a) | 81,800 | | 211,522 |
Denmark - 0.5% |
Carlsberg AS Series B | 3,200 | | 236,396 |
Finland - 0.6% |
Fortum Corp. | 9,700 | | 263,436 |
France - 7.9% |
Accor SA | 4,652 | | 254,746 |
Atos Origin SA (a) | 5,160 | | 237,022 |
AXA SA sponsored ADR | 15,100 | | 357,568 |
BNP Paribas SA | 5,881 | | 470,652 |
Carrefour SA | 6,637 | | 318,882 |
Credit Agricole SA | 19,300 | | 341,517 |
Iliad Group SA | 1,833 | | 219,174 |
Saft Groupe SA | 4,716 | | 227,936 |
Sanofi-Aventis sponsored ADR | 12,500 | | 490,875 |
Schneider Electric SA | 2,708 | | 317,054 |
Societe Generale Series A | 5,824 | | 408,142 |
TOTAL FRANCE | | 3,643,568 |
Germany - 3.2% |
Aixtron AG | 7,706 | | 259,259 |
Daimler AG (Reg.) | 7,148 | | 380,988 |
Deutsche Bank AG (NY Shares) | 5,100 | | 361,641 |
HeidelbergCement AG | 3,619 | | 249,886 |
Metro AG | 3,700 | | 225,498 |
TOTAL GERMANY | | 1,477,272 |
Greece - 1.2% |
Hellenic Telecommunications Organization SA | 17,523 | | 258,143 |
National Bank of Greece SA sponsored ADR | 53,900 | | 280,819 |
TOTAL GREECE | | 538,962 |
Hong Kong - 0.5% |
China Resources Power Holdings Co. Ltd. | 124,000 | | 245,638 |
India - 3.6% |
Bank of Baroda | 20,020 | | 221,704 |
Common Stocks - continued |
| Shares | | Value |
India - continued |
BGR Energy Systems Ltd. | 22,052 | | $ 233,278 |
Financial Technologies India Ltd. | 8,292 | | 240,211 |
ICSA (India) Ltd. | 63,316 | | 245,297 |
Jaiprakash Associates Ltd. | 75,192 | | 237,922 |
MIC Electronics Ltd. | 253,509 | | 247,173 |
Rural Electrification Corp. Ltd. (a) | 3,032 | | 15,862 |
Sintex Industries Ltd. | 36,134 | | 213,721 |
TOTAL INDIA | | 1,655,168 |
Indonesia - 0.5% |
PT Semen Gresik Tbk | 297,500 | | 238,316 |
Ireland - 0.5% |
Covidien PLC | 4,700 | | 225,083 |
Israel - 0.9% |
Teva Pharmaceutical Industries Ltd. sponsored ADR | 7,100 | | 398,878 |
Italy - 1.3% |
Intesa Sanpaolo SpA | 74,354 | | 335,314 |
Mediaset SpA | 31,700 | | 260,273 |
TOTAL ITALY | | 595,587 |
Japan - 14.9% |
eAccess Ltd. (c) | 444 | | 261,090 |
Elpida Memory, Inc. (a) | 15,000 | | 244,588 |
Fujifilm Holdings Corp. | 9,600 | | 290,067 |
Gulliver International Co. Ltd. | 3,310 | | 231,688 |
Itochu Corp. | 36,000 | | 266,052 |
Japan Tobacco, Inc. | 76 | | 256,738 |
JTEKT Corp. | 18,100 | | 232,910 |
Kenedix, Inc. (a) | 671 | | 217,227 |
Kimoto Co. Ltd. | 23,700 | | 280,028 |
Kirin Holdings Co. Ltd. | 17,000 | | 272,761 |
Kyocera Corp. | 3,200 | | 281,962 |
Mazda Motor Corp. (a) | 105,000 | | 241,557 |
Mitsubishi Corp. | 13,100 | | 326,460 |
Mitsubishi UFJ Financial Group, Inc. sponsored ADR | 96,300 | | 473,796 |
Mitsui & Co. Ltd. | 21,700 | | 307,987 |
Nitori Co. Ltd. | 3,150 | | 234,575 |
ORIX Corp. | 5,590 | | 380,775 |
Sapporo Breweries Ltd. | 41,000 | | 226,029 |
SOFTBANK CORP. | 11,300 | | 265,031 |
Sony Corp. sponsored ADR | 11,100 | | 321,900 |
Sumitomo Metal Industries Ltd. | 97,000 | | 260,866 |
Sumitomo Realty & Development Co. Ltd. | 13,000 | | 245,526 |
Tokyo Ohka Kogyo Co. Ltd. | 12,500 | | 232,616 |
Toshiba Corp. | 56,000 | | 310,889 |
Uni-Charm Corp. | 2,600 | | 243,858 |
TOTAL JAPAN | | 6,906,976 |
Korea (South) - 3.5% |
Duksan Hi-Metal Co. Ltd. (a) | 19,414 | | 217,270 |
|
| Shares | | Value |
Hanjin Heavy Industries & Consolidated Co. Ltd. | 11,955 | | $ 232,216 |
Hyundai Mipo Dockyard Co. Ltd. | 2,643 | | 233,458 |
Kia Motors Corp. (a) | 14,530 | | 249,835 |
Lumens Co. Ltd. (a) | 28,872 | | 221,107 |
Samsung Electronics Co. Ltd. | 704 | | 482,384 |
TOTAL KOREA (SOUTH) | | 1,636,270 |
Luxembourg - 0.5% |
Millicom International Cellular SA | 3,300 | | 243,441 |
Mexico - 0.6% |
Cemex SA de CV sponsored ADR | 22,200 | | 262,404 |
Netherlands - 2.4% |
ASM International NV (Netherlands) (a)(c) | 9,400 | | 238,938 |
ING Groep NV sponsored ADR (a)(c) | 55,184 | | 541,355 |
Koninklijke Philips Electronics NV | 10,663 | | 314,774 |
TOTAL NETHERLANDS | | 1,095,067 |
Norway - 1.6% |
Pronova BioPharma ASA (a) | 154,000 | | 467,637 |
Sevan Marine ASA (a)(c) | 145,000 | | 254,177 |
TOTAL NORWAY | | 721,814 |
Qatar - 0.7% |
Commercial Bank of Qatar GDR (Reg. S) | 97,450 | | 330,779 |
Russia - 4.2% |
LSR Group OJSC GDR (Reg. S) (a) | 31,900 | | 290,290 |
Mechel Steel Group OAO sponsored ADR | 12,100 | | 227,722 |
Mosenergo AO sponsored ADR (a) | 23,800 | | 249,900 |
OAO Gazprom sponsored ADR | 17,700 | | 443,385 |
RusHydro JSC sponsored ADR (a) | 61,300 | | 234,779 |
Uralkali JSC GDR (Reg. S) (a) | 12,300 | | 258,300 |
VTB Bank JSC unit | 52,700 | | 248,744 |
TOTAL RUSSIA | | 1,953,120 |
South Africa - 1.9% |
MTN Group Ltd. | 19,900 | | 316,628 |
Naspers Ltd. Class N | 6,800 | | 275,304 |
Raubex Group Ltd. | 82,900 | | 268,390 |
TOTAL SOUTH AFRICA | | 860,322 |
Spain - 0.5% |
NH Hoteles SA (a) | 41,737 | | 222,280 |
Sweden - 0.9% |
EnergyO Solutions AB (a) | 80,410 | | 440,313 |
Switzerland - 2.3% |
Actelion Ltd. (Reg.) (a) | 5,965 | | 317,995 |
Clariant AG (Reg.) (a) | 20,534 | | 242,335 |
UBS AG (NY Shares) (a) | 33,600 | | 521,136 |
TOTAL SWITZERLAND | | 1,081,466 |
Common Stocks - continued |
| Shares | | Value |
Taiwan - 0.5% |
Prime View International Co. Ltd. (a) | 93,000 | | $ 244,783 |
Turkey - 0.5% |
Sinpas Gayrimenkul Yatirim Ortakligi AS | 155,000 | | 239,306 |
United Kingdom - 11.8% |
Anglo American PLC (United Kingdom) (a) | 9,500 | | 416,231 |
Barclays PLC Sponsored ADR (c) | 33,700 | | 593,120 |
BG Group PLC | 23,059 | | 418,134 |
BT Group PLC | 119,500 | | 260,404 |
Cairn Energy PLC (a) | 46,540 | | 250,167 |
Carphone Warehouse Group PLC | 78,997 | | 239,766 |
Centrica PLC | 68,711 | | 312,154 |
Ferrexpo PLC | 68,570 | | 219,977 |
HSBC Holdings PLC sponsored ADR | 14,800 | | 844,927 |
Rio Tinto PLC (Reg.) | 9,800 | | 529,480 |
Royal Dutch Shell PLC Class B | 26,687 | | 777,669 |
Vedanta Resources PLC | 6,200 | | 261,626 |
Xstrata PLC (a) | 19,900 | | 360,529 |
TOTAL UNITED KINGDOM | | 5,484,184 |
United States of America - 8.0% |
Bank of America Corp. | 29,900 | | 450,294 |
Citigroup, Inc. | 70,000 | | 231,700 |
CVS Caremark Corp. | 7,100 | | 228,691 |
Ener1, Inc. (a)(c) | 31,620 | | 200,471 |
JPMorgan Chase & Co. | 10,890 | | 453,786 |
Morgan Stanley | 15,516 | | 459,274 |
Pfizer, Inc. | 13,100 | | 238,289 |
PNC Financial Services Group, Inc. | 4,700 | | 248,113 |
Rubicon Technology, Inc. (a)(c) | 13,331 | | 270,753 |
Sprint Nextel Corp. (a) | 62,802 | | 229,855 |
Veeco Instruments, Inc. (a) | 7,726 | | 255,267 |
Wells Fargo & Co. | 17,014 | | 459,208 |
TOTAL UNITED STATES OF AMERICA | | 3,725,701 |
TOTAL COMMON STOCKS (Cost $41,520,688) | 45,786,612 |
Nonconvertible Preferred Stocks - 0.6% |
| Shares | | Value |
Italy - 0.6% |
Fiat SpA (Risparmio Shares)
(Cost $161,564) | 28,300 | | $ 255,046 |
Nonconvertible Bonds - 0.5% |
| Principal Amount | | |
Venezuela - 0.5% |
Petroleos de Venezuela SA 5.375% 4/12/27
(Cost $244,363) | | $ 540,000 | | 238,950 |
Money Market Funds - 5.5% |
| Shares | | |
Fidelity Securities Lending Cash Central Fund, 0.15% (b)(d)
(Cost $2,568,752) | 2,568,752 | | 2,568,752 |
TOTAL INVESTMENT PORTFOLIO - 105.5% (Cost $44,495,367) | | 48,849,360 |
NET OTHER ASSETS - (5.5)% | | (2,547,162) |
NET ASSETS - 100% | $ 46,302,198 |
Legend |
(a) Non-income producing |
(b) Investment made with cash collateral received from securities on loan. |
(c) Security or a portion of the security is on loan at period end. |
(d) Affiliated fund that is available only to investment companies and other accounts managed by Fidelity Investments. The rate quoted is the annualized seven-day yield of the fund at period end. A complete unaudited listing of the fund's holdings as of its most recent quarter end is available upon request. |
Affiliated Central Funds |
Information regarding fiscal year to date income earned by the Fund from investments in Fidelity Central Funds is as follows: |
Fund | Income earned |
Fidelity Cash Central Fund | $ 2,820 |
Fidelity Securities Lending Cash Central Fund | 48,608 |
Total | $ 51,428 |
Other Information |
The following is a summary of the inputs used, as of December 31, 2009, involving the Fund's assets and liabilities carried at value. The inputs or methodology used for valuing securities may not be an indication of the risk associated with investing in those securities. For more information on valuation inputs, and their aggregation into the levels used in the tables below, please refer to the Security Valuation section in the accompanying Notes to Financial Statements. |
Valuation Inputs at Reporting Date: |
Description | Total | Level 1 | Level 2 | Level 3 |
Investments in Securities: | | | | |
Equities: | | | | |
Japan | $ 6,906,976 | $ 795,696 | $ 6,111,280 | $ - |
United Kingdom | 5,484,184 | 3,916,631 | 1,567,553 | - |
United States of America | 3,725,701 | 3,725,701 | - | - |
France | 3,643,568 | 3,643,568 | - | - |
Canada | 3,242,747 | 3,242,747 | - | - |
Australia | 2,264,235 | 2,264,235 | - | - |
Russia | 1,953,120 | 1,703,220 | - | 249,900 |
India | 1,655,168 | 1,655,168 | - | - |
Korea (South) | 1,636,270 | 1,636,270 | - | - |
Other | 15,529,689 | 13,455,139 | 2,074,550 | - |
Corporate Bonds | 238,950 | - | 238,950 | - |
Money Market Funds | 2,568,752 | 2,568,752 | - | - |
Total Investments in Securities: | $ 48,849,360 | $ 38,607,127 | $ 9,992,333 | $ 249,900 |
The following is a reconciliation of Investments in Securities for which Level 3 inputs were used in determining value: |
Investments in Securities: | |
Beginning Balance | $ 561,490 |
Total Realized Gain (Loss) | (334,263) |
Total Unrealized Gain (Loss) | 197,849 |
Cost of Purchases | 1,261,798 |
Proceeds of Sales | (1,436,974) |
Amortization/Accretion | - |
Transfers in/out of Level 3 | - |
Ending Balance | $ 249,900 |
The change in unrealized gain (loss) for the period attributable to Level 3 securities held at December 31, 2009 | $ 3,668 |
The information used in the above reconciliation represents fiscal year to date activity for any Investments in Securities identified as using Level 3 inputs at either the beginning or the end of the current fiscal period. Transfers in or out of Level 3 represents either the beginning value (for transfers in), or the ending value (for transfers out) of any Security or Instrument where a change in the pricing level occurred from the beginning to the end of the period. Realized and unrealized gains (losses) disclosed in the reconciliation are included in Net Gain (Loss) on the Fund's Statement of Operations. |
Income Tax Information |
At December 31, 2009, the fund had a capital loss carryforward of approximately $24,891,544 of which $20,462,362 and $4,429,182 will expire on December 31, 2016 and 2017, respectively. |
See accompanying notes which are an integral part of the financial statements.
Annual Report
Financial Statements
Statement of Assets and Liabilities
| December 31, 2009 |
Assets | | |
Investment in securities, at value (including securities loaned of $2,458,778) - See accompanying schedule: Unaffiliated issuers (cost $41,926,615) | $ 46,280,608 | |
Fidelity Central Funds (cost $2,568,752) | 2,568,752 | |
Total Investments (cost $44,495,367) | | $ 48,849,360 |
Foreign currency held at value (cost $199,573) | | 199,573 |
Receivable for investments sold | | 1,295,846 |
Receivable for fund shares sold | | 33,791 |
Dividends receivable | | 61,270 |
Interest receivable | | 6,369 |
Distributions receivable from Fidelity Central Funds | | 5,198 |
Prepaid expenses | | 174 |
Receivable from investment adviser for expense reductions | | 26,218 |
Other receivables | | 77,913 |
Total assets | | 50,555,712 |
| | |
Liabilities | | |
Payable to custodian bank | $ 482,477 | |
Payable for investments purchased | 966,468 | |
Payable for fund shares redeemed | 99,825 | |
Accrued management fee | 27,194 | |
Distribution fees payable | 140 | |
Other affiliated payables | 6,438 | |
Other payables and accrued expenses | 102,220 | |
Collateral on securities loaned, at value | 2,568,752 | |
Total liabilities | | 4,253,514 |
| | |
Net Assets | | $ 46,302,198 |
Net Assets consist of: | | |
Paid in capital | | $ 67,952,331 |
Undistributed net investment income | | 277 |
Accumulated undistributed net realized gain (loss) on investments and foreign currency transactions | | (25,989,565) |
Net unrealized appreciation (depreciation) on investments and assets and liabilities in foreign currencies | | 4,339,155 |
Net Assets | | $ 46,302,198 |
Statement of Assets and Liabilities - continued
| December 31, 2009 |
Initial Class:
Net Asset Value, offering price and redemption price per share ($644,549 ÷ 74,965 shares) | | $ 8.60 |
| | |
Service Class:
Net Asset Value, offering price and redemption price per share ($117,060 ÷ 13,637 shares) | | $ 8.58 |
| | |
Service Class 2:
Net Asset Value, offering price and redemption price per share ($423,680 ÷ 49,456 shares) | | $ 8.57 |
| | |
Initial Class R:
Net Asset Value, offering price and redemption price per share ($17,150,356 ÷ 1,994,433 shares) | | $ 8.60 |
| | |
Service Class R:
Net Asset Value, offering price and redemption price per share ($117,060 ÷ 13,637 shares) | | $ 8.58 |
| | |
Service Class 2R:
Net Asset Value, offering price and redemption price per share ($154,866 ÷ 18,071 shares) | | $ 8.57 |
| | |
Investor Class R:
Net Asset Value, offering price and redemption price per share ($27,694,627 ÷ 3,234,722 shares) | | $ 8.56 |
See accompanying notes which are an integral part of the financial statements.
Annual Report
Statement of Operations
| Year ended December 31, 2009 |
| | |
Investment Income | | |
Dividends | | $ 607,663 |
Interest | | 14,760 |
Income from Fidelity Central Funds (including $48,608 from security lending) | | 51,428 |
| | 673,851 |
Less foreign taxes withheld | | (46,252) |
Total income | | 627,599 |
| | |
Expenses | | |
Management fee | $ 227,680 | |
Transfer agent fees | 50,577 | |
Distribution fees | 1,557 | |
Accounting and security lending fees | 16,901 | |
Custodian fees and expenses | 173,315 | |
Independent trustees' compensation | 206 | |
Audit | 60,404 | |
Legal | 174 | |
Miscellaneous | 2,758 | |
Total expenses before reductions | 533,572 | |
Expense reductions | (217,955) | 315,617 |
Net investment income (loss) | | 311,982 |
Realized and Unrealized Gain (Loss) Net realized gain (loss) on: | | |
Investment securities: | | |
Unaffiliated issuers (net of foreign taxes of $47,039) | 3,341,158 | |
Foreign currency transactions | (39,859) | |
Total net realized gain (loss) | | 3,301,299 |
Change in net unrealized appreciation (depreciation) on: Investment securities (net of increase in deferred foreign taxes of $29,237) | 9,544,911 | |
Assets and liabilities in foreign currencies | 5,608 | |
Total change in net unrealized appreciation (depreciation) | | 9,550,519 |
Net gain (loss) | | 12,851,818 |
Net increase (decrease) in net assets resulting from operations | | $ 13,163,800 |
Statement of Changes in Net Assets
| Year ended
December 31, 2009 | Year ended
December 31, 2008 |
Increase (Decrease) in Net Assets | | |
Operations | | |
Net investment income (loss) | $ 311,982 | $ 754,623 |
Net realized gain (loss) | 3,301,299 | (24,913,119) |
Change in net unrealized appreciation (depreciation) | 9,550,519 | (5,460,953) |
Net increase (decrease) in net assets resulting from operations | 13,163,800 | (29,619,449) |
Distributions to shareholders from net investment income | (317,347) | - |
Distributions to shareholders from net realized gain | (478,375) | (328,342) |
Total distributions | (795,722) | (328,342) |
Share transactions - net increase (decrease) | 10,098,658 | (20,630,488) |
Redemption fees | 6,920 | 5,532 |
Total increase (decrease) in net assets | 22,473,656 | (50,572,747) |
| | |
Net Assets | | |
Beginning of period | 23,828,542 | 74,401,289 |
End of period (including undistributed net investment income of $277 and undistributed net investment income of $5,642, respectively) | $ 46,302,198 | $ 23,828,542 |
See accompanying notes which are an integral part of the financial statements.
Annual Report
Financial Highlights - Initial Class
Years ended December 31, | 2009 | 2008 | 2007 | 2006 | 2005 |
Selected Per-Share Data | | | | | |
Net asset value, beginning of period | $ 5.61 | $ 11.44 | $ 12.68 | $ 11.46 | $ 10.24 |
Income from Investment Operations | | | | | |
Net investment income (loss) C | .07 | .15 | .11 F | .11 | .06 |
Net realized and unrealized gain (loss) | 3.07 | (5.92) | .53 | 1.54 | 1.21 |
Total from investment operations | 3.14 | (5.77) | .64 | 1.65 | 1.27 |
Distributions from net investment income | (.06) | - | (.09) | (.10) | (.02) |
Distributions from net realized gain | (.09) | (.06) | (1.79) | (.34) | (.02) |
Total distributions | (.15) | (.06) | (1.88) | (.43) J | (.05) I |
Redemption fees added to paid in capital C, H | - | - | - | - | - |
Net asset value, end of period | $ 8.60 | $ 5.61 | $ 11.44 | $ 12.68 | $ 11.46 |
Total Return A, B | 56.04% | (50.69)% | 5.17% | 14.49% | 12.37% |
Ratios to Average Net Assets D, G | | | | | |
Expenses before reductions | 1.81% | 1.54% | 1.20% | 1.80% | 3.55% |
Expenses net of fee waivers, if any | 1.10% | 1.10% | 1.10% | 1.10% | 1.10% |
Expenses net of all reductions | .93% | .91% | 1.07% | 1.00% | .91% |
Net investment income (loss) | 1.03% | 1.65% | .82% F | .95% | .53% |
Supplemental Data | | | | | |
Net assets, end of period (000 omitted) | $ 645 | $ 388 | $ 1,409 | $ 1,357 | $ 9,367 |
Portfolio turnover rate E | 416% | 350% | 224% | 185% | 176% |
A Total returns do not reflect charges attributable to your insurance company's separate account. Inclusion of these charges would reduce the total returns shown. B Total returns would have been lower had certain expenses not been reduced during the periods shown. C Calculated based on average shares outstanding during the period. D Fees and expenses of the underlying Fidelity Central Funds are not included in the Fund's expense ratio. The Fund indirectly bears its proportionate share of the expenses of any underlying Fidelity Central Funds. E Amount does not include the portfolio activity of any underlying Fidelity Central Funds. F Investment income per share reflects a special dividend which amounted to $.02 per share. Excluding the special dividend, the ratio of net investment income (loss) to average net assets would have been .68%. G Expense ratios reflect operating expenses of the class. Expenses before reductions do not reflect amounts reimbursed by the investment adviser or reductions from brokerage service arrangements or reductions from other expense offset arrangements and do not represent the amount paid by the class during periods when reimbursements or reductions occur. Expenses net of fee waivers reflect expenses after reimbursement by the investment adviser but prior to reductions from brokerage service arrangements or other expense offset arrangements. Expenses net of all reductions represent the net expenses paid by the class. H Amount represents less than $.01 per share. I Total distributions of $.05 per share is comprised of distributions from net investment income of $.022 and distributions from net realized gain of $.023 per share. J Total distributions of $.43 per share is comprised of distributions from net investment income of $.095 and distributions from net realized gain of $.335 per share. |
Financial Highlights - Service Class
Years ended December 31, | 2009 | 2008 | 2007 | 2006 | 2005 |
Selected Per-Share Data | | | | | |
Net asset value, beginning of period | $ 5.61 | $ 11.43 | $ 12.67 | $ 11.46 | $ 10.24 |
Income from Investment Operations | | | | | |
Net investment income (loss) C | .06 | .14 | .10 F | .10 | .10 |
Net realized and unrealized gain (loss) | 3.05 | (5.90) | .53 | 1.53 | 1.16 |
Total from investment operations | 3.11 | (5.76) | .63 | 1.63 | 1.26 |
Distributions from net investment income | (.05) | - | (.08) | (.08) | (.01) |
Distributions from net realized gain | (.09) | (.06) | (1.79) | (.34) | (.02) |
Total distributions | (.14) | (.06) | (1.87) | (.42) J | (.04) I |
Redemption fees added to paid in capital C, H | - | - | - | - | - |
Net asset value, end of period | $ 8.58 | $ 5.61 | $ 11.43 | $ 12.67 | $ 11.46 |
Total Return A, B | 55.52% | (50.64)% | 5.06% | 14.30% | 12.27% |
Ratios to Average Net Assets D, G | | | | | |
Expenses before reductions | 1.73% | 1.51% | 1.20% | 1.62% | 4.35% |
Expenses net of fee waivers, if any | 1.20% | 1.20% | 1.20% | 1.20% | 1.20% |
Expenses net of all reductions | 1.04% | 1.01% | 1.16% | 1.10% | 1.01% |
Net investment income (loss) | .92% | 1.55% | .72% F | .85% | .98% |
Supplemental Data | | | | | |
Net assets, end of period (000 omitted) | $ 117 | $ 135 | $ 414 | $ 394 | $ 345 |
Portfolio turnover rate E | 416% | 350% | 224% | 185% | 176% |
A Total returns do not reflect charges attributable to your insurance company's separate account. Inclusion of these charges would reduce the total returns shown. B Total returns would have been lower had certain expenses not been reduced during the periods shown. C Calculated based on average shares outstanding during the period. D Fees and expenses of the underlying Fidelity Central Funds are not included in the Fund's expense ratio. The Fund indirectly bears its proportionate share of the expenses of any underlying Fidelity Central Funds. E Amount does not include the portfolio activity of any underlying Fidelity Central Funds. F Investment income per share reflects a special dividend which amounted to $.02 per share. Excluding the special dividend, the ratio of net investment income (loss) to average net assets would have been .58%. G Expense ratios reflect operating expenses of the class. Expenses before reductions do not reflect amounts reimbursed by the investment adviser or reductions from brokerage service arrangements or reductions from other expense offset arrangements and do not represent the amount paid by the class during periods when reimbursements or reductions occur. Expenses net of fee waivers reflect expenses after reimbursement by the investment adviser but prior to reductions from brokerage service arrangements or other expense offset arrangements. Expenses net of all reductions represent the net expenses paid by the class. H Amount represents less than $.01 per share. I Total distributions of $.04 per share is comprised of distributions from net investment income of $.012 and distributions from net realized gain of $.023 per share. J Total distributions of $.42 per share is comprised of distributions from net investment income of $.084 and distributions from net realized gain of $.335 per share. |
See accompanying notes which are an integral part of the financial statements.
Annual Report
Financial Highlights - Service Class 2
Years ended December 31, | 2009 | 2008 | 2007 | 2006 | 2005 |
Selected Per-Share Data | | | | | |
Net asset value, beginning of period | $ 5.60 | $ 11.43 | $ 12.67 | $ 11.46 | $ 10.24 |
Income from Investment Operations | | | | | |
Net investment income (loss) C | .05 | .12 | .08 F | .08 | .09 |
Net realized and unrealized gain (loss) | 3.05 | (5.89) | .53 | 1.53 | 1.15 |
Total from investment operations | 3.10 | (5.77) | .61 | 1.61 | 1.24 |
Distributions from net investment income | (.04) | - | (.06) | (.07) | - |
Distributions from net realized gain | (.09) | (.06) | (1.79) | (.34) | (.02) |
Total distributions | (.13) | (.06) | (1.85) | (.40) J | (.02) I |
Redemption fees added to paid in capital C, H | - | - | - | - | - |
Net asset value, end of period | $ 8.57 | $ 5.60 | $ 11.43 | $ 12.67 | $ 11.46 |
Total Return A, B | 55.44% | (50.73)% | 4.89% | 14.14% | 12.12% |
Ratios to Average Net Assets D, G | | | | | |
Expenses before reductions | 2.02% | 1.79% | 1.41% | 1.77% | 4.50% |
Expenses net of fee waivers, if any | 1.35% | 1.35% | 1.35% | 1.35% | 1.35% |
Expenses net of all reductions | 1.19% | 1.16% | 1.32% | 1.25% | 1.16% |
Net investment income (loss) | .77% | 1.40% | .57% F | .70% | .83% |
Supplemental Data | | | | | |
Net assets, end of period (000 omitted) | $ 424 | $ 302 | $ 550 | $ 524 | $ 459 |
Portfolio turnover rate E | 416% | 350% | 224% | 185% | 176% |
A Total returns do not reflect charges attributable to your insurance company's separate account. Inclusion of these charges would reduce the total returns shown. B Total returns would have been lower had certain expenses not been reduced during the periods shown. C Calculated based on average shares outstanding during the period. D Fees and expenses of the underlying Fidelity Central Funds are not included in the Fund's expense ratio. The Fund indirectly bears its proportionate share of the expenses of any underlying Fidelity Central Funds. E Amount does not include the portfolio activity of any underlying Fidelity Central Funds. F Investment income per share reflects a special dividend which amounted to $.02 per share. Excluding the special dividend, the ratio of net investment income (loss) to average net assets would have been .43%. G Expense ratios reflect operating expenses of the class. Expenses before reductions do not reflect amounts reimbursed by the investment adviser or reductions from brokerage service arrangements or reductions from other expense offset arrangements and do not represent the amount paid by the class during periods when reimbursements or reductions occur. Expenses net of fee waivers reflect expenses after reimbursement by the investment adviser but prior to reductions from brokerage service arrangements or other expense offset arrangements. Expenses net of all reductions represent the net expenses paid by the class. H Amount represents less than $.01 per share. I Total distributions of $.02 per share is comprised of distributions from net investment income of $.000 and distributions from net realized gain of $.020 per share. J Total distributions of $.40 per share is comprised of distributions from net investment income of $.066 and distributions from net realized gain of $.335 per share. |
Financial Highlights - Initial Class R
Years ended December 31, | 2009 | 2008 | 2007 | 2006 | 2005 |
Selected Per-Share Data | | | | | |
Net asset value, beginning of period | $ 5.62 | $ 11.44 | $ 12.68 | $ 11.46 | $ 10.24 |
Income from Investment Operations | | | | | |
Net investment income (loss) C | .07 | .15 | .11 F | .11 | .11 |
Net realized and unrealized gain (loss) | 3.06 | (5.91) | .53 | 1.54 | 1.16 |
Total from investment operations | 3.13 | (5.76) | .64 | 1.65 | 1.27 |
Distributions from net investment income | (.06) | - | (.09) | (.10) | (.02) |
Distributions from net realized gain | (.09) | (.06) | (1.79) | (.34) | (.02) |
Total distributions | (.15) | (.06) | (1.88) | (.43) J | (.05) I |
Redemption fees added to paid in capital C, H | - | - | - | - | - |
Net asset value, end of period | $ 8.60 | $ 5.62 | $ 11.44 | $ 12.68 | $ 11.46 |
Total Return A, B | 55.76% | (50.60)% | 5.17% | 14.50% | 12.37% |
Ratios to Average Net Assets D, G | | | | | |
Expenses before reductions | 1.60% | 1.44% | 1.11% | 1.46% | 4.25% |
Expenses net of fee waivers, if any | 1.10% | 1.10% | 1.10% | 1.10% | 1.10% |
Expenses net of all reductions | .93% | .91% | 1.06% | 1.00% | .91% |
Net investment income (loss) | 1.02% | 1.65% | .82% F | .95% | 1.08% |
Supplemental Data | | | | | |
Net assets, end of period (000 omitted) | $ 17,150 | $ 8,483 | $ 32,345 | $ 17,219 | $ 345 |
Portfolio turnover rate E | 416% | 350% | 224% | 185% | 176% |
A Total returns do not reflect charges attributable to your insurance company's separate account. Inclusion of these charges would reduce the total returns shown. B Total returns would have been lower had certain expenses not been reduced during the periods shown. C Calculated based on average shares outstanding during the period. D Fees and expenses of the underlying Fidelity Central Funds are not included in the Fund's expense ratio. The Fund indirectly bears its proportionate share of the expenses of any underlying Fidelity Central Funds. E Amount does not include the portfolio activity of any underlying Fidelity Central Funds. F Investment income per share reflects a special dividend which amounted to $.02 per share. Excluding the special dividend, the ratio of net investment income (loss) to average net assets would have been .68%. G Expense ratios reflect operating expenses of the class. Expenses before reductions do not reflect amounts reimbursed by the investment adviser or reductions from brokerage service arrangements or reductions from other expense offset arrangements and do not represent the amount paid by the class during periods when reimbursements or reductions occur. Expenses net of fee waivers reflect expenses after reimbursement by the investment adviser but prior to reductions from brokerage service arrangements or other expense offset arrangements. Expenses net of all reductions represent the net expenses paid by the class. H Amount represents less than $.01 per share. I Total distributions of $.05 per share is comprised of distributions from net investment income of $.022 and distributions from net realized gain of $.023 per share. J Total distributions of $.43 per share is comprised of distributions from net investment income of $.096 and distributions from net realized gain of $.335 per share. |
See accompanying notes which are an integral part of the financial statements.
Annual Report
Financial Highlights - Service Class R
Years ended December 31, | 2009 | 2008 | 2007 | 2006 | 2005 |
Selected Per-Share Data | | | | | |
Net asset value, beginning of period | $ 5.61 | $ 11.43 | $ 12.67 | $ 11.46 | $ 10.24 |
Income from Investment Operations | | | | | |
Net investment income (loss) C | .06 | .14 | .10 F | .10 | .10 |
Net realized and unrealized gain (loss) | 3.05 | (5.90) | .53 | 1.53 | 1.16 |
Total from investment operations | 3.11 | (5.76) | .63 | 1.63 | 1.26 |
Distributions from net investment income | (.05) | - | (.08) | (.08) | (.01) |
Distributions from net realized gain | (.09) | (.06) | (1.79) | (.34) | (.02) |
Total distributions | (.14) | (.06) | (1.87) | (.42) J | (.04) I |
Redemption fees added to paid in capital C, H | - | - | - | - | - |
Net asset value, end of period | $ 8.58 | $ 5.61 | $ 11.43 | $ 12.67 | $ 11.46 |
Total Return A, B | 55.52% | (50.64)% | 5.06% | 14.30% | 12.27% |
Ratios to Average Net Assets D, G | | | | | |
Expenses before reductions | 1.73% | 1.51% | 1.20% | 1.62% | 4.35% |
Expenses net of fee waivers, if any | 1.20% | 1.20% | 1.20% | 1.20% | 1.20% |
Expenses net of all reductions | 1.04% | 1.01% | 1.16% | 1.10% | 1.01% |
Net investment income (loss) | .92% | 1.55% | .72% F | .85% | .98% |
Supplemental Data | | | | | |
Net assets, end of period (000 omitted) | $ 117 | $ 135 | $ 414 | $ 394 | $ 345 |
Portfolio turnover rate E | 416% | 350% | 224% | 185% | 176% |
A Total returns do not reflect charges attributable to your insurance company's separate account. Inclusion of these charges would reduce the total returns shown. B Total returns would have been lower had certain expenses not been reduced during the periods shown. C Calculated based on average shares outstanding during the period. D Fees and expenses of the underlying Fidelity Central Funds are not included in the Fund's expense ratio. The Fund indirectly bears its proportionate share of the expenses of any underlying Fidelity Central Funds. E Amount does not include the portfolio activity of any underlying Fidelity Central Funds. F Investment income per share reflects a special dividend which amounted to $.02 per share. Excluding the special dividend, the ratio of net investment income (loss) to average net assets would have been .58%. G Expense ratios reflect operating expenses of the class. Expenses before reductions do not reflect amounts reimbursed by the investment adviser or reductions from brokerage service arrangements or reductions from other expense offset arrangements and do not represent the amount paid by the class during periods when reimbursements or reductions occur. Expenses net of fee waivers reflect expenses after reimbursement by the investment adviser but prior to reductions from brokerage service arrangements or other expense offset arrangements. Expenses net of all reductions represent the net expenses paid by the class. H Amount represents less than $.01 per share. I Total distributions of $.04 per share is comprised of distributions from net investment income of $.012 and distributions from net realized gain of $.023 per share. J Total distributions of $.42 per share is comprised of distributions from net investment income of $.084 and distributions from net realized gain of $.335 per share. |
Financial Highlights - Service Class 2R
Years ended December 31, | 2009 | 2008 | 2007 | 2006 | 2005 |
Selected Per-Share Data | | | | | |
Net asset value, beginning of period | $ 5.60 | $ 11.43 | $ 12.67 | $ 11.46 | $ 10.24 |
Income from Investment Operations | | | | | |
Net investment income (loss) C | .05 | .13 | .08 F | .08 | .09 |
Net realized and unrealized gain (loss) | 3.05 | (5.90) | .53 | 1.53 | 1.15 |
Total from investment operations | 3.10 | (5.77) | .61 | 1.61 | 1.24 |
Distributions from net investment income | (.04) | - | (.06) | (.07) | - |
Distributions from net realized gain | (.09) | (.06) | (1.79) | (.34) | (.02) |
Total distributions | (.13) | (.06) | (1.85) | (.40) J | (.02) I |
Redemption fees added to paid in capital C, H | - | - | - | - | - |
Net asset value, end of period | $ 8.57 | $ 5.60 | $ 11.43 | $ 12.67 | $ 11.46 |
Total Return A, B | 55.36% | (50.73)% | 4.90% | 14.14% | 12.12% |
Ratios to Average Net Assets D, G | | | | | |
Expenses before reductions | 1.87% | 1.66% | 1.35% | 1.77% | 4.50% |
Expenses net of fee waivers, if any | 1.35% | 1.35% | 1.35% | 1.35% | 1.35% |
Expenses net of all reductions | 1.19% | 1.16% | 1.31% | 1.25% | 1.16% |
Net investment income (loss) | .77% | 1.40% | .57% F | .70% | .83% |
Supplemental Data | | | | | |
Net assets, end of period (000 omitted) | $ 155 | $ 179 | $ 550 | $ 524 | $ 459 |
Portfolio turnover rate E | 416% | 350% | 224% | 185% | 176% |
A Total returns do not reflect charges attributable to your insurance company's separate account. Inclusion of these charges would reduce the total returns shown. B Total returns would have been lower had certain expenses not been reduced during the periods shown. C Calculated based on average shares outstanding during the period. D Fees and expenses of the underlying Fidelity Central Funds are not included in the Fund's expense ratio. The Fund indirectly bears its proportionate share of the expenses of any underlying Fidelity Central Funds. E Amount does not include the portfolio activity of any underlying Fidelity Central Funds. F Investment income per share reflects a special dividend which amounted to $.02 per share. Excluding the special dividend, the ratio of net investment income (loss) to average net assets would have been .43%. G Expense ratios reflect operating expenses of the class. Expenses before reductions do not reflect amounts reimbursed by the investment adviser or reductions from brokerage service arrangements or reductions from other expense offset arrangements and do not represent the amount paid by the class during periods when reimbursements or reductions occur. Expenses net of fee waivers reflect expenses after reimbursement by the investment adviser but prior to reductions from brokerage service arrangements or other expense offset arrangements. Expenses net of all reductions represent the net expenses paid by the class. H Amount represents less than $.01 per share. I Total distributions of $.02 per share is comprised of distributions from net investment income of $.000 and distributions from net realized gain of $.020 per share. J Total distributions of $.40 per share is comprised of distributions from net investment income of $.066 and distributions from net realized gain of $.335 per share. |
See accompanying notes which are an integral part of the financial statements.
Annual Report
Financial Highlights - Investor Class R
Years ended December 31, | 2009 | 2008 | 2007 | 2006 | 2005 I |
Selected Per-Share Data | | | | | |
Net asset value, beginning of period | $ 5.60 | $ 11.41 | $ 12.65 | $ 11.46 | $ 10.32 |
Income from Investment Operations | | | | | |
Net investment income (loss) E | .07 | .14 | .09 H | .09 | .01 |
Net realized and unrealized gain (loss) | 3.04 | (5.89) | .54 | 1.53 | 1.16 |
Total from investment operations | 3.11 | (5.75) | .63 | 1.62 | 1.17 |
Distributions from net investment income | (.06) | - | (.08) | (.10) | (.02) |
Distributions from net realized gain | (.09) | (.06) | (1.79) | (.34) | (.01) |
Total distributions | (.15) | (.06) | (1.87) | (.43) M | (.03) L |
Redemption fees added to paid in capital E, K | - | - | - | - | - |
Net asset value, end of period | $ 8.56 | $ 5.60 | $ 11.41 | $ 12.65 | $ 11.46 |
Total Return B, C, D | 55.61% | (50.65)% | 5.07% | 14.23% | 11.39% |
Ratios to Average Net Assets F, J | | | | | |
Expenses before reductions | 1.68% | 1.51% | 1.22% | 1.61% | 2.19% A |
Expenses net of fee waivers, if any | 1.18% | 1.17% | 1.22% | 1.25% | 1.25% A |
Expenses net of all reductions | 1.01% | .97% | 1.18% | 1.15% | 1.06% A |
Net investment income (loss) | .94% | 1.59% | .71% H | .80% | .31% A |
Supplemental Data | | | | | |
Net assets, end of period (000 omitted) | $ 27,695 | $ 14,208 | $ 38,719 | $ 24,505 | $ 9,810 |
Portfolio turnover rate G | 416% | 350% | 224% | 185% | 176% |
A Annualized B Total returns for periods of less than one year are not annualized. C Total returns do not reflect charges attributable to your insurance company's separate account. Inclusion of these charges would reduce the total returns shown. D Total returns would have been lower had certain expenses not been reduced during the periods shown. E Calculated based on average shares outstanding during the period. F Fees and expenses of the underlying Fidelity Central Funds are not included in the Fund's expense ratio. The Fund indirectly bears its proportionate share of the expenses of any underlying Fidelity Central Funds. G Amount does not include the portfolio activity of any underlying Fidelity Central Funds. H Investment income per share reflects a special dividend which amounted to $.02 per share. Excluding the special dividend, the ratio of net investment income (loss) to average net assets would have been .57%. I For the period July 21, 2005 (commencement of sale of shares) to December 31, 2005. J Expense ratios reflect operating expenses of the class. Expenses before reductions do not reflect amounts reimbursed by the investment adviser or reductions from brokerage service arrangements or reductions from other expense offset arrangements and do not represent the amount paid by the class during periods when reimbursements or reductions occur. Expense ratios before reductions for start-up periods may not be representative of longer-term operating periods. Expenses net of fee waivers reflect expenses after reimbursement by the investment adviser but prior to reductions from brokerage service arrangements or other expense offset arrangements. Expenses net of all reductions represent the net expenses paid by the class. K Amount represents less than $.01 per share. L Total distributions of $.03 per share is comprised of distributions from net investment income of $.022 and distributions from net realized gain of $.013 per share. M Total distributions of $.43 per share is comprised of distributions from net investment income of $.095 and distributions from net realized gain of $.335 per share. |
See accompanying notes which are an integral part of the financial statements.
Annual Report
Notes to Financial Statements
For the period ended December 31, 2009
1. Organization.
VIP International Capital Appreciation Portfolio (the Fund) is a fund of Variable Insurance Products Fund IV (the trust) and is authorized to issue an unlimited number of shares. The trust is registered under the Investment Company Act of 1940, as amended (the 1940 Act), as an open-end management investment company organized as a Massachusetts business trust. Shares of the Fund may only be purchased by insurance companies for the purpose of funding variable annuity or variable life insurance contracts. The Fund offers the following classes of shares: Initial Class shares, Service Class shares, Service Class 2 shares, Initial Class R shares, Service Class R shares, Service Class 2R shares, and Investor Class R shares. All classes have equal rights and voting privileges, except for matters affecting a single class. Investment income, realized and unrealized capital gains and losses, the common expenses of the Fund, and certain fund-level expense reductions, if any, are allocated on a pro-rata basis to each class based on the relative net assets of each class to the total net assets of the Fund. Each class differs with respect to transfer agent and distribution and service plan fees incurred. Certain expense reductions also differ by class. The Fund's investments in emerging markets can be subject to social, economic, regulatory, and political uncertainties and can be extremely volatile.
2. Investments in Fidelity Central Funds.
The Fund may invest in Fidelity Central Funds, which are open-end investment companies available only to other investment companies and accounts managed by Fidelity Management & Research Company (FMR) and its affiliates. The Fund's Schedule of Investments lists each of the Fidelity Central Funds held as of period end, if any, as an investment of the Fund, but does not include the underlying holdings of each Fidelity Central Fund. As an Investing Fund, the Fund indirectly bears its proportionate share of the expenses of the underlying Fidelity Central Funds.
The Money Market Central Funds seek preservation of capital and current income and are managed by Fidelity Investments Money Management, Inc. (FIMM), an affiliate of FMR.
A complete unaudited list of holdings for each Fidelity Central Fund is available upon request or at the Securities and Exchange Commission (the SEC) web site at www.sec.gov. In addition, the financial statements of the Fidelity Central Funds, which are not covered by the Fund's Report of Independent Registered Public Accounting Firm, are available on the SEC web site or upon request.
3. Significant Accounting Policies.
The financial statements have been prepared in conformity with accounting principles generally accepted in the United States of America, which require management to make certain estimates and assumptions at the date of the financial statements. Actual results could differ from those estimates. Events or transactions occurring after period end through the date that the financial statements were issued, February 12, 2010, have been evaluated in the preparation of the financial statements. The following summarizes the significant accounting policies of the Fund:
Security Valuation. Investments are valued as of 4:00 p.m. Eastern time on the last calendar day of the period. The Fund uses independent pricing services approved by the Board of Trustees to value its investments. When current market prices or quotations are not readily available or reliable, valuations may be determined in good faith in accordance with procedures adopted by the Board of Trustees. Factors used in determining value may include significant market or security specific events, changes in interest rates and credit quality. The frequency with which these procedures are used cannot be predicted and may be utilized to a significant extent. The value used for net asset value (NAV) calculation under these procedures may differ from published prices for the same securities.
The Fund categorizes the inputs to valuation techniques used to value its investments into a disclosure hierarchy consisting of three levels as shown below.
Level 1 - quoted prices in active markets for identical investments
Level 2 - other significant observable inputs (including quoted prices for similar investments, interest rates, prepayment speeds, etc.)
Level 3 - unobservable inputs (including the fund's own assumptions based on the best information available)
Changes in valuation techniques may result in transfers in or out of an assigned level within the disclosure hierarchy. The aggregate value of investments by input level, as of December 31, 2009, as well as a roll forward of Level 3 securities, is included at the end of the Fund's Schedule of Investments. Valuation techniques used to value the Fund's investments by major category are as follows.
Equity securities, including restricted securities, for which market quotations are readily available, are valued at the last reported sale price or official closing price as reported by an independent pricing service on the primary market or exchange on which they are traded and are categorized as level 1 in the hierarchy. In the event there were no sales during the day or closing prices are not available, securities are valued at the last quoted bid price or may be valued using the last available price and categorized as Level 2 in the hierarchy. For foreign equity securities, when significant market or security events arise, comparisons to the valuation of American Depository Receipts (ADRs), futures contracts, exchange-traded funds (ETFs) and certain indexes as well as quoted prices for similar securities are used and are categorized as Level 2 in the hierarchy in these circumstances.
Annual Report
3. Significant Accounting Policies - continued
Security Valuation - continued
For restricted securities and private placements where observable inputs are limited, assumptions about market activity and risk are used and are categorized as level 3 in the hierarchy.
Debt securities, including restricted securities, are valued based on evaluated quotations received from independent pricing services or from dealers who make markets in such securities. For corporate bonds and preferred securities, pricing services utilize matrix pricing which considers yield or price of bonds of comparable quality, coupon, maturity and type as well as dealer supplied prices and are generally categorized as Level 2 in the hierarchy.
Investments in open-end mutual funds including the Fidelity Money Market Central Funds are valued at their closing net asset value each business day and are categorized as Level 1 in the hierarchy. Short-term securities with remaining maturities of sixty days or less for which quotations are not readily available are valued at amortized cost, which approximates value and are categorized as level 2 in the hierarchy.
When independent prices are unavailable or unreliable, debt securities may be valued utilizing pricing matrices which consider similar factors that would be used by independent pricing services. These are generally categorized as Level 2 in the hierarchy but may be Level 3 depending on the circumstances.
Foreign Currency. The Fund uses foreign currency contracts to facilitate transactions in foreign-denominated securities. Losses from these transactions may arise from changes in the value of the foreign currency or if the counterparties do not perform under the contracts' terms.
Foreign-denominated assets, including investment securities, and liabilities are translated into U.S. dollars at the exchange rate at period end. Purchases and sales of investment securities, income and dividends received and expenses denominated in foreign currencies are translated into U.S. dollars at the exchange rate in effect on the transaction date.
The effects of exchange rate fluctuations on investments are included with the net realized and unrealized gain (loss) on investment securities. Other foreign currency transactions resulting in realized and unrealized gain (loss) are disclosed separately.
Investment Transactions and Income. For financial reporting purposes, the Fund's investment holdings and NAV include trades executed through the end of the last business day of the period. The NAV per share for processing shareholder transactions is calculated as of the close of business of the New York Stock Exchange (NYSE), normally 4:00 p.m. Eastern time and includes trades executed through the end of the prior business day. Gains and losses on securities sold are determined on the basis of identified cost. Dividend income is recorded on the ex-dividend date, except for certain dividends from foreign securities where the ex-dividend date may have passed, which are recorded as soon as the Fund is informed of the ex-dividend date. Non-cash dividends included in dividend income, if any, are recorded at the fair market value of the securities received. Interest income and distributions from the Fidelity Central Funds are accrued as earned. Interest income includes coupon interest and amortization of premium and accretion of discount on debt securities. Investment income is recorded net of foreign taxes withheld where recovery of such taxes is uncertain.
Expenses. Most expenses of the trust can be directly attributed to a fund. Expenses which cannot be directly attributed are apportioned among each Fund in the trust. Expense estimates are accrued in the period to which they relate and adjustments are made when actual amounts are known.
Income Tax Information and Distributions to Shareholders. Each year, the Fund intends to qualify as a regulated investment company by distributing substantially all of its taxable income and realized gains under Subchapter M of the Internal Revenue Code and filing its U.S. federal tax return. As a result, no provision for income taxes is required. As of December 31, 2009, the Fund did not have any unrecognized tax benefits in the accompanying financial statements. A Fund's federal tax return is subject to examination by the Internal Revenue Service (IRS) for a period of three years. Foreign taxes are provided for based on the Fund's understanding of the tax rules and rates that exist in the foreign markets in which it invests. The Fund is subject to a tax imposed on short term capital gains on securities of certain issuers domiciled in India. The Fund records an estimated deferred tax liability included in Other payables and accrued expenses in the accompanying Statement of Assets & Liabilities for net unrealized gains on these securities in an amount that would be payable if the securities were disposed of at period end.
Distributions are recorded on the ex-dividend date. Income dividends and capital gain distributions are declared separately for each class. Income and capital gain distributions are determined in accordance with income tax regulations, which may differ from generally accepted accounting principles.
Capital accounts within the financial statements are adjusted for permanent book-tax differences. These adjustments have no impact on net assets or the results of operations. Temporary book-tax differences will reverse in a subsequent period.
Book-tax differences are primarily due to the short-term gain distributions from the Fidelity Central Funds, foreign currency transactions, certain foreign taxes, passive foreign investment companies (PFIC), market discount, capital loss carryforwards, losses deferred due to wash sales and excise tax regulations.
Annual Report
Notes to Financial Statements - continued
3. Significant Accounting Policies - continued
Income Tax Information and Distributions to Shareholders - continued
The federal tax cost of investment securities and unrealized appreciation (depreciation) as of period end were as follows:
Gross unrealized appreciation | $ 4,712,993 |
Gross unrealized depreciation | (1,558,899) |
Net unrealized appreciation (depreciation) | $ 3,154,094 |
| |
Tax Cost | $ 45,695,266 |
The tax-based components of distributable earnings as of period end were as follows:
Undistributed ordinary income | $ 156,557 |
Capital loss carryforward | $ (24,891,544) |
Net unrealized appreciation (depreciation) | $ 3,151,694 |
The tax character of distributions paid was as follows:
| December 31, 2009 | December 31, 2008 |
Ordinary Income | $ 795,722 | $ 298,493 |
Long-term Capital Gains | - | 29,849 |
Total | $ 795,722 | $ 328,342 |
Trading (Redemption) Fees. Initial Class R shares, Service Class R shares, Service Class 2 R shares and Investor Class R shares held less than 60 days are subject to a redemption fee equal to 1% of the proceeds of the redeemed shares. All redemption fees, including any estimated redemption fees paid by FMR, are retained by the Fund and accounted for as an addition to paid in capital.
4. Purchases and Sales of Investments.
Purchases and sales of securities, other than short-term securities, aggregated $140,336,573 and $130,418,389, respectively.
5. Fees and Other Transactions with Affiliates.
Management Fee. FMR and its affiliates provide the Fund with investment management related services for which the Fund pays a monthly management fee. The management fee is the sum of an individual fund fee rate that is based on an annual rate of .45% of the Fund's average net assets and a group fee rate that averaged .26% during the period. The group fee rate is based upon the average net assets of all the mutual funds advised by FMR. The group fee rate decreases as assets under management increase and increases as assets under management decrease. For the period, the total annual management fee rate was .71% of the Fund's average net assets.
Distribution and Service Plan. In accordance with Rule 12b-1 of the 1940 Act, the Fund has adopted separate 12b-1 Plans for each Service Class of shares. Each Service Class pays Fidelity Distributors Corporation (FDC), an affiliate of FMR, a service fee. For the period, the service fee is based on an annual rate of .10% of Service Class' and Service Class R's average net assets and .25% of Service Class 2's and Service Class 2R's average net assets.
For the period, each class paid FDC the following amounts, all of which were re-allowed to insurance companies for the distribution of shares and providing shareholder support services:
Service Class | $ 122 |
Service Class 2 | 903 |
Service Class R | 122 |
Service Class 2 R | 410 |
| $ 1,557 |
Annual Report
5. Fees and Other Transactions with Affiliates - continued
Transfer Agent Fees. Fidelity Investments Institutional Operations Company, Inc. (FIIOC), an affiliate of FMR, is the Fund's transfer, dividend disbursing, and shareholder servicing agent. FIIOC receives an asset-based fee with respect to each class. Each class (with the exception of Investor Class R) pays a transfer agent fee, excluding out of pocket expenses, equal to an annual rate of .07% of average net assets. Investor Class R pays a monthly asset-based transfer agent fee of .15% of average net assets. The total transfer agent fees paid by each class to FIIOC, including out of pocket expenses, were as follows:
Initial Class | $ 1,453 |
Service Class | 173 |
Service Class 2 | 990 |
Initial Class R | 12,248 |
Service Class R | 173 |
Service Class 2R | 202 |
Investor Class R | 35,338 |
| $ 50,577 |
Accounting and Security Lending Fees. Fidelity Service Company, Inc. (FSC), an affiliate of FMR, maintains the Fund's accounting records. The accounting fee is based on the level of average net assets for the month. Under a separate contract, FSC administers the security lending program. The security lending fee is based on the number and duration of lending transactions.
Brokerage Commissions. The Fund placed a portion of its portfolio transactions with brokerage firms which are affiliates of the investment adviser. The commissions paid to these affiliated firms were $1,746 for the period.
6. Committed Line of Credit.
The Fund participates with other funds managed by FMR in a $3.5 billion credit facility (the "line of credit") to be utilized for temporary or emergency purposes to fund shareholder redemptions or for other short-term liquidity purposes. The Fund has agreed to pay commitment fees on its pro-rata portion of the line of credit, which amounted to $136 and is reflected in Miscellaneous Expense on the Statement of Operations. During the period, there were no borrowings on this line of credit.
7. Security Lending.
The Fund lends portfolio securities from time to time in order to earn additional income. On the settlement date of the loan, the Fund receives collateral (in the form of U.S. Treasury obligations, letters of credit and/or cash) against the loaned securities and maintains collateral in an amount not less than 100% of the market value of the loaned securities during the period of the loan. The market value of the loaned securities is determined at the close of business of the Fund and any additional required collateral is delivered to the Fund on the next business day. If the borrower defaults on its obligation to return the securities loaned because of insolvency or other reasons, a fund could experience delays and costs in recovering the securities loaned or in gaining access to the collateral. Any cash collateral received is invested in the Fidelity Securities Lending Cash Central Fund. The value of loaned securities and cash collateral at period end are disclosed on the Fund's Statement of Assets and Liabilities. Security lending income represents the income earned on investing cash collateral, less fees and expenses associated with the loan, plus any premium payments that may be received on the loan of certain types of securities. Security lending income is presented in the Statement of Operations as a component of income from Fidelity Central Funds.
8. Expense Reductions.
FMR voluntarily agreed to reimburse each class to the extent annual operating expenses exceeded certain levels of average net assets as noted in the table below. Some expenses, for example interest expense, including commitment fees, are excluded from this reimbursement.
Annual Report
Notes to Financial Statements - continued
8. Expense Reductions - continued
The following classes were in reimbursement during the period:
| Expense
Limitations | Reimbursement
from adviser |
Initial Class | 1.10% | $ 3,335 |
Service Class | 1.20% | 653 |
Service Class 2 | 1.35% | 2,404 |
Initial Class R | 1.10% | 60,024 |
Service Class R | 1.20% | 653 |
Service Class 2R | 1.35% | 840 |
Investor Class R | 1.18% | 95,877 |
| | $ 163,786 |
Many of the brokers with whom FMR places trades on behalf of the Fund provided services to the Fund in addition to trade execution. These services included payments of certain expenses on behalf of the Fund totaling $54,039 for the period. In addition, through arrangements with the Fund's custodian, credits realized as a result of uninvested cash balances were used to reduce the Fund's expenses. During the period, these credits reduced the Fund's custody expenses by $130.
9. Distributions to Shareholders.
Distributions to shareholders of each class were as follows:
Years ended December 31, | 2009 | 2008 |
From net investment income | | |
Initial Class | $ 4,242 | $ - |
Service Class | 684 | - |
Service Class 2 | 1,982 | - |
Initial Class R | 119,072 | - |
Service Class R | 684 | - |
Service Class 2R | 659 | - |
Investor Class R | 190,024 | - |
Total | $ 317,347 | $ - |
From net realized gain | | |
Initial Class | $ 6,363 | $ 6,626 |
Service Class | 1,207 | 1,993 |
Service Class 2 | 4,350 | 2,646 |
Initial Class R | 178,610 | 134,858 |
Service Class R | 1,207 | 1,993 |
Service Class 2R | 1,602 | 2,646 |
Investor Class R | 285,036 | 177,580 |
Total | $ 478,375 | $ 328,342 |
10. Share Transactions.
Transactions for each class of shares were as follows:
| Shares | Dollars |
Years ended December 31, | 2009 | 2008 | 2009 | 2008 |
Initial Class | | | | |
Shares sold | 23,291 | 30,908 | $ 165,986 | $ 260,134 |
Reinvestment of distributions | 1,265 | 672 | 10,605 | 6,626 |
Shares redeemed | (18,636) | (85,732) | (107,450) | (731,294) |
Net increase (decrease) | 5,920 | (54,152) | $ 69,141 | $ (464,534) |
Service Class | | | | |
Reinvestment of distributions | 226 | 202 | 1,891 | 1,993 |
Shares redeemed | (10,639) | (12,389) | (71,691) | (90,726) |
Net increase (decrease) | (10,413) | (12,187) | $ (69,800) | $ (88,733) |
10. Share Transactions - continued
Annual Report
| Shares | Dollars |
Years ended December 31, | 2009 | 2008 | 2009 | 2008 |
Service Class 2 | | | | |
Shares sold | 19,605 | 29,552 | $ 124,280 | $ 262,678 |
Reinvestment of distributions | 758 | 269 | 6,332 | 2,646 |
Shares redeemed | (24,845) | (23,991) | (158,018) | (171,548) |
Net increase (decrease) | (4,482) | 5,830 | $ (27,406) | $ 93,776 |
Initial Class R | | | | |
Shares sold | 897,081 | 148,524 | $ 6,785,884 | $ 1,413,988 |
Reinvestment of distributions | 35,523 | 13,677 | 297,682 | 134,858 |
Shares redeemed | (448,753) | (1,478,974) | (2,964,977) | (13,970,732) |
Net increase (decrease) | 483,851 | (1,316,773) | $ 4,118,589 | $ (12,421,886) |
Service Class R | | | | |
Reinvestment of distributions | 226 | 202 | 1,891 | 1,993 |
Shares redeemed | (10,639) | (12,389) | (71,691) | (90,726) |
Net increase (decrease) | (10,413) | (12,187) | $ (69,800) | $ (88,733) |
Service Class 2R | | | | |
Reinvestment of distributions | 271 | 269 | 2,261 | 2,646 |
Shares redeemed | (14,127) | (16,453) | (94,930) | (120,308) |
Net increase (decrease) | (13,856) | (16,184) | $ (92,669) | $ (117,662) |
Investor Class R | | | | |
Shares sold | 1,164,413 | 176,104 | $ 9,035,456 | $ 1,598,648 |
Reinvestment of distributions | 56,962 | 18,065 | 475,060 | 177,580 |
Shares redeemed | (525,663) | (1,048,997) | (3,339,913) | (9,318,944) |
Net increase (decrease) | 695,712 | (854,828) | $ 6,170,603 | $ (7,542,716) |
11. Other.
The Fund's organizational documents provide former and current trustees and officers with a limited indemnification against liabilities arising in connection with the performance of their duties to the Fund. In the normal course of business, the Fund may also enter into contracts that provide general indemnifications. The Fund's maximum exposure under these arrangements is unknown as this would be dependent on future claims that may be made against the Fund. The risk of material loss from such claims is considered remote.
At the end of the period, FMR or its affiliates were the owners of record of 98% of the total outstanding shares of the Fund.
Annual Report
Report of Independent Registered Public Accounting Firm
To the Trustees of Variable Insurance Products Fund IV and the Shareholders of VIP International Capital Appreciation Portfolio:
In our opinion, the accompanying statement of assets and liabilities, including the schedule of investments, and the related statements of operations and of changes in net assets and the financial highlights present fairly, in all material respects, the financial position of VIP International Capital Appreciation Portfolio (a fund of Variable Insurance Products Fund IV) at December 31, 2009, the results of its operations for the year then ended, the changes in its net assets for each of the two years in the period then ended and the financial highlights for each of the periods indicated, in conformity with accounting principles generally accepted in the United States of America. These financial statements and financial highlights (hereafter referred to as "financial statements") are the responsibility of the VIP International Capital Appreciation Portfolio's management. Our responsibility is to express an opinion on these financial statements based on our audits. We conducted our audits of these financial statements in accordance with the standards of the Public Company Accounting Oversight Board (United States). Those standards require that we plan and perform the audit to obtain reasonable assurance about whether the financial statements are free of material misstatement. An audit includes examining, on a test basis, evidence supporting the amounts and disclosures in the financial statements, assessing the accounting principles used and significant estimates made by management, and evaluating the overall financial statement presentation. We believe that our audits, which included confirmation of securities at December 31, 2009 by correspondence with the custodian and brokers, provide a reasonable basis for our opinion.
/s/ PricewaterhouseCoopers LLP
PricewaterhouseCoopers LLP
Boston, Massachusetts
February 12, 2010
Annual Report
Trustees and Officers
The Trustees, Member of the Advisory Board, and executive officers of the trust and fund, as applicable, are listed below. The Board of Trustees governs the fund and is responsible for protecting the interests of shareholders. The Trustees are experienced executives who meet periodically throughout the year to oversee the fund's activities, review contractual arrangements with companies that provide services to the fund, and review the fund's performance. Except for James C. Curvey, each of the Trustees oversees 222 funds advised by FMR or an affiliate. Mr. Curvey oversees 410 funds advised by FMR or an affiliate.
The Trustees hold office without limit in time except that (a) any Trustee may resign; (b) any Trustee may be removed by written instrument, signed by at least two-thirds of the number of Trustees prior to such removal; (c) any Trustee who requests to be retired or who has become incapacitated by illness or injury may be retired by written instrument signed by a majority of the other Trustees; and (d) any Trustee may be removed at any special meeting of shareholders by a two-thirds vote of the outstanding voting securities of the trust. Each Trustee who is not an interested person (as defined in the 1940 Act) (Independent Trustee), shall retire not later than the last day of the calendar year in which his or her 72nd birthday occurs. The Independent Trustees may waive this mandatory retirement age policy with respect to individual Trustees. The executive officers and Advisory Board Member hold office without limit in time, except that any officer and Advisory Board Member may resign or may be removed by a vote of a majority of the Trustees at any regular meeting or any special meeting of the Trustees. Except as indicated, each individual has held the office shown or other offices in the same company for the past five years.
The fund's Statement of Additional Information (SAI) includes more information about the Trustees. To request a free copy, call Fidelity at 1-877-208-0098.
Interested Trustees*:
Correspondence intended for each Trustee who is an interested person may be sent to Fidelity Investments, 82 Devonshire Street, Boston, Massachusetts 02109.
Name, Age; Principal Occupation |
Edward C. Johnson 3d (79) |
| Year of Election or Appointment: 1983 Mr. Johnson is Trustee and Chairman of the Board of Trustees of certain Trusts. Mr. Johnson serves as Chief Executive Officer, Chairman, and a Director of FMR LLC; Chairman and a Director of FMR; Chairman and a Director of Fidelity Research & Analysis Company (FRAC); Chairman and a Director of Fidelity Investments Money Management, Inc.; and Chairman and a Director of FMR Co., Inc. In addition, Mr. Johnson serves as Chairman and Director of FIL Limited. Previously, Mr. Johnson served as President of FMR LLC (2006-2007). |
James C. Curvey (74) |
| Year of Election or Appointment: 2007 Mr. Curvey also serves as Trustee (2007-present) of other investment companies advised by FMR. Mr. Curvey is a Director of FMR and FMR Co., Inc. (2007-present). Mr. Curvey is also Vice Chairman (2006-present) and Director of FMR LLC. In addition, Mr. Curvey serves as an Overseer for the Boston Symphony Orchestra and a member of the Trustees of Villanova University. |
* Trustees have been determined to be "Interested Trustees" by virtue of, among other things, their affiliation with the trust or various entities under common control with FMR.
Independent Trustees:
Correspondence intended for each Independent Trustee (that is, the Trustees other than the Interested Trustees) may be sent to Fidelity Investments, P.O. Box 55235, Boston, Massachusetts 02205-5235.
Name, Age; Principal Occupation |
Dennis J. Dirks (61) |
| Year of Election or Appointment: 2005 Prior to his retirement in May 2003, Mr. Dirks was Chief Operating Officer and a member of the Board of The Depository Trust & Clearing Corporation (DTCC). He also served as President, Chief Operating Officer, and Board member of The Depository Trust Company (DTC) and President and Board member of the National Securities Clearing Corporation (NSCC). In addition, Mr. Dirks served as Chief Executive Officer and Board member of the Government Securities Clearing Corporation, Chief Executive Officer and Board member of the Mortgage-Backed Securities Clearing Corporation, as a Trustee and a member of the Finance Committee of Manhattan College (2005-2008), and as a Trustee and a member of the Finance Committee of AHRC of Nassau County (2006-2008). Currently, Mr. Dirks serves as a member of the Board of Directors for The Brookville Center for Children's Services, Inc. (2009-present). |
Alan J. Lacy (56) |
| Year of Election or Appointment: 2008 Mr. Lacy serves as Senior Adviser (2007-present) of Oak Hill Capital Partners, L.P. (private equity). Mr. Lacy also served as Chief Executive Officer (2000-2005) and Vice Chairman (2005-2006) of Sears Holdings Corporation and Sears, Roebuck and Co. (retail). In addition, Mr. Lacy serves as a member of the Board of Directors of The Western Union Company (global money transfer, 2006-present) and Bristol-Myers Squibb Company (global pharmaceuticals, 2007-present). Mr. Lacy is Chairman (2008-present) and a member (2006-present) of the Board of Trustees of The National Parks Conservation Association. |
Ned C. Lautenbach (65) |
| Year of Election or Appointment: 2000 Mr. Lautenbach is Chairman of the Independent Trustees of the Equity and High Income Funds (2006-present). Mr. Lautenbach is an Advisory Partner of Clayton, Dubilier & Rice, Inc. (private equity investment). Previously, Mr. Lautenbach was with the International Business Machines Corporation (IBM) from 1968 until his retirement in 1998. Mr. Lautenbach serves as a Director of Eaton Corporation (diversified industrial) as well as the Philharmonic Center for the Arts in Naples, Florida. Mr. Lautenbach is also a member of the Board of Trustees of Fairfield University (2005-present), as well as a member of the Council on Foreign Relations. Previously, Mr. Lautenbach served as a Director of Sony Corporation (2006-2007). |
Joseph Mauriello (65) |
| Year of Election or Appointment: 2008 Prior to his retirement in January 2006, Mr. Mauriello served in numerous senior management positions including Deputy Chairman and Chief Operating Officer (2004-2005), and Vice Chairman of Financial Services (2002-2004) of KPMG LLP US (professional services, 1965-2005). Mr. Mauriello currently serves as a member of the Board of Directors of XL Capital Ltd. (global insurance and re-insurance, 2006-present) and of Arcadia Resources Inc. (health care services and products, 2007-present). Previously, Mr. Mauriello served as a Director of the Hamilton Funds of the Bank of New York (2006-2007). |
Cornelia M. Small (65) |
| Year of Election or Appointment: 2005 Ms. Small is a member of the Board of Directors of the Teagle Foundation (2009-present). Ms. Small is also a member of the Investment Committee, and Chair (2008-present) and a member of the Board of Trustees of Smith College. In addition, Ms. Small serves on the Investment Committee of the Berkshire Taconic Community Foundation (2008-present). Previously, Ms. Small served as Chairperson of the Investment Committee (2002-2008) of Smith College. In addition, Ms. Small served as Chief Investment Officer, Director of Global Equity Investments, and a member of the Board of Directors of Scudder, Stevens & Clark and Scudder Kemper Investments. |
William S. Stavropoulos (70) |
| Year of Election or Appointment: 2001 Mr. Stavropoulos serves as President and Founder of the Michigan Baseball Foundation, the Great Lakes Loons (2007-present). Mr. Stavropoulos is Chairman Emeritus of the Board of Directors of The Dow Chemical Company, where he previously served in numerous senior management positions, including President, CEO (1995-2000; 2002-2004), Chairman of the Executive Committee (2000-2006), and as a member of the Board of Directors (1990-2006). Currently, Mr. Stavropoulos is a Director of Teradata Corporation (data warehousing and technology solutions, 2008-present), Chemical Financial Corporation, Maersk Inc. (industrial conglomerate), Tyco International, Inc. (multinational manufacturing and services, 2007-present), and a member of the Advisory Board for Metalmark Capital (private equity investment, 2005-present). Mr. Stavropoulos is a special advisor to Clayton, Dubilier & Rice, Inc. (private equity investment). In addition, Mr. Stavropoulos is a member of the University of Notre Dame Advisory Council for the College of Science. |
David M. Thomas (60) |
| Year of Election or Appointment: 2008 Previously, Mr. Thomas served as Executive Chairman (2005-2006) and Chairman and Chief Executive Officer (2000-2005) of IMS Health, Inc. (pharmaceutical and healthcare information solutions). In addition, Mr. Thomas serves as a member of the Board of Directors of Fortune Brands, Inc. (consumer products), and Interpublic Group of Companies, Inc. (marketing communication, 2004-present). |
Michael E. Wiley (59) |
| Year of Election or Appointment: 2008 Mr. Wiley also serves as a Director of Asia Pacific Exploration Consolidated (international oil and gas exploration and production, 2008-present), and as a member of the Board of Trustees of the University of Tulsa (2000-2006; 2007-present). Mr. Wiley serves as a Director of Tesoro Corporation (independent oil refiner and marketer, 2005-present), and a Director of Bill Barrett Corporation (exploration and production, 2005-present). In addition, Mr. Wiley also serves as a Director of Post Oak Bank (privately-held bank, 2004-present). Previously, Mr. Wiley served as a Sr. Energy Advisor of Katzenbach Partners, LLC (consulting, 2006-2007), as an Advisory Director of Riverstone Holdings (private investment), Chairman, President, and CEO of Baker Hughes, Inc. (oilfield services, 2000-2004), and as Director of Spinnaker Exploration Company (exploration and production, 2001-2005). |
Annual Report
Trustees and Officers - continued
Advisory Board Member and Executive Officers:
Correspondence intended for each executive officer and Peter S. Lynch may be sent to Fidelity Investments, 82 Devonshire Street, Boston, Massachusetts 02109.
Name, Age; Principal Occupation |
Peter S. Lynch (65) |
| Year of Election or Appointment: 2003 Member of the Advisory Board of Fidelity's Equity and High Income Funds. Mr. Lynch is Vice Chairman and a Director of FMR and FMR Co., Inc. In addition, Mr. Lynch serves as a Trustee of Boston College and as the Chairman of the Inner-City Scholarship Fund. Previously, Mr. Lynch served on the Special Olympics International Board of Directors (1997-2006). |
Kenneth B. Robins (40) |
| Year of Election or Appointment: 2008 President and Treasurer of Fidelity's Equity and High Income Funds. Mr. Robins also serves as Assistant Treasurer of other Fidelity funds (2009-present) and is an employee of Fidelity Investments (2004-present). Before joining Fidelity Investments, Mr. Robins worked at KPMG LLP, where he was a partner in KPMG's department of professional practice (2002-2004). |
Brian B. Hogan (45) |
| Year of Election or Appointment: 2009 Vice President of certain Equity Funds and Vice President of Sector Funds. Mr. Hogan also serves as Senior Vice President, Equity Research of FMR (2006-present) and President of FMR's Equity Division (2009-present). Previously, Mr. Hogan served as a portfolio manager. |
Eric M. Wetlaufer (47) |
| Year of Election or Appointment: 2006 Vice President of Fidelity's International Equity Funds. Mr. Wetlaufer also serves as Group Chief Investment Officer of FMR. Mr. Wetlaufer is a Director (2007-present), Chairman, Chief Executive Officer, and President of Fidelity Management & Research (Hong Kong) Limited (2008-present); Chairman, Chief Executive Officer, President, and a Director of Fidelity Management & Research (Japan) Inc. (2008-present); Chairman and Chief Executive Officer (2007-present) and President and a Director (2006-present) of Fidelity Management & Research (U.K.) Inc. and President and a Director of Fidelity Research & Analysis Company (2006-present). Before joining Fidelity Investments in 2005, Mr. Wetlaufer was a partner in Oxhead Capital Management (2004-2005). |
Scott C. Goebel (41) |
| Year of Election or Appointment: 2008 Secretary and Chief Legal Officer (CLO) of the Fidelity funds. Mr. Goebel also serves as General Counsel, Secretary, and Senior Vice President of FMR (2008-present) and FMR Co., Inc. (2008-present); Deputy General Counsel of FMR LLC; Chief Legal Officer of Fidelity Management & Research (Hong Kong) Limited (2008-present) and Assistant Secretary of Fidelity Management & Research (Japan) Inc. (2008-present), Fidelity Investments Money Management, Inc. (2008-present), Fidelity Management & Research (U.K.) Inc. (2008-present), and Fidelity Research and Analysis Company (2008-present). Previously, Mr. Goebel served as Assistant Secretary of the Funds (2007-2008) and as Vice President and Secretary of Fidelity Distributors Corporation (FDC) (2005-2007). |
William C. Coffey (40) |
| Year of Election or Appointment: 2009 Assistant Secretary of Fidelity's Equity and High Income Funds. Mr. Coffey also serves as Vice President and Associate General Counsel of FMR LLC (2005-present), and is an employee of Fidelity Investments. |
Holly C. Laurent (55) |
| Year of Election or Appointment: 2008 Anti-Money Laundering (AML) Officer of the Fidelity funds. Ms. Laurent is an employee of Fidelity Investments. Previously, Ms. Laurent was Senior Vice President and Head of Legal for Fidelity Business Services India Pvt. Ltd. (2006-2008), and Senior Vice President, Deputy General Counsel and Group Head for FMR LLC (2005-2006). |
Christine Reynolds (51) |
| Year of Election or Appointment: 2008 Chief Financial Officer of the Fidelity funds. Ms. Reynolds became President of Fidelity Pricing and Cash Management Services (FPCMS) in August 2008. Ms. Reynolds served as Chief Operating Officer of FPCMS (2007-2008). Previously, Ms. Reynolds served as President, Treasurer, and Anti-Money Laundering officer of the Fidelity funds (2004-2007). |
Kenneth A. Rathgeber (62) |
| Year of Election or Appointment: 2004 Chief Compliance Officer of Fidelity's Equity and High Income Funds. Mr. Rathgeber is Chief Compliance Officer of Fidelity Management & Research (Hong Kong) Limited (2008-present), Fidelity Management & Research (Japan) Inc. (2008-present), FMR (2005-present), FMR Co., Inc. (2005-present), Fidelity Management & Research (U.K.) Inc. (2005-present), Fidelity Research & Analysis Company (2005-present), Fidelity Investments Money Management, Inc. (2005-present), Pyramis Global Advisors, LLC (2005-present), and Strategic Advisers, Inc. (2005-present). |
Jeffrey S. Christian (48) |
| Year of Election or Appointment: 2009 Deputy Treasurer of the Fidelity funds. Mr. Christian is an employee of Fidelity Investments. Previously, Mr. Christian served as Chief Financial Officer (2008-2009) of certain Fidelity funds, Senior Vice President of Fidelity Pricing and Cash Management Services (FPCMS) (2004-2009), and as Vice President of Business Analysis (2003-2004). |
Bryan A. Mehrmann (48) |
| Year of Election or Appointment: 2005 Deputy Treasurer of the Fidelity funds. Mr. Mehrmann is an employee of Fidelity Investments. Previously, Mr. Mehrmann served as Vice President of Fidelity Investments Institutional Services Group (FIIS)/Fidelity Investments Institutional Operations Company, Inc. (FIIOC) Client Services (1998-2004). |
Adrien E. Deberghes (42) |
| Year of Election or Appointment: 2008 Deputy Treasurer of Fidelity's Equity and High Income Funds. Mr. Deberghes is an employee of Fidelity Investments (2008-present). Previously, Mr. Deberghes served as Senior Vice President of Mutual Fund Administration at State Street Corporation (2007-2008), Senior Director of Mutual Fund Administration at Investors Bank & Trust (2005-2007), and Director of Finance for Dunkin' Brands (2000-2005). |
John R. Hebble (51) |
| Year of Election or Appointment: 2009 Assistant Treasurer of Fidelity's Equity and High Income Funds. Mr. Hebble also serves as President and Treasurer of other Fidelity funds (2008-present) and is an employee of Fidelity Investments. |
Paul M. Murphy (62) |
| Year of Election or Appointment: 2007 Assistant Treasurer of the Fidelity funds. Mr. Murphy is an employee of Fidelity Investments. Previously, Mr. Murphy served as Chief Financial Officer of the Fidelity funds (2005-2006), Vice President and Associate General Counsel of FMR (2007), and Senior Vice President of Fidelity Pricing and Cash Management Services (FPCMS) (1994-2007). |
Gary W. Ryan (51) |
| Year of Election or Appointment: 2005 Assistant Treasurer of the Fidelity funds. Mr. Ryan is an employee of Fidelity Investments. Previously, Mr. Ryan served as Vice President of Fund Reporting in Fidelity Pricing and Cash Management Services (FPCMS) (1999-2005). |
Annual Report
Distributions
The Board of Trustees of VIP International Capital Appreciation Portfolio voted to pay to shareholders of record at the opening of business on record date, the following distributions per share derived from capital gains realized from sales of portfolio securities and dividends derived from net investment income:
| Pay Date | Record Date | Dividends | Capital Gains |
Initial Class | 02/05/10 | 02/05/10 | $- | $0.03 |
Service Class | 02/05/10 | 02/05/10 | $- | $0.03 |
Service Class 2 | 02/05/10 | 02/05/10 | $- | $0.03 |
The amounts per share which represent income derived from sources within, and taxes paid to, foreign countries or possessions of the United States are as follows:
| Pay Date | Income | Taxes |
Initial Class | 12/18/09 | $0.124 | $0.015 |
Service Class | 12/18/09 | $0.117 | $0.015 |
Service Class 2 | 12/18/09 | $0.110 | $0.015 |
The fund will notify shareholders in January 2010 of amounts for use in preparing 2009 income tax returns.
Annual Report
Board Approval of Investment Advisory Contracts and Management Fees
VIP International Capital Appreciation Portfolio
Each year, the Board of Trustees, including the Independent Trustees (together, the Board), votes on the renewal of the management contract and sub-advisory agreements (together, the Advisory Contracts) for the fund. The Board, assisted by the advice of fund counsel and Independent Trustees' counsel, requests and considers a broad range of information throughout the year.
The Board meets regularly and, acting directly and through its separate committees, requests and receives information concerning, and considers at each of its meetings factors that are relevant to, its annual consideration of the renewal of the fund's Advisory Contracts, including the services and support provided to the fund and its shareholders. The Board has established various standing committees, each composed of Independent Trustees with varying backgrounds, to which the Board has assigned specific subject matter responsibilities in order to enhance effective decision-making by the Board. Each committee has a written charter outlining the structure and purposes of the committee. The Board also meets as needed to consider matters specifically related to the Board's annual consideration of the renewal of Advisory Contracts.
At its July 2009 meeting, the Board of Trustees, including the Independent Trustees, unanimously determined to renew the fund's Advisory Contracts. In reaching its determination, the Board considered all factors it believed relevant, including (i) the nature, extent, and quality of the services to be provided to the fund and its shareholders (including the investment performance of the fund); (ii) the competitiveness of the fund's management fee and total expenses; (iii) the total costs of the services to be provided by and the profits to be realized by Fidelity from its relationship with the fund; (iv) the extent to which economies of scale would be realized as the fund grows; and (v) whether fee levels reflect these economies of scale, if any, for the benefit of fund shareholders.
In considering whether to renew the Advisory Contracts for the fund, the Board ultimately reached a determination, with the assistance of fund counsel and Independent Trustees' counsel and through the exercise of its business judgment, that the renewal of the Advisory Contracts and the compensation to be received by Fidelity under the management contract is consistent with Fidelity's fiduciary duty under applicable law. The Board's decision to renew the Advisory Contracts was not based on any single factor noted above, but rather was based on a comprehensive consideration of all the information provided to the Board at its meetings throughout the year. The Board, in reaching its determination to renew the Advisory Contracts, is aware that shareholders in the fund have a broad range of investment choices available to them, including a wide choice among mutual funds offered by competitors to Fidelity, and that the fund's shareholders, with the opportunity to review and weigh the disclosure provided by the fund in its prospectus and other public disclosures, have chosen to invest in this fund, managed by Fidelity.
Nature, Extent, and Quality of Services Provided. The Board considered staffing within the investment adviser, FMR, and the sub-advisers (together, the Investment Advisers), including the backgrounds of the fund's investment personnel and the fund's investment objective and discipline. The Independent Trustees also had discussions with senior management of Fidelity's investment operations and investment groups. The Board considered the structure of the portfolio manager compensation program and whether this structure provides appropriate incentives.
Resources Dedicated to Investment Management and Support Services. The Board reviewed the size, education, and experience of the Investment Advisers' investment staff, their use of technology, and the Investment Advisers' approach to recruiting, training, and retaining portfolio managers and other research, advisory, and management personnel. In response to last year's financial crisis, FMR took a number of actions intended to cut costs and improve efficiency without weakening the investment teams or resources. The Board noted that Fidelity's analysts have access to a variety of technological tools and market and securities data that enable them to perform both fundamental and quantitative analysis and to specialize in various disciplines. The Board considered Fidelity's extensive global research capabilities that enable the Investment Advisers to aggregate data from various sources in an effort to produce positive investment results. The Board also considered that Fidelity's portfolio managers and analysts have access to daily portfolio attribution that allows for monitoring of a fund's portfolio, as well as an electronic communication system that provides immediate real-time access to research concerning issuers and credit enhancers.
Shareholder and Administrative Services. The Board considered (i) the nature, extent, quality, and cost of advisory, administrative, distribution, and shareholder services performed by the Investment Advisers and their affiliates under the Advisory Contracts and under separate agreements covering transfer agency, pricing and bookkeeping, and securities lending services for the fund; (ii) the nature and extent of the Investment Advisers' supervision of third party service providers, principally custodians and subcustodians; and (iii) the resources devoted to, and the record of compliance with, the fund's compliance policies and procedures. The Board also reviewed the allocation of fund brokerage, including allocations to brokers affiliated with the Investment Advisers, the use of brokerage commissions to pay fund expenses, and the use of "soft" commission dollars to pay for research services.
The Board noted that the growth of fund assets across the complex allows Fidelity to reinvest in the development of services designed to enhance the value or convenience of the Fidelity funds as investment vehicles. These services include 24-hour access to account information and market information through phone representatives and over the Internet, and investor education materials and asset allocation tools.
Investment in a Large Fund Family. The Board considered the benefits to shareholders of investing in a Fidelity fund, including the benefits of investing in a fund that is part of a large family of funds offering a variety of investment disciplines and providing for a large variety of mutual fund investor services. The Board noted that Fidelity has taken a number of actions over the previous year that benefited particular funds, including (i) dedicating additional resources to investment research and to restructure and broaden the focus of the investment research teams; (ii) bolstering the senior management team that oversees asset management; (iii) contractually agreeing to reduce the management fee on Fidelity U.S. Bond Index Fund; and (iv) expanding Class A and Class T load waiver categories to increase rollover retention opportunities and create consistent policies across the classes.
Annual Report
Board Approval of Investment Advisory Contracts and Management Fees - continued
Investment Performance. The Board considered whether the fund has operated within its investment objective, as well as its record of compliance with its investment restrictions. It also reviewed the fund's absolute investment performance for each class, as well as the fund's relative investment performance for each class measured against (i) a broad-based securities market index, and (ii) a custom peer group of mutual funds deemed appropriate by the Board over multiple periods. Because the fund had been in existence less than five calendar years, the following charts considered by the Board show, over the one- and three-year periods ended December 31, 2008, the cumulative total returns of Initial Class R and Service Class 2 of the fund, the cumulative total returns of a broad-based securities market index ("benchmark"), and a range of cumulative total returns of a custom peer group of mutual funds defined by FMR based on categories assigned by Morningstar, Inc. The returns of Initial Class R and Service Class 2 show the performance of the highest and lowest performing classes, respectively (based on three-year performance). The box within each chart shows the 25th percentile return (bottom of box) and the 75th percentile return (top of box) of the peer group. Returns shown above the box are in the first quartile and returns shown below the box are in the fourth quartile. The percentage beaten numbers noted below each chart correspond to the percentile box and represent the percentage of funds in the peer group whose performance was equal to or lower than that of the class indicated. The fund's custom peer group, defined by FMR, is a peer group that FMR believes provides a more meaningful performance comparison than the peer group assigned by Morningstar, Inc., which assigns mutual funds to categories based on their investment styles as measured by their underlying portfolio holdings.
VIP International Capital Appreciation Portfolio

The Board reviewed the fund's relative investment performance against its peer group and stated that the performance of Initial Class R of the fund was in the fourth quartile for all the periods shown. The Board also stated that the investment performance of the fund was lower than its benchmark for all the periods shown. The Board considered that the variations in performance among the fund's classes reflect the variations in class expenses, which result in lower performance for higher expense classes. The Board discussed with FMR actions that have been taken by FMR to improve the fund's disappointing performance relative to its peer group and benchmark. The Board noted that this fund had underperformed in the previous year and discussed with FMR its disappointment with the continued underperformance of the fund. The Board will continue to closely monitor the performance of the fund in the coming year and discuss with FMR other appropriate actions to address the performance of the fund.
The Board considered that FMR has taken steps to refocus and strengthen equity research, equity portfolio management, and compliance. The Board reviewed the year-to-date performance of Initial Class through May 31, 2009 and stated that it exceeded the fund's benchmark.
Based on its review, and giving particular weight to the nature and quality of the resources dedicated by the Investment Advisers to maintain and improve relative performance and factoring in the unprecedented market events in 2008, the Board concluded that the nature, extent, and quality of the services provided to the fund will benefit the fund's shareholders, particularly in light of the Board's view that the fund's shareholders benefit from investing in a fund that is part of a large family of funds offering a variety of investment disciplines and services.
Competitiveness of Management Fee and Total Fund Expenses. The Board considered the fund's management fee and total expenses compared to "mapped groups" of competitive funds and classes. Fidelity creates "mapped groups" by combining similar Lipper investment objective categories that have comparable management fee characteristics. Combining Lipper investment objective categories aids the Board's management fee and total expense comparisons by broadening the competitive group used for comparison and by reducing the number of universes to which various Fidelity funds are compared.
Annual Report
The Board considered two proprietary management fee comparisons for the 12-month (or shorter) periods shown in the chart below. The group of Lipper funds used by the Board for management fee comparisons is referred to below as the "Total Mapped Group." The Total Mapped Group comparison focuses on a fund's standing relative to the total universe of comparable funds available to investors, in terms of gross management fees before expense reimbursements or caps. "TMG %" represents the percentage of funds in the Total Mapped Group that had management fees that were lower than the fund's. For example, a TMG % of 18% means that 82% of the funds in the Total Mapped Group had higher management fees than the fund. The "Asset-Size Peer Group" (ASPG) comparison focuses on a fund's standing relative to non-Fidelity funds similar in size to the fund within the Total Mapped Group. The ASPG represents at least 15% of the funds in the Total Mapped Group with comparable asset size and management fee characteristics, subject to a minimum of 50 funds (or all funds in the Total Mapped Group if fewer than 50). Additional information, such as the ASPG quartile in which the fund's management fee ranked, is also included in the chart and considered by the Board.
VIP International Capital Appreciation Portfolio

The Board noted that the fund's management fee ranked below the median of its Total Mapped Group and below the median of its ASPG for 2008.
Based on its review, the Board concluded that the fund's management fee was fair and reasonable in light of the services that the fund receives and the other factors considered.
In its review of each class's total expenses, the Board considered the fund's management fee as well as other fund or class expenses, as applicable, such as transfer agent fees, pricing and bookkeeping fees, fund-paid 12b-1 fees, and custodial, legal, and audit fees. The Board also noted the effects of any waivers and reimbursements on fees and expenses. As part of its review, the Board also considered current and historical total expenses of each class of the fund compared to competitive fund median expenses. Each class of the fund is compared to those funds and classes in the Total Mapped Group (used by the Board for management fee comparisons) that have a similar sales load structure.
The Board noted that the total expenses of each of Initial Class and Initial Class R ranked equal to its competitive median for 2008 and the total expenses of each of Investor Class R, Service Class, Service Class 2, Service Class R, and Service Class 2 R ranked above its competitive median for 2008. The Board considered that the total expenses of Investor Class R were above the median primarily due to its higher transfer agent fee. The Board noted that the fund offers multiple classes, each of which has a different 12b-1 fee structure, and that the multiple structures are intended to offer a range of pricing options for the intermediary market. The Board also noted that the total expenses of the classes vary primarily by the level of their 12b-1 fees, although differences in transfer agent fees may also cause expenses to vary from class to class.
In its review of total expenses, the Board also considered Fidelity fee structures and other information on clients that FMR and its affiliates service in other competitive markets, such as other mutual funds advised or subadvised by FMR or its affiliates, pension plan clients, and other institutional clients.
Based on its review, the Board concluded that the total expenses of each class of the fund were reasonable, although in some cases above the median of the universe presented for comparison, in light of the services that the fund and its shareholders receive and the other factors considered.
Annual Report
Board Approval of Investment Advisory Contracts and Management Fees - continued
Costs of the Services and Profitability. The Board considered the revenues earned and the expenses incurred by Fidelity in conducting the business of developing, marketing, distributing, managing, administering and servicing the fund and its shareholders. The Board also considered the level of Fidelity's profits in respect of all the Fidelity funds.
On an annual basis, FMR presents to the Board Fidelity's profitability for the fund. Fidelity calculates the profitability for each fund, as well as aggregate profitability for groups of Fidelity funds and all Fidelity funds, using a series of detailed revenue and cost allocation methodologies which originate with the audited books and records of Fidelity. The Audit Committee of the Board reviews any significant changes from the prior year's methodologies.
PricewaterhouseCoopers LLP (PwC), independent registered public accounting firm and auditor to Fidelity and certain Fidelity funds, has been engaged annually by the Board as part of the Board's assessment of Fidelity's profitability analysis. PwC's engagement includes the review and assessment of Fidelity's methodologies used in determining the revenues and expenses attributable to Fidelity's mutual fund business, and completion of agreed-upon procedures surrounding the mathematical accuracy of fund profitability and its conformity to allocation methodologies. After considering PwC's reports issued under the engagement and information provided by Fidelity, the Board believes that while other allocation methods may also be reasonable, Fidelity's profitability methodologies are reasonable in all material respects.
The Board has also reviewed Fidelity's non-fund businesses and any fall-out benefits related to the mutual fund business as well as cases where Fidelity's affiliates may benefit from or be related to the fund's business.
The Board considered the costs of the services provided by and the profits realized by Fidelity in connection with the operation of the fund and determined that the amount of profit is a fair entrepreneurial profit for the management of the fund.
Economies of Scale. The Board considered whether there have been economies of scale in respect of the management of the Fidelity funds, whether the Fidelity funds (including the fund) have appropriately benefited from any such economies of scale, and whether there is potential for realization of any further economies of scale. The Board considered the extent to which the fund will benefit from economies of scale through increased services to the fund, through waivers or reimbursements, or through fee or expense reductions.
In February 2009, the Board created an Ad Hoc Committee (the "Committee") to analyze economies of scale. The Committee was formed to consider whether FMR attains economies of scale in respect of the management and servicing of the Fidelity funds, whether the Fidelity funds have appropriately benefited from such economies of scale, and whether there is potential for realization of any further economies of scale.
The Board recognized that the fund's management contract incorporates a "group fee" structure, which provides for lower group fee rates as total fund assets under FMR's management increase, and for higher group fee rates as total fund assets under FMR's management decrease. FMR determines the group fee rates based on a tiered asset "breakpoint" schedule. The Board considered that the group fee is designed to deliver the benefits of economies of scale to fund shareholders when total fund assets increase, even if assets of any particular fund are unchanged or have declined, because some portion of Fidelity's costs are attributable to services provided to all Fidelity funds, and all funds benefit if those costs can be allocated among more assets. The Board concluded that, given the group fee structure, fund shareholders will achieve a certain level of economies of scale as assets under FMR's management increase at the fund complex level, regardless of whether Fidelity achieves any such economies of scale.
The Board concluded, considering the findings of the Committee, that any potential economies of scale are being shared between fund shareholders and Fidelity in an appropriate manner.
Additional Information Requested by the Board. In order to develop fully the factual basis for consideration of the Fidelity funds' Advisory Contracts, the Board requested and received additional information on certain topics, including (i) fund performance trends, actions to be taken by FMR to improve certain funds' overall performance and Fidelity's long-term strategies for certain funds; (ii) portfolio manager changes that have occurred during the past year; (iii) Fidelity's compensation structure for portfolio managers and key personnel, including performance benchmarks used by Fidelity in evaluating incentive compensation for portfolio managers and research analysts; (iv) the structure and process of equity research and actions taken by FMR to improve the quality of research; (v) the selection of and compensation paid by FMR to fund sub-advisers; (vi) Fidelity's fee structures and rationale for recommending different fees among categories of funds; (vii) the rationale for any differences between fund fee structures and fee structures in place for other Fidelity clients; (viii) Fidelity's rationale for recommending which funds should have a performance adjustment component as part of their management fees; and (ix) explanations for the relative total expenses borne by certain funds and classes, total expense competitive trends, and actions that might be taken by FMR to reduce total expenses for certain funds and classes.
Based on its evaluation of all of the conclusions noted above, and after considering all material factors, the Board ultimately concluded that the advisory fee structures are fair and reasonable, and that the fund's Advisory Contracts should be renewed.
Annual Report
Investment Adviser
Fidelity Management & Research Company
Boston, MA
Investment Sub-Advisers
FMR Co., Inc.
Fidelity Management & Research (U.K.) Inc.
Fidelity Research & Analysis Company
FIL Investment Advisors
FIL Investment Advisors (U.K.) Ltd.
FIL Investments (Japan) Limited
Fidelity Management & Research (Hong Kong) Limited
Fidelity Management & Research (Japan) Inc.
General Distributor
Fidelity Distributors Corporation
Boston, MA
Transfer and Service Agents
Fidelity Investments Institutional Operations Company, Inc.
Boston, MA
Fidelity Service Company, Inc.
Boston, MA
Custodian
Brown Brothers Harriman & Co.
Boston, MA
VIPCAP-ANN-0210
1.811843.105
Fidelity® Variable Insurance Products:
International Capital Appreciation Portfolio - Class R
Annual Report
December 31, 2009
(2_fidelity_logos) (Registered_Trademark)
Contents
Performance | <Click Here> | How the fund has done over time. |
Management's Discussion | <Click Here> | The manager's review of fund performance, strategy and outlook. |
Shareholder Expense Example | <Click Here> | An example of shareholder expenses. |
Investment Changes | <Click Here> | A summary of major shifts in the fund's investments over the past six months. |
Investments | <Click Here> | A complete list of the fund's investments with their
market values. |
Financial Statements | <Click Here> | Statements of assets and liabilities, operations, and
changes in net assets, as well as financial highlights. |
Notes | <Click Here> | Notes to the financial statements. |
Report of Independent Registered Public Accounting Firm | <Click Here> | |
Trustees and Officers | <Click Here> | |
Distributions | <Click Here> | |
Board Approval of Investment Advisory Contracts and Management Fees | <Click Here> | |
To view a fund's proxy voting guidelines and proxy voting record for the 12-month period ended June 30, visit http://www.fidelity.com/proxyvotingresults or visit the Securities and Exchange Commission's (SEC) web site at http://www.sec.gov. You may also call 1-877-208-0098 to request a free copy of the proxy voting guidelines.
Fidelity Variable Insurance Products are separate account options which are purchased through a variable insurance contract.
Standard & Poor's, S&P and S&P 500 are registered service marks of The McGraw-Hill Companies, Inc. and have been licensed for use by Fidelity Distributors Corporation.
Other third party marks appearing herein are the property of their respective owners.
All other marks appearing herein are registered or unregistered trademarks or service marks of FMR LLC or an affiliated company.
This report and the financial statements contained herein are submitted for the general information of the shareholders of the fund. This report is not authorized for distribution to prospective investors in the fund unless preceded or accompanied by an effective prospectus.
A fund files its complete schedule of portfolio holdings with the SEC for the first and third quarters of each fiscal year on Form N-Q. Forms N-Q are available on the SEC's web site at http://www.sec.gov. A fund's Forms N-Q may be reviewed and copied at the SEC's Public Reference Room in Washington, DC. Information regarding the operation of the SEC's Public Reference Room may be obtained by calling 1-800-SEC-0330. For a complete list of a fund's portfolio holdings, view the most recent holdings listing, semiannual report, or annual report on Fidelity's web site at http://www.fidelity.com or http://www.advisor.fidelity.com, as applicable.
NOT FDIC INSURED · MAY LOSE VALUE · NO BANK GUARANTEE
Neither the fund nor Fidelity Distributors Corporation is a bank.
Annual Report
Average annual total return reflects the change in the value of an investment, assuming reinvestment of a class' dividend income and capital gains (the profits earned upon the sale of securities that have grown in value, if any) and assuming a constant rate of performance each year. During periods of reimbursement by Fidelity, a fund's total return will be greater than it would be had the reimbursement not occurred. Performance numbers are net of all underlying fund operating expenses, but do not include any insurance charges imposed by your insurance company's separate account. If performance information included the effect of these additional charges, the total returns would be lower. How a fund did yesterday is no guarantee of how it will do tomorrow.
Average Annual Total Returns
Periods ended December 31, 2009 | Past 1
year | Past 5
years | Life of
fundA |
VIP International Capital Appreciation - Initial Class | 56.04% | 0.81% | 1.28% |
VIP International Capital Appreciation - Service Class | 55.52% | 0.69% | 1.16% |
VIP International Capital Appreciation - Service Class 2 | 55.44% | 0.55% | 1.03% |
VIP International Capital Appreciation - Initial Class R | 55.76% | 0.81% | 1.28% |
VIP International Capital Appreciation - Service Class R | 55.52% | 0.69% | 1.16% |
VIP International Capital Appreciation - Service Class 2R | 55.36% | 0.55% | 1.02% |
VIP International Capital Appreciation - Investor Class R B | 55.61% | 0.70% | 1.18% |
A From December 22, 2004.
B The initial offering of Investor Class R shares took place on July 21, 2005. Returns prior to July 21, 2005 are those of Initial Class R. Had Investor Class R's transfer agent fee had been reflected, returns prior to July 21, 2005 would have been lower.
$10,000 Over Life of Fund
Let's say hypothetically that $10,000 was invested in VIP International Capital Appreciation Portfolio - Initial Class R on December 22, 2004, when the fund started. The chart shows how the value of your investment would have changed, and also shows the MSCI® ACWI (All Country World Index) ex USA Index performed over the same period.
Annual Report
Market Recap: In 2009, most global markets saw both crippling lows and considerable highs. After a dismal start, the economy began to show signs of improvement, suggesting that a recovery was on the horizon. Credit markets began to heal as fiscal and monetary stimulus efforts around the world started to take effect, and corporate earnings staged an impressive rebound, fueled in large part by massive cost cutting. As a result, the flight to quality that marked most of 2008 and early 2009 shifted in March as investors flocked to riskier asset categories. The U.S. equity market, as measured by the bellwether Standard & Poor's 500SM Index and the blue-chip proxy Dow Jones Industrial AverageSM, reflected this changing environment, gaining 26.46% and 22.68%, respectively. Meanwhile, the technology-laden Nasdaq Composite® Index rose 45.32%. Foreign stocks also produced strong gains, as illustrated by the 31.93% jump of the MSCI® EAFE® Index (Europe, Australasia, Far East), a gauge of developed stock markets outside the U.S. and Canada. Emerging-markets stocks, which suffered their worst calendar-year performance ever in 2008, posted record returns this past year, with the MSCI Emerging Markets Index soaring 79.02%. A depreciating U.S. dollar helped bolster returns for U.S. investors in foreign equities.
Comments from Sammy Simnegar, Portfolio Manager of VIP International Capital Appreciation Portfolio: During the past year, the fund handily beat the 41.60% return of its benchmark, the MSCI ACWI (All Country World Index) ex USA Index. (For specific portfolio results, please refer to the performance section of this report.) Stock selection in materials - where I focused on producers of industrial and precious metals such as copper, steel and platinum - accounted for more than a third of the fund's edge over its benchmark. The fund also benefited from favorable stock picks in energy, information technology, consumer discretionary and financials, among other sectors. In fact, nine out of 10 market sectors contributed to performance. Our top relative contributor was Germany-based Aixtron, a manufacturer of machines that make LED (light-emitting diode) lights, a rapidly growing market. Three notable contributors from the diversified financials segment of the financials sector were American firms Morgan Stanley, Goldman Sachs and Bank of America. To varying degrees, all three were pressured by balance sheet concerns until assistance from the federal government calmed investors nerves and triggered a rebound in the financial markets that lasted from March through the end of the year. Three other contributors were from the metals and mining industry: Canada's Consolidated Thompson Iron Mines, Russian steel producer Evraz Group and Swiss copper and coal miner Xstrata, all of which benefited from rising prices for their respective commodities. All the contributors I mentioned, except for Xstrata, were out-of-index positions. The fund did not hold Goldman Sachs or Evraz Group at period end. Conversely, the industrials sector detracted modestly because of lackluster stock picking. Additionally, within financials, which had a positive overall impact on our relative results, stock selection in the insurance group dampened the fund's gains. A small cash position also was counterproductive in a strongly rising market. Among individual holdings, French insurer AXA, Swiss diversified financial services provider UBS and U.S. commercial bank Citigroup detracted - mostly due to poor timing. First Uranium, a Canadian developer of uranium- and gold-mining projects in South Africa, was hurt by an inability to secure funding and other operational problems. Neither First Uranium nor Citigroup was a component of the index.
The views expressed above reflect those of the portfolio manager(s) only through the end of the period as stated on the cover of this report and do not necessarily represent the views of Fidelity or any other person in the Fidelity organization. Any such views are subject to change at any time based upon market or other conditions and Fidelity disclaims any responsibility to update such views. These views may not be relied on as investment advice and, because investment decisions for a Fidelity fund are based on numerous factors, may not be relied on as an indication of trading intent on behalf of any Fidelity fund.
Annual Report
Shareholder Expense Example
As a shareholder of the Fund, you incur two types of costs: (1) transaction costs, including redemption fees, and (2) ongoing costs, including management fees, distribution and/or service (12b-1) fees and other Fund expenses. This Example is intended to help you understand your ongoing costs (in dollars) of investing in the Fund and to compare these costs with the ongoing costs of investing in other mutual funds.
The Example is based on an investment of $1,000 invested at the beginning of the period and held for the entire period (July 1, 2009 to December 31, 2009).
Actual Expenses
The first line of the accompanying table for each class of the Fund provides information about actual account values and actual expenses. You may use the information in this line, together with the amount you invested, to estimate the expenses that you paid over the period. Simply divide your account value by $1,000.00 (for example, an $8,600 account value divided by $1,000.00 = 8.6), then multiply the result by the number in the first line for a class of the Fund under the heading entitled "Expenses Paid During Period" to estimate the expenses you paid on your account during this period. The estimate of expenses does not include any fees or other expenses of any variable annuity or variable life insurance product. If they were, the estimate of expenses you paid during the period would be higher, and your ending account value would be lower. In addition, the Fund, as a shareholder in the underlying Fidelity Central Funds, will indirectly bear its pro-rata share of the fees and expenses incurred by the underlying Fidelity Central Funds. These fees and expenses are not included in the Fund's annualized expense ratio used to calculate the expense estimate in the table below.
Hypothetical Example for Comparison Purposes
The second line of the accompanying table for each class of the Fund provides information about hypothetical account values and hypothetical expenses based on a Class' actual expense ratio and an assumed rate of return of 5% per year before expenses, which is not the Class' actual return. The hypothetical account values and expenses may not be used to estimate the actual ending account balance or expenses you paid for the period. You may use this information to compare the ongoing costs of investing in the Fund and other funds. To do so, compare this 5% hypothetical example with the 5% hypothetical examples that appear in the shareholder reports of the other funds. The estimate of expenses does not include any fees or other expenses of any variable annuity or variable life insurance product. If they were, the estimate of expenses you paid during the period would be higher, and your ending account value would be lower. In addition, the Fund, as a shareholder in the underlying Fidelity Central Funds, will indirectly bear its pro-rata share of the fees and expenses incurred by the underlying Fidelity Central Funds. These fees and expenses are not included in the Fund's annualized expense ratio used to calculate the expense estimate in the table below.
Please note that the expenses shown in the table are meant to highlight your ongoing costs only and do not reflect any transaction costs. Therefore, the second line of the table is useful in comparing ongoing costs only, and will not help you determine the relative total costs of owning different funds. In addition, if these transactional costs were included, your costs would have been higher.
| Annualized
Expense Ratio | Beginning
Account Value
July 1, 2009 | Ending
Account Value
December 31, 2009 | Expenses Paid
During Period*
July 1, 2009 to
December 31, 2009 |
Initial Class | 1.10% | | | |
Actual | | $ 1,000.00 | $ 1,254.10 | $ 6.25 |
HypotheticalA | | $ 1,000.00 | $ 1,019.66 | $ 5.60 |
Service Class | 1.20% | | | |
Actual | | $ 1,000.00 | $ 1,251.80 | $ 6.81 |
HypotheticalA | | $ 1,000.00 | $ 1,019.16 | $ 6.11 |
Service Class 2 | 1.35% | | | |
Actual | | $ 1,000.00 | $ 1,252.40 | $ 7.66 |
HypotheticalA | | $ 1,000.00 | $ 1,018.40 | $ 6.87 |
Initial Class R | 1.10% | | | |
Actual | | $ 1,000.00 | $ 1,254.10 | $ 6.25 |
HypotheticalA | | $ 1,000.00 | $ 1,019.66 | $ 5.60 |
Service Class R | 1.20% | | | |
Actual | | $ 1,000.00 | $ 1,251.80 | $ 6.81 |
HypotheticalA | | $ 1,000.00 | $ 1,019.16 | $ 6.11 |
Service Class 2R | 1.35% | | | |
Actual | | $ 1,000.00 | $ 1,251.80 | $ 7.66 |
HypotheticalA | | $ 1,000.00 | $ 1,018.40 | $ 6.87 |
Investor Class R | 1.18% | | | |
Actual | | $ 1,000.00 | $ 1,253.80 | $ 6.70 |
HypotheticalA | | $ 1,000.00 | $ 1,019.26 | $ 6.01 |
A 5% return per year before expenses
* Expenses are equal to each Class' annualized expense ratio, multiplied by the average account value over the period, multiplied by 184/365 (to reflect the one-half year period).
Annual Report
Investment Changes (Unaudited)
Geographic Diversification (% of fund's net assets) |
As of December 31, 2009 |
| Japan | 14.9% | |
| United Kingdom | 11.8% | |
| United States of America | 8.0% | |
| France | 7.9% | |
| Canada | 7.0% | |
| Australia | 4.9% | |
| Russia | 4.2% | |
| India | 3.6% | |
| Korea (South) | 3.5% | |
| Other | 34.2% | |

Percentages are adjusted for the effect of futures contracts, if applicable. |
As of June 30, 2009 |
| Japan | 17.1% | |
| United Kingdom | 13.2% | |
| United States of America | 11.9% | |
| France | 8.7% | |
| Canada | 7.6% | |
| Germany | 3.1% | |
| Spain | 3.0% | |
| India | 3.0% | |
| Russia | 2.9% | |
| Other | 29.5% | |

Percentages are adjusted for the effect of futures contracts, if applicable. |
Asset Allocation |
| % of fund's
net assets | % of fund's net assets
6 months ago |
Stocks | 99.5 | 98.1 |
Bonds | 0.5 | 0.0 |
Short-Term Investments and Net Other Assets | 0.0 | 1.9 |
Top Ten Stocks as of December 31, 2009 |
| % of fund's
net assets | % of fund's net assets
6 months ago |
HSBC Holdings PLC sponsored ADR (United Kingdom, Commercial Banks) | 1.8 | 0.0 |
Royal Dutch Shell PLC Class B (United Kingdom, Oil, Gas & Consumable Fuels) | 1.7 | 1.8 |
Barclays PLC Sponsored ADR (United Kingdom, Commercial Banks) | 1.3 | 1.2 |
ING Groep NV sponsored ADR (Netherlands, Diversified Financial Services) | 1.2 | 0.0 |
Rio Tinto PLC (Reg.) (United Kingdom, Metals & Mining) | 1.1 | 0.8 |
UBS AG (NY Shares) (Switzerland, Capital Markets) | 1.1 | 0.0 |
Sanofi-Aventis sponsored ADR (France, Pharmaceuticals) | 1.1 | 0.0 |
Centrais Electricas Brasileiras SA (Electrobras) ADR (Brazil, Electric Utilities) | 1.1 | 0.0 |
Samsung Electronics Co. Ltd. (Korea (South), Semiconductors & Semiconductor Equipment) | 1.0 | 1.0 |
Mitsubishi UFJ Financial Group, Inc. sponsored ADR (Japan, Commercial Banks) | 1.0 | 1.1 |
| 12.4 | |
Market Sectors as of December 31, 2009 |
| % of fund's
net assets | % of fund's net assets
6 months ago |
Financials | 27.0 | 24.4 |
Materials | 14.2 | 10.2 |
Consumer Discretionary | 10.4 | 12.2 |
Energy | 10.4 | 10.0 |
Information Technology | 9.8 | 8.8 |
Industrials | 8.3 | 10.0 |
Consumer Staples | 6.5 | 5.3 |
Utilities | 4.8 | 4.1 |
Health Care | 4.7 | 5.3 |
Telecommunication Services | 3.9 | 7.8 |
Annual Report
Investments December 31, 2009
Showing Percentage of Net Assets
Common Stocks - 98.9% |
| Shares | | Value |
Australia - 4.9% |
Fortescue Metals Group Ltd. (a) | 62,588 | | $ 249,615 |
JB Hi-Fi Ltd. | 11,156 | | 226,472 |
MacArthur Coal Ltd. | 26,983 | | 272,672 |
Macquarie Group Ltd. | 6,688 | | 290,763 |
Origin Energy Ltd. | 18,185 | | 274,749 |
Wesfarmers Ltd. | 11,786 | | 331,048 |
Westfield Group unit | 27,118 | | 305,459 |
Woolworths Ltd. | 12,463 | | 313,457 |
TOTAL AUSTRALIA | | 2,264,235 |
Bailiwick of Guernsey - 0.6% |
Raven Russia Ltd. | 305,500 | | 222,180 |
Tetragon Financial Group Ltd. | 12,200 | | 47,702 |
TOTAL BAILIWICK OF GUERNSEY | | 269,882 |
Belgium - 1.6% |
Anheuser-Busch InBev SA NV | 6,956 | | 362,442 |
Fortis (a) | 100,775 | | 378,432 |
TOTAL BELGIUM | | 740,874 |
Bermuda - 2.0% |
Aquarius Platinum Ltd. (United Kingdom) (a) | 37,700 | | 247,980 |
Dufry South America Ltd. unit | 10,003 | | 204,881 |
Huabao International Holdings Ltd. | 223,000 | | 239,785 |
Northern Offshore Ltd. (a)(c) | 136,000 | | 222,914 |
TOTAL BERMUDA | | 915,560 |
Brazil - 3.3% |
Banco Santander (Brasil) SA ADR | 19,500 | | 271,830 |
Centrais Eletricas Brasileiras SA (Electrobras) sponsored ADR | 23,000 | | 485,070 |
MRV Engenharia e Participacoes SA | 31,800 | | 252,685 |
OGX Petroleo e Gas Participacoes SA | 26,200 | | 254,785 |
PDG Realty S.A. Empreendimentos e Participacoes | 25,100 | | 249,992 |
TOTAL BRAZIL | | 1,514,362 |
Canada - 7.0% |
Canadian Imperial Bank of Commerce | 4,700 | | 304,864 |
Consolidated Thompson Iron Mines Ltd. (a) | 40,700 | | 261,868 |
First Quantum Minerals Ltd. | 3,700 | | 282,646 |
First Uranium Corp. (a) | 112,000 | | 245,182 |
Grande Cache Coal Corp. (a) | 43,700 | | 222,940 |
InterOil Corp. (a) | 3,100 | | 238,111 |
Niko Resources Ltd. | 2,600 | | 243,506 |
OPTI Canada, Inc. (a)(c) | 143,400 | | 277,068 |
Petrobank Energy & Resources Ltd. (a) | 5,200 | | 253,455 |
Quadra Mining Ltd. (a) | 17,100 | | 236,160 |
Suncor Energy, Inc. | 11,000 | | 389,578 |
Teck Resources Ltd. Class B (sub. vtg.) (a) | 8,200 | | 287,369 |
TOTAL CANADA | | 3,242,747 |
|
| Shares | | Value |
Cayman Islands - 1.9% |
Hengdeli Holdings Ltd. | 612,000 | | $ 231,076 |
JA Solar Holdings Co. Ltd. ADR (a) | 36,300 | | 206,910 |
Peak Sport Products Co. Ltd. | 442,000 | | 242,425 |
Trina Solar Ltd. ADR (a)(c) | 4,000 | | 215,880 |
TOTAL CAYMAN ISLANDS | | 896,291 |
China - 1.6% |
China Construction Bank Corp. (H Shares) | 423,000 | | 361,290 |
China Life Insurance Co. Ltd. ADR (c) | 4,700 | | 344,745 |
Digital China Holdings Ltd. (H Shares) | 44,000 | | 58,574 |
TOTAL CHINA | | 764,609 |
Cyprus - 0.5% |
Mirland Development Corp. PLC (a) | 81,800 | | 211,522 |
Denmark - 0.5% |
Carlsberg AS Series B | 3,200 | | 236,396 |
Finland - 0.6% |
Fortum Corp. | 9,700 | | 263,436 |
France - 7.9% |
Accor SA | 4,652 | | 254,746 |
Atos Origin SA (a) | 5,160 | | 237,022 |
AXA SA sponsored ADR | 15,100 | | 357,568 |
BNP Paribas SA | 5,881 | | 470,652 |
Carrefour SA | 6,637 | | 318,882 |
Credit Agricole SA | 19,300 | | 341,517 |
Iliad Group SA | 1,833 | | 219,174 |
Saft Groupe SA | 4,716 | | 227,936 |
Sanofi-Aventis sponsored ADR | 12,500 | | 490,875 |
Schneider Electric SA | 2,708 | | 317,054 |
Societe Generale Series A | 5,824 | | 408,142 |
TOTAL FRANCE | | 3,643,568 |
Germany - 3.2% |
Aixtron AG | 7,706 | | 259,259 |
Daimler AG (Reg.) | 7,148 | | 380,988 |
Deutsche Bank AG (NY Shares) | 5,100 | | 361,641 |
HeidelbergCement AG | 3,619 | | 249,886 |
Metro AG | 3,700 | | 225,498 |
TOTAL GERMANY | | 1,477,272 |
Greece - 1.2% |
Hellenic Telecommunications Organization SA | 17,523 | | 258,143 |
National Bank of Greece SA sponsored ADR | 53,900 | | 280,819 |
TOTAL GREECE | | 538,962 |
Hong Kong - 0.5% |
China Resources Power Holdings Co. Ltd. | 124,000 | | 245,638 |
India - 3.6% |
Bank of Baroda | 20,020 | | 221,704 |
Common Stocks - continued |
| Shares | | Value |
India - continued |
BGR Energy Systems Ltd. | 22,052 | | $ 233,278 |
Financial Technologies India Ltd. | 8,292 | | 240,211 |
ICSA (India) Ltd. | 63,316 | | 245,297 |
Jaiprakash Associates Ltd. | 75,192 | | 237,922 |
MIC Electronics Ltd. | 253,509 | | 247,173 |
Rural Electrification Corp. Ltd. (a) | 3,032 | | 15,862 |
Sintex Industries Ltd. | 36,134 | | 213,721 |
TOTAL INDIA | | 1,655,168 |
Indonesia - 0.5% |
PT Semen Gresik Tbk | 297,500 | | 238,316 |
Ireland - 0.5% |
Covidien PLC | 4,700 | | 225,083 |
Israel - 0.9% |
Teva Pharmaceutical Industries Ltd. sponsored ADR | 7,100 | | 398,878 |
Italy - 1.3% |
Intesa Sanpaolo SpA | 74,354 | | 335,314 |
Mediaset SpA | 31,700 | | 260,273 |
TOTAL ITALY | | 595,587 |
Japan - 14.9% |
eAccess Ltd. (c) | 444 | | 261,090 |
Elpida Memory, Inc. (a) | 15,000 | | 244,588 |
Fujifilm Holdings Corp. | 9,600 | | 290,067 |
Gulliver International Co. Ltd. | 3,310 | | 231,688 |
Itochu Corp. | 36,000 | | 266,052 |
Japan Tobacco, Inc. | 76 | | 256,738 |
JTEKT Corp. | 18,100 | | 232,910 |
Kenedix, Inc. (a) | 671 | | 217,227 |
Kimoto Co. Ltd. | 23,700 | | 280,028 |
Kirin Holdings Co. Ltd. | 17,000 | | 272,761 |
Kyocera Corp. | 3,200 | | 281,962 |
Mazda Motor Corp. (a) | 105,000 | | 241,557 |
Mitsubishi Corp. | 13,100 | | 326,460 |
Mitsubishi UFJ Financial Group, Inc. sponsored ADR | 96,300 | | 473,796 |
Mitsui & Co. Ltd. | 21,700 | | 307,987 |
Nitori Co. Ltd. | 3,150 | | 234,575 |
ORIX Corp. | 5,590 | | 380,775 |
Sapporo Breweries Ltd. | 41,000 | | 226,029 |
SOFTBANK CORP. | 11,300 | | 265,031 |
Sony Corp. sponsored ADR | 11,100 | | 321,900 |
Sumitomo Metal Industries Ltd. | 97,000 | | 260,866 |
Sumitomo Realty & Development Co. Ltd. | 13,000 | | 245,526 |
Tokyo Ohka Kogyo Co. Ltd. | 12,500 | | 232,616 |
Toshiba Corp. | 56,000 | | 310,889 |
Uni-Charm Corp. | 2,600 | | 243,858 |
TOTAL JAPAN | | 6,906,976 |
Korea (South) - 3.5% |
Duksan Hi-Metal Co. Ltd. (a) | 19,414 | | 217,270 |
|
| Shares | | Value |
Hanjin Heavy Industries & Consolidated Co. Ltd. | 11,955 | | $ 232,216 |
Hyundai Mipo Dockyard Co. Ltd. | 2,643 | | 233,458 |
Kia Motors Corp. (a) | 14,530 | | 249,835 |
Lumens Co. Ltd. (a) | 28,872 | | 221,107 |
Samsung Electronics Co. Ltd. | 704 | | 482,384 |
TOTAL KOREA (SOUTH) | | 1,636,270 |
Luxembourg - 0.5% |
Millicom International Cellular SA | 3,300 | | 243,441 |
Mexico - 0.6% |
Cemex SA de CV sponsored ADR | 22,200 | | 262,404 |
Netherlands - 2.4% |
ASM International NV (Netherlands) (a)(c) | 9,400 | | 238,938 |
ING Groep NV sponsored ADR (a)(c) | 55,184 | | 541,355 |
Koninklijke Philips Electronics NV | 10,663 | | 314,774 |
TOTAL NETHERLANDS | | 1,095,067 |
Norway - 1.6% |
Pronova BioPharma ASA (a) | 154,000 | | 467,637 |
Sevan Marine ASA (a)(c) | 145,000 | | 254,177 |
TOTAL NORWAY | | 721,814 |
Qatar - 0.7% |
Commercial Bank of Qatar GDR (Reg. S) | 97,450 | | 330,779 |
Russia - 4.2% |
LSR Group OJSC GDR (Reg. S) (a) | 31,900 | | 290,290 |
Mechel Steel Group OAO sponsored ADR | 12,100 | | 227,722 |
Mosenergo AO sponsored ADR (a) | 23,800 | | 249,900 |
OAO Gazprom sponsored ADR | 17,700 | | 443,385 |
RusHydro JSC sponsored ADR (a) | 61,300 | | 234,779 |
Uralkali JSC GDR (Reg. S) (a) | 12,300 | | 258,300 |
VTB Bank JSC unit | 52,700 | | 248,744 |
TOTAL RUSSIA | | 1,953,120 |
South Africa - 1.9% |
MTN Group Ltd. | 19,900 | | 316,628 |
Naspers Ltd. Class N | 6,800 | | 275,304 |
Raubex Group Ltd. | 82,900 | | 268,390 |
TOTAL SOUTH AFRICA | | 860,322 |
Spain - 0.5% |
NH Hoteles SA (a) | 41,737 | | 222,280 |
Sweden - 0.9% |
EnergyO Solutions AB (a) | 80,410 | | 440,313 |
Switzerland - 2.3% |
Actelion Ltd. (Reg.) (a) | 5,965 | | 317,995 |
Clariant AG (Reg.) (a) | 20,534 | | 242,335 |
UBS AG (NY Shares) (a) | 33,600 | | 521,136 |
TOTAL SWITZERLAND | | 1,081,466 |
Common Stocks - continued |
| Shares | | Value |
Taiwan - 0.5% |
Prime View International Co. Ltd. (a) | 93,000 | | $ 244,783 |
Turkey - 0.5% |
Sinpas Gayrimenkul Yatirim Ortakligi AS | 155,000 | | 239,306 |
United Kingdom - 11.8% |
Anglo American PLC (United Kingdom) (a) | 9,500 | | 416,231 |
Barclays PLC Sponsored ADR (c) | 33,700 | | 593,120 |
BG Group PLC | 23,059 | | 418,134 |
BT Group PLC | 119,500 | | 260,404 |
Cairn Energy PLC (a) | 46,540 | | 250,167 |
Carphone Warehouse Group PLC | 78,997 | | 239,766 |
Centrica PLC | 68,711 | | 312,154 |
Ferrexpo PLC | 68,570 | | 219,977 |
HSBC Holdings PLC sponsored ADR | 14,800 | | 844,927 |
Rio Tinto PLC (Reg.) | 9,800 | | 529,480 |
Royal Dutch Shell PLC Class B | 26,687 | | 777,669 |
Vedanta Resources PLC | 6,200 | | 261,626 |
Xstrata PLC (a) | 19,900 | | 360,529 |
TOTAL UNITED KINGDOM | | 5,484,184 |
United States of America - 8.0% |
Bank of America Corp. | 29,900 | | 450,294 |
Citigroup, Inc. | 70,000 | | 231,700 |
CVS Caremark Corp. | 7,100 | | 228,691 |
Ener1, Inc. (a)(c) | 31,620 | | 200,471 |
JPMorgan Chase & Co. | 10,890 | | 453,786 |
Morgan Stanley | 15,516 | | 459,274 |
Pfizer, Inc. | 13,100 | | 238,289 |
PNC Financial Services Group, Inc. | 4,700 | | 248,113 |
Rubicon Technology, Inc. (a)(c) | 13,331 | | 270,753 |
Sprint Nextel Corp. (a) | 62,802 | | 229,855 |
Veeco Instruments, Inc. (a) | 7,726 | | 255,267 |
Wells Fargo & Co. | 17,014 | | 459,208 |
TOTAL UNITED STATES OF AMERICA | | 3,725,701 |
TOTAL COMMON STOCKS (Cost $41,520,688) | 45,786,612 |
Nonconvertible Preferred Stocks - 0.6% |
| Shares | | Value |
Italy - 0.6% |
Fiat SpA (Risparmio Shares)
(Cost $161,564) | 28,300 | | $ 255,046 |
Nonconvertible Bonds - 0.5% |
| Principal Amount | | |
Venezuela - 0.5% |
Petroleos de Venezuela SA 5.375% 4/12/27
(Cost $244,363) | | $ 540,000 | | 238,950 |
Money Market Funds - 5.5% |
| Shares | | |
Fidelity Securities Lending Cash Central Fund, 0.15% (b)(d)
(Cost $2,568,752) | 2,568,752 | | 2,568,752 |
TOTAL INVESTMENT PORTFOLIO - 105.5% (Cost $44,495,367) | | 48,849,360 |
NET OTHER ASSETS - (5.5)% | | (2,547,162) |
NET ASSETS - 100% | $ 46,302,198 |
Legend |
(a) Non-income producing |
(b) Investment made with cash collateral received from securities on loan. |
(c) Security or a portion of the security is on loan at period end. |
(d) Affiliated fund that is available only to investment companies and other accounts managed by Fidelity Investments. The rate quoted is the annualized seven-day yield of the fund at period end. A complete unaudited listing of the fund's holdings as of its most recent quarter end is available upon request. |
Affiliated Central Funds |
Information regarding fiscal year to date income earned by the Fund from investments in Fidelity Central Funds is as follows: |
Fund | Income earned |
Fidelity Cash Central Fund | $ 2,820 |
Fidelity Securities Lending Cash Central Fund | 48,608 |
Total | $ 51,428 |
Other Information |
The following is a summary of the inputs used, as of December 31, 2009, involving the Fund's assets and liabilities carried at value. The inputs or methodology used for valuing securities may not be an indication of the risk associated with investing in those securities. For more information on valuation inputs, and their aggregation into the levels used in the tables below, please refer to the Security Valuation section in the accompanying Notes to Financial Statements. |
Valuation Inputs at Reporting Date: |
Description | Total | Level 1 | Level 2 | Level 3 |
Investments in Securities: | | | | |
Equities: | | | | |
Japan | $ 6,906,976 | $ 795,696 | $ 6,111,280 | $ - |
United Kingdom | 5,484,184 | 3,916,631 | 1,567,553 | - |
United States of America | 3,725,701 | 3,725,701 | - | - |
France | 3,643,568 | 3,643,568 | - | - |
Canada | 3,242,747 | 3,242,747 | - | - |
Australia | 2,264,235 | 2,264,235 | - | - |
Russia | 1,953,120 | 1,703,220 | - | 249,900 |
India | 1,655,168 | 1,655,168 | - | - |
Korea (South) | 1,636,270 | 1,636,270 | - | - |
Other | 15,529,689 | 13,455,139 | 2,074,550 | - |
Corporate Bonds | 238,950 | - | 238,950 | - |
Money Market Funds | 2,568,752 | 2,568,752 | - | - |
Total Investments in Securities: | $ 48,849,360 | $ 38,607,127 | $ 9,992,333 | $ 249,900 |
The following is a reconciliation of Investments in Securities for which Level 3 inputs were used in determining value: |
Investments in Securities: | |
Beginning Balance | $ 561,490 |
Total Realized Gain (Loss) | (334,263) |
Total Unrealized Gain (Loss) | 197,849 |
Cost of Purchases | 1,261,798 |
Proceeds of Sales | (1,436,974) |
Amortization/Accretion | - |
Transfers in/out of Level 3 | - |
Ending Balance | $ 249,900 |
The change in unrealized gain (loss) for the period attributable to Level 3 securities held at December 31, 2009 | $ 3,668 |
The information used in the above reconciliation represents fiscal year to date activity for any Investments in Securities identified as using Level 3 inputs at either the beginning or the end of the current fiscal period. Transfers in or out of Level 3 represents either the beginning value (for transfers in), or the ending value (for transfers out) of any Security or Instrument where a change in the pricing level occurred from the beginning to the end of the period. Realized and unrealized gains (losses) disclosed in the reconciliation are included in Net Gain (Loss) on the Fund's Statement of Operations. |
Income Tax Information |
At December 31, 2009, the fund had a capital loss carryforward of approximately $24,891,544 of which $20,462,362 and $4,429,182 will expire on December 31, 2016 and 2017, respectively. |
See accompanying notes which are an integral part of the financial statements.
Annual Report
Financial Statements
Statement of Assets and Liabilities
| December 31, 2009 |
Assets | | |
Investment in securities, at value (including securities loaned of $2,458,778) - See accompanying schedule: Unaffiliated issuers (cost $41,926,615) | $ 46,280,608 | |
Fidelity Central Funds (cost $2,568,752) | 2,568,752 | |
Total Investments (cost $44,495,367) | | $ 48,849,360 |
Foreign currency held at value (cost $199,573) | | 199,573 |
Receivable for investments sold | | 1,295,846 |
Receivable for fund shares sold | | 33,791 |
Dividends receivable | | 61,270 |
Interest receivable | | 6,369 |
Distributions receivable from Fidelity Central Funds | | 5,198 |
Prepaid expenses | | 174 |
Receivable from investment adviser for expense reductions | | 26,218 |
Other receivables | | 77,913 |
Total assets | | 50,555,712 |
| | |
Liabilities | | |
Payable to custodian bank | $ 482,477 | |
Payable for investments purchased | 966,468 | |
Payable for fund shares redeemed | 99,825 | |
Accrued management fee | 27,194 | |
Distribution fees payable | 140 | |
Other affiliated payables | 6,438 | |
Other payables and accrued expenses | 102,220 | |
Collateral on securities loaned, at value | 2,568,752 | |
Total liabilities | | 4,253,514 |
| | |
Net Assets | | $ 46,302,198 |
Net Assets consist of: | | |
Paid in capital | | $ 67,952,331 |
Undistributed net investment income | | 277 |
Accumulated undistributed net realized gain (loss) on investments and foreign currency transactions | | (25,989,565) |
Net unrealized appreciation (depreciation) on investments and assets and liabilities in foreign currencies | | 4,339,155 |
Net Assets | | $ 46,302,198 |
Statement of Assets and Liabilities - continued
| December 31, 2009 |
Initial Class:
Net Asset Value, offering price and redemption price per share ($644,549 ÷ 74,965 shares) | | $ 8.60 |
| | |
Service Class:
Net Asset Value, offering price and redemption price per share ($117,060 ÷ 13,637 shares) | | $ 8.58 |
| | |
Service Class 2:
Net Asset Value, offering price and redemption price per share ($423,680 ÷ 49,456 shares) | | $ 8.57 |
| | |
Initial Class R:
Net Asset Value, offering price and redemption price per share ($17,150,356 ÷ 1,994,433 shares) | | $ 8.60 |
| | |
Service Class R:
Net Asset Value, offering price and redemption price per share ($117,060 ÷ 13,637 shares) | | $ 8.58 |
| | |
Service Class 2R:
Net Asset Value, offering price and redemption price per share ($154,866 ÷ 18,071 shares) | | $ 8.57 |
| | |
Investor Class R:
Net Asset Value, offering price and redemption price per share ($27,694,627 ÷ 3,234,722 shares) | | $ 8.56 |
See accompanying notes which are an integral part of the financial statements.
Annual Report
Statement of Operations
| Year ended December 31, 2009 |
| | |
Investment Income | | |
Dividends | | $ 607,663 |
Interest | | 14,760 |
Income from Fidelity Central Funds (including $48,608 from security lending) | | 51,428 |
| | 673,851 |
Less foreign taxes withheld | | (46,252) |
Total income | | 627,599 |
| | |
Expenses | | |
Management fee | $ 227,680 | |
Transfer agent fees | 50,577 | |
Distribution fees | 1,557 | |
Accounting and security lending fees | 16,901 | |
Custodian fees and expenses | 173,315 | |
Independent trustees' compensation | 206 | |
Audit | 60,404 | |
Legal | 174 | |
Miscellaneous | 2,758 | |
Total expenses before reductions | 533,572 | |
Expense reductions | (217,955) | 315,617 |
Net investment income (loss) | | 311,982 |
Realized and Unrealized Gain (Loss) Net realized gain (loss) on: | | |
Investment securities: | | |
Unaffiliated issuers (net of foreign taxes of $47,039) | 3,341,158 | |
Foreign currency transactions | (39,859) | |
Total net realized gain (loss) | | 3,301,299 |
Change in net unrealized appreciation (depreciation) on: Investment securities (net of increase in deferred foreign taxes of $29,237) | 9,544,911 | |
Assets and liabilities in foreign currencies | 5,608 | |
Total change in net unrealized appreciation (depreciation) | | 9,550,519 |
Net gain (loss) | | 12,851,818 |
Net increase (decrease) in net assets resulting from operations | | $ 13,163,800 |
Statement of Changes in Net Assets
| Year ended
December 31, 2009 | Year ended
December 31, 2008 |
Increase (Decrease) in Net Assets | | |
Operations | | |
Net investment income (loss) | $ 311,982 | $ 754,623 |
Net realized gain (loss) | 3,301,299 | (24,913,119) |
Change in net unrealized appreciation (depreciation) | 9,550,519 | (5,460,953) |
Net increase (decrease) in net assets resulting from operations | 13,163,800 | (29,619,449) |
Distributions to shareholders from net investment income | (317,347) | - |
Distributions to shareholders from net realized gain | (478,375) | (328,342) |
Total distributions | (795,722) | (328,342) |
Share transactions - net increase (decrease) | 10,098,658 | (20,630,488) |
Redemption fees | 6,920 | 5,532 |
Total increase (decrease) in net assets | 22,473,656 | (50,572,747) |
| | |
Net Assets | | |
Beginning of period | 23,828,542 | 74,401,289 |
End of period (including undistributed net investment income of $277 and undistributed net investment income of $5,642, respectively) | $ 46,302,198 | $ 23,828,542 |
See accompanying notes which are an integral part of the financial statements.
Annual Report
Financial Highlights - Initial Class
Years ended December 31, | 2009 | 2008 | 2007 | 2006 | 2005 |
Selected Per-Share Data | | | | | |
Net asset value, beginning of period | $ 5.61 | $ 11.44 | $ 12.68 | $ 11.46 | $ 10.24 |
Income from Investment Operations | | | | | |
Net investment income (loss) C | .07 | .15 | .11 F | .11 | .06 |
Net realized and unrealized gain (loss) | 3.07 | (5.92) | .53 | 1.54 | 1.21 |
Total from investment operations | 3.14 | (5.77) | .64 | 1.65 | 1.27 |
Distributions from net investment income | (.06) | - | (.09) | (.10) | (.02) |
Distributions from net realized gain | (.09) | (.06) | (1.79) | (.34) | (.02) |
Total distributions | (.15) | (.06) | (1.88) | (.43) J | (.05) I |
Redemption fees added to paid in capital C, H | - | - | - | - | - |
Net asset value, end of period | $ 8.60 | $ 5.61 | $ 11.44 | $ 12.68 | $ 11.46 |
Total Return A, B | 56.04% | (50.69)% | 5.17% | 14.49% | 12.37% |
Ratios to Average Net Assets D, G | | | | | |
Expenses before reductions | 1.81% | 1.54% | 1.20% | 1.80% | 3.55% |
Expenses net of fee waivers, if any | 1.10% | 1.10% | 1.10% | 1.10% | 1.10% |
Expenses net of all reductions | .93% | .91% | 1.07% | 1.00% | .91% |
Net investment income (loss) | 1.03% | 1.65% | .82% F | .95% | .53% |
Supplemental Data | | | | | |
Net assets, end of period (000 omitted) | $ 645 | $ 388 | $ 1,409 | $ 1,357 | $ 9,367 |
Portfolio turnover rate E | 416% | 350% | 224% | 185% | 176% |
A Total returns do not reflect charges attributable to your insurance company's separate account. Inclusion of these charges would reduce the total returns shown. B Total returns would have been lower had certain expenses not been reduced during the periods shown. C Calculated based on average shares outstanding during the period. D Fees and expenses of the underlying Fidelity Central Funds are not included in the Fund's expense ratio. The Fund indirectly bears its proportionate share of the expenses of any underlying Fidelity Central Funds. E Amount does not include the portfolio activity of any underlying Fidelity Central Funds. F Investment income per share reflects a special dividend which amounted to $.02 per share. Excluding the special dividend, the ratio of net investment income (loss) to average net assets would have been .68%. G Expense ratios reflect operating expenses of the class. Expenses before reductions do not reflect amounts reimbursed by the investment adviser or reductions from brokerage service arrangements or reductions from other expense offset arrangements and do not represent the amount paid by the class during periods when reimbursements or reductions occur. Expenses net of fee waivers reflect expenses after reimbursement by the investment adviser but prior to reductions from brokerage service arrangements or other expense offset arrangements. Expenses net of all reductions represent the net expenses paid by the class. H Amount represents less than $.01 per share. I Total distributions of $.05 per share is comprised of distributions from net investment income of $.022 and distributions from net realized gain of $.023 per share. J Total distributions of $.43 per share is comprised of distributions from net investment income of $.095 and distributions from net realized gain of $.335 per share. |
Financial Highlights - Service Class
Years ended December 31, | 2009 | 2008 | 2007 | 2006 | 2005 |
Selected Per-Share Data | | | | | |
Net asset value, beginning of period | $ 5.61 | $ 11.43 | $ 12.67 | $ 11.46 | $ 10.24 |
Income from Investment Operations | | | | | |
Net investment income (loss) C | .06 | .14 | .10 F | .10 | .10 |
Net realized and unrealized gain (loss) | 3.05 | (5.90) | .53 | 1.53 | 1.16 |
Total from investment operations | 3.11 | (5.76) | .63 | 1.63 | 1.26 |
Distributions from net investment income | (.05) | - | (.08) | (.08) | (.01) |
Distributions from net realized gain | (.09) | (.06) | (1.79) | (.34) | (.02) |
Total distributions | (.14) | (.06) | (1.87) | (.42) J | (.04) I |
Redemption fees added to paid in capital C, H | - | - | - | - | - |
Net asset value, end of period | $ 8.58 | $ 5.61 | $ 11.43 | $ 12.67 | $ 11.46 |
Total Return A, B | 55.52% | (50.64)% | 5.06% | 14.30% | 12.27% |
Ratios to Average Net Assets D, G | | | | | |
Expenses before reductions | 1.73% | 1.51% | 1.20% | 1.62% | 4.35% |
Expenses net of fee waivers, if any | 1.20% | 1.20% | 1.20% | 1.20% | 1.20% |
Expenses net of all reductions | 1.04% | 1.01% | 1.16% | 1.10% | 1.01% |
Net investment income (loss) | .92% | 1.55% | .72% F | .85% | .98% |
Supplemental Data | | | | | |
Net assets, end of period (000 omitted) | $ 117 | $ 135 | $ 414 | $ 394 | $ 345 |
Portfolio turnover rate E | 416% | 350% | 224% | 185% | 176% |
A Total returns do not reflect charges attributable to your insurance company's separate account. Inclusion of these charges would reduce the total returns shown. B Total returns would have been lower had certain expenses not been reduced during the periods shown. C Calculated based on average shares outstanding during the period. D Fees and expenses of the underlying Fidelity Central Funds are not included in the Fund's expense ratio. The Fund indirectly bears its proportionate share of the expenses of any underlying Fidelity Central Funds. E Amount does not include the portfolio activity of any underlying Fidelity Central Funds. F Investment income per share reflects a special dividend which amounted to $.02 per share. Excluding the special dividend, the ratio of net investment income (loss) to average net assets would have been .58%. G Expense ratios reflect operating expenses of the class. Expenses before reductions do not reflect amounts reimbursed by the investment adviser or reductions from brokerage service arrangements or reductions from other expense offset arrangements and do not represent the amount paid by the class during periods when reimbursements or reductions occur. Expenses net of fee waivers reflect expenses after reimbursement by the investment adviser but prior to reductions from brokerage service arrangements or other expense offset arrangements. Expenses net of all reductions represent the net expenses paid by the class. H Amount represents less than $.01 per share. I Total distributions of $.04 per share is comprised of distributions from net investment income of $.012 and distributions from net realized gain of $.023 per share. J Total distributions of $.42 per share is comprised of distributions from net investment income of $.084 and distributions from net realized gain of $.335 per share. |
See accompanying notes which are an integral part of the financial statements.
Annual Report
Financial Highlights - Service Class 2
Years ended December 31, | 2009 | 2008 | 2007 | 2006 | 2005 |
Selected Per-Share Data | | | | | |
Net asset value, beginning of period | $ 5.60 | $ 11.43 | $ 12.67 | $ 11.46 | $ 10.24 |
Income from Investment Operations | | | | | |
Net investment income (loss) C | .05 | .12 | .08 F | .08 | .09 |
Net realized and unrealized gain (loss) | 3.05 | (5.89) | .53 | 1.53 | 1.15 |
Total from investment operations | 3.10 | (5.77) | .61 | 1.61 | 1.24 |
Distributions from net investment income | (.04) | - | (.06) | (.07) | - |
Distributions from net realized gain | (.09) | (.06) | (1.79) | (.34) | (.02) |
Total distributions | (.13) | (.06) | (1.85) | (.40) J | (.02) I |
Redemption fees added to paid in capital C, H | - | - | - | - | - |
Net asset value, end of period | $ 8.57 | $ 5.60 | $ 11.43 | $ 12.67 | $ 11.46 |
Total Return A, B | 55.44% | (50.73)% | 4.89% | 14.14% | 12.12% |
Ratios to Average Net Assets D, G | | | | | |
Expenses before reductions | 2.02% | 1.79% | 1.41% | 1.77% | 4.50% |
Expenses net of fee waivers, if any | 1.35% | 1.35% | 1.35% | 1.35% | 1.35% |
Expenses net of all reductions | 1.19% | 1.16% | 1.32% | 1.25% | 1.16% |
Net investment income (loss) | .77% | 1.40% | .57% F | .70% | .83% |
Supplemental Data | | | | | |
Net assets, end of period (000 omitted) | $ 424 | $ 302 | $ 550 | $ 524 | $ 459 |
Portfolio turnover rate E | 416% | 350% | 224% | 185% | 176% |
A Total returns do not reflect charges attributable to your insurance company's separate account. Inclusion of these charges would reduce the total returns shown. B Total returns would have been lower had certain expenses not been reduced during the periods shown. C Calculated based on average shares outstanding during the period. D Fees and expenses of the underlying Fidelity Central Funds are not included in the Fund's expense ratio. The Fund indirectly bears its proportionate share of the expenses of any underlying Fidelity Central Funds. E Amount does not include the portfolio activity of any underlying Fidelity Central Funds. F Investment income per share reflects a special dividend which amounted to $.02 per share. Excluding the special dividend, the ratio of net investment income (loss) to average net assets would have been .43%. G Expense ratios reflect operating expenses of the class. Expenses before reductions do not reflect amounts reimbursed by the investment adviser or reductions from brokerage service arrangements or reductions from other expense offset arrangements and do not represent the amount paid by the class during periods when reimbursements or reductions occur. Expenses net of fee waivers reflect expenses after reimbursement by the investment adviser but prior to reductions from brokerage service arrangements or other expense offset arrangements. Expenses net of all reductions represent the net expenses paid by the class. H Amount represents less than $.01 per share. I Total distributions of $.02 per share is comprised of distributions from net investment income of $.000 and distributions from net realized gain of $.020 per share. J Total distributions of $.40 per share is comprised of distributions from net investment income of $.066 and distributions from net realized gain of $.335 per share. |
Financial Highlights - Initial Class R
Years ended December 31, | 2009 | 2008 | 2007 | 2006 | 2005 |
Selected Per-Share Data | | | | | |
Net asset value, beginning of period | $ 5.62 | $ 11.44 | $ 12.68 | $ 11.46 | $ 10.24 |
Income from Investment Operations | | | | | |
Net investment income (loss) C | .07 | .15 | .11 F | .11 | .11 |
Net realized and unrealized gain (loss) | 3.06 | (5.91) | .53 | 1.54 | 1.16 |
Total from investment operations | 3.13 | (5.76) | .64 | 1.65 | 1.27 |
Distributions from net investment income | (.06) | - | (.09) | (.10) | (.02) |
Distributions from net realized gain | (.09) | (.06) | (1.79) | (.34) | (.02) |
Total distributions | (.15) | (.06) | (1.88) | (.43) J | (.05) I |
Redemption fees added to paid in capital C, H | - | - | - | - | - |
Net asset value, end of period | $ 8.60 | $ 5.62 | $ 11.44 | $ 12.68 | $ 11.46 |
Total Return A, B | 55.76% | (50.60)% | 5.17% | 14.50% | 12.37% |
Ratios to Average Net Assets D, G | | | | | |
Expenses before reductions | 1.60% | 1.44% | 1.11% | 1.46% | 4.25% |
Expenses net of fee waivers, if any | 1.10% | 1.10% | 1.10% | 1.10% | 1.10% |
Expenses net of all reductions | .93% | .91% | 1.06% | 1.00% | .91% |
Net investment income (loss) | 1.02% | 1.65% | .82% F | .95% | 1.08% |
Supplemental Data | | | | | |
Net assets, end of period (000 omitted) | $ 17,150 | $ 8,483 | $ 32,345 | $ 17,219 | $ 345 |
Portfolio turnover rate E | 416% | 350% | 224% | 185% | 176% |
A Total returns do not reflect charges attributable to your insurance company's separate account. Inclusion of these charges would reduce the total returns shown. B Total returns would have been lower had certain expenses not been reduced during the periods shown. C Calculated based on average shares outstanding during the period. D Fees and expenses of the underlying Fidelity Central Funds are not included in the Fund's expense ratio. The Fund indirectly bears its proportionate share of the expenses of any underlying Fidelity Central Funds. E Amount does not include the portfolio activity of any underlying Fidelity Central Funds. F Investment income per share reflects a special dividend which amounted to $.02 per share. Excluding the special dividend, the ratio of net investment income (loss) to average net assets would have been .68%. G Expense ratios reflect operating expenses of the class. Expenses before reductions do not reflect amounts reimbursed by the investment adviser or reductions from brokerage service arrangements or reductions from other expense offset arrangements and do not represent the amount paid by the class during periods when reimbursements or reductions occur. Expenses net of fee waivers reflect expenses after reimbursement by the investment adviser but prior to reductions from brokerage service arrangements or other expense offset arrangements. Expenses net of all reductions represent the net expenses paid by the class. H Amount represents less than $.01 per share. I Total distributions of $.05 per share is comprised of distributions from net investment income of $.022 and distributions from net realized gain of $.023 per share. J Total distributions of $.43 per share is comprised of distributions from net investment income of $.096 and distributions from net realized gain of $.335 per share. |
See accompanying notes which are an integral part of the financial statements.
Annual Report
Financial Highlights - Service Class R
Years ended December 31, | 2009 | 2008 | 2007 | 2006 | 2005 |
Selected Per-Share Data | | | | | |
Net asset value, beginning of period | $ 5.61 | $ 11.43 | $ 12.67 | $ 11.46 | $ 10.24 |
Income from Investment Operations | | | | | |
Net investment income (loss) C | .06 | .14 | .10 F | .10 | .10 |
Net realized and unrealized gain (loss) | 3.05 | (5.90) | .53 | 1.53 | 1.16 |
Total from investment operations | 3.11 | (5.76) | .63 | 1.63 | 1.26 |
Distributions from net investment income | (.05) | - | (.08) | (.08) | (.01) |
Distributions from net realized gain | (.09) | (.06) | (1.79) | (.34) | (.02) |
Total distributions | (.14) | (.06) | (1.87) | (.42) J | (.04) I |
Redemption fees added to paid in capital C, H | - | - | - | - | - |
Net asset value, end of period | $ 8.58 | $ 5.61 | $ 11.43 | $ 12.67 | $ 11.46 |
Total Return A, B | 55.52% | (50.64)% | 5.06% | 14.30% | 12.27% |
Ratios to Average Net Assets D, G | | | | | |
Expenses before reductions | 1.73% | 1.51% | 1.20% | 1.62% | 4.35% |
Expenses net of fee waivers, if any | 1.20% | 1.20% | 1.20% | 1.20% | 1.20% |
Expenses net of all reductions | 1.04% | 1.01% | 1.16% | 1.10% | 1.01% |
Net investment income (loss) | .92% | 1.55% | .72% F | .85% | .98% |
Supplemental Data | | | | | |
Net assets, end of period (000 omitted) | $ 117 | $ 135 | $ 414 | $ 394 | $ 345 |
Portfolio turnover rate E | 416% | 350% | 224% | 185% | 176% |
A Total returns do not reflect charges attributable to your insurance company's separate account. Inclusion of these charges would reduce the total returns shown. B Total returns would have been lower had certain expenses not been reduced during the periods shown. C Calculated based on average shares outstanding during the period. D Fees and expenses of the underlying Fidelity Central Funds are not included in the Fund's expense ratio. The Fund indirectly bears its proportionate share of the expenses of any underlying Fidelity Central Funds. E Amount does not include the portfolio activity of any underlying Fidelity Central Funds. F Investment income per share reflects a special dividend which amounted to $.02 per share. Excluding the special dividend, the ratio of net investment income (loss) to average net assets would have been .58%. G Expense ratios reflect operating expenses of the class. Expenses before reductions do not reflect amounts reimbursed by the investment adviser or reductions from brokerage service arrangements or reductions from other expense offset arrangements and do not represent the amount paid by the class during periods when reimbursements or reductions occur. Expenses net of fee waivers reflect expenses after reimbursement by the investment adviser but prior to reductions from brokerage service arrangements or other expense offset arrangements. Expenses net of all reductions represent the net expenses paid by the class. H Amount represents less than $.01 per share. I Total distributions of $.04 per share is comprised of distributions from net investment income of $.012 and distributions from net realized gain of $.023 per share. J Total distributions of $.42 per share is comprised of distributions from net investment income of $.084 and distributions from net realized gain of $.335 per share. |
Financial Highlights - Service Class 2R
Years ended December 31, | 2009 | 2008 | 2007 | 2006 | 2005 |
Selected Per-Share Data | | | | | |
Net asset value, beginning of period | $ 5.60 | $ 11.43 | $ 12.67 | $ 11.46 | $ 10.24 |
Income from Investment Operations | | | | | |
Net investment income (loss) C | .05 | .13 | .08 F | .08 | .09 |
Net realized and unrealized gain (loss) | 3.05 | (5.90) | .53 | 1.53 | 1.15 |
Total from investment operations | 3.10 | (5.77) | .61 | 1.61 | 1.24 |
Distributions from net investment income | (.04) | - | (.06) | (.07) | - |
Distributions from net realized gain | (.09) | (.06) | (1.79) | (.34) | (.02) |
Total distributions | (.13) | (.06) | (1.85) | (.40) J | (.02) I |
Redemption fees added to paid in capital C, H | - | - | - | - | - |
Net asset value, end of period | $ 8.57 | $ 5.60 | $ 11.43 | $ 12.67 | $ 11.46 |
Total Return A, B | 55.36% | (50.73)% | 4.90% | 14.14% | 12.12% |
Ratios to Average Net Assets D, G | | | | | |
Expenses before reductions | 1.87% | 1.66% | 1.35% | 1.77% | 4.50% |
Expenses net of fee waivers, if any | 1.35% | 1.35% | 1.35% | 1.35% | 1.35% |
Expenses net of all reductions | 1.19% | 1.16% | 1.31% | 1.25% | 1.16% |
Net investment income (loss) | .77% | 1.40% | .57% F | .70% | .83% |
Supplemental Data | | | | | |
Net assets, end of period (000 omitted) | $ 155 | $ 179 | $ 550 | $ 524 | $ 459 |
Portfolio turnover rate E | 416% | 350% | 224% | 185% | 176% |
A Total returns do not reflect charges attributable to your insurance company's separate account. Inclusion of these charges would reduce the total returns shown. B Total returns would have been lower had certain expenses not been reduced during the periods shown. C Calculated based on average shares outstanding during the period. D Fees and expenses of the underlying Fidelity Central Funds are not included in the Fund's expense ratio. The Fund indirectly bears its proportionate share of the expenses of any underlying Fidelity Central Funds. E Amount does not include the portfolio activity of any underlying Fidelity Central Funds. F Investment income per share reflects a special dividend which amounted to $.02 per share. Excluding the special dividend, the ratio of net investment income (loss) to average net assets would have been .43%. G Expense ratios reflect operating expenses of the class. Expenses before reductions do not reflect amounts reimbursed by the investment adviser or reductions from brokerage service arrangements or reductions from other expense offset arrangements and do not represent the amount paid by the class during periods when reimbursements or reductions occur. Expenses net of fee waivers reflect expenses after reimbursement by the investment adviser but prior to reductions from brokerage service arrangements or other expense offset arrangements. Expenses net of all reductions represent the net expenses paid by the class. H Amount represents less than $.01 per share. I Total distributions of $.02 per share is comprised of distributions from net investment income of $.000 and distributions from net realized gain of $.020 per share. J Total distributions of $.40 per share is comprised of distributions from net investment income of $.066 and distributions from net realized gain of $.335 per share. |
See accompanying notes which are an integral part of the financial statements.
Annual Report
Financial Highlights - Investor Class R
Years ended December 31, | 2009 | 2008 | 2007 | 2006 | 2005 I |
Selected Per-Share Data | | | | | |
Net asset value, beginning of period | $ 5.60 | $ 11.41 | $ 12.65 | $ 11.46 | $ 10.32 |
Income from Investment Operations | | | | | |
Net investment income (loss) E | .07 | .14 | .09 H | .09 | .01 |
Net realized and unrealized gain (loss) | 3.04 | (5.89) | .54 | 1.53 | 1.16 |
Total from investment operations | 3.11 | (5.75) | .63 | 1.62 | 1.17 |
Distributions from net investment income | (.06) | - | (.08) | (.10) | (.02) |
Distributions from net realized gain | (.09) | (.06) | (1.79) | (.34) | (.01) |
Total distributions | (.15) | (.06) | (1.87) | (.43) M | (.03) L |
Redemption fees added to paid in capital E, K | - | - | - | - | - |
Net asset value, end of period | $ 8.56 | $ 5.60 | $ 11.41 | $ 12.65 | $ 11.46 |
Total Return B, C, D | 55.61% | (50.65)% | 5.07% | 14.23% | 11.39% |
Ratios to Average Net Assets F, J | | | | | |
Expenses before reductions | 1.68% | 1.51% | 1.22% | 1.61% | 2.19% A |
Expenses net of fee waivers, if any | 1.18% | 1.17% | 1.22% | 1.25% | 1.25% A |
Expenses net of all reductions | 1.01% | .97% | 1.18% | 1.15% | 1.06% A |
Net investment income (loss) | .94% | 1.59% | .71% H | .80% | .31% A |
Supplemental Data | | | | | |
Net assets, end of period (000 omitted) | $ 27,695 | $ 14,208 | $ 38,719 | $ 24,505 | $ 9,810 |
Portfolio turnover rate G | 416% | 350% | 224% | 185% | 176% |
A Annualized B Total returns for periods of less than one year are not annualized. C Total returns do not reflect charges attributable to your insurance company's separate account. Inclusion of these charges would reduce the total returns shown. D Total returns would have been lower had certain expenses not been reduced during the periods shown. E Calculated based on average shares outstanding during the period. F Fees and expenses of the underlying Fidelity Central Funds are not included in the Fund's expense ratio. The Fund indirectly bears its proportionate share of the expenses of any underlying Fidelity Central Funds. G Amount does not include the portfolio activity of any underlying Fidelity Central Funds. H Investment income per share reflects a special dividend which amounted to $.02 per share. Excluding the special dividend, the ratio of net investment income (loss) to average net assets would have been .57%. I For the period July 21, 2005 (commencement of sale of shares) to December 31, 2005. J Expense ratios reflect operating expenses of the class. Expenses before reductions do not reflect amounts reimbursed by the investment adviser or reductions from brokerage service arrangements or reductions from other expense offset arrangements and do not represent the amount paid by the class during periods when reimbursements or reductions occur. Expense ratios before reductions for start-up periods may not be representative of longer-term operating periods. Expenses net of fee waivers reflect expenses after reimbursement by the investment adviser but prior to reductions from brokerage service arrangements or other expense offset arrangements. Expenses net of all reductions represent the net expenses paid by the class. K Amount represents less than $.01 per share. L Total distributions of $.03 per share is comprised of distributions from net investment income of $.022 and distributions from net realized gain of $.013 per share. M Total distributions of $.43 per share is comprised of distributions from net investment income of $.095 and distributions from net realized gain of $.335 per share. |
See accompanying notes which are an integral part of the financial statements.
Annual Report
Notes to Financial Statements
For the period ended December 31, 2009
1. Organization.
VIP International Capital Appreciation Portfolio (the Fund) is a fund of Variable Insurance Products Fund IV (the trust) and is authorized to issue an unlimited number of shares. The trust is registered under the Investment Company Act of 1940, as amended (the 1940 Act), as an open-end management investment company organized as a Massachusetts business trust. Shares of the Fund may only be purchased by insurance companies for the purpose of funding variable annuity or variable life insurance contracts. The Fund offers the following classes of shares: Initial Class shares, Service Class shares, Service Class 2 shares, Initial Class R shares, Service Class R shares, Service Class 2R shares, and Investor Class R shares. All classes have equal rights and voting privileges, except for matters affecting a single class. Investment income, realized and unrealized capital gains and losses, the common expenses of the Fund, and certain fund-level expense reductions, if any, are allocated on a pro-rata basis to each class based on the relative net assets of each class to the total net assets of the Fund. Each class differs with respect to transfer agent and distribution and service plan fees incurred. Certain expense reductions also differ by class. The Fund's investments in emerging markets can be subject to social, economic, regulatory, and political uncertainties and can be extremely volatile.
2. Investments in Fidelity Central Funds.
The Fund may invest in Fidelity Central Funds, which are open-end investment companies available only to other investment companies and accounts managed by Fidelity Management & Research Company (FMR) and its affiliates. The Fund's Schedule of Investments lists each of the Fidelity Central Funds held as of period end, if any, as an investment of the Fund, but does not include the underlying holdings of each Fidelity Central Fund. As an Investing Fund, the Fund indirectly bears its proportionate share of the expenses of the underlying Fidelity Central Funds.
The Money Market Central Funds seek preservation of capital and current income and are managed by Fidelity Investments Money Management, Inc. (FIMM), an affiliate of FMR.
A complete unaudited list of holdings for each Fidelity Central Fund is available upon request or at the Securities and Exchange Commission (the SEC) web site at www.sec.gov. In addition, the financial statements of the Fidelity Central Funds, which are not covered by the Fund's Report of Independent Registered Public Accounting Firm, are available on the SEC web site or upon request.
3. Significant Accounting Policies.
The financial statements have been prepared in conformity with accounting principles generally accepted in the United States of America, which require management to make certain estimates and assumptions at the date of the financial statements. Actual results could differ from those estimates. Events or transactions occurring after period end through the date that the financial statements were issued, February 12, 2010, have been evaluated in the preparation of the financial statements. The following summarizes the significant accounting policies of the Fund:
Security Valuation. Investments are valued as of 4:00 p.m. Eastern time on the last calendar day of the period. The Fund uses independent pricing services approved by the Board of Trustees to value its investments. When current market prices or quotations are not readily available or reliable, valuations may be determined in good faith in accordance with procedures adopted by the Board of Trustees. Factors used in determining value may include significant market or security specific events, changes in interest rates and credit quality. The frequency with which these procedures are used cannot be predicted and may be utilized to a significant extent. The value used for net asset value (NAV) calculation under these procedures may differ from published prices for the same securities.
The Fund categorizes the inputs to valuation techniques used to value its investments into a disclosure hierarchy consisting of three levels as shown below.
Level 1 - quoted prices in active markets for identical investments
Level 2 - other significant observable inputs (including quoted prices for similar investments, interest rates, prepayment speeds, etc.)
Level 3 - unobservable inputs (including the fund's own assumptions based on the best information available)
Changes in valuation techniques may result in transfers in or out of an assigned level within the disclosure hierarchy. The aggregate value of investments by input level, as of December 31, 2009, as well as a roll forward of Level 3 securities, is included at the end of the Fund's Schedule of Investments. Valuation techniques used to value the Fund's investments by major category are as follows.
Equity securities, including restricted securities, for which market quotations are readily available, are valued at the last reported sale price or official closing price as reported by an independent pricing service on the primary market or exchange on which they are traded and are categorized as level 1 in the hierarchy. In the event there were no sales during the day or closing prices are not available, securities are valued at the last quoted bid price or may be valued using the last available price and categorized as Level 2 in the hierarchy. For foreign equity securities, when significant market or security events arise, comparisons to the valuation of American Depository Receipts (ADRs), futures contracts, exchange-traded funds (ETFs) and certain indexes as well as quoted prices for similar securities are used and are categorized as Level 2 in the hierarchy in these circumstances.
Annual Report
3. Significant Accounting Policies - continued
Security Valuation - continued
For restricted securities and private placements where observable inputs are limited, assumptions about market activity and risk are used and are categorized as level 3 in the hierarchy.
Debt securities, including restricted securities, are valued based on evaluated quotations received from independent pricing services or from dealers who make markets in such securities. For corporate bonds and preferred securities, pricing services utilize matrix pricing which considers yield or price of bonds of comparable quality, coupon, maturity and type as well as dealer supplied prices and are generally categorized as Level 2 in the hierarchy.
Investments in open-end mutual funds including the Fidelity Money Market Central Funds are valued at their closing net asset value each business day and are categorized as Level 1 in the hierarchy. Short-term securities with remaining maturities of sixty days or less for which quotations are not readily available are valued at amortized cost, which approximates value and are categorized as level 2 in the hierarchy.
When independent prices are unavailable or unreliable, debt securities may be valued utilizing pricing matrices which consider similar factors that would be used by independent pricing services. These are generally categorized as Level 2 in the hierarchy but may be Level 3 depending on the circumstances.
Foreign Currency. The Fund uses foreign currency contracts to facilitate transactions in foreign-denominated securities. Losses from these transactions may arise from changes in the value of the foreign currency or if the counterparties do not perform under the contracts' terms.
Foreign-denominated assets, including investment securities, and liabilities are translated into U.S. dollars at the exchange rate at period end. Purchases and sales of investment securities, income and dividends received and expenses denominated in foreign currencies are translated into U.S. dollars at the exchange rate in effect on the transaction date.
The effects of exchange rate fluctuations on investments are included with the net realized and unrealized gain (loss) on investment securities. Other foreign currency transactions resulting in realized and unrealized gain (loss) are disclosed separately.
Investment Transactions and Income. For financial reporting purposes, the Fund's investment holdings and NAV include trades executed through the end of the last business day of the period. The NAV per share for processing shareholder transactions is calculated as of the close of business of the New York Stock Exchange (NYSE), normally 4:00 p.m. Eastern time and includes trades executed through the end of the prior business day. Gains and losses on securities sold are determined on the basis of identified cost. Dividend income is recorded on the ex-dividend date, except for certain dividends from foreign securities where the ex-dividend date may have passed, which are recorded as soon as the Fund is informed of the ex-dividend date. Non-cash dividends included in dividend income, if any, are recorded at the fair market value of the securities received. Interest income and distributions from the Fidelity Central Funds are accrued as earned. Interest income includes coupon interest and amortization of premium and accretion of discount on debt securities. Investment income is recorded net of foreign taxes withheld where recovery of such taxes is uncertain.
Expenses. Most expenses of the trust can be directly attributed to a fund. Expenses which cannot be directly attributed are apportioned among each Fund in the trust. Expense estimates are accrued in the period to which they relate and adjustments are made when actual amounts are known.
Income Tax Information and Distributions to Shareholders. Each year, the Fund intends to qualify as a regulated investment company by distributing substantially all of its taxable income and realized gains under Subchapter M of the Internal Revenue Code and filing its U.S. federal tax return. As a result, no provision for income taxes is required. As of December 31, 2009, the Fund did not have any unrecognized tax benefits in the accompanying financial statements. A Fund's federal tax return is subject to examination by the Internal Revenue Service (IRS) for a period of three years. Foreign taxes are provided for based on the Fund's understanding of the tax rules and rates that exist in the foreign markets in which it invests. The Fund is subject to a tax imposed on short term capital gains on securities of certain issuers domiciled in India. The Fund records an estimated deferred tax liability included in Other payables and accrued expenses in the accompanying Statement of Assets & Liabilities for net unrealized gains on these securities in an amount that would be payable if the securities were disposed of at period end.
Distributions are recorded on the ex-dividend date. Income dividends and capital gain distributions are declared separately for each class. Income and capital gain distributions are determined in accordance with income tax regulations, which may differ from generally accepted accounting principles.
Capital accounts within the financial statements are adjusted for permanent book-tax differences. These adjustments have no impact on net assets or the results of operations. Temporary book-tax differences will reverse in a subsequent period.
Book-tax differences are primarily due to the short-term gain distributions from the Fidelity Central Funds, foreign currency transactions, certain foreign taxes, passive foreign investment companies (PFIC), market discount, capital loss carryforwards, losses deferred due to wash sales and excise tax regulations.
Annual Report
Notes to Financial Statements - continued
3. Significant Accounting Policies - continued
Income Tax Information and Distributions to Shareholders - continued
The federal tax cost of investment securities and unrealized appreciation (depreciation) as of period end were as follows:
Gross unrealized appreciation | $ 4,712,993 |
Gross unrealized depreciation | (1,558,899) |
Net unrealized appreciation (depreciation) | $ 3,154,094 |
| |
Tax Cost | $ 45,695,266 |
The tax-based components of distributable earnings as of period end were as follows:
Undistributed ordinary income | $ 156,557 |
Capital loss carryforward | $ (24,891,544) |
Net unrealized appreciation (depreciation) | $ 3,151,694 |
The tax character of distributions paid was as follows:
| December 31, 2009 | December 31, 2008 |
Ordinary Income | $ 795,722 | $ 298,493 |
Long-term Capital Gains | - | 29,849 |
Total | $ 795,722 | $ 328,342 |
Trading (Redemption) Fees. Initial Class R shares, Service Class R shares, Service Class 2 R shares and Investor Class R shares held less than 60 days are subject to a redemption fee equal to 1% of the proceeds of the redeemed shares. All redemption fees, including any estimated redemption fees paid by FMR, are retained by the Fund and accounted for as an addition to paid in capital.
4. Purchases and Sales of Investments.
Purchases and sales of securities, other than short-term securities, aggregated $140,336,573 and $130,418,389, respectively.
5. Fees and Other Transactions with Affiliates.
Management Fee. FMR and its affiliates provide the Fund with investment management related services for which the Fund pays a monthly management fee. The management fee is the sum of an individual fund fee rate that is based on an annual rate of .45% of the Fund's average net assets and a group fee rate that averaged .26% during the period. The group fee rate is based upon the average net assets of all the mutual funds advised by FMR. The group fee rate decreases as assets under management increase and increases as assets under management decrease. For the period, the total annual management fee rate was .71% of the Fund's average net assets.
Distribution and Service Plan. In accordance with Rule 12b-1 of the 1940 Act, the Fund has adopted separate 12b-1 Plans for each Service Class of shares. Each Service Class pays Fidelity Distributors Corporation (FDC), an affiliate of FMR, a service fee. For the period, the service fee is based on an annual rate of .10% of Service Class' and Service Class R's average net assets and .25% of Service Class 2's and Service Class 2R's average net assets.
For the period, each class paid FDC the following amounts, all of which were re-allowed to insurance companies for the distribution of shares and providing shareholder support services:
Service Class | $ 122 |
Service Class 2 | 903 |
Service Class R | 122 |
Service Class 2 R | 410 |
| $ 1,557 |
Annual Report
5. Fees and Other Transactions with Affiliates - continued
Transfer Agent Fees. Fidelity Investments Institutional Operations Company, Inc. (FIIOC), an affiliate of FMR, is the Fund's transfer, dividend disbursing, and shareholder servicing agent. FIIOC receives an asset-based fee with respect to each class. Each class (with the exception of Investor Class R) pays a transfer agent fee, excluding out of pocket expenses, equal to an annual rate of .07% of average net assets. Investor Class R pays a monthly asset-based transfer agent fee of .15% of average net assets. The total transfer agent fees paid by each class to FIIOC, including out of pocket expenses, were as follows:
Initial Class | $ 1,453 |
Service Class | 173 |
Service Class 2 | 990 |
Initial Class R | 12,248 |
Service Class R | 173 |
Service Class 2R | 202 |
Investor Class R | 35,338 |
| $ 50,577 |
Accounting and Security Lending Fees. Fidelity Service Company, Inc. (FSC), an affiliate of FMR, maintains the Fund's accounting records. The accounting fee is based on the level of average net assets for the month. Under a separate contract, FSC administers the security lending program. The security lending fee is based on the number and duration of lending transactions.
Brokerage Commissions. The Fund placed a portion of its portfolio transactions with brokerage firms which are affiliates of the investment adviser. The commissions paid to these affiliated firms were $1,746 for the period.
6. Committed Line of Credit.
The Fund participates with other funds managed by FMR in a $3.5 billion credit facility (the "line of credit") to be utilized for temporary or emergency purposes to fund shareholder redemptions or for other short-term liquidity purposes. The Fund has agreed to pay commitment fees on its pro-rata portion of the line of credit, which amounted to $136 and is reflected in Miscellaneous Expense on the Statement of Operations. During the period, there were no borrowings on this line of credit.
7. Security Lending.
The Fund lends portfolio securities from time to time in order to earn additional income. On the settlement date of the loan, the Fund receives collateral (in the form of U.S. Treasury obligations, letters of credit and/or cash) against the loaned securities and maintains collateral in an amount not less than 100% of the market value of the loaned securities during the period of the loan. The market value of the loaned securities is determined at the close of business of the Fund and any additional required collateral is delivered to the Fund on the next business day. If the borrower defaults on its obligation to return the securities loaned because of insolvency or other reasons, a fund could experience delays and costs in recovering the securities loaned or in gaining access to the collateral. Any cash collateral received is invested in the Fidelity Securities Lending Cash Central Fund. The value of loaned securities and cash collateral at period end are disclosed on the Fund's Statement of Assets and Liabilities. Security lending income represents the income earned on investing cash collateral, less fees and expenses associated with the loan, plus any premium payments that may be received on the loan of certain types of securities. Security lending income is presented in the Statement of Operations as a component of income from Fidelity Central Funds.
8. Expense Reductions.
FMR voluntarily agreed to reimburse each class to the extent annual operating expenses exceeded certain levels of average net assets as noted in the table below. Some expenses, for example interest expense, including commitment fees, are excluded from this reimbursement.
Annual Report
Notes to Financial Statements - continued
8. Expense Reductions - continued
The following classes were in reimbursement during the period:
| Expense
Limitations | Reimbursement
from adviser |
Initial Class | 1.10% | $ 3,335 |
Service Class | 1.20% | 653 |
Service Class 2 | 1.35% | 2,404 |
Initial Class R | 1.10% | 60,024 |
Service Class R | 1.20% | 653 |
Service Class 2R | 1.35% | 840 |
Investor Class R | 1.18% | 95,877 |
| | $ 163,786 |
Many of the brokers with whom FMR places trades on behalf of the Fund provided services to the Fund in addition to trade execution. These services included payments of certain expenses on behalf of the Fund totaling $54,039 for the period. In addition, through arrangements with the Fund's custodian, credits realized as a result of uninvested cash balances were used to reduce the Fund's expenses. During the period, these credits reduced the Fund's custody expenses by $130.
9. Distributions to Shareholders.
Distributions to shareholders of each class were as follows:
Years ended December 31, | 2009 | 2008 |
From net investment income | | |
Initial Class | $ 4,242 | $ - |
Service Class | 684 | - |
Service Class 2 | 1,982 | - |
Initial Class R | 119,072 | - |
Service Class R | 684 | - |
Service Class 2R | 659 | - |
Investor Class R | 190,024 | - |
Total | $ 317,347 | $ - |
From net realized gain | | |
Initial Class | $ 6,363 | $ 6,626 |
Service Class | 1,207 | 1,993 |
Service Class 2 | 4,350 | 2,646 |
Initial Class R | 178,610 | 134,858 |
Service Class R | 1,207 | 1,993 |
Service Class 2R | 1,602 | 2,646 |
Investor Class R | 285,036 | 177,580 |
Total | $ 478,375 | $ 328,342 |
10. Share Transactions.
Transactions for each class of shares were as follows:
| Shares | Dollars |
Years ended December 31, | 2009 | 2008 | 2009 | 2008 |
Initial Class | | | | |
Shares sold | 23,291 | 30,908 | $ 165,986 | $ 260,134 |
Reinvestment of distributions | 1,265 | 672 | 10,605 | 6,626 |
Shares redeemed | (18,636) | (85,732) | (107,450) | (731,294) |
Net increase (decrease) | 5,920 | (54,152) | $ 69,141 | $ (464,534) |
Service Class | | | | |
Reinvestment of distributions | 226 | 202 | 1,891 | 1,993 |
Shares redeemed | (10,639) | (12,389) | (71,691) | (90,726) |
Net increase (decrease) | (10,413) | (12,187) | $ (69,800) | $ (88,733) |
10. Share Transactions - continued
Annual Report
| Shares | Dollars |
Years ended December 31, | 2009 | 2008 | 2009 | 2008 |
Service Class 2 | | | | |
Shares sold | 19,605 | 29,552 | $ 124,280 | $ 262,678 |
Reinvestment of distributions | 758 | 269 | 6,332 | 2,646 |
Shares redeemed | (24,845) | (23,991) | (158,018) | (171,548) |
Net increase (decrease) | (4,482) | 5,830 | $ (27,406) | $ 93,776 |
Initial Class R | | | | |
Shares sold | 897,081 | 148,524 | $ 6,785,884 | $ 1,413,988 |
Reinvestment of distributions | 35,523 | 13,677 | 297,682 | 134,858 |
Shares redeemed | (448,753) | (1,478,974) | (2,964,977) | (13,970,732) |
Net increase (decrease) | 483,851 | (1,316,773) | $ 4,118,589 | $ (12,421,886) |
Service Class R | | | | |
Reinvestment of distributions | 226 | 202 | 1,891 | 1,993 |
Shares redeemed | (10,639) | (12,389) | (71,691) | (90,726) |
Net increase (decrease) | (10,413) | (12,187) | $ (69,800) | $ (88,733) |
Service Class 2R | | | | |
Reinvestment of distributions | 271 | 269 | 2,261 | 2,646 |
Shares redeemed | (14,127) | (16,453) | (94,930) | (120,308) |
Net increase (decrease) | (13,856) | (16,184) | $ (92,669) | $ (117,662) |
Investor Class R | | | | |
Shares sold | 1,164,413 | 176,104 | $ 9,035,456 | $ 1,598,648 |
Reinvestment of distributions | 56,962 | 18,065 | 475,060 | 177,580 |
Shares redeemed | (525,663) | (1,048,997) | (3,339,913) | (9,318,944) |
Net increase (decrease) | 695,712 | (854,828) | $ 6,170,603 | $ (7,542,716) |
11. Other.
The Fund's organizational documents provide former and current trustees and officers with a limited indemnification against liabilities arising in connection with the performance of their duties to the Fund. In the normal course of business, the Fund may also enter into contracts that provide general indemnifications. The Fund's maximum exposure under these arrangements is unknown as this would be dependent on future claims that may be made against the Fund. The risk of material loss from such claims is considered remote.
At the end of the period, FMR or its affiliates were the owners of record of 98% of the total outstanding shares of the Fund.
Annual Report
Report of Independent Registered Public Accounting Firm
To the Trustees of Variable Insurance Products Fund IV and the Shareholders of VIP International Capital Appreciation Portfolio:
In our opinion, the accompanying statement of assets and liabilities, including the schedule of investments, and the related statements of operations and of changes in net assets and the financial highlights present fairly, in all material respects, the financial position of VIP International Capital Appreciation Portfolio (a fund of Variable Insurance Products Fund IV) at December 31, 2009, the results of its operations for the year then ended, the changes in its net assets for each of the two years in the period then ended and the financial highlights for each of the periods indicated, in conformity with accounting principles generally accepted in the United States of America. These financial statements and financial highlights (hereafter referred to as "financial statements") are the responsibility of the VIP International Capital Appreciation Portfolio's management. Our responsibility is to express an opinion on these financial statements based on our audits. We conducted our audits of these financial statements in accordance with the standards of the Public Company Accounting Oversight Board (United States). Those standards require that we plan and perform the audit to obtain reasonable assurance about whether the financial statements are free of material misstatement. An audit includes examining, on a test basis, evidence supporting the amounts and disclosures in the financial statements, assessing the accounting principles used and significant estimates made by management, and evaluating the overall financial statement presentation. We believe that our audits, which included confirmation of securities at December 31, 2009 by correspondence with the custodian and brokers, provide a reasonable basis for our opinion.
/s/ PricewaterhouseCoopers LLP
PricewaterhouseCoopers LLP
Boston, Massachusetts
February 12, 2010
Annual Report
Trustees and Officers
The Trustees, Member of the Advisory Board, and executive officers of the trust and fund, as applicable, are listed below. The Board of Trustees governs the fund and is responsible for protecting the interests of shareholders. The Trustees are experienced executives who meet periodically throughout the year to oversee the fund's activities, review contractual arrangements with companies that provide services to the fund, and review the fund's performance. Except for James C. Curvey, each of the Trustees oversees 222 funds advised by FMR or an affiliate. Mr. Curvey oversees 410 funds advised by FMR or an affiliate.
The Trustees hold office without limit in time except that (a) any Trustee may resign; (b) any Trustee may be removed by written instrument, signed by at least two-thirds of the number of Trustees prior to such removal; (c) any Trustee who requests to be retired or who has become incapacitated by illness or injury may be retired by written instrument signed by a majority of the other Trustees; and (d) any Trustee may be removed at any special meeting of shareholders by a two-thirds vote of the outstanding voting securities of the trust. Each Trustee who is not an interested person (as defined in the 1940 Act) (Independent Trustee), shall retire not later than the last day of the calendar year in which his or her 72nd birthday occurs. The Independent Trustees may waive this mandatory retirement age policy with respect to individual Trustees. The executive officers and Advisory Board Member hold office without limit in time, except that any officer and Advisory Board Member may resign or may be removed by a vote of a majority of the Trustees at any regular meeting or any special meeting of the Trustees. Except as indicated, each individual has held the office shown or other offices in the same company for the past five years.
The fund's Statement of Additional Information (SAI) includes more information about the Trustees. To request a free copy, call Fidelity at 1-877-208-0098.
Interested Trustees*:
Correspondence intended for each Trustee who is an interested person may be sent to Fidelity Investments, 82 Devonshire Street, Boston, Massachusetts 02109.
Name, Age; Principal Occupation |
Edward C. Johnson 3d (79) |
| Year of Election or Appointment: 1983 Mr. Johnson is Trustee and Chairman of the Board of Trustees of certain Trusts. Mr. Johnson serves as Chief Executive Officer, Chairman, and a Director of FMR LLC; Chairman and a Director of FMR; Chairman and a Director of Fidelity Research & Analysis Company (FRAC); Chairman and a Director of Fidelity Investments Money Management, Inc.; and Chairman and a Director of FMR Co., Inc. In addition, Mr. Johnson serves as Chairman and Director of FIL Limited. Previously, Mr. Johnson served as President of FMR LLC (2006-2007). |
James C. Curvey (74) |
| Year of Election or Appointment: 2007 Mr. Curvey also serves as Trustee (2007-present) of other investment companies advised by FMR. Mr. Curvey is a Director of FMR and FMR Co., Inc. (2007-present). Mr. Curvey is also Vice Chairman (2006-present) and Director of FMR LLC. In addition, Mr. Curvey serves as an Overseer for the Boston Symphony Orchestra and a member of the Trustees of Villanova University. |
* Trustees have been determined to be "Interested Trustees" by virtue of, among other things, their affiliation with the trust or various entities under common control with FMR.
Independent Trustees:
Correspondence intended for each Independent Trustee (that is, the Trustees other than the Interested Trustees) may be sent to Fidelity Investments, P.O. Box 55235, Boston, Massachusetts 02205-5235.
Name, Age; Principal Occupation |
Dennis J. Dirks (61) |
| Year of Election or Appointment: 2005 Prior to his retirement in May 2003, Mr. Dirks was Chief Operating Officer and a member of the Board of The Depository Trust & Clearing Corporation (DTCC). He also served as President, Chief Operating Officer, and Board member of The Depository Trust Company (DTC) and President and Board member of the National Securities Clearing Corporation (NSCC). In addition, Mr. Dirks served as Chief Executive Officer and Board member of the Government Securities Clearing Corporation, Chief Executive Officer and Board member of the Mortgage-Backed Securities Clearing Corporation, as a Trustee and a member of the Finance Committee of Manhattan College (2005-2008), and as a Trustee and a member of the Finance Committee of AHRC of Nassau County (2006-2008). Currently, Mr. Dirks serves as a member of the Board of Directors for The Brookville Center for Children's Services, Inc. (2009-present). |
Alan J. Lacy (56) |
| Year of Election or Appointment: 2008 Mr. Lacy serves as Senior Adviser (2007-present) of Oak Hill Capital Partners, L.P. (private equity). Mr. Lacy also served as Chief Executive Officer (2000-2005) and Vice Chairman (2005-2006) of Sears Holdings Corporation and Sears, Roebuck and Co. (retail). In addition, Mr. Lacy serves as a member of the Board of Directors of The Western Union Company (global money transfer, 2006-present) and Bristol-Myers Squibb Company (global pharmaceuticals, 2007-present). Mr. Lacy is Chairman (2008-present) and a member (2006-present) of the Board of Trustees of The National Parks Conservation Association. |
Ned C. Lautenbach (65) |
| Year of Election or Appointment: 2000 Mr. Lautenbach is Chairman of the Independent Trustees of the Equity and High Income Funds (2006-present). Mr. Lautenbach is an Advisory Partner of Clayton, Dubilier & Rice, Inc. (private equity investment). Previously, Mr. Lautenbach was with the International Business Machines Corporation (IBM) from 1968 until his retirement in 1998. Mr. Lautenbach serves as a Director of Eaton Corporation (diversified industrial) as well as the Philharmonic Center for the Arts in Naples, Florida. Mr. Lautenbach is also a member of the Board of Trustees of Fairfield University (2005-present), as well as a member of the Council on Foreign Relations. Previously, Mr. Lautenbach served as a Director of Sony Corporation (2006-2007). |
Joseph Mauriello (65) |
| Year of Election or Appointment: 2008 Prior to his retirement in January 2006, Mr. Mauriello served in numerous senior management positions including Deputy Chairman and Chief Operating Officer (2004-2005), and Vice Chairman of Financial Services (2002-2004) of KPMG LLP US (professional services, 1965-2005). Mr. Mauriello currently serves as a member of the Board of Directors of XL Capital Ltd. (global insurance and re-insurance, 2006-present) and of Arcadia Resources Inc. (health care services and products, 2007-present). Previously, Mr. Mauriello served as a Director of the Hamilton Funds of the Bank of New York (2006-2007). |
Cornelia M. Small (65) |
| Year of Election or Appointment: 2005 Ms. Small is a member of the Board of Directors of the Teagle Foundation (2009-present). Ms. Small is also a member of the Investment Committee, and Chair (2008-present) and a member of the Board of Trustees of Smith College. In addition, Ms. Small serves on the Investment Committee of the Berkshire Taconic Community Foundation (2008-present). Previously, Ms. Small served as Chairperson of the Investment Committee (2002-2008) of Smith College. In addition, Ms. Small served as Chief Investment Officer, Director of Global Equity Investments, and a member of the Board of Directors of Scudder, Stevens & Clark and Scudder Kemper Investments. |
William S. Stavropoulos (70) |
| Year of Election or Appointment: 2001 Mr. Stavropoulos serves as President and Founder of the Michigan Baseball Foundation, the Great Lakes Loons (2007-present). Mr. Stavropoulos is Chairman Emeritus of the Board of Directors of The Dow Chemical Company, where he previously served in numerous senior management positions, including President, CEO (1995-2000; 2002-2004), Chairman of the Executive Committee (2000-2006), and as a member of the Board of Directors (1990-2006). Currently, Mr. Stavropoulos is a Director of Teradata Corporation (data warehousing and technology solutions, 2008-present), Chemical Financial Corporation, Maersk Inc. (industrial conglomerate), Tyco International, Inc. (multinational manufacturing and services, 2007-present), and a member of the Advisory Board for Metalmark Capital (private equity investment, 2005-present). Mr. Stavropoulos is a special advisor to Clayton, Dubilier & Rice, Inc. (private equity investment). In addition, Mr. Stavropoulos is a member of the University of Notre Dame Advisory Council for the College of Science. |
David M. Thomas (60) |
| Year of Election or Appointment: 2008 Previously, Mr. Thomas served as Executive Chairman (2005-2006) and Chairman and Chief Executive Officer (2000-2005) of IMS Health, Inc. (pharmaceutical and healthcare information solutions). In addition, Mr. Thomas serves as a member of the Board of Directors of Fortune Brands, Inc. (consumer products), and Interpublic Group of Companies, Inc. (marketing communication, 2004-present). |
Michael E. Wiley (59) |
| Year of Election or Appointment: 2008 Mr. Wiley also serves as a Director of Asia Pacific Exploration Consolidated (international oil and gas exploration and production, 2008-present), and as a member of the Board of Trustees of the University of Tulsa (2000-2006; 2007-present). Mr. Wiley serves as a Director of Tesoro Corporation (independent oil refiner and marketer, 2005-present), and a Director of Bill Barrett Corporation (exploration and production, 2005-present). In addition, Mr. Wiley also serves as a Director of Post Oak Bank (privately-held bank, 2004-present). Previously, Mr. Wiley served as a Sr. Energy Advisor of Katzenbach Partners, LLC (consulting, 2006-2007), as an Advisory Director of Riverstone Holdings (private investment), Chairman, President, and CEO of Baker Hughes, Inc. (oilfield services, 2000-2004), and as Director of Spinnaker Exploration Company (exploration and production, 2001-2005). |
Annual Report
Trustees and Officers - continued
Advisory Board Member and Executive Officers:
Correspondence intended for each executive officer and Peter S. Lynch may be sent to Fidelity Investments, 82 Devonshire Street, Boston, Massachusetts 02109.
Name, Age; Principal Occupation |
Peter S. Lynch (65) |
| Year of Election or Appointment: 2003 Member of the Advisory Board of Fidelity's Equity and High Income Funds. Mr. Lynch is Vice Chairman and a Director of FMR and FMR Co., Inc. In addition, Mr. Lynch serves as a Trustee of Boston College and as the Chairman of the Inner-City Scholarship Fund. Previously, Mr. Lynch served on the Special Olympics International Board of Directors (1997-2006). |
Kenneth B. Robins (40) |
| Year of Election or Appointment: 2008 President and Treasurer of Fidelity's Equity and High Income Funds. Mr. Robins also serves as Assistant Treasurer of other Fidelity funds (2009-present) and is an employee of Fidelity Investments (2004-present). Before joining Fidelity Investments, Mr. Robins worked at KPMG LLP, where he was a partner in KPMG's department of professional practice (2002-2004). |
Brian B. Hogan (45) |
| Year of Election or Appointment: 2009 Vice President of certain Equity Funds and Vice President of Sector Funds. Mr. Hogan also serves as Senior Vice President, Equity Research of FMR (2006-present) and President of FMR's Equity Division (2009-present). Previously, Mr. Hogan served as a portfolio manager. |
Eric M. Wetlaufer (47) |
| Year of Election or Appointment: 2006 Vice President of Fidelity's International Equity Funds. Mr. Wetlaufer also serves as Group Chief Investment Officer of FMR. Mr. Wetlaufer is a Director (2007-present), Chairman, Chief Executive Officer, and President of Fidelity Management & Research (Hong Kong) Limited (2008-present); Chairman, Chief Executive Officer, President, and a Director of Fidelity Management & Research (Japan) Inc. (2008-present); Chairman and Chief Executive Officer (2007-present) and President and a Director (2006-present) of Fidelity Management & Research (U.K.) Inc. and President and a Director of Fidelity Research & Analysis Company (2006-present). Before joining Fidelity Investments in 2005, Mr. Wetlaufer was a partner in Oxhead Capital Management (2004-2005). |
Scott C. Goebel (41) |
| Year of Election or Appointment: 2008 Secretary and Chief Legal Officer (CLO) of the Fidelity funds. Mr. Goebel also serves as General Counsel, Secretary, and Senior Vice President of FMR (2008-present) and FMR Co., Inc. (2008-present); Deputy General Counsel of FMR LLC; Chief Legal Officer of Fidelity Management & Research (Hong Kong) Limited (2008-present) and Assistant Secretary of Fidelity Management & Research (Japan) Inc. (2008-present), Fidelity Investments Money Management, Inc. (2008-present), Fidelity Management & Research (U.K.) Inc. (2008-present), and Fidelity Research and Analysis Company (2008-present). Previously, Mr. Goebel served as Assistant Secretary of the Funds (2007-2008) and as Vice President and Secretary of Fidelity Distributors Corporation (FDC) (2005-2007). |
William C. Coffey (40) |
| Year of Election or Appointment: 2009 Assistant Secretary of Fidelity's Equity and High Income Funds. Mr. Coffey also serves as Vice President and Associate General Counsel of FMR LLC (2005-present), and is an employee of Fidelity Investments. |
Holly C. Laurent (55) |
| Year of Election or Appointment: 2008 Anti-Money Laundering (AML) Officer of the Fidelity funds. Ms. Laurent is an employee of Fidelity Investments. Previously, Ms. Laurent was Senior Vice President and Head of Legal for Fidelity Business Services India Pvt. Ltd. (2006-2008), and Senior Vice President, Deputy General Counsel and Group Head for FMR LLC (2005-2006). |
Christine Reynolds (51) |
| Year of Election or Appointment: 2008 Chief Financial Officer of the Fidelity funds. Ms. Reynolds became President of Fidelity Pricing and Cash Management Services (FPCMS) in August 2008. Ms. Reynolds served as Chief Operating Officer of FPCMS (2007-2008). Previously, Ms. Reynolds served as President, Treasurer, and Anti-Money Laundering officer of the Fidelity funds (2004-2007). |
Kenneth A. Rathgeber (62) |
| Year of Election or Appointment: 2004 Chief Compliance Officer of Fidelity's Equity and High Income Funds. Mr. Rathgeber is Chief Compliance Officer of Fidelity Management & Research (Hong Kong) Limited (2008-present), Fidelity Management & Research (Japan) Inc. (2008-present), FMR (2005-present), FMR Co., Inc. (2005-present), Fidelity Management & Research (U.K.) Inc. (2005-present), Fidelity Research & Analysis Company (2005-present), Fidelity Investments Money Management, Inc. (2005-present), Pyramis Global Advisors, LLC (2005-present), and Strategic Advisers, Inc. (2005-present). |
Jeffrey S. Christian (48) |
| Year of Election or Appointment: 2009 Deputy Treasurer of the Fidelity funds. Mr. Christian is an employee of Fidelity Investments. Previously, Mr. Christian served as Chief Financial Officer (2008-2009) of certain Fidelity funds, Senior Vice President of Fidelity Pricing and Cash Management Services (FPCMS) (2004-2009), and as Vice President of Business Analysis (2003-2004). |
Bryan A. Mehrmann (48) |
| Year of Election or Appointment: 2005 Deputy Treasurer of the Fidelity funds. Mr. Mehrmann is an employee of Fidelity Investments. Previously, Mr. Mehrmann served as Vice President of Fidelity Investments Institutional Services Group (FIIS)/Fidelity Investments Institutional Operations Company, Inc. (FIIOC) Client Services (1998-2004). |
Adrien E. Deberghes (42) |
| Year of Election or Appointment: 2008 Deputy Treasurer of Fidelity's Equity and High Income Funds. Mr. Deberghes is an employee of Fidelity Investments (2008-present). Previously, Mr. Deberghes served as Senior Vice President of Mutual Fund Administration at State Street Corporation (2007-2008), Senior Director of Mutual Fund Administration at Investors Bank & Trust (2005-2007), and Director of Finance for Dunkin' Brands (2000-2005). |
John R. Hebble (51) |
| Year of Election or Appointment: 2009 Assistant Treasurer of Fidelity's Equity and High Income Funds. Mr. Hebble also serves as President and Treasurer of other Fidelity funds (2008-present) and is an employee of Fidelity Investments. |
Paul M. Murphy (62) |
| Year of Election or Appointment: 2007 Assistant Treasurer of the Fidelity funds. Mr. Murphy is an employee of Fidelity Investments. Previously, Mr. Murphy served as Chief Financial Officer of the Fidelity funds (2005-2006), Vice President and Associate General Counsel of FMR (2007), and Senior Vice President of Fidelity Pricing and Cash Management Services (FPCMS) (1994-2007). |
Gary W. Ryan (51) |
| Year of Election or Appointment: 2005 Assistant Treasurer of the Fidelity funds. Mr. Ryan is an employee of Fidelity Investments. Previously, Mr. Ryan served as Vice President of Fund Reporting in Fidelity Pricing and Cash Management Services (FPCMS) (1999-2005). |
Annual Report
Distributions
The Board of Trustees of VIP International Capital Appreciation Portfolio voted to pay to shareholders of record at the opening of business on record date, the following distributions per share derived from capital gains realized from sales of portfolio securities and dividends derived from net investment income:
| Pay Date | Record Date | Dividends | Capital Gains |
Initial Class R | 02/05/10 | 02/05/10 | $- | $0.03 |
Service Class R | 02/05/10 | 02/05/10 | $- | $0.03 |
Service Class 2 R | 02/05/10 | 02/05/10 | $- | $0.03 |
Investor Class R | 02/05/10 | 02/05/10 | $- | $0.03 |
The amounts per share which represent income derived from sources within, and taxes paid to, foreign countries or possessions of the United States are as follows:
| Pay Date | Income | Taxes |
Initial Class R | 12/18/09 | $0.124 | $0.015 |
Service Class R | 12/18/09 | $0.117 | $0.015 |
Service Class 2 R | 12/18/09 | $0.107 | $0.015 |
Investor Class R | 12/18/09 | $0.124 | $0.015 |
The fund will notify shareholders in January 2010 of amounts for use in preparing 2009 income tax returns.
Annual Report
Board Approval of Investment Advisory Contracts and Management Fees
VIP International Capital Appreciation Portfolio
Each year, the Board of Trustees, including the Independent Trustees (together, the Board), votes on the renewal of the management contract and sub-advisory agreements (together, the Advisory Contracts) for the fund. The Board, assisted by the advice of fund counsel and Independent Trustees' counsel, requests and considers a broad range of information throughout the year.
The Board meets regularly and, acting directly and through its separate committees, requests and receives information concerning, and considers at each of its meetings factors that are relevant to, its annual consideration of the renewal of the fund's Advisory Contracts, including the services and support provided to the fund and its shareholders. The Board has established various standing committees, each composed of Independent Trustees with varying backgrounds, to which the Board has assigned specific subject matter responsibilities in order to enhance effective decision-making by the Board. Each committee has a written charter outlining the structure and purposes of the committee. The Board also meets as needed to consider matters specifically related to the Board's annual consideration of the renewal of Advisory Contracts.
At its July 2009 meeting, the Board of Trustees, including the Independent Trustees, unanimously determined to renew the fund's Advisory Contracts. In reaching its determination, the Board considered all factors it believed relevant, including (i) the nature, extent, and quality of the services to be provided to the fund and its shareholders (including the investment performance of the fund); (ii) the competitiveness of the fund's management fee and total expenses; (iii) the total costs of the services to be provided by and the profits to be realized by Fidelity from its relationship with the fund; (iv) the extent to which economies of scale would be realized as the fund grows; and (v) whether fee levels reflect these economies of scale, if any, for the benefit of fund shareholders.
In considering whether to renew the Advisory Contracts for the fund, the Board ultimately reached a determination, with the assistance of fund counsel and Independent Trustees' counsel and through the exercise of its business judgment, that the renewal of the Advisory Contracts and the compensation to be received by Fidelity under the management contract is consistent with Fidelity's fiduciary duty under applicable law. The Board's decision to renew the Advisory Contracts was not based on any single factor noted above, but rather was based on a comprehensive consideration of all the information provided to the Board at its meetings throughout the year. The Board, in reaching its determination to renew the Advisory Contracts, is aware that shareholders in the fund have a broad range of investment choices available to them, including a wide choice among mutual funds offered by competitors to Fidelity, and that the fund's shareholders, with the opportunity to review and weigh the disclosure provided by the fund in its prospectus and other public disclosures, have chosen to invest in this fund, managed by Fidelity.
Nature, Extent, and Quality of Services Provided. The Board considered staffing within the investment adviser, FMR, and the sub-advisers (together, the Investment Advisers), including the backgrounds of the fund's investment personnel and the fund's investment objective and discipline. The Independent Trustees also had discussions with senior management of Fidelity's investment operations and investment groups. The Board considered the structure of the portfolio manager compensation program and whether this structure provides appropriate incentives.
Resources Dedicated to Investment Management and Support Services. The Board reviewed the size, education, and experience of the Investment Advisers' investment staff, their use of technology, and the Investment Advisers' approach to recruiting, training, and retaining portfolio managers and other research, advisory, and management personnel. In response to last year's financial crisis, FMR took a number of actions intended to cut costs and improve efficiency without weakening the investment teams or resources. The Board noted that Fidelity's analysts have access to a variety of technological tools and market and securities data that enable them to perform both fundamental and quantitative analysis and to specialize in various disciplines. The Board considered Fidelity's extensive global research capabilities that enable the Investment Advisers to aggregate data from various sources in an effort to produce positive investment results. The Board also considered that Fidelity's portfolio managers and analysts have access to daily portfolio attribution that allows for monitoring of a fund's portfolio, as well as an electronic communication system that provides immediate real-time access to research concerning issuers and credit enhancers.
Shareholder and Administrative Services. The Board considered (i) the nature, extent, quality, and cost of advisory, administrative, distribution, and shareholder services performed by the Investment Advisers and their affiliates under the Advisory Contracts and under separate agreements covering transfer agency, pricing and bookkeeping, and securities lending services for the fund; (ii) the nature and extent of the Investment Advisers' supervision of third party service providers, principally custodians and subcustodians; and (iii) the resources devoted to, and the record of compliance with, the fund's compliance policies and procedures. The Board also reviewed the allocation of fund brokerage, including allocations to brokers affiliated with the Investment Advisers, the use of brokerage commissions to pay fund expenses, and the use of "soft" commission dollars to pay for research services.
The Board noted that the growth of fund assets across the complex allows Fidelity to reinvest in the development of services designed to enhance the value or convenience of the Fidelity funds as investment vehicles. These services include 24-hour access to account information and market information through phone representatives and over the Internet, and investor education materials and asset allocation tools.
Investment in a Large Fund Family. The Board considered the benefits to shareholders of investing in a Fidelity fund, including the benefits of investing in a fund that is part of a large family of funds offering a variety of investment disciplines and providing for a large variety of mutual fund investor services. The Board noted that Fidelity has taken a number of actions over the previous year that benefited particular funds, including (i) dedicating additional resources to investment research and to restructure and broaden the focus of the investment research teams; (ii) bolstering the senior management team that oversees asset management; (iii) contractually agreeing to reduce the management fee on Fidelity U.S. Bond Index Fund; and (iv) expanding Class A and Class T load waiver categories to increase rollover retention opportunities and create consistent policies across the classes.
Annual Report
Board Approval of Investment Advisory Contracts and Management Fees - continued
Investment Performance. The Board considered whether the fund has operated within its investment objective, as well as its record of compliance with its investment restrictions. It also reviewed the fund's absolute investment performance for each class, as well as the fund's relative investment performance for each class measured against (i) a broad-based securities market index, and (ii) a custom peer group of mutual funds deemed appropriate by the Board over multiple periods. Because the fund had been in existence less than five calendar years, the following charts considered by the Board show, over the one- and three-year periods ended December 31, 2008, the cumulative total returns of Initial Class R and Service Class 2 of the fund, the cumulative total returns of a broad-based securities market index ("benchmark"), and a range of cumulative total returns of a custom peer group of mutual funds defined by FMR based on categories assigned by Morningstar, Inc. The returns of Initial Class R and Service Class 2 show the performance of the highest and lowest performing classes, respectively (based on three-year performance). The box within each chart shows the 25th percentile return (bottom of box) and the 75th percentile return (top of box) of the peer group. Returns shown above the box are in the first quartile and returns shown below the box are in the fourth quartile. The percentage beaten numbers noted below each chart correspond to the percentile box and represent the percentage of funds in the peer group whose performance was equal to or lower than that of the class indicated. The fund's custom peer group, defined by FMR, is a peer group that FMR believes provides a more meaningful performance comparison than the peer group assigned by Morningstar, Inc., which assigns mutual funds to categories based on their investment styles as measured by their underlying portfolio holdings.
VIP International Capital Appreciation Portfolio
The Board reviewed the fund's relative investment performance against its peer group and stated that the performance of Initial Class R of the fund was in the fourth quartile for all the periods shown. The Board also stated that the investment performance of the fund was lower than its benchmark for all the periods shown. The Board considered that the variations in performance among the fund's classes reflect the variations in class expenses, which result in lower performance for higher expense classes. The Board discussed with FMR actions that have been taken by FMR to improve the fund's disappointing performance relative to its peer group and benchmark. The Board noted that this fund had underperformed in the previous year and discussed with FMR its disappointment with the continued underperformance of the fund. The Board will continue to closely monitor the performance of the fund in the coming year and discuss with FMR other appropriate actions to address the performance of the fund.
The Board considered that FMR has taken steps to refocus and strengthen equity research, equity portfolio management, and compliance. The Board reviewed the year-to-date performance of Initial Class through May 31, 2009 and stated that it exceeded the fund's benchmark.
Based on its review, and giving particular weight to the nature and quality of the resources dedicated by the Investment Advisers to maintain and improve relative performance and factoring in the unprecedented market events in 2008, the Board concluded that the nature, extent, and quality of the services provided to the fund will benefit the fund's shareholders, particularly in light of the Board's view that the fund's shareholders benefit from investing in a fund that is part of a large family of funds offering a variety of investment disciplines and services.
Competitiveness of Management Fee and Total Fund Expenses. The Board considered the fund's management fee and total expenses compared to "mapped groups" of competitive funds and classes. Fidelity creates "mapped groups" by combining similar Lipper investment objective categories that have comparable management fee characteristics. Combining Lipper investment objective categories aids the Board's management fee and total expense comparisons by broadening the competitive group used for comparison and by reducing the number of universes to which various Fidelity funds are compared.
Annual Report
The Board considered two proprietary management fee comparisons for the 12-month (or shorter) periods shown in the chart below. The group of Lipper funds used by the Board for management fee comparisons is referred to below as the "Total Mapped Group." The Total Mapped Group comparison focuses on a fund's standing relative to the total universe of comparable funds available to investors, in terms of gross management fees before expense reimbursements or caps. "TMG %" represents the percentage of funds in the Total Mapped Group that had management fees that were lower than the fund's. For example, a TMG % of 18% means that 82% of the funds in the Total Mapped Group had higher management fees than the fund. The "Asset-Size Peer Group" (ASPG) comparison focuses on a fund's standing relative to non-Fidelity funds similar in size to the fund within the Total Mapped Group. The ASPG represents at least 15% of the funds in the Total Mapped Group with comparable asset size and management fee characteristics, subject to a minimum of 50 funds (or all funds in the Total Mapped Group if fewer than 50). Additional information, such as the ASPG quartile in which the fund's management fee ranked, is also included in the chart and considered by the Board.
VIP International Capital Appreciation Portfolio
The Board noted that the fund's management fee ranked below the median of its Total Mapped Group and below the median of its ASPG for 2008.
Based on its review, the Board concluded that the fund's management fee was fair and reasonable in light of the services that the fund receives and the other factors considered.
In its review of each class's total expenses, the Board considered the fund's management fee as well as other fund or class expenses, as applicable, such as transfer agent fees, pricing and bookkeeping fees, fund-paid 12b-1 fees, and custodial, legal, and audit fees. The Board also noted the effects of any waivers and reimbursements on fees and expenses. As part of its review, the Board also considered current and historical total expenses of each class of the fund compared to competitive fund median expenses. Each class of the fund is compared to those funds and classes in the Total Mapped Group (used by the Board for management fee comparisons) that have a similar sales load structure.
The Board noted that the total expenses of each of Initial Class and Initial Class R ranked equal to its competitive median for 2008 and the total expenses of each of Investor Class R, Service Class, Service Class 2, Service Class R, and Service Class 2 R ranked above its competitive median for 2008. The Board considered that the total expenses of Investor Class R were above the median primarily due to its higher transfer agent fee. The Board noted that the fund offers multiple classes, each of which has a different 12b-1 fee structure, and that the multiple structures are intended to offer a range of pricing options for the intermediary market. The Board also noted that the total expenses of the classes vary primarily by the level of their 12b-1 fees, although differences in transfer agent fees may also cause expenses to vary from class to class.
In its review of total expenses, the Board also considered Fidelity fee structures and other information on clients that FMR and its affiliates service in other competitive markets, such as other mutual funds advised or subadvised by FMR or its affiliates, pension plan clients, and other institutional clients.
Based on its review, the Board concluded that the total expenses of each class of the fund were reasonable, although in some cases above the median of the universe presented for comparison, in light of the services that the fund and its shareholders receive and the other factors considered.
Annual Report
Board Approval of Investment Advisory Contracts and Management Fees - continued
Costs of the Services and Profitability. The Board considered the revenues earned and the expenses incurred by Fidelity in conducting the business of developing, marketing, distributing, managing, administering and servicing the fund and its shareholders. The Board also considered the level of Fidelity's profits in respect of all the Fidelity funds.
On an annual basis, FMR presents to the Board Fidelity's profitability for the fund. Fidelity calculates the profitability for each fund, as well as aggregate profitability for groups of Fidelity funds and all Fidelity funds, using a series of detailed revenue and cost allocation methodologies which originate with the audited books and records of Fidelity. The Audit Committee of the Board reviews any significant changes from the prior year's methodologies.
PricewaterhouseCoopers LLP (PwC), independent registered public accounting firm and auditor to Fidelity and certain Fidelity funds, has been engaged annually by the Board as part of the Board's assessment of Fidelity's profitability analysis. PwC's engagement includes the review and assessment of Fidelity's methodologies used in determining the revenues and expenses attributable to Fidelity's mutual fund business, and completion of agreed-upon procedures surrounding the mathematical accuracy of fund profitability and its conformity to allocation methodologies. After considering PwC's reports issued under the engagement and information provided by Fidelity, the Board believes that while other allocation methods may also be reasonable, Fidelity's profitability methodologies are reasonable in all material respects.
The Board has also reviewed Fidelity's non-fund businesses and any fall-out benefits related to the mutual fund business as well as cases where Fidelity's affiliates may benefit from or be related to the fund's business.
The Board considered the costs of the services provided by and the profits realized by Fidelity in connection with the operation of the fund and determined that the amount of profit is a fair entrepreneurial profit for the management of the fund.
Economies of Scale. The Board considered whether there have been economies of scale in respect of the management of the Fidelity funds, whether the Fidelity funds (including the fund) have appropriately benefited from any such economies of scale, and whether there is potential for realization of any further economies of scale. The Board considered the extent to which the fund will benefit from economies of scale through increased services to the fund, through waivers or reimbursements, or through fee or expense reductions.
In February 2009, the Board created an Ad Hoc Committee (the "Committee") to analyze economies of scale. The Committee was formed to consider whether FMR attains economies of scale in respect of the management and servicing of the Fidelity funds, whether the Fidelity funds have appropriately benefited from such economies of scale, and whether there is potential for realization of any further economies of scale.
The Board recognized that the fund's management contract incorporates a "group fee" structure, which provides for lower group fee rates as total fund assets under FMR's management increase, and for higher group fee rates as total fund assets under FMR's management decrease. FMR determines the group fee rates based on a tiered asset "breakpoint" schedule. The Board considered that the group fee is designed to deliver the benefits of economies of scale to fund shareholders when total fund assets increase, even if assets of any particular fund are unchanged or have declined, because some portion of Fidelity's costs are attributable to services provided to all Fidelity funds, and all funds benefit if those costs can be allocated among more assets. The Board concluded that, given the group fee structure, fund shareholders will achieve a certain level of economies of scale as assets under FMR's management increase at the fund complex level, regardless of whether Fidelity achieves any such economies of scale.
The Board concluded, considering the findings of the Committee, that any potential economies of scale are being shared between fund shareholders and Fidelity in an appropriate manner.
Additional Information Requested by the Board. In order to develop fully the factual basis for consideration of the Fidelity funds' Advisory Contracts, the Board requested and received additional information on certain topics, including (i) fund performance trends, actions to be taken by FMR to improve certain funds' overall performance and Fidelity's long-term strategies for certain funds; (ii) portfolio manager changes that have occurred during the past year; (iii) Fidelity's compensation structure for portfolio managers and key personnel, including performance benchmarks used by Fidelity in evaluating incentive compensation for portfolio managers and research analysts; (iv) the structure and process of equity research and actions taken by FMR to improve the quality of research; (v) the selection of and compensation paid by FMR to fund sub-advisers; (vi) Fidelity's fee structures and rationale for recommending different fees among categories of funds; (vii) the rationale for any differences between fund fee structures and fee structures in place for other Fidelity clients; (viii) Fidelity's rationale for recommending which funds should have a performance adjustment component as part of their management fees; and (ix) explanations for the relative total expenses borne by certain funds and classes, total expense competitive trends, and actions that might be taken by FMR to reduce total expenses for certain funds and classes.
Based on its evaluation of all of the conclusions noted above, and after considering all material factors, the Board ultimately concluded that the advisory fee structures are fair and reasonable, and that the fund's Advisory Contracts should be renewed.
Annual Report
Investment Adviser
Fidelity Management & Research Company
Boston, MA
Investment Sub-Advisers
FMR Co., Inc.
Fidelity Management & Research (U.K.) Inc.
Fidelity Research & Analysis Company
FIL Investment Advisors
FIL Investment Advisors (U.K.) Ltd.
FIL Investments (Japan) Limited
Fidelity Management & Research (Hong Kong) Limited
Fidelity Management & Research (Japan) Inc.
General Distributor
Fidelity Distributors Corporation
Boston, MA
Transfer and Service Agents
Fidelity Investments Institutional Operations Company, Inc.
Boston, MA
Fidelity Service Company, Inc.
Boston, MA
Custodian
Brown Brothers Harriman & Co.
Boston, MA
VIPCAR-ANN-0210
1.805787.105
Fidelity® Variable Insurance Products:
Materials Portfolio
Annual Report
December 31, 2009
(2_fidelity_logos) (Registered_Trademark)
Contents
Performance | <Click Here> | How the fund has done over time. |
Management's Discussion | <Click Here> | The manager's review of fund performance, strategy and outlook. |
Shareholder Expense Example | <Click Here> | An example of shareholder expenses. |
Investment Changes | <Click Here> | A summary of major shifts in the fund's investments over the past six months. |
Investments | <Click Here> | A complete list of the fund's investments with their market values. |
Financial Statements | <Click Here> | Statements of assets and liabilities, operations, and changes in net assets, as well as financial highlights. |
Notes | <Click Here> | Notes to the financial statements. |
Report of Independent Registered Public Accounting Firm | <Click Here> | |
Trustees and Officers | <Click Here> | |
Distributions | <Click Here> | |
Board Approval of Investment Advisory Contracts and Management Fees | <Click Here> | |
To view a fund's proxy voting guidelines and proxy voting record for the 12-month period ended June 30, visit http://www.fidelity.com/proxyvotingresults or visit the Securities and Exchange Commission's (SEC) web site at http://www.sec.gov. You may also call 1-877-208-0098 to request a free copy of the proxy voting guidelines.
Fidelity Variable Insurance Products are separate account options which are purchased through a variable insurance contract.
Standard & Poor's, S&P and S&P 500 are registered service marks of The McGraw-Hill Companies, Inc. and have been licensed for use by Fidelity Distributors Corporation.
Other third party marks appearing herein are the property of their respective owners.
All other marks appearing herein are registered or unregistered trademarks or service marks of FMR LLC or an affiliated company.
This report and the financial statements contained herein are submitted for the general information of the shareholders of the fund. This report is not authorized for distribution to prospective investors in the fund unless preceded or accompanied by an effective prospectus.
A fund files its complete schedule of portfolio holdings with the SEC for the first and third quarters of each fiscal year on Form N-Q. Forms N-Q are available on the SEC's web site at http://www.sec.gov. A fund's Forms N-Q may be reviewed and copied at the SEC's Public Reference Room in Washington, DC. Information regarding the operation of the SEC's Public Reference Room may be obtained by calling 1-800-SEC-0330. For a complete list of a fund's portfolio holdings, view the most recent holdings listing, semiannual report, or annual report on Fidelity's web site at http://www.fidelity.com or http://www.advisor.fidelity.com, as applicable.
NOT FDIC INSURED · MAY LOSE VALUE · NO BANK GUARANTEE
Neither the fund nor Fidelity Distributors Corporation is a bank.
Annual Report
Average annual total return reflects the change in the value of an investment, assuming reinvestment of the class' dividend income and capital gains (the profits earned upon the sale of securities that have grown in value, if any) and assuming a constant rate of performance each year. During periods of reimbursement by Fidelity, a fund's total return will be greater than it would be had the reimbursement not occurred. Performance numbers are net of all underlying fund operating expenses, but do not include any insurance charges imposed by your insurance company's separate account. If performance information included the effect of these additional charges, the total returns would have been lower. How a fund did yesterday is no guarantee of how it will do tomorrow.
Average Annual Total Returns
Periods ended December 31, 2009 | | Past 1
year | Life of fund A |
VIP Materials - Initial Class | | 78.09% | 2.55% |
VIP Materials - Investor Class | | 78.02% | 2.44% |
A From April 24, 2007.
$10,000 Over Life of Fund
Let's say hypothetically that $10,000 was invested in VIP Materials Portfolio - Initial Class on April 24, 2007, when the fund started. The chart shows how the value of your investment would have changed, and also shows how the Standard & Poor's 500SM Index (S&P 500®) performed over the same period.
Annual Report
Market Recap: In 2009, most global markets saw both crippling lows and considerable highs. After a dismal start, the economy began to show signs of improvement, suggesting that a recovery was on the horizon. Credit markets began to heal as fiscal and monetary stimulus efforts around the world started to take effect, and corporate earnings staged an impressive rebound, fueled in large part by massive cost cutting. As a result, the flight to quality that marked most of 2008 and early 2009 shifted in March as investors flocked to riskier asset categories. The U.S. equity market, as measured by the bellwether Standard & Poor's 500SM Index and the blue-chip proxy Dow Jones Industrial AverageSM, reflected this changing environment, gaining 26.46% and 22.68%, respectively. Meanwhile, the technology-laden Nasdaq Composite® Index rose 45.32%. Foreign stocks also produced strong gains, as illustrated by the 31.93% jump of the MSCI® EAFE® Index (Europe, Australasia, Far East), a gauge of developed stock markets outside the U.S. and Canada. Emerging-markets stocks, which suffered their worst calendar-year performance ever in 2008, posted record returns this past year, with the MSCI Emerging Markets Index soaring 79.02%. A depreciating U.S. dollar helped bolster returns for U.S. investors in foreign equities.
Comments from Tobias Welo, Portfolio Manager of VIP Materials Portfolio: For the one-year period ending December 31, 2009, the fund significantly outperformed the 51.80% return for the MSCI® U.S. Investable Market Materials Index as well as the S&P 500®. (For specific portfolio results, please refer to the performance section of this report.) Strong security selection played the key role in the fund's performance versus the MSCI index. Specifically, stock picks within the specialty, diversified and commodities chemicals groups, as well as the paper packaging and fertilizers/agricultural chemicals areas, aided results. Performance also was helped by an underweighting in construction materials in the first half of the period, along with underweightings in fertilizers/agricultural chemicals and steel, and overweightings in the commodity chemicals and diversified metals/mining areas. Conversely, an underweighting in the solidly performing paper products group detracted, as did a modest cash allocation, which hurt amid the run-up in stock prices. Among individual holdings, specialty chemicals company W.R. Grace & Co. rose sharply on better-than-expected earnings and the firm's win of a key environmental lawsuit. Commodity chemicals firm Celanese advanced on improved earnings and an uptick in demand. The fund's position in diversified chemicals giant Dow Chemical and an underweighting in agrochemicals company Monsanto also helped. Notable detractors included underweightings in fertilizer/agricultural chemicals firms Mosaic and CF Industries, which rallied ahead of a hoped-for global economic recovery through much of the year. Some holdings mentioned in this update were sold by period end.
Note to shareholders: In January 2010, Fidelity adopted capped benchmarks for most of its sector and industry funds, including the VIP sector portfolios. The capped benchmarks, which limit the weightings of individual issuers, better represent the investment opportunities available to the funds and will provide shareholders with more-meaningful performance comparisons. These changes do not affect the investment policies of any of the funds, and the primary benchmark for all of the funds remains the Standard & Poor's 500 Index.
The views expressed above reflect those of the portfolio manager(s) only through the end of the period as stated on the cover of this report and do not necessarily represent the views of Fidelity or any other person in the Fidelity organization. Any such views are subject to change at any time based upon market or other conditions and Fidelity disclaims any responsibility to update such views. These views may not be relied on as investment advice and, because investment decisions for a Fidelity fund are based on numerous factors, may not be relied on as an indication of trading intent on behalf of any Fidelity fund.
Annual Report
As a shareholder of the Fund, you incur two types of costs: (1) transaction costs, including redemption fees, and (2) ongoing costs, including management fees and other Fund expenses. This Example is intended to help you understand your ongoing costs (in dollars) of investing in the Fund and to compare these costs with the ongoing costs of investing in other mutual funds.
The Example is based on an investment of $1,000 invested at the beginning of the period and held for the entire period (July 1, 2009 to December 31, 2009).
Actual Expenses
The first line of the accompanying table for each class of the Fund provides information about actual account values and actual expenses. You may use the information in this line, together with the amount you invested, to estimate the expenses that you paid over the period. Simply divide your account value by $1,000.00 (for example, an $8,600 account value divided by $1,000.00 = 8.6), then multiply the result by the number in the first line for a class of the Fund under the heading entitled "Expenses Paid During Period" to estimate the expenses you paid on your account during this period. The estimate of expenses does not include any fees or other expenses of any variable annuity or variable life insurance product. If they were, the estimate of expenses you paid during the period would be higher, and your ending account value would be lower. In addition, the Fund, as a shareholder in the underlying Fidelity Central Funds, will indirectly bear its pro-rata share of the fees and expenses incurred by the underlying Fidelity Central Funds. These fees and expenses are not included in the Fund's annualized expense ratio used to calculate the expense estimate in the table below.
Hypothetical Example for Comparison Purposes
The second line of the accompanying table for each class of the Fund provides information about hypothetical account values and hypothetical expenses based on a Class' actual expense ratio and an assumed rate of return of 5% per year before expenses, which is not the Class' actual return. The hypothetical account values and expenses may not be used to estimate the actual ending account balance or expenses you paid for the period. You may use this information to compare the ongoing costs of investing in the Fund and other funds. To do so, compare this 5% hypothetical example with the 5% hypothetical examples that appear in the shareholder reports of the other funds. The estimate of expenses does not include any fees or other expenses of any variable annuity or variable life insurance product. If they were, the estimate of expenses you paid during the period would be higher, and your ending account value would be lower. In addition, the Fund, as a shareholder in the underlying Fidelity Central Funds, will indirectly bear its pro-rata share of the fees and expenses incurred by the underlying Fidelity Central Funds. These fees and expenses are not included in the Fund's annualized expense ratio used to calculate the expense estimate in the table below.
Please note that the expenses shown in the table are meant to highlight your ongoing costs only and do not reflect any transaction costs. Therefore, the second line of the table is useful in comparing ongoing costs only, and will not help you determine the relative total costs of owning different funds. In addition, if these transactional costs were included, your costs would have been higher.
| Annualized
Expense Ratio | Beginning
Account Value
July 1, 2009 | Ending
Account Value
December 31, 2009 | Expenses Paid
During Period*
July 1, 2009 to
December 31, 2009 |
Initial Class | .80% | | | |
Actual | | $ 1,000.00 | $ 1,379.00 | $ 4.80 |
HypotheticalA | | $ 1,000.00 | $ 1,021.17 | $ 4.08 |
Investor Class | .90% | | | |
Actual | | $ 1,000.00 | $ 1,378.50 | $ 5.40 |
HypotheticalA | | $ 1,000.00 | $ 1,020.67 | $ 4.58 |
A 5% return per year before expenses
* Expenses are equal to each Class' annualized expense ratio, multiplied by the average account value over the period, multiplied by 184/365 (to reflect the one-half year period).
Annual Report
Investment Changes (Unaudited)
Top Ten Stocks as of December 31, 2009 |
| % of fund's
net assets | % of fund's net assets
6 months ago |
Dow Chemical Co. | 9.3 | 6.7 |
Monsanto Co. | 8.5 | 6.3 |
E.I. du Pont de Nemours & Co. | 6.8 | 7.1 |
Praxair, Inc. | 5.8 | 3.5 |
Freeport-McMoRan Copper & Gold, Inc. | 5.7 | 7.3 |
Air Products & Chemicals, Inc. | 4.1 | 5.0 |
Celanese Corp. Class A | 4.0 | 5.0 |
Weyerhaeuser Co. | 3.7 | 2.6 |
Nucor Corp. | 3.5 | 4.0 |
Newmont Mining Corp. | 2.8 | 2.0 |
| 54.2 | |
Top Industries (% of fund's net assets) |
As of December 31, 2009 |
| Chemicals | 54.6% | |
| Metals & Mining | 24.6% | |
| Paper & Forest Products | 7.7% | |
| Containers & Packaging | 4.1% | |
| Construction Materials | 3.7% | |
| All Others* | 5.3% | |

As of June 30, 2009 |
| Chemicals | 51.6% | |
| Metals & Mining | 25.0% | |
| Containers & Packaging | 10.5% | |
| Construction Materials | 4.4% | |
| Paper & Forest Products | 2.6% | |
| All Others* | 5.9% | |

* Includes short-term investments and net other assets. |
Annual Report
Investments December 31, 2009
Showing Percentage of Net Assets
Common Stocks - 99.2% |
| Shares | | Value |
BUILDING PRODUCTS - 2.1% |
Building Products - 2.1% |
Masco Corp. | 94,410 | | $ 1,303,802 |
USG Corp. (a)(c) | 13,700 | | 192,485 |
| | 1,496,287 |
CHEMICALS - 54.6% |
Commodity Chemicals - 4.0% |
Celanese Corp. Class A | 89,700 | | 2,879,370 |
Diversified Chemicals - 20.2% |
Ashland, Inc. | 38,200 | | 1,513,484 |
Cabot Corp. | 23,000 | | 603,290 |
Dow Chemical Co. | 245,200 | | 6,774,875 |
E.I. du Pont de Nemours & Co. | 145,751 | | 4,907,436 |
Huntsman Corp. | 52,000 | | 587,080 |
Solutia, Inc. (a) | 23,300 | | 295,910 |
| | 14,682,075 |
Fertilizers & Agricultural Chemicals - 12.6% |
Fertilizantes Fosfatados SA (PN) (a) | 32,500 | | 305,235 |
Monsanto Co. | 75,924 | | 6,206,787 |
Potash Corp. of Saskatchewan, Inc. | 1,800 | | 195,976 |
Terra Industries, Inc. | 16,300 | | 524,697 |
The Mosaic Co. | 33,100 | | 1,977,063 |
| | 9,209,758 |
Industrial Gases - 11.1% |
Air Products & Chemicals, Inc. | 36,600 | | 2,966,796 |
Airgas, Inc. | 19,300 | | 918,680 |
Praxair, Inc. | 52,500 | | 4,216,275 |
| | 8,101,751 |
Specialty Chemicals - 6.7% |
Albemarle Corp. | 39,235 | | 1,426,977 |
Ferro Corp. | 91,866 | | 756,976 |
Innophos Holdings, Inc. | 17,300 | | 397,727 |
Johnson Matthey PLC | 14,909 | | 368,897 |
Kraton Performance Polymers, Inc. | 12,300 | | 166,788 |
W.R. Grace & Co. (a) | 68,800 | | 1,744,080 |
| | 4,861,445 |
TOTAL CHEMICALS | | 39,734,399 |
CONSTRUCTION MATERIALS - 3.7% |
Construction Materials - 3.7% |
Cemex SA de CV sponsored ADR | 49,600 | | 586,272 |
HeidelbergCement AG | 9,120 | | 629,722 |
Vulcan Materials Co. (c) | 27,900 | | 1,469,493 |
| | 2,685,487 |
CONTAINERS & PACKAGING - 4.1% |
Metal & Glass Containers - 2.7% |
Owens-Illinois, Inc. (a) | 58,900 | | 1,936,043 |
|
| Shares | | Value |
Paper Packaging - 1.4% |
Packaging Corp. of America | 44,900 | | $ 1,033,149 |
TOTAL CONTAINERS & PACKAGING | | 2,969,192 |
FOOD PRODUCTS - 1.4% |
Agricultural Products - 1.4% |
Bunge Ltd. | 10,100 | | 644,683 |
Corn Products International, Inc. | 14,000 | | 409,220 |
| | 1,053,903 |
HOUSEHOLD DURABLES - 0.1% |
Homebuilding - 0.1% |
Pulte Homes, Inc. | 9,750 | | 97,500 |
MARINE - 0.2% |
Marine - 0.2% |
Ultrapetrol (Bahamas) Ltd. (a) | 35,000 | | 166,600 |
METALS & MINING - 24.6% |
Diversified Metals & Mining - 9.0% |
Anglo American PLC (United Kingdom) (a) | 9,069 | | 397,348 |
Freeport-McMoRan Copper & Gold, Inc. | 51,330 | | 4,121,286 |
RTI International Metals, Inc. (a) | 26,400 | | 664,488 |
Teck Resources Ltd. Class B (sub. vtg.) (a) | 18,600 | | 651,836 |
Vale SA sponsored ADR | 24,700 | | 717,041 |
| | 6,551,999 |
Gold - 6.1% |
Agnico-Eagle Mines Ltd. (Canada) | 11,800 | | 639,277 |
AngloGold Ashanti Ltd. sponsored ADR | 15,353 | | 616,884 |
Harmony Gold Mining Co. Ltd. | 36,700 | | 371,047 |
Newcrest Mining Ltd. | 10,411 | | 330,395 |
Newmont Mining Corp. | 43,300 | | 2,048,523 |
Randgold Resources Ltd. sponsored ADR | 5,585 | | 441,885 |
| | 4,448,011 |
Precious Metals & Minerals - 0.8% |
Aquarius Platinum Ltd. (United Kingdom) (a) | 36,153 | | 237,805 |
Impala Platinum Holdings Ltd. | 12,713 | | 348,261 |
| | 586,066 |
Steel - 8.7% |
Allegheny Technologies, Inc. | 22,700 | | 1,016,279 |
Commercial Metals Co. | 18,900 | | 295,785 |
Nucor Corp. | 54,700 | | 2,551,755 |
Reliance Steel & Aluminum Co. | 27,900 | | 1,205,838 |
Steel Dynamics, Inc. | 70,000 | | 1,240,400 |
| | 6,310,057 |
TOTAL METALS & MINING | | 17,896,133 |
Common Stocks - continued |
| Shares | | Value |
OIL, GAS & CONSUMABLE FUELS - 0.7% |
Coal & Consumable Fuels - 0.7% |
Massey Energy Co. | 8,500 | | $ 357,085 |
SouthGobi Energy Resources Ltd. (a) | 7,300 | | 118,812 |
| | 475,897 |
PAPER & FOREST PRODUCTS - 7.7% |
Forest Products - 4.2% |
Louisiana-Pacific Corp. (a) | 53,800 | | 375,524 |
Weyerhaeuser Co. | 62,600 | | 2,700,564 |
| | 3,076,088 |
Paper Products - 3.5% |
International Paper Co. | 69,500 | | 1,861,210 |
Schweitzer-Mauduit International, Inc. | 9,700 | | 682,395 |
| | 2,543,605 |
TOTAL PAPER & FOREST PRODUCTS | | 5,619,693 |
TOTAL COMMON STOCKS (Cost $64,282,939) | 72,195,091 |
Money Market Funds - 6.4% |
| Shares | | Value |
Fidelity Cash Central Fund, 0.16% (d) | 3,178,487 | | $ 3,178,487 |
Fidelity Securities Lending Cash Central Fund, 0.15% (b)(d) | 1,468,650 | | 1,468,650 |
TOTAL MONEY MARKET FUNDS (Cost $4,647,137) | 4,647,137 |
TOTAL INVESTMENT PORTFOLIO - 105.6% (Cost $68,930,076) | | 76,842,228 |
NET OTHER ASSETS - (5.6)% | | (4,051,762) |
NET ASSETS - 100% | $ 72,790,466 |
Legend |
(a) Non-income producing |
(b) Investment made with cash collateral received from securities on loan. |
(c) Security or a portion of the security is on loan at period end. |
(d) Affiliated fund that is available only to investment companies and other accounts managed by Fidelity Investments. The rate quoted is the annualized seven-day yield of the fund at period end. A complete unaudited listing of the fund's holdings as of its most recent quarter end is available upon request. |
Affiliated Central Funds |
Information regarding fiscal year to date income earned by the Fund from investments in Fidelity Central Funds is as follows: |
Fund | Income earned |
Fidelity Cash Central Fund | $ 5,766 |
Fidelity Securities Lending Cash Central Fund | 871 |
Total | $ 6,637 |
Other Information |
The following is a summary of the inputs used, as of December 31, 2009, involving the Fund's assets and liabilities carried at value. The inputs or methodology used for valuing securities may not be an indication of the risk associated with investing in those securities. For more information on valuation inputs, and their aggregation into the levels used in the table below, please refer to the Investment Valuation section in the accompanying Notes to Financial Statements. |
Valuation Inputs at Reporting Date: |
Description | Total | Level 1 | Level 2 | Level 3 |
Investments in Securities: | | | | |
Common Stocks | $ 72,195,091 | $ 71,824,044 | $ 371,047 | $ - |
Money Market Funds | 4,647,137 | 4,647,137 | - | - |
Total Investments in Securities: | $ 76,842,228 | $ 76,471,181 | $ 371,047 | $ - |
Distribution of investments by country of issue, as a percentage of total net assets, is as follows: (Unaudited) |
United States of America | 89.3% |
Canada | 2.3% |
South Africa | 1.8% |
Brazil | 1.4% |
Bermuda | 1.2% |
United Kingdom | 1.0% |
Others (individually less than 1%) | 3.0% |
| 100.0% |
Income Tax Information |
At December 31, 2009, the fund had a capital loss carryforward of approximately $8,047,800 all of which will expire on December 31, 2016. |
See accompanying notes which are an integral part of the financial statements.
Annual Report
Statement of Assets and Liabilities
| December 31, 2009 |
Assets | | |
Investment in securities, at value (including securities loaned of $1,411,598) - See accompanying schedule: Unaffiliated issuers (cost $64,282,939) | $ 72,195,091 | |
Fidelity Central Funds (cost $4,647,137) | 4,647,137 | |
Total Investments (cost $68,930,076) | | $ 76,842,228 |
Receivable for fund shares sold | | 73,333 |
Dividends receivable | | 93,844 |
Distributions receivable from Fidelity Central Funds | | 619 |
Prepaid expenses | | 231 |
Other receivables | | 1,422 |
Total assets | | 77,011,677 |
| | |
Liabilities | | |
Payable for investments purchased | $ 2,594,418 | |
Payable for fund shares redeemed | 81,869 | |
Accrued management fee | 32,354 | |
Other affiliated payables | 8,645 | |
Other payables and accrued expenses | 35,275 | |
Collateral on securities loaned, at value | 1,468,650 | |
Total liabilities | | 4,221,211 |
| | |
Net Assets | | $ 72,790,466 |
Net Assets consist of: | | |
Paid in capital | | $ 74,018,175 |
Accumulated undistributed net realized gain (loss) on investments and foreign currency transactions | | (9,139,847) |
Net unrealized appreciation (depreciation) on investments and assets and liabilities in foreign currencies | | 7,912,138 |
Net Assets | | $ 72,790,466 |
Statement of Assets and Liabilities - continued
| December 31, 2009 |
Initial Class:
Net Asset Value, offering price and redemption price per share ($34,217,995 ÷ 3,337,556 shares) | | $ 10.25 |
| | |
Investor Class:
Net Asset Value, offering price and redemption price per share ($38,572,471 ÷ 3,762,755 shares) | | $ 10.25 |
See accompanying notes which are an integral part of the financial statements.
Annual Report
Financial Statements - continued
Statement of Operations
| Year ended December 31, 2009 |
Investment Income | | |
Dividends | | $ 731,932 |
Special dividends | | 96,900 |
Interest | | 3,493 |
Income from Fidelity Central Funds | | 6,637 |
Total income | | 838,962 |
| | |
Expenses | | |
Management fee | $ 224,614 | |
Transfer agent fees | 54,748 | |
Accounting and security lending fees | 15,653 | |
Custodian fees and expenses | 17,310 | |
Independent trustees' compensation | 238 | |
Audit | 32,041 | |
Legal | 176 | |
Miscellaneous | 4,293 | |
Total expenses before reductions | 349,073 | |
Expense reductions | (3,911) | 345,162 |
Net investment income (loss) | | 493,800 |
Realized and Unrealized Gain (Loss) Net realized gain (loss) on: | | |
Investment securities: | | |
Unaffiliated issuers | 1,858,540 | |
Foreign currency transactions | 692 | |
Total net realized gain (loss) | | 1,859,232 |
Change in net unrealized appreciation (depreciation) on: Investment securities | 18,289,731 | |
Assets and liabilities in foreign currencies | (6) | |
Total change in net unrealized appreciation (depreciation) | | 18,289,725 |
Net gain (loss) | | 20,148,957 |
Net increase (decrease) in net assets resulting from operations | | $ 20,642,757 |
Statement of Changes in Net Assets
| Year ended
December 31,
2009 | Year ended
December 31,
2008 |
Increase (Decrease) in Net Assets | | |
Operations | | |
Net investment income (loss) | $ 493,800 | $ 222,041 |
Net realized gain (loss) | 1,859,232 | (10,931,824) |
Change in net unrealized appreciation (depreciation) | 18,289,725 | (11,526,116) |
Net increase (decrease) in net assets resulting from operations | 20,642,757 | (22,235,899) |
Distributions to shareholders from net investment income | (512,074) | (219,419) |
Distributions to shareholders from net realized gain | - | (132,142) |
Total distributions | (512,074) | (351,561) |
Share transactions - net increase (decrease) | 34,825,755 | 15,709,835 |
Redemption fees | 26,955 | 161,568 |
Total increase (decrease) in net assets | 54,983,393 | (6,716,057) |
| | |
Net Assets | | |
Beginning of period | 17,807,073 | 24,523,130 |
End of period (including undistributed net investment income of $0 and undistributed net investment income of $280, respectively) | $ 72,790,466 | $ 17,807,073 |
See accompanying notes which are an integral part of the financial statements.
Annual Report
Financial Highlights - Initial Class
Years ended December 31, | 2009 | 2008 | 2007J |
Selected Per-Share Data | | | |
Net asset value, beginning of period | $ 5.80 | $ 11.13 | $ 10.00 |
Income from Investment Operations | | | |
Net investment income (loss) E | .10H | .07 | .10I |
Net realized and unrealized gain (loss) | 4.42 | (5.31) | 1.20 |
Total from investment operations | 4.52 | (5.24) | 1.30 |
Distributions from net investment income | (.08) | (.08) | (.07) |
Distributions from net realized gain | - | (.06) | (.11) |
Total distributions | (.08) | (.14) | (.18) |
Redemption fees added to paid in capitalE | .01 | .05 | .01 |
Net asset value, end of period | $ 10.25 | $ 5.80 | $ 11.13 |
Total ReturnB,C,D | 78.09% | (46.88)% | 13.12% |
Ratios to Average Net AssetsF,K | | | |
Expenses before reductions | .82% | .88% | 1.08%A |
Expenses net of fee waivers, if any | .82% | .88% | 1.00%A |
Expenses net of all reductions | .81% | .88% | 1.00%A |
Net investment income (loss) | 1.27%H | .74% | 1.31%A,I |
Supplemental Data | | | |
Net assets, end of period (000 omitted) | $ 34,218 | $ 9,963 | $ 13,730 |
Portfolio turnover rate G | 105% | 171% | 35%A |
A Annualized
B Total returns for periods of less than one year are not annualized.
C Total returns do not reflect charges attributable to your insurance company's separate account. Inclusion of these charges would reduce the total returns shown.
D Total returns would have been lower had certain expenses not been reduced during the periods shown.
E Calculated based on average shares outstanding during the period.
F Fees and expenses of the underlying Fidelity Central Funds are not included in the Fund's expense ratio. The Fund indirectly bears its proportionate share of the expenses of any underlying Fidelity Central Funds.
G Amount does not include the portfolio activity of any underlying Fidelity Central Funds.
H Investment income per share reflects a special dividend which amounted to $.02 per share. Excluding the special dividend, the ratio of net investment income (loss) to average net assets would have been 1.03%.
I Investment income per share reflects a special dividend which amounted to $.02 per share. Excluding the special dividend, the ratio of net investment income (loss) to average net assets would have been 1.03%.
J For the period April 24, 2007 (commencement of operations) to December 31, 2007.
K Expense ratios reflect operating expenses of the class. Expenses before reductions do not reflect amounts reimbursed by the investment adviser or reductions from brokerage service arrangements or reductions from other expense offset arrangements and do not represent the amount paid by the class during periods when reimbursements or reductions occur. Expense ratios before reductions for start-up periods may not be representative of longer-term operating periods. Expenses net of fee waivers reflect expenses after reimbursement by the investment adviser but prior to reductions from brokerage service arrangements or other expense offset arrangements. Expenses net of all reductions represent the net expenses paid by the class.
See accompanying notes which are an integral part of the financial statements.
Annual Report
Financial Highlights - Investor Class
Years ended December 31, | 2009 | 2008 | 2007 J |
Selected Per-Share Data | | | |
Net asset value, beginning of period | $ 5.80 | $ 11.13 | $ 10.00 |
Income from Investment Operations | | | |
Net investment income (loss) E | .10 H | .06 | .09 I |
Net realized and unrealized gain (loss) | 4.41 | (5.31) | 1.21 |
Total from investment operations | 4.51 | (5.25) | 1.30 |
Distributions from net investment income | (.07) | (.07) | (.07) |
Distributions from net realized gain | - | (.06) | (.11) |
Total distributions | (.07) | (.13) | (.18) |
Redemption fees added to paid in capital E | .01 | .05 | .01 |
Net asset value, end of period | $ 10.25 | $ 5.80 | $ 11.13 |
Total Return B,C,D | 78.02% | (46.98)% | 13.05% |
Ratios to Average Net Assets F,K | | | |
Expenses before reductions | .91% | .97% | 1.20% A |
Expenses net of fee waivers, if any | .91% | .97% | 1.15% A |
Expenses net of all reductions | .90% | .96% | 1.15% A |
Net investment income (loss) | 1.18% H | .65% | 1.16% A,I |
Supplemental Data | | | |
Net assets, end of period (000 omitted) | $ 38,572 | $ 7,844 | $ 10,793 |
Portfolio turnover rate G | 105% | 171% | 35% A |
A Annualized
B Total returns for periods of less than one year are not annualized.
C Total returns do not reflect charges attributable to your insurance company's separate account. Inclusion of these charges would reduce the total returns shown.
D Total returns would have been lower had certain expenses not been reduced during the periods shown.
E Calculated based on average shares outstanding during the period.
F Fees and expenses of the underlying Fidelity Central Funds are not included in the Fund's expense ratio. The Fund indirectly bears its proportionate share of the expenses of any underlying Fidelity Central Funds.
G Amount does not include the portfolio activity of any underlying Fidelity Central Funds.
H Investment income per share reflects a special dividend which amounted to $.02 per share. Excluding the special dividend, the ratio of net investment income (loss) to average net assets would have been .94%.
I Investment income per share reflects a special dividend which amounted to $.02 per share. Excluding the special dividend, the ratio of net investment income (loss) to average net assets would have been .88%.
J For the period April 24, 2007 (commencement of operations) to December31, 2007.
K Expense ratios reflect operating expenses of the class. Expenses before reductions do not reflect amounts reimbursed by the investment adviser or reductions from brokerage service arrangements or reductions from other expense offset arrangements and do not represent the amount paid by the class during periods when reimbursements or reductions occur. Expense ratios before reductions for start-up periods may not be representative of longer-term operating periods. Expenses net of fee waivers reflect expenses after reimbursement by the investment adviser but prior to reductions from brokerage service arrangements or other expense offset arrangements. Expenses net of all reductions represent the net expenses paid by the class.
See accompanying notes which are an integral part of the financial statements.
Annual Report
Notes to Financial Statements
For the period ended December 31, 2009
1. Organization.
VIP Materials Portfolio (the Fund) is a non-diversified fund of Variable Insurance Products Fund IV (the trust) and is authorized to issue an unlimited number of shares. The trust is registered under the Investment Company Act of 1940, as amended (the 1940 Act), as an open-end management investment company organized as a Massachusetts business trust. Shares of the Fund may only be purchased by insurance companies for the purpose of funding variable annuity or variable life insurance contracts. The Fund offers the following classes of shares: Initial Class shares and Investor Class shares. All classes have equal rights and voting privileges, except for matters affecting a single class. Investment income, realized and unrealized capital gains and losses, the common expenses of the Fund, and certain fund-level expense reductions, if any, are allocated on a pro-rata basis to each class based on the relative net assets of each class to the total net assets of the Fund. Each class differs with respect to transfer agent fees incurred. Certain expense reductions also differ by class.
2. Investments in Fidelity Central Funds.
The Fund may invest in Fidelity Central Funds, which are open-end investment companies available only to other investment companies and accounts managed by Fidelity Management & Research Company (FMR) and its affiliates. The Fund's Schedule of Investments lists each of the Fidelity Central Funds held as of period end, if any, as an investment of the Fund, but does not include the underlying holdings of each Fidelity Central Fund. As an Investing Fund, the Fund indirectly bears its proportionate share of the expenses of the underlying Fidelity Central Funds.
The Money Market Central Funds seek preservation of capital and current income and are managed by Fidelity Investments Money Management, Inc. (FIMM), an affiliate of FMR.
A complete unaudited list of holdings for each Fidelity Central Fund is available upon request or at the Securities and Exchange Commission (the SEC) web site at www.sec.gov. In addition, the financial statements of the Fidelity Central Funds, which are not covered by the Fund's Report of Independent Registered Public Accounting Firm, are available on the SEC web site or upon request.
3. Significant Accounting Policies.
The financial statements have been prepared in conformity with accounting principles generally accepted in the United States of America, which require management to make certain estimates and assumptions at the date of the financial statements. Actual results could differ from those estimates. Events or transactions occurring after period end through the date that the financial statements were issued, February 12, 2010, have been evaluated in the preparation of the financial statements. The following summarizes the significant accounting policies of the Fund:
Security Valuation. Investments are valued as of 4:00 p.m. Eastern time on the last calendar day of the period. The Fund uses independent pricing services approved by the Board of Trustees to value its investments. When current market prices or quotations are not readily available or reliable, valuations may be determined in good faith in accordance with procedures adopted by the Board of Trustees. Factors used in determining value may include significant market or security specific events. The frequency with which these procedures are used cannot be predicted and may be utilized to a significant extent. The value used for net asset value (NAV) calculation under these procedures may differ from published prices for the same securities.
The Fund categorizes the inputs to valuation techniques used to value its investments into a disclosure hierarchy consisting of three levels as shown below.
Level 1 - quoted prices in active markets for identical investments
Level 2 - other significant observable inputs (including quoted prices for similar investments, interest rates, prepayment speeds, etc.)
Level 3 - unobservable inputs (including the fund's own assumptions based on the best information available)
Changes in valuation techniques may result in transfers in or out of an assigned level within the disclosure hierarchy. The aggregate value of investments by input level, as of December 31, 2009 is included at the end of the Fund's Schedule of Investments. Valuation techniques used to value the Fund's investments by major category are as follows.
Equity securities, including restricted securities, for which market quotations are readily available, are valued at the last reported sale price or official closing price as reported by an independent pricing service on the primary market or exchange on which they are traded and are categorized as level 1 in the hierarchy. In the event there were no sales during the day or closing prices are not available, securities are valued at the last quoted bid price or may be valued using the last available price and categorized as Level 2 in the hierarchy. For foreign equity securities, when significant market or security events arise, comparisons to the valuation of American Depository Receipts (ADRs), futures contracts, exchange-traded funds (ETFs) and certain indexes as well as quoted prices for similar securities are used and are categorized as Level 2 in the hierarchy in these circumstances. For restricted securities and private placements where observable inputs are limited, assumptions about market activity and risk are used and are categorized as level 3 in the hierarchy.
Annual Report
Notes to Financial Statements - continued
3. Significant Accounting Policies - continued
Security Valuation - continued
Investments in open-end mutual funds including the Fidelity Money Market Central Funds are valued at their closing net asset value each business day and are categorized as Level 1 in the hierarchy. Short-term securities with remaining maturities of sixty days or less for which quotations are not readily available are valued at amortized cost, which approximates value and are categorized as level 2 in the hierarchy.
Foreign Currency. The Fund uses foreign currency contracts to facilitate transactions in foreign-denominated securities. Losses from these transactions may arise from changes in the value of the foreign currency or if the counterparties do not perform under the contracts' terms.
Foreign-denominated assets, including investment securities, and liabilities are translated into U.S. dollars at the exchange rate at period end. Purchases and sales of investment securities, income and dividends received and expenses denominated in foreign currencies are translated into U.S. dollars at the exchange rate in effect on the transaction date.
The effects of exchange rate fluctuations on investments are included with the net realized and unrealized gain (loss) on investment securities. Other foreign currency transactions resulting in realized and unrealized gain (loss) are disclosed separately.
Investment Transactions and Income. For financial reporting purposes, the Fund's investment holdings and NAV include trades executed through the end of the last business day of the period. The NAV per share for processing shareholder transactions is calculated as of the close of business of the New York Stock Exchange (NYSE), normally 4:00 p.m. Eastern time and includes trades executed through the end of the prior business day. Gains and losses on securities sold are determined on the basis of identified cost. Dividend income is recorded on the ex-dividend date, except for certain dividends from foreign securities where the ex-dividend date may have passed, which are recorded as soon as the Fund is informed of the ex-dividend date. Non-cash dividends included in dividend income, if any, are recorded at the fair market value of the securities received. Distributions received on securities that represent a return of capital or capital gain are recorded as a reduction of cost of investments and/or as a realized gain. The Fund estimates the components of distributions received that may be considered return of capital distributions or capital gain distributions. Large, non-recurring dividends recognized by the Fund are presented separately on the Statement of Operations as "Special Dividends" and the impact of these dividends is presented in the Financial Highlights. Interest income and distributions from the Fidelity Central Funds are accrued as earned. Interest income includes coupon interest and amortization of premium and accretion of discount on debt securities. Investment income is recorded net of foreign taxes withheld where recovery of such taxes is uncertain.
Expenses. Most expenses of the trust can be directly attributed to a fund. Expenses which cannot be directly attributed are apportioned among each Fund in the trust. Expense estimates are accrued in the period to which they relate and adjustments are made when actual amounts are known.
Income Tax Information and Distributions to Shareholders. Each year, the Fund intends to qualify as a regulated investment company by distributing substantially all of its taxable income and realized gains under Subchapter M of the Internal Revenue Code and filing its U.S. federal tax return. As a result, no provision for income taxes is required. As of December 31, 2009, the Fund did not have any unrecognized tax benefits in the accompanying financial statements. A Fund's federal tax return is subject to examination by the Internal Revenue Service (IRS) for a period of three years. Foreign taxes are provided for based on the Fund's understanding of the tax rules and rates that exist in the foreign markets in which it invests.
Distributions are recorded on the ex-dividend date. Income dividends and capital gain distributions are declared separately for each class. Income and capital gain distributions are determined in accordance with income tax regulations, which may differ from generally accepted accounting principles.
Capital accounts within the financial statements are adjusted for permanent book-tax differences. These adjustments have no impact on net assets or the results of operations. Temporary book-tax differences will reverse in a subsequent period.
Book-tax differences are primarily due to the short-term gain distributions from the Fidelity Central Funds, foreign currency transactions, passive foreign investment companies (PFIC), market discount capital loss carryforwards, and losses deferred due to wash sales and excise tax regulations.
The federal tax cost of investment securities and unrealized appreciation (depreciation) as of period end were as follows:
Gross unrealized appreciation | $ 11,319,288 |
Gross unrealized depreciation | (4,513,518) |
Net unrealized appreciation (depreciation) | $ 6,805,770 |
| |
Tax Cost | $ 70,036,458 |
Annual Report
3. Significant Accounting Policies - continued
Income Tax Information and Distributions to Shareholders - continued
The tax-based components of distributable earnings as of period end were as follows:
Undistributed ordinary income | $ 14,335 |
Capital loss carryforward | $ (8,047,800) |
Net unrealized appreciation (depreciation) | $ 6,805,756 |
The tax character of distributions paid was as follows:
| December 31, 2009 | December 31, 2008 |
Ordinary Income | $ 512,074 | $ 351,561 |
Trading (Redemption) Fees. Shares held less than 60 days are subject to a redemption fee equal to 1% of the proceeds of the redeemed shares. All redemption fees, including any estimated redemption fees paid by FMR, are retained by the Fund and accounted for as an addition to paid in capital.
4. Purchases and Sales of Investments.
Purchases and sales of securities, other than short-term securities, aggregated $75,764,703 and $40,952,205, respectively.
5. Fees and Other Transactions with Affiliates.
Management Fee. FMR and its affiliates provide the Fund with investment management related services for which the Fund pays a monthly management fee. The management fee is the sum of an individual fund fee rate that is based on an annual rate of .30% of the Fund's average net assets and a group fee rate that averaged .26% during the period. The group fee rate is based upon the average net assets of all the mutual funds advised by FMR. The group fee rate decreases as assets under management increase and increases as assets under management decrease. For the period, the total annual management fee rate was .56% of the Fund's average net assets.
Transfer Agent Fees. Fidelity Investments Institutional Operations Company, Inc. (FIIOC), an affiliate of FMR, is the Fund's transfer, dividend disbursing, and shareholder servicing agent. FIIOC receives an asset-based fee with respect to each class. Each class (with the exception of Investor Class) pays a transfer agent fee, excluding out of pocket expenses, equal to an annual rate of .07% of average net assets. Investor Class pays a monthly asset-based transfer agent fee of .15% of average net assets. The total transfer agent fees paid by each class to FIIOC, including out of pocket expenses, were as follows:
Initial Class | $ 18,560 |
Investor Class | 36,188 |
| $ 54,748 |
Accounting and Security Lending Fees. Fidelity Service Company, Inc. (FSC), an affiliate of FMR, maintains the Fund's accounting records. The accounting fee is based on the level of average net assets for the month. Under a separate contract, FSC administers the security lending program. The security lending fee is based on the number and duration of lending transactions.
Brokerage Commissions. The Fund placed a portion of its portfolio transactions with brokerage firms which are affiliates of the investment adviser. The commissions paid to these affiliated firms were $1,205 for the period.
6. Committed Line of Credit.
The Fund participates with other funds managed by FMR in a $3.5 billion credit facility (the "line of credit") to be utilized for temporary or emergency purposes to fund shareholder redemptions or for other short-term liquidity purposes. The Fund has agreed to pay commitment fees on its pro-rata portion of the line of credit, which amounted to $140 and is reflected in Miscellaneous Expense on the Statement of Operations. During the period, there were no borrowings on this line of credit.
Annual Report
Notes to Financial Statements - continued
7. Security Lending.
The Fund lends portfolio securities from time to time in order to earn additional income. On the settlement date of the loan, the Fund receives collateral (in the form of U.S. Treasury obligations, letters of credit and/or cash) against the loaned securities and maintains collateral in an amount not less than 100% of the market value of the loaned securities during the period of the loan. The market value of the loaned securities is determined at the close of business of the Fund and any additional required collateral is delivered to the Fund on the next business day. If the borrower defaults on its obligation to return the securities loaned because of insolvency or other reasons, a fund could experience delays and costs in recovering the securities loaned or in gaining access to the collateral. Any cash collateral received is invested in the Fidelity Securities Lending Cash Central Fund. The value of loaned securities and cash collateral at period end are disclosed on the Fund's Statement of Assets and Liabilities. Security lending income represents the income earned on investing cash collateral, less fees and expenses associated with the loan, plus any premium payments that may be received on the loan of certain types of securities. Security lending income is presented in the Statement of Operations as a component of income from Fidelity Central Funds. Net income from lending portfolio securities during the period amounted to $871.
8. Expense Reductions.
Many of the brokers with whom FMR places trades on behalf of the Fund provided services to the Fund in addition to trade execution. These services included payments of certain expenses on behalf of the Fund totaling $3,911 for the period.
9. Distributions to Shareholders.
Distributions to shareholders of each class were as follows:
Years ended December 31, | 2009 | 2008 |
From net investment income | | |
Initial Class | $ 246,700 | $ 130,583 |
Investor Class | 265,374 | 88,836 |
Total | $ 512,074 | $ 219,419 |
From net realized gain | | |
Initial Class | - | 69,513 |
Investor Class | - | 62,629 |
Total | $ - | $ 132,142 |
10. Share Transactions.
Transactions for each class of shares were as follows:
| Shares | Dollars |
Years ended December 31, | 2009 | 2008 | 2009 | 2008 |
Initial Class | | | | |
Shares sold | 2,411,066 | 2,413,136 | $ 19,464,964 | $ 26,368,625 |
Reinvestment of distributions | 24,695 | 29,762 | 246,700 | 200,096 |
Shares redeemed | (816,551) | (1,958,182) | (5,916,524) | (18,118,552) |
Net increase (decrease) | 1,619,210 | 484,716 | $ 13,795,140 | $ 8,450,169 |
Investor Class | | | | |
Shares sold | 2,970,858 | 2,230,231 | $ 25,184,648 | $ 25,342,249 |
Reinvestment of distributions | 26,564 | 21,729 | 265,374 | 151,465 |
Shares redeemed | (586,859) | (1,869,798) | (4,419,407) | (18,234,048) |
Net increase (decrease) | 2,410,563 | 382,162 | $ 21,030,615 | $ 7,259,666 |
11. Other.
The Fund's organizational documents provide former and current trustees and officers with a limited indemnification against liabilities arising in connection with the performance of their duties to the Fund. In the normal course of business, the Fund may also enter into contracts that provide general indemnifications. The Fund's maximum exposure under these arrangements is unknown as this would be dependent on future claims that may be made against the Fund. The risk of material loss from such claims is considered remote.
At the end of the period, FMR or its affiliates were the owners of record of 100% of the total outstanding shares of the Fund.
Annual Report
Report of Independent Registered Public Accounting Firm
To the Trustees of Variable Insurance Products Fund IV and the Shareholders of VIP Materials Portfolio:
In our opinion, the accompanying statement of assets and liabilities, including the schedule of investments, and the related statements of operations and of changes in net assets and the financial highlights present fairly, in all material respects, the financial position of VIP Materials Portfolio (a fund of Variable Insurance Products Fund IV) at December 31, 2009, the results of its operations for the year then ended, the changes in its net assets for each of the two years in the period then ended and the financial highlights for each of the periods indicated, in conformity with accounting principles generally accepted in the United States of America. These financial statements and financial highlights (hereafter referred to as "financial statements") are the responsibility of the VIP Materials Portfolio's management. Our responsibility is to express an opinion on these financial statements based on our audits. We conducted our audits of these financial statements in accordance with the standards of the Public Company Accounting Oversight Board (United States). Those standards require that we plan and perform the audit to obtain reasonable assurance about whether the financial statements are free of material misstatement. An audit includes examining, on a test basis, evidence supporting the amounts and disclosures in the financial statements, assessing the accounting principles used and significant estimates made by management, and evaluating the overall financial statement presentation. We believe that our audits, which included confirmation of securities at December 31, 2009 by correspondence with the custodian and brokers, provide a reasonable basis for our opinion.
/s/ PricewaterhouseCoopers LLP
PricewaterhouseCoopers LLP
Boston, Massachusetts
February 12, 2010
Annual Report
The Trustees, Member of the Advisory Board, and executive officers of the trust and fund, as applicable, are listed below. The Board of Trustees governs the fund and is responsible for protecting the interests of shareholders. The Trustees are experienced executives who meet periodically throughout the year to oversee the fund's activities, review contractual arrangements with companies that provide services to the fund, and review the fund's performance. Except for James C. Curvey, each of the Trustees oversees 222 funds advised by FMR or an affiliate. Mr. Curvey oversees 410 funds advised by FMR or an affiliate.
The Trustees hold office without limit in time except that (a) any Trustee may resign; (b) any Trustee may be removed by written instrument, signed by at least two-thirds of the number of Trustees prior to such removal; (c) any Trustee who requests to be retired or who has become incapacitated by illness or injury may be retired by written instrument signed by a majority of the other Trustees; and (d) any Trustee may be removed at any special meeting of shareholders by a two-thirds vote of the outstanding voting securities of the trust. Each Trustee who is not an interested person (as defined in the 1940 Act) (Independent Trustee), shall retire not later than the last day of the calendar year in which his or her 72nd birthday occurs. The Independent Trustees may waive this mandatory retirement age policy with respect to individual Trustees. The executive officers and Advisory Board Member hold office without limit in time, except that any officer and Advisory Board Member may resign or may be removed by a vote of a majority of the Trustees at any regular meeting or any special meeting of the Trustees. Except as indicated, each individual has held the office shown or other offices in the same company for the past five years.
The fund's Statement of Additional Information (SAI) includes more information about the Trustees. To request a free copy, call Fidelity at 1-800-544-8544.
Interested Trustees*:
Correspondence intended for each Trustee who is an interested person may be sent to Fidelity Investments, 82 Devonshire Street, Boston, Massachusetts 02109.
Name, Age; Principal Occupation |
Edward C. Johnson 3d (79) |
| Year of Election or Appointment: 1983 Mr. Johnson is Trustee and Chairman of the Board of Trustees of certain Trusts. Mr. Johnson serves as Chief Executive Officer, Chairman, and a Director of FMR LLC; Chairman and a Director of FMR; Chairman and a Director of Fidelity Research & Analysis Company (FRAC); Chairman and a Director of Fidelity Investments Money Management, Inc.; and Chairman and a Director of FMR Co., Inc. In addition, Mr. Johnson serves as Chairman and Director of FIL Limited. Previously, Mr. Johnson served as President of FMR LLC (2006-2007). |
James C. Curvey (74) |
| Year of Election or Appointment: 2007 Mr. Curvey also serves as Trustee (2007-present) of other investment companies advised by FMR. Mr. Curvey is a Director of FMR and FMR Co., Inc. (2007-present). Mr. Curvey is also Vice Chairman (2006-present) and Director of FMR LLC. In addition, Mr. Curvey serves as an Overseer for the Boston Symphony Orchestra and a member of the Trustees of Villanova University. |
* Trustees have been determined to be "Interested Trustees" by virtue of, among other things, their affiliation with the trust or various entities under common control with FMR.
Independent Trustees:
Correspondence intended for each Independent Trustee (that is, the Trustees other than the Interested Trustees) may be sent to Fidelity Investments, P.O. Box 55235, Boston, Massachusetts 02205-5235.
Name, Age; Principal Occupation |
Dennis J. Dirks (61) |
| Year of Election or Appointment: 2005 Prior to his retirement in May 2003, Mr. Dirks was Chief Operating Officer and a member of the Board of The Depository Trust & Clearing Corporation (DTCC). He also served as President, Chief Operating Officer, and Board member of The Depository Trust Company (DTC) and President and Board member of the National Securities Clearing Corporation (NSCC). In addition, Mr. Dirks served as Chief Executive Officer and Board member of the Government Securities Clearing Corporation, Chief Executive Officer and Board member of the Mortgage-Backed Securities Clearing Corporation, as a Trustee and a member of the Finance Committee of Manhattan College (2005-2008), and as a Trustee and a member of the Finance Committee of AHRC of Nassau County (2006-2008). Currently, Mr. Dirks serves as a member of the Board of Directors for The Brookville Center for Children's Services, Inc. (2009-present). |
Alan J. Lacy (56) |
| Year of Election or Appointment: 2008 Mr. Lacy serves as Senior Adviser (2007-present) of Oak Hill Capital Partners, L.P. (private equity). Mr. Lacy also served as Chief Executive Officer (2000-2005) and Vice Chairman (2005-2006) of Sears Holdings Corporation and Sears, Roebuck and Co. (retail). In addition, Mr. Lacy serves as a member of the Board of Directors of The Western Union Company (global money transfer, 2006-present) and Bristol-Myers Squibb Company (global pharmaceuticals, 2007-present). Mr. Lacy is Chairman (2008-present) and a member (2006-present) of the Board of Trustees of The National Parks Conservation Association. |
Ned C. Lautenbach (65) |
| Year of Election or Appointment: 2000 Mr. Lautenbach is Chairman of the Independent Trustees of the Equity and High Income Funds (2006-present). Mr. Lautenbach is an Advisory Partner of Clayton, Dubilier & Rice, Inc. (private equity investment). Previously, Mr. Lautenbach was with the International Business Machines Corporation (IBM) from 1968 until his retirement in 1998. Mr. Lautenbach serves as a Director of Eaton Corporation (diversified industrial) as well as the Philharmonic Center for the Arts in Naples, Florida. Mr. Lautenbach is also a member of the Board of Trustees of Fairfield University (2005-present), as well as a member of the Council on Foreign Relations. Previously, Mr. Lautenbach served as a Director of Sony Corporation (2006-2007). |
Joseph Mauriello (65) |
| Year of Election or Appointment: 2008 Prior to his retirement in January 2006, Mr. Mauriello served in numerous senior management positions including Deputy Chairman and Chief Operating Officer (2004-2005), and Vice Chairman of Financial Services (2002-2004) of KPMG LLP US (professional services, 1965-2005). Mr. Mauriello currently serves as a member of the Board of Directors of XL Capital Ltd. (global insurance and re-insurance, 2006-present) and of Arcadia Resources Inc. (health care services and products, 2007-present). Previously, Mr. Mauriello served as a Director of the Hamilton Funds of the Bank of New York (2006-2007). |
Cornelia M. Small (65) |
| Year of Election or Appointment: 2005 Ms. Small is a member of the Board of Directors of the Teagle Foundation (2009-present). Ms. Small is also a member of the Investment Committee, and Chair (2008-present) and a member of the Board of Trustees of Smith College. In addition, Ms. Small serves on the Investment Committee of the Berkshire Taconic Community Foundation (2008-present). Previously, Ms. Small served as Chairperson of the Investment Committee (2002-2008) of Smith College. In addition, Ms. Small served as Chief Investment Officer, Director of Global Equity Investments, and a member of the Board of Directors of Scudder, Stevens & Clark and Scudder Kemper Investments. |
William S. Stavropoulos (70) |
| Year of Election or Appointment: 2001 Mr. Stavropoulos serves as President and Founder of the Michigan Baseball Foundation, the Great Lakes Loons (2007-present). Mr. Stavropoulos is Chairman Emeritus of the Board of Directors of The Dow Chemical Company, where he previously served in numerous senior management positions, including President, CEO (1995-2000; 2002-2004), Chairman of the Executive Committee (2000-2006), and as a member of the Board of Directors (1990-2006). Currently, Mr. Stavropoulos is a Director of Teradata Corporation (data warehousing and technology solutions, 2008-present), Chemical Financial Corporation, Maersk Inc. (industrial conglomerate), Tyco International, Inc. (multinational manufacturing and services, 2007-present), and a member of the Advisory Board for Metalmark Capital (private equity investment, 2005-present). Mr. Stavropoulos is a special advisor to Clayton, Dubilier & Rice, Inc. (private equity investment). In addition, Mr. Stavropoulos is a member of the University of Notre Dame Advisory Council for the College of Science. |
David M. Thomas (60) |
| Year of Election or Appointment: 2008 Previously, Mr. Thomas served as Executive Chairman (2005-2006) and Chairman and Chief Executive Officer (2000-2005) of IMS Health, Inc. (pharmaceutical and healthcare information solutions). In addition, Mr. Thomas serves as a member of the Board of Directors of Fortune Brands, Inc. (consumer products), and Interpublic Group of Companies, Inc. (marketing communication, 2004-present). |
Michael E. Wiley (59) |
| Year of Election or Appointment: 2008 Mr. Wiley also serves as a Director of Asia Pacific Exploration Consolidated (international oil and gas exploration and production, 2008-present), and as a member of the Board of Trustees of the University of Tulsa (2000-2006; 2007-present). Mr. Wiley serves as a Director of Tesoro Corporation (independent oil refiner and marketer, 2005-present), and a Director of Bill Barrett Corporation (exploration and production, 2005-present). In addition, Mr. Wiley also serves as a Director of Post Oak Bank (privately-held bank, 2004-present). Previously, Mr. Wiley served as a Sr. Energy Advisor of Katzenbach Partners, LLC (consulting, 2006-2007), as an Advisory Director of Riverstone Holdings (private investment), Chairman, President, and CEO of Baker Hughes, Inc. (oilfield services, 2000-2004), and as Director of Spinnaker Exploration Company (exploration and production, 2001-2005). |
Annual Report
Advisory Board Member and Executive Officers:
Correspondence intended for each executive officer and Peter S. Lynch may be sent to Fidelity Investments, 82 Devonshire Street, Boston, Massachusetts 02109.
Name, Age; Principal Occupation |
Peter S. Lynch (65) |
| Year of Election or Appointment: 2003 Member of the Advisory Board of Fidelity's Equity and High Income Funds. Mr. Lynch is Vice Chairman and a Director of FMR and FMR Co., Inc. In addition, Mr. Lynch serves as a Trustee of Boston College and as the Chairman of the Inner-City Scholarship Fund. Previously, Mr. Lynch served on the Special Olympics International Board of Directors (1997-2006). |
Kenneth B. Robins (40) |
| Year of Election or Appointment: 2008 President and Treasurer of Fidelity's Equity and High Income Funds. Mr. Robins also serves as Assistant Treasurer of other Fidelity funds (2009-present) and is an employee of Fidelity Investments (2004-present). Before joining Fidelity Investments, Mr. Robins worked at KPMG LLP, where he was a partner in KPMG's department of professional practice (2002-2004). |
Bruce T. Herring (44) |
| Year of Election or Appointment: 2006 Vice President of certain Equity Funds. Mr. Herring also serves as Group Chief Investments Officer of FMR. Previously, Mr. Herring served as a portfolio manager for Fidelity U.S. Equity Funds. |
Brian B. Hogan (45) |
| Year of Election or Appointment: 2009 Vice President of certain Equity Funds and Vice President of Sector Funds. Mr. Hogan also serves as Senior Vice President, Equity Research of FMR (2006-present) and President of FMR's Equity Division (2009-present). Previously, Mr. Hogan served as a portfolio manager. |
Christopher S. Bartel (38) |
| Year of Election or Appointment: 2009 Vice President of Fidelity's Sector and Real Estate Equity Funds. Mr. Bartel also serves as Senior Vice President of Equity Research (2009-present). Previously, Mr. Bartel served as Managing Director of Research (2006-2009) and an analyst and portfolio manager (2000-2006). |
Scott C. Goebel (41) |
| Year of Election or Appointment: 2008 Secretary and Chief Legal Officer (CLO) of the Fidelity funds. Mr. Goebel also serves as General Counsel, Secretary, and Senior Vice President of FMR (2008-present) and FMR Co., Inc. (2008-present); Deputy General Counsel of FMR LLC; Chief Legal Officer of Fidelity Management & Research (Hong Kong) Limited (2008-present) and Assistant Secretary of Fidelity Management & Research (Japan) Inc. (2008-present), Fidelity Investments Money Management, Inc. (2008-present), Fidelity Management & Research (U.K.) Inc. (2008-present), and Fidelity Research and Analysis Company (2008-present). Previously, Mr. Goebel served as Assistant Secretary of the Funds (2007-2008) and as Vice President and Secretary of Fidelity Distributors Corporation (FDC) (2005-2007). |
William C. Coffey (40) |
| Year of Election or Appointment: 2009 Assistant Secretary of Fidelity's Equity and High Income Funds. Mr. Coffey also serves as Vice President and Associate General Counsel of FMR LLC (2005-present), and is an employee of Fidelity Investments. |
Holly C. Laurent (55) |
| Year of Election or Appointment: 2008 Anti-Money Laundering (AML) Officer of the Fidelity funds. Ms. Laurent is an employee of Fidelity Investments. Previously, Ms. Laurent was Senior Vice President and Head of Legal for Fidelity Business Services India Pvt. Ltd. (2006-2008), and Senior Vice President, Deputy General Counsel and Group Head for FMR LLC (2005-2006). |
Christine Reynolds (51) |
| Year of Election or Appointment: 2008 Chief Financial Officer of the Fidelity funds. Ms. Reynolds became President of Fidelity Pricing and Cash Management Services (FPCMS) in August 2008. Ms. Reynolds served as Chief Operating Officer of FPCMS (2007-2008). Previously, Ms. Reynolds served as President, Treasurer, and Anti-Money Laundering officer of the Fidelity funds (2004-2007). |
Kenneth A. Rathgeber (62) |
| Year of Election or Appointment: 2004 Chief Compliance Officer of Fidelity's Equity and High Income Funds. Mr. Rathgeber is Chief Compliance Officer of Fidelity Management & Research (Hong Kong) Limited (2008-present), Fidelity Management & Research (Japan) Inc. (2008-present), FMR (2005-present), FMR Co., Inc. (2005-present), Fidelity Management & Research (U.K.) Inc. (2005-present), Fidelity Research & Analysis Company (2005-present), Fidelity Investments Money Management, Inc. (2005-present), Pyramis Global Advisors, LLC (2005-present), and Strategic Advisers, Inc. (2005-present). |
Jeffrey S. Christian (48) |
| Year of Election or Appointment: 2009 Deputy Treasurer of the Fidelity funds. Mr. Christian is an employee of Fidelity Investments. Previously, Mr. Christian served as Chief Financial Officer (2008-2009) of certain Fidelity funds, Senior Vice President of Fidelity Pricing and Cash Management Services (FPCMS) (2004-2009), and as Vice President of Business Analysis (2003-2004). |
Bryan A. Mehrmann (48) |
| Year of Election or Appointment: 2005 Deputy Treasurer of the Fidelity funds. Mr. Mehrmann is an employee of Fidelity Investments. Previously, Mr. Mehrmann served as Vice President of Fidelity Investments Institutional Services Group (FIIS)/Fidelity Investments Institutional Operations Company, Inc. (FIIOC) Client Services (1998-2004). |
Adrien E. Deberghes (42) |
| Year of Election or Appointment: 2008 Deputy Treasurer of Fidelity's Equity and High Income Funds. Mr. Deberghes is an employee of Fidelity Investments (2008-present). Previously, Mr. Deberghes served as Senior Vice President of Mutual Fund Administration at State Street Corporation (2007-2008), Senior Director of Mutual Fund Administration at Investors Bank & Trust (2005-2007), and Director of Finance for Dunkin' Brands (2000-2005). |
John R. Hebble (51) |
| Year of Election or Appointment: 2009 Assistant Treasurer of Fidelity's Equity and High Income Funds. Mr. Hebble also serves as President and Treasurer of other Fidelity funds (2008-present) and is an employee of Fidelity Investments. |
Paul M. Murphy (62) |
| Year of Election or Appointment: 2007 Assistant Treasurer of the Fidelity funds. Mr. Murphy is an employee of Fidelity Investments. Previously, Mr. Murphy served as Chief Financial Officer of the Fidelity funds (2005-2006), Vice President and Associate General Counsel of FMR (2007), and Senior Vice President of Fidelity Pricing and Cash Management Services (FPCMS) (1994-2007). |
Gary W. Ryan (51) |
| Year of Election or Appointment: 2005 Assistant Treasurer of the Fidelity funds. Mr. Ryan is an employee of Fidelity Investments. Previously, Mr. Ryan served as Vice President of Fund Reporting in Fidelity Pricing and Cash Management Services (FPCMS) (1999-2005). |
Annual Report
The Board of Trustees of VIP Materials Portfolio voted to pay to shareholders of record at the opening of business on record date, the following distributions per share derived from capital gains realized from sales of portfolio securities:
| Pay Date | Record Date | Capital Gains |
Initial Class | 02/05/10 | 02/05/10 | $0.003 |
Investors Class | 02/05/10 | 02/05/10 | $0.003 |
Initial Class, Investors Class each designates 100% of the dividend distributed in December 2009 during the fiscal year as qualifying for the dividends-received deduction for corporate shareholders.
The fund will notify shareholders in January 2010 of amounts for use in preparing 2009 income tax returns.
Annual Report
Board Approval of Investment Advisory Contracts and Management Fees
VIP Materials Portfolio
Each year, the Board of Trustees, including the Independent Trustees (together, the Board), votes on the renewal of the management contract and sub-advisory agreements (together, the Advisory Contracts) for the fund. The Board, assisted by the advice of fund counsel and Independent Trustees' counsel, requests and considers a broad range of information throughout the year.
The Board meets regularly and, acting directly and through its separate committees, requests and receives information concerning, and considers at each of its meetings factors that are relevant to, its annual consideration of the renewal of the fund's Advisory Contracts, including the services and support provided to the fund and its shareholders. The Board has established various standing committees, each composed of Independent Trustees with varying backgrounds, to which the Board has assigned specific subject matter responsibilities in order to enhance effective decision-making by the Board. Each committee has a written charter outlining the structure and purposes of the committee. The Board also meets as needed to consider matters specifically related to the Board's annual consideration of the renewal of Advisory Contracts.
At its July 2009 meeting, the Board of Trustees, including the Independent Trustees, unanimously determined to renew the fund's Advisory Contracts. In reaching its determination, the Board considered all factors it believed relevant, including (i) the nature, extent, and quality of the services to be provided to the fund and its shareholders (including the investment performance of the fund); (ii) the competitiveness of the fund's management fee and total expenses; (iii) the total costs of the services to be provided by and the profits to be realized by Fidelity from its relationship with the fund; (iv) the extent to which economies of scale would be realized as the fund grows; and (v) whether fee levels reflect these economies of scale, if any, for the benefit of fund shareholders.
In considering whether to renew the Advisory Contracts for the fund, the Board ultimately reached a determination, with the assistance of fund counsel and Independent Trustees' counsel and through the exercise of its business judgment, that the renewal of the Advisory Contracts and the compensation to be received by Fidelity under the management contract is consistent with Fidelity's fiduciary duty under applicable law. The Board's decision to renew the Advisory Contracts was not based on any single factor noted above, but rather was based on a comprehensive consideration of all the information provided to the Board at its meetings throughout the year. The Board, in reaching its determination to renew the Advisory Contracts, is aware that shareholders in the fund have a broad range of investment choices available to them, including a wide choice among mutual funds offered by competitors to Fidelity, and that the fund's shareholders, with the opportunity to review and weigh the disclosure provided by the fund in its prospectus and other public disclosures, have chosen to invest in this fund, managed by Fidelity.
Nature, Extent, and Quality of Services Provided. The Board considered staffing within the investment adviser, FMR, and the sub-advisers (together, the Investment Advisers), including the backgrounds of the fund's investment personnel and the fund's investment objective and discipline. The Independent Trustees also had discussions with senior management of Fidelity's investment operations and investment groups. The Board considered the structure of the portfolio manager compensation program and whether this structure provides appropriate incentives.
Resources Dedicated to Investment Management and Support Services. The Board reviewed the size, education, and experience of the Investment Advisers' investment staff, their use of technology, and the Investment Advisers' approach to recruiting, training, and retaining portfolio managers and other research, advisory, and management personnel. In response to last year's financial crisis, FMR took a number of actions intended to cut costs and improve efficiency without weakening the investment teams or resources. The Board noted that Fidelity's analysts have access to a variety of technological tools and market and securities data that enable them to perform both fundamental and quantitative analysis and to specialize in various disciplines. The Board considered Fidelity's extensive global research capabilities that enable the Investment Advisers to aggregate data from various sources in an effort to produce positive investment results. The Board also considered that Fidelity's portfolio managers and analysts have access to daily portfolio attribution that allows for monitoring of a fund's portfolio, as well as an electronic communication system that provides immediate real-time access to research concerning issuers and credit enhancers.
Shareholder and Administrative Services. The Board considered (i) the nature, extent, quality, and cost of advisory, administrative, distribution, and shareholder services performed by the Investment Advisers and their affiliates under the Advisory Contracts and under separate agreements covering transfer agency, pricing and bookkeeping, and securities lending services for the fund; (ii) the nature and extent of the Investment Advisers' supervision of third party service providers, principally custodians and subcustodians; and (iii) the resources devoted to, and the record of compliance with, the fund's compliance policies and procedures. The Board also reviewed the allocation of fund brokerage, including allocations to brokers affiliated with the Investment Advisers, the use of brokerage commissions to pay fund expenses, and the use of "soft" commission dollars to pay for research services.
The Board noted that the growth of fund assets across the complex allows Fidelity to reinvest in the development of services designed to enhance the value or convenience of the Fidelity funds as investment vehicles. These services include 24-hour access to account information and market information through phone representatives and over the Internet, and investor education materials and asset allocation tools.
Investment in a Large Fund Family. The Board considered the benefits to shareholders of investing in a Fidelity fund, including the benefits of investing in a fund that is part of a large family of funds offering a variety of investment disciplines and providing for a large variety of mutual fund investor services. The Board noted that Fidelity has taken a number of actions over the previous year that benefited particular funds, including (i) dedicating additional resources to investment research and to restructure and broaden the focus of the investment research teams; (ii) bolstering the senior management team that oversees asset management; (iii) contractually agreeing to reduce the management fee on Fidelity U.S. Bond Index Fund; and (iv) expanding Class A and Class T load waiver categories to increase rollover retention opportunities and create consistent policies across the classes.
Annual Report
Investment Performance. The Board considered whether the fund has operated within its investment objective, as well as its record of compliance with its investment restrictions. It also reviewed the fund's absolute investment performance for each class, as well as the fund's relative investment performance for each class measured against a third-party-sponsored index that reflects the market sector in which the fund invests. The Board noted that FMR does not believe that a meaningful peer group exists against which to compare the fund's performance. Because the fund had been in existence less than three calendar years, the following chart considered by the Board shows, for the one-year period ended December 31, 2008, the total returns of Initial Class and Investor Class of the fund and the total return of a third-party-sponsored index ("benchmark").
VIP Materials Portfolio
The Board stated that the investment performance of the fund was lower than its benchmark for the period shown. The Board considered that the variations in performance between the fund's classes reflect the variations in class expenses, which result in lower performance for the higher expense class. The Board stated that it is difficult to evaluate in any comprehensive fashion the performance of the fund, in light of its relatively recent commencement of operations.
The Board considered that FMR has taken steps to refocus and strengthen equity research, equity portfolio management, and compliance. The Board reviewed the year-to-date performance of Initial Class through May 31, 2009 and stated that it exceeded the fund's benchmark.
Based on its review, and giving particular weight to the nature and quality of the resources dedicated by the Investment Advisers to maintain and improve relative performance and factoring in the unprecedented market events in 2008, the Board concluded that the nature, extent, and quality of the services provided to the fund will benefit the fund's shareholders, particularly in light of the Board's view that the fund's shareholders benefit from investing in a fund that is part of a large family of funds offering a variety of investment disciplines and services.
Competitiveness of Management Fee and Total Fund Expenses. The Board considered the fund's management fee and total expenses compared to "mapped groups" of competitive funds and classes. Fidelity creates "mapped groups" by combining similar Lipper investment objective categories that have comparable management fee characteristics. Combining Lipper investment objective categories aids the Board's management fee and total expense comparisons by broadening the competitive group used for comparison and by reducing the number of universes to which various Fidelity funds are compared.
The Board considered two proprietary management fee comparisons for the 12-month (or shorter) periods shown in the chart below. The group of Lipper funds used by the Board for management fee comparisons is referred to below as the "Total Mapped Group." The Total Mapped Group comparison focuses on a fund's standing relative to the total universe of comparable funds available to investors, in terms of gross management fees before expense reimbursements or caps. "TMG %" represents the percentage of funds in the Total Mapped Group that had management fees that were lower than the fund's. For example, a TMG % of 4% means that 96% of the funds in the Total Mapped Group had higher management fees than the fund. The "Asset-Size Peer Group" (ASPG) comparison focuses on a fund's standing relative to non-Fidelity funds similar in size to the fund within the Total Mapped Group. The ASPG represents at least 15% of the funds in the Total Mapped Group with comparable asset size and management fee characteristics, subject to a minimum of 50 funds (or all funds in the Total Mapped Group if fewer than 50). Additional information, such as the ASPG quartile in which the fund's management fee ranked, is also included in the chart and considered by the Board.
Annual Report
Board Approval of Investment Advisory Contracts and Management Fees - continued
VIP Materials Portfolio
The Board noted that the fund's management fee ranked below the median of its Total Mapped Group and below the median of its ASPG for 2008.
Based on its review, the Board concluded that the fund's management fee was fair and reasonable in light of the services that the fund receives and the other factors considered.
In its review of each class's total expenses, the Board considered the fund's management fee as well as other fund or class expenses, as applicable, such as transfer agent fees, pricing and bookkeeping fees, and custodial, legal, and audit fees. The Board also noted the effects of any waivers and reimbursements on fees and expenses. As part of its review, the Board also considered current and historical total expenses of each class of the fund compared to competitive fund median expenses. Each class of the fund is compared to those funds and classes in the Total Mapped Group (used by the Board for management fee comparisons) that have a similar sales load structure.
The Board noted that the total expenses of each class ranked below its competitive median for 2008.
In its review of total expenses, the Board also considered Fidelity fee structures and other information on clients that FMR and its affiliates service in other competitive markets, such as other mutual funds advised or subadvised by FMR or its affiliates, pension plan clients, and other institutional clients.
Based on its review, the Board concluded that the total expenses of each class of the fund were reasonable in light of the services that the fund and its shareholders receive and the other factors considered.
Costs of the Services and Profitability. The Board considered the revenues earned and the expenses incurred by Fidelity in conducting the business of developing, marketing, distributing, managing, administering and servicing the fund and its shareholders. The Board also considered the level of Fidelity's profits in respect of all the Fidelity funds.
On an annual basis, FMR presents to the Board Fidelity's profitability for the fund. Fidelity calculates the profitability for each fund, as well as aggregate profitability for groups of Fidelity funds and all Fidelity funds, using a series of detailed revenue and cost allocation methodologies which originate with the audited books and records of Fidelity. The Audit Committee of the Board reviews any significant changes from the prior year's methodologies.
PricewaterhouseCoopers LLP (PwC), independent registered public accounting firm and auditor to Fidelity and certain Fidelity funds, has been engaged annually by the Board as part of the Board's assessment of Fidelity's profitability analysis. PwC's engagement includes the review and assessment of Fidelity's methodologies used in determining the revenues and expenses attributable to Fidelity's mutual fund business, and completion of agreed-upon procedures surrounding the mathematical accuracy of fund profitability and its conformity to allocation methodologies. After considering PwC's reports issued under the engagement and information provided by Fidelity, the Board believes that while other allocation methods may also be reasonable, Fidelity's profitability methodologies are reasonable in all material respects.
The Board has also reviewed Fidelity's non-fund businesses and any fall-out benefits related to the mutual fund business as well as cases where Fidelity's affiliates may benefit from or be related to the fund's business.
Annual Report
The Board considered the costs of the services provided by and the profits realized by Fidelity in connection with the operation of the fund and determined that the amount of profit is a fair entrepreneurial profit for the management of the fund.
Economies of Scale. The Board considered whether there have been economies of scale in respect of the management of the Fidelity funds, whether the Fidelity funds (including the fund) have appropriately benefited from any such economies of scale, and whether there is potential for realization of any further economies of scale. The Board considered the extent to which the fund will benefit from economies of scale through increased services to the fund, through waivers or reimbursements, or through fee or expense reductions.
In February 2009, the Board created an Ad Hoc Committee (the "Committee") to analyze economies of scale. The Committee was formed to consider whether FMR attains economies of scale in respect of the management and servicing of the Fidelity funds, whether the Fidelity funds have appropriately benefited from such economies of scale, and whether there is potential for realization of any further economies of scale.
The Board recognized that the fund's management contract incorporates a "group fee" structure, which provides for lower group fee rates as total fund assets under FMR's management increase, and for higher group fee rates as total fund assets under FMR's management decrease. FMR determines the group fee rates based on a tiered asset "breakpoint" schedule. The Board considered that the group fee is designed to deliver the benefits of economies of scale to fund shareholders when total fund assets increase, even if assets of any particular fund are unchanged or have declined, because some portion of Fidelity's costs are attributable to services provided to all Fidelity funds, and all funds benefit if those costs can be allocated among more assets. The Board concluded that, given the group fee structure, fund shareholders will achieve a certain level of economies of scale as assets under FMR's management increase at the fund complex level, regardless of whether Fidelity achieves any such economies of scale.
The Board concluded, considering the findings of the Committee, that any potential economies of scale are being shared between fund shareholders and Fidelity in an appropriate manner.
Additional Information Requested by the Board. In order to develop fully the factual basis for consideration of the Fidelity funds' Advisory Contracts, the Board requested and received additional information on certain topics, including (i) fund performance trends, actions to be taken by FMR to improve certain funds' overall performance and Fidelity's long-term strategies for certain funds; (ii) portfolio manager changes that have occurred during the past year; (iii) Fidelity's compensation structure for portfolio managers and key personnel, including performance benchmarks used by Fidelity in evaluating incentive compensation for portfolio managers and research analysts; (iv) the structure and process of equity research and actions taken by FMR to improve the quality of research; (v) the selection of and compensation paid by FMR to fund sub-advisers; (vi) Fidelity's fee structures and rationale for recommending different fees among categories of funds; (vii) the rationale for any differences between fund fee structures and fee structures in place for other Fidelity clients; (viii) Fidelity's rationale for recommending which funds should have a performance adjustment component as part of their management fees; and (ix) explanations for the relative total expenses borne by certain funds and classes, total expense competitive trends, and actions that might be taken by FMR to reduce total expenses for certain funds and classes.
Based on its evaluation of all of the conclusions noted above, and after considering all material factors, the Board ultimately concluded that the advisory fee structures are fair and reasonable, and that the fund's Advisory Contracts should be renewed.
Annual Report
Investment Adviser
Fidelity Management & Research Company
Boston, MA
Investment Sub-Advisers
FMR Co., Inc.
Fidelity Management & Research (U.K.) Inc.
Fidelity Research & Analysis Company
FIL Investments (Japan) Limited
FIL Investment Advisors
FIL Investment Advisors (U.K.) Ltd.
Fidelity Management & Research (Hong Kong) Limited
Fidelity Management & Research (Japan) Inc.
General Distributor
Fidelity Distributors Corporation
Boston, MA
Transfer and Service Agents
Fidelity Investments Institutional Operations Company, Inc.
Boston, MA
Fidelity Service Company, Inc.
Boston, MA
Custodian
State Street Bank and Trust Company
Quincy, MA
VMATP-ANN-0210
1.850999.102
Fidelity® Variable Insurance Products:
Real Estate Portfolio
Annual Report
December 31, 2009
(2_fidelity_logos) (Registered_Trademark)
Contents
Performance | <Click Here> | How the fund has done over time. |
Management's Discussion | <Click Here> | The manager's review of fund performance, strategy and outlook. |
Shareholder Expense Example | <Click Here> | An example of shareholder expenses. |
Investment Changes | <Click Here> | A summary of major shifts in the fund's investments over the past six months. |
Investments | <Click Here> | A complete list of the fund's investments with their market values. |
Financial Statements | <Click Here> | Statements of assets and liabilities, operations, and changes in net assets, as well as financial highlights. |
Notes | <Click Here> | Notes to the financial statements. |
Report of Independent Registered Public Accounting Firm | <Click Here> | |
Trustees and Officers | <Click Here> | |
Board Approval of Investment Advisory Contracts and Management Fees | <Click Here> | |
To view a fund's proxy voting guidelines and proxy voting record for the 12-month period ended June 30, visit http://www.fidelity.com/proxyvotingresults or visit the Securities and Exchange Commission's (SEC) web site at http://www.sec.gov. You may also call 1-877-208-0098 to request a free copy of the proxy voting guidelines.
Fidelity Variable Insurance Products are separate account options which are purchased through a variable insurance contract.
Standard & Poor's, S&P and S&P 500 are registered service marks of The McGraw-Hill Companies, Inc. and have been licensed for use by Fidelity Distributors Corporation.
Other third party marks appearing herein are the property of their respective owners.
All other marks appearing herein are registered or unregistered trademarks or service marks of FMR LLC or an affiliated company.
This report and the financial statements contained herein are submitted for the general information of the shareholders of the fund. This report is not authorized for distribution to prospective investors in the fund unless preceded or accompanied by an effective prospectus.
A fund files its complete schedule of portfolio holdings with the SEC for the first and third quarters of each fiscal year on Form N-Q. Forms N-Q are available on the SEC's web site at http://www.sec.gov. A fund's Forms N-Q may be reviewed and copied at the SEC's Public Reference Room in Washington, DC. Information regarding the operation of the SEC's Public Reference Room may be obtained by calling 1-800-SEC-0330. For a complete list of a fund's portfolio holdings, view the most recent holdings listing, semiannual report, or annual report on Fidelity's web site at http://www.fidelity.com or http://www.advisor.fidelity.com, as applicable.
NOT FDIC INSURED · MAY LOSE VALUE · NO BANK GUARANTEE
Neither the fund nor Fidelity Distributors Corporation is a bank.
Annual Report
Average annual total return reflects the change in the value of an investment, assuming reinvestment of the class' dividend income and capital gains (the profits earned upon the sale of securities that have grown in value, if any) and assuming a constant rate of performance each year. During periods of reimbursement by Fidelity, a fund's total return will be greater than it would be had the reimbursement not occurred. Performance numbers are net of all underlying fund operating expenses, but do not include any insurance charges imposed by your insurance company's separate account. If performance information included the effect of these additional charges, the total returns would have been lower. How a fund did yesterday is no guarantee of how it will do tomorrow.
Average Annual Total Returns
Periods ended December 31, 2009 | Past 1
year | Past 5
years | Life of fund A |
VIP Real Estate - Initial Class | 37.69% | 1.40% | 9.91% |
VIP Real Estate - Service Class B | 37.62% | 1.31% | 9.80% |
VIP Real Estate - Service Class 2 C | 37.40% | 1.15% | 9.63% |
VIP Real Estate - Investor Class D | 37.57% | 1.31% | 9.83% |
A From November 6, 2002.
B Performance for Service Class shares reflects an asset-based service fee (12b-1 fee).
C Performance for Service Class 2 shares reflects an asset-based service fee (12b-1 fee).
D The initial offering of Investor Class shares took place on July 21, 2005. Returns prior to July 21, 2005 are those of Initial Class. Had Investor Class's transfer agent fee been reflected, returns prior to July 21, 2005 would have been lower.
$10,000 Over Life of Fund
Let's say hypothetically that $10,000 was invested in VIP Real Estate Portfolio - Initial Class on November 6, 2002, when the fund started. The chart shows how the value of your investment would have changed, and also shows how the Standard & Poor's 500SM Index (S&P 500®) performed over the same period.
Annual Report
Market Recap: In 2009, most global markets saw both crippling lows and considerable highs. After a dismal start, the economy began to show signs of improvement, suggesting that a recovery was on the horizon. Credit markets began to heal as fiscal and monetary stimulus efforts around the world started to take effect, and corporate earnings staged an impressive rebound, fueled in large part by massive cost cutting. As a result, the flight to quality that marked most of 2008 and early 2009 shifted in March as investors flocked to riskier asset categories. The U.S. equity market, as measured by the bellwether Standard & Poor's 500SM Index and the blue-chip proxy Dow Jones Industrial AverageSM, reflected this changing environment, gaining 26.46% and 22.68%, respectively. Meanwhile, the technology-laden Nasdaq Composite® Index rose 45.32%. Foreign stocks also produced strong gains, as illustrated by the 31.93% jump of the MSCI® EAFE® Index (Europe, Australasia, Far East), a gauge of developed stock markets outside the U.S. and Canada. Emerging-markets stocks, which suffered their worst calendar-year performance ever in 2008, posted record returns this past year, with the MSCI Emerging Markets Index soaring 79.02%. A depreciating U.S. dollar helped bolster returns for U.S. investors in foreign equities.
Comments from Samuel Wald, Portfolio Manager of VIP Real Estate Portfolio: For the year ending December 31, 2009, the fund significantly outperformed its benchmark, the Dow Jones U.S. Select Real Estate Securities IndexSM, which rose 29.01%. The fund also beat the broad equity market, as measured by the S&P 500®. (For specific portfolio results, please refer to the performance section of this report.) The fund benefited from being more aggressively positioned as the market bounced back. Early in the year, my Fidelity colleagues and I felt that the U.S. Treasury and the Federal Reserve Board were prepared to do everything necessary to keep the economy and the financial markets afloat. This made me increasingly comfortable owning certain riskier assets that I believed had fallen much too far, given their underlying business fundamentals. Many of the stocks displaying such traits ended up doing very well in the rebound. The fund's top individual performer during the past year was Macerich, a mall operator whose shares rose more than sixfold off their March low once it became clear the company would have access to the financing it needed. Real estate services company CB Richard Ellis Group, an out-of-benchmark holding; office REIT SL Green Realty; and hotel REIT Sunstone Hotel all benefited similarly. In all three cases, I felt the stocks were priced far too low, and my willingness to invest based on this conviction worked out very well. Also contributing was an underweighting in Kimco Realty, a shopping center REIT and benchmark component. Kimco was one of the relatively few property companies to lose value last year. Another shopping center REIT, Inland Real Estate, underperformed as well, and being overweighted in this position hampered the fund's results. In addition to being somewhat overleveraged, investors had ongoing concerns about the sluggish economy, which hurt Inland and other shopping center operators needing to fill retail space. Also detracting were LaSalle Hotel Properties and Host Hotels & Resorts. Both were strong performers that I underweighted in favor of Sunstone and other hotel REITs offering what I felt were better opportunities. Neither Inland or LaSalle were owned at period end. Of final note, a modest cash position in a rising market also hurt.
The views expressed above reflect those of the portfolio manager(s) only through the end of the period as stated on the cover of this report and do not necessarily represent the views of Fidelity or any other person in the Fidelity organization. Any such views are subject to change at any time based upon market or other conditions and Fidelity disclaims any responsibility to update such views. These views may not be relied on as investment advice and, because investment decisions for a Fidelity fund are based on numerous factors, may not be relied on as an indication of trading intent on behalf of any Fidelity fund.
Annual Report
As a shareholder of the Fund, you incur two types of costs: (1) transaction costs, and (2) ongoing costs, including management fees, distribution and/or service (12b-1) fees and other Fund expenses. This Example is intended to help you understand your ongoing costs (in dollars) of investing in the Fund and to compare these costs with the ongoing costs of investing in other mutual funds.
The Example is based on an investment of $1,000 invested at the beginning of the period and held for the entire period (July 1, 2009 to December 31, 2009).
Actual Expenses
The first line of the accompanying table for each class of the Fund provides information about actual account values and actual expenses. You may use the information in this line, together with the amount you invested, to estimate the expenses that you paid over the period. Simply divide your account value by $1,000.00 (for example, an $8,600 account value divided by $1,000.00 = 8.6), then multiply the result by the number in the first line for a class of the Fund under the heading entitled "Expenses Paid During Period" to estimate the expenses you paid on your account during this period. The estimate of expenses does not include any fees or other expenses of any variable annuity or variable life insurance product. If they were, the estimate of expenses you paid during the period would be higher, and your ending account value would be lower. In addition, the Fund, as a shareholder in the underlying Fidelity Central Funds, will indirectly bear its pro-rata share of the fees and expenses incurred by the underlying Fidelity Central Funds. These fees and expenses are not included in the Fund's annualized expense ratio used to calculate the expense estimate in the table below.
Hypothetical Example for Comparison Purposes
The second line of the accompanying table for each class of the Fund provides information about hypothetical account values and hypothetical expenses based on a Class' actual expense ratio and an assumed rate of return of 5% per year before expenses, which is not the Class' actual return. The hypothetical account values and expenses may not be used to estimate the actual ending account balance or expenses you paid for the period. You may use this information to compare the ongoing costs of investing in the Fund and other funds. To do so, compare this 5% hypothetical example with the 5% hypothetical examples that appear in the shareholder reports of the other funds. The estimate of expenses does not include any fees or other expenses of any variable annuity or variable life insurance product. If they were, the estimate of expenses you paid during the period would be higher, and your ending account value would be lower. In addition, the Fund, as a shareholder in the underlying Fidelity Central Funds, will indirectly bear its pro-rata share of the fees and expenses incurred by the underlying Fidelity Central Funds. These fees and expenses are not included in the Fund's annualized expense ratio used to calculate the expense estimate in the table below.
Please note that the expenses shown in the table are meant to highlight your ongoing costs only and do not reflect any transaction costs. Therefore, the second line of the table is useful in comparing ongoing costs only, and will not help you determine the relative total costs of owning different funds.
| Annualized
Expense Ratio | Beginning
Account Value
July 1, 2009 | Ending
Account Value
December 31, 2009 | Expenses Paid
During Period*
July 1, 2009 to
December 31, 2009 |
Initial Class | .79% | | | |
Actual | | $ 1,000.00 | $ 1,515.30 | $ 5.01 |
HypotheticalA | | $ 1,000.00 | $ 1,021.22 | $ 4.02 |
Service Class | .87% | | | |
Actual | | $ 1,000.00 | $ 1,514.90 | $ 5.51 |
HypotheticalA | | $ 1,000.00 | $ 1,020.82 | $ 4.43 |
Service Class 2 | 1.06% | | | |
Actual | | $ 1,000.00 | $ 1,513.20 | $ 6.71 |
HypotheticalA | | $ 1,000.00 | $ 1,019.86 | $ 5.40 |
Investor Class | .89% | | | |
Actual | | $ 1,000.00 | $ 1,514.40 | $ 5.64 |
HypotheticalA | | $ 1,000.00 | $ 1,020.72 | $ 4.53 |
A 5% return per year before expenses
* Expenses are equal to each Class' annualized expense ratio, multiplied by the average account value over the period, multiplied by 184/365 (to reflect the one-half year period).
Annual Report
Investment Changes (Unaudited)
Top Ten Stocks as of December 31, 2009 |
| % of fund's
net assets | % of fund's net assets
6 months ago |
Simon Property Group, Inc. | 11.2 | 9.0 |
Ventas, Inc. | 6.2 | 5.9 |
ProLogis Trust | 5.5 | 4.8 |
SL Green Realty Corp. | 4.4 | 3.5 |
Vornado Realty Trust | 4.3 | 3.4 |
Digital Realty Trust, Inc. | 3.9 | 3.8 |
Public Storage | 3.7 | 4.9 |
Equity Residential (SBI) | 3.6 | 2.5 |
HCP, Inc. | 3.1 | 2.9 |
Sunstone Hotel Investors, Inc. | 3.0 | 2.6 |
| 48.9 | |
Top Five REIT Sectors as of December 31, 2009 |
| % of fund's
net assets | % of fund's net assets
6 months ago |
REITs - Office Buildings | 15.8 | 16.7 |
REITs - Malls | 15.3 | 13.2 |
REITs - Industrial Buildings | 13.9 | 13.1 |
REITs - Apartments | 13.4 | 14.5 |
REITs - Health Care Facilities | 10.7 | 11.5 |
Asset Allocation (% of fund's net assets) |
As of December 31, 2009* | As of June 30, 2009** |
| Stocks 97.1% | | | Stocks 97.1% | |
 | Convertible
Securities 0.3% | | | Convertible
Securities 0.0% | |
| Short-Term
Investments and
Net Other Assets 2.6% | | | Short-Term
Investments and
Net Other Assets 2.9% | |
* Foreign investments | 1.0% | | ** Foreign investments | 1.5% | |

Annual Report
Investments December 31, 2009
Showing Percentage of Net Assets
Common Stocks - 97.1% |
| Shares | | Value |
HEALTH CARE PROVIDERS & SERVICES - 1.7% |
Health Care Facilities - 1.7% |
Brookdale Senior Living, Inc. (a) | 6,800 | | $ 123,692 |
Emeritus Corp. (a)(c) | 66,736 | | 1,251,300 |
Sunrise Senior Living, Inc. (a) | 25,400 | | 81,788 |
TOTAL HEALTH CARE FACILITIES | | 1,456,780 |
HOTELS, RESTAURANTS & LEISURE - 0.2% |
Casinos & Gaming - 0.2% |
MGM Mirage, Inc. (a)(c) | 19,900 | | 181,488 |
HOUSEHOLD DURABLES - 0.6% |
Homebuilding - 0.6% |
D.R. Horton, Inc. | 5,000 | | 54,350 |
Lennar Corp. Class A | 7,700 | | 98,329 |
M/I Homes, Inc. (a) | 4,400 | | 45,716 |
Pulte Homes, Inc. | 24,480 | | 244,800 |
Toll Brothers, Inc. (a) | 5,600 | | 105,336 |
TOTAL HOMEBUILDING | | 548,531 |
REAL ESTATE INVESTMENT TRUSTS - 90.2% |
REITs - Apartments - 13.4% |
Apartment Investment & Management Co. Class A | 132,934 | | 2,116,309 |
AvalonBay Communities, Inc. | 14,524 | | 1,192,566 |
Camden Property Trust (SBI) | 30,200 | | 1,279,574 |
Equity Residential (SBI) | 93,372 | | 3,154,106 |
Essex Property Trust, Inc. | 31,229 | | 2,612,306 |
Home Properties, Inc. | 20,500 | | 978,055 |
Mid-America Apartment Communities, Inc. | 4,900 | | 236,572 |
TOTAL REITS - APARTMENTS | | 11,569,488 |
REITs - Factory Outlets - 0.6% |
Tanger Factory Outlet Centers, Inc. | 13,039 | | 508,391 |
REITs - Health Care Facilities - 10.7% |
HCP, Inc. | 88,536 | | 2,703,889 |
Healthcare Realty Trust, Inc. | 45,800 | | 982,868 |
National Health Investors, Inc. | 7,200 | | 266,328 |
Ventas, Inc. | 121,800 | | 5,327,532 |
TOTAL REITS - HEALTH CARE FACILITIES | | 9,280,617 |
REITs - Hotels - 6.5% |
DiamondRock Hospitality Co. | 221,617 | | 1,877,096 |
|
| Shares | | Value |
Host Hotels & Resorts, Inc. | 98,005 | | $ 1,143,718 |
Sunstone Hotel Investors, Inc. | 294,581 | | 2,615,879 |
TOTAL REITS - HOTELS | | 5,636,693 |
REITs - Industrial Buildings - 13.9% |
Duke Realty LP | 170,000 | | 2,068,900 |
First Industrial Realty Trust, Inc. (c) | 68,200 | | 356,686 |
ProLogis Trust | 349,716 | | 4,787,612 |
Public Storage | 39,540 | | 3,220,533 |
U-Store-It Trust | 217,983 | | 1,595,636 |
TOTAL REITS - INDUSTRIAL BUILDINGS | | 12,029,367 |
REITs - Malls - 15.3% |
CBL & Associates Properties, Inc. (c) | 142,788 | | 1,380,760 |
Simon Property Group, Inc. | 121,662 | | 9,708,627 |
The Macerich Co. (c) | 59,984 | | 2,156,425 |
TOTAL REITS - MALLS | | 13,245,812 |
REITs - Management/Investment - 3.9% |
Digital Realty Trust, Inc. (c) | 67,200 | | 3,378,816 |
REITs - Office Buildings - 15.8% |
Alexandria Real Estate Equities, Inc. (c) | 30,933 | | 1,988,683 |
Boston Properties, Inc. | 36,000 | | 2,414,520 |
Brandywine Realty Trust (SBI) | 128,600 | | 1,466,040 |
Corporate Office Properties Trust (SBI) | 54,100 | | 1,981,683 |
Highwoods Properties, Inc. (SBI) | 60,100 | | 2,004,335 |
SL Green Realty Corp. | 76,400 | | 3,838,336 |
TOTAL REITS - OFFICE BUILDINGS | | 13,693,597 |
REITs - Shopping Centers - 10.1% |
Acadia Realty Trust (SBI) | 89,800 | | 1,514,926 |
Developers Diversified Realty Corp. | 141,675 | | 1,311,911 |
Kimco Realty Corp. | 121,025 | | 1,637,468 |
Kite Realty Group Trust | 125,900 | | 512,413 |
Vornado Realty Trust | 53,051 | | 3,710,387 |
TOTAL REITS - SHOPPING CENTERS | | 8,687,105 |
TOTAL REAL ESTATE INVESTMENT TRUSTS | | 78,029,886 |
REAL ESTATE MANAGEMENT & DEVELOPMENT - 4.4% |
Real Estate Operating Companies - 2.1% |
Brookfield Properties Corp. | 68,350 | | 832,704 |
Forest City Enterprises, Inc. Class A | 83,400 | | 982,452 |
TOTAL REAL ESTATE OPERATING COMPANIES | | 1,815,156 |
Common Stocks - continued |
| Shares | | Value |
REAL ESTATE MANAGEMENT & DEVELOPMENT - CONTINUED |
Real Estate Services - 2.3% |
CB Richard Ellis Group, Inc. Class A (a) | 147,567 | | $ 2,002,484 |
TOTAL REAL ESTATE MANAGEMENT & DEVELOPMENT | | 3,817,640 |
TOTAL COMMON STOCKS (Cost $77,356,472) | 84,034,325 |
Convertible Preferred Stocks - 0.3% |
| | | |
REAL ESTATE MANAGEMENT & DEVELOPMENT - 0.3% |
Real Estate Services - 0.3% |
Grubb & Ellis Co.: | | | |
12.00% (d) | 2,000 | | 195,000 |
12.00% (a)(d) | 700 | | 68,250 |
TOTAL REAL ESTATE SERVICES (Cost $270,000) | | 263,250 |
Money Market Funds - 12.1% |
| Shares | | Value |
Fidelity Cash Central Fund, 0.16% (e) | 2,275,798 | | $ 2,275,798 |
Fidelity Securities Lending Cash Central Fund, 0.15% (b)(e) | 8,185,106 | | 8,185,106 |
TOTAL MONEY MARKET FUNDS (Cost $10,460,904) | 10,460,904 |
TOTAL INVESTMENT PORTFOLIO - 109.5% (Cost $88,087,376) | | 94,758,479 |
NET OTHER ASSETS - (9.5)% | | (8,189,243) |
NET ASSETS - 100% | $ 86,569,236 |
Legend |
(a) Non-income producing |
(b) Investment made with cash collateral received from securities on loan. |
(c) Security or a portion of the security is on loan at period end. |
(d) Security exempt from registration under Rule 144A of the Securities Act of 1933. These securities may be resold in transactions exempt from registration, normally to qualified institutional buyers. At the end of the period, the value of these securities amounted to $263,250 or 0.3% of net assets. |
(e) Affiliated Fund that is available only to investment companies and other accounts managed by Fidelity Investments. The rate quoted is the annualized seven-day yield of the Fund at period end. A complete unaudited listing of the Fund's holdings as of its most recent quarter end is available upon request. |
Affiliated Central Funds |
Information regarding fiscal year to date income earned by the Fund from investments in Fidelity Central Funds is as follows: |
Fund | Income earned |
Fidelity Cash Central Fund | $ 7,446 |
Fidelity Securities Lending Cash Central Fund | 7,529 |
Total | $ 14,975 |
Other Information |
The following is a summary of the inputs used, as of December 31, 2009, involving the Fund's assets and liabilities carried at value. The inputs or methodology used for valuing securities may not be an indication of the risk associated with investing in those securities. For more information on valuation inputs, and their aggregation into the levels used in the table below, please refer to the Security Valuation section in the accompanying Notes to Financial Statements. |
Valuation Inputs at Reporting Date: |
Description | Total | Level 1 | Level 2 | Level 3 |
Investments in Securities: | | | | |
Common Stocks | $ 84,034,325 | $ 84,034,325 | $ - | $ - |
Convertible Preferred Stocks | 263,250 | - | 263,250 | - |
Money Market Funds | 10,460,904 | 10,460,904 | - | - |
Total Investments in Securities: | $ 94,758,479 | $ 94,495,229 | $ 263,250 | $ - |
Income Tax Information |
At December 31, 2009, the fund had a capital loss carryforward of approximately $16,458,534 all of which will expire on December 31, 2017. |
See accompanying notes which are an integral part of the financial statements.
Annual Report
Statement of Assets and Liabilities
| December 31, 2009 |
| | |
Assets | | |
Investment in securities, at value (including securities loaned of $7,963,384) - See accompanying schedule: Unaffiliated issuers (cost $77,626,472) | $ 84,297,575 | |
Fidelity Central Funds (cost $10,460,904) | 10,460,904 | |
Total Investments (cost $88,087,376) | | $ 94,758,479 |
Cash | | 6,408 |
Foreign currency held at value (cost $249) | | 249 |
Receivable for investments sold | | 385,787 |
Receivable for fund shares sold | | 92,207 |
Dividends receivable | | 320,173 |
Distributions receivable from Fidelity Central Funds | | 2,128 |
Prepaid expenses | | 326 |
Other receivables | | 1,318 |
Total assets | | 95,567,075 |
| | |
Liabilities | | |
Payable for investments purchased | $ 627,865 | |
Payable for fund shares redeemed | 90,448 | |
Accrued management fee | 39,110 | |
Distribution fees payable | 2,045 | |
Other affiliated payables | 9,625 | |
Other payables and accrued expenses | 43,640 | |
Collateral on securities loaned, at value | 8,185,106 | |
Total liabilities | | 8,997,839 |
| | |
Net Assets | | $ 86,569,236 |
Net Assets consist of: | | |
Paid in capital | | $ 103,511,091 |
Undistributed net investment income | | 154,144 |
Accumulated undistributed net realized gain (loss) on investments and foreign currency transactions | | (23,767,087) |
Net unrealized appreciation (depreciation) on investments and assets and liabilities in foreign currencies | | 6,671,088 |
Net Assets | | $ 86,569,236 |
Statement of Assets and Liabilities - continued
| December 31, 2009 |
| | |
Initial Class:
Net Asset Value, offering price and redemption price per share ($41,714,138 ÷ 3,814,764 shares) | | $ 10.93 |
| | |
Service Class:
Net Asset Value, offering price and redemption price per share ($1,051,424 ÷ 96,344 shares) | | $ 10.91 |
| | |
Service Class 2:
Net Asset Value, offering price and redemption price per share ($9,877,883 ÷ 911,056 shares) | | $ 10.84 |
| | |
Investor Class:
Net Asset Value, offering price and redemption price per share ($33,925,791 ÷ 3,112,258 shares) | | $ 10.90 |
See accompanying notes which are an integral part of the financial statements.
Annual Report
Statement of Operations
| Year ended December 31, 2009 |
| | |
Investment Income | | |
Dividends | | $ 2,324,027 |
Income from Fidelity Central Funds | | 14,975 |
Total income | | 2,339,002 |
| | |
Expenses | | |
Management fee | $ 344,758 | |
Transfer agent fees | 78,490 | |
Distribution fees | 15,720 | |
Accounting and security lending fees | 24,347 | |
Custodian fees and expenses | 25,285 | |
Independent trustees' compensation | 409 | |
Audit | 38,286 | |
Legal | 331 | |
Miscellaneous | 5,634 | |
Total expenses before reductions | 533,260 | |
Expense reductions | (4,565) | 528,695 |
Net investment income (loss) | | 1,810,307 |
Realized and Unrealized Gain (Loss) Net realized gain (loss) on: | | |
Investment securities: | | |
Unaffiliated issuers | (12,994,710) | |
Foreign currency transactions | (6,302) | |
Total net realized gain (loss) | | (13,001,012) |
Change in net unrealized appreciation (depreciation) on: Investment securities | 34,416,361 | |
Assets and liabilities in foreign currencies | (34) | |
Total change in net unrealized appreciation (depreciation) | | 34,416,327 |
Net gain (loss) | | 21,415,315 |
Net increase (decrease) in net assets resulting from operations | | $ 23,225,622 |
Statement of Changes in Net Assets
| Year ended
December 31, 2009 | Year ended
December 31, 2008 |
Increase (Decrease) in Net Assets | | |
Operations | | |
Net investment income (loss) | $ 1,810,307 | $ 2,354,248 |
Net realized gain (loss) | (13,001,012) | (9,263,145) |
Change in net unrealized appreciation (depreciation) | 34,416,327 | (36,927,350) |
Net increase (decrease) in net assets resulting from operations | 23,225,622 | (43,836,247) |
Distributions to shareholders from net investment income | (1,808,445) | (2,499,867) |
Distributions to shareholders from net realized gain | - | (1,117,046) |
Total distributions | (1,808,445) | (3,616,913) |
Share transactions - net increase (decrease) | 5,274,720 | 196,182 |
Total increase (decrease) in net assets | 26,691,897 | (47,256,978) |
| | |
Net Assets | | |
Beginning of period | 59,877,339 | 107,134,317 |
End of period (including undistributed net investment income of $154,144 and undistributed net investment income of $151,507, respectively) | $ 86,569,236 | $ 59,877,339 |
See accompanying notes which are an integral part of the financial statements.
Annual Report
Financial Highlights - Initial Class
Years ended December 31, | 2009 | 2008 | 2007 | 2006 | 2005 |
Selected Per-Share Data | | | | | |
Net asset value, beginning of period | $ 8.13 | $ 14.38 | $ 22.74 | $ 18.48 | $ 17.46 |
Income from Investment Operations | | | | | |
Net investment income (loss) C | .24 | .33 | .27 | .38 | .38 |
Net realized and unrealized gain (loss) | 2.80 | (6.06) | (4.15) | 6.23 | 2.25 |
Total from investment operations | 3.04 | (5.73) | (3.88) | 6.61 | 2.63 |
Distributions from net investment income | (.24) | (.36) | (.36) | (.33) | (.41) |
Distributions from net realized gain | - | (.16) | (4.12) | (2.02) | (1.20) |
Total distributions | (.24) | (.52) | (4.48) | (2.35) | (1.61) G |
Net asset value, end of period | $ 10.93 | $ 8.13 | $ 14.38 | $ 22.74 | $ 18.48 |
Total Return A, B | 37.69% | (39.87)% | (17.72)% | 36.71% | 15.12% |
Ratios to Average Net Assets D, F | | | | | |
Expenses before reductions | .80% | .76% | .74% | .72% | .74% |
Expenses net of fee waivers, if any | .80% | .76% | .74% | .72% | .74% |
Expenses net of all reductions | .80% | .76% | .74% | .71% | .71% |
Net investment income (loss) | 3.01% | 2.51% | 1.21% | 1.76% | 2.13% |
Supplemental Data | | | | | |
Net assets, end of period (000 omitted) | $ 41,714 | $ 32,918 | $ 68,401 | $ 205,802 | $ 145,065 |
Portfolio turnover rate E | 94% | 87% | 102% | 70% | 75% |
A Total returns do not reflect charges attributable to your insurance company's separate account. Inclusion of these charges would reduce the total returns shown. B Total returns would have been lower had certain expenses not been reduced during the periods shown. C Calculated based on average shares outstanding during the period. D Fees and expenses of the underlying Fidelity Central Funds are not included in the Fund's expense ratio. The Fund indirectly bears its proportionate share of the expenses of any underlying Fidelity Central Funds. E Amount does not include the portfolio activity of any underlying Fidelity Central Funds. F Expense ratios reflect operating expenses of the class. Expenses before reductions do not reflect amounts reimbursed by the investment adviser or reductions from brokerage service arrangements or reductions from other expense offset arrangements and do not represent the amount paid by the class during periods when reimbursements or reductions occur. Expenses net of fee waivers reflect expenses after reimbursement by the investment adviser but prior to reductions from brokerage service arrangements or other expense offset arrangements. Expenses net of all reductions represent the net expenses paid by the class. G Total distributions of $1.61 per share is comprised of distributions from net investment income of $.413 and distributions from net realized gain of $1.195 per share. |
Financial Highlights - Service Class
Years ended December 31, | 2009 | 2008 | 2007 | 2006 | 2005 |
Selected Per-Share Data | | | | | |
Net asset value, beginning of period | $ 8.11 | $ 14.33 | $ 22.69 | $ 18.44 | $ 17.43 |
Income from Investment Operations | | | | | |
Net investment income (loss) C | .23 | .32 | .24 | .35 | .37 |
Net realized and unrealized gain (loss) | 2.80 | (6.04) | (4.13) | 6.22 | 2.23 |
Total from investment operations | 3.03 | (5.72) | (3.89) | 6.57 | 2.60 |
Distributions from net investment income | (.23) | (.34) | (.35) | (.30) | (.40) |
Distributions from net realized gain | - | (.16) | (4.12) | (2.02) | (1.20) |
Total distributions | (.23) | (.50) | (4.47) | (2.32) | (1.59) G |
Net asset value, end of period | $ 10.91 | $ 8.11 | $ 14.33 | $ 22.69 | $ 18.44 |
Total Return A, B | 37.62% | (39.95)% | (17.80)% | 36.61% | 15.00% |
Ratios to Average Net Assets D, F | | | | | |
Expenses before reductions | .90% | .86% | .83% | .82% | .84% |
Expenses net of fee waivers, if any | .90% | .86% | .83% | .82% | .84% |
Expenses net of all reductions | .89% | .85% | .83% | .81% | .81% |
Net investment income (loss) | 2.91% | 2.41% | 1.12% | 1.66% | 2.03% |
Supplemental Data | | | | | |
Net assets, end of period (000 omitted) | $ 1,051 | $ 1,385 | $ 3,543 | $ 4,311 | $ 3,156 |
Portfolio turnover rate E | 94% | 87% | 102% | 70% | 75% |
A Total returns do not reflect charges attributable to your insurance company's separate account. Inclusion of these charges would reduce the total returns shown. B Total returns would have been lower had certain expenses not been reduced during the periods shown. C Calculated based on average shares outstanding during the period. D Fees and expenses of the underlying Fidelity Central Funds are not included in the Fund's expense ratio. The Fund indirectly bears its proportionate share of the expenses of any underlying Fidelity Central Funds. E Amount does not include the portfolio activity of any underlying Fidelity Central Funds. F Expense ratios reflect operating expenses of the class. Expenses before reductions do not reflect amounts reimbursed by the investment adviser or reductions from brokerage service arrangements or reductions from other expense offset arrangements and do not represent the amount paid by the class during periods when reimbursements or reductions occur. Expenses net of fee waivers reflect expenses after reimbursement by the investment adviser but prior to reductions from brokerage service arrangements or other expense offset arrangements. Expenses net of all reductions represent the net expenses paid by the class. G Total distributions of $1.59 per share is comprised of distributions from net investment income of $.397 and distributions from net realized gain of $1.195 per share. |
See accompanying notes which are an integral part of the financial statements.
Annual Report
Financial Highlights - Service Class 2
Years ended December 31, | 2009 | 2008 | 2007 | 2006 | 2005 |
Selected Per-Share Data | | | | | |
Net asset value, beginning of period | $ 8.07 | $ 14.28 | $ 22.62 | $ 18.40 | $ 17.39 |
Income from Investment Operations | | | | | |
Net investment income (loss) C | .23 | .28 | .21 | .32 | .34 |
Net realized and unrealized gain (loss) | 2.76 | (5.99) | (4.11) | 6.19 | 2.24 |
Total from investment operations | 2.99 | (5.71) | (3.90) | 6.51 | 2.58 |
Distributions from net investment income | (.22) | (.34) | (.32) | (.27) | (.37) |
Distributions from net realized gain | - | (.16) | (4.12) | (2.02) | (1.20) |
Total distributions | (.22) | (.50) | (4.44) | (2.29) | (1.57) G |
Net asset value, end of period | $ 10.84 | $ 8.07 | $ 14.28 | $ 22.62 | $ 18.40 |
Total Return A, B | 37.40% | (40.06)% | (17.91)% | 36.35% | 14.88% |
Ratios to Average Net Assets D, F | | | | | |
Expenses before reductions | 1.07% | 1.03% | .98% | .97% | .99% |
Expenses net of fee waivers, if any | 1.07% | 1.03% | .98% | .97% | .99% |
Expenses net of all reductions | 1.06% | 1.03% | .98% | .96% | .96% |
Net investment income (loss) | 2.74% | 2.24% | .97% | 1.51% | 1.88% |
Supplemental Data | | | | | |
Net assets, end of period (000 omitted) | $ 9,878 | $ 2,864 | $ 3,558 | $ 4,284 | $ 3,141 |
Portfolio turnover rate E | 94% | 87% | 102% | 70% | 75% |
A Total returns do not reflect charges attributable to your insurance company's separate account. Inclusion of these charges would reduce the total returns shown. B Total returns would have been lower had certain expenses not been reduced during the periods shown. C Calculated based on average shares outstanding during the period. D Fees and expenses of the underlying Fidelity Central Funds are not included in the Fund's expense ratio. The Fund indirectly bears its proportionate share of the expenses of any underlying Fidelity Central Funds. E Amount does not include the portfolio activity of any underlying Fidelity Central Funds. F Expense ratios reflect operating expenses of the class. Expenses before reductions do not reflect amounts reimbursed by the investment adviser or reductions from brokerage service arrangements or reductions from other expense offset arrangements and do not represent the amount paid by the class during periods when reimbursements or reductions occur. Expenses net of fee waivers reflect expenses after reimbursement by the investment adviser but prior to reductions from brokerage service arrangements or other expense offset arrangements. Expenses net of all reductions represent the net expenses paid by the class. G Total distributions of $1.57 per share is comprised of distributions from net investment income of $.37 and distributions from net realized gain of $1.195 per share. |
Financial Highlights - Investor Class
Years ended December 31, | 2009 | 2008 | 2007 | 2006 | 2005 H |
Selected Per-Share Data | | | | | |
Net asset value, beginning of period | $ 8.11 | $ 14.34 | $ 22.69 | $ 18.46 | $ 19.25 |
Income from Investment Operations | | | | | |
Net investment income (loss) E | .24 | .31 | .24 | .35 | .17 |
Net realized and unrealized gain (loss) | 2.78 | (6.03) | (4.13) | 6.22 | .52 |
Total from investment operations | 3.02 | (5.72) | (3.89) | 6.57 | .69 |
Distributions from net investment income | (.23) | (.35) | (.34) | (.32) | (.42) |
Distributions from net realized gain | - | (.16) | (4.12) | (2.02) | (1.06) |
Total distributions | (.23) | (.51) | (4.46) | (2.34) | (1.48) J |
Net asset value, end of period | $ 10.90 | $ 8.11 | $ 14.34 | $ 22.69 | $ 18.46 |
Total Return B, C, D | 37.57% | (39.91)% | (17.83)% | 36.53% | 3.52% |
Ratios to Average Net Assets F, I | | | | | |
Expenses before reductions | .90% | .85% | .85% | .85% | .99% A |
Expenses net of fee waivers, if any | .90% | .85% | .85% | .85% | .99% A |
Expenses net of all reductions | .89% | .85% | .85% | .85% | .96% A |
Net investment income (loss) | 2.91% | 2.42% | 1.10% | 1.62% | 1.98% A |
Supplemental Data | | | | | |
Net assets, end of period (000 omitted) | $ 33,926 | $ 22,711 | $ 31,632 | $ 50,198 | $ 7,134 |
Portfolio turnover rate G | 94% | 87% | 102% | 70% | 75% |
A Annualized B Total returns for periods of less than one year are not annualized. C Total returns do not reflect charges attributable to your insurance company's separate account. Inclusion of these charges would reduce the total returns shown. D Total returns would have been lower had certain expenses not been reduced during the periods shown. E Calculated based on average shares outstanding during the period. F Fees and expenses of the underlying Fidelity Central Funds are not included in the Fund's expense ratio. The Fund indirectly bears its proportionate share of the expenses of any underlying Fidelity Central Funds. G Amount does not include the portfolio activity of any underlying Fidelity Central Funds. H For the period July 21, 2005 (commencement of sale of shares) to December 31, 2005. I Expense ratios reflect operating expenses of the class. Expenses before reductions do not reflect amounts reimbursed by the investment adviser or reductions from brokerage service arrangements or reductions from other expense offset arrangements and do not represent the amount paid by the class during periods when reimbursements or reductions occur. Expense ratios before reductions for start-up periods may not be representative of longer-term operating periods. Expenses net of fee waivers reflect expenses after reimbursement by the investment adviser but prior to reductions from brokerage service arrangements or other expense offset arrangements. Expenses net of all reductions represent the net expenses paid by the class. J Total distributions of $1.48 per share is comprised of distributions from net investment income of $.419 and distributions from net realized gain of $1.06 per share. |
See accompanying notes which are an integral part of the financial statements.
Annual Report
Notes to Financial Statements
For the period ended December 31, 2009
1. Organization.
VIP Real Estate Portfolio (the Fund) is a non-diversified fund of Variable Insurance Products Fund IV (the trust) and is authorized to issue an unlimited number of shares. The trust is registered under the Investment Company Act of 1940, as amended (the 1940 Act), as an open-end management investment company organized as a Massachusetts business trust. Shares of the Fund may only be purchased by insurance companies for the purpose of funding variable annuity or variable life insurance contracts. The Fund offers the following classes of shares: Initial Class shares, Service Class shares, Service Class 2 shares and Investor Class shares. All classes have equal rights and voting privileges, except for matters affecting a single class. Investment income, realized and unrealized capital gains and losses, the common expenses of the Fund, and certain fund-level expense reductions, if any, are allocated on a pro-rata basis to each class based on the relative net assets of each class to the total net assets of the Fund. Each class differs with respect to transfer agent and distribution and service plan fees incurred. Certain expense reductions also differ by class.
2. Investments in Fidelity Central Funds.
The Fund may invest in Fidelity Central Funds, which are open-end investment companies available only to other investment companies and accounts managed by Fidelity Management & Research Company (FMR) and its affiliates. The Fund's Schedule of Investments lists each of the Fidelity Central Funds held as of period end, if any, as an investment of the Fund, but does not include the underlying holdings of each Fidelity Central Fund. As an Investing Fund, the Fund indirectly bears its proportionate share of the expenses of the underlying Fidelity Central Funds.
The Money Market Central Funds seek preservation of capital and current income and are managed by Fidelity Investments Money Management, Inc. (FIMM), an affiliate of FMR.
A complete unaudited list of holdings for each Fidelity Central Fund is available upon request or at the Securities and Exchange Commission (the SEC) web site at www.sec.gov. In addition, the financial statements of the Fidelity Central Funds, which are not covered by the Fund's Report of Independent Registered Public Accounting Firm, are available on the SEC web site or upon request.
3. Significant Accounting Policies.
The financial statements have been prepared in conformity with accounting principles generally accepted in the United States of America, which require management to make certain estimates and assumptions at the date of the financial statements. Actual results could differ from those estimates. Events or transactions occurring after period end through the date that the financial statements were issued, February 12, 2010, have been evaluated in the preparation of the financial statements. The following summarizes the significant accounting policies of the Fund:
Security Valuation. Investments are valued as of 4:00 p.m. Eastern time on the last calendar day of the period. The Fund uses independent pricing services approved by the Board of Trustees to value its investments. When current market prices or quotations are not readily available or reliable, valuations may be determined in good faith in accordance with procedures adopted by the Board of Trustees. Factors used in determining value may include significant market or security specific events. The frequency with which these procedures are used cannot be predicted and may be utilized to a significant extent. The value used for net asset value (NAV) calculation under these procedures may differ from published prices for the same securities.
The Fund categorizes the inputs to valuation techniques used to value its investments into a disclosure hierarchy consisting of three levels as shown below.
Level 1 - quoted prices in active markets for identical investments
Level 2 - other significant observable inputs (including quoted prices for similar investments, interest rates, prepayment speeds, etc.)
Level 3 - unobservable inputs (including the fund's own assumptions based on the best information available)
Changes in valuation techniques may result in transfers in or out of an assigned level within the disclosure hierarchy. The aggregate value of investments by input level, as of December 31, 2009, is included at the end of the Fund's Schedule of Investments. Valuation techniques used to value the Fund's investments by major category are as follows.
Equity securities, including restricted securities, for which market quotations are readily available, are valued at the last reported sale price or official closing price as reported by an independent pricing service on the primary market or exchange on which they are traded and are categorized as level 1 in the hierarchy. In the event there were no sales during the day or closing prices are not available, securities are valued at the last quoted bid price or may be valued using the last available price and categorized as Level 2 in the hierarchy. For foreign equity securities, when significant market or security events arise, comparisons to the valuation of American Depository Receipts (ADRs), futures contracts, exchange-traded funds (ETFs) and certain indexes as well as quoted prices for similar securities are used and are categorized as Level 2 in the hierarchy in these circumstances. For restricted securities and private placements where observable inputs are limited, assumptions about market activity and risk are used and are categorized as level 3 in the hierarchy.
Annual Report
3. Significant Accounting Policies - continued
Security Valuation - continued
Investments in open-end mutual funds including the Fidelity Central Funds are valued at their closing net asset value each business day and are categorized as Level 1 in the hierarchy. Short-term securities with remaining maturities of sixty days or less for which quotations are not readily available are valued at amortized cost, which approximates value and are categorized as level 2 in the hierarchy.
Foreign Currency. The Fund uses foreign currency contracts to facilitate transactions in foreign-denominated securities. Losses from these transactions may arise from changes in the value of the foreign currency or if the counterparties do not perform under the contracts' terms.
Foreign-denominated assets, including investment securities, and liabilities are translated into U.S. dollars at the exchange rate at period end. Purchases and sales of investment securities, income and dividends received and expenses denominated in foreign currencies are translated into U.S. dollars at the exchange rate in effect on the transaction date.
The effects of exchange rate fluctuations on investments are included with the net realized and unrealized gain (loss) on investment securities. Other foreign currency transactions resulting in realized and unrealized gain (loss) are disclosed separately.
Investment Transactions and Income. For financial reporting purposes, the Fund's investment holdings and NAV include trades executed through the end of the last business day of the period. The NAV per share for processing shareholder transactions is calculated as of the close of business of the New York Stock Exchange (NYSE), normally 4:00 p.m. Eastern time and includes trades executed through the end of the prior business day. Gains and losses on securities sold are determined on the basis of identified cost and may include proceeds received from litigation. Dividend income is recorded on the ex-dividend date, except for certain dividends from foreign securities where the ex-dividend date may have passed, which are recorded as soon as the Fund is informed of the ex-dividend date. Non-cash dividends included in dividend income, if any, are recorded at the fair market value of the securities received. Distributions received on securities that represent a return of capital or capital gain are recorded as a reduction of cost of investments and/or as a realized gain. The Fund estimates the components of distributions received that may be considered return of capital distributions or capital gain distributions. Interest income and distributions from the Fidelity Central Funds are accrued as earned. Interest income includes coupon interest and amortization of premium and accretion of discount on debt securities. Investment income is recorded net of foreign taxes withheld where recovery of such taxes is uncertain.
Expenses. Most expenses of the trust can be directly attributed to a fund. Expenses which cannot be directly attributed are apportioned among each Fund in the trust. Expense estimates are accrued in the period to which they relate and adjustments are made when actual amounts are known.
Income Tax Information and Distributions to Shareholders. Each year, the Fund intends to qualify as a regulated investment company by distributing substantially all of its taxable income and realized gains under Subchapter M of the Internal Revenue Code and filing its U.S. federal tax return. As a result, no provision for income taxes is required. As of December 31, 2009, the Fund did not have any unrecognized tax benefits in the accompanying financial statements. A Fund's federal tax return is subject to examination by the Internal Revenue Service (IRS) for a period of three years. Foreign taxes are provided for based on the Fund's understanding of the tax rules and rates that exist in the foreign markets in which it invests.
Distributions are recorded on the ex-dividend date. Income dividends and capital gain distributions are declared separately for each class. Income and capital gain distributions are determined in accordance with income tax regulations, which may differ from generally accepted accounting principles.
Capital accounts within the financial statements are adjusted for permanent book-tax differences. These adjustments have no impact on net assets or the results of operations. Temporary book-tax differences will reverse in a subsequent period.
Book-tax differences are primarily due to the short-term gain distributions from the Fidelity Central Funds, foreign currency transactions, passive foreign investment companies (PFIC), capital loss carryforwards and losses due to wash sales and excise tax regulations.
The federal tax cost of investment securities and unrealized appreciation (depreciation) as of period end were as follows:
Gross unrealized appreciation | $ 16,926,398 |
Gross unrealized depreciation | (16,845,365) |
Net unrealized appreciation (depreciation) | $ 81,033 |
| |
Tax Cost | $ 94,677,446 |
Annual Report
Notes to Financial Statements - continued
3. Significant Accounting Policies - continued
Income Tax Information and Distributions to Shareholders - continued
The tax-based components of distributable earnings as of period end were as follows:
Undistributed ordinary income | $ 154,144 |
Capital loss carryforward | $ (16,458,534) |
Net unrealized appreciation (depreciation) | $ 81,018 |
The tax character of distributions paid was as follows:
| December 31, 2009 | December 31, 2008 |
Ordinary Income | $ 1,808,445 | $ 2,499,867 |
Long-term Capital Gains | - | 1,117,046 |
Total | $ 1,808,445 | $ 3,616,913 |
4. Operating Policies.
Restricted Securities. The Fund may invest in securities that are subject to legal or contractual restrictions on resale. These securities generally may be resold in transactions exempt from registration or to the public if the securities are registered. Disposal of these securities may involve time-consuming negotiations and expense, and prompt sale at an acceptable price may be difficult. Information regarding restricted securities is included at the end of the Fund's Schedule of Investments.
5. Purchases and Sales of Investments.
Purchases and sales of securities, other than short-term securities, aggregated $62,355,057 and $56,542,730, respectively.
6. Fees and Other Transactions with Affiliates.
Management Fee. FMR and its affiliates provide the Fund with investment management related services for which the Fund pays a monthly management fee. The management fee is the sum of an individual fund fee rate that is based on an annual rate of .30% of the Fund's average net assets and a group fee rate that averaged .26% during the period. The group fee rate is based upon the average net assets of all the mutual funds advised by FMR. The group fee rate decreases as assets under management increase and increases as assets under management decrease. For the period, the total annual management fee rate was .56% of the Fund's average net assets.
Distribution and Service Plan. In accordance with Rule 12b-1 of the 1940 Act, the Fund has adopted separate 12b-1 Plans for each Service Class of shares. Each Service Class pays Fidelity Distributors Corporation (FDC), an affiliate of FMR, a service fee. For the period, the service fee is based on an annual rate of .10% of Service Class' average net assets and .25% of Service Class 2's average net assets.
For the period, each class paid FDC the following amounts, all of which were re-allowed to insurance companies for the distribution of shares and providing shareholder support services:
Service Class | $ 1,011 |
Service Class 2 | 14,709 |
| $ 15,720 |
Transfer Agent Fees. Fidelity Investments Institutional Operations Company, Inc. (FIIOC), an affiliate of FMR, is the Fund's transfer, dividend disbursing, and shareholder servicing agent. FIIOC receives an asset-based fee with respect to each class. Each class (with the exception of Investor Class) pays a transfer agent fee, excluding out of pocket expenses, equal to an annual rate of .07% of average net assets. Investor Class pays a monthly asset-based transfer agent fee of .15% of average net assets. The total transfer agent fees paid by each class to FIIOC, including out of pocket expenses, were as follows:
Initial Class | $ 28,406 |
Service Class | 880 |
Service Class 2 | 6,314 |
Investor Class | 42,890 |
| $ 78,490 |
Annual Report
6. Fees and Other Transactions with Affiliates - continued
Accounting and Security Lending Fees. Fidelity Service Company, Inc. (FSC), an affiliate of FMR, maintains the Fund's accounting records. The accounting fee is based on the level of average net assets for the month. Under a separate contract, FSC administers the security lending program. The security lending fee is based on the number and duration of lending transactions.
Brokerage Commissions. The Fund placed a portion of its portfolio transactions with brokerage firms which are affiliates of the investment adviser. The commissions paid to these affiliated firms were $992 for the period.
7. Committed Line of Credit.
The Fund participates with other funds managed by FMR in a $3.5 billion credit facility (the "line of credit") to be utilized for temporary or emergency purposes to fund shareholder redemptions or for other short-term liquidity purposes. The Fund has agreed to pay commitment fees on its pro-rata portion of the line of credit, which amounted to $294 and is reflected in Miscellaneous Expense on the Statement of Operations. During the period, there were no borrowings on this line of credit.
8. Security Lending.
The Fund lends portfolio securities from time to time in order to earn additional income. On the settlement date of the loan, the Fund receives collateral (in the form of U.S. Treasury obligations, letters of credit and/or cash) against the loaned securities and maintains collateral in an amount not less than 100% of the market value of the loaned securities during the period of the loan. The market value of the loaned securities is determined at the close of business of the Fund and any additional required collateral is delivered to the Fund on the next business day. If the borrower defaults on its obligation to return the securities loaned because of insolvency or other reasons, a fund could experience delays and costs in recovering the securities loaned or in gaining access to the collateral. Any cash collateral received is invested in the Fidelity Securities Lending Cash Central Fund. The value of loaned securities and cash collateral at period end are disclosed on the Fund's Statement of Assets and Liabilities. Security lending income represents the income earned on investing cash collateral, less fees and expenses associated with the loan, plus any premium payments that may be received on the loan of certain types of securities. Security lending income is presented in the Statement of Operations as a component of income from Fidelity Central Funds. Net income from lending portfolio securities during the period amounted to $7,529.
9. Expense Reductions.
Many of the brokers with whom FMR places trades on behalf of the Fund provided services to the Fund in addition to trade execution. These services included payments of certain expenses on behalf of the Fund totaling $4,556 for the period. In addition, through arrangements with the Fund's custodian, credits realized as a result of uninvested cash balances were used to reduce the Fund's expenses. During the period, these credits reduced the Fund's custody expenses by $9.
10. Distributions to Shareholders.
Distributions to shareholders of each class were as follows:
Years ended December 31, | 2009 | 2008 |
From net investment income | | |
Initial Class | $ 903,193 | $ 1,416,267 |
Service Class | 22,932 | 58,561 |
Service Class 2 | 186,016 | 104,945 |
Investor Class | 696,304 | 920,094 |
Total | $ 1,808,445 | $ 2,499,867 |
From net realized gain | | |
Initial Class | $ - | $ 631,633 |
Service Class | - | 28,427 |
Service Class 2 | - | 48,687 |
Investor Class | - | 408,299 |
Total | $ - | $ 1,117,046 |
Annual Report
Notes to Financial Statements - continued
11. Share Transactions.
Transactions for each class of shares were as follows:
| Shares | Dollars |
Years ended December 31, | 2009 | 2008 | 2009 | 2008 |
Initial Class | | | | |
Shares sold | 949,053 | 1,072,807 | $ 7,760,404 | $ 15,243,890 |
Reinvestment of distributions | 91,070 | 245,583 | 903,194 | 2,047,900 |
Shares redeemed | (1,274,438) | (2,026,672) | (10,025,868) | (26,391,337) |
Net increase (decrease) | (234,315) | (708,282) | $ (1,362,270) | $ (9,099,547) |
Service Class | | | | |
Shares sold | - | - | $ - | $ - |
Reinvestment of distributions | 2,420 | 10,234 | 22,932 | 86,988 |
Shares redeemed | (76,755) | (86,835) | (593,994) | (942,259) |
Net increase (decrease) | (74,335) | (76,601) | $ (571,062) | $ (855,271) |
Service Class 2 | | | | |
Shares sold | 1,276,261 | 230,882 | $ 9,920,540 | $ 2,490,148 |
Reinvestment of distributions | 18,182 | 18,848 | 186,016 | 153,632 |
Shares redeemed | (738,205) | (144,174) | (6,212,786) | (1,475,124) |
Net increase (decrease) | 556,238 | 105,556 | $ 3,893,770 | $ 1,168,656 |
Investor Class | | | | |
Shares sold | 1,144,876 | 1,443,530 | $ 9,684,422 | $ 20,545,410 |
Reinvestment of distributions | 69,851 | 162,246 | 696,304 | 1,328,392 |
Shares redeemed | (903,755) | (1,010,483) | (7,066,444) | (12,891,458) |
Net increase (decrease) | 310,972 | 595,293 | $ 3,314,282 | $ 8,982,344 |
12. Other.
The Fund's organizational documents provide former and current trustees and officers with a limited indemnification against liabilities arising in connection with the performance of their duties to the Fund. In the normal course of business, the Fund may also enter into contracts that provide general indemnifications. The Fund's maximum exposure under these arrangements is unknown as this would be dependent on future claims that may be made against the Fund. The risk of material loss from such claims is considered remote.
At the end of the period, FMR or its affiliates were the owners of record of 87% of the total outstanding shares of the Fund.
Annual Report
Report of Independent Registered Public Accounting Firm
To the Trustees of Variable Insurance Products Fund IV and the Shareholders of VIP Real Estate Portfolio:
In our opinion, the accompanying statement of assets and liabilities, including the schedule of investments, and the related statements of operations and of changes in net assets and the financial highlights present fairly, in all material respects, the financial position of VIP Real Estate Portfolio (a fund of Variable Insurance Products Fund IV) at December 31, 2009, the results of its operations for the year then ended, the changes in its net assets for each of the two years in the period then ended and the financial highlights for each of the periods indicated, in conformity with accounting principles generally accepted in the United States of America. These financial statements and financial highlights (hereafter referred to as "financial statements") are the responsibility of the VIP Real Estate Portfolio's management. Our responsibility is to express an opinion on these financial statements based on our audits. We conducted our audits of these financial statements in accordance with the standards of the Public Company Accounting Oversight Board (United States). Those standards require that we plan and perform the audit to obtain reasonable assurance about whether the financial statements are free of material misstatement. An audit includes examining, on a test basis, evidence supporting the amounts and disclosures in the financial statements, assessing the accounting principles used and significant estimates made by management, and evaluating the overall financial statement presentation. We believe that our audits, which included confirmation of securities at December 31, 2009 by correspondence with the custodian and brokers, provide a reasonable basis for our opinion.
/s/ PricewaterhouseCoopers LLP
PricewaterhouseCoopers LLP
Boston, Massachusetts
February 12, 2010
Annual Report
The Trustees, Member of the Advisory Board, and executive officers of the trust and fund, as applicable, are listed below. The Board of Trustees governs the fund and is responsible for protecting the interests of shareholders. The Trustees are experienced executives who meet periodically throughout the year to oversee the fund's activities, review contractual arrangements with companies that provide services to the fund, and review the fund's performance. Except for James C. Curvey, each of the Trustees oversees 222 funds advised by FMR or an affiliate. Mr. Curvey oversees 410 funds advised by FMR or an affiliate.
The Trustees hold office without limit in time except that (a) any Trustee may resign; (b) any Trustee may be removed by written instrument, signed by at least two-thirds of the number of Trustees prior to such removal; (c) any Trustee who requests to be retired or who has become incapacitated by illness or injury may be retired by written instrument signed by a majority of the other Trustees; and (d) any Trustee may be removed at any special meeting of shareholders by a two-thirds vote of the outstanding voting securities of the trust. Each Trustee who is not an interested person (as defined in the 1940 Act) (Independent Trustee), shall retire not later than the last day of the calendar year in which his or her 72nd birthday occurs. The Independent Trustees may waive this mandatory retirement age policy with respect to individual Trustees. The executive officers and Advisory Board Member hold office without limit in time, except that any officer and Advisory Board Member may resign or may be removed by a vote of a majority of the Trustees at any regular meeting or any special meeting of the Trustees. Except as indicated, each individual has held the office shown or other offices in the same company for the past five years.
The fund's Statement of Additional Information (SAI) includes more information about the Trustees. To request a free copy, call Fidelity at 1-877-208-0098.
Interested Trustees*:
Correspondence intended for each Trustee who is an interested person may be sent to Fidelity Investments, 82 Devonshire Street, Boston, Massachusetts 02109.
Name, Age; Principal Occupation |
Edward C. Johnson 3d (79) |
| Year of Election or Appointment: 1983 Mr. Johnson is Trustee and Chairman of the Board of Trustees of certain Trusts. Mr. Johnson serves as Chief Executive Officer, Chairman, and a Director of FMR LLC; Chairman and a Director of FMR; Chairman and a Director of Fidelity Research & Analysis Company (FRAC); Chairman and a Director of Fidelity Investments Money Management, Inc.; and Chairman and a Director of FMR Co., Inc. In addition, Mr. Johnson serves as Chairman and Director of FIL Limited. Previously, Mr. Johnson served as President of FMR LLC (2006-2007). |
James C. Curvey (74) |
| Year of Election or Appointment: 2007 Mr. Curvey also serves as Trustee (2007-present) of other investment companies advised by FMR. Mr. Curvey is a Director of FMR and FMR Co., Inc. (2007-present). Mr. Curvey is also Vice Chairman (2006-present) and Director of FMR LLC. In addition, Mr. Curvey serves as an Overseer for the Boston Symphony Orchestra and a member of the Trustees of Villanova University. |
* Trustees have been determined to be "Interested Trustees" by virtue of, among other things, their affiliation with the trust or various entities under common control with FMR.
Independent Trustees:
Correspondence intended for each Independent Trustee (that is, the Trustees other than the Interested Trustees) may be sent to Fidelity Investments, P.O. Box 55235, Boston, Massachusetts 02205-5235.
Name, Age; Principal Occupation |
Dennis J. Dirks (61) |
| Year of Election or Appointment: 2005 Prior to his retirement in May 2003, Mr. Dirks was Chief Operating Officer and a member of the Board of The Depository Trust & Clearing Corporation (DTCC). He also served as President, Chief Operating Officer, and Board member of The Depository Trust Company (DTC) and President and Board member of the National Securities Clearing Corporation (NSCC). In addition, Mr. Dirks served as Chief Executive Officer and Board member of the Government Securities Clearing Corporation, Chief Executive Officer and Board member of the Mortgage-Backed Securities Clearing Corporation, as a Trustee and a member of the Finance Committee of Manhattan College (2005-2008), and as a Trustee and a member of the Finance Committee of AHRC of Nassau County (2006-2008). Currently, Mr. Dirks serves as a member of the Board of Directors for The Brookville Center for Children's Services, Inc. (2009-present). |
Alan J. Lacy (56) |
| Year of Election or Appointment: 2008 Mr. Lacy serves as Senior Adviser (2007-present) of Oak Hill Capital Partners, L.P. (private equity). Mr. Lacy also served as Chief Executive Officer (2000-2005) and Vice Chairman (2005-2006) of Sears Holdings Corporation and Sears, Roebuck and Co. (retail). In addition, Mr. Lacy serves as a member of the Board of Directors of The Western Union Company (global money transfer, 2006-present) and Bristol-Myers Squibb Company (global pharmaceuticals, 2007-present). Mr. Lacy is Chairman (2008-present) and a member (2006-present) of the Board of Trustees of The National Parks Conservation Association. |
Ned C. Lautenbach (65) |
| Year of Election or Appointment: 2000 Mr. Lautenbach is Chairman of the Independent Trustees of the Equity and High Income Funds (2006-present). Mr. Lautenbach is an Advisory Partner of Clayton, Dubilier & Rice, Inc. (private equity investment). Previously, Mr. Lautenbach was with the International Business Machines Corporation (IBM) from 1968 until his retirement in 1998. Mr. Lautenbach serves as a Director of Eaton Corporation (diversified industrial) as well as the Philharmonic Center for the Arts in Naples, Florida. Mr. Lautenbach is also a member of the Board of Trustees of Fairfield University (2005-present), as well as a member of the Council on Foreign Relations. Previously, Mr. Lautenbach served as a Director of Sony Corporation (2006-2007). |
Joseph Mauriello (65) |
| Year of Election or Appointment: 2008 Prior to his retirement in January 2006, Mr. Mauriello served in numerous senior management positions including Deputy Chairman and Chief Operating Officer (2004-2005), and Vice Chairman of Financial Services (2002-2004) of KPMG LLP US (professional services, 1965-2005). Mr. Mauriello currently serves as a member of the Board of Directors of XL Capital Ltd. (global insurance and re-insurance, 2006-present) and of Arcadia Resources Inc. (health care services and products, 2007-present). Previously, Mr. Mauriello served as a Director of the Hamilton Funds of the Bank of New York (2006-2007). |
Cornelia M. Small (65) |
| Year of Election or Appointment: 2005 Ms. Small is a member of the Board of Directors of the Teagle Foundation (2009-present). Ms. Small is also a member of the Investment Committee, and Chair (2008-present) and a member of the Board of Trustees of Smith College. In addition, Ms. Small serves on the Investment Committee of the Berkshire Taconic Community Foundation (2008-present). Previously, Ms. Small served as Chairperson of the Investment Committee (2002-2008) of Smith College. In addition, Ms. Small served as Chief Investment Officer, Director of Global Equity Investments, and a member of the Board of Directors of Scudder, Stevens & Clark and Scudder Kemper Investments. |
William S. Stavropoulos (70) |
| Year of Election or Appointment: 2001 Mr. Stavropoulos serves as President and Founder of the Michigan Baseball Foundation, the Great Lakes Loons (2007-present). Mr. Stavropoulos is Chairman Emeritus of the Board of Directors of The Dow Chemical Company, where he previously served in numerous senior management positions, including President, CEO (1995-2000; 2002-2004), Chairman of the Executive Committee (2000-2006), and as a member of the Board of Directors (1990-2006). Currently, Mr. Stavropoulos is a Director of Teradata Corporation (data warehousing and technology solutions, 2008-present), Chemical Financial Corporation, Maersk Inc. (industrial conglomerate), Tyco International, Inc. (multinational manufacturing and services, 2007-present), and a member of the Advisory Board for Metalmark Capital (private equity investment, 2005-present). Mr. Stavropoulos is a special advisor to Clayton, Dubilier & Rice, Inc. (private equity investment). In addition, Mr. Stavropoulos is a member of the University of Notre Dame Advisory Council for the College of Science. |
David M. Thomas (60) |
| Year of Election or Appointment: 2008 Previously, Mr. Thomas served as Executive Chairman (2005-2006) and Chairman and Chief Executive Officer (2000-2005) of IMS Health, Inc. (pharmaceutical and healthcare information solutions). In addition, Mr. Thomas serves as a member of the Board of Directors of Fortune Brands, Inc. (consumer products), and Interpublic Group of Companies, Inc. (marketing communication, 2004-present). |
Michael E. Wiley (59) |
| Year of Election or Appointment: 2008 Mr. Wiley also serves as a Director of Asia Pacific Exploration Consolidated (international oil and gas exploration and production, 2008-present), and as a member of the Board of Trustees of the University of Tulsa (2000-2006; 2007-present). Mr. Wiley serves as a Director of Tesoro Corporation (independent oil refiner and marketer, 2005-present), and a Director of Bill Barrett Corporation (exploration and production, 2005-present). In addition, Mr. Wiley also serves as a Director of Post Oak Bank (privately-held bank, 2004-present). Previously, Mr. Wiley served as a Sr. Energy Advisor of Katzenbach Partners, LLC (consulting, 2006-2007), as an Advisory Director of Riverstone Holdings (private investment), Chairman, President, and CEO of Baker Hughes, Inc. (oilfield services, 2000-2004), and as Director of Spinnaker Exploration Company (exploration and production, 2001-2005). |
Annual Report
Advisory Board Member and Executive Officers:
Correspondence intended for each executive officer and Peter S. Lynch may be sent to Fidelity Investments, 82 Devonshire Street, Boston, Massachusetts 02109.
Name, Age; Principal Occupation |
Peter S. Lynch (65) |
| Year of Election or Appointment: 2003 Member of the Advisory Board of Fidelity's Equity and High Income Funds. Mr. Lynch is Vice Chairman and a Director of FMR and FMR Co., Inc. In addition, Mr. Lynch serves as a Trustee of Boston College and as the Chairman of the Inner-City Scholarship Fund. Previously, Mr. Lynch served on the Special Olympics International Board of Directors (1997-2006). |
Kenneth B. Robins (40) |
| Year of Election or Appointment: 2008 President and Treasurer of Fidelity's Equity and High Income Funds. Mr. Robins also serves as Assistant Treasurer of other Fidelity funds (2009-present) and is an employee of Fidelity Investments (2004-present). Before joining Fidelity Investments, Mr. Robins worked at KPMG LLP, where he was a partner in KPMG's department of professional practice (2002-2004). |
Brian B. Hogan (45) |
| Year of Election or Appointment: 2009 Vice President of certain Equity Funds and Vice President of Sector Funds. Mr. Hogan also serves as Senior Vice President, Equity Research of FMR (2006-present) and President of FMR's Equity Division (2009-present). Previously, Mr. Hogan served as a portfolio manager. |
Christopher S. Bartel (38) |
| Year of Election or Appointment: 2009 Vice President of Fidelity's Sector and Real Estate Equity Funds. Mr. Bartel also serves as Senior Vice President of Equity Research (2009-present). Previously, Mr. Bartel served as Managing Director of Research (2006-2009) and an analyst and portfolio manager (2000-2006). |
Scott C. Goebel (41) |
| Year of Election or Appointment: 2008 Secretary and Chief Legal Officer (CLO) of the Fidelity funds. Mr. Goebel also serves as General Counsel, Secretary, and Senior Vice President of FMR (2008-present) and FMR Co., Inc. (2008-present); Deputy General Counsel of FMR LLC; Chief Legal Officer of Fidelity Management & Research (Hong Kong) Limited (2008-present) and Assistant Secretary of Fidelity Management & Research (Japan) Inc. (2008-present), Fidelity Investments Money Management, Inc. (2008-present), Fidelity Management & Research (U.K.) Inc. (2008-present), and Fidelity Research and Analysis Company (2008-present). Previously, Mr. Goebel served as Assistant Secretary of the Funds (2007-2008) and as Vice President and Secretary of Fidelity Distributors Corporation (FDC) (2005-2007). |
William C. Coffey (40) |
| Year of Election or Appointment: 2009 Assistant Secretary of Fidelity's Equity and High Income Funds. Mr. Coffey also serves as Vice President and Associate General Counsel of FMR LLC (2005-present), and is an employee of Fidelity Investments. |
Holly C. Laurent (55) |
| Year of Election or Appointment: 2008 Anti-Money Laundering (AML) Officer of the Fidelity funds. Ms. Laurent is an employee of Fidelity Investments. Previously, Ms. Laurent was Senior Vice President and Head of Legal for Fidelity Business Services India Pvt. Ltd. (2006-2008), and Senior Vice President, Deputy General Counsel and Group Head for FMR LLC (2005-2006). |
Christine Reynolds (51) |
| Year of Election or Appointment: 2008 Chief Financial Officer of the Fidelity funds. Ms. Reynolds became President of Fidelity Pricing and Cash Management Services (FPCMS) in August 2008. Ms. Reynolds served as Chief Operating Officer of FPCMS (2007-2008). Previously, Ms. Reynolds served as President, Treasurer, and Anti-Money Laundering officer of the Fidelity funds (2004-2007). |
Kenneth A. Rathgeber (62) |
| Year of Election or Appointment: 2004 Chief Compliance Officer of Fidelity's Equity and High Income Funds. Mr. Rathgeber is Chief Compliance Officer of Fidelity Management & Research (Hong Kong) Limited (2008-present), Fidelity Management & Research (Japan) Inc. (2008-present), FMR (2005-present), FMR Co., Inc. (2005-present), Fidelity Management & Research (U.K.) Inc. (2005-present), Fidelity Research & Analysis Company (2005-present), Fidelity Investments Money Management, Inc. (2005-present), Pyramis Global Advisors, LLC (2005-present), and Strategic Advisers, Inc. (2005-present). |
Jeffrey S. Christian (48) |
| Year of Election or Appointment: 2009 Deputy Treasurer of the Fidelity funds. Mr. Christian is an employee of Fidelity Investments. Previously, Mr. Christian served as Chief Financial Officer (2008-2009) of certain Fidelity funds, Senior Vice President of Fidelity Pricing and Cash Management Services (FPCMS) (2004-2009), and as Vice President of Business Analysis (2003-2004). |
Bryan A. Mehrmann (48) |
| Year of Election or Appointment: 2005 Deputy Treasurer of the Fidelity funds. Mr. Mehrmann is an employee of Fidelity Investments. Previously, Mr. Mehrmann served as Vice President of Fidelity Investments Institutional Services Group (FIIS)/Fidelity Investments Institutional Operations Company, Inc. (FIIOC) Client Services (1998-2004). |
Adrien E. Deberghes (42) |
| Year of Election or Appointment: 2008 Deputy Treasurer of Fidelity's Equity and High Income Funds. Mr. Deberghes is an employee of Fidelity Investments (2008-present). Previously, Mr. Deberghes served as Senior Vice President of Mutual Fund Administration at State Street Corporation (2007-2008), Senior Director of Mutual Fund Administration at Investors Bank & Trust (2005-2007), and Director of Finance for Dunkin' Brands (2000-2005). |
John R. Hebble (51) |
| Year of Election or Appointment: 2009 Assistant Treasurer of Fidelity's Equity and High Income Funds. Mr. Hebble also serves as President and Treasurer of other Fidelity funds (2008-present) and is an employee of Fidelity Investments. |
Paul M. Murphy (62) |
| Year of Election or Appointment: 2007 Assistant Treasurer of the Fidelity funds. Mr. Murphy is an employee of Fidelity Investments. Previously, Mr. Murphy served as Chief Financial Officer of the Fidelity funds (2005-2006), Vice President and Associate General Counsel of FMR (2007), and Senior Vice President of Fidelity Pricing and Cash Management Services (FPCMS) (1994-2007). |
Gary W. Ryan (51) |
| Year of Election or Appointment: 2005 Assistant Treasurer of the Fidelity funds. Mr. Ryan is an employee of Fidelity Investments. Previously, Mr. Ryan served as Vice President of Fund Reporting in Fidelity Pricing and Cash Management Services (FPCMS) (1999-2005). |
Annual Report
Board Approval of Investment Advisory Contracts and Management Fees
VIP Real Estate Portfolio
Each year, the Board of Trustees, including the Independent Trustees (together, the Board), votes on the renewal of the management contract and sub-advisory agreements (together, the Advisory Contracts) for the fund. The Board, assisted by the advice of fund counsel and Independent Trustees' counsel, requests and considers a broad range of information throughout the year.
The Board meets regularly and, acting directly and through its separate committees, requests and receives information concerning, and considers at each of its meetings factors that are relevant to, its annual consideration of the renewal of the fund's Advisory Contracts, including the services and support provided to the fund and its shareholders. The Board has established various standing committees, each composed of Independent Trustees with varying backgrounds, to which the Board has assigned specific subject matter responsibilities in order to enhance effective decision-making by the Board. Each committee has a written charter outlining the structure and purposes of the committee. The Board also meets as needed to consider matters specifically related to the Board's annual consideration of the renewal of Advisory Contracts.
At its July 2009 meeting, the Board of Trustees, including the Independent Trustees, unanimously determined to renew the fund's Advisory Contracts. In reaching its determination, the Board considered all factors it believed relevant, including (i) the nature, extent, and quality of the services to be provided to the fund and its shareholders (including the investment performance of the fund); (ii) the competitiveness of the fund's management fee and total expenses; (iii) the total costs of the services to be provided by and the profits to be realized by Fidelity from its relationship with the fund; (iv) the extent to which economies of scale would be realized as the fund grows; and (v) whether fee levels reflect these economies of scale, if any, for the benefit of fund shareholders.
In considering whether to renew the Advisory Contracts for the fund, the Board ultimately reached a determination, with the assistance of fund counsel and Independent Trustees' counsel and through the exercise of its business judgment, that the renewal of the Advisory Contracts and the compensation to be received by Fidelity under the management contract is consistent with Fidelity's fiduciary duty under applicable law. The Board's decision to renew the Advisory Contracts was not based on any single factor noted above, but rather was based on a comprehensive consideration of all the information provided to the Board at its meetings throughout the year. The Board, in reaching its determination to renew the Advisory Contracts, is aware that shareholders in the fund have a broad range of investment choices available to them, including a wide choice among mutual funds offered by competitors to Fidelity, and that the fund's shareholders, with the opportunity to review and weigh the disclosure provided by the fund in its prospectus and other public disclosures, have chosen to invest in this fund, managed by Fidelity.
Nature, Extent, and Quality of Services Provided. The Board considered staffing within the investment adviser, FMR, and the sub-advisers (together, the Investment Advisers), including the backgrounds of the fund's investment personnel and the fund's investment objective and discipline. The Independent Trustees also had discussions with senior management of Fidelity's investment operations and investment groups. The Board considered the structure of the portfolio manager compensation program and whether this structure provides appropriate incentives.
Resources Dedicated to Investment Management and Support Services. The Board reviewed the size, education, and experience of the Investment Advisers' investment staff, their use of technology, and the Investment Advisers' approach to recruiting, training, and retaining portfolio managers and other research, advisory, and management personnel. In response to last year's financial crisis, FMR took a number of actions intended to cut costs and improve efficiency without weakening the investment teams or resources. The Board noted that Fidelity's analysts have access to a variety of technological tools and market and securities data that enable them to perform both fundamental and quantitative analysis and to specialize in various disciplines. The Board considered Fidelity's extensive global research capabilities that enable the Investment Advisers to aggregate data from various sources in an effort to produce positive investment results. The Board also considered that Fidelity's portfolio managers and analysts have access to daily portfolio attribution that allows for monitoring of a fund's portfolio, as well as an electronic communication system that provides immediate real-time access to research concerning issuers and credit enhancers.
Shareholder and Administrative Services. The Board considered (i) the nature, extent, quality, and cost of advisory, administrative, distribution, and shareholder services performed by the Investment Advisers and their affiliates under the Advisory Contracts and under separate agreements covering transfer agency, pricing and bookkeeping, and securities lending services for the fund; (ii) the nature and extent of the Investment Advisers' supervision of third party service providers, principally custodians and subcustodians; and (iii) the resources devoted to, and the record of compliance with, the fund's compliance policies and procedures. The Board also reviewed the allocation of fund brokerage, including allocations to brokers affiliated with the Investment Advisers, the use of brokerage commissions to pay fund expenses, and the use of "soft" commission dollars to pay for research services.
The Board noted that the growth of fund assets across the complex allows Fidelity to reinvest in the development of services designed to enhance the value or convenience of the Fidelity funds as investment vehicles. These services include 24-hour access to account information and market information through phone representatives and over the Internet, and investor education materials and asset allocation tools.
Investment in a Large Fund Family. The Board considered the benefits to shareholders of investing in a Fidelity fund, including the benefits of investing in a fund that is part of a large family of funds offering a variety of investment disciplines and providing for a large variety of mutual fund investor services. The Board noted that Fidelity has taken a number of actions over the previous year that benefited particular funds, including (i) dedicating additional resources to investment research and to restructure and broaden the focus of the investment research teams; (ii) bolstering the senior management team that oversees asset management; (iii) contractually agreeing to reduce the management fee on Fidelity U.S. Bond Index Fund; and (iv) expanding Class A and Class T load waiver categories to increase rollover retention opportunities and create consistent policies across the classes.
Annual Report
Board Approval of Investment Advisory Contracts and Management Fees - continued
Investment Performance. The Board considered whether the fund has operated within its investment objective, as well as its record of compliance with its investment restrictions. It also reviewed the fund's absolute investment performance for each class, as well as the fund's relative investment performance for each class measured against a broad-based securities market index over multiple periods. The Board noted that FMR does not believe that a meaningful peer group exists against which to compare the fund's performance. The following charts considered by the Board show, over the one-, three-, and five-year periods ended December 31, 2008, the cumulative total returns of Initial Class and Service Class 2 of the fund and the cumulative total returns of a broad-based securities market index ("benchmark"). The returns of Initial Class and Service Class 2 show the performance of the highest and lowest performing classes, respectively (based on five-year performance).
VIP Real Estate Portfolio
The Board stated that the investment performance of Initial Class of the fund compared favorably to its benchmark for the three- and five-year periods, although the fund's one-year cumulative total return was lower than its benchmark. The Board considered that the variations in performance among the fund's classes reflect the variations in class expenses, which result in lower performance for higher expense classes.
The Board considered that FMR has taken steps to refocus and strengthen equity research, equity portfolio management, and compliance. The Board reviewed the year-to-date performance of Initial Class through May 31, 2009 and stated that it exceeded the fund's benchmark.
Based on its review, and giving particular weight to the nature and quality of the resources dedicated by the Investment Advisers to maintain and improve relative performance and factoring in the unprecedented market events in 2008, the Board concluded that the nature, extent, and quality of the services provided to the fund will benefit the fund's shareholders, particularly in light of the Board's view that the fund's shareholders benefit from investing in a fund that is part of a large family of funds offering a variety of investment disciplines and services.
Competitiveness of Management Fee and Total Fund Expenses. The Board considered the fund's management fee and total expenses compared to "mapped groups" of competitive funds and classes. Fidelity creates "mapped groups" by combining similar Lipper investment objective categories that have comparable management fee characteristics. Combining Lipper investment objective categories aids the Board's management fee and total expense comparisons by broadening the competitive group used for comparison and by reducing the number of universes to which various Fidelity funds are compared.
The Board considered two proprietary management fee comparisons for the 12-month periods shown in the chart below. The group of Lipper funds used by the Board for management fee comparisons is referred to below as the "Total Mapped Group." The Total Mapped Group comparison focuses on a fund's standing relative to the total universe of comparable funds available to investors, in terms of gross management fees before expense reimbursements or caps. "TMG %" represents the percentage of funds in the Total Mapped Group that had management fees that were lower than the fund's. For example, a TMG % of 4% means that 96% of the funds in the Total Mapped Group had higher management fees than the fund. The "Asset-Size Peer Group" (ASPG) comparison focuses on a fund's standing relative to non-Fidelity funds similar in size to the fund within the Total Mapped Group. The ASPG represents at least 15% of the funds in the Total Mapped Group with comparable asset size and management fee characteristics, subject to a minimum of 50 funds (or all funds in the Total Mapped Group if fewer than 50). Additional information, such as the ASPG quartile in which the fund's management fee ranked, is also included in the chart and considered by the Board.
Annual Report
VIP Real Estate Portfolio
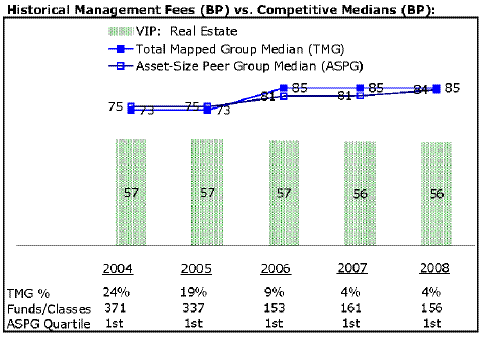
The Board noted that the fund's management fee ranked below the median of its Total Mapped Group and below the median of its ASPG for 2008.
Based on its review, the Board concluded that the fund's management fee was fair and reasonable in light of the services that the fund receives and the other factors considered.
In its review of each class's total expenses, the Board considered the fund's management fee as well as other fund or class expenses, as applicable, such as transfer agent fees, pricing and bookkeeping fees, fund-paid 12b-1 fees, and custodial, legal, and audit fees. The Board also noted the effects of any waivers and reimbursements on fees and expenses. As part of its review, the Board also considered current and historical total expenses of each class of the fund compared to competitive fund median expenses. Each class of the fund is compared to those funds and classes in the Total Mapped Group (used by the Board for management fee comparisons) that have a similar sales load structure.
The Board noted that the total expenses of each class ranked below its competitive median for 2008.
In its review of total expenses, the Board also considered Fidelity fee structures and other information on clients that FMR and its affiliates service in other competitive markets, such as other mutual funds advised or subadvised by FMR or its affiliates, pension plan clients, and other institutional clients.
Based on its review, the Board concluded that the total expenses of each class of the fund were reasonable in light of the services that the fund and its shareholders receive and the other factors considered.
Costs of the Services and Profitability. The Board considered the revenues earned and the expenses incurred by Fidelity in conducting the business of developing, marketing, distributing, managing, administering and servicing the fund and its shareholders. The Board also considered the level of Fidelity's profits in respect of all the Fidelity funds.
On an annual basis, FMR presents to the Board Fidelity's profitability for the fund. Fidelity calculates the profitability for each fund, as well as aggregate profitability for groups of Fidelity funds and all Fidelity funds, using a series of detailed revenue and cost allocation methodologies which originate with the audited books and records of Fidelity. The Audit Committee of the Board reviews any significant changes from the prior year's methodologies.
PricewaterhouseCoopers LLP (PwC), independent registered public accounting firm and auditor to Fidelity and certain Fidelity funds, has been engaged annually by the Board as part of the Board's assessment of Fidelity's profitability analysis. PwC's engagement includes the review and assessment of Fidelity's methodologies used in determining the revenues and expenses attributable to Fidelity's mutual fund business, and completion of agreed-upon procedures surrounding the mathematical accuracy of fund profitability and its conformity to allocation methodologies. After considering PwC's reports issued under the engagement and information provided by Fidelity, the Board believes that while other allocation methods may also be reasonable, Fidelity's profitability methodologies are reasonable in all material respects.
The Board has also reviewed Fidelity's non-fund businesses and any fall-out benefits related to the mutual fund business as well as cases where Fidelity's affiliates may benefit from or be related to the fund's business.
Annual Report
Board Approval of Investment Advisory Contracts and Management Fees - continued
The Board considered the costs of the services provided by and the profits realized by Fidelity in connection with the operation of the fund and determined that the amount of profit is a fair entrepreneurial profit for the management of the fund.
Economies of Scale. The Board considered whether there have been economies of scale in respect of the management of the Fidelity funds, whether the Fidelity funds (including the fund) have appropriately benefited from any such economies of scale, and whether there is potential for realization of any further economies of scale. The Board considered the extent to which the fund will benefit from economies of scale through increased services to the fund, through waivers or reimbursements, or through fee or expense reductions.
In February 2009, the Board created an Ad Hoc Committee (the "Committee") to analyze economies of scale. The Committee was formed to consider whether FMR attains economies of scale in respect of the management and servicing of the Fidelity funds, whether the Fidelity funds have appropriately benefited from such economies of scale, and whether there is potential for realization of any further economies of scale.
The Board recognized that the fund's management contract incorporates a "group fee" structure, which provides for lower group fee rates as total fund assets under FMR's management increase, and for higher group fee rates as total fund assets under FMR's management decrease. FMR determines the group fee rates based on a tiered asset "breakpoint" schedule. The Board considered that the group fee is designed to deliver the benefits of economies of scale to fund shareholders when total fund assets increase, even if assets of any particular fund are unchanged or have declined, because some portion of Fidelity's costs are attributable to services provided to all Fidelity funds, and all funds benefit if those costs can be allocated among more assets. The Board concluded that, given the group fee structure, fund shareholders will achieve a certain level of economies of scale as assets under FMR's management increase at the fund complex level, regardless of whether Fidelity achieves any such economies of scale.
The Board concluded, considering the findings of the Committee, that any potential economies of scale are being shared between fund shareholders and Fidelity in an appropriate manner.
Additional Information Requested by the Board. In order to develop fully the factual basis for consideration of the Fidelity funds' Advisory Contracts, the Board requested and received additional information on certain topics, including (i) fund performance trends, actions to be taken by FMR to improve certain funds' overall performance and Fidelity's long-term strategies for certain funds; (ii) portfolio manager changes that have occurred during the past year; (iii) Fidelity's compensation structure for portfolio managers and key personnel, including performance benchmarks used by Fidelity in evaluating incentive compensation for portfolio managers and research analysts; (iv) the structure and process of equity research and actions taken by FMR to improve the quality of research; (v) the selection of and compensation paid by FMR to fund sub-advisers; (vi) Fidelity's fee structures and rationale for recommending different fees among categories of funds; (vii) the rationale for any differences between fund fee structures and fee structures in place for other Fidelity clients; (viii) Fidelity's rationale for recommending which funds should have a performance adjustment component as part of their management fees; and (ix) explanations for the relative total expenses borne by certain funds and classes, total expense competitive trends, and actions that might be taken by FMR to reduce total expenses for certain funds and classes.
Based on its evaluation of all of the conclusions noted above, and after considering all material factors, the Board ultimately concluded that the advisory fee structures are fair and reasonable, and that the fund's Advisory Contracts should be renewed.
Annual Report
Investment Adviser
Fidelity Management & Research Company
Boston, MA
Investment Sub-Advisers
FMR Co., Inc.
Fidelity Management & Research (U.K.) Inc.
Fidelity Research & Analysis Company
FIL Investments (Japan) Limited
FIL Investment Advisors
FIL Investment Advisors (U.K.) Ltd.
Fidelity Management & Research (Japan) Inc.
Fidelity Management & Research (Hong Kong) Limited
General Distributor
Fidelity Distributors Corporation
Boston, MA
Transfer and Service Agents
Fidelity Investments Institutional Operations Company, Inc.
Boston, MA
Fidelity Service Company, Inc.
Boston, MA
Custodian
The Bank of New York Mellon
New York, NY
VIPRE-ANN-0210
1.781992.107
Fidelity® Variable Insurance Products:
Technology Portfolio
Annual Report
December 31, 2009
(2_fidelity_logos) (Registered_Trademark)
Contents
Performance | <Click Here> | How the fund has done over time. |
Management's Discussion | <Click Here> | The manager's review of fund performance, strategy and outlook. |
Shareholder Expense Example | <Click Here> | An example of shareholder expenses. |
Investment Changes | <Click Here> | A summary of major shifts in the fund's investments over the past six months. |
Investments | <Click Here> | A complete list of the fund's investments with their market values. |
Financial Statements | <Click Here> | Statements of assets and liabilities, operations, and changes in net assets, as well as financial highlights. |
Notes | <Click Here> | Notes to the financial statements. |
Report of Independent Registered Public Accounting Firm | <Click Here> | |
Trustees and Officers | <Click Here> | |
Distributions | <Click Here> | |
Board Approval of Investment Advisory Contracts and Management Fees | <Click Here> | |
To view a fund's proxy voting guidelines and proxy voting record for the 12-month period ended June 30, visit http://www.fidelity.com/proxyvotingresults or visit the Securities and Exchange Commission's (SEC) web site at http://www.sec.gov. You may also call 1-877-208-0098 to request a free copy of the proxy voting guidelines.
Fidelity Variable Insurance Products are separate account options which are purchased through a variable insurance contract.
Standard & Poor's, S&P and S&P 500 are registered service marks of The McGraw-Hill Companies, Inc. and have been licensed for use by Fidelity Distributors Corporation.
Other third party marks appearing herein are the property of their respective owners.
All other marks appearing herein are registered or unregistered trademarks or service marks of FMR LLC or an affiliated company.
This report and the financial statements contained herein are submitted for the general information of the shareholders of the fund. This report is not authorized for distribution to prospective investors in the fund unless preceded or accompanied by an effective prospectus.
The fund files its complete schedule of portfolio holdings with the SEC for the first and third quarters of each fiscal year on Form N-Q. Forms N-Q are available on the SEC's web site at http://www.sec.gov. The fund's Forms N-Q may be reviewed and copied at the SEC's Public Reference Room in Washington, DC. Information regarding the operation of the SEC's Public Reference Room may be obtained by calling 1-800-SEC-0330. For a complete list of the fund's portfolio holdings, view the most recent holdings listing, semiannual report, or annual report on Fidelity's web site at http://www.fidelity.com or http://www.advisor.fidelity.com, as applicable.
NOT FDIC INSURED · MAY LOSE VALUE · NO BANK GUARANTEE
Neither the fund nor Fidelity Distributors Corporation is a bank.
Annual Report
Average annual total return reflects the change in the value of an investment, assuming reinvestment of the class' dividend income and capital gains (the profits earned upon the sale of securities that have grown in value, if any) and assuming a constant rate of performance each year. During periods of reimbursement by Fidelity, a fund's total return will be greater than it would be had the reimbursement not occurred. Performance numbers are net of all underlying fund operating expenses, but do not include any insurance charges imposed by your insurance company's separate account. If performance information included the effect of these additional charges, the total returns would have been lower. How a fund did yesterday is no guarantee of how it will do tomorrow.
Average Annual Total Returns
Periods ended December 31, 2009 | Past 1
year | Past 5
years | Life of fund A |
VIP Technology - Initial Class | 96.02% | 5.96% | 2.69% |
VIP Technology - Investor Class B | 95.49% | 5.82% | 2.61% |
A From July 19, 2001.
B The initial offering of Investor Class shares took place on July 21, 2005. Returns prior to July 21, 2005 are those of Initial Class. Had Investor Class's transfer agent fee been reflected, returns prior to July 21, 2005 would have been lower.
$10,000 Over Life of Fund
Let's say hypothetically that $10,000 was invested in VIP Technology Portfolio - Initial Class on July 19, 2001, when the fund started. The chart shows how the value of your investment would have changed, and also shows how the Standard & Poor's 500SM Index (S&P 500®) performed over the same period.
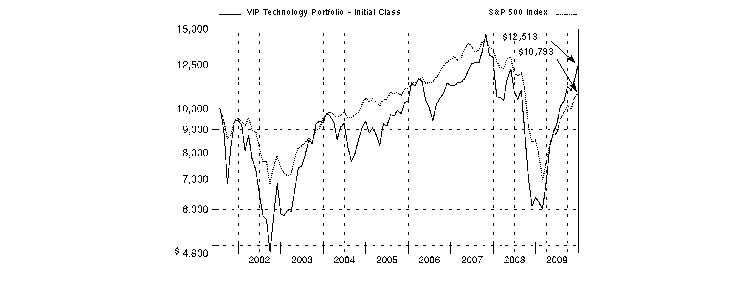
Annual Report
Market Recap: In 2009, most global markets saw both crippling lows and considerable highs. After a dismal start, the economy began to show signs of improvement, suggesting that a recovery was on the horizon. Credit markets began to heal as fiscal and monetary stimulus efforts around the world started to take effect, and corporate earnings staged an impressive rebound, fueled in large part by massive cost cutting. As a result, the flight to quality that marked most of 2008 and early 2009 shifted in March as investors flocked to riskier asset categories. The U.S. equity market, as measured by the bellwether Standard & Poor's 500SM Index and the blue-chip proxy Dow Jones Industrial AverageSM, reflected this changing environment, gaining 26.46% and 22.68%, respectively. Meanwhile, the technology-laden Nasdaq Composite® Index rose 45.32%. Foreign stocks also produced strong gains, as illustrated by the 31.93% jump of the MSCI® EAFE® Index (Europe, Australasia, Far East), a gauge of developed stock markets outside the U.S. and Canada. Emerging-markets stocks, which suffered their worst calendar-year performance ever in 2008, posted record returns this past year, with the MSCI Emerging Markets Index soaring 79.02%. A depreciating U.S. dollar helped bolster returns for U.S. investors in foreign equities.
Comments from Charlie Chai, Portfolio Manager of VIP Technology Portfolio: During the past year, the fund far outdistanced the S&P 500® and the robust 62.18% return of the MSCI U.S. Investable Market Information Technology Index. (For specific portfolio results, please refer to the performance section of this report.) Versus our sector benchmark, semiconductors provided by far the largest performance boost, almost entirely due to favorable stock selection. Stock picking also was rewarding in communications equipment, semiconductor equipment, application software, computer storage and peripherals, Internet software and services, and systems software. Our top contributor, German chip maker Infineon Technologies, was a company that investors feared might declare bankruptcy back in March. However, Fidelity's research indicated that bankruptcy was an unlikely outcome for the company, and that view was subsequently proven correct. Also bolstering our results was Starent Networks, which provides mobile data infrastructure products. Starent was acquired by Cisco Systems in mid-December. Underweighting major index component Intel, the worldwide leader in personal computer chips, further aided our results, as did chip equipment maker Aixtron. Infineon Technologies and Aixtron were out-of-index positions. Conversely, my stock picks in home entertainment software detracted, as did a large underweighting in computer hardware. At the stock level, modest underweightings in personal computer and consumer electronics maker Apple and paid-search provider Google held back our gains, as both stocks more than doubled during the period. Additionally, our out-of-index position in Japanese video-game maker Nintendo fared poorly, and I liquidated the position.
Note to shareholders: In January 2010, Fidelity adopted capped benchmarks for most of its sector and industry funds, including the VIP sector portfolios. The capped benchmarks, which limit the weightings of individual issuers, better represent the investment opportunities available to the funds and will provide shareholders with more-meaningful performance comparisons. These changes do not affect the investment policies of any of the funds, and the primary benchmark for all of the funds remains the Standard & Poor's 500 Index.
The views expressed above reflect those of the portfolio manager(s) only through the end of the period as stated on the cover of this report and do not necessarily represent the views of Fidelity or any other person in the Fidelity organization. Any such views are subject to change at any time based upon market or other conditions and Fidelity disclaims any responsibility to update such views. These views may not be relied on as investment advice and, because investment decisions for a Fidelity fund are based on numerous factors, may not be relied on as an indication of trading intent on behalf of any Fidelity fund.
Annual Report
As a shareholder of the Fund, you incur two types of costs: (1) transaction costs, including redemption fees, and (2) ongoing costs, including management fees and other Fund expenses. This Example is intended to help you understand your ongoing costs (in dollars) of investing in the Fund and to compare these costs with the ongoing costs of investing in other mutual funds.
The Example is based on an investment of $1,000 invested at the beginning of the period and held for the entire period (July 1, 2009 to December 31, 2009).
Actual Expenses
The first line of the accompanying table for each class of the Fund provides information about actual account values and actual expenses. You may use the information in this line, together with the amount you invested, to estimate the expenses that you paid over the period. Simply divide your account value by $1,000.00 (for example, an $8,600 account value divided by $1,000.00 = 8.6), then multiply the result by the number in the first line for a class of the Fund under the heading entitled "Expenses Paid During Period" to estimate the expenses you paid on your account during this period. The estimate of expenses does not include any fees or other expenses of any variable annuity or variable life insurance product. If they were, the estimate of expenses you paid during the period would be higher, and your ending account value would be lower. In addition, the Fund, as a shareholder in the underlying Fidelity Central Funds, will indirectly bear its pro-rata share of the fees and expenses incurred by the underlying Fidelity Central Funds. These fees and expenses are not included in the Fund's annualized expense ratio used to calculate the expense estimate in the table below.
Hypothetical Example for Comparison Purposes
The second line of the accompanying table for each class of the Fund provides information about hypothetical account values and hypothetical expenses based on a Class' actual expense ratio and an assumed rate of return of 5% per year before expenses, which is not the Class' actual return. The hypothetical account values and expenses may not be used to estimate the actual ending account balance or expenses you paid for the period. You may use this information to compare the ongoing costs of investing in the Fund and other funds. To do so, compare this 5% hypothetical example with the 5% hypothetical examples that appear in the shareholder reports of the other funds. The estimate of expenses does not include any fees or other expenses of any variable annuity or variable life insurance product. If they were, the estimate of expenses you paid during the period would be higher, and your ending account value would be lower. In addition, the Fund, as a shareholder in the underlying Fidelity Central Funds, will indirectly bear its pro-rata share of the fees and expenses incurred by the underlying Fidelity Central Funds. These fees and expenses are not included in the Fund's annualized expense ratio used to calculate the expense estimate in the table below.
Please note that the expenses shown in the table are meant to highlight your ongoing costs only and do not reflect any transaction costs. Therefore, the second line of the table is useful in comparing ongoing costs only, and will not help you determine the relative total costs of owning different funds. In addition, if these transactional costs were included, your costs would have been higher.
| Annualized
Expense Ratio | Beginning
Account Value
July 1, 2009 | Ending
Account Value
December 31, 2009 | Expenses Paid
During Period*
July 1, 2009 to
December 31, 2009 |
Initial Class | .76% | | | |
Actual | | $ 1,000.00 | $ 1,353.80 | $ 4.51 |
Hypothetical A | | $ 1,000.00 | $ 1,021.37 | $ 3.87 |
Investor Class | .85% | | | |
Actual | | $ 1,000.00 | $ 1,353.40 | $ 5.04 |
Hypothetical A | | $ 1,000.00 | $ 1,020.92 | $ 4.33 |
A 5% return per year before expenses
* Expenses are equal to each Class' annualized expense ratio, multiplied by the average account value over the period, multiplied by 184/365 (to reflect the one-half year period). The fees and expenses of the underlying Fidelity Central Funds in which the Fund invests are not included in the Fund's annualized expense ratio.
Annual Report
Investment Changes (Unaudited)
Top Ten Stocks as of December 31, 2009 |
| % of fund's
net assets | % of fund's net assets
6 months ago |
Microsoft Corp. | 9.0 | 9.6 |
Apple, Inc. | 8.2 | 7.1 |
Google, Inc. Class A | 6.4 | 4.0 |
Oracle Corp. | 3.7 | 3.3 |
Hewlett-Packard Co. | 3.7 | 2.9 |
Cisco Systems, Inc. | 3.5 | 0.2 |
QUALCOMM, Inc. | 2.5 | 2.6 |
BMC Software, Inc. | 1.9 | 2.1 |
Salesforce.com, Inc. | 1.7 | 1.3 |
SanDisk Corp. | 1.5 | 0.8 |
| 42.1 | |
Top Industries (% of fund's net assets) |
As of December 31, 2009 |
| Software | 26.6% | |
| Computers & Peripherals | 16.3% | |
| Semiconductors & Semiconductor Equipment | 15.1% | |
| Internet Software & Services | 14.1% | |
| Communications Equipment | 9.8% | |
| All Others* | 18.1% | |

As of June 30, 2009 |
| Software | 31.2% | |
| Semiconductors & Semiconductor Equipment | 24.3% | |
| Computers & Peripherals | 13.0% | |
| Communications Equipment | 9.8% | |
| Internet Software & Services | 9.5% | |
| All Others* | 12.2% | |

* Includes short-term investments and net other assets. |
Annual Report
Investments December 31, 2009
Showing Percentage of Net Assets
Common Stocks - 95.1% |
| Shares | | Value |
COMMERCIAL SERVICES & SUPPLIES - 0.1% |
Commercial Printing - 0.1% |
Nissha Printing Co. Ltd. (c) | 3,600 | | $ 177,434 |
COMMUNICATIONS EQUIPMENT - 9.7% |
Communications Equipment - 9.7% |
Adtran, Inc. | 12,700 | | 286,385 |
Aruba Networks, Inc. (a) | 900 | | 9,594 |
Brocade Communications Systems, Inc. (a) | 50,200 | | 383,026 |
BYD Electronic International Co. Ltd. (a) | 130,500 | | 106,287 |
Ciena Corp. (a) | 5,200 | | 56,368 |
Cisco Systems, Inc. (a) | 221,537 | | 5,303,596 |
Comverse Technology, Inc. (a) | 12,970 | | 122,567 |
EMCORE Corp. (a) | 20,000 | | 21,400 |
Emulex Corp. (a) | 12,800 | | 139,520 |
F5 Networks, Inc. (a) | 15,018 | | 795,654 |
Infinera Corp. (a) | 13,800 | | 122,406 |
Juniper Networks, Inc. (a) | 43,800 | | 1,168,146 |
Motorola, Inc. | 13,500 | | 104,760 |
Netronix, Inc. (a) | 24,000 | | 98,281 |
Palm, Inc. (a) | 15,300 | | 153,612 |
Polycom, Inc. (a) | 28,900 | | 721,633 |
QUALCOMM, Inc. | 82,334 | | 3,808,771 |
Research In Motion Ltd. (a) | 3,100 | | 209,374 |
Riverbed Technology, Inc. (a) | 18,900 | | 434,133 |
Sandvine Corp. (a) | 185,700 | | 228,005 |
Sandvine Corp. (U.K.) (a) | 100,288 | | 126,423 |
Sonus Networks, Inc. (a) | 5,300 | | 11,183 |
Tekelec (a) | 22,400 | | 342,272 |
| | 14,753,396 |
COMPUTERS & PERIPHERALS - 16.3% |
Computer Hardware - 12.4% |
3PAR, Inc. (a) | 18,000 | | 213,300 |
Apple, Inc. (a) | 59,545 | | 12,555,659 |
Hewlett-Packard Co. | 108,517 | | 5,589,711 |
Stratasys, Inc. (a) | 13,110 | | 226,541 |
Toshiba Corp. | 53,000 | | 294,234 |
| | 18,879,445 |
Computer Storage & Peripherals - 3.9% |
Chicony Electronics Co. Ltd. | 35,267 | | 85,549 |
Compellent Technologies, Inc. (a) | 7,300 | | 165,564 |
EMC Corp. (a) | 20,000 | | 349,400 |
NetApp, Inc. (a) | 11,200 | | 385,168 |
Netezza Corp. (a) | 11,500 | | 111,550 |
Qisda Corp. (a) | 172,000 | | 107,802 |
QLogic Corp. (a) | 11,000 | | 207,570 |
SanDisk Corp. (a) | 80,287 | | 2,327,520 |
Seagate Technology | 58,900 | | 1,071,391 |
SIMPLO Technology Co. Ltd. | 12,100 | | 71,866 |
|
| Shares | | Value |
Synaptics, Inc. (a) | 17,900 | | $ 548,635 |
Western Digital Corp. (a) | 12,000 | | 529,800 |
| | 5,961,815 |
TOTAL COMPUTERS & PERIPHERALS | | 24,841,260 |
DIVERSIFIED CONSUMER SERVICES - 0.1% |
Education Services - 0.1% |
New Oriental Education & Technology Group, Inc. sponsored ADR (a) | 2,700 | | 204,147 |
ELECTRICAL EQUIPMENT - 1.7% |
Electrical Components & Equipment - 1.7% |
A123 Systems, Inc. | 500 | | 11,220 |
Canadian Solar, Inc. (a) | 3,200 | | 92,224 |
centrotherm photovoltaics AG (a) | 4,300 | | 259,787 |
Energy Conversion Devices, Inc. (a) | 8,300 | | 87,731 |
First Solar, Inc. (a) | 86 | | 11,644 |
GT Solar International, Inc. (a)(c) | 101,400 | | 563,784 |
JA Solar Holdings Co. Ltd. ADR (a) | 3,100 | | 17,670 |
Q-Cells SE (a) | 200 | | 3,264 |
Roth & Rau AG (a)(c) | 3,600 | | 155,752 |
SunPower Corp.: | | | |
Class A (a)(c) | 8,900 | | 210,752 |
Class B (a) | 15,242 | | 319,320 |
Suntech Power Holdings Co. Ltd. sponsored ADR (a)(c) | 600 | | 9,978 |
Trina Solar Ltd. ADR (a)(c) | 8,500 | | 458,745 |
Yingli Green Energy Holding Co. Ltd. ADR (a)(c) | 22,200 | | 350,982 |
| | 2,552,853 |
ELECTRONIC EQUIPMENT & COMPONENTS - 5.4% |
Electronic Components - 2.1% |
Amphenol Corp. Class A | 300 | | 13,854 |
BYD Co. Ltd. (H Shares) (a) | 35,500 | | 311,173 |
Corning, Inc. | 16,400 | | 316,684 |
DTS, Inc. (a) | 4,400 | | 150,524 |
Everlight Electronics Co. Ltd. | 42,957 | | 161,139 |
Prime View International Co. Ltd. (a) | 568,000 | | 1,495,017 |
Prime View International Co. Ltd. sponsored GDR (a)(d) | 1,000 | | 26,325 |
Universal Display Corp. (a)(c) | 30,000 | | 370,800 |
Vishay Intertechnology, Inc. (a) | 9,200 | | 76,820 |
Wintek Corp. (a) | 252,000 | | 224,508 |
| | 3,146,844 |
Electronic Equipment & Instruments - 0.6% |
Agilent Technologies, Inc. (a) | 500 | | 15,535 |
China Security & Surveillance Technology, Inc. warrants 8/25/10 (a)(f) | 8,400 | | 9,384 |
Chroma ATE, Inc. | 218,132 | | 495,724 |
Comverge, Inc. (a) | 1,211 | | 13,612 |
Coretronic Corp. | 23,000 | | 33,360 |
Common Stocks - continued |
| Shares | | Value |
ELECTRONIC EQUIPMENT & COMPONENTS - CONTINUED |
Electronic Equipment & Instruments - continued |
Itron, Inc. (a) | 200 | | $ 13,514 |
National Instruments Corp. | 11,537 | | 339,765 |
| | 920,894 |
Electronic Manufacturing Services - 1.6% |
Benchmark Electronics, Inc. (a) | 6,500 | | 122,915 |
Flextronics International Ltd. (a) | 40,500 | | 296,055 |
Ju Teng International Holdings Ltd. | 104,000 | | 103,040 |
Multi-Fineline Electronix, Inc. (a) | 411 | | 11,660 |
Trimble Navigation Ltd. (a) | 72,985 | | 1,839,222 |
| | 2,372,892 |
Technology Distributors - 1.1% |
Digital China Holdings Ltd. (H Shares) | 711,000 | | 946,496 |
Inspur International Ltd. | 411,000 | | 58,427 |
Supreme Electronics Co. Ltd. (a) | 177,000 | | 168,756 |
Synnex Technology International Corp. | 59,800 | | 129,919 |
WPG Holding Co. Ltd. | 252,000 | | 438,775 |
| | 1,742,373 |
TOTAL ELECTRONIC EQUIPMENT & COMPONENTS | | 8,183,003 |
HEALTH CARE EQUIPMENT & SUPPLIES - 0.4% |
Health Care Equipment - 0.2% |
China Medical Technologies, Inc. sponsored ADR | 300 | | 4,215 |
Golden Meditech Co. Ltd. (a) | 262,000 | | 63,236 |
Mingyuan Medicare Development Co. Ltd. (a) | 1,080,000 | | 184,266 |
| | 251,717 |
Health Care Supplies - 0.2% |
Shandong Weigao Group Medical Polymer Co. Ltd. (H Shares) | 92,000 | | 306,598 |
TOTAL HEALTH CARE EQUIPMENT & SUPPLIES | | 558,315 |
HEALTH CARE TECHNOLOGY - 0.0% |
Health Care Technology - 0.0% |
athenahealth, Inc. (a) | 100 | | 4,524 |
HOTELS, RESTAURANTS & LEISURE - 0.5% |
Hotels, Resorts & Cruise Lines - 0.5% |
Ctrip.com International Ltd. sponsored ADR (a) | 10,400 | | 747,344 |
INDEPENDENT POWER PRODUCERS & ENERGY TRADERS - 0.0% |
Independent Power Producers & Energy Traders - 0.0% |
GCL-Poly Energy Holdings Ltd. | 129,000 | | 38,262 |
|
| Shares | | Value |
INTERNET & CATALOG RETAIL - 1.3% |
Internet Retail - 1.3% |
Amazon.com, Inc. (a) | 8,700 | | $ 1,170,324 |
Priceline.com, Inc. (a) | 3,288 | | 718,428 |
| | 1,888,752 |
INTERNET SOFTWARE & SERVICES - 14.1% |
Internet Software & Services - 14.1% |
Alibaba.com Ltd. | 21,500 | | 49,564 |
AOL, Inc. (a) | 11,200 | | 260,736 |
Art Technology Group, Inc. (a) | 31,503 | | 142,079 |
Baidu.com, Inc. sponsored ADR (a) | 5,530 | | 2,274,102 |
Daum Communications Corp. (a) | 3,914 | | 235,966 |
DealerTrack Holdings, Inc. (a) | 1,500 | | 28,185 |
eBay, Inc. (a) | 62,400 | | 1,468,896 |
Google, Inc. Class A (a) | 15,600 | | 9,671,688 |
GREE, Inc. | 6,100 | | 377,343 |
Internap Network Services Corp. (a) | 16,500 | | 77,550 |
LogMeIn, Inc. | 800 | | 15,960 |
Mercadolibre, Inc. (a) | 7,000 | | 363,090 |
ModusLink Global Solutions, Inc. (a) | 30,000 | | 282,300 |
NetEase.com, Inc. sponsored ADR (a) | 11,000 | | 413,710 |
NHN Corp. (a) | 5,197 | | 855,712 |
Open Text Corp. (a) | 27,600 | | 1,121,968 |
OpenTable, Inc. | 100 | | 2,546 |
Tencent Holdings Ltd. | 103,300 | | 2,234,057 |
VeriSign, Inc. (a) | 33,800 | | 819,312 |
VistaPrint Ltd. (a) | 14,100 | | 798,906 |
Vocus, Inc. (a) | 1,300 | | 23,400 |
| | 21,517,070 |
IT SERVICES - 1.8% |
Data Processing & Outsourced Services - 0.7% |
Visa, Inc. Class A | 12,600 | | 1,101,996 |
IT Consulting & Other Services - 1.1% |
Atos Origin SA (a) | 4,634 | | 212,860 |
China Information Security Technology, Inc. (a) | 83 | | 511 |
Cognizant Technology Solutions Corp. Class A (a) | 13,200 | | 597,960 |
RightNow Technologies, Inc. (a) | 35,700 | | 620,109 |
Yucheng Technologies Ltd. (a) | 29,800 | | 254,194 |
| | 1,685,634 |
TOTAL IT SERVICES | | 2,787,630 |
LIFE SCIENCES TOOLS & SERVICES - 0.1% |
Life Sciences Tools & Services - 0.1% |
Life Technologies Corp. (a) | 4,000 | | 208,920 |
Common Stocks - continued |
| Shares | | Value |
MACHINERY - 0.2% |
Industrial Machinery - 0.2% |
Meyer Burger Technology AG (a) | 550 | | $ 140,229 |
Shin Zu Shing Co. Ltd. | 44,302 | | 220,887 |
| | 361,116 |
MEDIA - 1.0% |
Advertising - 0.9% |
AirMedia Group, Inc. ADR (a)(c) | 66,700 | | 500,917 |
Focus Media Holding Ltd. ADR (a) | 16,800 | | 266,280 |
VisionChina Media, Inc. ADR (a) | 48,200 | | 526,344 |
| | 1,293,541 |
Cable & Satellite - 0.1% |
Virgin Media, Inc. | 12,700 | | 213,741 |
TOTAL MEDIA | | 1,507,282 |
METALS & MINING - 0.0% |
Diversified Metals & Mining - 0.0% |
Globe Specialty Metals, Inc. | 4,300 | | 40,420 |
Timminco Ltd. (a) | 700 | | 866 |
| | 41,286 |
SEMICONDUCTORS & SEMICONDUCTOR EQUIPMENT - 15.1% |
Semiconductor Equipment - 3.9% |
Aixtron AG | 18,200 | | 612,317 |
Amkor Technology, Inc. (a) | 73,495 | | 526,224 |
ASM International NV (NASDAQ) (a) | 2,800 | | 72,044 |
ASML Holding NV (NY Shares) | 51,700 | | 1,762,453 |
ATMI, Inc. (a) | 15,000 | | 279,300 |
Cymer, Inc. (a) | 3,600 | | 138,168 |
FormFactor, Inc. (a) | 6,700 | | 145,792 |
Lam Research Corp. (a) | 15,400 | | 603,834 |
LTX-Credence Corp. (a) | 55,615 | | 98,995 |
MEMC Electronic Materials, Inc. (a) | 10,000 | | 136,200 |
Photronics, Inc. (a) | 9,700 | | 43,165 |
Tessera Technologies, Inc. (a) | 28,500 | | 663,195 |
Varian Semiconductor Equipment Associates, Inc. (a) | 20,100 | | 721,188 |
Veeco Instruments, Inc. (a) | 2,700 | | 89,208 |
| | 5,892,083 |
Semiconductors - 11.2% |
Atmel Corp. (a) | 48,500 | | 223,585 |
Avago Technologies Ltd. | 109,300 | | 1,999,097 |
Broadcom Corp. Class A (a) | 23,400 | | 735,930 |
Cavium Networks, Inc. (a) | 63,991 | | 1,524,906 |
Cree, Inc. (a) | 19,760 | | 1,113,871 |
CSR PLC (a) | 52,144 | | 344,759 |
Cypress Semiconductor Corp. (a) | 33,100 | | 349,536 |
Epistar Corp. | 79,000 | | 296,343 |
Fairchild Semiconductor International, Inc. (a) | 16,200 | | 161,838 |
Global Unichip Corp. | 36,994 | | 196,014 |
|
| Shares | | Value |
Hittite Microwave Corp. (a) | 4,921 | | $ 200,531 |
Hynix Semiconductor, Inc. (a) | 12,580 | | 249,750 |
Infineon Technologies AG (a) | 55,364 | | 304,502 |
Inotera Memories, Inc. (a) | 221,000 | | 186,182 |
Integrated Device Technology, Inc. (a) | 69,400 | | 449,018 |
Intel Corp. | 100,500 | | 2,050,200 |
International Rectifier Corp. (a) | 24,600 | | 544,152 |
Intersil Corp. Class A | 26,100 | | 400,374 |
LSI Corp. (a) | 1,800 | | 10,818 |
Marvell Technology Group Ltd. (a) | 77,995 | | 1,618,396 |
MediaTek, Inc. | 3,006 | | 52,434 |
Microchip Technology, Inc. | 4,400 | | 127,864 |
Micron Technology, Inc. (a) | 86,700 | | 915,552 |
Microsemi Corp. (a) | 900 | | 15,975 |
Monolithic Power Systems, Inc. (a) | 9,900 | | 237,303 |
National Semiconductor Corp. | 9,600 | | 147,456 |
Netlogic Microsystems, Inc. (a) | 4,500 | | 208,170 |
NVIDIA Corp. (a) | 61,800 | | 1,154,424 |
Omnivision Technologies, Inc. (a) | 12,801 | | 185,999 |
PixArt Imaging, Inc. | 23,800 | | 200,875 |
Power Integrations, Inc. | 2,714 | | 98,681 |
Radiant Opto-Electronics Corp. | 50,470 | | 73,441 |
Silicon Laboratories, Inc. (a) | 4,500 | | 217,530 |
Standard Microsystems Corp. (a) | 16,500 | | 342,870 |
Volterra Semiconductor Corp. (a) | 2,000 | | 38,240 |
YoungTek Electronics Corp. | 17,000 | | 43,045 |
| | 17,019,661 |
TOTAL SEMICONDUCTORS & SEMICONDUCTOR EQUIPMENT | | 22,911,744 |
SOFTWARE - 26.6% |
Application Software - 8.7% |
Adobe Systems, Inc. (a) | 1,900 | | 69,882 |
ANSYS, Inc. (a) | 700 | | 30,422 |
AsiaInfo Holdings, Inc. (a) | 6,300 | | 191,961 |
Blackboard, Inc. (a) | 2,500 | | 113,475 |
Citrix Systems, Inc. (a) | 33,200 | | 1,381,452 |
Concur Technologies, Inc. (a) | 15,300 | | 654,075 |
Epicor Software Corp. (a) | 44,195 | | 336,766 |
Gameloft (a) | 32,800 | | 165,762 |
i2 Technologies, Inc. (a) | 1,300 | | 24,856 |
Informatica Corp. (a) | 43,400 | | 1,122,324 |
JDA Software Group, Inc. (a) | 12,000 | | 305,640 |
Kingdee International Software Group Co. Ltd. | 2,824,000 | | 628,849 |
Longtop Financial Technologies Ltd. ADR (a) | 10,200 | | 377,604 |
Magma Design Automation, Inc. (a)(c) | 54,000 | | 124,740 |
Manhattan Associates, Inc. (a) | 2,888 | | 69,399 |
Mentor Graphics Corp. (a) | 24,700 | | 218,101 |
MicroStrategy, Inc. Class A (a) | 2,401 | | 225,742 |
Nuance Communications, Inc. (a) | 44,000 | | 683,760 |
Parametric Technology Corp. (a) | 55,200 | | 901,968 |
Common Stocks - continued |
| Shares | | Value |
SOFTWARE - CONTINUED |
Application Software - continued |
Pegasystems, Inc. | 8,800 | | $ 299,200 |
Salesforce.com, Inc. (a) | 35,700 | | 2,633,589 |
Smith Micro Software, Inc. (a) | 42,700 | | 390,278 |
SolarWinds, Inc. | 500 | | 11,505 |
SuccessFactors, Inc. (a) | 28,100 | | 465,898 |
Synchronoss Technologies, Inc. (a) | 15,352 | | 242,715 |
Taleo Corp. Class A (a) | 20,900 | | 491,568 |
TIBCO Software, Inc. (a) | 64,500 | | 621,135 |
Ulticom, Inc. | 9,673 | | 91,507 |
Verint Systems, Inc. (a) | 21,400 | | 411,950 |
| | 13,286,123 |
Home Entertainment Software - 0.3% |
Activision Blizzard, Inc. (a) | 23,700 | | 263,307 |
Changyou.com Ltd. (A Shares) ADR | 100 | | 3,321 |
Giant Interactive Group, Inc. ADR (c) | 17,189 | | 120,667 |
NCsoft Corp. | 610 | | 78,207 |
Neowiz Games Corp. | 717 | | 24,934 |
Rosetta Stone, Inc. | 1,100 | | 19,745 |
| | 510,181 |
Systems Software - 17.6% |
Ariba, Inc. (a) | 54,192 | | 678,484 |
BMC Software, Inc. (a) | 69,900 | | 2,802,990 |
Check Point Software Technologies Ltd. (a) | 10,600 | | 359,128 |
CommVault Systems, Inc. (a) | 7,900 | | 187,151 |
Fortinet, Inc. | 2,400 | | 42,168 |
Insyde Software Corp. | 35,206 | | 165,630 |
Microsoft Corp. | 448,125 | | 13,663,323 |
Oracle Corp. | 231,400 | | 5,678,556 |
Red Hat, Inc. (a) | 67,000 | | 2,070,300 |
Rovi Corp. (a) | 6,819 | | 217,322 |
TeleCommunication Systems, Inc. Class A (a) | 20,600 | | 199,408 |
VMware, Inc. Class A (a) | 15,100 | | 639,938 |
| | 26,704,398 |
TOTAL SOFTWARE | | 40,500,702 |
WIRELESS TELECOMMUNICATION SERVICES - 0.7% |
Wireless Telecommunication Services - 0.7% |
SOFTBANK CORP. | 17,800 | | 417,482 |
Sprint Nextel Corp. (a) | 88,200 | | 322,812 |
Syniverse Holdings, Inc. (a) | 17,743 | | 310,148 |
| | 1,050,442 |
TOTAL COMMON STOCKS (Cost $113,001,172) | 144,835,482 |
Convertible Bonds - 0.1% |
| Principal Amount | | Value |
COMMUNICATIONS EQUIPMENT - 0.1% |
Communications Equipment - 0.1% |
Ciena Corp. 0.25% 5/1/13
(Cost $157,875) | | $ 150,000 | | $ 113,400 |
Money Market Funds - 5.8% |
| Shares | | |
Fidelity Cash Central Fund, 0.16% (e) | 6,772,471 | | 6,772,471 |
Fidelity Securities Lending Cash Central Fund, 0.15% (b)(e) | 2,006,365 | | 2,006,365 |
TOTAL MONEY MARKET FUNDS (Cost $8,778,836) | 8,778,836 |
TOTAL INVESTMENT PORTFOLIO - 101.0% (Cost $121,937,883) | | 153,727,718 |
NET OTHER ASSETS - (1.0)% | | (1,516,215) |
NET ASSETS - 100% | $ 152,211,503 |
Legend |
(a) Non-income producing |
(b) Investment made with cash collateral received from securities on loan. |
(c) Security or a portion of the security is on loan at period end. |
(d) Security exempt from registration under Rule 144A of the Securities Act of 1933. These securities may be resold in transactions exempt from registration, normally to qualified institutional buyers. At the end of the period, the value of these securities amounted to $26,325 or 0.0% of net assets. |
(e) Affiliated fund that is available only to investment companies and other accounts managed by Fidelity Investments. The rate quoted is the annualized seven-day yield of the fund at period end. A complete unaudited listing of the fund's holdings as of its most recent quarter end is available upon request. |
(f) Restricted securities - Investment in securities not registered under the Securities Act of 1933 (excluding 144A issues). At the end of the period, the value of restricted securities (excluding 144A issues) amounted to $9,384 or 0.0% of net assets. |
Additional information on each holding is as follows: |
Security | Acquisition Date | Acquisition Cost |
China Security & Surveillance Technology, Inc. warrants 8/25/10 | 8/25/09 | $ 1 |
Affiliated Central Funds |
Information regarding fiscal year to date income earned by the Fund from investments in Fidelity Central Funds is as follows: |
Fund | Income earned |
Fidelity Cash Central Fund | $ 7,457 |
Fidelity Securities Lending Cash Central Fund | 49,326 |
Total | $ 56,783 |
Other Information |
The following is a summary of the inputs used, as of December 31, 2009, involving the Fund's assets and liabilities carried at value. The inputs or methodology used for valuing securities may not be an indication of the risk associated with investing in those securities. For more information on valuation inputs, and their aggregation into the levels used in the table below, please refer to the Security Valuation section in the accompanying Notes to Financial Statements. |
Valuation Inputs at Reporting Date: |
Description | Total | Level 1 | Level 2 | Level 3 |
Investments in Securities: | | | | |
Common Stocks | $ 144,835,482 | $ 138,224,848 | $ 6,610,634 | $ - |
Convertible Bonds | 113,400 | - | 113,400 | - |
Money Market Funds | 8,778,836 | 8,778,836 | - | - |
Total Investments in Securities: | $ 153,727,718 | $ 147,003,684 | $ 6,724,034 | $ - |
Distribution of investments by country of issue, as a percentage of total net assets, is as follows: (Unaudited) |
United States of America | 79.5% |
China | 4.5% |
Cayman Islands | 3.4% |
Taiwan | 3.3% |
Bermuda | 1.7% |
Singapore | 1.5% |
Netherlands | 1.2% |
Canada | 1.1% |
Korea (South) | 1.0% |
Others (individually less than 1%) | 2.8% |
| 100.0% |
Income Tax Information |
At December 31, 2009, the Fund had a capital loss carryforward of approximately $17,998,325, of which $15,064,221 and $2,934,104 will expire on December 31, 2016 and 2017, respectively. |
See accompanying notes which are an integral part of the financial statements.
Annual Report
Statement of Assets and Liabilities
| December 31, 2009 |
| | |
Assets | | |
Investment in securities, at value (including securities loaned of $1,946,544) - See accompanying schedule: Unaffiliated issuers (cost $113,159,047) | $ 144,948,882 | |
Fidelity Central Funds (cost $8,778,836) | 8,778,836 | |
Total Investments (cost $121,937,883) | | $ 153,727,718 |
Foreign currency held at value (cost $5) | | 5 |
Receivable for investments sold | | 130,779 |
Receivable for fund shares sold | | 747,501 |
Dividends receivable | | 9,924 |
Interest receivable | | 62 |
Distributions receivable from Fidelity Central Funds | | 2,829 |
Prepaid expenses | | 488 |
Other receivables | | 7,093 |
Total assets | | 154,626,399 |
| | |
Liabilities | | |
Payable for investments purchased | $ 280,238 | |
Payable for fund shares redeemed | 2,824 | |
Accrued management fee | 65,132 | |
Other affiliated payables | 16,246 | |
Other payables and accrued expenses | 44,091 | |
Collateral on securities loaned, at value | 2,006,365 | |
Total liabilities | | 2,414,896 |
| | |
Net Assets | | $ 152,211,503 |
Net Assets consist of: | | |
Paid in capital | | $ 139,051,134 |
Accumulated undistributed net realized gain (loss) on investments and foreign currency transactions | | (18,629,467) |
Net unrealized appreciation (depreciation) on investments and assets and liabilities in foreign currencies | | 31,789,836 |
Net Assets | | $ 152,211,503 |
Statement of Assets and Liabilities - continued
| December 31, 2009 |
| | |
Initial Class:
Net Asset Value, offering price and redemption price per share ($88,231,369 ÷ 9,990,168 shares) | | $ 8.83 |
| | |
Investor Class:
Net Asset Value, offering price and redemption price per share ($63,980,134 ÷ 7,276,473 shares) | | $ 8.79 |
See accompanying notes which are an integral part of the financial statements.
Annual Report
Financial Statements - continued
Statement of Operations
| Year ended December 31, 2009 |
| | |
Investment Income | | |
Dividends | | $ 448,942 |
Special dividends | | 177,214 |
Interest | | 90,654 |
Income from Fidelity Central Funds (including $49,326 from security lending) | | 56,783 |
Total income | | 773,593 |
| | |
Expenses | | |
Management fee | $ 486,098 | |
Transfer agent fees | 102,332 | |
Accounting and security lending fees | 34,177 | |
Custodian fees and expenses | 42,530 | |
Independent trustees' compensation | 524 | |
Audit | 40,606 | |
Legal | 450 | |
Miscellaneous | 7,261 | |
Total expenses before reductions | 713,978 | |
Expense reductions | (19,261) | 694,717 |
Net investment income (loss) | | 78,876 |
Realized and Unrealized Gain (Loss) Net realized gain (loss) on: | | |
Investment securities: | | |
Unaffiliated issuers | 6,523,576 | |
Foreign currency transactions | (4,108) | |
Total net realized gain (loss) | | 6,519,468 |
Change in net unrealized appreciation (depreciation) on: Investment securities | 49,267,472 | |
Assets and liabilities in foreign currencies | (312) | |
Total change in net unrealized appreciation (depreciation) | | 49,267,160 |
Net gain (loss) | | 55,786,628 |
Net increase (decrease) in net assets resulting from operations | | $ 55,865,504 |
Statement of Changes in Net Assets
| Year ended
December 31,
2009 | Year ended
December 31,
2008 |
Increase (Decrease) in Net Assets | | |
Operations | | |
Net investment income (loss) | $ 78,876 | $ 111,168 |
Net realized gain (loss) | 6,519,468 | (24,802,819) |
Change in net unrealized appreciation (depreciation) | 49,267,160 | (23,720,929) |
Net increase (decrease) in net assets resulting from operations | 55,865,504 | (48,412,580) |
Distributions to shareholders from net investment income | (143,352) | (77,871) |
Distributions to shareholders from net realized gain | - | (12,421,709) |
Total distributions | (143,352) | (12,499,580) |
Share transactions - net increase (decrease) | 58,132,204 | (5,986,585) |
Redemption fees | 54,256 | 47,060 |
Total increase (decrease) in net assets | 113,908,612 | (66,851,685) |
| | |
Net Assets | | |
Beginning of period | 38,302,891 | 105,154,576 |
End of period (including undistributed net investment income of $0 and $26,283, respectively) | $ 152,211,503 | $ 38,302,891 |
See accompanying notes which are an integral part of the financial statements.
Annual Report
Financial Highlights - Initial Class
Years ended December 31, | 2009 | 2008 | 2007 | 2006 | 2005 |
Selected Per-Share Data | | | | | |
Net asset value, beginning of period | $ 4.51 | $ 11.02 | $ 10.37 | $ 10.35 | $ 9.37 |
Income from Investment Operations | | | | | |
Net investment income (loss) C | .01 F | .01 | (.05) | (.04) | (.02) |
Net realized and unrealized gain (loss) | 4.32 | (5.01) | 1.52 | .88 | 1.04 |
Total from investment operations | 4.33 | (5.00) | 1.47 | .84 | 1.02 |
Distributions from net investment income | (.01) | (.01) | - | - | (.04) |
Distributions from net realized gain | - | (1.49) | (.83) | (.83) | - |
Total distributions | (.01) | (1.51) I | (.83) | (.83) | (.04) |
Redemption fees added to paid in capital C | - H | - H | .01 | .01 | - H |
Net asset value, end of period | $ 8.83 | $ 4.51 | $ 11.02 | $ 10.37 | $ 10.35 |
Total Return A,B | 96.02% | (50.77)% | 15.36% | 8.19% | 10.88% |
Ratios to Average Net Assets D,G | | | | | |
Expenses before reductions | .78% | .81% | .81% | .80% | .79% |
Expenses net of fee waivers, if any | .78% | .81% | .81% | .80% | .79% |
Expenses net of all reductions | .76% | .79% | .79% | .77% | .62% |
Net investment income (loss) | .13% F | .19% | (.44)% | (.43)% | (.24)% |
Supplemental Data | | | | | |
Net assets, end of period (000 omitted) | $ 88,231 | $ 25,400 | $ 70,788 | $ 64,689 | $ 78,892 |
Portfolio turnover rate E | 130% | 237% | 213% | 269% | 249% |
A Total returns do not reflect charges attributable to your insurance company's separate account. Inclusion of these charges would reduce the total returns shown. B Total returns would have been lower had certain expenses not been reduced during the periods shown. C Calculated based on average shares outstanding during the period. D Fees and expenses of the underlying Fidelity Central Funds are not included in the Fund's expense ratio. The Fund indirectly bears its proportionate share of the expenses of any underlying Fidelity Central Funds. E Amount does not include the portfolio activity of any underlying Fidelity Central Funds. F Investment income per share reflects a special dividend which amounted to $.01 per share. Excluding the special dividend, the ratio of net investment income (loss) to average net assets would have been (.08)%. G Expense ratios reflect operating expenses of the class. Expenses before reductions do not reflect amounts reimbursed by the investment adviser or reductions from brokerage service arrangements or reductions from other expense offset arrangements and do not represent the amount paid by the class during periods when reimbursements or reductions occur. Expenses net of fee waivers reflect expenses after reimbursement by the investment adviser but prior to reductions from brokerage service arrangements or other expense offset arrangements. Expenses net of all reductions represent the net expenses paid by the class. H Amount represents less than $.01 per share. I Total distributions of $1.51 per share is comprised of distributions from net investment income of $0.011 and distributions from net realized gain of $1.494 per share. |
Financial Highlights - Investor Class
Years ended December 31, | 2009 | 2008 | 2007 | 2006 | 2005 I |
Selected Per-Share Data | | | | | |
Net asset value, beginning of period | $ 4.50 | $ 10.97 | $ 10.34 | $ 10.33 | $ 9.71 |
Income from Investment Operations | | | | | |
Net investment income (loss) E | - H,K | .01 | (.06) | (.06) | (.02) |
Net realized and unrealized gain (loss) | 4.30 | (4.99) | 1.50 | .89 | .64 |
Total from investment operations | 4.30 | (4.98) | 1.44 | .83 | .62 |
Distributions from net investment income | (.01) | (.01) | - | - | - |
Distributions from net realized gain | - | (1.49) | (.82) | (.83) | - |
Total distributions | (.01) | (1.49) L | (.82) | (.83) | - |
Redemption fees added to paid in capital E | - K | - K | .01 | .01 | - K |
Net asset value, end of period | $ 8.79 | $ 4.50 | $ 10.97 | $ 10.34 | $ 10.33 |
Total Return B,C,D | 95.49% | (50.74)% | 15.15% | 8.10% | 6.39% |
Ratios to Average Net Assets F,J | | | | | |
Expenses before reductions | .88% | .90% | .93% | .93% | .97% A |
Expenses net of fee waivers, if any | .88% | .90% | .93% | .93% | .97% A |
Expenses net of all reductions | .85% | .89% | .91% | .90% | .80% A |
Net investment income (loss) | .03% H | .10% | (.56)% | (.56)% | (.45)% A |
Supplemental Data | | | | | |
Net assets, end of period (000 omitted) | $ 63,980 | $ 12,903 | $ 34,367 | $ 15,939 | $ 5,809 |
Portfolio turnover rate G | 130% | 237% | 213% | 269% | 249% |
A Annualized B Total returns for periods of less than one year are not annualized. C Total returns do not reflect charges attributable to your insurance company's separate account. Inclusion of these charges would reduce the total returns shown. D Total returns would have been lower had certain expenses not been reduced during the periods shown. E Calculated based on average shares outstanding during the period. F Fees and expenses of the underlying Fidelity Central Funds are not included in the Fund's expense ratio. The Fund indirectly bears its proportionate share of the expenses of any underlying Fidelity Central Funds. G Amount does not include the portfolio activity of any underlying Fidelity Central Funds. H Investment income per share reflects a special dividend which amounted to $.01 per share. Excluding the special dividend, the ratio of net investment income (loss) to average net assets would have been (.17)%. I For the period July 21, 2005 (commencement of sale of shares) to December 31, 2005. J Expense ratios reflect operating expenses of the class. Expenses before reductions do not reflect amounts reimbursed by the investment adviser or reductions from brokerage service arrangements or reductions from other expense offset arrangements and do not represent the amount paid by the class during periods when reimbursements or reductions occur. Expense ratios before reductions for start-up periods may not be representative of longer-term operating periods. Expenses net of fee waivers reflect expenses after reimbursement by the investment adviser but prior to reductions from brokerage service arrangements or other expense offset arrangements. Expenses net of all reductions represent the net expenses paid by the class. K Amount represents less than $.01 per share. L Total distributions of $1.49 per share is comprised of distributions from net investment income of $0.005 and distributions from net realized gain of $1.485 per share. |
See accompanying notes which are an integral part of the financial statements.
Annual Report
Notes to Financial Statements
For the period ended December 31, 2009
1. Organization.
VIP Technology Portfolio (the Fund) is a non-diversified fund of Variable Insurance Products Fund IV (the trust) and is authorized to issue an unlimited number of shares. The trust is registered under the Investment Company Act of 1940, as amended (the 1940 Act), as an open-end management investment company organized as a Massachusetts business trust. Shares of the Fund may only be purchased by insurance companies for the purpose of funding variable annuity or variable life insurance contracts. The Fund offers the following classes of shares: Initial Class shares and Investor Class shares. All classes have equal rights and voting privileges, except for matters affecting a single class. Investment income, realized and unrealized capital gains and losses, the common expenses of the Fund, and certain fund-level expense reductions, if any, are allocated on a pro-rata basis to each class based on the relative net assets of each class to the total net assets of the Fund. Each class differs with respect to transfer agent fees incurred. Certain expense reductions also differ by class. The Fund's investments in emerging markets can be subject to social, economic, regulatory, and political uncertainties and can be extremely volatile.
2. Investments in Fidelity Central Funds.
The Fund may invest in Fidelity Central Funds, which are open-end investment companies available only to other investment companies and accounts managed by Fidelity Management & Research Company (FMR) and its affiliates. The Fund's Schedule of Investments lists each of the Fidelity Central Funds held as of period end, if any, as an investment of the Fund, but does not include the underlying holdings of each Fidelity Central Fund. As an Investing Fund, the Fund indirectly bears its proportionate share of the expenses of the underlying Fidelity Central Funds.
The Money Market Central Funds seek preservation of capital and current income and are managed by Fidelity Investments Money Management, Inc. (FIMM), an affiliate of FMR.
A complete unaudited list of holdings for each Fidelity Central Fund is available upon request or at the Securities and Exchange Commission (the SEC) web site at www.sec.gov. In addition, the financial statements of the Fidelity Central Funds, which are not covered by the Fund's Report of Independent Registered Public Accounting Firm, are available on the SEC web site or upon request.
3. Significant Accounting Policies.
The financial statements have been prepared in conformity with accounting principles generally accepted in the United States of America, which require management to make certain estimates and assumptions at the date of the financial statements. Actual results could differ from those estimates. Events or transactions occurring after period end through the date that the financial statements were issued, February 12, 2010, have been evaluated in the preparation of the financial statements. The following summarizes the significant accounting policies of the Fund:
Security Valuation. Investments are valued as of 4:00 p.m. Eastern time on the last calendar day of the period. The Fund uses independent pricing services approved by the Board of Trustees to value its investments. When current market prices or quotations are not readily available or reliable, valuations may be determined in good faith in accordance with procedures adopted by the Board of Trustees. Factors used in determining value may include significant market or security specific events, changes in interest rates and credit quality. The frequency with which these procedures are used cannot be predicted and may be utilized to a significant extent. The value used for net asset value (NAV) calculation under these procedures may differ from published prices for the same securities.
The Fund categorizes the inputs to valuation techniques used to value its investments into a disclosure hierarchy consisting of three levels as shown below.
Level 1 - quoted prices in active markets for identical investments
Level 2 - other significant observable inputs (including quoted prices for similar investments, interest rates, prepayment speeds, etc.)
Level 3 - unobservable inputs (including the fund's own assumptions based on the best information available)
Changes in valuation techniques may result in transfers in or out of an assigned level within the disclosure hierarchy. The aggregate value of investments by input level, as of December 31, 2009 is included at the end of the Fund's Schedule of Investments. Valuation techniques used to value the Fund's investments by major category are as follows.
Equity securities, including restricted securities, for which market quotations are readily available, are valued at the last reported sale price or official closing price as reported by an independent pricing service on the primary market or exchange on which they are traded and are categorized as level 1 in the hierarchy. In the event there were no sales during the day or closing prices are not available, securities are valued at the last quoted bid price or may be valued using the last available price and categorized as Level 2 in the hierarchy. For foreign equity securities, when significant market or security events arise, comparisons to the valuation of American Depository Receipts (ADRs), futures contracts, exchange-traded funds (ETFs) and certain indexes as well as quoted prices for similar securities are used and are categorized as Level 2 in the hierarchy in these circumstances. For
Annual Report
3. Significant Accounting Policies - continued
Security Valuation - continued
restricted securities and private placements where observable inputs are limited, assumptions about market activity and risk are used and are categorized as level 3 in the hierarchy.
Debt securities, including restricted securities, are valued based on evaluated quotations received from independent pricing services or from dealers who make markets in such securities. For corporate bonds, pricing services utilize matrix pricing which considers yield or price of bonds of comparable quality, coupon, maturity and type as well as dealer supplied prices and are generally categorized as Level 2 in the hierarchy.
Investments in open-end mutual funds, including the Fidelity Money Market Central Funds, are valued at their closing net asset value each business day and are categorized as Level 1 in the hierarchy. Short-term securities with remaining maturities of sixty days or less for which quotations are not readily available are valued at amortized cost, which approximates value and are categorized as level 2 in the hierarchy.
When independent prices are unavailable or unreliable, debt securities may be valued utilizing pricing matrices which consider similar factors that would be used by independent pricing services. These are generally categorized as Level 2 in the hierarchy but may be Level 3 depending on the circumstances.
Foreign Currency. The Fund uses foreign currency contracts to facilitate transactions in foreign-denominated securities. Losses from these transactions may arise from changes in the value of the foreign currency or if the counterparties do not perform under the contracts' terms.
Foreign-denominated assets, including investment securities, and liabilities are translated into U.S. dollars at the exchange rate at period end. Purchases and sales of investment securities, income and dividends received and expenses denominated in foreign currencies are translated into U.S. dollars at the exchange rate in effect on the transaction date.
The effects of exchange rate fluctuations on investments are included with the net realized and unrealized gain (loss) on investment securities. Other foreign currency transactions resulting in realized and unrealized gain (loss) are disclosed separately.
Investment Transactions and Income. For financial reporting purposes, the Fund's investment holdings and NAV include trades executed through the end of the last business day of the period. The NAV per share for processing shareholder transactions is calculated as of the close of business of the New York Stock Exchange (NYSE), normally 4:00 p.m. Eastern time and includes trades executed through the end of the prior business day. Gains and losses on securities sold are determined on the basis of identified cost and may include proceeds received from litigation. Dividend income is recorded on the ex-dividend date, except for certain dividends from foreign securities where the ex-dividend date may have passed, which are recorded as soon as the Fund is informed of the ex-dividend date. Non-cash dividends included in dividend income, if any, are recorded at the fair market value of the securities received. Distributions received on securities that represent a return of capital or capital gain are recorded as a reduction of cost of investments and/or as a realized gain. The Fund estimates the components of distributions received that may be considered return of capital distributions or capital gain distributions. Interest income and distributions from the Fidelity Central Funds are accrued as earned. Large, non-recurring dividends recognized by the Fund are presented separately on the Statement of Operations as "Special Dividends" and the impact of these dividends is presented in the Financial Highlights. Interest income includes coupon interest and amortization of premium and accretion of discount on debt securities. Investment income is recorded net of foreign taxes withheld where recovery of such taxes is uncertain.
Expenses. Most expenses of the trust can be directly attributed to a fund. Expenses which cannot be directly attributed are apportioned among each Fund in the trust. Expense estimates are accrued in the period to which they relate and adjustments are made when actual amounts are known.
Income Tax Information and Distributions to Shareholders. Each year, the Fund intends to qualify as a regulated investment company by distributing substantially all of its taxable income and realized gains under Subchapter M of the Internal Revenue Code and filing its U.S. federal tax return. As a result, no provision for income taxes is required. As of December 31, 2009, the Fund did not have any unrecognized tax benefits in the accompanying financial statements. A Fund's federal tax return is subject to examination by the Internal Revenue Service (IRS) for a period of three years. Foreign taxes are provided for based on the Fund's understanding of the tax rules and rates that exist in the foreign markets in which it invests.
Distributions are recorded on the ex-dividend date. Income dividends and capital gain distributions are declared separately for each class. Income and capital gain distributions are determined in accordance with income tax regulations, which may differ from generally accepted accounting principles.
Capital accounts within the financial statements are adjusted for permanent book-tax differences. These adjustments have no impact on net assets or the results of operations. Temporary book-tax differences will reverse in a subsequent period.
Book-tax differences are primarily due to the short-term gain distributions from the Fidelity Central Funds, foreign currency transactions, market discount, capital loss carryforwards and losses deferred due to wash sales and excise tax regulations.
Annual Report
Notes to Financial Statements - continued
3. Significant Accounting Policies - continued
Income Tax Information and Distributions to Shareholders - continued
The federal tax cost of investment securities and unrealized appreciation (depreciation) as of period end were as follows:
Gross unrealized appreciation | $ 34,723,236 |
Gross unrealized depreciation | (3,261,271) |
Net unrealized appreciation (depreciation) | $ 31,461,965 |
| |
Tax Cost | $ 122,265,753 |
The tax-based components of distributable earnings as of period end were as follows:
Capital loss carryforward | $ (17,998,325) |
Net unrealized appreciation (depreciation) | $ 31,461,966 |
The tax character of distributions paid was as follows:
| December 31, 2009 | December 31, 2008 |
Ordinary Income | $ 143,352 | $ 6,751,533 |
Long-term Capital Gains | - | 5,748,047 |
Total | $ 143,352 | $ 12,499,580 |
Trading (Redemption) Fees. Shares held less than 60 days are subject to a redemption fee equal to 1% of the proceeds of the redeemed shares. All redemption fees, including any estimated redemption fees paid by FMR, are retained by the Fund and accounted for as an addition to paid in capital.
4. Operating Policies.
Restricted Securities. The Fund may invest in securities that are subject to legal or contractual restrictions on resale. These securities generally may be resold in transactions exempt from registration or to the public if the securities are registered. Disposal of these securities may involve time-consuming negotiations and expense, and prompt sale at an acceptable price may be difficult. Information regarding restricted securities is included at the end of the Fund's Schedule of Investments.
5. Purchases and Sales of Investments.
Purchases and sales of securities, other than short-term securities, aggregated $161,533,546 and $109,959,619, respectively.
6. Fees and Other Transactions with Affiliates.
Management Fee. FMR and its affiliates provide the Fund with investment management related services for which the Fund pays a monthly management fee. The management fee is the sum of an individual fund fee rate that is based on an annual rate of .30% of the Fund's average net assets and a group fee rate that averaged .26% during the period. The group fee rate is based upon the average net assets of all the mutual funds advised by FMR. The group fee rate decreases as assets under management increase and increases as assets under management decrease. For the period, the total annual management fee rate was .56% of the Fund's average net assets.
Transfer Agent Fees. Fidelity Investments Institutional Operations Company, Inc. (FIIOC), an affiliate of FMR, is the Fund's transfer, dividend disbursing, and shareholder servicing agent. FIIOC receives an asset-based fee with respect to each class. Each class (with the exception of Investor Class) pays a transfer agent fee, excluding out of pocket expenses, equal to an annual rate of .07% of average net assets. Investor Class pays a monthly asset-based transfer agent fee of .15% of average net assets. The total transfer agent fees paid by each class to FIIOC, including out of pocket expenses, were as follows:
Initial Class | $ 44,277 |
Investor Class | 58,055 |
| $ 102,332 |
Accounting and Security Lending Fees. Fidelity Service Company, Inc. (FSC), an affiliate of FMR, maintains the Fund's accounting records. The accounting fee is based on the level of average net assets for the month. Under a separate contract, FSC administers the security lending program. The security lending fee is based on the number and duration of lending transactions.
Annual Report
6. Fees and Other Transactions with Affiliates - continued
Brokerage Commissions. The Fund placed a portion of its portfolio transactions with brokerage firms which are affiliates of the investment adviser. The commissions paid to these affiliated firms were $3,423 for the period.
7. Committed Line of Credit.
The Fund participates with other funds managed by FMR in a $3.5 billion credit facility (the "line of credit") to be utilized for temporary or emergency purposes to fund shareholder redemptions or for other short-term liquidity purposes. The Fund has agreed to pay commitment fees on its pro-rata portion of the line of credit, which amounted to $316 and is reflected in Miscellaneous Expense on the Statement of Operations. During the period, there were no borrowings on this line of credit.
8. Security Lending.
The Fund lends portfolio securities from time to time in order to earn additional income. On the settlement date of the loan, the Fund receives collateral (in the form of U.S. Treasury obligations, letters of credit and/or cash) against the loaned securities and maintains collateral in an amount not less than 100% of the market value of the loaned securities during the period of the loan. The market value of the loaned securities is determined at the close of business of the Fund and any additional required collateral is delivered to the Fund on the next business day. If the borrower defaults on its obligation to return the securities loaned because of insolvency or other reasons, a fund could experience delays and costs in recovering the securities loaned or in gaining access to the collateral. Any cash collateral received is invested in the Fidelity Securities Lending Cash Central Fund. The value of loaned securities and cash collateral at period end are disclosed on the Fund's Statement of Assets and Liabilities. Security lending income represents the income earned on investing cash collateral, less fees and expenses associated with the loan, plus any premium payments that may be received on the loan of certain types of securities. Security lending income is presented in the Statement of Operations as a component of income from Fidelity Central Funds.
9. Expense Reductions.
Many of the brokers with whom FMR places trades on behalf of the Fund provided services to the Fund in addition to trade execution. These services included payments of certain expenses on behalf of the Fund totaling $19,261 for the period.
10. Distributions to Shareholders.
Distributions to shareholders of each class were as follows:
Years ended December 31, | 2009 | 2008 |
From net investment income | | |
Initial Class | $ 95,944 | $ 62,217 |
Investor Class | 47,408 | 15,654 |
Total | $ 143,352 | $ 77,871 |
From net realized gain | | |
Initial Class | $ - | $ 8,440,333 |
Investor Class | - | 3,981,376 |
Total | $ - | $ 12,421,709 |
Annual Report
Notes to Financial Statements - continued
11. Share Transactions.
Transactions for each class of shares were as follows:
| Shares | Dollars |
Years ended December 31, | 2009 | 2008 | 2009 | 2008 |
Initial Class | | | | |
Shares sold | 5,685,392 | 1,178,491 | $ 36,339,585 | $ 8,240,629 |
Reinvestment of distributions | 11,274 | 1,143,754 | 95,944 | 8,502,550 |
Shares redeemed | (1,334,192) | (3,119,510) | (8,872,724) | (22,814,157) |
Net increase (decrease) | 4,362,474 | (797,265) | $ 27,562,805 | $ (6,070,978) |
Investor Class | | | | |
Shares sold | 5,536,402 | 1,576,768 | $ 38,178,193 | $ 12,608,557 |
Reinvestment of distributions | 5,591 | 538,625 | 47,408 | 3,997,030 |
Shares redeemed | (1,135,168) | (2,379,042) | (7,656,202) | (16,521,194) |
Net increase (decrease) | 4,406,825 | (263,649) | $ 30,569,399 | $ 84,393 |
12. Other.
The Fund's organizational documents provide former and current trustees and officers with a limited indemnification against liabilities arising in connection with the performance of their duties to the Fund. In the normal course of business, the Fund may also enter into contracts that provide general indemnifications. The Fund's maximum exposure under these arrangements is unknown as this would be dependent on future claims that may be made against the Fund. The risk of material loss from such claims is considered remote.
At the end of the period, FMR or its affiliates were the owners of record of 100% of the total outstanding shares of the Fund.
Annual Report
Report of Independent Registered Public Accounting Firm
To the Trustees of Variable Insurance Products Fund IV and the Shareholders of VIP Technology Portfolio:
In our opinion, the accompanying statement of assets and liabilities, including the schedule of investments, and the related statements of operations and of changes in net assets and the financial highlights present fairly, in all material respects, the financial position of VIP Technology Portfolio (a fund of Variable Insurance Products Fund IV) at December 31, 2009, the results of its operations for the year then ended, the changes in its net assets for each of the two years in the period then ended and the financial highlights for each of the periods indicated, in conformity with accounting principles generally accepted in the United States of America. These financial statements and financial highlights (hereafter referred to as "financial statements") are the responsibility of the VIP Technology Portfolio's management. Our responsibility is to express an opinion on these financial statements based on our audits. We conducted our audits of these financial statements in accordance with the standards of the Public Company Accounting Oversight Board (United States). Those standards require that we plan and perform the audit to obtain reasonable assurance about whether the financial statements are free of material misstatement. An audit includes examining, on a test basis, evidence supporting the amounts and disclosures in the financial statements, assessing the accounting principles used and significant estimates made by management, and evaluating the overall financial statement presentation. We believe that our audits, which included confirmation of securities at December 31, 2009 by correspondence with the custodian and brokers, provide a reasonable basis for our opinion.
/s/ PricewaterhouseCoopers LLP
PricewaterhouseCoopers LLP
Boston, Massachusetts
February 12, 2010
Annual Report
The Trustees, Member of the Advisory Board, and executive officers of the trust and fund, as applicable, are listed below. The Board of Trustees governs the fund and is responsible for protecting the interests of shareholders. The Trustees are experienced executives who meet periodically throughout the year to oversee the fund's activities, review contractual arrangements with companies that provide services to the fund, and review the fund's performance. Except for James C. Curvey, each of the Trustees oversees 222 funds advised by FMR or an affiliate. Mr. Curvey oversees 410 funds advised by FMR or an affiliate.
The Trustees hold office without limit in time except that (a) any Trustee may resign; (b) any Trustee may be removed by written instrument, signed by at least two-thirds of the number of Trustees prior to such removal; (c) any Trustee who requests to be retired or who has become incapacitated by illness or injury may be retired by written instrument signed by a majority of the other Trustees; and (d) any Trustee may be removed at any special meeting of shareholders by a two-thirds vote of the outstanding voting securities of the trust. Each Trustee who is not an interested person (as defined in the 1940 Act) (Independent Trustee), shall retire not later than the last day of the calendar year in which his or her 72nd birthday occurs. The Independent Trustees may waive this mandatory retirement age policy with respect to individual Trustees. The executive officers and Advisory Board Member hold office without limit in time, except that any officer and Advisory Board Member may resign or may be removed by a vote of a majority of the Trustees at any regular meeting or any special meeting of the Trustees. Except as indicated, each individual has held the office shown or other offices in the same company for the past five years.
The fund's Statement of Additional Information (SAI) includes more information about the Trustees. To request a free copy, call Fidelity at 1-800-544-8544.
Interested Trustees*:
Correspondence intended for each Trustee who is an interested person may be sent to Fidelity Investments, 82 Devonshire Street, Boston, Massachusetts 02109.
Name, Age; Principal Occupation |
Edward C. Johnson 3d (79) |
| Year of Election or Appointment: 1983 Mr. Johnson is Trustee and Chairman of the Board of Trustees of certain Trusts. Mr. Johnson serves as Chief Executive Officer, Chairman, and a Director of FMR LLC; Chairman and a Director of FMR; Chairman and a Director of Fidelity Research & Analysis Company (FRAC); Chairman and a Director of Fidelity Investments Money Management, Inc.; and Chairman and a Director of FMR Co., Inc. In addition, Mr. Johnson serves as Chairman and Director of FIL Limited. Previously, Mr. Johnson served as President of FMR LLC (2006-2007). |
James C. Curvey (74) |
| Year of Election or Appointment: 2007 Mr. Curvey also serves as Trustee (2007-present) of other investment companies advised by FMR. Mr. Curvey is a Director of FMR and FMR Co., Inc. (2007-present). Mr. Curvey is also Vice Chairman (2006-present) and Director of FMR LLC. In addition, Mr. Curvey serves as an Overseer for the Boston Symphony Orchestra and a member of the Trustees of Villanova University. |
* Trustees have been determined to be "Interested Trustees" by virtue of, among other things, their affiliation with the trust or various entities under common control with FMR.
Independent Trustees:
Correspondence intended for each Independent Trustee (that is, the Trustees other than the Interested Trustees) may be sent to Fidelity Investments, P.O. Box 55235, Boston, Massachusetts 02205-5235.
Name, Age; Principal Occupation |
Dennis J. Dirks (61) |
| Year of Election or Appointment: 2005 Prior to his retirement in May 2003, Mr. Dirks was Chief Operating Officer and a member of the Board of The Depository Trust & Clearing Corporation (DTCC). He also served as President, Chief Operating Officer, and Board member of The Depository Trust Company (DTC) and President and Board member of the National Securities Clearing Corporation (NSCC). In addition, Mr. Dirks served as Chief Executive Officer and Board member of the Government Securities Clearing Corporation, Chief Executive Officer and Board member of the Mortgage-Backed Securities Clearing Corporation, as a Trustee and a member of the Finance Committee of Manhattan College (2005-2008), and as a Trustee and a member of the Finance Committee of AHRC of Nassau County (2006-2008). Currently, Mr. Dirks serves as a member of the Board of Directors for The Brookville Center for Children's Services, Inc. (2009-present). |
Alan J. Lacy (56) |
| Year of Election or Appointment: 2008 Mr. Lacy serves as Senior Adviser (2007-present) of Oak Hill Capital Partners, L.P. (private equity). Mr. Lacy also served as Chief Executive Officer (2000-2005) and Vice Chairman (2005-2006) of Sears Holdings Corporation and Sears, Roebuck and Co. (retail). In addition, Mr. Lacy serves as a member of the Board of Directors of The Western Union Company (global money transfer, 2006-present) and Bristol-Myers Squibb Company (global pharmaceuticals, 2007-present). Mr. Lacy is Chairman (2008-present) and a member (2006-present) of the Board of Trustees of The National Parks Conservation Association. |
Ned C. Lautenbach (65) |
| Year of Election or Appointment: 2000 Mr. Lautenbach is Chairman of the Independent Trustees of the Equity and High Income Funds (2006-present). Mr. Lautenbach is an Advisory Partner of Clayton, Dubilier & Rice, Inc. (private equity investment). Previously, Mr. Lautenbach was with the International Business Machines Corporation (IBM) from 1968 until his retirement in 1998. Mr. Lautenbach serves as a Director of Eaton Corporation (diversified industrial) as well as the Philharmonic Center for the Arts in Naples, Florida. Mr. Lautenbach is also a member of the Board of Trustees of Fairfield University (2005-present), as well as a member of the Council on Foreign Relations. Previously, Mr. Lautenbach served as a Director of Sony Corporation (2006-2007). |
Joseph Mauriello (65) |
| Year of Election or Appointment: 2008 Prior to his retirement in January 2006, Mr. Mauriello served in numerous senior management positions including Deputy Chairman and Chief Operating Officer (2004-2005), and Vice Chairman of Financial Services (2002-2004) of KPMG LLP US (professional services, 1965-2005). Mr. Mauriello currently serves as a member of the Board of Directors of XL Capital Ltd. (global insurance and re-insurance, 2006-present) and of Arcadia Resources Inc. (health care services and products, 2007-present). Previously, Mr. Mauriello served as a Director of the Hamilton Funds of the Bank of New York (2006-2007). |
Cornelia M. Small (65) |
| Year of Election or Appointment: 2005 Ms. Small is a member of the Board of Directors of the Teagle Foundation (2009-present). Ms. Small is also a member of the Investment Committee, and Chair (2008-present) and a member of the Board of Trustees of Smith College. In addition, Ms. Small serves on the Investment Committee of the Berkshire Taconic Community Foundation (2008-present). Previously, Ms. Small served as Chairperson of the Investment Committee (2002-2008) of Smith College. In addition, Ms. Small served as Chief Investment Officer, Director of Global Equity Investments, and a member of the Board of Directors of Scudder, Stevens & Clark and Scudder Kemper Investments. |
William S. Stavropoulos (70) |
| Year of Election or Appointment: 2001 Mr. Stavropoulos serves as President and Founder of the Michigan Baseball Foundation, the Great Lakes Loons (2007-present). Mr. Stavropoulos is Chairman Emeritus of the Board of Directors of The Dow Chemical Company, where he previously served in numerous senior management positions, including President, CEO (1995-2000; 2002-2004), Chairman of the Executive Committee (2000-2006), and as a member of the Board of Directors (1990-2006). Currently, Mr. Stavropoulos is a Director of Teradata Corporation (data warehousing and technology solutions, 2008-present), Chemical Financial Corporation, Maersk Inc. (industrial conglomerate), Tyco International, Inc. (multinational manufacturing and services, 2007-present), and a member of the Advisory Board for Metalmark Capital (private equity investment, 2005-present). Mr. Stavropoulos is a special advisor to Clayton, Dubilier & Rice, Inc. (private equity investment). In addition, Mr. Stavropoulos is a member of the University of Notre Dame Advisory Council for the College of Science. |
David M. Thomas (60) |
| Year of Election or Appointment: 2008 Previously, Mr. Thomas served as Executive Chairman (2005-2006) and Chairman and Chief Executive Officer (2000-2005) of IMS Health, Inc. (pharmaceutical and healthcare information solutions). In addition, Mr. Thomas serves as a member of the Board of Directors of Fortune Brands, Inc. (consumer products), and Interpublic Group of Companies, Inc. (marketing communication, 2004-present). |
Michael E. Wiley (59) |
| Year of Election or Appointment: 2008 Mr. Wiley also serves as a Director of Asia Pacific Exploration Consolidated (international oil and gas exploration and production, 2008-present), and as a member of the Board of Trustees of the University of Tulsa (2000-2006; 2007-present). Mr. Wiley serves as a Director of Tesoro Corporation (independent oil refiner and marketer, 2005-present), and a Director of Bill Barrett Corporation (exploration and production, 2005-present). In addition, Mr. Wiley also serves as a Director of Post Oak Bank (privately-held bank, 2004-present). Previously, Mr. Wiley served as a Sr. Energy Advisor of Katzenbach Partners, LLC (consulting, 2006-2007), as an Advisory Director of Riverstone Holdings (private investment), Chairman, President, and CEO of Baker Hughes, Inc. (oilfield services, 2000-2004), and as Director of Spinnaker Exploration Company (exploration and production, 2001-2005). |
Annual Report
Advisory Board Member and Executive Officers:
Correspondence intended for each executive officer and Peter S. Lynch may be sent to Fidelity Investments, 82 Devonshire Street, Boston, Massachusetts 02109.
Name, Age; Principal Occupation |
Peter S. Lynch (65) |
| Year of Election or Appointment: 2003 Member of the Advisory Board of Fidelity's Equity and High Income Funds. Mr. Lynch is Vice Chairman and a Director of FMR and FMR Co., Inc. In addition, Mr. Lynch serves as a Trustee of Boston College and as the Chairman of the Inner-City Scholarship Fund. Previously, Mr. Lynch served on the Special Olympics International Board of Directors (1997-2006). |
Kenneth B. Robins (40) |
| Year of Election or Appointment: 2008 President and Treasurer of Fidelity's Equity and High Income Funds. Mr. Robins also serves as Assistant Treasurer of other Fidelity funds (2009-present) and is an employee of Fidelity Investments (2004-present). Before joining Fidelity Investments, Mr. Robins worked at KPMG LLP, where he was a partner in KPMG's department of professional practice (2002-2004). |
Bruce T. Herring (44) |
| Year of Election or Appointment: 2006 Vice President of certain Equity Funds. Mr. Herring also serves as Group Chief Investments Officer of FMR. Previously, Mr. Herring served as a portfolio manager for Fidelity U.S. Equity Funds. |
Brian B. Hogan (45) |
| Year of Election or Appointment: 2009 Vice President of certain Equity Funds and Vice President of Sector Funds. Mr. Hogan also serves as Senior Vice President, Equity Research of FMR (2006-present) and President of FMR's Equity Division (2009-present). Previously, Mr. Hogan served as a portfolio manager. |
Christopher S. Bartel (38) |
| Year of Election or Appointment: 2009 Vice President of Fidelity's Sector and Real Estate Equity Funds. Mr. Bartel also serves as Senior Vice President of Equity Research (2009-present). Previously, Mr. Bartel served as Managing Director of Research (2006-2009) and an analyst and portfolio manager (2000-2006). |
Scott C. Goebel (41) |
| Year of Election or Appointment: 2008 Secretary and Chief Legal Officer (CLO) of the Fidelity funds. Mr. Goebel also serves as General Counsel, Secretary, and Senior Vice President of FMR (2008-present) and FMR Co., Inc. (2008-present); Deputy General Counsel of FMR LLC; Chief Legal Officer of Fidelity Management & Research (Hong Kong) Limited (2008-present) and Assistant Secretary of Fidelity Management & Research (Japan) Inc. (2008-present), Fidelity Investments Money Management, Inc. (2008-present), Fidelity Management & Research (U.K.) Inc. (2008-present), and Fidelity Research and Analysis Company (2008-present). Previously, Mr. Goebel served as Assistant Secretary of the Funds (2007-2008) and as Vice President and Secretary of Fidelity Distributors Corporation (FDC) (2005-2007). |
William C. Coffey (40) |
| Year of Election or Appointment: 2009 Assistant Secretary of Fidelity's Equity and High Income Funds. Mr. Coffey also serves as Vice President and Associate General Counsel of FMR LLC (2005-present), and is an employee of Fidelity Investments. |
Holly C. Laurent (55) |
| Year of Election or Appointment: 2008 Anti-Money Laundering (AML) Officer of the Fidelity funds. Ms. Laurent is an employee of Fidelity Investments. Previously, Ms. Laurent was Senior Vice President and Head of Legal for Fidelity Business Services India Pvt. Ltd. (2006-2008), and Senior Vice President, Deputy General Counsel and Group Head for FMR LLC (2005-2006). |
Christine Reynolds (51) |
| Year of Election or Appointment: 2008 Chief Financial Officer of the Fidelity funds. Ms. Reynolds became President of Fidelity Pricing and Cash Management Services (FPCMS) in August 2008. Ms. Reynolds served as Chief Operating Officer of FPCMS (2007-2008). Previously, Ms. Reynolds served as President, Treasurer, and Anti-Money Laundering officer of the Fidelity funds (2004-2007). |
Kenneth A. Rathgeber (62) |
| Year of Election or Appointment: 2004 Chief Compliance Officer of Fidelity's Equity and High Income Funds. Mr. Rathgeber is Chief Compliance Officer of Fidelity Management & Research (Hong Kong) Limited (2008-present), Fidelity Management & Research (Japan) Inc. (2008-present), FMR (2005-present), FMR Co., Inc. (2005-present), Fidelity Management & Research (U.K.) Inc. (2005-present), Fidelity Research & Analysis Company (2005-present), Fidelity Investments Money Management, Inc. (2005-present), Pyramis Global Advisors, LLC (2005-present), and Strategic Advisers, Inc. (2005-present). |
Jeffrey S. Christian (48) |
| Year of Election or Appointment: 2009 Deputy Treasurer of the Fidelity funds. Mr. Christian is an employee of Fidelity Investments. Previously, Mr. Christian served as Chief Financial Officer (2008-2009) of certain Fidelity funds, Senior Vice President of Fidelity Pricing and Cash Management Services (FPCMS) (2004-2009), and as Vice President of Business Analysis (2003-2004). |
Bryan A. Mehrmann (48) |
| Year of Election or Appointment: 2005 Deputy Treasurer of the Fidelity funds. Mr. Mehrmann is an employee of Fidelity Investments. Previously, Mr. Mehrmann served as Vice President of Fidelity Investments Institutional Services Group (FIIS)/Fidelity Investments Institutional Operations Company, Inc. (FIIOC) Client Services (1998-2004). |
Adrien E. Deberghes (42) |
| Year of Election or Appointment: 2008 Deputy Treasurer of Fidelity's Equity and High Income Funds. Mr. Deberghes is an employee of Fidelity Investments (2008-present). Previously, Mr. Deberghes served as Senior Vice President of Mutual Fund Administration at State Street Corporation (2007-2008), Senior Director of Mutual Fund Administration at Investors Bank & Trust (2005-2007), and Director of Finance for Dunkin' Brands (2000-2005). |
John R. Hebble (51) |
| Year of Election or Appointment: 2009 Assistant Treasurer of Fidelity's Equity and High Income Funds. Mr. Hebble also serves as President and Treasurer of other Fidelity funds (2008-present) and is an employee of Fidelity Investments. |
Paul M. Murphy (62) |
| Year of Election or Appointment: 2007 Assistant Treasurer of the Fidelity funds. Mr. Murphy is an employee of Fidelity Investments. Previously, Mr. Murphy served as Chief Financial Officer of the Fidelity funds (2005-2006), Vice President and Associate General Counsel of FMR (2007), and Senior Vice President of Fidelity Pricing and Cash Management Services (FPCMS) (1994-2007). |
Gary W. Ryan (51) |
| Year of Election or Appointment: 2005 Assistant Treasurer of the Fidelity funds. Mr. Ryan is an employee of Fidelity Investments. Previously, Mr. Ryan served as Vice President of Fund Reporting in Fidelity Pricing and Cash Management Services (FPCMS) (1999-2005). |
Annual Report
Initial Class and Investor Class designate 100% of the dividends distributed in December 2009 as qualifying for the dividends-received deduction for corporate shareholders.
The fund will notify shareholders in January 2010 of amounts for use in preparing 2009 income tax returns.
Annual Report
Board Approval of Investment Advisory Contracts and Management Fees
VIP Technology Portfolio
Each year, the Board of Trustees, including the Independent Trustees (together, the Board), votes on the renewal of the management contract and sub-advisory agreements (together, the Advisory Contracts) for the fund. The Board, assisted by the advice of fund counsel and Independent Trustees' counsel, requests and considers a broad range of information throughout the year.
The Board meets regularly and, acting directly and through its separate committees, requests and receives information concerning, and considers at each of its meetings factors that are relevant to, its annual consideration of the renewal of the fund's Advisory Contracts, including the services and support provided to the fund and its shareholders. The Board has established various standing committees, each composed of Independent Trustees with varying backgrounds, to which the Board has assigned specific subject matter responsibilities in order to enhance effective decision-making by the Board. Each committee has a written charter outlining the structure and purposes of the committee. The Board also meets as needed to consider matters specifically related to the Board's annual consideration of the renewal of Advisory Contracts.
At its July 2009 meeting, the Board of Trustees, including the Independent Trustees, unanimously determined to renew the fund's Advisory Contracts. In reaching its determination, the Board considered all factors it believed relevant, including (i) the nature, extent, and quality of the services to be provided to the fund and its shareholders (including the investment performance of the fund); (ii) the competitiveness of the fund's management fee and total expenses; (iii) the total costs of the services to be provided by and the profits to be realized by Fidelity from its relationship with the fund; (iv) the extent to which economies of scale would be realized as the fund grows; and (v) whether fee levels reflect these economies of scale, if any, for the benefit of fund shareholders.
In considering whether to renew the Advisory Contracts for the fund, the Board ultimately reached a determination, with the assistance of fund counsel and Independent Trustees' counsel and through the exercise of its business judgment, that the renewal of the Advisory Contracts and the compensation to be received by Fidelity under the management contract is consistent with Fidelity's fiduciary duty under applicable law. The Board's decision to renew the Advisory Contracts was not based on any single factor noted above, but rather was based on a comprehensive consideration of all the information provided to the Board at its meetings throughout the year. The Board, in reaching its determination to renew the Advisory Contracts, is aware that shareholders in the fund have a broad range of investment choices available to them, including a wide choice among mutual funds offered by competitors to Fidelity, and that the fund's shareholders, with the opportunity to review and weigh the disclosure provided by the fund in its prospectus and other public disclosures, have chosen to invest in this fund, managed by Fidelity.
Nature, Extent, and Quality of Services Provided. The Board considered staffing within the investment adviser, FMR, and the sub-advisers (together, the Investment Advisers), including the backgrounds of the fund's investment personnel and the fund's investment objective and discipline. The Independent Trustees also had discussions with senior management of Fidelity's investment operations and investment groups. The Board considered the structure of the portfolio manager compensation program and whether this structure provides appropriate incentives.
Resources Dedicated to Investment Management and Support Services. The Board reviewed the size, education, and experience of the Investment Advisers' investment staff, their use of technology, and the Investment Advisers' approach to recruiting, training, and retaining portfolio managers and other research, advisory, and management personnel. In response to last year's financial crisis, FMR took a number of actions intended to cut costs and improve efficiency without weakening the investment teams or resources. The Board noted that Fidelity's analysts have access to a variety of technological tools and market and securities data that enable them to perform both fundamental and quantitative analysis and to specialize in various disciplines. The Board considered Fidelity's extensive global research capabilities that enable the Investment Advisers to aggregate data from various sources in an effort to produce positive investment results. The Board also considered that Fidelity's portfolio managers and analysts have access to daily portfolio attribution that allows for monitoring of a fund's portfolio, as well as an electronic communication system that provides immediate real-time access to research concerning issuers and credit enhancers.
Shareholder and Administrative Services. The Board considered (i) the nature, extent, quality, and cost of advisory, administrative, distribution, and shareholder services performed by the Investment Advisers and their affiliates under the Advisory Contracts and under separate agreements covering transfer agency, pricing and bookkeeping, and securities lending services for the fund; (ii) the nature and extent of the Investment Advisers' supervision of third party service providers, principally custodians and subcustodians; and (iii) the resources devoted to, and the record of compliance with, the fund's compliance policies and procedures. The Board also reviewed the allocation of fund brokerage, including allocations to brokers affiliated with the Investment Advisers, the use of brokerage commissions to pay fund expenses, and the use of "soft" commission dollars to pay for research services.
The Board noted that the growth of fund assets across the complex allows Fidelity to reinvest in the development of services designed to enhance the value or convenience of the Fidelity funds as investment vehicles. These services include 24-hour access to account information and market information through phone representatives and over the Internet, and investor education materials and asset allocation tools.
Investment in a Large Fund Family. The Board considered the benefits to shareholders of investing in a Fidelity fund, including the benefits of investing in a fund that is part of a large family of funds offering a variety of investment disciplines and providing for a large variety of mutual fund investor services. The Board noted that Fidelity has taken a number of actions over the previous year that benefited particular funds, including (i) dedicating additional resources to investment research and to restructure and broaden the focus of the investment research teams; (ii) bolstering the senior management team that oversees asset management; (iii) contractually agreeing to reduce the management fee on Fidelity U.S. Bond Index Fund; and (iv) expanding Class A and Class T load waiver categories to increase rollover retention opportunities and create consistent policies across the classes.
Annual Report
Investment Performance. The Board considered whether the fund has operated within its investment objective, as well as its record of compliance with its investment restrictions. It also reviewed the fund's absolute investment performance for each class, as well as the fund's relative investment performance for each class measured against a third-party-sponsored index that reflects the market sector in which the fund invests over multiple periods. The Board noted that FMR does not believe that a meaningful peer group exists against which to compare the fund's performance. The following charts considered by the Board show, over the one-, three-, and five-year periods ended December 31, 2008, as available, the cumulative total returns of Initial Class and Investor Class of the fund and the cumulative total returns of a third-party-sponsored index ("benchmark").
VIP Technology Portfolio
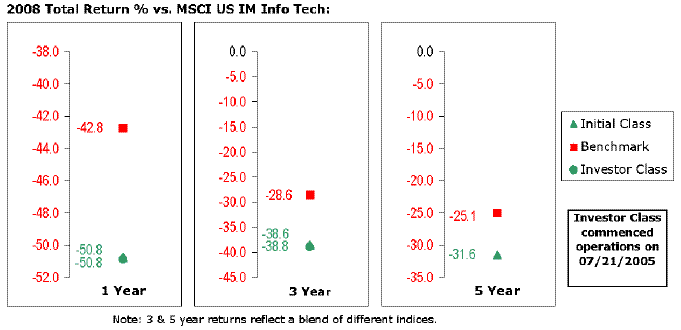
The Board stated that the investment performance of the fund was lower than its benchmark for all the periods shown. The Board discussed with FMR actions that have been taken by FMR to improve the fund's below-benchmark performance. The Board will continue to closely monitor the performance of the fund in the coming year and discuss with FMR other appropriate actions to address the performance of the fund. The Board considered that the variations in performance between the fund's classes reflect the variations in class expenses, which result in lower performance for the higher expense class.
The Board considered that FMR has taken steps to refocus and strengthen equity research, equity portfolio management, and compliance. The Board reviewed the year-to-date performance of Initial Class through May 31, 2009 and stated that it exceeded the fund's benchmark.
Based on its review, and giving particular weight to the nature and quality of the resources dedicated by the Investment Advisers to maintain and improve relative performance and factoring in the unprecedented market events in 2008, the Board concluded that the nature, extent, and quality of the services provided to the fund will benefit the fund's shareholders, particularly in light of the Board's view that the fund's shareholders benefit from investing in a fund that is part of a large family of funds offering a variety of investment disciplines and services.
Competitiveness of Management Fee and Total Fund Expenses. The Board considered the fund's management fee and total expenses compared to "mapped groups" of competitive funds and classes. Fidelity creates "mapped groups" by combining similar Lipper investment objective categories that have comparable management fee characteristics. Combining Lipper investment objective categories aids the Board's management fee and total expense comparisons by broadening the competitive group used for comparison and by reducing the number of universes to which various Fidelity funds are compared.
The Board considered two proprietary management fee comparisons for the 12-month periods shown in the chart below. The group of Lipper funds used by the Board for management fee comparisons is referred to below as the "Total Mapped Group." The Total Mapped Group comparison focuses on a fund's standing relative to the total universe of comparable funds available to investors, in terms of gross management fees before expense reimbursements or caps. "TMG %" represents the percentage of funds in the Total Mapped Group that had management fees that were lower than the fund's. For example, a TMG % of 4% means that 96% of the funds in the Total Mapped Group had higher management fees than the fund. The "Asset-Size Peer Group" (ASPG) comparison focuses on a fund's standing relative to non-Fidelity funds similar in size to the fund within the Total Mapped Group. The ASPG represents at least 15% of the funds in the Total Mapped Group with comparable asset size and management fee characteristics, subject to a minimum of 50 funds (or all funds in the Total Mapped Group if fewer than 50). Additional information, such as the ASPG quartile in which the fund's management fee ranked, is also included in the chart and considered by the Board.
Annual Report
Board Approval of Investment Advisory Contracts and Management Fees - continued
VIP Technology Portfolio
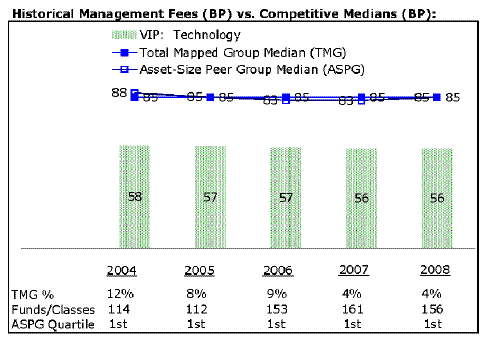
The Board noted that the fund's management fee ranked below the median of its Total Mapped Group and below the median of its ASPG for 2008.
Based on its review, the Board concluded that the fund's management fee was fair and reasonable in light of the services that the fund receives and the other factors considered.
In its review of each class's total expenses, the Board considered the fund's management fee as well as other fund or class expenses, as applicable, such as transfer agent fees, pricing and bookkeeping fees, and custodial, legal, and audit fees. The Board also noted the effects of any waivers and reimbursements on fees and expenses. As part of its review, the Board also considered current and historical total expenses of each class of the fund compared to competitive fund median expenses. Each class of the fund is compared to those funds and classes in the Total Mapped Group (used by the Board for management fee comparisons) that have a similar sales load structure.
The Board noted that the total expenses of each class ranked below its competitive median for 2008.
In its review of total expenses, the Board also considered Fidelity fee structures and other information on clients that FMR and its affiliates service in other competitive markets, such as other mutual funds advised or subadvised by FMR or its affiliates, pension plan clients, and other institutional clients.
Based on its review, the Board concluded that the total expenses of each class of the fund were reasonable in light of the services that the fund and its shareholders receive and the other factors considered.
Costs of the Services and Profitability. The Board considered the revenues earned and the expenses incurred by Fidelity in conducting the business of developing, marketing, distributing, managing, administering and servicing the fund and its shareholders. The Board also considered the level of Fidelity's profits in respect of all the Fidelity funds.
On an annual basis, FMR presents to the Board Fidelity's profitability for the fund. Fidelity calculates the profitability for each fund, as well as aggregate profitability for groups of Fidelity funds and all Fidelity funds, using a series of detailed revenue and cost allocation methodologies which originate with the audited books and records of Fidelity. The Audit Committee of the Board reviews any significant changes from the prior year's methodologies.
PricewaterhouseCoopers LLP (PwC), independent registered public accounting firm and auditor to Fidelity and certain Fidelity funds, has been engaged annually by the Board as part of the Board's assessment of Fidelity's profitability analysis. PwC's engagement includes the review and assessment of Fidelity's methodologies used in determining the revenues and expenses attributable to Fidelity's mutual fund business, and completion of agreed-upon procedures surrounding the mathematical accuracy of fund profitability and its conformity to allocation methodologies. After considering PwC's reports issued under the engagement and information provided by Fidelity, the Board believes that while other allocation methods may also be reasonable, Fidelity's profitability methodologies are reasonable in all material respects.
The Board has also reviewed Fidelity's non-fund businesses and any fall-out benefits related to the mutual fund business as well as cases where Fidelity's affiliates may benefit from or be related to the fund's business.
Annual Report
The Board considered the costs of the services provided by and the profits realized by Fidelity in connection with the operation of the fund and determined that the amount of profit is a fair entrepreneurial profit for the management of the fund.
Economies of Scale. The Board considered whether there have been economies of scale in respect of the management of the Fidelity funds, whether the Fidelity funds (including the fund) have appropriately benefited from any such economies of scale, and whether there is potential for realization of any further economies of scale. The Board considered the extent to which the fund will benefit from economies of scale through increased services to the fund, through waivers or reimbursements, or through fee or expense reductions.
In February 2009, the Board created an Ad Hoc Committee (the "Committee") to analyze economies of scale. The Committee was formed to consider whether FMR attains economies of scale in respect of the management and servicing of the Fidelity funds, whether the Fidelity funds have appropriately benefited from such economies of scale, and whether there is potential for realization of any further economies of scale.
The Board recognized that the fund's management contract incorporates a "group fee" structure, which provides for lower group fee rates as total fund assets under FMR's management increase, and for higher group fee rates as total fund assets under FMR's management decrease. FMR determines the group fee rates based on a tiered asset "breakpoint" schedule. The Board considered that the group fee is designed to deliver the benefits of economies of scale to fund shareholders when total fund assets increase, even if assets of any particular fund are unchanged or have declined, because some portion of Fidelity's costs are attributable to services provided to all Fidelity funds, and all funds benefit if those costs can be allocated among more assets. The Board concluded that, given the group fee structure, fund shareholders will achieve a certain level of economies of scale as assets under FMR's management increase at the fund complex level, regardless of whether Fidelity achieves any such economies of scale.
The Board concluded, considering the findings of the Committee, that any potential economies of scale are being shared between fund shareholders and Fidelity in an appropriate manner.
Additional Information Requested by the Board. In order to develop fully the factual basis for consideration of the Fidelity funds' Advisory Contracts, the Board requested and received additional information on certain topics, including (i) fund performance trends, actions to be taken by FMR to improve certain funds' overall performance and Fidelity's long-term strategies for certain funds; (ii) portfolio manager changes that have occurred during the past year; (iii) Fidelity's compensation structure for portfolio managers and key personnel, including performance benchmarks used by Fidelity in evaluating incentive compensation for portfolio managers and research analysts; (iv) the structure and process of equity research and actions taken by FMR to improve the quality of research; (v) the selection of and compensation paid by FMR to fund sub-advisers; (vi) Fidelity's fee structures and rationale for recommending different fees among categories of funds; (vii) the rationale for any differences between fund fee structures and fee structures in place for other Fidelity clients; (viii) Fidelity's rationale for recommending which funds should have a performance adjustment component as part of their management fees; and (ix) explanations for the relative total expenses borne by certain funds and classes, total expense competitive trends, and actions that might be taken by FMR to reduce total expenses for certain funds and classes.
Based on its evaluation of all of the conclusions noted above, and after considering all material factors, the Board ultimately concluded that the advisory fee structures are fair and reasonable, and that the fund's Advisory Contracts should be renewed.
Annual Report
Investment Adviser
Fidelity Management & Research Company
Boston, MA
Investment Sub-Advisers
FMR Co., Inc.
Fidelity Management & Research (U.K.) Inc.
Fidelity Research & Analysis Company
FIL Investments (Japan) Limited
FIL Investment Advisors
FIL Investment Advisors (U.K.) Ltd.
Fidelity Management & Research (Hong Kong) Limited
Fidelity Management & Research (Japan) Inc.
General Distributor
Fidelity Distributors Corporation
Boston, MA
Transfer and Service Agents
Fidelity Investments Institutional Operations Company, Inc.
Boston, MA
Fidelity Service Company, Inc.
Boston, MA
Custodian
JPMorgan Chase Bank
New York, NY
VTECIC-ANN-0210
1.817385.104
Fidelity® Variable Insurance Products:
Telecommunications Portfolio
Annual Report
December 31, 2009
(2_fidelity_logos) (Registered_Trademark)
Contents
Performance | <Click Here> | How the fund has done over time. |
Management's Discussion | <Click Here> | The manager's review of fund performance, strategy and outlook. |
Shareholder Expense Example | <Click Here> | An example of shareholder expenses. |
Investment Changes | <Click Here> | A summary of major shifts in the fund's investments over the past six months. |
Investments | <Click Here> | A complete list of the fund's investments with their market values. |
Financial Statements | <Click Here> | Statements of assets and liabilities, operations, and changes in net assets, as well as financial highlights. |
Notes | <Click Here> | Notes to the financial statements. |
Report of Independent Registered Public Accounting Firm | <Click Here> | |
Trustees and Officers | <Click Here> | |
Distributions | <Click Here> | |
Board Approval of Investment Advisory Contracts and Management Fees | <Click Here> | |
To view a fund's proxy voting guidelines and proxy voting record for the 12-month period ended June 30, visit http://www.fidelity.com/proxyvotingresults or visit the Securities and Exchange Commission's (SEC) web site at http://www.sec.gov. You may also call 1-877-208-0098 to request a free copy of the proxy voting guidelines.
Fidelity Variable Insurance Products are separate account options which are purchased through a variable insurance contract.
Standard & Poor's, S&P and S&P 500 are registered service marks of The McGraw-Hill Companies, Inc. and have been licensed for use by Fidelity Distributors Corporation.
Other third party marks appearing herein are the property of their respective owners.
All other marks appearing herein are registered or unregistered trademarks or service marks of FMR LLC or an affiliated company.
This report and the financial statements contained herein are submitted for the general information of the shareholders of the fund. This report is not authorized for distribution to prospective investors in the fund unless preceded or accompanied by an effective prospectus.
A fund files its complete schedule of portfolio holdings with the SEC for the first and third quarters of each fiscal year on Form N-Q. Forms N-Q are available on the SEC's web site at http://www.sec.gov. A fund's Forms N-Q may be reviewed and copied at the SEC's Public Reference Room in Washington, DC. Information regarding the operation of the SEC's Public Reference Room may be obtained by calling 1-800-SEC-0330. For a complete list of a fund's portfolio holdings, view the most recent holdings listing, semiannual report, or annual report on Fidelity's web site at http://www.fidelity.com or http://www.advisor.fidelity.com, as applicable.
NOT FDIC INSURED · MAY LOSE VALUE · NO BANK GUARANTEE
Neither the fund nor Fidelity Distributors Corporation is a bank.
Annual Report
Average annual total return reflects the change in the value of an investment, assuming reinvestment of the class' dividend income and capital gains (the profits earned upon the sale of securities that have grown in value, if any) and assuming a constant rate of performance each year. During periods of reimbursement by Fidelity, a fund's total return will be greater than it would be had the reimbursement not occurred. Performance numbers are net of all underlying fund operating expenses, but do not include any insurance charges imposed by your insurance company's separate account. If performance information included the effect of these additional charges, the total returns would have been lower. How a fund did yesterday is no guarantee of how it will do tomorrow.
Average Annual Total Returns
Periods ended December 31, 2009 | Past 1
year | Life of
fundA |
VIP Telecommunications - Initial Class | 48.00% | -9.30% |
VIP Telecommunications - Investor Class | 47.90% | -9.39% |
A From April 24, 2007.
$10,000 Over Life of Fund
Let's say hypothetically that $10,000 was invested in VIP Telecommunications Portfolio - Initial Class on April 24, 2007, when the fund started. The chart shows how the value of your investment would have changed, and also shows how the Standard & Poor's 500SM Index (S&P 500®) performed over the same period.

Annual Report
Market Recap: In 2009, most global markets saw both crippling lows and considerable highs. After a dismal start, the economy began to show signs of improvement, suggesting that a recovery was on the horizon. Credit markets began to heal as fiscal and monetary stimulus efforts around the world started to take effect, and corporate earnings staged an impressive rebound, fueled in large part by massive cost cutting. As a result, the flight to quality that marked most of 2008 and early 2009 shifted in March as investors flocked to riskier asset categories. The U.S. equity market, as measured by the bellwether Standard & Poor's 500SM Index and the blue-chip proxy Dow Jones Industrial AverageSM, reflected this changing environment, gaining 26.46% and 22.68%, respectively. Meanwhile, the technology-laden Nasdaq Composite® Index rose 45.32%. Foreign stocks also produced strong gains, as illustrated by the 31.93% jump of the MSCI® EAFE® Index (Europe, Australasia, Far East), a gauge of developed stock markets outside the U.S. and Canada. Emerging-markets stocks, which suffered their worst calendar-year performance ever in 2008, posted record returns this past year, with the MSCI Emerging Markets Index soaring 79.02%. A depreciating U.S. dollar helped bolster returns for U.S. investors in foreign equities.
Comments from Kristina Salen, who became Portfolio Manager of VIP Telecommunications Portfolio on July 1, 2009: The fund performed very well for the year, beating the S&P 500® and the MSCI U.S. Investable Market Telecommunications Services Index, which returned 12.56%. (For specific portfolio results, please refer to the performance section of this report.) The fund benefited from being well-positioned in highly leveraged, smaller-cap telecommunication companies that performed strongly when the market rallied between March and June of 2009. Most notably, the fund was helped by overweighting telecom services company Sprint Nextel, by far the fund's top performer relative to the MSCI index. In addition, the fund got a boost from being significantly underweighted in the integrated telecom services group, specifically in AT&T and Verizon, which grew at a much lower rate than other telecom sub-sectors. AT&T and Verizon comprise roughly 75% of the MSCI index. An out-of-benchmark stake and strong stock selection in the cable and satellite group, notably U.K.-based Virgin Media, also helped. In addition, the fund benefited from holding another out-of-index position in communications equipment company Starent Networks. The fund sold this stock during the period. Conversely, the fund's performance was hampered by some weak stock picks. Specifically, it was hurt by holding underweighted positions in Embarq and CenturyTel, two rural, integrated telecom services providers that did well when CenturyTel acquired Embarq. British wireless telecom giant Vodafone, in which the fund held an out-of-network position, also disappointed during the rally when large, liquid stocks fell out of favor as people invested in smaller, more growth-oriented names.
Note to shareholders: In January 2010, Fidelity adopted capped benchmarks for most of its sector and industry funds, including the VIP sector portfolios. The capped benchmarks, which limit the weightings of individual issuers, better represent the investment opportunities available to the funds and will provide shareholders with more-meaningful performance comparisons. These changes do not affect the investment policies of any of the funds, and the primary benchmark for all of the funds remains the Standard & Poor's 500 Index.
The views expressed above reflect those of the portfolio manager(s) only through the end of the period as stated on the cover of this report and do not necessarily represent the views of Fidelity or any other person in the Fidelity organization. Any such views are subject to change at any time based upon market or other conditions and Fidelity disclaims any responsibility to update such views. These views may not be relied on as investment advice and, because investment decisions for a Fidelity fund are based on numerous factors, may not be relied on as an indication of trading intent on behalf of any Fidelity fund.
Annual Report
As a shareholder of the Fund, you incur two types of costs: (1) transaction costs, including redemption fees, and (2) ongoing costs, including management fees and other Fund expenses. This Example is intended to help you understand your ongoing costs (in dollars) of investing in the Fund and to compare these costs with the ongoing costs of investing in other mutual funds.
The Example is based on an investment of $1,000 invested at the beginning of the period and held for the entire period (July 1, 2009 to December 31, 2009).
Actual Expenses
The first line of the accompanying table for each class of the Fund provides information about actual account values and actual expenses. You may use the information in this line, together with the amount you invested, to estimate the expenses that you paid over the period. Simply divide your account value by $1,000.00 (for example, an $8,600 account value divided by $1,000.00 = 8.6), then multiply the result by the number in the first line for a class of the Fund under the heading entitled "Expenses Paid During Period" to estimate the expenses you paid on your account during this period. The estimate of expenses does not include any fees or other expenses of any variable annuity or variable life insurance product. If they were, the estimate of expenses you paid during the period would be higher, and your ending account value would be lower. In addition, the Fund, as a shareholder in the underlying Fidelity Central Funds, will indirectly bear its pro-rata share of the fees and expenses incurred by the underlying Fidelity Central Funds. These fees and expenses are not included in the Fund's annualized expense ratio used to calculate the expense estimate in the table below.
Hypothetical Example for Comparison Purposes
The second line of the accompanying table for each class of the Fund provides information about hypothetical account values and hypothetical expenses based on a Class' actual expense ratio and an assumed rate of return of 5% per year before expenses, which is not the Class' actual return. The hypothetical account values and expenses may not be used to estimate the actual ending account balance or expenses you paid for the period. You may use this information to compare the ongoing costs of investing in the Fund and other funds. To do so, compare this 5% hypothetical example with the 5% hypothetical examples that appear in the shareholder reports of the other funds. The estimate of expenses does not include any fees or other expenses of any variable annuity or variable life insurance product. If they were, the estimate of expenses you paid during the period would be higher, and your ending account value would be lower. In addition, the Fund, as a shareholder in the underlying Fidelity Central Funds, will indirectly bear its pro-rata share of the fees and expenses incurred by the underlying Fidelity Central Funds. These fees and expenses are not included in the Fund's annualized expense ratio used to calculate the expense estimate in the table below.
Please note that the expenses shown in the table are meant to highlight your ongoing costs only and do not reflect any transaction costs. Therefore, the second line of the table is useful in comparing ongoing costs only, and will not help you determine the relative total costs of owning different funds. In addition, if these transactional costs were included, your costs would have been higher.
|
Annualized
Expense Ratio
|
Beginning
Account Value
July 1, 2009
|
Ending
Account Value
December 31, 2009
| Expenses Paid
During Period*
July 1, 2009 to
December 31, 2009 |
Initial Class | 1.00% | | | |
Actual | | $ 1,000.00 | $ 1,169.00 | $ 5.47 |
HypotheticalA | | $ 1,000.00 | $ 1,020.16 | $ 5.09 |
Investor Class | 1.08% | | | |
Actual | | $ 1,000.00 | $ 1,167.60 | $ 5.90 |
HypotheticalA | | $ 1,000.00 | $ 1,019.76 | $ 5.50 |
A 5% return per year before expenses
* Expenses are equal to each Class' annualized expense ratio, multiplied by the average account value over the period, multiplied by 184/365 (to reflect the one-half year period).
Annual Report
Investment Changes (Unaudited)
Top Ten Stocks as of December 31, 2009 |
| % of fund's
net assets | % of fund's net assets
6 months ago |
AT&T, Inc. | 20.7 | 22.3 |
Verizon Communications, Inc. | 15.0 | 16.8 |
American Tower Corp. Class A | 5.7 | 4.7 |
Sprint Nextel Corp. | 4.5 | 9.7 |
Virgin Media, Inc. | 3.3 | 2.2 |
Crown Castle International Corp. | 3.2 | 1.2 |
Qwest Communications International, Inc. | 3.1 | 3.7 |
MTN Group Ltd. | 2.6 | 3.8 |
tw telecom, inc. | 2.5 | 1.3 |
DIRECTV | 2.5 | 1.8 |
| 63.1 | |
Top Industries (% of fund's net assets) |
As of December 31, 2009 |
| Diversified Telecommunication Services | 56.1% | |
| Wireless Telecommunication Services | 25.5% | |
| Media | 11.1% | |
| Software | 1.6% | |
| Communications Equipment | 0.4% | |
| All Others* | 5.3% | |

As of June 30, 2009 |
| Diversified Telecommunication Services | 55.2% | |
| Wireless Telecommunication Services | 26.0% | |
| Media | 7.4% | |
| Communications Equipment | 2.5% | |
| Software | 1.5% | |
| All Others* | 7.4% | |

* Includes short-term investments and net other assets. |
Annual Report
Investments December 31, 2009
Showing Percentage of Net Assets
Common Stocks - 94.9% |
| Shares | | Value |
COMMUNICATIONS EQUIPMENT - 0.4% |
Communications Equipment - 0.4% |
Aruba Networks, Inc. (a) | 5 | | $ 53 |
F5 Networks, Inc. (a) | 40 | | 2,119 |
Infinera Corp. (a) | 2,300 | | 20,401 |
Nortel Networks Corp. (a) | 100 | | 0 |
Polycom, Inc. (a) | 40 | | 999 |
Sandvine Corp. (a) | 100 | | 123 |
Sonus Networks, Inc. (a) | 1,800 | | 3,798 |
| | 27,493 |
COMPUTERS & PERIPHERALS - 0.1% |
Computer Hardware - 0.1% |
Apple, Inc. (a) | 40 | | 8,434 |
DIVERSIFIED TELECOMMUNICATION SERVICES - 56.1% |
Alternative Carriers - 7.8% |
Cable & Wireless PLC | 309 | | 706 |
Clearwire Corp.: | | | |
rights 6/21/10 (a) | 23,529 | | 9,412 |
Class A (a) | 23,529 | | 159,056 |
Cogent Communications Group, Inc. (a) | 1,406 | | 13,863 |
Global Crossing Ltd. (a) | 8,919 | | 127,096 |
Iliad Group SA | 189 | | 22,599 |
Level 3 Communications, Inc. (a) | 27,192 | | 41,604 |
PAETEC Holding Corp. (a) | 1,700 | | 7,055 |
tw telecom, inc. (a) | 10,633 | | 182,250 |
| | 563,641 |
Integrated Telecommunication Services - 48.3% |
AT&T, Inc. | 53,483 | | 1,499,127 |
BT Group PLC | 109 | | 238 |
Cbeyond, Inc. (a) | 5,350 | | 84,263 |
CenturyTel, Inc. | 585 | | 21,183 |
China Telecom Corp. Ltd. sponsored ADR | 2,500 | | 103,550 |
China Unicom (Hong Kong) Ltd. sponsored ADR | 10,800 | | 141,588 |
Cincinnati Bell, Inc. (a) | 4,900 | | 16,905 |
Deutsche Telekom AG (Reg.) | 4,206 | | 61,828 |
FairPoint Communications, Inc. | 522 | | 17 |
Hellenic Telecommunications Organization SA | 37 | | 545 |
PT Telkomunikasi Indonesia Tbk Series B | 7,500 | | 7,520 |
Qwest Communications International, Inc. | 54,155 | | 227,993 |
Telecom Italia SpA sponsored ADR | 2,700 | | 41,661 |
Telefonica SA sponsored ADR | 1,700 | | 141,984 |
Telenor ASA (a) | 100 | | 1,398 |
Telenor ASA sponsored ADR (a) | 830 | | 34,694 |
Telkom SA Ltd. | 100 | | 505 |
Verizon Communications, Inc. | 32,900 | | 1,089,977 |
|
| Shares | | Value |
Vimpel Communications sponsored ADR | 800 | | $ 14,872 |
Windstream Corp. | 1,593 | | 17,507 |
| | 3,507,355 |
TOTAL DIVERSIFIED TELECOMMUNICATION SERVICES | | 4,070,996 |
INTERNET SOFTWARE & SERVICES - 0.1% |
Internet Software & Services - 0.1% |
SAVVIS, Inc. | 601 | | 8,444 |
MEDIA - 11.1% |
Broadcasting - 0.6% |
Ten Network Holdings Ltd. | 27,660 | | 40,498 |
Cable & Satellite - 10.5% |
Cablevision Systems Corp. - NY Group Class A | 4,000 | | 103,280 |
Comcast Corp. Class A | 8,800 | | 148,368 |
DIRECTV (a) | 5,371 | | 179,123 |
Dish TV India Ltd. (a) | 112 | | 103 |
Liberty Global, Inc. Class A (a) | 2,166 | | 47,457 |
Net Servicos de Comunicacao SA sponsored ADR | 3,100 | | 41,943 |
Virgin Media, Inc. | 14,400 | | 242,352 |
| | 762,626 |
TOTAL MEDIA | | 803,124 |
SOFTWARE - 1.6% |
Application Software - 1.5% |
Gameloft (a) | 21,214 | | 107,210 |
Synchronoss Technologies, Inc. (a) | 137 | | 2,166 |
| | 109,376 |
Home Entertainment Software - 0.1% |
Glu Mobile, Inc. (a) | 2,589 | | 2,951 |
TOTAL SOFTWARE | | 112,327 |
WIRELESS TELECOMMUNICATION SERVICES - 25.5% |
Wireless Telecommunication Services - 25.5% |
America Movil SAB de CV Series L sponsored ADR | 300 | | 14,094 |
American Tower Corp. Class A (a) | 9,600 | | 414,816 |
China Mobile (Hong Kong) Ltd. sponsored ADR | 1,300 | | 60,359 |
Crown Castle International Corp. (a) | 5,917 | | 231,000 |
Idea Cellular Ltd. (a) | 63 | | 79 |
Leap Wireless International, Inc. (a) | 1,992 | | 34,960 |
MetroPCS Communications, Inc. (a) | 5,084 | | 38,791 |
MTN Group Ltd. | 11,875 | | 188,942 |
NII Holdings, Inc. (a) | 4,300 | | 144,394 |
NTELOS Holdings Corp. | 36 | | 642 |
NTT DoCoMo, Inc. | 21 | | 29,319 |
Rogers Communications, Inc. Class B (non-vtg.) | 60 | | 1,867 |
Common Stocks - continued |
| Shares | | Value |
WIRELESS TELECOMMUNICATION SERVICES - CONTINUED |
Wireless Telecommunication Services - continued |
SBA Communications Corp. Class A (a) | 3,818 | | $ 130,423 |
Sprint Nextel Corp. (a) | 88,568 | | 324,159 |
Syniverse Holdings, Inc. (a) | 732 | | 12,795 |
Telephone & Data Systems, Inc. | 330 | | 11,194 |
Vivo Participacoes SA sponsored ADR | 1,800 | | 55,800 |
Vodafone Group PLC sponsored ADR | 6,900 | | 159,321 |
| | 1,852,955 |
TOTAL COMMON STOCKS (Cost $6,523,406) | 6,883,773 |
Money Market Funds - 4.8% |
| Shares | | Value |
Fidelity Cash Central Fund, 0.16% (b)
(Cost $351,739) | 351,739 | | $ 351,739 |
TOTAL INVESTMENT PORTFOLIO - 99.7% (Cost $6,875,145) | | 7,235,512 |
NET OTHER ASSETS - 0.3% | | 19,252 |
NET ASSETS - 100% | $ 7,254,764 |
Legend |
(a) Non-income producing |
(b) Affiliated fund that is available only to investment companies and other accounts managed by Fidelity Investments. The rate quoted is the annualized seven-day yield of the fund at period end. A complete unaudited listing of the fund's holdings as of its most recent quarter end is available upon request. |
Affiliated Central Funds |
Information regarding fiscal year to date income earned by the Fund from investments in Fidelity Central Funds is as follows: |
Fund | Income earned |
Fidelity Cash Central Fund | $ 1,051 |
Other Information |
The following is a summary of the inputs used, as of December 31, 2009, involving the Fund's assets and liabilities carried at value. The inputs or methodology used for valuing securities may not be an indication of the risk associated with investing in those securities. For more information on valuation inputs, and their aggregation into the levels used in the tables below, please refer to the Security Valuation section in the accompanying Notes to Financial Statements. |
Valuation Inputs at Reporting Date: |
Description | Total | Level 1 | Level 2 | Level 3 |
Investments in Securities: | | | | |
Common Stocks | $ 6,883,773 | $ 6,792,388 | $ 91,385 | $ - |
Money Market Funds | 351,739 | 351,739 | - | - |
Total Investments in Securities: | $ 7,235,512 | $ 7,144,127 | $ 91,385 | $ - |
The following is a reconciliation of Investments in Securities for which Level 3 inputs were used in determining value: |
Investments in Securities: | |
Beginning Balance | $ - |
Total Realized Gain (Loss) | - |
Total Unrealized Gain (Loss) | (26) |
Cost of Purchases | - |
Proceeds of Sales | - |
Amortization/Accretion | - |
Transfers in/out of Level 3 | 26 |
Ending Balance | $ - |
The change in unrealized gain (loss) for the period attributable to Level 3 securities held at December 31, 2009 | $ (26) |
The information used in the above reconciliation represents fiscal year to date activity for any Investments in Securities identified as using Level 3 inputs at either the beginning or the end of the current fiscal period. Transfers in or out of Level 3 represents either the beginning value (for transfers in), or the ending value (for transfers out) of any Security or Instrument where a change in the pricing level occurred from the beginning to the end of the period. Realized and unrealized gains (losses) disclosed in the reconciliation are included in Net Gain (Loss) on the Fund's Statement of Operations. |
Distribution of investments by country of issue, as a percentage of total net assets, is as follows: (Unaudited) |
United States of America | 80.6% |
Hong Kong | 2.7% |
South Africa | 2.6% |
United Kingdom | 2.2% |
Spain | 2.0% |
France | 1.8% |
Bermuda | 1.8% |
China | 1.4% |
Brazil | 1.4% |
Others (individually less than 1%) | 3.5% |
| 100.0% |
Income Tax Information |
At December 31, 2009, the fund had a capital loss carryforward of approximately $2,357,837 of which $1,999,657 and $358,180 will expire on December 31, 2016 and 2017, respectively. |
See accompanying notes which are an integral part of the financial statements.
Annual Report
Statement of Assets and Liabilities
| December 31, 2009 |
Assets | | |
Investment in securities, at value - See accompanying schedule: Unaffiliated issuers (cost $6,523,406) | $ 6,883,773 | |
Fidelity Central Funds (cost $351,739) | 351,739 | |
Total Investments (cost $6,875,145) | | $ 7,235,512 |
Cash | | 6,718 |
Foreign currency held at value (cost $18) | | 18 |
Receivable for fund shares sold | | 42,465 |
Dividends receivable | | 3,653 |
Distributions receivable from Fidelity Central Funds | | 35 |
Prepaid expenses | | 38 |
Receivable from investment adviser for expense reductions | | 2,858 |
Other receivables | | 975 |
Total assets | | 7,292,272 |
| | |
Liabilities | | |
Payable for fund shares redeemed | $ 6 | |
Accrued management fee | 3,197 | |
Other affiliated payables | 839 | |
Other payables and accrued expenses | 33,466 | |
Total liabilities | | 37,508 |
| | |
Net Assets | | $ 7,254,764 |
Net Assets consist of: | | |
Paid in capital | | $ 9,458,513 |
Undistributed net investment income | | 16,827 |
Accumulated undistributed net realized gain (loss) on investments and foreign currency transactions | | (2,580,782) |
Net unrealized appreciation (depreciation) on investments and assets and liabilities in foreign currencies | | 360,206 |
Net Assets | | $ 7,254,764 |
Statement of Assets and Liabilities - continued
| December 31, 2009 |
Initial Class:
Net Asset Value, offering price and redemption price per share ($3,625,893 ÷ 517,523 shares) | | $ 7.01 |
| | |
Investor Class:
Net Asset Value, offering price and redemption price per share ($3,628,871 ÷ 519,409 shares) | | $ 6.99 |
See accompanying notes which are an integral part of the financial statements.
Annual Report
Statement of Operations
| Year ended December 31, 2009 |
Investment Income | | |
Dividends | | $ 162,803 |
Interest | | 12 |
Income from Fidelity Central Funds | | 1,051 |
Total income | | 163,866 |
| | |
Expenses | | |
Management fee | $ 36,129 | |
Transfer agent fees | 13,937 | |
Accounting fees and expenses | 2,500 | |
Custodian fees and expenses | 15,062 | |
Independent trustees' compensation | 43 | |
Audit | 43,774 | |
Legal | 34 | |
Miscellaneous | 856 | |
Total expenses before reductions | 112,335 | |
Expense reductions | (46,118) | 66,217 |
Net investment income (loss) | | 97,649 |
Realized and Unrealized Gain (Loss) Net realized gain (loss) on: | | |
Investment securities: | | |
Unaffiliated issuers | (125,275) | |
Foreign currency transactions | (908) | |
Total net realized gain (loss) | | (126,183) |
Change in net unrealized appreciation (depreciation) on: Investment securities | 2,373,703 | |
Assets and liabilities in foreign currencies | 44 | |
Total change in net unrealized appreciation (depreciation) | | 2,373,747 |
Net gain (loss) | | 2,247,564 |
Net increase (decrease) in net assets resulting from operations | | $ 2,345,213 |
Statement of Changes in Net Assets
| Year ended
December 31, 2009 | Year ended
December 31, 2008 |
Increase (Decrease) in Net Assets | | |
Operations | | |
Net investment income (loss) | $ 97,649 | $ 66,311 |
Net realized gain (loss) | (126,183) | (2,213,104) |
Change in net unrealized appreciation (depreciation) | 2,373,747 | (1,315,009) |
Net increase (decrease) in net assets resulting from operations | 2,345,213 | (3,461,802) |
Distributions to shareholders from net investment income | (105,936) | (68,515) |
Share transactions - net increase (decrease) | 1,824,836 | (1,545,159) |
Redemption fees | 9,387 | 2,509 |
Total increase (decrease) in net assets | 4,073,500 | (5,072,967) |
| | |
Net Assets | | |
Beginning of period | 3,181,264 | 8,254,231 |
End of period (including undistributed net investment income of $16,827 and $0, respectively) | $ 7,254,764 | $ 3,181,264 |
See accompanying notes which are an integral part of the financial statements.
Annual Report
Financial Highlights - Initial Class
Years ended December 31, | 2009 | 2008 | 2007 H |
Selected Per-Share Data | | | |
Net asset value, beginning of period | $ 4.81 | $ 9.36 | $ 10.00 |
Income from Investment Operations | | | |
Net investment income (loss) E | .09 | .09 | .05 |
Net realized and unrealized gain (loss) | 2.21 | (4.53) | (.17) |
Total from investment operations | 2.30 | (4.44) | (.12) |
Distributions from net investment income | (.11) | (.11) | (.05) |
Distributions from net realized gain | - | - | (.48) |
Total distributions | (.11) | (.11) | (.53) |
Redemption fees added to paid in capital E | .01 | - J | .01 |
Net asset value, end of period | $ 7.01 | $ 4.81 | $ 9.36 |
Total Return B, C, D | 48.00% | (47.41)% | (1.18)% |
Ratios to Average Net Assets F, I | | | |
Expenses before reductions | 1.70% | 2.07% | 1.37% A |
Expenses net of fee waivers, if any | 1.00% | 1.00% | 1.00% A |
Expenses net of all reductions | .98% | .99% | 1.00% A |
Net investment income (loss) | 1.55% | 1.32% | .63% A |
Supplemental Data | | | |
Net assets, end of period (000 omitted) | $ 3,626 | $ 1,549 | $ 3,956 |
Portfolio turnover rate G | 167% | 203% | 160% A |
A Annualized B Total returns for periods of less than one year are not annualized. C Total returns do not reflect charges attributable to your insurance company's separate account. Inclusion of these charges would reduce the total returns shown. D Total returns would have been lower had certain expenses not been reduced during the periods shown. E Calculated based on average shares outstanding during the period. F Fees and expenses of the underlying Fidelity Central Funds are not included in the Fund's expense ratio. The Fund indirectly bears its proportionate share of the expenses of any underlying Fidelity Central Funds. G Amount does not include the portfolio activity of any underlying Fidelity Central Funds. H For the period April 24, 2007 (commencement of operations) to December 31, 2007. I Expense ratios reflect operating expenses of the class. Expenses before reductions do not reflect amounts reimbursed by the investment adviser or reductions from brokerage service arrangements or reductions from other expense offset arrangements and do not represent the amount paid by the class during periods when reimbursements or reductions occur. Expense ratios before reductions for start-up periods may not be representative of longer-term operating periods. Expenses net of fee waivers reflect expenses after reimbursement by the investment adviser but prior to reductions from brokerage service arrangements or other expense offset arrangements. Expenses net of all reductions represent the net expenses paid by the class. J Amount represents less than $.01 per share. |
Financial Highlights - Investor Class
Years ended December 31, | 2009 | 2008 | 2007 H |
Selected Per-Share Data | | | |
Net asset value, beginning of period | $ 4.80 | $ 9.35 | $ 10.00 |
Income from Investment Operations | | | |
Net investment income (loss) E | .09 | .09 | .04 |
Net realized and unrealized gain (loss) | 2.20 | (4.53) | (.17) |
Total from investment operations | 2.29 | (4.44) | (.13) |
Distributions from net investment income | (.11) | (.11) | (.05) |
Distributions from net realized gain | - | - | (.48) |
Total distributions | (.11) | (.11) | (.53) |
Redemption fees added to paid in capital E | .01 | - J | .01 |
Net asset value, end of period | $ 6.99 | $ 4.80 | $ 9.35 |
Total Return B, C, D | 47.90% | (47.46)% | (1.28)% |
Ratios to Average Net Assets F, I | | | |
Expenses before reductions | 1.78% | 2.15% | 1.50% A |
Expenses net of fee waivers, if any | 1.08% | 1.09% | 1.15% A |
Expenses net of all reductions | 1.07% | 1.08% | 1.15% A |
Net investment income (loss) | 1.47% | 1.23% | .48% A |
Supplemental Data | | | |
Net assets, end of period (000 omitted) | $ 3,629 | $ 1,632 | $ 4,298 |
Portfolio turnover rate G | 167% | 203% | 160% A |
A Annualized B Total returns for periods of less than one year are not annualized. C Total returns do not reflect charges attributable to your insurance company's separate account. Inclusion of these charges would reduce the total returns shown. D Total returns would have been lower had certain expenses not been reduced during the periods shown. E Calculated based on average shares outstanding during the period. F Fees and expenses of the underlying Fidelity Central Funds are not included in the Fund's expense ratio. The Fund indirectly bears its proportionate share of the expenses of any underlying Fidelity Central Funds. G Amount does not include the portfolio activity of any underlying Fidelity Central Funds. H For the period April 24, 2007 (commencement of operations) to December 31, 2007. I Expense ratios reflect operating expenses of the class. Expenses before reductions do not reflect amounts reimbursed by the investment adviser or reductions from brokerage service arrangements or reductions from other expense offset arrangements and do not represent the amount paid by the class during periods when reimbursements or reductions occur. Expense ratios before reductions for start-up periods may not be representative of longer-term operating periods. Expenses net of fee waivers reflect expenses after reimbursement by the investment adviser but prior to reductions from brokerage service arrangements or other expense offset arrangements. Expenses net of all reductions represent the net expenses paid by the class. J Amount represents less than $.01 per share. |
See accompanying notes which are an integral part of the financial statements.
Annual Report
Notes to Financial Statements
For the period ended December 31, 2009
1. Organization.
VIP Telecommunications Portfolio (the Fund) is a non-diversified fund of Variable Insurance Products Fund IV (the trust) and is authorized to issue an unlimited number of shares. The trust is registered under the Investment Company Act of 1940, as amended (the 1940 Act), as an open-end management investment company organized as a Massachusetts business trust. Shares of the Fund may only be purchased by insurance companies for the purpose of funding variable annuity or variable life insurance contracts. The Fund offers the following classes of shares: Initial Class shares and Investor Class shares. All classes have equal rights and voting privileges, except for matters affecting a single class. Investment income, realized and unrealized capital gains and losses, the common expenses of the Fund, and certain fund-level expense reductions, if any, are allocated on a pro-rata basis to each class based on the relative net assets of each class to the total net assets of the Fund. Each class differs with respect to transfer agent fees incurred. Certain expense reductions also differ by class.
2. Investments in Fidelity Central Funds.
The Fund may invest in Fidelity Central Funds, which are open-end investment companies available only to other investment companies and accounts managed by Fidelity Management & Research Company (FMR) and its affiliates. The Fund's Schedule of Investments lists each of the Fidelity Central Funds held as of period end, if any, as an investment of the Fund, but does not include the underlying holdings of each Fidelity Central Fund. As an Investing Fund, the Fund indirectly bears its proportionate share of the expenses of the underlying Fidelity Central Funds.
The Money Market Central Funds seek preservation of capital and current income and are managed by Fidelity Investments Money Management, Inc. (FIMM), an affiliate of FMR.
A complete unaudited list of holdings for each Fidelity Central Fund is available upon request or at the Securities and Exchange Commission (the SEC) web site at www.sec.gov. In addition, the financial statements of the Fidelity Central Funds, which are not covered by the Fund's Report of Independent Registered Public Accounting Firm, are available on the SEC web site or upon request.
3. Significant Accounting Policies.
The financial statements have been prepared in conformity with accounting principles generally accepted in the United States of America, which require management to make certain estimates and assumptions at the date of the financial statements. Actual results could differ from those estimates. Events or transactions occurring after period end through the date that the financial statements were issued, February 12, 2010, have been evaluated in the preparation of the financial statements. The following summarizes the significant accounting policies of the Fund:
Security Valuation. Investments are valued as of 4:00 p.m. Eastern time on the last calendar day of the period. The Fund uses independent pricing services approved by the Board of Trustees to value its investments. When current market prices or quotations are not readily available or reliable, valuations may be determined in good faith in accordance with procedures adopted by the Board of Trustees. Factors used in determining value may include significant market or security specific events. The frequency with which these procedures are used cannot be predicted and may be utilized to a significant extent. The value used for net asset value (NAV) calculation under these procedures may differ from published prices for the same securities.
The Fund categorizes the inputs to valuation techniques used to value its investments into a disclosure hierarchy consisting of three levels as shown below.
Level 1 - quoted prices in active markets for identical investments
Level 2 - other significant observable inputs (including quoted prices for similar investments, interest rates, prepayment speeds, etc.)
Level 3 - unobservable inputs (including the fund's own assumptions based on the best information available)
Changes in valuation techniques may result in transfers in or out of an assigned level within the disclosure hierarchy. The aggregate value of investments by input level, as of December 31, 2009, as well as a roll forward of level 3 securities is included at the end of the Fund's Schedule of Investments. Valuation techniques used to value the Fund's investments by major category are as follows.
Equity securities, including restricted securities, for which market quotations are readily available, are valued at the last reported sale price or official closing price as reported by an independent pricing service on the primary market or exchange on which they are traded and are categorized as level 1 in the hierarchy. In the event there were no sales during the day or closing prices are not available, securities are valued at the last quoted bid price or may be valued using the last available price and categorized as Level 2 in the hierarchy. For foreign equity securities, when significant market or security events arise, comparisons to the valuation of American Depository Receipts (ADRs), futures contracts, exchange-traded funds (ETFs) and certain indexes as well as quoted prices for similar securities are used and are categorized as Level 2 in the hierarchy in these circumstances. For restricted securities and private placements where observable inputs are limited, assumptions about market activity and risk are used and are categorized as level 3 in the hierarchy.
Annual Report
Notes to Financial Statements - continued
3. Significant Accounting Policies - continued
Security Valuation - continued
Investments in open-end mutual funds including the Fidelity Money Market Central Funds are valued at their closing net asset value each business day and are categorized as Level 1 in the hierarchy. Short-term securities with remaining maturities of sixty days or less for which quotations are not readily available are valued at amortized cost, which approximates value and are categorized as level 2 in the hierarchy.
Foreign Currency. The Fund uses foreign currency contracts to facilitate transactions in foreign-denominated securities. Losses from these transactions may arise from changes in the value of the foreign currency or if the counterparties do not perform under the contracts' terms.
Foreign-denominated assets, including investment securities, and liabilities are translated into U.S. dollars at the exchange rate at period end. Purchases and sales of investment securities, income and dividends received and expenses denominated in foreign currencies are translated into U.S. dollars at the exchange rate in effect on the transaction date.
The effects of exchange rate fluctuations on investments are included with the net realized and unrealized gain (loss) on investment securities. Other foreign currency transactions resulting in realized and unrealized gain (loss) are disclosed separately.
Investment Transactions and Income. For financial reporting purposes, the Fund's investment holdings and NAV include trades executed through the end of the last business day of the period. The NAV per share for processing shareholder transactions is calculated as of the close of business of the New York Stock Exchange (NYSE), normally 4:00 p.m. Eastern time and includes trades executed through the end of the prior business day. Gains and losses on securities sold are determined on the basis of identified cost. Dividend income is recorded on the ex-dividend date, except for certain dividends from foreign securities where the ex-dividend date may have passed, which are recorded as soon as the Fund is informed of the ex-dividend date. Non-cash dividends included in dividend income, if any, are recorded at the fair market value of the securities received. Distributions received on securities that represent a return of capital or capital gain are recorded as a reduction of cost of investments and/or as a realized gain. The Fund estimates the components of distributions received that may be considered return of capital distributions or capital gain distributions. As a result of a change in the estimate of the return of capital component of dividend income realized in the year ended December 31, 2008, dividend income has been reduced $26,022 with a corresponding increase to net unrealized appreciation (depreciation). The change in estimate has no impact on total net assets or total return of the Fund. Interest income and distributions from the Fidelity Central Funds are accrued as earned. Interest income includes coupon interest and amortization of premium and accretion of discount on debt securities. Investment income is recorded net of foreign taxes withheld where recovery of such taxes is uncertain.
Expenses. Most expenses of the trust can be directly attributed to a fund. Expenses which cannot be directly attributed are apportioned among each Fund in the trust. Expense estimates are accrued in the period to which they relate and adjustments are made when actual amounts are known.
Income Tax Information and Distributions to Shareholders. Each year, the Fund intends to qualify as a regulated investment company by distributing substantially all of its taxable income and realized gains under Subchapter M of the Internal Revenue Code and filing its U.S. federal tax return. As a result, no provision for income taxes is required. As of December 31, 2009, the Fund did not have any unrecognized tax benefits in the accompanying financial statements. A Fund's federal tax return is subject to examination by the Internal Revenue Service (IRS) for a period of three years. Foreign taxes are provided for based on the Fund's understanding of the tax rules and rates that exist in the foreign markets in which it invests.
Distributions are recorded on the ex-dividend date. Income dividends and capital gain distributions are declared separately for each class. Income and capital gain distributions are determined in accordance with income tax regulations, which may differ from generally accepted accounting principles.
Capital accounts within the financial statements are adjusted for permanent book-tax differences. These adjustments have no impact on net assets or the results of operations. Temporary book-tax differences will reverse in a subsequent period.
Book-tax differences are primarily due to foreign currency transactions, capital loss carryforwards, and losses deferred due to wash sales and excise tax regulations.
The federal tax cost of investment securities and unrealized appreciation (depreciation) as of period end were as follows:
Gross unrealized appreciation | $ 1,094,414 |
Gross unrealized depreciation | (956,992) |
Net unrealized appreciation (depreciation) | $ 137,422 |
| |
Tax Cost | $ 7,098,090 |
Annual Report
3. Significant Accounting Policies - continued
Income Tax Information and Distributions to Shareholders - continued
The tax-based components of distributable earnings as of period end were as follows:
Undistributed ordinary income | $ 16,827 |
Capital loss carryforward | $ (2,357,837) |
Net unrealized appreciation (depreciation) | $ 137,262 |
The tax character of distributions paid was as follows:
| December 31, 2009 | December 31, 2008 |
| | |
Ordinary Income | $ 105,936 | $ 68,515 |
Trading (Redemption) Fees. Shares held less than 60 days are subject to a redemption fee equal to 1% of the proceeds of the redeemed shares. All redemption fees, including any estimated redemption fees paid by FMR, are retained by the Fund and accounted for as an addition to paid in capital.
4. Purchases and Sales of Investments.
Purchases and sales of securities, other than short-term securities, aggregated $11,960,821 and $10,242,263, respectively.
5. Fees and Other Transactions with Affiliates.
Management Fee. FMR and its affiliates provide the Fund with investment management related services for which the Fund pays a monthly management fee. The management fee is the sum of an individual fund fee rate that is based on an annual rate of .30% of the Fund's average net assets and a group fee rate that averaged .26% during the period. The group fee rate is based upon the average net assets of all the mutual funds advised by FMR. The group fee rate decreases as assets under management increase and increases as assets under management decrease. For the period, the total annual management fee rate was .56% of the Fund's average net assets.
Transfer Agent Fees. Fidelity Investments Institutional Operations Company, Inc. (FIIOC), an affiliate of FMR, is the Fund's transfer, dividend disbursing, and shareholder servicing agent. FIIOC receives an asset-based fee with respect to each class. Each class (with the exception of Investor Class) pays a transfer agent fee, excluding out of pocket expenses, equal to an annual rate of .07% of average net assets. Investor Class pays a monthly asset-based transfer agent fee of .15% of average net assets. The total transfer agent fees paid by each class to FIIOC, including out of pocket expenses, were as follows:
Initial Class | $ 5,841 |
Investor Class | 8,096 |
| $ 13,937 |
Accounting Fees. Fidelity Service Company, Inc. (FSC), an affiliate of FMR, maintains the Fund's accounting records. The fee is based on the level of average net assets for the month.
Brokerage Commissions. The Fund placed a portion of its portfolio transactions with brokerage firms which are affiliates of the investment adviser. The commissions paid to these affiliated firms were $3,118 for the period.
6. Committed Line of Credit.
The Fund participates with other funds managed by FMR in a $3.5 billion credit facility (the "line of credit") to be utilized for temporary or emergency purposes to fund shareholder redemptions or for other short-term liquidity purposes. The Fund has agreed to pay commitment fees on its pro-rata portion of the line of credit, which amounted to $27 and is reflected in Miscellaneous Expense on the Statement of Operations. During the period, there were no borrowings on this line of credit.
Annual Report
Notes to Financial Statements - continued
7. Expense Reductions.
FMR voluntarily agreed to reimburse each class to the extent annual operating expenses exceeded certain levels of average net assets as noted in the table below. Some expenses, for example interest expense, including commitment fees, are excluded from this reimbursement.
The following classes were in reimbursement during the period:
| Expense
Limitations | Reimbursement
from adviser |
| | |
Initial Class | 1.00% | $ 23,362 |
Investor Class | 1.08% | 21,788 |
| | $ 45,150 |
Many of the brokers with whom FMR places trades on behalf of the Fund provided services to the Fund in addition to trade execution. These services included payments of certain expenses on behalf of the Fund totaling $968 for the period.
8. Distributions to Shareholders.
Distributions to shareholders of each class were as follows:
Years ended December 31, | 2009 | 2008 |
From net investment income | | |
Initial Class | $ 52,826 | $ 34,167 |
Investor Class | 53,110 | 34,348 |
Total | $ 105,936 | $ 68,515 |
9. Share Transactions.
Transactions for each class of shares were as follows:
| Shares | Dollars |
Years ended December 31, | 2009 | 2008 | 2009 | 2008 |
Initial Class | | | | |
Shares sold | 793,797 | 166,405 | $ 4,532,094 | $ 1,029,476 |
Reinvestment of distributions | 7,678 | 7,239 | 52,826 | 34,167 |
Shares redeemed | (605,766) | (274,366) | (3,645,605) | (1,833,477) |
Net increase (decrease) | 195,709 | (100,722) | $ 939,315 | $ (769,834) |
Investor Class | | | | |
Shares sold | 754,251 | 149,553 | $ 4,408,596 | $ 986,673 |
Reinvestment of distributions | 7,742 | 7,293 | 53,110 | 34,348 |
Shares redeemed | (582,365) | (276,604) | (3,576,185) | (1,796,346) |
Net increase (decrease) | 179,628 | (119,758) | $ 885,521 | $ (775,325) |
10. Other.
The Fund's organizational documents provide former and current trustees and officers with a limited indemnification against liabilities arising in connection with the performance of their duties to the Fund. In the normal course of business, the Fund may also enter into contracts that provide general indemnifications. The Fund's maximum exposure under these arrangements is unknown as this would be dependent on future claims that may be made against the Fund. The risk of material loss from such claims is considered remote.
At the end of the period, FMR or its affiliates were the owners of record of 100% of the total outstanding shares of the Fund.
Annual Report
Report of Independent Registered Public Accounting Firm
To the Trustees of Variable Insurance Products Fund IV and the Shareholders of VIP Telecommunications Portfolio:
In our opinion, the accompanying statement of assets and liabilities, including the schedule of investments, and the related statements of operations and of changes in net assets and the financial highlights present fairly, in all material respects, the financial position of VIP Telecommunications Portfolio (a fund of Variable Insurance Products Fund IV) at December 31, 2009, the results of its operations for the year then ended, the changes in its net assets for each of the two years in the period then ended and the financial highlights for each of the periods indicated, in conformity with accounting principles generally accepted in the United States of America. These financial statements and financial highlights (hereafter referred to as "financial statements") are the responsibility of the VIP Telecommunications Portfolio's management. Our responsibility is to express an opinion on these financial statements based on our audits. We conducted our audits of these financial statements in accordance with the standards of the Public Company Accounting Oversight Board (United States). Those standards require that we plan and perform the audit to obtain reasonable assurance about whether the financial statements are free of material misstatement. An audit includes examining, on a test basis, evidence supporting the amounts and disclosures in the financial statements, assessing the accounting principles used and significant estimates made by management, and evaluating the overall financial statement presentation. We believe that our audits, which included confirmation of securities at December 31, 2009 by correspondence with the custodian and brokers, provide a reasonable basis for our opinion.
/s/ PricewaterhouseCoopers LLP
PricewaterhouseCoopers LLP
Boston, Massachusetts
February 12, 2010
Annual Report
The Trustees, Member of the Advisory Board, and executive officers of the trust and fund, as applicable, are listed below. The Board of Trustees governs the fund and is responsible for protecting the interests of shareholders. The Trustees are experienced executives who meet periodically throughout the year to oversee the fund's activities, review contractual arrangements with companies that provide services to the fund, and review the fund's performance. Except for James C. Curvey, each of the Trustees oversees 222 funds advised by FMR or an affiliate. Mr. Curvey oversees 410 funds advised by FMR or an affiliate.
The Trustees hold office without limit in time except that (a) any Trustee may resign; (b) any Trustee may be removed by written instrument, signed by at least two-thirds of the number of Trustees prior to such removal; (c) any Trustee who requests to be retired or who has become incapacitated by illness or injury may be retired by written instrument signed by a majority of the other Trustees; and (d) any Trustee may be removed at any special meeting of shareholders by a two-thirds vote of the outstanding voting securities of the trust. Each Trustee who is not an interested person (as defined in the 1940 Act) (Independent Trustee), shall retire not later than the last day of the calendar year in which his or her 72nd birthday occurs. The Independent Trustees may waive this mandatory retirement age policy with respect to individual Trustees. The executive officers and Advisory Board Member hold office without limit in time, except that any officer and Advisory Board Member may resign or may be removed by a vote of a majority of the Trustees at any regular meeting or any special meeting of the Trustees. Except as indicated, each individual has held the office shown or other offices in the same company for the past five years.
The fund's Statement of Additional Information (SAI) includes more information about the Trustees. To request a free copy, call Fidelity at 1-800-544-8544.
Interested Trustees*:
Correspondence intended for each Trustee who is an interested person may be sent to Fidelity Investments, 82 Devonshire Street, Boston, Massachusetts 02109.
Name, Age; Principal Occupation |
Edward C. Johnson 3d (79) |
| Year of Election or Appointment: 1983 Mr. Johnson is Trustee and Chairman of the Board of Trustees of certain Trusts. Mr. Johnson serves as Chief Executive Officer, Chairman, and a Director of FMR LLC; Chairman and a Director of FMR; Chairman and a Director of Fidelity Research & Analysis Company (FRAC); Chairman and a Director of Fidelity Investments Money Management, Inc.; and Chairman and a Director of FMR Co., Inc. In addition, Mr. Johnson serves as Chairman and Director of FIL Limited. Previously, Mr. Johnson served as President of FMR LLC (2006-2007). |
James C. Curvey (74) |
| Year of Election or Appointment: 2007 Mr. Curvey also serves as Trustee (2007-present) of other investment companies advised by FMR. Mr. Curvey is a Director of FMR and FMR Co., Inc. (2007-present). Mr. Curvey is also Vice Chairman (2006-present) and Director of FMR LLC. In addition, Mr. Curvey serves as an Overseer for the Boston Symphony Orchestra and a member of the Trustees of Villanova University. |
* Trustees have been determined to be "Interested Trustees" by virtue of, among other things, their affiliation with the trust or various entities under common control with FMR.
Independent Trustees:
Correspondence intended for each Independent Trustee (that is, the Trustees other than the Interested Trustees) may be sent to Fidelity Investments, P.O. Box 55235, Boston, Massachusetts 02205-5235.
Name, Age; Principal Occupation |
Dennis J. Dirks (61) |
| Year of Election or Appointment: 2005 Prior to his retirement in May 2003, Mr. Dirks was Chief Operating Officer and a member of the Board of The Depository Trust & Clearing Corporation (DTCC). He also served as President, Chief Operating Officer, and Board member of The Depository Trust Company (DTC) and President and Board member of the National Securities Clearing Corporation (NSCC). In addition, Mr. Dirks served as Chief Executive Officer and Board member of the Government Securities Clearing Corporation, Chief Executive Officer and Board member of the Mortgage-Backed Securities Clearing Corporation, as a Trustee and a member of the Finance Committee of Manhattan College (2005-2008), and as a Trustee and a member of the Finance Committee of AHRC of Nassau County (2006-2008). Currently, Mr. Dirks serves as a member of the Board of Directors for The Brookville Center for Children's Services, Inc. (2009-present). |
Alan J. Lacy (56) |
| Year of Election or Appointment: 2008 Mr. Lacy serves as Senior Adviser (2007-present) of Oak Hill Capital Partners, L.P. (private equity). Mr. Lacy also served as Chief Executive Officer (2000-2005) and Vice Chairman (2005-2006) of Sears Holdings Corporation and Sears, Roebuck and Co. (retail). In addition, Mr. Lacy serves as a member of the Board of Directors of The Western Union Company (global money transfer, 2006-present) and Bristol-Myers Squibb Company (global pharmaceuticals, 2007-present). Mr. Lacy is Chairman (2008-present) and a member (2006-present) of the Board of Trustees of The National Parks Conservation Association. |
Ned C. Lautenbach (65) |
| Year of Election or Appointment: 2000 Mr. Lautenbach is Chairman of the Independent Trustees of the Equity and High Income Funds (2006-present). Mr. Lautenbach is an Advisory Partner of Clayton, Dubilier & Rice, Inc. (private equity investment). Previously, Mr. Lautenbach was with the International Business Machines Corporation (IBM) from 1968 until his retirement in 1998. Mr. Lautenbach serves as a Director of Eaton Corporation (diversified industrial) as well as the Philharmonic Center for the Arts in Naples, Florida. Mr. Lautenbach is also a member of the Board of Trustees of Fairfield University (2005-present), as well as a member of the Council on Foreign Relations. Previously, Mr. Lautenbach served as a Director of Sony Corporation (2006-2007). |
Joseph Mauriello (65) |
| Year of Election or Appointment: 2008 Prior to his retirement in January 2006, Mr. Mauriello served in numerous senior management positions including Deputy Chairman and Chief Operating Officer (2004-2005), and Vice Chairman of Financial Services (2002-2004) of KPMG LLP US (professional services, 1965-2005). Mr. Mauriello currently serves as a member of the Board of Directors of XL Capital Ltd. (global insurance and re-insurance, 2006-present) and of Arcadia Resources Inc. (health care services and products, 2007-present). Previously, Mr. Mauriello served as a Director of the Hamilton Funds of the Bank of New York (2006-2007). |
Cornelia M. Small (65) |
| Year of Election or Appointment: 2005 Ms. Small is a member of the Board of Directors of the Teagle Foundation (2009-present). Ms. Small is also a member of the Investment Committee, and Chair (2008-present) and a member of the Board of Trustees of Smith College. In addition, Ms. Small serves on the Investment Committee of the Berkshire Taconic Community Foundation (2008-present). Previously, Ms. Small served as Chairperson of the Investment Committee (2002-2008) of Smith College. In addition, Ms. Small served as Chief Investment Officer, Director of Global Equity Investments, and a member of the Board of Directors of Scudder, Stevens & Clark and Scudder Kemper Investments. |
William S. Stavropoulos (70) |
| Year of Election or Appointment: 2001 Mr. Stavropoulos serves as President and Founder of the Michigan Baseball Foundation, the Great Lakes Loons (2007-present). Mr. Stavropoulos is Chairman Emeritus of the Board of Directors of The Dow Chemical Company, where he previously served in numerous senior management positions, including President, CEO (1995-2000; 2002-2004), Chairman of the Executive Committee (2000-2006), and as a member of the Board of Directors (1990-2006). Currently, Mr. Stavropoulos is a Director of Teradata Corporation (data warehousing and technology solutions, 2008-present), Chemical Financial Corporation, Maersk Inc. (industrial conglomerate), Tyco International, Inc. (multinational manufacturing and services, 2007-present), and a member of the Advisory Board for Metalmark Capital (private equity investment, 2005-present). Mr. Stavropoulos is a special advisor to Clayton, Dubilier & Rice, Inc. (private equity investment). In addition, Mr. Stavropoulos is a member of the University of Notre Dame Advisory Council for the College of Science. |
David M. Thomas (60) |
| Year of Election or Appointment: 2008 Previously, Mr. Thomas served as Executive Chairman (2005-2006) and Chairman and Chief Executive Officer (2000-2005) of IMS Health, Inc. (pharmaceutical and healthcare information solutions). In addition, Mr. Thomas serves as a member of the Board of Directors of Fortune Brands, Inc. (consumer products), and Interpublic Group of Companies, Inc. (marketing communication, 2004-present). |
Michael E. Wiley (59) |
| Year of Election or Appointment: 2008 Mr. Wiley also serves as a Director of Asia Pacific Exploration Consolidated (international oil and gas exploration and production, 2008-present), and as a member of the Board of Trustees of the University of Tulsa (2000-2006; 2007-present). Mr. Wiley serves as a Director of Tesoro Corporation (independent oil refiner and marketer, 2005-present), and a Director of Bill Barrett Corporation (exploration and production, 2005-present). In addition, Mr. Wiley also serves as a Director of Post Oak Bank (privately-held bank, 2004-present). Previously, Mr. Wiley served as a Sr. Energy Advisor of Katzenbach Partners, LLC (consulting, 2006-2007), as an Advisory Director of Riverstone Holdings (private investment), Chairman, President, and CEO of Baker Hughes, Inc. (oilfield services, 2000-2004), and as Director of Spinnaker Exploration Company (exploration and production, 2001-2005). |
Annual Report
Advisory Board Member and Executive Officers:
Correspondence intended for each executive officer and Peter S. Lynch may be sent to Fidelity Investments, 82 Devonshire Street, Boston, Massachusetts 02109.
Name, Age; Principal Occupation |
Peter S. Lynch (65) |
| Year of Election or Appointment: 2003 Member of the Advisory Board of Fidelity's Equity and High Income Funds. Mr. Lynch is Vice Chairman and a Director of FMR and FMR Co., Inc. In addition, Mr. Lynch serves as a Trustee of Boston College and as the Chairman of the Inner-City Scholarship Fund. Previously, Mr. Lynch served on the Special Olympics International Board of Directors (1997-2006). |
Kenneth B. Robins (40) |
| Year of Election or Appointment: 2008 President and Treasurer of Fidelity's Equity and High Income Funds. Mr. Robins also serves as Assistant Treasurer of other Fidelity funds (2009-present) and is an employee of Fidelity Investments (2004-present). Before joining Fidelity Investments, Mr. Robins worked at KPMG LLP, where he was a partner in KPMG's department of professional practice (2002-2004). |
Bruce T. Herring (44) |
| Year of Election or Appointment: 2006 Vice President of certain Equity Funds. Mr. Herring also serves as Group Chief Investments Officer of FMR. Previously, Mr. Herring served as a portfolio manager for Fidelity U.S. Equity Funds. |
Brian B. Hogan (45) |
| Year of Election or Appointment: 2009 Vice President of certain Equity Funds and Vice President of Sector Funds. Mr. Hogan also serves as Senior Vice President, Equity Research of FMR (2006-present) and President of FMR's Equity Division (2009-present). Previously, Mr. Hogan served as a portfolio manager. |
Christopher S. Bartel (38) |
| Year of Election or Appointment: 2009 Vice President of Fidelity's Sector and Real Estate Equity Funds. Mr. Bartel also serves as Senior Vice President of Equity Research (2009-present). Previously, Mr. Bartel served as Managing Director of Research (2006-2009) and an analyst and portfolio manager (2000-2006). |
Scott C. Goebel (41) |
| Year of Election or Appointment: 2008 Secretary and Chief Legal Officer (CLO) of the Fidelity funds. Mr. Goebel also serves as General Counsel, Secretary, and Senior Vice President of FMR (2008-present) and FMR Co., Inc. (2008-present); Deputy General Counsel of FMR LLC; Chief Legal Officer of Fidelity Management & Research (Hong Kong) Limited (2008-present) and Assistant Secretary of Fidelity Management & Research (Japan) Inc. (2008-present), Fidelity Investments Money Management, Inc. (2008-present), Fidelity Management & Research (U.K.) Inc. (2008-present), and Fidelity Research and Analysis Company (2008-present). Previously, Mr. Goebel served as Assistant Secretary of the Funds (2007-2008) and as Vice President and Secretary of Fidelity Distributors Corporation (FDC) (2005-2007). |
William C. Coffey (40) |
| Year of Election or Appointment: 2009 Assistant Secretary of Fidelity's Equity and High Income Funds. Mr. Coffey also serves as Vice President and Associate General Counsel of FMR LLC (2005-present), and is an employee of Fidelity Investments. |
Holly C. Laurent (55) |
| Year of Election or Appointment: 2008 Anti-Money Laundering (AML) Officer of the Fidelity funds. Ms. Laurent is an employee of Fidelity Investments. Previously, Ms. Laurent was Senior Vice President and Head of Legal for Fidelity Business Services India Pvt. Ltd. (2006-2008), and Senior Vice President, Deputy General Counsel and Group Head for FMR LLC (2005-2006). |
Christine Reynolds (51) |
| Year of Election or Appointment: 2008 Chief Financial Officer of the Fidelity funds. Ms. Reynolds became President of Fidelity Pricing and Cash Management Services (FPCMS) in August 2008. Ms. Reynolds served as Chief Operating Officer of FPCMS (2007-2008). Previously, Ms. Reynolds served as President, Treasurer, and Anti-Money Laundering officer of the Fidelity funds (2004-2007). |
Kenneth A. Rathgeber (62) |
| Year of Election or Appointment: 2004 Chief Compliance Officer of Fidelity's Equity and High Income Funds. Mr. Rathgeber is Chief Compliance Officer of Fidelity Management & Research (Hong Kong) Limited (2008-present), Fidelity Management & Research (Japan) Inc. (2008-present), FMR (2005-present), FMR Co., Inc. (2005-present), Fidelity Management & Research (U.K.) Inc. (2005-present), Fidelity Research & Analysis Company (2005-present), Fidelity Investments Money Management, Inc. (2005-present), Pyramis Global Advisors, LLC (2005-present), and Strategic Advisers, Inc. (2005-present). |
Jeffrey S. Christian (48) |
| Year of Election or Appointment: 2009 Deputy Treasurer of the Fidelity funds. Mr. Christian is an employee of Fidelity Investments. Previously, Mr. Christian served as Chief Financial Officer (2008-2009) of certain Fidelity funds, Senior Vice President of Fidelity Pricing and Cash Management Services (FPCMS) (2004-2009), and as Vice President of Business Analysis (2003-2004). |
Bryan A. Mehrmann (48) |
| Year of Election or Appointment: 2005 Deputy Treasurer of the Fidelity funds. Mr. Mehrmann is an employee of Fidelity Investments. Previously, Mr. Mehrmann served as Vice President of Fidelity Investments Institutional Services Group (FIIS)/Fidelity Investments Institutional Operations Company, Inc. (FIIOC) Client Services (1998-2004). |
Adrien E. Deberghes (42) |
| Year of Election or Appointment: 2008 Deputy Treasurer of Fidelity's Equity and High Income Funds. Mr. Deberghes is an employee of Fidelity Investments (2008-present). Previously, Mr. Deberghes served as Senior Vice President of Mutual Fund Administration at State Street Corporation (2007-2008), Senior Director of Mutual Fund Administration at Investors Bank & Trust (2005-2007), and Director of Finance for Dunkin' Brands (2000-2005). |
John R. Hebble (51) |
| Year of Election or Appointment: 2009 Assistant Treasurer of Fidelity's Equity and High Income Funds. Mr. Hebble also serves as President and Treasurer of other Fidelity funds (2008-present) and is an employee of Fidelity Investments. |
Paul M. Murphy (62) |
| Year of Election or Appointment: 2007 Assistant Treasurer of the Fidelity funds. Mr. Murphy is an employee of Fidelity Investments. Previously, Mr. Murphy served as Chief Financial Officer of the Fidelity funds (2005-2006), Vice President and Associate General Counsel of FMR (2007), and Senior Vice President of Fidelity Pricing and Cash Management Services (FPCMS) (1994-2007). |
Gary W. Ryan (51) |
| Year of Election or Appointment: 2005 Assistant Treasurer of the Fidelity funds. Mr. Ryan is an employee of Fidelity Investments. Previously, Mr. Ryan served as Vice President of Fund Reporting in Fidelity Pricing and Cash Management Services (FPCMS) (1999-2005). |
Annual Report
Initial Class and Investors Class each designate 100% of each dividend distributed in December 2009, during the fiscal year as qualifying for the dividends-received deduction for corporate shareholders.
The fund will notify shareholders in January 2010 of amounts for use in preparing 2009 income tax returns.
Annual Report
Board Approval of Investment Advisory Contracts and Management Fees
VIP Telecommunications Portfolio
Each year, the Board of Trustees, including the Independent Trustees (together, the Board), votes on the renewal of the management contract and sub-advisory agreements (together, the Advisory Contracts) for the fund. The Board, assisted by the advice of fund counsel and Independent Trustees' counsel, requests and considers a broad range of information throughout the year.
The Board meets regularly and, acting directly and through its separate committees, requests and receives information concerning, and considers at each of its meetings factors that are relevant to, its annual consideration of the renewal of the fund's Advisory Contracts, including the services and support provided to the fund and its shareholders. The Board has established various standing committees, each composed of Independent Trustees with varying backgrounds, to which the Board has assigned specific subject matter responsibilities in order to enhance effective decision-making by the Board. Each committee has a written charter outlining the structure and purposes of the committee. The Board also meets as needed to consider matters specifically related to the Board's annual consideration of the renewal of Advisory Contracts.
At its July 2009 meeting, the Board of Trustees, including the Independent Trustees, unanimously determined to renew the fund's Advisory Contracts. In reaching its determination, the Board considered all factors it believed relevant, including (i) the nature, extent, and quality of the services to be provided to the fund and its shareholders (including the investment performance of the fund); (ii) the competitiveness of the fund's management fee and total expenses; (iii) the total costs of the services to be provided by and the profits to be realized by Fidelity from its relationship with the fund; (iv) the extent to which economies of scale would be realized as the fund grows; and (v) whether fee levels reflect these economies of scale, if any, for the benefit of fund shareholders.
In considering whether to renew the Advisory Contracts for the fund, the Board ultimately reached a determination, with the assistance of fund counsel and Independent Trustees' counsel and through the exercise of its business judgment, that the renewal of the Advisory Contracts and the compensation to be received by Fidelity under the management contract is consistent with Fidelity's fiduciary duty under applicable law. The Board's decision to renew the Advisory Contracts was not based on any single factor noted above, but rather was based on a comprehensive consideration of all the information provided to the Board at its meetings throughout the year. The Board, in reaching its determination to renew the Advisory Contracts, is aware that shareholders in the fund have a broad range of investment choices available to them, including a wide choice among mutual funds offered by competitors to Fidelity, and that the fund's shareholders, with the opportunity to review and weigh the disclosure provided by the fund in its prospectus and other public disclosures, have chosen to invest in this fund, managed by Fidelity.
Nature, Extent, and Quality of Services Provided. The Board considered staffing within the investment adviser, FMR, and the sub-advisers (together, the Investment Advisers), including the backgrounds of the fund's investment personnel and the fund's investment objective and discipline. The Independent Trustees also had discussions with senior management of Fidelity's investment operations and investment groups. The Board considered the structure of the portfolio manager compensation program and whether this structure provides appropriate incentives.
Resources Dedicated to Investment Management and Support Services. The Board reviewed the size, education, and experience of the Investment Advisers' investment staff, their use of technology, and the Investment Advisers' approach to recruiting, training, and retaining portfolio managers and other research, advisory, and management personnel. In response to last year's financial crisis, FMR took a number of actions intended to cut costs and improve efficiency without weakening the investment teams or resources. The Board noted that Fidelity's analysts have access to a variety of technological tools and market and securities data that enable them to perform both fundamental and quantitative analysis and to specialize in various disciplines. The Board considered Fidelity's extensive global research capabilities that enable the Investment Advisers to aggregate data from various sources in an effort to produce positive investment results. The Board also considered that Fidelity's portfolio managers and analysts have access to daily portfolio attribution that allows for monitoring of a fund's portfolio, as well as an electronic communication system that provides immediate real-time access to research concerning issuers and credit enhancers.
Shareholder and Administrative Services. The Board considered (i) the nature, extent, quality, and cost of advisory, administrative, distribution, and shareholder services performed by the Investment Advisers and their affiliates under the Advisory Contracts and under separate agreements covering transfer agency, pricing and bookkeeping, and securities lending services for the fund; (ii) the nature and extent of the Investment Advisers' supervision of third party service providers, principally custodians and subcustodians; and (iii) the resources devoted to, and the record of compliance with, the fund's compliance policies and procedures. The Board also reviewed the allocation of fund brokerage, including allocations to brokers affiliated with the Investment Advisers, the use of brokerage commissions to pay fund expenses, and the use of "soft" commission dollars to pay for research services.
The Board noted that the growth of fund assets across the complex allows Fidelity to reinvest in the development of services designed to enhance the value or convenience of the Fidelity funds as investment vehicles. These services include 24-hour access to account information and market information through phone representatives and over the Internet, and investor education materials and asset allocation tools.
Investment in a Large Fund Family. The Board considered the benefits to shareholders of investing in a Fidelity fund, including the benefits of investing in a fund that is part of a large family of funds offering a variety of investment disciplines and providing for a large variety of mutual fund investor services. The Board noted that Fidelity has taken a number of actions over the previous year that benefited particular funds, including (i) dedicating additional resources to investment research and to restructure and broaden the focus of the investment research teams; (ii) bolstering the senior management team that oversees asset management; (iii) contractually agreeing to reduce the management fee on Fidelity U.S. Bond Index Fund; and (iv) expanding Class A and Class T load waiver categories to increase rollover retention opportunities and create consistent policies across the classes.
Annual Report
Investment Performance. The Board considered whether the fund has operated within its investment objective, as well as its record of compliance with its investment restrictions. It also reviewed the fund's absolute investment performance for each class, as well as the fund's relative investment performance for each class measured against a third-party-sponsored index that reflects the market sector in which the fund invests. The Board noted that FMR does not believe that a meaningful peer group exists against which to compare the fund's performance. Because the fund had been in existence less than three calendar years, the following chart considered by the Board shows, for the one-year period ended December 31, 2008, the total returns of Initial Class and Investor Class of the fund and the total return of a third-party-sponsored index ("benchmark").
VIP Telecommunications Portfolio
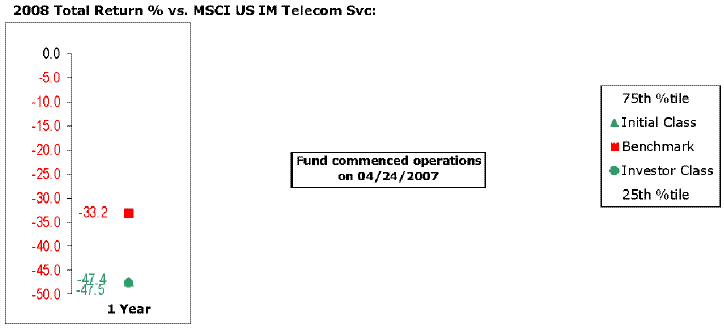
The Board stated that the investment performance of the fund was lower than its benchmark for the period shown. The Board considered that the variations in performance between the fund's classes reflect the variations in class expenses, which result in lower performance for the higher expense class. The Board stated that it is difficult to evaluate in any comprehensive fashion the performance of the fund, in light of its relatively recent commencement of operations.
The Board considered that FMR has taken steps to refocus and strengthen equity research, equity portfolio management, and compliance. The Board reviewed the year-to-date performance of Initial Class through May 31, 2009 and stated that it exceeded the fund's benchmark.
Based on its review, and giving particular weight to the nature and quality of the resources dedicated by the Investment Advisers to maintain and improve relative performance and factoring in the unprecedented market events in 2008, the Board concluded that the nature, extent, and quality of the services provided to the fund will benefit the fund's shareholders, particularly in light of the Board's view that the fund's shareholders benefit from investing in a fund that is part of a large family of funds offering a variety of investment disciplines and services.
Competitiveness of Management Fee and Total Fund Expenses. The Board considered the fund's management fee and total expenses compared to "mapped groups" of competitive funds and classes. Fidelity creates "mapped groups" by combining similar Lipper investment objective categories that have comparable management fee characteristics. Combining Lipper investment objective categories aids the Board's management fee and total expense comparisons by broadening the competitive group used for comparison and by reducing the number of universes to which various Fidelity funds are compared.
The Board considered two proprietary management fee comparisons for the 12-month (or shorter) periods shown in the chart below. The group of Lipper funds used by the Board for management fee comparisons is referred to below as the "Total Mapped Group." The Total Mapped Group comparison focuses on a fund's standing relative to the total universe of comparable funds available to investors, in terms of gross management fees before expense reimbursements or caps. "TMG %" represents the percentage of funds in the Total Mapped Group that had management fees that were lower than the fund's. For example, a TMG % of 4% means that 96% of the funds in the Total Mapped Group had higher management fees than the fund. The "Asset-Size Peer Group" (ASPG) comparison focuses on a fund's standing relative to non-Fidelity funds similar in size to the fund within the Total Mapped Group. The ASPG represents at least 15% of the funds in the Total Mapped Group with comparable asset size and management fee characteristics, subject to a minimum of 50 funds (or all funds in the Total Mapped Group if fewer than 50). Additional information, such as the ASPG quartile in which the fund's management fee ranked, is also included in the chart and considered by the Board.
Annual Report
Board Approval of Investment Advisory Contracts and Management Fees - continued
VIP Telecommunications Portfolio
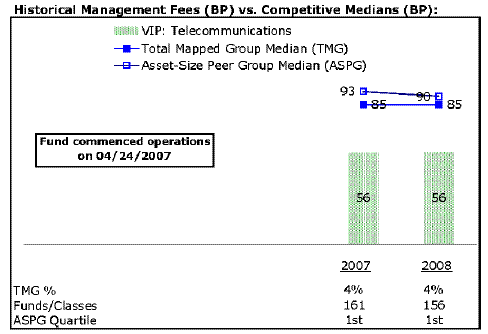
The Board noted that the fund's management fee ranked below the median of its Total Mapped Group and below the median of its ASPG for 2008.
Based on its review, the Board concluded that the fund's management fee was fair and reasonable in light of the services that the fund receives and the other factors considered.
In its review of each class's total expenses, the Board considered the fund's management fee as well as other fund or class expenses, as applicable, such as transfer agent fees, pricing and bookkeeping fees, and custodial, legal, and audit fees. The Board also noted the effects of any waivers and reimbursements on fees and expenses. As part of its review, the Board also considered current and historical total expenses of each class of the fund compared to competitive fund median expenses. Each class of the fund is compared to those funds and classes in the Total Mapped Group (used by the Board for management fee comparisons) that have a similar sales load structure.
The Board noted that the total expenses of each class ranked below its competitive median for 2008.
In its review of total expenses, the Board also considered Fidelity fee structures and other information on clients that FMR and its affiliates service in other competitive markets, such as other mutual funds advised or subadvised by FMR or its affiliates, pension plan clients, and other institutional clients.
Based on its review, the Board concluded that the total expenses of each class of the fund were reasonable in light of the services that the fund and its shareholders receive and the other factors considered.
Costs of the Services and Profitability. The Board considered the revenues earned and the expenses incurred by Fidelity in conducting the business of developing, marketing, distributing, managing, administering and servicing the fund and its shareholders. The Board also considered the level of Fidelity's profits in respect of all the Fidelity funds.
On an annual basis, FMR presents to the Board Fidelity's profitability for the fund. Fidelity calculates the profitability for each fund, as well as aggregate profitability for groups of Fidelity funds and all Fidelity funds, using a series of detailed revenue and cost allocation methodologies which originate with the audited books and records of Fidelity. The Audit Committee of the Board reviews any significant changes from the prior year's methodologies.
PricewaterhouseCoopers LLP (PwC), independent registered public accounting firm and auditor to Fidelity and certain Fidelity funds, has been engaged annually by the Board as part of the Board's assessment of Fidelity's profitability analysis. PwC's engagement includes the review and assessment of Fidelity's methodologies used in determining the revenues and expenses attributable to Fidelity's mutual fund business, and completion of agreed-upon procedures surrounding the mathematical accuracy of fund profitability and its conformity to allocation methodologies. After considering PwC's reports issued under the engagement and information provided by Fidelity, the Board believes that while other allocation methods may also be reasonable, Fidelity's profitability methodologies are reasonable in all material respects.
The Board has also reviewed Fidelity's non-fund businesses and any fall-out benefits related to the mutual fund business as well as cases where Fidelity's affiliates may benefit from or be related to the fund's business.
Annual Report
The Board considered the costs of the services provided by and the profits realized by Fidelity in connection with the operation of the fund and determined that the amount of profit is a fair entrepreneurial profit for the management of the fund.
Economies of Scale. The Board considered whether there have been economies of scale in respect of the management of the Fidelity funds, whether the Fidelity funds (including the fund) have appropriately benefited from any such economies of scale, and whether there is potential for realization of any further economies of scale. The Board considered the extent to which the fund will benefit from economies of scale through increased services to the fund, through waivers or reimbursements, or through fee or expense reductions.
In February 2009, the Board created an Ad Hoc Committee (the "Committee") to analyze economies of scale. The Committee was formed to consider whether FMR attains economies of scale in respect of the management and servicing of the Fidelity funds, whether the Fidelity funds have appropriately benefited from such economies of scale, and whether there is potential for realization of any further economies of scale.
The Board recognized that the fund's management contract incorporates a "group fee" structure, which provides for lower group fee rates as total fund assets under FMR's management increase, and for higher group fee rates as total fund assets under FMR's management decrease. FMR determines the group fee rates based on a tiered asset "breakpoint" schedule. The Board considered that the group fee is designed to deliver the benefits of economies of scale to fund shareholders when total fund assets increase, even if assets of any particular fund are unchanged or have declined, because some portion of Fidelity's costs are attributable to services provided to all Fidelity funds, and all funds benefit if those costs can be allocated among more assets. The Board concluded that, given the group fee structure, fund shareholders will achieve a certain level of economies of scale as assets under FMR's management increase at the fund complex level, regardless of whether Fidelity achieves any such economies of scale.
The Board concluded, considering the findings of the Committee, that any potential economies of scale are being shared between fund shareholders and Fidelity in an appropriate manner.
Additional Information Requested by the Board. In order to develop fully the factual basis for consideration of the Fidelity funds' Advisory Contracts, the Board requested and received additional information on certain topics, including (i) fund performance trends, actions to be taken by FMR to improve certain funds' overall performance and Fidelity's long-term strategies for certain funds; (ii) portfolio manager changes that have occurred during the past year; (iii) Fidelity's compensation structure for portfolio managers and key personnel, including performance benchmarks used by Fidelity in evaluating incentive compensation for portfolio managers and research analysts; (iv) the structure and process of equity research and actions taken by FMR to improve the quality of research; (v) the selection of and compensation paid by FMR to fund sub-advisers; (vi) Fidelity's fee structures and rationale for recommending different fees among categories of funds; (vii) the rationale for any differences between fund fee structures and fee structures in place for other Fidelity clients; (viii) Fidelity's rationale for recommending which funds should have a performance adjustment component as part of their management fees; and (ix) explanations for the relative total expenses borne by certain funds and classes, total expense competitive trends, and actions that might be taken by FMR to reduce total expenses for certain funds and classes.
Based on its evaluation of all of the conclusions noted above, and after considering all material factors, the Board ultimately concluded that the advisory fee structures are fair and reasonable, and that the fund's Advisory Contracts should be renewed.
Annual Report
Investment Adviser
Fidelity Management & Research Company
Boston, MA
Investment Sub-Advisers
FMR Co., Inc.
Fidelity Management & Research (U.K.) Inc.
Fidelity Research & Analysis Company
FIL Investments (Japan) Limited
FIL Investment Advisors
FIL Investment Advisors (U.K.) Ltd.
Fidelity Management & Research (Hong Kong)
Limited
Fidelity Management & Research (Japan) Inc.
General Distributor
Fidelity Distributors Corporation
Boston, MA
Transfer and Service Agents
Fidelity Investments Institutional Operations Company, Inc.
Boston, MA
Fidelity Service Company, Inc.
Boston, MA
Custodian
State Street Bank and Trust Company
Quincy, MA
VTELP-ANN-0210
1.851004.102
Fidelity® Variable Insurance Products:
Utilities Portfolio
Annual Report
December 31, 2009
(2_fidelity_logos) (Registered_Trademark)
Contents
Performance | <Click Here> | How the fund has done over time. |
Management's Discussion | <Click Here> | The manager's review of fund performance, strategy and outlook. |
Shareholder Expense Example | <Click Here> | An example of shareholder expenses. |
Investment Changes | <Click Here> | A summary of major shifts in the fund's investments over the past six months. |
Investments | <Click Here> | A complete list of the fund's investments with their market values. |
Financial Statements | <Click Here> | Statements of assets and liabilities, operations, and changes in net assets, as well as financial highlights. |
Notes | <Click Here> | Notes to the financial statements. |
Report of Independent Registered Public Accounting Firm | <Click Here> | |
Trustees and Officers | <Click Here> | |
Distributions | <Click Here> | |
Board Approval of Investment Advisory Contracts and Management Fees | <Click Here> | |
To view a fund's proxy voting guidelines and proxy voting record for the 12-month period ended June 30, visit http://www.fidelity.com/proxyvotingresults or visit the Securities and Exchange Commission's (SEC) web site at http://www.sec.gov. You may also call 1-877-208-0098 to request a free copy of the proxy voting guidelines.
Fidelity Variable Insurance Products are separate account options which are purchased through a variable insurance contract.
Standard & Poor's, S&P and S&P 500 are registered service marks of The McGraw-Hill Companies, Inc. and have been licensed for use by Fidelity Distributors Corporation.
Other third party marks appearing herein are the property of their respective owners.
All other marks appearing herein are registered or unregistered trademarks or service marks of FMR LLC or an affiliated company.
This report and the financial statements contained herein are submitted for the general information of the shareholders of the fund. This report is not authorized for distribution to prospective investors in the fund unless preceded or accompanied by an effective prospectus.
A fund files its complete schedule of portfolio holdings with the SEC for the first and third quarters of each fiscal year on Form N-Q. Forms N-Q are available on the SEC's web site at http://www.sec.gov. A fund's Forms N-Q may be reviewed and copied at the SEC's Public Reference Room in Washington, DC. Information regarding the operation of the SEC's Public Reference Room may be obtained by calling 1-800-SEC-0330. For a complete list of the fund's portfolio holdings, view the most recent holdings listing, semiannual report, or annual report on Fidelity's web site at http://www.fidelity.com or http://www.advisor.fidelity.com, as applicable.
NOT FDIC INSURED · MAY LOSE VALUE · NO BANK GUARANTEE
Neither the fund nor Fidelity Distributors Corporation is a bank.
Annual Report
Average annual total return reflects the change in the value of an investment, assuming reinvestment of the class' dividend income and capital gains (the profits earned upon the sale of securities that have grown in value, if any) and assuming a constant rate of performance each year. During periods of reimbursement by Fidelity, a fund's total return will be greater than it would be had the reimbursement not occurred. Performance numbers are net of all underlying fund operating expenses, but do not include any insurance charges imposed by your insurance company's separate account. If performance information included the effect of these additional charges, the total returns would have been lower. How a fund did yesterday is no guarantee of how it will do tomorrow.
Average Annual Total Returns
Periods ended December 31, 2009 | Past 1
year | Past 5
years | Life of fund A |
VIP Utilities - Initial Class C | 15.42% | 5.30% | 2.46% |
VIP Utilities - Investor ClassB,C | 15.24% | 5.18% | 2.39% |
A From July 19, 2001.
B The initial offering of Investor Class shares took place on July 21, 2005. Returns prior to July 21, 2005 are those of Initial Class. Had Investor Class's transfer agent fee been reflected, returns prior to July 21, 2005, would have been lower.
C Prior to October 1, 2006, VIP Utilities Portfolio operated under certain different investment policies. The historical performance for the fund may not represent its current investment policies.
$10,000 Over Life of Fund
Let's say hypothetically that $10,000 was invested in VIP Utilities Portfolio - Initial Class on July 19, 2001, when the fund started. The chart shows how the value of your investment would have changed, and also shows how the Standard & Poor's 500SM Index (S&P 500®) performed over the same period.
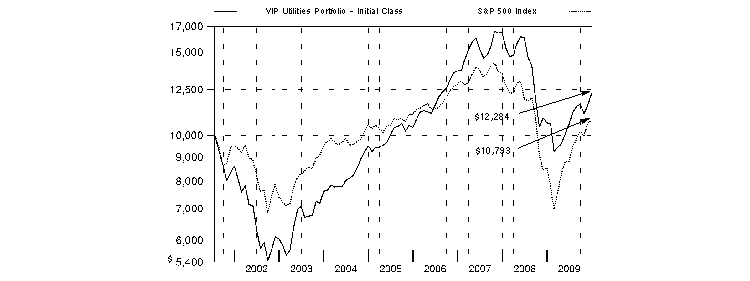
Annual Report
Market Recap: In 2009, most global markets saw both crippling lows and considerable highs. After a dismal start, the economy began to show signs of improvement, suggesting that a recovery was on the horizon. Credit markets began to heal as fiscal and monetary stimulus efforts around the world started to take effect, and corporate earnings staged an impressive rebound, fueled in large part by massive cost cutting. As a result, the flight to quality that marked most of 2008 and early 2009 shifted in March as investors flocked to riskier asset categories. The U.S. equity market, as measured by the bellwether Standard & Poor's 500SM Index and the blue-chip proxy Dow Jones Industrial AverageSM, reflected this changing environment, gaining 26.46% and 22.68%, respectively. Meanwhile, the technology-laden Nasdaq Composite® Index rose 45.32%. Foreign stocks also produced strong gains, as illustrated by the 31.93% jump of the MSCI® EAFE® Index (Europe, Australasia, Far East), a gauge of developed stock markets outside the U.S. and Canada. Emerging-markets stocks, which suffered their worst calendar-year performance ever in 2008, posted record returns this past year, with the MSCI Emerging Markets Index soaring 79.02%. A depreciating U.S. dollar helped bolster returns for U.S. investors in foreign equities.
Comments from Douglas Simmons, Portfolio Manager of VIP Utilities Portfolio: For the year ending December 31, 2009, the fund solidly outperformed the 11.70% return of the MSCI® U.S. Investable Market Utilities Index but underperformed the S&P 500®. (For specific portfolio results, please refer to the performance section of this report.) Strong stock selection within multi-utilities and independent power/energy trade were the two main factors that helped the portfolio outperform the MSCI index. The fund also benefited from overweighting the latter group. On the downside, the fund was hurt by less-favorable security selection and an underweighting in the outperforming gas utilities industry. Contributions to relative performance came from investments in Maryland-based independent power producer Constellation Energy Group; TECO Energy, a multi-utility located in Florida; and CMS Energy and CenterPoint Energy, multi-utilities that operate in Mississippi and Houston, respectively. The fund also benefited from underweighting two electric utilities and index components that underperformed, Exelon in Chicago and Southern Company in Atlanta. Detractors included Allegheny Energy, an electric utility in Pennsylvania, Florida-based electric utility FPL Group and untimely ownership of three stocks: Virginia-headquartered multi-utility Dominion Resources; Duke Energy, an electric utility in North Carolina; and RRI Energy, an independent power producer located in Houston. Some stocks mentioned here were not held at period end.
Note to shareholders: In January 2010, Fidelity adopted capped benchmarks for most of its sector and industry funds, including the VIP sector portfolios. The capped benchmarks, which limit the weightings of individual issuers, better represent the investment opportunities available to the funds and will provide shareholders with more-meaningful performance comparisons. These changes do not affect the investment policies of any of the funds, and the primary benchmark for all of the funds remains the Standard & Poor's 500 Index.
The views expressed above reflect those of the portfolio manager(s) only through the end of the period as stated on the cover of this report and do not necessarily represent the views of Fidelity or any other person in the Fidelity organization. Any such views are subject to change at any time based upon market or other conditions and Fidelity disclaims any responsibility to update such views. These views may not be relied on as investment advice and, because investment decisions for a Fidelity fund are based on numerous factors, may not be relied on as an indication of trading intent on behalf of any Fidelity fund.
Annual Report
As a shareholder of the Fund, you incur two types of costs: (1) transaction costs, including redemption fees, and (2) ongoing costs, including management fees and other Fund expenses. This Example is intended to help you understand your ongoing costs (in dollars) of investing in the Fund and to compare these costs with the ongoing costs of investing in other mutual funds.
The Example is based on an investment of $1,000 invested at the beginning of the period and held for the entire period (July 1, 2009 to December 31, 2009).
Actual Expenses
The first line of the accompanying table for each class of the Fund provides information about actual account values and actual expenses. You may use the information in this line, together with the amount you invested, to estimate the expenses that you paid over the period. Simply divide your account value by $1,000.00 (for example, an $8,600 account value divided by $1,000.00 = 8.6), then multiply the result by the number in the first line for a class of the Fund under the heading entitled "Expenses Paid During Period" to estimate the expenses you paid on your account during this period. The estimate of expenses does not include any fees or other expenses of any variable annuity or variable life insurance product. If they were, the estimate of expenses you paid during the period would be higher, and your ending account value would be lower. In addition, the Fund, as a shareholder in the underlying Fidelity Central Funds, will indirectly bear its pro-rata share of the fees and expenses incurred by the underlying Fidelity Central Funds. These fees and expenses are not included in the Fund's annualized expense ratio used to calculate the expense estimate in the table below.
Hypothetical Example for Comparison Purposes
The second line of the accompanying table for each class of the Fund provides information about hypothetical account values and hypothetical expenses based on a Class' actual expense ratio and an assumed rate of return of 5% per year before expenses, which is not the Class' actual return. The hypothetical account values and expenses may not be used to estimate the actual ending account balance or expenses you paid for the period. You may use this information to compare the ongoing costs of investing in the Fund and other funds. To do so, compare this 5% hypothetical example with the 5% hypothetical examples that appear in the shareholder reports of the other funds. The estimate of expenses does not include any fees or other expenses of any variable annuity or variable life insurance product. If they were, the estimate of expenses you paid during the period would be higher, and your ending account value would be lower. In addition, the Fund, as a shareholder in the underlying Fidelity Central Funds, will indirectly bear its pro-rata share of the fees and expenses incurred by the underlying Fidelity Central Funds. These fees and expenses are not included in the Fund's annualized expense ratio used to calculate the expense estimate in the table below.
Please note that the expenses shown in the table are meant to highlight your ongoing costs only and do not reflect any transaction costs. Therefore, the second line of the table is useful in comparing ongoing costs only, and will not help you determine the relative total costs of owning different funds. In addition, if these transactional costs were included, your costs would have been higher.
| Annualized Expense Ratio | Beginning
Account Value
July 1, 2009 | Ending
Account Value
December 31, 2009 | Expenses Paid
During Period*
July 1, 2009 to December 31, 2009 |
Initial Class | .80% | | | |
Actual | | $ 1,000.00 | $ 1,161.30 | $ 4.36 |
HypotheticalA | | $ 1,000.00 | $ 1,021.17 | $ 4.08 |
Investor Class | .90% | | | |
Actual | | $ 1,000.00 | $ 1,160.90 | $ 4.90 |
HypotheticalA | | $ 1,000.00 | $ 1,020.67 | $ 4.58 |
A 5% return per year before expenses
* Expenses are equal to each Class' annualized expense ratio, multiplied by the average account value over the period, multiplied by 184/365 (to reflect the one-half year period).
Annual Report
Investment Changes (Unaudited)
Top Ten Stocks as of December 31, 2009 |
| % of fund's
net assets | % of fund's net assets
6 months ago |
FPL Group, Inc. | 9.3 | 4.8 |
FirstEnergy Corp. | 8.7 | 9.7 |
PG&E Corp. | 8.5 | 4.5 |
American Electric Power Co., Inc. | 8.5 | 13.4 |
Entergy Corp. | 5.8 | 6.0 |
CenterPoint Energy, Inc. | 5.0 | 5.3 |
Wisconsin Energy Corp. | 5.0 | 1.1 |
CMS Energy Corp. | 4.9 | 2.3 |
Constellation Energy Group, Inc. | 4.9 | 7.5 |
TECO Energy, Inc. | 4.9 | 4.7 |
| 65.5 | |
Top Industries (% of fund's net assets) |
As of December 31, 2009 |
| Electric Utilities | 41.7% | |
| Multi-Utilities | 40.0% | |
| Independent
Power Producers
& Energy Traders | 14.0% | |
| Water Utilities | 1.8% | |
| Electronic
Equipment & Components | 1.5% | |
| All Others* | 1.0% | |

As of June 30, 2009 |
| Electric Utilities | 49.2% | |
 | Multi-Utilities | 25.2% | |
 | Independent
Power Producers
& Energy Traders | 18.6% | |
| Gas Utilities | 2.1% | |
| All Others* | 4.9% | |

* Includes short-term investments and net other assets. |
Annual Report
Investments December 31, 2009
Showing Percentage of Net Assets
Common Stocks - 100.0% |
| Shares | | Value |
CHEMICALS - 0.5% |
Commodity Chemicals - 0.5% |
Calgon Carbon Corp. (a) | 14,200 | | $ 197,380 |
COMMERCIAL SERVICES & SUPPLIES - 0.5% |
Diversified Support Services - 0.5% |
EnerNOC, Inc. (a) | 7,400 | | 224,886 |
ELECTRIC UTILITIES - 41.7% |
Electric Utilities - 41.7% |
Allegheny Energy, Inc. | 17,700 | | 415,596 |
American Electric Power Co., Inc. | 99,021 | | 3,444,941 |
Entergy Corp. | 28,849 | | 2,361,002 |
FirstEnergy Corp. | 76,445 | | 3,550,870 |
FPL Group, Inc. | 71,400 | | 3,771,348 |
Hawaiian Electric Industries, Inc. (c) | 26,976 | | 563,798 |
ITC Holdings Corp. | 26,621 | | 1,386,688 |
Pepco Holdings, Inc. | 22,800 | | 384,180 |
Pinnacle West Capital Corp. | 26,565 | | 971,748 |
PNM Resources, Inc. | 6,300 | | 79,695 |
| | 16,929,866 |
ELECTRONIC EQUIPMENT & COMPONENTS - 1.5% |
Electronic Equipment & Instruments - 1.5% |
Itron, Inc. (a) | 9,141 | | 617,657 |
INDEPENDENT POWER PRODUCERS & ENERGY TRADERS - 14.0% |
Independent Power Producers & Energy Traders - 14.0% |
Adani Power Ltd. | 33,065 | | 70,533 |
AES Corp. | 87,045 | | 1,158,569 |
Calpine Corp. (a) | 118,700 | | 1,305,700 |
Constellation Energy Group, Inc. | 56,700 | | 1,994,139 |
Dynegy, Inc. Class A (a) | 116,300 | | 210,503 |
NRG Energy, Inc. (a) | 39,600 | | 934,956 |
| | 5,674,400 |
MULTI-UTILITIES - 40.0% |
Multi-Utilities - 40.0% |
Alliant Energy Corp. | 30,000 | | 907,800 |
|
| Shares | | Value |
CenterPoint Energy, Inc. | 138,400 | | $ 2,008,184 |
Centrica PLC | 188,600 | | 856,809 |
CMS Energy Corp. (c) | 127,400 | | 1,995,084 |
DTE Energy Co. | 33,800 | | 1,473,342 |
PG&E Corp. | 77,245 | | 3,448,989 |
Sempra Energy | 27,700 | | 1,550,646 |
TECO Energy, Inc. | 122,800 | | 1,991,816 |
Wisconsin Energy Corp. | 40,300 | | 2,008,149 |
| | 16,240,819 |
WATER UTILITIES - 1.8% |
Water Utilities - 1.8% |
American Water Works Co., Inc. | 32,800 | | 735,048 |
TOTAL COMMON STOCKS (Cost $37,170,984) | 40,620,056 |
Money Market Funds - 7.2% |
| | | |
Fidelity Cash Central Fund, 0.16% (d) | 398,386 | | 398,386 |
Fidelity Securities Lending Cash Central Fund, 0.15% (b)(d) | 2,515,275 | | 2,515,275 |
TOTAL MONEY MARKET FUNDS (Cost $2,913,661) | 2,913,661 |
TOTAL INVESTMENT PORTFOLIO - 107.2% (Cost $40,084,645) | | 43,533,717 |
NET OTHER ASSETS - (7.2)% | | (2,923,400) |
NET ASSETS - 100% | $ 40,610,317 |
Legend |
(a) Non-income producing |
(b) Investment made with cash collateral received from securities on loan. |
(c) Security or a portion of the security is on loan at period end. |
(d) Affiliated fund that is available only to investment companies and other accounts managed by Fidelity Investments. The rate quoted is the annualized seven-day yield of the fund at period end. A complete unaudited listing of the fund's holdings as of its most recent quarter end is available upon request. |
Affiliated Central Funds |
Information regarding fiscal year to date income earned by the Fund from investments in Fidelity Central Funds is as follows: |
Fund | Income earned |
Fidelity Cash Central Fund | $ 2,320 |
Fidelity Securities Lending Cash Central Fund | 1,871 |
Total | $ 4,191 |
Other Information |
All investments are categorized as Level 1 under the Fair Value Hierarchy. The inputs or methodology used for valuing securities may not be an indication of the risk associated with investing in those securities. For more information on valuation inputs, please refer to the Security Valuation section in the accompanying Notes to Financial Statements. |
Income Tax Information |
At December 31, 2009, the Fund had a capital loss carryforward of approximately $13,093,363 of which $3,279,978 and $9,813,385 will expire on December 31, 2016 and 2017, respectively. |
See accompanying notes which are an integral part of the financial statements.
Annual Report
Statement of Assets and Liabilities
| December 31, 2009 |
Assets | | |
Investment in securities, at value (including securities loaned of $2,392,190) - See accompanying schedule: Unaffiliated issuers (cost $37,170,984) | $ 40,620,056 | |
Fidelity Central Funds (cost $2,913,661) | 2,913,661 | |
Total Investments (cost $40,084,645) | | $ 43,533,717 |
Receivable for investments sold | | 95,735 |
Receivable for fund shares sold | | 556 |
Dividends receivable | | 79,272 |
Distributions receivable from Fidelity Central Funds | | 415 |
Prepaid expenses | | 191 |
Other receivables | | 2,063 |
Total assets | | 43,711,949 |
| | |
Liabilities | | |
Payable for investments purchased | $ 483,116 | |
Payable for fund shares redeemed | 47,402 | |
Accrued management fee | 18,596 | |
Other affiliated payables | 4,606 | |
Other payables and accrued expenses | 32,637 | |
Collateral on securities loaned, at value | 2,515,275 | |
Total liabilities | | 3,101,632 |
| | |
Net Assets | | $ 40,610,317 |
Net Assets consist of: | | |
Paid in capital | | $ 52,136,568 |
Accumulated undistributed net realized gain (loss) on investments and foreign currency transactions | | (14,975,323) |
Net unrealized appreciation (depreciation) on investments | | 3,449,072 |
Net Assets | | $ 40,610,317 |
Statement of Assets and Liabilities - continued
| December 31, 2009 |
Initial Class:
Net Asset Value, offering price and redemption price per share ($24,158,797 ÷ 2,655,101 shares) | | $ 9.10 |
| | |
Investor Class:
Net Asset Value, offering price and redemption price per share ($16,451,520 ÷ 1,814,180 shares) | | $ 9.07 |
See accompanying notes which are an integral part of the financial statements.
Annual Report
Statement of Operations
| Year ended December 31, 2009 |
| | |
Investment Income | | |
Dividends | | $ 1,584,248 |
Interest | | 1,694 |
Income from Fidelity Central Funds | | 4,191 |
Total income | | 1,590,133 |
Expenses | | |
Management fee | $ 228,695 | |
Transfer agent fees | 54,509 | |
Accounting and security lending fees | 15,936 | |
Custodian fees and expenses | 5,906 | |
Independent trustees' compensation | 301 | |
Audit | 35,371 | |
Legal | 258 | |
Miscellaneous | 3,754 | |
Total expenses before reductions | 344,730 | |
Expense reductions | (6,846) | 337,884 |
Net investment income (loss) | | 1,252,249 |
Realized and Unrealized Gain (Loss) Net realized gain (loss) on: | | |
Investment securities: | | |
Unaffiliated issuers | (6,870,222) | |
Foreign currency transactions | 300 | |
Total net realized gain (loss) | | (6,869,922) |
Change in net unrealized appreciation (depreciation) on investment securities | | 10,129,353 |
Net gain (loss) | | 3,259,431 |
Net increase (decrease) in net assets resulting from operations | | $ 4,511,680 |
Statement of Changes in Net Assets
| Year ended
December 31, 2009 | Year ended
December 31, 2008 |
Increase (Decrease) in Net Assets | | |
Operations | | |
Net investment income (loss) | $ 1,252,249 | $ 1,515,249 |
Net realized gain (loss) | (6,869,922) | (7,922,274) |
Change in net unrealized appreciation (depreciation) | 10,129,353 | (28,563,857) |
Net increase (decrease) in net assets resulting from operations | 4,511,680 | (34,970,882) |
Distributions to shareholders from net investment income | (1,275,840) | (1,542,657) |
Distributions to shareholders from net realized gain | - | (278,438) |
Total distributions | (1,275,840) | (1,821,095) |
Share transactions - net increase (decrease) | (12,914,534) | (39,256,959) |
Redemption fees | 10,970 | 25,756 |
Total increase (decrease) in net assets | (9,667,724) | (76,023,180) |
| | |
Net Assets | | |
Beginning of period | 50,278,041 | 126,301,221 |
End of period | $ 40,610,317 | $ 50,278,041 |
See accompanying notes which are an integral part of the financial statements.
Annual Report
Financial Highlights - Initial Class
Years ended December 31, | 2009 | 2008 | 2007 | 2006 | 2005 |
Selected Per-Share Data | | | | | |
Net asset value, beginning of period | $ 8.14 | $ 13.09 | $ 11.29 | $ 9.53 | $ 9.14 |
Income from Investment Operations | | | | | |
Net investment income (loss) C | .25 | .20 | .21 | .24 | .17 |
Net realized and unrealized gain (loss) | 1.01 | (4.86) | 2.12 | 2.76 | .71 |
Total from investment operations | 1.26 | (4.66) | 2.33 | 3.00 | .88 |
Distributions from net investment income | (.30) | (.26) | (.25) | (.14) | (.19) |
Distributions from net realized gain | - | (.03) | (.29) | (1.10) | (.30) |
Total distributions | (.30) | (.29) | (.54) | (1.24) I | (.49) H |
Redemption fees added to paid in capital C | - G | - G | .01 | - G | - G |
Net asset value, end of period | $ 9.10 | $ 8.14 | $ 13.09 | $ 11.29 | $ 9.53 |
Total Return A, B | 15.42% | (35.61)% | 20.67% | 31.79% | 9.54% |
Ratios to Average Net Assets D, F | | | | | |
Expenses before reductions | .81% | .75% | .73% | .81% | .83% |
Expenses net of fee waivers, if any | .81% | .75% | .73% | .81% | .83% |
Expenses net of all reductions | .79% | .74% | .73% | .80% | .80% |
Net investment income (loss) | 3.13% | 1.81% | 1.65% | 2.20% | 1.81% |
Supplemental Data | | | | | |
Net assets, end of period (000 omitted) | $ 24,159 | $ 31,760 | $ 84,105 | $ 77,153 | $ 36,444 |
Portfolio turnover rate E | 219% | 112% | 90% | 139% | 100% |
A Total returns do not reflect charges attributable to your insurance company's separate account. Inclusion of these charges would reduce the total returns shown. B Total returns would have been lower had certain expenses not been reduced during the periods shown. C Calculated based on average shares outstanding during the period. D Fees and expenses of the underlying Fidelity Central Funds are not included in the Fund's expense ratio. The Fund indirectly bears its proportionate share of the expenses of any underlying Fidelity Central Funds. E Amount does not include the portfolio activity of any underlying Fidelity Central Funds. F Expense ratios reflect operating expenses of the class. Expenses before reductions do not reflect amounts reimbursed by the investment adviser or reductions from brokerage service arrangements or reductions from other expense offset arrangements and do not represent the amount paid by the class during periods when reimbursements or reductions occur. Expenses net of fee waivers reflect expenses after reimbursement by the investment adviser but prior to reductions from brokerage service arrangements or other expense offset arrangements. Expenses net of all reductions represent the net expenses paid by the class. G Amount represents less than $.01 per share. H Total distributions of $.49 per share is comprised of distributions from net investment income of $.193 and distributions from net realized gain of $.295 per share. I Total distributions of $1.24 per share is comprised of distributions from net investment income of $.139 and distributions from net realized gain of $1.105 per share. |
Financial Highlights - Investor Class
Years ended December 31, | 2009 | 2008 | 2007 | 2006 | 2005 H |
Selected Per-Share Data | | | | | |
Net asset value, beginning of period | $ 8.12 | $ 13.05 | $ 11.26 | $ 9.52 | $ 9.72 |
Income from Investment Operations | | | | | |
Net investment income (loss) E | .25 | .19 | .19 | .23 | .05 |
Net realized and unrealized gain (loss) | .99 | (4.84) | 2.12 | 2.75 | .24 |
Total from investment operations | 1.24 | (4.65) | 2.31 | 2.98 | .29 |
Distributions from net investment income | (.29) | (.25) | (.24) | (.13) | (.20) |
Distributions from net realized gain | - | (.03) | (.29) | (1.10) | (.30) |
Total distributions | (.29) | (.28) | (.53) | (1.24) L | (.49) K |
Redemption fees added to paid in capital E | - J | - J | .01 | - J | - J |
Net asset value, end of period | $ 9.07 | $ 8.12 | $ 13.05 | $ 11.26 | $ 9.52 |
Total Return B, C, D | 15.24% | (35.65)% | 20.53% | 31.56% | 2.94% |
Ratios to Average Net Assets F, I | | | | | |
Expenses before reductions | .92% | .84% | .84% | .96% | 1.16% A |
Expenses net of fee waivers, if any | .92% | .84% | .84% | .96% | 1.16% A |
Expenses net of all reductions | .90% | .84% | .84% | .96% | 1.12% A |
Net investment income (loss) | 3.02% | 1.72% | 1.53% | 2.04% | 1.09% A |
Supplemental Data | | | | | |
Net assets, end of period (000 omitted) | $ 16,452 | $ 18,518 | $ 42,196 | $ 18,889 | $ 1,150 |
Portfolio turnover rate G | 219% | 112% | 90% | 139% | 100% |
A Annualized B Total returns for periods of less than one year are not annualized. C Total returns do not reflect charges attributable to your insurance company's separate account. Inclusion of these charges would reduce the total returns shown. D Total returns would have been lower had certain expenses not been reduced during the periods shown. E Calculated based on average shares outstanding during the period. F Fees and expenses of the underlying Fidelity Central Funds are not included in the Fund's expense ratio. The Fund indirectly bears its proportionate share of the expenses of any underlying Fidelity Central Funds. G Amount does not include the portfolio activity of any underlying Fidelity Central Funds. H For the period July 21, 2005 (commencement of sale of shares) to December 31, 2005. I Expense ratios reflect operating expenses of the class. Expenses before reductions do not reflect amounts reimbursed by the investment adviser or reductions from brokerage service arrangements or reductions from other expense offset arrangements and do not represent the amount paid by the class during periods when reimbursements or reductions occur. Expense ratios before reductions for start-up periods may not be representative of longer-term operating periods. Expenses net of fee waivers reflect expenses after reimbursement by the investment adviser but prior to reductions from brokerage service arrangements or other expense offset arrangements. Expenses net of all reductions represent the net expenses paid by the class. J Amount represents less than $.01 per share. K Total distributions of $.49 per share is comprised of distributions from net investment income of $.196 and distributions from net realized gain of $.295 per share. L Total distributions of $1.24 per share is comprised of distributions from net investment income of $.134 and distributions from net realized gain of $1.105 per share. |
See accompanying notes which are an integral part of the financial statements.
Fund Name/Sector
Notes to Financial Statements
For the period ended December 31, 2009
1. Organization.
VIP Utilities Portfolio (the Fund) is a non-diversified fund of Variable Insurance Products Fund IV (the trust) and is authorized to issue an unlimited number of shares. The trust is registered under the Investment Company Act of 1940, as amended (the 1940 Act), as an open-end management investment company organized as a Massachusetts business trust. Shares of the Fund may only be purchased by insurance companies for the purpose of funding variable annuity or variable life insurance contracts. The Fund offers the following classes of shares: Initial Class shares and Investor Class shares. All classes have equal rights and voting privileges, except for matters affecting a single class. Investment income, realized and unrealized capital gains and losses, the common expenses of the Fund, and certain fund-level expense reductions, if any, are allocated on a pro-rata basis to each class based on the relative net assets of each class to the total net assets of the Fund. Each class differs with respect to transfer agent fees incurred. Certain expense reductions also differ by class.
2. Investments in Fidelity Central Funds.
The Fund may invest in Fidelity Central Funds, which are open-end investment companies available only to other investment companies and accounts managed by Fidelity Management & Research Company (FMR) and its affiliates. The Fund's Schedule of Investments lists each of the Fidelity Central Funds held as of period end, if any, as an investment of the Fund, but does not include the underlying holdings of each Fidelity Central Fund. As an Investing Fund, the Fund indirectly bears its proportionate share of the expenses of the underlying Fidelity Central Funds.
The Money Market Central Funds seek preservation of capital and current income and are managed by Fidelity Investments Money Management, Inc. (FIMM), an affiliate of FMR.
A complete unaudited list of holdings for each Fidelity Central Fund is available upon request or at the Securities and Exchange Commission (the SEC) web site at www.sec.gov. In addition, the financial statements of the Fidelity Central Funds, which are not covered by the Fund's Report of Independent Registered Public Accounting Firm, are available on the SEC web site or upon request.
3. Significant Accounting Policies.
The financial statements have been prepared in conformity with accounting principles generally accepted in the United States of America, which require management to make certain estimates and assumptions at the date of the financial statements. Actual results could differ from those estimates. Events or transactions occurring after period end through the date that the financial statements were issued, February 12, 2010, have been evaluated in the preparation of the financial statements. The following summarizes the significant accounting policies of the Fund:
Security Valuation. Investments are valued as of 4:00 p.m. Eastern time on the last calendar day of the period. The Fund uses independent pricing services approved by the Board of Trustees to value its investments. When current market prices or quotations are not readily available or reliable, valuations may be determined in good faith in accordance with procedures adopted by the Board of Trustees. Factors used in determining value may include significant market or security specific events. The frequency with which these procedures are used cannot be predicted and may be utilized to a significant extent. The value used for net asset value (NAV) calculation under these procedures may differ from published prices for the same securities.
The Fund categorizes the inputs to valuation techniques used to value its investments into a disclosure hierarchy consisting of three levels as shown below.
Level 1 - quoted prices in active markets for identical investments
Level 2 - other significant observable inputs (including quoted prices for similar investments, interest rates, prepayment speeds, etc.)
Level 3 - unobservable inputs (including the fund's own assumptions based on the best information available)
Changes in valuation techniques may result in transfers in or out of an assigned level within the disclosure hierarchy. The aggregate value of investments by input level, as of December 31, 2009 is included at the end of the Fund's Schedule of Investments. Valuation techniques used to value the Fund's investments by major category are as follows.
Equity securities, including restricted securities, for which market quotations are readily available, are valued at the last reported sale price or official closing price as reported by an independent pricing service on the primary market or exchange on which they are traded and are categorized as level 1 in the hierarchy. In the event there were no sales during the day or closing prices are not available, securities are valued at the last quoted bid price or may be valued using the last available price and categorized as Level 2 in the hierarchy. For foreign equity securities, when significant market or security events arise, comparisons to the valuation of American Depository Receipts (ADRs), futures contracts, exchange-traded funds (ETFs) and certain indexes as well as quoted prices for similar securities are used and are categorized as Level 2 in the hierarchy in these circumstances. For restricted securities and private placements where observable inputs are limited, assumptions about market activity and risk are used and are categorized as level 3 in the hierarchy.
Annual Report
Notes to Financial Statements - continued
3. Significant Accounting Policies - continued
Security Valuation - continued
Investments in open-end mutual funds, including the Fidelity Money Market Central Funds, are valued at their closing net asset value each business day and are categorized as Level 1 in the hierarchy. Short-term securities with remaining maturities of sixty days or less for which quotations are not readily available are valued at amortized cost, which approximates value and are categorized as level 2 in the hierarchy.
Foreign Currency. The Fund uses foreign currency contracts to facilitate transactions in foreign-denominated securities. Losses from these transactions may arise from changes in the value of the foreign currency or if the counterparties do not perform under the contracts' terms.
Foreign-denominated assets, including investment securities, and liabilities are translated into U.S. dollars at the exchange rate at period end. Purchases and sales of investment securities, income and dividends received and expenses denominated in foreign currencies are translated into U.S. dollars at the exchange rate in effect on the transaction date.
The effects of exchange rate fluctuations on investments are included with the net realized and unrealized gain (loss) on investment securities. Other foreign currency transactions resulting in realized and unrealized gain (loss) are disclosed separately.
Investment Transactions and Income. For financial reporting purposes, the Fund's investment holdings and NAV include trades executed through the end of the last business day of the period. The NAV per share for processing shareholder transactions is calculated as of the close of business of the New York Stock Exchange (NYSE), normally 4:00 p.m. Eastern time and includes trades executed through the end of the prior business day. Gains and losses on securities sold are determined on the basis of identified cost and may include proceeds received from litigation. Dividend income is recorded on the ex-dividend date, except for certain dividends from foreign securities where the ex-dividend date may have passed, which are recorded as soon as the Fund is informed of the ex-dividend date. Non-cash dividends included in dividend income, if any, are recorded at the fair market value of the securities received. Distributions received on securities that represent a return of capital or capital gain are recorded as a reduction of cost of investments and/or as a realized gain. The Fund estimates the components of distributions received that may be considered return of capital distributions or capital gain distributions. Interest income and distributions from the Fidelity Central Funds are accrued as earned. Interest income includes coupon interest and amortization of premium and accretion of discount on debt securities. Investment income is recorded net of foreign taxes withheld where recovery of such taxes is uncertain.
Expenses. Most expenses of the trust can be directly attributed to a fund. Expenses which cannot be directly attributed are apportioned among each Fund in the trust. Expense estimates are accrued in the period to which they relate and adjustments are made when actual amounts are known.
Income Tax Information and Distributions to Shareholders. Each year, the Fund intends to qualify as a regulated investment company by distributing substantially all of its taxable income and realized gains under Subchapter M of the Internal Revenue Code and filing its U.S. federal tax return. As a result, no provision for income taxes is required. As of December 31, 2009, the Fund did not have any unrecognized tax benefits in the accompanying financial statements. A Fund's federal tax return is subject to examination by the Internal Revenue Service (IRS) for a period of three years. Foreign taxes are provided for based on the Fund's understanding of the tax rules and rates that exist in the foreign markets in which it invests.
Distributions are recorded on the ex-dividend date. Income dividends and capital gain distributions are declared separately for each class. Income and capital gain distributions are determined in accordance with income tax regulations, which may differ from generally accepted accounting principles.
Capital accounts within the financial statements are adjusted for permanent book-tax differences. These adjustments have no impact on net assets or the results of operations. Temporary book-tax differences will reverse in a subsequent period.
Book-tax differences are primarily due to the short-term gain distributions from the Fidelity Central Funds, foreign currency transactions, market discount, capital loss carryforwards and losses deferred due to wash sales and excise tax regulations.
The federal tax cost of investment securities and unrealized appreciation (depreciation) as of period end were as follows:
Gross unrealized appreciation | $ 4,414,655 |
Gross unrealized depreciation | (2,847,543) |
Net unrealized appreciation (depreciation) | $ 1,567,112 |
| |
Tax Cost | $ 41,966,605 |
The tax-based components of distributable earnings as of period end were as follows:
Capital loss carryforward | $ (13,093,363) |
Net unrealized appreciation (depreciation) | $ 1,567,112 |
Annual Report
3. Significant Accounting Policies - continued
Income Tax Information and Distributions to Shareholders - continued
The tax character of distributions paid was as follows:
| December 31, 2009 | December 31, 2008 |
Ordinary Income | $ 1,275,840 | $ 1,635,469 |
Long-term Capital Gains | - | 185,626 |
Total | $ 1,275,840 | $ 1,821,095 |
Trading (Redemption) Fees. Shares held less than 60 days are subject to a redemption fee equal to 1% of the proceeds of the redeemed shares. All redemption fees, including any estimated redemption fees paid by FMR, are retained by the Fund and accounted for as an addition to paid in capital.
4. Purchases and Sales of Investments.
Purchases and sales of securities, other than short-term securities, aggregated $87,870,161 and $98,406,948, respectively.
5. Fees and Other Transactions with Affiliates.
Management Fee. FMR and its affiliates provide the Fund with investment management related services for which the Fund pays a monthly management fee. The management fee is the sum of an individual fund fee rate that is based on an annual rate of .30% of the Fund's average net assets and a group fee rate that averaged .26% during the period. The group fee rate is based upon the average net assets of all the mutual funds advised by FMR. The group fee rate decreases as assets under management increase and increases as assets under management decrease. For the period, the total annual management fee rate was .56% of the Fund's average net assets.
Transfer Agent Fees. Fidelity Investments Institutional Operations Company, Inc. (FIIOC), an affiliate of FMR, is the Fund's transfer, dividend disbursing, and shareholder servicing agent. FIIOC receives an asset-based fee with respect to each class. Each class (with the exception of Investor Class) pays a transfer agent fee, excluding out of pocket expenses, equal to an annual rate of .07% of average net assets. Investor Class pays a monthly asset-based transfer agent fee of .15% of average net assets. The total transfer agent fees paid by each class to FIIOC, including out of pocket expenses, were as follows:
Initial Class | $ 23,784 |
Investor Class | 30,725 |
| $ 54,509 |
Accounting and Security Lending Fees. Fidelity Service Company, Inc. (FSC), an affiliate of FMR, maintains the Fund's accounting records. The accounting fee is based on the level of average net assets for the month. Under a separate contract, FSC administers the security lending program. The security lending fee is based on the number and duration of lending transactions.
Brokerage Commissions. The Fund placed a portion of its portfolio transactions with brokerage firms which are affiliates of the investment adviser. The commissions paid to these affiliated firms were $1,970 for the period.
6. Committed Line of Credit.
The Fund participates with other funds managed by FMR in a $3.5 billion credit facility (the "line of credit") to be utilized for temporary or emergency purposes to fund shareholder redemptions or for other short-term liquidity purposes. The Fund has agreed to pay commitment fees on its pro-rata portion of the line of credit, which amounted to $234 and is reflected in Miscellaneous Expense on the Statement of Operations. During the period, there were no borrowings on this line of credit.
7. Security Lending.
The Fund lends portfolio securities from time to time in order to earn additional income. On the settlement date of the loan, the Fund receives collateral (in the form of U.S. Treasury obligations, letters of credit and/or cash) against the loaned securities and maintains collateral in an amount not less than 100% of the market value of the loaned securities during the period of the loan. The market value of the loaned securities is determined at the close of business of the Fund and any additional required collateral is delivered to the Fund on the next business day. If the borrower defaults on its obligation to return the securities loaned because of insolvency or other reasons, a fund could experience delays and costs in recovering the securities loaned or in gaining access to the collateral. Any cash collateral received is invested in the Fidelity Securities Lending Cash Central Fund. The value of loaned securities and cash collateral at period end are disclosed on the Fund's Statement of Assets and Liabilities. Security lending income represents
Annual Report
Notes to Financial Statements - continued
7. Security Lending - continued
the income earned on investing cash collateral, less fees and expenses associated with the loan, plus any premium payments that may be received on the loan of certain types of securities. Security lending income is presented in the Statement of Operations as a component of income from Fidelity Central Funds. Net income from lending portfolio securities during the period amounted to $1,871.
8. Expense Reductions.
Many of the brokers with whom FMR places trades on behalf of the Fund provided services to the Fund in addition to trade execution. These services included payments of certain expenses on behalf of the Fund totaling $6,846 for the period.
9. Distributions to Shareholders.
Distributions to shareholders of each class were as follows:
Years ended December 31, | 2009 | 2008 |
From net investment income | | |
Initial Class | $ 770,027 | $ 992,400 |
Investor Class | 505,813 | 550,257 |
Total | $ 1,275,840 | $ 1,542,657 |
From net realized gain | | |
Initial Class | $ - | $ 185,094 |
Investor Class | - | 93,344 |
Total | $ - | $ 278,438 |
10. Share Transactions.
Transactions for each class of shares were as follows:
| Shares | Dollars |
Years ended December 31, | 2009 | 2008 | 2009 | 2008 |
Initial Class | | | | |
Shares sold | 189,678 | 534,178 | $ 1,639,700 | $ 5,586,449 |
Reinvestment of distributions | 84,064 | 140,658 | 770,027 | 1,177,495 |
Shares redeemed | (1,518,047) | (3,198,980) | (12,048,930) | (35,570,008) |
Net increase (decrease) | (1,244,305) | (2,524,144) | $ (9,639,203) | $ (28,806,064) |
Investor Class | | | | |
Shares sold | 430,537 | 603,317 | $ 3,722,045 | $ 6,888,002 |
Reinvestment of distributions | 55,401 | 77,430 | 505,813 | 643,601 |
Shares redeemed | (952,381) | (1,633,572) | (7,503,189) | (17,982,498) |
Net increase (decrease) | (466,443) | (952,825) | $ (3,275,331) | $ (10,450,895) |
11. Other.
The Fund's organizational documents provide former and current trustees and officers with a limited indemnification against liabilities arising in connection with the performance of their duties to the Fund. In the normal course of business, the Fund may also enter into contracts that provide general indemnifications. The Fund's maximum exposure under these arrangements is unknown as this would be dependent on future claims that may be made against the Fund. The risk of material loss from such claims is considered remote.
At the end of the period, FMR or its affiliates were owners of record of 100% of the total outstanding shares of the Fund.
Annual Report
Report of Independent Registered Public Accounting Firm
To the Trustees of Variable Insurance Products Fund IV and the Shareholders of VIP Utilities Portfolio:
In our opinion, the accompanying statement of assets and liabilities, including the schedule of investments, and the related statements of operations and of changes in net assets and the financial highlights present fairly, in all material respects, the financial position of VIP Utilities Portfolio (a fund of Variable Insurance Products Fund IV) at December 31, 2009, the results of its operations for the year then ended, the changes in its net assets for each of the two years in the period then ended and the financial highlights for each of the periods indicated, in conformity with accounting principles generally accepted in the United States of America. These financial statements and financial highlights (hereafter referred to as "financial statements") are the responsibility of the VIP Utilities Portfolio's management. Our responsibility is to express an opinion on these financial statements based on our audits. We conducted our audits of these financial statements in accordance with the standards of the Public Company Accounting Oversight Board (United States). Those standards require that we plan and perform the audit to obtain reasonable assurance about whether the financial statements are free of material misstatement. An audit includes examining, on a test basis, evidence supporting the amounts and disclosures in the financial statements, assessing the accounting principles used and significant estimates made by management, and evaluating the overall financial statement presentation. We believe that our audits, which included confirmation of securities at December 31, 2009 by correspondence with the custodian and brokers, provide a reasonable basis for our opinion.
/s/ PricewaterhouseCoopers LLP
PricewaterhouseCoopers LLP
Boston, Massachusetts
February 12, 2010
Annual Report
The Trustees, Member of the Advisory Board, and executive officers of the trust and fund, as applicable, are listed below. The Board of Trustees governs the fund and is responsible for protecting the interests of shareholders. The Trustees are experienced executives who meet periodically throughout the year to oversee the fund's activities, review contractual arrangements with companies that provide services to the fund, and review the fund's performance. Except for James C. Curvey, each of the Trustees oversees 222 funds advised by FMR or an affiliate. Mr. Curvey oversees 410 funds advised by FMR or an affiliate.
The Trustees hold office without limit in time except that (a) any Trustee may resign; (b) any Trustee may be removed by written instrument, signed by at least two-thirds of the number of Trustees prior to such removal; (c) any Trustee who requests to be retired or who has become incapacitated by illness or injury may be retired by written instrument signed by a majority of the other Trustees; and (d) any Trustee may be removed at any special meeting of shareholders by a two-thirds vote of the outstanding voting securities of the trust. Each Trustee who is not an interested person (as defined in the 1940 Act) (Independent Trustee), shall retire not later than the last day of the calendar year in which his or her 72nd birthday occurs. The Independent Trustees may waive this mandatory retirement age policy with respect to individual Trustees. The executive officers and Advisory Board Member hold office without limit in time, except that any officer and Advisory Board Member may resign or may be removed by a vote of a majority of the Trustees at any regular meeting or any special meeting of the Trustees. Except as indicated, each individual has held the office shown or other offices in the same company for the past five years.
The fund's Statement of Additional Information (SAI) includes more information about the Trustees. To request a free copy, call Fidelity at 1-877-208-0098.
Interested Trustees*:
Correspondence intended for each Trustee who is an interested person may be sent to Fidelity Investments, 82 Devonshire Street, Boston, Massachusetts 02109.
Name, Age; Principal Occupation |
Edward C. Johnson 3d (79) |
| Year of Election or Appointment: 1983 Mr. Johnson is Trustee and Chairman of the Board of Trustees of certain Trusts. Mr. Johnson serves as Chief Executive Officer, Chairman, and a Director of FMR LLC; Chairman and a Director of FMR; Chairman and a Director of Fidelity Research & Analysis Company (FRAC); Chairman and a Director of Fidelity Investments Money Management, Inc.; and Chairman and a Director of FMR Co., Inc. In addition, Mr. Johnson serves as Chairman and Director of FIL Limited. Previously, Mr. Johnson served as President of FMR LLC (2006-2007). |
James C. Curvey (74) |
| Year of Election or Appointment: 2007 Mr. Curvey also serves as Trustee (2007-present) of other investment companies advised by FMR. Mr. Curvey is a Director of FMR and FMR Co., Inc. (2007-present). Mr. Curvey is also Vice Chairman (2006-present) and Director of FMR LLC. In addition, Mr. Curvey serves as an Overseer for the Boston Symphony Orchestra and a member of the Trustees of Villanova University. |
* Trustees have been determined to be "Interested Trustees" by virtue of, among other things, their affiliation with the trust or various entities under common control with FMR.
Independent Trustees:
Correspondence intended for each Independent Trustee (that is, the Trustees other than the Interested Trustees) may be sent to Fidelity Investments, P.O. Box 55235, Boston, Massachusetts 02205-5235.
Name, Age; Principal Occupation |
Dennis J. Dirks (61) |
| Year of Election or Appointment: 2005 Prior to his retirement in May 2003, Mr. Dirks was Chief Operating Officer and a member of the Board of The Depository Trust & Clearing Corporation (DTCC). He also served as President, Chief Operating Officer, and Board member of The Depository Trust Company (DTC) and President and Board member of the National Securities Clearing Corporation (NSCC). In addition, Mr. Dirks served as Chief Executive Officer and Board member of the Government Securities Clearing Corporation, Chief Executive Officer and Board member of the Mortgage-Backed Securities Clearing Corporation, as a Trustee and a member of the Finance Committee of Manhattan College (2005-2008), and as a Trustee and a member of the Finance Committee of AHRC of Nassau County (2006-2008). Currently, Mr. Dirks serves as a member of the Board of Directors for The Brookville Center for Children's Services, Inc. (2009-present). |
Alan J. Lacy (56) |
| Year of Election or Appointment: 2008 Mr. Lacy serves as Senior Adviser (2007-present) of Oak Hill Capital Partners, L.P. (private equity). Mr. Lacy also served as Chief Executive Officer (2000-2005) and Vice Chairman (2005-2006) of Sears Holdings Corporation and Sears, Roebuck and Co. (retail). In addition, Mr. Lacy serves as a member of the Board of Directors of The Western Union Company (global money transfer, 2006-present) and Bristol-Myers Squibb Company (global pharmaceuticals, 2007-present). Mr. Lacy is Chairman (2008-present) and a member (2006-present) of the Board of Trustees of The National Parks Conservation Association. |
Ned C. Lautenbach (65) |
| Year of Election or Appointment: 2000 Mr. Lautenbach is Chairman of the Independent Trustees of the Equity and High Income Funds (2006-present). Mr. Lautenbach is an Advisory Partner of Clayton, Dubilier & Rice, Inc. (private equity investment). Previously, Mr. Lautenbach was with the International Business Machines Corporation (IBM) from 1968 until his retirement in 1998. Mr. Lautenbach serves as a Director of Eaton Corporation (diversified industrial) as well as the Philharmonic Center for the Arts in Naples, Florida. Mr. Lautenbach is also a member of the Board of Trustees of Fairfield University (2005-present), as well as a member of the Council on Foreign Relations. Previously, Mr. Lautenbach served as a Director of Sony Corporation (2006-2007). |
Joseph Mauriello (65) |
| Year of Election or Appointment: 2008 Prior to his retirement in January 2006, Mr. Mauriello served in numerous senior management positions including Deputy Chairman and Chief Operating Officer (2004-2005), and Vice Chairman of Financial Services (2002-2004) of KPMG LLP US (professional services, 1965-2005). Mr. Mauriello currently serves as a member of the Board of Directors of XL Capital Ltd. (global insurance and re-insurance, 2006-present) and of Arcadia Resources Inc. (health care services and products, 2007-present). Previously, Mr. Mauriello served as a Director of the Hamilton Funds of the Bank of New York (2006-2007). |
Cornelia M. Small (65) |
| Year of Election or Appointment: 2005 Ms. Small is a member of the Board of Directors of the Teagle Foundation (2009-present). Ms. Small is also a member of the Investment Committee, and Chair (2008-present) and a member of the Board of Trustees of Smith College. In addition, Ms. Small serves on the Investment Committee of the Berkshire Taconic Community Foundation (2008-present). Previously, Ms. Small served as Chairperson of the Investment Committee (2002-2008) of Smith College. In addition, Ms. Small served as Chief Investment Officer, Director of Global Equity Investments, and a member of the Board of Directors of Scudder, Stevens & Clark and Scudder Kemper Investments. |
William S. Stavropoulos (70) |
| Year of Election or Appointment: 2001 Mr. Stavropoulos serves as President and Founder of the Michigan Baseball Foundation, the Great Lakes Loons (2007-present). Mr. Stavropoulos is Chairman Emeritus of the Board of Directors of The Dow Chemical Company, where he previously served in numerous senior management positions, including President, CEO (1995-2000; 2002-2004), Chairman of the Executive Committee (2000-2006), and as a member of the Board of Directors (1990-2006). Currently, Mr. Stavropoulos is a Director of Teradata Corporation (data warehousing and technology solutions, 2008-present), Chemical Financial Corporation, Maersk Inc. (industrial conglomerate), Tyco International, Inc. (multinational manufacturing and services, 2007-present), and a member of the Advisory Board for Metalmark Capital (private equity investment, 2005-present). Mr. Stavropoulos is a special advisor to Clayton, Dubilier & Rice, Inc. (private equity investment). In addition, Mr. Stavropoulos is a member of the University of Notre Dame Advisory Council for the College of Science. |
David M. Thomas (60) |
| Year of Election or Appointment: 2008 Previously, Mr. Thomas served as Executive Chairman (2005-2006) and Chairman and Chief Executive Officer (2000-2005) of IMS Health, Inc. (pharmaceutical and healthcare information solutions). In addition, Mr. Thomas serves as a member of the Board of Directors of Fortune Brands, Inc. (consumer products), and Interpublic Group of Companies, Inc. (marketing communication, 2004-present). |
Michael E. Wiley (59) |
| Year of Election or Appointment: 2008 Mr. Wiley also serves as a Director of Asia Pacific Exploration Consolidated (international oil and gas exploration and production, 2008-present), and as a member of the Board of Trustees of the University of Tulsa (2000-2006; 2007-present). Mr. Wiley serves as a Director of Tesoro Corporation (independent oil refiner and marketer, 2005-present), and a Director of Bill Barrett Corporation (exploration and production, 2005-present). In addition, Mr. Wiley also serves as a Director of Post Oak Bank (privately-held bank, 2004-present). Previously, Mr. Wiley served as a Sr. Energy Advisor of Katzenbach Partners, LLC (consulting, 2006-2007), as an Advisory Director of Riverstone Holdings (private investment), Chairman, President, and CEO of Baker Hughes, Inc. (oilfield services, 2000-2004), and as Director of Spinnaker Exploration Company (exploration and production, 2001-2005). |
Annual Report
Advisory Board Member and Executive Officers:
Correspondence intended for each executive officer and Peter S. Lynch may be sent to Fidelity Investments, 82 Devonshire Street, Boston, Massachusetts 02109.
Name, Age; Principal Occupation |
Peter S. Lynch (65) |
| Year of Election or Appointment: 2003 Member of the Advisory Board of Fidelity's Equity and High Income Funds. Mr. Lynch is Vice Chairman and a Director of FMR and FMR Co., Inc. In addition, Mr. Lynch serves as a Trustee of Boston College and as the Chairman of the Inner-City Scholarship Fund. Previously, Mr. Lynch served on the Special Olympics International Board of Directors (1997-2006). |
Kenneth B. Robins (40) |
| Year of Election or Appointment: 2008 President and Treasurer of Fidelity's Equity and High Income Funds. Mr. Robins also serves as Assistant Treasurer of other Fidelity funds (2009-present) and is an employee of Fidelity Investments (2004-present). Before joining Fidelity Investments, Mr. Robins worked at KPMG LLP, where he was a partner in KPMG's department of professional practice (2002-2004). |
Brian B. Hogan (45) |
| Year of Election or Appointment: 2009 Vice President of certain Equity Funds and Vice President of Sector Funds. Mr. Hogan also serves as Senior Vice President, Equity Research of FMR (2006-present) and President of FMR's Equity Division (2009-present). Previously, Mr. Hogan served as a portfolio manager. |
Christopher S. Bartel (38) |
| Year of Election or Appointment: 2009 Vice President of Fidelity's Sector and Real Estate Equity Funds. Mr. Bartel also serves as Senior Vice President of Equity Research (2009-present). Previously, Mr. Bartel served as Managing Director of Research (2006-2009) and an analyst and portfolio manager (2000-2006). |
Scott C. Goebel (41) |
| Year of Election or Appointment: 2008 Secretary and Chief Legal Officer (CLO) of the Fidelity funds. Mr. Goebel also serves as General Counsel, Secretary, and Senior Vice President of FMR (2008-present) and FMR Co., Inc. (2008-present); Deputy General Counsel of FMR LLC; Chief Legal Officer of Fidelity Management & Research (Hong Kong) Limited (2008-present) and Assistant Secretary of Fidelity Management & Research (Japan) Inc. (2008-present), Fidelity Investments Money Management, Inc. (2008-present), Fidelity Management & Research (U.K.) Inc. (2008-present), and Fidelity Research and Analysis Company (2008-present). Previously, Mr. Goebel served as Assistant Secretary of the Funds (2007-2008) and as Vice President and Secretary of Fidelity Distributors Corporation (FDC) (2005-2007). |
William C. Coffey (40) |
| Year of Election or Appointment: 2009 Assistant Secretary of Fidelity's Equity and High Income Funds. Mr. Coffey also serves as Vice President and Associate General Counsel of FMR LLC (2005-present), and is an employee of Fidelity Investments. |
Holly C. Laurent (55) |
| Year of Election or Appointment: 2008 Anti-Money Laundering (AML) Officer of the Fidelity funds. Ms. Laurent is an employee of Fidelity Investments. Previously, Ms. Laurent was Senior Vice President and Head of Legal for Fidelity Business Services India Pvt. Ltd. (2006-2008), and Senior Vice President, Deputy General Counsel and Group Head for FMR LLC (2005-2006). |
Christine Reynolds (51) |
| Year of Election or Appointment: 2008 Chief Financial Officer of the Fidelity funds. Ms. Reynolds became President of Fidelity Pricing and Cash Management Services (FPCMS) in August 2008. Ms. Reynolds served as Chief Operating Officer of FPCMS (2007-2008). Previously, Ms. Reynolds served as President, Treasurer, and Anti-Money Laundering officer of the Fidelity funds (2004-2007). |
Kenneth A. Rathgeber (62) |
| Year of Election or Appointment: 2004 Chief Compliance Officer of Fidelity's Equity and High Income Funds. Mr. Rathgeber is Chief Compliance Officer of Fidelity Management & Research (Hong Kong) Limited (2008-present), Fidelity Management & Research (Japan) Inc. (2008-present), FMR (2005-present), FMR Co., Inc. (2005-present), Fidelity Management & Research (U.K.) Inc. (2005-present), Fidelity Research & Analysis Company (2005-present), Fidelity Investments Money Management, Inc. (2005-present), Pyramis Global Advisors, LLC (2005-present), and Strategic Advisers, Inc. (2005-present). |
Jeffrey S. Christian (48) |
| Year of Election or Appointment: 2009 Deputy Treasurer of the Fidelity funds. Mr. Christian is an employee of Fidelity Investments. Previously, Mr. Christian served as Chief Financial Officer (2008-2009) of certain Fidelity funds, Senior Vice President of Fidelity Pricing and Cash Management Services (FPCMS) (2004-2009), and as Vice President of Business Analysis (2003-2004). |
Bryan A. Mehrmann (48) |
| Year of Election or Appointment: 2005 Deputy Treasurer of the Fidelity funds. Mr. Mehrmann is an employee of Fidelity Investments. Previously, Mr. Mehrmann served as Vice President of Fidelity Investments Institutional Services Group (FIIS)/Fidelity Investments Institutional Operations Company, Inc. (FIIOC) Client Services (1998-2004). |
Adrien E. Deberghes (42) |
| Year of Election or Appointment: 2008 Deputy Treasurer of Fidelity's Equity and High Income Funds. Mr. Deberghes is an employee of Fidelity Investments (2008-present). Previously, Mr. Deberghes served as Senior Vice President of Mutual Fund Administration at State Street Corporation (2007-2008), Senior Director of Mutual Fund Administration at Investors Bank & Trust (2005-2007), and Director of Finance for Dunkin' Brands (2000-2005). |
John R. Hebble (51) |
| Year of Election or Appointment: 2009 Assistant Treasurer of Fidelity's Equity and High Income Funds. Mr. Hebble also serves as President and Treasurer of other Fidelity funds (2008-present) and is an employee of Fidelity Investments. |
Paul M. Murphy (62) |
| Year of Election or Appointment: 2007 Assistant Treasurer of the Fidelity funds. Mr. Murphy is an employee of Fidelity Investments. Previously, Mr. Murphy served as Chief Financial Officer of the Fidelity funds (2005-2006), Vice President and Associate General Counsel of FMR (2007), and Senior Vice President of Fidelity Pricing and Cash Management Services (FPCMS) (1994-2007). |
Gary W. Ryan (51) |
| Year of Election or Appointment: 2005 Assistant Treasurer of the Fidelity funds. Mr. Ryan is an employee of Fidelity Investments. Previously, Mr. Ryan served as Vice President of Fund Reporting in Fidelity Pricing and Cash Management Services (FPCMS) (1999-2005). |
Annual Report
Initial Class and Investor Class designate 100% of the dividends distributed in December 2009 as qualifying for the dividends-received deduction for corporate shareholders.
The fund will notify shareholders in January 2010 of amounts for use in preparing 2009 income tax returns.
Annual Report
Board Approval of Investment Advisory Contracts and Management Fees
VIP Utilities Portfolio
Each year, the Board of Trustees, including the Independent Trustees (together, the Board), votes on the renewal of the management contract and sub-advisory agreements (together, the Advisory Contracts) for the fund. The Board, assisted by the advice of fund counsel and Independent Trustees' counsel, requests and considers a broad range of information throughout the year.
The Board meets regularly and, acting directly and through its separate committees, requests and receives information concerning, and considers at each of its meetings factors that are relevant to, its annual consideration of the renewal of the fund's Advisory Contracts, including the services and support provided to the fund and its shareholders. The Board has established various standing committees, each composed of Independent Trustees with varying backgrounds, to which the Board has assigned specific subject matter responsibilities in order to enhance effective decision-making by the Board. Each committee has a written charter outlining the structure and purposes of the committee. The Board also meets as needed to consider matters specifically related to the Board's annual consideration of the renewal of Advisory Contracts.
At its July 2009 meeting, the Board of Trustees, including the Independent Trustees, unanimously determined to renew the fund's Advisory Contracts. In reaching its determination, the Board considered all factors it believed relevant, including (i) the nature, extent, and quality of the services to be provided to the fund and its shareholders (including the investment performance of the fund); (ii) the competitiveness of the fund's management fee and total expenses; (iii) the total costs of the services to be provided by and the profits to be realized by Fidelity from its relationship with the fund; (iv) the extent to which economies of scale would be realized as the fund grows; and (v) whether fee levels reflect these economies of scale, if any, for the benefit of fund shareholders.
In considering whether to renew the Advisory Contracts for the fund, the Board ultimately reached a determination, with the assistance of fund counsel and Independent Trustees' counsel and through the exercise of its business judgment, that the renewal of the Advisory Contracts and the compensation to be received by Fidelity under the management contract is consistent with Fidelity's fiduciary duty under applicable law. The Board's decision to renew the Advisory Contracts was not based on any single factor noted above, but rather was based on a comprehensive consideration of all the information provided to the Board at its meetings throughout the year. The Board, in reaching its determination to renew the Advisory Contracts, is aware that shareholders in the fund have a broad range of investment choices available to them, including a wide choice among mutual funds offered by competitors to Fidelity, and that the fund's shareholders, with the opportunity to review and weigh the disclosure provided by the fund in its prospectus and other public disclosures, have chosen to invest in this fund, managed by Fidelity.
Nature, Extent, and Quality of Services Provided. The Board considered staffing within the investment adviser, FMR, and the sub-advisers (together, the Investment Advisers), including the backgrounds of the fund's investment personnel and the fund's investment objective and discipline. The Independent Trustees also had discussions with senior management of Fidelity's investment operations and investment groups. The Board considered the structure of the portfolio manager compensation program and whether this structure provides appropriate incentives.
Resources Dedicated to Investment Management and Support Services. The Board reviewed the size, education, and experience of the Investment Advisers' investment staff, their use of technology, and the Investment Advisers' approach to recruiting, training, and retaining portfolio managers and other research, advisory, and management personnel. In response to last year's financial crisis, FMR took a number of actions intended to cut costs and improve efficiency without weakening the investment teams or resources. The Board noted that Fidelity's analysts have access to a variety of technological tools and market and securities data that enable them to perform both fundamental and quantitative analysis and to specialize in various disciplines. The Board considered Fidelity's extensive global research capabilities that enable the Investment Advisers to aggregate data from various sources in an effort to produce positive investment results. The Board also considered that Fidelity's portfolio managers and analysts have access to daily portfolio attribution that allows for monitoring of a fund's portfolio, as well as an electronic communication system that provides immediate real-time access to research concerning issuers and credit enhancers.
Shareholder and Administrative Services. The Board considered (i) the nature, extent, quality, and cost of advisory, administrative, distribution, and shareholder services performed by the Investment Advisers and their affiliates under the Advisory Contracts and under separate agreements covering transfer agency, pricing and bookkeeping, and securities lending services for the fund; (ii) the nature and extent of the Investment Advisers' supervision of third party service providers, principally custodians and subcustodians; and (iii) the resources devoted to, and the record of compliance with, the fund's compliance policies and procedures. The Board also reviewed the allocation of fund brokerage, including allocations to brokers affiliated with the Investment Advisers, the use of brokerage commissions to pay fund expenses, and the use of "soft" commission dollars to pay for research services.
The Board noted that the growth of fund assets across the complex allows Fidelity to reinvest in the development of services designed to enhance the value or convenience of the Fidelity funds as investment vehicles. These services include 24-hour access to account information and market information through phone representatives and over the Internet, and investor education materials and asset allocation tools.
Investment in a Large Fund Family. The Board considered the benefits to shareholders of investing in a Fidelity fund, including the benefits of investing in a fund that is part of a large family of funds offering a variety of investment disciplines and providing for a large variety of mutual fund investor services. The Board noted that Fidelity has taken a number of actions over the previous year that benefited particular funds, including (i) dedicating additional resources to investment research and to restructure and broaden the focus of the investment research teams; (ii) bolstering the senior management team that oversees asset management; (iii) contractually agreeing to reduce the management fee on Fidelity U.S. Bond Index Fund; and (iv) expanding Class A and Class T load waiver categories to increase rollover retention opportunities and create consistent policies across the classes.
Annual Report
Investment Performance. The Board considered whether the fund has operated within its investment objective, as well as its record of compliance with its investment restrictions. It also reviewed the fund's absolute investment performance for each class, as well as the fund's relative investment performance for each class measured against a third-party-sponsored index that reflects the market sector in which the fund invests over multiple periods. The Board noted that FMR does not believe that a meaningful peer group exists against which to compare the fund's performance. The following charts considered by the Board show, over the one-, three-, and five-year periods ended December 31, 2008, as available, the cumulative total returns of Initial Class and Investor Class of the fund and the cumulative total returns of a third-party-sponsored index ("benchmark").
VIP Utilities Portfolio
The Board stated that the investment performance of the fund was lower than its benchmark for the one- and three-year periods, although the five-year cumulative total return of Initial Class compared favorably to its benchmark. The Board discussed with FMR actions that have been taken by FMR to improve the fund's below-benchmark performance. The Board will continue to closely monitor the performance of the fund in the coming year and discuss with FMR other appropriate actions to address the performance of the fund. The Board considered that the variations in performance between the fund's classes reflect the variations in class expenses, which result in lower performance for the higher expense class.
The Board considered that FMR has taken steps to refocus and strengthen equity research, equity portfolio management, and compliance. The Board reviewed the year-to-date performance of Initial Class through May 31, 2009 and stated that it exceeded the fund's benchmark.
Based on its review, and giving particular weight to the nature and quality of the resources dedicated by the Investment Advisers to maintain and improve relative performance and factoring in the unprecedented market events in 2008, the Board concluded that the nature, extent, and quality of the services provided to the fund will benefit the fund's shareholders, particularly in light of the Board's view that the fund's shareholders benefit from investing in a fund that is part of a large family of funds offering a variety of investment disciplines and services.
Competitiveness of Management Fee and Total Fund Expenses. The Board considered the fund's management fee and total expenses compared to "mapped groups" of competitive funds and classes. Fidelity creates "mapped groups" by combining similar Lipper investment objective categories that have comparable management fee characteristics. Combining Lipper investment objective categories aids the Board's management fee and total expense comparisons by broadening the competitive group used for comparison and by reducing the number of universes to which various Fidelity funds are compared.
The Board considered two proprietary management fee comparisons for the 12-month periods shown in the chart below. The group of Lipper funds used by the Board for management fee comparisons is referred to below as the "Total Mapped Group." The Total Mapped Group comparison focuses on a fund's standing relative to the total universe of comparable funds available to investors, in terms of gross management fees before expense reimbursements or caps. "TMG %" represents the percentage of funds in the Total Mapped Group that had management fees that were lower than the fund's. For example, a TMG % of 4% means that 96% of the funds in the Total Mapped Group had higher management fees than the fund. The "Asset-Size Peer Group" (ASPG) comparison focuses on a fund's standing relative to non-Fidelity funds similar in size to the fund within the Total Mapped Group. The ASPG represents at least 15% of the funds in the Total Mapped Group with comparable asset size and management fee characteristics, subject to a minimum of 50 funds (or all funds in the Total Mapped Group if fewer than 50). Additional information, such as the ASPG quartile in which the fund's management fee ranked, is also included in the chart and considered by the Board.
Annual Report
Board Approval of Investment Advisory Contracts and Management Fees - continued
VIP Utilities Portfolio
The Board noted that the fund's management fee ranked below the median of its Total Mapped Group and below the median of its ASPG for 2008.
Based on its review, the Board concluded that the fund's management fee was fair and reasonable in light of the services that the fund receives and the other factors considered.
In its review of each class's total expenses, the Board considered the fund's management fee as well as other fund or class expenses, as applicable, such as transfer agent fees, pricing and bookkeeping fees, and custodial, legal, and audit fees. The Board also noted the effects of any waivers and reimbursements on fees and expenses. As part of its review, the Board also considered current and historical total expenses of each class of the fund compared to competitive fund median expenses. Each class of the fund is compared to those funds and classes in the Total Mapped Group (used by the Board for management fee comparisons) that have a similar sales load structure.
The Board noted that the total expenses of each class ranked below its competitive median for 2008.
In its review of total expenses, the Board also considered Fidelity fee structures and other information on clients that FMR and its affiliates service in other competitive markets, such as other mutual funds advised or subadvised by FMR or its affiliates, pension plan clients, and other institutional clients.
Based on its review, the Board concluded that the total expenses of each class of the fund were reasonable in light of the services that the fund and its shareholders receive and the other factors considered.
Costs of the Services and Profitability. The Board considered the revenues earned and the expenses incurred by Fidelity in conducting the business of developing, marketing, distributing, managing, administering and servicing the fund and its shareholders. The Board also considered the level of Fidelity's profits in respect of all the Fidelity funds.
On an annual basis, FMR presents to the Board Fidelity's profitability for the fund. Fidelity calculates the profitability for each fund, as well as aggregate profitability for groups of Fidelity funds and all Fidelity funds, using a series of detailed revenue and cost allocation methodologies which originate with the audited books and records of Fidelity. The Audit Committee of the Board reviews any significant changes from the prior year's methodologies.
PricewaterhouseCoopers LLP (PwC), independent registered public accounting firm and auditor to Fidelity and certain Fidelity funds, has been engaged annually by the Board as part of the Board's assessment of Fidelity's profitability analysis. PwC's engagement includes the review and assessment of Fidelity's methodologies used in determining the revenues and expenses attributable to Fidelity's mutual fund business, and completion of agreed-upon procedures surrounding the mathematical accuracy of fund profitability and its conformity to allocation methodologies. After considering PwC's reports issued under the engagement and information provided by Fidelity, the Board believes that while other allocation methods may also be reasonable, Fidelity's profitability methodologies are reasonable in all material respects.
The Board has also reviewed Fidelity's non-fund businesses and any fall-out benefits related to the mutual fund business as well as cases where Fidelity's affiliates may benefit from or be related to the fund's business.
Annual Report
The Board considered the costs of the services provided by and the profits realized by Fidelity in connection with the operation of the fund and determined that the amount of profit is a fair entrepreneurial profit for the management of the fund.
Economies of Scale. The Board considered whether there have been economies of scale in respect of the management of the Fidelity funds, whether the Fidelity funds (including the fund) have appropriately benefited from any such economies of scale, and whether there is potential for realization of any further economies of scale. The Board considered the extent to which the fund will benefit from economies of scale through increased services to the fund, through waivers or reimbursements, or through fee or expense reductions.
In February 2009, the Board created an Ad Hoc Committee (the "Committee") to analyze economies of scale. The Committee was formed to consider whether FMR attains economies of scale in respect of the management and servicing of the Fidelity funds, whether the Fidelity funds have appropriately benefited from such economies of scale, and whether there is potential for realization of any further economies of scale.
The Board recognized that the fund's management contract incorporates a "group fee" structure, which provides for lower group fee rates as total fund assets under FMR's management increase, and for higher group fee rates as total fund assets under FMR's management decrease. FMR determines the group fee rates based on a tiered asset "breakpoint" schedule. The Board considered that the group fee is designed to deliver the benefits of economies of scale to fund shareholders when total fund assets increase, even if assets of any particular fund are unchanged or have declined, because some portion of Fidelity's costs are attributable to services provided to all Fidelity funds, and all funds benefit if those costs can be allocated among more assets. The Board concluded that, given the group fee structure, fund shareholders will achieve a certain level of economies of scale as assets under FMR's management increase at the fund complex level, regardless of whether Fidelity achieves any such economies of scale.
The Board concluded, considering the findings of the Committee, that any potential economies of scale are being shared between fund shareholders and Fidelity in an appropriate manner.
Additional Information Requested by the Board. In order to develop fully the factual basis for consideration of the Fidelity funds' Advisory Contracts, the Board requested and received additional information on certain topics, including (i) fund performance trends, actions to be taken by FMR to improve certain funds' overall performance and Fidelity's long-term strategies for certain funds; (ii) portfolio manager changes that have occurred during the past year; (iii) Fidelity's compensation structure for portfolio managers and key personnel, including performance benchmarks used by Fidelity in evaluating incentive compensation for portfolio managers and research analysts; (iv) the structure and process of equity research and actions taken by FMR to improve the quality of research; (v) the selection of and compensation paid by FMR to fund sub-advisers; (vi) Fidelity's fee structures and rationale for recommending different fees among categories of funds; (vii) the rationale for any differences between fund fee structures and fee structures in place for other Fidelity clients; (viii) Fidelity's rationale for recommending which funds should have a performance adjustment component as part of their management fees; and (ix) explanations for the relative total expenses borne by certain funds and classes, total expense competitive trends, and actions that might be taken by FMR to reduce total expenses for certain funds and classes.
Based on its evaluation of all of the conclusions noted above, and after considering all material factors, the Board ultimately concluded that the advisory fee structures are fair and reasonable, and that the fund's Advisory Contracts should be renewed.
Annual Report
Investment Adviser
Fidelity Management & Research Company
Boston, MA
Investment Sub-Advisers
FMR Co., Inc.
Fidelity Management & Research (U.K.) Inc.
Fidelity Research & Analysis Company
FIL Investments (Japan) Limited
FIL Investment Advisors
FIL Investment Advisors (U.K.) Ltd.
Fidelity Management & Research (Hong Kong) Limited
Fidelity Management & Research (Japan) Inc.
General Distributor
Fidelity Distributors Corporation
Boston, MA
Transfer and Service Agents
Fidelity Investments Institutional Operations Company, Inc.
Boston, MA
Fidelity Service Company, Inc.
Boston, MA
Custodian
JPMorgan Chase Bank
New York, NY
VTELIC-ANN-0210
1.817391.104
Fidelity® Variable Insurance Products:
Value Leaders Portfolio
Annual Report
December 31, 2009
(2_fidelity_logos) (Registered_Trademark)
Contents
Performance | <Click Here> | How the fund has done over time. |
Management's Discussion | <Click Here> | The manager's review of fund performance, strategy and outlook. |
Shareholder Expense Example | <Click Here> | An example of shareholder expenses. |
Investment Changes | <Click Here> | A summary of major shifts in the fund's investments over the past six months. |
Investments | <Click Here> | A complete list of the fund's investments with their market values. |
Financial Statements | <Click Here> | Statements of assets and liabilities, operations, and changes in net assets, as well as financial highlights. |
Notes | <Click Here> | Notes to the financial statements. |
Report of Independent Registered Public Accounting Firm | <Click Here> | |
Trustees and Officers | <Click Here> | |
Distributions | <Click Here> | |
Board Approval of Investment Advisory Contracts and Management Fees | <Click Here> | |
To view a fund's proxy voting guidelines and proxy voting record for the 12-month period ended June 30, visit http://www.fidelity.com/proxyvotingresults or visit the Securities and Exchange Commission's (SEC) web site at http://www.sec.gov. You may also call 1-877-208-0098 to request a free copy of the proxy voting guidelines.
Fidelity Variable Insurance Products are separate account options which are purchased through a variable insurance contract.
Standard & Poor's, S&P and S&P 500 are registered service marks of The McGraw-Hill Companies, Inc. and have been licensed for use by Fidelity Distributors Corporation.
Other third party marks appearing herein are the property of their respective owners.
All other marks appearing herein are registered or unregistered trademarks or service marks of FMR Corp. or an affiliated company.
This report and the financial statements contained herein are submitted for the general information of the shareholders of the fund. This report is not authorized for distribution to prospective investors in the fund unless preceded or accompanied by an effective prospectus.
A fund files its complete schedule of portfolio holdings with the SEC for the first and third quarters of each fiscal year on Form N-Q. Forms N-Q are available on the SEC's web site at http://www.sec.gov. A fund's Forms N-Q may be reviewed and copied at the SEC's Public Reference Room in Washington, DC. Information regarding the operation of the SEC's Public Reference Room may be obtained by calling 1-800-SEC-0330. For a complete list of a fund's portfolio holdings, view the most recent holdings listing, semiannual report, or annual report on Fidelity's web site at http://www.fidelity.com or http://www.advisor.fidelity.com, as applicable.
NOT FDIC INSURED · MAY LOSE VALUE · NO BANK GUARANTEE
Neither the fund nor Fidelity Distributors Corporation is a bank.
Annual Report
Average annual total return reflects the change in the value of an investment, assuming reinvestment of the class' dividend income and capital gains (the profits earned upon the sale of securities that have grown in value, if any) and assuming a constant rate of performance each year. During periods of reimbursement by Fidelity, a fund's total return will be greater than it would be had the reimbursement not occurred. Performance numbers are net of all underlying fund operating expenses, but do not include any insurance charges imposed by your insurance company's separate account. If performance information included the effect of these additional charges, the total returns would have been lower. How a fund did yesterday is no guarantee of how it will do tomorrow.
Average Annual Total Returns
Periods ended December 31, 2009 | Past 1
year | Past 5
years | Life of fund A |
VIP® Value Leaders - Initial Class | 27.91% | -1.22% | 3.06% |
VIP Value Leaders - Service Class B | 27.80% | -1.33% | 2.96% |
VIP Value Leaders - Service Class 2 C | 27.70% | -1.47% | 2.80% |
VIP Value Leaders - Investor Class D | 27.72% | -1.33% | 2.98% |
A From June 17, 2003.
B Performance of Service Class shares reflects an asset-based service fee (12b-1 fee).
C Performance of Service Class 2 shares reflects an asset-based service fee (12b-1 fee).
D The initial offering of Investor Class shares took place on July 21, 2005. Returns prior to July 21, 2005 are those of Initial Class. Had Investor Class's transfer agent fee been reflected, returns prior to July 21, 2005, would have been lower.
$10,000 Over Life of Fund
Let's say hypothetically that $10,000 was invested in VIP Value Leaders Portfolio - Initial Class on June 17, 2003, when the fund started. The chart shows how the value of your investment would have changed, and also shows how the Russell 1000® Value Index performed over the same period.
Annual Report
Market Recap: In 2009, most global markets saw both crippling lows and considerable highs. After a dismal start, the economy began to show signs of improvement, suggesting that a recovery was on the horizon. Credit markets began to heal as fiscal and monetary stimulus efforts around the world started to take effect, and corporate earnings staged an impressive rebound, fueled in large part by massive cost cutting. As a result, the flight to quality that marked most of 2008 and early 2009 shifted in March as investors flocked to riskier asset categories. The U.S. equity market, as measured by the bellwether Standard & Poor's 500SM Index and the blue-chip proxy Dow Jones Industrial AverageSM, reflected this changing environment, gaining 26.46% and 22.68%, respectively. Meanwhile, the technology-laden Nasdaq Composite® Index rose 45.32%. Foreign stocks also produced strong gains, as illustrated by the 31.93% jump of the MSCI® EAFE® Index (Europe, Australasia, Far East), a gauge of developed stock markets outside the U.S. and Canada. Emerging-markets stocks, which suffered their worst calendar-year performance ever in 2008, posted record returns this past year, with the MSCI Emerging Markets Index soaring 79.02%. A depreciating U.S. dollar helped bolster returns for U.S. investors in foreign equities.
Comments from Charles Hebard, Portfolio Manager of VIP Value Leaders Portfolio: For the year ending December 31, 2009, the fund's shares solidly outperformed the Russell 1000® Value Index, which returned 19.69%. (For specific portfolio results, please refer to the performance section of this report.) Stock picking in the energy sector was a key to performance, including underweighting integrated oil giant Exxon Mobil, which lagged when the markets rebounded, and good returns from land-driller Nabors Industries and exploration and production company Occidental Petroleum. In the financials sector, underweighting Citigroup in diversified financials paid off when the stock was pummeled by significant credit losses, while a stake in commercial real estate broker CB Richard Ellis Group rallied strongly on investors' expectations of a more favorable commercial real estate environment. Overweighting in investment banks JPMorgan Chase and Goldman Sachs further contributed. Underweighting major index component General Electric, which was battered by slowdowns in its industrial businesses and its financing arm, aided results in the industrials space. Elsewhere, an out-of-index position in Belgian brewer Anheuser-Busch InBev boosted returns. On the negative side, several diversified financials stocks detracted, including Bank of America and State Street, which performed poorly early in the period. Not owning automaker and index component Ford was a mistake, as the company was better capitalized than its Detroit brethren and was the only one of the "Big Three" domestic automakers to forgo government assistance, increasing the likelihood of its survival. Within telecommunication services, our holdings in wireless provider Sprint Nextel were pressured by concerns about a potential price war in the industry, while homebuilders KB Home and Pulte Homes failed to participate in the market rally. Citigroup and GE were no longer held at period end.
The views expressed above reflect those of the portfolio manager(s) only through the end of the period as stated on the cover of this report and do not necessarily represent the views of Fidelity or any other person in the Fidelity organization. Any such views are subject to change at any time based upon market or other conditions and Fidelity disclaims any responsibility to update such views. These views may not be relied on as investment advice and, because investment decisions for a Fidelity fund are based on numerous factors, may not be relied on as an indication of trading intent on behalf of any Fidelity fund.
Annual Report
As a shareholder of the Fund, you incur two types of costs: (1) transaction costs, and (2) ongoing costs, including management fees, distribution and/or service (12b-1) fees and other Fund expenses. This Example is intended to help you understand your ongoing costs (in dollars) of investing in the Fund and to compare these costs with the ongoing costs of investing in other mutual funds.
The Example is based on an investment of $1,000 invested at the beginning of the period and held for the entire period (July 1, 2009 to December 31, 2009).
Actual Expenses
The first line of the accompanying table for each class of the Fund provides information about actual account values and actual expenses. You may use the information in this line, together with the amount you invested, to estimate the expenses that you paid over the period. Simply divide your account value by $1,000.00 (for example, an $8,600 account value divided by $1,000.00 = 8.6), then multiply the result by the number in the first line for a class of the Fund under the heading entitled "Expenses Paid During Period" to estimate the expenses you paid on your account during this period. The estimate of expenses does not include any fees or other expenses of any variable annuity or variable life insurance product. If they were, the estimate of expenses you paid during the period would be higher, and your ending account value would be lower. In addition, the Fund, as a shareholder in the underlying Fidelity Central Funds, will indirectly bear its pro-rata share of the fees and expenses incurred by the underlying Fidelity Central Funds. These fees and expenses are not included in the Fund's annualized expense ratio used to calculate the expense estimate in the table below.
Hypothetical Example for Comparison Purposes
The second line of the accompanying table for each class of the Fund provides information about hypothetical account values and hypothetical expenses based on a Class' actual expense ratio and an assumed rate of return of 5% per year before expenses, which is not the Class' actual return. The hypothetical account values and expenses may not be used to estimate the actual ending account balance or expenses you paid for the period. You may use this information to compare the ongoing costs of investing in the Fund and other funds. To do so, compare this 5% hypothetical example with the 5% hypothetical examples that appear in the shareholder reports of the other funds. The estimate of expenses does not include any fees or other expenses of any variable annuity or variable life insurance product. If they were, the estimate of expenses you paid during the period would be higher, and your ending account value would be lower. In addition, the Fund, as a shareholder in the underlying Fidelity Central Funds, will indirectly bear its pro-rata share of the fees and expenses incurred by the underlying Fidelity Central Funds. These fees and expenses are not included in the Fund's annualized expense ratio used to calculate the expense estimate in the table below.
Please note that the expenses shown in the table are meant to highlight your ongoing costs only and do not reflect any transaction costs. Therefore, the second line of the table is useful in comparing ongoing costs only, and will not help you determine the relative total costs of owning different funds.
| Annualized
Expense
Ratio | Beginning
Account Value
July 1, 2009 | Ending
Account Value
December 31, 2009 | Expenses Paid
During Period*
July 1, 2009 to
December 31, 2009 |
Initial Class | .85% | | | |
Actual | | $ 1,000.00 | $ 1,240.80 | $ 4.80 |
HypotheticalA | | $ 1,000.00 | $ 1,020.92 | $ 4.33 |
Service Class | .95% | | | |
Actual | | $ 1,000.00 | $ 1,239.60 | $ 5.36 |
HypotheticalA | | $ 1,000.00 | $ 1,020.42 | $ 4.84 |
Service Class 2 | 1.10% | | | |
Actual | | $ 1,000.00 | $ 1,238.60 | $ 6.21 |
HypotheticalA | | $ 1,000.00 | $ 1,019.66 | $ 5.60 |
Investor Class | .93% | | | |
Actual | | $ 1,000.00 | $ 1,238.90 | $ 5.25 |
HypotheticalA | | $ 1,000.00 | $ 1,020.52 | $ 4.74 |
A 5% return per year before expenses
* Expenses are equal to each Class' annualized expense ratio, multiplied by the average account value over the period, multiplied by 184/365 (to reflect the one-half year period).
Annual Report
Top Ten Stocks as of December 31, 2009 |
| % of fund's
net assets | % of fund's net assets
6 months ago |
JPMorgan Chase & Co. | 4.8 | 4.8 |
Wells Fargo & Co. | 4.4 | 3.5 |
Pfizer, Inc. | 3.9 | 2.9 |
Chevron Corp. | 3.7 | 3.6 |
Bank of America Corp. | 3.6 | 3.6 |
Verizon Communications, Inc. | 3.3 | 2.3 |
Occidental Petroleum Corp. | 3.2 | 3.2 |
Merck & Co., Inc. | 1.8 | 1.7 |
Hewlett-Packard Co. | 1.8 | 1.7 |
Morgan Stanley | 1.6 | 1.7 |
| 32.1 | |
Top Five Market Sectors as of December 31, 2009 |
| % of fund's
net assets | % of fund's net assets
6 months ago |
Financials | 27.3 | 24.6 |
Energy | 18.5 | 18.7 |
Health Care | 10.8 | 9.9 |
Industrials | 9.8 | 10.0 |
Consumer Discretionary | 8.8 | 9.2 |
Asset Allocation (% of fund's net assets) |
As of December 31, 2009* | As of June 30, 2009** |
| Stocks 99.7% | | | Stocks 99.6% | |
| Bonds 0.0% | | | Bonds 0.1% | |
| Short-Term
Investments and
Net Other Assets 0.3% | | | Short-Term
Investments and
Net Other Assets 0.3% | |
* Foreign investments | 9.7% | | ** Foreign investments | 10.5% | |

Annual Report
Showing Percentage of Net Assets
Common Stocks - 99.2% |
| Shares | | Value |
CONSUMER DISCRETIONARY - 8.8% |
Auto Components - 0.8% |
Johnson Controls, Inc. | 7,300 | | $ 198,852 |
The Goodyear Tire & Rubber Co. (a) | 5,500 | | 77,550 |
| | 276,402 |
Automobiles - 0.2% |
Renault SA (a) | 1,400 | | 72,556 |
Hotels, Restaurants & Leisure - 0.2% |
Wyndham Worldwide Corp. | 3,700 | | 74,629 |
Household Durables - 2.4% |
Black & Decker Corp. | 2,300 | | 149,109 |
KB Home (c) | 31,900 | | 436,392 |
Pulte Homes, Inc. | 18,330 | | 183,300 |
Whirlpool Corp. | 866 | | 69,852 |
| | 838,653 |
Media - 2.7% |
Cablevision Systems Corp. - NY Group Class A | 5,100 | | 131,682 |
DIRECTV (a) | 3,100 | | 103,385 |
DISH Network Corp. Class A | 5,600 | | 116,312 |
Time Warner Cable, Inc. | 7,062 | | 292,296 |
Time Warner, Inc. | 9,400 | | 273,916 |
| | 917,591 |
Specialty Retail - 2.5% |
Advance Auto Parts, Inc. | 2,000 | | 80,960 |
Home Depot, Inc. | 4,250 | | 122,953 |
Lowe's Companies, Inc. | 11,400 | | 266,646 |
Ross Stores, Inc. | 1,500 | | 64,065 |
Staples, Inc. | 13,000 | | 319,670 |
| | 854,294 |
TOTAL CONSUMER DISCRETIONARY | | 3,034,125 |
CONSUMER STAPLES - 4.8% |
Beverages - 0.9% |
Anheuser-Busch InBev SA NV | 2,383 | | 124,166 |
Constellation Brands, Inc. Class A (sub. vtg.) (a) | 3,400 | | 54,162 |
The Coca-Cola Co. | 2,400 | | 136,800 |
| | 315,128 |
Food & Staples Retailing - 1.4% |
CVS Caremark Corp. | 9,400 | | 302,774 |
Kroger Co. | 4,600 | | 94,438 |
Winn-Dixie Stores, Inc. (a) | 7,500 | | 75,300 |
| | 472,512 |
Food Products - 1.2% |
Bunge Ltd. | 1,300 | | 82,979 |
Nestle SA (Reg.) | 4,949 | | 239,934 |
Ralcorp Holdings, Inc. (a) | 1,900 | | 113,449 |
| | 436,362 |
|
| Shares | | Value |
Household Products - 1.0% |
Energizer Holdings, Inc. (a) | 1,400 | | $ 85,792 |
Procter & Gamble Co. | 4,100 | | 248,583 |
| | 334,375 |
Tobacco - 0.3% |
British American Tobacco PLC sponsored ADR | 1,800 | | 116,388 |
TOTAL CONSUMER STAPLES | | 1,674,765 |
ENERGY - 18.5% |
Energy Equipment & Services - 5.2% |
Baker Hughes, Inc. | 3,800 | | 153,824 |
Ensco International Ltd. ADR | 2,250 | | 89,865 |
Halliburton Co. | 9,500 | | 285,855 |
Helmerich & Payne, Inc. | 1,200 | | 47,856 |
Nabors Industries Ltd. (a) | 15,600 | | 341,484 |
National Oilwell Varco, Inc. | 4,726 | | 208,369 |
Noble Corp. | 1,900 | | 77,330 |
Pride International, Inc. (a) | 3,200 | | 102,112 |
Transocean Ltd. (a) | 2,500 | | 207,000 |
Weatherford International Ltd. (a) | 15,200 | | 272,232 |
| | 1,785,927 |
Oil, Gas & Consumable Fuels - 13.3% |
Arch Coal, Inc. | 4,600 | | 102,350 |
Chesapeake Energy Corp. | 7,100 | | 183,748 |
Chevron Corp. | 16,400 | | 1,262,636 |
EOG Resources, Inc. | 1,200 | | 116,760 |
EXCO Resources, Inc. | 2,800 | | 59,444 |
Exxon Mobil Corp. | 5,700 | | 388,683 |
Marathon Oil Corp. | 12,800 | | 399,616 |
Occidental Petroleum Corp. | 13,700 | | 1,114,495 |
Petrohawk Energy Corp. (a) | 7,300 | | 175,127 |
Plains Exploration & Production Co. (a) | 5,200 | | 143,832 |
Range Resources Corp. | 3,700 | | 184,445 |
Royal Dutch Shell PLC Class B ADR | 4,000 | | 232,520 |
Southwestern Energy Co. (a) | 3,300 | | 159,060 |
Suncor Energy, Inc. | 1,720 | | 60,916 |
| | 4,583,632 |
TOTAL ENERGY | | 6,369,559 |
FINANCIALS - 26.8% |
Capital Markets - 4.9% |
Bank of New York Mellon Corp. | 3,200 | | 89,504 |
Charles Schwab Corp. | 3,968 | | 74,678 |
Franklin Resources, Inc. | 1,500 | | 158,025 |
Goldman Sachs Group, Inc. | 3,100 | | 523,404 |
Morgan Stanley | 18,600 | | 550,560 |
Northern Trust Corp. | 1,800 | | 94,320 |
State Street Corp. | 4,300 | | 187,222 |
| | 1,677,713 |
Common Stocks - continued |
| Shares | | Value |
FINANCIALS - continued |
Commercial Banks - 6.3% |
Huntington Bancshares, Inc. | 5,800 | | $ 21,170 |
Mitsubishi UFJ Financial Group, Inc. | 10,600 | | 52,239 |
PNC Financial Services Group, Inc. | 7,600 | | 401,204 |
SVB Financial Group (a) | 1,800 | | 75,042 |
U.S. Bancorp, Delaware | 5,100 | | 114,801 |
Wells Fargo & Co. | 55,776 | | 1,505,394 |
| | 2,169,850 |
Consumer Finance - 0.9% |
Capital One Financial Corp. | 4,500 | | 172,530 |
Discover Financial Services | 8,400 | | 123,564 |
| | 296,094 |
Diversified Financial Services - 9.5% |
Bank of America Corp. | 82,832 | | 1,247,450 |
CME Group, Inc. | 600 | | 201,570 |
JPMorgan Chase & Co. | 39,996 | | 1,666,630 |
KKR Financial Holdings LLC | 14,100 | | 81,780 |
Moody's Corp. | 3,100 | | 83,080 |
| | 3,280,510 |
Insurance - 3.5% |
ACE Ltd. | 6,320 | | 318,528 |
Allstate Corp. | 3,500 | | 105,140 |
Genworth Financial, Inc. Class A (a) | 18,173 | | 206,264 |
Lincoln National Corp. | 6,100 | | 151,768 |
Loews Corp. | 1,600 | | 58,160 |
MetLife, Inc. | 4,600 | | 162,610 |
Unum Group | 5,400 | | 105,408 |
XL Capital Ltd. Class A | 5,900 | | 108,147 |
| | 1,216,025 |
Real Estate Investment Trusts - 0.9% |
Alexandria Real Estate Equities, Inc. | 1,600 | | 102,864 |
Duke Realty LP | 3,000 | | 36,510 |
ProLogis Trust | 4,300 | | 58,867 |
SL Green Realty Corp. | 2,100 | | 105,504 |
| | 303,745 |
Real Estate Management & Development - 0.8% |
CB Richard Ellis Group, Inc. Class A (a) | 21,600 | | 293,112 |
TOTAL FINANCIALS | | 9,237,049 |
HEALTH CARE - 10.8% |
Biotechnology - 0.6% |
Amgen, Inc. (a) | 1,400 | | 79,198 |
Biogen Idec, Inc. (a) | 2,500 | | 133,750 |
| | 212,948 |
Health Care Equipment & Supplies - 1.9% |
Boston Scientific Corp. (a) | 7,100 | | 63,900 |
C. R. Bard, Inc. | 600 | | 46,740 |
|
| Shares | | Value |
Covidien PLC | 9,582 | | $ 458,882 |
Stryker Corp. | 1,500 | | 75,555 |
| | 645,077 |
Health Care Providers & Services - 2.0% |
Aetna, Inc. | 5,800 | | 183,860 |
Brookdale Senior Living, Inc. (a) | 6,700 | | 121,873 |
CIGNA Corp. | 6,600 | | 232,782 |
UnitedHealth Group, Inc. | 4,700 | | 143,256 |
| | 681,771 |
Life Sciences Tools & Services - 0.2% |
Thermo Fisher Scientific, Inc. (a) | 1,200 | | 57,228 |
Pharmaceuticals - 6.1% |
King Pharmaceuticals, Inc. (a) | 4,300 | | 52,761 |
Merck & Co., Inc. | 17,300 | | 632,142 |
Pfizer, Inc. | 73,920 | | 1,344,605 |
Teva Pharmaceutical Industries Ltd. sponsored ADR | 1,700 | | 95,506 |
| | 2,125,014 |
TOTAL HEALTH CARE | | 3,722,038 |
INDUSTRIALS - 9.8% |
Aerospace & Defense - 2.0% |
Honeywell International, Inc. | 7,500 | | 294,000 |
Precision Castparts Corp. | 800 | | 88,280 |
United Technologies Corp. | 4,400 | | 305,404 |
| | 687,684 |
Building Products - 1.1% |
Armstrong World Industries, Inc. (a) | 500 | | 19,465 |
Masco Corp. | 19,800 | | 273,438 |
Owens Corning (a) | 3,500 | | 89,740 |
| | 382,643 |
Commercial Services & Supplies - 0.4% |
Republic Services, Inc. | 4,245 | | 120,176 |
Construction & Engineering - 0.3% |
Fluor Corp. | 2,500 | | 112,600 |
Electrical Equipment - 0.4% |
Acuity Brands, Inc. | 1,500 | | 53,460 |
Regal-Beloit Corp. | 1,800 | | 93,492 |
| | 146,952 |
Industrial Conglomerates - 0.5% |
Textron, Inc. | 8,600 | | 161,766 |
Machinery - 2.6% |
Caterpillar, Inc. | 2,100 | | 119,679 |
Cummins, Inc. | 6,000 | | 275,160 |
Deere & Co. | 2,400 | | 129,816 |
Ingersoll-Rand Co. Ltd. | 8,800 | | 314,512 |
Navistar International Corp. (a) | 1,420 | | 54,883 |
| | 894,050 |
Road & Rail - 2.5% |
Avis Budget Group, Inc. (a) | 5,700 | | 74,784 |
Common Stocks - continued |
| Shares | | Value |
INDUSTRIALS - continued |
Road & Rail - continued |
CSX Corp. | 7,800 | | $ 378,222 |
Union Pacific Corp. | 6,600 | | 421,740 |
| | 874,746 |
TOTAL INDUSTRIALS | | 3,380,617 |
INFORMATION TECHNOLOGY - 7.8% |
Communications Equipment - 1.0% |
Cisco Systems, Inc. (a) | 10,900 | | 260,946 |
Juniper Networks, Inc. (a) | 3,200 | | 85,344 |
| | 346,290 |
Computers & Peripherals - 2.0% |
Hewlett-Packard Co. | 12,200 | | 628,422 |
NCR Corp. (a) | 6,900 | | 76,797 |
| | 705,219 |
Electronic Equipment & Components - 2.2% |
Agilent Technologies, Inc. (a) | 3,350 | | 104,085 |
Amphenol Corp. Class A | 900 | | 41,562 |
Arrow Electronics, Inc. (a) | 4,500 | | 133,245 |
Avnet, Inc. (a) | 7,654 | | 230,845 |
Flextronics International Ltd. (a) | 14,300 | | 104,533 |
Tyco Electronics Ltd. | 5,782 | | 141,948 |
| | 756,218 |
Internet Software & Services - 0.5% |
eBay, Inc. (a) | 7,000 | | 164,780 |
Semiconductors & Semiconductor Equipment - 1.8% |
Applied Materials, Inc. | 18,400 | | 256,496 |
Atmel Corp. (a) | 13,900 | | 64,079 |
KLA-Tencor Corp. | 2,100 | | 75,936 |
Lam Research Corp. (a) | 4,600 | | 180,366 |
MEMC Electronic Materials, Inc. (a) | 2,400 | | 32,688 |
| | 609,565 |
Software - 0.3% |
Microsoft Corp. | 4,100 | | 125,009 |
TOTAL INFORMATION TECHNOLOGY | | 2,707,081 |
MATERIALS - 3.4% |
Chemicals - 1.5% |
Albemarle Corp. | 3,610 | | 131,296 |
Celanese Corp. Class A | 3,300 | | 105,930 |
Dow Chemical Co. | 10,100 | | 279,063 |
| | 516,289 |
Construction Materials - 0.5% |
HeidelbergCement AG | 1,725 | | 119,109 |
Vulcan Materials Co. | 900 | | 47,403 |
| | 166,512 |
|
| Shares | | Value |
Containers & Packaging - 0.3% |
Owens-Illinois, Inc. (a) | 3,300 | | $ 108,471 |
Metals & Mining - 0.8% |
ArcelorMittal SA (NY Shares) Class A | 2,800 | | 128,100 |
Newcrest Mining Ltd. | 2,003 | | 63,566 |
Steel Dynamics, Inc. | 5,400 | | 95,688 |
| | 287,354 |
Paper & Forest Products - 0.3% |
Weyerhaeuser Co. | 2,395 | | 103,320 |
TOTAL MATERIALS | | 1,181,946 |
TELECOMMUNICATION SERVICES - 4.2% |
Diversified Telecommunication Services - 3.6% |
Qwest Communications International, Inc. | 25,200 | | 106,092 |
Verizon Communications, Inc. | 33,900 | | 1,123,107 |
| | 1,229,199 |
Wireless Telecommunication Services - 0.6% |
Sprint Nextel Corp. (a) | 61,200 | | 223,992 |
TOTAL TELECOMMUNICATION SERVICES | | 1,453,191 |
UTILITIES - 4.3% |
Electric Utilities - 2.2% |
Allegheny Energy, Inc. | 2,300 | | 54,004 |
American Electric Power Co., Inc. | 6,600 | | 229,614 |
Entergy Corp. | 2,500 | | 204,600 |
FirstEnergy Corp. | 5,700 | | 264,765 |
| | 752,983 |
Independent Power Producers & Energy Traders - 0.8% |
AES Corp. | 3,700 | | 49,247 |
Constellation Energy Group, Inc. | 3,300 | | 116,061 |
NRG Energy, Inc. (a) | 5,000 | | 118,050 |
| | 283,358 |
Multi-Utilities - 1.3% |
CMS Energy Corp. | 9,100 | | 142,506 |
PG&E Corp. | 3,900 | | 174,135 |
Sempra Energy | 2,200 | | 123,156 |
| | 439,797 |
TOTAL UTILITIES | | 1,476,138 |
TOTAL COMMON STOCKS (Cost $36,443,561) | 34,236,509 |
Convertible Preferred Stocks - 0.5% |
| | | |
FINANCIALS - 0.5% |
Commercial Banks - 0.2% |
Huntington Bancshares, Inc. 8.50% | 100 | | 84,000 |
Convertible Preferred Stocks - continued |
| Shares | | Value |
FINANCIALS - continued |
Diversified Financial Services - 0.3% |
Bank of America Corp. | 5,900 | | $ 88,028 |
TOTAL CONVERTIBLE PREFERRED STOCKS (Cost $157,800) | 172,028 |
Money Market Funds - 1.9% |
Fidelity Cash Central Fund, 0.16% (d) | 197,635 | | 197,635 |
Fidelity Securities Lending Cash Central Fund, 0.15% (b)(d) | 440,325 | | 440,325 |
TOTAL MONEY MARKET FUNDS (Cost $637,960) | 637,960 |
TOTAL INVESTMENT PORTFOLIO - 101.6% (Cost $37,239,321) | | 35,046,497 |
NET OTHER ASSETS - (1.6)% | | (538,134) |
NET ASSETS - 100% | $ 34,508,363 |
Legend |
(a) Non-income producing |
(b) Investment made with cash collateral received from securities on loan. |
(c) Security or a portion of the security is on loan at period end. |
(d) Affiliated fund that is available only to investment companies and other accounts managed by Fidelity Investments. The rate quoted is the annualized seven-day yield of the fund at period end. A complete unaudited listing of the fund's holdings as of its most recent quarter end is available upon request. |
Affiliated Central Funds |
Information regarding fiscal year to date income earned by the Fund from investments in Fidelity Central Funds is as follows: |
Fund | Income earned |
Fidelity Cash Central Fund | $ 757 |
Fidelity Securities Lending Cash Central Fund | 1,255 |
Total | $ 2,012 |
Other Information |
The following is a summary of the inputs used, as of December 31, 2009, involving the Fund's assets and liabilities carried at value. The inputs or methodology used for valuing securities may not be an indication of the risk associated with investing in those securities. For more information on valuation inputs, and their aggregation into the levels used in the table below, please refer to the Security Valuation section in the accompanying Notes to Financial Statements. |
Valuation Inputs at Reporting Date: |
Description | Total | Level 1 | Level 2 | Level 3 |
Investments in Securities: | | | | |
Equities: | | | | |
Consumer Discretionary | $ 3,034,125 | $ 3,034,125 | $ - | $ - |
Consumer Staples | 1,674,765 | 1,674,765 | - | - |
Energy | 6,369,559 | 6,369,559 | - | - |
Financials | 9,409,077 | 9,272,838 | 136,239 | - |
Health Care | 3,722,038 | 3,722,038 | - | - |
Industrials | 3,380,617 | 3,380,617 | - | - |
Information Technology | 2,707,081 | 2,707,081 | - | - |
Materials | 1,181,946 | 1,181,946 | - | - |
Telecommunication Services | 1,453,191 | 1,453,191 | - | - |
Utilities | 1,476,138 | 1,476,138 | - | - |
Money Market Funds | 637,960 | 637,960 | - | - |
Total Investments in Securities: | $ 35,046,497 | $ 34,910,258 | $ 136,239 | $ - |
Income Tax Information |
At December 31, 2009, the fund had a capital loss carryforward of approximately $23,281,217 of which $11,835,995 and $11,445,222 will expire on December 31, 2016 and 2017, respectively. |
See accompanying notes which are an integral part of the financial statements.
Annual Report
Statement of Assets and Liabilities
| December 31, 2009 |
Assets | | |
Investment in securities, at value (including securities loaned of $422,712) - See accompanying schedule: Unaffiliated issuers (cost $36,601,361) | $ 34,408,537 | |
Fidelity Central Funds (cost $637,960) | 637,960 | |
Total Investments (cost $37,239,321) | | $ 35,046,497 |
Receivable for investments sold | | 59,759 |
Receivable for fund shares sold | | 9,587 |
Dividends receivable | | 32,575 |
Distributions receivable from Fidelity Central Funds | | 59 |
Prepaid expenses | | 174 |
Other receivables | | 321 |
Total assets | | 35,148,972 |
| | |
Liabilities | | |
Payable for investments purchased | $ 36,291 | |
Payable for fund shares redeemed | 81,695 | |
Accrued management fee | 16,570 | |
Distribution fees payable | 420 | |
Other affiliated payables | 4,387 | |
Other payables and accrued expenses | 60,921 | |
Collateral on securities loaned, at value | 440,325 | |
Total liabilities | | 640,609 |
| | |
Net Assets | | $ 34,508,363 |
Net Assets consist of: | | |
Paid in capital | | $ 61,478,019 |
Undistributed net investment income | | 8,181 |
Accumulated undistributed net realized gain (loss) on investments and foreign currency transactions | | (24,764,957) |
Net unrealized appreciation (depreciation) on investments and assets and liabilities in foreign currencies | | (2,212,880) |
Net Assets | | $ 34,508,363 |
Statement of Assets and Liabilities - continued
| December 31, 2009 |
Initial Class:
Net Asset Value, offering price and redemption price per share ($12,825,654 ÷ 1,362,080 shares) | | $ 9.42 |
| | |
Service Class:
Net Asset Value, offering price and redemption price per share ($677,131 ÷ 71,946 shares) | | $ 9.41 |
| | |
Service Class 2:
Net Asset Value, offering price and redemption price per share ($1,756,358 ÷ 187,099 shares) | | $ 9.39 |
| | |
Investor Class:
Net Asset Value, offering price and redemption price per share ($19,249,220 ÷ 2,046,731 shares) | | $ 9.40 |
See accompanying notes which are an integral part of the financial statements.
Annual Report
Statement of Operations
| Year ended December 31, 2009 |
Investment Income | | |
Dividends | | $ 856,026 |
Interest | | 350 |
Income from Fidelity Central Funds | | 2,012 |
Total income | | 858,388 |
| | |
Expenses | | |
Management fee | $ 208,164 | |
Transfer agent fees | 55,223 | |
Distribution fees | 5,219 | |
Accounting and security lending fees | 14,483 | |
Custodian fees and expenses | 21,642 | |
Independent trustees' compensation | 274 | |
Audit | 40,663 | |
Legal | 237 | |
Miscellaneous | 3,458 | |
Total expenses before reductions | 349,363 | |
Expense reductions | (15,334) | 334,029 |
Net investment income (loss) | | 524,359 |
Realized and Unrealized Gain (Loss) Net realized gain (loss) on: | | |
Investment securities: | | |
Unaffiliated issuers | (8,605,676) | |
Foreign currency transactions | (773) | |
Total net realized gain (loss) | | (8,606,449) |
Change in net unrealized appreciation (depreciation) on: Investment securities | 16,401,566 | |
Assets and liabilities in foreign currencies | (61) | |
Total change in net unrealized appreciation (depreciation) | | 16,401,505 |
Net gain (loss) | | 7,795,056 |
Net increase (decrease) in net assets resulting from operations | | $ 8,319,415 |
Statement of Changes in Net Assets
| Year ended
December 31,
2009 | Year ended
December 31,
2008 |
Increase (Decrease) in Net Assets | | |
Operations | | |
Net investment income (loss) | $ 524,359 | $ 1,146,095 |
Net realized gain (loss) | (8,606,449) | (15,570,917) |
Change in net unrealized appreciation (depreciation) | 16,401,505 | (23,671,296) |
Net increase (decrease) in net assets resulting from operations | 8,319,415 | (38,096,118) |
Distributions to shareholders from net investment income | (567,198) | (1,069,463) |
Distributions to shareholders from net realized gain | - | (105,299) |
Total distributions | (567,198) | (1,174,762) |
Share transactions - net increase (decrease) | (18,654,274) | 6,466,333 |
Total increase (decrease) in net assets | (10,902,057) | (32,804,547) |
| | |
Net Assets | | |
Beginning of period | 45,410,420 | 78,214,967 |
End of period (including undistributed net investment income of $8,181 and undistributed net investment income of $43,927, respectively) | $ 34,508,363 | $ 45,410,420 |
See accompanying notes which are an integral part of the financial statements.
Annual Report
Financial Highlights - Initial Class
Years ended December 31, | 2009 | 2008 | 2007 | 2006 | 2005 |
Selected Per-Share Data | | | | | |
Net asset value, beginning of period | $ 7.49 | $ 13.89 | $ 14.82 | $ 13.30 | $ 12.28 |
Income from Investment Operations | | | | | |
Net investment income (loss) C | .12 | .20 | .20 | .15 | .13 |
Net realized and unrealized gain (loss) | 1.97 | (6.39) | .48 | 1.86 | 1.11 |
Total from investment operations | 2.09 | (6.19) | .68 | 2.01 | 1.24 |
Distributions from net investment income | (.16) | (.19) | (.21) | (.13) | (.07) |
Distributions from net realized gain | - | (.02) | (1.40) | (.37) | (.16) |
Total distributions | (.16) | (.21) | (1.61) | (.49) H | (.22) G |
Net asset value, end of period | $ 9.42 | $ 7.49 | $ 13.89 | $ 14.82 | $ 13.30 |
Total Return A,B | 27.91% | (44.61)% | 4.56% | 15.18% | 10.18% |
Ratios to Average Net Assets D,F | | | | | |
Expenses before reductions | .89% | .81% | .80% | .84% | .98% |
Expenses net of fee waivers, if any | .85% | .81% | .80% | .84% | .85% |
Expenses net of all reductions | .85% | .81% | .80% | .83% | .81% |
Net investment income (loss) | 1.48% | 1.79% | 1.27% | 1.09% | 1.00% |
Supplemental Data | | | | | |
Net assets, end of period (000 omitted) | $ 12,826 | $ 18,847 | $ 30,300 | $ 42,725 | $ 37,465 |
Portfolio turnover rate E | 58% | 95% | 98% | 94% | 75% |
A Total returns do not reflect charges attributable to your insurance company's separate account. Inclusion of these charges would reduce the total returns shown.
B Total returns would have been lower had certain expenses not been reduced during the periods shown.
C Calculated based on average shares outstanding during the period.
D Fees and expenses of the underlying Fidelity Central Funds are not included in the Fund's expense ratio. The Fund indirectly bears its proportionate share of the expenses of any underlying Fidelity Central Funds.
E Amount does not include the portfolio activity of any underlying Fidelity Central Funds.
F Expense ratios reflect operating expenses of the class. Expenses before reductions do not reflect amounts reimbursed by the investment adviser or reductions from brokerage service arrangements or reductions from other expense offset arrangements and do not represent the amount paid by the class during periods when reimbursements or reductions occur. Expenses net of fee waivers reflect expenses after reimbursement by the investment adviser but prior to reductions from brokerage service arrangements or other expense offset arrangements. Expenses net of all reductions represent the net expenses paid by the class.
G Total distributions of $.22 per share is comprised of distributions from net investment income of $.066 and distributions from net realized gain of $.155 per share.
H Total distributions of $.49 per share is comprised of distributions from net investment income of $.129 and distributions from net realized gain of $.365 per share.
Financial Highlights - Service Class
Years ended December 31, | 2009 | 2008 | 2007 | 2006 | 2005 |
Selected Per-Share Data | | | | | |
Net asset value, beginning of period | $ 7.48 | $ 13.86 | $ 14.80 | $ 13.28 | $ 12.26 |
Income from Investment Operations | | | | | |
Net investment income (loss) C | .11 | .19 | .18 | .14 | .10 |
Net realized and unrealized gain (loss) | 1.96 | (6.38) | .48 | 1.86 | 1.13 |
Total from investment operations | 2.07 | (6.19) | .66 | 2.00 | 1.23 |
Distributions from net investment income | (.14) | (.17) | (.20) | (.12) | (.05) |
Distributions from net realized gain | - | (.02) | (1.40) | (.37) | (.16) |
Total distributions | (.14) | (.19) | (1.60) | (.48) H | (.21) G |
Net asset value, end of period | $ 9.41 | $ 7.48 | $ 13.86 | $ 14.80 | $ 13.28 |
Total Return A,B | 27.80% | (44.69)% | 4.43% | 15.11% | 10.10% |
Ratios to Average Net Assets D,F | | | | | |
Expenses before reductions | .97% | .90% | .89% | .93% | 1.42% |
Expenses net of fee waivers, if any | .95% | .90% | .89% | .93% | .97% |
Expenses net of all reductions | .95% | .90% | .89% | .93% | .93% |
Net investment income (loss) | 1.38% | 1.70% | 1.18% | 1.00% | .78% |
Supplemental Data | | | | | |
Net assets, end of period (000 omitted) | $ 677 | $ 956 | $ 2,577 | $ 2,458 | $ 2,137 |
Portfolio turnover rate E | 58% | 95% | 98% | 94% | 75% |
A Total returns do not reflect charges attributable to your insurance company's separate account. Inclusion of these charges would reduce the total returns shown.
B Total returns would have been lower had certain expenses not been reduced during the periods shown.
C Calculated based on average shares outstanding during the period.
D Fees and expenses of the underlying Fidelity Central Funds are not included in the Fund's expense ratio. The Fund indirectly bears its proportionate share of the expenses of any underlying Fidelity Central Funds.
E Amount does not include the portfolio activity of any underlying Fidelity Central Funds.
F Expense ratios reflect operating expenses of the class. Expenses before reductions do not reflect amounts reimbursed by the investment adviser or reductions from brokerage service arrangements or reductions from other expense offset arrangements and do not represent the amount paid by the class during periods when reimbursements or reductions occur. Expenses net of fee waivers reflect expenses after reimbursement by the investment adviser but prior to reductions from brokerage service arrangements or other expense offset arrangements. Expenses net of all reductions represent the net expenses paid by the class.
G Total distributions of $.21 per share is comprised of distributions from net investment income of $.054 and distributions from net realized gain of $.155 per share.
H Total distributions of $.48 per share is comprised of distributions from net investment income of $.116 and distributions from net realized gain of $.365 per share.
See accompanying notes which are an integral part of the financial statements.
Annual Report
Financial Highlights - Service Class 2
Years ended December 31, | 2009 | 2008 | 2007 | 2006 | 2005 |
Selected Per-Share Data | | | | | |
Net asset value, beginning of period | $ 7.46 | $ 13.80 | $ 14.75 | $ 13.25 | $ 12.23 |
Income from Investment Operations | | | | | |
Net investment income (loss) C | .10 | .18 | .15 | .12 | .08 |
Net realized and unrealized gain (loss) | 1.96 | (6.35) | .48 | 1.84 | 1.13 |
Total from investment operations | 2.06 | (6.17) | .63 | 1.96 | 1.21 |
Distributions from net investment income | (.13) | (.15) | (.18) | (.10) | (.04) |
Distributions from net realized gain | - | (.02) | (1.40) | (.37) | (.16) |
Total distributions | (.13) | (.17) | (1.58) | (.46) H | (.19) G |
Net asset value, end of period | $ 9.39 | $ 7.46 | $ 13.80 | $ 14.75 | $ 13.25 |
Total Return A,B | 27.70% | (44.77)% | 4.22% | 14.86% | 9.98% |
Ratios to Average Net Assets D,F | | | | | |
Expenses before reductions | 1.12% | 1.05% | 1.07% | 1.14% | 1.60% |
Expenses net of fee waivers, if any | 1.10% | 1.05% | 1.07% | 1.10% | 1.12% |
Expenses net of all reductions | 1.10% | 1.05% | 1.06% | 1.09% | 1.08% |
Net investment income (loss) | 1.23% | 1.55% | 1.01% | .83% | .63% |
Supplemental Data | | | | | |
Net assets, end of period (000 omitted) | $ 1,756 | $ 2,001 | $ 5,724 | $ 4,467 | $ 2,957 |
Portfolio turnover rate E | 58% | 95% | 98% | 94% | 75% |
A Total returns do not reflect charges attributable to your insurance company's separate account. Inclusion of these charges would reduce the total returns shown.
B Total returns would have been lower had certain expenses not been reduced during the periods shown.
C Calculated based on average shares outstanding during the period.
D Fees and expenses of the underlying Fidelity Central Funds are not included in the Fund's expense ratio. The Fund indirectly bears its proportionate share of the expenses of any underlying Fidelity Central Funds.
E Amount does not include the portfolio activity of any underlying Fidelity Central Funds.
F Expense ratios reflect operating expenses of the class. Expenses before reductions do not reflect amounts reimbursed by the investment adviser or reductions from brokerage service arrangements or reductions from other expense offset arrangements and do not represent the amount paid by the class during periods when reimbursements or reductions occur. Expenses net of fee waivers reflect expenses after reimbursement by the investment adviser but prior to reductions from brokerage service arrangements or other expense offset arrangements. Expenses net of all reductions represent the net expenses paid by the class.
G Total distributions of $.19 per share is comprised of distributions from net investment income of $.036 and distributions from net realized gain of $.155 per share.
H Total distributions of $.46 per share is comprised of distributions from net investment income of $.099 and distributions from net realized gain of $.365 per share.
Financial Highlights - Investor Class
Years ended December 31, | 2009 | 2008 | 2007 | 2006 | 2005 H |
Selected Per-Share Data | | | | | |
Net asset value, beginning of period | $ 7.48 | $ 13.87 | $ 14.81 | $ 13.30 | $ 12.72 |
Income from Investment Operations | | | | | |
Net investment income (loss) E | .11 | .19 | .18 | .14 | .05 |
Net realized and unrealized gain (loss) | 1.96 | (6.38) | .48 | 1.86 | .61 |
Total from investment operations | 2.07 | (6.19) | .66 | 2.00 | .66 |
Distributions from net investment income | (.15) | (.18) | (.20) | (.12) | (.05) |
Distributions from net realized gain | - | (.02) | (1.40) | (.37) | (.03) |
Total distributions | (.15) | (.20) | (1.60) | (.49) K | (.08) J |
Net asset value, end of period | $ 9.40 | $ 7.48 | $ 13.87 | $ 14.81 | $ 13.30 |
Total Return B,C,D | 27.72% | (44.67)% | 4.41% | 15.06% | 5.20% |
Ratios to Average Net Assets F,I | | | | | |
Expenses before reductions | .97% | .90% | .91% | .97% | 1.15% A |
Expenses net of fee waivers, if any | .93% | .90% | .91% | .97% | 1.00% A |
Expenses net of all reductions | .93% | .90% | .91% | .96% | .96% A |
Net investment income (loss) | 1.40% | 1.71% | 1.16% | .96% | .87% A |
Supplemental Data | | | | | |
Net assets, end of period (000 omitted) | $ 19,249 | $ 23,606 | $ 39,614 | $ 28,274 | $ 4,279 |
Portfolio turnover rate G | 58% | 95% | 98% | 94% | 75% |
A Annualized
B Total returns for periods of less than one year are not annualized.
C Total returns do not reflect charges attributable to your insurance company's separate account. Inclusion of these charges would reduce the total returns shown.
D Total returns would have been lower had certain expenses not been reduced during the periods shown.
E Calculated based on average shares outstanding during the period.
F Fees and expenses of the underlying Fidelity Central Funds are not included in the Fund's expense ratio. The Fund indirectly bears its proportionate share of the expenses of any underlying Fidelity Central Funds.
G Amount does not include the portfolio activity of any underlying Fidelity Central Funds.
H For the period July 21, 2005 (commencement of sale of shares) to December 31, 2005.
I Expense ratios reflect operating expenses of the class. Expenses before reductions do not reflect amounts reimbursed by the investment adviser or reductions from brokerage service arrangements or reductions from other expense offset arrangements and do not represent the amount paid by the class during periods when reimbursements or reductions occur. Expense ratios before reductions for start-up periods may not be representative of longer-term operating periods. Expenses net of fee waivers reflect expenses after reimbursement by the investment adviser but prior to reductions from brokerage service arrangements or other expense offset arrangements. Expenses net of all reductions represent the net expenses paid by the class.
J Total distributions of $.08 per share is comprised of distributions from net investment income of $.053 and distributions from net realized gain of $.030 per share.
K Total distributions of $.49 per share is comprised of distributions from net investment income of $.123 and distributions from net realized gain of $.365 per share.
See accompanying notes which are an integral part of the financial statements.
Annual Report
Notes to Financial Statements
For the period ended December 31, 2009
1. Organization.
VIP Value Leaders Portfolio (the Fund) is a fund of Variable Insurance Products Fund IV (the trust) and is authorized to issue an unlimited number of shares. The trust is registered under the Investment Company Act of 1940, as amended (the 1940 Act), as an open-end management investment company organized as a Massachusetts business trust. Shares of the Fund may only be purchased by insurance companies for the purpose of funding variable annuity or variable life insurance contracts. The Fund offers the following classes of shares: Initial Class shares, Service Class shares, Service Class 2 shares and Investor Class shares. All classes have equal rights and voting privileges, except for matters affecting a single class. Investment income, realized and unrealized capital gains and losses, the common expenses of the Fund, and certain fund-level expense reductions, if any, are allocated on a pro-rata basis to each class based on the relative net assets of each class to the total net assets of the Fund. Each class differs with respect to transfer agent and distribution and service plan fees incurred. Certain expense reductions also differ by class.
2. Investments in Fidelity Central Funds.
The Fund may invest in Fidelity Central Funds, which are open-end investment companies available only to other investment companies and accounts managed by Fidelity Management & Research Company (FMR) and its affiliates. The Fund's Schedule of Investments lists each of the Fidelity Central Funds held as of period end, if any, as an investment of the Fund, but does not include the underlying holdings of each Fidelity Central Fund. As an Investing Fund, the Fund indirectly bears its proportionate share of the expenses of the underlying Fidelity Central Funds.
The Money Market Central Funds seek preservation of capital and current income and are managed by Fidelity Investments Money Management, Inc. (FIMM), an affiliate of FMR.
A complete unaudited list of holdings for each Fidelity Central Fund is available upon request or at the Securities and Exchange Commission (the SEC) web site at www.sec.gov. In addition, the financial statements of the Fidelity Central Funds, which are not covered by the Fund's Report of Independent Registered Public Accounting Firm, are available on the SEC web site or upon request.
3. Significant Accounting Policies.
The financial statements have been prepared in conformity with accounting principles generally accepted in the United States of America, which require management to make certain estimates and assumptions at the date of the financial statements. Actual results could differ from those estimates. Events or transactions occurring after period end through the date that the financial statements were issued, February 16, 2010, have been evaluated in the preparation of the financial statements. The following summarizes the significant accounting policies of the Fund:
Security Valuation. Investments are valued as of 4:00 p.m. Eastern time on the last calendar day of the period. The Fund uses independent pricing services approved by the Board of Trustees to value its investments. When current market prices or quotations are not readily available or reliable, valuations may be determined in good faith in accordance with procedures adopted by the Board of Trustees. Factors used in determining value may include significant market or security specific events. The frequency with which these procedures are used cannot be predicted and may be utilized to a significant extent. The value used for net asset value (NAV) calculation under these procedures may differ from published prices for the same securities.
The Fund categorizes the inputs to valuation techniques used to value its investments into a disclosure hierarchy consisting of three levels as shown below.
Level 1 - quoted prices in active markets for identical investments
Level 2 - other significant observable inputs (including quoted prices for similar investments, interest rates, prepayment speeds, etc.)
Level 3 - unobservable inputs (including the fund's own assumptions based on the best information available)
Changes in valuation techniques may result in transfers in or out of an assigned level within the disclosure hierarchy. The aggregate value of investments by input level, as of December 31, 2009, is included at the end of the Fund's Schedule of Investments. Valuation techniques used to value the Fund's investments by major category are as follows.
Equity securities, including restricted securities, for which market quotations are readily available, are valued at the last reported sale price or official closing price as reported by an independent pricing service on the primary market or exchange on which they are traded and are categorized as level 1 in the hierarchy. In the event there were no sales during the day or closing prices are not available, securities are valued at the last quoted bid price or may be valued using the last available price and categorized as Level 2 in the hierarchy. For foreign equity securities, when significant market or security events arise, comparisons to the valuation of American Depository Receipts (ADRs), futures contracts, exchange-traded funds (ETFs) and certain indexes as well as quoted prices for similar securities are used and are categorized as Level 2 in the hierarchy in these circumstances. For restricted securities and private placements where observable inputs are limited, assumptions about market activity and risk are used and are categorized as level 3 in the hierarchy.
Annual Report
Notes to Financial Statements - continued
3. Significant Accounting Policies - continued
Security Valuation - continued
Investments in open-end mutual funds, including the Fidelity Money Market Central Funds, are valued at their closing net asset value each business day and are categorized as Level 1 in the hierarchy. Short-term securities with remaining maturities of sixty days or less for which quotations are not readily available are valued at amortized cost, which approximates value and are categorized as level 2 in the hierarchy.
Foreign Currency. The Fund uses foreign currency contracts to facilitate transactions in foreign-denominated securities. Losses from these transactions may arise from changes in the value of the foreign currency or if the counterparties do not perform under the contracts' terms.
Foreign-denominated assets, including investment securities, and liabilities are translated into U.S. dollars at the exchange rate at period end. Purchases and sales of investment securities, income and dividends received and expenses denominated in foreign currencies are translated into U.S. dollars at the exchange rate in effect on the transaction date.
The effects of exchange rate fluctuations on investments are included with the net realized and unrealized gain (loss) on investment securities. Other foreign currency transactions resulting in realized and unrealized gain (loss) are disclosed separately.
Investment Transactions and Income. For financial reporting purposes, the Fund's investment holdings and NAV include trades executed through the end of the last business day of the period. The NAV per share for processing shareholder transactions is calculated as of the close of business of the New York Stock Exchange (NYSE), normally 4:00 p.m. Eastern time and includes trades executed through the end of the prior business day. Gains and losses on securities sold are determined on the basis of identified cost and may include proceeds received from litigation. Dividend income is recorded on the ex-dividend date, except for certain dividends from foreign securities where the ex-dividend date may have passed, which are recorded as soon as the Fund is informed of the ex-dividend date. Non-cash dividends included in dividend income, if any, are recorded at the fair market value of the securities received. Distributions received on securities that represent a return of capital or capital gain are recorded as a reduction of cost of investments and/or as a realized gain. The Fund estimates the components of distributions received that may be considered return of capital distributions or capital gain distributions. Interest income and distributions from the Fidelity Central Funds are accrued as earned. Interest income includes coupon interest and amortization of premium and accretion of discount on debt securities. Investment income is recorded net of foreign taxes withheld where recovery of such taxes is uncertain.
Expenses. Most expenses of the trust can be directly attributed to a fund. Expenses which cannot be directly attributed are apportioned among each Fund in the trust. Expense estimates are accrued in the period to which they relate and adjustments are made when actual amounts are known.
Income Tax Information and Distributions to Shareholders. Each year, the Fund intends to qualify as a regulated investment company by distributing substantially all of its taxable income and realized gains under Subchapter M of the Internal Revenue Code and filing its U.S. federal tax return. As a result, no provision for income taxes is required. As of December 31, 2009, the Fund did not have any unrecognized tax benefits in the accompanying financial statements. A Fund's federal tax return is subject to examination by the Internal Revenue Service (IRS) for a period of three years. Foreign taxes are provided for based on the Fund's understanding of the tax rules and rates that exist in the foreign markets in which it invests.
Distributions are recorded on the ex-dividend date. Income dividends and capital gain distributions are declared separately for each class. Income and capital gain distributions are determined in accordance with income tax regulations, which may differ from generally accepted accounting principles.
Capital accounts within the financial statements are adjusted for permanent book-tax differences. These adjustments have no impact on net assets or the results of operations. Temporary book-tax differences will reverse in a subsequent period.
Book-tax differences are primarily due to the short-term gain distributions from the Fidelity Central Funds, foreign currency transactions, partnerships, capital loss carryforwards and losses deferred due to wash sales and excise tax regulations.
The federal tax cost of investment securities and unrealized appreciation (depreciation) as of period end were as follows:
Gross unrealized appreciation | $ 4,389,385 |
Gross unrealized depreciation | (7,940,159) |
Net unrealized appreciation (depreciation) | $ (3,550,774) |
| |
Tax Cost | $ 38,597,271 |
The tax-based components of distributable earnings as of period end were as follows:
Undistributed ordinary income | $ 8,181 |
Capital loss carryforward | $ (23,281,217) |
Net unrealized appreciation (depreciation) | $ (3,570,830) |
Annual Report
3. Significant Accounting Policies - continued
Income Tax Information and Distributions to Shareholders - continued
The tax character of distributions paid was as follows:
| December 31, 2009 | December 31, 2008 |
Ordinary Income | $ 567,198 | $ 1,174,762 |
4. Purchases and Sales of Investments.
Purchases and sales of securities, other than short-term securities, aggregated $21,314,310 and $39,897,914, respectively.
5. Fees and Other Transactions with Affiliates.
Management Fee. FMR and its affiliates provide the Fund with investment management related services for which the Fund pays a monthly management fee. The management fee is the sum of an individual fund fee rate that is based on an annual rate of .30% of the Fund's average net assets and a group fee rate that averaged .26% during the period. The group fee rate is based upon the average net assets of all the mutual funds advised by FMR. The group fee rate decreases as assets under management increase and increases as assets under management decrease. For the period, the total annual management fee rate was .56% of the Fund's average net assets.
Distribution and Service Plan. In accordance with Rule 12b-1 of the 1940 Act, the Fund has adopted separate 12b-1 Plans for each Service Class of shares. Each Service Class pays Fidelity Distributors Corporation (FDC), an affiliate of FMR, a service fee. For the period, the service fee is based on an annual rate of .10% of Service Class' average net assets and .25% of Service Class 2's average net assets.
For the period, each class paid FDC the following amounts, all of which were re-allowed to insurance companies for the distribution of shares and providing shareholder support services:
Service Class | $ 761 |
Service Class 2 | 4,458 |
| $ 5,219 |
Transfer Agent Fees. Fidelity Investments Institutional Operations Company, Inc. (FIIOC), an affiliate of FMR, is the Fund's transfer, dividend disbursing, and shareholder servicing agent. FIIOC receives an asset-based fee with respect to each class. Each class (with the exception of Investor Class) pays a transfer agent fee, excluding out of pocket expenses, equal to an annual rate of .07% of average net assets. Investor Class pays a monthly asset-based transfer agent fee of .15% of average net assets. The total transfer agent fees paid by each class to FIIOC, including out of pocket expenses, were as follows:
Initial Class | $ 14,903 |
Service Class | 682 |
Service Class 2 | 1,489 |
Investor Class | 38,149 |
| $ 55,223 |
Accounting and Security Lending Fees. Fidelity Service Company, Inc. (FSC), an affiliate of FMR, maintains the Fund's accounting records. The accounting fee is based on the level of average net assets for the month. Under a separate contract, FSC administers the security lending program. The security lending fee is based on the number and duration of lending transactions.
Brokerage Commissions. The Fund placed a portion of its portfolio transactions with brokerage firms which are affiliates of the investment adviser. The commissions paid to these affiliated firms were $3,712 for the period.
Annual Report
Notes to Financial Statements - continued
6. Committed Line of Credit.
The Fund participates with other funds managed by FMR in a $3.5 billion credit facility (the "line of credit") to be utilized for temporary or emergency purposes to fund shareholder redemptions or for other short-term liquidity purposes. The Fund has agreed to pay commitment fees on its pro-rata portion of the line of credit, which amounted to $215 and is reflected in Miscellaneous Expense on the Statement of Operations. During the period, there were no borrowings on this line of credit.
7. Security Lending.
The Fund lends portfolio securities from time to time in order to earn additional income. On the settlement date of the loan, the Fund receives collateral (in the form of U.S. Treasury obligations, letters of credit and/or cash) against the loaned securities and maintains collateral in an amount not less than 100% of the market value of the loaned securities during the period of the loan. The market value of the loaned securities is determined at the close of business of the Fund and any additional required collateral is delivered to the Fund on the next business day. If the borrower defaults on its obligation to return the securities loaned because of insolvency or other reasons, a fund could experience delays and costs in recovering the securities loaned or in gaining access to the collateral. Any cash collateral received is invested in the Fidelity Securities Lending Cash Central Fund. The value of loaned securities and cash collateral at period end are disclosed on the Fund's Statement of Assets and Liabilities. Security lending income represents the income earned on investing cash collateral, less fees and expenses associated with the loan, plus any premium payments that may be received on the loan of certain types of securities. Security lending income is presented in the Statement of Operations as a component of income from Fidelity Central Funds. Net income from lending portfolio securities during the period amounted to $1,255.
8. Expense Reductions.
FMR voluntarily agreed to reimburse each class to the extent annual operating expenses exceeded certain levels of average net assets as noted in the table below. Some expenses, for example interest expense, including commitment fees, are excluded from this reimbursement.
The following classes were in reimbursement during the period:
| Expense
Limitations | Reimbursement
from adviser |
Initial Class | .85% | $ 5,036 |
Service Class | .95% | 167 |
Service Class 2 | 1.10% | 292 |
Investor Class | .93% | 8,476 |
| | $ 13,971 |
Many of the brokers with whom FMR places trades on behalf of the Fund provided services to the Fund in addition to trade execution. These services included payments of certain expenses on behalf of the Fund totaling $1,363 for the period.
9. Distributions to Shareholders.
Distributions to shareholders of each class were as follows:
Years ended December 31, | 2009 | 2008 |
From net investment income | | |
Initial Class | $ 219,670 | $ 460,521 |
Service Class | 10,712 | 21,104 |
Service Class 2 | 24,668 | 38,328 |
Investor Class | 312,148 | 549,510 |
Total | $ 567,198 | $ 1,069,463 |
From net realized gain | | |
Initial Class | $ - | $ 38,367 |
Service Class | - | 3,720 |
Service Class 2 | - | 8,161 |
Investor Class | - | 55,051 |
Total | $ - | $ 105,299 |
Annual Report
10. Share Transactions.
Transactions for each class of shares were as follows:
| Shares | Dollars |
Years ended December 31, | 2009 | 2008 | 2009 | 2008 |
Initial Class | | | | |
Shares sold | 239,960 | 1,249,574 | $ 1,819,515 | $ 15,002,246 |
Reinvestment of distributions | 24,543 | 66,157 | 219,670 | 498,888 |
Shares redeemed | (1,420,346) | (979,932) | (10,917,966) | (10,972,093) |
Net increase (decrease) | (1,155,843) | 335,799 | $ (8,878,781) | $ 4,529,041 |
Service Class | | | | |
Reinvestment of distributions | 1,203 | 3,185 | 10,712 | 24,823 |
Shares redeemed | (57,024) | (61,406) | (445,124) | (584,123) |
Net increase (decrease) | (55,821) | (58,221) | $ (434,412) | $ (559,300) |
Service Class 2 | | | | |
Shares sold | 85,657 | 45,542 | $ 640,879 | $ 514,841 |
Reinvestment of distributions | 2,768 | 5,912 | 24,668 | 46,489 |
Shares redeemed | (169,508) | (198,033) | (1,319,098) | (2,015,823) |
Net increase (decrease) | (81,083) | (146,579) | $ (653,551) | $ (1,454,493) |
Investor Class | | | | |
Shares sold | 494,371 | 1,143,976 | $ 3,783,197 | $ 13,354,389 |
Reinvestment of distributions | 34,870 | 79,773 | 312,148 | 604,561 |
Shares redeemed | (1,639,748) | (923,568) | (12,782,875) | (10,007,865) |
Net increase (decrease) | (1,110,507) | 300,181 | $ (8,687,530) | $ 3,951,085 |
11. Other.
The Fund's organizational documents provide former and current trustees and officers with a limited indemnification against liabilities arising in connection with the performance of their duties to the Fund. In the normal course of business, the Fund may also enter into contracts that provide general indemnifications. The Fund's maximum exposure under these arrangements is unknown as this would be dependent on future claims that may be made against the Fund. The risk of material loss from such claims is considered remote.
At the end of the period, FMR or its affiliates were the owners of record of 95% of the total outstanding shares of the Fund.
Annual Report
Report of Independent Registered Public Accounting Firm
To the Trustees of Variable Insurance Products Fund IV and the Shareholders of VIP Value Leaders Portfolio:
In our opinion, the accompanying statement of assets and liabilities, including the schedule of investments, and the related statements of operations and of changes in net assets and the financial highlights present fairly, in all material respects, the financial position of VIP Value Leaders Portfolio (a fund of Variable Insurance Products Fund IV) at December 31, 2009, the results of its operations for the year then ended, the changes in its net assets for each of the two years in the period then ended and the financial highlights for each of the periods indicated, in conformity with accounting principles generally accepted in the United States of America. These financial statements and financial highlights (hereafter referred to as "financial statements") are the responsibility of the VIP Value Leaders Portfolio's management. Our responsibility is to express an opinion on these financial statements based on our audits. We conducted our audits of these financial statements in accordance with the standards of the Public Company Accounting Oversight Board (United States). Those standards require that we plan and perform the audit to obtain reasonable assurance about whether the financial statements are free of material misstatement. An audit includes examining, on a test basis, evidence supporting the amounts and disclosures in the financial statements, assessing the accounting principles used and significant estimates made by management, and evaluating the overall financial statement presentation. We believe that our audits, which included confirmation of securities at December 31, 2009 by correspondence with the custodian and brokers, provide a reasonable basis for our opinion.
/s/ PricewaterhouseCoopers LLP
PricewaterhouseCoopers LLP
Boston, Massachusetts
February 16, 2010
Annual Report
The Trustees, Member of the Advisory Board, and executive officers of the trust and fund, as applicable, are listed below. The Board of Trustees governs the fund and is responsible for protecting the interests of shareholders. The Trustees are experienced executives who meet periodically throughout the year to oversee the fund's activities, review contractual arrangements with companies that provide services to the fund, and review the fund's performance. Except for James C. Curvey, each of the Trustees oversees 222 funds advised by FMR or an affiliate. Mr. Curvey oversees 410 funds advised by FMR or an affiliate.
The Trustees hold office without limit in time except that (a) any Trustee may resign; (b) any Trustee may be removed by written instrument, signed by at least two-thirds of the number of Trustees prior to such removal; (c) any Trustee who requests to be retired or who has become incapacitated by illness or injury may be retired by written instrument signed by a majority of the other Trustees; and (d) any Trustee may be removed at any special meeting of shareholders by a two-thirds vote of the outstanding voting securities of the trust. Each Trustee who is not an interested person (as defined in the 1940 Act) (Independent Trustee), shall retire not later than the last day of the calendar year in which his or her 72nd birthday occurs. The Independent Trustees may waive this mandatory retirement age policy with respect to individual Trustees. The executive officers and Advisory Board Member hold office without limit in time, except that any officer and Advisory Board Member may resign or may be removed by a vote of a majority of the Trustees at any regular meeting or any special meeting of the Trustees. Except as indicated, each individual has held the office shown or other offices in the same company for the past five years.
The fund's Statement of Additional Information (SAI) includes more information about the Trustees. To request a free copy, call Fidelity at 1-877-208-0098.
Interested Trustees*:
Correspondence intended for each Trustee who is an interested person may be sent to Fidelity Investments, 82 Devonshire Street, Boston, Massachusetts 02109.
Name, Age; Principal Occupation |
Edward C. Johnson 3d (79) |
| Year of Election or Appointment: 1983 Mr. Johnson is Trustee and Chairman of the Board of Trustees of certain Trusts. Mr. Johnson serves as Chief Executive Officer, Chairman, and a Director of FMR LLC; Chairman and a Director of FMR; Chairman and a Director of Fidelity Research & Analysis Company (FRAC); Chairman and a Director of Fidelity Investments Money Management, Inc.; and Chairman and a Director of FMR Co., Inc. In addition, Mr. Johnson serves as Chairman and Director of FIL Limited. Previously, Mr. Johnson served as President of FMR LLC (2006-2007). |
James C. Curvey (74) |
| Year of Election or Appointment: 2007 Mr. Curvey also serves as Trustee (2007-present) of other investment companies advised by FMR. Mr. Curvey is a Director of FMR and FMR Co., Inc. (2007-present). Mr. Curvey is also Vice Chairman (2006-present) and Director of FMR LLC. In addition, Mr. Curvey serves as an Overseer for the Boston Symphony Orchestra and a member of the Trustees of Villanova University. |
* Trustees have been determined to be "Interested Trustees" by virtue of, among other things, their affiliation with the trust or various entities under common control with FMR.
Independent Trustees:
Correspondence intended for each Independent Trustee (that is, the Trustees other than the Interested Trustees) may be sent to Fidelity Investments, P.O. Box 55235, Boston, Massachusetts 02205-5235.
Name, Age; Principal Occupation |
Dennis J. Dirks (61) |
| Year of Election or Appointment: 2005 Prior to his retirement in May 2003, Mr. Dirks was Chief Operating Officer and a member of the Board of The Depository Trust & Clearing Corporation (DTCC). He also served as President, Chief Operating Officer, and Board member of The Depository Trust Company (DTC) and President and Board member of the National Securities Clearing Corporation (NSCC). In addition, Mr. Dirks served as Chief Executive Officer and Board member of the Government Securities Clearing Corporation, Chief Executive Officer and Board member of the Mortgage-Backed Securities Clearing Corporation, as a Trustee and a member of the Finance Committee of Manhattan College (2005-2008), and as a Trustee and a member of the Finance Committee of AHRC of Nassau County (2006-2008). Currently, Mr. Dirks serves as a member of the Board of Directors for The Brookville Center for Children's Services, Inc. (2009-present). |
Alan J. Lacy (56) |
| Year of Election or Appointment: 2008 Mr. Lacy serves as Senior Adviser (2007-present) of Oak Hill Capital Partners, L.P. (private equity). Mr. Lacy also served as Chief Executive Officer (2000-2005) and Vice Chairman (2005-2006) of Sears Holdings Corporation and Sears, Roebuck and Co. (retail). In addition, Mr. Lacy serves as a member of the Board of Directors of The Western Union Company (global money transfer, 2006-present) and Bristol-Myers Squibb Company (global pharmaceuticals, 2007-present). Mr. Lacy is Chairman (2008-present) and a member (2006-present) of the Board of Trustees of The National Parks Conservation Association. |
Ned C. Lautenbach (65) |
| Year of Election or Appointment: 2000 Mr. Lautenbach is Chairman of the Independent Trustees of the Equity and High Income Funds (2006-present). Mr. Lautenbach is an Advisory Partner of Clayton, Dubilier & Rice, Inc. (private equity investment). Previously, Mr. Lautenbach was with the International Business Machines Corporation (IBM) from 1968 until his retirement in 1998. Mr. Lautenbach serves as a Director of Eaton Corporation (diversified industrial) as well as the Philharmonic Center for the Arts in Naples, Florida. Mr. Lautenbach is also a member of the Board of Trustees of Fairfield University (2005-present), as well as a member of the Council on Foreign Relations. Previously, Mr. Lautenbach served as a Director of Sony Corporation (2006-2007). |
Joseph Mauriello (65) |
| Year of Election or Appointment: 2008 Prior to his retirement in January 2006, Mr. Mauriello served in numerous senior management positions including Deputy Chairman and Chief Operating Officer (2004-2005), and Vice Chairman of Financial Services (2002-2004) of KPMG LLP US (professional services, 1965-2005). Mr. Mauriello currently serves as a member of the Board of Directors of XL Capital Ltd. (global insurance and re-insurance, 2006-present) and of Arcadia Resources Inc. (health care services and products, 2007-present). Previously, Mr. Mauriello served as a Director of the Hamilton Funds of the Bank of New York (2006-2007). |
Cornelia M. Small (65) |
| Year of Election or Appointment: 2005 Ms. Small is a member of the Board of Directors of the Teagle Foundation (2009-present). Ms. Small is also a member of the Investment Committee, and Chair (2008-present) and a member of the Board of Trustees of Smith College. In addition, Ms. Small serves on the Investment Committee of the Berkshire Taconic Community Foundation (2008-present). Previously, Ms. Small served as Chairperson of the Investment Committee (2002-2008) of Smith College. In addition, Ms. Small served as Chief Investment Officer, Director of Global Equity Investments, and a member of the Board of Directors of Scudder, Stevens & Clark and Scudder Kemper Investments. |
William S. Stavropoulos (70) |
| Year of Election or Appointment: 2001 Mr. Stavropoulos serves as President and Founder of the Michigan Baseball Foundation, the Great Lakes Loons (2007-present). Mr. Stavropoulos is Chairman Emeritus of the Board of Directors of The Dow Chemical Company, where he previously served in numerous senior management positions, including President, CEO (1995-2000; 2002-2004), Chairman of the Executive Committee (2000-2006), and as a member of the Board of Directors (1990-2006). Currently, Mr. Stavropoulos is a Director of Teradata Corporation (data warehousing and technology solutions, 2008-present), Chemical Financial Corporation, Maersk Inc. (industrial conglomerate), Tyco International, Inc. (multinational manufacturing and services, 2007-present), and a member of the Advisory Board for Metalmark Capital (private equity investment, 2005-present). Mr. Stavropoulos is a special advisor to Clayton, Dubilier & Rice, Inc. (private equity investment). In addition, Mr. Stavropoulos is a member of the University of Notre Dame Advisory Council for the College of Science. |
David M. Thomas (60) |
| Year of Election or Appointment: 2008 Previously, Mr. Thomas served as Executive Chairman (2005-2006) and Chairman and Chief Executive Officer (2000-2005) of IMS Health, Inc. (pharmaceutical and healthcare information solutions). In addition, Mr. Thomas serves as a member of the Board of Directors of Fortune Brands, Inc. (consumer products), and Interpublic Group of Companies, Inc. (marketing communication, 2004-present). |
Michael E. Wiley (59) |
| Year of Election or Appointment: 2008 Mr. Wiley also serves as a Director of Asia Pacific Exploration Consolidated (international oil and gas exploration and production, 2008-present), and as a member of the Board of Trustees of the University of Tulsa (2000-2006; 2007-present). Mr. Wiley serves as a Director of Tesoro Corporation (independent oil refiner and marketer, 2005-present), and a Director of Bill Barrett Corporation (exploration and production, 2005-present). In addition, Mr. Wiley also serves as a Director of Post Oak Bank (privately-held bank, 2004-present). Previously, Mr. Wiley served as a Sr. Energy Advisor of Katzenbach Partners, LLC (consulting, 2006-2007), as an Advisory Director of Riverstone Holdings (private investment), Chairman, President, and CEO of Baker Hughes, Inc. (oilfield services, 2000-2004), and as Director of Spinnaker Exploration Company (exploration and production, 2001-2005). |
Annual Report
Advisory Board Member and Executive Officers:
Correspondence intended for each executive officer and Peter S. Lynch may be sent to Fidelity Investments, 82 Devonshire Street, Boston, Massachusetts 02109.
Name, Age; Principal Occupation |
Peter S. Lynch (65) |
| Year of Election or Appointment: 2003 Member of the Advisory Board of Fidelity's Equity and High Income Funds. Mr. Lynch is Vice Chairman and a Director of FMR and FMR Co., Inc. In addition, Mr. Lynch serves as a Trustee of Boston College and as the Chairman of the Inner-City Scholarship Fund. Previously, Mr. Lynch served on the Special Olympics International Board of Directors (1997-2006). |
Kenneth B. Robins (40) |
| Year of Election or Appointment: 2008 President and Treasurer of Fidelity's Equity and High Income Funds. Mr. Robins also serves as Assistant Treasurer of other Fidelity funds (2009-present) and is an employee of Fidelity Investments (2004-present). Before joining Fidelity Investments, Mr. Robins worked at KPMG LLP, where he was a partner in KPMG's department of professional practice (2002-2004). |
Bruce T. Herring (44) |
| Year of Election or Appointment: 2006 Vice President of certain Equity Funds. Mr. Herring also serves as Group Chief Investments Officer of FMR. Previously, Mr. Herring served as a portfolio manager for Fidelity U.S. Equity Funds. |
Brian B. Hogan (45) |
| Year of Election or Appointment: 2009 Vice President of certain Equity Funds and Vice President of Sector Funds. Mr. Hogan also serves as Senior Vice President, Equity Research of FMR (2006-present) and President of FMR's Equity Division (2009-present). Previously, Mr. Hogan served as a portfolio manager. |
Scott C. Goebel (41) |
| Year of Election or Appointment: 2008 Secretary and Chief Legal Officer (CLO) of the Fidelity funds. Mr. Goebel also serves as General Counsel, Secretary, and Senior Vice President of FMR (2008-present) and FMR Co., Inc. (2008-present); Deputy General Counsel of FMR LLC; Chief Legal Officer of Fidelity Management & Research (Hong Kong) Limited (2008-present) and Assistant Secretary of Fidelity Management & Research (Japan) Inc. (2008-present), Fidelity Investments Money Management, Inc. (2008-present), Fidelity Management & Research (U.K.) Inc. (2008-present), and Fidelity Research and Analysis Company (2008-present). Previously, Mr. Goebel served as Assistant Secretary of the Funds (2007-2008) and as Vice President and Secretary of Fidelity Distributors Corporation (FDC) (2005-2007). |
William C. Coffey (40) |
| Year of Election or Appointment: 2009 Assistant Secretary of Fidelity's Equity and High Income Funds. Mr. Coffey also serves as Vice President and Associate General Counsel of FMR LLC (2005-present), and is an employee of Fidelity Investments. |
Holly C. Laurent (55) |
| Year of Election or Appointment: 2008 Anti-Money Laundering (AML) Officer of the Fidelity funds. Ms. Laurent is an employee of Fidelity Investments. Previously, Ms. Laurent was Senior Vice President and Head of Legal for Fidelity Business Services India Pvt. Ltd. (2006-2008), and Senior Vice President, Deputy General Counsel and Group Head for FMR LLC (2005-2006). |
Christine Reynolds (51) |
| Year of Election or Appointment: 2008 Chief Financial Officer of the Fidelity funds. Ms. Reynolds became President of Fidelity Pricing and Cash Management Services (FPCMS) in August 2008. Ms. Reynolds served as Chief Operating Officer of FPCMS (2007-2008). Previously, Ms. Reynolds served as President, Treasurer, and Anti-Money Laundering officer of the Fidelity funds (2004-2007). |
Kenneth A. Rathgeber (62) |
| Year of Election or Appointment: 2004 Chief Compliance Officer of Fidelity's Equity and High Income Funds. Mr. Rathgeber is Chief Compliance Officer of Fidelity Management & Research (Hong Kong) Limited (2008-present), Fidelity Management & Research (Japan) Inc. (2008-present), FMR (2005-present), FMR Co., Inc. (2005-present), Fidelity Management & Research (U.K.) Inc. (2005-present), Fidelity Research & Analysis Company (2005-present), Fidelity Investments Money Management, Inc. (2005-present), Pyramis Global Advisors, LLC (2005-present), and Strategic Advisers, Inc. (2005-present). |
Jeffrey S. Christian (48) |
| Year of Election or Appointment: 2009 Deputy Treasurer of the Fidelity funds. Mr. Christian is an employee of Fidelity Investments. Previously, Mr. Christian served as Chief Financial Officer (2008-2009) of certain Fidelity funds, Senior Vice President of Fidelity Pricing and Cash Management Services (FPCMS) (2004-2009), and as Vice President of Business Analysis (2003-2004). |
Bryan A. Mehrmann (48) |
| Year of Election or Appointment: 2005 Deputy Treasurer of the Fidelity funds. Mr. Mehrmann is an employee of Fidelity Investments. Previously, Mr. Mehrmann served as Vice President of Fidelity Investments Institutional Services Group (FIIS)/Fidelity Investments Institutional Operations Company, Inc. (FIIOC) Client Services (1998-2004). |
Adrien E. Deberghes (42) |
| Year of Election or Appointment: 2008 Deputy Treasurer of Fidelity's Equity and High Income Funds. Mr. Deberghes is an employee of Fidelity Investments (2008-present). Previously, Mr. Deberghes served as Senior Vice President of Mutual Fund Administration at State Street Corporation (2007-2008), Senior Director of Mutual Fund Administration at Investors Bank & Trust (2005-2007), and Director of Finance for Dunkin' Brands (2000-2005). |
John R. Hebble (51) |
| Year of Election or Appointment: 2009 Assistant Treasurer of Fidelity's Equity and High Income Funds. Mr. Hebble also serves as President and Treasurer of other Fidelity funds (2008-present) and is an employee of Fidelity Investments. |
Paul M. Murphy (62) |
| Year of Election or Appointment: 2007 Assistant Treasurer of the Fidelity funds. Mr. Murphy is an employee of Fidelity Investments. Previously, Mr. Murphy served as Chief Financial Officer of the Fidelity funds (2005-2006), Vice President and Associate General Counsel of FMR (2007), and Senior Vice President of Fidelity Pricing and Cash Management Services (FPCMS) (1994-2007). |
Gary W. Ryan (51) |
| Year of Election or Appointment: 2005 Assistant Treasurer of the Fidelity funds. Mr. Ryan is an employee of Fidelity Investments. Previously, Mr. Ryan served as Vice President of Fund Reporting in Fidelity Pricing and Cash Management Services (FPCMS) (1999-2005). |
Annual Report
Initial Class, Service Class, Service Class 2, and Investor Class designates 100% of the dividends distributed during the fiscal year as qualifying for the dividends-received deduction for corporate shareholders.
Annual Report
Board Approval of Investment Advisory Contracts and Management Fees
VIP Value Leaders Portfolio
Each year, the Board of Trustees, including the Independent Trustees (together, the Board), votes on the renewal of the management contract and sub-advisory agreements (together, the Advisory Contracts) for the fund. The Board, assisted by the advice of fund counsel and Independent Trustees' counsel, requests and considers a broad range of information throughout the year.
The Board meets regularly and, acting directly and through its separate committees, requests and receives information concerning, and considers at each of its meetings factors that are relevant to, its annual consideration of the renewal of the fund's Advisory Contracts, including the services and support provided to the fund and its shareholders. The Board has established various standing committees, each composed of Independent Trustees with varying backgrounds, to which the Board has assigned specific subject matter responsibilities in order to enhance effective decision-making by the Board. Each committee has a written charter outlining the structure and purposes of the committee. The Board also meets as needed to consider matters specifically related to the Board's annual consideration of the renewal of Advisory Contracts.
At its July 2009 meeting, the Board of Trustees, including the Independent Trustees, unanimously determined to renew the fund's Advisory Contracts. In reaching its determination, the Board considered all factors it believed relevant, including (i) the nature, extent, and quality of the services to be provided to the fund and its shareholders (including the investment performance of the fund); (ii) the competitiveness of the fund's management fee and total expenses; (iii) the total costs of the services to be provided by and the profits to be realized by Fidelity from its relationship with the fund; (iv) the extent to which economies of scale would be realized as the fund grows; and (v) whether fee levels reflect these economies of scale, if any, for the benefit of fund shareholders.
In considering whether to renew the Advisory Contracts for the fund, the Board ultimately reached a determination, with the assistance of fund counsel and Independent Trustees' counsel and through the exercise of its business judgment, that the renewal of the Advisory Contracts and the compensation to be received by Fidelity under the management contract is consistent with Fidelity's fiduciary duty under applicable law. The Board's decision to renew the Advisory Contracts was not based on any single factor noted above, but rather was based on a comprehensive consideration of all the information provided to the Board at its meetings throughout the year. The Board, in reaching its determination to renew the Advisory Contracts, is aware that shareholders in the fund have a broad range of investment choices available to them, including a wide choice among mutual funds offered by competitors to Fidelity, and that the fund's shareholders, with the opportunity to review and weigh the disclosure provided by the fund in its prospectus and other public disclosures, have chosen to invest in this fund, managed by Fidelity.
Nature, Extent, and Quality of Services Provided. The Board considered staffing within the investment adviser, FMR, and the sub-advisers (together, the Investment Advisers), including the backgrounds of the fund's investment personnel and the fund's investment objective and discipline. The Independent Trustees also had discussions with senior management of Fidelity's investment operations and investment groups. The Board considered the structure of the portfolio manager compensation program and whether this structure provides appropriate incentives.
Resources Dedicated to Investment Management and Support Services. The Board reviewed the size, education, and experience of the Investment Advisers' investment staff, their use of technology, and the Investment Advisers' approach to recruiting, training, and retaining portfolio managers and other research, advisory, and management personnel. In response to last year's financial crisis, FMR took a number of actions intended to cut costs and improve efficiency without weakening the investment teams or resources. The Board noted that Fidelity's analysts have access to a variety of technological tools and market and securities data that enable them to perform both fundamental and quantitative analysis and to specialize in various disciplines. The Board considered Fidelity's extensive global research capabilities that enable the Investment Advisers to aggregate data from various sources in an effort to produce positive investment results. The Board also considered that Fidelity's portfolio managers and analysts have access to daily portfolio attribution that allows for monitoring of a fund's portfolio, as well as an electronic communication system that provides immediate real-time access to research concerning issuers and credit enhancers.
Shareholder and Administrative Services. The Board considered (i) the nature, extent, quality, and cost of advisory, administrative, distribution, and shareholder services performed by the Investment Advisers and their affiliates under the Advisory Contracts and under separate agreements covering transfer agency, pricing and bookkeeping, and securities lending services for the fund; (ii) the nature and extent of the Investment Advisers' supervision of third party service providers, principally custodians and subcustodians; and (iii) the resources devoted to, and the record of compliance with, the fund's compliance policies and procedures. The Board also reviewed the allocation of fund brokerage, including allocations to brokers affiliated with the Investment Advisers, the use of brokerage commissions to pay fund expenses, and the use of "soft" commission dollars to pay for research services.
The Board noted that the growth of fund assets across the complex allows Fidelity to reinvest in the development of services designed to enhance the value or convenience of the Fidelity funds as investment vehicles. These services include 24-hour access to account information and market information through phone representatives and over the Internet, and investor education materials and asset allocation tools.
Investment in a Large Fund Family. The Board considered the benefits to shareholders of investing in a Fidelity fund, including the benefits of investing in a fund that is part of a large family of funds offering a variety of investment disciplines and providing for a large variety of mutual fund investor services. The Board noted that Fidelity has taken a number of actions over the previous year that benefited particular funds, including (i) dedicating additional resources to investment research and to restructure and broaden the focus of the investment research teams; (ii) bolstering the senior management team that oversees asset management; (iii) contractually agreeing to reduce the management fee on Fidelity U.S. Bond Index Fund; and (iv) expanding Class A and Class T load waiver categories to increase rollover retention opportunities and create consistent policies across the classes.
Annual Report
Investment Performance. The Board considered whether the fund has operated within its investment objective, as well as its record of compliance with its investment restrictions. It also reviewed the fund's absolute investment performance for each class, as well as the fund's relative investment performance for each class measured against (i) a broad-based securities market index, and (ii) a peer group of mutual funds deemed appropriate by the Board over multiple periods. The following charts considered by the Board show, over the one-, three-, and five-year periods ended December 31, 2008, the cumulative total returns of Initial Class and Service Class 2 of the fund, the cumulative total returns of a broad-based securities market index ("benchmark"), and a range of cumulative total returns of a peer group of mutual funds identified by Morningstar, Inc. as having an investment style similar to that of the fund based on underlying portfolio holdings. The returns of Initial Class and Service Class 2 show the performance of the highest and lowest performing classes, respectively (based on five-year performance). The box within each chart shows the 25th percentile return (bottom of box) and the 75th percentile return (top of box) of the peer group. Returns shown above the box are in the first quartile and returns shown below the box are in the fourth quartile. The percentage beaten numbers noted below each chart correspond to the percentile box and represent the percentage of funds in the peer group whose performance was equal to or lower than that of the class indicated.
VIP Value Leaders Portfolio
The Board reviewed the fund's relative investment performance against its peer group and stated that the performance of Initial Class of the fund was in the fourth quartile for all the periods shown. The Board also stated that the investment performance of the fund was lower than its benchmark for all the periods shown. The Board considered that the variations in performance among the fund's classes reflect the variations in class expenses, which result in lower performance for higher expense classes. The Board discussed with FMR actions that have been taken by FMR to improve the fund's disappointing performance relative to its peer group and benchmark. The Board will continue to closely monitor the performance of the fund in the coming year and discuss with FMR other appropriate actions to address the performance of the fund.
The Board considered that FMR has taken steps to refocus and strengthen equity research, equity portfolio management, and compliance. The Board reviewed the year-to-date performance of Initial Class through May 31, 2009 and stated that it exceeded the fund's benchmark.
Based on its review, and giving particular weight to the nature and quality of the resources dedicated by the Investment Advisers to maintain and improve relative performance and factoring in the unprecedented market events in 2008, the Board concluded that the nature, extent, and quality of the services provided to the fund will benefit the fund's shareholders, particularly in light of the Board's view that the fund's shareholders benefit from investing in a fund that is part of a large family of funds offering a variety of investment disciplines and services.
Competitiveness of Management Fee and Total Fund Expenses. The Board considered the fund's management fee and total expenses compared to "mapped groups" of competitive funds and classes. Fidelity creates "mapped groups" by combining similar Lipper investment objective categories that have comparable management fee characteristics. Combining Lipper investment objective categories aids the Board's management fee and total expense comparisons by broadening the competitive group used for comparison and by reducing the number of universes to which various Fidelity funds are compared.
Annual Report
Board Approval of Investment Advisory Contracts and Management Fees - continued
The Board considered two proprietary management fee comparisons for the 12-month periods shown in the chart below. The group of Lipper funds used by the Board for management fee comparisons is referred to below as the "Total Mapped Group." The Total Mapped Group comparison focuses on a fund's standing relative to the total universe of comparable funds available to investors, in terms of gross management fees before expense reimbursements or caps. "TMG %" represents the percentage of funds in the Total Mapped Group that had management fees that were lower than the fund's. For example, a TMG % of 9% means that 91% of the funds in the Total Mapped Group had higher management fees than the fund. The "Asset-Size Peer Group" (ASPG) comparison focuses on a fund's standing relative to non-Fidelity funds similar in size to the fund within the Total Mapped Group. The ASPG represents at least 15% of the funds in the Total Mapped Group with comparable asset size and management fee characteristics, subject to a minimum of 50 funds (or all funds in the Total Mapped Group if fewer than 50). Additional information, such as the ASPG quartile in which the fund's management fee ranked, is also included in the chart and considered by the Board.
VIP Value Leaders Portfolio

The Board noted that the fund's management fee ranked below the median of its Total Mapped Group and below the median of its ASPG for 2008.
Based on its review, the Board concluded that the fund's management fee was fair and reasonable in light of the services that the fund receives and the other factors considered.
In its review of each class's total expenses, the Board considered the fund's management fee as well as other fund or class expenses, as applicable, such as transfer agent fees, pricing and bookkeeping fees, fund-paid 12b-1 fees, and custodial, legal, and audit fees. The Board also noted the effects of any waivers and reimbursements on fees and expenses. As part of its review, the Board also considered current and historical total expenses of each class of the fund compared to competitive fund median expenses. Each class of the fund is compared to those funds and classes in the Total Mapped Group (used by the Board for management fee comparisons) that have a similar sales load structure.
The Board noted that the total expenses of each of Initial Class, Investor Class, and Service Class ranked below its competitive median for 2008 and the total expenses of Service Class 2 ranked above its competitive median for 2008. The Board noted that the fund offers multiple classes, each of which has a different 12b-1 fee structure, and that the multiple structures are intended to offer a range of pricing options for the intermediary market. The Board also noted that the total expenses of the classes vary primarily by the level of their 12b-1 fees, although differences in transfer agent fees may also cause expenses to vary from class to class.
In its review of total expenses, the Board also considered Fidelity fee structures and other information on clients that FMR and its affiliates service in other competitive markets, such as other mutual funds advised or subadvised by FMR or its affiliates, pension plan clients, and other institutional clients.
Based on its review, the Board concluded that the total expenses of each class of the fund were reasonable, although in one case above the median of the universe presented for comparison, in light of the services that the fund and its shareholders receive and the other factors considered.
Costs of the Services and Profitability. The Board considered the revenues earned and the expenses incurred by Fidelity in conducting the business of developing, marketing, distributing, managing, administering and servicing the fund and its shareholders. The Board also considered the level of Fidelity's profits in respect of all the Fidelity funds.
Annual Report
On an annual basis, FMR presents to the Board Fidelity's profitability for the fund. Fidelity calculates the profitability for each fund, as well as aggregate profitability for groups of Fidelity funds and all Fidelity funds, using a series of detailed revenue and cost allocation methodologies which originate with the audited books and records of Fidelity. The Audit Committee of the Board reviews any significant changes from the prior year's methodologies.
PricewaterhouseCoopers LLP (PwC), independent registered public accounting firm and auditor to Fidelity and certain Fidelity funds, has been engaged annually by the Board as part of the Board's assessment of Fidelity's profitability analysis. PwC's engagement includes the review and assessment of Fidelity's methodologies used in determining the revenues and expenses attributable to Fidelity's mutual fund business, and completion of agreed-upon procedures surrounding the mathematical accuracy of fund profitability and its conformity to allocation methodologies. After considering PwC's reports issued under the engagement and information provided by Fidelity, the Board believes that while other allocation methods may also be reasonable, Fidelity's profitability methodologies are reasonable in all material respects.
The Board has also reviewed Fidelity's non-fund businesses and any fall-out benefits related to the mutual fund business as well as cases where Fidelity's affiliates may benefit from or be related to the fund's business.
The Board considered the costs of the services provided by and the profits realized by Fidelity in connection with the operation of the fund and determined that the amount of profit is a fair entrepreneurial profit for the management of the fund.
Economies of Scale. The Board considered whether there have been economies of scale in respect of the management of the Fidelity funds, whether the Fidelity funds (including the fund) have appropriately benefited from any such economies of scale, and whether there is potential for realization of any further economies of scale. The Board considered the extent to which the fund will benefit from economies of scale through increased services to the fund, through waivers or reimbursements, or through fee or expense reductions.
In February 2009, the Board created an Ad Hoc Committee (the "Committee") to analyze economies of scale. The Committee was formed to consider whether FMR attains economies of scale in respect of the management and servicing of the Fidelity funds, whether the Fidelity funds have appropriately benefited from such economies of scale, and whether there is potential for realization of any further economies of scale.
The Board recognized that the fund's management contract incorporates a "group fee" structure, which provides for lower group fee rates as total fund assets under FMR's management increase, and for higher group fee rates as total fund assets under FMR's management decrease. FMR determines the group fee rates based on a tiered asset "breakpoint" schedule. The Board considered that the group fee is designed to deliver the benefits of economies of scale to fund shareholders when total fund assets increase, even if assets of any particular fund are unchanged or have declined, because some portion of Fidelity's costs are attributable to services provided to all Fidelity funds, and all funds benefit if those costs can be allocated among more assets. The Board concluded that, given the group fee structure, fund shareholders will achieve a certain level of economies of scale as assets under FMR's management increase at the fund complex level, regardless of whether Fidelity achieves any such economies of scale.
The Board concluded, considering the findings of the Committee, that any potential economies of scale are being shared between fund shareholders and Fidelity in an appropriate manner.
Additional Information Requested by the Board. In order to develop fully the factual basis for consideration of the Fidelity funds' Advisory Contracts, the Board requested and received additional information on certain topics, including (i) fund performance trends, actions to be taken by FMR to improve certain funds' overall performance and Fidelity's long-term strategies for certain funds; (ii) portfolio manager changes that have occurred during the past year; (iii) Fidelity's compensation structure for portfolio managers and key personnel, including performance benchmarks used by Fidelity in evaluating incentive compensation for portfolio managers and research analysts; (iv) the structure and process of equity research and actions taken by FMR to improve the quality of research; (v) the selection of and compensation paid by FMR to fund sub-advisers; (vi) Fidelity's fee structures and rationale for recommending different fees among categories of funds; (vii) the rationale for any differences between fund fee structures and fee structures in place for other Fidelity clients; (viii) Fidelity's rationale for recommending which funds should have a performance adjustment component as part of their management fees; and (ix) explanations for the relative total expenses borne by certain funds and classes, total expense competitive trends, and actions that might be taken by FMR to reduce total expenses for certain funds and classes.
Based on its evaluation of all of the conclusions noted above, and after considering all material factors, the Board ultimately concluded that the advisory fee structures are fair and reasonable, and that the fund's Advisory Contracts should be renewed.
Annual Report
Investment Adviser
Fidelity Management & Research Company
Boston, MA
Investment Sub-Advisers
FMR Co., Inc.
Fidelity Management & Research (U.K.) Inc.
Fidelity Research & Analysis Company
FIL Investments (Japan) Limited
FIL Investment Advisors
FIL Investment Advisors (U.K.) Ltd.
Fidelity Management & Research (Hong Kong) Limited
Fidelity Management & Research (Japan) Inc.
General Distributor
Fidelity Distributors Corporation
Boston, MA
Transfer and Service Agents
Fidelity Investments Institutional Operations Company, Inc.
Boston, MA
Fidelity Service Company, Inc.
Boston, MA
Custodian
Brown Brothers Harriman & Co.
Boston, MA
VVL-ANN-0210
1.796594.106
Item 2. Code of Ethics
As of the end of the period, December 31, 2009, Variable Insurance Products Fund IV (the trust) has adopted a code of ethics, as defined in Item 2 of Form N-CSR, that applies to its President and Treasurer and its Chief Financial Officer. A copy of the code of ethics is filed as an exhibit to this Form N-CSR.
Item 3. Audit Committee Financial Expert
The Board of Trustees of the trust has determined that Joseph Mauriello is an audit committee financial expert, as defined in Item 3 of Form N-CSR. Mr. Mauriello is independent for purposes of Item 3 of Form N-CSR.
Item 4. Principal Accountant Fees and Services
Fees and Services
The following table presents fees billed by Deloitte & Touche LLP, the member firms of Deloitte Touche Tohmatsu, and their respective affiliates (collectively, "Deloitte Entities") in each of the last two fiscal years for services rendered to Emerging Markets Portfolio (the "Fund"):
Services Billed by Deloitte Entities
December 31, 2009 FeesA
| Audit Fees | Audit-Related Fees | Tax Fees | All Other Fees |
Emerging Markets Portfolio | $47,000 | $- | $5,600 | $- |
December 31, 2008 FeesA,B
| Audit Fees | Audit-Related Fees | Tax Fees | All Other Fees |
Emerging Markets Portfolio | $40,000 | $- | $5,700 | $- |
A Amounts may reflect rounding.
B Emerging Markets Portfolio commenced operations on January 23, 2008.
The following table presents fees billed by PricewaterhouseCoopers LLP ("PwC") in each of the last two fiscal years for services rendered to Consumer Discretionary Portfolio, Consumer Staples Portfolio, Energy Portfolio, Financial Services Portfolio, Growth Stock Portfolio, Health Care Portfolio, Industrials Portfolio, International Capital Appreciation Portfolio, Materials Portfolio, Real Estate Portfolio, Technology Portfolio, Telecommunications Portfolio, Utilities Portfolio, and Value Leaders Portfolio (the "Funds"):
Services Billed by PwC
December 31, 2009 FeesA
| Audit Fees | Audit-Related Fees | Tax Fees | All Other Fees |
Consumer Discretionary Portfolio | $36,000 | $- | $2,400 | $1,400 |
Consumer Staples Portfolio | $36,000 | $- | $2,400 | $1,500 |
Energy Portfolio | $36,000 | $- | $2,400 | $1,700 |
Financial Services Portfolio | $37,000 | $- | $3,400 | $1,500 |
Growth Stock Portfolio | $43,000 | $- | $3,000 | $1,500 |
Health Care Portfolio | $38,000 | $- | $2,400 | $1,500 |
Industrials Portfolio | $36,000 | $- | $2,400 | $1,500 |
International Capital Appreciation Portfolio | $45,000 | $- | $4,900 | $1,500 |
Materials Portfolio | $36,000 | $- | $2,400 | $1,500 |
Real Estate Portfolio | $43,000 | $- | $3,400 | $1,500 |
Technology Portfolio | $35,000 | $- | $2,400 | $1,500 |
Telecommunications Portfolio | $36,000 | $- | $2,400 | $1,400 |
Utilities Portfolio | $35,000 | $- | $2,400 | $1,500 |
Value Leaders Portfolio | $42,000 | $- | $4,000 | $1,500 |
December 31, 2008 FeesA
| Audit Fees | Audit-Related Fees | Tax Fees | All Other Fees |
Consumer Discretionary Portfolio | $35,000 | $- | $4,500 | $1,500 |
Consumer Staples Portfolio | $29,000 | $- | $3,100 | $1,500 |
Energy Portfolio | $35,000 | $- | $4,500 | $2,000 |
Financial Services Portfolio | $35,000 | $- | $5,900 | $1,500 |
Growth Stock Portfolio | $41,000 | $- | $4,700 | $1,500 |
Health Care Portfolio | $37,000 | $- | $4,500 | $1,500 |
Industrials Portfolio | $33,000 | $- | $4,500 | $1,500 |
International Capital Appreciation Portfolio | $43,000 | $- | $5,100 | $1,500 |
Materials Portfolio | $29,000 | $- | $3,100 | $1,500 |
Real Estate Portfolio | $42,000 | $- | $5,500 | $1,500 |
Technology Portfolio | $34,000 | $- | $4,500 | $1,500 |
Telecommunications Portfolio | $29,000 | $- | $3,100 | $1,500 |
Utilities Portfolio | $34,000 | $- | $4,500 | $1,500 |
Value Leaders Portfolio | $39,000 | $- | $6,100 | $1,500 |
A Amounts may reflect rounding.
The following table presents fees billed by PwC and Deloitte Entities that were required to be approved by the Audit Committee for services that relate directly to the operations and financial reporting of the Funds and that are rendered on behalf of Fidelity Management & Research Company ("FMR") and entities controlling, controlled by, or under common control with FMR (not including any sub-adviser whose role is primarily portfolio management and is subcontracted with or overseen by another investment adviser) that provide ongoing services to the Funds ("Fund Service Providers"):
Services Billed by Deloitte Entities
| December 31, 2009A | December 31, 2008A,C |
Audit-Related Fees | $725,000 | $815,000 |
Tax Fees | $- | $2,000 |
All Other Fees | $515,000 | $225,000B |
A Amounts may reflect rounding.
B Reflects current period presentation.
C May include amounts billed prior to Emerging Market Portfolio's commencement of operations.
Services Billed by PwC
| December 31, 2009A | December 31, 2008A |
Audit-Related Fees | $2,655,000 | $2,530,000B |
Tax Fees | $- | $2,000 |
All Other Fees | $- | $- B |
A Amounts may reflect rounding.
B Reflects current period presentation.
"Audit-Related Fees" represent fees billed for assurance and related services that are reasonably related to the performance of the fund audit or the review of the fund's financial statements and that are not reported under Audit Fees.
"Tax Fees" represent fees billed for tax compliance, tax advice or tax planning that relate directly to the operations and financial reporting of the fund.
"All Other Fees" represent fees billed for assurance services provided to the fund or Fund Service Provider that relate directly to the operations and financial reporting of the fund, excluding those services that are reported under Audit Fees, Audit-Related Fees or Tax Fees.
Assurance services must be performed by an independent public accountant.
* * *
The aggregate non-audit fees billed by PwC and Deloitte Entities for services rendered to the Funds, FMR (not including any sub-adviser whose role is primarily portfolio management and is subcontracted with or overseen by another investment adviser), and any Fund Service Provider for each of the last two fiscal years of the Funds are as follows:
Billed By | December 31, 2009 A | December 31, 2008 A,B |
PwC | $4,600,000 | $3,170,000 |
Deloitte Entities | $1,245,000 | $1,260,000C |
A Amounts may reflect rounding.
B Reflects current period presentation.
C May include amounts billed prior to Emerging Market Portfolio's commencement of operations.
The trust's Audit Committee has considered non-audit services that were not pre-approved that were provided by PwC and Deloitte Entities to Fund Service Providers to be compatible with maintaining the independence of PwC and Deloitte Entities in their audits of the Funds, taking into account representations from PwC and Deloitte Entities, in accordance with Public Company Accounting Oversight Board rules, regarding their independence from the Funds and their related entities and FMR's review of the appropriateness and permissibility under applicable law of such non-audit services prior to their provision to the Fund Service Providers.
Audit Committee Pre-Approval Policies and Procedures
The trust's Audit Committee must pre-approve all audit and non-audit services provided by a fund's independent registered public accounting firm relating to the operations or financial reporting of the fund. Prior to the commencement of any audit or non-audit services to a fund, the Audit Committee reviews the services to determine whether they are appropriate and permissible under applicable law.
The Audit Committee has adopted policies and procedures to, among other purposes, provide a framework for the Committee's consideration of non-audit services by the audit firms that audit the Fidelity funds. The policies and procedures require that any non-audit service provided by a fund audit firm to a Fidelity fund and any non-audit service provided by a fund auditor to a Fund Service Provider that relates directly to the operations and financial reporting of a Fidelity fund ("Covered Service") are subject to approval by the Audit Committee before such service is provided.
All Covered Services must be approved in advance of provision of the service either: (i) by formal resolution of the Audit Committee, or (ii) by oral or written approval of the service by the Chair of the Audit Committee (or if the Chair is unavailable, such other member of the Audit Committee as may be designated by the Chair to act in the Chair's absence). The approval contemplated by (ii) above is permitted where the Treasurer determines that action on such an engagement is necessary before the next meeting of the Audit Committee.
Non-audit services provided by a fund audit firm to a Fund Service Provider that do not relate directly to the operations and financial reporting of a Fidelity fund are reported to the Audit Committee on a periodic basis.
Non-Audit Services Approved Pursuant to Rule 2-01(c)(7)(i)(C) and (ii) of Regulation S-X ("De Minimis Exception")
There were no non-audit services approved or required to be approved by the Audit Committee pursuant to the De Minimis Exception during the Funds' last two fiscal years relating to services provided to (i) the Funds or (ii) any Fund Service Provider that relate directly to the operations and financial reporting of the Funds.
Item 5. Audit Committee of Listed Registrants
Not applicable.
Item 6. Investments
(a) Not applicable.
(b) Not applicable
Item 7. Disclosure of Proxy Voting Policies and Procedures for Closed-End Management Investment Companies
Not applicable.
Item 8. Portfolio Managers of Closed-End Management Investment Companies
Not applicable.
Item 9. Purchase of Equity Securities by Closed-End Management Investment Company and Affiliated Purchasers
Not applicable.
Item 10. Submission of Matters to a Vote of Security Holders
There were no material changes to the procedures by which shareholders may recommend nominees to the trust's Board of Trustees.
Item 11. Controls and Procedures
(a)(i) The President and Treasurer and the Chief Financial Officer have concluded that the trust's disclosure controls and procedures (as defined in Rule 30a-3(c) under the Investment Company Act) provide reasonable assurances that material information relating to the trust is made known to them by the appropriate persons, based on their evaluation of these controls and procedures as of a date within 90 days of the filing date of this report.
(a)(ii) There was no change in the trust's internal control over financial reporting (as defined in Rule 30a-3(d) under the Investment Company Act) that occurred during the second fiscal quarter of the period covered by this report that has materially affected, or is reasonably likely to materially affect, the trust's internal control over financial reporting.
Item 12. Exhibits
(a) | (1) | Code of Ethics pursuant to Item 2 of Form N-CSR is filed and attached hereto as EX-99.CODE ETH. |
(a) | (2) | Certification pursuant to Rule 30a-2(a) under the Investment Company Act of 1940 (17 CFR 270.30a-2(a)) is filed and attached hereto as Exhibit 99.CERT. |
(a) | (3) | Not applicable. |
(b) | | Certification pursuant to Rule 30a-2(b) under the Investment Company Act of 1940 (17 CFR 270.30a-2(b)) is furnished and attached hereto as Exhibit 99.906CERT. |
SIGNATURES
Pursuant to the requirements of the Securities Exchange Act of 1934 and the Investment Company Act of 1940, the registrant has duly caused this report to be signed on its behalf by the undersigned, thereunto duly authorized.
Variable Insurance Products Fund IV
By: | /s/Kenneth B. Robins |
| Kenneth B. Robins |
| President and Treasurer |
| |
Date: | February 26, 2010 |
Pursuant to the requirements of the Securities Exchange Act of 1934 and the Investment Company Act of 1940, this report has been signed below by the following persons on behalf of the registrant and in the capacities and on the dates indicated.
By: | /s/Kenneth B. Robins |
| Kenneth B. Robins |
| President and Treasurer |
| |
Date: | February 26, 2010 |
By: | /s/Christine Reynolds |
| Christine Reynolds |
| Chief Financial Officer |
| |
Date: | February 26, 2010 |