UNITED STATES
SECURITIES AND EXCHANGE COMMISSION
Washington, D.C. 20549
FORM N-CSR
CERTIFIED SHAREHOLDER REPORT OF REGISTERED
MANAGEMENT INVESTMENT COMPANIES
Investment Company Act file number 811-3759
Variable Insurance Products Fund IV
(Exact name of registrant as specified in charter)
82 Devonshire St., Boston, Massachusetts 02109
(Address of principal executive offices) (Zip code)
Eric D. Roiter, Secretary
82 Devonshire St.
Boston, Massachusetts 02109
(Name and address of agent for service)
Registrant's telephone number, including area code: 617-563-7000
Date of fiscal year end: | December 31 |
| |
Date of reporting period: | December 31, 2006 |
Item 1. Reports to Stockholders
Fidelity® Variable Insurance Products:
Consumer Discretionary Portfolio
(formerly Consumer Industries Portfolio)
Annual Report
December 31, 2006
(2_fidelity_logos) (Registered_Trademark)
Contents
Notes to Shareholders | <Click Here> | An explanation of the changes to the fund. |
Performance | <Click Here> | How the fund has done over time. |
Management's Discussion | <Click Here> | The manager's review of fund performance, strategy and outlook. |
Shareholder Expense Example | <Click Here> | An example of shareholder expenses. |
Investment Changes | <Click Here> | A summary of major shifts in the fund's investments over the past six months. |
Investments | <Click Here> | A complete list of the fund's investments with their
market values. |
Financial Statements | <Click Here> | Statements of assets and liabilities, operations, and
changes in net assets, as well as financial highlights. |
Notes | <Click Here> | Notes to the financial statements. |
Report of Independent Registered Public Accounting Firm | <Click Here> | |
Trustees and Officers | <Click Here> | |
Distributions | <Click Here> | |
Proxy Voting Results | <Click Here> | |
Board Approval of Investment Advisory Contracts and Management Fees | <Click Here> | |
| | |
To view a fund's proxy voting guidelines and proxy voting record for the 12-month period ended June 30, visit www.fidelity.com/proxyvotingresults or visit the Securities and Exchange Commission's (SEC) web site at www.sec.gov. You may also call 1-877-208-0098 to request a free copy of the proxy voting guidelines.
Fidelity Variable Insurance Products are separate account options which are purchased through a variable insurance contract.
Standard & Poor's, S&P and S&P 500 are registered service marks of The McGraw-Hill Companies, Inc. and have been licensed for use by Fidelity Distributors Corporation.
Other third party marks appearing herein are the property of their respective owners.
All other marks appearing herein are registered or unregistered trademarks or service marks of FMR Corp. or an affiliated company.
This report and the financial statements contained herein are submitted for the general information of the shareholders of the fund. This report is not authorized for distribution to prospective investors in the fund unless preceded or accompanied by an effective prospectus.
A fund files its complete schedule of portfolio holdings with the SEC for the first and third quarters of each fiscal year on Form N-Q. Forms N-Q are available on the SEC's web site at http://www.sec.gov. A fund's Forms N-Q may be reviewed and copied at the SEC's Public Reference Room in Washington, DC. Information regarding the operation of the SEC's Public Reference Room may be obtained by calling 1-800-SEC-0330. For a complete list of a fund's portfolio holdings, view the most recent quarterly holdings report, semiannual report, or annual report on Fidelity's web site at http://www.advisor.fidelity.com.
NOT FDIC INSURED · MAY LOSE VALUE · NO BANK GUARANTEE
Neither the fund nor Fidelity Distributors Corporation is a bank.
VIP Consumer Discretionary Portfolio
Notes to Shareholders:
Effective October 1, 2006, Fidelity restructured the VIP Sector product line. The restructuring aligned the funds' investment goals more closely with standard industry classifications and facilitated adoption of more-specific benchmark indexes to evaluate fund performance. As restructured, the funds generally align under seven sectors in the widely recognized Global Industry Classification Standard (GICS), developed by Standard & Poor's® (S&P®) and Morgan Stanley Capital InternationalSM (MSCI®): Consumer Discretionary, Energy, Financials, Health Care, Industrials, Information Technology and Utilities. Changes to the funds ranged from simply adopting a new supplemental benchmark to, in some cases, changing investment policies and fund names.
For VIP Consumer Discretionary (formerly VIP Consumer Industries), VIP Energy (formerly VIP Natural Resources), VIP Industrials (formerly VIP Cyclical Industries), and VIP Utilities (formerly VIP Telecommunications & Utilities Growth), shareholders approved certain fundamental investment policy changes related to the restructuring at a special meeting of shareholders held September 20, 2006. All the funds adopted new benchmark indexes from MSCI. Taken together, the name, policy and benchmark changes will make it easier for investors to distinguish funds in the product line and to evaluate Fidelity Management & Research Company's skill in managing the funds.
For VIP Consumer Discretionary, shareholders approved narrowing the fund's policies to focus on companies engaged in the manufacture and distribution of consumer discretionary products and services. Consumer discretionary companies are a subset of the broader consumer industries sector, which is generally made up of consumer discretionary and consumer staples companies. The fund is now benchmarked to the MSCI US Investable Market Consumer Discretionary Index.
Annual Report
VIP Consumer Discretionary Portfolio
Performance: The Bottom Line
Average annual total return reflects the change in the value of an investment, assuming reinvestment of the class' dividend income and capital gains (the profits earned upon the sale of securities that have grown in value) and assuming a constant rate of performance each year. During periods of reimbursement by Fidelity, a fund's total return will be greater than it would be had the reimbursement not occurred. Performance numbers are net of all underlying fund operating expenses, but do not include any insurance charges imposed by your insurance company's separate account. If performance information included the effect of these additional charges, the total returns would have been lower. How a fund did yesterday is no guarantee of how it will do tomorrow.
Average Annual Total Returns
Periods ended December 31, 2006 | Past 1
year | Past 5
years | Life of fund A |
VIP Consumer Discretionary - Initial Class | 12.63% | 5.84% | 4.79% |
VIP Consumer Discretionary - Investor Class B | 12.62% | 5.82% | 4.77% |
A From July 18, 2001.
B The initial offering of Investor Class shares took place on July 21, 2005. Returns prior to July 21, 2005 are those of Initial Class. If Investor Class's transfer agent fee had been reflected, returns prior to July 21, 2005 would have been lower.
$10,000 Over Life of Fund
Let's say hypothetically that $10,000 was invested in VIP Consumer Discretionary Portfolio - Initial Class on July 18, 2001, when the fund started. The chart shows how the value of your investment would have changed, and also shows how the Standard & Poor's 500SM Index (S&P 500®) performed over the same period.

VIP Consumer Discretionary Portfolio
VIP Consumer Discretionary Portfolio
Management's Discussion of Fund Performance
Comments from Martin Zinny, who became sole manager of VIP Consumer Discretionary Portfolio on October 2, 2006
U.S. stock markets registered their fourth consecutive year of positive returns in 2006. Among the highlights were the performances of the Dow Jones Industrial AverageSM - a gauge of 30 mega-cap, blue-chip stocks - and the small-cap-oriented Russell 2000® Index, both of which reached new highs. The efforts of the Federal Reserve Board to contain inflation levels also dominated the investment headlines. In all, the Fed hiked short-term interest rates four times, but held rates steady after its June 29 increase, finally pausing after 17 rate hikes over a two-year period. A slowing residential housing market and moderating oil prices - the latter of which hit a record closing high of $77 per barrel in July before falling sharply - also held economic growth in check. For the year overall, the Standard & Poor's 500SM Index was up 15.79%, the Dow advanced 19.05%, the Russell 2000 Index gained 18.37% and the NASDAQ Composite® Index rose 10.39%.
For the 12 months ending December 31, 2006, the fund underperformed the 16.79% gain of the Morgan Stanley Capital InternationalSM (MSCI®) US Investable Market Consumer Discretionary Index and the 20.21% advance of a blended index specific to this fund. This blended index is a combination of the Goldman Sachs® Consumer Industries Index, which the fund was compared with through September, and the new MSCI benchmark mentioned above, which the fund was compared with during the period's final three months1. The new supplemental benchmark and simultaneous name change reflected a narrowing of the fund's focus, from both consumer discretionary and consumer staples stocks to just consumer discretionary issues. During the same 12-month period, the fund also lagged the S&P 500®. (For specific portfolio performance results, please refer to the performance section of this report.) For the first nine months of the period, the portfolio underperformed the Goldman Sachs benchmark. Out-of-index holdings in Internet firms eBay and Yahoo encountered difficulties and were sold. Not owning cable operator Comcast during that period also proved detrimental to results, as the index component soared on strong profits. On the positive side, the stock of Federated Department Stores did well as it acquired May Department Stores and investors applauded the merger plan. Out-of-index Swiss food conglomerate Nestle also helped results, as did our avoidance of index component Home Depot, whose stock was hurt by a slowdown in the housing market. By the end of the 12-month period, however Comcast and Home Depot were in the portfolio, but the position in Nestle had been sold to lock in profits. The fund underperformed the MSCI index during the final three months of the period, hurt by lowered investor expectations for many of our retail holdings. Federated Department Stores' merger plan did not produce results as quickly as investors had hoped, and its stock price retreated. Women's retailer Coldwater Creek also saw its stock stumble. I had expected electronics retailers Best Buy and Circuit City to be buoyed by strong sales of high-definition TVs, but instead they were hurt by price competition that lowered profits. Elsewhere in retail, however, our investments in high-end apparel retailers helped results, as Saks, Polo Ralph Lauren and Coach all delivered strong performance.
1 The fund's blended index is a customized index developed by Fidelity for the limited purpose of discussing the fund's performance for the 12-month period ending December 31, 2006. From January 1, 2006, through September 30, 2006, the fund compared its performance to the Goldman Sachs Consumer Industries Index, which returned 8.81% during that period. On October 1, 2006, the fund began comparing its performance to a different index, the MSCI US Investable Market Consumer Discretionary Index, which returned 10.48% from October 1, 2006, through December 31, 2006. For the 12-month period ending December 31, 2006, the blended index (Goldman Sachs and MSCI) returned 20.21%.
The views expressed above reflect those of the portfolio manager(s) only through the end of the period as stated on the cover of this report and do not necessarily represent the views of Fidelity or any other person in the Fidelity organization. Any such views are subject to change at any time based upon market or other conditions and Fidelity disclaims any responsibility to update such views. These views may not be relied on as investment advice and, because investment decisions for a Fidelity fund are based on numerous factors, may not be relied on as an indication of trading intent on behalf of any Fidelity fund.
Annual Report
VIP Consumer Discretionary Portfolio
Shareholder Expense Example
As a shareholder of the Fund, you incur two types of costs: (1) transaction costs, including redemption fees, and (2) ongoing costs, including management fees and other Fund expenses. This Example is intended to help you understand your ongoing costs (in dollars) of investing in the Fund and to compare these costs with the ongoing costs of investing in other mutual funds.
The Example is based on an investment of $1,000 invested at the beginning of the period and held for the entire period (July 1, 2006 to December 31, 2006).
Actual Expenses
The first line of the accompanying table for each class of the Fund provides information about actual account values and actual expenses. You may use the information in this line, together with the amount you invested, to estimate the expenses that you paid over the period. Simply divide your account value by $1,000.00 (for example, an $8,600 account value divided by $1,000.00 = 8.6), then multiply the result by the number in the first line for a class of the Fund under the heading entitled "Expenses Paid During Period" to estimate the expenses you paid on your account during this period. The estimate of expenses does not include any fees or other expenses of any variable annuity or variable life insurance product. If they were, the estimate of expenses you paid during the period would be higher, and your ending account value would be lower.
Hypothetical Example for Comparison Purposes
The second line of the accompanying table for each class of the Fund provides information about hypothetical account values and hypothetical expenses based on a Class' actual expense ratio and an assumed rate of return of 5% per year before expenses, which is not the Class' actual return. The hypothetical account values and expenses may not be used to estimate the actual ending account balance or expenses you paid for the period. You may use this information to compare the ongoing costs of investing in the Fund and other funds. To do so, compare this 5% hypothetical example with the 5% hypothetical examples that appear in the shareholder reports of the other funds. The estimate of expenses does not include any fees or other expenses of any variable annuity or variable life insurance product. If they were, the estimate of expenses you paid during the period would be higher, and your ending account value would be lower.
Please note that the expenses shown in the table are meant to highlight your ongoing costs only and do not reflect any transaction costs. Therefore, the second line of the table is useful in comparing ongoing costs only, and will not help you determine the relative total costs of owning different funds. In addition, if these transactional costs were included, your costs would have been higher.
| Beginning
Account Value
July 1, 2006 | Ending
Account Value
December 31, 2006 | Expenses Paid
During Period*
July 1, 2006 to
December 31, 2006 |
Initial Class | | | |
Actual | $ 1,000.00 | $ 1,104.10 | $ 6.10** |
Hypothetical A | $ 1,000.00 | $ 1,019.41 | $ 5.85** |
Investor Class | | | |
Actual | $ 1,000.00 | $ 1,105.00 | $ 6.63** |
Hypothetical A | $ 1,000.00 | $ 1,018.90 | $ 6.36** |
A 5% return per year before expenses
* Expenses are equal to each Class' annualized expense ratio (shown in the table below); multiplied by the average account value over the period, multiplied by 184/365 (to reflect the one-half year period).
| Annualized
Expense Ratio |
Initial Class | 1.15%** |
Investor Class | 1.25%** |
** If changes to voluntary expense limitations, effective February 1, 2007 had been in effect during the entire period, the annualized expense ratio and the expenses paid in the actual and hypothetical examples above would have been as follows:
| Annualized
Expense Ratio | Expenses
Paid |
Initial Class | 1.00% | |
Actual | | $ 5.30 |
Hypothetical A | | $ 5.09 |
Investor Class | 1.15% | |
Actual | | $ 6.10 |
Hypothetical A | | $ 5.85 |
A 5% return per year before expenses
VIP Consumer Discretionary Portfolio
VIP Consumer Discretionary Portfolio
Investment Changes
Top Ten Stocks as of December 31, 2006 |
| % of fund's
net assets | % of fund's net assets
6 months ago |
Federated Department Stores, Inc. | 6.4 | 1.9 |
News Corp. Class A | 6.0 | 1.5 |
Time Warner, Inc. | 5.9 | 0.0 |
Comcast Corp. Class A | 3.7 | 0.0 |
McDonald's Corp. | 3.3 | 0.0 |
Target Corp. | 3.1 | 2.9 |
JCPenney Co., Inc. | 3.0 | 1.1 |
Polo Ralph Lauren Corp. Class A | 3.0 | 0.7 |
McGraw-Hill Companies, Inc. | 3.0 | 1.1 |
Saks, Inc. | 3.0 | 0.3 |
| 40.4 | |
Top Industries (% of fund's net assets) |
As of December 31, 2006 |
 | Specialty Retail | 24.0% | |
 | Media | 22.9% | |
 | Multiline Retail | 17.3% | |
 | Hotels, Restaurants & Leisure | 13.5% | |
 | Textiles, Apparel & Luxury Goods | 8.5% | |
 | All Others* | 13.8% | |

|
As of June 30, 2006 |
| Specialty Retail | 13.6% | |
| Hotels, Restaurants & Leisure | 12.5% | |
| Internet Software & Services | 12.0% | |
| Media | 9.3% | |
| Multiline Retail | 8.8% | |
| All Others* | 43.8% | |

* Includes short-term investments and net other assets. |
Prior period industry classifications reflect the categories in place as of the date indicated and have not been adjusted to reflect current industry classifications. |
Annual Report
VIP Consumer Discretionary Portfolio
Investments December 31, 2006
Showing Percentage of Net Assets
Common Stocks - 98.2% |
| Shares | | Value (Note 1) |
AUTOMOBILES - 1.3% |
Automobile Manufacturers - 1.3% |
Renault SA | 800 | | $ 96,111 |
Toyota Motor Corp. sponsored ADR | 1,000 | | 134,310 |
| | 230,421 |
COMPUTERS & PERIPHERALS - 1.7% |
Computer Hardware - 1.7% |
Hewlett-Packard Co. | 7,700 | | 317,163 |
DIVERSIFIED CONSUMER SERVICES - 1.5% |
Specialized Consumer Services - 1.5% |
Sotheby's Class A (ltd. vtg.) | 8,500 | | 263,670 |
DIVERSIFIED FINANCIAL SERVICES - 1.7% |
Specialized Finance - 1.7% |
Moody's Corp. | 4,400 | | 303,864 |
FOOD & STAPLES RETAILING - 1.0% |
Food Retail - 1.0% |
Tesco PLC | 5,000 | | 39,612 |
Tesco PLC Sponsored ADR | 5,900 | | 142,780 |
| | 182,392 |
HOTELS, RESTAURANTS & LEISURE - 13.5% |
Casinos & Gaming - 4.8% |
Ameristar Casinos, Inc. | 2,500 | | 76,850 |
Boyd Gaming Corp. | 3,700 | | 167,647 |
International Game Technology | 5,800 | | 267,960 |
Las Vegas Sands Corp. (a) | 1,500 | | 134,220 |
Penn National Gaming, Inc. (a) | 2,800 | | 116,536 |
Wynn Resorts Ltd. | 1,100 | | 103,235 |
| | 866,448 |
Hotels, Resorts & Cruise Lines - 2.0% |
Accor SA | 2,600 | | 201,489 |
Marriott International, Inc. Class A | 3,500 | | 167,020 |
| | 368,509 |
Restaurants - 6.7% |
McDonald's Corp. | 13,700 | | 607,321 |
Starbucks Corp. (a) | 5,600 | | 198,352 |
Tim Hortons, Inc. | 1,754 | | 50,796 |
Wendy's International, Inc. | 11,000 | | 363,990 |
| | 1,220,459 |
TOTAL HOTELS, RESTAURANTS & LEISURE | | 2,455,416 |
HOUSEHOLD DURABLES - 0.7% |
Homebuilding - 0.3% |
D.R. Horton, Inc. | 2,000 | | 52,980 |
Household Appliances - 0.4% |
Whirlpool Corp. | 1,000 | | 83,020 |
TOTAL HOUSEHOLD DURABLES | | 136,000 |
|
| Shares | | Value (Note 1) |
INTERNET & CATALOG RETAIL - 2.1% |
Catalog Retail - 1.6% |
Coldwater Creek, Inc. (a) | 12,000 | | $ 294,240 |
Internet Retail - 0.5% |
Blue Nile, Inc. (a) | 2,300 | | 84,847 |
TOTAL INTERNET & CATALOG RETAIL | | 379,087 |
INTERNET SOFTWARE & SERVICES - 1.3% |
Internet Software & Services - 1.3% |
Google, Inc. Class A (sub. vtg.) (a) | 500 | | 230,240 |
MEDIA - 22.9% |
Broadcasting & Cable TV - 4.9% |
Comcast Corp. Class A | 16,000 | | 677,280 |
Grupo Televisa SA de CV (CPO) sponsored ADR | 7,700 | | 207,977 |
| | 885,257 |
Movies & Entertainment - 13.4% |
Live Nation, Inc. (a) | 300 | | 6,720 |
News Corp.: | | | |
Class A | 50,741 | | 1,089,917 |
Class B | 1,700 | | 37,842 |
The Walt Disney Co. | 4,700 | | 161,069 |
Time Warner, Inc. | 49,300 | | 1,073,754 |
Viacom, Inc. Class B (non-vtg.) (a) | 1,500 | | 61,545 |
| | 2,430,847 |
Publishing - 4.6% |
McGraw-Hill Companies, Inc. | 7,900 | | 537,358 |
R.H. Donnelley Corp. | 4,700 | | 294,831 |
| | 832,189 |
TOTAL MEDIA | | 4,148,293 |
MULTILINE RETAIL - 17.3% |
Department Stores - 14.2% |
Federated Department Stores, Inc. | 30,500 | | 1,162,962 |
JCPenney Co., Inc. | 7,100 | | 549,256 |
Kohl's Corp. (a) | 900 | | 61,587 |
Nordstrom, Inc. | 1,000 | | 49,340 |
Saks, Inc. | 29,900 | | 532,818 |
Sears Holdings Corp. (a) | 1,300 | | 218,309 |
| | 2,574,272 |
General Merchandise Stores - 3.1% |
Target Corp. | 9,900 | | 564,795 |
TOTAL MULTILINE RETAIL | | 3,139,067 |
PERSONAL PRODUCTS - 0.7% |
Personal Products - 0.7% |
Bare Escentuals, Inc. | 3,900 | | 121,173 |
Common Stocks - continued |
| Shares | | Value (Note 1) |
SPECIALTY RETAIL - 24.0% |
Apparel Retail - 12.2% |
Abercrombie & Fitch Co. Class A | 2,300 | | $ 160,149 |
Aeropostale, Inc. (a) | 1,300 | | 40,131 |
American Eagle Outfitters, Inc. | 5,350 | | 166,974 |
Casual Male Retail Group, Inc. (a) | 7,200 | | 93,960 |
Charlotte Russe Holding, Inc. (a) | 1,950 | | 59,963 |
Gap, Inc. | 5,800 | | 113,100 |
Gymboree Corp. (a) | 7,700 | | 293,832 |
Hot Topic, Inc. (a) | 1,800 | | 24,012 |
Limited Brands, Inc. | 13,900 | | 402,266 |
Ross Stores, Inc. | 2,500 | | 73,250 |
The Children's Place Retail Stores, Inc. (a) | 900 | | 57,168 |
TJX Companies, Inc. | 17,500 | | 499,100 |
Tween Brands, Inc. (a) | 1,600 | | 63,888 |
Urban Outfitters, Inc. (a) | 1,700 | | 39,151 |
Zumiez, Inc. (a) | 4,200 | | 124,068 |
| | 2,211,012 |
Computer & Electronics Retail - 4.5% |
Best Buy Co., Inc. | 10,150 | | 499,279 |
Circuit City Stores, Inc. | 6,800 | | 129,064 |
RadioShack Corp. | 10,900 | | 182,902 |
| | 811,245 |
Home Improvement Retail - 2.6% |
Home Depot, Inc. | 7,400 | | 297,184 |
Lowe's Companies, Inc. | 5,700 | | 177,555 |
| | 474,739 |
Specialty Stores - 4.7% |
Office Depot, Inc. (a) | 3,300 | | 125,961 |
OfficeMax, Inc. | 3,100 | | 153,915 |
PETsMART, Inc. | 1,600 | | 46,176 |
Staples, Inc. | 16,050 | | 428,535 |
Tiffany & Co., Inc. | 2,500 | | 98,100 |
| | 852,687 |
TOTAL SPECIALTY RETAIL | | 4,349,683 |
TEXTILES, APPAREL & LUXURY GOODS - 8.5% |
Apparel, Accessories & Luxury Goods - 6.7% |
Coach, Inc. (a) | 10,900 | | 468,264 |
|
| Shares | | Value (Note 1) |
Phillips-Van Heusen Corp. | 3,900 | | $ 195,663 |
Polo Ralph Lauren Corp. Class A | 7,000 | | 543,620 |
| | 1,207,547 |
Footwear - 1.8% |
Deckers Outdoor Corp. (a) | 2,100 | | 125,895 |
Iconix Brand Group, Inc. (a) | 1,900 | | 36,841 |
NIKE, Inc. Class B | 1,000 | | 99,030 |
Skechers U.S.A., Inc. Class A (sub. vtg.) (a) | 1,962 | | 65,354 |
| | 327,120 |
TOTAL TEXTILES, APPAREL & LUXURY GOODS | | 1,534,667 |
TOTAL COMMON STOCKS (Cost $16,310,055) | 17,791,136 |
Money Market Funds - 2.3% |
| | | |
Fidelity Cash Central Fund, 5.37% (b)
(Cost $417,698) | 417,698 | | 417,698 |
TOTAL INVESTMENT PORTFOLIO - 100.5% (Cost $16,727,753) | | 18,208,834 |
NET OTHER ASSETS - (0.5)% | | (87,620) |
NET ASSETS - 100% | $ 18,121,214 |
Legend |
(a) Non-income producing |
(b) Affiliated fund that is available only to investment companies and other accounts managed by Fidelity Investments. The rate quoted is the annualized seven-day yield of the fund at period end. A complete unaudited listing of the fund's holdings as of its most recent quarter end is available upon request. |
Affiliated Central Funds |
Information regarding fiscal year to date income earned by the Fund from investments in Fidelity Central Funds is as follows: |
Fund | Income earned |
Fidelity Cash Central Fund | $ 16,702 |
Income Tax Information |
At December 31, 2006, the fund had a capital loss carryforward of approximately $299,913 all of which will expire on December 31, 2011. |
See accompanying notes which are an integral part of the financial statements.
Annual Report
VIP Consumer Discretionary Portfolio
Financial Statements
Statement of Assets and Liabilities
| December 31, 2006 |
| | |
Assets | | |
Investment in securities, at value - See accompanying schedule: Unaffiliated issuers
(cost $16,310,055) | $ 17,791,136 | |
Fidelity Central Funds
(cost $417,698) | 417,698 | |
Total Investments (cost $16,727,753) | | $ 18,208,834 |
Receivable for investments sold | | 294,970 |
Dividends receivable | | 11,779 |
Interest receivable | | 555 |
Prepaid expenses | | 46 |
Receivable from investment adviser for expense reductions | | 1,476 |
Other receivables | | 298 |
Total assets | | 18,517,958 |
| | |
Liabilities | | |
Payable for investments purchased | $ 344,797 | |
Accrued management fee | 8,681 | |
Other affiliated payables | 2,043 | |
Other payables and accrued expenses | 41,223 | |
Total liabilities | | 396,744 |
| | |
Net Assets | | $ 18,121,214 |
Net Assets consist of: | | |
Paid in capital | | $ 16,987,185 |
Undistributed net investment income | | 24,654 |
Accumulated undistributed net realized gain (loss) on investments and foreign currency transactions | | (371,753) |
Net unrealized appreciation (depreciation) on investments and assets and liabilities in foreign currencies | | 1,481,128 |
Net Assets | | $ 18,121,214 |
Statement of Assets and Liabilities - continued
| December 31, 2006 |
| | |
Initial Class:
Net Asset Value, offering price and redemption price per share ($13,865,636 ÷ 1,080,029 shares) | | $ 12.84 |
| | |
Investor Class:
Net Asset Value, offering price and redemption price per share ($4,255,578 ÷ 331,628 shares) | | $ 12.83 |
See accompanying notes which are an integral part of the financial statements.
VIP Consumer Discretionary Portfolio
Statement of Operations
| Year ended December 31, 2006 |
| | |
Investment Income | | |
Dividends | | $ 130,965 |
Special dividends | | 88,800 |
Interest | | 80 |
Income from Fidelity Central Funds | | 16,702 |
Total income | | 236,547 |
| | |
Expenses | | |
Management fee | $ 65,645 | |
Transfer agent fees | 16,003 | |
Accounting fees and expenses | 4,586 | |
Custodian fees and expenses | 13,759 | |
Independent trustees' compensation | 40 | |
Audit | 40,378 | |
Legal | 380 | |
Miscellaneous | 1,583 | |
Total expenses before reductions | 142,374 | |
Expense reductions | (8,342) | 134,032 |
Net investment income (loss) | | 102,515 |
Realized and Unrealized Gain (Loss) Net realized gain (loss) on: | | |
Investment securities: | | |
Unaffiliated issuers | 1,366,601 | |
Foreign currency transactions | (103) | |
Total net realized gain (loss) | | 1,366,498 |
Change in net unrealized appreciation (depreciation) on: Investment securities | (45,476) | |
Assets and liabilities in foreign currencies | 54 | |
Total change in net unrealized appreciation (depreciation) | | (45,422) |
Net gain (loss) | | 1,321,076 |
Net increase (decrease) in net assets resulting from operations | | $ 1,423,591 |
Statement of Changes in Net Assets
| Year ended
December 31, 2006 | Year ended
December 31, 2005 |
Increase (Decrease) in Net Assets | | |
Operations | | |
Net investment income (loss) | $ 102,515 | $ (20,318) |
Net realized gain (loss) | 1,366,498 | 700,317 |
Change in net unrealized appreciation (depreciation) | (45,422) | (445,638) |
Net increase (decrease) in net assets resulting from operations | 1,423,591 | 234,361 |
Distributions to shareholders from net investment income | (77,653) | - |
Share transactions - net increase (decrease) | 6,814,768 | (2,334,340) |
Redemption fees | 5,302 | 4,414 |
Total increase (decrease) in net assets | 8,166,008 | (2,095,565) |
| | |
Net Assets | | |
Beginning of period | 9,955,206 | 12,050,771 |
End of period (including undistributed net investment income of $24,654 and $0, respectively.) | $ 18,121,214 | $ 9,955,206 |
See accompanying notes which are an integral part of the financial statements.
Annual Report
Financial Highlights - Initial Class
Years ended December 31, | 2006 | 2005 | 2004 | 2003 | 2002 |
Selected Per-Share Data | | | | | |
Net asset value, beginning of period | $ 11.45 | $ 11.12 | $ 10.17 | $ 8.13 | $ 9.72 |
Income from Investment Operations | | | | | |
Net investment income (loss) C | .11 F | (.02) | (.04) | (.03) | (.03) |
Net realized and unrealized gain (loss) | 1.33 | .35 | .99 | 2.07 | (1.56) |
Total from investment operations | 1.44 | .33 | .95 | 2.04 | (1.59) |
Distributions from net investment income | (.06) | - | - | - | (.01) |
Redemption fees added to paid in capital C | .01 | - H | - H | - H | .01 |
Net asset value, end of period | $ 12.84 | $ 11.45 | $ 11.12 | $ 10.17 | $ 8.13 |
Total Return A, B | 12.63% | 2.97% | 9.34% | 25.09% | (16.27)% |
Ratios to Average Net Assets D, G | | | | | |
Expenses before reductions | 1.20% | 1.19% | 1.35% | 1.72% | 1.30% |
Expenses net of fee waivers, if any | 1.15% | 1.14% | 1.35% | 1.50% | 1.30% |
Expenses net of all reductions | 1.14% | 1.12% | 1.31% | 1.46% | 1.27% |
Net investment income (loss) | .90% F | (.19)% | (.42)% | (.34)% | (.29)% |
Supplemental Data | | | | | |
Net assets, end of period (000 omitted) | $ 13,866 | $ 9,616 | $ 12,051 | $ 10,959 | $ 12,176 |
Portfolio turnover rate E | 189% | 74% | 145% | 108% | 129% |
A Total returns do not reflect charges attributable to your insurance company's separate account. Inclusion of these charges would reduce the total returns shown.
B Total returns would have been lower had certain expenses not been reduced during the periods shown.
C Calculated based on average shares outstanding during the period.
D Fees and expenses of the underlying Fidelity Central Funds are not included in the Fund's expense ratio. The Fund indirectly bears its proportionate share of the expenses of any underlying Fidelity Central Funds.
E Amount does not include the portfolio activity of any underlying Fidelity Central Funds.
F Investment income per share reflects special dividends which amounted to $.09 per share. Excluding these special dividends, the ratio of net investment income (loss) to average net assets would have been .13%.
G Expense ratios reflect operating expenses of the class. Expenses before reductions do not reflect amounts reimbursed by the investment adviser or reductions from brokerage service arrangements or other expense offset arrangements and do not represent the amount paid by the class during periods when reimbursements or reductions occur. Expenses net of fee waivers reflect expenses after reimbursement by the investment adviser but prior to reductions from brokerage service arrangements or other expense offset arrangements. Expenses net of all reductions represent the net expenses paid by the class.
H Amount represents less than $.01 per share.
Financial Highlights - Investor Class
Years ended December 31, | 2006 | 2005 I |
Selected Per-Share Data | | |
Net asset value, beginning of period | $ 11.44 | $ 11.49 |
Income from Investment Operations | | |
Net investment income (loss) E | .10 H | (.01) |
Net realized and unrealized gain (loss) | 1.33 | (.04) |
Total from investment operations | 1.43 | (.05) |
Distributions from net investment income | (.05) | - |
Redemption fees added to paid in capital E | .01 | - K |
Net asset value, end of period | $ 12.83 | $ 11.44 |
Total Return B, C, D | 12.62% | (.44)% |
Ratios to Average Net Assets F, J | | |
Expenses before reductions | 1.41% | 1.61% A |
Expenses net of fee waivers, if any | 1.25% | 1.25% A |
Expenses net of all reductions | 1.24% | 1.23% A |
Net investment income (loss) | .80% H | (.20)% A |
Supplemental Data | | |
Net assets, end of period (000 omitted) | $ 4,256 | $ 339 |
Portfolio turnover rate G | 189% | 74% |
A Annualized
B Total returns for periods of less than one year are not annualized.
C Total returns do not reflect charges attributable to your insurance company's separate account. Inclusion of these charges would reduce the total returns shown.
D Total returns would have been lower had certain expenses not been reduced during the periods shown.
E Calculated based on average shares outstanding during the period.
F Fees and expenses of the underlying Fidelity Central Funds are not included in the Fund's expense ratio. The Fund indirectly bears its proportionate share of the expenses of any underlying Fidelity Central Funds.
G Amount does not include the portfolio activity of any underlying Fidelity Central Funds.
H Investment income per share reflects special dividends which amounted to $.09 per share. Excluding these special dividends, the ratio of net investment income (loss) to average net assets would have been .03%.
I For the period July 21, 2005 (commencement of sale of shares) to December 31, 2005.
J Expense ratios reflect operating expenses of the class. Expenses before reductions do not reflect amounts reimbursed by the investment adviser or reductions from brokerage service arrangements or other expense offset arrangements and do not represent the amount paid by the class during periods when reimbursements or reductions occur. Expense ratios before reductions for start-up periods may not be representative of longer-term operating periods. Expenses net of fee waivers reflect expenses after reimbursement by the investment adviser but prior to reductions from brokerage service arrangements or other expense offset arrangements. Expenses net of all reductions represent the net expenses paid by the class.
K Amount represents less than $.01 per share.
See accompanying notes which are an integral part of the financial statements.
VIP Consumer Discretionary Portfolio
Notes to Financial Statements
For the period ended December 31, 2006
1. Significant Accounting Policies.
VIP Consumer Discretionary Portfolio (the Fund) (formerly VIP Consumer Industries Portfolio) is a non-diversified fund of Variable Insurance Products Fund IV (the trust) and is authorized to issue an unlimited number of shares. The trust is registered under the Investment Company Act of 1940, as amended (the 1940 Act), as an open-end management investment company organized as a Massachusetts business trust. Shares of the Fund may only be purchased by insurance companies for the purpose of funding variable annuity or variable life insurance contracts. The Fund offers the following classes of shares: Initial Class shares and Investor Class shares. All classes have equal rights and voting privileges, except for matters affecting a single class. Investment income, realized and unrealized capital gains and losses, the common expenses of the Fund, and certain fund-level expense reductions, if any, are allocated on a pro rata basis to each class based on the relative net assets of each class to the total net assets of the Fund. Each class differs with respect to transfer agent fees incurred. Certain expense reductions also differ by class.
The Fund may invest in Fidelity Central Funds which are open-end investment companies available to investment companies and other accounts managed by Fidelity Management & Research Company (FMR) and its affiliates. The financial statements have been prepared in conformity with accounting principles generally accepted in the United States of America, which require management to make certain estimates and assumptions at the date of the financial statements. The following summarizes the significant accounting policies of the Fund, which are also consistently followed by the Fidelity Central Funds:
Security Valuation. Investments are valued and net asset value (NAV) per share is calculated (NAV calculation) as of the close of business of the New York Stock Exchange (NYSE), normally 4:00 p.m. Eastern time. Wherever possible, the Fund uses independent pricing services approved by the Board of Trustees to value its investments.
Equity securities, including restricted securities, for which market quotations are readily available, are valued at the last reported sale price or official closing price as reported by an independent pricing service on the primary market or exchange on which they are traded. In the event there were no sales during the day or closing prices are not available, securities are valued at the last quoted bid price. Investments in open-end mutual funds, including the Fidelity Central Funds, are valued at their closing net asset value each business day. Short-term securities with remaining maturities of sixty days or less for which quotations are not readily available are valued at amortized cost, which approximates value.
When current market prices or quotations are not readily available or do not accurately reflect fair value, valuations may be determined in accordance with procedures adopted by the Board of Trustees. For example, when developments occur between the close of a market and the close of the NYSE that may materially affect the value of some or all of the securities, or when trading in a security is halted, those securities may be fair valued. Factors used in the determination of fair value may include monitoring news to identify significant market or security specific events such as changes in the value of U.S. securities markets, reviewing developments in foreign markets and evaluating the performance of ADRs, futures contracts and exchange-traded funds. Because the Fund's utilization of fair value pricing depends on market activity, the frequency with which fair value pricing is used can not be predicted and may be utilized to a significant extent. The value of securities used for NAV calculation under fair value pricing may differ from published prices for the same securities.
Foreign Currency. The Fund uses foreign currency contracts to facilitate transactions in foreign-denominated securities. Losses from these transactions may arise from changes in the value of the foreign currency or if the counterparties do not perform under the contracts' terms.
Foreign-denominated assets, including investment securities, and liabilities are translated into U.S. dollars at the exchange rate at period end. Purchases and sales of investment securities, income and dividends received and expenses denominated in foreign currencies are translated into U.S. dollars at the exchange rate in effect on the transaction date.
The effects of exchange rate fluctuations on investments are included with the net realized and unrealized gain (loss) on investment securities. Other foreign currency transactions resulting in realized and unrealized gain (loss) are disclosed separately.
Investment Transactions and Income. Security transactions, including the Fund's investment activity in the Fidelity Central Funds, are accounted for as of trade date. Gains and losses on securities sold are determined on the basis of identified cost and may include proceeds received from litigation. Dividend income is recorded on the ex-dividend date, except for certain dividends from foreign securities where the ex-dividend date may have passed, which are recorded as soon as the Fund is informed of the ex-dividend date. Non-cash dividends included in dividend income, if any, are recorded at the fair market value of the securities received. Distributions received on securities that represent a return of capital or capital gain are recorded as a reduction of cost of investments and/or as a realized gain. The Fund estimates the components of distributions received that may be considered return of capital distributions or capital gain distributions. Large, non-recurring dividends recognized by the Fund are presented separately on the Statement of Operations as "Special Dividends" and the impact of these dividends is presented in the Financial Highlights. Interest income and income distributions from the Fidelity Central Funds are accrued as earned, with any income distributions receivable as of period end included in Interest Receivable on the Statement of Assets and Liabilities. Interest income includes coupon interest and amortization of premium and accretion of discount on debt securities. Investment income is recorded net of foreign taxes withheld where recovery of such taxes is uncertain.
Annual Report
Notes to Financial Statements - continued
1. Significant Accounting Policies - continued
Expenses. Most expenses of the trust can be directly attributed to a fund. Expenses which cannot be directly attributed are apportioned among each Fund in the trust. Expense estimates are accrued in the period to which they relate and adjustments are made when actual amounts are known.
Income Tax Information and Distributions to Shareholders. Each year, the Fund intends to qualify as a regulated investment company by distributing all of its taxable income and realized gains under Subchapter M of the Internal Revenue Code. As a result, no provision for income taxes is required in the accompanying financial statements. Foreign taxes are provided for based on the Fund's understanding of the tax rules and rates that exist in the foreign markets in which it invests.
Distributions are recorded on the ex-dividend date. Income dividends and capital gain distributions are declared separately for each class. Income and capital gain distributions are determined in accordance with income tax regulations, which may differ from generally accepted accounting principles.
Capital accounts within the financial statements are adjusted for permanent book-tax differences. These adjustments have no impact on net assets or the results of operations. Temporary book-tax differences will reverse in a subsequent period.
Book-tax differences are primarily due to foreign currency transactions, capital loss carryforwards, and losses deferred due to wash sales.
The tax-basis components of distributable earnings and the federal tax cost as of period end were as follows:
Unrealized appreciation | $ 1,728,401 | |
Unrealized depreciation | (319,114) | |
Net unrealized appreciation (depreciation) | 1,409,287 | |
Undistributed ordinary income | 24,654 | |
Capital loss carryforward | (299,913) | |
| | |
Cost for federal income tax purposes | $ 16,799,547 | |
The tax character of distributions paid was as follows:
| December 31, 2006 | December 31, 2005 |
Ordinary Income | $ 77,653 | $ - |
Trading (Redemption) Fees. Shares held less than 60 days are subject to a redemption fee equal to 1% of the proceeds of the redeemed shares. All redemption fees, including any estimated redemption fees paid by FMR, are retained by the Fund and accounted for as an addition to paid in capital.
New Accounting Pronouncements. In July 2006, Financial Accounting Standards Board Interpretation No. 48, Accounting for Uncertainty in Income Taxes - an interpretation of FASB Statement 109 (FIN 48), was issued and is effective on the last business day of the semiannual reporting period for fiscal years beginning after December 15, 2006. FIN 48 sets forth a threshold for financial statement recognition, measurement and disclosure of a tax position taken or expected to be taken on a tax return. Management is currently evaluating the impact, if any, the adoption of FIN 48 will have on the Fund's net assets, results of operations and financial statement disclosures.
In addition, in September 2006, Statement of Financial Accounting Standards No. 157, Fair Value Measurements (SFAS 157), was issued and is effective for fiscal years beginning after November 15, 2007. SFAS 157 defines fair value, establishes a framework for measuring fair value and expands disclosures about fair value measurements. Management is currently evaluating the impact the adoption of SFAS 157 will have on the Fund's financial statement disclosures.
2. Operating Policies.
Repurchase Agreements. FMR has received an Exemptive Order from the Securities and Exchange Commission (the SEC) which permits the Fund and other affiliated entities of FMR to transfer uninvested cash balances into joint trading accounts which are then invested in repurchase agreements. The Fund may also invest directly with institutions in repurchase agreements. Repurchase agreements are collateralized by government or non-government securities. Upon settlement date, collateral is held in segregated accounts with custodian banks and may be obtained in the event of a default of the counterparty. The Fund monitors, on a daily basis, the value of the collateral to ensure it is at least equal to the principal amount of the repurchase agreement (including accrued interest). In the event of a default by the counterparty, realization of the collateral proceeds could be delayed, during which time the value of the collateral may decline.
3. Purchases and Sales of Investments.
Purchases and sales of securities, other than short-term securities, aggregated $28,384,869 and $21,778,362, respectively.
VIP Consumer Discretionary Portfolio
4. Fees and Other Transactions with Affiliates.
Management Fee. FMR and its affiliates provide the Fund with investment management related services for which the Fund pays a monthly management fee. The management fee is the sum of an individual fund fee rate that is based on an annual rate of .30% of the Fund's average net assets and a group fee rate that averaged .27% during the period. The group fee rate is based upon the average net assets of all the mutual funds advised by FMR. The group fee rate decreases as assets under management increase and increases as assets under management decrease. For the period, the total annual management fee rate was .57% of the Fund's average net assets.
Transfer Agent Fees. Fidelity Investments Institutional Operations Company, Inc. (FIIOC), an affiliate of FMR, is the fund's transfer, dividend disbursing, and shareholder servicing agent. FIIOC receives an asset-based fee with respect to each class. Each class with the exception of Investor Class pays a transfer agent fee, excluding out of pocket expenses, equal to an annual rate of .07% of their month end net assets. Investor Class pays a monthly asset-based transfer agent fee of .18% of its month end net assets. The total transfer agent fees paid by each class to FIIOC, including out of pocket expenses, were as follows:
Initial Class | $ 10,821 |
Investor Class | 5,182 |
| $ 16,003 |
Accounting Fees. Fidelity Service Company, Inc. (FSC), an affiliate of FMR, maintains the Fund's accounting records. The fee is based on the level of average net assets for the month.
Investments in Fidelity Central Funds. The Fund may invest in Fidelity Central Funds. The Fund's Schedule of Investments lists each of the Fidelity Central Funds as an investment of the Fund but does not include the underlying holdings of each Fidelity Central Fund. As an Investing Fund, the Fund indirectly bears its proportionate share of the expenses of the underlying Fidelity Central Funds. A complete unaudited list of holdings for each Fidelity Central Fund is available upon request. In addition, the financial statements of the Fidelity Central Funds, which are not covered by the Fund's Report of Independent Registered Public Accounting Firm, are available on the EDGAR Database on the SEC's web site, www.sec.gov, or upon request.
The Money Market Central Funds seek preservation of capital and current income and are managed by Fidelity Investments Money Management, Inc. (FIMM), an affiliate of FMR.
Brokerage Commissions. The Fund placed a portion of its portfolio transactions with brokerage firms which are affiliates of the investment adviser. The commissions paid to these affiliated firms were $104 for the period.
5. Committed Line of Credit.
The Fund participates with other funds managed by FMR in a $4.2 billion credit facility (the "line of credit") to be utilized for temporary or emergency purposes to fund shareholder redemptions or for other short-term liquidity purposes. The Fund has agreed to pay commitment fees on its pro rata portion of the line of credit, which amounted to $27 and is reflected in Miscellaneous Expense on the Statement of Operations. During the period, there were no borrowings on this line of credit.
6. Expense Reductions.
FMR voluntarily agreed to reimburse each class to the extent annual operating expenses exceeded certain levels of average net assets as noted in the table below. Some expenses, for example interest expense, including commitment fees, are excluded from this reimbursement.
The following classes were in reimbursement during the period:
| Expense
Limitations | Reimbursement
from adviser |
| | |
Initial Class | 1.15% | $ 4,886 |
Investor Class | 1.25% | 2,707 |
| | $ 7,593 |
Effective February 1, 2007 the expense limitations changed to 1.00% and 1.15% for VIP Consumer Discretionary Portfolio Initial Class and VIP Consumer Discretionary Portfolio Investor Class, respectively.
Many of the brokers with whom FMR places trades on behalf of the Fund provided services to the Fund in addition to trade execution. These services included payments of certain expenses on behalf of the Fund totaling $587 for the period.
Annual Report
Notes to Financial Statements - continued
7. Other.
The Fund's organizational documents provide former and current trustees and officers with a limited indemnification against liabilities arising in connection with the performance of their duties to the Fund. In the normal course of business, the Fund may also enter into contracts that provide general indemnifications. The Fund's maximum exposure under these arrangements is unknown as this would be dependent on future claims that may be made against the Fund. The risk of material loss from such claims is considered remote.
At the end of the period, FMR or its affiliates were the owners of record of 100% of the total outstanding shares of the Fund.
The United States Securities and Exchange Commission ("SEC") is conducting an investigation of FMR (covering the years 2002 to 2004) arising from gifts, gratuities and business entertainment provided by certain brokers to certain individuals who were employed on FMR's domestic equity trading desk during that period. FMR is in discussions with the SEC staff regarding the possible resolution of the matter, but as of period-end no final resolution has been reached.
In December 2006, the Independent Trustees completed their own investigation of the matter with the assistance of independent counsel. The Independent Trustees and FMR agree that, despite the absence of proof that the Fidelity mutual funds experienced diminished execution quality as a result of the improper receipt of gifts and business entertainment, the conduct at issue was serious and is worthy of redress. Accordingly, the Independent Trustees have requested and FMR has agreed to pay $42 million to Fidelity mutual funds, plus interest to be determined at the time that payment is made. A method of allocating this payment among the funds has not yet been determined. The total payment to the Fund is not anticipated to have a material impact on the Fund's net assets. In addition, FMR reimbursed related legal expenses which are recorded in the accompanying Statement of Operations as an expense reduction.
8. Distributions to Shareholders.
Distributions to shareholders of each class were as follows:
| Years ended December 31, |
| 2006 | 2005 |
From net investment income | | |
Initial Class | $ 59,733 | $ - |
Investor Class | 17,920 | - |
Total | $ 77,653 | $ - |
9. Share Transactions.
Transactions for each class of shares were as follows:
| Shares | Dollars |
| Years ended December 31, | Years ended December 31, |
| 2006 | 2005 A | 2006 | 2005 A |
Initial Class | | | | |
Shares sold | 587,575 | 218,817 | $ 7,314,538 | $ 2,412,375 |
Reinvestment of distributions | 4,634 | - | 59,733 | - |
Shares redeemed | (351,833) | (463,005) | (4,301,667) | (5,081,138) |
Net increase (decrease) | 240,376 | (244,188) | $ 3,072,604 | $ (2,668,763) |
Investor Class | | | | |
Shares sold | 344,914 | 32,066 | $ 4,271,675 | $ 361,952 |
Reinvestment of distributions | 1,391 | - | 17,920 | - |
Shares redeemed | (44,309) | (2,434) | (547,431) | (27,529) |
Net increase (decrease) | 301,996 | 29,632 | $ 3,742,164 | $ 334,423 |
A Share transactions for Investor Class are for the period July 21, 2005 (commencement of sale of shares) to December 31, 2005.
VIP Consumer Discretionary Portfolio
Report of Independent Registered Public Accounting Firm
To the Trustees of Variable Insurance Products Fund IV and the Shareholders of VIP Consumer Discretionary Portfolio (formerly VIP Consumer Industries Portfolio):
In our opinion, the accompanying statement of assets and liabilities, including the schedule of investments, and the related statements of operations and of changes in net assets and the financial highlights present fairly, in all material respects, the financial position of VIP Consumer Discretionary Portfolio (formerly VIP Consumer Industries Portfolio) (a fund of Variable Insurance Products Fund IV) at December 31, 2006, the results of its operations for the year then ended, the changes in its net assets for each of the two years in the period then ended and the financial highlights for each of the periods indicated, in conformity with accounting principles generally accepted in the United States of America. These financial statements and financial highlights (hereafter referred to as "financial statements") are the responsibility of the VIP Consumer Discretionary Portfolio's management; our responsibility is to express an opinion on these financial statements based on our audits. We conducted our audits of these financial statements in accordance with the standards of the Public Company Accounting Oversight Board (United States). Those standards require that we plan and perform the audit to obtain reasonable assurance about whether the financial statements are free of material misstatement. An audit includes examining, on a test basis, evidence supporting the amounts and disclosures in the financial statements, assessing the accounting principles used and significant estimates made by management, and evaluating the overall financial statement presentation. We believe that our audits, which included confirmation of securities at December 31, 2006 by correspondence with the custodian and brokers, provide a reasonable basis for our opinion.
/s/ PricewaterhouseCoopers LLP
PricewaterhouseCoopers LLP
Boston, Massachusetts
February 21, 2007
Annual Report
Trustees and Officers
The Trustees, Member of the Advisory Board, and executive officers of the trust and funds, as applicable, are listed below. The Board of Trustees governs the fund and is responsible for protecting the interests of shareholders. The Trustees are experienced executives who meet periodically throughout the year to oversee the fund's activities, review contractual arrangements with companies that provide services to the fund, and review the fund's performance. Each of the Trustees oversees 348 funds advised by FMR or an affiliate.
The Trustees hold office without limit in time except that (a) any Trustee may resign; (b) any Trustee may be removed by written instrument, signed by at least two-thirds of the number of Trustees prior to such removal; (c) any Trustee who requests to be retired or who has become incapacitated by illness or injury may be retired by written instrument signed by a majority of the other Trustees; and (d) any Trustee may be removed at any special meeting of shareholders by a two-thirds vote of the outstanding voting securities of the trust. Each Trustee who is not an interested person (as defined in the 1940 Act) (Independent Trustee), shall retire not later than the last day of the calendar year in which his or her 72nd birthday occurs. The Independent Trustees may waive this mandatory retirement age policy with respect to individual Trustees. The executive officers and Advisory Board Member hold office without limit in time, except that any officer and Advisory Board Member may resign or may be removed by a vote of a majority of the Trustees at any regular meeting or any special meeting of the Trustees. Except as indicated, each individual has held the office shown or other offices in the same company for the past five years.
The fund's Statement of Additional Information (SAI) includes more information about the Trustees. To request a free copy, call Fidelity at 1-877-208-0098.
Interested Trustees*:
Correspondence intended for each Trustee who is an interested person may be sent to Fidelity Investments, 82 Devonshire Street, Boston, Massachusetts 02109.
Name, Age; Principal Occupation |
Edward C. Johnson 3d (76) |
| Year of Election or Appointment: 1983 Mr. Johnson is Chairman of the Board of Trustees. Mr. Johnson serves as President (2006-present), Chief Executive Officer, Chairman, and a Director of FMR Corp.; Chairman and a Director of FMR; Chairman and a Director of Fidelity Research & Analysis Company (FRAC); Chairman and a Director of Fidelity Investments Money Management, Inc.; and Chairman (2001-present) and a Director of FMR Co., Inc. In addition, Mr. Johnson serves as Chairman and Director of Fidelity International Limited (FIL). |
Robert L. Reynolds (54) |
| Year of Election or Appointment: 2003 Mr. Reynolds is President and a Director of FMR (2005-present), Fidelity Investments Money Management, Inc. (2005-present), and FMR Co., Inc. (2005-present). Mr. Reynolds also serves as Vice Chairman (2006-present), a Director (2003-present), and Chief Operating Officer of FMR Corp. and a Director of Strategic Advisers, Inc. (2005-present). He also serves on the Board at Fidelity Investments Canada, Ltd. |
* Trustees have been determined to be "Interested Trustees" by virtue of, among other things, their affiliation with the trust or various entities under common control with FMR.
Independent Trustees:
Correspondence intended for each Independent Trustee (that is, the Trustees other than the Interested Trustees) may be sent to Fidelity Investments, P.O. Box 55235, Boston, Massachusetts 02205-5235.
Name, Age; Principal Occupation |
Dennis J. Dirks (58) |
| Year of Election or Appointment: 2005 Prior to his retirement in May 2003, Mr. Dirks was Chief Operating Officer and a member of the Board of The Depository Trust & Clearing Corporation (DTCC) (1999-2003). He also served as President, Chief Operating Officer, and Board member of The Depository Trust Company (DTC) (1999-2003) and President and Board member of the National Securities Clearing Corporation (NSCC) (1999-2003). In addition, Mr. Dirks served as Chief Executive Officer and Board member of the Government Securities Clearing Corporation (2001-2003) and Chief Executive Officer and Board member of the Mortgage-Backed Securities Clearing Corporation (2001-2003). Mr. Dirks also serves as a Trustee and a member of the Finance Committee of Manhattan College (2005-present) and a Trustee and a member of the Finance Committee of AHRC of Nassau County (2006-present). |
Albert R. Gamper, Jr. (64) |
| Year of Election or Appointment: 2006 Prior to his retirement in December 2004, Mr. Gamper served as Chairman of the Board of CIT Group Inc. (commercial finance). During his tenure with CIT Group Inc. Mr. Gamper served in numerous senior management positions, including Chairman (1987-1989; 1999-2001; 2002-2004), Chief Executive Officer (1987-2004), and President (1989-2002). He currently serves as a member of the Board of Directors of Public Service Enterprise Group (utilities, 2001-present), Chairman of the Board of Governors, Rutgers University (2004-present), and Chairman of the Board of Saint Barnabas Health Care System. |
George H. Heilmeier (70) |
| Year of Election or Appointment: 2004 Dr. Heilmeier is Chairman Emeritus of Telcordia Technologies (communication software and systems), where prior to his retirement, he served as company Chairman and Chief Executive Officer. He currently serves on the Boards of Directors of The Mitre Corporation (systems engineering and information technology support for the government), and HRL Laboratories (private research and development, 2004-present). He is Chairman of the General Motors Science & Technology Advisory Board and a Life Fellow of the Institute of Electrical and Electronics Engineers (IEEE). Dr. Heilmeier is a member of the Defense Science Board and the National Security Agency Advisory Board. He is also a member of the National Academy of Engineering, the American Academy of Arts and Sciences, and the Board of Overseers of the School of Engineering and Applied Science of the University of Pennsylvania. Previously, Dr. Heilmeier served as a Director of TRW Inc. (automotive, space, defense, and information technology, 1992-2002), Compaq (1994-2002), Automatic Data Processing, Inc. (ADP) (technology-based business outsourcing, 1995-2002), INET Technologies Inc. (telecommunications network surveillance, 2001-2004), and Teletech Holdings (customer management services). He is the recipient of the 2005 Kyoto Prize in Advanced Technology for his invention of the liquid crystal display, and a member of the Consumer Electronics Hall of Fame. |
James H. Keyes (66) |
| Year of Election or Appointment: 2007 Prior to his retirement in 2003, Mr. Keyes was Chairman, President, and Chief Executive Officer of Johnson Controls, Inc. (automotive supplier, 1993-2003). He currently serves as a member of the boards of LSI Logic Corporation (semiconductor technologies), Navistar International Corporation (manufacture and sale of trucks, buses, and diesel engines, 2002-present), and Pitney Bowes, Inc. (integrated mail, messaging, and document management solutions). |
Marie L. Knowles (60) |
| Year of Election or Appointment: 2001 Prior to Ms. Knowles' retirement in June 2000, she served as Executive Vice President and Chief Financial Officer of Atlantic Richfield Company (ARCO) (diversified energy, 1996-2000). From 1993 to 1996, she was a Senior Vice President of ARCO and President of ARCO Transportation Company. She served as a Director of ARCO from 1996 to 1998. She currently serves as a Director of Phelps Dodge Corporation (copper mining and manufacturing) and McKesson Corporation (healthcare service, 2002-present). Ms. Knowles is a Trustee of the Brookings Institution and the Catalina Island Conservancy and also serves as a member of the Advisory Board for the School of Engineering of the University of Southern California. |
Ned C. Lautenbach (62) |
| Year of Election or Appointment: 2000 Mr. Lautenbach is Chairman of the Independent Trustees (2006-present). Mr. Lautenbach has been a partner of Clayton, Dubilier & Rice, Inc. (private equity investment firm) since September 1998. Previously, Mr. Lautenbach was with the International Business Machines Corporation (IBM) from 1968 until his retirement in 1998. Mr. Lautenbach serves as a Director of Sony Corporation (2006-present) and Eaton Corporation (diversified industrial) as well as the Philharmonic Center for the Arts in Naples, Florida. He also is a member of the Board of Trustees of Fairfield University (2005-present), as well as a member of the Council on Foreign Relations. |
Cornelia M. Small (62) |
| Year of Election or Appointment: 2005 Ms. Small is a member (2000-present) and Chairperson (2002-present) of the Investment Committee, and a member (2002-
present) of the Board of Trustees of Smith College. Previously, she served as Chief Investment Officer (1999-2000), Director of Global Equity Investments (1996-1999), and a member of the Board of Directors of Scudder, Stevens & Clark (1990-1997) and Scudder Kemper Investments (1997-1999). In addition, Ms. Small served as Co-Chair (2000-2003) of the Annual Fund for the Fletcher School of Law and Diplomacy. |
William S. Stavropoulos (67) |
| Year of Election or Appointment: 2001 Mr. Stavropoulos is Chairman Emeritus of the Board of Directors of The Dow Chemical Company. Since joining The Dow Chemical Company in 1967, Mr. Stavropoulos served in numerous senior management positions, including President (1993-2000; 2002-2003), CEO (1995-2000; 2002-2004), and Chairman of the Executive Committee (2000-2004). Currently, he is a Director of NCR Corporation (data warehousing and technology solutions), BellSouth Corporation (telecommunications), Chemical Financial Corporation, Maersk Inc. (industrial conglomerate, 2002-present), and Metalmark Capital (private equity investment firm, 2005-present). He also serves as a member of the Board of Trustees of the American Enterprise Institute for Public Policy Research. In addition, Mr. Stavropoulos is a member of The Business Council, J.P. Morgan International Council and the University of Notre Dame Advisory Council for the College of Science. |
Kenneth L. Wolfe (67) |
| Year of Election or Appointment: 2005 Prior to his retirement in 2001, Mr. Wolfe was Chairman and Chief Executive Officer of Hershey Foods Corporation (1993-2001). He currently serves as a member of the boards of Adelphia Communications Corporation (2003-present), Bausch & Lomb, Inc., and Revlon Inc. (2004-present). |
Advisory Board Member and Executive Officers:
Correspondence intended for each executive officer and Mr. Lynch may be sent to Fidelity Investments, 82 Devonshire Street, Boston, Massachusetts 02109.
Name, Age; Principal Occupation |
Peter S. Lynch (62) |
| Year of Election or Appointment: 2003 Member of the Advisory Board of Variable Insurance Products Fund IV. Mr. Lynch is Vice Chairman and a Director of FMR, and Vice Chairman (2001-present) and a Director of FMR Co., Inc. Previously, Mr. Lynch served as a Trustee of the Fidelity funds (1990-2003). In addition, he serves as a Trustee of Boston College and as the Chairman of the Inner-City Scholarship Fund. |
Kimberley H. Monasterio (43) |
| Year of Election or Appointment: 2007 President and Treasurer of VIP Consumer Discretionary. Ms. Monasterio also serves as President and Treasurer of other Fidelity funds (2007-present) and is an employee of FMR (2004-present). Previously, Ms. Monasterio served as Deputy Treasurer of the Fidelity funds (2004-2006). Before joining Fidelity Investments, Ms. Monasterio served as Treasurer (2000-2004) and Chief Financial Officer (2002-2004) of the Franklin Templeton Funds and Senior Vice President of Franklin Templeton Services, LLC (2000-2004). |
Boyce I. Greer (50) |
| Year of Election or Appointment: 2005 Vice President of VIP Consumer Discretionary. Mr. Greer also serves as Vice President of certain Equity Funds (2005-present), certain Asset Allocation Funds (2005-present), Fixed-Income Funds (2006-present), and Money Market Funds (2006-present). Mr. Greer is also a Trustee of other investment companies advised by FMR (2003-present). He is an Executive Vice President of FMR (2005-present) and FMR Co., Inc. (2005-present), and Senior Vice President of Fidelity Investments Money Management, Inc. (2006-present). Previously, Mr. Greer served as a Director and Managing Director of Strategic Advisers, Inc. (2002-2005), and Executive Vice President (2000-2002) and Money Market Group Leader (1997-2002) of the Fidelity Investments Fixed Income Division. He also served as Vice President of Fidelity's Money Market Funds (1997-2002), Senior Vice President of FMR (1997-2002), and Vice President of FIMM (1998-2002). |
Eric D. Roiter (58) |
| Year of Election or Appointment: 2001 Secretary of VIP Consumer Discretionary. He also serves as Secretary of other Fidelity funds; Vice President, General Counsel, and Secretary of FMR Co., Inc. (2001-present) and FMR; Assistant Secretary of Fidelity Management & Research (U.K.) Inc. (2001-
present), Fidelity Research & Analysis Company (2001-present), and Fidelity Investments Money Management, Inc. (2001-present). Mr. Roiter is an Adjunct Member, Faculty of Law, at Boston College Law School (2003-present). Previously, Mr. Roiter served as Vice President and Secretary of Fidelity Distributors Corporation (FDC) (1998-2005). |
Stuart Fross (47) |
| Year of Election or Appointment: 2003 Assistant Secretary of VIP Consumer Discretionary. Mr. Fross also serves as Assistant Secretary of other Fidelity funds (2003-
present), Vice President and Secretary of FDC (2005-present), and is an employee of FMR. |
R. Stephen Ganis (40) |
| Year of Election or Appointment: 2006 Anti-Money Laundering (AML) officer of VIP Consumer Discretionary. Mr. Ganis also serves as AML officer of other Fidelity funds (2006-present) and FMR Corp. (2003-present). Before joining Fidelity Investments, Mr. Ganis practiced law at Goodwin Procter, LLP (2000-2002). |
Joseph B. Hollis (58) |
| Year of Election or Appointment: 2006 Chief Financial Officer of VIP Consumer Discretionary. Mr. Hollis also serves as Chief Financial Officer of other Fidelity funds. Mr. Hollis is President of Fidelity Pricing and Cash Management Services (FPCMS) (2005-present). Mr. Hollis also serves as President and Director of Fidelity Service Company, Inc. (2006-present). Previously, Mr. Hollis served as Senior Vice President of Cash Management Services (1999-2002) and Investment Management Operations (2002-2005). |
Kenneth A. Rathgeber (59) |
| Year of Election or Appointment: 2004 Chief Compliance Officer of VIP Consumer Discretionary. Mr. Rathgeber also serves as Chief Compliance Officer of other Fidelity funds (2004-present) and Executive Vice President of Risk Oversight for Fidelity Investments (2002-present). He is Chief Compliance Officer of FMR (2005-present), FMR Co., Inc. (2005-present), Fidelity Management & Research (U.K.) Inc. (2005-present), Fidelity Research & Analysis Company (2005-present), Fidelity Investments Money Management, Inc. (2005-present), and Strategic Advisers, Inc. (2005-present). Previously, Mr. Rathgeber served as Executive Vice President and Chief Operating Officer for Fidelity Investments Institutional Services Company, Inc. (1998-2002). |
Bryan A. Mehrmann (45) |
| Year of Election or Appointment: 2005 Deputy Treasurer of VIP Consumer Discretionary. Mr. Mehrmann also serves as Deputy Treasurer of other Fidelity funds (2005-
present) and is an employee of FMR. Previously, Mr. Mehrmann served as Vice President of Fidelity Investments Institutional Services Group (FIIS)/Fidelity Investments Institutional Operations Corporation, Inc. (FIIOC) Client Services (1998-2004). |
Kenneth B. Robins (37) |
| Year of Election or Appointment: 2005 Deputy Treasurer of VIP Consumer Discretionary. Mr. Robins also serves as Deputy Treasurer of other Fidelity funds (2005-present) and is an employee of FMR (2004-present). Before joining Fidelity Investments, Mr. Robins worked at KPMG LLP, where he was a partner in KPMG's department of professional practice (2002-2004) and a Senior Manager (1999-2000). In addition, Mr. Robins served as Assistant Chief Accountant, United States Securities and Exchange Commission (2000-2002). |
Robert G. Byrnes (40) |
| Year of Election or Appointment: 2005 Assistant Treasurer of VIP Consumer Discretionary. Mr. Byrnes also serves as Assistant Treasurer of other Fidelity funds (2005-
present) and is an employee of FMR (2005-present). Previously, Mr. Byrnes served as Vice President of FPCMS (2003-2005). Before joining Fidelity Investments, Mr. Byrnes worked at Deutsche Asset Management where he served as Vice President of the Investment Operations Group (2000-2003). |
John H. Costello (60) |
| Year of Election or Appointment: 1991 Assistant Treasurer of VIP Consumer Discretionary. Mr. Costello also serves as Assistant Treasurer of other Fidelity funds and is an employee of FMR. |
Peter L. Lydecker (52) |
| Year of Election or Appointment: 2004 Assistant Treasurer of VIP Consumer Discretionary. Mr. Lydecker also serves as Assistant Treasurer of other Fidelity funds (2004) and is an employee of FMR. |
Mark Osterheld (51) |
| Year of Election or Appointment: 2002 Assistant Treasurer of VIP Consumer Discretionary. Mr. Osterheld also serves as Assistant Treasurer of other Fidelity funds (2002) and is an employee of FMR. |
Gary W. Ryan (48) |
| Year of Election or Appointment: 2005 Assistant Treasurer of VIP Consumer Discretionary. Mr. Ryan also serves as Assistant Treasurer of other Fidelity funds (2005-
present) and is an employee of FMR (2005-present). Previously, Mr. Ryan served as Vice President of Fund Reporting in FPCMS (1999-2005). |
Salvatore Schiavone (41) |
| Year of Election or Appointment: 2005 Assistant Treasurer of VIP Consumer Discretionary. Mr. Schiavone also serves as Assistant Treasurer of other Fidelity funds (2005-
present) and is an employee of FMR (2005-present). Before joining Fidelity Investments, Mr. Schiavone worked at Deutsche Asset Management, where he most recently served as Assistant Treasurer (2003-2005) of the Scudder Funds and Vice President and Head of Fund Reporting (1996-2003). |
VIP Consumer Discretionary Portfolio
Distributions
Initial Class and Investor Class of VIP Consumer Discretionary Portfolio designate 100% of the dividends distributed during the fiscal year as qualifying for the dividends-received deduction for corporate shareholders.
The fund will notify shareholders in January 2007 of amounts for use in preparing 2006 income tax returns.
Annual Report
Proxy Voting Results
A special meeting of the fund's shareholders was held on September 20, 2006. The results of votes taken among shareholders on the proposals before them are reported below. Each vote reported represents one dollar of net asset value held on the record date for the meeting.
PROPOSAL 1 |
To elect a Board of Trustees.A |
| # of
Votes | % of
Votes |
Dennis J. Dirks |
Affirmative | 92,459,317.52 | 96.102 |
Withheld | 3,749,837.05 | 3.898 |
TOTAL | 96,209,154.57 | 100.000 |
Albert R. Gamper, Jr. |
Affirmative | 92,260,598.99 | 95.896 |
Withheld | 3,948,555.58 | 4.104 |
TOTAL | 96,209,154.57 | 100.000 |
Robert M. Gates |
Affirmative | 92,315,480.72 | 95.953 |
Withheld | 3,893,673.85 | 4.047 |
TOTAL | 96,209,154.57 | 100.000 |
George H. Heilmeier |
Affirmative | 92,208,255.41 | 95.841 |
Withheld | 4,000,899.16 | 4.159 |
TOTAL | 96,209,154.57 | 100.000 |
Edward C. Johnson 3d |
Affirmative | 91,928,267.76 | 95.550 |
Withheld | 4,280,886.81 | 4.450 |
TOTAL | 96,209,154.57 | 100.000 |
Stephen P. Jonas |
Affirmative | 92,457,628.76 | 96.101 |
Withheld | 3,751,525.81 | 3.899 |
TOTAL | 96,209,154.57 | 100.000 |
James H. KeyesB |
Affirmative | 92,432,729.82 | 96.075 |
Withheld | 3,776,424.75 | 3.925 |
TOTAL | 96,209,154.57 | 100.000 |
Marie L. Knowles |
Affirmative | 92,398,847.52 | 96.040 |
Withheld | 3,810,307.05 | 3.960 |
TOTAL | 96,209,154.57 | 100.000 |
Ned C. Lautenbach |
Affirmative | 92,423,184.47 | 96.065 |
Withheld | 3,785,970.10 | 3.935 |
TOTAL | 96,209,154.57 | 100.000 |
William O. McCoy |
Affirmative | 92,086,293.90 | 95.715 |
Withheld | 4,122,860.67 | 4.285 |
TOTAL | 96,209,154.57 | 100.000 |
| # of
Votes | % of
Votes |
Robert L. Reynolds |
Affirmative | 92,439,032.86 | 96.081 |
Withheld | 3,770,121.71 | 3.919 |
TOTAL | 96,209,154.57 | 100.000 |
Cornelia M. Small |
Affirmative | 92,415,567.29 | 96.057 |
Withheld | 3,793,587.28 | 3.943 |
TOTAL | 96,209,154.57 | 100.000 |
William S. Stavropoulos |
Affirmative | 92,135,400.08 | 95.766 |
Withheld | 4,073,754.49 | 4.234 |
TOTAL | 96,209,154.57 | 100.000 |
Kenneth L. Wolfe |
Affirmative | 92,445,865.31 | 96.088 |
Withheld | 3,763,289.26 | 3.912 |
TOTAL | 96,209,154.57 | 100.000 |
PROPOSAL 2A |
To modify the fund's fundamental "invests primarily" policy (the investment policy concerning the fund's primary investments). |
| # of
Votes | % of
Votes |
Affirmative | 749,858.99 | 94.668 |
Against | 30,652.91 | 3.870 |
Abstain | 11,582.98 | 1.462 |
TOTAL | 792,094.88 | 100.000 |
PROPOSAL 2B |
To modify the fund's fundamental concentration policy. |
| # of
Votes | % of
Votes |
Affirmative | 700,648.07 | 88.455 |
Against | 79,863.83 | 10.083 |
Abstain | 11,582.98 | 1.462 |
TOTAL | 792,094.88 | 100.000 |
A Denotes trust-wide proposal and voting results. B Effective on or about January 1, 2007. |
VIP Consumer Discretionary Portfolio
Board Approval of Investment Advisory Contracts and Management Fees
VIP Consumer Discretionary Portfolio
Each year, typically in July, the Board of Trustees, including the Independent Trustees (together, the Board), votes on the renewal of the management contract and sub-advisory agreements (together, the Advisory Contracts) for the fund. The Board, assisted by the advice of fund counsel and Independent Trustees' counsel, requests and considers a broad range of information throughout the year.
The Board meets regularly each month except August and takes into account throughout the year matters bearing on Advisory Contracts. The Board, acting directly and through its separate committees, considers at each of its meetings factors that are relevant to the annual renewal of the fund's Advisory Contracts, including the services and support provided to the fund and its shareholders. At the time of the renewal, the Board had 12 standing committees, each composed of Independent Trustees with varying backgrounds, to which the Board has assigned specific subject matter responsibilities in order to enhance effective decision-making by the Board. Each committee has adopted a written charter outlining the structure and purposes of the committee. One such committee, the Equity Contract Committee, meets periodically as needed throughout the year to consider matters specifically related to the annual renewal of Advisory Contracts. The committee requests and receives information on, and makes recommendations to the Independent Trustees concerning, the approval and annual review of the Advisory Contracts.
At its July 2006 meeting, the Board of Trustees, including the Independent Trustees, unanimously determined to renew the Advisory Contracts for the fund. In reaching its determination, the Board considered all factors it believed relevant, including (i) the nature, extent, and quality of the services to be provided to the fund and its shareholders (including the investment performance of the fund); (ii) the competitiveness of the management fee and total expenses of the fund; (iii) the total costs of the services to be provided by and the profits to be realized by the investment adviser and its affiliates from the relationship with the fund; (iv) the extent to which economies of scale would be realized as the fund grows; and (v) whether fee levels reflect these economies of scale, if any, for the benefit of fund shareholders.
In determining whether to renew the Advisory Contracts for the fund, the Board ultimately reached a determination, with the assistance of fund counsel and Independent Trustees' counsel, that the renewal of the Advisory Contracts and the compensation to be received by Fidelity under the management contract is consistent with Fidelity's fiduciary duty under applicable law. In addition to evaluating the specific factors noted above, the Board, in reaching its determination, is aware that shareholders in the fund have a broad range of investment choices available to them, including a wide choice among mutual funds offered by competitors to Fidelity, and that the fund's shareholders, with the opportunity to review and weigh the disclosure provided by the fund in its prospectus and other public disclosures, have chosen to invest in this fund, managed by Fidelity.
Nature, Extent, and Quality of Services Provided. The Board considered staffing within the investment adviser, FMR, and the sub-advisers (together, the Investment Advisers), including the background of the fund's portfolio manager and the fund's investment objective and discipline. The Independent Trustees also had discussions with senior management of Fidelity's investment operations and investment groups. The Board considered the structure of the portfolio manager compensation program and whether this structure provides appropriate incentives.
Resources Dedicated to Investment Management and Support Services. The Board reviewed the size, education, and experience of the Investment Advisers' investment staff, their use of technology, and the Investment Advisers' approach to recruiting, training, and retaining portfolio managers and other research, advisory, and management personnel. The Board considered Fidelity's extensive global research capabilities that enable the Investment Advisers to aggregate data from various sources in an effort to produce positive investment results. The Board noted that Fidelity's analysts have access to a variety of technological tools that enable them to perform both fundamental and quantitative analysis and to specialize in various disciplines. The Board also considered that Fidelity's portfolio managers and analysts have access to daily portfolio attribution that allows for monitoring of a fund's portfolio, as well as an electronic communication system that provides immediate real-time access to research concerning issuers and credit enhancers.
Shareholder and Administrative Services. The Board considered (i) the nature, extent, quality, and cost of administrative, distribution, and shareholder services performed by the Investment Advisers and their affiliates under the Advisory Contracts and under separate agreements covering transfer agency, pricing and bookkeeping, and securities lending services for the fund; (ii) the nature and extent of the Investment Advisers' supervision of third party service providers, principally custodians and subcustodians; and (iii) the resources devoted to, and the record of compliance with, the fund's compliance policies and procedures. The Board reviewed the allocation of fund brokerage, including allocations to brokers affiliated with the Investment Advisers, the use of brokerage commissions to pay fund expenses, and the use of "soft" commission dollars to pay for research services. The Board also considered that Fidelity voluntarily pays for market data out of its own resources.
The Board noted that the growth of fund assets across the complex allows Fidelity to reinvest in the development of services designed to enhance the value or convenience of the Fidelity funds as investment vehicles. These services include 24-hour access to account information and market information through phone representatives and over the Internet, and investor education materials and asset allocation tools.
Investment in a Large Fund Family. The Board considered the benefits to shareholders of investing in a Fidelity fund, including the benefits of investing in a fund that is part of a large family of funds offering a variety of investment disciplines and providing for a large variety of mutual fund investor services. The Board noted that, since the last Advisory Contract renewals in July 2005, Fidelity has taken a number of actions that benefited particular funds, including (i) dedicating additional resources to investment research and to restructure the investment research teams; (ii) voluntarily entering into contractual arrangements with certain brokers pursuant to which Fidelity pays for research products and services separately out of its own resources, rather than bundling with fund commissions; (iii) launching the Fidelity Advantage Class of its five Spartan stock index funds and three Spartan bond index funds, which is a lower-fee class available to shareholders with higher account balances; (iv) contractually agreeing to impose expense limitations on Fidelity U.S. Bond Index Fund and reducing the fund's initial investment minimum; and (v) offering shareholders of each of the Fidelity Institutional Money Market Funds the privilege of exchanging shares of the fund for shares of other Fidelity funds.
Annual Report
Board Approval of Investment Advisory Contracts and Management Fees - continued
Investment Performance and Compliance. The Board considered whether the fund has operated within its investment objective, as well as its record of compliance with its investment restrictions. It also reviewed the fund's absolute investment performance for Initial Class, as well as the fund's relative investment performance for Initial Class measured against (i) a Goldman Sachs index that reflects the market sector in which the fund invests, and (ii) a peer group of mutual funds over multiple periods. Because the fund had been in existence less than five calendar years, the following charts considered by the Board show, over the one- and three-year periods ended December 31, 2005, the cumulative total returns of Initial Class of the fund, the cumulative total returns of a Goldman Sachs index ("benchmark"), and a range of cumulative total returns of a peer group of mutual funds identified by Lipper Inc. as having an investment objective similar to that of the fund. (Investor Class of the fund had less than one year of performance as of December 31, 2005.) The box within each chart shows the 25th percentile return (bottom of box) and the 75th percentile return (top of box) of the Lipper peer group. Returns shown above the box are in the first quartile and returns shown below the box are in the fourth quartile. The percentage beaten number noted below each chart corresponds to the percentile box and represents the percentage of funds in the Lipper peer group whose performance was equal to or lower than that of Initial Class.
VIP Consumer Discretionary Portfolio
The Board reviewed the fund's relative investment performance against its Lipper peer group and stated that the performance of Initial Class of the fund was in the third quartile for the one-year period and the fourth quartile for the three-year period. The Board noted that FMR does not consider that Lipper peer group to be a meaningful comparison for the fund, however, because the peer group includes funds that focus on different industries and sectors than the fund. The Board also stated that the relative investment performance of Initial Class of the fund compared favorably to its benchmark for all the periods shown.
The Board considered that FMR has taken steps to refocus and strengthen equity research, equity portfolio management, and compliance. The Board noted with favor FMR's reorganization of its senior management team in 2005 and FMR's dedication of additional resources to investment research, and participated in the process that led to those changes.
Based on its review, and giving particular weight to the nature and quality of the resources dedicated by the Investment Advisers to maintain and improve relative performance, the Board concluded that the nature, extent, and quality of the services provided to the fund will benefit the fund's shareholders, particularly in light of the Board's view that the fund's shareholders benefit from investing in a fund that is part of a large family of funds offering a variety of investment disciplines and services.
Competitiveness of Management Fee and Total Fund Expenses. The Board considered the fund's management fee and total expenses compared to "mapped groups" of competitive funds and classes. Fidelity creates "mapped groups" by combining similar Lipper investment objective categories that have comparable management fee characteristics. Combining Lipper investment objective categories aids the Board's management fee and total expense comparisons by broadening the competitive group used for comparison and by reducing the number of universes to which various Fidelity funds are compared.
VIP Consumer Discretionary Portfolio
The Board considered two proprietary management fee comparisons for the 12-month (or shorter) periods shown in the chart below. The group of Lipper funds used by the Board for management fee comparisons is referred to below as the "Total Mapped Group" and, for the reasons explained above, is broader than the Lipper peer group used by the Board for performance comparisons. The Total Mapped Group comparison focuses on a fund's standing relative to the total universe of comparable funds available to investors, in terms of gross management fees before expense reimbursements or caps. "TMG %" represents the percentage of funds in the Total Mapped Group that had management fees that were lower than the fund's. For example, a TMG % of 8% means that 92% of the funds in the Total Mapped Group had higher management fees than the fund. The "Asset-Size Peer Group" (ASPG) comparison focuses on a fund's standing relative to non-Fidelity funds similar in size to the fund within the Total Mapped Group. The ASPG represents at least 15% of the funds in the Total Mapped Group with comparable asset size and management fee characteristics, subject to a minimum of 50 funds (or all funds in the Total Mapped Group if fewer than 50). Additional information, such as the ASPG quartile in which the fund's management fee ranked, is also included in the chart and considered by the Board.
VIP Consumer Discretionary Portfolio
The Board noted that the fund's management fee ranked below the median of its Total Mapped Group and below the median of its ASPG for 2005.
Based on its review, the Board concluded that the fund's management fee was fair and reasonable in light of the services that the fund receives and the other factors considered.
In its review of each class's total expenses, the Board considered the fund's management fee as well as other fund or class expenses, as applicable, such as transfer agent fees, pricing and bookkeeping fees, and custodial, legal, and audit fees. The Board also noted the effects of any waivers and reimbursements on fees and expenses. As part of its review, the Board also considered current and historical total expenses of each class of the fund compared to competitive fund median expenses. Each class of the fund is compared to those funds and classes in the Total Mapped Group (used by the Board for management fee comparisons) that have a similar sales load structure.
The Board noted that the total expenses of Initial Class ranked below its competitive median for 2005, and the total expenses of Investor Class ranked above its competitive median for 2005. The Board noted that the fund offers multiple classes and that the multiple structures are intended to offer pricing options for the intermediary market. The Board also noted that the total expenses of the classes vary primarily due to differences in transfer agent fees. The Board considered that Investor Class was above median primarily due to its higher transfer agent fee.
In its review of total expenses, the Board also considered Fidelity fee structures and other information on clients that FMR and its affiliates service in other competitive markets, such as other mutual funds advised or subadvised by FMR or its affiliates, pension plan clients, and other institutional clients.
Based on its review, the Board concluded that the total expenses of each class of the fund were reasonable, although in one case above the median of the universe presented for comparison, in light of the services that the fund and its shareholders receive and the other factors considered.
Annual Report
Board Approval of Investment Advisory Contracts and Management Fees - continued
Costs of the Services and Profitability. The Board considered the revenues earned and the expenses incurred by Fidelity in conducting the business of developing, marketing, distributing, managing, administering and servicing the fund and its shareholders. The Board also considered the level of Fidelity's profits in respect of all the Fidelity funds.
On an annual basis, FMR presents to the Board Fidelity's profitability for the fund. Fidelity calculates the profitability for each fund, as well as aggregate profitability for groups of Fidelity funds and all Fidelity funds, using a series of detailed revenue and cost allocation methodologies which originate with the audited books and records of Fidelity. The Audit Committee of the Board reviews any significant changes from the prior year's methodologies.
PricewaterhouseCoopers LLP (PwC), independent registered accounting firm and auditor to Fidelity and certain Fidelity funds, has been engaged annually by the Board as part of the Board's assessment of the results of Fidelity's profitability analysis. PwC's engagement includes the review and assessment of Fidelity's methodologies used in determining the revenues and expenses attributable to Fidelity's mutual fund business, and completion of agreed-upon procedures surrounding the mathematical accuracy of fund profitability and its conformity to allocation methodologies. After considering PwC's reports issued under the engagement and information provided by Fidelity, the Board believes that while other allocation methods may also be reasonable, Fidelity's profitability methodologies are reasonable in all material respects.
The Board has also reviewed Fidelity's non-fund businesses and any fall-out benefits related to the mutual fund business as well as cases where Fidelity's affiliates may benefit from or be related to the fund's business.
The Board considered the costs of the services provided by and the profits realized by Fidelity in connection with the operation of the fund and determined that the amount of profit is a fair entrepreneurial profit for the management of the fund.
Economies of Scale. The Board considered whether there have been economies of scale in respect of the management of the Fidelity funds, whether the Fidelity funds (including the fund) have appropriately benefited from any such economies of scale, and whether there is potential for realization of any further economies of scale. The Board considered the extent to which the fund will benefit from economies of scale through increased services to the fund, through waivers or reimbursements, or through fee or expense reductions.
The Board recognized that the fund's management contract incorporates a "group fee" structure, which provides for lower fee rates as total fund assets under FMR's management increase, and for higher fee rates as total fund assets under FMR's management decrease. The Board considered that the group fee is designed to deliver the benefits of economies of scale to fund shareholders when total fund assets increase, even if assets of any particular fund are unchanged or have declined, because some portion of Fidelity's costs are attributable to services provided to all Fidelity funds, and all funds benefit if those costs can be allocated among more assets. The Board concluded that, given the group fee structure, fund shareholders will achieve a certain level of economies of scale as assets under FMR's management increase at the fund complex level, regardless of whether Fidelity achieves any such economies of scale.
The Board further concluded that any potential economies of scale are being shared between fund shareholders and Fidelity in an appropriate manner.
Additional Information Requested by the Board. In order to develop fully the factual basis for consideration of the Advisory Contracts, the Board requested additional information on several topics, including (i) Fidelity's fund profitability methodology and profitability trends within certain funds; (ii) portfolio manager compensation; (iii) the extent to which any economies of scale exist and are shared between the funds and Fidelity; (iv) the total expenses of certain funds and classes relative to competitors, including the extent to which the expenses of certain funds have been or could be capped; (v) fund performance trends; and (vi) Fidelity's fee structures, including use of performance fees.
Based on its evaluation of all of the conclusions noted above, and after considering all material factors, the Board ultimately concluded that the advisory fee structures are fair and reasonable, and that the fund's Advisory Contracts should be renewed.
VIP Consumer Discretionary Portfolio
Annual Report
VIP Consumer Discretionary Portfolio
Annual Report
Investment Adviser
Fidelity Management & Research Company
Boston, MA
Investment Sub-Advisers
FMR Co., Inc.
Fidelity Management & Research (U.K.) Inc.
Fidelity Research & Analysis Company
(formerly Fidelity Management & Research (Far East) Inc.)
Fidelity Investments Japan Limited
Fidelity International Investment Advisors
Fidelity International Investment Advisors
(U.K.) Limited
General Distributor
Fidelity Distributors Corporation
Boston, MA
Transfer and Service Agents
Fidelity Investments Institutional Operations Company, Inc.
Boston, MA
Fidelity Service Company, Inc.
Boston, MA
Custodian
JPMorgan Chase Bank
New York, NY
VCONIC-ANN-0207
1.817355.101
Fidelity® Variable Insurance Products:
Energy Portfolio
(formerly Natural Resources Portfolio)
Annual Report
December 31, 2006
(2_fidelity_logos) (Registered_Trademark)
Contents
Note to Shareholders | <Click Here> | An explanation of the changes to the fund. |
Performance | <Click Here> | How the fund has done over time. |
Management's Discussion | <Click Here> | The manager's review of fund performance, strategy and outlook. |
Shareholder Expense Example | <Click Here> | An example of shareholder expenses. |
Investment Changes | <Click Here> | A summary of major shifts in the fund's investments over the past six months. |
Investments | <Click Here> | A complete list of the fund's investments with their
market values. |
Financial Statements | <Click Here> | Statements of assets and liabilities, operations, and
changes in net assets, as well as financial highlights. |
Notes | <Click Here> | Notes to the financial statements. |
Report of Independent Registered Public Accounting Firm | <Click Here> | |
Trustees and Officers | <Click Here> | |
Distributions | <Click Here> | |
Proxy Voting Results | <Click Here> | |
Board Approval of Investment Advisory Contracts and Management Fees | <Click Here> | |
To view a fund's proxy voting guidelines and proxy voting record for the 12-month period ended June 30, visit www.fidelity.com/proxyvotingresults or visit the Securities and Exchange Commission's (SEC) web site at www.sec.gov. You may also call 1-877-208-0098 to request a free copy of the proxy voting guidelines.
Fidelity Variable Insurance Products are separate account options which are purchased through a variable insurance contract.
Standard & Poor's, S&P and S&P 500 are registered service marks of The McGraw-Hill Companies, Inc. and have been licensed for use by Fidelity Distributors Corporation.
Other third party marks appearing herein are the property of their respective owners.
All other marks appearing herein are registered or unregistered trademarks or service marks of FMR Corp. or an affiliated company.
This report and the financial statements contained herein are submitted for the general information of the shareholders of the fund. This report is not authorized for distribution to prospective investors in the fund unless preceded or accompanied by an effective prospectus.
A fund files its complete schedule of portfolio holdings with the SEC for the first and third quarters of each fiscal year on Form N-Q. Forms N-Q are available on the SEC's web site at http://www.sec.gov. A fund's Forms N-Q may be reviewed and copied at the SEC's Public Reference Room in Washington, DC. Information regarding the operation of the SEC's Public Reference Room may be obtained by calling 1-800-SEC-0330. For a complete list of the fund's portfolio holdings, view the most recent quarterly holdings report, semiannual report, or annual report on Fidelity's web site at http://www.advisor.fidelity.com.
NOT FDIC INSURED · MAY LOSE VALUE · NO BANK GUARANTEE
Neither the fund nor Fidelity Distributors Corporation is a bank.
VIP Energy Portfolio
Notes to Shareholders:
Effective October 1, 2006, Fidelity restructured the VIP Sector product line. The restructuring aligned the funds' investment goals more closely with standard industry classifications and facilitated adoption of more-specific benchmark indexes to evaluate fund performance. As restructured, the funds generally align under seven sectors in the widely recognized Global Industry Classification Standard (GICS), developed by Standard & Poor's® (S&P®) and Morgan Stanley Capital InternationalSM (MSCI®): Consumer Discretionary, Energy, Financials, Health Care, Industrials, Information Technology and Utilities. Changes to the funds ranged from simply adopting a new supplemental benchmark to, in some cases, changing investment policies and fund names.
For VIP Consumer Discretionary (formerly VIP Consumer Industries), VIP Energy (formerly VIP Natural Resources), VIP Industrials (formerly VIP Cyclical Industries), and VIP Utilities (formerly VIP Telecommunications & Utilities Growth), shareholders approved certain fundamental investment policy changes related to the restructuring at a special meeting of shareholders held September 20, 2006. All the funds adopted new benchmark indexes from MSCI. Taken together, the name, policy and benchmark changes will make it easier for investors to distinguish funds in the product line and to evaluate Fidelity Management & Research Company's skill in managing the funds.
For VIP Energy, shareholders approved narrowing the fund's policies to focus on energy and to exclude industrial or agricultural materials and unfinished goods. Energy companies are a subset of the broader natural resources sector, which is generally made up of energy and materials companies. The fund is now benchmarked to the MSCI US Investable Market Energy Index.
Annual Report
VIP Energy Portfolio
Performance: The Bottom Line
Average annual total return reflects the change in the value of an investment, assuming reinvestment of the class' dividend income and capital gains (the profits earned upon the sale of securities that have grown in value) and assuming a constant rate of performance each year. During periods of reimbursement by Fidelity, a fund's total return will be greater than it would be had the reimbursement not occurred. Performance numbers are net of all underlying fund operating expenses, but do not include any insurance charges imposed by your insurance company's separate account. If performance information included the effect of these additional charges, the total returns would have been lower. How a fund did yesterday is no guarantee of how it will do tomorrow.
Average Annual Total Returns
Periods ended December 31, 2006 | Past 1
year | Past 5
years | Life of
fundA |
VIP Energy - Initial Class | 16.91% | 19.62% | 17.16% |
VIP Energy - Investor ClassB | 16.69% | 19.56% | 17.11% |
A From July 19, 2001.
B The initial offering of Investor Class took place on July 21, 2005. Returns prior to July 21, 2005 are those of Initial Class. If Investor Class's transfer agent fee had been reflected, returns prior to July 21, 2005 would have been lower.
$10,000 Life of Fund
Let's say hypothetically that $10,000 was invested in VIP Energy Portfolio - Initial Class on July 19, 2001, when the fund started. The chart shows how the value of your investment would have changed, and also shows how the Standard & Poor's 500SM Index (S&P 500®) performed over the same period.
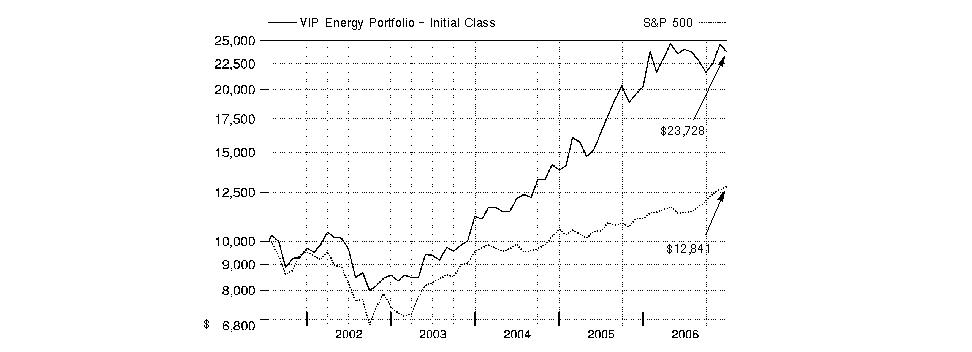
VIP Energy Portfolio
VIP Energy Portfolio
Management's Discussion of Fund Performance
Comments from John Dowd, Portfolio Manager of VIP Energy Portfolio
U.S. stock markets registered their fourth consecutive year of positive returns in 2006. Among the highlights were the performances of the Dow Jones Industrial AverageSM - a gauge of 30 mega-cap, blue-chip stocks - and the small-cap-oriented Russell 2000® Index, both of which reached new highs. The efforts of the Federal Reserve Board to contain inflation levels also dominated the investment headlines. In all, the Fed hiked short-term interest rates four times, but held rates steady after its June 29 increase, finally pausing after 17 rate hikes over a two-year period. A slowing residential housing market and moderating oil prices - the latter of which hit a record closing high of $77 per barrel in July before falling sharply - also held economic growth in check. For the year overall, the Standard & Poor's 500SM Index was up 15.79%, the Dow advanced 19.05%, the Russell 2000 Index gained 18.37% and the NASDAQ Composite® Index rose 10.39%.
For the 12 months that ended December 31, 2006, the fund underperformed the 21.03% gain of the Morgan Stanley Capital InternationalSM (MSCI®) US Investable Market Energy Index and the 18.25% advance of a blended index specific to this fund. This blended index is a combination of the Goldman Sachs® Natural Resources Index, which the fund was compared to through September, and the new MSCI benchmark mentioned above, which the fund was compared to during the period's final three months.1 During the same 12-month period, the fund outpaced the S&P 500®. (For specific portfolio performance results, please refer to the performance section of this report.) During the first nine months of the period, the fund's performance was in line with the Goldman Sachs benchmark. A number of out-of-index stocks performed very well. Metal producers Oregon Steel Mills and Allegheny Technologies, along with mining equipment manufacturer Bucyrus International, benefited from strong demand for industrial metals, as did index-component Titanium Metals. Danish wind turbine manufacturer Vestas Wind Systems also boosted performance. On the other hand, the fund suffered from underweighting or not owning the integrated oil companies - most of which were sizable components of the index - that outperformed during the summer and early fall, including Exxon Mobil, Chevron, Marathon Oil and Suncor Energy. National Oilwell Varco disappointed in response to declining natural gas prices. For the final three months of the period, the fund modestly underperformed the new MSCI index partly because the new index is more heavily concentrated in energy stocks than the Goldman Sachs index. The fund was less concentrated in certain areas that performed very well during this time frame, including integrated oils Exxon Mobil, Chevron, and Marathon Oil, which the fund didn't own. Overweighting oil and gas exploration and production (E&P) companies such as Ultra Petroleum and EOG Resources hurt, as did overweighting refiner Valero Energy. On the flip side, performance was enhanced by overweighting several undervalued stocks, including drillers Noble and GlobalSantaFe, and Cabot Oil & Gas in the E&P area. Lastly, out-of-index Vestas Wind Systems generated strong returns and aided performance. Some of the stocks I've mentioned were no longer held at period end.
1 The fund's blended index is a customized index developed by Fidelity for the limited purpose of discussing the fund's performance for the 12-month period ending December 31, 2006. From January 1, 2006, through September 30, 2006, the fund compared its performance to the Goldman Sachs Natural Resources Index, which returned 6.64% during that period. On October 1, 2006, the fund began comparing its performance to a different index, the MSCI US Investable Market Energy Index, which returned 10.89% from October 1, 2006, through December 31, 2006. For the 12-month period ending December 31, 2006, the blended index (Goldman Sachs and MSCI) returned 18.25%.
The views expressed above reflect those of the portfolio manager(s) only through the end of the period as stated on the cover of this report and do not necessarily represent the views of Fidelity or any other person in the Fidelity organization. Any such views are subject to change at any time based upon market or other conditions and Fidelity disclaims any responsibility to update such views. These views may not be relied on as investment advice and, because investment decisions for a Fidelity fund are based on numerous factors, may not be relied on as an indication of trading intent on behalf of any Fidelity fund.
Annual Report
VIP Energy Portfolio
Shareholder Expense Example
As a shareholder of the Fund, you incur two types of costs: (1) transaction costs, including redemption fees, and (2) ongoing costs, including management fees, distribution and/or service (12b-1) fees and other Fund expenses. This Example is intended to help you understand your ongoing costs (in dollars) of investing in the Fund and to compare these costs with the ongoing costs of investing in other mutual funds.
The Example is based on an investment of $1,000 invested at the beginning of the period and held for the entire period (July 1, 2006 to December 31, 2006).
Actual Expenses
The first line of the accompanying table for each class of the Fund provides information about actual account values and actual expenses. You may use the information in this line, together with the amount you invested, to estimate the expenses that you paid over the period. Simply divide your account value by $1,000.00 (for example, an $8,600 account value divided by $1,000.00 = 8.6), then multiply the result by the number in the first line for a class of the Fund under the heading entitled "Expenses Paid During Period" to estimate the expenses you paid on your account during this period. The estimate of expenses does not include any fees or other expenses of any variable annuity or variable life insurance product. If they were, the estimate of expenses you paid during the period would be higher, and your ending account value would be lower.
Hypothetical Example for Comparison Purposes
The second line of the accompanying table for each class of the Fund provides information about hypothetical account values and hypothetical expenses based on a Class' actual expense ratio and an assumed rate of return of 5% per year before expenses, which is not the Class' actual return. The hypothetical account values and expenses may not be used to estimate the actual ending account balance or expenses you paid for the period. You may use this information to compare the ongoing costs of investing in the Fund and other funds. To do so, compare this 5% hypothetical example with the 5% hypothetical examples that appear in the shareholder reports of the other funds. The estimate of expenses does not include any fees or other expenses of any variable annuity or variable life insurance product. If they were, the estimate of expenses you paid during the period would be higher, and your ending account value would be lower.
Please note that the expenses shown in the table are meant to highlight your ongoing costs only and do not reflect any transaction costs. Therefore, the second line of the table is useful in comparing ongoing costs only, and will not help you determine the relative total costs of owning different funds. In addition, if these transactional costs were included, your costs would have been higher.
| Beginning
Account Value
July 1, 2006 | Ending
Account Value
December 31, 2006 | Expenses Paid
During Period*
July 1, 2006 to
December 31, 2006 |
Initial Class | | | |
Actual | $ 1,000.00 | $ 987.50 | $ 3.56 |
Hypothetical A | $ 1,000.00 | $ 1,021.63 | $ 3.62 |
Service Class 2 | | | |
Actual | $ 1,000.00 | $ 986.00 | $ 4.86 |
Hypothetical A | $ 1,000.00 | $ 1,020.32 | $ 4.94 |
Investor Class | | | |
Actual | $ 1,000.00 | $ 986.80 | $ 4.16 |
Hypothetical A | $ 1,000.00 | $ 1,021.02 | $ 4.23 |
A 5% return per year before expenses
* Expenses are equal to each Class' annualized expense ratio (shown in the table below); multiplied by the average account value over the period, multiplied by 184/365 (to reflect the one-half year period).
| Annualized
Expense Ratio |
Initial Class | .71% |
Service Class 2 | .97% |
Investor Class | .83% |
VIP Energy Portfolio
VIP Energy Portfolio
Investment Changes
Top Ten Stocks as of December 31, 2006 |
| % of fund's
net assets | % of fund's net assets
6 months ago |
Chevron Corp. | 8.9 | 2.7 |
ConocoPhillips | 8.4 | 3.7 |
Exxon Mobil Corp. | 8.0 | 2.5 |
Valero Energy Corp. | 7.3 | 3.5 |
Noble Corp. | 5.9 | 2.4 |
Schlumberger Ltd. (NY Shares) | 5.8 | 4.0 |
Baker Hughes, Inc. | 5.2 | 1.7 |
National Oilwell Varco, Inc. | 3.5 | 3.4 |
Ultra Petroleum Corp. | 3.4 | 2.1 |
GlobalSantaFe Corp. | 3.2 | 3.5 |
| 59.6 | |
Top Industries (% of fund's net assets) |
As of December 31, 2006 |
 | Oil, Gas &
Consumable Fuels | 58.0% | |
 | Energy Equipment & Services | 36.6% | |
 | Construction & Engineering | 1.9% | |
 | Machinery | 1.6% | |
 | Electrical Equipment | 1.4% | |
 | All Others* | 0.5% | |

|
As of June 30, 2006 |
| Oil, Gas &
Consumable Fuels | 41.7% | |
| Energy Equipment & Services | 28.9% | |
| Metals & Mining | 15.5% | |
| Machinery | 2.4% | |
| Chemicals | 1.9% | |
| All Others* | 9.6% | |

* Includes short-term investments and net other assets. |
Prior period industry classifications reflect the categories in place as of the date indicated and have not been adjusted to reflect current industry classifications. |
Annual Report
VIP Energy Portfolio
Investments December 31, 2006
Showing Percentage of Net Assets
Common Stocks - 99.5% |
| Shares | | Value (Note 1) |
CONSTRUCTION & ENGINEERING - 1.9% |
Construction & Engineering - 1.9% |
Chicago Bridge & Iron Co. NV (NY Shares) | 163,000 | | $ 4,456,420 |
Fluor Corp. | 9,200 | | 751,180 |
Jacobs Engineering Group, Inc. (a) | 28,800 | | 2,348,352 |
| | 7,555,952 |
ELECTRICAL EQUIPMENT - 1.4% |
Heavy Electrical Equipment - 1.4% |
Vestas Wind Systems AS (a) | 137,200 | | 5,799,150 |
ENERGY EQUIPMENT & SERVICES - 36.6% |
Oil & Gas Drilling - 15.7% |
Diamond Offshore Drilling, Inc. | 137,500 | | 10,991,750 |
GlobalSantaFe Corp. | 219,700 | | 12,913,966 |
Noble Corp. | 309,430 | | 23,563,095 |
Pride International, Inc. (a) | 314,900 | | 9,450,149 |
Transocean, Inc. (a) | 75,300 | | 6,091,017 |
| | 63,009,977 |
Oil & Gas Equipment & Services - 20.9% |
Baker Hughes, Inc. | 279,480 | | 20,865,977 |
Halliburton Co. | 331,500 | | 10,293,075 |
Hydril Co. (a) | 25,600 | | 1,924,864 |
National Oilwell Varco, Inc. (a) | 229,439 | | 14,037,078 |
Oceaneering International, Inc. (a) | 26,700 | | 1,059,990 |
Schlumberger Ltd. (NY Shares) | 369,120 | | 23,313,619 |
Smith International, Inc. | 127,880 | | 5,252,032 |
Superior Energy Services, Inc. (a) | 116,700 | | 3,813,756 |
W-H Energy Services, Inc. (a) | 38,400 | | 1,869,696 |
Weatherford International Ltd. (a) | 41,900 | | 1,751,001 |
| | 84,181,088 |
TOTAL ENERGY EQUIPMENT & SERVICES | | 147,191,065 |
INDEPENDENT POWER PRODUCERS & ENERGY TRADERS - 0.0% |
Independent Power Producers & Energy Traders - 0.0% |
Dynegy, Inc. Class A (a) | 267 | | 1,933 |
MACHINERY - 1.6% |
Construction & Farm Machinery & Heavy Trucks - 1.6% |
Bucyrus International, Inc. Class A | 54,700 | | 2,831,272 |
Joy Global, Inc. | 78,750 | | 3,806,775 |
| | 6,638,047 |
OIL, GAS & CONSUMABLE FUELS - 58.0% |
Coal & Consumable Fuels - 3.9% |
Arch Coal, Inc. | 121,700 | | 3,654,651 |
CONSOL Energy, Inc. | 167,700 | | 5,388,201 |
Foundation Coal Holdings, Inc. | 25,700 | | 816,232 |
Peabody Energy Corp. | 144,200 | | 5,827,122 |
| | 15,686,206 |
Integrated Oil & Gas - 27.5% |
Chevron Corp. | 487,500 | | 35,845,874 |
|
| Shares | | Value (Note 1) |
ConocoPhillips | 471,075 | | $ 33,893,846 |
Exxon Mobil Corp. | 422,181 | | 32,351,730 |
Hess Corp. | 62,500 | | 3,098,125 |
Occidental Petroleum Corp. | 110,700 | | 5,405,481 |
| | 110,595,056 |
Oil & Gas Exploration & Production - 18.7% |
Aurora Oil & Gas Corp. (a) | 163,307 | | 524,215 |
Cabot Oil & Gas Corp. | 134,659 | | 8,167,068 |
Chesapeake Energy Corp. | 344,500 | | 10,007,725 |
Energy Partners Ltd. (a) | 46,087 | | 1,125,445 |
EOG Resources, Inc. | 167,000 | | 10,429,150 |
Houston Exploration Co. (a) | 70,446 | | 3,647,694 |
Mariner Energy, Inc. (a) | 25,916 | | 507,954 |
Newfield Exploration Co. (a) | 28,700 | | 1,318,765 |
Noble Energy, Inc. | 8,000 | | 392,560 |
Petrohawk Energy Corp. (a) | 158,600 | | 1,823,900 |
Plains Exploration & Production Co. (a) | 57,100 | | 2,713,963 |
Quicksilver Resources, Inc. (a) | 40,850 | | 1,494,702 |
Range Resources Corp. | 387,200 | | 10,632,512 |
Ultra Petroleum Corp. (a) | 282,400 | | 13,484,600 |
XTO Energy, Inc. | 191,500 | | 9,010,075 |
| | 75,280,328 |
Oil & Gas Refining & Marketing - 7.9% |
Petroplus Holdings AG | 5,140 | | 312,039 |
Sunoco, Inc. | 35,000 | | 2,182,600 |
Valero Energy Corp. | 571,124 | | 29,218,704 |
| | 31,713,343 |
TOTAL OIL, GAS & CONSUMABLE FUELS | | 233,274,933 |
TOTAL COMMON STOCKS (Cost $325,020,602) | 400,461,080 |
Money Market Funds - 0.5% |
| | | |
Fidelity Cash Central Fund, 5.37% (b)
(Cost $1,897,908) | 1,897,908 | | 1,897,908 |
TOTAL INVESTMENT PORTFOLIO - 100.0% (Cost $326,918,510) | 402,358,988 |
NET OTHER ASSETS - 0.0% | | (80,737) |
NET ASSETS - 100% | $ 402,278,251 |
Legend |
(a) Non-income producing |
(b) Affiliated fund that is available only to investment companies and other accounts managed by Fidelity Investments. The rate quoted is the annualized seven-day yield of the fund at period end. A complete unaudited listing of the fund's holdings as of its most recent quarter end is available upon request. |
Affiliated Central Funds |
Information regarding fiscal year to date income earned by the Fund from investments in Fidelity Central Funds is as follows: |
Fund | Income earned |
Fidelity Cash Central Fund | $ 253,814 |
Fidelity Securities Lending Cash Central Fund | 84,109 |
Total | $ 337,923 |
Other Information |
Distribution of investments by country of issue, as a percentage of total net assets, is as follows: |
United States of America | 79.1% |
Cayman Islands | 9.1% |
Netherlands Antilles | 5.8% |
Canada | 3.4% |
Denmark | 1.4% |
Netherlands | 1.1% |
Others (individually less than 1%) | 0.1% |
| 100.0% |
See accompanying notes which are an integral part of the financial statements.
Annual Report
VIP Energy Portfolio
Financial Statements
Statement of Assets and Liabilities
| December 31, 2006 |
| | |
Assets | | |
Investment in securities, at value - See accompanying schedule: Unaffiliated issuers
(cost $325,020,602) | $ 400,461,080 | |
Fidelity Central Funds
(cost $1,897,908) | 1,897,908 | |
Total Investments
(cost $326,918,510) | | $ 402,358,988 |
Foreign currency held at value
(cost $3) | | 3 |
Dividends receivable | | 177,471 |
Interest receivable | | 18,009 |
Prepaid expenses | | 2,425 |
Other receivables | | 17,608 |
Total assets | | 402,574,504 |
| | |
Liabilities | | |
Accrued management fee | $ 195,414 | |
Transfer agent fee payable | 27,303 | |
Distribution fees payable | 14,816 | |
Other affiliated payables | 12,499 | |
Other payables and accrued expenses | 46,221 | |
Total liabilities | | 296,253 |
| | |
Net Assets | | $ 402,278,251 |
Net Assets consist of: | | |
Paid in capital | | $ 328,790,210 |
Accumulated undistributed net realized gain (loss) on investments and foreign currency transactions | | (1,952,492) |
Net unrealized appreciation (depreciation) on investments and assets and liabilities in foreign currencies | | 75,440,533 |
Net Assets | | $ 402,278,251 |
Initial Class:
Net Asset Value, offering price and redemption price per share ($280,536,639 ÷ 14,734,859 shares) | | $ 19.04 |
| | |
| | |
Service Class 2:
Net Asset Value, offering price and redemption price per share ($70,305,186 ÷ 3,703,841 shares) | | $ 18.98 |
| | |
| | |
Investor Class:
Net Asset Value, offering price and redemption price per share ($51,436,426 ÷ 2,706,487 shares) | | $ 19.00 |
Statement of Operations
| Year ended December 31, 2006 |
| | |
Investment Income | | |
Dividends | | $ 4,719,649 |
Interest | | 95 |
Income from Fidelity Central Funds | | 337,923 |
Total income | | 5,057,667 |
| | |
Expenses | | |
Management fee | $ 2,537,706 | |
Transfer agent fees | 352,584 | |
Distribution fees | 124,029 | |
Accounting and security lending fees | 185,933 | |
Custodian fees and expenses | 58,716 | |
Independent trustees' compensation | 1,657 | |
Audit | 41,105 | |
Legal | 15,806 | |
Interest | 30,867 | |
Miscellaneous | 32,917 | |
Total expenses before reductions | 3,381,320 | |
Expense reductions | (75,255) | 3,306,065 |
Net investment income (loss) | | 1,751,602 |
Realized and Unrealized Gain (Loss) Net realized gain (loss) on: | | |
Investment securities: | | |
Unaffiliated issuers | 50,116,453 | |
Foreign currency transactions | (942) | |
Total net realized gain (loss) | | 50,115,511 |
Change in net unrealized appreciation (depreciation) on: Investment securities | (2,183,547) | |
Assets and liabilities in foreign currencies | 293 | |
Total change in net unrealized appreciation (depreciation) | | (2,183,254) |
Net gain (loss) | | 47,932,257 |
Net increase (decrease) in net assets resulting from operations | | $ 49,683,859 |
See accompanying notes which are an integral part of the financial statements.
VIP Energy Portfolio
Statement of Changes in Net Assets
| Year ended
December 31, 2006 | Year ended
December 31, 2005 |
Increase (Decrease) in Net Assets | | |
Operations | | |
Net investment income (loss) | $ 1,751,602 | $ 1,402,783 |
Net realized gain (loss) | 50,115,511 | 21,384,356 |
Change in net unrealized appreciation (depreciation) | (2,183,254) | 62,078,286 |
Net increase (decrease) in net assets resulting from operations | 49,683,859 | 84,865,425 |
Distributions to shareholders from net investment income | (2,844,412) | (1,478,904) |
Distributions to shareholders from net realized gain | (54,354,221) | (17,250,199) |
Total distributions | (57,198,633) | (18,729,103) |
Share transactions - net increase (decrease) | 38,551,892 | 178,824,579 |
Redemption fees | 261,131 | 237,972 |
Total increase (decrease) in net assets | 31,298,249 | 245,198,873 |
| | |
Net Assets | | |
Beginning of period | 370,980,002 | 125,781,129 |
End of period | $ 402,278,251 | $ 370,980,002 |
Financial Highlights - Initial Class
Years ended December 31, | 2006 | 2005 | 2004 | 2003 | 2002 |
Selected Per-Share Data | | | | | |
Net asset value, beginning of period | $ 18.92 | $ 13.62 | $ 11.04 | $ 8.49 | $ 9.68 |
Income from Investment Operations | | | | | |
Net investment income (loss) C | .09 | .10 | .10 | .05 | .06 |
Net realized and unrealized gain (loss) | 3.09 | 6.20 | 2.53 | 2.54 | (1.20) |
Total from investment operations | 3.18 | 6.30 | 2.63 | 2.59 | (1.14) |
Distributions from net investment income | (.16) | (.08) | (.07) | (.05) | (.07) |
Distributions from net realized gain | (2.91) | (.94) | - | - | - |
Total distributions | (3.07) | (1.02) | (.07) | (.05) | (.07) |
Redemption fees added to paid in capital C | .01 | .02 | .02 | .01 | .02 |
Net asset value, end of period | $ 19.04 | $ 18.92 | $ 13.62 | $ 11.04 | $ 8.49 |
Total Return A, B | 16.91% | 46.31% | 23.96% | 30.61% | (11.58)% |
Ratios to Average Net Assets D, F | | | | | |
Expenses before reductions | .71% | .72% | .78% | 1.26% | 1.10% |
Expenses net of fee waivers, if any | .71% | .72% | .78% | 1.26% | 1.10% |
Expenses net of all reductions | .70% | .66% | .74% | 1.25% | 1.08% |
Net investment income (loss) | .43% | .56% | .80% | .56% | .70% |
Supplemental Data | | | | | |
Net assets, end of period (000 omitted) | $ 280,537 | $ 334,368 | $ 125,781 | $ 31,624 | $ 20,537 |
Portfolio turnover rate E | 151% | 107% | 87% | 73% | 83% |
A Total returns do not reflect charges attributable to your insurance company's separate account. Inclusion of these charges would reduce the total returns shown.
B Total returns would have been lower had certain expenses not been reduced during the periods shown.
C Calculated based on average shares outstanding during the period.
D Fees and expenses of the underlying Fidelity Central Funds are not included in the Fund's expense ratio. The Fund indirectly bears its proportionate share of the expenses of any underlying Fidelity Central Funds.
E Amount does not include the portfolio activity of any underlying Fidelity Central Funds.
F Expense ratios reflect operating expenses of the class. Expenses before reductions do not reflect amounts reimbursed by the investment adviser or reductions from brokerage service arrangements or other expense offset arrangements and do not represent the amount paid by the class during periods when reimbursements or reductions occur. Expenses net of fee waivers reflect expenses after reimbursement by the investment adviser but prior to reductions from brokerage service arrangements or other expense offset arrangements. Expenses net of all reductions represent the net expenses paid by the class.
See accompanying notes which are an integral part of the financial statements.
Annual Report
Financial Highlights - Service Class 2
Years ended December 31, | 2006 | 2005 H |
Selected Per-Share Data | | |
Net asset value, beginning of period | $ 18.90 | $ 15.80 |
Income from Investment Operations | | |
Net investment income (loss) E | .04 | .04 |
Net realized and unrealized gain (loss) | 3.07 | 4.04 |
Total from investment operations | 3.11 | 4.08 |
Distributions from net investment income | (.13) | (.07) |
Distributions from net realized gain | (2.91) | (.92) |
Total distributions | (3.04) | (.99) |
Redemption fees added to paid in capital E | .01 | .01 |
Net asset value, end of period | $ 18.98 | $ 18.90 |
Total Return B, C, D | 16.55% | 25.80% |
Ratios to Average Net Assets F, I | | |
Expenses before reductions | .96% | .97% A |
Expenses net of fee waivers, if any | .96% | .97% A |
Expenses net of all reductions | .95% | .91% A |
Net investment income (loss) | .18% | .31% A |
Supplemental Data | | |
Net assets, end of period (000 omitted) | $ 70,305 | $ 20,211 |
Portfolio turnover rate G | 151% | 107% |
A Annualized
B Total returns for periods of less than one year are not annualized.
C Total returns do not reflect charges attributable to your insurance company's separate account. Inclusion of these charges would reduce the total returns shown.
D Total returns would have been lower had certain expenses not been reduced during the periods shown.
E Calculated based on average shares outstanding during the period.
F Fees and expenses of the underlying Fidelity Central Funds are not included in the Fund's expense ratio. The Fund indirectly bears its proportionate share of the expenses of any underlying Fidelity Central Funds.
G Amount does not include the portfolio activity of any underlying Fidelity Central Funds.
H For the period April 6, 2005 (commencement of sale of shares) to December 31, 2005.
I Expense ratios reflect operating expenses of the class. Expenses before reductions do not reflect amounts reimbursed by the investment adviser or reductions from brokerage service arrangements or other expense offset arrangements and do not represent the amount paid by the class during periods when reimbursements or reductions occur. Expense ratios before reductions for start-up periods may not be representative of longer-term operating periods. Expenses net of fee waivers reflect expenses after reimbursement by the investment adviser but prior to reductions from brokerage service arrangements or other expense offset arrangements. Expenses net of all reductions represent the net expenses paid by the class.
Financial Highlights - Investor Class
Years ended December 31, | 2006 | 2005 H |
Selected Per-Share Data | | |
Net asset value, beginning of period | $ 18.91 | $ 16.76 |
Income from Investment Operations | | |
Net investment income (loss) E | .06 | .03 |
Net realized and unrealized gain (loss) | 3.08 | 3.11 |
Total from investment operations | 3.14 | 3.14 |
Distributions from net investment income | (.15) | (.08) |
Distributions from net realized gain | (2.91) | (.92) |
Total distributions | (3.06) | (1.00) |
Redemption fees added to paid in capital E | .01 | .01 |
Net asset value, end of period | $ 19.00 | $ 18.91 |
Total Return B, C, D | 16.69% | 18.73% |
Ratios to Average Net Assets F, I | | |
Expenses before reductions | .84% | .91% A |
Expenses net of fee waivers, if any | .84% | .91% A |
Expenses net of all reductions | .82% | .85% A |
Net investment income (loss) | .31% | .37% A |
Supplemental Data | | |
Net assets, end of period (000 omitted) | $ 51,436 | $ 16,402 |
Portfolio turnover rate G | 151% | 107% |
A Annualized
B Total returns for periods of less than one year are not annualized.
C Total returns do not reflect charges attributable to your insurance company's separate account. Inclusion of these charges would reduce the total returns shown.
D Total returns would have been lower had certain expenses not been reduced during the periods shown.
E Calculated based on average shares outstanding during the period.
F Fees and expenses of the underlying Fidelity Central Funds are not included in the Fund's expense ratio. The Fund indirectly bears its proportionate share of the expenses of any underlying Fidelity Central Funds.
G Amount does not include the portfolio activity of any underlying Fidelity Central Funds.
H For the period July 21, 2005 (commencement of sale of shares) to December 31, 2005.
I Expense ratios reflect operating expenses of the class. Expenses before reductions do not reflect amounts reimbursed by the investment adviser or reductions from brokerage service arrangements or other expense offset arrangements and do not represent the amount paid by the class during periods when reimbursements or reductions occur. Expense ratios before reductions for start-up periods may not be representative of longer-term operating periods. Expenses net of fee waivers reflect expenses after reimbursement by the investment adviser but prior to reductions from brokerage service arrangements or other expense offset arrangements. Expenses net of all reductions represent the net expenses paid by the class.
See accompanying notes which are an integral part of the financial statements.
VIP Energy Portfolio
Notes to Financial Statements
For the period ended December 31, 2006
1. Significant Accounting Policies.
VIP Energy Portfolio (the Fund)(formerly VIP Natural Resources Portfolio) is a non-diversified fund of Variable Insurance Products Fund IV (the trust) and is authorized to issue an unlimited number of shares. The trust is registered under the Investment Company Act of 1940, as amended (the 1940 Act), as an open-end management investment company organized as a Massachusetts business trust. Shares of the Fund may only be purchased by insurance companies for the purpose of funding variable annuity or variable life insurance contracts. The Fund offers the following classes of shares: Initial Class shares, Service Class 2 shares, and Investor Class shares. All classes have equal rights and voting privileges, except for matters affecting a single class. Investment income, realized and unrealized capital gains and losses, the common expenses of the Fund, and certain fund-level expense reductions, if any, are allocated on a pro rata basis to each class based on the relative net assets of each class to the total net assets of the Fund. Each class differs with respect to transfer agent and distribution and service plan fees incurred. Certain expense reductions also differ by class.
The Fund may invest in Fidelity Central Funds which are open-end investment companies available to investment companies and other accounts managed by Fidelity Management & Research Company, (FMR) and its affiliates. The financial statements have been prepared in conformity with accounting principles generally accepted in the United States of America, which require management to make certain estimates and assumptions at the date of the financial statements. The following summarizes the significant accounting policies of the Fund, which are also consistently followed by the Fidelity Central Funds:
Security Valuation. Investments are valued and net asset value (NAV) per share is calculated (NAV calculation) as of the close of business of the New York Stock Exchange (NYSE), normally 4:00 p.m. Eastern time. Wherever possible, the Fund uses independent pricing services approved by the Board of Trustees to value its investments.
Equity securities, including restricted securities, for which market quotations are readily available, are valued at the last reported sale price or official closing price as reported by an independent pricing service on the primary market or exchange on which they are traded. In the event there were no sales during the day or closing prices are not available, securities are valued at the last quoted bid price. Investments in open-end mutual funds, including the Fidelity Central Funds, are valued at their closing net asset value each business day. Short-term securities with remaining maturities of sixty days or less for which quotations are not readily available are valued at amortized cost, which approximates value.
When current market prices or quotations are not readily available or do not accurately reflect fair value, valuations may be determined in accordance with procedures adopted by the Board of Trustees. For example, when developments occur between the close of a market and the close of the NYSE that may materially affect the value of some or all of the securities, or when trading in a security is halted, those securities may be fair valued. Factors used in the determination of fair value may include monitoring news to identify significant market or security specific events such as changes in the value of U.S. securities markets, reviewing developments in foreign markets and evaluating the performance of ADRs, futures contracts and exchange-traded funds. Because the Fund's utilization of fair value pricing depends on market activity, the frequency with which fair value pricing is used can not be predicted and may be utilized to a significant extent. The value of securities used for NAV calculation under fair value pricing may differ from published prices for the same securities.
Foreign Currency. The Fund uses foreign currency contracts to facilitate transactions in foreign-denominated securities. Losses from these transactions may arise from changes in the value of the foreign currency or if the counterparties do not perform under the contracts' terms.
Foreign-denominated assets, including investment securities, and liabilities are translated into U.S. dollars at the exchange rate at period end. Purchases and sales of investment securities, income and dividends received and expenses denominated in foreign currencies are translated into U.S. dollars at the exchange rate in effect on the transaction date.
The effects of exchange rate fluctuations on investments are included with the net realized and unrealized gain (loss) on investment securities. Other foreign currency transactions resulting in realized and unrealized gain (loss) are disclosed separately.
Investment Transactions and Income. Security transactions, including the Fund's investment activity in the Fidelity Central Funds, are accounted for as of trade date. Gains and losses on securities sold are determined on the basis of identified cost and may include proceeds received from litigation. Dividend income is recorded on the ex-dividend date, except for certain dividends from foreign securities where the ex-dividend date may have passed, which are recorded as soon as the Fund is informed of the ex-dividend date. Non-cash dividends included in dividend income, if any, are recorded at the fair market value of the securities received. Distributions received on securities that represent a return of capital or capital gain are recorded as a reduction of cost of investments and/or as a realized gain. The Fund estimates the components of distributions received that may be considered return of capital distributions or capital gain distributions. Interest income and income distributions from the Fidelity Central Funds are accrued as earned, with any income distributions receivable as of period end included in Interest Receivable on the Statement of Assets and Liabilities. Interest income includes coupon interest and amortization of premium and accretion of discount on debt securities. Investment income is recorded net of foreign taxes withheld where recovery of such taxes is uncertain.
Annual Report
Notes to Financial Statements - continued
1. Significant Accounting Policies - continued
Expenses. Most expenses of the trust can be directly attributed to a fund. Expenses which cannot be directly attributed are apportioned among each Fund in the trust. Expense estimates are accrued in the period to which they relate and adjustments are made when actual amounts are known.
Income Tax Information and Distributions to Shareholders. Each year, the Fund intends to qualify as a regulated investment company by distributing all of its taxable income and realized gains under Subchapter M of the Internal Revenue Code. As a result, no provision for income taxes is required in the accompanying financial statements. Foreign taxes are provided for based on the Fund's understanding of the tax rules and rates that exist in the foreign markets in which it invests.
Distributions are recorded on the ex-dividend date. Income dividends and capital gain distributions are declared separately for each class. Income and capital gain distributions are determined in accordance with income tax regulations, which may differ from generally accepted accounting principles.
Capital accounts within the financial statements are adjusted for permanent book-tax differences. These adjustments have no impact on net assets or the results of operations. Temporary book-tax differences will reverse in a subsequent period.
Book-tax differences are primarily due to foreign currency transactions, passive foreign investment companies (PFIC), partnerships (including allocations from Fidelity Central Funds) and losses deferred due to wash sales.
The tax-basis components of distributable earnings and the federal tax cost as of period end were as follows:
Unrealized appreciation | $ 77,834,342 | |
Unrealized depreciation | (6,083,488) | |
Net unrealized appreciation (depreciation) | 71,750,854 | |
Undistributed ordinary income | 174,115 | |
Undistributed long-term capital gain | 1,563,059 | |
| | |
Cost for federal income tax purposes | $ 330,608,134 | |
The tax character of distributions paid was as follows:
| December 31, 2006 | December 31, 2005 |
Ordinary Income | $ 27,103,286 | $ 13,373,526 |
Long-term Capital Gains | 30,095,347 | 5,355,577 |
Total | $ 57,198,633 | $ 18,729,103 |
Trading (Redemption) Fees. Initial Class shares, Service Class 2 shares, and Investor Class shares held less than 60 days are subject to a redemption fee equal to 1% of the proceeds of the redeemed shares. All redemption fees, including any estimated redemption fees paid by FMR, are retained by the Fund and accounted for as an addition to paid in capital.
New Accounting Pronouncements. In July 2006, Financial Accounting Standards Board Interpretation No. 48, Accounting for Uncertainty in Income Taxes - an interpretation of FASB Statement 109 (FIN 48), was issued and is effective on the last business day of the semiannual reporting period for fiscal years beginning after December 15, 2006. FIN 48 sets forth a threshold for financial statement recognition, measurement and disclosure of a tax position taken or expected to be taken on a tax return. Management is currently evaluating the impact, if any, the adoption of FIN 48 will have on the Fund's net assets, results of operations and financial statement disclosures.
In addition, in September 2006, Statement of Financial Accounting Standards No. 157, Fair Value Measurements (SFAS 157), was issued and is effective for fiscal years beginning after November 15, 2007. SFAS 157 defines fair value, establishes a framework for measuring fair value and expands disclosures about fair value measurements. Management is currently evaluating the impact the adoption of SFAS 157 will have on the Fund's financial statement disclosures.
2. Operating Policies.
Repurchase Agreements. FMR has received an Exemptive Order from the Securities and Exchange Commission (the SEC) which permits the Fund and other affiliated entities of FMR to transfer uninvested cash balances into joint trading accounts which are then invested in repurchase agreements. The Fund may also invest directly with institutions in repurchase agreements. Repurchase agreements are collateralized by government or non-government securities. Upon settlement date, collateral is held in segregated accounts with custodian banks and may be obtained in the event of a default of the counterparty. The Fund monitors, on a daily basis, the value of the collateral to ensure it is at least equal to the principal amount of the repurchase agreement (including accrued interest). In the event of a default by the counterparty, realization of the collateral proceeds could be delayed, during which time the value of the collateral may decline.
VIP Energy Portfolio
3. Purchases and Sales of Investments.
Purchases and sales of securities, other than short-term securities, aggregated $669,662,540 and $682,768,197, respectively.
4. Fees and Other Transactions with Affiliates.
Management Fee. FMR and its affiliates provide the Fund with investment management related services for which the Fund pays a monthly management fee. The management fee is the sum of an individual fund fee rate that is based on an annual rate of .30% of the Fund's average net assets and a group fee rate that averaged .27% during the period. The group fee rate is based upon the average net assets of all the mutual funds advised by FMR. The group fee rate decreases as assets under management increase and increases as assets under management decrease. For the period, the total annual management fee rate was .57% of the Fund's average net assets.
Distribution and Service Plan. In accordance with Rule 12b-1 of the 1940 Act, the Fund has adopted separate 12b-1 Plans for Service Class 2 shares. Service Class 2 pays Fidelity Distributors Corporation (FDC), an affiliate of FMR, a service fee. For the period, the service fee is based on an annual rate of .25% of Service Class 2's average net assets.
For the period, Service Class 2 paid FDC $124,029, all of which was re-allowed to insurance companies for the distribution of shares and providing shareholder support services.
Transfer Agent Fees. Fidelity Investments Institutional Operations Company, Inc. (FIIOC), an affiliate of FMR, is the fund's transfer, dividend disbursing, and shareholder servicing agent. FIIOC receives an asset-based fee with respect to each class. Each class with the exception of Investor Class pays a transfer agent fee, excluding out of pocket expenses, equal to an annual rate of .07% of their month end net assets. Investor Class pays a monthly asset-based transfer agent fee of .18% of its month end net assets. The total transfer agent fees paid by each class to FIIOC, including out of pocket expenses, were as follows:
Initial Class | $ 241,910 | |
Service Class 2 | 34,377 | |
Investor Class | 76,297 | |
| $ 352,584 | |
Accounting and Security Lending Fees. Fidelity Service Company, Inc. (FSC), an affiliate of FMR, maintains the Fund's accounting records. The accounting fee is based on the level of average net assets for the month. Under a separate contract, FSC administers the security lending program. The security lending fee is based on the number and duration of lending transactions.
Investments in Fidelity Central Funds. The Fund may invest in Fidelity Central Funds. The Fund's Schedule of Investments lists each of the Fidelity Central Funds as an investment of the Fund but does not include the underlying holdings of each Fidelity Central Fund. As an Investing Fund, the Fund indirectly bears its proportionate share of the expenses of the underlying Fidelity Central Funds. A complete unaudited list of holdings for each Fidelity Central Fund is available upon request. In addition, the financial statements of the Fidelity Central Funds, which are not covered by the Fund's Report of Independent Registered Public Accounting Firm, are available on the EDGAR Database on the SEC's web site, www.sec.gov, or upon request.
The Money Market Central Funds seek preservation of capital and current income and are managed by Fidelity Investments Money Management, Inc. (FIMM), an affiliate of FMR.
Brokerage Commissions. The Fund placed a portion of its portfolio transactions with brokerage firms which are affiliates of the investment adviser. The commissions paid to these affiliated firms were $2,037 for the period.
Interfund Lending Program. Pursuant to an Exemptive Order issued by the SEC, the Fund, along with other registered investment companies having management contracts with FMR, may participate in an interfund lending program. This program provides an alternative credit facility allowing the funds to borrow from, or lend money to, other participating affiliated funds. At period end, there were no interfund loans outstanding. The Fund's activity in this program during the period for which loans were outstanding was as follows:
Borrower or Lender | Average Daily
Loan Balance | Weighted Average Interest Rate | Interest Expense |
Borrower | $ 6,266,407 | 5.12% | $ 24,060 |
Annual Report
Notes to Financial Statements - continued
5. Committed Line of Credit.
The Fund participates with other funds managed by FMR in a $4.2 billion credit facility (the "line of credit") to be utilized for temporary or emergency purposes to fund shareholder redemptions or for other short-term liquidity purposes. The Fund has agreed to pay commitment fees on its pro rata portion of the line of credit, which amounted to $1,194 and is reflected in Miscellaneous Expense on the Statement of Operations. During the period, there were no borrowings on this line of credit.
6. Security Lending.
The Fund lends portfolio securities from time to time in order to earn additional income. On the settlement date of the loan, the Fund receives collateral (in the form of U.S. Treasury obligations, letters of credit and/or cash) against the loaned securities and maintains collateral in an amount not less than 100% of the market value of the loaned securities during the period of the loan. The market value of the loaned securities is determined at the close of business of the Fund and any additional required collateral is delivered to the Fund on the next business day. If the borrower defaults on its obligation to return the securities loaned because of insolvency or other reasons, a fund could experience delays and costs in recovering the securities loaned or in gaining access to the collateral. Any cash collateral received is invested in the Fidelity Securities Lending Cash Central Fund. At period end, there were no security loans outstanding. Security lending income represents the income earned on investing cash collateral, less fees and expenses associated with the loan, plus any premium payments that may be received on the loan of certain types of securities. Security lending income is presented in the Statement of Operations as a component of income from Fidelity Central Funds. Net income from lending portfolio securities during the period amounted to $84,109.
7. Bank Borrowings.
The Fund is permitted to have bank borrowings for temporary or emergency purposes to fund shareholder redemptions. The Fund has established borrowing arrangements with certain banks. The interest rate on the borrowings is the bank's base rate, as revised from time to time. The average daily loan balance during the period for which loans were outstanding amounted to $3,170,714. The weighted average interest rate was 5.52%. At period end, there were no bank borrowings outstanding.
8. Expense Reductions.
Many of the brokers with whom FMR places trades on behalf of the Fund provided services to the Fund in addition to trade execution. These services included payments of certain expenses on behalf of the Fund totaling $68,646 for the period.
9. Other.
The Fund's organizational documents provide former and current trustees and officers with a limited indemnification against liabilities arising in connection with the performance of their duties to the Fund. In the normal course of business, the Fund may also enter into contracts that provide general indemnifications. The Fund's maximum exposure under these arrangements is unknown as this would be dependent on future claims that may be made against the Fund. The risk of material loss from such claims is considered remote.
At the end of the period, FMR or its affiliates were the owners of record of 83% of the total outstanding shares of the Fund and one otherwise unaffiliated shareholder was the owner of record of 17% of the total outstanding shares of the Fund.
The United States Securities and Exchange Commission ("SEC") is conducting an investigation of FMR (covering the years 2002 to 2004) arising from gifts, gratuities and business entertainment provided by certain brokers to certain individuals who were employed on FMR's domestic equity trading desk during that period. FMR is in discussions with the SEC staff regarding the possible resolution of the matter, but as of period-end no final resolution has been reached.
In December 2006, the Independent Trustees completed their own investigation of the matter with the assistance of independent counsel. The Independent Trustees and FMR agree that, despite the absence of proof that the Fidelity mutual funds experienced diminished execution quality as a result of the improper receipt of gifts and business entertainment, the conduct at issue was serious and is worthy of redress. Accordingly, the Independent Trustees have requested and FMR has agreed to pay $42 million to Fidelity mutual funds, plus interest to be determined at the time that payment is made. A method of allocating this payment among the funds has not yet been determined. The total payment to the Fund is not anticipated to have a material impact on the Fund's net assets. In addition, FMR reimbursed related legal expenses which are recorded in the accompanying Statement of Operations as an expense reduction.
VIP Energy Portfolio
10. Distributions to Shareholders.
Distributions to shareholders of each class were as follows:
| Years ended December 31, |
| 2006 | 2005 A, B |
From net investment income | | |
Initial Class | $ 2,085,944 | $ 1,343,474 |
Service Class 2 | 417,004 | 71,612 |
Investor Class | 341,464 | 63,818 |
Total | $ 2,844,412 | $ 1,478,904 |
From net realized gain | | |
Initial Class | $ 38,831,658 | $ 15,601,628 |
Service Class 2 | 8,989,384 | 941,185 |
Investor Class | 6,533,179 | 707,386 |
Total | $ 54,354,221 | $ 17,250,199 |
A Distributions for Service Class 2 are for the period April 6, 2005 (commencement of sale of shares) to December 31, 2005.
B Distributions for Investor Class are for the period July 21, 2005 (commencement of sale of shares) to December 31, 2005.
11. Share Transactions.
Transactions for each class of shares were as follows:
| Shares | Dollars |
| Years ended December 31, | Years ended December 31, |
| 2006 | 2005 A, B | 2006 | 2005 A, B |
Initial Class | | | | |
Shares sold | 3,276,992 | 11,239,675 | $ 71,557,806 | $ 187,039,778 |
Reinvestment of distributions | 2,133,823 | 885,881 | 40,917,603 | 16,945,102 |
Shares redeemed | (8,345,943) | (3,689,662) | (169,302,328) | (60,940,355) |
Net increase (decrease) | (2,935,128) | 8,435,894 | $ (56,826,919) | $ 143,044,525 |
Service Class 2 | | | | |
Shares sold | 3,062,096 | 1,150,550 | $ 65,681,537 | $ 20,814,905 |
Reinvestment of distributions | 493,393 | 52,860 | 9,406,387 | 1,012,797 |
Shares redeemed | (921,256) | (133,802) | (18,804,698) | (2,529,981) |
Net increase (decrease) | 2,634,233 | 1,069,608 | $ 56,283,226 | $ 19,297,721 |
Investor Class | | | | |
Shares sold | 1,990,866 | 842,330 | $ 42,583,288 | $ 15,997,464 |
Reinvestment of distributions | 360,165 | 40,230 | 6,874,643 | 771,205 |
Shares redeemed | (512,058) | (15,046) | (10,362,346) | (286,336) |
Net increase (decrease) | 1,838,973 | 867,514 | $ 39,095,585 | $ 16,482,333 |
A Share transactions for Service Class 2 are for the period April 6, 2005 (commencement of sale of shares) to December 31, 2005.
B Share transactions for Investor Class are for the period July 21, 2005 (commencement of sale of shares) to December 31, 2005.
Annual Report
Report of Independent Registered Public Accounting Firm
To the Trustees of Variable Insurance Products Fund IV and the Shareholders of VIP Energy Portfolio (formerly VIP Natural Resources Portfolio):
In our opinion, the accompanying statement of assets and liabilities, including the schedule of investments, and the related statements of operations and of changes in net assets and the financial highlights present fairly, in all material respects, the financial position of VIP Energy Portfolio (formerly VIP Natural Resources Portfolio) (a fund of Variable Insurance Products Fund IV) at December 31, 2006, the results of its operations for the year then ended, the changes in its net assets for each of the two years in the period then ended and the financial highlights for each of the periods indicated, in conformity with accounting principles generally accepted in the United States of America. These financial statements and financial highlights (hereafter referred to as "financial statements") are the responsibility of the VIP Energy Portfolio's management; our responsibility is to express an opinion on these financial statements based on our audits. We conducted our audits of these financial statements in accordance with the standards of the Public Company Accounting Oversight Board (United States). Those standards require that we plan and perform the audit to obtain reasonable assurance about whether the financial statements are free of material misstatement. An audit includes examining, on a test basis, evidence supporting the amounts and disclosures in the financial statements, assessing the accounting principles used and significant estimates made by management, and evaluating the overall financial statement presentation. We believe that our audits, which included confirmation of securities at December 31, 2006 by correspondence with the custodian and brokers, provide a reasonable basis for our opinion.
/s/ PricewaterhouseCoopers LLP
PricewaterhouseCoopers LLP
Boston, Massachusetts
February 13, 2007
VIP Energy Portfolio
Trustees and Officers
The Trustees, Member of the Advisory Board, and executive officers of the trust and fund, as applicable, are listed below. The Board of Trustees governs the fund and is responsible for protecting the interests of shareholders. The Trustees are experienced executives who meet periodically throughout the year to oversee the fund's activities, review contractual arrangements with companies that provide services to the fund, and review the fund's performance. Each of the Trustees oversees 348 funds advised by FMR or an affiliate.
The Trustees hold office without limit in time except that (a) any Trustee may resign; (b) any Trustee may be removed by written instrument, signed by at least two-thirds of the number of Trustees prior to such removal; (c) any Trustee who requests to be retired or who has become incapacitated by illness or injury may be retired by written instrument signed by a majority of the other Trustees; and (d) any Trustee may be removed at any special meeting of shareholders by a two-thirds vote of the outstanding voting securities of the trust. Each Trustee who is not an interested person (as defined in the 1940 Act) (Independent Trustee), shall retire not later than the last day of the calendar year in which his or her 72nd birthday occurs. The Independent Trustees may waive this mandatory retirement age policy with respect to individual Trustees. The executive officers and Advisory Board Member hold office without limit in time, except that any officer and Advisory Board Member may resign or may be removed by a vote of a majority of the Trustees at any regular meeting or any special meeting of the Trustees. Except as indicated, each individual has held the office shown or other offices in the same company for the past five years.
The fund's Statement of Additional Information (SAI) includes more information about the Trustees. To request a free copy, call Fidelity at 1-877-208-0098.
Interested Trustees*:
Correspondence intended for each Trustee who is an interested person may be sent to Fidelity Investments, 82 Devonshire Street, Boston, Massachusetts 02109.
Name, Age; Principal Occupation |
Edward C. Johnson 3d (76) |
| Year of Election or Appointment: 1983 Mr. Johnson is Chairman of the Board of Trustees. Mr. Johnson serves as President (2006-present), Chief Executive Officer, Chairman, and a Director of FMR Corp.; Chairman and a Director of FMR; Chairman and a Director of Fidelity Research & Analysis Company (FRAC); Chairman and a Director of Fidelity Investments Money Management, Inc.; and Chairman (2001-present) and a Director of FMR Co., Inc. In addition, Mr. Johnson serves as Chairman and Director of Fidelity International Limited (FIL). |
Robert L. Reynolds (54) |
| Year of Election or Appointment: 2003 Mr. Reynolds is President and a Director of FMR (2005-present), Fidelity Investments Money Management, Inc. (2005-present), and FMR Co., Inc. (2005-present). Mr. Reynolds also serves as Vice Chairman (2006-present), a Director (2003-present), and Chief Operating Officer of FMR Corp. and a Director of Strategic Advisers, Inc. (2005-present). He also serves on the Board at Fidelity Investments Canada, Ltd. |
* Trustees have been determined to be "Interested Trustees" by virtue of, among other things, their affiliation with the trust or various entities under common control with FMR.
Independent Trustees:
Correspondence intended for each Independent Trustee (that is, the Trustees other than the Interested Trustees) may be sent to Fidelity Investments, P.O. Box 55235, Boston, Massachusetts 02205-5235.
Name, Age; Principal Occupation |
Dennis J. Dirks (58) |
| Year of Election or Appointment: 2005 Prior to his retirement in May 2003, Mr. Dirks was Chief Operating Officer and a member of the Board of The Depository Trust & Clearing Corporation (DTCC) (1999-2003). He also served as President, Chief Operating Officer, and Board member of The Depository Trust Company (DTC) (1999-2003) and President and Board member of the National Securities Clearing Corporation (NSCC) (1999-2003). In addition, Mr. Dirks served as Chief Executive Officer and Board member of the Government Securities Clearing Corporation (2001-2003) and Chief Executive Officer and Board member of the Mortgage-Backed Securities Clearing Corporation (2001-2003). Mr. Dirks also serves as a Trustee and a member of the Finance Committee of Manhattan College (2005-present) and a Trustee and a member of the Finance Committee of AHRC of Nassau County (2006-present). |
Albert R. Gamper, Jr. (64) |
| Year of Election or Appointment: 2006 Prior to his retirement in December 2004, Mr. Gamper served as Chairman of the Board of CIT Group Inc. (commercial finance). During his tenure with CIT Group Inc. Mr. Gamper served in numerous senior management positions, including Chairman (1987-1989; 1999-2001; 2002-2004), Chief Executive Officer (1987-2004), and President (1989-2002). He currently serves as a member of the Board of Directors of Public Service Enterprise Group (utilities, 2001-present), Chairman of the Board of Governors, Rutgers University (2004-present), and Chairman of the Board of Saint Barnabas Health Care System. |
George H. Heilmeier (70) |
| Year of Election or Appointment: 2004 Dr. Heilmeier is Chairman Emeritus of Telcordia Technologies (communication software and systems), where prior to his retirement, he served as company Chairman and Chief Executive Officer. He currently serves on the Boards of Directors of The Mitre Corporation (systems engineering and information technology support for the government), and HRL Laboratories (private research and development, 2004-present). He is Chairman of the General Motors Science & Technology Advisory Board and a Life Fellow of the Institute of Electrical and Electronics Engineers (IEEE). Dr. Heilmeier is a member of the Defense Science Board and the National Security Agency Advisory Board. He is also a member of the National Academy of Engineering, the American Academy of Arts and Sciences, and the Board of Overseers of the School of Engineering and Applied Science of the University of Pennsylvania. Previously, Dr. Heilmeier served as a Director of TRW Inc. (automotive, space, defense, and information technology, 1992-2002), Compaq (1994-2002), Automatic Data Processing, Inc. (ADP) (technology-based business outsourcing, 1995-2002), INET Technologies Inc. (telecommunications network surveillance, 2001-2004), and Teletech Holdings (customer management services). He is the recipient of the 2005 Kyoto Prize in Advanced Technology for his invention of the liquid crystal display, and a member of the Consumer Electronics Hall of Fame. |
James H. Keyes (66) |
| Year of Election or Appointment: 2007 Prior to his retirement in 2003, Mr. Keyes was Chairman, President, and Chief Executive Officer of Johnson Controls, Inc. (automotive supplier, 1993-2003). He currently serves as a member of the boards of LSI Logic Corporation (semiconductor technologies), Navistar International Corporation (manufacture and sale of trucks, buses, and diesel engines, 2002-present), and Pitney Bowes, Inc. (integrated mail, messaging, and document management solutions). |
Marie L. Knowles (60) |
| Year of Election or Appointment: 2001 Prior to Ms. Knowles' retirement in June 2000, she served as Executive Vice President and Chief Financial Officer of Atlantic Richfield Company (ARCO) (diversified energy, 1996-2000). From 1993 to 1996, she was a Senior Vice President of ARCO and President of ARCO Transportation Company. She served as a Director of ARCO from 1996 to 1998. She currently serves as a Director of Phelps Dodge Corporation (copper mining and manufacturing) and McKesson Corporation (healthcare service, 2002-present). Ms. Knowles is a Trustee of the Brookings Institution and the Catalina Island Conservancy and also serves as a member of the Advisory Board for the School of Engineering of the University of Southern California. |
Ned C. Lautenbach (62) |
| Year of Election or Appointment: 2000 Mr. Lautenbach is Chairman of the Independent Trustees (2006-present). Mr. Lautenbach has been a partner of Clayton, Dubilier & Rice, Inc. (private equity investment firm) since September 1998. Previously, Mr. Lautenbach was with the International Business Machines Corporation (IBM) from 1968 until his retirement in 1998. Mr. Lautenbach serves as a Director of Sony Corporation (2006-present) and Eaton Corporation (diversified industrial) as well as the Philharmonic Center for the Arts in Naples, Florida. He also is a member of the Board of Trustees of Fairfield University (2005-present), as well as a member of the Council on Foreign Relations. |
Cornelia M. Small (62) |
| Year of Election or Appointment: 2005 Ms. Small is a member (2000-present) and Chairperson (2002-present) of the Investment Committee, and a member (2002-
present) of the Board of Trustees of Smith College. Previously, she served as Chief Investment Officer (1999-2000), Director of Global Equity Investments (1996-1999), and a member of the Board of Directors of Scudder, Stevens & Clark (1990-1997) and Scudder Kemper Investments (1997-1999). In addition, Ms. Small served as Co-Chair (2000-2003) of the Annual Fund for the Fletcher School of Law and Diplomacy. |
William S. Stavropoulos (67) |
| Year of Election or Appointment: 2001 Mr. Stavropoulos is Chairman Emeritus of the Board of Directors of The Dow Chemical Company. Since joining The Dow Chemical Company in 1967, Mr. Stavropoulos served in numerous senior management positions, including President (1993-2000; 2002-2003), CEO (1995-2000; 2002-2004), and Chairman of the Executive Committee (2000-2004). Currently, he is a Director of NCR Corporation (data warehousing and technology solutions), BellSouth Corporation (telecommunications), Chemical Financial Corporation, Maersk Inc. (industrial conglomerate, 2002-present), and Metalmark Capital (private equity investment firm, 2005-
present). He also serves as a member of the Board of Trustees of the American Enterprise Institute for Public Policy Research. In addition, Mr. Stavropoulos is a member of The Business Council, J.P. Morgan International Council and the University of Notre Dame Advisory Council for the College of Science. |
Kenneth L. Wolfe (67) |
| Year of Election or Appointment: 2005 Prior to his retirement in 2001, Mr. Wolfe was Chairman and Chief Executive Officer of Hershey Foods Corporation (1993-2001). He currently serves as a member of the boards of Adelphia Communications Corporation (2003-present), Bausch & Lomb, Inc., and Revlon Inc. (2004-present). |
Advisory Board Member and Executive Officers:
Correspondence intended for each executive officer and Mr. Lynch may be sent to Fidelity Investments, 82 Devonshire Street, Boston, Massachusetts 02109.
Name, Age; Principal Occupation |
Peter S. Lynch (62) |
| Year of Election or Appointment: 2003 Member of the Advisory Board of Variable Insurance Products Fund IV. Mr. Lynch is Vice Chairman and a Director of FMR, and Vice Chairman (2001-present) and a Director of FMR Co., Inc. Previously, Mr. Lynch served as a Trustee of the Fidelity funds (1990-2003). In addition, he serves as a Trustee of Boston College and as the Chairman of the Inner-City Scholarship Fund. |
Kimberley H. Monasterio (43) |
| Year of Election or Appointment: 2007 President and Treasurer of VIP Energy. Ms. Monasterio also serves as President and Treasurer of other Fidelity funds (2007-present) and is an employee of FMR (2004-present). Previously, Ms. Monasterio served as Deputy Treasurer of the Fidelity funds (2004-2006). Before joining Fidelity Investments, Ms. Monasterio served as Treasurer (2000-2004) and Chief Financial Officer (2002-2004) of the Franklin Templeton Funds and Senior Vice President of Franklin Templeton Services, LLC (2000-2004). |
Dwight D. Churchill (53) |
| Year of Election or Appointment: 2005 Vice President of VIP Energy. Mr. Churchill also serves as Vice President of certain Equity Funds (2005-present). Mr. Churchill is Executive Vice President of FMR (2005-present) and FMR Co., Inc. (2005-present). Previously, Mr. Churchill served as Senior Vice President of Fidelity Investments Money Management, Inc. (2005-2006), Head of Fidelity's Fixed-Income Division (2000-2005), Vice President of Fidelity's Money Market Funds (2000-2005), Vice President of Fidelity's Bond Funds, and Senior Vice President of FMR. |
Boyce I. Greer (50) |
| Year of Election or Appointment: 2005 Vice President of VIP Energy. Mr. Greer also serves as Vice President of certain Equity Funds (2005-present), certain Asset Allocation Funds (2005-present), Fixed-Income Funds (2006-present), and Money Market Funds (2006-present). Mr. Greer is also a Trustee of other investment companies advised by FMR (2003-present). He is an Executive Vice President of FMR (2005-present) and FMR Co., Inc. (2005-present), and Senior Vice President of Fidelity Investments Money Management, Inc. (2006-present). Previously, Mr. Greer served as a Director and Managing Director of Strategic Advisers, Inc. (2002-2005), and Executive Vice President (2000-2002) and Money Market Group Leader (1997-2002) of the Fidelity Investments Fixed Income Division. He also served as Vice President of Fidelity's Money Market Funds (1997-2002), Senior Vice President of FMR (1997-2002), and Vice President of FIMM (1998-2002). |
Eric D. Roiter (58) |
| Year of Election or Appointment: 2001 Secretary of VIP Energy. He also serves as Secretary of other Fidelity funds; Vice President, General Counsel, and Secretary of FMR Co., Inc. (2001-present) and FMR; Assistant Secretary of Fidelity Management & Research (U.K.) Inc. (2001-present), Fidelity Research & Analysis Company (2001-present), and Fidelity Investments Money Management, Inc. (2001-present). Mr. Roiter is an Adjunct Member, Faculty of Law, at Boston College Law School (2003-present). Previously, Mr. Roiter served as Vice President and Secretary of Fidelity Distributors Corporation (FDC) (1998-2005). |
Stuart Fross (47) |
| Year of Election or Appointment: 2003 Assistant Secretary of VIP Energy. Mr. Fross also serves as Assistant Secretary of other Fidelity funds (2003-present), Vice President and Secretary of FDC (2005-present), and is an employee of FMR. |
R. Stephen Ganis (40) |
| Year of Election or Appointment: 2006 Anti-Money Laundering (AML) officer of VIP Energy. Mr. Ganis also serves as AML officer of other Fidelity funds (2006-present) and FMR Corp. (2003-present). Before joining Fidelity Investments, Mr. Ganis practiced law at Goodwin Procter, LLP (2000-2002). |
Joseph B. Hollis (58) |
| Year of Election or Appointment: 2006 Chief Financial Officer of VIP Energy. Mr. Hollis also serves as Chief Financial Officer of other Fidelity funds. Mr. Hollis is President of Fidelity Pricing and Cash Management Services (FPCMS) (2005-present). Mr. Hollis also serves as President and Director of Fidelity Service Company, Inc. (2006-present). Previously, Mr. Hollis served as Senior Vice President of Cash Management Services (1999-2002) and Investment Management Operations (2002-2005). |
Kenneth A. Rathgeber (59) |
| Year of Election or Appointment: 2004 Chief Compliance Officer of VIP Energy. Mr. Rathgeber also serves as Chief Compliance Officer of other Fidelity funds (2004-present) and Executive Vice President of Risk Oversight for Fidelity Investments (2002-present). He is Chief Compliance Officer of FMR (2005-present), FMR Co., Inc. (2005-present), Fidelity Management & Research (U.K.) Inc. (2005-present), Fidelity Research & Analysis Company (2005-present), Fidelity Investments Money Management, Inc. (2005-present), and Strategic Advisers, Inc. (2005-present). Previously, Mr. Rathgeber served as Executive Vice President and Chief Operating Officer for Fidelity Investments Institutional Services Company, Inc. (1998-2002). |
Bryan A. Mehrmann (45) |
| Year of Election or Appointment: 2005 Deputy Treasurer of VIP Energy. Mr. Mehrmann also serves as Deputy Treasurer of other Fidelity funds (2005-present) and is an employee of FMR. Previously, Mr. Mehrmann served as Vice President of Fidelity Investments Institutional Services Group (FIIS)/Fidelity Investments Institutional Operations Corporation, Inc. (FIIOC) Client Services (1998-2004). |
Kenneth B. Robins (37) |
| Year of Election or Appointment: 2005 Deputy Treasurer of VIP Energy. Mr. Robins also serves as Deputy Treasurer of other Fidelity funds (2005-present) and is an employee of FMR (2004-present). Before joining Fidelity Investments, Mr. Robins worked at KPMG LLP, where he was a partner in KPMG's department of professional practice (2002-2004) and a Senior Manager (1999-2000). In addition, Mr. Robins served as Assistant Chief Accountant, United States Securities and Exchange Commission (2000-2002). |
Robert G. Byrnes (40) |
| Year of Election or Appointment: 2005 Assistant Treasurer of VIP Energy. Mr. Byrnes also serves as Assistant Treasurer of other Fidelity funds (2005-present) and is an employee of FMR (2005-present). Previously, Mr. Byrnes served as Vice President of FPCMS (2003-2005). Before joining Fidelity Investments, Mr. Byrnes worked at Deutsche Asset Management where he served as Vice President of the Investment Operations Group (2000-2003). |
John H. Costello (60) |
| Year of Election or Appointment: 1991 Assistant Treasurer of VIP Energy. Mr. Costello also serves as Assistant Treasurer of other Fidelity funds and is an employee of FMR. |
Peter L. Lydecker (52) |
| Year of Election or Appointment: 2004 Assistant Treasurer of VIP Energy. Mr. Lydecker also serves as Assistant Treasurer of other Fidelity funds (2004) and is an employee of FMR. |
Mark Osterheld (51) |
| Year of Election or Appointment: 2002 Assistant Treasurer of VIP Energy. Mr. Osterheld also serves as Assistant Treasurer of other Fidelity funds (2002) and is an employee of FMR. |
Gary W. Ryan (48) |
| Year of Election or Appointment: 2005 Assistant Treasurer of VIP Energy. Mr. Ryan also serves as Assistant Treasurer of other Fidelity funds (2005-present) and is an employee of FMR (2005-present). Previously, Mr. Ryan served as Vice President of Fund Reporting in FPCMS (1999-2005). |
Salvatore Schiavone (41) |
| Year of Election or Appointment: 2005 Assistant Treasurer of VIP Energy. Mr. Schiavone also serves as Assistant Treasurer of other Fidelity funds (2005-present) and is an employee of FMR (2005-present). Before joining Fidelity Investments, Mr. Schiavone worked at Deutsche Asset Management, where he most recently served as Assistant Treasurer (2003-2005) of the Scudder Funds and Vice President and Head of Fund Reporting (1996-2003). |
Annual Report
Distributions
The Board of Trustees of VIP Energy Portfolio voted to pay to shareholders of record at the opening of business on record date, the following distributions per share derived from capital gains realized from sales of portfolio securities:
| Pay Date | Record Date | Capital Gains |
Initial Class | 02/09/07 | 02/09/07 | $.09 |
Investor Class | 02/09/07 | 02/09/07 | $.09 |
The fund hereby designates as a capital gain dividend with respect to the taxable year ended December 31, 2006, $30,572,308, or, if subsequently determined to be different, the net capital gain of such year.
Initial Class designates 12% and Investor Class designates 12% of the dividends distributed in December 2006 as qualifying for the dividends-received deduction for corporate shareholders.
The fund will notify shareholders in January 2007 of amounts for use in preparing 2006 income tax returns.
VIP Energy Portfolio
Proxy Voting Results
A special meeting of the fund's shareholders was held on September 20, 2006. The results of votes taken among shareholders on the proposals before them are reported below. Each vote reported represents one dollar of net asset value held on the record date for the meeting.
PROPOSAL 1 |
To elect a Board of Trustees. A |
| # of
Votes | % of
Votes |
Dennis J. Dirks |
Affirmative | 92,459,317.52 | 96.102 |
Withheld | 3,749,837.05 | 3.898 |
TOTAL | 96,209,154.57 | 100.00 |
Albert R. Gamper, Jr. |
Affirmative | 92,260,598.99 | 95.896 |
Withheld | 3,948,555.58 | 4.104 |
TOTAL | 96,209,154.57 | 100.000 |
Robert M. Gates |
Affirmative | 92,315,480.72 | 95.953 |
Withheld | 3,893,673.85 | 4.047 |
TOTAL | 96,209,154.57 | 100.000 |
George H. Heilmeier |
Affirmative | 92,208,255.41 | 95.841 |
Withheld | 4,000,899.16 | 4.159 |
TOTAL | 96,209,154.57 | 100.000 |
Edward C. Johnson 3d |
Affirmative | 91,928,267.76 | 95.550 |
Withheld | 4,280,886.81 | 4.450 |
TOTAL | 96,209,154.57 | 100.000 |
Stephen P. Jonas |
Affirmative | 92,457,628.76 | 96.101 |
Withheld | 3,751,525.81 | 3.899 |
TOTAL | 96,209,154.57 | 100.000 |
James H. KeyesB |
Affirmative | 92,432,729.82 | 96.075 |
Withheld | 3,776,424.75 | 3.925 |
TOTAL | 96,209,154.57 | 100.000 |
Marie L. Knowles |
Affirmative | 92,398,847.52 | 96.040 |
Withheld | 3,810,307.05 | 3.960 |
TOTAL | 96,209,154.57 | 100.000 |
Ned C. Lautenbach |
Affirmative | 92,423,184.47 | 96.065 |
Withheld | 3,785,970.10 | 3.935 |
TOTAL | 96,209,154.57 | 100.000 |
William O. McCoy |
Affirmative | 92,086,293.90 | 95.715 |
Withheld | 4,122,860.67 | 4.285 |
TOTAL | 96,209,154.57 | 100.000 |
| # of
Votes | % of
Votes |
Robert L. Reynolds |
Affirmative | 92,439,032.86 | 96.081 |
Withheld | 3,770,121.71 | 3.919 |
TOTAL | 96,209,154.57 | 100.000 |
Cornelia M. Small |
Affirmative | 92,415,567.29 | 96.057 |
Withheld | 3,793,587.28 | 3.943 |
TOTAL | 96,209,154.57 | 100.000 |
William S. Stavropoulos |
Affirmative | 92,135,400.08 | 95.766 |
Withheld | 4,073,754.49 | 4.234 |
TOTAL | 96,209,154.57 | 100.000 |
Kenneth L. Wolfe |
Affirmative | 92,445,865.31 | 96.088 |
Withheld | 3,763,289.26 | 3.912 |
TOTAL | 96,209,154.57 | 100.000 |
PROPOSAL 5A |
To modify the fundamental "invests primarily" policy (the investment policy concerning the fund's primary investments). |
| # of
Votes | % of
Votes |
Affirmative | 19,873,521.07 | 88.078 |
Against | 1,449,180.97 | 6.423 |
Abstain | 1,240,843.12 | 5.499 |
TOTAL | 22,563,545.16 | 100.000 |
PROPOSAL 5B |
To modify the fund's fundamental concentration policy. |
| # of
Votes | % of
Votes |
Affirmative | 19,722,892.30 | 87.410 |
Against | 1,536,621.08 | 6.811 |
Abstain | 1,304,031.78 | 5.779 |
TOTAL | 22,563,545.16 | 100.000 |
A Denotes trust-wide proposal and voting results. B Effective on or about January 1, 2007. |
Annual Report
Board Approval of Investment Advisory Contracts and Management Fees
VIP Energy Portfolio (formerly Natural Resources Portfolio)
Each year, typically in July, the Board of Trustees, including the Independent Trustees (together, the Board), votes on the renewal of the management contract and sub-advisory agreements (together, the Advisory Contracts) for the fund. The Board, assisted by the advice of fund counsel and Independent Trustees' counsel, requests and considers a broad range of information throughout the year.
The Board meets regularly each month except August and takes into account throughout the year matters bearing on Advisory Contracts. The Board, acting directly and through its separate committees, considers at each of its meetings factors that are relevant to the annual renewal of the fund's Advisory Contracts, including the services and support provided to the fund and its shareholders. At the time of the renewal, the Board had 12 standing committees, each composed of Independent Trustees with varying backgrounds, to which the Board has assigned specific subject matter responsibilities in order to enhance effective decision-making by the Board. Each committee has adopted a written charter outlining the structure and purposes of the committee. One such committee, the Equity Contract Committee, meets periodically as needed throughout the year to consider matters specifically related to the annual renewal of Advisory Contracts. The committee requests and receives information on, and makes recommendations to the Independent Trustees concerning, the approval and annual review of the Advisory Contracts.
At its July 2006 meeting, the Board of Trustees, including the Independent Trustees, unanimously determined to renew the Advisory Contracts for the fund. In reaching its determination, the Board considered all factors it believed relevant, including (i) the nature, extent, and quality of the services to be provided to the fund and its shareholders (including the investment performance of the fund); (ii) the competitiveness of the management fee and total expenses of the fund; (iii) the total costs of the services to be provided by and the profits to be realized by the investment adviser and its affiliates from the relationship with the fund; (iv) the extent to which economies of scale would be realized as the fund grows; and (v) whether fee levels reflect these economies of scale, if any, for the benefit of fund shareholders.
In determining whether to renew the Advisory Contracts for the fund, the Board ultimately reached a determination, with the assistance of fund counsel and Independent Trustees' counsel, that the renewal of the Advisory Contracts and the compensation to be received by Fidelity under the management contract is consistent with Fidelity's fiduciary duty under applicable law. In addition to evaluating the specific factors noted above, the Board, in reaching its determination, is aware that shareholders in the fund have a broad range of investment choices available to them, including a wide choice among mutual funds offered by competitors to Fidelity, and that the fund's shareholders, with the opportunity to review and weigh the disclosure provided by the fund in its prospectus and other public disclosures, have chosen to invest in this fund, managed by Fidelity.
Nature, Extent, and Quality of Services Provided. The Board considered staffing within the investment adviser, FMR, and the sub-advisers (together, the Investment Advisers), including the background of the fund's portfolio manager and the fund's investment objective and discipline. The Independent Trustees also had discussions with senior management of Fidelity's investment operations and investment groups. The Board considered the structure of the portfolio manager compensation program and whether this structure provides appropriate incentives.
Resources Dedicated to Investment Management and Support Services. The Board reviewed the size, education, and experience of the Investment Advisers' investment staff, their use of technology, and the Investment Advisers' approach to recruiting, training, and retaining portfolio managers and other research, advisory, and management personnel. The Board considered Fidelity's extensive global research capabilities that enable the Investment Advisers to aggregate data from various sources in an effort to produce positive investment results. The Board noted that Fidelity's analysts have access to a variety of technological tools that enable them to perform both fundamental and quantitative analysis and to specialize in various disciplines. The Board also considered that Fidelity's portfolio managers and analysts have access to daily portfolio attribution that allows for monitoring of a fund's portfolio, as well as an electronic communication system that provides immediate real-time access to research concerning issuers and credit enhancers.
Shareholder and Administrative Services. The Board considered (i) the nature, extent, quality, and cost of administrative, distribution, and shareholder services performed by the Investment Advisers and their affiliates under the Advisory Contracts and under separate agreements covering transfer agency, pricing and bookkeeping, and securities lending services for the fund; (ii) the nature and extent of the Investment Advisers' supervision of third party service providers, principally custodians and subcustodians; and (iii) the resources devoted to, and the record of compliance with, the fund's compliance policies and procedures. The Board reviewed the allocation of fund brokerage, including allocations to brokers affiliated with the Investment Advisers, the use of brokerage commissions to pay fund expenses, and the use of "soft" commission dollars to pay for research services. The Board also considered that Fidelity voluntarily pays for market data out of its own resources.
The Board noted that the growth of fund assets across the complex allows Fidelity to reinvest in the development of services designed to enhance the value or convenience of the Fidelity funds as investment vehicles. These services include 24-hour access to account information and market information through phone representatives and over the Internet, and investor education materials and asset allocation tools.
Investment in a Large Fund Family. The Board considered the benefits to shareholders of investing in a Fidelity fund, including the benefits of investing in a fund that is part of a large family of funds offering a variety of investment disciplines and providing for a large variety of mutual fund investor services. The Board noted that, since the last Advisory Contract renewals in July 2005, Fidelity has taken a number of actions that benefited particular funds, including (i) dedicating additional resources to investment research and to restructure the investment research teams; (ii) voluntarily entering into contractual arrangements with certain brokers pursuant to which Fidelity pays for research products and services separately out of its own resources, rather than bundling with fund commissions; (iii) launching the Fidelity Advantage Class of its five Spartan stock index funds and three Spartan bond index funds, which is a lower-fee class available to shareholders with higher account balances; (iv) contractually agreeing to impose expense limitations on Fidelity U.S. Bond Index Fund and reducing the fund's initial investment minimum; and (v) offering shareholders of each of the Fidelity Institutional Money Market Funds the privilege of exchanging shares of the fund for shares of other Fidelity funds.
VIP Energy Portfolio
Investment Performance and Compliance. The Board considered whether the fund has operated within its investment objective, as well as its record of compliance with its investment restrictions. It also reviewed the fund's absolute investment performance for Initial Class, as well as the fund's relative investment performance for Initial Class measured against (i) a Goldman Sachs index that reflects the market sector in which the fund invests, and (ii) a peer group of mutual funds deemed appropriate by the Board over multiple periods. Because the fund had been in existence less than five calendar years, the following charts considered by the Board show, over the one- and three-year periods ended December 31, 2005, the cumulative total returns of Initial Class of the fund, the cumulative total returns of a Goldman Sachs index ("benchmark"), and a range of cumulative total returns of a peer group of mutual funds identified by Lipper Inc. as having an investment objective similar to that of the fund. (Investor Class and Service Class 2 of the fund had less than one year of performance as of December 31, 2005.) The box within each chart shows the 25th percentile return (bottom of box) and the 75th percentile return (top of box) of the Lipper peer group. Returns shown above the box are in the first quartile and returns shown below the box are in the fourth quartile. The percentage beaten number noted below each chart corresponds to the percentile box and represents the percentage of funds in the Lipper peer group whose performance was equal to or lower than that of Initial Class.
VIP Energy Portfolio
The Board reviewed the fund's relative investment performance against its Lipper peer group and stated that the performance of Initial Class of the fund was in the second quartile for all the periods shown. The Board also stated that the relative investment performance of Initial Class of the fund compared favorably to its benchmark for all the periods shown.
The Board considered that FMR has taken steps to refocus and strengthen equity research, equity portfolio management, and compliance. The Board noted with favor FMR's reorganization of its senior management team in 2005 and FMR's dedication of additional resources to investment research, and participated in the process that led to those changes.
Based on its review, and giving particular weight to the nature and quality of the resources dedicated by the Investment Advisers to maintain and improve relative performance, the Board concluded that the nature, extent, and quality of the services provided to the fund will benefit the fund's shareholders, particularly in light of the Board's view that the fund's shareholders benefit from investing in a fund that is part of a large family of funds offering a variety of investment disciplines and services.
Competitiveness of Management Fee and Total Fund Expenses. The Board considered the fund's management fee and total expenses compared to "mapped groups" of competitive funds and classes. Fidelity creates "mapped groups" by combining similar Lipper investment objective categories that have comparable management fee characteristics. Combining Lipper investment objective categories aids the Board's management fee and total expense comparisons by broadening the competitive group used for comparison and by reducing the number of universes to which various Fidelity funds are compared.
Annual Report
Board Approval of Investment Advisory Contracts and Management Fees - continued
The Board considered two proprietary management fee comparisons for the 12-month (or shorter) periods shown in the chart below. The group of Lipper funds used by the Board for management fee comparisons is referred to below as the "Total Mapped Group" and, for the reasons explained above, is broader than the Lipper peer group used by the Board for performance comparisons. The Total Mapped Group comparison focuses on a fund's standing relative to the total universe of comparable funds available to investors, in terms of gross management fees before expense reimbursements or caps. "TMG %" represents the percentage of funds in the Total Mapped Group that had management fees that were lower than the fund's. For example, a TMG % of 8% means that 92% of the funds in the Total Mapped Group had higher management fees than the fund. The "Asset-Size Peer Group" (ASPG) comparison focuses on a fund's standing relative to non-Fidelity funds similar in size to the fund within the Total Mapped Group. The ASPG represents at least 15% of the funds in the Total Mapped Group with comparable asset size and management fee characteristics, subject to a minimum of 50 funds (or all funds in the Total Mapped Group if fewer than 50). Additional information, such as the ASPG quartile in which the fund's management fee ranked, is also included in the chart and considered by the Board.
VIP Energy Portfolio

The Board noted that the fund's management fee ranked below the median of its Total Mapped Group and below the median of its ASPG for 2005.
Based on its review, the Board concluded that the fund's management fee was fair and reasonable in light of the services that the fund receives and the other factors considered.
In its review of each class's total expenses, the Board considered the fund's management fee as well as other fund or class expenses, as applicable, such as transfer agent fees, pricing and bookkeeping fees, fund-paid 12b-1 fees, and custodial, legal, and audit fees. The Board also noted the effects of any waivers and reimbursements on fees and expenses. As part of its review, the Board also considered current and historical total expenses of each class of the fund compared to competitive fund median expenses. Each class of the fund is compared to those funds and classes in the Total Mapped Group (used by the Board for management fee comparisons) that have a similar sales load structure.
The Board noted that the total expenses of each class ranked below its competitive median for 2005.
In its review of total expenses, the Board also considered Fidelity fee structures and other information on clients that FMR and its affiliates service in other competitive markets, such as other mutual funds advised or subadvised by FMR or its affiliates, pension plan clients, and other institutional clients.
Based on its review, the Board concluded that the total expenses of each class of the fund were reasonable in light of the services that the fund and its shareholders receive and the other factors considered.
Costs of the Services and Profitability. The Board considered the revenues earned and the expenses incurred by Fidelity in conducting the business of developing, marketing, distributing, managing, administering and servicing the fund and its shareholders. The Board also considered the level of Fidelity's profits in respect of all the Fidelity funds.
On an annual basis, FMR presents to the Board Fidelity's profitability for the fund. Fidelity calculates the profitability for each fund, as well as aggregate profitability for groups of Fidelity funds and all Fidelity funds, using a series of detailed revenue and cost allocation methodologies which originate with the audited books and records of Fidelity. The Audit Committee of the Board reviews any significant changes from the prior year's methodologies.
VIP Energy Portfolio
PricewaterhouseCoopers LLP (PwC), independent registered accounting firm and auditor to Fidelity and certain Fidelity funds, has been engaged annually by the Board as part of the Board's assessment of the results of Fidelity's profitability analysis. PwC's engagement includes the review and assessment of Fidelity's methodologies used in determining the revenues and expenses attributable to Fidelity's mutual fund business, and completion of agreed-upon procedures surrounding the mathematical accuracy of fund profitability and its conformity to allocation methodologies. After considering PwC's reports issued under the engagement and information provided by Fidelity, the Board believes that while other allocation methods may also be reasonable, Fidelity's profitability methodologies are reasonable in all material respects.
The Board has also reviewed Fidelity's non-fund businesses and any fall-out benefits related to the mutual fund business as well as cases where Fidelity's affiliates may benefit from or be related to the fund's business.
The Board considered the costs of the services provided by and the profits realized by Fidelity in connection with the operation of the fund and determined that the amount of profit is a fair entrepreneurial profit for the management of the fund.
Economies of Scale. The Board considered whether there have been economies of scale in respect of the management of the Fidelity funds, whether the Fidelity funds (including the fund) have appropriately benefited from any such economies of scale, and whether there is potential for realization of any further economies of scale. The Board considered the extent to which the fund will benefit from economies of scale through increased services to the fund, through waivers or reimbursements, or through fee or expense reductions.
The Board recognized that the fund's management contract incorporates a "group fee" structure, which provides for lower fee rates as total fund assets under FMR's management increase, and for higher fee rates as total fund assets under FMR's management decrease. The Board considered that the group fee is designed to deliver the benefits of economies of scale to fund shareholders when total fund assets increase, even if assets of any particular fund are unchanged or have declined, because some portion of Fidelity's costs are attributable to services provided to all Fidelity funds, and all funds benefit if those costs can be allocated among more assets. The Board concluded that, given the group fee structure, fund shareholders will achieve a certain level of economies of scale as assets under FMR's management increase at the fund complex level, regardless of whether Fidelity achieves any such economies of scale.
The Board further concluded that any potential economies of scale are being shared between fund shareholders and Fidelity in an appropriate manner.
Additional Information Requested by the Board. In order to develop fully the factual basis for consideration of the Advisory Contracts, the Board requested additional information on several topics, including (i) Fidelity's fund profitability methodology and profitability trends within certain funds; (ii) portfolio manager compensation; (iii) the extent to which any economies of scale exist and are shared between the funds and Fidelity; (iv) the total expenses of certain funds and classes relative to competitors, including the extent to which the expenses of certain funds have been or could be capped; (v) fund performance trends; and (vi) Fidelity's fee structures, including use of performance fees.
Based on its evaluation of all of the conclusions noted above, and after considering all material factors, the Board ultimately concluded that the advisory fee structures are fair and reasonable, and that the fund's Advisory Contracts should be renewed.
Annual Report
VIP Energy Portfolio
Annual Report
Investment Adviser
Fidelity Management & Research Company
Boston, MA
Investment Sub-Advisers
FMR Co., Inc.
Fidelity Management & Research (U.K.) Inc.
Fidelity Research & Analysis Company
(formerly Fidelity Management &
Research (Far East) Inc.)
Fidelity Investments Japan Limited
Fidelity International Investment Advisors
Fidelity International Investment Advisors
(U.K.) Limited
General Distributor
Fidelity Distributors Corporation
Boston, MA
Transfer and Service Agents
Fidelity Investments Institutional Operations Company, Inc.
Boston, MA
Fidelity Service Company, Inc.
Boston, MA
Custodian
State Street Bank & Trust Co.
Quincy, MA
VNRIC-ANN-0207
1.817379.101
Fidelity® Variable Insurance Products:
Energy Portfolio: Service Class 2
(formerly Natural Resources Portfolio: Service Class 2)
Annual Report
December 31, 2006
(2_fidelity_logos) (Registered_Trademark)
Contents
Note to Shareholders | <Click Here> | An explanation of the changes to the fund. |
Performance | <Click Here> | How the fund has done over time. |
Management's Discussion | <Click Here> | The manager's review of fund performance, strategy and outlook. |
Shareholder Expense Example | <Click Here> | An example of shareholder expenses. |
Investment Changes | <Click Here> | A summary of major shifts in the fund's investments over the past six months. |
Investments | <Click Here> | A complete list of the fund's investments with their
market values. |
Financial Statements | <Click Here> | Statements of assets and liabilities, operations, and
changes in net assets, as well as financial highlights. |
Notes | <Click Here> | Notes to the financial statements. |
Report of Independent Registered Public Accounting Firm | <Click Here> | |
Trustees and Officers | <Click Here> | |
Distributions | <Click Here> | |
Proxy Voting Results | <Click Here> | |
Board Approval of Investment Advisory Contracts and Management Fees | <Click Here> | |
To view a fund's proxy voting guidelines and proxy voting record for the 12-month period ended June 30, visit www.fidelity.com/proxyvotingresults or visit the Securities and Exchange Commission's (SEC) web site at www.sec.gov. You may also call 1-877-208-0098 to request a free copy of the proxy voting guidelines.
Fidelity Variable Insurance Products are separate account options which are purchased through a variable insurance contract.
Standard & Poor's, S&P and S&P 500 are registered service marks of The McGraw-Hill Companies, Inc. and have been licensed for use by Fidelity Distributors Corporation.
Other third party marks appearing herein are the property of their respective owners.
All other marks appearing herein are registered or unregistered trademarks or service marks of FMR Corp. or an affiliated company.
This report and the financial statements contained herein are submitted for the general information of the shareholders of the fund. This report is not authorized for distribution to prospective investors in the fund unless preceded or accompanied by an effective prospectus.
A fund files its complete schedule of portfolio holdings with the SEC for the first and third quarters of each fiscal year on Form N-Q. Forms N-Q are available on the SEC's web site at http://www.sec.gov. A fund's Forms N-Q may be reviewed and copied at the SEC's Public Reference Room in Washington, DC. Information regarding the operation of the SEC's Public Reference Room may be obtained by calling 1-800-SEC-0330. For a complete list of the fund's portfolio holdings, view the most recent quarterly holdings report, semiannual report, or annual report on Fidelity's web site at http://www.advisor.fidelity.com.
NOT FDIC INSURED · MAY LOSE VALUE · NO BANK GUARANTEE
Neither the fund nor Fidelity Distributors Corporation is a bank.
VIP Energy Portfolio
Notes to Shareholders:
Effective October 1, 2006, Fidelity restructured the VIP Sector product line. The restructuring aligned the funds' investment goals more closely with standard industry classifications and facilitated adoption of more-specific benchmark indexes to evaluate fund performance. As restructured, the funds generally align under seven sectors in the widely recognized Global Industry Classification Standard (GICS), developed by Standard & Poor's® (S&P®) and Morgan Stanley Capital InternationalSM (MSCI®): Consumer Discretionary, Energy, Financials, Health Care, Industrials, Information Technology and Utilities. Changes to the funds ranged from simply adopting a new supplemental benchmark to, in some cases, changing investment policies and fund names.
For VIP Consumer Discretionary (formerly VIP Consumer Industries), VIP Energy (formerly VIP Natural Resources), VIP Industrials (formerly VIP Cyclical Industries), and VIP Utilities (formerly VIP Telecommunications & Utilities Growth), shareholders approved certain fundamental investment policy changes related to the restructuring at a special meeting of shareholders held September 20, 2006. All the funds adopted new benchmark indexes from MSCI. Taken together, the name, policy and benchmark changes will make it easier for investors to distinguish funds in the product line and to evaluate Fidelity Management & Research Company's skill in managing the funds.
For VIP Energy, shareholders approved narrowing the fund's policies to focus on energy and to exclude industrial or agricultural materials and unfinished goods. Energy companies are a subset of the broader natural resources sector, which is generally made up of energy and materials companies. The fund is now benchmarked to the MSCI US Investable Market Energy Index.
Annual Report
VIP Energy Portfolio
Performance: The Bottom Line
Average annual total return reflects the change in the value of an investment, assuming reinvestment of the class' dividend income and capital gains (the profits earned upon the sale of securities that have grown in value) and assuming a constant rate of performance each year. During periods of reimbursement by Fidelity, a fund's total return will be greater than it would be had the reimbursement not occurred. Performance numbers are net of all underlying fund operating expenses, but do not include any insurance charges imposed by your insurance company's separate account. If performance information included the effect of these additional charges, the total returns would have been lower. How a fund did yesterday is no guarantee of how it will do tomorrow.
Average Annual Total Returns
Periods ended December 31, 2006 | Past 1
year | Past 5
years | Life of
fundA |
VIP Energy - Service Class 2 B | 16.55% | 19.51% | 17.06% |
A From July 19, 2001.
B The initial offering of Service Class 2 shares took place on April 6, 2005. Performance for Service Class 2 shares reflects an asset-based service fee (12b-1 fee). Returns prior to April 6, 2005 are those of Initial Class and do not include the effects of Service Class 2's 12b-1 fee. Had Service Class 2's 12b-1 fee been reflected, returns prior to April 6, 2005 would have been lower.
$10,000 Life of Fund
Let's say hypothetically that $10,000 was invested in VIP Energy Portfolio - Service Class 2 on July 19, 2001, when the fund started. The chart shows how the value of your investment would have changed, and also shows how the Standard & Poor's 500SM Index (S&P 500®) performed over the same period.

VIP Energy Portfolio
VIP Energy Portfolio
Management's Discussion of Fund Performance
Comments from John Dowd, Portfolio Manager of VIP Energy Portfolio
U.S. stock markets registered their fourth consecutive year of positive returns in 2006. Among the highlights were the performances of the Dow Jones Industrial AverageSM - a gauge of 30 mega-cap, blue-chip stocks - and the small-cap-oriented Russell 2000® Index, both of which reached new highs. The efforts of the Federal Reserve Board to contain inflation levels also dominated the investment headlines. In all, the Fed hiked short-term interest rates four times, but held rates steady after its June 29 increase, finally pausing after 17 rate hikes over a two-year period. A slowing residential housing market and moderating oil prices - the latter of which hit a record closing high of $77 per barrel in July before falling sharply - also held economic growth in check. For the year overall, the Standard & Poor's 500SM Index was up 15.79%, the Dow advanced 19.05%, the Russell 2000 Index gained 18.37% and the NASDAQ Composite® Index rose 10.39%.
For the 12 months that ended December 31, 2006, the fund underperformed the 21.03% gain of the Morgan Stanley Capital InternationalSM (MSCI®) US Investable Market Energy Index and the 18.25% advance of a blended index specific to this fund. This blended index is a combination of the Goldman Sachs® Natural Resources Index, which the fund was compared to through September, and the new MSCI benchmark mentioned above, which the fund was compared to during the period's final three months.1 During the same 12-month period, the fund outpaced the S&P 500®. (For specific portfolio performance results, please refer to the performance section of this report.) During the first nine months of the period, the fund's performance was in line with the Goldman Sachs benchmark. A number of out-of-index stocks performed very well. Metal producers Oregon Steel Mills and Allegheny Technologies, along with mining equipment manufacturer Bucyrus International, benefited from strong demand for industrial metals, as did index-component Titanium Metals. Danish wind turbine manufacturer Vestas Wind Systems also boosted performance. On the other hand, the fund suffered from underweighting or not owning the integrated oil companies - most of which were sizable components of the index - that outperformed during the summer and early fall, including Exxon Mobil, Chevron, Marathon Oil and Suncor Energy. National Oilwell Varco disappointed in response to declining natural gas prices. For the final three months of the period, the fund modestly underperformed the new MSCI index partly because the new index is more heavily concentrated in energy stocks than the Goldman Sachs index. The fund was less concentrated in certain areas that performed very well during this time frame, including integrated oils Exxon Mobil, Chevron, and Marathon Oil, which the fund didn't own. Overweighting oil and gas exploration and production (E&P) companies such as Ultra Petroleum and EOG Resources hurt, as did overweighting refiner Valero Energy. On the flip side, performance was enhanced by overweighting several undervalued stocks, including drillers Noble and GlobalSantaFe, and Cabot Oil & Gas in the E&P area. Lastly, out-of-index Vestas Wind Systems generated strong returns and aided performance. Some of the stocks I've mentioned were no longer held at period end.
1 The fund's blended index is a customized index developed by Fidelity for the limited purpose of discussing the fund's performance for the 12-month period ending December 31, 2006. From January 1, 2006, through September 30, 2006, the fund compared its performance to the Goldman Sachs Natural Resources Index, which returned 6.64% during that period. On October 1, 2006, the fund began comparing its performance to a different index, the MSCI US Investable Market Energy Index, which returned 10.89% from October 1, 2006, through December 31, 2006. For the 12-month period ending December 31, 2006, the blended index (Goldman Sachs and MSCI) returned 18.25%.
The views expressed above reflect those of the portfolio manager(s) only through the end of the period as stated on the cover of this report and do not necessarily represent the views of Fidelity or any other person in the Fidelity organization. Any such views are subject to change at any time based upon market or other conditions and Fidelity disclaims any responsibility to update such views. These views may not be relied on as investment advice and, because investment decisions for a Fidelity fund are based on numerous factors, may not be relied on as an indication of trading intent on behalf of any Fidelity fund.
Annual Report
VIP Energy Portfolio
Shareholder Expense Example
As a shareholder of the Fund, you incur two types of costs: (1) transaction costs, including redemption fees, and (2) ongoing costs, including management fees, distribution and/or service (12b-1) fees and other Fund expenses. This Example is intended to help you understand your ongoing costs (in dollars) of investing in the Fund and to compare these costs with the ongoing costs of investing in other mutual funds.
The Example is based on an investment of $1,000 invested at the beginning of the period and held for the entire period (July 1, 2006 to December 31, 2006).
Actual Expenses
The first line of the accompanying table for each class of the Fund provides information about actual account values and actual expenses. You may use the information in this line, together with the amount you invested, to estimate the expenses that you paid over the period. Simply divide your account value by $1,000.00 (for example, an $8,600 account value divided by $1,000.00 = 8.6), then multiply the result by the number in the first line for a class of the Fund under the heading entitled "Expenses Paid During Period" to estimate the expenses you paid on your account during this period. The estimate of expenses does not include any fees or other expenses of any variable annuity or variable life insurance product. If they were, the estimate of expenses you paid during the period would be higher, and your ending account value would be lower.
Hypothetical Example for Comparison Purposes
The second line of the accompanying table for each class of the Fund provides information about hypothetical account values and hypothetical expenses based on a Class' actual expense ratio and an assumed rate of return of 5% per year before expenses, which is not the Class' actual return. The hypothetical account values and expenses may not be used to estimate the actual ending account balance or expenses you paid for the period. You may use this information to compare the ongoing costs of investing in the Fund and other funds. To do so, compare this 5% hypothetical example with the 5% hypothetical examples that appear in the shareholder reports of the other funds. The estimate of expenses does not include any fees or other expenses of any variable annuity or variable life insurance product. If they were, the estimate of expenses you paid during the period would be higher, and your ending account value would be lower.
Please note that the expenses shown in the table are meant to highlight your ongoing costs only and do not reflect any transaction costs. Therefore, the second line of the table is useful in comparing ongoing costs only, and will not help you determine the relative total costs of owning different funds. In addition, if these transactional costs were included, your costs would have been higher.
| Beginning
Account Value
July 1, 2006 | Ending
Account Value
December 31, 2006 | Expenses Paid
During Period*
July 1, 2006 to
December 31, 2006 |
Initial Class | | | |
Actual | $ 1,000.00 | $ 987.50 | $ 3.56 |
Hypothetical A | $ 1,000.00 | $ 1,021.63 | $ 3.62 |
Service Class 2 | | | |
Actual | $ 1,000.00 | $ 986.00 | $ 4.86 |
Hypothetical A | $ 1,000.00 | $ 1,020.32 | $ 4.94 |
Investor Class | | | |
Actual | $ 1,000.00 | $ 986.80 | $ 4.16 |
Hypothetical A | $ 1,000.00 | $ 1,021.02 | $ 4.23 |
A 5% return per year before expenses
* Expenses are equal to each Class' annualized expense ratio (shown in the table below); multiplied by the average account value over the period, multiplied by 184/365 (to reflect the one-half year period).
| Annualized
Expense Ratio |
Initial Class | .71% |
Service Class 2 | .97% |
Investor Class | .83% |
VIP Energy Portfolio
VIP Energy Portfolio
Investment Changes
Top Ten Stocks as of December 31, 2006 |
| % of fund's
net assets | % of fund's net assets
6 months ago |
Chevron Corp. | 8.9 | 2.7 |
ConocoPhillips | 8.4 | 3.7 |
Exxon Mobil Corp. | 8.0 | 2.5 |
Valero Energy Corp. | 7.3 | 3.5 |
Noble Corp. | 5.9 | 2.4 |
Schlumberger Ltd. (NY Shares) | 5.8 | 4.0 |
Baker Hughes, Inc. | 5.2 | 1.7 |
National Oilwell Varco, Inc. | 3.5 | 3.4 |
Ultra Petroleum Corp. | 3.4 | 2.1 |
GlobalSantaFe Corp. | 3.2 | 3.5 |
| 59.6 | |
Top Industries (% of fund's net assets) |
As of December 31, 2006 |
 | Oil, Gas &
Consumable Fuels | 58.0% | |
 | Energy Equipment & Services | 36.6% | |
 | Construction & Engineering | 1.9% | |
 | Machinery | 1.6% | |
 | Electrical Equipment | 1.4% | |
 | All Others* | 0.5% | |

|
As of June 30, 2006 |
| Oil, Gas &
Consumable Fuels | 41.7% | |
| Energy Equipment & Services | 28.9% | |
| Metals & Mining | 15.5% | |
| Machinery | 2.4% | |
| Chemicals | 1.9% | |
| All Others* | 9.6% | |

* Includes short-term investments and net other assets. |
Prior period industry classifications reflect the categories in place as of the date indicated and have not been adjusted to reflect current industry classifications. |
Annual Report
VIP Energy Portfolio
Investments December 31, 2006
Showing Percentage of Net Assets
Common Stocks - 99.5% |
| Shares | | Value (Note 1) |
CONSTRUCTION & ENGINEERING - 1.9% |
Construction & Engineering - 1.9% |
Chicago Bridge & Iron Co. NV (NY Shares) | 163,000 | | $ 4,456,420 |
Fluor Corp. | 9,200 | | 751,180 |
Jacobs Engineering Group, Inc. (a) | 28,800 | | 2,348,352 |
| | 7,555,952 |
ELECTRICAL EQUIPMENT - 1.4% |
Heavy Electrical Equipment - 1.4% |
Vestas Wind Systems AS (a) | 137,200 | | 5,799,150 |
ENERGY EQUIPMENT & SERVICES - 36.6% |
Oil & Gas Drilling - 15.7% |
Diamond Offshore Drilling, Inc. | 137,500 | | 10,991,750 |
GlobalSantaFe Corp. | 219,700 | | 12,913,966 |
Noble Corp. | 309,430 | | 23,563,095 |
Pride International, Inc. (a) | 314,900 | | 9,450,149 |
Transocean, Inc. (a) | 75,300 | | 6,091,017 |
| | 63,009,977 |
Oil & Gas Equipment & Services - 20.9% |
Baker Hughes, Inc. | 279,480 | | 20,865,977 |
Halliburton Co. | 331,500 | | 10,293,075 |
Hydril Co. (a) | 25,600 | | 1,924,864 |
National Oilwell Varco, Inc. (a) | 229,439 | | 14,037,078 |
Oceaneering International, Inc. (a) | 26,700 | | 1,059,990 |
Schlumberger Ltd. (NY Shares) | 369,120 | | 23,313,619 |
Smith International, Inc. | 127,880 | | 5,252,032 |
Superior Energy Services, Inc. (a) | 116,700 | | 3,813,756 |
W-H Energy Services, Inc. (a) | 38,400 | | 1,869,696 |
Weatherford International Ltd. (a) | 41,900 | | 1,751,001 |
| | 84,181,088 |
TOTAL ENERGY EQUIPMENT & SERVICES | | 147,191,065 |
INDEPENDENT POWER PRODUCERS & ENERGY TRADERS - 0.0% |
Independent Power Producers & Energy Traders - 0.0% |
Dynegy, Inc. Class A (a) | 267 | | 1,933 |
MACHINERY - 1.6% |
Construction & Farm Machinery & Heavy Trucks - 1.6% |
Bucyrus International, Inc. Class A | 54,700 | | 2,831,272 |
Joy Global, Inc. | 78,750 | | 3,806,775 |
| | 6,638,047 |
OIL, GAS & CONSUMABLE FUELS - 58.0% |
Coal & Consumable Fuels - 3.9% |
Arch Coal, Inc. | 121,700 | | 3,654,651 |
CONSOL Energy, Inc. | 167,700 | | 5,388,201 |
Foundation Coal Holdings, Inc. | 25,700 | | 816,232 |
Peabody Energy Corp. | 144,200 | | 5,827,122 |
| | 15,686,206 |
Integrated Oil & Gas - 27.5% |
Chevron Corp. | 487,500 | | 35,845,874 |
|
| Shares | | Value (Note 1) |
ConocoPhillips | 471,075 | | $ 33,893,846 |
Exxon Mobil Corp. | 422,181 | | 32,351,730 |
Hess Corp. | 62,500 | | 3,098,125 |
Occidental Petroleum Corp. | 110,700 | | 5,405,481 |
| | 110,595,056 |
Oil & Gas Exploration & Production - 18.7% |
Aurora Oil & Gas Corp. (a) | 163,307 | | 524,215 |
Cabot Oil & Gas Corp. | 134,659 | | 8,167,068 |
Chesapeake Energy Corp. | 344,500 | | 10,007,725 |
Energy Partners Ltd. (a) | 46,087 | | 1,125,445 |
EOG Resources, Inc. | 167,000 | | 10,429,150 |
Houston Exploration Co. (a) | 70,446 | | 3,647,694 |
Mariner Energy, Inc. (a) | 25,916 | | 507,954 |
Newfield Exploration Co. (a) | 28,700 | | 1,318,765 |
Noble Energy, Inc. | 8,000 | | 392,560 |
Petrohawk Energy Corp. (a) | 158,600 | | 1,823,900 |
Plains Exploration & Production Co. (a) | 57,100 | | 2,713,963 |
Quicksilver Resources, Inc. (a) | 40,850 | | 1,494,702 |
Range Resources Corp. | 387,200 | | 10,632,512 |
Ultra Petroleum Corp. (a) | 282,400 | | 13,484,600 |
XTO Energy, Inc. | 191,500 | | 9,010,075 |
| | 75,280,328 |
Oil & Gas Refining & Marketing - 7.9% |
Petroplus Holdings AG | 5,140 | | 312,039 |
Sunoco, Inc. | 35,000 | | 2,182,600 |
Valero Energy Corp. | 571,124 | | 29,218,704 |
| | 31,713,343 |
TOTAL OIL, GAS & CONSUMABLE FUELS | | 233,274,933 |
TOTAL COMMON STOCKS (Cost $325,020,602) | 400,461,080 |
Money Market Funds - 0.5% |
| | | |
Fidelity Cash Central Fund, 5.37% (b)
(Cost $1,897,908) | 1,897,908 | | 1,897,908 |
TOTAL INVESTMENT PORTFOLIO - 100.0% (Cost $326,918,510) | 402,358,988 |
NET OTHER ASSETS - 0.0% | | (80,737) |
NET ASSETS - 100% | $ 402,278,251 |
Legend |
(a) Non-income producing |
(b) Affiliated fund that is available only to investment companies and other accounts managed by Fidelity Investments. The rate quoted is the annualized seven-day yield of the fund at period end. A complete unaudited listing of the fund's holdings as of its most recent quarter end is available upon request. |
Affiliated Central Funds |
Information regarding fiscal year to date income earned by the Fund from investments in Fidelity Central Funds is as follows: |
Fund | Income earned |
Fidelity Cash Central Fund | $ 253,814 |
Fidelity Securities Lending Cash Central Fund | 84,109 |
Total | $ 337,923 |
Other Information |
Distribution of investments by country of issue, as a percentage of total net assets, is as follows: |
United States of America | 79.1% |
Cayman Islands | 9.1% |
Netherlands Antilles | 5.8% |
Canada | 3.4% |
Denmark | 1.4% |
Netherlands | 1.1% |
Others (individually less than 1%) | 0.1% |
| 100.0% |
See accompanying notes which are an integral part of the financial statements.
Annual Report
VIP Energy Portfolio
Financial Statements
Statement of Assets and Liabilities
| December 31, 2006 |
| | |
Assets | | |
Investment in securities, at value - See accompanying schedule: Unaffiliated issuers
(cost $325,020,602) | $ 400,461,080 | |
Fidelity Central Funds
(cost $1,897,908) | 1,897,908 | |
Total Investments
(cost $326,918,510) | | $ 402,358,988 |
Foreign currency held at value
(cost $3) | | 3 |
Dividends receivable | | 177,471 |
Interest receivable | | 18,009 |
Prepaid expenses | | 2,425 |
Other receivables | | 17,608 |
Total assets | | 402,574,504 |
| | |
Liabilities | | |
Accrued management fee | $ 195,414 | |
Transfer agent fee payable | 27,303 | |
Distribution fees payable | 14,816 | |
Other affiliated payables | 12,499 | |
Other payables and accrued expenses | 46,221 | |
Total liabilities | | 296,253 |
| | |
Net Assets | | $ 402,278,251 |
Net Assets consist of: | | |
Paid in capital | | $ 328,790,210 |
Accumulated undistributed net realized gain (loss) on investments and foreign currency transactions | | (1,952,492) |
Net unrealized appreciation (depreciation) on investments and assets and liabilities in foreign currencies | | 75,440,533 |
Net Assets | | $ 402,278,251 |
Initial Class:
Net Asset Value, offering price and redemption price per share ($280,536,639 ÷ 14,734,859 shares) | | $ 19.04 |
| | |
| | |
Service Class 2:
Net Asset Value, offering price and redemption price per share ($70,305,186 ÷ 3,703,841 shares) | | $ 18.98 |
| | |
| | |
Investor Class:
Net Asset Value, offering price and redemption price per share ($51,436,426 ÷ 2,706,487 shares) | | $ 19.00 |
Statement of Operations
| Year ended December 31, 2006 |
| | |
Investment Income | | |
Dividends | | $ 4,719,649 |
Interest | | 95 |
Income from Fidelity Central Funds | | 337,923 |
Total income | | 5,057,667 |
| | |
Expenses | | |
Management fee | $ 2,537,706 | |
Transfer agent fees | 352,584 | |
Distribution fees | 124,029 | |
Accounting and security lending fees | 185,933 | |
Custodian fees and expenses | 58,716 | |
Independent trustees' compensation | 1,657 | |
Audit | 41,105 | |
Legal | 15,806 | |
Interest | 30,867 | |
Miscellaneous | 32,917 | |
Total expenses before reductions | 3,381,320 | |
Expense reductions | (75,255) | 3,306,065 |
Net investment income (loss) | | 1,751,602 |
Realized and Unrealized Gain (Loss) Net realized gain (loss) on: | | |
Investment securities: | | |
Unaffiliated issuers | 50,116,453 | |
Foreign currency transactions | (942) | |
Total net realized gain (loss) | | 50,115,511 |
Change in net unrealized appreciation (depreciation) on: Investment securities | (2,183,547) | |
Assets and liabilities in foreign currencies | 293 | |
Total change in net unrealized appreciation (depreciation) | | (2,183,254) |
Net gain (loss) | | 47,932,257 |
Net increase (decrease) in net assets resulting from operations | | $ 49,683,859 |
See accompanying notes which are an integral part of the financial statements.
VIP Energy Portfolio
Statement of Changes in Net Assets
| Year ended
December 31, 2006 | Year ended
December 31, 2005 |
Increase (Decrease) in Net Assets | | |
Operations | | |
Net investment income (loss) | $ 1,751,602 | $ 1,402,783 |
Net realized gain (loss) | 50,115,511 | 21,384,356 |
Change in net unrealized appreciation (depreciation) | (2,183,254) | 62,078,286 |
Net increase (decrease) in net assets resulting from operations | 49,683,859 | 84,865,425 |
Distributions to shareholders from net investment income | (2,844,412) | (1,478,904) |
Distributions to shareholders from net realized gain | (54,354,221) | (17,250,199) |
Total distributions | (57,198,633) | (18,729,103) |
Share transactions - net increase (decrease) | 38,551,892 | 178,824,579 |
Redemption fees | 261,131 | 237,972 |
Total increase (decrease) in net assets | 31,298,249 | 245,198,873 |
| | |
Net Assets | | |
Beginning of period | 370,980,002 | 125,781,129 |
End of period | $ 402,278,251 | $ 370,980,002 |
Financial Highlights - Initial Class
Years ended December 31, | 2006 | 2005 | 2004 | 2003 | 2002 |
Selected Per-Share Data | | | | | |
Net asset value, beginning of period | $ 18.92 | $ 13.62 | $ 11.04 | $ 8.49 | $ 9.68 |
Income from Investment Operations | | | | | |
Net investment income (loss) C | .09 | .10 | .10 | .05 | .06 |
Net realized and unrealized gain (loss) | 3.09 | 6.20 | 2.53 | 2.54 | (1.20) |
Total from investment operations | 3.18 | 6.30 | 2.63 | 2.59 | (1.14) |
Distributions from net investment income | (.16) | (.08) | (.07) | (.05) | (.07) |
Distributions from net realized gain | (2.91) | (.94) | - | - | - |
Total distributions | (3.07) | (1.02) | (.07) | (.05) | (.07) |
Redemption fees added to paid in capital C | .01 | .02 | .02 | .01 | .02 |
Net asset value, end of period | $ 19.04 | $ 18.92 | $ 13.62 | $ 11.04 | $ 8.49 |
Total Return A, B | 16.91% | 46.31% | 23.96% | 30.61% | (11.58)% |
Ratios to Average Net Assets D, F | | | | | |
Expenses before reductions | .71% | .72% | .78% | 1.26% | 1.10% |
Expenses net of fee waivers, if any | .71% | .72% | .78% | 1.26% | 1.10% |
Expenses net of all reductions | .70% | .66% | .74% | 1.25% | 1.08% |
Net investment income (loss) | .43% | .56% | .80% | .56% | .70% |
Supplemental Data | | | | | |
Net assets, end of period (000 omitted) | $ 280,537 | $ 334,368 | $ 125,781 | $ 31,624 | $ 20,537 |
Portfolio turnover rate E | 151% | 107% | 87% | 73% | 83% |
A Total returns do not reflect charges attributable to your insurance company's separate account. Inclusion of these charges would reduce the total returns shown.
B Total returns would have been lower had certain expenses not been reduced during the periods shown.
C Calculated based on average shares outstanding during the period.
D Fees and expenses of the underlying Fidelity Central Funds are not included in the Fund's expense ratio. The Fund indirectly bears its proportionate share of the expenses of any underlying Fidelity Central Funds.
E Amount does not include the portfolio activity of any underlying Fidelity Central Funds.
F Expense ratios reflect operating expenses of the class. Expenses before reductions do not reflect amounts reimbursed by the investment adviser or reductions from brokerage service arrangements or other expense offset arrangements and do not represent the amount paid by the class during periods when reimbursements or reductions occur. Expenses net of fee waivers reflect expenses after reimbursement by the investment adviser but prior to reductions from brokerage service arrangements or other expense offset arrangements. Expenses net of all reductions represent the net expenses paid by the class.
See accompanying notes which are an integral part of the financial statements.
Annual Report
Financial Highlights - Service Class 2
Years ended December 31, | 2006 | 2005 H |
Selected Per-Share Data | | |
Net asset value, beginning of period | $ 18.90 | $ 15.80 |
Income from Investment Operations | | |
Net investment income (loss) E | .04 | .04 |
Net realized and unrealized gain (loss) | 3.07 | 4.04 |
Total from investment operations | 3.11 | 4.08 |
Distributions from net investment income | (.13) | (.07) |
Distributions from net realized gain | (2.91) | (.92) |
Total distributions | (3.04) | (.99) |
Redemption fees added to paid in capital E | .01 | .01 |
Net asset value, end of period | $ 18.98 | $ 18.90 |
Total Return B, C, D | 16.55% | 25.80% |
Ratios to Average Net Assets F, I | | |
Expenses before reductions | .96% | .97% A |
Expenses net of fee waivers, if any | .96% | .97% A |
Expenses net of all reductions | .95% | .91% A |
Net investment income (loss) | .18% | .31% A |
Supplemental Data | | |
Net assets, end of period (000 omitted) | $ 70,305 | $ 20,211 |
Portfolio turnover rate G | 151% | 107% |
A Annualized
B Total returns for periods of less than one year are not annualized.
C Total returns do not reflect charges attributable to your insurance company's separate account. Inclusion of these charges would reduce the total returns shown.
D Total returns would have been lower had certain expenses not been reduced during the periods shown.
E Calculated based on average shares outstanding during the period.
F Fees and expenses of the underlying Fidelity Central Funds are not included in the Fund's expense ratio. The Fund indirectly bears its proportionate share of the expenses of any underlying Fidelity Central Funds.
G Amount does not include the portfolio activity of any underlying Fidelity Central Funds.
H For the period April 6, 2005 (commencement of sale of shares) to December 31, 2005.
I Expense ratios reflect operating expenses of the class. Expenses before reductions do not reflect amounts reimbursed by the investment adviser or reductions from brokerage service arrangements or other expense offset arrangements and do not represent the amount paid by the class during periods when reimbursements or reductions occur. Expense ratios before reductions for start-up periods may not be representative of longer-term operating periods. Expenses net of fee waivers reflect expenses after reimbursement by the investment adviser but prior to reductions from brokerage service arrangements or other expense offset arrangements. Expenses net of all reductions represent the net expenses paid by the class.
Financial Highlights - Investor Class
Years ended December 31, | 2006 | 2005 H |
Selected Per-Share Data | | |
Net asset value, beginning of period | $ 18.91 | $ 16.76 |
Income from Investment Operations | | |
Net investment income (loss) E | .06 | .03 |
Net realized and unrealized gain (loss) | 3.08 | 3.11 |
Total from investment operations | 3.14 | 3.14 |
Distributions from net investment income | (.15) | (.08) |
Distributions from net realized gain | (2.91) | (.92) |
Total distributions | (3.06) | (1.00) |
Redemption fees added to paid in capital E | .01 | .01 |
Net asset value, end of period | $ 19.00 | $ 18.91 |
Total Return B, C, D | 16.69% | 18.73% |
Ratios to Average Net Assets F, I | | |
Expenses before reductions | .84% | .91% A |
Expenses net of fee waivers, if any | .84% | .91% A |
Expenses net of all reductions | .82% | .85% A |
Net investment income (loss) | .31% | .37% A |
Supplemental Data | | |
Net assets, end of period (000 omitted) | $ 51,436 | $ 16,402 |
Portfolio turnover rate G | 151% | 107% |
A Annualized
B Total returns for periods of less than one year are not annualized.
C Total returns do not reflect charges attributable to your insurance company's separate account. Inclusion of these charges would reduce the total returns shown.
D Total returns would have been lower had certain expenses not been reduced during the periods shown.
E Calculated based on average shares outstanding during the period.
F Fees and expenses of the underlying Fidelity Central Funds are not included in the Fund's expense ratio. The Fund indirectly bears its proportionate share of the expenses of any underlying Fidelity Central Funds.
G Amount does not include the portfolio activity of any underlying Fidelity Central Funds.
H For the period July 21, 2005 (commencement of sale of shares) to December 31, 2005.
I Expense ratios reflect operating expenses of the class. Expenses before reductions do not reflect amounts reimbursed by the investment adviser or reductions from brokerage service arrangements or other expense offset arrangements and do not represent the amount paid by the class during periods when reimbursements or reductions occur. Expense ratios before reductions for start-up periods may not be representative of longer-term operating periods. Expenses net of fee waivers reflect expenses after reimbursement by the investment adviser but prior to reductions from brokerage service arrangements or other expense offset arrangements. Expenses net of all reductions represent the net expenses paid by the class.
See accompanying notes which are an integral part of the financial statements.
VIP Energy Portfolio
Notes to Financial Statements
For the period ended December 31, 2006
1. Significant Accounting Policies.
VIP Energy Portfolio (the Fund)(formerly VIP Natural Resources Portfolio) is a non-diversified fund of Variable Insurance Products Fund IV (the trust) and is authorized to issue an unlimited number of shares. The trust is registered under the Investment Company Act of 1940, as amended (the 1940 Act), as an open-end management investment company organized as a Massachusetts business trust. Shares of the Fund may only be purchased by insurance companies for the purpose of funding variable annuity or variable life insurance contracts. The Fund offers the following classes of shares: Initial Class shares, Service Class 2 shares, and Investor Class shares. All classes have equal rights and voting privileges, except for matters affecting a single class. Investment income, realized and unrealized capital gains and losses, the common expenses of the Fund, and certain fund-level expense reductions, if any, are allocated on a pro rata basis to each class based on the relative net assets of each class to the total net assets of the Fund. Each class differs with respect to transfer agent and distribution and service plan fees incurred. Certain expense reductions also differ by class.
The Fund may invest in Fidelity Central Funds which are open-end investment companies available to investment companies and other accounts managed by Fidelity Management & Research Company, (FMR) and its affiliates. The financial statements have been prepared in conformity with accounting principles generally accepted in the United States of America, which require management to make certain estimates and assumptions at the date of the financial statements. The following summarizes the significant accounting policies of the Fund, which are also consistently followed by the Fidelity Central Funds:
Security Valuation. Investments are valued and net asset value (NAV) per share is calculated (NAV calculation) as of the close of business of the New York Stock Exchange (NYSE), normally 4:00 p.m. Eastern time. Wherever possible, the Fund uses independent pricing services approved by the Board of Trustees to value its investments.
Equity securities, including restricted securities, for which market quotations are readily available, are valued at the last reported sale price or official closing price as reported by an independent pricing service on the primary market or exchange on which they are traded. In the event there were no sales during the day or closing prices are not available, securities are valued at the last quoted bid price. Investments in open-end mutual funds, including the Fidelity Central Funds, are valued at their closing net asset value each business day. Short-term securities with remaining maturities of sixty days or less for which quotations are not readily available are valued at amortized cost, which approximates value.
When current market prices or quotations are not readily available or do not accurately reflect fair value, valuations may be determined in accordance with procedures adopted by the Board of Trustees. For example, when developments occur between the close of a market and the close of the NYSE that may materially affect the value of some or all of the securities, or when trading in a security is halted, those securities may be fair valued. Factors used in the determination of fair value may include monitoring news to identify significant market or security specific events such as changes in the value of U.S. securities markets, reviewing developments in foreign markets and evaluating the performance of ADRs, futures contracts and exchange-traded funds. Because the Fund's utilization of fair value pricing depends on market activity, the frequency with which fair value pricing is used can not be predicted and may be utilized to a significant extent. The value of securities used for NAV calculation under fair value pricing may differ from published prices for the same securities.
Foreign Currency. The Fund uses foreign currency contracts to facilitate transactions in foreign-denominated securities. Losses from these transactions may arise from changes in the value of the foreign currency or if the counterparties do not perform under the contracts' terms.
Foreign-denominated assets, including investment securities, and liabilities are translated into U.S. dollars at the exchange rate at period end. Purchases and sales of investment securities, income and dividends received and expenses denominated in foreign currencies are translated into U.S. dollars at the exchange rate in effect on the transaction date.
The effects of exchange rate fluctuations on investments are included with the net realized and unrealized gain (loss) on investment securities. Other foreign currency transactions resulting in realized and unrealized gain (loss) are disclosed separately.
Investment Transactions and Income. Security transactions, including the Fund's investment activity in the Fidelity Central Funds, are accounted for as of trade date. Gains and losses on securities sold are determined on the basis of identified cost and may include proceeds received from litigation. Dividend income is recorded on the ex-dividend date, except for certain dividends from foreign securities where the ex-dividend date may have passed, which are recorded as soon as the Fund is informed of the ex-dividend date. Non-cash dividends included in dividend income, if any, are recorded at the fair market value of the securities received. Distributions received on securities that represent a return of capital or capital gain are recorded as a reduction of cost of investments and/or as a realized gain. The Fund estimates the components of distributions received that may be considered return of capital distributions or capital gain distributions. Interest income and income distributions from the Fidelity Central Funds are accrued as earned, with any income distributions receivable as of period end included in Interest Receivable on the Statement of Assets and Liabilities. Interest income includes coupon interest and amortization of premium and accretion of discount on debt securities. Investment income is recorded net of foreign taxes withheld where recovery of such taxes is uncertain.
Annual Report
Notes to Financial Statements - continued
1. Significant Accounting Policies - continued
Expenses. Most expenses of the trust can be directly attributed to a fund. Expenses which cannot be directly attributed are apportioned among each Fund in the trust. Expense estimates are accrued in the period to which they relate and adjustments are made when actual amounts are known.
Income Tax Information and Distributions to Shareholders. Each year, the Fund intends to qualify as a regulated investment company by distributing all of its taxable income and realized gains under Subchapter M of the Internal Revenue Code. As a result, no provision for income taxes is required in the accompanying financial statements. Foreign taxes are provided for based on the Fund's understanding of the tax rules and rates that exist in the foreign markets in which it invests.
Distributions are recorded on the ex-dividend date. Income dividends and capital gain distributions are declared separately for each class. Income and capital gain distributions are determined in accordance with income tax regulations, which may differ from generally accepted accounting principles.
Capital accounts within the financial statements are adjusted for permanent book-tax differences. These adjustments have no impact on net assets or the results of operations. Temporary book-tax differences will reverse in a subsequent period.
Book-tax differences are primarily due to foreign currency transactions, passive foreign investment companies (PFIC), partnerships (including allocations from Fidelity Central Funds) and losses deferred due to wash sales.
The tax-basis components of distributable earnings and the federal tax cost as of period end were as follows:
Unrealized appreciation | $ 77,834,342 | |
Unrealized depreciation | (6,083,488) | |
Net unrealized appreciation (depreciation) | 71,750,854 | |
Undistributed ordinary income | 174,115 | |
Undistributed long-term capital gain | 1,563,059 | |
| | |
Cost for federal income tax purposes | $ 330,608,134 | |
The tax character of distributions paid was as follows:
| December 31, 2006 | December 31, 2005 |
Ordinary Income | $ 27,103,286 | $ 13,373,526 |
Long-term Capital Gains | 30,095,347 | 5,355,577 |
Total | $ 57,198,633 | $ 18,729,103 |
Trading (Redemption) Fees. Initial Class shares, Service Class 2 shares, and Investor Class shares held less than 60 days are subject to a redemption fee equal to 1% of the proceeds of the redeemed shares. All redemption fees, including any estimated redemption fees paid by FMR, are retained by the Fund and accounted for as an addition to paid in capital.
New Accounting Pronouncements. In July 2006, Financial Accounting Standards Board Interpretation No. 48, Accounting for Uncertainty in Income Taxes - an interpretation of FASB Statement 109 (FIN 48), was issued and is effective on the last business day of the semiannual reporting period for fiscal years beginning after December 15, 2006. FIN 48 sets forth a threshold for financial statement recognition, measurement and disclosure of a tax position taken or expected to be taken on a tax return. Management is currently evaluating the impact, if any, the adoption of FIN 48 will have on the Fund's net assets, results of operations and financial statement disclosures.
In addition, in September 2006, Statement of Financial Accounting Standards No. 157, Fair Value Measurements (SFAS 157), was issued and is effective for fiscal years beginning after November 15, 2007. SFAS 157 defines fair value, establishes a framework for measuring fair value and expands disclosures about fair value measurements. Management is currently evaluating the impact the adoption of SFAS 157 will have on the Fund's financial statement disclosures.
2. Operating Policies.
Repurchase Agreements. FMR has received an Exemptive Order from the Securities and Exchange Commission (the SEC) which permits the Fund and other affiliated entities of FMR to transfer uninvested cash balances into joint trading accounts which are then invested in repurchase agreements. The Fund may also invest directly with institutions in repurchase agreements. Repurchase agreements are collateralized by government or non-government securities. Upon settlement date, collateral is held in segregated accounts with custodian banks and may be obtained in the event of a default of the counterparty. The Fund monitors, on a daily basis, the value of the collateral to ensure it is at least equal to the principal amount of the repurchase agreement (including accrued interest). In the event of a default by the counterparty, realization of the collateral proceeds could be delayed, during which time the value of the collateral may decline.
VIP Energy Portfolio
3. Purchases and Sales of Investments.
Purchases and sales of securities, other than short-term securities, aggregated $669,662,540 and $682,768,197, respectively.
4. Fees and Other Transactions with Affiliates.
Management Fee. FMR and its affiliates provide the Fund with investment management related services for which the Fund pays a monthly management fee. The management fee is the sum of an individual fund fee rate that is based on an annual rate of .30% of the Fund's average net assets and a group fee rate that averaged .27% during the period. The group fee rate is based upon the average net assets of all the mutual funds advised by FMR. The group fee rate decreases as assets under management increase and increases as assets under management decrease. For the period, the total annual management fee rate was .57% of the Fund's average net assets.
Distribution and Service Plan. In accordance with Rule 12b-1 of the 1940 Act, the Fund has adopted separate 12b-1 Plans for Service Class 2 shares. Service Class 2 pays Fidelity Distributors Corporation (FDC), an affiliate of FMR, a service fee. For the period, the service fee is based on an annual rate of .25% of Service Class 2's average net assets.
For the period, Service Class 2 paid FDC $124,029, all of which was re-allowed to insurance companies for the distribution of shares and providing shareholder support services.
Transfer Agent Fees. Fidelity Investments Institutional Operations Company, Inc. (FIIOC), an affiliate of FMR, is the fund's transfer, dividend disbursing, and shareholder servicing agent. FIIOC receives an asset-based fee with respect to each class. Each class with the exception of Investor Class pays a transfer agent fee, excluding out of pocket expenses, equal to an annual rate of .07% of their month end net assets. Investor Class pays a monthly asset-based transfer agent fee of .18% of its month end net assets. The total transfer agent fees paid by each class to FIIOC, including out of pocket expenses, were as follows:
Initial Class | $ 241,910 | |
Service Class 2 | 34,377 | |
Investor Class | 76,297 | |
| $ 352,584 | |
Accounting and Security Lending Fees. Fidelity Service Company, Inc. (FSC), an affiliate of FMR, maintains the Fund's accounting records. The accounting fee is based on the level of average net assets for the month. Under a separate contract, FSC administers the security lending program. The security lending fee is based on the number and duration of lending transactions.
Investments in Fidelity Central Funds. The Fund may invest in Fidelity Central Funds. The Fund's Schedule of Investments lists each of the Fidelity Central Funds as an investment of the Fund but does not include the underlying holdings of each Fidelity Central Fund. As an Investing Fund, the Fund indirectly bears its proportionate share of the expenses of the underlying Fidelity Central Funds. A complete unaudited list of holdings for each Fidelity Central Fund is available upon request. In addition, the financial statements of the Fidelity Central Funds, which are not covered by the Fund's Report of Independent Registered Public Accounting Firm, are available on the EDGAR Database on the SEC's web site, www.sec.gov, or upon request.
The Money Market Central Funds seek preservation of capital and current income and are managed by Fidelity Investments Money Management, Inc. (FIMM), an affiliate of FMR.
Brokerage Commissions. The Fund placed a portion of its portfolio transactions with brokerage firms which are affiliates of the investment adviser. The commissions paid to these affiliated firms were $2,037 for the period.
Interfund Lending Program. Pursuant to an Exemptive Order issued by the SEC, the Fund, along with other registered investment companies having management contracts with FMR, may participate in an interfund lending program. This program provides an alternative credit facility allowing the funds to borrow from, or lend money to, other participating affiliated funds. At period end, there were no interfund loans outstanding. The Fund's activity in this program during the period for which loans were outstanding was as follows:
Borrower or Lender | Average Daily
Loan Balance | Weighted Average Interest Rate | Interest Expense |
Borrower | $ 6,266,407 | 5.12% | $ 24,060 |
Annual Report
Notes to Financial Statements - continued
5. Committed Line of Credit.
The Fund participates with other funds managed by FMR in a $4.2 billion credit facility (the "line of credit") to be utilized for temporary or emergency purposes to fund shareholder redemptions or for other short-term liquidity purposes. The Fund has agreed to pay commitment fees on its pro rata portion of the line of credit, which amounted to $1,194 and is reflected in Miscellaneous Expense on the Statement of Operations. During the period, there were no borrowings on this line of credit.
6. Security Lending.
The Fund lends portfolio securities from time to time in order to earn additional income. On the settlement date of the loan, the Fund receives collateral (in the form of U.S. Treasury obligations, letters of credit and/or cash) against the loaned securities and maintains collateral in an amount not less than 100% of the market value of the loaned securities during the period of the loan. The market value of the loaned securities is determined at the close of business of the Fund and any additional required collateral is delivered to the Fund on the next business day. If the borrower defaults on its obligation to return the securities loaned because of insolvency or other reasons, a fund could experience delays and costs in recovering the securities loaned or in gaining access to the collateral. Any cash collateral received is invested in the Fidelity Securities Lending Cash Central Fund. At period end, there were no security loans outstanding. Security lending income represents the income earned on investing cash collateral, less fees and expenses associated with the loan, plus any premium payments that may be received on the loan of certain types of securities. Security lending income is presented in the Statement of Operations as a component of income from Fidelity Central Funds. Net income from lending portfolio securities during the period amounted to $84,109.
7. Bank Borrowings.
The Fund is permitted to have bank borrowings for temporary or emergency purposes to fund shareholder redemptions. The Fund has established borrowing arrangements with certain banks. The interest rate on the borrowings is the bank's base rate, as revised from time to time. The average daily loan balance during the period for which loans were outstanding amounted to $3,170,714. The weighted average interest rate was 5.52%. At period end, there were no bank borrowings outstanding.
8. Expense Reductions.
Many of the brokers with whom FMR places trades on behalf of the Fund provided services to the Fund in addition to trade execution. These services included payments of certain expenses on behalf of the Fund totaling $68,646 for the period.
9. Other.
The Fund's organizational documents provide former and current trustees and officers with a limited indemnification against liabilities arising in connection with the performance of their duties to the Fund. In the normal course of business, the Fund may also enter into contracts that provide general indemnifications. The Fund's maximum exposure under these arrangements is unknown as this would be dependent on future claims that may be made against the Fund. The risk of material loss from such claims is considered remote.
At the end of the period, FMR or its affiliates were the owners of record of 83% of the total outstanding shares of the Fund and one otherwise unaffiliated shareholder was the owner of record of 17% of the total outstanding shares of the Fund.
The United States Securities and Exchange Commission ("SEC") is conducting an investigation of FMR (covering the years 2002 to 2004) arising from gifts, gratuities and business entertainment provided by certain brokers to certain individuals who were employed on FMR's domestic equity trading desk during that period. FMR is in discussions with the SEC staff regarding the possible resolution of the matter, but as of period-end no final resolution has been reached.
In December 2006, the Independent Trustees completed their own investigation of the matter with the assistance of independent counsel. The Independent Trustees and FMR agree that, despite the absence of proof that the Fidelity mutual funds experienced diminished execution quality as a result of the improper receipt of gifts and business entertainment, the conduct at issue was serious and is worthy of redress. Accordingly, the Independent Trustees have requested and FMR has agreed to pay $42 million to Fidelity mutual funds, plus interest to be determined at the time that payment is made. A method of allocating this payment among the funds has not yet been determined. The total payment to the Fund is not anticipated to have a material impact on the Fund's net assets. In addition, FMR reimbursed related legal expenses which are recorded in the accompanying Statement of Operations as an expense reduction.
VIP Energy Portfolio
10. Distributions to Shareholders.
Distributions to shareholders of each class were as follows:
| Years ended December 31, |
| 2006 | 2005 A, B |
From net investment income | | |
Initial Class | $ 2,085,944 | $ 1,343,474 |
Service Class 2 | 417,004 | 71,612 |
Investor Class | 341,464 | 63,818 |
Total | $ 2,844,412 | $ 1,478,904 |
From net realized gain | | |
Initial Class | $ 38,831,658 | $ 15,601,628 |
Service Class 2 | 8,989,384 | 941,185 |
Investor Class | 6,533,179 | 707,386 |
Total | $ 54,354,221 | $ 17,250,199 |
A Distributions for Service Class 2 are for the period April 6, 2005 (commencement of sale of shares) to December 31, 2005.
B Distributions for Investor Class are for the period July 21, 2005 (commencement of sale of shares) to December 31, 2005.
11. Share Transactions.
Transactions for each class of shares were as follows:
| Shares | Dollars |
| Years ended December 31, | Years ended December 31, |
| 2006 | 2005 A, B | 2006 | 2005 A, B |
Initial Class | | | | |
Shares sold | 3,276,992 | 11,239,675 | $ 71,557,806 | $ 187,039,778 |
Reinvestment of distributions | 2,133,823 | 885,881 | 40,917,603 | 16,945,102 |
Shares redeemed | (8,345,943) | (3,689,662) | (169,302,328) | (60,940,355) |
Net increase (decrease) | (2,935,128) | 8,435,894 | $ (56,826,919) | $ 143,044,525 |
Service Class 2 | | | | |
Shares sold | 3,062,096 | 1,150,550 | $ 65,681,537 | $ 20,814,905 |
Reinvestment of distributions | 493,393 | 52,860 | 9,406,387 | 1,012,797 |
Shares redeemed | (921,256) | (133,802) | (18,804,698) | (2,529,981) |
Net increase (decrease) | 2,634,233 | 1,069,608 | $ 56,283,226 | $ 19,297,721 |
Investor Class | | | | |
Shares sold | 1,990,866 | 842,330 | $ 42,583,288 | $ 15,997,464 |
Reinvestment of distributions | 360,165 | 40,230 | 6,874,643 | 771,205 |
Shares redeemed | (512,058) | (15,046) | (10,362,346) | (286,336) |
Net increase (decrease) | 1,838,973 | 867,514 | $ 39,095,585 | $ 16,482,333 |
A Share transactions for Service Class 2 are for the period April 6, 2005 (commencement of sale of shares) to December 31, 2005.
B Share transactions for Investor Class are for the period July 21, 2005 (commencement of sale of shares) to December 31, 2005.
Annual Report
Report of Independent Registered Public Accounting Firm
To the Trustees of Variable Insurance Products Fund IV and the Shareholders of VIP Energy Portfolio (formerly VIP Natural Resources Portfolio):
In our opinion, the accompanying statement of assets and liabilities, including the schedule of investments, and the related statements of operations and of changes in net assets and the financial highlights present fairly, in all material respects, the financial position of VIP Energy Portfolio (formerly VIP Natural Resources Portfolio) (a fund of Variable Insurance Products Fund IV) at December 31, 2006, the results of its operations for the year then ended, the changes in its net assets for each of the two years in the period then ended and the financial highlights for each of the periods indicated, in conformity with accounting principles generally accepted in the United States of America. These financial statements and financial highlights (hereafter referred to as "financial statements") are the responsibility of the VIP Energy Portfolio's management; our responsibility is to express an opinion on these financial statements based on our audits. We conducted our audits of these financial statements in accordance with the standards of the Public Company Accounting Oversight Board (United States). Those standards require that we plan and perform the audit to obtain reasonable assurance about whether the financial statements are free of material misstatement. An audit includes examining, on a test basis, evidence supporting the amounts and disclosures in the financial statements, assessing the accounting principles used and significant estimates made by management, and evaluating the overall financial statement presentation. We believe that our audits, which included confirmation of securities at December 31, 2006 by correspondence with the custodian and brokers, provide a reasonable basis for our opinion.
/s/ PricewaterhouseCoopers LLP
PricewaterhouseCoopers LLP
Boston, Massachusetts
February 13, 2007
VIP Energy Portfolio
Trustees and Officers
The Trustees, Member of the Advisory Board, and executive officers of the trust and fund, as applicable, are listed below. The Board of Trustees governs the fund and is responsible for protecting the interests of shareholders. The Trustees are experienced executives who meet periodically throughout the year to oversee the fund's activities, review contractual arrangements with companies that provide services to the fund, and review the fund's performance. Each of the Trustees oversees 348 funds advised by FMR or an affiliate.
The Trustees hold office without limit in time except that (a) any Trustee may resign; (b) any Trustee may be removed by written instrument, signed by at least two-thirds of the number of Trustees prior to such removal; (c) any Trustee who requests to be retired or who has become incapacitated by illness or injury may be retired by written instrument signed by a majority of the other Trustees; and (d) any Trustee may be removed at any special meeting of shareholders by a two-thirds vote of the outstanding voting securities of the trust. Each Trustee who is not an interested person (as defined in the 1940 Act) (Independent Trustee), shall retire not later than the last day of the calendar year in which his or her 72nd birthday occurs. The Independent Trustees may waive this mandatory retirement age policy with respect to individual Trustees. The executive officers and Advisory Board Member hold office without limit in time, except that any officer and Advisory Board Member may resign or may be removed by a vote of a majority of the Trustees at any regular meeting or any special meeting of the Trustees. Except as indicated, each individual has held the office shown or other offices in the same company for the past five years.
The fund's Statement of Additional Information (SAI) includes more information about the Trustees. To request a free copy, call Fidelity at 1-877-208-0098.
Interested Trustees*:
Correspondence intended for each Trustee who is an interested person may be sent to Fidelity Investments, 82 Devonshire Street, Boston, Massachusetts 02109.
Name, Age; Principal Occupation |
Edward C. Johnson 3d (76) |
| Year of Election or Appointment: 1983 Mr. Johnson is Chairman of the Board of Trustees. Mr. Johnson serves as President (2006-present), Chief Executive Officer, Chairman, and a Director of FMR Corp.; Chairman and a Director of FMR; Chairman and a Director of Fidelity Research & Analysis Company (FRAC); Chairman and a Director of Fidelity Investments Money Management, Inc.; and Chairman (2001-present) and a Director of FMR Co., Inc. In addition, Mr. Johnson serves as Chairman and Director of Fidelity International Limited (FIL). |
Robert L. Reynolds (54) |
| Year of Election or Appointment: 2003 Mr. Reynolds is President and a Director of FMR (2005-present), Fidelity Investments Money Management, Inc. (2005-present), and FMR Co., Inc. (2005-present). Mr. Reynolds also serves as Vice Chairman (2006-present), a Director (2003-present), and Chief Operating Officer of FMR Corp. and a Director of Strategic Advisers, Inc. (2005-present). He also serves on the Board at Fidelity Investments Canada, Ltd. |
* Trustees have been determined to be "Interested Trustees" by virtue of, among other things, their affiliation with the trust or various entities under common control with FMR.
Independent Trustees:
Correspondence intended for each Independent Trustee (that is, the Trustees other than the Interested Trustees) may be sent to Fidelity Investments, P.O. Box 55235, Boston, Massachusetts 02205-5235.
Name, Age; Principal Occupation |
Dennis J. Dirks (58) |
| Year of Election or Appointment: 2005 Prior to his retirement in May 2003, Mr. Dirks was Chief Operating Officer and a member of the Board of The Depository Trust & Clearing Corporation (DTCC) (1999-2003). He also served as President, Chief Operating Officer, and Board member of The Depository Trust Company (DTC) (1999-2003) and President and Board member of the National Securities Clearing Corporation (NSCC) (1999-2003). In addition, Mr. Dirks served as Chief Executive Officer and Board member of the Government Securities Clearing Corporation (2001-2003) and Chief Executive Officer and Board member of the Mortgage-Backed Securities Clearing Corporation (2001-2003). Mr. Dirks also serves as a Trustee and a member of the Finance Committee of Manhattan College (2005-present) and a Trustee and a member of the Finance Committee of AHRC of Nassau County (2006-present). |
Albert R. Gamper, Jr. (64) |
| Year of Election or Appointment: 2006 Prior to his retirement in December 2004, Mr. Gamper served as Chairman of the Board of CIT Group Inc. (commercial finance). During his tenure with CIT Group Inc. Mr. Gamper served in numerous senior management positions, including Chairman (1987-1989; 1999-2001; 2002-2004), Chief Executive Officer (1987-2004), and President (1989-2002). He currently serves as a member of the Board of Directors of Public Service Enterprise Group (utilities, 2001-present), Chairman of the Board of Governors, Rutgers University (2004-present), and Chairman of the Board of Saint Barnabas Health Care System. |
George H. Heilmeier (70) |
| Year of Election or Appointment: 2004 Dr. Heilmeier is Chairman Emeritus of Telcordia Technologies (communication software and systems), where prior to his retirement, he served as company Chairman and Chief Executive Officer. He currently serves on the Boards of Directors of The Mitre Corporation (systems engineering and information technology support for the government), and HRL Laboratories (private research and development, 2004-present). He is Chairman of the General Motors Science & Technology Advisory Board and a Life Fellow of the Institute of Electrical and Electronics Engineers (IEEE). Dr. Heilmeier is a member of the Defense Science Board and the National Security Agency Advisory Board. He is also a member of the National Academy of Engineering, the American Academy of Arts and Sciences, and the Board of Overseers of the School of Engineering and Applied Science of the University of Pennsylvania. Previously, Dr. Heilmeier served as a Director of TRW Inc. (automotive, space, defense, and information technology, 1992-2002), Compaq (1994-2002), Automatic Data Processing, Inc. (ADP) (technology-based business outsourcing, 1995-2002), INET Technologies Inc. (telecommunications network surveillance, 2001-2004), and Teletech Holdings (customer management services). He is the recipient of the 2005 Kyoto Prize in Advanced Technology for his invention of the liquid crystal display, and a member of the Consumer Electronics Hall of Fame. |
James H. Keyes (66) |
| Year of Election or Appointment: 2007 Prior to his retirement in 2003, Mr. Keyes was Chairman, President, and Chief Executive Officer of Johnson Controls, Inc. (automotive supplier, 1993-2003). He currently serves as a member of the boards of LSI Logic Corporation (semiconductor technologies), Navistar International Corporation (manufacture and sale of trucks, buses, and diesel engines, 2002-present), and Pitney Bowes, Inc. (integrated mail, messaging, and document management solutions). |
Marie L. Knowles (60) |
| Year of Election or Appointment: 2001 Prior to Ms. Knowles' retirement in June 2000, she served as Executive Vice President and Chief Financial Officer of Atlantic Richfield Company (ARCO) (diversified energy, 1996-2000). From 1993 to 1996, she was a Senior Vice President of ARCO and President of ARCO Transportation Company. She served as a Director of ARCO from 1996 to 1998. She currently serves as a Director of Phelps Dodge Corporation (copper mining and manufacturing) and McKesson Corporation (healthcare service, 2002-present). Ms. Knowles is a Trustee of the Brookings Institution and the Catalina Island Conservancy and also serves as a member of the Advisory Board for the School of Engineering of the University of Southern California. |
Ned C. Lautenbach (62) |
| Year of Election or Appointment: 2000 Mr. Lautenbach is Chairman of the Independent Trustees (2006-present). Mr. Lautenbach has been a partner of Clayton, Dubilier & Rice, Inc. (private equity investment firm) since September 1998. Previously, Mr. Lautenbach was with the International Business Machines Corporation (IBM) from 1968 until his retirement in 1998. Mr. Lautenbach serves as a Director of Sony Corporation (2006-present) and Eaton Corporation (diversified industrial) as well as the Philharmonic Center for the Arts in Naples, Florida. He also is a member of the Board of Trustees of Fairfield University (2005-present), as well as a member of the Council on Foreign Relations. |
Cornelia M. Small (62) |
| Year of Election or Appointment: 2005 Ms. Small is a member (2000-present) and Chairperson (2002-present) of the Investment Committee, and a member (2002-
present) of the Board of Trustees of Smith College. Previously, she served as Chief Investment Officer (1999-2000), Director of Global Equity Investments (1996-1999), and a member of the Board of Directors of Scudder, Stevens & Clark (1990-1997) and Scudder Kemper Investments (1997-1999). In addition, Ms. Small served as Co-Chair (2000-2003) of the Annual Fund for the Fletcher School of Law and Diplomacy. |
William S. Stavropoulos (67) |
| Year of Election or Appointment: 2001 Mr. Stavropoulos is Chairman Emeritus of the Board of Directors of The Dow Chemical Company. Since joining The Dow Chemical Company in 1967, Mr. Stavropoulos served in numerous senior management positions, including President (1993-2000; 2002-2003), CEO (1995-2000; 2002-2004), and Chairman of the Executive Committee (2000-2004). Currently, he is a Director of NCR Corporation (data warehousing and technology solutions), BellSouth Corporation (telecommunications), Chemical Financial Corporation, Maersk Inc. (industrial conglomerate, 2002-present), and Metalmark Capital (private equity investment firm, 2005-
present). He also serves as a member of the Board of Trustees of the American Enterprise Institute for Public Policy Research. In addition, Mr. Stavropoulos is a member of The Business Council, J.P. Morgan International Council and the University of Notre Dame Advisory Council for the College of Science. |
Kenneth L. Wolfe (67) |
| Year of Election or Appointment: 2005 Prior to his retirement in 2001, Mr. Wolfe was Chairman and Chief Executive Officer of Hershey Foods Corporation (1993-2001). He currently serves as a member of the boards of Adelphia Communications Corporation (2003-present), Bausch & Lomb, Inc., and Revlon Inc. (2004-present). |
Advisory Board Member and Executive Officers:
Correspondence intended for each executive officer and Mr. Lynch may be sent to Fidelity Investments, 82 Devonshire Street, Boston, Massachusetts 02109.
Name, Age; Principal Occupation |
Peter S. Lynch (62) |
| Year of Election or Appointment: 2003 Member of the Advisory Board of Variable Insurance Products Fund IV. Mr. Lynch is Vice Chairman and a Director of FMR, and Vice Chairman (2001-present) and a Director of FMR Co., Inc. Previously, Mr. Lynch served as a Trustee of the Fidelity funds (1990-2003). In addition, he serves as a Trustee of Boston College and as the Chairman of the Inner-City Scholarship Fund. |
Kimberley H. Monasterio (43) |
| Year of Election or Appointment: 2007 President and Treasurer of VIP Energy. Ms. Monasterio also serves as President and Treasurer of other Fidelity funds (2007-present) and is an employee of FMR (2004-present). Previously, Ms. Monasterio served as Deputy Treasurer of the Fidelity funds (2004-2006). Before joining Fidelity Investments, Ms. Monasterio served as Treasurer (2000-2004) and Chief Financial Officer (2002-2004) of the Franklin Templeton Funds and Senior Vice President of Franklin Templeton Services, LLC (2000-2004). |
Dwight D. Churchill (53) |
| Year of Election or Appointment: 2005 Vice President of VIP Energy. Mr. Churchill also serves as Vice President of certain Equity Funds (2005-present). Mr. Churchill is Executive Vice President of FMR (2005-present) and FMR Co., Inc. (2005-present). Previously, Mr. Churchill served as Senior Vice President of Fidelity Investments Money Management, Inc. (2005-2006), Head of Fidelity's Fixed-Income Division (2000-2005), Vice President of Fidelity's Money Market Funds (2000-2005), Vice President of Fidelity's Bond Funds, and Senior Vice President of FMR. |
Boyce I. Greer (50) |
| Year of Election or Appointment: 2005 Vice President of VIP Energy. Mr. Greer also serves as Vice President of certain Equity Funds (2005-present), certain Asset Allocation Funds (2005-present), Fixed-Income Funds (2006-present), and Money Market Funds (2006-present). Mr. Greer is also a Trustee of other investment companies advised by FMR (2003-present). He is an Executive Vice President of FMR (2005-present) and FMR Co., Inc. (2005-present), and Senior Vice President of Fidelity Investments Money Management, Inc. (2006-present). Previously, Mr. Greer served as a Director and Managing Director of Strategic Advisers, Inc. (2002-2005), and Executive Vice President (2000-2002) and Money Market Group Leader (1997-2002) of the Fidelity Investments Fixed Income Division. He also served as Vice President of Fidelity's Money Market Funds (1997-2002), Senior Vice President of FMR (1997-2002), and Vice President of FIMM (1998-2002). |
Eric D. Roiter (58) |
| Year of Election or Appointment: 2001 Secretary of VIP Energy. He also serves as Secretary of other Fidelity funds; Vice President, General Counsel, and Secretary of FMR Co., Inc. (2001-present) and FMR; Assistant Secretary of Fidelity Management & Research (U.K.) Inc. (2001-present), Fidelity Research & Analysis Company (2001-present), and Fidelity Investments Money Management, Inc. (2001-present). Mr. Roiter is an Adjunct Member, Faculty of Law, at Boston College Law School (2003-present). Previously, Mr. Roiter served as Vice President and Secretary of Fidelity Distributors Corporation (FDC) (1998-2005). |
Stuart Fross (47) |
| Year of Election or Appointment: 2003 Assistant Secretary of VIP Energy. Mr. Fross also serves as Assistant Secretary of other Fidelity funds (2003-present), Vice President and Secretary of FDC (2005-present), and is an employee of FMR. |
R. Stephen Ganis (40) |
| Year of Election or Appointment: 2006 Anti-Money Laundering (AML) officer of VIP Energy. Mr. Ganis also serves as AML officer of other Fidelity funds (2006-present) and FMR Corp. (2003-present). Before joining Fidelity Investments, Mr. Ganis practiced law at Goodwin Procter, LLP (2000-2002). |
Joseph B. Hollis (58) |
| Year of Election or Appointment: 2006 Chief Financial Officer of VIP Energy. Mr. Hollis also serves as Chief Financial Officer of other Fidelity funds. Mr. Hollis is President of Fidelity Pricing and Cash Management Services (FPCMS) (2005-present). Mr. Hollis also serves as President and Director of Fidelity Service Company, Inc. (2006-present). Previously, Mr. Hollis served as Senior Vice President of Cash Management Services (1999-2002) and Investment Management Operations (2002-2005). |
Kenneth A. Rathgeber (59) |
| Year of Election or Appointment: 2004 Chief Compliance Officer of VIP Energy. Mr. Rathgeber also serves as Chief Compliance Officer of other Fidelity funds (2004-present) and Executive Vice President of Risk Oversight for Fidelity Investments (2002-present). He is Chief Compliance Officer of FMR (2005-present), FMR Co., Inc. (2005-present), Fidelity Management & Research (U.K.) Inc. (2005-present), Fidelity Research & Analysis Company (2005-present), Fidelity Investments Money Management, Inc. (2005-present), and Strategic Advisers, Inc. (2005-present). Previously, Mr. Rathgeber served as Executive Vice President and Chief Operating Officer for Fidelity Investments Institutional Services Company, Inc. (1998-2002). |
Bryan A. Mehrmann (45) |
| Year of Election or Appointment: 2005 Deputy Treasurer of VIP Energy. Mr. Mehrmann also serves as Deputy Treasurer of other Fidelity funds (2005-present) and is an employee of FMR. Previously, Mr. Mehrmann served as Vice President of Fidelity Investments Institutional Services Group (FIIS)/Fidelity Investments Institutional Operations Corporation, Inc. (FIIOC) Client Services (1998-2004). |
Kenneth B. Robins (37) |
| Year of Election or Appointment: 2005 Deputy Treasurer of VIP Energy. Mr. Robins also serves as Deputy Treasurer of other Fidelity funds (2005-present) and is an employee of FMR (2004-present). Before joining Fidelity Investments, Mr. Robins worked at KPMG LLP, where he was a partner in KPMG's department of professional practice (2002-2004) and a Senior Manager (1999-2000). In addition, Mr. Robins served as Assistant Chief Accountant, United States Securities and Exchange Commission (2000-2002). |
Robert G. Byrnes (40) |
| Year of Election or Appointment: 2005 Assistant Treasurer of VIP Energy. Mr. Byrnes also serves as Assistant Treasurer of other Fidelity funds (2005-present) and is an employee of FMR (2005-present). Previously, Mr. Byrnes served as Vice President of FPCMS (2003-2005). Before joining Fidelity Investments, Mr. Byrnes worked at Deutsche Asset Management where he served as Vice President of the Investment Operations Group (2000-2003). |
John H. Costello (60) |
| Year of Election or Appointment: 1991 Assistant Treasurer of VIP Energy. Mr. Costello also serves as Assistant Treasurer of other Fidelity funds and is an employee of FMR. |
Peter L. Lydecker (52) |
| Year of Election or Appointment: 2004 Assistant Treasurer of VIP Energy. Mr. Lydecker also serves as Assistant Treasurer of other Fidelity funds (2004) and is an employee of FMR. |
Mark Osterheld (51) |
| Year of Election or Appointment: 2002 Assistant Treasurer of VIP Energy. Mr. Osterheld also serves as Assistant Treasurer of other Fidelity funds (2002) and is an employee of FMR. |
Gary W. Ryan (48) |
| Year of Election or Appointment: 2005 Assistant Treasurer of VIP Energy. Mr. Ryan also serves as Assistant Treasurer of other Fidelity funds (2005-present) and is an employee of FMR (2005-present). Previously, Mr. Ryan served as Vice President of Fund Reporting in FPCMS (1999-2005). |
Salvatore Schiavone (41) |
| Year of Election or Appointment: 2005 Assistant Treasurer of VIP Energy. Mr. Schiavone also serves as Assistant Treasurer of other Fidelity funds (2005-present) and is an employee of FMR (2005-present). Before joining Fidelity Investments, Mr. Schiavone worked at Deutsche Asset Management, where he most recently served as Assistant Treasurer (2003-2005) of the Scudder Funds and Vice President and Head of Fund Reporting (1996-2003). |
Annual Report
Distributions
The Board of Trustees of VIP Energy Portfolio voted to pay to shareholders of record at the opening of business on record date, the following distributions per share derived from capital gains realized from sales of portfolio securities:
| Pay Date | Record Date | Capital Gains |
Service Class 2 | 02/09/07 | 02/09/07 | $.09 |
The fund hereby designates as a capital gain dividend with respect to the taxable year ended December 31, 2006, $30,572,308, or, if subsequently determined to be different, the net capital gain of such year.
Service Class 2 designates 12% of the dividends distributed in December 2006 as qualifying for the dividends-received deduction for corporate shareholders.
The fund will notify shareholders in January 2007 of amounts for use in preparing 2006 income tax returns.
VIP Energy Portfolio
Proxy Voting Results
A special meeting of the fund's shareholders was held on September 20, 2006. The results of votes taken among shareholders on the proposals before them are reported below. Each vote reported represents one dollar of net asset value held on the record date for the meeting.
PROPOSAL 1 |
To elect a Board of Trustees. A |
| # of
Votes | % of
Votes |
Dennis J. Dirks |
Affirmative | 92,459,317.52 | 96.102 |
Withheld | 3,749,837.05 | 3.898 |
TOTAL | 96,209,154.57 | 100.00 |
Albert R. Gamper, Jr. |
Affirmative | 92,260,598.99 | 95.896 |
Withheld | 3,948,555.58 | 4.104 |
TOTAL | 96,209,154.57 | 100.000 |
Robert M. Gates |
Affirmative | 92,315,480.72 | 95.953 |
Withheld | 3,893,673.85 | 4.047 |
TOTAL | 96,209,154.57 | 100.000 |
George H. Heilmeier |
Affirmative | 92,208,255.41 | 95.841 |
Withheld | 4,000,899.16 | 4.159 |
TOTAL | 96,209,154.57 | 100.000 |
Edward C. Johnson 3d |
Affirmative | 91,928,267.76 | 95.550 |
Withheld | 4,280,886.81 | 4.450 |
TOTAL | 96,209,154.57 | 100.000 |
Stephen P. Jonas |
Affirmative | 92,457,628.76 | 96.101 |
Withheld | 3,751,525.81 | 3.899 |
TOTAL | 96,209,154.57 | 100.000 |
James H. KeyesB |
Affirmative | 92,432,729.82 | 96.075 |
Withheld | 3,776,424.75 | 3.925 |
TOTAL | 96,209,154.57 | 100.000 |
Marie L. Knowles |
Affirmative | 92,398,847.52 | 96.040 |
Withheld | 3,810,307.05 | 3.960 |
TOTAL | 96,209,154.57 | 100.000 |
Ned C. Lautenbach |
Affirmative | 92,423,184.47 | 96.065 |
Withheld | 3,785,970.10 | 3.935 |
TOTAL | 96,209,154.57 | 100.000 |
William O. McCoy |
Affirmative | 92,086,293.90 | 95.715 |
Withheld | 4,122,860.67 | 4.285 |
TOTAL | 96,209,154.57 | 100.000 |
| # of
Votes | % of
Votes |
Robert L. Reynolds |
Affirmative | 92,439,032.86 | 96.081 |
Withheld | 3,770,121.71 | 3.919 |
TOTAL | 96,209,154.57 | 100.000 |
Cornelia M. Small |
Affirmative | 92,415,567.29 | 96.057 |
Withheld | 3,793,587.28 | 3.943 |
TOTAL | 96,209,154.57 | 100.000 |
William S. Stavropoulos |
Affirmative | 92,135,400.08 | 95.766 |
Withheld | 4,073,754.49 | 4.234 |
TOTAL | 96,209,154.57 | 100.000 |
Kenneth L. Wolfe |
Affirmative | 92,445,865.31 | 96.088 |
Withheld | 3,763,289.26 | 3.912 |
TOTAL | 96,209,154.57 | 100.000 |
PROPOSAL 5A |
To modify the fundamental "invests primarily" policy (the investment policy concerning the fund's primary investments). |
| # of
Votes | % of
Votes |
Affirmative | 19,873,521.07 | 88.078 |
Against | 1,449,180.97 | 6.423 |
Abstain | 1,240,843.12 | 5.499 |
TOTAL | 22,563,545.16 | 100.000 |
PROPOSAL 5B |
To modify the fund's fundamental concentration policy. |
| # of
Votes | % of
Votes |
Affirmative | 19,722,892.30 | 87.410 |
Against | 1,536,621.08 | 6.811 |
Abstain | 1,304,031.78 | 5.779 |
TOTAL | 22,563,545.16 | 100.000 |
A Denotes trust-wide proposal and voting results. B Effective on or about January 1, 2007. |
Annual Report
Board Approval of Investment Advisory Contracts and Management Fees
VIP Energy Portfolio (formerly Natural Resources Portfolio)
Each year, typically in July, the Board of Trustees, including the Independent Trustees (together, the Board), votes on the renewal of the management contract and sub-advisory agreements (together, the Advisory Contracts) for the fund. The Board, assisted by the advice of fund counsel and Independent Trustees' counsel, requests and considers a broad range of information throughout the year.
The Board meets regularly each month except August and takes into account throughout the year matters bearing on Advisory Contracts. The Board, acting directly and through its separate committees, considers at each of its meetings factors that are relevant to the annual renewal of the fund's Advisory Contracts, including the services and support provided to the fund and its shareholders. At the time of the renewal, the Board had 12 standing committees, each composed of Independent Trustees with varying backgrounds, to which the Board has assigned specific subject matter responsibilities in order to enhance effective decision-making by the Board. Each committee has adopted a written charter outlining the structure and purposes of the committee. One such committee, the Equity Contract Committee, meets periodically as needed throughout the year to consider matters specifically related to the annual renewal of Advisory Contracts. The committee requests and receives information on, and makes recommendations to the Independent Trustees concerning, the approval and annual review of the Advisory Contracts.
At its July 2006 meeting, the Board of Trustees, including the Independent Trustees, unanimously determined to renew the Advisory Contracts for the fund. In reaching its determination, the Board considered all factors it believed relevant, including (i) the nature, extent, and quality of the services to be provided to the fund and its shareholders (including the investment performance of the fund); (ii) the competitiveness of the management fee and total expenses of the fund; (iii) the total costs of the services to be provided by and the profits to be realized by the investment adviser and its affiliates from the relationship with the fund; (iv) the extent to which economies of scale would be realized as the fund grows; and (v) whether fee levels reflect these economies of scale, if any, for the benefit of fund shareholders.
In determining whether to renew the Advisory Contracts for the fund, the Board ultimately reached a determination, with the assistance of fund counsel and Independent Trustees' counsel, that the renewal of the Advisory Contracts and the compensation to be received by Fidelity under the management contract is consistent with Fidelity's fiduciary duty under applicable law. In addition to evaluating the specific factors noted above, the Board, in reaching its determination, is aware that shareholders in the fund have a broad range of investment choices available to them, including a wide choice among mutual funds offered by competitors to Fidelity, and that the fund's shareholders, with the opportunity to review and weigh the disclosure provided by the fund in its prospectus and other public disclosures, have chosen to invest in this fund, managed by Fidelity.
Nature, Extent, and Quality of Services Provided. The Board considered staffing within the investment adviser, FMR, and the sub-advisers (together, the Investment Advisers), including the background of the fund's portfolio manager and the fund's investment objective and discipline. The Independent Trustees also had discussions with senior management of Fidelity's investment operations and investment groups. The Board considered the structure of the portfolio manager compensation program and whether this structure provides appropriate incentives.
Resources Dedicated to Investment Management and Support Services. The Board reviewed the size, education, and experience of the Investment Advisers' investment staff, their use of technology, and the Investment Advisers' approach to recruiting, training, and retaining portfolio managers and other research, advisory, and management personnel. The Board considered Fidelity's extensive global research capabilities that enable the Investment Advisers to aggregate data from various sources in an effort to produce positive investment results. The Board noted that Fidelity's analysts have access to a variety of technological tools that enable them to perform both fundamental and quantitative analysis and to specialize in various disciplines. The Board also considered that Fidelity's portfolio managers and analysts have access to daily portfolio attribution that allows for monitoring of a fund's portfolio, as well as an electronic communication system that provides immediate real-time access to research concerning issuers and credit enhancers.
Shareholder and Administrative Services. The Board considered (i) the nature, extent, quality, and cost of administrative, distribution, and shareholder services performed by the Investment Advisers and their affiliates under the Advisory Contracts and under separate agreements covering transfer agency, pricing and bookkeeping, and securities lending services for the fund; (ii) the nature and extent of the Investment Advisers' supervision of third party service providers, principally custodians and subcustodians; and (iii) the resources devoted to, and the record of compliance with, the fund's compliance policies and procedures. The Board reviewed the allocation of fund brokerage, including allocations to brokers affiliated with the Investment Advisers, the use of brokerage commissions to pay fund expenses, and the use of "soft" commission dollars to pay for research services. The Board also considered that Fidelity voluntarily pays for market data out of its own resources.
The Board noted that the growth of fund assets across the complex allows Fidelity to reinvest in the development of services designed to enhance the value or convenience of the Fidelity funds as investment vehicles. These services include 24-hour access to account information and market information through phone representatives and over the Internet, and investor education materials and asset allocation tools.
Investment in a Large Fund Family. The Board considered the benefits to shareholders of investing in a Fidelity fund, including the benefits of investing in a fund that is part of a large family of funds offering a variety of investment disciplines and providing for a large variety of mutual fund investor services. The Board noted that, since the last Advisory Contract renewals in July 2005, Fidelity has taken a number of actions that benefited particular funds, including (i) dedicating additional resources to investment research and to restructure the investment research teams; (ii) voluntarily entering into contractual arrangements with certain brokers pursuant to which Fidelity pays for research products and services separately out of its own resources, rather than bundling with fund commissions; (iii) launching the Fidelity Advantage Class of its five Spartan stock index funds and three Spartan bond index funds, which is a lower-fee class available to shareholders with higher account balances; (iv) contractually agreeing to impose expense limitations on Fidelity U.S. Bond Index Fund and reducing the fund's initial investment minimum; and (v) offering shareholders of each of the Fidelity Institutional Money Market Funds the privilege of exchanging shares of the fund for shares of other Fidelity funds.
VIP Energy Portfolio
Investment Performance and Compliance. The Board considered whether the fund has operated within its investment objective, as well as its record of compliance with its investment restrictions. It also reviewed the fund's absolute investment performance for Initial Class, as well as the fund's relative investment performance for Initial Class measured against (i) a Goldman Sachs index that reflects the market sector in which the fund invests, and (ii) a peer group of mutual funds deemed appropriate by the Board over multiple periods. Because the fund had been in existence less than five calendar years, the following charts considered by the Board show, over the one- and three-year periods ended December 31, 2005, the cumulative total returns of Initial Class of the fund, the cumulative total returns of a Goldman Sachs index ("benchmark"), and a range of cumulative total returns of a peer group of mutual funds identified by Lipper Inc. as having an investment objective similar to that of the fund. (Investor Class and Service Class 2 of the fund had less than one year of performance as of December 31, 2005.) The box within each chart shows the 25th percentile return (bottom of box) and the 75th percentile return (top of box) of the Lipper peer group. Returns shown above the box are in the first quartile and returns shown below the box are in the fourth quartile. The percentage beaten number noted below each chart corresponds to the percentile box and represents the percentage of funds in the Lipper peer group whose performance was equal to or lower than that of Initial Class.
VIP Energy Portfolio

The Board reviewed the fund's relative investment performance against its Lipper peer group and stated that the performance of Initial Class of the fund was in the second quartile for all the periods shown. The Board also stated that the relative investment performance of Initial Class of the fund compared favorably to its benchmark for all the periods shown.
The Board considered that FMR has taken steps to refocus and strengthen equity research, equity portfolio management, and compliance. The Board noted with favor FMR's reorganization of its senior management team in 2005 and FMR's dedication of additional resources to investment research, and participated in the process that led to those changes.
Based on its review, and giving particular weight to the nature and quality of the resources dedicated by the Investment Advisers to maintain and improve relative performance, the Board concluded that the nature, extent, and quality of the services provided to the fund will benefit the fund's shareholders, particularly in light of the Board's view that the fund's shareholders benefit from investing in a fund that is part of a large family of funds offering a variety of investment disciplines and services.
Competitiveness of Management Fee and Total Fund Expenses. The Board considered the fund's management fee and total expenses compared to "mapped groups" of competitive funds and classes. Fidelity creates "mapped groups" by combining similar Lipper investment objective categories that have comparable management fee characteristics. Combining Lipper investment objective categories aids the Board's management fee and total expense comparisons by broadening the competitive group used for comparison and by reducing the number of universes to which various Fidelity funds are compared.
Annual Report
Board Approval of Investment Advisory Contracts and Management Fees - continued
The Board considered two proprietary management fee comparisons for the 12-month (or shorter) periods shown in the chart below. The group of Lipper funds used by the Board for management fee comparisons is referred to below as the "Total Mapped Group" and, for the reasons explained above, is broader than the Lipper peer group used by the Board for performance comparisons. The Total Mapped Group comparison focuses on a fund's standing relative to the total universe of comparable funds available to investors, in terms of gross management fees before expense reimbursements or caps. "TMG %" represents the percentage of funds in the Total Mapped Group that had management fees that were lower than the fund's. For example, a TMG % of 8% means that 92% of the funds in the Total Mapped Group had higher management fees than the fund. The "Asset-Size Peer Group" (ASPG) comparison focuses on a fund's standing relative to non-Fidelity funds similar in size to the fund within the Total Mapped Group. The ASPG represents at least 15% of the funds in the Total Mapped Group with comparable asset size and management fee characteristics, subject to a minimum of 50 funds (or all funds in the Total Mapped Group if fewer than 50). Additional information, such as the ASPG quartile in which the fund's management fee ranked, is also included in the chart and considered by the Board.
VIP Energy Portfolio
The Board noted that the fund's management fee ranked below the median of its Total Mapped Group and below the median of its ASPG for 2005.
Based on its review, the Board concluded that the fund's management fee was fair and reasonable in light of the services that the fund receives and the other factors considered.
In its review of each class's total expenses, the Board considered the fund's management fee as well as other fund or class expenses, as applicable, such as transfer agent fees, pricing and bookkeeping fees, fund-paid 12b-1 fees, and custodial, legal, and audit fees. The Board also noted the effects of any waivers and reimbursements on fees and expenses. As part of its review, the Board also considered current and historical total expenses of each class of the fund compared to competitive fund median expenses. Each class of the fund is compared to those funds and classes in the Total Mapped Group (used by the Board for management fee comparisons) that have a similar sales load structure.
The Board noted that the total expenses of each class ranked below its competitive median for 2005.
In its review of total expenses, the Board also considered Fidelity fee structures and other information on clients that FMR and its affiliates service in other competitive markets, such as other mutual funds advised or subadvised by FMR or its affiliates, pension plan clients, and other institutional clients.
Based on its review, the Board concluded that the total expenses of each class of the fund were reasonable in light of the services that the fund and its shareholders receive and the other factors considered.
Costs of the Services and Profitability. The Board considered the revenues earned and the expenses incurred by Fidelity in conducting the business of developing, marketing, distributing, managing, administering and servicing the fund and its shareholders. The Board also considered the level of Fidelity's profits in respect of all the Fidelity funds.
On an annual basis, FMR presents to the Board Fidelity's profitability for the fund. Fidelity calculates the profitability for each fund, as well as aggregate profitability for groups of Fidelity funds and all Fidelity funds, using a series of detailed revenue and cost allocation methodologies which originate with the audited books and records of Fidelity. The Audit Committee of the Board reviews any significant changes from the prior year's methodologies.
VIP Energy Portfolio
PricewaterhouseCoopers LLP (PwC), independent registered accounting firm and auditor to Fidelity and certain Fidelity funds, has been engaged annually by the Board as part of the Board's assessment of the results of Fidelity's profitability analysis. PwC's engagement includes the review and assessment of Fidelity's methodologies used in determining the revenues and expenses attributable to Fidelity's mutual fund business, and completion of agreed-upon procedures surrounding the mathematical accuracy of fund profitability and its conformity to allocation methodologies. After considering PwC's reports issued under the engagement and information provided by Fidelity, the Board believes that while other allocation methods may also be reasonable, Fidelity's profitability methodologies are reasonable in all material respects.
The Board has also reviewed Fidelity's non-fund businesses and any fall-out benefits related to the mutual fund business as well as cases where Fidelity's affiliates may benefit from or be related to the fund's business.
The Board considered the costs of the services provided by and the profits realized by Fidelity in connection with the operation of the fund and determined that the amount of profit is a fair entrepreneurial profit for the management of the fund.
Economies of Scale. The Board considered whether there have been economies of scale in respect of the management of the Fidelity funds, whether the Fidelity funds (including the fund) have appropriately benefited from any such economies of scale, and whether there is potential for realization of any further economies of scale. The Board considered the extent to which the fund will benefit from economies of scale through increased services to the fund, through waivers or reimbursements, or through fee or expense reductions.
The Board recognized that the fund's management contract incorporates a "group fee" structure, which provides for lower fee rates as total fund assets under FMR's management increase, and for higher fee rates as total fund assets under FMR's management decrease. The Board considered that the group fee is designed to deliver the benefits of economies of scale to fund shareholders when total fund assets increase, even if assets of any particular fund are unchanged or have declined, because some portion of Fidelity's costs are attributable to services provided to all Fidelity funds, and all funds benefit if those costs can be allocated among more assets. The Board concluded that, given the group fee structure, fund shareholders will achieve a certain level of economies of scale as assets under FMR's management increase at the fund complex level, regardless of whether Fidelity achieves any such economies of scale.
The Board further concluded that any potential economies of scale are being shared between fund shareholders and Fidelity in an appropriate manner.
Additional Information Requested by the Board. In order to develop fully the factual basis for consideration of the Advisory Contracts, the Board requested additional information on several topics, including (i) Fidelity's fund profitability methodology and profitability trends within certain funds; (ii) portfolio manager compensation; (iii) the extent to which any economies of scale exist and are shared between the funds and Fidelity; (iv) the total expenses of certain funds and classes relative to competitors, including the extent to which the expenses of certain funds have been or could be capped; (v) fund performance trends; and (vi) Fidelity's fee structures, including use of performance fees.
Based on its evaluation of all of the conclusions noted above, and after considering all material factors, the Board ultimately concluded that the advisory fee structures are fair and reasonable, and that the fund's Advisory Contracts should be renewed.
Annual Report
VIP Energy Portfolio
Annual Report
Investment Adviser
Fidelity Management & Research Company
Boston, MA
Investment Sub-Advisers
FMR Co., Inc.
Fidelity Management & Research (U.K.) Inc.
Fidelity Research & Analysis Company
(formerly Fidelity Management &
Research (Far East) Inc.)
Fidelity Investments Japan Limited
Fidelity International Investment Advisors
Fidelity International Investment Advisors
(U.K.) Limited
General Distributor
Fidelity Distributors Corporation
Boston, MA
Transfer and Service Agent
Fidelity Investments Institutional Operations Company, Inc.
Boston, MA
Fidelity Service Company, Inc.
Boston, MA
Custodian
State Street Bank & Trust Co.
Quincy, MA
VNR2-ANN-0207
1.826359.102
Fidelity® Variable Insurance Products:
Financial Services Portfolio
Annual Report
December 31, 2006
(2_fidelity_logos) (Registered_Trademark)
Contents
Note to Shareholders | <Click Here> | An explanation of the changes to the fund. |
Performance | <Click Here> | How the fund has done over time. |
Management's Discussion | <Click Here> | The manager's review of fund performance, strategy and outlook. |
Shareholder Expense Example | <Click Here> | An example of shareholder expenses. |
Investment Changes | <Click Here> | A summary of major shifts in the fund's investments over the past six months. |
Investments | <Click Here> | A complete list of the fund's investments with their
market values. |
Financial Statements | <Click Here> | Statements of assets and liabilities, operations, and
changes in net assets, as well as financial highlights. |
Notes | <Click Here> | Notes to the financial statements. |
Report of Independent Registered Public Accounting Firm | <Click Here> | |
Trustees and Officers | <Click Here> | |
Distributions | <Click Here> | |
Proxy Voting Results | <Click Here> | |
Board Approval of Investment Advisory Contracts and Management Fees | <Click Here> | |
| | |
To view a fund's proxy voting guidelines and proxy voting record for the 12-month period ended June 30, visit www.fidelity.com/proxyvotingresults or visit the Securities and Exchange Commission's (SEC) web site at www.sec.gov. You may also call 1-877-208-0098 to request a free copy of the proxy voting guidelines.
Fidelity Variable Insurance Products are separate account options which are purchased through a variable insurance contract.
Standard & Poor's, S&P and S&P 500 are registered service marks of The McGraw-Hill Companies, Inc. and have been licensed for use by Fidelity Distributors Corporation.
Other third party marks appearing herein are the property of their respective owners.
All other marks appearing herein are registered or unregistered trademarks or service marks of FMR Corp. or an affiliated company.
This report and the financial statements contained herein are submitted for the general information of the shareholders of the fund. This report is not authorized for distribution to prospective investors in the fund unless preceded or accompanied by an effective prospectus.
A fund files its complete schedule of portfolio holdings with the SEC for the first and third quarters of each fiscal year on Form N-Q. Forms N-Q are available on the SEC's web site at http://www.sec.gov. A fund's Forms N-Q may be reviewed and copied at the SEC's Public Reference Room in Washington, DC. Information regarding the operation of the SEC's Public Reference Room may be obtained by calling 1-800-SEC-0330. For a complete list of the fund's portfolio holdings, view the most recent quarterly holdings report, semiannual report, or annual report on Fidelity's web site at http://www.advisor.fidelity.com.
NOT FDIC INSURED · MAY LOSE VALUE · NO BANK GUARANTEE
Neither the fund nor Fidelity Distributors Corporation is a bank.
VIP Financial Services Portfolio
Note to Shareholders:
Effective October 1, 2006, Fidelity restructured the VIP Sector product line. The restructuring aligned the funds' investment goals more closely with standard industry classifications and facilitated adoption of more-specific benchmark indexes to evaluate fund performance. As restructured, the funds generally align under seven sectors in the widely recognized Global Industry Classification Standard (GICS), developed by Standard & Poor's® (S&P®) and Morgan Stanley Capital InternationalSM (MSCI®): Consumer Discretionary, Energy, Financials, Health Care, Industrials, Information Technology and Utilities. Changes to the funds ranged from simply adopting a new supplemental benchmark to, in some cases, changing investment policies and fund names.
For VIP Consumer Discretionary (formerly VIP Consumer Industries), VIP Energy (formerly VIP Natural Resources), VIP Industrials (formerly VIP Cyclical Industries), and VIP Utilities (formerly VIP Telecommunications & Utilities Growth), shareholders approved certain fundamental investment policy changes related to the restructuring at a special meeting of shareholders held September 20, 2006. All the funds adopted new benchmark indexes from MSCI. Taken together, the name, policy and benchmark changes will make it easier for investors to distinguish funds in the product line and to evaluate Fidelity Management & Research Company's skill in managing the funds.
For VIP Financial Services, the fund is now benchmarked to the MSCI US Investable Market Financials Index.
Annual Report
VIP Financial Services Portfolio
Performance: The Bottom Line
Average annual total return reflects the change in the value of an investment, assuming reinvestment of the class' dividend income and capital gains (the profits earned upon the sale of securities that have grown in value) and assuming a constant rate of performance each year. During periods of reimbursement by Fidelity, a fund's total return will be greater than it would be had the reimbursement not occurred. Performance numbers are net of all underlying fund operating expenses, but do not include any insurance charges imposed by your insurance company's separate account. If performance information included the effect of these additional charges, the total returns would have been lower. How a fund did yesterday is no guarantee of how it will do tomorrow.
Average Annual Total Returns
Periods ended December 31, 2006 | Past 1
year | Past 5
years | Life of fund A |
VIP Financial Services - Initial Class | 16.29% | 10.12% | 8.54% |
VIP Financial Services - Investor Class B | 16.12% | 10.08% | 8.51% |
A From July 18, 2001.
B The initial offering of Investor Class shares took place on July 21, 2005. Returns prior to July 21, 2005 are those of Initial Class. If Investor Class's transfer agent fee had been reflected, returns prior to July 21, 2005 would have been lower.
$10,000 Over Life of Fund
Let's say hypothetically that $10,000 was invested in VIP Financial Services Portfolio - Initial Class on July 18, 2001, when the fund started. The chart shows how the value of your investment would have changed, and also shows how the Standard & Poor's 500SM Index (S&P 500®) performed over the same period.

VIP Financial Services Portfolio
VIP Financial Services Portfolio
Management's Discussion of Fund Performance
Comments from Charles Hebard, who managed VIP Financial Services Portfolio during the period covered by this report.
U.S. stock markets registered their fourth consecutive year of positive returns in 2006. Among the highlights were the performances of the Dow Jones Industrial AverageSM - a gauge of 30 mega-cap, blue-chip stocks - and the small-cap-oriented Russell 2000® Index, both of which reached new highs. The efforts of the Federal Reserve Board to contain inflation levels also dominated the investment headlines. In all, the Fed hiked short-term interest rates four times, but held rates steady after its June 29 increase, finally pausing after 17 rate hikes over a two-year period. A slowing residential housing market and moderating oil prices - the latter of which hit a record closing high of $77 per barrel in July before falling sharply - also held economic growth in check. For the year overall, the Standard & Poor's 500SM Index was up 15.79%, the Dow advanced 19.05%, the Russell 2000 Index gained 18.37% and the NASDAQ Composite® Index rose 10.39%.
For the 12 months ending December 31, 2006, VIP Financial Services Portfolio outperformed the S&P 500® while trailing the 19.50% gain of the Morgan Stanley Capital InternationalSM (MSCI®) US Investable Market Financials Index and the 19.66% advance of a blended index specific to this fund. This blended index is a combination of the Goldman Sachs® Financial Services Index, with which the fund was compared through September, and the new MSCI benchmark mentioned above, which the fund was compared with during the period's final three months.1 (For specific portfolio performance results, please refer to the performance section of this report.) During the first nine months of the year, the fund underperformed the Goldman Sachs index principally because of significant positions in underperforming multiline insurance and reinsurance companies and an underweighting in real estate investment trusts (REITs). Detractors included an overweighted position in insurance giant American International Group (AIG) and the fund's investment in reinsurer Scottish Re. I subsequently sold the latter position. Underweighting investment banking firm Goldman Sachs held back results, as did our stake in NETeller, a British company that operates an online money transfer system. Helping performance during the first nine months were our holdings in IntercontinentalExchange, an energy futures exchange, consumer finance company Dollar Financial and Swiss financial firm UBS. We sold Goldman Sachs, UBS, NETeller and IntercontinentalExchange. The fund trailed its new MSCI index in the final three months, with many of the trends affecting individual financial services stocks reversing. For example, overweighting AIG helped during this period, but underweighting Citigroup hurt - after helping earlier in the year. Other detractors during the final three months included Goldman Sachs, a strong performing index component we didn't own, reinsurer Platinum Underwriters Holdings and Equity Residential, a REIT. The fund got a boost in the period's final quarter from overweighting investment bank Merrill Lynch and underweighting Bank of America.
Note to shareholders: Brian Younger and Richard Manuel will become co-managers of the fund on February 1, 2007, replacing Charles Hebard.
1 The fund's blended index is a customized index developed by Fidelity for the limited purpose of discussing the fund's performance for the 12-month period ending December 31, 2006. From January 1, 2006, through September 30, 2006, the fund compared its performance to the Goldman Sachs Financial Services Index, which returned 11.78% during that period. On October 1, 2006, the fund began comparing its performance to a different index, the MSCI US Investable Market Financials Index, which returned 7.06% from October 1, 2006, through December 31, 2006. For the 12-month period ending December 31, 2006, the blended index (Goldman Sachs and MSCI) returned 19.66%.
The views expressed above reflect those of the portfolio manager(s) only through the end of the period as stated on the cover of this report and do not necessarily represent the views of Fidelity or any other person in the Fidelity organization. Any such views are subject to change at any time based upon market or other conditions and Fidelity disclaims any responsibility to update such views. These views may not be relied on as investment advice and, because investment decisions for a Fidelity fund are based on numerous factors, may not be relied on as an indication of trading intent on behalf of any Fidelity fund.
Annual Report
VIP Financial Services Portfolio
Shareholder Expense Example
As a shareholder of the Fund, you incur two types of costs: (1) transaction costs, including redemption fees, and (2) ongoing costs, including management fees and other Fund expenses. This Example is intended to help you understand your ongoing costs (in dollars) of investing in the Fund and to compare these costs with the ongoing costs of investing in other mutual funds.
The Example is based on an investment of $1,000 invested at the beginning of the period and held for the entire period (July 1, 2006 to December 31, 2006).
Actual Expenses
The first line of the accompanying table for each class of the Fund provides information about actual account values and actual expenses. You may use the information in this line, together with the amount you invested, to estimate the expenses that you paid over the period. Simply divide your account value by $1,000.00 (for example, an $8,600 account value divided by $1,000.00 = 8.6), then multiply the result by the number in the first line for a class of the Fund under the heading entitled "Expenses Paid During Period" to estimate the expenses you paid on your account during this period. The estimate of expenses does not include any fees or other expenses of any variable annuity or variable life insurance product. If they were, the estimate of expenses you paid during the period would be higher, and your ending account value would be lower.
Hypothetical Example for Comparison Purposes
The second line of the accompanying table for each class of the Fund provides information about hypothetical account values and hypothetical expenses based on a Class' actual expense ratio and an assumed rate of return of 5% per year before expenses, which is not the Class' actual return. The hypothetical account values and expenses may not be used to estimate the actual ending account balance or expenses you paid for the period. You may use this information to compare the ongoing costs of investing in the Fund and other funds. To do so, compare this 5% hypothetical example with the 5% hypothetical examples that appear in the shareholder reports of the other funds. The estimate of expenses does not include any fees or other expenses of any variable annuity or variable life insurance product. If they were, the estimate of expenses you paid during the period would be higher, and your ending account value would be lower.
Please note that the expenses shown in the table are meant to highlight your ongoing costs only and do not reflect any transaction costs. Therefore, the second line of the table is useful in comparing ongoing costs only, and will not help you determine the relative total costs of owning different funds. In addition, if these transactional costs were included, your costs would have been higher.
| Beginning
Account Value
July 1, 2006 | Ending
Account Value
December 31, 2006 | Expenses Paid
During Period*
July 1, 2006 to
December 31, 2006 |
Initial Class | | | |
Actual | $ 1,000.00 | $ 1,141.50 | $ 4.70 |
Hypothetical A | $ 1,000.00 | $ 1,020.82 | $ 4.43 |
Investor Class | | | |
Actual | $ 1,000.00 | $ 1,141.00 | $ 5.40 |
Hypothetical A | $ 1,000.00 | $ 1,020.16 | $ 5.09 |
A 5% return per year before expenses
* Expenses are equal to each Class' annualized expense ratio (shown in the table below); multiplied by the average account value over the period, multiplied by 184/365 (to reflect the one-half year period).
| Annualized
Expense Ratio |
Initial Class | .87% |
Investor Class | 1.00% |
VIP Financial Services Portfolio
VIP Financial Services Portfolio
Investment Changes
Top Ten Stocks as of December 31, 2006 |
| % of fund's
net assets | % of fund's net assets
6 months ago |
American International Group, Inc. | 9.4 | 8.3 |
JPMorgan Chase & Co. | 4.9 | 5.1 |
Bank of America Corp. | 4.7 | 5.7 |
Wells Fargo & Co. | 4.3 | 3.7 |
Wachovia Corp. | 4.2 | 4.3 |
Merrill Lynch & Co., Inc. | 3.7 | 2.9 |
Morgan Stanley | 3.3 | 1.7 |
Endurance Specialty Holdings Ltd. | 3.2 | 2.8 |
ACE Ltd. | 2.9 | 2.7 |
Citigroup, Inc. | 2.7 | 1.6 |
| 43.3 | |
Top Industries (% of fund's net assets) |
As of December 31, 2006 |
| Insurance | 31.4% | |
| Commercial Banks | 18.9% | |
| Capital Markets | 17.0% | |
| Diversified Financial Services | 13.3% | |
| Real Estate Investment Trusts | 7.0% | |
| All Others* | 12.4% | |

|
As of June 30, 2006 |
| Insurance | 29.8% | |
| Commercial Banks | 19.0% | |
| Capital Markets | 17.9% | |
| Diversified Financial Services | 15.2% | |
| Thrifts & Mortgage Finance | 8.3% | |
| All Others* | 9.8% | |

* Includes short-term investments and net other assets. |
Prior period industry classifications reflect the categories in place as of the date indicated and have not been adjusted to reflect current industry classifications. |
Annual Report
VIP Financial Services Portfolio
Investments December 31, 2006
Showing Percentage of Net Assets
Common Stocks - 99.6% |
| Shares | | Value (Note 1) |
CAPITAL MARKETS - 17.0% |
Asset Management & Custody Banks - 4.6% |
Affiliated Managers Group, Inc. (d) | 2,700 | | $ 283,851 |
American Capital Strategies Ltd. (d) | 7,000 | | 323,820 |
Franklin Resources, Inc. | 5,200 | | 572,884 |
Investors Financial Services Corp. | 10,400 | | 443,768 |
Legg Mason, Inc. | 2,200 | | 209,110 |
State Street Corp. | 12,200 | | 822,768 |
| | 2,656,201 |
Diversified Capital Markets - 1.0% |
UBS AG (NY Shares) | 9,900 | | 597,267 |
Investment Banking & Brokerage - 11.4% |
Charles Schwab Corp. | 25,700 | | 497,038 |
E*TRADE Financial Corp. | 32,100 | | 719,682 |
KKR Private Equity Investors, LP | 4,000 | | 88,000 |
KKR Private Equity Investors, LP Restricted Depositary Units (e) | 4,300 | | 94,600 |
Lazard Ltd. Class A | 10,900 | | 516,006 |
Merrill Lynch & Co., Inc. | 23,000 | | 2,141,300 |
Morgan Stanley | 23,510 | | 1,914,419 |
Nomura Holdings, Inc. | 25,800 | | 486,527 |
optionsXpress Holdings, Inc. | 4,800 | | 108,912 |
| | 6,566,484 |
TOTAL CAPITAL MARKETS | | 9,819,952 |
COMMERCIAL BANKS - 18.9% |
Diversified Banks - 15.2% |
Banco Bilbao Vizcaya Argentaria SA | 24,800 | | 596,688 |
HSBC Holdings PLC sponsored ADR (d) | 8,700 | | 797,355 |
ICICI Bank Ltd. sponsored ADR | 7,000 | | 292,180 |
Kookmin Bank sponsored ADR | 4,400 | | 354,816 |
Mizrahi Tefahot Bank Ltd. | 8,700 | | 65,410 |
U.S. Bancorp, Delaware | 27,200 | | 984,368 |
Unicredito Italiano Spa | 92,800 | | 813,497 |
Wachovia Corp. | 42,297 | | 2,408,814 |
Wells Fargo & Co. | 69,000 | | 2,453,640 |
| | 8,766,768 |
Regional Banks - 3.7% |
Cathay General Bancorp | 8,529 | | 294,336 |
Center Financial Corp., California | 6,900 | | 165,393 |
Colonial Bancgroup, Inc. | 12,000 | | 308,880 |
Nara Bancorp, Inc. | 5,100 | | 106,692 |
PNC Financial Services Group, Inc. | 9,900 | | 732,996 |
SVB Financial Group (a) | 7,000 | | 326,340 |
|
| Shares | | Value (Note 1) |
Wintrust Financial Corp. | 400 | | $ 19,208 |
Zions Bancorp | 2,200 | | 181,368 |
| | 2,135,213 |
TOTAL COMMERCIAL BANKS | | 10,901,981 |
CONSUMER FINANCE - 4.8% |
Consumer Finance - 4.8% |
American Express Co. | 21,640 | | 1,312,899 |
Capital One Financial Corp. (d) | 7,500 | | 576,150 |
Dollar Financial Corp. (a) | 13,810 | | 384,747 |
SLM Corp. | 10,040 | | 489,651 |
| | 2,763,447 |
DIVERSIFIED FINANCIAL SERVICES - 13.3% |
Other Diversifed Financial Services - 12.3% |
Bank of America Corp. | 51,249 | | 2,736,184 |
Citigroup, Inc. | 28,030 | | 1,561,271 |
JPMorgan Chase & Co. | 58,538 | | 2,827,385 |
| | 7,124,840 |
Specialized Finance - 1.0% |
CBOT Holdings, Inc. Class A (a) | 1,300 | | 196,911 |
The NASDAQ Stock Market, Inc. (a) | 12,300 | | 378,717 |
| | 575,628 |
TOTAL DIVERSIFIED FINANCIAL SERVICES | | 7,700,468 |
HOUSEHOLD DURABLES - 0.6% |
Homebuilding - 0.6% |
D.R. Horton, Inc. | 13,600 | | 360,264 |
INSURANCE - 31.4% |
Insurance Brokers - 0.6% |
National Financial Partners Corp. | 7,200 | | 316,584 |
Life & Health Insurance - 3.2% |
AFLAC, Inc. | 13,600 | | 625,600 |
MetLife, Inc. (d) | 21,110 | | 1,245,701 |
| | 1,871,301 |
Multi-Line Insurance - 11.1% |
American International Group, Inc. | 75,710 | | 5,425,374 |
Hartford Financial Services Group, Inc. | 10,760 | | 1,004,016 |
| | 6,429,390 |
Property & Casualty Insurance - 9.2% |
ACE Ltd. | 28,250 | | 1,711,103 |
Allied World Assurance Co. Holdings Ltd. | 3,600 | | 157,068 |
Aspen Insurance Holdings Ltd. | 27,800 | | 732,808 |
Axis Capital Holdings Ltd. | 6,700 | | 223,579 |
MBIA, Inc. | 7,360 | | 537,722 |
Old Republic International Corp. | 15,000 | | 349,200 |
The St. Paul Travelers Companies, Inc. | 25,500 | | 1,369,095 |
XL Capital Ltd. Class A | 3,300 | | 237,666 |
| | 5,318,241 |
Common Stocks - continued |
| Shares | | Value (Note 1) |
INSURANCE - CONTINUED |
Reinsurance - 7.3% |
Endurance Specialty Holdings Ltd. | 49,860 | | $ 1,823,879 |
Everest Re Group Ltd. | 1,700 | | 166,787 |
IPC Holdings Ltd. | 9,200 | | 289,340 |
Max Re Capital Ltd. | 17,099 | | 424,397 |
Montpelier Re Holdings Ltd. | 4,200 | | 78,162 |
PartnerRe Ltd. | 2,100 | | 149,163 |
Platinum Underwriters Holdings Ltd. | 42,000 | | 1,299,480 |
| | 4,231,208 |
TOTAL INSURANCE | | 18,166,724 |
REAL ESTATE INVESTMENT TRUSTS - 7.0% |
Mortgage REITs - 0.3% |
Annaly Capital Management, Inc. | 12,300 | | 171,093 |
Residential REITs - 2.9% |
Equity Lifestyle Properties, Inc. | 6,400 | | 348,352 |
Equity Residential (SBI) | 21,290 | | 1,080,468 |
United Dominion Realty Trust, Inc. (SBI) | 8,100 | | 257,499 |
| | 1,686,319 |
Retail REITs - 3.8% |
CBL & Associates Properties, Inc. | 2,900 | | 125,715 |
Developers Diversified Realty Corp. | 12,400 | | 780,580 |
General Growth Properties, Inc. | 17,500 | | 914,025 |
Simon Property Group, Inc. | 3,800 | | 384,902 |
| | 2,205,222 |
TOTAL REAL ESTATE INVESTMENT TRUSTS | | 4,062,634 |
REAL ESTATE MANAGEMENT & DEVELOPMENT - 1.0% |
Real Estate Management & Development - 1.0% |
Mitsubishi Estate Co. Ltd. | 22,000 | | 569,173 |
THRIFTS & MORTGAGE FINANCE - 5.6% |
Thrifts & Mortgage Finance - 5.6% |
Countrywide Financial Corp. | 19,230 | | 816,314 |
Fannie Mae | 23,050 | | 1,368,940 |
|
| Shares | | Value (Note 1) |
Hudson City Bancorp, Inc. | 30,379 | | $ 421,661 |
Washington Mutual, Inc. | 13,600 | | 618,664 |
| | 3,225,579 |
TOTAL COMMON STOCKS (Cost $47,234,236) | 57,570,222 |
Money Market Funds - 6.8% |
| | | |
Fidelity Cash Central Fund, 5.37% (b) | 1,113,122 | | 1,113,122 |
Fidelity Securities Lending Cash Central Fund, 5.38% (b)(c) | 2,825,775 | | 2,825,775 |
TOTAL MONEY MARKET FUNDS (Cost $3,938,897) | 3,938,897 |
TOTAL INVESTMENT PORTFOLIO - 106.4% (Cost $51,173,133) | | 61,509,119 |
NET OTHER ASSETS - (6.4)% | | (3,698,506) |
NET ASSETS - 100% | $ 57,810,613 |
Legend |
(a) Non-income producing |
(b) Affiliated fund that is available only to investment companies and other accounts managed by Fidelity Investments. The rate quoted is the annualized seven-day yield of the fund at period end. A complete unaudited listing of the fund's holdings as of its most recent quarter end is available upon request. |
(c) Investment made with cash collateral received from securities on loan. |
(d) Security or a portion of the security is on loan at period end. |
(e) Security exempt from registration under Rule 144A of the Securities Act of 1933. These securities may be resold in transactions exempt from registration, normally to qualified institutional buyers. At the end of the period, the value of these securities amounted to $ 94,600 or 0.2% of net assets. |
Affiliated Central Funds |
Information regarding fiscal year to date income earned by the Fund from investments in Fidelity Central Funds is as follows: |
Fund | Income earned |
Fidelity Cash Central Fund | $ 29,065 |
Fidelity Securities Lending Cash Central Fund | 2,868 |
Total | $ 31,933 |
Other Information |
Distribution of investments by country of issue, as a percentage of total net assets, is as follows: |
United States of America | 78.7% |
Bermuda | 10.2% |
Cayman Islands | 2.9% |
Japan | 1.8% |
United Kingdom | 1.8% |
Italy | 1.4% |
Switzerland | 1.0% |
Spain | 1.0% |
Others (individually less than 1%) | 1.2% |
| 100.0% |
See accompanying notes which are an integral part of the financial statements.
VIP Financial Services Portfolio
VIP Financial Services Portfolio
Financial Statements
Statement of Assets and Liabilities
| December 31, 2006 |
| | |
Assets | | |
Investment in securities, at value (including securities loaned of $2,747,978) - See accompanying schedule: Unaffiliated issuers
(cost $47,234,236) | $ 57,570,222 | |
Fidelity Central Funds
(cost $3,938,897) | 3,938,897 | |
Total Investments (cost $51,173,133) | | $ 61,509,119 |
Cash | | 21,189 |
Dividends receivable | | 71,856 |
Interest receivable | | 2,788 |
Prepaid expenses | | 179 |
Other receivables | | 2,476 |
Total assets | | 61,607,607 |
| | |
Liabilities | | |
Payable for investments purchased | $ 891,111 | |
Accrued management fee | 27,150 | |
Other affiliated payables | 6,422 | |
Other payables and accrued expenses | 46,536 | |
Collateral on securities loaned,
at value | 2,825,775 | |
Total liabilities | | 3,796,994 |
| | |
Net Assets | | $ 57,810,613 |
Net Assets consist of: | | |
Paid in capital | | $ 43,754,286 |
Undistributed net investment income | | 523,852 |
Accumulated undistributed net realized gain (loss) on investments and foreign currency transactions | | 3,196,494 |
Net unrealized appreciation (depreciation) on investments and assets and liabilities in foreign currencies | | 10,335,981 |
Net Assets | | $ 57,810,613 |
Statement of Assets and Liabilities - continued
| December 31, 2006 |
| | |
Initial Class:
Net Asset Value, offering price and redemption price per share ($44,780,978 ÷ 3,066,728 shares) | | $ 14.60 |
| | |
Investor Class:
Net Asset Value, offering price and redemption price per share ($13,029,635 ÷ 894,509
shares) | | $ 14.57 |
See accompanying notes which are an integral part of the financial statements.
Annual Report
VIP Financial Services Portfolio
Financial Statements - continued
Statement of Operations
| Year ended December 31, 2006 |
| | |
Investment Income | | |
Dividends | | $ 859,781 |
Interest | | 150 |
Income from Fidelity Central Funds | | 31,933 |
Total income | | 891,864 |
| | |
Expenses | | |
Management fee | $ 228,316 | |
Transfer agent fees | 41,153 | |
Accounting and security lending fees | 16,101 | |
Custodian fees and expenses | 27,425 | |
Independent trustees' compensation | 142 | |
Audit | 37,937 | |
Legal | 1,119 | |
Miscellaneous | 4,244 | |
Total expenses before reductions | 356,437 | |
Expense reductions | (4,649) | 351,788 |
Net investment income (loss) | | 540,076 |
Realized and Unrealized Gain (Loss) Net realized gain (loss) on: | | |
Investment securities: | | |
Unaffiliated issuers (net of foreign taxes of $9,364) | 3,292,794 | |
Foreign currency transactions | 5,160 | |
Total net realized gain (loss) | | 3,297,954 |
Change in net unrealized appreciation (depreciation) on: Investment securities (net of decrease in deferred foreign taxes of $224) | 2,439,089 | |
Assets and liabilities in foreign currencies | (15) | |
Total change in net unrealized appreciation (depreciation) | | 2,439,074 |
Net gain (loss) | | 5,737,028 |
Net increase (decrease) in net assets resulting from operations | | $ 6,277,104 |
Statement of Changes in Net Assets
| Year ended
December 31, 2006 | Year ended
December 31, 2005 |
Increase (Decrease) in Net Assets | | |
Operations | | |
Net investment income (loss) | $ 540,076 | $ 438,555 |
Net realized gain (loss) | 3,297,954 | 2,507,591 |
Change in net unrealized appreciation (depreciation) | 2,439,074 | (955,014) |
Net increase (decrease) in net assets resulting from operations | 6,277,104 | 1,991,132 |
Distributions to shareholders from net investment income | (428,612) | (452,940) |
Distributions to shareholders from net realized gain | (703,305) | - |
Total distributions | (1,131,917) | (452,940) |
Share transactions - net increase (decrease) | 17,738,147 | (8,232,955) |
Redemption fees | 18,458 | 8,912 |
Total increase (decrease) in net assets | 22,901,792 | (6,685,851) |
| | |
Net Assets | | |
Beginning of period | 34,908,821 | 41,594,672 |
End of period (including undistributed net investment income of $523,852 and undistributed net investment income of $431,362, respectively) | $ 57,810,613 | $ 34,908,821 |
See accompanying notes which are an integral part of the financial statements.
VIP Financial Services Portfolio
Financial Highlights - Initial Class
Years ended December 31, | 2006 | 2005 | 2004 | 2003 | 2002 |
Selected Per-Share Data | | | | | |
Net asset value, beginning of period | $ 12.98 | $ 12.19 | $ 10.91 | $ 8.44 | $ 9.64 |
Income from Investment Operations | | | | | |
Net investment income (loss) C | .18 | .16 | .12 | .10 | .10 |
Net realized and unrealized gain (loss) | 1.86 | .77 | 1.15 | 2.47 | (1.21) |
Total from investment operations | 2.04 | .93 | 1.27 | 2.57 | (1.11) |
Distributions from net investment income | (.16) | (.14) | - | (.11) | (.10) |
Distributions from net realized gain | (.27) | - | - | - | - |
Total distributions | (.43) | (.14) | - | (.11) | (.10) |
Redemption fees added to paid in capital C | .01 | - G | .01 | .01 | .01 |
Net asset value, end of period | $ 14.60 | $ 12.98 | $ 12.19 | $ 10.91 | $ 8.44 |
Total Return A, B | 16.29% | 7.71% | 11.73% | 30.59% | (11.41)% |
Ratios to Average Net Assets D, F | | | | | |
Expenses before reductions | .86% | .86% | .85% | .97% | .92% |
Expenses net of fee waivers, if any | .86% | .86% | .85% | .97% | .92% |
Expenses net of all reductions | .85% | .85% | .83% | .96% | .89% |
Net investment income (loss) | 1.36% | 1.31% | 1.10% | 1.06% | 1.07% |
Supplemental Data | | | | | |
Net assets, end of period (000 omitted) | $ 44,781 | $ 32,776 | $ 41,595 | $ 40,900 | $ 34,724 |
Portfolio turnover rate E | 68% | 59% | 98% | 66% | 107% |
A Total returns do not reflect charges attributable to your insurance company's separate account. Inclusion of these charges would reduce the total returns shown.
B Total returns would have been lower had certain expenses not been reduced during the periods shown.
C Calculated based on average shares outstanding during the period.
D Fees and expenses of the underlying Fidelity Central Funds are not included in the Fund's expense ratio. The Fund indirectly bears its proportionate share of the expenses of any underlying Fidelity Central Funds.
E Amount does not include the portfolio activity of any underlying Fidelity Central Funds.
F Expense ratios reflect operating expenses of the class. Expenses before reductions do not reflect amounts reimbursed by the investment adviser or reductions from brokerage service arrangements or other expense offset arrangements and do not represent the amount paid by the class during periods when reimbursements or reductions occur. Expenses net of fee waivers reflect expenses after reimbursement by the investment adviser but prior to reductions from brokerage service arrangements or other expense offset arrangements. Expenses net of all reductions represent the net expenses paid by the class.
G Amount represents less than $.01 per share.
Financial Highlights - Investor Class
Years ended December 31, | 2006 | 2005 H |
Selected Per-Share Data | | |
Net asset value, beginning of period | $ 12.98 | $ 12.07 |
Income from Investment Operations | | |
Net investment income (loss) E | .16 | .05 |
Net realized and unrealized gain (loss) | 1.86 | .86 |
Total from investment operations | 2.02 | .91 |
Distributions from net investment income | (.17) | - |
Distributions from net realized gain | (.27) | - |
Total distributions | (.44) | - |
Redemption fees added to paid in capital E | .01 | - J |
Net asset value, end of period | $ 14.57 | $ 12.98 |
Total Return B, C, D | 16.12% | 7.54% |
Ratios to Average Net Assets F, I | | |
Expenses before reductions | 1.00% | 1.18% A |
Expenses net of fee waivers, if any | 1.00% | 1.18% A |
Expenses net of all reductions | .99% | 1.16% A |
Net investment income (loss) | 1.22% | .95% A |
Supplemental Data | | |
Net assets, end of period (000 omitted) | $ 13,030 | $ 2,133 |
Portfolio turnover rate G | 68% | 59% |
A Annualized
B Total returns for periods of less than one year are not annualized.
C Total returns do not reflect charges attributable to your insurance company's separate account. Inclusion of these charges would reduce the total returns shown.
D Total returns would have been lower had certain expenses not been reduced during the periods shown.
E Calculated based on average shares outstanding during the period.
F Fees and expenses of the underlying Fidelity Central Funds are not included in the Fund's expense ratio. The Fund indirectly bears its proportionate share of the expenses of any underlying Fidelity Central Funds.
G Amount does not include the portfolio activity of any underlying Fidelity Central Funds.
H For the period July 21, 2005 (commencement of sale of shares) to December 31, 2005.
I Expense ratios reflect operating expenses of the class. Expenses before reductions do not reflect amounts reimbursed by the investment adviser or reductions from brokerage service arrangements or other expense offset arrangements and do not represent the amount paid by the class during periods when reimbursements or reductions occur. Expense ratios before reductions for start-up periods may not be representative of longer-term operating periods. Expenses net of fee waivers reflect expenses after reimbursement by the investment adviser but prior to reductions from brokerage service arrangements or other expense offset arrangements. Expenses net of all reductions represent the net expenses paid by the class.
J Amount represents less than $.01 per share.
See accompanying notes which are an integral part of the financial statements.
Annual Report
Notes to Financial Statements
For the period ended December 31, 2006
1. Significant Accounting Policies.
VIP Financial Services Portfolio (the Fund) is a fund of Variable Insurance Products Fund IV (the trust) and is authorized to issue an unlimited number of shares. The trust is registered under the Investment Company Act of 1940, as amended (the 1940 Act), as an open-end management investment company organized as a Massachusetts business trust. Shares of the Fund may only be purchased by insurance companies for the purpose of funding variable annuity or variable life insurance contracts. The Fund offers the following classes of shares: Initial Class shares and Investor Class shares. All classes have equal rights and voting privileges, except for matters affecting a single class. Investment income, realized and unrealized capital gains and losses, the common expenses of the Fund, and certain fund-level expense reductions, if any, are allocated on a pro rata basis to each class based on the relative net assets of each class to the total net assets of the Fund. Each class differs with respect to transfer agent fees incurred. Certain expense reductions also differ by class.
The Fund's investments in emerging markets can be subject to social, economic, regulatory, and political uncertainties and can be extremely volatile. The Fund may invest in Fidelity Central Funds which are open-end investment companies available to investment companies and other accounts managed by FMR and its affiliates. The financial statements have been prepared in conformity with accounting principles generally accepted in the United States of America, which require management to make certain estimates and assumptions at the date of the financial statements. The following summarizes the significant accounting policies of the Fund, which are also consistently followed by the Fidelity Central Funds:
Security Valuation. Investments are valued and net asset value (NAV) per share is calculated (NAV calculation) as of the close of business of the New York Stock Exchange (NYSE), normally 4:00 p.m. Eastern time. Wherever possible, the Fund uses independent pricing services approved by the Board of Trustees to value its investments.
Equity securities, including restricted securities, for which market quotations are readily available, are valued at the last reported sale price or official closing price as reported by an independent pricing service on the primary market or exchange on which they are traded. In the event there were no sales during the day or closing prices are not available, securities are valued at the last quoted bid price. Investments in open-end mutual funds, including the Fidelity Central Funds, are valued at their closing net asset value each business day. Short-term securities with remaining maturities of sixty days or less for which quotations are not readily available are valued at amortized cost, which approximates value.
When current market prices or quotations are not readily available or do not accurately reflect fair value, valuations may be determined in accordance with procedures adopted by the Board of Trustees. For example, when developments occur between the close of a market and the close of the NYSE that may materially affect the value of some or all of the securities, or when trading in a security is halted, those securities may be fair valued. Factors used in the determination of fair value may include monitoring news to identify significant market or security specific events such as changes in the value of U.S. securities markets, reviewing developments in foreign markets and evaluating the performance of ADRs, futures contracts and exchange-traded funds. Because the Fund's utilization of fair value pricing depends on market activity, the frequency with which fair value pricing is used can not be predicted and may be utilized to a significant extent. The value of securities used for NAV calculation under fair value pricing may differ from published prices for the same securities.
Foreign Currency. The Fund uses foreign currency contracts to facilitate transactions in foreign-denominated securities. Losses from these transactions may arise from changes in the value of the foreign currency or if the counterparties do not perform under the contracts' terms.
Foreign-denominated assets, including investment securities, and liabilities are translated into U.S. dollars at the exchange rate at period end. Purchases and sales of investment securities, income and dividends received and expenses denominated in foreign currencies are translated into U.S. dollars at the exchange rate in effect on the transaction date.
The effects of exchange rate fluctuations on investments are included with the net realized and unrealized gain (loss) on investment securities. Other foreign currency transactions resulting in realized and unrealized gain (loss) are disclosed separately.
Investment Transactions and Income. Security transactions, including the Fund's investment activity in the Fidelity Central Funds, are accounted for as of trade date. Gains and losses on securities sold are determined on the basis of identified cost. Dividend income is recorded on the ex-dividend date, except for certain dividends from foreign securities where the ex-dividend date may have passed, which are recorded as soon as the Fund is informed of the ex-dividend date. Non-cash dividends included in dividend income, if any, are recorded at the fair market value of the securities received. Distributions received on securities that represent a return of capital or capital gain are recorded as a reduction of cost of investments and/or as a realized gain. The Fund estimates the components of distributions received that may be considered return of capital distributions or capital gain distributions. Interest income and income distributions from the Fidelity Central Funds are accrued as earned, with any income distributions receivable as of period end included in Interest Receivable on the Statement of Assets and Liabilities. Interest income includes coupon interest and amortization of premium and accretion of discount on debt securities. Investment income is recorded net of foreign taxes withheld where recovery of such taxes is uncertain.
VIP Financial Services Portfolio
1. Significant Accounting Policies - continued
Expenses. Most expenses of the trust can be directly attributed to a fund. Expenses which cannot be directly attributed are apportioned among each Fund in the trust. Expense estimates are accrued in the period to which they relate and adjustments are made when actual amounts are known.
Income Tax Information and Distributions to Shareholders. Each year, the Fund intends to qualify as a regulated investment company by distributing all of its taxable income and realized gains under Subchapter M of the Internal Revenue Code. As a result, no provision for income taxes is required in the accompanying financial statements. Foreign taxes are provided for based on the Fund's understanding of the tax rules and rates that exist in the foreign markets in which it invests.
Distributions are recorded on the ex-dividend date. Income dividends and capital gain distributions are declared separately for each class. Income and capital gain distributions are determined in accordance with income tax regulations, which may differ from generally accepted accounting principles.
Capital accounts within the financial statements are adjusted for permanent book-tax differences. These adjustments have no impact on net assets or the results of operations. Temporary book-tax differences will reverse in a subsequent period.
Book-tax differences are primarily due to foreign currency transactions, partnerships, certain foreign taxes, and losses deferred due to wash sales.
The tax-basis components of distributable earnings and the federal tax cost as of period end were as follows:
Unrealized appreciation | $ 10,476,042 | |
Unrealized depreciation | (330,809) | |
Net unrealized appreciation (depreciation) | 10,145,233 | |
Undistributed ordinary income | 986,318 | |
Undistributed long-term capital gain | 2,924,779 | |
| | |
Cost for federal income tax purposes | $ 51,363,886 | |
The tax character of distributions paid was as follows:
| December 31, 2006 | December 31, 2005 |
Ordinary Income | $ 454,660 | $ 452,940 |
Long-term Capital Gains | 677,257 | - |
Total | $ 1,131,917 | $ 452,940 |
Trading (Redemption) Fees. Initial Class shares and Investor Class shares held less than 60 days are subject to a redemption fee equal to 1% of the proceeds of the redeemed shares. All redemption fees, including any estimated redemption fees paid by FMR, are retained by the Fund and accounted for as an addition to paid in capital.
New Accounting Pronouncements. In July 2006, Financial Accounting Standards Board Interpretation No. 48, Accounting for Uncertainty in Income Taxes - an interpretation of FASB Statement 109 (FIN 48), was issued and is effective on the last business day of the semiannual reporting period for fiscal years beginning after December 15, 2006. FIN 48 sets forth a threshold for financial statement recognition, measurement and disclosure of a tax position taken or expected to be taken on a tax return. Management is currently evaluating the impact, if any, the adoption of FIN 48 will have on the Fund's net assets, results of operations and financial statement disclosures.
In addition, in September 2006, Statement of Financial Accounting Standards No. 157, Fair Value Measurements (SFAS 157), was issued and is effective for fiscal years beginning after November 15, 2007. SFAS 157 defines fair value, establishes a framework for measuring fair value and expands disclosures about fair value measurements. Management is currently evaluating the impact the adoption of SFAS 157 will have on the Fund's financial statement disclosures.
2. Operating Policies.
Repurchase Agreements. FMR has received an Exemptive Order from the Securities and Exchange Commission (the SEC) which permits the Fund and other affiliated entities of FMR to transfer uninvested cash balances into joint trading accounts which are then invested in repurchase agreements. The Fund may also invest directly with institutions in repurchase agreements. Repurchase agreements are collateralized by government or non-government securities. Upon settlement date, collateral is held in segregated accounts with custodian banks and may be obtained in the event of a default of the counterparty. The Fund monitors, on a daily basis, the value of the collateral to ensure it is at least equal to the principal amount of the repurchase agreement (including accrued interest). In the event of a default by the counterparty, realization of the collateral proceeds could be delayed, during which time the value of the collateral may decline.
Annual Report
Notes to Financial Statements - continued
2. Operating Policies - continued
Restricted Securities. The Fund may invest in securities that are subject to legal or contractual restrictions on resale. These securities generally may be resold in transactions exempt from registration or to the public if the securities are registered. Disposal of these securities may involve time-consuming negotiations and expense, and prompt sale at an acceptable price may be difficult. Information regarding restricted securities is included at the end of the Fund's Schedule of Investments.
3. Purchases and Sales of Investments.
Purchases and sales of securities , other than short-term securities, aggregated $44,636,459 and $27,585,297, respectively.
4. Fees and Other Transactions with Affiliates.
Management Fee. FMR and its affiliates provide the Fund with investment management related services for which the Fund pays a monthly management fee. The management fee is the sum of an individual fund fee rate that is based on an annual rate of .30% of the Fund's average net assets and a group fee rate that averaged .27% during the period. The group fee rate is based upon the average net assets of all the mutual funds advised by FMR. The group fee rate decreases as assets under management increase and increases as assets under management decrease. For the period, the total annual management fee rate was .57% of the Fund's average net assets.
Transfer Agent Fees. Fidelity Investments Institutional Operations Company, Inc. (FIIOC), an affiliate of FMR, is the fund's transfer, dividend disbursing, and shareholder servicing agent. FIIOC receives an asset-based fee with respect to each class. Each class with the exception of Investor Class pays a transfer agent fee, excluding out of pocket expenses, equal to an annual rate of .07% of their month end net assets. Investor Class pays a monthly asset-based transfer agent fee of .18% of its month end net assets. The total transfer agent fees paid by each class to FIIOC, including out of pocket expenses, were as follows:
Initial Class | $ 26,702 |
Investor Class | 14,451 |
| $ 41,153 |
Accounting and Security Lending Fees. Fidelity Service Company, Inc. (FSC), an affiliate of FMR, maintains the Fund's accounting records. The accounting fee is based on the level of average net assets for the month. Under a separate contract, FSC administers the security lending program. The security lending fee is based on the number and duration of lending transactions.
Investments in Fidelity Central Funds. The Fund may invest in Fidelity Central Funds. The Fund's Schedule of Investments lists each of the Fidelity Central Funds as an investment of the Fund but does not include the underlying holdings of each Fidelity Central Fund. As an Investing Fund, the Fund indirectly bears its proportionate share of the expenses of the underlying Fidelity Central Funds. A complete unaudited list of holdings for each Fidelity Central Fund is available upon request. In addition, the financial statements of the Fidelity Central Funds, which are not covered by the Fund's Report of Independent Registered Public Accounting Firm, are available on the EDGAR Database on the SEC's web site, www.sec.gov, or upon request.
The Money Market Central Funds seek preservation of capital and current income and are managed by Fidelity Investments Money Management, Inc. (FIMM), an affiliate of FMR.
Brokerage Commissions. The Fund placed a portion of its portfolio transactions with brokerage firms which are affiliates of the investment adviser. The commissions paid to these affiliated firms were $457 for the period.
5. Committed Line of Credit.
The Fund participates with other funds managed by FMR in a $4.2 billion credit facility (the "line of credit") to be utilized for temporary or emergency purposes to fund shareholder redemptions or for other short-term liquidity purposes. The Fund has agreed to pay commitment fees on its pro rata portion of the line of credit, which amounted to $97 and is reflected in Miscellaneous Expense on the Statement of Operations. During the period, there were no borrowings on this line of credit.
6. Security Lending.
The Fund lends portfolio securities from time to time in order to earn additional income. On the settlement date of the loan, the Fund receives collateral (in the form of U.S. Treasury obligations, letters of credit and/or cash) against the loaned securities and maintains collateral in an amount not less than 100% of the market value of the loaned securities during the period of the loan. The market value of the loaned securities is determined at the
VIP Financial Services Portfolio
6. Security Lending - continued
close of business of the Fund and any additional required collateral is delivered to the Fund on the next business day. If the borrower defaults on its obligation to return the securities loaned because of insolvency or other reasons, a fund could experience delays and costs in recovering the securities loaned or in gaining access to the collateral. Any cash collateral received is invested in the Fidelity Securities Lending Cash Central Fund. The value of loaned securities and cash collateral at period end are disclosed on the Fund's Statement of Assets and Liabilities. Security lending income represents the income earned on investing cash collateral, less fees and expenses associated with the loan, plus any premium payments that may be received on the loan of certain types of securities. Security lending income is presented in the Statement of Operations as a component of income from Fidelity Central Funds. Net income from lending portfolio securities during the period amounted to $2,868.
7. Expense Reductions.
Many of the brokers with whom FMR places trades on behalf of the Fund provided services to the Fund in addition to trade execution. These services included payments of certain expenses on behalf of the Fund totaling $4,084 for the period.
8. Other.
The Fund's organizational documents provide former and current trustees and officers with a limited indemnification against liabilities arising in connection with the performance of their duties to the Fund. In the normal course of business, the Fund may also enter into contracts that provide general indemnifications. The Fund's maximum exposure under these arrangements is unknown as this would be dependent on future claims that may be made against the Fund. The risk of material loss from such claims is considered remote.
At the end of the period, FMR or its affiliates were the owners of record of 100% of the total outstanding shares of the Fund.
The United States Securities and Exchange Commission ("SEC") is conducting an investigation of FMR (covering the years 2002 to 2004) arising from gifts, gratuities and business entertainment provided by certain brokers to certain individuals who were employed on FMR's domestic equity trading desk during that period. FMR is in discussions with the SEC staff regarding the possible resolution of the matter, but as of period-end no final resolution has been reached.
In December 2006, the Independent Trustees completed their own investigation of the matter with the assistance of independent counsel. The Independent Trustees and FMR agree that, despite the absence of proof that the Fidelity mutual funds experienced diminished execution quality as a result of the improper receipt of gifts and business entertainment, the conduct at issue was serious and is worthy of redress. Accordingly, the Independent Trustees have requested and FMR has agreed to pay $42 million to Fidelity mutual funds, plus interest to be determined at the time that payment is made. A method of allocating this payment among the funds has not yet been determined. The total payment to the Fund is not anticipated to have a material impact on the Fund's net assets. In addition, FMR reimbursed related legal expenses which are recorded in accompanying Statement of Operations as an expense reduction.
9. Distributions to Shareholders.
Distributions to shareholders of each class were as follows:
| Years ended December 31, |
| 2006 | 2005 |
From net investment income | | |
Initial Class | $ 393,932 | $ 452,940 |
Investor Class | 34,680 | - |
Total | $ 428,612 | $ 452,940 |
From net realized gain | | |
Initial Class | $ 648,547 | $ - |
Investor Class | 54,758 | - |
Total | $ 703,305 | $ - |
Annual Report
Notes to Financial Statements - continued
10. Share Transactions.
Transactions for each class of shares were as follows:
| Shares | Dollars |
| Years ended December 31, | Years ended December 31, |
| 2006 | 2005 A | 2006 | 2005 A |
Initial Class | | | | |
Shares sold | 1,476,307 | 477,544 | $ 20,458,429 | $ 5,858,204 |
Reinvestment of distributions | 81,317 | 37,371 | 1,042,479 | 452,940 |
Shares redeemed | (1,015,687) | (1,403,661) | (13,691,216) | (16,611,409) |
Net increase (decrease) | 541,937 | (888,746) | $ 7,809,692 | $ (10,300,265) |
Investor Class | | | | |
Shares sold | 822,641 | 172,425 | $ 11,174,887 | $ 2,163,613 |
Reinvestment of distributions | 6,987 | - | 89,437 | - |
Shares redeemed | (99,504) | (8,040) | (1,335,869) | (96,303) |
Net increase (decrease) | 730,124 | 164,385 | $ 9,928,455 | $ 2,067,310 |
A Share transactions for Investor Class are for the period July 21, 2005 (commencement of sale of shares) to December 31, 2005.
VIP Financial Services Portfolio
Report of Independent Registered Public Accounting Firm
To the Trustees of Variable Insurance Products Fund IV and the Shareholders of VIP Financial Services Portfolio:
In our opinion, the accompanying statement of assets and liabilities, including the schedule of investments, and the related statements of operations and of changes in net assets and the financial highlights present fairly, in all material respects, the financial position of VIP Financial Services Portfolio (a fund of Variable Insurance Products Fund IV) at December 31, 2006, the results of its operations for the year then ended, the changes in its net assets for each of the two years in the period then ended and the financial highlights for each of the periods indicated, in conformity with accounting principles generally accepted in the United States of America. These financial statements and financial highlights (hereafter referred to as "financial statements") are the responsibility of the VIP Financial Services Portfolio's management; our responsibility is to express an opinion on these financial statements based on our audits. We conducted our audits of these financial statements in accordance with the standards of the Public Company Accounting Oversight Board (United States). Those standards require that we plan and perform the audit to obtain reasonable assurance about whether the financial statements are free of material misstatement. An audit includes examining, on a test basis, evidence supporting the amounts and disclosures in the financial statements, assessing the accounting principles used and significant estimates made by management, and evaluating the overall financial statement presentation. We believe that our audits, which included confirmation of securities at December 31, 2006 by correspondence with the custodian and brokers, provide a reasonable basis for our opinion.
/s/ PricewaterhouseCoopers LLP
PricewaterhouseCoopers LLP
Boston, Massachusetts
February 20, 2007
Annual Report
Trustees and Officers
The Trustees, Member of the Advisory Board, and executive officers of the trust and funds, as applicable, are listed below. The Board of Trustees governs the fund and is responsible for protecting the interests of shareholders. The Trustees are experienced executives who meet periodically throughout the year to oversee the fund's activities, review contractual arrangements with companies that provide services to the fund, and review the fund's performance. Each of the Trustees oversees 348 funds advised by FMR or an affiliate.
The Trustees hold office without limit in time except that (a) any Trustee may resign; (b) any Trustee may be removed by written instrument, signed by at least two-thirds of the number of Trustees prior to such removal; (c) any Trustee who requests to be retired or who has become incapacitated by illness or injury may be retired by written instrument signed by a majority of the other Trustees; and (d) any Trustee may be removed at any special meeting of shareholders by a two-thirds vote of the outstanding voting securities of the trust. Each Trustee who is not an interested person (as defined in the 1940 Act) (Independent Trustee), shall retire not later than the last day of the calendar year in which his or her 72nd birthday occurs. The Independent Trustees may waive this mandatory retirement age policy with respect to individual Trustees. The executive officers and Advisory Board Member hold office without limit in time, except that any officer and Advisory Board Member may resign or may be removed by a vote of a majority of the Trustees at any regular meeting or any special meeting of the Trustees. Except as indicated, each individual has held the office shown or other offices in the same company for the past five years.
The fund's Statement of Additional Information (SAI) includes more information about the Trustees. To request a free copy, call Fidelity at 1-877-208-0098.
Interested Trustees*:
Correspondence intended for each Trustee who is an interested person may be sent to Fidelity Investments, 82 Devonshire Street, Boston, Massachusetts 02109.
Name, Age; Principal Occupation |
Edward C. Johnson 3d (76) |
| Year of Election or Appointment: 1983 Mr. Johnson is Chairman of the Board of Trustees. Mr. Johnson serves as President (2006-present), Chief Executive Officer, Chairman, and a Director of FMR Corp.; Chairman and a Director of FMR; Chairman and a Director of Fidelity Research & Analysis Company (FRAC); Chairman and a Director of Fidelity Investments Money Management, Inc.; and Chairman (2001-present) and a Director of FMR Co., Inc. In addition, Mr. Johnson serves as Chairman and Director of Fidelity International Limited (FIL). |
Robert L. Reynolds (54) |
| Year of Election or Appointment: 2003 Mr. Reynolds is President and a Director of FMR (2005-present), Fidelity Investments Money Management, Inc. (2005-present), and FMR Co., Inc. (2005-present). Mr. Reynolds also serves as Vice Chairman (2006-present), a Director (2003-present), and Chief Operating Officer of FMR Corp. and a Director of Strategic Advisers, Inc. (2005-present). He also serves on the Board at Fidelity Investments Canada, Ltd. |
* Trustees have been determined to be "Interested Trustees" by virtue of, among other things, their affiliation with the trust or various entities under common control with FMR.
Independent Trustees:
Correspondence intended for each Independent Trustee (that is, the Trustees other than the Interested Trustees) may be sent to Fidelity Investments, P.O. Box 55235, Boston, Massachusetts 02205-5235.
Name, Age; Principal Occupation |
Dennis J. Dirks (58) |
| Year of Election or Appointment: 2005 Prior to his retirement in May 2003, Mr. Dirks was Chief Operating Officer and a member of the Board of The Depository Trust & Clearing Corporation (DTCC) (1999-2003). He also served as President, Chief Operating Officer, and Board member of The Depository Trust Company (DTC) (1999-2003) and President and Board member of the National Securities Clearing Corporation (NSCC) (1999-2003). In addition, Mr. Dirks served as Chief Executive Officer and Board member of the Government Securities Clearing Corporation (2001-2003) and Chief Executive Officer and Board member of the Mortgage-Backed Securities Clearing Corporation (2001-2003). Mr. Dirks also serves as a Trustee and a member of the Finance Committee of Manhattan College (2005-present) and a Trustee and a member of the Finance Committee of AHRC of Nassau County (2006-present). |
Albert R. Gamper, Jr. (64) |
| Year of Election or Appointment: 2006 Prior to his retirement in December 2004, Mr. Gamper served as Chairman of the Board of CIT Group Inc. (commercial finance). During his tenure with CIT Group Inc. Mr. Gamper served in numerous senior management positions, including Chairman (1987-1989; 1999-2001; 2002-2004), Chief Executive Officer (1987-2004), and President (1989-2002). He currently serves as a member of the Board of Directors of Public Service Enterprise Group (utilities, 2001-present), Chairman of the Board of Governors, Rutgers University (2004-present), and Chairman of the Board of Saint Barnabas Health Care System. |
George H. Heilmeier (70) |
| Year of Election or Appointment: 2004 Dr. Heilmeier is Chairman Emeritus of Telcordia Technologies (communication software and systems), where prior to his retirement, he served as company Chairman and Chief Executive Officer. He currently serves on the Boards of Directors of The Mitre Corporation (systems engineering and information technology support for the government), and HRL Laboratories (private research and development, 2004-present). He is Chairman of the General Motors Science & Technology Advisory Board and a Life Fellow of the Institute of Electrical and Electronics Engineers (IEEE). Dr. Heilmeier is a member of the Defense Science Board and the National Security Agency Advisory Board. He is also a member of the National Academy of Engineering, the American Academy of Arts and Sciences, and the Board of Overseers of the School of Engineering and Applied Science of the University of Pennsylvania. Previously, Dr. Heilmeier served as a Director of TRW Inc. (automotive, space, defense, and information technology, 1992-2002), Compaq (1994-2002), Automatic Data Processing, Inc. (ADP) (technology-based business outsourcing, 1995-2002), INET Technologies Inc. (telecommunications network surveillance, 2001-2004), and Teletech Holdings (customer management services). He is the recipient of the 2005 Kyoto Prize in Advanced Technology for his invention of the liquid crystal display, and a member of the Consumer Electronics Hall of Fame. |
James H. Keyes (66) |
| Year of Election or Appointment: 2007 Prior to his retirement in 2003, Mr. Keyes was Chairman, President, and Chief Executive Officer of Johnson Controls, Inc. (automotive supplier, 1993-2003). He currently serves as a member of the boards of LSI Logic Corporation (semiconductor technologies), Navistar International Corporation (manufacture and sale of trucks, buses, and diesel engines, 2002-present), and Pitney Bowes, Inc. (integrated mail, messaging, and document management solutions). |
Marie L. Knowles (60) |
| Year of Election or Appointment: 2001 Prior to Ms. Knowles' retirement in June 2000, she served as Executive Vice President and Chief Financial Officer of Atlantic Richfield Company (ARCO) (diversified energy, 1996-2000). From 1993 to 1996, she was a Senior Vice President of ARCO and President of ARCO Transportation Company. She served as a Director of ARCO from 1996 to 1998. She currently serves as a Director of Phelps Dodge Corporation (copper mining and manufacturing) and McKesson Corporation (healthcare service, 2002-present). Ms. Knowles is a Trustee of the Brookings Institution and the Catalina Island Conservancy and also serves as a member of the Advisory Board for the School of Engineering of the University of Southern California. |
Ned C. Lautenbach (62) |
| Year of Election or Appointment: 2000 Mr. Lautenbach is Chairman of the Independent Trustees (2006-present). Mr. Lautenbach has been a partner of Clayton, Dubilier & Rice, Inc. (private equity investment firm) since September 1998. Previously, Mr. Lautenbach was with the International Business Machines Corporation (IBM) from 1968 until his retirement in 1998. Mr. Lautenbach serves as a Director of Sony Corporation (2006-present) and Eaton Corporation (diversified industrial) as well as the Philharmonic Center for the Arts in Naples, Florida. He also is a member of the Board of Trustees of Fairfield University (2005-present), as well as a member of the Council on Foreign Relations. |
Cornelia M. Small (62) |
| Year of Election or Appointment: 2005 Ms. Small is a member (2000-present) and Chairperson (2002-present) of the Investment Committee, and a member (2002-
present) of the Board of Trustees of Smith College. Previously, she served as Chief Investment Officer (1999-2000), Director of Global Equity Investments (1996-1999), and a member of the Board of Directors of Scudder, Stevens & Clark (1990-1997) and Scudder Kemper Investments (1997-1999). In addition, Ms. Small served as Co-Chair (2000-2003) of the Annual Fund for the Fletcher School of Law and Diplomacy. |
William S. Stavropoulos (67) |
| Year of Election or Appointment: 2001 Mr. Stavropoulos is Chairman Emeritus of the Board of Directors of The Dow Chemical Company. Since joining The Dow Chemical Company in 1967, Mr. Stavropoulos served in numerous senior management positions, including President (1993-2000; 2002-2003), CEO (1995-2000; 2002-2004), and Chairman of the Executive Committee (2000-2004). Currently, he is a Director of NCR Corporation (data warehousing and technology solutions), BellSouth Corporation (telecommunications), Chemical Financial Corporation, Maersk Inc. (industrial conglomerate, 2002-present), and Metalmark Capital (private equity investment firm, 2005-present). He also serves as a member of the Board of Trustees of the American Enterprise Institute for Public Policy Research. In addition, Mr. Stavropoulos is a member of The Business Council, J.P. Morgan International Council and the University of Notre Dame Advisory Council for the College of Science. |
Kenneth L. Wolfe (67) |
| Year of Election or Appointment: 2005 Prior to his retirement in 2001, Mr. Wolfe was Chairman and Chief Executive Officer of Hershey Foods Corporation (1993-2001). He currently serves as a member of the boards of Adelphia Communications Corporation (2003-present), Bausch & Lomb, Inc., and Revlon Inc. (2004-present). |
Advisory Board Member and Executive Officers:
Correspondence intended for each executive officer and Mr. Lynch may be sent to Fidelity Investments, 82 Devonshire Street, Boston, Massachusetts 02109.
Name, Age; Principal Occupation |
Peter S. Lynch (62) |
| Year of Election or Appointment: 2003 Member of the Advisory Board of Variable Insurance Products Fund IV. Mr. Lynch is Vice Chairman and a Director of FMR, and Vice Chairman (2001-present) and a Director of FMR Co., Inc. Previously, Mr. Lynch served as a Trustee of the Fidelity funds (1990-2003). In addition, he serves as a Trustee of Boston College and as the Chairman of the Inner-City Scholarship Fund. |
Kimberley H. Monasterio (43) |
| Year of Election or Appointment: 2007 President and Treasurer of VIP Financial Services. Ms. Monasterio also serves as President and Treasurer of other Fidelity funds (2007-present) and is an employee of FMR (2004-present). Previously, Ms. Monasterio served as Deputy Treasurer of the Fidelity funds (2004-2006). Before joining Fidelity Investments, Ms. Monasterio served as Treasurer (2000-2004) and Chief Financial Officer (2002-2004) of the Franklin Templeton Funds and Senior Vice President of Franklin Templeton Services, LLC (2000-2004). |
Boyce I. Greer (50) |
| Year of Election or Appointment: 2005 Vice President of VIP Financial Services. Mr. Greer also serves as Vice President of certain Equity Funds (2005-present), certain Asset Allocation Funds (2005-present), Fixed-Income Funds (2006-present), and Money Market Funds (2006-present). Mr. Greer is also a Trustee of other investment companies advised by FMR (2003-present). He is an Executive Vice President of FMR (2005-
present) and FMR Co., Inc. (2005-present), and Senior Vice President of Fidelity Investments Money Management, Inc. (2006-
present). Previously, Mr. Greer served as a Director and Managing Director of Strategic Advisers, Inc. (2002-2005), and Executive Vice President (2000-2002) and Money Market Group Leader (1997-2002) of the Fidelity Investments Fixed Income Division. He also served as Vice President of Fidelity's Money Market Funds (1997-2002), Senior Vice President of FMR (1997-2002), and Vice President of FIMM (1998-2002). |
Eric D. Roiter (58) |
| Year of Election or Appointment: 2001 Secretary of VIP Financial Services. He also serves as Secretary of other Fidelity funds; Vice President, General Counsel, and Secretary of FMR Co., Inc. (2001-present) and FMR; Assistant Secretary of Fidelity Management & Research (U.K.) Inc. (2001-present), Fidelity Research & Analysis Company (2001-present), and Fidelity Investments Money Management, Inc. (2001-present). Mr. Roiter is an Adjunct Member, Faculty of Law, at Boston College Law School (2003-present). Previously, Mr. Roiter served as Vice President and Secretary of Fidelity Distributors Corporation (FDC) (1998-2005). |
Stuart Fross (47) |
| Year of Election or Appointment: 2003 Assistant Secretary of VIP Financial Services. Mr. Fross also serves as Assistant Secretary of other Fidelity funds (2003-present), Vice President and Secretary of FDC (2005-present), and is an employee of FMR. |
R. Stephen Ganis (40) |
| Year of Election or Appointment: 2006 Anti-Money Laundering (AML) officer of VIP Financial Services. Mr. Ganis also serves as AML officer of other Fidelity funds (2006-present) and FMR Corp. (2003-present). Before joining Fidelity Investments, Mr. Ganis practiced law at Goodwin Procter, LLP (2000-2002). |
Joseph B. Hollis (58) |
| Year of Election or Appointment: 2006 Chief Financial Officer of VIP Financial Services. Mr. Hollis also serves as Chief Financial Officer of other Fidelity funds. Mr. Hollis is President of Fidelity Pricing and Cash Management Services (FPCMS) (2005-present). Mr. Hollis also serves as President and Director of Fidelity Service Company, Inc. (2006-present). Previously, Mr. Hollis served as Senior Vice President of Cash Management Services (1999-2002) and Investment Management Operations (2002-2005). |
Kenneth A. Rathgeber (59) |
| Year of Election or Appointment: 2004 Chief Compliance Officer of VIP Financial Services. Mr. Rathgeber also serves as Chief Compliance Officer of other Fidelity funds (2004-present) and Executive Vice President of Risk Oversight for Fidelity Investments (2002-present). He is Chief Compliance Officer of FMR (2005-present), FMR Co., Inc. (2005-present), Fidelity Management & Research (U.K.) Inc. (2005-present), Fidelity Research & Analysis Company (2005-present), Fidelity Investments Money Management, Inc. (2005-present), and Strategic Advisers, Inc. (2005-present). Previously, Mr. Rathgeber served as Executive Vice President and Chief Operating Officer for Fidelity Investments Institutional Services Company, Inc. (1998-2002). |
Bryan A. Mehrmann (45) |
| Year of Election or Appointment: 2005 Deputy Treasurer of VIP Financial Services. Mr. Mehrmann also serves as Deputy Treasurer of other Fidelity funds (2005-present) and is an employee of FMR. Previously, Mr. Mehrmann served as Vice President of Fidelity Investments Institutional Services Group (FIIS)/Fidelity Investments Institutional Operations Corporation, Inc. (FIIOC) Client Services (1998-2004). |
Kenneth B. Robins (37) |
| Year of Election or Appointment: 2005 Deputy Treasurer of VIP Financial Services. Mr. Robins also serves as Deputy Treasurer of other Fidelity funds (2005-present) and is an employee of FMR (2004-present). Before joining Fidelity Investments, Mr. Robins worked at KPMG LLP, where he was a partner in KPMG's department of professional practice (2002-2004) and a Senior Manager (1999-2000). In addition, Mr. Robins served as Assistant Chief Accountant, United States Securities and Exchange Commission (2000-2002). |
Robert G. Byrnes (40) |
| Year of Election or Appointment: 2005 Assistant Treasurer of VIP Financial Services. Mr. Byrnes also serves as Assistant Treasurer of other Fidelity funds (2005-present) and is an employee of FMR (2005-present). Previously, Mr. Byrnes served as Vice President of FPCMS (2003-2005). Before joining Fidelity Investments, Mr. Byrnes worked at Deutsche Asset Management where he served as Vice President of the Investment Operations Group (2000-2003). |
John H. Costello (60) |
| Year of Election or Appointment: 1991 Assistant Treasurer of VIP Financial Services. Mr. Costello also serves as Assistant Treasurer of other Fidelity funds and is an employee of FMR. |
Peter L. Lydecker (52) |
| Year of Election or Appointment: 2004 Assistant Treasurer of VIP Financial Services. Mr. Lydecker also serves as Assistant Treasurer of other Fidelity funds (2004) and is an employee of FMR. |
Mark Osterheld (51) |
| Year of Election or Appointment: 2002 Assistant Treasurer of VIP Financial Services. Mr. Osterheld also serves as Assistant Treasurer of other Fidelity funds (2002) and is an employee of FMR. |
Gary W. Ryan (48) |
| Year of Election or Appointment: 2005 Assistant Treasurer of VIP Financial Services. Mr. Ryan also serves as Assistant Treasurer of other Fidelity funds (2005-present) and is an employee of FMR (2005-present). Previously, Mr. Ryan served as Vice President of Fund Reporting in FPCMS (1999-2005). |
Salvatore Schiavone (41) |
| Year of Election or Appointment: 2005 Assistant Treasurer of VIP Financial Services. Mr. Schiavone also serves as Assistant Treasurer of other Fidelity funds (2005-present) and is an employee of FMR (2005-present). Before joining Fidelity Investments, Mr. Schiavone worked at Deutsche Asset Management, where he most recently served as Assistant Treasurer (2003-2005) of the Scudder Funds and Vice President and Head of Fund Reporting (1996-2003). |
VIP Financial Services Portfolio
Distributions
The Board of Trustees of VIP Financial Services Portfolio voted to pay to shareholders of record at the opening of business on record date, the following distributions per share derived from capital gains realized from sales of portfolio securities, and dividends derived from net investment income:
| Pay Date | Record Date | Dividends | Capital Gains |
Initial Class | 02/09/2007 | 02/09/2007 | $.135 | $.857 |
Investor Class | 02/09/2007 | 02/09/2007 | $.129 | $.857 |
The fund hereby designates as a capital gain dividend with respect to the taxable year ended December 31 2006, $2,924,779, or, if subsequently determined to be different, the net capital gain of such year.
Initial Class and Investor Class designates 100% of the dividends distributed in February, 2006 as indicated in the Corporate Qualifying memo distributed by the Tax department, respectively during the fiscal year as qualifying for the dividends-received deduction for corporate shareholders.
The fund will notify shareholders in January 2007 of amounts for use in preparing 2006 income tax returns.
Annual Report
Proxy Voting Results
A special meeting of the fund's shareholders was held on September 20, 2006. The results of votes taken among shareholders on the proposal before them are reported below. Each vote reported represents one dollar of net asset value held on the record date for the meeting.
PROPOSAL 1 |
To elect a Board of Trustees.A |
| # of
Votes | % of
Votes |
Dennis J. Dirks |
Affirmative | 92,459,317.52 | 96.102 |
Withheld | 3,749,837.05 | 3.898 |
TOTAL | 96,209,154.57 | 100.000 |
Albert R. Gamper, Jr. |
Affirmative | 92,260,598.99 | 95.896 |
Withheld | 3,948,555.58 | 4.104 |
TOTAL | 96,209,154.57 | 100.000 |
Robert M. Gates |
Affirmative | 92,315,480.72 | 95.953 |
Withheld | 3,893,673.85 | 4.047 |
TOTAL | 96,209,154.57 | 100.000 |
George H. Heilmeier |
Affirmative | 92,208,255.41 | 95.841 |
Withheld | 4,000,899.16 | 4.159 |
TOTAL | 96,209,154.57 | 100.000 |
Edward C. Johnson 3d |
Affirmative | 91,928,267.76 | 95.550 |
Withheld | 4,280,886.81 | 4.450 |
TOTAL | 96,209,154.57 | 100.000 |
Stephen P. Jonas |
Affirmative | 92,457,628.76 | 96.101 |
Withheld | 3,751,525.81 | 3.899 |
TOTAL | 96,209,154.57 | 100.000 |
James H. KeyesB |
Affirmative | 92,432,729.82 | 96.075 |
Withheld | 3,776,424.75 | 3.925 |
TOTAL | 96,209,154.57 | 100.000 |
Marie L. Knowles |
Affirmative | 92,398,847.52 | 96.040 |
Withheld | 3,810,307.05 | 3.960 |
TOTAL | 96,209,154.57 | 100.000 |
Ned C. Lautenbach |
Affirmative | 92,423,184.47 | 96.065 |
Withheld | 3,785,970.10 | 3.935 |
TOTAL | 96,209,154.57 | 100.000 |
William O. McCoy |
Affirmative | 92,086,293.90 | 95.715 |
Withheld | 4,122,860.67 | 4.285 |
TOTAL | 96,209,154.57 | 100.000 |
| # of
Votes | % of
Votes |
Robert L. Reynolds |
Affirmative | 92,439,032.86 | 96.081 |
Withheld | 3,770,121.71 | 3.919 |
TOTAL | 96,209,154.57 | 100.000 |
Cornelia M. Small |
Affirmative | 92,415,567.29 | 96.057 |
Withheld | 3,793,587.28 | 3.943 |
TOTAL | 96,209,154.57 | 100.000 |
William S. Stavropoulos |
Affirmative | 92,135,400.08 | 95.766 |
Withheld | 4,073,754.49 | 4.234 |
TOTAL | 96,209,154.57 | 100.000 |
Kenneth L. Wolfe |
Affirmative | 92,445,865.31 | 96.088 |
Withheld | 3,763,289.26 | 3.912 |
TOTAL | 96,209,154.57 | 100.000 |
A Denotes trust-wide proposal and voting results. B Effective on or about January 1, 2007. |
VIP Financial Services Portfolio
Board Approval of Investment Advisory Contracts and Management Fees
VIP Financial Services Portfolio
Each year, typically in July, the Board of Trustees, including the Independent Trustees (together, the Board), votes on the renewal of the management contract and sub-advisory agreements (together, the Advisory Contracts) for the fund. The Board, assisted by the advice of fund counsel and Independent Trustees' counsel, requests and considers a broad range of information throughout the year.
The Board meets regularly each month except August and takes into account throughout the year matters bearing on Advisory Contracts. The Board, acting directly and through its separate committees, considers at each of its meetings factors that are relevant to the annual renewal of the fund's Advisory Contracts, including the services and support provided to the fund and its shareholders. At the time of the renewal, the Board had 12 standing committees, each composed of Independent Trustees with varying backgrounds, to which the Board has assigned specific subject matter responsibilities in order to enhance effective decision-making by the Board. Each committee has adopted a written charter outlining the structure and purposes of the committee. One such committee, the Equity Contract Committee, meets periodically as needed throughout the year to consider matters specifically related to the annual renewal of Advisory Contracts. The committee requests and receives information on, and makes recommendations to the Independent Trustees concerning, the approval and annual review of the Advisory Contracts.
At its July 2006 meeting, the Board of Trustees, including the Independent Trustees, unanimously determined to renew the Advisory Contracts for the fund. In reaching its determination, the Board considered all factors it believed relevant, including (i) the nature, extent, and quality of the services to be provided to the fund and its shareholders (including the investment performance of the fund); (ii) the competitiveness of the management fee and total expenses of the fund; (iii) the total costs of the services to be provided by and the profits to be realized by the investment adviser and its affiliates from the relationship with the fund; (iv) the extent to which economies of scale would be realized as the fund grows; and (v) whether fee levels reflect these economies of scale, if any, for the benefit of fund shareholders.
In determining whether to renew the Advisory Contracts for the fund, the Board ultimately reached a determination, with the assistance of fund counsel and Independent Trustees' counsel, that the renewal of the Advisory Contracts and the compensation to be received by Fidelity under the management contract is consistent with Fidelity's fiduciary duty under applicable law. In addition to evaluating the specific factors noted above, the Board, in reaching its determination, is aware that shareholders in the fund have a broad range of investment choices available to them, including a wide choice among mutual funds offered by competitors to Fidelity, and that the fund's shareholders, with the opportunity to review and weigh the disclosure provided by the fund in its prospectus and other public disclosures, have chosen to invest in this fund, managed by Fidelity.
Nature, Extent, and Quality of Services Provided. The Board considered staffing within the investment adviser, FMR, and the sub-advisers (together, the Investment Advisers), including the background of the fund's portfolio manager and the fund's investment objective and discipline. The Independent Trustees also had discussions with senior management of Fidelity's investment operations and investment groups. The Board considered the structure of the portfolio manager compensation program and whether this structure provides appropriate incentives.
Resources Dedicated to Investment Management and Support Services. The Board reviewed the size, education, and experience of the Investment Advisers' investment staff, their use of technology, and the Investment Advisers' approach to recruiting, training, and retaining portfolio managers and other research, advisory, and management personnel. The Board considered Fidelity's extensive global research capabilities that enable the Investment Advisers to aggregate data from various sources in an effort to produce positive investment results. The Board noted that Fidelity's analysts have access to a variety of technological tools that enable them to perform both fundamental and quantitative analysis and to specialize in various disciplines. The Board also considered that Fidelity's portfolio managers and analysts have access to daily portfolio attribution that allows for monitoring of a fund's portfolio, as well as an electronic communication system that provides immediate real-time access to research concerning issuers and credit enhancers.
Shareholder and Administrative Services. The Board considered (i) the nature, extent, quality, and cost of administrative, distribution, and shareholder services performed by the Investment Advisers and their affiliates under the Advisory Contracts and under separate agreements covering transfer agency, pricing and bookkeeping, and securities lending services for the fund; (ii) the nature and extent of the Investment Advisers' supervision of third party service providers, principally custodians and subcustodians; and (iii) the resources devoted to, and the record of compliance with, the fund's compliance policies and procedures. The Board reviewed the allocation of fund brokerage, including allocations to brokers affiliated with the Investment Advisers, the use of brokerage commissions to pay fund expenses, and the use of "soft" commission dollars to pay for research services. The Board also considered that Fidelity voluntarily pays for market data out of its own resources.
The Board noted that the growth of fund assets across the complex allows Fidelity to reinvest in the development of services designed to enhance the value or convenience of the Fidelity funds as investment vehicles. These services include 24-hour access to account information and market information through phone representatives and over the Internet, and investor education materials and asset allocation tools.
Investment in a Large Fund Family. The Board considered the benefits to shareholders of investing in a Fidelity fund, including the benefits of investing in a fund that is part of a large family of funds offering a variety of investment disciplines and providing for a large variety of mutual fund investor services. The Board noted that, since the last Advisory Contract renewals in July 2005, Fidelity has taken a number of actions that benefited particular funds, including (i) dedicating additional resources to investment research and to restructure the investment research teams; (ii) voluntarily entering into contractual arrangements with certain brokers pursuant to which Fidelity pays for research products and services separately out of its own resources, rather than bundling with fund commissions; (iii) launching the Fidelity Advantage Class of its five Spartan stock index funds and three Spartan bond index funds, which is a lower-fee class available to shareholders with higher account balances; (iv) contractually agreeing to impose expense limitations on Fidelity U.S. Bond Index Fund and reducing the fund's initial investment minimum; and (v) offering shareholders of each of the Fidelity Institutional Money Market Funds the privilege of exchanging shares of the fund for shares of other Fidelity funds.
Annual Report
Board Approval of Investment Advisory Contracts and Management Fees - continued
Investment Performance and Compliance. The Board considered whether the fund has operated within its investment objective, as well as its record of compliance with its investment restrictions. It also reviewed the fund's absolute investment performance for Initial Class, as well as the fund's relative investment performance for Initial Class measured against (i) a Goldman Sachs index that reflects the market sector in which the fund invests, and (ii) a peer group of mutual funds over multiple periods. Because the fund had been in existence less than five calendar years, the following charts considered by the Board show, over the one- and three-year periods ended December 31, 2005, the cumulative total returns of Initial Class of the fund, the cumulative total returns of a Goldman Sachs index ("benchmark"), and a range of cumulative total returns of a peer group of mutual funds identified by Lipper Inc. as having an investment objective similar to that of the fund. (Investor Class of the fund had less than one year of performance as of December 31, 2005.) The box within each chart shows the 25th percentile return (bottom of box) and the 75th percentile return (top of box) of the Lipper peer group. Returns shown above the box are in the first quartile and returns shown below the box are in the fourth quartile. The percentage beaten number noted below each chart corresponds to the percentile box and represents the percentage of funds in the Lipper peer group whose performance was equal to or lower than that of Initial Class.
VIP Financial Services Portfolio
The Board reviewed the fund's relative investment performance against its Lipper peer group and stated that the performance of Initial Class of the fund was in the second quartile for the one-year period and the third quartile for the three-year period. The Board noted that FMR does not consider that Lipper peer group to be a meaningful comparison for the fund, however, because the peer group includes funds that focus on different industries and sectors than the fund. The Board also stated that the investment performance of the fund was lower than its benchmark for all the periods shown. In the absence of a meaningful peer group comparison for the fund and in consideration of the fund's exposure to a narrow market sector, the Board focused its review on the fund's relative investment performance measured against its benchmark. In light of that comparison, the Board discussed with FMR actions to be taken by FMR to improve the fund's below-benchmark performance.
The Board considered that FMR has taken steps to refocus and strengthen equity research, equity portfolio management, and compliance. The Board noted with favor FMR's reorganization of its senior management team in 2005 and FMR's dedication of additional resources to investment research, and participated in the process that led to those changes.
Based on its review, and giving particular weight to the nature and quality of the resources dedicated by the Investment Advisers to maintain and improve relative performance, the Board concluded that the nature, extent, and quality of the services provided to the fund will benefit the fund's shareholders, particularly in light of the Board's view that the fund's shareholders benefit from investing in a fund that is part of a large family of funds offering a variety of investment disciplines and services.
Competitiveness of Management Fee and Total Fund Expenses. The Board considered the fund's management fee and total expenses compared to "mapped groups" of competitive funds and classes. Fidelity creates "mapped groups" by combining similar Lipper investment objective categories that have comparable management fee characteristics. Combining Lipper investment objective categories aids the Board's management fee and total expense comparisons by broadening the competitive group used for comparison and by reducing the number of universes to which various Fidelity funds are compared.
VIP Financial Services Portfolio
The Board considered two proprietary management fee comparisons for the 12-month (or shorter) periods shown in the chart below. The group of Lipper funds used by the Board for management fee comparisons is referred to below as the "Total Mapped Group" and, for the reasons explained above, is broader than the Lipper peer group used by the Board for performance comparisons. The Total Mapped Group comparison focuses on a fund's standing relative to the total universe of comparable funds available to investors, in terms of gross management fees before expense reimbursements or caps. "TMG %" represents the percentage of funds in the Total Mapped Group that had management fees that were lower than the fund's. For example, a TMG % of 8% means that 92% of the funds in the Total Mapped Group had higher management fees than the fund. The "Asset-Size Peer Group" (ASPG) comparison focuses on a fund's standing relative to non-Fidelity funds similar in size to the fund within the Total Mapped Group. The ASPG represents at least 15% of the funds in the Total Mapped Group with comparable asset size and management fee characteristics, subject to a minimum of 50 funds (or all funds in the Total Mapped Group if fewer than 50). Additional information, such as the ASPG quartile in which the fund's management fee ranked, is also included in the chart and considered by the Board.
VIP Financial Services Portfolio
The Board noted that the fund's management fee ranked below the median of its Total Mapped Group and below the median of its ASPG for 2005.
Based on its review, the Board concluded that the fund's management fee was fair and reasonable in light of the services that the fund receives and the other factors considered.
In its review of each class's total expenses, the Board considered the fund's management fee as well as other fund or class expenses, as applicable, such as transfer agent fees, pricing and bookkeeping fees, and custodial, legal, and audit fees. The Board also noted the effects of any waivers and reimbursements on fees and expenses. As part of its review, the Board also considered current and historical total expenses of each class of the fund compared to competitive fund median expenses. Each class of the fund is compared to those funds and classes in the Total Mapped Group (used by the Board for management fee comparisons) that have a similar sales load structure.
The Board noted that the total expenses of each class ranked below its competitive median for 2005.
In its review of total expenses, the Board also considered Fidelity fee structures and other information on clients that FMR and its affiliates service in other competitive markets, such as other mutual funds advised or subadvised by FMR or its affiliates, pension plan clients, and other institutional clients.
Based on its review, the Board concluded that the total expenses of each class of the fund were reasonable in light of the services that the fund and its shareholders receive and the other factors considered.
Costs of the Services and Profitability. The Board considered the revenues earned and the expenses incurred by Fidelity in conducting the business of developing, marketing, distributing, managing, administering and servicing the fund and its shareholders. The Board also considered the level of Fidelity's profits in respect of all the Fidelity funds.
Annual Report
Board Approval of Investment Advisory Contracts and Management Fees - continued
On an annual basis, FMR presents to the Board Fidelity's profitability for the fund. Fidelity calculates the profitability for each fund, as well as aggregate profitability for groups of Fidelity funds and all Fidelity funds, using a series of detailed revenue and cost allocation methodologies which originate with the audited books and records of Fidelity. The Audit Committee of the Board reviews any significant changes from the prior year's methodologies.
PricewaterhouseCoopers LLP (PwC), independent registered accounting firm and auditor to Fidelity and certain Fidelity funds, has been engaged annually by the Board as part of the Board's assessment of the results of Fidelity's profitability analysis. PwC's engagement includes the review and assessment of Fidelity's methodologies used in determining the revenues and expenses attributable to Fidelity's mutual fund business, and completion of agreed-upon procedures surrounding the mathematical accuracy of fund profitability and its conformity to allocation methodologies. After considering PwC's reports issued under the engagement and information provided by Fidelity, the Board believes that while other allocation methods may also be reasonable, Fidelity's profitability methodologies are reasonable in all material respects.
The Board has also reviewed Fidelity's non-fund businesses and any fall-out benefits related to the mutual fund business as well as cases where Fidelity's affiliates may benefit from or be related to the fund's business.
The Board considered the costs of the services provided by and the profits realized by Fidelity in connection with the operation of the fund and determined that the amount of profit is a fair entrepreneurial profit for the management of the fund.
Economies of Scale. The Board considered whether there have been economies of scale in respect of the management of the Fidelity funds, whether the Fidelity funds (including the fund) have appropriately benefited from any such economies of scale, and whether there is potential for realization of any further economies of scale. The Board considered the extent to which the fund will benefit from economies of scale through increased services to the fund, through waivers or reimbursements, or through fee or expense reductions.
The Board recognized that the fund's management contract incorporates a "group fee" structure, which provides for lower fee rates as total fund assets under FMR's management increase, and for higher fee rates as total fund assets under FMR's management decrease. The Board considered that the group fee is designed to deliver the benefits of economies of scale to fund shareholders when total fund assets increase, even if assets of any particular fund are unchanged or have declined, because some portion of Fidelity's costs are attributable to services provided to all Fidelity funds, and all funds benefit if those costs can be allocated among more assets. The Board concluded that, given the group fee structure, fund shareholders will achieve a certain level of economies of scale as assets under FMR's management increase at the fund complex level, regardless of whether Fidelity achieves any such economies of scale.
The Board further concluded that any potential economies of scale are being shared between fund shareholders and Fidelity in an appropriate manner.
Additional Information Requested by the Board. In order to develop fully the factual basis for consideration of the Advisory Contracts, the Board requested additional information on several topics, including (i) Fidelity's fund profitability methodology and profitability trends within certain funds; (ii) portfolio manager compensation; (iii) the extent to which any economies of scale exist and are shared between the funds and Fidelity; (iv) the total expenses of certain funds and classes relative to competitors, including the extent to which the expenses of certain funds have been or could be capped; (v) fund performance trends; and (vi) Fidelity's fee structures, including use of performance fees.
Based on its evaluation of all of the conclusions noted above, and after considering all material factors, the Board ultimately concluded that the advisory fee structures are fair and reasonable, and that the fund's Advisory Contracts should be renewed.
VIP Financial Services Portfolio
Annual Report
Investment Adviser
Fidelity Management & Research Company
Boston, MA
Investment Sub-Advisers
FMR Co., Inc.
Fidelity Management & Research (U.K.) Inc.
Fidelity Research & Analysis Company (formerly Fidelity
Management & Research (Far East) Inc.)
Fidelity Investments Japan Limited
Fidelity International Investment Advisors
Fidelity International Investment Advisors
(U.K.) Limited
General Distributor
Fidelity Distributors Corporation
Boston, MA
Transfer and Service Agents
Fidelity Investments Institutional Operations Company, Inc.
Boston, MA
Fidelity Service Company, Inc.
Boston, MA
Custodian
JPMorgan Chase Bank
New York, NY
VFSIC-ANN-0207
1.817367.101
Fidelity® Variable Insurance Products:
Freedom Funds -
Income, 2005, 2010, 2015, 2020, 2025, 2030
Annual Report
December 31, 2006
(2_fidelity_logos) (Registered_Trademark)
Contents
To view a fund's proxy voting guidelines and proxy voting record for the 12-month period ended June 30, visit www.fidelity.com/proxyvotingresults or visit the Securities and Exchange Commission's (SEC) web site at www.sec.gov. You may also call 1-877-208-0098 to request a free copy of the proxy voting guidelines.
Fidelity Variable Insurance Products are separate account options which are purchased through a variable insurance contract.
Standard & Poor's, S&P and S&P 500 are registered service marks of The McGraw-Hill Companies, Inc. and have been licensed for use by Fidelity Distributors Corporation.
Other third party marks appearing herein are the property of their respective owners.
All other marks appearing herein are registered or unregistered trademarks or service marks of FMR Corp. or an affiliated company.
This report and the financial statements contained herein are submitted for the general information of the shareholders of the fund. This report is not authorized for distribution to prospective investors in the fund unless preceded or accompanied by an effective prospectus.
A fund files its complete schedule of portfolio holdings with the SEC for the first and third quarters of each fiscal year on Form N-Q. Forms N-Q are available on the SEC's web site at http://www.sec.gov. A fund's Forms N-Q may be reviewed and copied at the SEC's Public Reference Room in Washington, DC. Information regarding the operation of the SEC's Public Reference Room may be obtained by calling 1-800-SEC-0330. For a complete list of a fund's portfolio holdings, view the most recent quarterly holdings report, semiannual report, or annual report on Fidelity's web site at http://www.advisor.fidelity.com.
NOT FDIC INSURED · MAY LOSE VALUE · NO BANK GUARANTEE
Neither the fund nor Fidelity Distributors Corporation is a bank.
VIP Freedom Funds Portfolio
VIP Freedom Income Portfolio
Performance: The Bottom Line
Average annual total return reflects the change in the value of an investment, assuming reinvestment of the class' dividend income and capital gains (the profits earned upon the sale of securities that have grown in value) and assuming a constant rate of performance each year. During periods of reimbursement by Fidelity, a fund's total return will be greater than it would be had the reimbursement not occurred. Performance numbers are net of all underlying fund operating expenses, but do not include any insurance charges imposed by your insurance company's separate account. If performance information included the effect of these additional charges, the total returns would have been lower. How a fund did yesterday is no guarantee of how it will do tomorrow.
Average Annual Total Returns
Periods ended December 31, 2006 | Past 1
year | Life of FundA |
VIP Freedom Income - Initial Class | 6.94% | 6.88% |
A From April 26, 2005.
$10,000 Over Life of Fund
Let's say hypothetically that $10,000 was invested in VIP Freedom Income Portfolio - Initial Class on April 26, 2005, when the fund started. The chart shows how the value of your investment would have changed, and also shows how the Lehman Brothers Aggregate Bond Index performed over the same period.
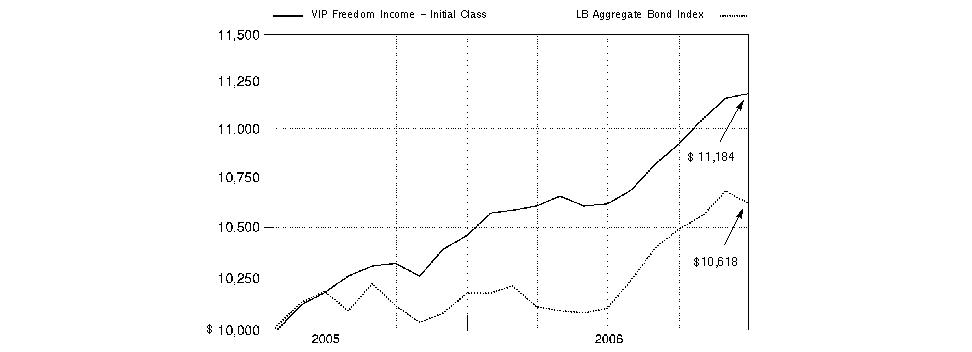
Annual Report
VIP Freedom 2005 Portfolio
Performance: The Bottom Line
Average annual total return reflects the change in the value of an investment, assuming reinvestment of the class' dividend income and capital gains (the profits earned upon the sale of securities that have grown in value) and assuming a constant rate of performance each year. During periods of reimbursement by Fidelity, a fund's total return will be greater than it would be had the reimbursement not occurred. Performance numbers are net of all underlying fund operating expenses, but do not include any insurance charges imposed by your insurance company's separate account. If performance information included the effect of these additional charges, the total returns would have been lower. How a fund did yesterday is no guarantee of how it will do tomorrow.
Average Annual Total Returns
Periods ended December 31, 2006 | Past 1
year | Life of FundA |
VIP Freedom 2005 - Initial Class | 9.59% | 10.52% |
A From April 26, 2005.
$10,000 Over Life of Fund
Let's say hypothetically that $10,000 was invested in VIP Freedom 2005 Portfolio - Initial Class on April 26, 2005, when the fund started. The chart shows how the value of your investment would have changed, and also shows how the Lehman Brothers Aggregate Bond Index performed over the same period.

VIP Freedom Funds Portfolio
VIP Freedom 2010 Portfolio
Performance: The Bottom Line
Average annual total return reflects the change in the value of an investment, assuming reinvestment of the class' dividend income and capital gains (the profits earned upon the sale of securities that have grown in value) and assuming a constant rate of performance each year. During periods of reimbursement by Fidelity, a fund's total return will be greater than it would be had the reimbursement not occurred. Performance numbers are net of all underlying fund operating expenses, but do not include any insurance charges imposed by your insurance company's separate account. If performance information included the effect of these additional charges, the total returns would have been lower. How a fund did yesterday is no guarantee of how it will do tomorrow.
Average Annual Total Returns
Periods ended December 31, 2006 | Past 1
year | Life of FundA |
VIP Freedom 2010 - Initial Class | 9.82% | 10.88% |
A From April 26, 2005.
$10,000 Over Life of Fund
Let's say hypothetically that $10,000 was invested in VIP Freedom 2010 Portfolio - Initial Class on April 26, 2005, when the fund started. The chart shows how the value of your investment would have changed, and also shows how the Lehman Brothers Aggregate Bond Index performed over the same period.

Annual Report
VIP Freedom 2015 Portfolio
Performance: The Bottom Line
Average annual total return reflects the change in the value of an investment, assuming reinvestment of the class' dividend income and capital gains (the profits earned upon the sale of securities that have grown in value) and assuming a constant rate of performance each year. During periods of reimbursement by Fidelity, a fund's total return will be greater than it would be had the reimbursement not occurred. Performance numbers are net of all underlying fund operating expenses, but do not include any insurance charges imposed by your insurance company's separate account. If performance information included the effect of these additional charges, the total returns would have been lower. How a fund did yesterday is no guarantee of how it will do tomorrow.
Average Annual Total Returns
Periods ended December 31, 2006 | Past 1
year | Life of FundA |
VIP Freedom 2015 - Initial Class | 11.04% | 12.69% |
A From April 26, 2005.
$10,000 Over Life of Fund
Let's say hypothetically that $10,000 was invested in VIP Freedom 2015 Portfolio - Initial Class on April 26, 2005, when the fund started. The chart shows how the value of your investment would have changed, and also shows how the Standard & Poor's 500SM (S&P 500®) Index performed over the same period.
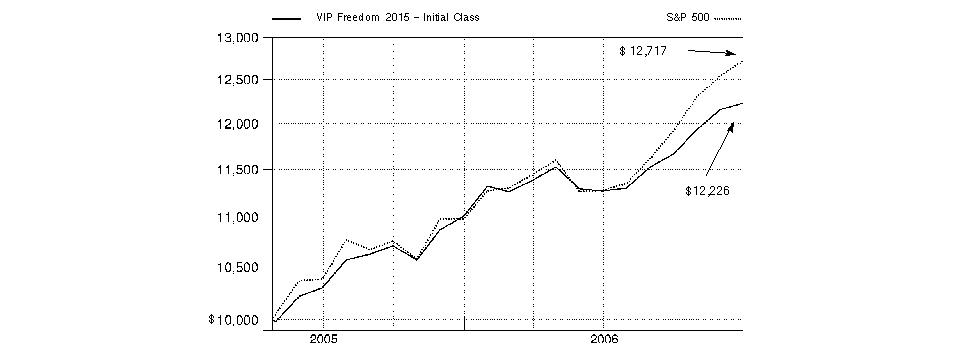
VIP Freedom Funds Portfolio
VIP Freedom 2020 Portfolio
Performance: The Bottom Line
Average annual total return reflects the change in the value of an investment, assuming reinvestment of the class' dividend income and capital gains (the profits earned upon the sale of securities that have grown in value) and assuming a constant rate of performance each year. During periods of reimbursement by Fidelity, a fund's total return will be greater than it would be had the reimbursement not occurred. Performance numbers are net of all underlying fund operating expenses, but do not include any insurance charges imposed by your insurance company's separate account. If performance information included the effect of these additional charges, the total returns would have been lower. How a fund did yesterday is no guarantee of how it will do tomorrow.
Average Annual Total Returns
Periods ended December 31, 2006 | Past 1
year | Life of FundA |
VIP Freedom 2020 - Initial Class | 11.95% | 13.99% |
A From April 26, 2005.
$10,000 Over Life of Fund
Let's say hypothetically that $10,000 was invested in VIP Freedom 2020 Portfolio - Initial Class on April 26, 2005, when the fund started. The chart shows how the value of your investment would have changed, and also shows how the Standard & Poor's 500SM (S&P 500®) Index performed over the same period.

Annual Report
VIP Freedom 2025 Portfolio
Performance: The Bottom Line
Average annual total return reflects the change in the value of an investment, assuming reinvestment of the class' dividend income and capital gains (the profits earned upon the sale of securities that have grown in value) and assuming a constant rate of performance each year. During periods of reimbursement by Fidelity, a fund's total return will be greater than it would be had the reimbursement not occurred. Performance numbers are net of all underlying fund operating expenses, but do not include any insurance charges imposed by your insurance company's separate account. If performance information included the effect of these additional charges, the total returns would have been lower. How a fund did yesterday is no guarantee of how it will do tomorrow.
Average Annual Total Returns
Periods ended December 31, 2006 | Past 1
year | Life of FundA |
VIP Freedom 2025 - Initial Class | 12.49% | 14.87% |
A From April 26, 2005.
$10,000 Over Life of Fund
Let's say hypothetically that $10,000 was invested in VIP Freedom 2025 Portfolio - Initial Class on April 26, 2005, when the fund started. The chart shows how the value of your investment would have changed, and also shows how the Standard & Poor's 500SM (S&P 500®) Index performed over the same period.

VIP Freedom Funds Portfolio
VIP Freedom 2030 Portfolio
Performance: The Bottom Line
Average annual total return reflects the change in the value of an investment, assuming reinvestment of the class' dividend income and capital gains (the profits earned upon the sale of securities that have grown in value) and assuming a constant rate of performance each year. During periods of reimbursement by Fidelity, a fund's total return will be greater than it would be had the reimbursement not occurred. Performance numbers are net of all underlying fund operating expenses, but do not include any insurance charges imposed by your insurance company's separate account. If performance information included the effect of these additional charges, the total returns would have been lower. How a fund did yesterday is no guarantee of how it will do tomorrow.
Average Annual Total Returns
Periods ended December 31, 2006 | Past 1
year | Life of FundA |
VIP Freedom 2030 - Initial Class | 13.20% | 15.97% |
A From April 26, 2005.
$10,000 Over Life of Fund
Let's say hypothetically that $10,000 was invested in VIP Freedom 2030 Portfolio - Initial Class on April 26, 2005, when the fund started. The chart shows how the value of your investment would have changed, and also shows how the Standard & Poor's 500SM (S&P 500®) Index performed over the same period.

Annual Report
Management's Discussion of Fund Performance
Comments from Ren Cheng and Christopher Sharpe, Co-Portfolio Managers of VIP Freedom Funds
It was a positive year for stocks around the globe and for investment-grade and high-yield bonds in the United States. International equity markets as a whole outpaced their U.S. counterparts for the 12 months ending December 31, 2006 - partly as a result of favorable currency exchanges that boosted returns for U.S. investors in foreign stocks. The Morgan Stanley Capital InternationalSM Europe, Australasia, Far East (MSCI® EAFE®) Index - a gauge of developed stock markets outside the United States and Canada - gained 26.53% during that time. This marked the fifth year in a row that the MSCI EAFE outperformed the Standard & Poor's 500SM Index, a popular barometer of the U.S. equity market, which returned 15.79% in 2006. In the domestic debt markets, high yield outperformed high quality. Junk bonds' lower sensitivity to interest rate movements and investors' thirst for higher yields drove the Merrill Lynch® U.S. High Yield Master II Constrained Index up 10.76%. Investment-grade bonds rallied in the second half of the year but performed less than half as well as their riskier counterparts, finishing with a 4.33% return as measured by the Lehman Brothers® Aggregate Bond Index.
During the past year, VIP Freedom Funds' absolute returns were in line with what one might expect from a series of portfolios with different age-appropriate, asset-allocation risk levels. On a relative basis, all of the Funds slightly underperformed their composite benchmarks during the period. (For specific portfolio performance results, please refer to the performance section of this report.) The Funds underperformed mainly as a result of lagging returns in the domestic and international equities asset classes, both of which had generally strong absolute returns, but fell short of their corresponding benchmarks - the Dow Jones Wilshire 5000 Composite IndexSM, which rose 15.77%, and the MSCI EAFE. Among the seven underlying U.S. equity funds in the lineup, only VIP Mid Cap Portfolio produced a return in excess of its benchmark, led higher by productive stock picking, especially in the capital goods segment. Inopportune security selection in VIP Overseas Portfolio - mainly in the financials sector - was responsible for our underperformance in the international equities asset class, and this underlying portfolio also was a big drag on the overall equity return. In fixed-income, the relative returns for our underlying funds in the investment-grade, high-yield and short-term bond asset classes all were roughly in line with their individual benchmarks.
Notes to shareholders:
- In order to better accommodate investors' increasing life expectancies and high inflation pressures due to rising health care and other costs, the "roll-down" into the VIP Freedom Income Fund - previously expected to occur between five and 10 years after an investor's target retirement date - has been extended to approximately 10 to 15 years after the target retirement date. This change will have the effect of increasing the equity exposure of the VIP Freedom Funds with target dates closest to retirement - currently VIP Freedom 2005 and 2010 - by up to five percentage points, allowing for the possibility of greater investment growth.
- Additionally, to help increase portfolio diversification and capitalize on investment opportunities presented by an increasingly global economy, the allocation to international equity funds was increased by up to five percentage points. The allocation to domestic equity funds was reduced by a corresponding amount.
- Lastly, the benchmark for the VIP Freedom Funds' underlying high-yield bond fund changed to the Merrill Lynch U.S. High Yield Master II Constrained Index, effective July 1, 2006, concurrent with the scheduled rebalancing of the Funds' composite indexes. In Fidelity's view, the Constrained index - which replaces the Merrill Lynch U.S. High Yield Master II Index - represents a better measure of the high-yield market, as it limits issuer allocations to no more than 2% of the index and thus is more diversified than the previous benchmark and less likely to be disrupted by rapid market changes.
The views expressed above reflect those of the portfolio manager(s) only through the end of the period as stated on the cover of this report and do not necessarily represent the views of Fidelity or any other person in the Fidelity organization. Any such views are subject to change at any time based upon market or other conditions and Fidelity disclaims any responsibility to update such views. These views may not be relied on as investment advice and, because investment decisions for a Fidelity fund are based on numerous factors, may not be relied on as an indication of trading intent on behalf of any Fidelity fund.
VIP Freedom Funds Portfolio
Shareholder Expense Example
As a shareholder of a Fund, you incur two types of costs: (1) transaction costs, and (2) ongoing costs, including distribution and/or service (12b-1) fees and other Fund expenses. This Example is intended to help you understand your ongoing costs (in dollars) of investing in the Funds and to compare these costs with the ongoing costs of investing in other mutual funds.
The Example is based on an investment of $1,000 invested at the beginning of the period and held for the entire period (July 1, 2006 to December 31, 2006).
Actual Expenses
The first line of the accompanying table for each class of each fund provides information about actual account values and actual expenses. You may use the information in this line, together with the amount you invested, to estimate the expenses that you paid over the period. Simply divide your account value by $1,000.00 (for example, an $8,600 account value divided by $1,000.00 = 8.6), then multiply the result by the number in the first line for a class of the fund under the heading entitled "Expenses Paid During Period" to estimate the expenses you paid on your account during this period. The estimate of expenses does not include any fees or other expenses of any variable annuity or variable life insurance product. If they were, the estimate of expenses you paid during the period would be higher, and your ending account value would be lower. In addition, each Fund, as a shareholder in underlying Fidelity Funds, will indirectly bear its pro rata share of the fees and expenses incurred by the underlying Fidelity Funds. These fees and expenses are not included in each Fund's annualized expense ratio used to calculate the expense estimates in the table below.
Hypothetical Example for Comparison Purposes
The second line of the accompanying table for each class of each fund provides information about hypothetical account values and hypothetical expenses based on a Class' actual expense ratio and an assumed rate of return of 5% per year before expenses, which is not the Class' actual return. The hypothetical account values and expenses may not be used to estimate the actual ending account balance or expenses you paid for the period. You may use this information to compare the ongoing costs of investing in the Fund and other funds. To do so, compare this 5% hypothetical example with the 5% hypothetical examples that appear in the shareholder reports of the other funds. The estimate of expenses does not include any fees or other expenses of any variable annuity or variable life insurance product. If they were, the estimate of expenses you paid during the period would be higher, and your ending account value would be lower. In addition, each Fund, as a shareholder in underlying Fidelity Funds, will indirectly bear its pro rata share of the fees and expenses incurred by the underlying Fidelity Funds. These fees and expenses are not included in each Fund's annualized expense ratio used to calculate the expense estimates in the table below.
Please note that the expenses shown in the table are meant to highlight your ongoing costs only and do not reflect any transaction costs. Therefore, the second line of the table is useful in comparing ongoing costs only, and will not help you determine the relative total costs of owning different funds.
| Beginning
Account Value
July 1, 2006 | Ending
Account Value
December 31, 2006 | Expenses Paid
During Period*
July 1, 2006 to December 31, 2006 |
VIP Freedom Income | | | |
Initial Class | | | |
Actual | $ 1,000.00 | $ 1,053.60 | $ .00 |
HypotheticalA | $ 1,000.00 | $ 1,025.21 | $ .00 |
Service Class | | | |
Actual | $ 1,000.00 | $ 1,052.60 | $ .52 |
HypotheticalA | $ 1,000.00 | $ 1,024.70 | $ .51 |
Service Class 2 | | | |
Actual | $ 1,000.00 | $ 1,051.40 | $ 1.29 |
HypotheticalA | $ 1,000.00 | $ 1,023.95 | $ 1.28 |
| | | |
VIP Freedom 2005 | | | |
Initial Class | | | |
Actual | $ 1,000.00 | $ 1,077.60 | $ .00 |
HypotheticalA | $ 1,000.00 | $ 1,025.21 | $ .00 |
Service Class | | | |
Actual | $ 1,000.00 | $ 1,077.60 | $ .52 |
HypotheticalA | $ 1,000.00 | $ 1,024.70 | $ .51 |
Service Class 2 | | | |
Actual | $ 1,000.00 | $ 1,076.10 | $ 1.31 |
HypotheticalA | $ 1,000.00 | $ 1,023.95 | $ 1.28 |
| Beginning
Account Value
July 1, 2006 | Ending
Account Value
December 31, 2006 | Expenses Paid
During Period*
July 1, 2006 to December 31, 2006 |
VIP Freedom 2010 | | | |
Initial Class | | | |
Actual | $ 1,000.00 | $ 1,079.20 | $ .00 |
HypotheticalA | $ 1,000.00 | $ 1,025.21 | $ .00 |
Service Class | | | |
Actual | $ 1,000.00 | $ 1,078.80 | $ .52 |
HypotheticalA | $ 1,000.00 | $ 1,024.70 | $ .51 |
Service Class 2 | | | |
Actual | $ 1,000.00 | $ 1,077.80 | $ 1.31 |
HypotheticalA | $ 1,000.00 | $ 1,023.95 | $ 1.28 |
| | | |
VIP Freedom 2015 | | | |
Initial Class | | | |
Actual | $ 1,000.00 | $ 1,084.60 | $ .00 |
HypotheticalA | $ 1,000.00 | $ 1,025.21 | $ .00 |
Service Class | | | |
Actual | $ 1,000.00 | $ 1,083.60 | $ .53 |
HypotheticalA | $ 1,000.00 | $ 1,024.70 | $ .51 |
Service Class 2 | | | |
Actual | $ 1,000.00 | $ 1,083.60 | $ 1.31 |
HypotheticalA | $ 1,000.00 | $ 1,023.95 | $ 1.28 |
| | | |
VIP Freedom 2020 | | | |
Initial Class | | | |
Actual | $ 1,000.00 | $ 1,091.00 | $ .00 |
HypotheticalA | $ 1,000.00 | $ 1,025.21 | $ .00 |
Service Class | | | |
Actual | $ 1,000.00 | $ 1,090.50 | $ .53 |
HypotheticalA | $ 1,000.00 | $ 1,024.70 | $ .51 |
Service Class 2 | | | |
Actual | $ 1,000.00 | $ 1,090.40 | $ 1.32 |
HypotheticalA | $ 1,000.00 | $ 1,023.95 | $ 1.28 |
| | | |
VIP Freedom 2025 | | | |
Initial Class | | | |
Actual | $ 1,000.00 | $ 1,093.60 | $ .00 |
HypotheticalA | $ 1,000.00 | $ 1,025.21 | $ .00 |
Service Class | | | |
Actual | $ 1,000.00 | $ 1,092.50 | $ .53 |
HypotheticalA | $ 1,000.00 | $ 1,024.70 | $ .51 |
Service Class 2 | | | |
Actual | $ 1,000.00 | $ 1,091.50 | $ 1.32 |
HypotheticalA | $ 1,000.00 | $ 1,023.95 | $ 1.28 |
| | | |
VIP Freedom 2030 | | | |
Initial Class | | | |
Actual | $ 1,000.00 | $ 1,098.80 | $ .00 |
HypotheticalA | $ 1,000.00 | $ 1,025.21 | $ .00 |
Service Class | | | |
Actual | $ 1,000.00 | $ 1,098.40 | $ .53 |
HypotheticalA | $ 1,000.00 | $ 1,024.70 | $ .51 |
Service Class 2 | | | |
Actual | $ 1,000.00 | $ 1,097.10 | $ 1.32 |
HypotheticalA | $ 1,000.00 | $ 1,023.95 | $ 1.28 |
A 5% return per year before expenses
* Expenses are equal to each Class' annualized expense ratio (shown in the table below); multiplied by the average account value over the period, multiplied by 184/ 365 (to reflect the one-half year period). The fees and expenses of the underlying Fidelity Funds in which the Fund invests are not included in each class' annualized expense ratio.
VIP Freedom Funds Portfolio
| Annualized
Expense Ratio |
VIP Freedom Income | |
Initial Class | .00% |
Service Class | .10% |
Service Class 2 | .25% |
VIP Freedom 2005 | |
Initial Class | .00% |
Service Class | .10% |
Service Class 2 | .25% |
VIP Freedom 2010 | |
Initial Class | .00% |
Service Class | .10% |
Service Class 2 | .25% |
VIP Freedom 2015 | |
Initial Class | .00% |
Service Class | .10% |
Service Class 2 | .25% |
VIP Freedom 2020 | |
Initial Class | .00% |
Service Class | .10% |
Service Class 2 | .25% |
VIP Freedom 2025 | |
Initial Class | .00% |
Service Class | .10% |
Service Class 2 | .25% |
VIP Freedom 2030 | |
Initial Class | .00% |
Service Class | .10% |
Service Class 2 | .25% |
Annual Report
VIP Freedom Income Portfolio
Investment Changes
Fund Holdings as of December 31, 2006 |
| % of fund's
investments | % of fund's investments
6 months ago |
Domestic Equity Funds | | |
VIP Contrafund Portfolio Initial Class | 3.2 | 3.0 |
VIP Equity-Income Portfolio Initial Class | 3.8 | 3.6 |
VIP Growth & Income Portfolio Initial Class | 3.7 | 3.5 |
VIP Growth Portfolio Initial Class | 3.7 | 3.5 |
VIP Mid Cap Portfolio Initial Class | 1.3 | 1.2 |
VIP Value Portfolio Initial Class | 3.2 | 3.0 |
VIP Value Strategies Portfolio Initial Class | 1.3 | 1.3 |
| 20.2 | 19.1 |
High Yield Fixed-Income Funds | | |
VIP High Income Portfolio Initial Class | 5.1 | 5.0 |
Investment Grade Fixed-Income Funds | | |
VIP Investment Grade Bond Portfolio Initial Class | 34.8 | 35.3 |
Short-Term Funds | | |
VIP Money Market Portfolio Initial Class | 39.9 | 40.6 |
| 100.0 | 100.0 |
Asset Allocation (% of fund's investments) |
Current |
| Domestic Equity Funds | 20.2% | |
 | Investment Grade Fixed-Income Funds | 34.8% | |
 | High Yield Fixed-Income Funds | 5.1% | |
| Short-Term Funds | 39.9% | |

Six months ago |
| Domestic Equity Funds | 19.1% | |
| Investment Grade Fixed-Income Funds | 35.3% | |
| High Yield Fixed-Income Funds | 5.0% | |
| Short-Term Funds | 40.6% | |

The six months ago allocation is based on the fund's holdings as of June 30, 2006. The current allocation is based on the fund's holdings as of
December 31, 2006. |
VIP Freedom Funds Portfolio
VIP Freedom Income Portfolio
Investments December 31, 2006
Showing Percentage of Total Value of Investment in Securities
Equity Funds - 20.2% |
| Shares | | Value (Note 1) |
Domestic Equity Funds - 20.2% |
VIP Contrafund Portfolio Initial Class | 11,035 | | $ 347,262 |
VIP Equity-Income Portfolio Initial Class | 15,599 | | 408,685 |
VIP Growth & Income Portfolio Initial Class | 25,045 | | 403,733 |
VIP Growth Portfolio Initial Class | 11,036 | | 395,853 |
VIP Mid Cap Portfolio Initial Class | 4,187 | | 145,577 |
VIP Value Portfolio Initial Class | 24,216 | | 345,803 |
VIP Value Strategies Portfolio Initial Class | 10,862 | | 146,310 |
TOTAL EQUITY FUNDS (Cost $1,999,241) | 2,193,223 |
Fixed-Income Funds - 39.9% |
| | | |
High Yield Fixed-Income Funds - 5.1% |
VIP High Income Portfolio Initial Class | 86,552 | | 549,605 |
Investment Grade Fixed-Income Funds - 34.8% |
VIP Investment Grade Bond Portfolio Initial Class | 295,829 | | 3,774,772 |
TOTAL FIXED-INCOME FUNDS (Cost $4,261,833) | 4,324,377 |
Short-Term Funds - 39.9% |
| | | |
VIP Money Market Portfolio Initial Class
(Cost $4,331,271) | 4,331,271 | | 4,331,271 |
TOTAL INVESTMENT IN SECURITIES - 100% (Cost $10,592,345) | $ 10,848,871 |
See accompanying notes which are an integral part of the financial statements.
Annual Report
VIP Freedom Income Portfolio
Financial Statements
Statement of Assets and Liabilities
| December 31, 2006 |
Assets | | |
Investment in securities, at value (cost $10,592,345) - See accompanying schedule | | $ 10,848,871 |
Cash | | 35 |
Dividends receivable from underlying funds | | 1,194 |
Total assets | | 10,850,100 |
| | |
Liabilities | | |
Distribution fees payable | | 241 |
| | |
Net Assets | | $ 10,849,859 |
Net Assets consist of: | | |
Paid in capital | | $ 10,547,228 |
Undistributed net investment income | | 4,498 |
Accumulated undistributed net realized gain (loss) on investments | | 41,607 |
Net unrealized appreciation (depreciation) on investments | | 256,526 |
Net Assets | | $ 10,849,859 |
Initial Class:
Net Asset Value, offering price and redemption price per share ($9,398,411 ÷ 877,858 shares) | | $ 10.71 |
| | |
Service Class:
Net Asset Value, offering price and redemption price per share ($390,743 ÷ 36,488 shares) | | $ 10.71 |
| | |
Service Class 2:
Net Asset Value, offering price and redemption price per share ($1,060,705 ÷ 99,205 shares) | | $ 10.69 |
Statement of Operations
| Year ended December 31, 2006 |
Investment Income | | |
Income distributions from underlying funds | | $ 315,403 |
Interest | | 25 |
Total income | | 315,428 |
| | |
Expenses | | |
Distribution fees | $ 1,756 | |
Independent trustees' compensation | 28 | |
Total expenses before reductions | 1,784 | |
Expense reductions | (28) | 1,756 |
Net investment income (loss) | | 313,672 |
Realized and Unrealized Gain (Loss) Realized gain (loss) on sale of underlying fund shares | (15,045) | |
Capital gain distributions from underlying funds | 106,674 | 91,629 |
Change in net unrealized appreciation (depreciation) on underlying funds | | 167,067 |
Net gain (loss) | | 258,696 |
Net increase (decrease) in net assets resulting from operations | | $ 572,368 |
See accompanying notes which are an integral part of the financial statements.
VIP Freedom Funds Portfolio
Statement of Changes in Net Assets
| Year ended
December 31,
2006 | For the period
April 26, 2005
(commencement
of operations) to
December 31, 2005 |
Increase (Decrease) in Net Assets | | |
Operations | | |
Net investment income (loss) | $ 313,672 | $ 62,848 |
Net realized gain (loss) | 91,629 | (1,370) |
Change in net unrealized appreciation (depreciation) | 167,067 | 89,459 |
Net increase (decrease) in net assets resulting from operations | 572,368 | 150,937 |
Distributions to shareholders from net investment income | (309,765) | (61,841) |
Distributions to shareholders from net realized gain | (49,069) | - |
Total distributions | (358,834) | (61,841) |
Share transactions - net increase (decrease) | 3,951,196 | 6,596,033 |
Total increase (decrease) in net assets | 4,164,730 | 6,685,129 |
| | |
Net Assets | | |
Beginning of period | 6,685,129 | - |
End of period (including undistributed net investment income of $4,498 and undistributed net investment income of $1,007, respectively) | $ 10,849,859 | $ 6,685,129 |
Financial Highlights - Initial Class
Years ended December 31, | 2006 | 2005 G |
Selected Per-Share Data | | |
Net asset value, beginning of period | $ 10.36 | $ 10.00 |
Income from Investment Operations | | |
Net investment income (loss) E | .40 | .16 |
Net realized and unrealized gain (loss) | .32 | .30 |
Total from investment operations | .72 | .46 |
Distributions from net investment income | (.32) | (.10) |
Distributions from net realized gain | (.05) | - |
Total distributions | (.37) | (.10) |
Net asset value, end of period | $ 10.71 | $ 10.36 |
Total Return B, C, D | 6.94% | 4.58% |
Ratios to Average Net Assets F, H | | |
Expenses before reductions | .00% | .00%A |
Expenses net of fee waivers, if any | .00% | .00%A |
Expenses net of all reductions | .00% | .00%A |
Net investment income (loss) | 3.75% | 2.34%A |
Supplemental Data | | |
Net assets, end of period (000 omitted) | $ 9,398 | $ 5,954 |
Portfolio turnover rate | 44% | 12%A |
A Annualized
B Total returns for periods of less than one year are not annualized.
C Total returns do not reflect charges attributable to your insurance company's separate account. Inclusion of these charges would reduce the total returns shown.
D Total returns would have been lower had certain expenses not been reduced during the periods shown.
E Calculated based on average shares outstanding during the period.
F Amounts do not include the activity of the underlying funds.
G For the period April 26, 2005 (commencement of operations) to December 31, 2005.
H Expense ratios reflect operating expenses of the class. Expenses before reductions do not reflect amounts reimbursed by the investment adviser or expense offset arrangements and do not represent the amount paid by the class during periods when reimbursements or reductions occur. Expense ratios before reductions for start-up periods may not be representative of longer-term operating periods. Expenses net of fee waivers reflect expenses after reimbursement by the investment adviser but prior to reductions from expense offset arrangements. Expenses net of all reductions represent the net expenses paid by the class but do not include expenses of the investment companies in which the Fund invests.
See accompanying notes which are an integral part of the financial statements.
Annual Report
Financial Highlights - Service Class
Years ended December 31, | 2006 | 2005 G |
Selected Per-Share Data | | |
Net asset value, beginning of period | $ 10.36 | $ 10.00 |
Income from Investment Operations | | |
Net investment income (loss) E | .39 | .16 |
Net realized and unrealized gain (loss) | .32 | .29 |
Total from investment operations | .71 | .45 |
Distributions from net investment income | (.31) | (.09) |
Distributions from net realized gain | (.05) | - |
Total distributions | (.36) | (.09) |
Net asset value, end of period | $ 10.71 | $ 10.36 |
Total Return B, C, D | 6.83% | 4.51% |
Ratios to Average Net Assets F, H | | |
Expenses before reductions | .10% | .10%A |
Expenses net of fee waivers, if any | .10% | .10%A |
Expenses net of all reductions | .10% | .10%A |
Net investment income (loss) | 3.65% | 2.24%A |
Supplemental Data | | |
Net assets, end of period (000 omitted) | $ 391 | $ 366 |
Portfolio turnover rate | 44% | 12%A |
A Annualized
B Total returns for periods of less than one year are not annualized.
C Total returns do not reflect charges attributable to your insurance company's separate account. Inclusion of these charges would reduce the total returns shown.
D Total returns would have been lower had certain expenses not been reduced during the periods shown.
E Calculated based on average shares outstanding during the period.
F Amounts do not include the activity of the underlying funds.
G For the period April 26, 2005 (commencement of operations) to December 31, 2005.
H Expense ratios reflect operating expenses of the class. Expenses before reductions do not reflect amounts reimbursed by the investment adviser or expense offset arrangements and do not represent the amount paid by the class during periods when reimbursements or reductions occur. Expense ratios before reductions for start-up periods may not be representative of longer-term operating periods. Expenses net of fee waivers reflect expenses after reimbursement by the investment adviser but prior to reductions from expense offset arrangements. Expenses net of all reductions represent the net expenses paid by the class but do not include expenses of the investment companies in which the Fund invests.
Financial Highlights - Service Class 2
Years ended December 31, | 2006 | 2005 G |
Selected Per-Share Data | | |
Net asset value, beginning of period | $ 10.36 | $ 10.00 |
Income from Investment Operations | | |
Net investment income (loss) E | .37 | .15 |
Net realized and unrealized gain (loss) | .32 | .29 |
Total from investment operations | .69 | .44 |
Distributions from net investment income | (.31) | (.08) |
Distributions from net realized gain | (.05) | - |
Total distributions | (.36) | (.08) |
Net asset value, end of period | $ 10.69 | $ 10.36 |
Total Return B, C, D | 6.61% | 4.41% |
Ratios to Average Net Assets F, H | | |
Expenses before reductions | .25% | .25%A |
Expenses net of fee waivers, if any | .25% | .25%A |
Expenses net of all reductions | .25% | .25%A |
Net investment income (loss) | 3.50% | 2.09%A |
Supplemental Data | | |
Net assets, end of period (000 omitted) | $ 1,061 | $ 365 |
Portfolio turnover rate | 44% | 12% A |
A Annualized
B Total returns for periods of less than one year are not annualized.
C Total returns do not reflect charges attributable to your insurance company's separate account. Inclusion of these charges would reduce the total returns shown.
D Total returns would have been lower had certain expenses not been reduced during the periods shown.
E Calculated based on average shares outstanding during the period.
F Amounts do not include the activity of the underlying funds.
G For the period April 26, 2005 (commencement of operations) to December 31, 2005.
H Expense ratios reflect operating expenses of the class. Expenses before reductions do not reflect amounts reimbursed by the investment adviser or expense offset arrangements and do not represent the amount paid by the class during periods when reimbursements or reductions occur. Expense ratios before reductions for start-up periods may not be representative of longer-term operating periods. Expenses net of fee waivers reflect expenses after reimbursement by the investment adviser but prior to reductions from expense offset arrangements. Expenses net of all reductions represent the net expenses paid by the class but do not include expenses of the investment companies in which the Fund invests.
See accompanying notes which are an integral part of the financial statements.
VIP Freedom Funds Portfolio
VIP Freedom 2005 Portfolio
Investment Changes
Fund Holdings as of December 31, 2006 |
| % of fund's investments | % of fund's investments 6 months ago |
Domestic Equity Funds | | |
VIP Contrafund Portfolio Initial Class | 6.3 | 6.1 |
VIP Equity-Income Portfolio Initial Class | 7.4 | 7.2 |
VIP Growth & Income Portfolio Initial Class | 7.3 | 7.1 |
VIP Growth Portfolio Initial Class | 7.1 | 7.1 |
VIP Mid Cap Portfolio Initial Class | 2.6 | 2.5 |
VIP Value Portfolio Initial Class | 6.3 | 6.1 |
VIP Value Strategies Portfolio Initial Class | 2.7 | 2.5 |
| 39.7 | 38.6 |
International Equity Funds | | |
VIP Overseas Portfolio Initial Class | 10.1 | 7.5 |
High Yield Fixed-Income Funds | | |
VIP High Income Portfolio Initial Class | 5.0 | 5.1 |
Investment Grade Fixed-Income Funds | | |
VIP Investment Grade Bond Portfolio Initial Class | 34.2 | 36.5 |
Short-Term Funds | | |
VIP Money Market Portfolio Initial Class | 11.0 | 12.3 |
| 100.0 | 100.0 |
Asset Allocation (% of fund's investments) |
Current |
| Domestic Equity Funds | 39.7% | |
| International Equity Funds | 10.1% | |
 | Investment Grade Fixed-Income Funds | 34.2% | |
| High Yield Fixed-Income Funds | 5.0% | |
| Short-Term Funds | 11.0% | |

Six months ago |
| Domestic Equity Funds | 38.6% | |
| International Equity Funds | 7.5% | |
| Investment Grade Fixed-Income Funds | 36.5% | |
| High Yield Fixed-Income Funds | 5.1% | |
| Short-Term Funds | 12.3% | |

Expected |
| Domestic Equity Funds | 39.4% | |
| International Equity Funds | 9.4% | |
| Investment Grade Fixed-Income Funds | 34.4% | |
| High Yield Fixed-Income Funds | 5.0% | |
| Short-Term Funds | 11.8% | |

The current allocation is based on the fund's holdings as of December 31, 2006. The expected allocation represents the fund's anticipated allocation at June 30, 2007. In March 2006, the target date for combining the fund with the VIP Freedom Income Fund was extended by approximately five years resulting in a greater allocation to equity funds. Also, beginning in March 2006, the fund increased its allocation to international equity. The six months ago allocation is based on the fund's holdings as of June 30, 2006. |
Annual Report
VIP Freedom 2005 Portfolio
Investments December 31, 2006
Showing Percentage of Total Value of Investment in Securities
Equity Funds - 49.8% |
| Shares | | Value (Note 1) |
Domestic Equity Funds - 39.7% |
VIP Contrafund Portfolio Initial Class | 17,382 | | $ 546,997 |
VIP Equity-Income Portfolio Initial Class | 24,587 | | 644,187 |
VIP Growth & Income Portfolio Initial Class | 39,440 | | 635,766 |
VIP Growth Portfolio Initial Class | 17,340 | | 621,980 |
VIP Mid Cap Portfolio Initial Class | 6,601 | | 229,516 |
VIP Value Portfolio Initial Class | 38,099 | | 544,050 |
VIP Value Strategies Portfolio Initial Class | 17,127 | | 230,699 |
TOTAL DOMESTIC EQUITY FUNDS | | 3,453,195 |
International Equity Funds - 10.1% |
VIP Overseas Portfolio Initial Class | 36,569 | | 876,553 |
TOTAL EQUITY FUNDS (Cost $3,812,681) | 4,329,748 |
Fixed-Income Funds - 39.2% |
| | | |
High Yield Fixed-Income Funds - 5.0% |
VIP High Income Portfolio Initial Class | 69,302 | | 440,066 |
Investment Grade Fixed-Income Funds - 34.2% |
VIP Investment Grade Bond Portfolio Initial Class | 232,877 | | 2,971,517 |
TOTAL FIXED-INCOME FUNDS (Cost $3,344,279) | 3,411,583 |
Short-Term Funds - 11.0% |
| | | |
VIP Money Market Portfolio Initial Class
(Cost $955,720) | 955,720 | | 955,720 |
TOTAL INVESTMENT IN SECURITIES - 100% (Cost $8,112,680) | $ 8,697,051 |
See accompanying notes which are an integral part of the financial statements.
VIP Freedom Funds Portfolio
VIP Freedom 2005 Portfolio
Financial Statements
Statement of Assets and Liabilities
| December 31, 2006 |
| | |
Assets | | |
Investment in securities, at value (cost $8,112,680) - See accompanying schedule | | $ 8,697,051 |
Dividends receivable from underlying funds | | 261 |
Total assets | | 8,697,312 |
| | |
Liabilities | | |
Distribution fees payable | | 120 |
| | |
Net Assets | | $ 8,697,192 |
Net Assets consist of: | | |
Paid in capital | | $ 8,028,778 |
Accumulated undistributed net realized gain (loss) on investments | | 84,043 |
Net unrealized appreciation (depreciation) on investments | | 584,371 |
Net Assets | | $ 8,697,192 |
| | |
Initial Class:
Net Asset Value, offering price and redemption price per share ($7,871,101 ÷ 689,615 shares) | | $ 11.41 |
| | |
Service Class:
Net Asset Value, offering price and redemption price per share ($413,568 ÷ 36,241 shares) | | $ 11.41 |
| | |
Service Class 2:
Net Asset Value, offering price and redemption price per share ($412,523 ÷ 36,155 shares) | | $ 11.41 |
Statement of Operations
| Year ended December 31, 2006 |
| | |
Investment Income | | |
Income distributions from underlying funds | | $ 225,205 |
| | |
Expenses | | |
Distribution fees | $ 1,367 | |
Independent trustees' compensation | 26 | |
Total expenses before reductions | 1,393 | |
Expense reductions | (26) | 1,367 |
Net investment income (loss) | | 223,838 |
Realized and Unrealized Gain (Loss) Realized gain (loss) on sale of underlying fund shares | (69,068) | |
Capital gain distributions from underlying funds | 195,599 | 126,531 |
Change in net unrealized appreciation (depreciation) on underlying funds | | 371,871 |
Net gain (loss) | | 498,402 |
Net increase (decrease) in net assets resulting from operations | | $ 722,240 |
See accompanying notes which are an integral part of the financial statements.
Annual Report
VIP Freedom 2005 Portfolio
Financial Statements - continued
Statement of Changes in Net Assets
| Year ended
December 31, 2006 | For the period
April 26, 2005
(commencement
of operations) to
December 31, 2005 |
Increase (Decrease) in Net Assets | | |
Operations | | |
Net investment income (loss) | $ 223,838 | $ 31,641 |
Net realized gain (loss) | 126,531 | (1,861) |
Change in net unrealized appreciation (depreciation) | 371,871 | 212,500 |
Net increase (decrease) in net assets resulting from operations | 722,240 | 242,280 |
Distributions to shareholders from net investment income | (227,593) | (31,563) |
Distributions to shareholders from net realized gain | (36,950) | - |
Total distributions | (264,543) | (31,563) |
Share transactions - net increase (decrease) | 2,200,656 | 5,828,122 |
Total increase (decrease) in net assets | 2,658,353 | 6,038,839 |
| | |
Net Assets | | |
Beginning of period | 6,038,839 | - |
End of period (including undistributed net investment income of $0 and undistributed net investment income of $78, respectively) | $ 8,697,192 | $ 6,038,839 |
Financial Highlights - Initial Class
Years ended December 31, | 2006 | 2005 G |
Selected Per-Share Data | | |
Net asset value, beginning of period | $ 10.74 | $ 10.00 |
Income from Investment Operations | | |
Net investment income (loss) E | .31 | .09 |
Net realized and unrealized gain (loss) | .72 | .71 |
Total from investment operations | 1.03 | .80 |
Distributions from net investment income | (.31) | (.06) |
Distributions from net realized gain | (.05) | - |
Total distributions | (.36) | (.06) |
Net asset value, end of period | $ 11.41 | $ 10.74 |
Total Return B, C, D | 9.59% | 7.98% |
Ratios to Average Net Assets F, H | | |
Expenses before reductions | .00% | .00% A |
Expenses net of fee waivers, if any | .00% | .00% A |
Expenses net of all reductions | .00% | .00% A |
Net investment income (loss) | 2.82% | 1.24% A |
Supplemental Data | | |
Net assets, end of period (000 omitted) | $ 7,871 | $ 5,284 |
Portfolio turnover rate | 56% | 43% A |
A Annualized
B Total returns for periods of less than one year are not annualized.
C Total returns do not reflect charges attributable to your insurance company's separate account. Inclusion of these charges would reduce the total returns shown.
D Total returns would have been lower had certain expenses not been reduced during the periods shown.
E Calculated based on average shares outstanding during the period.
F Amounts do not include the activity of the underlying funds.
G For the period April 26, 2005 (commencement of operations) to December 31, 2005.
H Expense ratios reflect operating expenses of the class. Expenses before reductions do not reflect amounts reimbursed by the investment adviser or expense offset arrangements and do not represent the amount paid by the class during periods when reimbursements or reductions occur. Expense ratios before reductions for start-up periods may not be representative of longer-term operating periods. Expenses net of fee waivers reflect expenses after reimbursement by the investment adviser but prior to reductions from expense offset arrangements. Expenses net of all reductions represent the net expenses paid by the class but do not include expenses of the investment companies in which the Fund invests.
See accompanying notes which are an integral part of the financial statements.
VIP Freedom Funds Portfolio
Financial Highlights - Service Class
Years ended December 31, | 2006 | 2005 G |
Selected Per-Share Data | | |
Net asset value, beginning of period | $ 10.74 | $ 10.00 |
Income from Investment Operations | | |
Net investment income (loss) E | .30 | .08 |
Net realized and unrealized gain (loss) | .72 | .71 |
Total from investment operations | 1.02 | .79 |
Distributions from net investment income | (.30) | (.05) |
Distributions from net realized gain | (.05) | - |
Total distributions | (.35) | (.05) |
Net asset value, end of period | $ 11.41 | $ 10.74 |
Total Return B, C, D | 9.48% | 7.91% |
Ratios to Average Net Assets F, H | | |
Expenses before reductions | .10% | .10% A |
Expenses net of fee waivers, if any | .10% | .10% A |
Expenses net of all reductions | .10% | .10% A |
Net investment income (loss) | 2.72% | 1.14% A |
Supplemental Data | | |
Net assets, end of period (000 omitted) | $ 414 | $ 378 |
Portfolio turnover rate | 56% | 43% A |
A Annualized
B Total returns for periods of less than one year are not annualized.
C Total returns do not reflect charges attributable to your insurance company's separate account. Inclusion of these charges would reduce the total returns shown.
D Total returns would have been lower had certain expenses not been reduced during the periods shown.
E Calculated based on average shares outstanding during the period.
F Amounts do not include the activity of the underlying funds.
G For the period April 26, 2005 (commencement of operations) to December 31, 2005.
H Expense ratios reflect operating expenses of the class. Expenses before reductions do not reflect amounts reimbursed by the investment adviser or expense offset arrangements and do not represent the amount paid by the class during periods when reimbursements or reductions occur. Expense ratios before reductions for start-up periods may not be representative of longer-term operating periods. Expenses net of fee waivers reflect expenses after reimbursement by the investment adviser but prior to reductions from expense offset arrangements. Expenses net of all reductions represent the net expenses paid by the class but do not include expenses of the investment companies in which the Fund invests.
Financial Highlights - Service Class 2
Years ended December 31, | 2006 | 2005 G |
Selected Per-Share Data | | |
Net asset value, beginning of period | $ 10.74 | $ 10.00 |
Income from Investment Operations | | |
Net investment income (loss) E | .29 | .07 |
Net realized and unrealized gain (loss) | .71 | .71 |
Total from investment operations | 1.00 | .78 |
Distributions from net investment income | (.28) | (.04) |
Distributions from net realized gain | (.05) | - |
Total distributions | (.33) | (.04) |
Net asset value, end of period | $ 11.41 | $ 10.74 |
Total Return B, C, D | 9.34% | 7.80% |
Ratios to Average Net Assets F, H | | |
Expenses before reductions | .25% | .25% A |
Expenses net of fee waivers, if any | .25% | .25% A |
Expenses net of all reductions | .25% | .25% A |
Net investment income (loss) | 2.57% | 1.00% A |
Supplemental Data | | |
Net assets, end of period (000 omitted) | $ 413 | $ 377 |
Portfolio turnover rate | 56% | 43% A |
A Annualized
B Total returns for periods of less than one year are not annualized.
C Total returns do not reflect charges attributable to your insurance company's separate account. Inclusion of these charges would reduce the total returns shown.
D Total returns would have been lower had certain expenses not been reduced during the periods shown.
E Calculated based on average shares outstanding during the period.
F Amounts do not include the activity of the underlying funds.
G For the period April 26, 2005 (commencement of operations) to December 31, 2005.
H Expense ratios reflect operating expenses of the class. Expenses before reductions do not reflect amounts reimbursed by the investment adviser or expense offset arrangements and do not represent the amount paid by the class during periods when reimbursements or reductions occur. Expense ratios before reductions for start-up periods may not be representative of longer-term operating periods. Expenses net of fee waivers reflect expenses after reimbursement by the investment adviser but prior to reductions from expense offset arrangements. Expenses net of all reductions represent the net expenses paid by the class but do not include expenses of the investment companies in which the Fund invests.
See accompanying notes which are an integral part of the financial statements.
Annual Report
VIP Freedom 2010 Portfolio
Investment Changes
Fund Holdings as of December 31, 2006 |
| % of fund's investments | % of fund's investments 6 months ago |
Domestic Equity Funds | | |
VIP Contrafund Portfolio Initial Class | 6.4 | 6.4 |
VIP Equity-Income Portfolio Initial Class | 7.5 | 7.4 |
VIP Growth & Income Portfolio Initial Class | 7.5 | 7.4 |
VIP Growth Portfolio Initial Class | 7.3 | 7.3 |
VIP Mid Cap Portfolio Initial Class | 2.7 | 2.6 |
VIP Value Portfolio Initial Class | 6.4 | 6.3 |
VIP Value Strategies Portfolio Initial Class | 2.7 | 2.6 |
| 40.5 | 40.0 |
International Equity Funds | | |
VIP Overseas Portfolio Initial Class | 10.5 | 7.2 |
High Yield Fixed-Income Funds | | |
VIP High Income Portfolio Initial Class | 5.0 | 5.2 |
Investment Grade Fixed-Income Funds | | |
VIP Investment Grade Bond Portfolio Initial Class | 34.4 | 37.9 |
Short-Term Funds | | |
VIP Money Market Portfolio Initial Class | 9.6 | 9.7 |
| 100.0 | 100.0 |
Asset Allocation (% of fund's investments) |
Current |
| Domestic Equity Funds | 40.5% | |
| International Equity Funds | 10.5% | |
| Investment Grade Fixed-Income Funds | 34.4% | |
| High Yield Fixed-Income Funds | 5.0% | |
| Short-Term Funds | 9.6% | |

Six months ago |
| Domestic Equity Funds | 40.0% | |
| International Equity Funds | 7.2% | |
| Investment Grade Fixed-Income Funds | 37.9% | |
| High Yield Fixed-Income Funds | 5.2% | |
| Short-Term Funds | 9.7% | |

Expected |
| Domestic Equity Funds | 40.2% | |
| International Equity Funds | 10.1% | |
| Investment Grade Fixed-Income Funds | 34.8% | |
| High Yield Fixed-Income Funds | 5.0% | |
| Short-Term Funds | 9.9% | |

The current allocation is based on the fund's holdings as of December 31, 2006. The expected allocation represents the fund's anticipated allocation at June 30, 2007. In March 2006, the target date for combining the fund with the VIP Freedom Income Fund was extended by approximately five years resulting in a greater allocation to equity funds. Also, beginning in March 2006, the fund increased its allocation to international equity. The six months ago allocation is based on the fund's holdings as of June 30, 2006. |
VIP Freedom Funds Portfolio
VIP Freedom 2010 Portfolio
Investments December 31, 2006
Showing Percentage of Total Value of Investment in Securities
Equity Funds - 51.0% |
| Shares | | Value (Note 1) |
Domestic Equity Funds - 40.5% |
VIP Contrafund Portfolio Initial Class | 133,769 | | $ 4,209,711 |
VIP Equity-Income Portfolio Initial Class | 189,303 | | 4,959,736 |
VIP Growth & Income Portfolio Initial Class | 303,672 | | 4,895,187 |
VIP Growth Portfolio Initial Class | 133,624 | | 4,793,084 |
VIP Mid Cap Portfolio Initial Class | 50,679 | | 1,762,107 |
VIP Value Portfolio Initial Class | 293,546 | | 4,191,836 |
VIP Value Strategies Portfolio Initial Class | 131,551 | | 1,771,995 |
TOTAL DOMESTIC EQUITY FUNDS | | 26,583,656 |
International Equity Funds - 10.5% |
VIP Overseas Portfolio Initial Class | 286,579 | | 6,869,302 |
TOTAL EQUITY FUNDS (Cost $30,797,822) | 33,452,958 |
Fixed-Income Funds - 39.4% |
| | | |
High Yield Fixed-Income Funds - 5.0% |
VIP High Income Portfolio Initial Class | 522,062 | | 3,315,092 |
Investment Grade Fixed-Income Funds - 34.4% |
VIP Investment Grade Bond Portfolio Initial Class | 1,767,470 | | 22,552,915 |
TOTAL FIXED-INCOME FUNDS (Cost $25,379,441) | 25,868,007 |
Short-Term Funds - 9.6% |
| | | |
VIP Money Market Portfolio Initial Class (Cost $6,323,551) | 6,323,551 | | 6,323,551 |
TOTAL INVESTMENT IN SECURITIES - 100% (Cost $62,500,814) | $ 65,644,516 |
See accompanying notes which are an integral part of the financial statements.
Annual Report
VIP Freedom 2010 Portfolio
Financial Statements
Statement of Assets and Liabilities
| December 31, 2006 |
| | |
Assets | | |
Investment in securities, at value (cost $62,500,814) - See accompanying schedule | | $ 65,644,516 |
Cash | | 7 |
Dividends receivable from underlying funds | | 1,735 |
Total assets | | 65,646,258 |
| | |
Liabilities | | |
Distribution fees payable | | 8,314 |
| | |
Net Assets | | $ 65,637,944 |
Net Assets consist of: | | |
Paid in capital | | $ 61,881,473 |
Accumulated undistributed net realized gain (loss) on investments | | 612,769 |
Net unrealized appreciation (depreciation) on investments | | 3,143,702 |
Net Assets | | $ 65,637,944 |
| | |
Initial Class:
Net Asset Value, offering price and redemption price per share ($20,991,957 ÷ 1,811,862 shares) | | $ 11.59 |
| | |
Service Class:
Net Asset Value, offering price and redemption price per share ($5,984,357 ÷ 516,833 shares) | | $ 11.58 |
| | |
Service Class 2:
Net Asset Value, offering price and redemption price per share ($38,661,630 ÷ 3,345,662 shares) | | $ 11.56 |
Statement of Operations
| Year ended December 31, 2006 |
| | |
Investment Income | | |
Income distributions from underlying funds | | $ 1,091,576 |
| | |
Expenses | | |
Distribution fees | $ 62,400 | |
Independent trustees' compensation | 136 | |
Total expenses before reductions | 62,536 | |
Expense reductions | (136) | 62,400 |
Net investment income (loss) | | 1,029,176 |
Realized and Unrealized Gain (Loss) Realized gain (loss) on sale of underlying fund shares | (183,421) | |
Capital gain distributions from underlying funds | 1,086,255 | 902,834 |
Change in net unrealized appreciation (depreciation) on underlying funds | | 2,551,775 |
Net gain (loss) | | 3,454,609 |
Net increase (decrease) in net assets resulting from operations | | $ 4,483,785 |
See accompanying notes which are an integral part of the financial statements.
VIP Freedom Funds Portfolio
Statement of Changes in Net Assets
| Year ended
December 31, 2006 | For the period
April 26, 2005
(commencement
of operations) to
December 31, 2005 |
Increase (Decrease) in Net Assets | | |
Operations | | |
Net investment income (loss) | $ 1,029,176 | $ 108,050 |
Net realized gain (loss) | 902,834 | (13,200) |
Change in net unrealized appreciation (depreciation) | 2,551,775 | 591,927 |
Net increase (decrease) in net assets resulting from operations | 4,483,785 | 686,777 |
Distributions to shareholders from net investment income | (1,040,763) | (109,350) |
Distributions to shareholders from net realized gain | (276,865) | - |
Total distributions | (1,317,628) | (109,350) |
Share transactions - net increase (decrease) | 38,663,621 | 23,230,739 |
Total increase (decrease) in net assets | 41,829,778 | 23,808,166 |
| | |
Net Assets | | |
Beginning of period | 23,808,166 | - |
End of period | $ 65,637,944 | $ 23,808,166 |
Financial Highlights - Initial Class
Years ended December 31, | 2006 | 2005 G |
Selected Per-Share Data | | |
Net asset value, beginning of period | $ 10.78 | $ 10.00 |
Income from Investment Operations | | |
Net investment income (loss) E | .28 | .11 |
Net realized and unrealized gain (loss) | .78 | .72 |
Total from investment operations | 1.06 | .83 |
Distributions from net investment income | (.20) | (.05) |
Distributions from net realized gain | (.05) | - |
Total distributions | (.25) | (.05) |
Net asset value, end of period | $ 11.59 | $ 10.78 |
Total Return B, C, D | 9.82% | 8.33% |
Ratios to Average Net Assets F, H | | |
Expenses before reductions | .00% | .00% A |
Expenses net of fee waivers, if any | .00% | .00% A |
Expenses net of all reductions | .00% | .00% A |
Net investment income (loss) | 2.48% | 1.56% A |
Supplemental Data | | |
Net assets, end of period (000 omitted) | $ 20,992 | $ 13,343 |
Portfolio turnover rate | 24% | 24% A |
A Annualized
B Total returns for periods of less than one year are not annualized.
C Total returns do not reflect charges attributable to your insurance company's separate account. Inclusion of these charges would reduce the total returns shown.
D Total returns would have been lower had certain expenses not been reduced during the periods shown.
E Calculated based on average shares outstanding during the period.
F Amounts do not include the activity of the underlying funds.
G For the period April 26, 2005 (commencement of operations) to December 31, 2005.
H Expense ratios reflect operating expenses of the class. Expenses before reductions do not reflect amounts reimbursed by the investment adviser or expense offset arrangements and do not represent the amount paid by the class during periods when reimbursements or reductions occur. Expense ratios before reductions for start-up periods may not be representative of longer-term operating periods. Expenses net of fee waivers reflect expenses after reimbursement by the investment adviser but prior to reductions from expense offset arrangements. Expenses net of all reductions represent the net expenses paid by the class but do not include expenses of the investment companies in which the Fund invests.
See accompanying notes which are an integral part of the financial statements.
Annual Report
Financial Highlights - Service Class
Years ended December 31, | 2006 | 2005 G |
Selected Per-Share Data | | |
Net asset value, beginning of period | $ 10.77 | $ 10.00 |
Income from Investment Operations | | |
Net investment income (loss) E | .27 | .10 |
Net realized and unrealized gain (loss) | .78 | .72 |
Total from investment operations | 1.05 | .82 |
Distributions from net investment income | (.19) | (.05) |
Distributions from net realized gain | (.05) | - |
Total distributions | (.24) | (.05) |
Net asset value, end of period | $ 11.58 | $ 10.77 |
Total Return B, C, D | 9.78% | 8.17% |
Ratios to Average Net Assets F, H | | |
Expenses before reductions | .10% | .10% A |
Expenses net of fee waivers, if any | .10% | .10% A |
Expenses net of all reductions | .10% | .10% A |
Net investment income (loss) | 2.39% | 1.46% A |
Supplemental Data | | |
Net assets, end of period (000 omitted) | $ 5,984 | $ 764 |
Portfolio turnover rate | 24% | 24% A |
A Annualized
B Total returns for periods of less than one year are not annualized.
C Total returns do not reflect charges attributable to your insurance company's separate account. Inclusion of these charges would reduce the total returns shown.
D Total returns would have been lower had certain expenses not been reduced during the periods shown.
E Calculated based on average shares outstanding during the period.
F Amounts do not include the activity of the underlying funds.
G For the period April 26, 2005 (commencement of operations) to December 31, 2005.
H Expense ratios reflect operating expenses of the class. Expenses before reductions do not reflect amounts reimbursed by the investment adviser or expense offset arrangements and do not represent the amount paid by the class during periods when reimbursements or reductions occur. Expense ratios before reductions for start-up periods may not be representative of longer-term operating periods. Expenses net of fee waivers reflect expenses after reimbursement by the investment adviser but prior to reductions from expense offset arrangements. Expenses net of all reductions represent the net expenses paid by the class but do not include expenses of the investment companies in which the Fund invests.
Financial Highlights - Service Class 2
Years ended December 31, | 2006 | 2005 G |
Selected Per-Share Data | | |
Net asset value, beginning of period | $ 10.76 | $ 10.00 |
Income from Investment Operations | | |
Net investment income (loss) E | .25 | .09 |
Net realized and unrealized gain (loss) | .78 | .72 |
Total from investment operations | 1.03 | .81 |
Distributions from net investment income | (.18) | (.05) |
Distributions from net realized gain | (.05) | - |
Total distributions | (.23) | (.05) |
Net asset value, end of period | $ 11.56 | $ 10.76 |
Total Return B, C, D | 9.58% | 8.07% |
Ratios to Average Net Assets F, H | | |
Expenses before reductions | .25% | .25% A |
Expenses net of fee waivers, if any | .25% | .25% A |
Expenses net of all reductions | .25% | .25% A |
Net investment income (loss) | 2.24% | 1.31% A |
Supplemental Data | | |
Net assets, end of period (000 omitted) | $ 38,662 | $ 9,702 |
Portfolio turnover rate | 24% | 24% A |
A Annualized
B Total returns for periods of less than one year are not annualized.
C Total returns do not reflect charges attributable to your insurance company's separate account. Inclusion of these charges would reduce the total returns shown.
D Total returns would have been lower had certain expenses not been reduced during the periods shown.
E Calculated based on average shares outstanding during the period.
F Amounts do not include the activity of the underlying funds.
G For the period April 26, 2005 (commencement of operations) to December 31, 2005.
H Expense ratios reflect operating expenses of the class. Expenses before reductions do not reflect amounts reimbursed by the investment adviser or expense offset arrangements and do not represent the amount paid by the class during periods when reimbursements or reductions occur. Expense ratios before reductions for start-up periods may not be representative of longer-term operating periods. Expenses net of fee waivers reflect expenses after reimbursement by the investment adviser but prior to reductions from expense offset arrangements. Expenses net of all reductions represent the net expenses paid by the class but do not include expenses of the investment companies in which the Fund invests.
See accompanying notes which are an integral part of the financial statements.
VIP Freedom Funds Portfolio
VIP Freedom 2015 Portfolio
Investment Changes
Fund Holdings as of December 31, 2006 |
| % of fund's investments | % of fund's investments 6 months ago |
Domestic Equity Funds | | |
VIP Contrafund Portfolio Initial Class | 7.4 | 7.6 |
VIP Equity-Income Portfolio Initial Class | 8.7 | 8.9 |
VIP Growth & Income Portfolio Initial Class | 8.6 | 8.8 |
VIP Growth Portfolio Initial Class | 8.4 | 8.8 |
VIP Mid Cap Portfolio Initial Class | 3.1 | 3.1 |
VIP Value Portfolio Initial Class | 7.3 | 7.6 |
VIP Value Strategies Portfolio Initial Class | 3.1 | 3.1 |
| 46.6 | 47.9 |
International Equity Funds | | |
VIP Overseas Portfolio Initial Class | 12.1 | 9.6 |
High Yield Fixed-Income Funds | | |
VIP High Income Portfolio Initial Class | 6.3 | 6.7 |
Investment Grade Fixed-Income Funds | | |
VIP Investment Grade Bond Portfolio Initial Class | 30.2 | 31.6 |
Short-Term Funds | | |
VIP Money Market Portfolio Initial Class | 4.8 | 4.2 |
| 100.0 | 100.0 |
Asset Allocation (% of fund's investments) |
Current |
| Domestic Equity Funds | 46.6% | |
| International Equity Funds | 12.1% | |
| Investment Grade Fixed-Income Funds | 30.2% | |
| High Yield Fixed-Income Funds | 6.3% | |
| Short-Term Funds | 4.8% | |

Six months ago |
| Domestic Equity Funds | 47.9% | |
| International Equity Funds | 9.6% | |
| Investment Grade Fixed-Income Funds | 31.6% | |
| High Yield Fixed-Income Funds | 6.7% | |
| Short-Term Funds | 4.2% | |

Expected |
| Domestic Equity Funds | 45.1% | |
| International Equity Funds | 11.3% | |
| Investment Grade Fixed-Income Funds | 31.6% | |
| High Yield Fixed-Income Funds | 6.0% | |
| Short-Term Funds | 6.0% | |

The fund invests according to an asset allocation strategy that becomes increasingly conservative over time. The six months ago allocation is based on the fund's holdings as of June 30, 2006. The current allocation is based on the fund's holdings as of December 31, 2006. The expected allocation represents the fund's anticipated allocation at June 30, 2007. Beginning in March 2006, the fund changed its asset allocation strategy, resulting in an increased emphasis on international equity. |
Annual Report
VIP Freedom 2015 Portfolio
Investments December 31, 2006
Showing Percentage of Total Value of Investment in Securities
Equity Funds - 58.7% |
| Shares | | Value (Note 1) |
Domestic Equity Funds - 46.6% |
VIP Contrafund Portfolio Initial Class | 80,026 | | $ 2,518,406 |
VIP Equity-Income Portfolio Initial Class | 113,282 | | 2,968,001 |
VIP Growth & Income Portfolio Initial Class | 181,676 | | 2,928,622 |
VIP Growth Portfolio Initial Class | 79,924 | | 2,866,856 |
VIP Mid Cap Portfolio Initial Class | 30,371 | | 1,055,994 |
VIP Value Portfolio Initial Class | 175,617 | | 2,507,817 |
VIP Value Strategies Portfolio Initial Class | 78,839 | | 1,061,968 |
TOTAL DOMESTIC EQUITY FUNDS | | 15,907,664 |
International Equity Funds - 12.1% |
VIP Overseas Portfolio Initial Class | 172,110 | | 4,125,476 |
TOTAL EQUITY FUNDS (Cost $18,158,979) | 20,033,140 |
Fixed-Income Funds - 36.5% |
| | | |
High Yield Fixed-Income Funds - 6.3% |
VIP High Income Portfolio Initial Class | 338,746 | | 2,151,034 |
Investment Grade Fixed-Income Funds - 30.2% |
VIP Investment Grade Bond Portfolio Initial Class | 806,348 | | 10,289,005 |
TOTAL FIXED-INCOME FUNDS (Cost $12,259,044) | 12,440,039 |
Short-Term Funds - 4.8% |
| | | |
VIP Money Market Portfolio Initial Class (Cost $1,651,671) | 1,651,671 | | 1,651,671 |
TOTAL INVESTMENT IN SECURITIES - 100% (Cost $32,069,694) | $ 34,124,850 |
See accompanying notes which are an integral part of the financial statements.
Annual Report
VIP Freedom 2015 Portfolio
Financial Statements
Statement of Assets and Liabilities
| December 31, 2006 |
| | |
Assets | | |
Investment in securities, at value (cost $32,069,694) - See accompanying schedule | | $ 34,124,850 |
Cash | | 81 |
Dividends receivable from underlying funds | | 453 |
Total assets | | 34,125,384 |
| | |
Liabilities | | |
Distribution fees payable | | 2,027 |
| | |
Net Assets | | $ 34,123,357 |
Net Assets consist of: | | |
Paid in capital | | $ 31,531,527 |
Undistributed net investment income | | 172,565 |
Accumulated undistributed net realized gain (loss) on investments | | 364,109 |
Net unrealized appreciation (depreciation) on investments | | 2,055,156 |
Net Assets | | $ 34,123,357 |
| | |
Initial Class:
Net Asset Value, offering price and redemption price per share ($23,711,803 ÷ 1,987,982 shares) | | $ 11.93 |
| | |
Service Class:
Net Asset Value, offering price and redemption price per share ($427,213 ÷ 35,815 shares) | | $ 11.93 |
| | |
Service Class 2:
Net Asset Value, offering price and redemption price per share ($9,984,341 ÷ 838,602 shares) | | $ 11.91 |
Statement of Operations
| Year ended December 31, 2006 |
| | |
Investment Income | | |
Income distributions from underlying funds | | $ 564,031 |
Interest | | 76 |
Total income | | 564,107 |
| | |
Expenses | | |
Distribution fees | $ 11,136 | |
Independent trustees' compensation | 76 | |
Total expenses before reductions | 11,212 | |
Expense reductions | (76) | 11,136 |
Net investment income (loss) | | 552,971 |
Realized and Unrealized Gain (Loss) Realized gain (loss) on sale of underlying fund shares | (86,329) | |
Capital gain distributions from underlying funds | 713,599 | 627,270 |
Change in net unrealized appreciation (depreciation) on underlying funds | | 1,475,662 |
Net gain (loss) | | 2,102,932 |
Net increase (decrease) in net assets resulting from operations | | $ 2,655,903 |
See accompanying notes which are an integral part of the financial statements.
Annual Report
VIP Freedom 2015 Portfolio
Financial Statements - continued
Statement of Changes in Net Assets
| Year ended
December 31, 2006 | For the period
April 26, 2005
(commencement
of operations) to
December 31, 2005 |
Increase (Decrease) in Net Assets | | |
Operations | | |
Net investment income (loss) | $ 552,971 | $ 81,936 |
Net realized gain (loss) | 627,270 | (11,496) |
Change in net unrealized appreciation (depreciation) | 1,475,662 | 579,494 |
Net increase (decrease) in net assets resulting from operations | 2,655,903 | 649,934 |
Distributions to shareholders from net investment income | (379,299) | (82,427) |
Distributions to shareholders from net realized gain | (252,774) | - |
Total distributions | (632,073) | (82,427) |
Share transactions - net increase (decrease) | 17,131,091 | 14,400,929 |
Total increase (decrease) in net assets | 19,154,921 | 14,968,436 |
| | |
Net Assets | | |
Beginning of period | 14,968,436 | - |
End of period (including undistributed net investment income of $172,565 and undistributed net investment income of $0, respectively) | $ 34,123,357 | $ 14,968,436 |
Financial Highlights - Initial Class
Years ended December 31, | 2006 | 2005 G |
Selected Per-Share Data | | |
Net asset value, beginning of period | $ 10.95 | $ 10.00 |
Income from Investment Operations | | |
Net investment income (loss) E | .27 | .11 |
Net realized and unrealized gain (loss) | .94 | .90 |
Total from investment operations | 1.21 | 1.01 |
Distributions from net investment income | (.14) | (.06) |
Distributions from net realized gain | (.09) | - |
Total distributions | (.23) | (.06) |
Net asset value, end of period | $ 11.93 | $ 10.95 |
Total Return B, C, D | 11.04% | 10.11% |
Ratios to Average Net Assets F, H | | |
Expenses before reductions | .00% | .00% A |
Expenses net of fee waivers, if any | .00% | .00% A |
Expenses net of all reductions | .00% | .00% A |
Net investment income (loss) | 2.34% | 1.50% A |
Supplemental Data | | |
Net assets, end of period (000 omitted) | $ 23,712 | $ 13,930 |
Portfolio turnover rate | 24% | 38% A |
A Annualized
B Total returns for periods of less than one year are not annualized.
C Total returns do not reflect charges attributable to your insurance company's separate account. Inclusion of these charges would reduce the total returns shown.
D Total returns would have been lower had certain expenses not been reduced during the periods shown.
E Calculated based on average shares outstanding during the period.
F Amounts do not include the activity of the underlying funds.
G For the period April 26, 2005 (commencement of operations) to December 31, 2005.
H Expense ratios reflect operating expenses of the class. Expenses before reductions do not reflect amounts reimbursed by the investment adviser or expense offset arrangements and do not represent the amount paid by the class during periods when reimbursements or reductions occur. Expense ratios before reductions for start-up periods may not be representative of longer-term operating periods. Expenses net of fee waivers reflect expenses after reimbursement by the investment adviser but prior to reductions from expense offset arrangements. Expenses net of all reductions represent the net expenses paid by the class but do not include expenses of the investment companies in which the Fund invests.
See accompanying notes which are an integral part of the financial statements.
VIP Freedom Funds Portfolio
Financial Highlights - Service Class
Years ended December 31, | 2006 | 2005 G |
Selected Per-Share Data | | |
Net asset value, beginning of period | $ 10.95 | $ 10.00 |
Income from Investment Operations | | |
Net investment income (loss) E | .26 | .10 |
Net realized and unrealized gain (loss) | .94 | .90 |
Total from investment operations | 1.20 | 1.00 |
Distributions from net investment income | (.13) | (.05) |
Distributions from net realized gain | (.09) | - |
Total distributions | (.22) | (.05) |
Net asset value, end of period | $ 11.93 | $ 10.95 |
Total Return B, C, D | 10.94% | 10.04% |
Ratios to Average Net Assets F, H | | |
Expenses before reductions | .10% | .10% A |
Expenses net of fee waivers, if any | .10% | .10% A |
Expenses net of all reductions | .10% | .10% A |
Net investment income (loss) | 2.24% | 1.40% A |
Supplemental Data | | |
Net assets, end of period (000 omitted) | $ 427 | $ 385 |
Portfolio turnover rate | 24% | 38% A |
A Annualized
B Total returns for periods of less than one year are not annualized.
C Total returns do not reflect charges attributable to your insurance company's separate account. Inclusion of these charges would reduce the total returns shown.
D Total returns would have been lower had certain expenses not been reduced during the periods shown.
E Calculated based on average shares outstanding during the period.
F Amounts do not include the activity of the underlying funds.
G For the period April 26, 2005 (commencement of operations) to December 31, 2005.
H Expense ratios reflect operating expenses of the class. Expenses before reductions do not reflect amounts reimbursed by the investment adviser or expense offset arrangements and do not represent the amount paid by the class during periods when reimbursements or reductions occur. Expense ratios before reductions for start-up periods may not be representative of longer-term operating periods. Expenses net of fee waivers reflect expenses after reimbursement by the investment adviser but prior to reductions from expense offset arrangements. Expenses net of all reductions represent the net expenses paid by the class but do not include expenses of the investment companies in which the Fund invests.
Financial Highlights - Service Class 2
Years ended December 31, | 2006 | 2005 G |
Selected Per-Share Data | | |
Net asset value, beginning of period | $ 10.94 | $ 10.00 |
Income from Investment Operations | | |
Net investment income (loss) E | .24 | .09 |
Net realized and unrealized gain (loss) | .95 | .90 |
Total from investment operations | 1.19 | .99 |
Distributions from net investment income | (.13) | (.05) |
Distributions from net realized gain | (.09) | - |
Total distributions | (.22) | (.05) |
Net asset value, end of period | $ 11.91 | $ 10.94 |
Total Return B, C, D | 10.84% | 9.90% |
Ratios to Average Net Assets F, H | | |
Expenses before reductions | .25% | .25%A |
Expenses net of fee waivers, if any | .25% | .25%A |
Expenses net of all reductions | .25% | .25%A |
Net investment income (loss) | 2.09% | 1.25%A |
Supplemental Data | | |
Net assets, end of period (000 omitted) | $ 9,984 | $ 653 |
Portfolio turnover rate | 24% | 38%A |
A Annualized
B Total returns for periods of less than one year are not annualized.
C Total returns do not reflect charges attributable to your insurance company's separate account. Inclusion of these charges would reduce the total returns shown.
D Total returns would have been lower had certain expenses not been reduced during the periods shown.
E Calculated based on average shares outstanding during the period.
F Amounts do not include the activity of the underlying funds.
G For the period April 26, 2005 (commencement of operations) to December 31, 2005.
H Expense ratios reflect operating expenses of the class. Expenses before reductions do not reflect amounts reimbursed by the investment adviser or expense offset arrangements and do not represent the amount paid by the class during periods when reimbursements or reductions occur. Expense ratios before reductions for start-up periods may not be representative of longer-term operating periods. Expenses net of fee waivers reflect expenses after reimbursement by the investment adviser but prior to reductions from expense offset arrangements. Expenses net of all reductions represent the net expenses paid by the class but do not include expenses of the investment companies in which the Fund invests.
See accompanying notes which are an integral part of the financial statements.
Annual Report
VIP Freedom 2020 Portfolio
Investment Changes
Fund Holdings as of December 31, 2006 |
| % of fund's investments | % of fund's investments 6 months ago |
Domestic Equity Funds | | |
VIP Contrafund Portfolio Initial Class | 8.7 | 9.0 |
VIP Equity-Income Portfolio Initial Class | 10.3 | 10.5 |
VIP Growth & Income Portfolio Initial Class | 10.1 | 10.4 |
VIP Growth Portfolio Initial Class | 9.9 | 10.3 |
VIP Mid Cap Portfolio Initial Class | 3.6 | 3.6 |
VIP Value Portfolio Initial Class | 8.7 | 8.9 |
VIP Value Strategies Portfolio Initial Class | 3.7 | 3.7 |
| 55.0 | 56.4 |
International Equity Funds | | |
VIP Overseas Portfolio Initial Class | 14.2 | 11.5 |
High Yield Fixed-Income Funds | | |
VIP High Income Portfolio Initial Class | 7.5 | 7.7 |
Investment Grade Fixed-Income Funds | | |
VIP Investment Grade Bond Portfolio Initial Class | 23.1 | 24.2 |
Short-Term Funds | | |
VIP Money Market Portfolio Initial Class | 0.2 | 0.2 |
| 100.0 | 100.0 |
Asset Allocation (% of fund's investments) |
Current |
| Domestic Equity Funds | 55.0% | |
| International Equity Funds | 14.2% | |
| Investment Grade Fixed-Income Funds | 23.1% | |
| High Yield Fixed-Income Funds | 7.5% | |
| Short-Term Funds | 0.2% | |

Six months ago |
| Domestic Equity Funds | 56.4% | |
| International Equity Funds | 11.5% | |
| Investment Grade Fixed-Income Funds | 24.2% | |
| High Yield Fixed-Income Funds | 7.7% | |
| Short-Term Funds | 0.2% | |

Expected |
| Domestic Equity Funds | 54.4% | |
| International Equity Funds | 13.6% | |
| Investment Grade Fixed-Income Funds | 24.1% | |
| High Yield Fixed-Income Funds | 7.5% | |
| Short-Term Funds | 0.4% | |

The fund invests according to an asset allocation strategy that becomes increasingly conservative over time. The six months ago allocation is based on the fund's holdings as of June 30, 2006. The current allocation is based on the fund's holdings as of December 31, 2006. The expected allocation represents the fund's anticipated allocation at June 30, 2007. Beginning in March 2006, the fund changed its asset allocation strategy, resulting in an increased emphasis on international equity. |
VIP Freedom Funds Portfolio
VIP Freedom 2020 Portfolio
Investments December 31, 2006
Showing Percentage of Total Value of Investment in Securities
Equity Funds - 69.2% |
| Shares | | Value (Note 1) |
Domestic Equity Funds - 55.0% |
VIP Contrafund Portfolio Initial Class | 234,284 | | $ 7,372,916 |
VIP Equity-Income Portfolio Initial Class | 331,533 | | 8,686,164 |
VIP Growth & Income Portfolio Initial Class | 531,754 | | 8,571,869 |
VIP Growth Portfolio Initial Class | 233,975 | | 8,392,690 |
VIP Mid Cap Portfolio Initial Class | 88,924 | | 3,091,887 |
VIP Value Portfolio Initial Class | 514,155 | | 7,342,131 |
VIP Value Strategies Portfolio Initial Class | 230,820 | | 3,109,152 |
TOTAL DOMESTIC EQUITY FUNDS | | 46,566,809 |
International Equity Funds - 14.2% |
VIP Overseas Portfolio Initial Class | 503,725 | | 12,074,276 |
TOTAL EQUITY FUNDS (Cost $53,639,487) | 58,641,085 |
Fixed-Income Funds - 30.6% |
| | | |
High Yield Fixed-Income Funds - 7.5% |
VIP High Income Portfolio Initial Class | 996,681 | | 6,328,927 |
Investment Grade Fixed-Income Funds - 23.1% |
VIP Investment Grade Bond Portfolio Initial Class | 1,533,455 | | 19,566,891 |
TOTAL FIXED-INCOME FUNDS (Cost $25,593,665) | 25,895,818 |
Short-Term Funds - 0.2% |
| | | |
VIP Money Market Portfolio Initial Class
(Cost $196,649) | 196,649 | | 196,649 |
TOTAL INVESTMENT IN SECURITIES - 100% (Cost $79,429,801) | $ 84,733,552 |
See accompanying notes which are an integral part of the financial statements.
Annual Report
VIP Freedom 2020 Portfolio
Financial Statements
Statement of Assets and Liabilities
| December 31, 2006 |
| | |
Assets | | |
Investment in securities, at value (cost $79,429,801) - See accompanying schedule | | $ 84,733,552 |
Dividends receivable from underlying funds | | 54 |
Total assets | | 84,733,606 |
| | |
Liabilities | | |
Distribution fees payable | | 12,059 |
| | |
Net Assets | | $ 84,721,547 |
Net Assets consist of: | | |
Paid in capital | | $ 78,351,834 |
Undistributed net investment income | | 8,841 |
Accumulated undistributed net realized gain (loss) on investments | | 1,057,121 |
Net unrealized appreciation (depreciation) on investments | | 5,303,751 |
Net Assets | | $ 84,721,547 |
| | |
Initial Class:
Net Asset Value, offering price and redemption price per share ($21,356,159 ÷ 1,764,524 shares) | | $ 12.10 |
| | |
Service Class:
Net Asset Value, offering price and redemption price per share ($6,555,389 ÷ 542,066 shares) | | $ 12.09 |
| | |
Service Class 2:
Net Asset Value, offering price and redemption price per share ($56,809,999 ÷ 4,703,447 shares) | | $ 12.08 |
Statement of Operations
| Year ended December 31, 2006 |
| | |
Investment Income | | |
Income distributions from underlying funds | | $ 1,269,017 |
Interest | | 283 |
Total income | | 1,269,300 |
| | |
Expenses | | |
Distribution fees | $ 90,829 | |
Independent trustees' compensation | 179 | |
Total expenses before reductions | 91,008 | |
Expense reductions | (179) | 90,829 |
Net investment income (loss) | | 1,178,471 |
Realized and Unrealized Gain (Loss) Realized gain (loss) on sale of underlying fund shares | (159,421) | |
Capital gain distributions from underlying funds | 1,975,759 | 1,816,338 |
Change in net unrealized appreciation (depreciation) on underlying funds | | 4,058,003 |
Net gain (loss) | | 5,874,341 |
Net increase (decrease) in net assets resulting from operations | | $ 7,052,812 |
See accompanying notes which are an integral part of the financial statements.
VIP Freedom Funds Portfolio
Statement of Changes in Net Assets
| Year ended
December 31, 2006 | For the period
April 26, 2005
(commencement
of operations) to
December 31, 2005 |
Increase (Decrease) in Net Assets | | |
Operations | | |
Net investment income (loss) | $ 1,178,471 | $ 181,643 |
Net realized gain (loss) | 1,816,338 | (5,878) |
Change in net unrealized appreciation (depreciation) | 4,058,003 | 1,245,748 |
Net increase (decrease) in net assets resulting from operations | 7,052,812 | 1,421,513 |
Distributions to shareholders from net investment income | (1,169,624) | (183,754) |
Distributions to shareholders from net realized gain | (753,339) | - |
Total distributions | (1,922,963) | (183,754) |
Share transactions - net increase (decrease) | 45,506,036 | 32,847,903 |
Total increase (decrease) in net assets | 50,635,885 | 34,085,662 |
| | |
Net Assets | | |
Beginning of period | 34,085,662 | - |
End of period (including undistributed net investment income of $8,841 and undistributed net investment income of $0, respectively) | $ 84,721,547 | $ 34,085,662 |
Financial Highlights - Initial Class
Years ended December 31, | 2006 | 2005 G |
Selected Per-Share Data | | |
Net asset value, beginning of period | $ 11.07 | $ 10.00 |
Income from Investment Operations | | |
Net investment income (loss) E | .26 | .13 |
Net realized and unrealized gain (loss) | 1.06 | 1.00 |
Total from investment operations | 1.32 | 1.13 |
Distributions from net investment income | (.18) | (.06) |
Distributions from net realized gain | (.11) | - |
Total distributions | (.29) | (.06) |
Net asset value, end of period | $ 12.10 | $ 11.07 |
Total Return B, C, D | 11.95% | 11.34% |
Ratios to Average Net Assets F, H | | |
Expenses before reductions | .00% | .00% A |
Expenses net of fee waivers, if any | .00% | .00% A |
Expenses net of all reductions | .00% | .00% A |
Net investment income (loss) | 2.21% | 1.80% A |
Supplemental Data | | |
Net assets, end of period (000 omitted) | $ 21,356 | $ 16,085 |
Portfolio turnover rate | 21% | 14% A |
A Annualized
B Total returns for periods of less than one year are not annualized.
C Total returns do not reflect charges attributable to your insurance company's separate account. Inclusion of these charges would reduce the total returns shown.
D Total returns would have been lower had certain expenses not been reduced during the periods shown.
E Calculated based on average shares outstanding during the period.
F Amounts do not include the activity of the underlying funds.
G For the period April 26, 2005 (commencement of operations) to December 31, 2005.
H Expense ratios reflect operating expenses of the class. Expenses before reductions do not reflect amounts reimbursed by the investment adviser or expense offset arrangements and do not represent the amount paid by the class during periods when reimbursements or reductions occur. Expense ratios before reductions for start-up periods may not be representative of longer-term operating periods. Expenses net of fee waivers reflect expenses after reimbursement by the investment adviser but prior to reductions from expense offset arrangements. Expenses net of all reductions represent the net expenses paid by the class but do not include expenses of the investment companies in which the Fund invests.
See accompanying notes which are an integral part of the financial statements.
Annual Report
Financial Highlights - Service Class
Years ended December 31, | 2006 | 2005 G |
Selected Per-Share Data | | |
Net asset value, beginning of period | $ 11.07 | $ 10.00 |
Income from Investment Operations | | |
Net investment income (loss) E | .25 | .12 |
Net realized and unrealized gain (loss) | 1.06 | 1.01 |
Total from investment operations | 1.31 | 1.13 |
Distributions from net investment income | (.18) | (.06) |
Distributions from net realized gain | (.11) | - |
Total distributions | (.29) | (.06) |
Net asset value, end of period | $ 12.09 | $ 11.07 |
Total Return B, C, D | 11.81% | 11.30% |
Ratios to Average Net Assets F, H | | |
Expenses before reductions | .10% | .10% A |
Expenses net of fee waivers, if any | .10% | .10% A |
Expenses net of all reductions | .10% | .10% A |
Net investment income (loss) | 2.11% | 1.70% A |
Supplemental Data | | |
Net assets, end of period (000 omitted) | $ 6,555 | $ 1,586 |
Portfolio turnover rate | 21% | 14% A |
A Annualized
B Total returns for periods of less than one year are not annualized.
C Total returns do not reflect charges attributable to your insurance company's separate account. Inclusion of these charges would reduce the total returns shown.
D Total returns would have been lower had certain expenses not been reduced during the periods shown.
E Calculated based on average shares outstanding during the period.
F Amounts do not include the activity of the underlying funds.
G For the period April 26, 2005 (commencement of operations) to December 31, 2005.
H Expense ratios reflect operating expenses of the class. Expenses before reductions do not reflect amounts reimbursed by the investment adviser or expense offset arrangements and do not represent the amount paid by the class during periods when reimbursements or reductions occur. Expense ratios before reductions for start-up periods may not be representative of longer-term operating periods. Expenses net of fee waivers reflect expenses after reimbursement by the investment adviser but prior to reductions from expense offset arrangements. Expenses net of all reductions represent the net expenses paid by the class but do not include expenses of the investment companies in which the Fund invests.
Financial Highlights - Service Class 2
Years ended December 31, | 2006 | 2005 G |
Selected Per-Share Data | | |
Net asset value, beginning of period | $ 11.06 | $ 10.00 |
Income from Investment Operations | | |
Net investment income (loss) E | .23 | .11 |
Net realized and unrealized gain (loss) | 1.07 | 1.01 |
Total from investment operations | 1.30 | 1.12 |
Distributions from net investment income | (.17) | (.06) |
Distributions from net realized gain | (.11) | - |
Total distributions | (.28) | (.06) |
Net asset value, end of period | $ 12.08 | $ 11.06 |
Total Return B, C, D | 11.70% | 11.17% |
Ratios to Average Net Assets F, H | | |
Expenses before reductions | .25% | .25% A |
Expenses net of fee waivers, if any | .25% | .25% A |
Expenses net of all reductions | .25% | .25% A |
Net investment income (loss) | 1.96% | 1.55% A |
Supplemental Data | | |
Net assets, end of period (000 omitted) | $ 56,810 | $ 16,414 |
Portfolio turnover rate | 21% | 14% A |
A Annualized
B Total returns for periods of less than one year are not annualized.
C Total returns do not reflect charges attributable to your insurance company's separate account. Inclusion of these charges would reduce the total returns shown.
D Total returns would have been lower had certain expenses not been reduced during the periods shown.
E Calculated based on average shares outstanding during the period.
F Amounts do not include the activity of the underlying funds.
G For the period April 26, 2005 (commencement of operations) to December 31, 2005.
H Expense ratios reflect operating expenses of the class. Expenses before reductions do not reflect amounts reimbursed by the investment adviser or expense offset arrangements and do not represent the amount paid by the class during periods when reimbursements or reductions occur. Expense ratios before reductions for start-up periods may not be representative of longer-term operating periods. Expenses net of fee waivers reflect expenses after reimbursement by the investment adviser but prior to reductions from expense offset arrangements. Expenses net of all reductions represent the net expenses paid by the class but do not include expenses of the investment companies in which the Fund invests.
See accompanying notes which are an integral part of the financial statements.
VIP Freedom Funds Portfolio
VIP Freedom 2025 Portfolio
Investment Changes
Fund Holdings as of December 31, 2006 |
| % of fund's
investments | % of fund's investments
6 months ago |
Domestic Equity Funds | | |
VIP Contrafund Portfolio Initial Class | 9.1 | 9.4 |
VIP Equity-Income Portfolio Initial Class | 10.7 | 11.0 |
VIP Growth & Income Portfolio Initial Class | 10.6 | 11.0 |
VIP Growth Portfolio Initial Class | 10.3 | 10.9 |
VIP Mid Cap Portfolio Initial Class | 3.8 | 3.8 |
VIP Value Portfolio Initial Class | 9.1 | 9.4 |
VIP Value Strategies Portfolio Initial Class | 3.8 | 3.9 |
| 57.4 | 59.4 |
International Equity Funds | | |
VIP Overseas Portfolio Initial Class | 15.0 | 12.5 |
High Yield Fixed-Income Funds | | |
VIP High Income Portfolio Initial Class | 7.5 | 7.8 |
Investment Grade Fixed-Income Funds | | |
VIP Investment Grade Bond Portfolio Initial Class | 20.1 | 20.3 |
| 100.0 | 100.0 |
Asset Allocation (% of fund's investments) |
Current |
| Domestic Equity Funds | 57.4% | |
| International Equity Funds | 15.0% | |
| Investment Grade Fixed-Income Funds | 20.1% | |
| High Yield Fixed-Income Funds | 7.5% | |

Six months ago |
| Domestic Equity Funds | 59.4% | |
| International Equity Funds | 12.5% | |
| Investment Grade Fixed-Income Funds | 20.3% | |
| High Yield Fixed-Income Funds | 7.8% | |

Expected |
| Domestic Equity Funds | 56.8% | |
| International Equity Funds | 14.2% | |
| Investment Grade Fixed-Income Funds | 21.5% | |
| High Yield Fixed-Income Funds | 7.5% | |

The fund invests according to an asset allocation strategy that becomes increasingly conservative over time. The six months ago allocation is based on the fund's holdings as of June 30, 2006. The current allocation is based on the fund's holdings as of December 31, 2006. The expected allocation represents the fund's anticipated allocation at June 30, 2007. Beginning in March 2006, the fund changed its asset allocation strategy, resulting in an increased emphasis on international equity. |
Annual Report
VIP Freedom 2025 Portfolio
Investments December 31, 2006
Showing Percentage of Total Value of Investment in Securities
Equity Funds - 72.4% |
| Shares | | Value (Note 1) |
Domestic Equity Funds - 57.4% |
VIP Contrafund Portfolio Initial Class | 27,033 | | $ 850,733 |
VIP Equity-Income Portfolio Initial Class | 38,301 | | 1,003,480 |
VIP Growth & Income Portfolio Initial Class | 61,365 | | 989,211 |
VIP Growth Portfolio Initial Class | 26,931 | | 966,004 |
VIP Mid Cap Portfolio Initial Class | 10,270 | | 357,074 |
VIP Value Portfolio Initial Class | 59,253 | | 846,126 |
VIP Value Strategies Portfolio Initial Class | 26,655 | | 359,042 |
TOTAL DOMESTIC EQUITY FUNDS | | 5,371,670 |
International Equity Funds - 15.0% |
VIP Overseas Portfolio Initial Class | 58,765 | | 1,408,609 |
TOTAL EQUITY FUNDS (Cost $5,990,182) | 6,780,279 |
Fixed-Income Funds - 27.6% |
| | | |
High Yield Fixed-Income Funds - 7.5% |
VIP High Income Portfolio Initial Class | 110,342 | | 700,671 |
Investment Grade Fixed-Income Funds - 20.1% |
VIP Investment Grade Bond Portfolio Initial Class | 147,286 | | 1,879,363 |
TOTAL FIXED-INCOME FUNDS (Cost $2,545,507) | 2,580,034 |
TOTAL INVESTMENT IN SECURITIES - 100% (Cost $8,535,689) | $ 9,360,313 |
See accompanying notes which are an integral part of the financial statements.
VIP Freedom Funds Portfolio
VIP Freedom 2025 Portfolio
Financial Statements
Statement of Assets and Liabilities
| December 31, 2006 |
Assets | | |
Investment in securities, at value (cost $8,535,689) - See accompanying schedule | | $ 9,360,313 |
Cash | | 10 |
Total assets | | 9,360,323 |
| | |
Liabilities | | |
Distribution fees payable | | 151 |
| | |
Net Assets | | $ 9,360,172 |
Net Assets consist of: | | |
Paid in capital | | $ 8,381,144 |
Accumulated undistributed net realized gain (loss) on investments | | 154,404 |
Net unrealized appreciation (depreciation) on investments | | 824,624 |
Net Assets | | $ 9,360,172 |
Initial Class:
Net Asset Value, offering price and redemption price per share ($8,363,463 ÷ 686,615 shares) | | $ 12.18 |
| | |
Service Class:
Net Asset Value, offering price and redemption price per share ($441,181 ÷ 36,229 shares) | | $ 12.18 |
| | |
Service Class 2:
Net Asset Value, offering price and redemption price per share ($555,528 ÷ 45,645 shares) | | $ 12.17 |
Statement of Operations
| Year ended December 31, 2006 |
Investment Income | | |
Income distributions from underlying funds | | $ 151,977 |
Interest | | 5 |
Total income | | 151,982 |
| | |
Expenses | | |
Distribution fees | $ 1,486 | |
Independent trustees' compensation | 25 | |
Total expenses before reductions | 1,511 | |
Expense reductions | (25) | 1,486 |
Net investment income (loss) | | 150,496 |
Realized and Unrealized Gain (Loss) Realized gain (loss) on sale of underlying fund shares | 15,928 | |
Capital gain distributions from underlying funds | 268,051 | 283,979 |
Change in net unrealized appreciation (depreciation) on underlying funds | | 528,242 |
Net gain (loss) | | 812,221 |
Net increase (decrease) in net assets resulting from operations | | $ 962,717 |
See accompanying notes which are an integral part of the financial statements.
Annual Report
VIP Freedom 2025 Portfolio
Financial Statements - continued
Statement of Changes in Net Assets
| Year ended
December 31,
2006 | For the period
April 26, 2005
(commencement
of operations) to
December 31, 2005 |
Increase (Decrease) in Net Assets | | |
Operations | | |
Net investment income (loss) | $ 150,496 | $ 31,400 |
Net realized gain (loss) | 283,979 | (2,025) |
Change in net unrealized appreciation (depreciation) | 528,242 | 296,382 |
Net increase (decrease) in net assets resulting from operations | 962,717 | 325,757 |
Distributions to shareholders from net investment income | (151,306) | (31,744) |
Distributions to shareholders from net realized gain | (126,743) | - |
Total distributions | (278,049) | (31,744) |
Share transactions - net increase (decrease) | 3,065,781 | 5,315,710 |
Total increase (decrease) in net assets | 3,750,449 | 5,609,723 |
| | |
Net Assets | | |
Beginning of period | 5,609,723 | - |
End of period | $ 9,360,172 | $ 5,609,723 |
Financial Highlights - Initial Class
Years ended December 31, | 2006 | 2005 G |
Selected Per-Share Data | | |
Net asset value, beginning of period | $ 11.16 | $ 10.00 |
Income from Investment Operations | | |
Net investment income (loss) E | .23 | .11 |
Net realized and unrealized gain (loss) | 1.17 | 1.12 |
Total from investment operations | 1.40 | 1.23 |
Distributions from net investment income | (.21) | (.07) |
Distributions from net realized gain | (.17) | - |
Total distributions | (.38) | (.07) |
Net asset value, end of period | $ 12.18 | $ 11.16 |
Total Return B, C, D | 12.49% | 12.25% |
Ratios to Average Net Assets F, H | | |
Expenses before reductions | .00% | .00%A |
Expenses net of fee waivers, if any | .00% | .00%A |
Expenses net of all reductions | .00% | .00%A |
Net investment income (loss) | 1.95% | 1.44%A |
Supplemental Data | | |
Net assets, end of period (000 omitted) | $ 8,363 | $ 4,825 |
Portfolio turnover rate | 49% | 9%A |
A Annualized
B Total returns for periods of less than one year are not annualized.
C Total returns do not reflect charges attributable to your insurance company's separate account. Inclusion of these charges would reduce the total returns shown.
D Total returns would have been lower had certain expenses not been reduced during the periods shown.
E Calculated based on average shares outstanding during the period.
F Amounts do not include the activity of the underlying funds.
G For the period April 26, 2005 (commencement of operations) to December 31, 2005.
H Expense ratios reflect operating expenses of the class. Expenses before reductions do not reflect amounts reimbursed by the investment adviser or expense offset arrangements and do not represent the amount paid by the class during periods when reimbursements or reductions occur. Expense ratios before reductions for start-up periods may not be representative of longer-term operating periods. Expenses net of fee waivers reflect expenses after reimbursement by the investment adviser but prior to reductions from expense offset arrangements. Expenses net of all reductions represent the net expenses paid by the class but do not include expenses of the investment companies in which the Fund invests.
See accompanying notes which are an integral part of the financial statements.
VIP Freedom Funds Portfolio
Financial Highlights - Service Class
Years ended December 31, | 2006 | 2005 G |
Selected Per-Share Data | | |
Net asset value, beginning of period | $ 11.16 | $ 10.00 |
Income from Investment Operations | | |
Net investment income (loss) E | .22 | .10 |
Net realized and unrealized gain (loss) | 1.16 | 1.12 |
Total from investment operations | 1.38 | 1.22 |
Distributions from net investment income | (.19) | (.06) |
Distributions from net realized gain | (.17) | - |
Total distributions | (.36) | (.06) |
Net asset value, end of period | $ 12.18 | $ 11.16 |
Total Return B, C, D | 12.39% | 12.18% |
Ratios to Average Net Assets F, H | | |
Expenses before reductions | .10% | .10%A |
Expenses net of fee waivers, if any | .10% | .10%A |
Expenses net of all reductions | .10% | .10%A |
Net investment income (loss) | 1.85% | 1.34%A |
Supplemental Data | | |
Net assets, end of period (000 omitted) | $ 441 | $ 393 |
Portfolio turnover rate | 49% | 9%A |
A Annualized
B Total returns for periods of less than one year are not annualized.
C Total returns do not reflect charges attributable to your insurance company's separate account. Inclusion of these charges would reduce the total returns shown.
D Total returns would have been lower had certain expenses not been reduced during the periods shown.
E Calculated based on average shares outstanding during the period.
F Amounts do not include the activity of the underlying funds.
G For the period April 26, 2005 (commencement of operations) to December 31, 2005.
H Expense ratios reflect operating expenses of the class. Expenses before reductions do not reflect amounts reimbursed by the investment adviser or expense offset arrangements and do not represent the amount paid by the class during periods when reimbursements or reductions occur. Expense ratios before reductions for start-up periods may not be representative of longer-term operating periods. Expenses net of fee waivers reflect expenses after reimbursement by the investment adviser but prior to reductions from expense offset arrangements. Expenses net of all reductions represent the net expenses paid by the class but do not include expenses of the investment companies in which the Fund invests.
Financial Highlights - Service Class 2
Years ended December 31, | 2006 | 2005 G |
Selected Per-Share Data | | |
Net asset value, beginning of period | $ 11.16 | $ 10.00 |
Income from Investment Operations | | |
Net investment income (loss) E | .20 | .09 |
Net realized and unrealized gain (loss) | 1.16 | 1.12 |
Total from investment operations | 1.36 | 1.21 |
Distributions from net investment income | (.18) | (.05) |
Distributions from net realized gain | (.17) | - |
Total distributions | (.35) | (.05) |
Net asset value, end of period | $ 12.17 | $ 11.16 |
Total Return B, C, D | 12.18% | 12.07% |
Ratios to Average Net Assets F, H | | |
Expenses before reductions | .25% | .25%A |
Expenses net of fee waivers, if any | .25% | .25%A |
Expenses net of all reductions | .25% | .25%A |
Net investment income (loss) | 1.70% | 1.19%A |
Supplemental Data | | |
Net assets, end of period (000 omitted) | $ 556 | $ 392 |
Portfolio turnover rate | 49% | 9% A |
A Annualized
B Total returns for periods of less than one year are not annualized.
C Total returns do not reflect charges attributable to your insurance company's separate account. Inclusion of these charges would reduce the total returns shown.
D Total returns would have been lower had certain expenses not been reduced during the periods shown.
E Calculated based on average shares outstanding during the period.
F Amounts do not include the activity of the underlying funds.
G For the period April 26, 2005 (commencement of operations) to December 31, 2005.
H Expense ratios reflect operating expenses of the class. Expenses before reductions do not reflect amounts reimbursed by the investment adviser or expense offset arrangements and do not represent the amount paid by the class during periods when reimbursements or reductions occur. Expense ratios before reductions for start-up periods may not be representative of longer-term operating periods. Expenses net of fee waivers reflect expenses after reimbursement by the investment adviser but prior to reductions from expense offset arrangements. Expenses net of all reductions represent the net expenses paid by the class but do not include expenses of the investment companies in which the Fund invests.
See accompanying notes which are an integral part of the financial statements.
Annual Report
VIP Freedom 2030 Portfolio
Investment Changes
Fund Holdings as of December 31, 2006 |
| % of fund's
investments | % of fund's investments
6 months ago |
Domestic Equity Funds | | |
VIP Contrafund Portfolio Initial Class | 10.4 | 10.7 |
VIP Equity-Income Portfolio Initial Class | 12.2 | 12.5 |
VIP Growth & Income Portfolio Initial Class | 12.1 | 12.4 |
VIP Growth Portfolio Initial Class | 11.8 | 12.3 |
VIP Mid Cap Portfolio Initial Class | 4.4 | 4.3 |
VIP Value Portfolio Initial Class | 10.3 | 10.7 |
VIP Value Strategies Portfolio Initial Class | 4.4 | 4.4 |
| 65.6 | 67.3 |
International Equity Funds | | |
VIP Overseas Portfolio Initial Class | 17.0 | 14.3 |
High Yield Fixed-Income Funds | | |
VIP High Income Portfolio Initial Class | 7.4 | 7.8 |
Investment Grade Fixed-Income Funds | | |
VIP Investment Grade Bond Portfolio Initial Class | 10.0 | 10.6 |
| 100.0 | 100.0 |
Asset Allocation (% of fund's investments) |
Current |
| Domestic Equity Funds | 65.6% | |
| International Equity Funds | 17.0% | |
| Investment Grade Fixed-Income Funds | 10.0% | |
| High Yield Fixed-Income Funds | 7.4% | |

Six months ago |
| Domestic Equity Funds | 67.3% | |
| International Equity Funds | 14.3% | |
| Investment Grade Fixed-Income Funds | 10.6% | |
| High Yield Fixed-Income Funds | 7.8% | |

Expected |
| Domestic Equity Funds | 65.6% | |
| International Equity Funds | 16.4% | |
| Investment Grade Fixed-Income Funds | 10.5% | |
| High Yield Fixed-Income Funds | 7.5% | |

The fund invests according to an asset allocation strategy that becomes increasingly conservative over time. The six months ago allocation is based on the fund's holdings as of June 30, 2006. The current allocation is based on the fund's holdings as of December 31, 2006. The expected allocation represents the fund's anticipated allocation at June 30, 2007. Beginning in March 2006, the fund changed its asset allocation strategy, resulting in an increased emphasis on international equity. |
VIP Freedom Funds Portfolio
VIP Freedom 2030 Portfolio
Investments December 31, 2006
Showing Percentage of Total Value of Investment in Securities
Equity Funds - 82.6% |
| Shares | | Value (Note 1) |
Domestic Equity Funds - 65.6% |
VIP Contrafund Portfolio Initial Class | 111,899 | | $ 3,521,455 |
VIP Equity-Income Portfolio Initial Class | 158,463 | | 4,151,720 |
VIP Growth & Income Portfolio Initial Class | 254,196 | | 4,097,647 |
VIP Growth Portfolio Initial Class | 111,839 | | 4,011,675 |
VIP Mid Cap Portfolio Initial Class | 42,502 | | 1,477,809 |
VIP Value Portfolio Initial Class | 245,596 | | 3,507,114 |
VIP Value Strategies Portfolio Initial Class | 110,362 | | 1,486,577 |
TOTAL DOMESTIC EQUITY FUNDS | | 22,253,997 |
International Equity Funds - 17.0% |
VIP Overseas Portfolio Initial Class | 240,265 | | 5,759,142 |
TOTAL EQUITY FUNDS (Cost $25,479,107) | 28,013,139 |
Fixed-Income Funds - 17.4% |
| | | |
High Yield Fixed-Income Funds - 7.4% |
VIP High Income Portfolio Initial Class | 398,884 | | 2,532,916 |
Investment Grade Fixed-Income Funds - 10.0% |
VIP Investment Grade Bond Portfolio Initial Class | 265,025 | | 3,381,714 |
TOTAL FIXED-INCOME FUNDS (Cost $5,891,901) | 5,914,630 |
TOTAL INVESTMENT IN SECURITIES - 100% (Cost $31,371,008) | $ 33,927,769 |
See accompanying notes which are an integral part of the financial statements.
Annual Report
VIP Freedom 2030 Portfolio
Financial Statements
Statement of Assets and Liabilities
| December 31, 2006 |
Assets | | |
Investment in securities, at value (cost $31,371,008) - See accompanying schedule | | $ 33,927,769 |
Receivable for fund shares sold | | 15,090 |
Total assets | | 33,942,859 |
| | |
Liabilities | | |
Distribution fees payable | | 3,559 |
| | |
Net Assets | | $ 33,939,300 |
Net Assets consist of: | | |
Paid in capital | | $ 30,870,766 |
Accumulated undistributed net realized gain (loss) on investments | | 511,773 |
Net unrealized appreciation (depreciation) on investments | | 2,556,761 |
Net Assets | | $ 33,939,300 |
Initial Class:
Net Asset Value, offering price and redemption price per share ($14,298,131 ÷ 1,148,954 shares) | | $ 12.44 |
| | |
Service Class:
Net Asset Value, offering price and redemption price per share ($3,866,791 ÷ 310,922 shares) | | $ 12.44 |
| | |
Service Class 2:
Net Asset Value, offering price and redemption price per share ($15,774,378 ÷ 1,270,000 shares) | | $ 12.42 |
Statement of Operations
| Year ended December 31, 2006 |
Investment Income | | |
Income distributions from underlying funds | | $ 484,053 |
Interest | | 60 |
Total income | | 484,113 |
| | |
Expenses | | |
Distribution fees | $ 29,484 | |
Independent trustees' compensation | 75 | |
Total expenses before reductions | 29,559 | |
Expense reductions | (75) | 29,484 |
Net investment income (loss) | | 454,629 |
Realized and Unrealized Gain (Loss) Realized gain (loss) on sale of underlying fund shares | (120,287) | |
Capital gain distributions from underlying funds | 990,902 | 870,615 |
Change in net unrealized appreciation (depreciation) on underlying funds | | 1,738,118 |
Net gain (loss) | | 2,608,733 |
Net increase (decrease) in net assets resulting from operations | | $ 3,063,362 |
See accompanying notes which are an integral part of the financial statements.
VIP Freedom Funds Portfolio
Statement of Changes in Net Assets
| Year ended
December 31,
2006 | For the period
April 26, 2005
(commencement
of operations) to
December 31, 2005 |
Increase (Decrease) in Net Assets | | |
Operations | | |
Net investment income (loss) | $ 454,629 | $ 87,397 |
Net realized gain (loss) | 870,615 | (15,312) |
Change in net unrealized appreciation (depreciation) | 1,738,118 | 818,643 |
Net increase (decrease) in net assets resulting from operations | 3,063,362 | 890,728 |
Distributions to shareholders from net investment income | (470,715) | (87,912) |
Distributions to shareholders from net realized gain | (345,367) | - |
Total distributions | (816,082) | (87,912) |
Share transactions - net increase (decrease) | 15,075,481 | 15,813,723 |
Total increase (decrease) in net assets | 17,322,761 | 16,616,539 |
| | |
Net Assets | | |
Beginning of period | 16,616,539 | - |
End of period | $ 33,939,300 | $ 16,616,539 |
Financial Highlights - Initial Class
Years ended December 31, | 2006 | 2005 G |
Selected Per-Share Data | | |
Net asset value, beginning of period | $ 11.27 | $ 10.00 |
Income from Investment Operations | | |
Net investment income (loss) E | .24 | .13 |
Net realized and unrealized gain (loss) | 1.25 | 1.21 |
Total from investment operations | 1.49 | 1.34 |
Distributions from net investment income | (.19) | (.07) |
Distributions from net realized gain | (.13) | - |
Total distributions | (.32) | (.07) |
Net asset value, end of period | $ 12.44 | $ 11.27 |
Total Return B, C, D | 13.20% | 13.35% |
Ratios to Average Net Assets F, H | | |
Expenses before reductions | .00% | .00%A |
Expenses net of fee waivers, if any | .00% | .00%A |
Expenses net of all reductions | .00% | .00%A |
Net investment income (loss) | 2.05% | 1.71%A |
Supplemental Data | | |
Net assets, end of period (000 omitted) | $ 14,298 | $ 8,262 |
Portfolio turnover rate | 32% | 33% A |
A Annualized
B Total returns for periods of less than one year are not annualized.
C Total returns do not reflect charges attributable to your insurance company's separate account. Inclusion of these charges would reduce the total returns shown.
D Total returns would have been lower had certain expenses not been reduced during the periods shown.
E Calculated based on average shares outstanding during the period.
F Amounts do not include the activity of the underlying funds.
G For the period April 26, 2005 (commencement of operations) to December 31, 2005.
H Expense ratios reflect operating expenses of the class. Expenses before reductions do not reflect amounts reimbursed by the investment adviser or expense offset arrangements and do not represent the amount paid by the class during periods when reimbursements or reductions occur. Expense ratios before reductions for start-up periods may not be representative of longer-term operating periods. Expenses net of fee waivers reflect expenses after reimbursement by the investment adviser but prior to reductions from expense offset arrangements. Expenses net of all reductions represent the net expenses paid by the class but do not include expenses of the investment companies in which the Fund invests.
See accompanying notes which are an integral part of the financial statements.
Annual Report
Financial Highlights - Service Class
Years ended December 31, | 2006 | 2005 G |
Selected Per-Share Data | | |
Net asset value, beginning of period | $ 11.27 | $ 10.00 |
Income from Investment Operations | | |
Net investment income (loss) E | .23 | .12 |
Net realized and unrealized gain (loss) | 1.25 | 1.21 |
Total from investment operations | 1.48 | 1.33 |
Distributions from net investment income | (.18) | (.06) |
Distributions from net realized gain | (.13) | - |
Total distributions | (.31) | (.06) |
Net asset value, end of period | $ 12.44 | $ 11.27 |
Total Return B, C, D | 13.15% | 13.30% |
Ratios to Average Net Assets F, H | | |
Expenses before reductions | .10% | .10%A |
Expenses net of fee waivers, if any | .10% | .10%A |
Expenses net of all reductions | .10% | .10%A |
Net investment income (loss) | 1.95% | 1.62%A |
Supplemental Data | | |
Net assets, end of period (000 omitted) | $ 3,867 | $ 958 |
Portfolio turnover rate | 32% | 33%A |
A Annualized
B Total returns for periods of less than one year are not annualized.
C Total returns do not reflect charges attributable to your insurance company's separate account. Inclusion of these charges would reduce the total returns shown.
D Total returns would have been lower had certain expenses not been reduced during the periods shown.
E Calculated based on average shares outstanding during the period.
F Amounts do not include the activity of the underlying funds.
G For the period April 26, 2005 (commencement of operations) to December 31, 2005.
H Expense ratios reflect operating expenses of the class. Expenses before reductions do not reflect amounts reimbursed by the investment adviser or expense offset arrangements and do not represent the amount paid by the class during periods when reimbursements or reductions occur. Expense ratios before reductions for start-up periods may not be representative of longer-term operating periods. Expenses net of fee waivers reflect expenses after reimbursement by the investment adviser but prior to reductions from expense offset arrangements. Expenses net of all reductions represent the net expenses paid by the class but do not include expenses of the investment companies in which the Fund invests.
Financial Highlights - Service Class 2
Years ended December 31, | 2006 | 2005 G |
Selected Per-Share Data | | |
Net asset value, beginning of period | $ 11.26 | $ 10.00 |
Income from Investment Operations | | |
Net investment income (loss) E | .21 | .11 |
Net realized and unrealized gain (loss) | 1.25 | 1.21 |
Total from investment operations | 1.46 | 1.32 |
Distributions from net investment income | (.17) | (.06) |
Distributions from net realized gain | (.13) | - |
Total distributions | (.30) | (.06) |
Net asset value, end of period | $ 12.42 | $ 11.26 |
Total Return B, C, D | 12.92% | 13.16% |
Ratios to Average Net Assets F, H | | |
Expenses before reductions | .25% | .25%A |
Expenses net of fee waivers, if any | .25% | .25%A |
Expenses net of all reductions | .25% | .25%A |
Net investment income (loss) | 1.80% | 1.47%A |
Supplemental Data | | |
Net assets, end of period (000 omitted) | $ 15,774 | $ 7,396 |
Portfolio turnover rate | 32% | 33%A |
A Annualized
B Total returns for periods of less than one year are not annualized.
C Total returns do not reflect charges attributable to your insurance company's separate account. Inclusion of these charges would reduce the total returns shown.
D Total returns would have been lower had certain expenses not been reduced during the periods shown.
E Calculated based on average shares outstanding during the period.
F Amounts do not include the activity of the underlying funds.
G For the period April 26, 2005 (commencement of operations) to December 31, 2005.
H Expense ratios reflect operating expenses of the class. Expenses before reductions do not reflect amounts reimbursed by the investment adviser or expense offset arrangements and do not represent the amount paid by the class during periods when reimbursements or reductions occur. Expense ratios before reductions for start-up periods may not be representative of longer-term operating periods. Expenses net of fee waivers reflect expenses after reimbursement by the investment adviser but prior to reductions from expense offset arrangements. Expenses net of all reductions represent the net expenses paid by the class but do not include expenses of the investment companies in which the Fund invests.
See accompanying notes which are an integral part of the financial statements.
VIP Freedom Funds Portfolio
Notes to Financial Statements
For the period ended December 31, 2006
1. Significant Accounting Policies.
VIP Freedom Income Portfolio, VIP Freedom 2005 Portfolio, VIP Freedom 2010 Portfolio, VIP Freedom 2015 Portfolio, VIP Freedom 2020 Portfolio, VIP Freedom 2025 Portfolio and VIP Freedom 2030 Portfolio (the Funds) are funds of Variable Insurance Products Fund IV. The Variable Insurance Products Fund IV (the trust) (referred to in this report as Fidelity Variable Insurance Products) is registered under the Investment Company Act of 1940, as amended (the 1940 Act), as an open-end management investment company organized as a Massachusetts business trust. Each Fund is authorized to issue an unlimited number of shares. The Funds invest primarily in a combination of other VIP equity, fixed income, and money market funds (the Underlying Funds) managed by Fidelity Management & Research Company (FMR). Shares of each Fund may only be purchased by insurance companies for the purpose of funding variable annuity or variable life insurance contracts. Each Fund offers three classes of shares: Initial Class shares, Service Class shares and Service Class 2 shares. All classes have equal rights and voting privileges, except for matters affecting a single class. Investment income, realized and unrealized capital gains and losses, the common expenses of the Fund, and certain fund-level expense reductions, if any, are allocated on a pro rata basis to each class based on the relative net assets of each class to the total net assets of the Fund. Each class differs with respect to distribution and service plan fees incurred. Certain expense reductions also differ by class.
The financial statements have been prepared in conformity with accounting principles generally accepted in the United States of America, which require management to make certain estimates and assumptions at the date of the financial statements. The following summarizes the significant accounting policies of the Funds:
Security Valuation. Net asset value per share is calculated as of the close of business of the New York Stock Exchange, normally 4:00 p.m. Eastern time. Investments in the Underlying Funds are valued at their closing net asset value each business day. Short-term securities with remaining maturities of sixty days or less for which quotations are not readily available are valued on the basis of amortized cost, which approximates value.
Investment Transactions and Income. Security transactions, normally shares of the Underlying Funds, are accounted for as of trade date. Gains and losses on securities sold are determined on the basis of identified cost. Income and capital gain distributions from the Underlying Funds, if any, are recorded on the ex-dividend date. Interest income is accrued as earned. Interest income includes coupon interest and amortization of premium and accretion of discount on debt securities.
Expenses. Most expenses of the trust can be directly attributed to a fund. Expenses which cannot be directly attributed are apportioned among each fund in the trust. Expenses included in the accompanying financial statements reflect the expenses of each Fund and do not include any expenses associated with the Underlying Funds. Expense estimates are accrued in the period to which they relate and adjustments are made when actual amounts are known.
Income Tax Information and Distributions to Shareholders. Each year, each Fund intends to qualify as a regulated investment company by distributing all of its taxable income and realized gains under Subchapter M of the Internal Revenue Code. As a result, no provision for income taxes is required in the accompanying financial statements.
Distributions are recorded on the ex-dividend date. Income dividends and capital gain distributions are declared separately for each class. Income and capital gain distributions are determined in accordance with income tax regulations, which may differ from generally accepted accounting principles.
Capital accounts within the financial statements are adjusted for permanent book-tax differences. These adjustments have no impact on net assets or the results of operations. Temporary book-tax differences will reverse in a subsequent period.
Book-tax differences are primarily due to the short-term gain distributions from the Underlying Funds, capital loss carryforwards, losses deferred due to wash sales and excise tax regulations.
The tax-basis components of distributable earnings and the federal tax cost as of period end were as follows for each Fund:
| Cost for
Federal Income
Tax Purposes | Unrealized
Appreciation | Unrealized
Depreciation | Net Unrealized
Appreciation/
(Depreciation) |
VIP Freedom Income | $ 10,592,344 | $ 271,106 | $ (14,579) | $ 256,527 |
VIP Freedom 2005 | 8,112,679 | 588,416 | (4,044) | 584,372 |
VIP Freedom 2010 | 62,500,846 | 3,278,658 | (134,988) | 3,143,670 |
VIP Freedom 2015 | 32,069,695 | 2,129,564 | (74,409) | 2,055,155 |
VIP Freedom 2020 | 79,429,824 | 5,546,506 | (242,778) | 5,303,728 |
VIP Freedom 2025 | 8,535,689 | 837,608 | (12,984) | 824,624 |
VIP Freedom 2030 | 31,371,008 | 2,682,253 | (125,492) | 2,556,761 |
Annual Report
Notes to Financial Statements - continued
1. Significant Accounting Policies - continued
Income Tax Information and Distributions to Shareholders - continued
| Undistributed
Ordinary Income | Undistributed
Long-term
Capital Gain | Capital Loss
Carry forward |
VIP Freedom Income | $ 4,498 | $ 41,607 | $ - |
VIP Freedom 2005 | 62 | 83,981 | - |
VIP Freedom 2010 | 19,313 | 593,490 | - |
VIP Freedom 2015 | 172,565 | 364,110 | - |
VIP Freedom 2020 | 19,512 | 1,046,471 | - |
VIP Freedom 2025 | 24,413 | 129,991 | - |
VIP Freedom 2030 | - | 511,773 | - |
The tax character of distributions paid was as follows:
December 31, 2006 | | | |
| Ordinary
Income | Long-term
Capital Gains | Total |
VIP Freedom Income | $ 319,579 | $ 39,255 | $ 358,834 |
VIP Freedom 2005 | 242,373 | 22,170 | 264,543 |
VIP Freedom 2010 | 1,096,136 | 221,492 | 1,317,628 |
VIP Freedom 2015 | 435,471 | 196,602 | 632,073 |
VIP Freedom 2020 | 1,306,595 | 616,368 | 1,922,963 |
VIP Freedom 2025 | 173,672 | 104,377 | 278,049 |
VIP Freedom 2030 | 550,416 | 265,666 | 816,082 |
December 31, 2005 | | | |
| Ordinary
Income | Long-term
Capital Gains | Total |
VIP Freedom Income | $ 61,841 | $ - | $ 61,841 |
VIP Freedom 2005 | 31,563 | - | 31,563 |
VIP Freedom 2010 | 109,350 | - | 109,350 |
VIP Freedom 2015 | 82,427 | - | 82,427 |
VIP Freedom 2020 | 183,754 | - | 183,754 |
VIP Freedom 2025 | 31,744 | - | 31,744 |
VIP Freedom 2030 | 87,912 | - | 87,912 |
New Accounting Pronouncements. In July 2006, Financial Accounting Standards Board Interpretation No. 48, Accounting for Uncertainty in Income Taxes - an interpretation of FASB Statement 109 (FIN 48), was issued and is effective on the last business day of the semiannual reporting period for fiscal years beginning after December 15, 2006. FIN 48 sets forth a threshold for financial statement recognition, measurement and disclosure of a tax position taken or expected to be taken on a tax return. Management is currently evaluating the impact, if any, the adoption of FIN 48 will have on the Funds' net assets, results of operations and financial statement disclosures.
In addition, in September 2006, Statement of Financial Accounting Standards No. 157, Fair Value Measurements (SFAS 157), was issued and is effective for fiscal years beginning after November 15, 2007. SFAS 157 defines fair value, establishes a framework for measuring fair value and expands disclosures about fair value measurements. Management is currently evaluating the impact the adoption of SFAS 157 will have on the Funds' financial statement disclosures.
2. Operating Policies.
Repurchase Agreements. FMR has received an Exemptive Order from the Securities and Exchange Commission (the SEC) which permits certain Funds and other affiliated entities of FMR to transfer uninvested cash balances into joint trading accounts which are then invested in repurchase agreements. Certain Funds may also invest directly with institutions in repurchase agreements. Repurchase agreements are collateralized by government or non-government securities. Upon settlement date, collateral is held in segregated accounts with custodian banks and may be obtained in the event of a default of the counterparty. Each applicable Fund monitors, on a daily basis, the value of the collateral to ensure it is at least equal to the principal amount of the repurchase agreement (including accrued interest). In the event of a default by the counterparty, realization of the collateral proceeds could be delayed, during which time the value of the collateral may decline.
VIP Freedom Funds Portfolio
3. Purchases and Sales of Investments.
Purchases and redemptions of the underlying fund shares are noted in the table below.
| Purchases ($) | Redemptions ($) |
VIP Freedom Income | 7,792,959 | 3,781,030 |
VIP Freedom 2005 | 6,823,431 | 4,468,065 |
VIP Freedom 2010 | 50,064,002 | 10,597,480 |
VIP Freedom 2015 | 23,462,884 | 5,695,882 |
VIP Freedom 2020 | 58,634,519 | 11,888,367 |
VIP Freedom 2025 | 7,062,762 | 3,856,452 |
VIP Freedom 2030 | 23,276,125 | 7,584,111 |
4. Fees and Other Transactions with Affiliates.
Management Fee. Strategic Advisers, Inc. (Strategic Advisers), an affiliate of FMR, provides the Funds with investment management related services. The Funds do not pay any fees for these services.
Other Transactions. Strategic Advisers has entered into an administration agreement with FMR under which FMR provides management and administrative services (other than investment advisory services) necessary for the operation of each Fund. Pursuant to this agreement, FMR pays all expenses of each Fund, excluding the distribution and service fees, the compensation of the independent Trustees and certain other expenses such as interest expense. FMR also contracts with other Fidelity companies to perform the services necessary for the operation of each Fund. The Funds do not pay any fees for these services.
Distribution and Service Plan. In accordance with Rule 12b-1 of the 1940 Act, the Funds have adopted separate 12b-1 Plans for each Service Class of shares. Each Service Class pays Fidelity Distributors Corporation (FDC), an affiliate of FMR, a service fee. For the period, the service fee is based on an annual rate of .10% of Service Class' average net assets and .25% of Service Class 2's average net assets.
For the period, each class paid FDC the following amounts, all of which were reallowed to insurance companies for the distribution of shares and providing shareholder support services:
| Service
Class | Service
Class 2 | Total |
VIP Freedom Income | $ 376 | $ 1,380 | $ 1,756 |
VIP Freedom 2005 | 390 | 977 | 1,367 |
VIP Freedom 2010 | 2,703 | 59,697 | 62,400 |
VIP Freedom 2015 | 401 | 10,735 | 11,136 |
VIP Freedom 2020 | 3,426 | 87,403 | 90,829 |
VIP Freedom 2025 | 412 | 1,074 | 1,486 |
VIP Freedom 2030 | 1,789 | 27,695 | 29,484 |
5. Expense Reductions.
FMR voluntarily agreed to reimburse funds to the extent annual operating expenses exceeded certain levels of average net assets as noted in the table below. Total expenses for each class are limited to 0.00% of average net assets plus the distribution and service fees applicable to each class. Some expenses, for example interest expense, are excluded from this reimbursement.
The following classes of each applicable Fund were in reimbursement during the period:
| Expense
Limitations | Reimbursement
from adviser |
VIP Freedom Income | | |
Initial Class | 0% | $ 25 |
Service Class | .10% | 1 |
Service Class 2 | .25% | 2 |
VIP Freedom 2005 | | |
Initial Class | 0% | 24 |
Service Class | .10% | 1 |
Service Class 2 | .25% | 1 |
Annual Report
Notes to Financial Statements - continued
5. Expense Reductions - continued
The following classes of each applicable Fund were in reimbursement during the period:
| Expense
Limitations | Reimbursement
from adviser |
VIP Freedom 2010 | | |
Initial Class | 0% | $ 54 |
Service Class | .10% | 8 |
Service Class 2 | .25% | 74 |
VIP Freedom 2015 | | |
Initial Class | 0% | 61 |
Service Class | .10% | 1 |
Service Class 2 | .25% | 14 |
VIP Freedom 2020 | | |
Initial Class | 0% | 59 |
Service Class | .10% | 11 |
Service Class 2 | .25% | 109 |
VIP Freedom 2025 | | |
Initial Class | 0% | 22 |
Service Class | .10% | 1 |
Service Class 2 | .25% | 2 |
VIP Freedom 2030 | | |
Initial Class | 0% | 34 |
Service Class | .10% | 6 |
Service Class 2 | .25% | 35 |
6. Other.
The Funds' organizational documents provide former and current trustees and officers with a limited indemnification against liabilities arising in connection with the performance of their duties to the Funds. In the normal course of business, the Funds may also enter into contracts that provide general indemnifications. The Funds' maximum exposure under these arrangements is unknown as this would be dependent on future claims that may be made against the Funds. The risk of material loss from such claims is considered remote.
The Funds do not invest in the Underlying Funds for the purpose of exercising management or control; however, investments by the Funds within their principal investment strategies may represent a significant portion of the Underlying Fund's net assets. At the end of the period, FMR or its affiliates and certain otherwise unaffiliated shareholders each were owners of record of more than 10% of the outstanding shares of the following funds:
| Affiliated % | Number of
Unaffiliated
Shareholders | Unaffiliated
Shareholders % |
VIP Freedom Income | 89% | - | - |
VIP Freedom 2005 | 97% | - | - |
VIP Freedom 2010 | 33% | 1 | 56% |
VIP Freedom 2015 | 71% | 1 | 28% |
VIP Freedom 2020 | 26% | 2 | 71% |
VIP Freedom 2025 | 93% | - | - |
VIP Freedom 2030 | 43% | 1 | 50% |
VIP Freedom Funds Portfolio
7. Distributions to Shareholders.
Distributions to shareholders of each class were as follows:
Years ended December 31, | 2006 | 2005A |
VIP Freedom Income | | |
From net investment income | | |
Initial Class | $ 269,889 | $ 55,821 |
Service Class | 10,880 | 3,185 |
Service Class 2 | 28,996 | 2,835 |
Total | $ 309,765 | $ 61,841 |
From net realized gain | | |
Initial Class | $ 42,500 | $ - |
Service Class | 1,766 | - |
Service Class 2 | 4,803 | - |
Total | $ 49,069 | $ - |
VIP Freedom 2005 | | |
From net investment income | | |
Initial Class | $ 207,132 | $ 28,378 |
Service Class | 10,517 | 1,785 |
Service Class 2 | 9,944 | 1,400 |
Total | $ 227,593 | $ 31,563 |
From net realized gain | | |
Initial Class | $ 33,434 | $ - |
Service Class | 1,759 | - |
Service Class 2 | 1,757 | - |
Total | $ 36,950 | $ - |
VIP Freedom 2010 | | |
From net investment income | | |
Initial Class | $ 353,057 | $ 64,854 |
Service Class | 98,166 | 3,317 |
Service Class 2 | 589,540 | 41,179 |
Total | $ 1,040,763 | $ 109,350 |
From net realized gain | | |
Initial Class | $ 88,708 | $ - |
Service Class | 25,301 | - |
Service Class 2 | 162,856 | - |
Total | $ 276,865 | $ - |
VIP Freedom 2015 | | |
From net investment income | | |
Initial Class | $ 271,006 | $ 77,678 |
Service Class | 4,502 | 1,890 |
Service Class 2 | 103,791 | 2,859 |
Total | $ 379,299 | $ 82,427 |
From net realized gain | | |
Initial Class | $ 175,471 | $ - |
Service Class | 3,166 | - |
Service Class 2 | 74,137 | - |
Total | $ 252,774 | $ - |
VIP Freedom 2020 | | |
From net investment income | | |
Initial Class | $ 316,990 | $ 92,441 |
Service Class | 94,245 | 8,472 |
Service Class 2 | 758,389 | 82,841 |
Total | $ 1,169,624 | $ 183,754 |
Annual Report
Notes to Financial Statements - continued
7. Distributions to Shareholders - continued
Distributions to shareholders of each class were as follows:
Years ended December 31, | 2006 | 2005A |
VIP Freedom 2020 | | |
From net realized gain | | |
Initial Class | $ 189,505 | $ - |
Service Class | 58,242 | - |
Service Class 2 | 505,592 | - |
Total | $ 753,339 | $ - |
VIP Freedom 2025 | | |
From net investment income | | |
Initial Class | $ 136,529 | $ 28,069 |
Service Class | 6,790 | 2,030 |
Service Class 2 | 7,987 | 1,645 |
Total | $ 151,306 | $ 31,744 |
From net realized gain | | |
Initial Class | $ 113,219 | $ - |
Service Class | 5,981 | - |
Service Class 2 | 7,543 | - |
Total | $ 126,743 | $ - |
VIP Freedom 2030 | | |
From net investment income | | |
Initial Class | $ 210,649 | $ 46,470 |
Service Class | 54,452 | 4,989 |
Service Class 2 | 205,614 | 36,453 |
Total | $ 470,715 | $ 87,912 |
From net realized gain | | |
Initial Class | $ 145,662 | $ - |
Service Class | 38,682 | - |
Service Class 2 | 161,023 | - |
Total | $ 345,367 | $ - |
A Distributions are for the period April 26, 2005 (commencement of operations) to December 31, 2005.
8. Share Transactions.
Transactions for each class of shares were as follows:
| Shares | Dollars |
Years ended December 31, | 2006 | 2005 A | 2006 | 2005 A |
VIP Freedom Income | | | | |
Initial Class | | | | |
Shares sold | 628,341 | 606,283 | $ 6,697,181 | $ 6,212,950 |
Reinvestment of distributions | 29,149 | 5,388 | 312,388 | 55,821 |
Shares redeemed | (354,600) | (36,703) | (3,763,363) | (378,778) |
Net increase (decrease) | 302,890 | 574,968 | $ 3,246,206 | $ 5,889,993 |
Service Class | | | | |
Shares sold | - | 35,001 | $ - | $ 350,010 |
Reinvestment of distributions | 1,180 | 307 | 12,646 | 3,185 |
Net increase (decrease) | 1,180 | 35,308 | $ 12,646 | $ 353,195 |
Service Class 2 | | | | |
Shares sold | 77,795 | 35,001 | $ 837,357 | $ 350,010 |
Reinvestment of distributions | 3,159 | 273 | 33,799 | 2,835 |
Shares redeemed | (17,023) | - | (178,812) | - |
Net increase (decrease) | 63,931 | 35,274 | $ 692,344 | $ 352,845 |
VIP Freedom Funds Portfolio
8. Share Transactions - continued
Transactions for each class of shares were as follows:
| Shares | Dollars |
Years ended December 31, | 2006 | 2005 A | 2006 | 2005 A |
VIP Freedom 2005 | | | | |
Initial Class | | | | |
Shares sold | 512,176 | 596,639 | $ 5,650,369 | $ 6,232,781 |
Reinvestment of distributions | 21,052 | 2,637 | 240,567 | 28,378 |
Shares redeemed | (335,528) | (107,361) | (3,714,256) | (1,136,242) |
Net increase (decrease) | 197,700 | 491,915 | $ 2,176,680 | $ 5,124,917 |
Service Class | | | | |
Shares sold | - | 35,001 | $ - | $ 350,010 |
Reinvestment of distributions | 1,074 | 166 | 12,275 | 1,785 |
Net increase (decrease) | 1,074 | 35,167 | $ 12,275 | $ 351,795 |
Service Class 2 | | | | |
Shares sold | - | 35,001 | $ - | $ 350,010 |
Reinvestment of distributions | 1,024 | 130 | 11,701 | 1,400 |
Net increase (decrease) | 1,024 | 35,131 | $ 11,701 | $ 351,410 |
VIP Freedom 2010 | | | | |
Initial Class | | | | |
Shares sold | 1,085,640 | 1,396,144 | $ 12,091,220 | $ 14,664,567 |
Reinvestment of distributions | 38,083 | 6,005 | 441,765 | 64,854 |
Shares redeemed | (550,105) | (163,905) | (6,137,550) | (1,740,697) |
Net increase (decrease) | 573,618 | 1,238,244 | $ 6,395,435 | $ 12,988,724 |
Service Class | | | | |
Shares sold | 461,171 | 84,421 | $ 5,186,749 | $ 862,130 |
Reinvestment of distributions | 10,644 | 307 | 123,467 | 3,317 |
Shares redeemed | (25,858) | (13,852) | (288,627) | (143,657) |
Net increase (decrease) | 445,957 | 70,876 | $ 5,021,589 | $ 721,790 |
Service Class 2 | | | | |
Shares sold | 2,611,488 | 922,623 | $ 29,083,720 | $ 9,735,562 |
Reinvestment of distributions | 65,030 | 3,820 | 752,397 | 41,179 |
Shares redeemed | (232,684) | (24,615) | (2,589,520) | (256,516) |
Net increase (decrease) | 2,443,834 | 901,828 | $ 27,246,597 | $ 9,520,225 |
VIP Freedom 2015 | | | | |
Initial Class | | | | |
Shares sold | 1,063,240 | 1,472,595 | $ 12,155,808 | $ 15,572,982 |
Reinvestment of distributions | 37,362 | 7,074 | 446,476 | 77,678 |
Shares redeemed | (384,997) | (207,292) | (4,436,992) | (2,223,649) |
Net increase (decrease) | 715,605 | 1,272,377 | $ 8,165,292 | $ 13,427,011 |
Service Class | | | | |
Shares sold | - | 35,001 | $ - | $ 350,010 |
Reinvestment of distributions | 642 | 172 | 7,668 | 1,890 |
Net increase (decrease) | 642 | 35,173 | $ 7,668 | $ 351,900 |
Service Class 2 | | | | |
Shares sold | 825,508 | 59,460 | $ 9,476,778 | $ 619,300 |
Reinvestment of distributions | 14,914 | 261 | 177,928 | 2,859 |
Shares redeemed | (61,528) | (13) | (696,575) | (141) |
Net increase (decrease) | 778,894 | 59,708 | $ 8,958,131 | $ 622,018 |
VIP Freedom 2020 | | | | |
Initial Class | | | | |
Shares sold | 858,421 | 1,564,154 | $ 9,934,015 | $ 16,654,069 |
Reinvestment of distributions | 41,756 | 8,320 | 506,495 | 92,441 |
Shares redeemed | (588,301) | (119,826) | (6,802,896) | (1,315,072) |
Net increase (decrease) | 311,876 | 1,452,648 | $ 3,637,614 | $ 15,431,438 |
Annual Report
Notes to Financial Statements - continued
8. Share Transactions - continued
Transactions for each class of shares were as follows:
| Shares | Dollars |
Years ended December 31, | 2006 | 2005A | 2006 | 2005A |
VIP Freedom 2020 | | | | |
Service Class | | | | |
Shares sold | 411,929 | 143,748 | $ 4,798,643 | $ 1,505,055 |
Reinvestment of distributions | 12,581 | 763 | 152,487 | 8,472 |
Shares redeemed | (25,736) | (1,219) | (305,071) | (13,120) |
Net increase (decrease) | 398,774 | 143,292 | $ 4,646,059 | $ 1,500,407 |
Service Class 2 | | | | |
Shares sold | 3,353,614 | 1,501,452 | $ 38,778,034 | $ 16,109,143 |
Reinvestment of distributions | 104,461 | 7,463 | 1,263,981 | 82,841 |
Shares redeemed | (238,340) | (25,203) | (2,819,652) | (275,926) |
Net increase (decrease) | 3,219,735 | 1,483,712 | $ 37,222,363 | $ 15,916,058 |
VIP Freedom 2025 | | | | |
Initial Class | | | | |
Shares sold | 508,046 | 453,648 | $ 5,956,062 | $ 4,845,340 |
Reinvestment of distributions | 20,454 | 2,506 | 249,748 | 28,069 |
Shares redeemed | (274,265) | (23,774) | (3,281,077) | (261,394) |
Net increase (decrease) | 254,235 | 432,380 | $ 2,924,733 | $ 4,612,015 |
Service Class | | | | |
Shares sold | - | 35,001 | $ - | $ 350,010 |
Reinvestment of distributions | 1,047 | 181 | 12,771 | 2,030 |
Net increase (decrease) | 1,047 | 35,182 | $ 12,771 | $ 352,040 |
Service Class 2 | | | | |
Shares sold | 9,336 | 35,001 | $ 114,122 | $ 350,010 |
Reinvestment of distributions | 1,273 | 147 | 15,530 | 1,645 |
Shares redeemed | (112) | - | (1,375) | - |
Net increase (decrease) | 10,497 | 35,148 | $ 128,277 | $ 351,655 |
VIP Freedom 2030 | | | | |
Initial Class | | | | |
Shares sold | 710,684 | 890,212 | $ 8,499,790 | $ 9,562,775 |
Reinvestment of distributions | 28,573 | 4,109 | 356,311 | 46,470 |
Shares redeemed | (323,491) | (161,133) | (3,808,183) | (1,749,772) |
Net increase (decrease) | 415,766 | 733,188 | $ 5,047,918 | $ 7,859,473 |
Service Class | | | | |
Shares sold | 235,504 | 91,941 | $ 2,842,204 | $ 959,711 |
Reinvestment of distributions | 7,469 | 441 | 93,133 | 4,989 |
Shares redeemed | (17,091) | (7,342) | (204,059) | (78,548) |
Net increase (decrease) | 225,882 | 85,040 | $ 2,731,278 | $ 886,152 |
Service Class 2 | | | | |
Shares sold | 819,368 | 684,652 | $ 9,707,801 | $ 7,360,607 |
Reinvestment of distributions | 29,449 | 3,226 | 366,637 | 36,453 |
Shares redeemed | (235,970) | (30,725) | (2,778,153) | (328,962) |
Net increase (decrease) | 612,847 | 657,153 | $ 7,296,285 | $ 7,068,098 |
A Share transactions for each class are for the period April 26, 2005 (commencement of operations) to December 31, 2005.
VIP Freedom Funds Portfolio
Report of Independent Registered Public Accounting Firm
To the Trustees of Variable Insurance Products Fund IV and the Shareholders of VIP Freedom Income Portfolio, VIP Freedom 2005 Portfolio, VIP Freedom 2010 Portfolio, VIP Freedom 2015 Portfolio, VIP Freedom 2020 Portfolio, VIP Freedom 2025 Portfolio, and VIP Freedom 2030 Portfolio:
We have audited the accompanying statements of assets and liabilities of VIP Freedom Income Portfolio, VIP Freedom 2005 Portfolio, VIP Freedom 2010 Portfolio, VIP Freedom 2015 Portfolio, VIP Freedom 2020 Portfolio, VIP Freedom 2025 Portfolio, and VIP Freedom 2030 Portfolio (the Funds), each a fund of the Variable Insurance Products Fund IV, including the schedules of investments, as of December 31, 2006, and the related statements of operations for the year then ended and the statements of changes in net assets and the financial highlights for the year ended December 31, 2006 and for the period April 26, 2005 (commencement of operations) to December 31, 2005. These financial statements and financial highlights are the responsibility of the Funds' management. Our responsibility is to express an opinion on these financial statements and financial highlights based on our audits.
We conducted our audits in accordance with standards of the Public Company Accounting Oversight Board (United States). Those standards require that we plan and perform the audit to obtain reasonable assurance about whether the financial statements and financial highlights are free of material misstatement. The Funds are not required to have, nor were we engaged to perform, an audit of their internal control over financial reporting. Our audits included consideration of internal control over financial reporting as a basis for designing audit procedures that are appropriate in the circumstances, but not for the purpose of expressing an opinion on the effectiveness of the Funds' internal control over financial reporting. Accordingly, we express no such opinion. An audit also includes examining, on a test basis, evidence supporting the amounts and disclosures in the financial statements, assessing the accounting principles used and significant estimates made by management, as well as evaluating the overall financial statement presentation. Our procedures included confirmation of securities owned as of December 31, 2006, by correspondence with the custodian. We believe that our audits provide a reasonable basis for our opinion.
In our opinion, the financial statements and financial highlights referred to above present fairly, in all material respects, the financial position of VIP Freedom Income Portfolio, VIP Freedom 2005 Portfolio, VIP Freedom 2010 Portfolio, VIP Freedom 2015 Portfolio, VIP Freedom 2020 Portfolio, VIP Freedom 2025 Portfolio, and VIP Freedom 2030 Portfolio as of December 31, 2006, the results of their operations for the year then ended and the changes in their net assets and their financial highlights for the year ended December 31, 2006 and for the period April 26, 2005 (commencement of operations) to December 31, 2005 in conformity with accounting principles generally accepted in the United States of America.
/s/ Deloitte & Touche LLP
DELOITTE & TOUCHE LLP
Boston, Massachusetts
February 16, 2007
Annual Report
Trustees and Officers
The Trustees, Member of the Advisory Board, and executive officers of the trust and fund, as applicable, are listed below. The Board of Trustees governs the fund and is responsible for protecting the interests of shareholders. The Trustees are experienced executives who meet periodically throughout the year to oversee the fund's activities, review contractual arrangements with companies that provide services to the fund, and review the fund's performance. Each of the Trustees oversees 348 funds advised by FMR or an affiliate.
The Trustees hold office without limit in time except that (a) any Trustee may resign; (b) any Trustee may be removed by written instrument, signed by at least two-thirds of the number of Trustees prior to such removal; (c) any Trustee who requests to be retired or who has become incapacitated by illness or injury may be retired by written instrument signed by a majority of the other Trustees; and (d) any Trustee may be removed at any special meeting of shareholders by a two-thirds vote of the outstanding voting securities of the trust. Each Trustee who is not an interested person (as defined in the 1940 Act) (Independent Trustee), shall retire not later than the last day of the calendar year in which his or her 72nd birthday occurs. The Independent Trustees may waive this mandatory retirement age policy with respect to individual Trustees. The executive officers and Advisory Board Member hold office without limit in time, except that any officer and Advisory Board Member may resign or may be removed by a vote of a majority of the Trustees at any regular meeting or any special meeting of the Trustees. Except as indicated, each individual has held the office shown or other offices in the same company for the past five years.
The fund's Statement of Additional Information (SAI) includes more information about the Trustees. To request a free copy, call Fidelity at 1-877-208-0098.
Interested Trustees*:
Correspondence intended for each Trustee who is an interested person may be sent to Fidelity Investments, 82 Devonshire Street, Boston, Massachusetts 02109.
Name, Age; Principal Occupation |
Edward C. Johnson 3d (76) |
| Year of Election or Appointment: 1983 Mr. Johnson is Chairman of the Board of Trustees. Mr. Johnson serves as President (2006-present), Chief Executive Officer, Chairman, and a Director of FMR Corp.; Chairman and a Director of FMR; Chairman and a Director of Fidelity Research & Analysis Company (FRAC); Chairman and a Director of Fidelity Investments Money Management, Inc.; and Chairman (2001- present) and a Director of FMR Co., Inc. In addition, Mr. Johnson serves as Chairman and Director of Fidelity International Limited (FIL). |
Robert L. Reynolds (54) |
| Year of Election or Appointment: 2003 Mr. Reynolds is President and a Director of FMR (2005-present), Fidelity Investments Money Management, Inc. (2005-present), and FMR Co., Inc. (2005-present). Mr. Reynolds also serves as Vice Chairman (2006-present), a Director (2003-present), and Chief Operating Officer of FMR Corp. and a Director of Strategic Advisers, Inc. (2005-present). He also serves on the Board at Fidelity Investments Canada, Ltd. |
* Trustees have been determined to be "Interested Trustees" by virtue of, among other things, their affiliation with the trust or various entities under common control with FMR.
Independent Trustees:
Correspondence intended for each Independent Trustee (that is, the Trustees other than the Interested Trustees) may be sent to Fidelity Investments, P.O. Box 55235, Boston, Massachusetts 02205-5235.
Name, Age; Principal Occupation |
Dennis J. Dirks (58) |
| Year of Election or Appointment: 2005 Prior to his retirement in May 2003, Mr. Dirks was Chief Operating Officer and a member of the Board of The Depository Trust & Clearing Corporation (DTCC) (1999-2003). He also served as President, Chief Operating Officer, and Board member of The Depository Trust Company (DTC) (1999-2003) and President and Board member of the National Securities Clearing Corporation (NSCC) (1999-2003). In addition, Mr. Dirks served as Chief Executive Officer and Board member of the Government Securities Clearing Corporation (2001-2003) and Chief Executive Officer and Board member of the Mortgage-Backed Securities Clearing Corporation (2001-2003). Mr. Dirks also serves as a Trustee and a member of the Finance Committee of Manhattan College (2005-present) and a Trustee and a member of the Finance Committee of AHRC of Nassau County (2006-present). |
Albert R. Gamper, Jr. (64) |
| Year of Election or Appointment: 2006 Prior to his retirement in December 2004, Mr. Gamper served as Chairman of the Board of CIT Group Inc. (commercial finance). During his tenure with CIT Group Inc. Mr. Gamper served in numerous senior management positions, including Chairman (1987-1989; 1999-2001; 2002-2004), Chief Executive Officer (1987-2004), and President (1989-2002). He currently serves as a member of the Board of Directors of Public Service Enterprise Group (utilities, 2001-present), Chairman of the Board of Governors, Rutgers University (2004-present), and Chairman of the Board of Saint Barnabas Health Care System. |
George H. Heilmeier (70) |
| Year of Election or Appointment: 2004 Dr. Heilmeier is Chairman Emeritus of Telcordia Technologies (communication software and systems), where prior to his retirement, he served as company Chairman and Chief Executive Officer. He currently serves on the Boards of Directors of The Mitre Corporation (systems engineering and information technology support for the government), and HRL Laboratories (private research and development, 2004-present). He is Chairman of the General Motors Science & Technology Advisory Board and a Life Fellow of the Institute of Electrical and Electronics Engineers (IEEE). Dr. Heilmeier is a member of the Defense Science Board and the National Security Agency Advisory Board. He is also a member of the National Academy of Engineering, the American Academy of Arts and Sciences, and the Board of Overseers of the School of Engineering and Applied Science of the University of Pennsylvania. Previously, Dr. Heilmeier served as a Director of TRW Inc. (automotive, space, defense, and information technology, 1992-2002), Compaq (1994-2002), Automatic Data Processing, Inc. (ADP) (technology-based business outsourcing, 1995-2002), INET Technologies Inc. (telecommunications network surveillance, 2001-2004), and Teletech Holdings (customer management services). He is the recipient of the 2005 Kyoto Prize in Advanced Technology for his invention of the liquid crystal display, and a member of the Consumer Electronics Hall of Fame. |
James H. Keyes (66) |
| Year of Election or Appointment: 2007 Prior to his retirement in 2003, Mr. Keyes was Chairman, President, and Chief Executive Officer of Johnson Controls, Inc. (automotive supplier, 1993-2003). He currently serves as a member of the boards of LSI Logic Corporation (semiconductor technologies), Navistar International Corporation (manufacture and sale of trucks, buses, and diesel engines, 2002-present), and Pitney Bowes, Inc. (integrated mail, messaging, and document management solutions). |
Marie L. Knowles (60) |
| Year of Election or Appointment: 2001 Prior to Ms. Knowles' retirement in June 2000, she served as Executive Vice President and Chief Financial Officer of Atlantic Richfield Company (ARCO) (diversified energy, 1996-2000). From 1993 to 1996, she was a Senior Vice President of ARCO and President of ARCO Transportation Company. She served as a Director of ARCO from 1996 to 1998. She currently serves as a Director of Phelps Dodge Corporation (copper mining and manufacturing) and McKesson Corporation (healthcare service, 2002-present). Ms. Knowles is a Trustee of the Brookings Institution and the Catalina Island Conservancy and also serves as a member of the Advisory Board for the School of Engineering of the University of Southern California. |
Ned C. Lautenbach (62) |
| Year of Election or Appointment: 2000 Mr. Lautenbach is Chairman of the Independent Trustees (2006-present). Mr. Lautenbach has been a partner of Clayton, Dubilier & Rice, Inc. (private equity investment firm) since September 1998. Previously, Mr. Lautenbach was with the International Business Machines Corporation (IBM) from 1968 until his retirement in 1998. Mr. Lautenbach serves as a Director of Sony Corporation (2006-present) and Eaton Corporation (diversified industrial) as well as the Philharmonic Center for the Arts in Naples, Florida. He also is a member of the Board of Trustees of Fairfield University (2005-present), as well as a member of the Council on Foreign Relations. |
Cornelia M. Small (62) |
| Year of Election or Appointment: 2005 Ms. Small is a member (2000-present) and Chairperson (2002-present) of the Investment Committee, and a member (2002- present) of the Board of Trustees of Smith College. Previously, she served as Chief Investment Officer (1999-2000), Director of Global Equity Investments (1996-1999), and a member of the Board of Directors of Scudder, Stevens & Clark (1990-1997) and Scudder Kemper Investments (1997-1999). In addition, Ms. Small served as Co-Chair (2000-2003) of the Annual Fund for the Fletcher School of Law and Diplomacy. |
William S. Stavropoulos (67) |
| Year of Election or Appointment: 2001 Mr. Stavropoulos is Chairman Emeritus of the Board of Directors of The Dow Chemical Company. Since joining The Dow Chemical Company in 1967, Mr. Stavropoulos served in numerous senior management positions, including President (1993-2000; 2002-2003), CEO (1995-2000; 2002-2004), and Chairman of the Executive Committee (2000-2004). Currently, he is a Director of NCR Corporation (data warehousing and technology solutions), BellSouth Corporation (telecommunications), Chemical Financial Corporation, Maersk Inc. (industrial conglomerate, 2002-present), and Metalmark Capital (private equity investment firm, 2005-present). He also serves as a member of the Board of Trustees of the American Enterprise Institute for Public Policy Research. In addition, Mr. Stavropoulos is a member of The Business Council, J.P. Morgan International Council and the University of Notre Dame Advisory Council for the College of Science. |
Kenneth L. Wolfe (67) |
| Year of Election or Appointment: 2005 Prior to his retirement in 2001, Mr. Wolfe was Chairman and Chief Executive Officer of Hershey Foods Corporation (1993-2001). He currently serves as a member of the boards of Adelphia Communications Corporation (2003-present), Bausch & Lomb, Inc., and Revlon Inc. (2004-present). |
Advisory Board Member and Executive Officers:
Correspondence intended for each executive officer and Mr. Lynch may be sent to Fidelity Investments, 82 Devonshire Street, Boston, Massachusetts 02109.
Name, Age; Principal Occupation |
Peter S. Lynch (62) |
| Year of Election or Appointment: 2003 Member of the Advisory Board of Variable Insurance Products Fund IV. Mr. Lynch is Vice Chairman and a Director of FMR, and Vice Chairman (2001-present) and a Director of FMR Co., Inc. Previously, Mr. Lynch served as a Trustee of the Fidelity funds (1990-2003). In addition, he serves as a Trustee of Boston College and as the Chairman of the Inner-City Scholarship Fund. |
Kimberley H. Monasterio (43) |
| Year of Election or Appointment: 2007 President and Treasurer of VIP Freedom Income, VIP Freedom 2005, VIP Freedom 2010, VIP Freedom 2015, VIP Freedom 2020, VIP Freedom 2025, and VIP Freedom 2030. Ms. Monasterio also serves as President and Treasurer of other Fidelity funds (2007-present) and is an employee of FMR (2004-present). Previously, Ms. Monasterio served as Deputy Treasurer of the Fidelity funds (2004-2006). Before joining Fidelity Investments, Ms. Monasterio served as Treasurer (2000-2004) and Chief Financial Officer (2002-2004) of the Franklin Templeton Funds and Senior Vice President of Franklin Templeton Services, LLC (2000-2004). |
Boyce I. Greer (50) |
| Year of Election or Appointment: 2005 Vice President of VIP Freedom Income, VIP Freedom 2005, VIP Freedom 2010, VIP Freedom 2015, VIP Freedom 2020, VIP Freedom 2025, and VIP Freedom 2030. Mr. Greer also serves as Vice President of certain Equity Funds (2005-present), certain Asset Allocation Funds (2005-present), Fixed-Income Funds (2006-present), and Money Market Funds (2006-present). Mr. Greer is also a Trustee of other investment companies advised by FMR (2003-present). He is an Executive Vice President of FMR (2005-present) and FMR Co., Inc. (2005-present), and Senior Vice President of Fidelity Investments Money Management, Inc. (2006-present). Previously, Mr. Greer served as a Director and Managing Director of Strategic Advisers, Inc. (2002-2005), and Executive Vice President (2000-2002) and Money Market Group Leader (1997-2002) of the Fidelity Investments Fixed Income Division. He also served as Vice President of Fidelity's Money Market Funds (1997-2002), Senior Vice President of FMR (1997-2002), and Vice President of FIMM (1998-2002). |
Ren Y. Cheng (49) |
| Year of Election or Appointment: 2005
Vice President of VIP Freedom Income, VIP Freedom 2005, VIP Freedom 2010, VIP Freedom 2015, VIP Freedom 2020, VIP Freedom 2025, and VIP Freedom 2030. Mr. Cheng also serves as Vice President for other funds advised by FMR. Prior to assuming his current responsibilities, Mr. Cheng worked as a portfolio manager. Mr. Cheng also serves as Vice President of FMR and FMR Co., Inc. (2002). |
Christopher L. Sharpe (38) |
| Year of Election or Appointment: 2005
Vice President of VIP Freedom Income, VIP Freedom 2005, VIP Freedom 2010, VIP Freedom 2015, VIP Freedom 2020, VIP Freedom 2025, and VIP Freedom 2030. Mr. Sharpe also serves as Vice President of other funds advised by FMR. Prior to assuming his current responsibilities, Mr. Sharpe worked as an associate investment policy officer for John Hancock Financial Services, Inc. in Boston. From 1990 to 2000 he was with William M. Mercer, Inc. in Boston. Mr. Sharpe also serves as Vice President of FMR and FMR Co., Inc. (2006). |
Eric D. Roiter (58) |
| Year of Election or Appointment: 2005 Secretary of VIP Freedom Income, VIP Freedom 2005, VIP Freedom 2010, VIP Freedom 2015, VIP Freedom 2020, VIP Freedom 2025, and VIP Freedom 2030. He also serves as Secretary of other Fidelity funds; Vice President, General Counsel, and Secretary of FMR Co., Inc. (2001-present) and FMR; Assistant Secretary of Fidelity Management & Research (U.K.) Inc. (2001-present), Fidelity Research & Analysis Company (2001-present), and Fidelity Investments Money Management, Inc. (2001-present). Mr. Roiter is an Adjunct Member, Faculty of Law, at Boston College Law School (2003-present). Previously, Mr. Roiter served as Vice President and Secretary of Fidelity Distributors Corporation (FDC) (1998-2005). |
Stuart Fross (47) |
| Year of Election or Appointment: 2005 Assistant Secretary of VIP Freedom Income, VIP Freedom 2005, VIP Freedom 2010, VIP Freedom 2015, VIP Freedom 2020, VIP Freedom 2025, and VIP Freedom 2030. Mr. Fross also serves as Assistant Secretary of other Fidelity funds (2003-present), Vice President and Secretary of FDC (2005-present), and is an employee of FMR. |
R. Stephen Ganis (40) |
| Year of Election or Appointment: 2006 Anti-Money Laundering (AML) officer of VIP Freedom Income, VIP Freedom 2005, VIP Freedom 2010, VIP Freedom 2015, VIP Freedom 2020, VIP Freedom 2025, and VIP Freedom 2030. Mr. Ganis also serves as AML officer of other Fidelity funds (2006-present) and FMR Corp. (2003-present). Before joining Fidelity Investments, Mr. Ganis practiced law at Goodwin Procter, LLP (2000-2002). |
Joseph B. Hollis (58) |
| Year of Election or Appointment: 2006 Chief Financial Officer of VIP Freedom Income, VIP Freedom 2005, VIP Freedom 2010, VIP Freedom 2015, VIP Freedom 2020, VIP Freedom 2025, and VIP Freedom 2030. Mr. Hollis also serves as Chief Financial Officer of other Fidelity funds. Mr. Hollis is President of Fidelity Pricing and Cash Management Services (FPCMS) (2005-present). Mr. Hollis also serves as President and Director of Fidelity Service Company, Inc. (2006-present). Previously, Mr. Hollis served as Senior Vice President of Cash Management Services (1999-2002) and Investment Management Operations (2002-2005). |
Kenneth A. Rathgeber (59) |
| Year of Election or Appointment: 2005 Chief Compliance Officer of VIP Freedom Income, VIP Freedom 2005, VIP Freedom 2010, VIP Freedom 2015, VIP Freedom 2020, VIP Freedom 2025, and VIP Freedom 2030. Mr. Rathgeber also serves as Chief Compliance Officer of other Fidelity funds (2004-present) and Executive Vice President of Risk Oversight for Fidelity Investments (2002-present). He is Chief Compliance Officer of FMR (2005-present), FMR Co., Inc. (2005-present), Fidelity Management & Research (U.K.) Inc. (2005-present), Fidelity Research & Analysis Company (2005-present), Fidelity Investments Money Management, Inc. (2005-present), and Strategic Advisers, Inc. (2005-present). Previously, Mr. Rathgeber served as Executive Vice President and Chief Operating Officer for Fidelity Investments Institutional Services Company, Inc. (1998-2002). |
Bryan A. Mehrmann (45) |
| Year of Election or Appointment: 2005 Deputy Treasurer of VIP Freedom Income, VIP Freedom 2005, VIP Freedom 2010, VIP Freedom 2015, VIP Freedom 2020, VIP Freedom 2025, and VIP Freedom 2030. Mr. Mehrmann also serves as Deputy Treasurer of other Fidelity funds (2005-present) and is an employee of FMR. Previously, Mr. Mehrmann served as Vice President of Fidelity Investments Institutional Services Group (FIIS)/Fidelity Investments Institutional Operations Corporation, Inc. (FIIOC) Client Services (1998-2004). |
Kenneth B. Robins (37) |
| Year of Election or Appointment: 2005 Deputy Treasurer of VIP Freedom Income, VIP Freedom 2005, VIP Freedom 2010, VIP Freedom 2015, VIP Freedom 2020, VIP Freedom 2025, and VIP Freedom 2030. Mr. Robins also serves as Deputy Treasurer of other Fidelity funds (2005-present) and is an employee of FMR (2004-present). Before joining Fidelity Investments, Mr. Robins worked at KPMG LLP, where he was a partner in KPMG's department of professional practice (2002-2004) and a Senior Manager (1999-2000). In addition, Mr. Robins served as Assistant Chief Accountant, United States Securities and Exchange Commission (2000-2002). |
Robert G. Byrnes (40) |
| Year of Election or Appointment: 2005 Assistant Treasurer of VIP Freedom Income, VIP Freedom 2005, VIP Freedom 2010, VIP Freedom 2015, VIP Freedom 2020, VIP Freedom 2025, and VIP Freedom 2030. Mr. Byrnes also serves as Assistant Treasurer of other Fidelity funds (2005-present) and is an employee of FMR (2005-present). Previously, Mr. Byrnes served as Vice President of FPCMS (2003-2005). Before joining Fidelity Investments, Mr. Byrnes worked at Deutsche Asset Management where he served as Vice President of the Investment Operations Group (2000-2003). |
John H. Costello (60) |
| Year of Election or Appointment: 2005 Assistant Treasurer of VIP Freedom Income, VIP Freedom 2005, VIP Freedom 2010, VIP Freedom 2015, VIP Freedom 2020, VIP Freedom 2025, and VIP Freedom 2030. Mr. Costello also serves as Assistant Treasurer of other Fidelity funds and is an employee of FMR. |
Peter L. Lydecker (52) |
| Year of Election or Appointment: 2005 Assistant Treasurer of VIP Freedom Income, VIP Freedom 2005, VIP Freedom 2010, VIP Freedom 2015, VIP Freedom 2020, VIP Freedom 2025, and VIP Freedom 2030. Mr. Lydecker also serves as Assistant Treasurer of other Fidelity funds (2004) and is an employee of FMR. |
Mark Osterheld (51) |
| Year of Election or Appointment: 2005 Assistant Treasurer of VIP Freedom Income, VIP Freedom 2005, VIP Freedom 2010, VIP Freedom 2015, VIP Freedom 2020, VIP Freedom 2025, and VIP Freedom 2030. Mr. Osterheld also serves as Assistant Treasurer of other Fidelity funds (2002) and is an employee of FMR. |
Gary W. Ryan (48) |
| Year of Election or Appointment: 2005 Assistant Treasurer of VIP Freedom Income, VIP Freedom 2005, VIP Freedom 2010, VIP Freedom 2015, VIP Freedom 2020, VIP Freedom 2025, and VIP Freedom 2030. Mr. Ryan also serves as Assistant Treasurer of other Fidelity funds (2005-present) and is an employee of FMR (2005-present). Previously, Mr. Ryan served as Vice President of Fund Reporting in FPCMS (1999-2005). |
Salvatore Schiavone (41) |
| Year of Election or Appointment: 2005 Assistant Treasurer of VIP Freedom Income, VIP Freedom 2005, VIP Freedom 2010, VIP Freedom 2015, VIP Freedom 2020, VIP Freedom 2025, and VIP Freedom 2030. Mr. Schiavone also serves as Assistant Treasurer of other Fidelity funds (2005-present) and is an employee of FMR (2005-present). Before joining Fidelity Investments, Mr. Schiavone worked at Deutsche Asset Management, where he most recently served as Assistant Treasurer (2003-2005) of the Scudder Funds and Vice President and Head of Fund Reporting (1996-2003). |
VIP Freedom Funds Portfolio
Distributions
The Board of Trustees of each fund voted to pay to shareholders of record at the opening of business on record date, the following distributions per share derived from capital gains realized from sales of portfolio securities, and dividends derived from net investment income:
Fund | Pay Date | Record Date | Dividends | Capital Gains |
VIP Freedom Income | | | | |
Initial Class | 02/09/07 | 02/09/07 | $.01 | $.04 |
Service Class | 02/09/07 | 02/09/07 | $.01 | $.04 |
Service Class 2 | 02/09/07 | 02/09/07 | $.01 | $.04 |
VIP Freedom 2005 | | | | |
Initial Class | 02/09/07 | 02/09/07 | __ | $.125 |
Service Class | 02/09/07 | 02/09/07 | __ | $.125 |
Service Class 2 | 02/09/07 | 02/09/07 | __ | $.125 |
VIP Freedom 2010 | | | | |
Initial Class | 02/09/07 | 02/09/07 | __ | $.11 |
Service Class | 02/09/07 | 02/09/07 | __ | $.11 |
Service Class 2 | 02/09/07 | 02/09/07 | __ | $.11 |
VIP Freedom 2015 | | | | |
Initial Class | 02/09/07 | 02/09/07 | $.055 | $.12 |
Service Class | 02/09/07 | 02/09/07 | $.055 | $.12 |
Service Class 2 | 02/09/07 | 02/09/07 | $.055 | $.12 |
VIP Freedom 2020 | | | | |
Initial Class | 02/09/07 | 02/09/07 | __ | $.145 |
Service Class | 02/09/07 | 02/09/07 | __ | $.145 |
Service Class 2 | 02/09/07 | 02/09/07 | __ | $.145 |
VIP Freedom 2025 | | | | |
Initial Class | 02/09/07 | 02/09/07 | __ | $.19 |
Service Class | 02/09/07 | 02/09/07 | __ | $.19 |
Service Class 2 | 02/09/07 | 02/09/07 | __ | $.19 |
VIP Freedom 2030 | | | | |
Initial Class | 02/09/07 | 02/09/07 | __ | $.17 |
Service Class | 02/09/07 | 02/09/07 | __ | $.17 |
Service Class 2 | 02/09/07 | 02/09/07 | __ | $.17 |
The funds hereby designate as capital gain dividend the amounts noted below for the taxable year ended December 31, 2006, or, if subsequently determined to be different, the net capital gain of such year.
Fund | |
VIP Freedom Income | $ 80,862 |
VIP Freedom 2005 | $ 106,151 |
VIP Freedom 2010 | $ 814,982 |
VIP Freedom 2015 | $ 560,711 |
VIP Freedom 2020 | $ 1,662,839 |
VIP Freedom 2025 | $ 234,368 |
VIP Freedom 2030 | $ 777,439 |
Annual Report
Distributions - continued
A percentage of the dividends distributed during the fiscal year for the following funds qualifies for the dividends-received deduction for corporate shareholders:
Fund | February 2006 | December 2006 |
VIP Freedom Income | | |
Initial Class | 5% | 7% |
Service Class | 5% | 7% |
Service Class 2 | 5% | 7% |
VIP Freedom 2005 | | |
Initial Class | 16% | 16% |
Service Class | 16% | 17% |
Service Class 2 | 16% | 18% |
VIP Freedom 2010 | | |
Initial Class | __ | 20% |
Service Class | __ | 20% |
Service Class 2 | __ | 22% |
VIP Freedom 2015 | | |
Initial Class | __ | 34% |
Service Class | __ | 36% |
Service Class 2 | __ | 37% |
VIP Freedom 2020 | | |
Initial Class | __ | 30% |
Service Class | __ | 31% |
Service Class 2 | __ | 33% |
VIP Freedom 2025 | | |
Initial Class | __ | 32% |
Service Class | __ | 34% |
Service Class 2 | __ | 36% |
VIP Freedom 2030 | | |
Initial Class | __ | 37% |
Service Class | __ | 38% |
Service Class 2 | __ | 41% |
The funds will notify shareholders in January 2007 of amounts for use in preparing 2006 income tax returns.
VIP Freedom Funds Portfolio
Proxy Voting Results
A special meeting of each fund's shareholders was held on September 20, 2006. The results of votes taken among shareholders on the proposal before them are reported below. Each vote reported represents one dollar of net asset value held on the record date for the meeting.
PROPOSAL 1 |
To elect a Board of Trustees. A |
| # of
Votes | % of
Votes |
Dennis J. Dirks |
Affirmative | 92,459,317.52 | 96.102 |
Withheld | 3,749,837.05 | 3.898 |
TOTAL | 96,209,154.57 | 100.00 |
Albert R. Gamper, Jr. |
Affirmative | 92,260,598.99 | 95.896 |
Withheld | 3,948,555.58 | 4.104 |
TOTAL | 96,209,154.57 | 100.000 |
Robert M. Gates |
Affirmative | 92,315,480.72 | 95.953 |
Withheld | 3,893,673.85 | 4.047 |
TOTAL | 96,209,154.57 | 100.000 |
George H. Heilmeier |
Affirmative | 92,208,255.41 | 95.841 |
Withheld | 4,000,899.16 | 4.159 |
TOTAL | 96,209,154.57 | 100.000 |
Edward C. Johnson 3d |
Affirmative | 91,928,267.76 | 95.550 |
Withheld | 4,280,886.81 | 4.450 |
TOTAL | 96,209,154.57 | 100.000 |
Stephen P. Jonas |
Affirmative | 92,457,628.76 | 96.101 |
Withheld | 3,751,525.81 | 3.899 |
TOTAL | 96,209,154.57 | 100.000 |
James H. KeyesB |
Affirmative | 92,432,729.82 | 96.075 |
Withheld | 3,776,424.75 | 3.925 |
TOTAL | 96,209,154.57 | 100.000 |
| # of
Votes | % of
Votes |
Marie L. Knowles |
Affirmative | 92,398,847.52 | 96.040 |
Withheld | 3,810,307.05 | 3.960 |
TOTAL | 96,209,154.57 | 100.000 |
Ned C. Lautenbach |
Affirmative | 92,423,184.47 | 96.065 |
Withheld | 3,785,970.10 | 3.935 |
TOTAL | 96,209,154.57 | 100.000 |
William O. McCoy |
Affirmative | 92,086,293.90 | 95.715 |
Withheld | 4,122,860.67 | 4.285 |
TOTAL | 96,209,154.57 | 100.000 |
Robert L. Reynolds |
Affirmative | 92,439,032.86 | 96.081 |
Withheld | 3,770,121.71 | 3.919 |
TOTAL | 96,209,154.57 | 100.000 |
Cornelia M. Small |
Affirmative | 92,415,567.29 | 96.057 |
Withheld | 3,793,587.28 | 3.943 |
TOTAL | 96,209,154.57 | 100.000 |
William S. Stavropoulos |
Affirmative | 92,135,400.08 | 95.766 |
Withheld | 4,073,754.49 | 4.234 |
TOTAL | 96,209,154.57 | 100.000 |
Kenneth L. Wolfe |
Affirmative | 92,445,865.31 | 96.088 |
Withheld | 3,763,289.26 | 3.912 |
TOTAL | 96,209,154.57 | 100.000 |
A Denotes trust-wide proposal and voting results. B Effective on or about January 1, 2007. |
Annual Report
Board Approval of Investment Advisory Contracts and Management Fees
VIP Freedom Funds
Each year, typically in July, the Board of Trustees, including the Independent Trustees (together, the Board), votes on the renewal of the management contract and administration agreement (together, the Advisory Contracts) for each fund. The Board, assisted by the advice of fund counsel and Independent Trustees' counsel, requests and considers a broad range of information throughout the year.
The Board meets regularly each month except August and takes into account throughout the year matters bearing on Advisory Contracts. The Board, acting directly and through its separate committees, considers at each of its meetings factors that are relevant to the annual renewal of each fund's Advisory Contracts, including the services and support provided to each fund and its shareholders. At the time of the renewal, the Board had 12 standing committees, each composed of Independent Trustees with varying backgrounds, to which the Board has assigned specific subject matter responsibilities in order to enhance effective decision-making by the Board. Each committee has adopted a written charter outlining the structure and purposes of the committee. One such committee, the Equity Contract Committee, meets periodically as needed throughout the year to consider matters specifically related to the annual renewal of Advisory Contracts. The committee requests and receives information on, and makes recommendations to the Independent Trustees concerning, the approval and annual review of the Advisory Contracts.
At its July 2006 meeting, the Board of Trustees, including the Independent Trustees, unanimously determined to renew the Advisory Contracts for each fund. In reaching its determination, the Board considered all factors it believed relevant and ultimately reached a determination, with the assistance of fund counsel and Independent Trustees' counsel, that the renewal of the Advisory Contracts and the compensation to be received by Fidelity under the management contracts is consistent with Fidelity's fiduciary duty under applicable law.
Nature, Extent, and Quality of Services Provided. The Board considered staffing within the investment adviser, Strategic Advisers, Inc. (Strategic Advisers), and the administrator, FMR, including the backgrounds of the funds' portfolio managers and the funds' investment objectives and disciplines. The Independent Trustees also had discussions with senior management of Fidelity's investment operations and investment groups. The Board considered the structure of the portfolio manager compensation program and whether this structure provides appropriate incentives.
Resources Dedicated to Investment Management and Support Services. The Board reviewed the size, education, and experience of Strategic Advisers' investment staff, their use of technology, and Strategic Advisers' and FMR's approach to recruiting, training, and retaining portfolio managers and other research, advisory, and management personnel. The Board noted that Fidelity's analysts have access to a variety of technological tools that enable them to perform both fundamental and quantitative analysis and to specialize in various disciplines.
Shareholder and Administrative Services. The Board considered (i) the nature, extent, quality, and cost of administrative, distribution, and shareholder services performed by FMR and its affiliates under the Advisory Contracts and under separate agreements covering transfer agency, pricing and bookkeeping, and securities lending services for each fund; (ii) the nature and extent of FMR's supervision of third party service providers, principally custodians and subcustodians; and (iii) the resources devoted to, and the record of compliance with, each fund's compliance policies and procedures.
The Board noted that the growth of fund assets across the complex allows Fidelity to reinvest in the development of services designed to enhance the value or convenience of the Fidelity funds as investment vehicles. These services include 24-hour access to account information and market information through phone representatives and over the Internet, and investor education materials and asset allocation tools.
Investment in a Large Fund Family. The Board considered the benefits to shareholders of investing in a Fidelity fund, including the benefits of investing in a fund that is part of a large family of funds offering a variety of investment disciplines and providing for a large variety of mutual fund investor services. The Board noted that, since July 2005, Fidelity has taken a number of actions that benefited particular funds, including (i) dedicating additional resources to investment research and to restructure the investment research teams; (ii) voluntarily entering into contractual arrangements with certain brokers pursuant to which Fidelity pays for research products and services separately out of its own resources, rather than bundling with fund commissions; (iii) launching the Fidelity Advantage Class of its five Spartan stock index funds and three Spartan bond index funds, which is a lower-fee class available to shareholders with higher account balances; (iv) contractually agreeing to impose expense limitations on Fidelity U.S. Bond Index Fund and reducing the fund's initial investment minimum; and (v) offering shareholders of each of the Fidelity Institutional Money Market Funds the privilege of exchanging shares of the fund for shares of other Fidelity funds.
Investment Performance and Compliance. The Board considered whether each fund has operated within its investment objective, as well as its record of compliance with its investment restrictions. The Board noted that it is not possible to evaluate performance in any comprehensive fashion because each fund had been in operation for less than one calendar year. Once a fund has been in operation for at least one calendar year, the Board will review the fund's absolute investment performance, as well as the fund's relative investment performance measured against a proprietary custom index and a peer group of mutual funds.
The Board considered that FMR has taken steps to refocus and strengthen equity research, equity portfolio management, and compliance. The Board noted with favor FMR's reorganization of its senior management team in 2005 and FMR's dedication of additional resources to investment research, and participated in the process that led to those changes.
VIP FreedomFunds Portfolio
Based on its review, and giving particular weight to the nature and quality of the resources dedicated by Strategic Advisers and FMR to maintain and improve relative performance, the Board concluded that the nature, extent, and quality of the services provided to each fund will benefit each fund's shareholders, particularly in light of the Board's view that each fund's shareholders benefit from investing in a fund that is part of a large family of funds offering a variety of investment disciplines and services.
Competitiveness of Management Fee and Total Fund Expenses. The Board noted that the funds do not pay Strategic Advisers a management fee for investment advisory services.
The Board considered each fund's management fee and total expenses compared to "mapped groups" of competitive funds and classes. Fidelity creates "mapped groups" by combining similar Lipper investment objective categories that have comparable management fee characteristics. Combining Lipper investment objective categories aids the Board's management fee and total expense comparisons by broadening the competitive group used for comparison and by reducing the number of universes to which various Fidelity funds are compared.
The Board considered two proprietary management fee comparisons for the period of each fund's operations shown in the charts below. The group of Lipper funds used by the Board for management fee comparisons is referred to below as the "Total Mapped Group" and, for the reasons explained above, is broader than the Lipper peer group used by the Board for performance comparisons. The Total Mapped Group comparison focuses on a fund's standing relative to the total universe of comparable funds available to investors, in terms of gross management fees before expense reimbursements or caps. "TMG %" represents the percentage of funds in the Total Mapped Group that had management fees that were lower than a fund's. For example, a TMG % of 0% means that 100% of the funds in the Total Mapped Group had higher management fees than a fund. The "Asset-Size Peer Group" (ASPG) comparison focuses on a fund's standing relative to non-Fidelity funds similar in size to the fund within the Total Mapped Group. The ASPG represents at least 15% of the funds in the Total Mapped Group with comparable asset size and management fee characteristics, subject to a minimum of 50 funds (or all funds in the Total Mapped Group if fewer than 50). Additional information, such as the ASPG quartile in which a fund's management fee ranked, is also included in the charts and considered by the Board.
VIP Freedom 2005 Portfolio
Annual Report
Board Approval of Investment Advisory Contracts and Management Fees - continued
VIP Freedom 2010 Portfolio
VIP Freedom 2015 Portfolio
VIP Freedom Funds Portfolio
VIP Freedom 2020 Portfolio
VIP Freedom 2025 Portfolio
VIP Freedom Funds Portfolio
Board Approval of Investment Advisory Contracts and Management Fees - continued
VIP Freedom 2030 Portfolio
VIP Freedom Income Portfolio
The Board noted that each fund's management fee ranked below the median of its Total Mapped Group and below the median of its ASPG for the period.
Based on its review, the Board concluded that each fund's management fee was fair and reasonable in light of the services that the fund receives and the other factors considered.
In its review of each fund's total expenses, the Board noted that each fund invests in Initial Class of the underlying fund to avoid charging fund-paid 12b-1 fees at both fund levels. The Board considered that the funds do not pay transfer agency fees. Instead, Initial Class of each underlying fund bears its pro rata portion of the VIP transfer agency fee according to the percentage of each fund's assets invested in that underlying fund. The Board further noted that FMR pays all other expenses of each fund, with limited exceptions.
The Board noted that the total expenses of each of Initial Class and Service Class of each fund ranked below its competitive median for the period, and the total expenses of Service Class 2 of each fund ranked above its competitive median for the period. The Board noted that each fund offers multiple classes, each of which has a different 12b-1 fee structure, and that the multiple structures are intended to offer a range of pricing options for the intermediary market. The Board also noted that the total expenses of the classes vary primarily by the level of their 12b-1 fees.
VIP Freedom Funds Portfolio
In its review of total expenses, the Board also considered Fidelity fee structures and other information on clients that FMR and its affiliates service in other competitive markets, such as other mutual funds advised or subadvised by FMR or its affiliates, pension plan clients, and other institutional clients.
Based on its review, the Board concluded that the total expenses of each class of each fund were reasonable, although in one case above the median of the universe presented for comparison, in light of the services that the fund and its shareholders receive and the other factors considered.
Costs of the Services and Profitability. The Board considered the level of Fidelity's profits in respect of all the Fidelity funds, as well as the profitability of each underlying fund.
PricewaterhouseCoopers LLP (PwC), independent registered accounting firm and auditor to Fidelity and certain Fidelity funds, has been engaged annually by the Board as part of the Board's assessment of the results of Fidelity's profitability analysis. PwC's engagement includes the review and assessment of Fidelity's methodologies used in determining the revenues and expenses attributable to Fidelity's mutual fund business, and completion of agreed-upon procedures surrounding the mathematical accuracy of fund profitability and its conformity to allocation methodologies. After considering PwC's reports issued under the engagement and information provided by Fidelity, the Board believes that while other allocation methods may also be reasonable, Fidelity's profitability methodologies are reasonable in all material respects.
The Board has also reviewed Fidelity's non-fund businesses and any fall-out benefits related to the mutual fund business as well as cases where Fidelity's affiliates may benefit from or be related to the funds' business.
The Board concluded that the costs of the services provided by and the profits realized by Fidelity in connection with the operation of each fund were not relevant to the renewal of each fund's Advisory Contracts because the funds do not pay management fees and FMR pays all other expenses of each fund, with limited exceptions.
Economies of Scale. The Board concluded that the realization of economies of scale was not relevant to the renewal of each fund's Advisory Contracts because the funds do not pay management fees and FMR pays all other expenses of each fund, with limited exceptions.
Additional Information Requested by the Board. In order to develop fully the factual basis for consideration of the Advisory Contracts, the Board requested additional information on several topics, including (i) Fidelity's fund profitability methodology and profitability trends within certain funds; (ii) portfolio manager compensation; (iii) the extent to which any economies of scale exist and are shared between the funds and Fidelity; (iv) the total expenses of certain funds and classes relative to competitors, including the extent to which the expenses of certain funds have been or could be capped; (v) fund performance trends; and (vi) Fidelity's fee structures, including use of performance fees.
Based on its evaluation of all of the conclusions noted above, and after considering all material factors, the Board ultimately concluded that the advisory fee structures are fair and reasonable, and that each fund's Advisory Contracts should be renewed.
Annual Report
Investment Adviser
Strategic Advisers, Inc.
Boston, MA
General Distributor
Fidelity Distributors Corporation
Boston, MA
Transfer and Service Agents
Fidelity Investments Institutional Operations Company, Inc.
Boston, MA
Fidelity Service Company, Inc.
Boston, MA
Custodian
Mellon Bank, N.A.
Pittsburgh, PA
VIPFF2K-ANN-0207
1.826371.102
Fidelity® Variable Insurance Products:
Freedom Lifetime Income Funds -
Portfolios I, II, & III
Annual Report
December 31, 2006
(2_fidelity_logos) (Registered_Trademark)
Contents
To view a fund's proxy voting guidelines and proxy voting record for the 12-month period ended June 30, visit www.fidelity.com/proxyvotingresults or visit the Securities and Exchange Commission's (SEC) web site at www.sec.gov. You may also call 1-877-208-0098 to request a free copy of the proxy voting guidelines.
Fidelity Variable Insurance Products are separate account options which are purchased through a variable insurance contract.
Standard & Poor's, S&P and S&P 500 are registered service marks of The McGraw-Hill Companies, Inc. and have been licensed for use by Fidelity Distributors Corporation.
Other third party marks appearing herein are the property of their respective owners.
All other marks appearing herein are registered or unregistered trademarks or service marks of FMR Corp. or an affiliated company.
This report and the financial statements contained herein are submitted for the general information of the shareholders of the funds. This report is not authorized for distribution to prospective investors in the funds unless preceded or accompanied by an effective prospectus.
A fund files its complete schedule of portfolio holdings with the SEC for the first and third quarters of each fiscal year on Form N-Q. Forms N-Q are available on the SEC's web site at http://www.sec.gov. A fund's Forms N-Q may be reviewed and copied at the SEC's Public Reference Room in Washington, DC. Information regarding the operation of the SEC's Public Reference Room may be obtained by calling 1-800-SEC-0330. For a complete list of a fund's portfolio holdings, view the most recent quarterly holdings report, semiannual report, or annual report on Fidelity's web site at http://www.advisor.fidelity.com.
NOT FDIC INSURED · MAY LOSE VALUE · NO BANK GUARANTEE
Neither the fund nor Fidelity Distributors Corporation is a bank.
VIP Lifetime Income Funds
VIP Freedom Lifetime Income I Portfolio
Performance: The Bottom Line
Average annual total return reflects the change in the value of an investment, assuming reinvestment of the fund's dividend income and capital gains (the profits earned upon the sale of securities that have grown in value) and assuming a constant rate of performance each year. During periods of reimbursement by Fidelity, a fund's total return will be greater than it would be had the reimbursement not occurred. Performance numbers are net of all underlying fund operating expenses, but do not include any insurance charges imposed by your insurance company's separate account. If performance information included the effect of these additional charges, the total returns would have been lower. How a fund did yesterday is no guarantee of how it will do tomorrow.
Average Annual Total Returns
Periods ended December 31, 2006 | | Past 1
year | Life of fund A |
VIP Freedom Lifetime Income I | | 9.15% | 8.92% |
A From July 26, 2005.
$10,000 Over Life of Fund
Let's say hypothetically that $10,000 was invested in VIP Freedom Lifetime Income I on July 26, 2005, when the fund started. The chart shows how the value of your investment would have changed, and also shows how the Standard & Poor's 500SM (S&P 500®) Index performed over the same period.
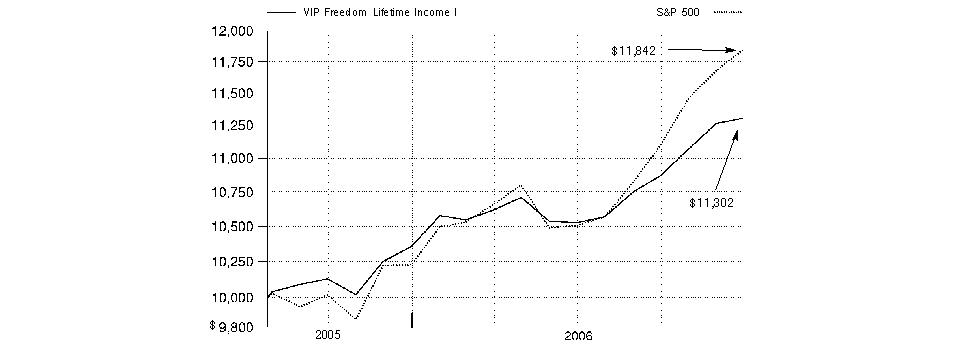
Annual Report
VIP Freedom Lifetime Income II Portfolio
Performance: The Bottom Line
Average annual total return reflects the change in the value of an investment, assuming reinvestment of the fund's dividend income and capital gains (the profits earned upon the sale of securities that have grown in value) and assuming a constant rate of performance each year. During periods of reimbursement by Fidelity, a fund's total return will be greater than it would be had the reimbursement not occurred. Performance numbers are net of all underlying fund operating expenses, but do not include any insurance charges imposed by your insurance company's separate account. If performance information included the effect of these additional charges, the total returns would have been lower. How a fund did yesterday is no guarantee of how it will do tomorrow.
Average Annual Total Returns
Periods ended December 31, 2006 | | Past 1
year | Life of fund A |
VIP Freedom Lifetime Income II | | 11.38% | 11.54% |
A From July 26, 2005.
$10,000 Over Life of Fund
Let's say hypothetically that $10,000 was invested in VIP Freedom Lifetime Income II on July 26, 2005, when the fund started. The chart shows how the value of your investment would have changed, and also shows how the Standard & Poor's 500SM (S&P 500®) Index performed over the same period.
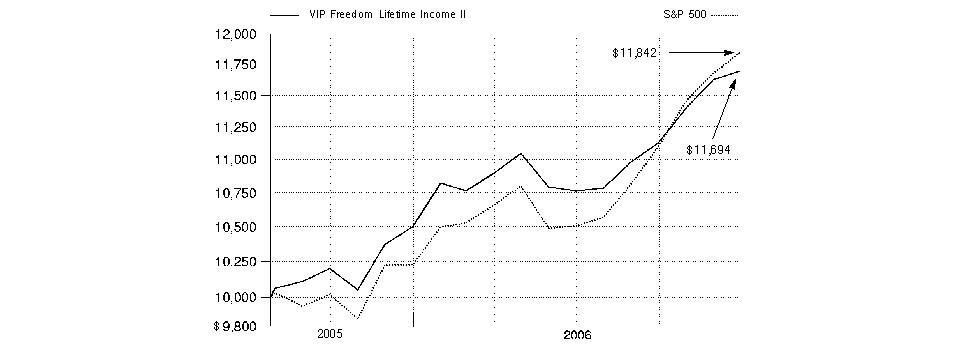
VIP Freedom Lifetime Funds Portfolio
VIP Freedom Lifetime Income III Portfolio
Performance: The Bottom Line
Average annual total return reflects the change in the value of an investment, assuming reinvestment of the fund's dividend income and capital gains (the profits earned upon the sale of securities that have grown in value) and assuming a constant rate of performance each year. During periods of reimbursement by Fidelity, a fund's total return will be greater than it would be had the reimbursement not occurred. Performance numbers are net of all underlying fund operating expenses, but do not include any insurance charges imposed by your insurance company's separate account. If performance information included the effect of these additional charges, the total returns would have been lower. How a fund did yesterday is no guarantee of how it will do tomorrow.
Average Annual Total Returns
Periods ended December 31, 2006 | | Past 1
year | Life of fund A |
VIP Freedom Lifetime Income III | | 12.78% | 13.34% |
A From July 26, 2005.
$10,000 Over Life of Fund
Let's say hypothetically that $10,000 was invested in VIP Freedom Lifetime Income III on July 26, 2005, when the fund started. The chart shows how the value of your investment would have changed, and also shows how the Standard & Poor's 500SM (S&P 500®) Index performed over the same period.

Annual Report
VIP Lifetime Income Funds Portfolio
Management's Discussion of Fund Performance
Comments from Ren Cheng and Christopher Sharpe, Co-Portfolio Managers of VIP Freedom Lifetime Income Funds
It was a positive year for stocks around the globe and for investment-grade and high-yield bonds in the United States. International equity markets as a whole outpaced their U.S. counterparts for the 12 months ending December 31, 2006 - partly as a result of favorable currency exchanges that boosted returns for U.S. investors in foreign stocks. The Morgan Stanley Capital InternationalSM Europe, Australasia, Far East (MSCI® EAFE®) Index - a gauge of developed stock markets outside the United States and Canada - gained 26.53% during that time. This marked the fifth year in a row that the MSCI EAFE outperformed the Standard & Poor's 500SM Index, a popular barometer of the U.S. equity market, which returned 15.79% in 2006. In the domestic debt markets, high yield outperformed high quality. Junk bonds' lower sensitivity to interest rate movements and investors' thirst for higher yields drove the Merrill Lynch® U.S. High Yield Master II Constrained Index up 10.76%. Investment-grade bonds rallied in the second half of the year but performed less than half as well as their riskier counterparts, finishing with a 4.33% return as measured by the Lehman Brothers® Aggregate Bond Index.
During the past year, VIP Freedom Lifetime Income Funds' absolute returns were in line with what one might expect from a series of portfolios with different age-appropriate, asset-allocation risk levels. On a relative basis, all of the Funds slightly underperformed their composite benchmarks during the period. (For specific portfolio performance results, please refer to the performance section of this report.) The Funds underperformed mainly as a result of lagging returns in the domestic and international equities asset classes, both of which had generally strong absolute returns, but fell short of their corresponding benchmarks - - the Dow Jones Wilshire 5000 Composite IndexSM, which rose 15.77%, and the MSCI EAFE. Among the seven underlying U.S. equity funds in the lineup, only VIP Mid Cap Portfolio produced a return in excess of its benchmark, led higher by productive stock picking, especially in the capital goods segment. Inopportune security selection in VIP Overseas Portfolio - mainly in the financials sector - was responsible for our underperformance in the international equities asset class, and this underlying portfolio also was a big drag on the overall equity return. In fixed-income, the relative returns for our underlying funds in the investment-grade, high-yield and short-term bond asset classes all were roughly in line with their individual benchmarks.
Note to shareholders:
In order to help increase portfolio diversification and capitalize on investment opportunities presented by an increasingly global economy, the allocation to international equity funds was increased by up to five percentage points. The allocation to domestic equity funds was reduced by a corresponding amount.
Also, the benchmark for the VIP Investor Freedom Funds' underlying high-yield bond fund changed to the Merrill Lynch U.S. High Yield Master II Constrained Index, effective July 1, 2006, concurrent with the scheduled rebalancing of the Funds' composite indexes. In Fidelity's view, the Constrained index - which replaces the Merrill Lynch U.S. High Yield Master II Index - represents a better measure of the high-yield market, as it limits issuer allocations to no more than 2% of the index and thus is more diversified than the previous benchmark and less likely to be disrupted by rapid market changes.
The views expressed above reflect those of the portfolio manager(s) only through the end of the period as stated on the cover of this report and do not necessarily represent the views of Fidelity or any other person in the Fidelity organization. Any such views are subject to change at any time based upon market or other conditions and Fidelity disclaims any responsibility to update such views. These views may not be relied on as investment advice and, because investment decisions for a Fidelity fund are based on numerous factors, may not be relied on as an indication of trading intent on behalf of any Fidelity fund.
VIP Lifetime Income Funds Portfolio
Shareholder Expense Example
As a shareholder of a Fund, you incur two types of costs: (1) transaction costs, and (2) ongoing costs. This Example is intended to help you understand your ongoing costs (in dollars) of investing in the Funds and to compare these costs with the ongoing costs of investing in other mutual funds.
The Example is based on an investment of $1,000 invested at the beginning of the period and held for the entire period (July 1, 2006 to December 31, 2006).
Actual Expenses
The first line of the accompanying table for each fund provides information about actual account values and actual expenses. You may use the information in this line, together with the amount you invested, to estimate the expenses that you paid over the period. Simply divide your account value by $1,000.00 (for example, an $8,600 account value divided by $1,000.00 = 8.6), then multiply the result by the number in the first line for a fund under the heading entitled "Expenses Paid During Period" to estimate the expenses you paid on your account during this period. The estimate of expenses does not include any fees or other expenses of any variable annuity or variable life insurance product. If they were, the estimate of expenses you paid during the period would be higher, and your ending account value would be lower. In addition, each Fund, as a shareholder in underlying Fidelity Funds, will indirectly bear its pro rata share of the fees and expenses incurred by the underlying Fidelity Funds. These fees and expenses are not included in each Fund's annualized expense ratio used to calculate the expense estimates in the table below.
Hypothetical Example for Comparison Purposes
The second line of the accompanying table for each fund provides information about hypothetical account values and hypothetical expenses based on a fund's actual expense ratio and an assumed rate of return of 5% per year before expenses, which is not the Fund's actual return. The hypothetical account values and expenses may not be used to estimate the actual ending account balance or expenses you paid for the period. You may use this information to compare the ongoing costs of investing in the Fund and other funds. To do so, compare this 5% hypothetical example with the 5% hypothetical examples that appear in the shareholder reports of the other funds. The estimate of expenses does not include any fees or other expenses of any variable annuity or variable life insurance product. If they were, the estimate of expenses you paid during the period would be higher, and your ending account value would be lower. In addition, each Fund, as a shareholder in underlying Fidelity Funds, will indirectly bear its pro rata share of the fees and expenses incurred by the underlying Fidelity Funds. These fees and expenses are not included in each Fund's annualized expense ratio used to calculate the expense estimates in the table below.
Please note that the expenses shown in the table are meant to highlight your ongoing costs only and do not reflect any transaction costs. Therefore, the second line of the table is useful in comparing ongoing costs only, and will not help you determine the relative total costs of owning different funds.
| Beginning
Account Value
July 1, 2006 | Ending
Account Value
December 31, 2006 | Expenses Paid
During Period*
July 1, 2006 to
December 31, 2006 |
VIP Freedom Lifetime Income I | | | |
Actual | $ 1,000.00 | $ 1,073.70 | $ .00 |
HypotheticalA | $ 1,000.00 | $ 1,025.21 | $ .00 |
VIP Freedom Lifetime Income II | | | |
Actual | $ 1,000.00 | $ 1,086.50 | $ .00 |
HypotheticalA | $ 1,000.00 | $ 1,025.21 | $ .00 |
VIP Freedom Lifetime Income III | | | |
Actual | $ 1,000.00 | $ 1,095.40 | $ .00 |
HypotheticalA | $ 1,000.00 | $ 1,025.21 | $ .00 |
A 5% return per year before expenses
* Expenses are equal to each Fund's annualized expense ratio of .00% multiplied by the average account value over the period, multiplied by 184/365 (to reflect the one-half year period). The fees and expenses of the underlying Fidelity Funds in which the Fund invests are not included in the Fund's annualized expense ratio.
Annual Report
VIP Freedom Lifetime Income I Portfolio
Investment Changes
Fund Holdings as of December 31, 2006 |
| % of fund's investments | % of fund's investments 6 months ago |
Domestic Equity Funds | | |
VIP Contrafund Portfolio Investor Class | 5.8 | 5.6 |
VIP Equity-Income Portfolio Investor Class | 6.8 | 6.6 |
VIP Growth & Income Portfolio Investor Class | 6.7 | 6.5 |
VIP Growth Portfolio Investor Class | 6.6 | 6.4 |
VIP Mid Cap Portfolio Investor Class | 2.4 | 2.3 |
VIP Value Portfolio Investor Class | 5.7 | 5.6 |
VIP Value Strategies Portfolio Investor Class | 2.4 | 2.3 |
| 36.4 | 35.3 |
International Equity Funds | | |
VIP Overseas Portfolio Investor Class R | 9.1 | 8.2 |
High Yield Fixed-Income Funds | | |
VIP High Income Portfolio Investor Class | 5.1 | 5.1 |
Investment Grade Fixed-Income Funds | | |
VIP Investment Grade Bond Portfolio Investor Class | 38.7 | 40.6 |
Short-Term Funds | | |
VIP Money Market Portfolio Investor Class | 10.7 | 10.8 |
| 100.0 | 100.0 |
Asset Allocation (% of fund's investments) |
Current |
| Domestic Equity Funds | 36.4% | |
| International Equity Funds | 9.1% | |
| Investment Grade Fixed-Income Funds | 38.7% | |
| High Yield Fixed-Income Funds | 5.1% | |
| Short-Term Funds | 10.7% | |

Six months ago |
| Domestic Equity Funds | 35.3% | |
| International Equity Funds | 8.2% | |
| Investment Grade Fixed-Income Funds | 40.6% | |
| High Yield Fixed-Income Funds | 5.1% | |
| Short-Term Funds | 10.8% | |

Expected |
| Domestic Equity Funds | 35.9% | |
| International Equity Funds | 9.0% | |
| Investment Grade Fixed-Income Funds | 38.7% | |
| High Yield Fixed-Income Funds | 5.0% | |
| Short-Term Funds | 11.4% | |

The fund invests according to an asset allocation strategy that becomes increasingly conservative over time. The six months ago allocation is based on the fund's holdings as of June 30, 2006. The current allocation is based on the fund's holdings as of December 31, 2006. The expected allocation represents the fund's anticipated allocation at June 30, 2007. Beginning in March 2006, the fund changed its asset allocation strategy, resulting in an increased emphasis on international equity. |
VIP Freedom Lifetime Income Funds Portfolio
VIP Freedom Lifetime Income I Portfolio
Investments December 31, 2006
Showing Percentage of Total Value of Investment in Securities
Equity Funds - 45.5% |
| Shares | | Value (Note 1) |
Domestic Equity Funds - 36.4% |
VIP Contrafund Portfolio Investor Class | 18,527 | | $ 581,947 |
VIP Equity-Income Portfolio Investor Class | 26,222 | | 685,715 |
VIP Growth & Income Portfolio Investor Class | 42,103 | | 676,595 |
VIP Growth Portfolio Investor Class | 18,520 | | 662,659 |
VIP Mid Cap Portfolio Investor Class | 7,029 | | 243,832 |
VIP Value Portfolio Investor Class | 40,584 | | 578,732 |
VIP Value Strategies Portfolio Investor Class | 18,254 | | 245,146 |
TOTAL DOMESTIC EQUITY FUNDS | | 3,674,626 |
International Equity Funds - 9.1% |
VIP Overseas Portfolio Investor Class R | 38,653 | | 924,184 |
TOTAL EQUITY FUNDS (Cost $4,306,296) | 4,598,810 |
Fixed-Income Funds - 43.8% |
| | | |
High Yield Fixed-Income Funds - 5.1% |
VIP High Income Portfolio Investor Class | 80,433 | | 509,945 |
Investment Grade Fixed-Income Funds - 38.7% |
VIP Investment Grade Bond Portfolio Investor Class | 307,331 | | 3,915,401 |
TOTAL FIXED-INCOME FUNDS (Cost $4,339,833) | 4,425,346 |
Short-Term Funds - 10.7% |
| | | |
VIP Money Market Portfolio Investor Class
(Cost $1,081,219) | 1,081,219 | | 1,081,219 |
TOTAL INVESTMENT IN SECURITIES - 100% (Cost $9,727,348) | $ 10,105,375 |
See accompanying notes which are an integral part of the financial statements.
Annual Report
VIP Freedom Lifetime Income I Portfolio
Financial Statements
Statement of Assets and Liabilities
| December 31, 2006 |
| | |
Assets | | |
Investment in securities, at value (cost $9,727,348) - See accompanying schedule | | $ 10,105,375 |
Cash | | 89 |
Dividends receivable from underlying funds | | 292 |
Total assets | | 10,105,756 |
| | |
Net Assets | | $ 10,105,756 |
Net Assets consist of: | | |
Paid in capital | | $ 9,647,940 |
Accumulated undistributed net realized gain (loss) on investments | | 79,789 |
Net unrealized appreciation (depreciation) on investments | | 378,027 |
Net Assets, for 920,753 shares outstanding | | $ 10,105,756 |
Net Asset Value, offering price and redemption price per share ($10,105,756 ÷ 920,753 shares) | | $ 10.98 |
Statement of Operations
| Year ended December 31, 2006 |
| | |
Investment Income | | |
Income distributions from underlying funds | | $ 160,138 |
| | |
Expenses | | |
Independent trustees' compensation | $ 21 | |
Total expenses before reductions | 21 | |
Expense reductions | (21) | 0 |
Net investment income (loss) | | 160,138 |
Realized and Unrealized Gain (Loss) Realized gain (loss) on sale of underlying fund shares | (18,334) | |
Capital gain distributions from underlying funds | 145,420 | 127,086 |
Change in net unrealized appreciation (depreciation) on underlying funds | | 348,399 |
Net gain (loss) | | 475,485 |
Net increase (decrease) in net assets resulting from operations | | $ 635,623 |
See accompanying notes which are an integral part of the financial statements.
VIP Lifetime Income Funds Portfolio
Statement of Changes in Net Assets
| Year ended
December 31,
2006 | For the period
July 26, 2005
(commencement
of operations) to
December 31, 2005 |
Increase (Decrease) in Net Assets | | |
Operations | | |
Net investment income (loss) | $ 160,138 | $ 13,358 |
Net realized gain (loss) | 127,086 | 9,938 |
Change in net unrealized appreciation (depreciation) | 348,399 | 29,628 |
Net increase (decrease) in net assets resulting from operations | 635,623 | 52,924 |
Distributions to shareholders from net investment income | (162,340) | (14,034) |
Distributions to shareholders from net realized gain | (45,095) | (9,824) |
Total distributions | (207,435) | (23,858) |
Share transactions
Proceeds from sales of shares | 7,602,656 | 2,908,474 |
Reinvestment of distributions | 207,435 | 23,858 |
Cost of shares redeemed | (1,038,565) | (55,356) |
Net increase (decrease) in net assets resulting from share transactions | 6,771,526 | 2,876,976 |
Total increase (decrease) in net assets | 7,199,714 | 2,906,042 |
| | |
Net Assets | | |
Beginning of period | 2,906,042 | - |
End of period | $ 10,105,756 | $ 2,906,042 |
Other Information Shares | | |
Sold | 715,785 | 286,018 |
Issued in reinvestment of distributions | 18,875 | 2,319 |
Redeemed | (96,908) | (5,336) |
Net increase (decrease) | 637,752 | 283,001 |
Financial Highlights
Years ended December 31, | 2006 | 2005 G |
Selected Per-Share Data | | |
Net asset value, beginning of period | $ 10.27 | $ 10.00 |
Income from Investment Operations | | |
Net investment income (loss) E | .27 | .10 |
Net realized and unrealized gain (loss) | .67 | .26 |
Total from investment operations | .94 | .36 |
Distributions from net investment income | (.18) | (.05) |
Distributions from net realized gain | (.05) | (.04) |
Total distributions | (.23) | (.09) |
Net asset value, end of period | $ 10.98 | $ 10.27 |
Total Return B, C, D | 9.15% | 3.55% |
Ratios to Average Net Assets F, H | | |
Expenses before reductions | .00% | .00% A |
Expenses net of fee waivers, if any | .00% | .00% A |
Expenses net of all reductions | .00% | .00% A |
Net investment income (loss) | 2.50% | 2.23% A |
Supplemental Data | | |
Net assets, end of period (000 omitted) | $ 10,106 | $ 2,906 |
Portfolio turnover rate | 28% | 71% |
A Annualized B Total returns for periods of less than one year are not annualized. C Total returns do not reflect charges attributable to your insurance company's separate account. Inclusion of these charges would reduce the total returns shown. D Total returns would have been lower had certain expenses not been reduced during the periods shown. E Calculated based on average shares outstanding during the period. F Amounts do not include the activity of the underlying funds. G For the period July 26, 2005 (commencement of operations) to December 31, 2005. H Expense ratios reflect operating expenses of the Fund. Expenses before reductions do not reflect amounts reimbursed by the investment adviser or expense offset arrangements and do not represent the amount paid by the Fund during periods when reimbursements or reductions occur. Expense ratios before reductions for start-up periods may not be representative of longer term operating periods. Expenses net of fee waivers reflect expenses after reimbursement by the investment adviser but prior to reductions from expense offset arrangements. Expenses net of all reductions represent the net expenses paid by the Fund but do not include expenses of the investment companies in which the Fund invests. |
See accompanying notes which are an integral part of the financial statements.
Annual Report
VIP Freedom Lifetime Income II Portfolio
Investment Changes
Fund Holdings as of December 31, 2006 |
| % of fund's investments | % of fund's investments 6 months ago |
Domestic Equity Funds | | |
VIP Contrafund Portfolio Investor Class | 8.1 | 8.2 |
VIP Equity-Income Portfolio Investor Class | 9.6 | 9.6 |
VIP Growth & Income Portfolio Investor Class | 9.4 | 9.5 |
VIP Growth Portfolio Investor Class | 9.2 | 9.5 |
VIP Mid Cap Portfolio Investor Class | 3.4 | 3.3 |
VIP Value Portfolio Investor Class | 8.1 | 8.2 |
VIP Value Strategies Portfolio Investor Class | 3.4 | 3.4 |
| 51.2 | 51.7 |
International Equity Funds | | |
VIP Overseas Portfolio Investor Class R | 12.6 | 11.8 |
High Yield Fixed-Income Funds | | |
VIP High Income Portfolio Investor Class | 7.7 | 7.4 |
Investment Grade Fixed-Income Funds | | |
VIP Investment Grade Bond Portfolio Investor Class | 26.6 | 27.5 |
Short-Term Funds | | |
VIP Money Market Portfolio Investor Class | 1.9 | 1.6 |
| 100.0 | 100.0 |
Asset Allocation (% of fund's investments) |
Current |
| Domestic Equity Funds | 51.2% | |
| International Equity Funds | 12.6% | |
| Investment Grade Fixed-Income Funds | 26.6% | |
| High Yield Fixed-Income Funds | 7.7% | |
| Short-Term Funds | 1.9% | |

Six months ago |
| Domestic Equity Funds | 51.7% | |
| International Equity Funds | 11.8% | |
| Investment Grade Fixed-Income Funds | 27.5% | |
| High Yield Fixed-Income Funds | 7.4% | |
| Short-Term Funds | 1.6% | |

Expected |
| Domestic Equity Funds | 48.7% | |
| International Equity Funds | 12.2% | |
| Investment Grade Fixed-Income Funds | 29.4% | |
| High Yield Fixed-Income Funds | 6.9% | |
| Short-Term Funds | 2.8% | |

The fund invests according to an asset allocation strategy that becomes increasingly conservative over time. The six months ago allocation is based on the fund's holdings as of June 30, 2006. The current allocation is based on the fund's holdings as of December 31, 2006. The expected allocation represents the fund's anticipated allocation at June 30, 2007. Beginning in March 2006, the fund changed its asset allocation strategy, resulting in an increased emphasis on international equity. |
VIP Freedom Lifetime Income Funds Portfolio
VIP Freedom Lifetime Income II Portfolio
Investments December 31, 2006
Showing Percentage of Total Value of Investment in Securities
Equity Funds - 63.8% |
| Shares | | Value (Note 1) |
Domestic Equity Funds - 51.2% |
VIP Contrafund Portfolio Investor Class | 44,399 | | $ 1,394,568 |
VIP Equity-Income Portfolio Investor Class | 62,884 | | 1,644,429 |
VIP Growth & Income Portfolio Investor Class | 101,001 | | 1,623,081 |
VIP Growth Portfolio Investor Class | 44,469 | | 1,591,114 |
VIP Mid Cap Portfolio Investor Class | 16,827 | | 583,732 |
VIP Value Portfolio Investor Class | 97,389 | | 1,388,774 |
VIP Value Strategies Portfolio Investor Class | 43,723 | | 587,204 |
TOTAL DOMESTIC EQUITY FUNDS | | 8,812,902 |
International Equity Funds - 12.6% |
VIP Overseas Portfolio Investor Class R | 90,531 | | 2,164,586 |
TOTAL EQUITY FUNDS (Cost $10,391,089) | 10,977,488 |
Fixed-Income Funds - 34.3% |
| | | |
High Yield Fixed-Income Funds - 7.7% |
VIP High Income Portfolio Investor Class | 209,458 | | 1,327,965 |
Investment Grade Fixed-Income Funds - 26.6% |
VIP Investment Grade Bond Portfolio Investor Class | 359,895 | | 4,585,062 |
TOTAL FIXED-INCOME FUNDS (Cost $5,810,216) | 5,913,027 |
Short-Term Funds - 1.9% |
| | | |
VIP Money Market Portfolio Investor Class
(Cost $330,274) | 330,274 | | 330,274 |
TOTAL INVESTMENT IN SECURITIES - 100% (Cost $16,531,579) | $ 17,220,789 |
See accompanying notes which are an integral part of the financial statements.
Annual Report
VIP Freedom Lifetime Income II Portfolio
Financial Statements
Statement of Assets and Liabilities
| December 31, 2006 |
| | |
Assets | | |
Investment in securities, at value (cost $16,531,579) - See accompanying schedule | | $ 17,220,789 |
Cash | | 90 |
Dividends receivable from underlying funds | | 88 |
Total assets | | 17,220,967 |
| | |
| | |
Net Assets | | $ 17,220,967 |
Net Assets consist of: | | |
Paid in capital | | $ 16,325,155 |
Undistributed net investment income | | 3,703 |
Accumulated undistributed net realized gain (loss) on investments | | 202,899 |
Net unrealized appreciation (depreciation) on investments | | 689,210 |
Net Assets, for 1,515,679 shares outstanding | | $ 17,220,967 |
Net Asset Value, offering price and redemption price per share ($17,220,967 ÷ 1,515,679 shares) | | $ 11.36 |
Statement of Operations
| Year ended December 31, 2006 |
| | |
Investment Income | | |
Income distributions from underlying funds | | $ 212,416 |
| | |
Expenses | | |
Independent trustees' compensation | $ 32 | |
Total expenses before reductions | 32 | |
Expense reductions | (32) | 0 |
Net investment income (loss) | | 212,416 |
Realized and Unrealized Gain (Loss) Realized gain (loss) on sale of underlying fund shares | (21,204) | |
Capital gain distributions from underlying funds | 298,666 | 277,462 |
Change in net unrealized appreciation (depreciation) on underlying funds | | 641,870 |
Net gain (loss) | | 919,332 |
Net increase (decrease) in net assets resulting from operations | | $ 1,131,748 |
See accompanying notes which are an integral part of the financial statements.
VIP Freedom Lifetime Income Funds Portfolio
Statement of Changes in Net Assets
| Year ended
December 31,
2006 | For the period
July 26, 2005
(commencement
of operations) to
December 31, 2005 |
Increase (Decrease) in Net Assets | | |
Operations | | |
Net investment income (loss) | $ 212,416 | $ 13,748 |
Net realized gain (loss) | 277,462 | 14,608 |
Change in net unrealized appreciation (depreciation) | 641,870 | 47,340 |
Net increase (decrease) in net assets resulting from operations | 1,131,748 | 75,696 |
Distributions to shareholders from net investment income | (208,713) | (13,519) |
Distributions to shareholders from net realized gain | (74,541) | (15,772) |
Total distributions | (283,254) | (29,291) |
Share transactions
Proceeds from sales of shares | 14,411,163 | 2,296,292 |
Reinvestment of distributions | 283,254 | 29,291 |
Cost of shares redeemed | (688,332) | (5,600) |
Net increase (decrease) in net assets resulting from share transactions | 14,006,085 | 2,319,983 |
Total increase (decrease) in net assets | 14,854,579 | 2,366,388 |
| | |
Net Assets | | |
Beginning of period | 2,366,388 | - |
End of period (including undistributed net investment income of $3,703 and undistributed net investment income of $0, respectively) | $ 17,220,967 | $ 2,366,388 |
Other Information Shares | | |
Sold | 1,326,173 | 225,850 |
Issued in reinvestment of distributions | 24,891 | 2,814 |
Redeemed | (63,508) | (541) |
Net increase (decrease) | 1,287,556 | 228,123 |
Financial Highlights
Years ended December 31, | 2006 | 2005 G |
Selected Per-Share Data | | |
Net asset value, beginning of period | $ 10.37 | $ 10.00 |
Income from Investment Operations | | |
Net investment income (loss) E | .23 | .10 |
Net realized and unrealized gain (loss) | .95 | .40 |
Total from investment operations | 1.18 | .50 |
Distributions from net investment income | (.14) | (.06) |
Distributions from net realized gain | (.05) | (.07) |
Total distributions | (.19) | (.13) |
Net asset value, end of period | $ 11.36 | $ 10.37 |
Total Return B, C, D | 11.38% | 5.00% |
Ratios to Average Net Assets F, H | | |
Expenses before reductions | .00% | .00% A |
Expenses net of fee waivers, if any | .00% | .00% A |
Expenses net of all reductions | .00% | .00% A |
Net investment income (loss) | 2.12% | 2.18% A |
Supplemental Data | | |
Net assets, end of period (000 omitted) | $ 17,221 | $ 2,366 |
Portfolio turnover rate | 16% | 69% |
A Annualized B Total returns for periods of less than one year are not annualized. C Total returns do not reflect charges attributable to your insurance company's separate account. Inclusion of these charges would reduce the total returns shown. D Total returns would have been lower had certain expenses not been reduced during the periods shown. E Calculated based on average shares outstanding during the period. F Amounts do not include the activity of the underlying funds. G For the period July 26, 2005 (commencement of operations) to December 31, 2005. H Expense ratios reflect operating expenses of the Fund. Expenses before reductions do not reflect amounts reimbursed by the investment adviser or expense offset arrangements and do not represent the amount paid by the Fund during periods when reimbursements or reductions occur. Expense ratios before reductions for start-up periods may not be representative of longer term operating periods. Expenses net of fee waivers reflect expenses after reimbursement by the investment adviser but prior to reductions from expense offset arrangements. Expenses net of all reductions represent the net expenses paid by the Fund but do not include expenses of the investment companies in which the Fund invests. |
See accompanying notes which are an integral part of the financial statements.
Annual Report
VIP Freedom Lifetime Income III Portfolio
Investment Changes
Fund Holdings as of December 31, 2006 |
| % of fund's investments | % of fund's investments 6 months ago |
Domestic Equity Funds | | |
VIP Contrafund Portfolio Investor Class | 9.8 | 10.2 |
VIP Equity-Income Portfolio Investor Class | 11.5 | 11.9 |
VIP Growth & Income Portfolio Investor Class | 11.4 | 11.8 |
VIP Growth Portfolio Investor Class | 11.2 | 11.8 |
VIP Mid Cap Portfolio Investor Class | 4.1 | 4.1 |
VIP Value Portfolio Investor Class | 9.7 | 10.2 |
VIP Value Strategies Portfolio Investor Class | 4.1 | 4.2 |
| 61.8 | 64.2 |
International Equity Funds | | |
VIP Overseas Portfolio Investor Class R | 16.3 | 14.6 |
High Yield Fixed-Income Funds | | |
VIP High Income Portfolio Investor Class | 7.5 | 7.8 |
Investment Grade Fixed-Income Funds | | |
VIP Investment Grade Bond Portfolio Investor Class | 14.4 | 13.4 |
Short-Term Funds | | |
VIP Money Market Portfolio Investor Class | 0.0 | 0.0 |
| 100.0 | 100.0 |
Asset Allocation (% of fund's investments) |
Current |
| Domestic Equity Funds | 61.8% | |
| International Equity Funds | 16.3% | |
| Investment Grade Fixed-Income Funds | 14.4% | |
| High Yield Fixed-Income Funds | 7.5% | |
| Short-Term Funds | 0.0% | |

Six months ago |
| Domestic Equity Funds | 64.2% | |
| International Equity Funds | 14.6% | |
| Investment Grade Fixed-Income Funds | 13.4% | |
| High Yield Fixed-Income Funds | 7.8% | |
| Short-Term Funds | 0.0% | |

Expected |
| Domestic Equity Funds | 60.6% | |
| International Equity Funds | 15.1% | |
| Investment Grade Fixed-Income Funds | 16.8% | |
| High Yield Fixed-Income Funds | 7.5% | |
| Short-Term Funds | 0.0% | |

The fund invests according to an asset allocation strategy that becomes increasingly conservative over time. The six months ago allocation is based on the fund's holdings as of June 30, 2006. The current allocation is based on the fund's holdings as of December 31, 2006. The expected allocation represents the fund's anticipated allocation at June 30, 2007. Beginning in March 2006, the fund changed its asset allocation strategy, resulting in an increased emphasis on international equity. |
VIP Freedom Lifetime Income Funds Portfolio
VIP Freedom Lifetime Income III Portfolio
Investments December 31, 2006
Showing Percentage of Total Value of Investment in Securities
Equity Funds - 78.1% |
| Shares | | Value (Note 1) |
Domestic Equity Funds - 61.8% |
VIP Contrafund Portfolio Investor Class | 27,549 | | $ 865,325 |
VIP Equity-Income Portfolio Investor Class | 38,967 | | 1,018,988 |
VIP Growth & Income Portfolio Investor Class | 62,554 | | 1,005,237 |
VIP Growth Portfolio Investor Class | 27,497 | | 983,846 |
VIP Mid Cap Portfolio Investor Class | 10,477 | | 363,450 |
VIP Value Portfolio Investor Class | 60,301 | | 859,891 |
VIP Value Strategies Portfolio Investor Class | 27,203 | | 365,331 |
TOTAL DOMESTIC EQUITY FUNDS | | 5,462,068 |
International Equity Funds - 16.3% |
VIP Overseas Portfolio Investor Class R | 59,962 | | 1,433,701 |
TOTAL EQUITY FUNDS (Cost $6,360,806) | 6,895,769 |
Fixed-Income Funds - 21.9% |
| | | |
High Yield Fixed-Income Funds - 7.5% |
VIP High Income Portfolio Investor Class | 104,526 | | 662,697 |
Investment Grade Fixed-Income Funds - 14.4% |
VIP Investment Grade Bond Portfolio Investor Class | 100,060 | | 1,274,771 |
TOTAL FIXED-INCOME FUNDS (Cost $1,905,522) | 1,937,468 |
Short-Term Funds - 0.0% |
| | | |
VIP Money Market Portfolio Investor Class
(Cost $1,772) | 1,772 | | 1,772 |
TOTAL INVESTMENT IN SECURITIES - 100% (Cost $8,268,100) | $ 8,835,009 |
See accompanying notes which are an integral part of the financial statements.
Annual Report
VIP Freedom Lifetime Income III Portfolio
Financial Statements
Statement of Assets and Liabilities
| December 31, 2006 |
| | |
Assets | | |
Investment in securities, at value (cost $8,268,100) - See accompanying schedule | | $ 8,835,009 |
Cash | | 90 |
Total assets | | 8,835,099 |
| | |
| | |
Net Assets | | $ 8,835,099 |
Net Assets consist of: | | |
Paid in capital | | $ 8,130,966 |
Undistributed net investment income | | 630 |
Accumulated undistributed net realized gain (loss) on investments | | 136,594 |
Net unrealized appreciation (depreciation) on investments | | 566,909 |
Net Assets, for 764,279 shares outstanding | | $ 8,835,099 |
Net Asset Value, offering price and redemption price per share ($8,835,099 ÷ 764,279 shares) | | $ 11.56 |
Statement of Operations
| Year ended December 31, 2006 |
| | |
Investment Income | | |
Income distributions from underlying funds | | $ 112,758 |
| | |
Expenses | | |
Independent trustees' compensation | $ 21 | |
Total expenses before reductions | 21 | |
Expense reductions | (21) | 0 |
Net investment income (loss) | | 112,758 |
Realized and Unrealized Gain (Loss) Realized gain (loss) on sale of underlying fund shares | 3,304 | |
Capital gain distributions from underlying funds | 215,764 | 219,068 |
Change in net unrealized appreciation (depreciation) on underlying funds | | 469,611 |
Net gain (loss) | | 688,679 |
Net increase (decrease) in net assets resulting from operations | | $ 801,437 |
See accompanying notes which are an integral part of the financial statements.
VIP Freedom Lifetime Income Funds Portfolio
Statement of Changes in Net Assets
| Year ended
December 31,
2006 | For the period
July 26, 2005
(commencement
of operations) to
December 31, 2005 |
Increase (Decrease) in Net Assets | | |
Operations | | |
Net investment income (loss) | $ 112,758 | $ 17,298 |
Net realized gain (loss) | 219,068 | 17,826 |
Change in net unrealized appreciation (depreciation) | 469,611 | 97,298 |
Net increase (decrease) in net assets resulting from operations | 801,437 | 132,422 |
Distributions to shareholders from net investment income | (112,128) | (16,737) |
Distributions to shareholders from net realized gain | (82,227) | (19,527) |
Total distributions | (194,355) | (36,264) |
Share transactions
Proceeds from sales of shares | 5,427,409 | 2,909,912 |
Reinvestment of distributions | 194,355 | 36,264 |
Cost of shares redeemed | (352,017) | (84,064) |
Net increase (decrease) in net assets resulting from share transactions | 5,269,747 | 2,862,112 |
Total increase (decrease) in net assets | 5,876,829 | 2,958,270 |
| | |
Net Assets | | |
Beginning of period | 2,958,270 | - |
End of period (including undistributed net investment income of $630 and undistributed net investment income of $0, respectively) | $ 8,835,099 | $ 2,958,270 |
Other Information Shares | | |
Sold | 496,103 | 287,287 |
Issued in reinvestment of distributions | 16,769 | 3,450 |
Redeemed | (30,993) | (8,337) |
Net increase (decrease) | 481,879 | 282,400 |
Financial Highlights
Years ended December 31, | 2006 | 2005 G |
Selected Per-Share Data | | |
Net asset value, beginning of period | $ 10.48 | $ 10.00 |
Income from Investment Operations | | |
Net investment income (loss) E | .19 | .11 |
Net realized and unrealized gain (loss) | 1.15 | .50 |
Total from investment operations | 1.34 | .61 |
Distributions from net investment income | (.15) | (.06) |
Distributions from net realized gain | (.11) | (.07) |
Total distributions | (.26) | (.13) |
Net asset value, end of period | $ 11.56 | $ 10.48 |
Total Return B, C, D | 12.78% | 6.10% |
Ratios to Average Net Assets F, H | | |
Expenses before reductions | .00% | .00% A |
Expenses net of fee waivers, if any | .00% | .00% A |
Expenses net of all reductions | .00% | .00% A |
Net investment income (loss) | 1.76% | 2.39% A |
Supplemental Data | | |
Net assets, end of period (000 omitted) | $ 8,835 | $ 2,958 |
Portfolio turnover rate | 15% | 59% |
A Annualized B Total returns for periods of less than one year are not annualized. C Total returns do not reflect charges attributable to your insurance company's separate account. Inclusion of these charges would reduce the total returns shown. D Total returns would have been lower had certain expenses not been reduced during the periods shown. E Calculated based on average shares outstanding during the period. F Amounts do not include the activity of the underlying funds. G For the period July 26, 2005 (commencement of operations) to December 31, 2005. H Expense ratios reflect operating expenses of the Fund. Expenses before reductions do not reflect amounts reimbursed by the investment adviser or expense offset arrangements and do not represent the amount paid by the Fund during periods when reimbursements or reductions occur. Expense ratios before reductions for start-up periods may not be representative of longer term operating periods. Expenses net of fee waivers reflect expenses after reimbursement by the investment adviser but prior to reductions from expense offset arrangements. Expenses net of all reductions represent the net expenses paid by the Fund but do not include expenses of the investment companies in which the Fund invests. |
See accompanying notes which are an integral part of the financial statements.
Annual Report
Notes to Financial Statements
For the period ended December 31, 2006
1. Significant Accounting Policies.
VIP Freedom Lifetime Income I Portfolio, VIP Freedom Lifetime Income II Portfolio, and VIP Freedom Lifetime Income III Portfolio (the Funds) are funds of Variable Insurance Products Fund IV. The Variable Insurance Products Fund IV (the trust) is registered under the Investment Company Act of 1940, as amended (the 1940 Act), as an open-end management investment company organized as a Massachusetts business trust. Each Fund is authorized to issue an unlimited number of shares. The Funds invest primarily in a combination of other VIP equity, fixed income, and money market funds (the Underlying Funds) managed by Fidelity Management & Research Company (FMR). Shares of each Fund may only be purchased by insurance companies for the purpose of funding variable annuity or variable life insurance contracts.
The financial statements have been prepared in conformity with accounting principles generally accepted in the United States of America, which require management to make certain estimates and assumptions at the date of the financial statements. The following summarizes the significant accounting policies of the Funds:
Security Valuation. Net asset value per share is calculated as of the close of business of the New York Stock Exchange, normally 4:00 p.m. Eastern time. Investments in the Underlying Funds are valued at their closing net asset value each business day. Short-term securities with remaining maturities of sixty days or less for which quotations are not readily available are valued on the basis of amortized cost, which approximates value.
Investment Transactions and Income. Security transactions, normally shares of the Underlying Funds, are accounted for as of trade date. Gains and losses on securities sold are determined on the basis of identified cost. Income and capital gain distributions from the Underlying Funds, if any, are recorded on the ex-dividend date. Interest income is accrued as earned. Interest income includes coupon interest and amortization of premium and accretion of discount on debt securities.
Expenses. Most expenses of the trust can be directly attributed to a fund. Expenses which cannot be directly attributed are apportioned among each fund in the trust. Expenses included in the accompanying financial statements reflect the expenses of each Fund and do not include any expenses associated with the Underlying Funds. Expense estimates are accrued in the period to which they relate and adjustments are made when actual amounts are known.
Income Tax Information and Distributions to Shareholders. Each year, each Fund intends to qualify as a regulated investment company by distributing all of its taxable income and realized gains under Subchapter M of the Internal Revenue Code. As a result, no provision for income taxes is required in the accompanying financial statements.
Distributions are recorded on the ex-dividend date. Income and capital gain distributions are determined in accordance with income tax regulations, which may differ from generally accepted accounting principles.
Capital accounts within the financial statements are adjusted for permanent book-tax differences. These adjustments have no impact on net assets or the results of operations. Temporary book-tax differences will reverse in a subsequent period.
Book-tax differences are primarily due to the short-term gain distributions from the Underlying Funds and wash sales.
The tax-basis components of distributable earnings and the federal tax cost as of period end were as follows for each Fund:
| Cost for Federal
Income Tax Purposes | Unrealized
Appreciation | Unrealized
Depreciation | Net Unrealized
Appreciation/
(Depreciation) |
VIP Freedom Lifetime Income I | $ 9,727,348 | $ 395,415 | $ (17,388) | $ 378,027 |
VIP Freedom Lifetime Income II | 16,531,578 | 775,772 | (86,561) | 689,211 |
VIP Freedom Lifetime Income III | 8,268,195 | 583,939 | (17,125) | 566,814 |
| Undistributed
Ordinary Income | Undistributed
Long-term
Capital Gain | Capital Loss
Carryforward |
VIP Freedom Lifetime Income I | $ - | $ 79,789 | $ - |
VIP Freedom Lifetime Income II | 7,087 | 199,514 | - |
VIP Freedom Lifetime Income III | 4,749 | 132,568 | - |
VIP Lifetime Income Funds Portfolio
1. Significant Accounting Policies - continued
Income Tax Information and Distributions to Shareholders - continued
The tax character of distributions paid was as follows:
December 31, 2006 | Ordinary Income | Long-term
Capital Gains | Total |
VIP Freedom Lifetime Income I | $ 171,359 | $ 36,076 | $ 207,435 |
VIP Freedom Lifetime Income II | 223,622 | 59,632 | 283,254 |
VIP Freedom Lifetime Income III | 127,078 | 67,277 | 194,355 |
December 31, 2005 | Ordinary Income | Long-term
Capital Gains | Total |
VIP Freedom Lifetime Income I | $ 23,858 | $ - | $ 23,858 |
VIP Freedom Lifetime Income II | 29,291 | - | 29,291 |
VIP Freedom Lifetime Income III | 36,264 | - | 36,264 |
New Accounting Pronouncements. In July 2006, Financial Accounting Standards Board Interpretation No. 48, Accounting for Uncertainty in Income Taxes - an interpretation of FASB Statement 109 (FIN 48), was issued and is effective on the last business day of the semiannual reporting period for fiscal years beginning after December 15, 2006. FIN 48 sets forth a threshold for financial statement recognition, measurement and disclosure of a tax position taken or expected to be taken on a tax return. Management is currently evaluating the impact, if any, the adoption of FIN 48 will have on the Funds' net assets, results of operations and financial statement disclosures.
In addition, in September 2006, Statement of Financial Accounting Standards No. 157, Fair Value Measurements (SFAS 157), was issued and is effective for fiscal years beginning after November 15, 2007. SFAS 157 defines fair value, establishes a framework for measuring fair value and expands disclosures about fair value measurements. Management is currently evaluating the impact the adoption of SFAS 157 will have on the Funds' financial statement disclosures.
2. Operating Policies.
Repurchase Agreements. FMR has received an Exemptive Order from the Securities and Exchange Commission (the SEC) which permits certain Funds and other affiliated entities of FMR to transfer uninvested cash balances into joint trading accounts which are then invested in repurchase agreements. Certain Funds may also invest directly with institutions in repurchase agreements. Repurchase agreements are collateralized by government or non-government securities. Upon settlement date, collateral is held in segregated accounts with custodian banks and may be obtained in the event of a default of the counterparty. Each applicable Fund monitors, on a daily basis, the value of the collateral to ensure it is at least equal to the principal amount of the repurchase agreement (including accrued interest). In the event of a default by the counterparty, realization of the collateral proceeds could be delayed, during which time the value of the collateral may decline.
3. Purchases and Sales of Investments.
Purchases and redemptions of the underlying fund shares are noted in the table below.
| Purchases ($) | Redemptions ($) |
VIP Freedom Lifetime Income I | 8,667,680 | 1,798,283 |
VIP Freedom Lifetime Income II | 15,885,228 | 1,651,400 |
VIP Freedom Lifetime Income III | 6,361,448 | 957,536 |
4. Fees and Other Transactions with Affiliates.
Management Fee. Strategic Advisers, Inc. (Strategic Advisers), an affiliate of FMR, provides the Funds with investment management related services. The Funds do not pay any fees for these services.
Other Transactions. Strategic Advisers, Inc. (Strategic Advisers) has entered into an administration agreement with FMR under which FMR provides management and administrative services (other than investment advisory services) necessary for the operation of each Fund. Pursuant to this agreement, FMR pays all expenses of each Fund, excluding the compensation of the independent Trustees and certain other expenses such as interest expense. FMR also contracts with other Fidelity companies to perform the services necessary for the operation of each Fund. The Funds do not pay any fees for these services.
Annual Report
Notes to Financial Statements - continued
5. Expense Reductions.
FMR voluntarily agreed to reimburse the Funds to the extent annual operating expenses exceeded certain levels of average net assets. Total expenses are limited to 0.00% of average net assets. Some expenses, for example interest expense, are excluded from this reimbursement.
The following amounts were reimbursed during the period:
| Reimbursement
from adviser |
VIP Freedom Lifetime Income I | $ 21 |
VIP Freedom Lifetime Income II | $ 32 |
VIP Freedom Lifetime Income III | $ 21 |
6. Other.
The Funds' organizational documents provide former and current trustees and officers with a limited indemnification against liabilities arising in connection with the performance of their duties to the Funds. In the normal course of business, the Funds may also enter into contracts that provide general indemnifications. The Funds' maximum exposure under these arrangements is unknown as this would be dependent on future claims that may be made against the Funds. The risk of material loss from such claims is considered remote.
The Funds do not invest in the Underlying Funds for the purpose of exercising management or control; however, investments by the Funds within their principal investment strategies may represent a significant portion of an Underlying Funds' net assets.
At the end of the period, FMR or its affiliates were owners of record of all of the outstanding shares of the Funds.
VIP Lifetime Income Funds Portfolio
Report of Independent Registered Public Accounting Firm
To the Trustees of Variable Insurance Products Fund IV and the Shareholders of VIP Freedom Lifetime Income I Portfolio, VIP Freedom Lifetime Income II Portfolio, VIP Freedom Lifetime Income III Portfolio:
We have audited the accompanying statements of assets and liabilities of VIP Freedom Lifetime Income I Portfolio, VIP Freedom Lifetime Income II Portfolio, and VIP Freedom Lifetime Income III Portfolio (the Funds), each a fund of Variable Insurance Products Fund IV, including the schedules of investments, as of December 31, 2006, and the related statements of operations for the year then ended, the statements of changes in net assets and the financial highlights for the year ended December 31, 2006 and for the period from July 26, 2005 (commencement of operations) to December 31, 2005. These financial statements and financial highlights are the responsibility of the Funds' management. Our responsibility is to express an opinion on these financial statements and financial highlights based on our audits.
We conducted our audits in accordance with the standards of the Public Company Accounting Oversight Board (United States). Those standards require that we plan and perform the audit to obtain reasonable assurance about whether the financial statements and financial highlights are free of material misstatement. The Funds are not required to have, nor were we engaged to perform, an audit of their internal control over financial reporting. Our audits included consideration of internal control over financial reporting as a basis for designing audit procedures that are appropriate in the circumstances, but not for the purpose of expressing an opinion on the effectiveness of the Funds' internal control over financial reporting. Accordingly, we express no such opinion. An audit also includes examining, on a test basis, evidence supporting the amounts and disclosures in the financial statements, assessing the accounting principles used and significant estimates made by management, as well as evaluating the overall financial statement presentation. Our procedures included confirmation of securities owned as of December 31, 2006, by correspondence with the custodian. We believe that our audits provide a reasonable basis for our opinion.
In our opinion, the financial statements and financial highlights referred to above present fairly, in all material respects, the financial position of VIP Freedom Lifetime Income I Portfolio, VIP Freedom Lifetime Income II Portfolio, VIP Freedom Lifetime Income III Portfolio as of December 31, 2006, the results of their operations for the year then ended and the changes in their net assets for the year ended December 31, 2006 and for the period from July 26, 2005 (commencement of operations) to December 31, 2005 and their financial highlights in conformity with accounting principles generally accepted in the United States of America.
/s/ Deloitte & Touche LLP
DELOITTE & TOUCHE LLP
Boston, Massachusetts
February 16, 2007
Annual Report
Trustees and Officers
The Trustees, Member of the Advisory Board, and executive officers of the trust and funds, as applicable, are listed below. The Board of Trustees governs each VIP Freedom Lifetime Income Fund and is responsible for protecting the interests of shareholders. The Trustees are experienced executives who meet periodically throughout the year to oversee each VIP Freedom Lifetime Income Fund's activities, review contractual arrangements with companies that provide services to each VIP Freedom Lifetime Income Fund, and review each VIP Freedom Lifetime Income Fund's performance. If the interests of a VIP Freedom Lifetime Income Fund and an underlying Fidelity fund were to diverge, a conflict of interest could arise and affect how the Trustees and Member of the Advisory Board fulfill their fiduciary duties to the affected funds. Strategic Advisers has structured the VIP Freedom Lifetime Income Funds to avoid these potential conflicts, although there may be situations where a conflict of interest is unavoidable. In such instances, Strategic Advisers, the Trustees, and Member of the Advisory Board would take reasonable steps to minimize and, if possible, eliminate the conflict. Each of the Trustees oversees 348 funds advised by FMR or an affiliate.
The Trustees hold office without limit in time except that (a) any Trustee may resign; (b) any Trustee may be removed by written instrument, signed by at least two-thirds of the number of Trustees prior to such removal; (c) any Trustee who requests to be retired or who has become incapacitated by illness or injury may be retired by written instrument signed by a majority of the other Trustees; and (d) any Trustee may be removed at any special meeting of shareholders by a two-thirds vote of the outstanding voting securities of the trust. Each Trustee who is not an interested person (as defined in the 1940 Act) (Independent Trustee), shall retire not later than the last day of the calendar year in which his or her 72nd birthday occurs. The Independent Trustees may waive this mandatory retirement age policy with respect to individual Trustees. The executive officers and Advisory Board Member hold office without limit in time, except that any officer and Advisory Board Member may resign or may be removed by a vote of a majority of the Trustees at any regular meeting or any special meeting of the Trustees. Except as indicated, each individual has held the office shown or other offices in the same company for the past five years.
The fund's statement of additional information (SAI) includes more information about the Trustees. To request a free copy, call Fidelity at 1-877-208-0098.
Interested Trustees*:
Correspondence intended for each Trustee who is an interested person may be sent to Fidelity Investments, 82 Devonshire Street, Boston, Massachusetts 02109.
Name, Age; Principal Occupation |
Edward C. Johnson 3d (76) |
| Year of Election or Appointment: 1983 Mr. Johnson is Chairman of the Board of Trustees. Mr. Johnson serves as President (2006-present), Chief Executive Officer, Chairman, and a Director of FMR Corp.; Chairman and a Director of FMR; Chairman and a Director of Fidelity Research & Analysis Company (FRAC); Chairman and a Director of Fidelity Investments Money Management, Inc.; and Chairman (2001-present) and a Director of FMR Co., Inc. In addition, Mr. Johnson serves as Chairman and Director of Fidelity International Limited (FIL). |
Robert L. Reynolds (54) |
| Year of Election or Appointment: 2003 Mr. Reynolds is President and a Director of FMR (2005-present), Fidelity Investments Money Management, Inc. (2005-present), and FMR Co., Inc. (2005-present). Mr. Reynolds also serves as Vice Chairman (2006-present), a Director (2003-present), and Chief Operating Officer of FMR Corp. and a Director of Strategic Advisers, Inc. (2005-present). He also serves on the Board at Fidelity Investments Canada, Ltd. |
* Trustees have been determined to be "Interested Trustees" by virtue of, among other things, their affiliation with the trust or various entities under common control with FMR.
VIP Lifetime Income Funds Portfolio
Independent Trustees:
Correspondence intended for each Independent Trustee (that is, the Trustees other than the Interested Trustees) may be sent to Fidelity Investments, P.O. Box 55235, Boston, Massachusetts 02205-5235.
Name, Age; Principal Occupation |
Dennis J. Dirks (58) |
| Year of Election or Appointment: 2005 Prior to his retirement in May 2003, Mr. Dirks was Chief Operating Officer and a member of the Board of The Depository Trust & Clearing Corporation (DTCC) (1999-2003). He also served as President, Chief Operating Officer, and Board member of The Depository Trust Company (DTC) (1999-2003) and President and Board member of the National Securities Clearing Corporation (NSCC) (1999-2003). In addition, Mr. Dirks served as Chief Executive Officer and Board member of the Government Securities Clearing Corporation (2001-2003) and Chief Executive Officer and Board member of the Mortgage-Backed Securities Clearing Corporation (2001-2003). Mr. Dirks also serves as a Trustee and a member of the Finance Committee of Manhattan College (2005-present) and a Trustee and a member of the Finance Committee of AHRC of Nassau County (2006-present). |
Albert R. Gamper, Jr. (64) |
| Year of Election or Appointment: 2006 Prior to his retirement in December 2004, Mr. Gamper served as Chairman of the Board of CIT Group Inc. (commercial finance). During his tenure with CIT Group Inc. Mr. Gamper served in numerous senior management positions, including Chairman (1987-1989; 1999-2001; 2002-2004), Chief Executive Officer (1987-2004), and President (1989-2002). He currently serves as a member of the Board of Directors of Public Service Enterprise Group (utilities, 2001-present), Chairman of the Board of Governors, Rutgers University (2004-present), and Chairman of the Board of Saint Barnabas Health Care System. |
George H. Heilmeier (70) |
| Year of Election or Appointment: 2004 Dr. Heilmeier is Chairman Emeritus of Telcordia Technologies (communication software and systems), where prior to his retirement, he served as company Chairman and Chief Executive Officer. He currently serves on the Boards of Directors of The Mitre Corporation (systems engineering and information technology support for the government), and HRL Laboratories (private research and development, 2004-present). He is Chairman of the General Motors Science & Technology Advisory Board and a Life Fellow of the Institute of Electrical and Electronics Engineers (IEEE). Dr. Heilmeier is a member of the Defense Science Board and the National Security Agency Advisory Board. He is also a member of the National Academy of Engineering, the American Academy of Arts and Sciences, and the Board of Overseers of the School of Engineering and Applied Science of the University of Pennsylvania. Previously, Dr. Heilmeier served as a Director of TRW Inc. (automotive, space, defense, and information technology, 1992-2002), Compaq (1994-2002), Automatic Data Processing, Inc. (ADP) (technology-based business outsourcing, 1995-2002), INET Technologies Inc. (telecommunications network surveillance, 2001-2004), and Teletech Holdings (customer management services). He is the recipient of the 2005 Kyoto Prize in Advanced Technology for his invention of the liquid crystal display, and a member of the Consumer Electronics Hall of Fame. |
James H. Keyes (66) |
| Year of Election or Appointment: 2007 Prior to his retirement in 2003, Mr. Keyes was Chairman, President, and Chief Executive Officer of Johnson Controls, Inc. (automotive supplier, 1993-2003). He currently serves as a member of the boards of LSI Logic Corporation (semiconductor technologies), Navistar International Corporation (manufacture and sale of trucks, buses, and diesel engines, 2002-present), and Pitney Bowes, Inc. (integrated mail, messaging, and document management solutions). |
Marie L. Knowles (60) |
| Year of Election or Appointment: 2001 Prior to Ms. Knowles' retirement in June 2000, she served as Executive Vice President and Chief Financial Officer of Atlantic Richfield Company (ARCO) (diversified energy, 1996-2000). From 1993 to 1996, she was a Senior Vice President of ARCO and President of ARCO Transportation Company. She served as a Director of ARCO from 1996 to 1998. She currently serves as a Director of Phelps Dodge Corporation (copper mining and manufacturing) and McKesson Corporation (healthcare service, 2002-present). Ms. Knowles is a Trustee of the Brookings Institution and the Catalina Island Conservancy and also serves as a member of the Advisory Board for the School of Engineering of the University of Southern California. |
Ned C. Lautenbach (62) |
| Year of Election or Appointment: 2000 Mr. Lautenbach is Chairman of the Independent Trustees (2006-present). Mr. Lautenbach has been a partner of Clayton, Dubilier & Rice, Inc. (private equity investment firm) since September 1998. Previously, Mr. Lautenbach was with the International Business Machines Corporation (IBM) from 1968 until his retirement in 1998. Mr. Lautenbach serves as a Director of Sony Corporation (2006-present) and Eaton Corporation (diversified industrial) as well as the Philharmonic Center for the Arts in Naples, Florida. He also is a member of the Board of Trustees of Fairfield University (2005-present), as well as a member of the Council on Foreign Relations. |
Cornelia M. Small (62) |
| Year of Election or Appointment: 2005 Ms. Small is a member (2000-present) and Chairperson (2002-present) of the Investment Committee, and a member (2002-present) of the Board of Trustees of Smith College. Previously, she served as Chief Investment Officer (1999-2000), Director of Global Equity Investments (1996-1999), and a member of the Board of Directors of Scudder, Stevens & Clark (1990-1997) and Scudder Kemper Investments (1997-1999). In addition, Ms. Small served as Co-Chair (2000-2003) of the Annual Fund for the Fletcher School of Law and Diplomacy. |
William S. Stavropoulos (67) |
| Year of Election or Appointment: 2001 Mr. Stavropoulos is Chairman Emeritus of the Board of Directors of The Dow Chemical Company. Since joining The Dow Chemical Company in 1967, Mr. Stavropoulos served in numerous senior management positions, including President (1993-2000; 2002-2003), CEO (1995-2000; 2002-2004), and Chairman of the Executive Committee (2000-2004). Currently, he is a Director of NCR Corporation (data warehousing and technology solutions), BellSouth Corporation (telecommunications), Chemical Financial Corporation, Maersk Inc. (industrial conglomerate, 2002-present), and Metalmark Capital (private equity investment firm, 2005-present). He also serves as a member of the Board of Trustees of the American Enterprise Institute for Public Policy Research. In addition, Mr. Stavropoulos is a member of The Business Council, J.P. Morgan International Council and the University of Notre Dame Advisory Council for the College of Science. |
Kenneth L. Wolfe (67) |
| Year of Election or Appointment: 2005 Prior to his retirement in 2001, Mr. Wolfe was Chairman and Chief Executive Officer of Hershey Foods Corporation (1993-2001). He currently serves as a member of the boards of Adelphia Communications Corporation (2003-present), Bausch & Lomb, Inc., and Revlon Inc. (2004-present). |
Advisory Board Member and Executive Officers:
Correspondence intended for each executive officer and Mr. Lynch may be sent to Fidelity Investments, 82 Devonshire Street, Boston, Massachusetts 02109.
Name, Age; Principal Occupation |
Peter S. Lynch (62) |
| Year of Election or Appointment: 2003 Member of the Advisory Board of Variable Insurance Products IV. Mr. Lynch is Vice Chairman and a Director of FMR, and Vice Chairman (2001-present) and a Director of FMR Co., Inc. Previously, Mr. Lynch served as a Trustee of the Fidelity funds (1990-2003). In addition, he serves as a Trustee of Boston College and as the Chairman of the Inner-City Scholarship Fund. |
Kimberley H. Monasterio (43) |
| Year of Election or Appointment: 2007 President and Treasurer of VIP Freedom Lifetime Income I, VIP Freedom Lifetime Income II, and VIP Freedom Lifetime Income III. Ms. Monasterio also serves as President and Treasurer of other Fidelity funds (2007-present) and is an employee of FMR (2004-present). Previously, Ms. Monasterio served as Deputy Treasurer of the Fidelity funds (2004-2006). Before joining Fidelity Investments, Ms. Monasterio served as Treasurer (2000-2004) and Chief Financial Officer (2002-2004) of the Franklin Templeton Funds and Senior Vice President of Franklin Templeton Services, LLC (2000-2004). |
Boyce I. Greer (50) |
| Year of Election or Appointment: 2005 Vice President of VIP Freedom Lifetime Income I, VIP Freedom Lifetime Income II, and VIP Freedom Lifetime Income III. Mr. Greer also serves as Vice President of certain Equity Funds (2005-present), certain Asset Allocation Funds (2005-present), Fixed-Income Funds (2006-present), and Money Market Funds (2006-present). Mr. Greer is also a Trustee of other investment companies advised by FMR (2003-present). He is an Executive Vice President of FMR (2005-present) and FMR Co., Inc. (2005-present), and Senior Vice President of Fidelity Investments Money Management, Inc. (2006-present). Previously, Mr. Greer served as a Director and Managing Director of Strategic Advisers, Inc. (2002-2005), and Executive Vice President (2000-2002) and Money Market Group Leader (1997-2002) of the Fidelity Investments Fixed Income Division. He also served as Vice President of Fidelity's Money Market Funds (1997-2002), Senior Vice President of FMR (1997-2002), and Vice President of FIMM (1998-2002). |
Ren Cheng (49) |
| Year of Election or Appointment: 2005 Vice President of VIP Freedom Lifetime Income I, VIP Freedom Lifetime Income II, and VIP Freedom Lifetime Income III. Mr. Cheng also serves as Vice President for other funds advised by FMR. Prior to assuming his current responsibilities, Mr. Cheng worked as a portfolio manager. Mr. Cheng also serves as Vice President of FMR and FMR Co., Inc. (2002). |
Christopher L. Sharpe (38) |
| Year of Election or Appointment: 2005 Vice President of VIP Freedom Lifetime Income I, VIP Freedom Lifetime Income II, and VIP Freedom Lifetime Income III. Mr. Sharpe also serves as Vice President of other funds advised by FMR. Prior to assuming his current responsibilities, Mr. Sharpe worked as an associate investment policy officer for John Hancock Financial Services, Inc. in Boston. From 1990 to 2000 he was with William M. Mercer, Inc. in Boston. Mr. Sharpe also serves as Vice President of FMR and FMR Co., Inc. (2006). |
Eric D. Roiter (58) |
| Year of Election or Appointment: 2005 Secretary of VIP Freedom Lifetime Income I, VIP Freedom Lifetime Income II, and VIP Freedom Lifetime Income III. He also serves as Secretary of other Fidelity funds; Vice President, General Counsel, and Secretary of FMR Co., Inc. (2001-present) and FMR; Assistant Secretary of Fidelity Management & Research (U.K.) Inc. (2001-present), Fidelity Research & Analysis Company (2001-present), and Fidelity Investments Money Management, Inc. (2001-present). Mr. Roiter is an Adjunct Member, Faculty of Law, at Boston College Law School (2003-present). Previously, Mr. Roiter served as Vice President and Secretary of Fidelity Distributors Corporation (FDC) (1998-2005). |
Stuart Fross (47) |
| Year of Election or Appointment: 2005 Assistant Secretary of VIP Freedom Lifetime Income I, VIP Freedom Lifetime Income II, and VIP Freedom Lifetime Income III. Mr. Fross also serves as Assistant Secretary of other Fidelity funds (2003-present), Vice President and Secretary of FDC (2005-present), and is an employee of FMR. |
R. Stephen Ganis (40) |
| Year of Election or Appointment: 2006 Anti-Money Laundering (AML) officer of VIP Freedom Lifetime Income I, VIP Freedom Lifetime Income II, and VIP Freedom Lifetime Income III. Mr. Ganis also serves as AML officer of other Fidelity funds (2006-present) and FMR Corp. (2003-present). Before joining Fidelity Investments, Mr. Ganis practiced law at Goodwin Procter, LLP (2000-2002). |
Joseph B. Hollis (58) |
| Year of Election or Appointment: 2006 Chief Financial Officer of VIP Freedom Lifetime Income I, VIP Freedom Lifetime Income II, and VIP Freedom Lifetime Income III. Mr. Hollis also serves as Chief Financial Officer of other Fidelity funds. Mr. Hollis is President of Fidelity Pricing and Cash Management Services (FPCMS) (2005-present). Mr. Hollis also serves as President and Director of Fidelity Service Company, Inc. (2006-present). Previously, Mr. Hollis served as Senior Vice President of Cash Management Services (1999-2002) and Investment Management Operations (2002-2005). |
Kenneth A. Rathgeber (59) |
| Year of Election or Appointment: 2005 Chief Compliance Officer of VIP Freedom Lifetime Income I, VIP Freedom Lifetime Income II, and VIP Freedom Lifetime Income III. Mr. Rathgeber also serves as Chief Compliance Officer of other Fidelity funds (2004-present) and Executive Vice President of Risk Oversight for Fidelity Investments (2002-present). He is Chief Compliance Officer of FMR (2005-present), FMR Co., Inc. (2005-present), Fidelity Management & Research (U.K.) Inc. (2005-present), Fidelity Research & Analysis Company (2005-present), Fidelity Investments Money Management, Inc. (2005-present), and Strategic Advisers, Inc. (2005-present). Previously, Mr. Rathgeber served as Executive Vice President and Chief Operating Officer for Fidelity Investments Institutional Services Company, Inc. (1998-2002). |
Bryan A. Mehrmann (45) |
| Year of Election or Appointment: 2005 Deputy Treasurer of VIP Freedom Lifetime Income I, VIP Freedom Lifetime Income II, and VIP Freedom Lifetime Income III. Mr. Mehrmann also serves as Deputy Treasurer of other Fidelity funds (2005-present) and is an employee of FMR. Previously, Mr. Mehrmann served as Vice President of Fidelity Investments Institutional Services Group (FIIS)/Fidelity Investments Institutional Operations Corporation, Inc. (FIIOC) Client Services (1998-2004). |
Kenneth B. Robins (37) |
| Year of Election or Appointment: 2005 Deputy Treasurer of VIP Freedom Lifetime Income I, VIP Freedom Lifetime Income II, and VIP Freedom Lifetime Income III. Mr. Robins also serves as Deputy Treasurer of other Fidelity funds (2005-present) and is an employee of FMR (2004-present). Before joining Fidelity Investments, Mr. Robins worked at KPMG LLP, where he was a partner in KPMG's department of professional practice (2002-2004) and a Senior Manager (1999-2000). In addition, Mr. Robins served as Assistant Chief Accountant, United States Securities and Exchange Commission (2000-2002). |
Robert G. Byrnes (40) |
| Year of Election or Appointment: 2005 Assistant Treasurer of VIP Freedom Lifetime Income I, VIP Freedom Lifetime Income II, and VIP Freedom Lifetime Income III. Mr. Byrnes also serves as Assistant Treasurer of other Fidelity funds (2005-present) and is an employee of FMR (2005-present). Previously, Mr. Byrnes served as Vice President of FPCMS (2003-2005). Before joining Fidelity Investments, Mr. Byrnes worked at Deutsche Asset Management where he served as Vice President of the Investment Operations Group (2000-2003). |
John H. Costello (60) |
| Year of Election or Appointment: 2005 Assistant Treasurer of VIP Freedom Lifetime Income I, VIP Freedom Lifetime Income II, and VIP Freedom Lifetime Income III. Mr. Costello also serves as Assistant Treasurer of other Fidelity funds and is an employee of FMR. |
Peter L. Lydecker (52) |
| Year of Election or Appointment: 2005 Assistant Treasurer of VIP Freedom Lifetime Income I, VIP Freedom Lifetime Income II, and VIP Freedom Lifetime Income III. Mr. Lydecker also serves as Assistant Treasurer of other Fidelity funds (2004) and is an employee of FMR. |
Mark Osterheld (51) |
| Year of Election or Appointment: 2005 Assistant Treasurer of VIP Freedom Lifetime Income I, VIP Freedom Lifetime Income II, and VIP Freedom Lifetime Income III. Mr. Osterheld also serves as Assistant Treasurer of other Fidelity funds (2002) and is an employee of FMR. |
Gary W. Ryan (48) |
| Year of Election or Appointment: 2005 Assistant Treasurer of VIP Freedom Lifetime Income I, VIP Freedom Lifetime Income II, and VIP Freedom Lifetime Income III. Mr. Ryan also serves as Assistant Treasurer of other Fidelity funds (2005-present) and is an employee of FMR (2005-present). Previously, Mr. Ryan served as Vice President of Fund Reporting in FPCMS (1999-2005). |
Salvatore Schiavone (41) |
| Year of Election or Appointment: 2005 Assistant Treasurer of VIP Freedom Lifetime Income I, VIP Freedom Lifetime Income II, and VIP Freedom Lifetime Income III. Mr. Schiavone also serves as Assistant Treasurer of other Fidelity funds (2005-present) and is an employee of FMR (2005-present). Before joining Fidelity Investments, Mr. Schiavone worked at Deutsche Asset Management, where he most recently served as Assistant Treasurer (2003-2005) of the Scudder Funds and Vice President and Head of Fund Reporting (1996-2003). |
VIP Lifetime Income Funds Portfolio
Distributions
The Board of Trustees of each fund voted to pay to shareholders of record at the opening of business on record date, the following distributions per share derived from capital gains realized from sales of portfolio securities, and dividends derived from net investment income:
| Pay Date | Record Date | Dividends | Capital Gains |
VIP Freedom Lifetime Income I | 02/09/07 | 02/09/07 | $.000 | $.090 |
VIP Freedom Lifetime Income II | 02/09/07 | 02/09/07 | $.005 | $.135 |
VIP Freedom Lifetime Income III | 02/09/07 | 02/09/07 | $.005 | $.170 |
The funds hereby designate as capital gain dividends the amounts noted below for the taxable year ended December 31, 2006, or, if subsequently determined to be different, the net capital gain of such year.
VIP Freedom Lifetime Income I | $117,341 |
VIP Freedom Lifetime Income II | $259,146 |
VIP Freedom Lifetime Income III | $199,845 |
A percentage of the dividends distributed during the fiscal year for the following funds qualifies for the dividends-received deduction for corporate shareholders:
VIP Freedom Lifetime Income I | 18% |
VIP Freedom Lifetime Income II | 29% |
VIP Freedom Lifetime Income III | 37% |
The funds will notify shareholders in January 2007 of amounts for use in preparing 2006 income tax returns.
Annual Report
Proxy Voting Results
A special meeting of the fund's shareholders was held on September 20, 2006. The results of votes taken among shareholders on the proposal before them are reported below. Each vote reported represents one dollar of net asset value held on the record date for the meeting.
PROPOSAL 1 |
To elect a Board of Trustees. A |
| # of
Votes | % of
Votes |
Dennis J. Dirks |
Affirmative | 92,459,317.52 | 96.102 |
Withheld | 3,749,837.05 | 3.898 |
TOTAL | 96,209,154.57 | 100.000 |
Albert R. Gamper, Jr. |
Affirmative | 92,260,598.99 | 95.896 |
Withheld | 3,948,555.58 | 4.104 |
TOTAL | 96,209,154.57 | 100.000 |
Robert M. Gates |
Affirmative | 92,315,480.72 | 95.953 |
Withheld | 3,893,673.85 | 4.047 |
TOTAL | 96,209,154.57 | 100.000 |
George H. Heilmeier |
Affirmative | 92,208,255.41 | 95.841 |
Withheld | 4,000,899.16 | 4.159 |
TOTAL | 96,209,154.57 | 100.000 |
Edward C. Johnson 3d |
Affirmative | 91,928,267.76 | 95.550 |
Withheld | 4,280,886.81 | 4.450 |
TOTAL | 96,209,154.57 | 100.000 |
Stephen P. Jonas |
Affirmative | 92,457,628.76 | 96.101 |
Withheld | 3,751,525.81 | 3.899 |
TOTAL | 96,209,154.57 | 100.000 |
James H. KeyesB |
Affirmative | 92,432,729.82 | 96.075 |
Withheld | 3,776,424.75 | 3.925 |
TOTAL | 96,209,154.57 | 100.000 |
Marie L. Knowles |
Affirmative | 92,398,847.52 | 96.040 |
Withheld | 3,810,307.05 | 3.960 |
TOTAL | 96,209,154.57 | 100.000 |
Ned C. Lautenbach |
Affirmative | 92,423,184.47 | 96.065 |
Withheld | 3,785,970.10 | 3.935 |
TOTAL | 96,209,154.57 | 100.000 |
| # of
Votes | % of
Votes |
William O. McCoy |
Affirmative | 92,086,293.90 | 95.715 |
Withheld | 4,122,860.67 | 4.285 |
TOTAL | 96,209,154.57 | 100.000 |
Robert L. Reynolds |
Affirmative | 92,439,032.86 | 96.081 |
Withheld | 3,770,121.71 | 3.919 |
TOTAL | 96,209,154.57 | 100.000 |
Cornelia M. Small |
Affirmative | 92,415,567.29 | 96.057 |
Withheld | 3,793,587.28 | 3.943 |
TOTAL | 96,209,154.57 | 100.000 |
William S. Stavropoulos |
Affirmative | 92,135,400.08 | 95.766 |
Withheld | 4,073,754.49 | 4.234 |
TOTAL | 96,209,154.57 | 100.000 |
Kenneth L. Wolfe |
Affirmative | 92,445,865.31 | 96.088 |
Withheld | 3,763,289.26 | 3.912 |
TOTAL | 96,209,154.57 | 100.000 |
A Denotes trust-wide proposal and voting results. B Effective on or about January 1, 2007. |
VIP Freedom Lifetime Income Funds Portfolio
Board Approval of Investment Advisory Contracts and Management Fees
VIP Freedom Lifetime Income Funds
Each year, typically in July, the Board of Trustees, including the Independent Trustees (together, the Board), votes on the renewal of the management contract and administration agreement (together, the Advisory Contracts) for each fund. The Board, assisted by the advice of fund counsel and Independent Trustees' counsel, requests and considers a broad range of information throughout the year.
The Board meets regularly each month except August and takes into account throughout the year matters bearing on Advisory Contracts. The Board, acting directly and through its separate committees, considers at each of its meetings factors that are relevant to the annual renewal of each fund's Advisory Contracts, including the services and support provided to each fund and its shareholders. At the time of the renewal, the Board had 12 standing committees, each composed of Independent Trustees with varying backgrounds, to which the Board has assigned specific subject matter responsibilities in order to enhance effective decision-making by the Board. Each committee has adopted a written charter outlining the structure and purposes of the committee. One such committee, the Equity Contract Committee, meets periodically as needed throughout the year to consider matters specifically related to the annual renewal of Advisory Contracts. The committee requests and receives information on, and makes recommendations to the Independent Trustees concerning, the approval and annual review of the Advisory Contracts.
At its July 2006 meeting, the Board of Trustees, including the Independent Trustees, unanimously determined to renew the Advisory Contracts for each fund. In reaching its determination, the Board considered all factors it believed relevant and ultimately reached a determination, with the assistance of fund counsel and Independent Trustees' counsel, that the renewal of the Advisory Contracts and the compensation to be received by Fidelity under the management contracts is consistent with Fidelity's fiduciary duty under applicable law.
Nature, Extent, and Quality of Services Provided. The Board considered staffing within the investment adviser, Strategic Advisers, Inc. (Strategic Advisers), and the administrator, FMR, including the backgrounds of the funds' portfolio managers and the funds' investment objectives and disciplines. The Independent Trustees also had discussions with senior management of Fidelity's investment operations and investment groups. The Board considered the structure of the portfolio manager compensation program and whether this structure provides appropriate incentives.
Resources Dedicated to Investment Management and Support Services. The Board reviewed the size, education, and experience of Strategic Advisers' investment staff, their use of technology, and Strategic Advisers' and FMR's approach to recruiting, training, and retaining portfolio managers and other research, advisory, and management personnel. The Board noted that Fidelity's analysts have access to a variety of technological tools that enable them to perform both fundamental and quantitative analysis and to specialize in various disciplines.
Shareholder and Administrative Services. The Board considered (i) the nature, extent, quality, and cost of administrative, distribution, and shareholder services performed by FMR and its affiliates under the Advisory Contracts and under separate agreements covering transfer agency, pricing and bookkeeping, and securities lending services for each fund; (ii) the nature and extent of FMR's supervision of third party service providers, principally custodians and subcustodians; and (iii) the resources devoted to, and the record of compliance with, each fund's compliance policies and procedures.
The Board noted that the growth of fund assets across the complex allows Fidelity to reinvest in the development of services designed to enhance the value or convenience of the Fidelity funds as investment vehicles. These services include 24-hour access to account information and market information through phone representatives and over the Internet, and investor education materials and asset allocation tools.
Investment in a Large Fund Family. The Board considered the benefits to shareholders of investing in a Fidelity fund, including the benefits of investing in a fund that is part of a large family of funds offering a variety of investment disciplines and providing for a large variety of mutual fund investor services. The Board noted that, since July 2005, Fidelity has taken a number of actions that benefited particular funds, including (i) dedicating additional resources to investment research and to restructure the investment research teams; (ii) voluntarily entering into contractual arrangements with certain brokers pursuant to which Fidelity pays for research products and services separately out of its own resources, rather than bundling with fund commissions; (iii) launching the Fidelity Advantage Class of its five Spartan stock index funds and three Spartan bond index funds, which is a lower-fee class available to shareholders with higher account balances; (iv) contractually agreeing to impose expense limitations on Fidelity U.S. Bond Index Fund and reducing the fund's initial investment minimum; and (v) offering shareholders of each of the Fidelity Institutional Money Market Funds the privilege of exchanging shares of the fund for shares of other Fidelity funds.
Investment Performance and Compliance. The Board considered whether each fund has operated within its investment objective, as well as its record of compliance with its investment restrictions. The Board noted that it is not possible to evaluate performance in any comprehensive fashion because each fund had been in operation for less than one calendar year. Once a fund has been in operation for at least one calendar year, the Board will review the fund's absolute investment performance, as well as the fund's relative investment performance measured against a proprietary custom index and a peer group of mutual funds.
The Board considered that FMR has taken steps to refocus and strengthen equity research, equity portfolio management, and compliance. The Board noted with favor FMR's reorganization of its senior management team in 2005 and FMR's dedication of additional resources to investment research, and participated in the process that led to those changes.
Annual Report
Board Approval of Investment Advisory Contracts and Management Fees - continued
Based on its review, and giving particular weight to the nature and quality of the resources dedicated by Strategic Advisers and FMR to maintain and improve relative performance, the Board concluded that the nature, extent, and quality of the services provided to each fund will benefit each fund's shareholders, particularly in light of the Board's view that each fund's shareholders benefit from investing in a fund that is part of a large family of funds offering a variety of investment disciplines and services.
Competitiveness of Management Fee and Total Fund Expenses. The Board noted that the funds do not pay Strategic Advisers a management fee for investment advisory services.
The Board considered each fund's management fee and total expenses compared to "mapped groups" of competitive funds and classes. Fidelity creates "mapped groups" by combining similar Lipper investment objective categories that have comparable management fee characteristics. Combining Lipper investment objective categories aids the Board's management fee and total expense comparisons by broadening the competitive group used for comparison and by reducing the number of universes to which various Fidelity funds are compared.
The Board considered two proprietary management fee comparisons for the period of each fund's operations shown in the charts below. The group of Lipper funds used by the Board for management fee comparisons is referred to below as the "Total Mapped Group" and, for the reasons explained above, is broader than the Lipper peer group used by the Board for performance comparisons. The Total Mapped Group comparison focuses on a fund's standing relative to the total universe of comparable funds available to investors, in terms of gross management fees before expense reimbursements or caps. "TMG %" represents the percentage of funds in the Total Mapped Group that had management fees that were lower than a fund's. For example, a TMG % of 0% means that 100% of the funds in the Total Mapped Group had higher management fees than a fund. The "Asset-Size Peer Group" (ASPG) comparison focuses on a fund's standing relative to non-Fidelity funds similar in size to the fund within the Total Mapped Group. The ASPG represents at least 15% of the funds in the Total Mapped Group with comparable asset size and management fee characteristics, subject to a minimum of 50 funds (or all funds in the Total Mapped Group if fewer than 50). Additional information, such as the ASPG quartile in which a fund's management fee ranked, is also included in the charts and considered by the Board.
VIP Freedom Lifetime Income I Portfolio
VIP Lifetime Income Funds Portfolio
VIP Freedom Lifetime Income II Portfolio

VIP Freedom Lifetime Income III Portfolio
The Board noted that each fund's management fee ranked below the median of its Total Mapped Group and below the median of its ASPG for the period.
In its review of each fund's total expenses, the Board noted that each fund invests in Investor Class of the underlying fund to avoid charging fund-paid 12b-1 fees at both fund levels. The Board considered that the funds do not pay transfer agency fees. Instead, Investor Class of each underlying fund bears its pro rata portion of the VIP transfer agency fee according to the percentage of each fund's assets invested in that underlying fund. The Board further noted that FMR pays all other expenses of each fund, with limited exceptions.
The Board noted that each fund's total expenses ranked below its competitive median for the period.
In its review of total expenses, the Board also considered Fidelity fee structures and other information on clients that FMR and its affiliates service in other competitive markets, such as other mutual funds advised or subadvised by FMR or its affiliates, pension plan clients, and other institutional clients.
Based on its review, the Board concluded that each fund's management fee and total expenses were fair and reasonable in light of the services that the fund and its shareholders receive and the other factors considered.
Annual Report
Board Approval of Investment Advisory Contracts and Management Fees - continued
Costs of the Services and Profitability. The Board considered the level of Fidelity's profits in respect of all the Fidelity funds, as well as the profitability of each underlying fund.
PricewaterhouseCoopers LLP (PwC), independent registered accounting firm and auditor to Fidelity and certain Fidelity funds, has been engaged annually by the Board as part of the Board's assessment of the results of Fidelity's profitability analysis. PwC's engagement includes the review and assessment of Fidelity's methodologies used in determining the revenues and expenses attributable to Fidelity's mutual fund business, and completion of agreed-upon procedures surrounding the mathematical accuracy of fund profitability and its conformity to allocation methodologies. After considering PwC's reports issued under the engagement and information provided by Fidelity, the Board believes that while other allocation methods may also be reasonable, Fidelity's profitability methodologies are reasonable in all material respects.
The Board has also reviewed Fidelity's non-fund businesses and any fall-out benefits related to the mutual fund business as well as cases where Fidelity's affiliates may benefit from or be related to the funds' business.
The Board concluded that the costs of the services provided by and the profits realized by Fidelity in connection with the operation of each fund were not relevant to the renewal of each fund's Advisory Contracts because the funds do not pay management fees and FMR pays all other expenses of each fund, with limited exceptions.
Economies of Scale. The Board concluded that the realization of economies of scale was not relevant to the renewal of each fund's Advisory Contracts because the funds do not pay management fees and FMR pays all other expenses of each fund, with limited exceptions.
Additional Information Requested by the Board. In order to develop fully the factual basis for consideration of the Advisory Contracts, the Board requested additional information on several topics, including (i) Fidelity's fund profitability methodology and profitability trends within certain funds; (ii) portfolio manager compensation; (iii) the extent to which any economies of scale exist and are shared between the funds and Fidelity; (iv) the total expenses of certain funds and classes relative to competitors, including the extent to which the expenses of certain funds have been or could be capped; (v) fund performance trends; and (vi) Fidelity's fee structures, including use of performance fees.
Based on its evaluation of all of the conclusions noted above, and after considering all material factors, the Board ultimately concluded that the advisory fee structures are fair and reasonable, and that each fund's Advisory Contracts should be renewed.
VIP Lifetime Income Funds Portfolio
Annual Report
Investment Adviser
Strategic Advisers, Inc.
Boston, MA
General Distributor
Fidelity Distributors Corporation
Boston, MA
Transfer and Service Agents
Fidelity Investments Institutional Operations Company, Inc.
Boston, MA
Fidelity Service Company, Inc.
Boston, MA
Custodian
Mellon Bank, N.A.
Pittsburgh, PA
VIPFLI-ANN-0207
1.816199.101
Fidelity® Variable Insurance Products:
FundsManager - 20%, 50%, 70%, 85% Portfolio
Annual Report
December 31, 2006
(2_fidelity_logos) (Registered_Trademark)
Contents
To view a fund's proxy voting guidelines and proxy voting record for the 12-month period ended June 30, visit www.fidelity.com/proxyvotingresults or visit the Securities and Exchange Commission's (SEC) web site at www.sec.gov. You may also call 1-877-208-0098 to request a free copy of the proxy voting guidelines.
Fidelity Variable Insurance Products are separate account options which are purchased through a variable insurance contract.
Standard & Poor's, S&P and S&P 500 are registered service marks of The McGraw-Hill Companies, Inc. and have been licensed for use by Fidelity Distributors Corporation.
Other third party marks appearing herein are the property of their respective owners.
All other marks appearing herein are registered or unregistered trademarks or service marks of FMR Corp. or an affiliated company.
This report and the financial statements contained herein are submitted for the general information of the shareholders of the funds. This report is not authorized for distribution to prospective investors in the funds unless preceded or accompanied by an effective prospectus.
A fund files its complete schedule of portfolio holdings with the SEC for the first and third quarters of each fiscal year on Form N-Q. Forms N-Q are available on the SEC's web site at http://www.sec.gov. A fund's Forms N-Q may be reviewed and copied at the SEC's Public Reference Room in Washington, DC. Information regarding the operation of the SEC's Public Reference Room may be obtained by calling 1-800-SEC-0330. For a complete list of a fund's portfolio holdings, view the most recent quarterly holdings report, semiannual report, or annual report on Fidelity's web site at http://www.advisor.fidelity.com.
NOT FDIC INSURED · MAY LOSE VALUE · NO BANK GUARANTEE
Neither the fund nor Fidelity Distributors Corporation is a bank.
VIP FundsManager Portfolio
VIP FundsManager 20% Portfolio
Performance: The Bottom Line
Average annual total return reflects the change in the value of an investment, assuming reinvestment of the class' dividend income and capital gains (the profits earned upon the sale of securities that have grown in value) and assuming a constant rate of performance each year. The $10,000 table does not reflect the deduction of taxes that a shareholder would pay on fund distributions or the redemption of fund shares. During periods of reimbursement by Fidelity, a fund's total return will be greater than it would be had the reimbursement not occurred. Performance numbers are net of all underlying fund operating expenses, but do not include any insurance charges imposed by your insurance company's separate account. If performance information included the effect of these additional charges, the total returns would have been lower. How a fund did yesterday is no guarantee of how it will do tomorrow.
Average annual total returns take VIP FundsManager 20% Portfolio's cumulative total return and show you what would have happened if VIP FundsManager 20% Portfolio shares had performed at a constant rate each year. These numbers will be reported once the fund is a year old.
$10,000 Over Life of Fund
Let's say hypothetically that $10,000 was invested in VIP FundsManager 20% Portfolio - Investor Class on April 13, 2006, when the fund started. The chart shows how the value of your investment would have changed, and also shows how the Lehman Brothers® Aggregate Bond Index performed over the same period.

Annual Report
VIP FundsManager 50% Portfolio
Performance: The Bottom Line
Average annual total return reflects the change in the value of an investment, assuming reinvestment of the class' dividend income and capital gains (the profits earned upon the sale of securities that have grown in value) and assuming a constant rate of performance each year. The $10,000 table does not reflect the deduction of taxes that a shareholder would pay on fund distributions or the redemption of fund shares. During periods of reimbursement by Fidelity, a fund's total return will be greater than it would be had the reimbursement not occurred. Performance numbers are net of all underlying fund operating expenses, but do not include any insurance charges imposed by your insurance company's separate account. If performance information included the effect of these additional charges, the total returns would have been lower. How a fund did yesterday is no guarantee of how it will do tomorrow.
Average annual total returns take VIP FundsManager 50% Portfolio's cumulative total return and show you what would have happened if VIP FundsManager 50% Portfolio shares had performed at a constant rate each year. These numbers will be reported once the fund is a year old.
$10,000 Over Life of Fund
Let's say hypothetically that $10,000 was invested in VIP FundsManager 50% Portfolio - Investor Class on April 13, 2006, when the fund started. The chart shows how the value of your investment would have changed, and also shows how the Standard & Poor's 500SM Index (S&P 500®) performed over the same period.
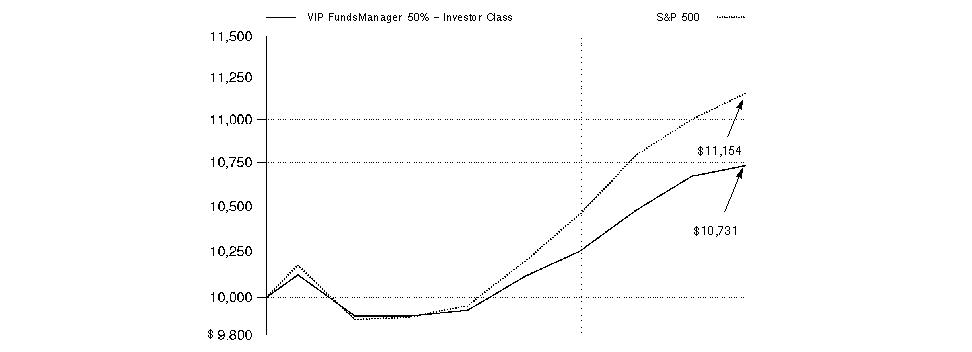
VIP FundsManager Portfolio
VIP FundsManager 70% Portfolio
Performance: The Bottom Line
Average annual total return reflects the change in the value of an investment, assuming reinvestment of the class' dividend income and capital gains (the profits earned upon the sale of securities that have grown in value) and assuming a constant rate of performance each year. The $10,000 table does not reflect the deduction of taxes that a shareholder would pay on fund distributions or the redemption of fund shares. During periods of reimbursement by Fidelity, a fund's total return will be greater than it would be had the reimbursement not occurred. Performance numbers are net of all underlying fund operating expenses, but do not include any insurance charges imposed by your insurance company's separate account. If performance information included the effect of these additional charges, the total returns would have been lower. How a fund did yesterday is no guarantee of how it will do tomorrow.
Average annual total returns take VIP FundsManager 70% Portfolio's cumulative total return and show you what would have happened if VIP FundsManager 70% Portfolio shares had performed at a constant rate each year. These numbers will be reported once the fund is a year old.
$10,000 Over Life of Fund
Let's say hypothetically that $10,000 was invested in VIP FundsManager 70% Portfolio - Investor Class on April 13, 2006, when the fund started. The chart shows how the value of your investment would have changed, and also shows how the S&P 500 Index performed over the same period.
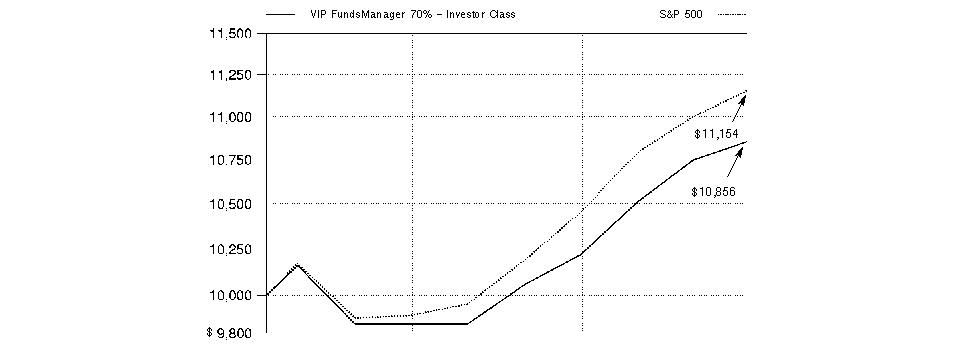
Annual Report
VIP FundsManager 85% Portfolio
Performance: The Bottom Line
Average annual total return reflects the change in the value of an investment, assuming reinvestment of the class' dividend income and capital gains (the profits earned upon the sale of securities that have grown in value) and assuming a constant rate of performance each year. The $10,000 table does not reflect the deduction of taxes that a shareholder would pay on fund distributions or the redemption of fund shares. During periods of reimbursement by Fidelity, a fund's total return will be greater than it would be had the reimbursement not occurred. Performance numbers are net of all underlying fund operating expenses, but do not include any insurance charges imposed by your insurance company's separate account. If performance information included the effect of these additional charges, the total returns would have been lower. How a fund did yesterday is no guarantee of how it will do tomorrow.
Average annual total returns take VIP FundsManager 85% Portfolio's cumulative total return and show you what would have happened if VIP FundsManager 85% Portfolio shares had performed at a constant rate each year. These numbers will be reported once the fund is a year old.
$10,000 Over Life of Fund
Let's say hypothetically that $10,000 was invested in VIP FundsManager 85% Portfolio - Investor Class on April 13, 2006, when the fund started. The chart shows how the value of your investment would have changed, and also shows how the S&P 500 Index performed over the same period.

VIP FundsManager Portfolio
Management's Discussion of Fund Performance
Comments from Scott Kuldell, Portfolio Manager of VIP FundsManager Portfolios
It was a positive year for stocks around the globe and for investment-grade and high-yield bonds in the United States. International equity markets as a whole outpaced their U.S. counterparts for the 12 months ending December 31, 2006 - partly as a result of favorable currency exchanges that boosted returns for U.S. investors in foreign stocks. The Morgan Stanley Capital InternationalSM Europe, Australasia, Far East (MSCI® EAFE®) Index - a gauge of developed stock markets outside the United States and Canada - gained 26.53% during that time. This marked the fifth year in a row that the MSCI EAFE outperformed the Standard & Poor's 500SM Index, a popular barometer of the U.S. equity market, which returned 15.79% in 2006. In the domestic debt markets, high yield outperformed high quality. Junk bonds' lower sensitivity to interest rate movements and investors' thirst for higher yields drove the Merrill Lynch® U.S. High Yield Master II Constrained Index up 10.76%. Investment-grade bonds rallied in the second half of the year but performed less than half as well as their riskier counterparts, finishing with a 4.33% return as measured by the Lehman Brothers® Aggregate Bond Index.
For the period from their inception on April 13, 2006, through December 31, 2006, the VIP FundsManager Portfolios modestly underperformed their composite benchmarks. Generally, across the four portfolios, greater equity exposure resulted in higher absolute returns but also greater underperformance relative to the benchmarks. A global market downturn during the May-July period created a significant head wind for active managers to overcome in subsequent months. As a result, most of the actively managed equity funds within our selection universe underperformed their respective benchmarks during the period. Allocations to domestic and international equities remained relatively static over the period. Fund selection, while active, detracted from performance, but exposure to the investment-grade and high-yield fixed-income markets helped to partially offset the negative impact of our fund selection. The benefit of this fixed-income exposure was most noticeable in the 20% portfolio, which trailed its composite benchmark by the smallest margin of the four portfolios. As active managers struggled against their performance benchmarks, I employed the defensive strategy of increasing the portfolios' holdings of index funds, seeking to track the indexes as closely as possible.
The views expressed above reflect those of the portfolio manager(s) only through the end of the period as stated on the cover of this report and do not necessarily represent the views of Fidelity or any other person in the Fidelity organization. Any such views are subject to change at any time based upon market or other conditions and Fidelity disclaims any responsibility to update such views. These views may not be relied on as investment advice and, because investment decisions for a Fidelity fund are based on numerous factors, may not be relied on as an indication of trading intent on behalf of any Fidelity fund.
Annual Report
Shareholder Expense Example
As a shareholder of a Fund, you incur two types of costs: (1) transaction costs, and (2) ongoing costs, including distribution and/or service (12b-1) fees and other Fund expenses. This Example is intended to help you understand your ongoing costs (in dollars) of investing in the Funds and to compare these costs with the ongoing costs of investing in other mutual funds.
The Example is based on an investment of $1,000 invested at the beginning of the period and held for the entire period (July 1, 2006 to December 31, 2006).
Actual Expenses
The first line of the accompanying table for each class of each fund provides information about actual account values and actual expenses. You may use the information in this line, together with the amount you invested, to estimate the expenses that you paid over the period. Simply divide your account value by $1,000.00 (for example, an $8,600 account value divided by $1,000.00 = 8.6), then multiply the result by the number in the first line for a class of the fund under the heading entitled "Expenses Paid During Period" to estimate the expenses you paid on your account during this period. The estimate of expenses does not include any fees or other expenses of any variable annuity or variable life insurance product. If they were, the estimate of expenses you paid during the period would be higher, and your ending account value would be lower. In addition, each Fund, as a shareholder in underlying Fidelity Funds, will indirectly bear its pro rata share of the fees and expenses incurred by the underlying Fidelity Funds. These fees and expenses are not included in each Fund's annualized expense ratio used to calculate the expense estimates in the table below.
Hypothetical Example for Comparison Purposes
The second line of the accompanying table for each class of each fund provides information about hypothetical account values and hypothetical expenses based on a Class' actual expense ratio and an assumed rate of return of 5% per year before expenses, which is not the Class' actual return. The hypothetical account values and expenses may not be used to estimate the actual ending account balance or expenses you paid for the period. You may use this information to compare the ongoing costs of investing in the Fund and other funds. To do so, compare this 5% hypothetical example with the 5% hypothetical examples that appear in the shareholder reports of the other funds. The estimate of expenses does not include any fees or other expenses of any variable annuity or variable life insurance product. If they were, the estimate of expenses you paid during the period would be higher, and your ending account value would be lower. In addition, each Fund, as a shareholder in underlying Fidelity Funds, will indirectly bear its pro rata share of the fees and expenses incurred by the underlying Fidelity Funds. These fees and expenses are not included in each Fund's annualized expense ratio used to calculate the expense estimates in the table below.
Please note that the expenses shown in the table are meant to highlight your ongoing costs only and do not reflect any transaction costs. Therefore, the second line of the table is useful in comparing ongoing costs only, and will not help you determine the relative total costs of owning different funds.
| Beginning
Account Value
July 1, 2006 | Ending
Account Value
December 31, 2006 | Expenses Paid
During Period*
July 1, 2006 to December 31, 2006 |
VIP FundsManager 20% Portfolio | | | |
Service Class | | | |
Actual | $ 1,000.00 | $ 1,054.40 | $ 1.04 |
HypotheticalA | $ 1,000.00 | $ 1,024.20 | $ 1.02 |
Service Class 2 | | | |
Actual | $ 1,000.00 | $ 1,054.40 | $ 1.81 |
HypotheticalA | $ 1,000.00 | $ 1,023.44 | $ 1.79 |
Investor Class | | | |
Actual | $ 1,000.00 | $ 1,055.50 | $ 1.04 |
HypotheticalA | $ 1,000.00 | $ 1,024.20 | $ 1.02 |
| | | |
VIP FundsManager 50% Portfolio | | | |
Service Class | | | |
Actual | $ 1,000.00 | $ 1,083.90 | $ 1.05 |
HypotheticalA | $ 1,000.00 | $ 1,024.20 | $ 1.02 |
Service Class 2 | | | |
Actual | $ 1,000.00 | $ 1,080.70 | $ 1.84 |
HypotheticalA | $ 1,000.00 | $ 1,023.44 | $ 1.79 |
Investor Class | | | |
Actual | $ 1,000.00 | $ 1,083.90 | $ 1.05 |
HypotheticalA | $ 1,000.00 | $ 1,024.20 | $ 1.02 |
| Beginning
Account Value
July 1, 2006 | Ending
Account Value
December 31, 2006 | Expenses Paid
During Period*
July 1, 2006 to December 31, 2006 |
VIP FundsManager 70% Portfolio | | | |
Service Class | | | |
Actual | $ 1,000.00 | $ 1,102.10 | $ 1.06 |
HypotheticalA | $ 1,000.00 | $ 1,024.20 | $ 1.02 |
Service Class 2 | | | |
Actual | $ 1,000.00 | $ 1,102.10 | $ 1.85 |
HypotheticalA | $ 1,000.00 | $ 1,023.44 | $ 1.79 |
Investor Class | | | |
Actual | $ 1,000.00 | $ 1,102.10 | $ 1.06 |
HypotheticalA | $ 1,000.00 | $ 1,024.20 | $ 1.02 |
| | | |
VIP FundsManager 85% Portfolio | | | |
Service Class | | | |
Actual | $ 1,000.00 | $ 1,112.10 | $ 1.06 |
HypotheticalA | $ 1,000.00 | $ 1,024.20 | $ 1.02 |
Service Class 2 | | | |
Actual | $ 1,000.00 | $ 1,111.00 | $ 1.86 |
HypotheticalA | $ 1,000.00 | $ 1,023.44 | $ 1.79 |
Investor Class | | | |
Actual | $ 1,000.00 | $ 1,112.10 | $ 1.06 |
HypotheticalA | $ 1,000.00 | $ 1,024.20 | $ 1.02 |
A 5% return per year before expenses
* Expenses are equal to each Class' annualized expense ratio (shown in the table below); multiplied by the average account value over the period, multiplied by 184/ 365 (to reflect the one-half year period). The fees and expenses of the underlying Fidelity Funds in which each Fund invests are not included in each class' annualized expense ratio.
| Annualized
Expense Ratio |
VIP FundsManager 20% Portfolio | |
Service Class | .20% |
Service Class 2 | .35% |
Investor Class | .20% |
| |
VIP FundsManager 50% Portfolio | |
Service Class | .20% |
Service Class 2 | .35% |
Investor Class | .20% |
| |
VIP FundsManager 70% Portfolio | |
Service Class | .20% |
Service Class 2 | .35% |
Investor Class | .20% |
| |
VIP FundsManager 85% Portfolio | |
Service Class | .20% |
Service Class 2 | .35% |
Investor Class | .20% |
Annual Report
VIP FundsManager 20% Portfolio
Investment Summary
Fund Holdings as of December 31, 2006 |
| % of fund's
investments |
Domestic Equity Funds | |
Fidelity Aggressive Growth Fund | 1.7 |
Fidelity Contrafund | 0.1 |
Fidelity Dividend Growth Fund | 1.1 |
Fidelity Equity-Income Fund | 2.1 |
Fidelity Growth Company Fund | 0.1 |
Fidelity Large Cap Stock Fund | 1.9 |
Fidelity Mid-Cap Stock Fund | 1.0 |
Fidelity Real Estate Investment Portfolio | 0.7 |
Fidelity Small Cap Stock Fund | 2.2 |
Fidelity Small Cap Value Fund | 0.1 |
Spartan Extended Market Index Fund Investor Class | 2.1 |
Spartan Total Market Index Fund Investor Class | 3.9 |
VIP Growth Opportunities Portfolio Investor Class | 1.5 |
| 18.5 |
International Equity Funds | |
Fidelity International Discovery Fund | 0.0 |
Fidelity International Real Estate Fund | 0.3 |
Fidelity International Small Capital Opportunities Fund | 0.2 |
Fidelity Overseas Fund | 0.1 |
Spartan International Index Fund Investor Class | 1.7 |
| 2.3 |
Fixed-Income Funds | |
Fidelity Capital & Income Fund | 5.7 |
Fidelity Floating Rate High Income Fund Retail Class | 5.1 |
Fidelity High Income Fund | 1.3 |
Fidelity New Markets Income Fund | 3.0 |
Fidelity U.S. Bond Index Fund | 35.6 |
| 50.7 |
Money Market Funds | |
Fidelity Institutional Prime Money Market Portfolio Class I | 28.5 |
| 100.0 |
Asset Allocation (% of fund's investments) |
As of December 31, 2006 |
| Domestic Equity Funds | 18.5% | |
| International Equity Funds | 2.3% | |
| Fixed Income Funds | 50.7% | |
| Money Market Funds | 28.5% | |

As of June 30, 2006 |
| Domestic Equity Funds | 20.4% | |
| International Equity Funds | 2.3% | |
| Fixed Income Funds | 49.4% | |
| Money Market Funds | 27.9% | |

VIP FundsManager Portfolio
VIP FundsManager 20% Portfolio
Investments December 31, 2006
Showing Percentage of Total Value of Investment in Securities
Equity Funds - 20.8% |
| Shares | | Value (Note 1) |
Domestic Equity Funds - 18.5% |
Fidelity Aggressive Growth Fund (a) | 21,539 | | $ 417,645 |
Fidelity Contrafund | 370 | | 24,096 |
Fidelity Dividend Growth Fund | 8,768 | | 277,761 |
Fidelity Equity-Income Fund | 8,713 | | 510,148 |
Fidelity Growth Company Fund (a) | 348 | | 24,256 |
Fidelity Large Cap Stock Fund | 25,794 | | 451,914 |
Fidelity Mid-Cap Stock Fund | 8,507 | | 247,880 |
Fidelity Real Estate Investment Portfolio | 4,955 | | 180,210 |
Fidelity Small Cap Stock Fund | 27,856 | | 529,548 |
Fidelity Small Cap Value Fund | 863 | | 12,081 |
Spartan Extended Market Index Fund Investor Class | 13,532 | | 521,389 |
Spartan Total Market Index Fund Investor Class | 23,878 | | 945,104 |
VIP Growth Opportunities Portfolio Investor Class | 19,622 | | 355,349 |
TOTAL DOMESTIC EQUITY FUNDS | | 4,497,381 |
International Equity Funds - 2.3% |
Fidelity International Discovery Fund | 65 | | 2,461 |
Fidelity International Real Estate Fund | 3,809 | | 63,114 |
Fidelity International Small Capital Opportunities Fund | 3,483 | | 54,991 |
Fidelity Overseas Fund | 328 | | 14,708 |
Spartan International Index Fund Investor Class | 9,557 | | 421,859 |
TOTAL INTERNATIONAL EQUITY FUNDS | | 557,133 |
TOTAL EQUITY FUNDS (Cost $4,986,003) | 5,054,514 |
Fixed-Income Funds - 50.7% |
| | | |
Fidelity Capital & Income Fund | 156,237 | | 1,388,946 |
Fidelity Floating Rate High Income Fund Retail Class | 123,028 | | 1,224,133 |
Fidelity High Income Fund | 34,882 | | 316,027 |
Fidelity New Markets Income Fund | 49,251 | | 728,914 |
Fidelity U.S. Bond Index Fund | 795,156 | | 8,635,391 |
TOTAL FIXED-INCOME FUNDS (Cost $12,194,862) | 12,293,411 |
Money Market Funds - 28.5% |
| | | |
Fidelity Institutional Prime Money Market Portfolio Class I
(Cost $6,910,831) | 6,910,831 | | 6,910,831 |
TOTAL INVESTMENT IN SECURITIES - 100% (Cost $24,091,696) | $ 24,258,756 |
Legend |
(a) Non-income producing |
See accompanying notes which are an integral part of the financial statements.
Annual Report
VIP FundsManager 20% Portfolio
Financial Statements
Statement of Assets and Liabilities
| December 31, 2006 |
Assets | | |
Investment in securities, at value (cost $24,091,696) - See accompanying schedule | | $ 24,258,756 |
Cash | | 39 |
Receivable for investments sold | | 600 |
Total assets | | 24,259,395 |
| | |
Liabilities | | |
Payable for investments purchased | $ 38 | |
Accrued management fee | 3,887 | |
Distribution fees payable | 13 | |
Total liabilities | | 3,938 |
| | |
Net Assets | | $ 24,255,457 |
Net Assets consist of: | | |
Paid in capital | | $ 23,949,724 |
Accumulated undistributed net realized gain (loss) on investments | | 138,673 |
Net unrealized appreciation (depreciation) on investments | | 167,060 |
Net Assets | | $ 24,255,457 |
| | |
Service Class:
Net Asset Value, offering price and redemption price per share ($105,354 ÷ 10,188 shares) | | $ 10.34 |
| | |
Service Class 2:
Net Asset Value, offering price and redemption price per share ($105,241 ÷ 10,178 shares) | | $ 10.34 |
| | |
Investor Class:
Net Asset Value, offering price and redemption price per share ($24,044,862 ÷ 2,325,654 shares) | | $ 10.34 |
Statement of Operations
| | For the period
April 13, 2006
(commencement
of operations) to
December 31, 2006 |
Investment Income | | |
Income distributions from underlying funds | | $ 342,088 |
Interest | | 199 |
Total income | | 342,287 |
| | |
Expenses | | |
Management fee | $ 18,086 | |
Distribution fees | 255 | |
Independent trustees' compensation | 19 | |
Total expenses before reductions | 18,360 | |
Expense reductions | (3,769) | 14,591 |
Net investment income (loss) | | 327,696 |
Realized and Unrealized Gain (Loss)
Realized gain (loss) on sale of underlying fund shares | 113,168 | |
Capital gain distributions from underlying funds | 142,334 | 255,502 |
Change in net unrealized appreciation (depreciation) on underlying funds | | 167,060 |
Net gain (loss) | | 422,562 |
Net increase (decrease) in net assets resulting from operations | | $ 750,258 |
See accompanying notes which are an integral part of the financial statements.
VIP FundsManager Portfolio
Statement of Changes in Net Assets
| For the period
April 13, 2006
(commencement
of operations) to
December 31, 2006 |
Increase (Decrease) in Net Assets | |
Operations | |
Net investment income (loss) | $ 327,696 |
Net realized gain (loss) | 255,502 |
Change in net unrealized appreciation (depreciation) | 167,060 |
Net increase (decrease) in net assets resulting from operations | 750,258 |
Distributions to shareholders from net investment income | (329,928) |
Distributions to shareholders from net realized gain | (114,596) |
Total distributions | (444,524) |
Share transactions - net increase (decrease) | 23,949,723 |
Total increase (decrease) in net assets | 24,255,457 |
| |
Net Assets | |
Beginning of period | - |
End of period | $ 24,255,457 |
Financial Highlights - Service Class
Period ended December 31, | 2006 G |
Selected Per-Share Data | |
Net asset value, beginning of period | $ 10.00 |
Income from Investment Operations | |
Net investment income (loss) E | .33 |
Net realized and unrealized gain (loss) | .20 |
Total from investment operations | .53 |
Distributions from net investment income | (.14) |
Distributions from net realized gain | (.05) |
Total distributions | (.19) |
Net asset value, end of period | $ 10.34 |
Total Return B, C, D | 5.34% |
Ratios to Average Net Assets F, H | |
Expenses before reductions | .35% A |
Expenses net of fee waivers, if any | .20% A |
Expenses net of all reductions | .20% A |
Net investment income (loss) | 4.52% A |
Supplemental Data | |
Net assets, end of period (000 omitted) | $ 105 |
Portfolio turnover rate | 92%A |
A Annualized
B Total returns for periods of less than one year are not annualized.
C Total returns do not reflect charges attributable to your insurance company's separate account. Inclusion of these charges would reduce the total returns shown.
D Total returns would have been lower had certain expenses not been reduced during the periods shown.
E Calculated based on average shares outstanding during the period.
F Amounts do not include the activity of the underlying funds.
G For the period April 13, 2006 (commencement of operations) to December 31, 2006.
H Expense ratios reflect operating expenses of the class. Expenses before reductions do not reflect amounts reimbursed by the investment adviser or expense offset arrangements and do not represent the amount paid by the class during periods when reimbursements or reductions occur. Expense ratios before reductions for start-up periods may not be representative of longer-term operating periods. Expenses net of fee waivers reflect expenses after reimbursement by the investment adviser but prior to reductions from expense offset arrangements. Expenses net of all reductions represent the net expenses paid by the class but do not include expenses of the investment companies in which the Fund invests.
See accompanying notes which are an integral part of the financial statements.
Annual Report
Financial Highlights - Service Class 2
Period ended December 31, | 2006 G |
Selected Per-Share Data | |
Net asset value, beginning of period | $ 10.00 |
Income from Investment Operations | |
Net investment income (loss) E | .32 |
Net realized and unrealized gain (loss) | .20 |
Total from investment operations | .52 |
Distributions from net investment income | (.13) |
Distributions from net realized gain | (.05) |
Total distributions | (.18) |
Net asset value, end of period | $ 10.34 |
Total Return B, C, D | 5.23% |
Ratios to Average Net Assets F, H | |
Expenses before reductions | .50% A |
Expenses net of fee waivers, if any | .35% A |
Expenses net of all reductions | .35% A |
Net investment income (loss) | 4.38% A |
Supplemental Data | |
Net assets, end of period (000 omitted) | $ 105 |
Portfolio turnover rate | 92% A |
A Annualized
B Total returns for periods of less than one year are not annualized.
C Total returns do not reflect charges attributable to your insurance company's separate account. Inclusion of these charges would reduce the total returns shown.
D Total returns would have been lower had certain expenses not been reduced during the periods shown.
E Calculated based on average shares outstanding during the period.
F Amounts do not include the activity of the underlying funds.
G For the period April 13, 2006 (commencement of operations) to December 31, 2006.
H Expense ratios reflect operating expenses of the class. Expenses before reductions do not reflect amounts reimbursed by the investment adviser or expense offset arrangements and do not represent the amount paid by the class during periods when reimbursements or reductions occur. Expense ratios before reductions for start-up periods may not be representative of longer-term operating periods. Expenses net of fee waivers reflect expenses after reimbursement by the investment adviser but prior to reductions from expense offset arrangements. Expenses net of all reductions represent the net expenses paid by the class but do not include expenses of the investment companies in which the Fund invests.
Financial Highlights - Investor Class
Period ended December 31, | 2006 G |
Selected Per-Share Data | |
Net asset value, beginning of period | $ 10.00 |
Income from Investment Operations | |
Net investment income (loss)E | .33 |
Net realized and unrealized gain (loss) | .20 |
Total from investment operations | .53 |
Distributions from net investment income | (.14) |
Distributions from net realized gain | (.05) |
Total distributions | (.19) |
Net asset value, end of period | $ 10.34 |
Total Return B, C, D | 5.34% |
Ratios to Average Net Assets F, H | |
Expenses before reductions | .25% A |
Expenses net of fee waivers, if any | .20% A |
Expenses net of all reductions | .20% A |
Net investment income (loss) | 4.52% A |
Supplemental Data | |
Net assets, end of period (000 omitted) | $ 24,045 |
Portfolio turnover rate | 92% A |
A Annualized
B Total returns for periods of less than one year are not annualized.
C Total returns do not reflect charges attributable to your insurance company's separate account. Inclusion of these charges would reduce the total returns shown.
D Total returns would have been lower had certain expenses not been reduced during the periods shown.
E Calculated based on average shares outstanding during the period.
F Amounts do not include the activity of the underlying funds.
G For the period April 13, 2006 (commencement of operations) to December 31, 2006.
H Expense ratios reflect operating expenses of the class. Expenses before reductions do not reflect amounts reimbursed by the investment adviser or expense offset arrangements and do not represent the amount paid by the class during periods when reimbursements or reductions occur. Expense ratios before reductions for start-up periods may not be representative of longer-term operating periods. Expenses net of fee waivers reflect expenses after reimbursement by the investment adviser but prior to reductions from expense offset arrangements. Expenses net of all reductions represent the net expenses paid by the class but do not include expenses of the investment companies in which the Fund invests.
See accompanying notes which are an integral part of the financial statements.
VIP FundsManager Portfolio
VIP FundsManager 50% Portfolio
Investment Summary
Fund Holdings as of December 31, 2006 |
| % of fund's
investments |
Domestic Equity Funds | |
Fidelity Aggressive Growth Fund | 3.8 |
Fidelity Contrafund | 1.2 |
Fidelity Dividend Growth Fund | 7.0 |
Fidelity Equity-Income Fund | 7.1 |
Fidelity Growth Company Fund | 1.6 |
Fidelity Large Cap Stock Fund | 3.0 |
Fidelity Mid-Cap Stock Fund | 0.9 |
Fidelity Nasdaq Composite Index Fund | 1.8 |
Fidelity Real Estate Investment Portfolio | 1.2 |
Fidelity Small Cap Independence Fund | 0.5 |
Fidelity Small Cap Stock Fund | 1.0 |
Fidelity Value Discovery Fund | 2.8 |
Fidelity Value Strategies Fund | 3.8 |
Spartan Extended Market Index Fund Investor Class | 0.8 |
Spartan Total Market Index Fund Investor Class | 6.7 |
Spartan U.S. Equity Index Fund Investor Class | 1.4 |
VIP Growth Opportunities Portfolio Investor Class | 1.5 |
| 46.1 |
International Equity Funds | |
Fidelity International Discovery Fund | 0.0 |
Fidelity International Real Estate Fund | 0.8 |
Fidelity International Small Capital Opportunities Fund | 1.3 |
Fidelity Overseas Fund | 0.1 |
Spartan International Index Fund Investor Class | 3.7 |
| 5.9 |
Fixed-Income Funds | |
Fidelity Capital & Income Fund | 4.8 |
Fidelity Floating Rate High Income Fund Retail Class | 2.0 |
Fidelity High Income Fund | 2.2 |
Fidelity New Markets Income Fund | 2.0 |
Fidelity U.S. Bond Index Fund | 28.3 |
| 39.3 |
Money Market Funds | |
Fidelity Institutional Prime Money Market Portfolio Class I | 8.7 |
| 100.0 |
Asset Allocation (% of fund's investments) |
As of December 31, 2006 |
| Domestic Equity Funds | 46.1% | |
| International Equity Funds | 5.9% | |
| Fixed Income Funds | 39.3% | |
| Money Market Funds | 8.7% | |

As of June 30, 2006 |
| Domestic Equity Funds | 46.2% | |
| International Equity Funds | 5.8% | |
| Fixed Income Funds | 38.8% | |
| Money Market Funds | 9.2% | |

Annual Report
VIP FundsManager 50% Portfolio
Investments December 31, 2006
Showing Percentage of Total Value of Investment in Securities
Equity Funds - 52.0% |
| Shares | | Value (Note 1) |
Domestic Equity Funds - 46.1% |
Fidelity Aggressive Growth Fund (a) | 281,988 | | $ 5,467,752 |
Fidelity Contrafund | 27,205 | | 1,773,745 |
Fidelity Dividend Growth Fund | 319,590 | | 10,124,605 |
Fidelity Equity-Income Fund | 173,240 | | 10,143,195 |
Fidelity Growth Company Fund (a) | 33,667 | | 2,346,955 |
Fidelity Large Cap Stock Fund | 242,846 | | 4,254,658 |
Fidelity Mid-Cap Stock Fund | 45,106 | | 1,314,385 |
Fidelity Nasdaq Composite Index Fund | 79,663 | | 2,585,080 |
Fidelity Real Estate Investment Portfolio | 49,033 | | 1,783,341 |
Fidelity Small Cap Independence Fund | 34,202 | | 719,944 |
Fidelity Small Cap Stock Fund | 77,782 | | 1,478,640 |
Fidelity Value Discovery Fund | 230,870 | | 4,035,614 |
Fidelity Value Strategies Fund | 169,796 | | 5,472,514 |
Spartan Extended Market Index Fund Investor Class | 28,638 | | 1,103,429 |
Spartan Total Market Index Fund Investor Class | 243,054 | | 9,620,076 |
Spartan U.S. Equity Index Fund Investor Class | 40,589 | | 2,036,736 |
VIP Growth Opportunities Portfolio Investor Class | 116,471 | | 2,109,288 |
TOTAL DOMESTIC EQUITY FUNDS | | 66,369,957 |
International Equity Funds - 5.9% |
Fidelity International Discovery Fund | 771 | | 29,219 |
Fidelity International Real Estate Fund | 67,841 | | 1,124,125 |
Fidelity International Small Capital Opportunities Fund | 118,414 | | 1,869,749 |
Fidelity Overseas Fund | 3,248 | | 145,529 |
Spartan International Index Fund Investor Class | 119,412 | | 5,270,832 |
TOTAL INTERNATIONAL EQUITY FUNDS | | 8,439,454 |
TOTAL EQUITY FUNDS (Cost $73,066,246) | 74,809,411 |
Fixed-Income Funds - 39.3% |
| | | |
Fidelity Capital & Income Fund | 774,616 | | 6,886,338 |
Fidelity Floating Rate High Income Fund Retail Class | 290,877 | | 2,894,224 |
Fidelity High Income Fund | 357,419 | | 3,238,215 |
Fidelity New Markets Income Fund | 194,905 | | 2,884,599 |
Fidelity U.S. Bond Index Fund | 3,747,866 | | 40,701,831 |
TOTAL FIXED-INCOME FUNDS (Cost $56,035,411) | 56,605,207 |
Money Market Funds - 8.7% |
| Shares | | Value (Note 1) |
Fidelity Institutional Prime Money Market Portfolio Class I
(Cost $12,567,153) | 12,567,153 | | $ 12,567,153 |
TOTAL INVESTMENT IN SECURITIES - 100% (Cost $141,668,810) | $ 143,981,771 |
Legend |
(a) Non-income producing |
See accompanying notes which are an integral part of the financial statements.
VIP FundsManager Portfolio
VIP FundsManager 50% Portfolio
Financial Statements
Statement of Assets and Liabilities
| December 31, 2006 |
Assets | | |
Investment in securities, at value (cost $141,668,810) - See accompanying schedule | | $ 143,981,771 |
Receivable for investments sold | | 243 |
Total assets | | 143,982,014 |
| | |
Liabilities | | |
Payable for investments purchased | $ 126 | |
Accrued management fee | 23,301 | |
Distribution fees payable | 13 | |
Total liabilities | | 23,440 |
| | |
Net Assets | | $ 143,958,574 |
Net Assets consist of: | | |
Paid in capital | | $ 139,314,448 |
Accumulated undistributed net realized gain (loss) on investments | | 2,331,165 |
Net unrealized appreciation (depreciation) on investments | | 2,312,961 |
Net Assets | | $ 143,958,574 |
| | |
Service Class:
Net Asset Value, offering price and redemption price per share ($107,270 ÷ 10,201 shares) | | $ 10.52 |
| | |
Service Class 2:
Net Asset Value, offering price and redemption price per share ($107,155 ÷ 10,191 shares) | | $ 10.51 |
| | |
Investor Class:
Net Asset Value, offering price and redemption price per share ($143,744,149 ÷ 13,669,907 shares) | | $ 10.52 |
Statement of Operations
| | For the period
April 13, 2006
(commencement
of operations) to
December 31, 2006 |
Investment Income | | |
Income distributions from underlying funds | | $ 1,701,266 |
Interest | | 727 |
Total income | | 1,701,993 |
| | |
Expenses | | |
Management fee | $ 115,162 | |
Distribution fees | 255 | |
Independent trustees' compensation | 123 | |
Total expenses before reductions | 115,540 | |
Expense reductions | (23,255) | 92,285 |
Net investment income (loss) | | 1,609,708 |
Realized and Unrealized Gain (Loss) Realized gain (loss) on sale of underlying fund shares | 1,160,326 | |
Capital gain distributions from underlying funds | 2,399,457 | 3,559,783 |
Change in net unrealized appreciation (depreciation) on underlying funds | | 2,312,961 |
Net gain (loss) | | 5,872,744 |
Net increase (decrease) in net assets resulting from operations | | $ 7,482,452 |
See accompanying notes which are an integral part of the financial statements.
Annual Report
VIP FundsManager 50% Portfolio
Financial Statements - continued
Statement of Changes in Net Assets
| For the period
April 13, 2006
(commencement
of operations) to
December 31, 2006 |
Increase (Decrease) in Net Assets | |
Operations | |
Net investment income (loss) | $ 1,609,708 |
Net realized gain (loss) | 3,559,783 |
Change in net unrealized appreciation (depreciation) | 2,312,961 |
Net increase (decrease) in net assets resulting from operations | 7,482,452 |
Distributions to shareholders from net investment income | (1,627,619) |
Distributions to shareholders from net realized gain | (1,210,707) |
Total distributions | (2,838,326) |
Share transactions - net increase (decrease) | 139,314,448 |
Total increase (decrease) in net assets | 143,958,574 |
| |
Net Assets | |
Beginning of period | - |
End of period | $ 143,958,574 |
Financial Highlights - Service Class
Period ended December 31, | 2006 G |
Selected Per-Share Data | |
Net asset value, beginning of period | $ 10.00 |
Income from Investment Operations | |
Net investment income (loss) E | .26 |
Net realized and unrealized gain (loss) | .47 |
Total from investment operations | .73 |
Distributions from net investment income | (.12) |
Distributions from net realized gain | (.09) |
Total distributions | (.21) |
Net asset value, end of period | $ 10.52 |
Total Return B, C, D | 7.31% |
Ratios to Average Net Assets F, H | |
Expenses before reductions | .35% A |
Expenses net of fee waivers, if any | .20%A |
Expenses net of all reductions | .20%A |
Net investment income (loss) | 3.48%A |
Supplemental Data | |
Net assets, end of period (000 omitted) | $ 107 |
Portfolio turnover rate | 103%A |
A Annualized
B Total returns for periods of less than one year are not annualized.
C Total returns do not reflect charges attributable to your insurance company's separate account. Inclusion of these charges would reduce the total returns shown.
D Total returns would have been lower had certain expenses not been reduced during the periods shown.
E Calculated based on average shares outstanding during the period.
F Amounts do not include the activity of the underlying funds.
G For the period April 13, 2006 (commencement of operations) to December 31, 2006.
H Expense ratios reflect operating expenses of the class. Expenses before reductions do not reflect amounts reimbursed by the investment adviser or expense offset arrangements and do not represent the amount paid by the class during periods when reimbursements or reductions occur. Expense ratios before reductions for start-up periods may not be representative of longer-term operating periods. Expenses net of fee waivers reflect expenses after reimbursement by the investment adviser but prior to reductions from expense offset arrangements. Expenses net of all reductions represent the net expenses paid by the class but do not include expenses of the investment companies in which the Fund invests.
See accompanying notes which are an integral part of the financial statements.
VIP FundsManager Portfolio
Financial Highlights - Service Class 2
Period ended December 31, | 2006 G |
Selected Per-Share Data | |
Net asset value, beginning of period | $ 10.00 |
Income from Investment Operations | |
Net investment income (loss) E | .24 |
Net realized and unrealized gain (loss) | .47 |
Total from investment operations | .71 |
Distributions from net investment income | (.11) |
Distributions from net realized gain | (.09) |
Total distributions | (.20) |
Net asset value, end of period | $ 10.51 |
Total Return B, C, D | 7.09% |
Ratios to Average Net Assets F, H | |
Expenses before reductions | .50% A |
Expenses net of fee waivers, if any | .35% A |
Expenses net of all reductions | .35% A |
Net investment income (loss) | 3.34% A |
Supplemental Data | |
Net assets, end of period (000 omitted) | $ 107 |
Portfolio turnover rate | 103% A |
A Annualized
B Total returns for periods of less than one year are not annualized.
C Total returns do not reflect charges attributable to your insurance company's separate account. Inclusion of these charges would reduce the total returns shown.
D Total returns would have been lower had certain expenses not been reduced during the periods shown.
E Calculated based on average shares outstanding during the period.
F Amounts do not include the activity of the underlying funds.
G For the period April 13, 2006 (commencement of operations) to December 31, 2006.
H Expense ratios reflect operating expenses of the class. Expenses before reductions do not reflect amounts reimbursed by the investment adviser or expense offset arrangements and do not represent the amount paid by the class during periods when reimbursements or reductions occur. Expense ratios before reductions for start-up periods may not be representative of longer-term operating periods. Expenses net of fee waivers reflect expenses after reimbursement by the investment adviser but prior to reductions from expense offset arrangements. Expenses net of all reductions represent the net expenses paid by the class but do not include expenses of the investment companies in which the Fund invests.
Financial Highlights - Investor Class
Period ended December 31, | 2006 G |
Selected Per-Share Data | |
Net asset value, beginning of period | $ 10.00 |
Income from Investment Operations | |
Net investment income (loss) E | .26 |
Net realized and unrealized gain (loss) | .47 |
Total from investment operations | .73 |
Distributions from net investment income | (.12) |
Distributions from net realized gain | (.09) |
Total distributions | (.21) |
Net asset value, end of period | $ 10.52 |
Total Return B, C, D | 7.31% |
Ratios to Average Net Assets F, H | |
Expenses before reductions | .25% A |
Expenses net of fee waivers, if any | .20% A |
Expenses net of all reductions | .20% A |
Net investment income (loss) | 3.48% A |
Supplemental Data | |
Net assets, end of period (000 omitted) | $ 143,744 |
Portfolio turnover rate | 103% A |
A Annualized
B Total returns for periods of less than one year are not annualized.
C Total returns do not reflect charges attributable to your insurance company's separate account. Inclusion of these charges would reduce the total returns shown.
D Total returns would have been lower had certain expenses not been reduced during the periods shown.
E Calculated based on average shares outstanding during the period.
F Amounts do not include the activity of the underlying funds.
G For the period April 13, 2006 (commencement of operations) to December 31, 2006.
H Expense ratios reflect operating expenses of the class. Expenses before reductions do not reflect amounts reimbursed by the investment adviser or expense offset arrangements and do not represent the amount paid by the class during periods when reimbursements or reductions occur. Expense ratios before reductions for start-up periods may not be representative of longer-term operating periods. Expenses net of fee waivers reflect expenses after reimbursement by the investment adviser but prior to reductions from expense offset arrangements. Expenses net of all reductions represent the net expenses paid by the class but do not include expenses of the investment companies in which the Fund invests.
See accompanying notes which are an integral part of the financial statements.
Annual Report
VIP FundsManager 70% Portfolio
Investment Summary
Fund Holdings as of December 31, 2006 |
| % of fund's
investments |
Domestic Equity Funds | |
Fidelity Aggressive Growth Fund | 4.6 |
Fidelity Capital Appreciation Fund | 1.7 |
Fidelity Contrafund | 0.5 |
Fidelity Dividend Growth Fund | 9.0 |
Fidelity Equity-Income Fund | 9.0 |
Fidelity Growth Company Fund | 4.0 |
Fidelity Large Cap Stock Fund | 3.7 |
Fidelity Mid-Cap Stock Fund | 1.2 |
Fidelity Nasdaq Composite Index Fund | 2.2 |
Fidelity Real Estate Investment Portfolio | 2.0 |
Fidelity Small Cap Independence Fund | 0.5 |
Fidelity Small Cap Stock Fund | 0.6 |
Fidelity Value Discovery Fund | 3.2 |
Fidelity Value Strategies Fund | 6.1 |
Spartan Total Market Index Fund Investor Class | 6.8 |
Spartan U.S. Equity Index Fund Investor Class | 4.8 |
VIP Growth Opportunities Portfolio Investor Class | 1.5 |
| 61.4 |
International Equity Funds | |
Fidelity Emerging Markets Fund | 2.1 |
Fidelity International Discovery Fund | 0.1 |
Fidelity International Real Estate Fund | 1.0 |
Fidelity International Small Capital Opportunities Fund | 3.5 |
Fidelity Overseas Fund | 0.6 |
Spartan International Index Fund Investor Class | 3.9 |
| 11.2 |
Fixed-Income Funds | |
Fidelity Capital & Income Fund | 4.0 |
Fidelity Floating Rate High Income Fund Retail Class | 2.0 |
Fidelity High Income Fund | 2.0 |
Fidelity New Markets Income Fund | 2.0 |
Fidelity U.S. Bond Index Fund | 14.1 |
| 24.1 |
Money Market Funds | |
Fidelity Institutional Prime Money Market Portfolio Class I | 3.3 |
| 100.0 |
Asset Allocation (% of fund's investments) |
As of December 31, 2006 |
| Domestic Equity Funds | 61.4% | |
| International Equity Funds | 11.2% | |
| Fixed Income Funds | 24.1% | |
| Money Market Funds | 3.3% | |

As of June 30, 2006 |
| Domestic Equity Funds | 61.6% | |
| International Equity Funds | 11.0% | |
| Fixed Income Funds | 23.6% | |
| Money Market Funds | 3.8% | |

VIP FundsManager Portfolio
VIP FundsManager 70% Portfolio
Investments December 31, 2006
Showing Percentage of Total Value of Investment in Securities
Equity Funds - 72.6% |
| Shares | | Value (Note 1) |
Domestic Equity Funds - 61.4% |
Fidelity Aggressive Growth Fund (a) | 421,500 | | $ 8,172,892 |
Fidelity Capital Appreciation Fund | 111,610 | | 3,025,743 |
Fidelity Contrafund | 13,009 | | 848,207 |
Fidelity Dividend Growth Fund | 507,556 | | 16,079,361 |
Fidelity Equity-Income Fund | 275,124 | | 16,108,493 |
Fidelity Growth Company Fund (a) | 103,334 | | 7,203,409 |
Fidelity Large Cap Stock Fund | 371,162 | | 6,502,762 |
Fidelity Mid-Cap Stock Fund | 73,283 | | 2,135,473 |
Fidelity Nasdaq Composite Index Fund | 118,527 | | 3,846,201 |
Fidelity Real Estate Investment Portfolio | 96,917 | | 3,524,859 |
Fidelity Small Cap Independence Fund | 42,248 | | 889,323 |
Fidelity Small Cap Stock Fund | 60,633 | | 1,152,627 |
Fidelity Value Discovery Fund | 329,696 | | 5,763,086 |
Fidelity Value Strategies Fund | 335,486 | | 10,812,705 |
Spartan Total Market Index Fund Investor Class | 307,883 | | 12,186,023 |
Spartan U.S. Equity Index Fund Investor Class | 169,612 | | 8,511,118 |
VIP Growth Opportunities Portfolio Investor Class | 143,908 | | 2,606,180 |
TOTAL DOMESTIC EQUITY FUNDS | | 109,368,462 |
International Equity Funds - 11.2% |
Fidelity Emerging Markets Fund | 151,435 | | 3,693,505 |
Fidelity International Discovery Fund | 4,759 | | 180,455 |
Fidelity International Real Estate Fund | 111,702 | | 1,850,904 |
Fidelity International Small Capital Opportunities Fund | 392,309 | | 6,194,562 |
Fidelity Overseas Fund | 25,279 | | 1,132,480 |
Spartan International Index Fund Investor Class | 158,908 | | 7,014,188 |
TOTAL INTERNATIONAL EQUITY FUNDS | | 20,066,094 |
TOTAL EQUITY FUNDS (Cost $125,337,283) | 129,434,556 |
Fixed-Income Funds - 24.1% |
| | | |
Fidelity Capital & Income Fund | 804,368 | | 7,150,835 |
Fidelity Floating Rate High Income Fund Retail Class | 359,298 | | 3,575,012 |
Fidelity High Income Fund | 393,921 | | 3,568,922 |
Fidelity New Markets Income Fund | 240,760 | | 3,563,250 |
Fidelity U.S. Bond Index Fund | 2,305,934 | | 25,042,449 |
TOTAL FIXED-INCOME FUNDS (Cost $42,511,523) | 42,900,468 |
Money Market Funds - 3.3% |
| Shares | | Value (Note 1) |
Fidelity Institutional Prime Money Market Portfolio Class I
(Cost $5,888,273) | 5,888,273 | | $ 5,888,273 |
TOTAL INVESTMENT IN SECURITIES - 100% (Cost $173,737,079) | $ 178,223,297 |
Legend |
(a) Non-income producing |
See accompanying notes which are an integral part of the financial statements.
Annual Report
VIP FundsManager 70% Portfolio
Financial Statements
Statement of Assets and Liabilities
| December 31, 2006 |
Assets | | |
Investment in securities, at value (cost $173,737,079) - See accompanying schedule | | $ 178,223,297 |
Cash | | 63 |
Total assets | | 178,223,360 |
| | |
Liabilities | | |
Payable for investments purchased | $ 95 | |
Accrued management fee | 28,283 | |
Distribution fees payable | 14 | |
Total liabilities | | 28,392 |
| | |
Net Assets | | $ 178,194,968 |
Net Assets consist of: | | |
Paid in capital | | $ 170,819,879 |
Accumulated undistributed net realized gain (loss) on investments | | 2,888,871 |
Net unrealized appreciation (depreciation) on investments | | 4,486,218 |
Net Assets | | $ 178,194,968 |
| | |
Service Class:
Net Asset Value, offering price and redemption price per share ($108,527 ÷ 10,204 shares) | | $ 10.64 |
| | |
Service Class 2:
Net Asset Value, offering price and redemption price per share ($108,410 ÷ 10,193 shares) | | $ 10.64 |
| | |
Investor Class:
Net Asset Value, offering price and redemption price per share ($177,978,031 ÷ 16,733,129 shares) | | $ 10.64 |
Statement of Operations
| | For the period
April 13, 2006
(commencement
of operations) to
December 31, 2006 |
Investment Income | | |
Income distributions from underlying funds | | $ 1,661,854 |
Interest | | 235 |
Total income | | 1,662,089 |
| | |
Expenses | | |
Management fee | $ 135,225 | |
Distribution fees | 255 | |
Independent trustees' compensation | 142 | |
Total expenses before reductions | 135,622 | |
Expense reductions | (27,264) | 108,358 |
Net investment income (loss) | | 1,553,731 |
Realized and Unrealized Gain (Loss) Realized gain (loss) on sale of underlying fund shares | 911,370 | |
Capital gain distributions from underlying funds | 3,951,062 | 4,862,432 |
Change in net unrealized appreciation (depreciation) on underlying funds | | 4,486,218 |
Net gain (loss) | | 9,348,650 |
Net increase (decrease) in net assets resulting from operations | | $ 10,902,381 |
See accompanying notes which are an integral part of the financial statements.
VIP FundsManager Portfolio
Statement of Changes in Net Assets
| For the period
April 13, 2006
(commencement
of operations) to
December 31, 2006 |
Increase (Decrease) in Net Assets | |
Operations | |
Net investment income (loss) | $ 1,553,731 |
Net realized gain (loss) | 4,862,432 |
Change in net unrealized appreciation (depreciation) | 4,486,218 |
Net increase (decrease) in net assets resulting from operations | 10,902,381 |
Distributions to shareholders from net investment income | (1,730,930) |
Distributions to shareholders from net realized gain | (1,796,362) |
Total distributions | (3,527,292) |
Share transactions - net increase (decrease) | 170,819,879 |
Total increase (decrease) in net assets | 178,194,968 |
| |
Net Assets | |
Beginning of period | - |
End of period | $ 178,194,968 |
Financial Highlights - Service Class
Period ended December 31, | 2006 G |
Selected Per-Share Data | |
Net asset value, beginning of period | $ 10.00 |
Income from Investment Operations | |
Net investment income (loss) E | .21 |
Net realized and unrealized gain (loss) | .65 |
Total from investment operations | .86 |
Distributions from net investment income | (.11) |
Distributions from net realized gain | (.11) |
Total distributions | (.22) |
Net asset value, end of period | $ 10.64 |
Total Return B, C, D | 8.56% |
Ratios to Average Net Assets F, H | |
Expenses before reductions | .35% A |
Expenses net of fee waivers, if any | .20% A |
Expenses net of all reductions | .20% A |
Net investment income (loss) | 2.87% A |
Supplemental Data | |
Net assets, end of period (000 omitted) | $ 109 |
Portfolio turnover rate | 106% A |
A Annualized
B Total returns for periods of less than one year are not annualized.
C Total returns do not reflect charges attributable to your insurance company's separate account. Inclusion of these charges would reduce the total returns shown.
D Total returns would have been lower had certain expenses not been reduced during the periods shown.
E Calculated based on average shares outstanding during the period.
F Amounts do not include the activity of the underlying funds.
G For the period April 13, 2006 (commencement of operations) to December 31, 2006.
H Expense ratios reflect operating expenses of the class. Expenses before reductions do not reflect amounts reimbursed by the investment adviser or expense offset arrangements and do not represent the amount paid by the class during periods when reimbursements or reductions occur. Expense ratios before reductions for start-up periods may not be representative of longer-term operating periods. Expenses net of fee waivers reflect expenses after reimbursement by the investment adviser but prior to reductions from expense offset arrangements. Expenses net of all reductions represent the net expenses paid by the class but do not include expenses of the investment companies in which the Fund invests.
See accompanying notes which are an integral part of the financial statements.
Annual Report
Financial Highlights - Service Class 2
Period ended December 31, | 2006G |
Selected Per-Share Data | |
Net asset value, beginning of period | $ 10.00 |
Income from Investment Operations | |
Net investment income (loss) E | .20 |
Net realized and unrealized gain (loss) | .65 |
Total from investment operations | .85 |
Distributions from net investment income | (.10) |
Distributions from net realized gain | (.11) |
Total distributions | (.21) |
Net asset value, end of period | $ 10.64 |
Total Return B, C, D | 8.45% |
Ratios to Average Net Assets F, H | |
Expenses before reductions | .50% A |
Expenses net of fee waivers, if any | .35% A |
Expenses net of all reductions | .35% A |
Net investment income (loss) | 2.72% A |
Supplemental Data | |
Net assets, end of period (000 omitted) | $ 108 |
Portfolio turnover rate | 106%A |
A Annualized
B Total returns for periods of less than one year are not annualized.
C Total returns do not reflect charges attributable to your insurance company's separate account. Inclusion of these charges would reduce the total returns shown.
D Total returns would have been lower had certain expenses not been reduced during the periods shown.
E Calculated based on average shares outstanding during the period.
F Amounts do not include the activity of the underlying funds.
G For the period April 13, 2006 (commencement of operations) to December 31, 2006.
H Expense ratios reflect operating expenses of the class. Expenses before reductions do not reflect amounts reimbursed by the investment adviser or expense offset arrangements and do not represent the amount paid by the class during periods when reimbursements or reductions occur. Expense ratios before reductions for start-up periods may not be representative of longer-term operating periods. Expenses net of fee waivers reflect expenses after reimbursement by the investment adviser but prior to reductions from expense offset arrangements. Expenses net of all reductions represent the net expenses paid by the class but do not include expenses of the investment companies in which the Fund invests.
Financial Highlights - Investor Class
Period ended December 31, | 2006 G |
Selected Per-Share Data | |
Net asset value, beginning of period | $ 10.00 |
Income from Investment Operations | |
Net investment income (loss) E | .21 |
Net realized and unrealized gain (loss) | .65 |
Total from investment operations | .86 |
Distributions from net investment income | (.11) |
Distributions from net realized gain | (.11) |
Total distributions | (.22) |
Net asset value, end of period | $ 10.64 |
Total Return B, C, D | 8.56% |
Ratios to Average Net Assets F, H | |
Expenses before reductions | .25% A |
Expenses net of fee waivers, if any | .20% A |
Expenses net of all reductions | .20% A |
Net investment income (loss) | 2.86% A |
Supplemental Data | |
Net assets, end of period (000 omitted) | $ 177,978 |
Portfolio turnover rate | 106%A |
A Annualized
B Total returns for periods of less than one year are not annualized.
C Total returns do not reflect charges attributable to your insurance company's separate account. Inclusion of these charges would reduce the total returns shown.
D Total returns would have been lower had certain expenses not been reduced during the periods shown.
E Calculated based on average shares outstanding during the period.
F Amounts do not include the activity of the underlying funds.
G For the period April 13, 2006 (commencement of operations) to December 31, 2006.
H Expense ratios reflect operating expenses of the class. Expenses before reductions do not reflect amounts reimbursed by the investment adviser or expense offset arrangements and do not represent the amount paid by the class during periods when reimbursements or reductions occur. Expense ratios before reductions for start-up periods may not be representative of longer-term operating periods. Expenses net of fee waivers reflect expenses after reimbursement by the investment adviser but prior to reductions from expense offset arrangements. Expenses net of all reductions represent the net expenses paid by the class but do not include expenses of the investment companies in which the Fund invests.
See accompanying notes which are an integral part of the financial statements.
VIP FundsManager Portfolio
VIP FundsManager 85% Portfolio
Investment Summary
Fund Holdings as of December 31, 2006 |
| % of fund's
investments |
Domestic Equity Funds | |
Fidelity Aggressive Growth Fund | 3.8 |
Fidelity Capital Appreciation Fund | 2.4 |
Fidelity Contrafund | 0.8 |
Fidelity Dividend Growth Fund | 9.8 |
Fidelity Equity-Income Fund | 10.0 |
Fidelity Growth Company Fund | 3.8 |
Fidelity Large Cap Stock Fund | 4.4 |
Fidelity Mid Cap Value Fund | 0.2 |
Fidelity Mid-Cap Stock Fund | 1.4 |
Fidelity Nasdaq Composite Index Fund | 3.1 |
Fidelity Real Estate Investment Portfolio | 3.0 |
Fidelity Small Cap Independence Fund | 0.6 |
Fidelity Small Cap Stock Fund | 0.6 |
Fidelity Small Cap Value Fund | 0.1 |
Fidelity Value Discovery Fund | 3.1 |
Fidelity Value Fund | 2.0 |
Fidelity Value Strategies Fund | 7.2 |
Spartan Total Market Index Fund Investor Class | 6.3 |
Spartan U.S. Equity Index Fund Investor Class | 7.6 |
VIP Growth Opportunities Portfolio Investor Class | 1.5 |
| 71.7 |
International Equity Funds | |
Fidelity Emerging Markets Fund | 2.1 |
Fidelity International Discovery Fund | 4.0 |
Fidelity International Real Estate Fund | 1.0 |
Fidelity International Small Capital Opportunities Fund | 2.8 |
Fidelity Overseas Fund | 2.6 |
Spartan International Index Fund Investor Class | 3.8 |
| 16.3 |
Fixed-Income Funds | |
Fidelity Capital & Income Fund | 1.7 |
Fidelity High Income Fund | 1.3 |
Fidelity New Markets Income Fund | 2.0 |
Fidelity U.S. Bond Index Fund | 7.0 |
| 12.0 |
| 100.0 |
Asset Allocation (% of fund's investments) |
As of December 31, 2006 |
| Domestic Equity Funds | 71.7% | |
| International Equity Funds | 16.3% | |
| Fixed Income Funds | 12.0% | |

As of June 30, 2006 |
| Domestic Equity Funds | 72.1% | |
| International Equity Funds | 15.8% | |
| Fixed Income Funds | 12.1% | |

Annual Report
VIP FundsManager 85% Portfolio
Investments December 31, 2006
Showing Percentage of Total Value of Investment in Securities
Equity Funds - 88.0% |
| Shares | | Value (Note 1) |
Domestic Equity Funds - 71.7% |
Fidelity Aggressive Growth Fund (a) | 143,113 | | $ 2,774,967 |
Fidelity Capital Appreciation Fund | 63,481 | | 1,720,970 |
Fidelity Contrafund | 9,124 | | 594,877 |
Fidelity Dividend Growth Fund | 225,061 | | 7,129,927 |
Fidelity Equity-Income Fund | 123,985 | | 7,259,345 |
Fidelity Growth Company Fund (a) | 39,527 | | 2,755,408 |
Fidelity Large Cap Stock Fund | 182,278 | | 3,193,505 |
Fidelity Mid Cap Value Fund | 7,319 | | 122,006 |
Fidelity Mid-Cap Stock Fund | 34,388 | | 1,002,072 |
Fidelity Nasdaq Composite Index Fund | 70,119 | | 2,275,346 |
Fidelity Real Estate Investment Portfolio | 58,969 | | 2,144,710 |
Fidelity Small Cap Independence Fund | 20,221 | | 425,657 |
Fidelity Small Cap Stock Fund | 23,458 | | 445,935 |
Fidelity Small Cap Value Fund | 5,134 | | 71,870 |
Fidelity Value Discovery Fund | 127,566 | | 2,229,848 |
Fidelity Value Fund | 17,890 | | 1,441,944 |
Fidelity Value Strategies Fund | 161,015 | | 5,189,497 |
Spartan Total Market Index Fund Investor Class | 114,831 | | 4,545,010 |
Spartan U.S. Equity Index Fund Investor Class | 109,603 | | 5,499,895 |
VIP Growth Opportunities Portfolio Investor Class | 58,360 | | 1,056,908 |
TOTAL DOMESTIC EQUITY FUNDS | | 51,879,697 |
International Equity Funds - 16.3% |
Fidelity Emerging Markets Fund | 61,417 | | 1,497,960 |
Fidelity International Discovery Fund | 76,633 | | 2,905,908 |
Fidelity International Real Estate Fund | 45,309 | | 750,769 |
Fidelity International Small Capital Opportunities Fund | 128,979 | | 2,036,576 |
Fidelity Overseas Fund | 41,826 | | 1,873,817 |
Spartan International Index Fund Investor Class | 61,648 | | 2,721,123 |
TOTAL INTERNATIONAL EQUITY FUNDS | | 11,786,153 |
TOTAL EQUITY FUNDS (Cost $61,683,796) | 63,665,850 |
Fixed-Income Funds - 12.0% |
| | | |
Fidelity Capital & Income Fund | 141,527 | | 1,258,177 |
Fidelity High Income Fund | 101,949 | | 923,660 |
Fidelity New Markets Income Fund | 97,655 | | 1,445,291 |
Fidelity U.S. Bond Index Fund | 463,354 | | 5,032,020 |
TOTAL FIXED-INCOME FUNDS (Cost $8,581,707) | 8,659,148 |
TOTAL INVESTMENT IN SECURITIES - 100% (Cost $70,265,503) | $ 72,324,998 |
Legend |
(a) Non-income producing |
See accompanying notes which are an integral part of the financial statements.
VIP FundsManager Portfolio
VIP FundsManager 85% Portfolio
Financial Statements
Statement of Assets and Liabilities
| December 31, 2006 |
Assets | | |
Investment in securities, at value (cost $70,265,503) - See accompanying schedule | | $ 72,324,998 |
Cash | | 44 |
Total assets | | 72,325,042 |
| | |
Liabilities | | |
Payable for investments purchased | $ 16 | |
Accrued management fee | 11,486 | |
Distribution fees payable | 14 | |
Total liabilities | | 11,516 |
| | |
Net Assets | | $ 72,313,526 |
Net Assets consist of: | | |
Paid in capital | | $ 68,685,344 |
Accumulated undistributed net realized gain (loss) on investments | | 1,568,687 |
Net unrealized appreciation (depreciation) on investments | | 2,059,495 |
Net Assets | | $ 72,313,526 |
| | |
Service Class:
Net Asset Value, offering price and redemption price per share ($109,079 ÷ 10,178 shares) | | $ 10.72 |
| | |
Service Class 2:
Net Asset Value, offering price and redemption price per share ($108,961 ÷ 10,168 shares) | | $ 10.72 |
| | |
Investor Class:
Net Asset Value, offering price and redemption price per share ($72,095,486 ÷ 6,722,978 shares) | | $ 10.72 |
Statement of Operations
| | For the period
April 13, 2006
(commencement
of operations) to
December 31, 2006 |
Investment Income | | |
Income distributions from underlying funds | | $ 569,044 |
Interest | | 226 |
Total income | | 569,270 |
| | |
Expenses | | |
Management fee | $ 56,188 | |
Distribution fees | 255 | |
Independent trustees' compensation | 60 | |
Total expenses before reductions | 56,503 | |
Expense reductions | (11,424) | 45,079 |
Net investment income (loss) | | 524,191 |
Realized and Unrealized Gain (Loss) Realized gain (loss) on sale of underlying fund shares | 253,590 | |
Capital gain distributions from underlying funds | 2,042,583 | 2,296,173 |
Change in net unrealized appreciation (depreciation) on underlying funds | | 2,059,495 |
Net gain (loss) | | 4,355,668 |
Net increase (decrease) in net assets resulting from operations | | $ 4,879,859 |
See accompanying notes which are an integral part of the financial statements.
Annual Report
VIP FundsManager 85% Portfolio
Financial Statements - continued
Statement of Changes in Net Assets
| For the period
April 13, 2006
(commencement
of operations) to
December 31, 2006 |
Increase (Decrease) in Net Assets | |
Operations | |
Net investment income (loss) | $ 524,191 |
Net realized gain (loss) | 2,296,173 |
Change in net unrealized appreciation (depreciation) | 2,059,495 |
Net increase (decrease) in net assets resulting from operations | 4,879,859 |
Distributions to shareholders from net investment income | (528,972) |
Distributions to shareholders from net realized gain | (727,487) |
Total distributions | (1,256,459) |
Share transactions - net increase (decrease) | 68,690,126 |
Total increase (decrease) in net assets | 72,313,526 |
| |
Net Assets | |
Beginning of period | - |
End of period | $ 72,313,526 |
Financial Highlights - Service Class
Period ended December 31, | 2006 G |
Selected Per-Share Data | |
Net asset value, beginning of period | $ 10.00 |
Income from Investment Operations | |
Net investment income (loss) E | .17 |
Net realized and unrealized gain (loss) | .74 |
Total from investment operations | .91 |
Distributions from net investment income | (.08) |
Distributions from net realized gain | (.11) |
Total distributions | (.19) |
Net asset value, end of period | $ 10.72 |
Total Return B, C, D | 9.09% |
Ratios to Average Net Assets F, H | |
Expenses before reductions | .35% A |
Expenses net of fee waivers, if any | .20% A |
Expenses net of all reductions | .20% A |
Net investment income (loss) | 2.33% A |
Supplemental Data | |
Net assets, end of period (000 omitted) | $ 109 |
Portfolio turnover rate | 111% A |
A Annualized
B Total returns for periods of less than one year are not annualized.
C Total returns do not reflect charges attributable to your insurance company's separate account. Inclusion of these charges would reduce the total returns shown.
D Total returns would have been lower had certain expenses not been reduced during the periods shown.
E Calculated based on average shares outstanding during the period.
F Amounts do not include the activity of the underlying funds.
G For the period April 13, 2006 (commencement of operations) to December 31, 2006.
H Expense ratios reflect operating expenses of the class. Expenses before reductions do not reflect amounts reimbursed by the investment adviser or expense offset arrangements and do not represent the amount paid by the class during periods when reimbursements or reductions occur. Expense ratios before reductions for start-up periods may not be representative of longer-term operating periods. Expenses net of fee waivers reflect expenses after reimbursement by the investment adviser but prior to reductions from expense offset arrangements. Expenses net of all reductions represent the net expenses paid by the class but do not include expenses of the investment companies in which the Fund invests.
See accompanying notes which are an integral part of the financial statements.
VIP FundsManager Portfolio
Financial Highlights - Service Class 2
Period ended December 31, | 2006 G |
Selected Per-Share Data | |
Net asset value, beginning of period | $ 10.00 |
Income from Investment Operations | |
Net investment income (loss) E | .16 |
Net realized and unrealized gain (loss) | .74 |
Total from investment operations | .90 |
Distributions from net investment income | (.07) |
Distributions from net realized gain | (.11) |
Total distributions | (.18) |
Net asset value, end of period | $ 10.72 |
Total Return B, C, D | 8.99% |
Ratios to Average Net Assets F, H | |
Expenses before reductions | .50% A |
Expenses net of fee waivers, if any | .35% A |
Expenses net of all reductions | .35% A |
Net investment income (loss) | 2.17% A |
Supplemental Data | |
Net assets, end of period (000 omitted) | $ 109 |
Portfolio turnover rate | 111% A |
A Annualized
B Total returns for periods of less than one year are not annualized.
C Total returns do not reflect charges attributable to your insurance company's separate account. Inclusion of these charges would reduce the total returns shown.
D Total returns would have been lower had certain expenses not been reduced during the periods shown.
E Calculated based on average shares outstanding during the period.
F Amounts do not include the activity of the underlying funds.
G For the period April 13, 2006 (commencement of operations) to December 31, 2006.
H Expense ratios reflect operating expenses of the class. Expenses before reductions do not reflect amounts reimbursed by the investment adviser or expense offset arrangements and do not represent the amount paid by the class during periods when reimbursements or reductions occur. Expense ratios before reductions for start-up periods may not be representative of longer-term operating periods. Expenses net of fee waivers reflect expenses after reimbursement by the investment adviser but prior to reductions from expense offset arrangements. Expenses net of all reductions represent the net expenses paid by the class but do not include expenses of the investment companies in which the Fund invests.
Financial Highlights - Investor Class
Period ended December 31, | 2006 G |
Selected Per-Share Data | |
Net asset value, beginning of period | $ 10.00 |
Income from Investment Operations | |
Net investment income (loss) E | .17 |
Net realized and unrealized gain (loss) | .74 |
Total from investment operations | .91 |
Distributions from net investment income | (.08) |
Distributions from net realized gain | (.11) |
Total distributions | (.19) |
Net asset value, end of period | $ 10.72 |
Total Return B, C, D | 9.09% |
Ratios to Average Net Assets F, H | |
Expenses before reductions | .25% A |
Expenses net of fee waivers, if any | .20% A |
Expenses net of all reductions | .20% A |
Net investment income (loss) | 2.32% A |
Supplemental Data | |
Net assets, end of period (000 omitted) | $ 72,095 |
Portfolio turnover rate | 111% A |
A Annualized
B Total returns for periods of less than one year are not annualized.
C Total returns do not reflect charges attributable to your insurance company's separate account. Inclusion of these charges would reduce the total returns shown.
D Total returns would have been lower had certain expenses not been reduced during the periods shown.
E Calculated based on average shares outstanding during the period.
F Amounts do not include the activity of the underlying funds.
G For the period April 13, 2006 (commencement of operations) to December 31, 2006.
H Expense ratios reflect operating expenses of the class. Expenses before reductions do not reflect amounts reimbursed by the investment adviser or expense offset arrangements and do not represent the amount paid by the class during periods when reimbursements or reductions occur. Expense ratios before reductions for start-up periods may not be representative of longer-term operating periods. Expenses net of fee waivers reflect expenses after reimbursement by the investment adviser but prior to reductions from expense offset arrangements. Expenses net of all reductions represent the net expenses paid by the class but do not include expenses of the investment companies in which the Fund invests.
See accompanying notes which are an integral part of the financial statements.
Annual Report
Notes to Financial Statements
For the period ended December 31, 2006
1. Significant Accounting Policies.
VIP FundsManager 20% Portfolio, VIP FundsManager 50% Portfolio, VIP FundsManager 70% Portfolio, and VIP FundsManager 85% Portfolio(the Funds) are funds of Variable Insurance Products Fund IV(the Trust). The Trust is registered under the Investment Company Act of 1940, as amended(the 1940 Act), as an open-end management investment company organized as a Massachusetts business trust. Each Fund is authorized to issue an unlimited number of shares. The Funds invest primarily in a combination of other VIP and Fidelity retail equity, fixed income, and money market funds(the Underlying Funds) managed by Fidelity Management & Research Company(FMR) and its affiliates. Shares of each Fund may only be purchased by insurance companies for the purpose of funding variable annuity or variable life insurance contracts. Each Fund offers three classes of shares: Investor Class shares, Service Class shares and Service Class 2 shares. All classes have equal rights and voting privileges, except for matters affecting a single class. Investment income, realized and unrealized capital gains and losses, the common expenses of the Fund, and certain fund-level expense reductions, if any, are allocated on a pro rata basis to each class based on the relative net assets of each class to the total net assets of the Fund. Each class differs with respect to distribution and service plan fees incurred. Certain expense reductions also differ by class.
The financial statements have been prepared in conformity with accounting principles generally accepted in the United States of America, which require management to make certain estimates and assumptions at the date of the financial statements. The following summarizes the significant accounting policies of the Funds.
Security Valuation. Net asset value per share is calculated as of the close of business of the New York Stock Exchange, normally 4:00 p.m. Eastern time. Investments in the Underlying Funds are valued at their closing net asset value each business day. Short-term securities with remaining maturities of sixty days or less for which quotations are not readily available are valued on the basis of amortized cost, which approximates value.
Investment Transactions and Income. Security transactions, normally shares of the Underlying Funds, are accounted for as of trade date. Gains and losses on securities sold are determined on the basis of identified cost. Income and capital gain distributions from the Underlying Funds, if any, are recorded on the ex-dividend date. Interest income is accrued as earned. Interest income includes coupon interest and amortization of premium and accretion of discount on debt securities.
Expenses. Most expenses of the trust can be directly attributed to a fund. Expenses which cannot be directly attributed are apportioned among each fund in the trust. Expenses included in the accompanying financial statements reflect the expenses of each Fund and do not include any expenses associated with the Underlying Funds. Expense estimates are accrued in the period to which they relate and adjustments are made when actual amounts are known.
Income Tax Information and Distributions to Shareholders. Each year, each Fund intends to qualify as a regulated investment company by distributing all of its taxable income and realized gains under Subchapter M of the Internal Revenue Code. As a result, no provision for income taxes is required in the accompanying financial statements.
Distributions are recorded on the ex-dividend date. Income dividends and capital gain distributions are declared separately for each class. Income and capital gain distributions are determined in accordance with income tax regulations, which may differ from generally accepted accounting principles.
Capital accounts within the financial statements are adjusted for permanent book-tax differences. These adjustments have no impact on net assets or the results of operations. Temporary book-tax differences will reverse in a subsequent period.
Book-tax differences are primarily due to the short-term gain distributions from the Underlying Funds and losses deferred due to wash sales.
The tax-basis components of distributable earnings and the federal tax cost as of period end were as follows for each Fund:
| Cost for
Federal Income
Tax Purposes | Unrealized
Appreciation | Unrealized
Depreciation | Net Unrealized
Appreciation/
(Depreciation) |
VIP FundsManager 20% Portfolio | $ 24,092,281 | $ 224,370 | $ (57,895) | $ 166,475 |
VIP FundsManager 50% Portfolio | 141,670,244 | 3,087,381 | (775,854) | 2,311,527 |
VIP FundsManager 70% Portfolio | 173,737,102 | 5,708,301 | (1,222,106) | 4,486,195 |
VIP FundsManager 85% Portfolio | 70,265,594 | 2,648,786 | (589,382) | 2,059,404 |
| Undistributed
Ordinary
Income | Undistributed
Long-term
Capital Gain |
VIP FundsManager 20% Portfolio | $ 58,928 | $ 80,330 |
VIP FundsManager 50% Portfolio | 764,205 | 1,568,395 |
VIP FundsManager 70% Portfolio | 308,980 | 2,579,917 |
VIP FundsManager 85% Portfolio | 277,246 | 1,291,530 |
VIP FundsManager Portfolio
1. Significant Accounting Policies - continued
Income Tax Information and Distributions to Shareholders - continued
The tax character of distributions paid was as follows:
December 31, 2006 | | | |
| Ordinary
Income | Long-term
Capital Gains | Total |
VIP FundsManager 20% Portfolio | $ 421,605 | $ 22,919 | $ 444,524 |
VIP FundsManager 50% Portfolio | 2,569,280 | 269,046 | 2,838,326 |
VIP FundsManager 70% Portfolio | 3,200,680 | 326,612 | 3,527,292 |
VIP FundsManager 85% Portfolio | 1,058,054 | 198,405 | 1,256,459 |
New Accounting Pronouncements. In July 2006, Financial Accounting Standards Board Interpretation No. 48, Accounting for Uncertainty in Income Taxes - an interpretation of FASB Statement 109(FIN 48), was issued and is effective on the last business day of the semiannual reporting period for fiscal years beginning after December 15, 2006. FIN 48 sets forth a threshold for financial statement recognition, measurement and disclosure of a tax position taken or expected to be taken on a tax return. Management is currently evaluating the impact, if any, the adoption of FIN 48 will have on the Funds' net assets, results of operations and financial statement disclosures.
In addition, in September 2006, Statement of Financial Accounting Standards No. 157, Fair Value Measurements(SFAS 157), was issued and is effective for fiscal years beginning after November 15, 2007. SFAS 157 defines fair value, establishes a framework for measuring fair value and expands disclosures about fair value measurements. Management is currently evaluating the impact the adoption of SFAS 157 will have on the Funds' financial statement disclosures.
2. Operating Policies.
Repurchase Agreements. FMR has received an Exemptive Order from the Securities and Exchange Commission(the SEC) which permits certain Funds and other affiliated entities of FMR to transfer uninvested cash balances into joint trading accounts which are then invested in repurchase agreements. Certain Funds may also invest directly with institutions in repurchase agreements. Repurchase agreements are collateralized by government or non-government securities. Upon settlement date, collateral is held in segregated accounts with custodian banks and may be obtained in the event of a default of the counterparty. Each applicable Fund monitors, on a daily basis, the value of the collateral to ensure it is at least equal to the principal amount of the repurchase agreement (including accrued interest). In the event of a default by the counterparty, realization of the collateral proceeds could be delayed, during which time the value of the collateral may decline.
3. Purchases and Sales of Investments.
Purchases and redemptions of the underlying fund shares are noted in the table below.
| Purchases($) | Redemptions($) |
VIP FundsManager 20% Portfolio | 31,442,649 | 7,464,121 |
VIP FundsManager 50% Portfolio | 192,602,817 | 52,094,334 |
VIP FundsManager 70% Portfolio | 236,180,320 | 63,354,611 |
VIP FundsManager 85% Portfolio | 97,319,560 | 27,307,647 |
4. Fees and Other Transactions with Affiliates.
Management Fee. Strategic Advisers, Inc.(Strategic Advisers), an affiliate of FMR, provides the funds with investment management related services. For these services each fund pays a monthly management fee to Strategic Advisers. The management fee is based on an annual rate of .25% of each fund's average net assets. The management fee is reduced by an amount equal to the fees and expenses paid by the fund to the independent Trustees.
Strategic Advisers has contractually agreed to waive 0.05% of its management fee, thereby limiting each fund's management fee to an annual rate of 0.20% of average net assets, until July 31, 2007.
Other Transactions. Strategic Advisers has entered into an administration agreement with FMR under which FMR provides management and administrative services (other than investment advisory services) necessary for the operation of each Fund. Pursuant to this agreement, FMR pays all expenses of each Fund, excluding the distribution and service fees, the compensation of the independent Trustees and certain other expenses such as interest expense. FMR also contracts with other Fidelity companies to perform the services necessary for the operation of each Fund. The Funds do not pay any fees for these services.
Annual Report
Notes to Financial Statements - continued
4. Fees and Other Transactions with Affiliates - continued
Distribution and Service Plan. In accordance with Rule 12b-1 of the 1940 Act, the Funds have adopted separate 12b-1 Plans for each Service Class of shares. Each Service Class pays Fidelity Distributors Corporation(FDC), an affiliate of FMR, a service fee. For the period, the service fee is based on an annual rate of .10% of Service Class' average net assets and .25% of Service Class 2's average net assets.
For the period, each class paid FDC the following amounts, all of which were reallowed to insurance companies for the distribution of shares and providing shareholder support services:
| Service
Class | Service
Class 2 | Total |
VIP FundsManager 20% Portfolio | $ 73 | $ 182 | $ 255 |
VIP FundsManager 50% Portfolio | 73 | 182 | 255 |
VIP FundsManager 70% Portfolio | 73 | 182 | 255 |
VIP FundsManager 85% Portfolio | 73 | 182 | 255 |
5. Expense Reductions.
Strategic Advisers contractually agreed to limit each funds' management fee to an annual rate of 0.20% of each funds' average net assets until July 31, 2007. For the period, each fund's management fees were reduced by the following amounts:
| Management
Fee Waiver |
VIP FundsManager 20% Portfolio | $ 3,623 |
VIP FundsManager 50% Portfolio | $ 23,109 |
VIP FundsManager 70% Portfolio | $ 27,118 |
VIP FundsManager 85% Portfolio | $ 11,278 |
In addition, FMR has contractually agreed to reimburse 0.10% of class-level expenses for each fund's Service class and Service Class 2. During the period, this reimbursement reduced each fund's Service class and Service class 2's expenses by the following amounts:
| Reimbursement |
VIP FundsManager 20% Portfolio | |
Service Class | $ 73 |
Service Class 2 | 73 |
VIP FundsManager 50% Portfolio | |
Service Class | 73 |
Service Class 2 | 73 |
VIP FundsManager 70% Portfolio | |
Service Class | 73 |
Service Class 2 | 73 |
VIP FundsManager 85% Portfolio | |
Service Class | 73 |
Service Class 2 | 73 |
6. Other.
The Funds' organizational documents provide former and current trustees and officers with a limited indemnification against liabilities arising in connection with the performance of their duties to the Funds. In the normal course of business, the Funds may also enter into contracts that provide general indemnifications. The Funds' maximum exposure under these arrangements is unknown as this would be dependent on future claims that may be made against the Funds. The risk of material loss from such claims is considered remote.
The Funds do not invest in the Underlying Funds for the purpose of exercising management or control; however, investments by the Funds within their principal investment strategies may represent a significant portion of the Underlying Funds' net assets. At the end of the period, FMR or its affiliates were owners of record of all of the outstanding shares of the Funds.
VIP FundsManager Portfolio
7. Distributions to Shareholders.
Distributions to shareholders of each class were as follows:
Period ended December 31, | 2006 A |
VIP FundsManager 20% Portfolio | |
From net investment income | |
Service Class | 1,440 |
Service Class 2 | 1,330 |
Investor Class | 327,158 |
Total | $ 329,928 |
From net realized gain | |
Service Class | 500 |
Service Class 2 | 500 |
Investor Class | 113,596 |
Total | $ 114,596 |
| |
VIP FundsManager 50% Portfolio | |
From net investment income | |
Service Class | 1,210 |
Service Class 2 | 1,100 |
Investor Class | 1,625,309 |
Total | $ 1,627,619 |
From net realized gain | |
Service Class | 900 |
Service Class 2 | 900 |
Investor Class | 1,208,907 |
Total | $ 1,210,707 |
| |
VIP FundsManager 70% Portfolio | |
From net investment income | |
Service Class | 1,060 |
Service Class 2 | 950 |
Investor Class | 1,728,920 |
Total | $ 1,730,930 |
From net realized gain | |
Service Class | 1,100 |
Service Class 2 | 1,100 |
Investor Class | 1,794,162 |
Total | $ 1,796,362 |
| |
VIP FundsManager 85% Portfolio | |
From net investment income | |
Service Class | 800 |
Service Class 2 | 690 |
Investor Class | 527,482 |
Total | $ 528,972 |
From net realized gain | |
Service Class | 1,100 |
Service Class 2 | 1,100 |
Investor Class | 725,287 |
Total | $ 727,487 |
A Distributions for Service Class, Service Class 2 and Investor Class are for the period April 13, 2006 (commencement of operations) to December 31, 2006.
Annual Report
Notes to Financial Statements - continued
8. Share Transactions.
Transactions for each class of shares were as follows:
| Shares | Dollars |
Period ended December 31, | 2006 A | 2006A |
VIP FundsManager 20% Portfolio | | |
Service Class | | |
Shares sold | 10,001 | $ 100,010 |
Reinvestment of distributions | 187 | 1,940 |
Net increase (decrease) | 10,188 | $ 101,950 |
Service Class 2 | | |
Shares sold | 10,001 | $ 100,010 |
Reinvestment of distributions | 177 | 1,830 |
Net increase (decrease) | 10,178 | $ 101,840 |
Investor Class | | |
Shares sold | 2,582,277 | $ 26,408,816 |
Reinvestment of distributions | 42,585 | 440,754 |
Shares redeemed | (299,208) | (3,103,637) |
Net increase (decrease) | 2,325,654 | $ 23,745,933 |
| | |
VIP FundsManager 50% Portfolio | | |
Service Class | | |
Shares sold | 10,001 | $ 100,010 |
Reinvestment of distributions | 200 | 2,110 |
Net increase (decrease) | 10,201 | $ 102,120 |
Service Class 2 | | |
Shares sold | 10,001 | $ 100,010 |
Reinvestment of distributions | 190 | 2,000 |
Net increase (decrease) | 10,191 | $ 102,010 |
Investor Class | | |
Shares sold | 13,626,238 | $ 138,574,548 |
Reinvestment of distributions | 268,901 | 2,834,216 |
Shares redeemed | (225,232) | (2,298,446) |
Net increase (decrease) | 13,669,907 | $ 139,110,318 |
| | |
VIP FundsManager 70% Portfolio | | |
Service Class | | |
Shares sold | 10,001 | $ 100,010 |
Reinvestment of distributions | 203 | 2,160 |
Net increase (decrease) | 10,204 | $ 102,170 |
Service Class 2 | | |
Shares sold | 10,001 | $ 100,010 |
Reinvestment of distributions | 192 | 2,050 |
Net increase (decrease) | 10,193 | $ 102,060 |
Investor Class | | |
Shares sold | 16,535,121 | $ 168,412,346 |
Reinvestment of distributions | 330,495 | 3,523,082 |
Shares redeemed | (132,487) | (1,319,779) |
Net increase (decrease) | 16,733,129 | $ 170,615,649 |
| | |
VIP FundsMaanger Portfolio
8. Share Transactions - continued
Transactions for each class of shares were as follows:
| Shares | Dollars |
Period ended December 31, | 2006 A | 2006 A |
VIP FundsManager 85% Portfolio | | |
Service Class | | |
Shares sold | 10,001 | $ 100,010 |
Reinvestment of distributions | 177 | 1,900 |
Net increase (decrease) | 10,178 | $ 101,910 |
Service Class 2 | | |
Shares sold | 10,001 | $ 100,010 |
Reinvestment of distributions | 167 | 1,790 |
Net increase (decrease) | 10,168 | $ 101,800 |
Investor Class | | |
Shares sold | 6,665,215 | $ 67,823,047 |
Reinvestment of distributions | 116,537 | 1,252,769 |
Shares redeemed | (58,774) | (589,400) |
Net increase (decrease) | 6,722,978 | $ 68,486,416 |
A For the period April 13, 2006 (commencement of operations) to December 31, 2006.
Annual Report
Report of Independent Registered Public Accounting Firm
To the Trustees of Variable Insurance Products Fund IV and the Shareholders of VIP FundsManager 20% Portfolio, VIP FundsManager 50% Portfolio, VIP FundsManager 70% Portfolio and VIP FundsManager 85% Portfolio:
In our opinion, the accompanying statements of assets and liabilities, including the schedules of investments, and the related statements of operations and of changes in net assets and the financial highlights present fairly, in all material respects, the financial position of VIP FundsManager 20% Portfolio, VIP FundsManager 50% Portfolio, VIP FundsManager 70% Portfolio and VIP FundsManager 85% Portfolio, (funds of Variable Insurance Products Fund IV) at December 31, 2006, and the results of each of their operations, the changes in each of their net assets and the financial highlights for the period April 13, 2006 (commencement of operations) through December 31, 2006, in conformity with accounting principles generally accepted in the United States of America. These financial statements and financial highlights (hereafter referred to as "financial statements") are the responsibility of the Variable Insurance Products Fund IV's management; our responsibility is to express an opinion on these financial statements based on our audit. We conducted our audit of these financial statements in accordance with the standards of the Public Company Accounting Oversight Board (United States). Those standards require that we plan and perform the audit to obtain reasonable assurance about whether the financial statements are free of material misstatement. An audit includes examining, on a test basis, evidence supporting the amounts and disclosures in the financial statements, assessing the accounting principles used and significant estimates made by management, and evaluating the overall financial statement presentation. We believe that our audit, which included confirmation of securities at December 31, 2006 by correspondence with the transfer agent, provides a reasonable basis for our opinion.
/s/ PricewaterhouseCoopers LLP
PricewaterhouseCoopers LLP
Boston, Massachusetts
February 15, 2007
VIP FundsManager Portfolio
Trustees and Officers
The Trustees, Member of the Advisory Board, and executive officers of the trust and funds, as applicable, are listed below. The Board of Trustees governs each VIP FundsManager Portfolio and is responsible for protecting the interests of shareholders. The Trustees are experienced executives who meet periodically throughout the year to oversee each VIP FundsManager Portfolio's activities, review contractual arrangements with companies that provide services to each VIP FundsManager Portfolio, and review each VIP FundsManager Portfolio's performance. If the interests of a VIP FundsManager Portfolio and an underlying Fidelity fund were to diverge, a conflict of interest could arise and affect how the Trustees and Member of the Advisory Board fulfill their fiduciary duties to the affected funds. Strategic Advisers has structured the VIP FundsManager Portfolios to avoid these potential conflicts, although there may be situations where a conflict of interest is unavoidable. In such instances, Strategic Advisers, the Trustees, and Member of the Advisory Board would take reasonable steps to minimize and, if possible, eliminate the conflict. Each of the Trustees oversees 348 funds advised by FMR or an affiliate.
The Trustees hold office without limit in time except that (a) any Trustee may resign; (b) any Trustee may be removed by written instrument, signed by at least two-thirds of the number of Trustees prior to such removal; (c) any Trustee who requests to be retired or who has become incapacitated by illness or injury may be retired by written instrument signed by a majority of the other Trustees; and (d) any Trustee may be removed at any special meeting of shareholders by a two-thirds vote of the outstanding voting securities of the trust. Each Trustee who is not an interested person (as defined in the 1940 Act) (Independent Trustee), shall retire not later than the last day of the calendar year in which his or her 72nd birthday occurs. The Independent Trustees may waive this mandatory retirement age policy with respect to individual Trustees. The executive officers and Advisory Board Member hold office without limit in time, except that any officer and Advisory Board Member may resign or may be removed by a vote of a majority of the Trustees at any regular meeting or any special meeting of the Trustees. Except as indicated, each individual has held the office shown or other offices in the same company for the past five years.
The funds' Statement of Additional Information (SAI) includes more information about the Trustees. To request a free copy, call Fidelity at 1-877-208-0098.
Interested Trustees*:
Correspondence intended for each Trustee who is an interested person may be sent to Fidelity Investments, 82 Devonshire Street, Boston, Massachusetts 02109.
Name, Age; Principal Occupation |
Edward C. Johnson 3d (76) |
| Year of Election or Appointment: 1983 Mr. Johnson is Chairman of the Board of Trustees. Mr. Johnson serves as President (2006-present), Chief Executive Officer, Chairman, and a Director of FMR Corp.; Chairman and a Director of FMR; Chairman and a Director of Fidelity Research & Analysis Company (FRAC); Chairman and a Director of Fidelity Investments Money Management, Inc.; and Chairman (2001-present) and a Director of FMR Co., Inc. In addition, Mr. Johnson serves as Chairman and Director of Fidelity International Limited (FIL). |
Robert L. Reynolds (54) |
| Year of Election or Appointment: 2003 Mr. Reynolds is President and a Director of FMR (2005-present), Fidelity Investments Money Management, Inc. (2005-present), and FMR Co., Inc. (2005-present). Mr. Reynolds also serves as Vice Chairman (2006-present), a Director (2003-present), and Chief Operating Officer of FMR Corp. and a Director of Strategic Advisers, Inc. (2005-present). He also serves on the Board at Fidelity Investments Canada, Ltd. |
* Trustees have been determined to be "Interested Trustees" by virtue of, among other things, their affiliation with the trust or various entities under common control with FMR.
Independent Trustees:
Correspondence intended for each Independent Trustee (that is, the Trustees other than the Interested Trustees) may be sent to Fidelity Investments, P.O. Box 55235, Boston, Massachusetts 02205-5235.
Name, Age; Principal Occupation |
Dennis J. Dirks (58) |
| Year of Election or Appointment: 2005 Prior to his retirement in May 2003, Mr. Dirks was Chief Operating Officer and a member of the Board of The Depository Trust & Clearing Corporation (DTCC) (1999-2003). He also served as President, Chief Operating Officer, and Board member of The Depository Trust Company (DTC) (1999-2003) and President and Board member of the National Securities Clearing Corporation (NSCC) (1999-2003). In addition, Mr. Dirks served as Chief Executive Officer and Board member of the Government Securities Clearing Corporation (2001-2003) and Chief Executive Officer and Board member of the Mortgage-Backed Securities Clearing Corporation (2001-2003). Mr. Dirks also serves as a Trustee and a member of the Finance Committee of Manhattan College (2005-present) and a Trustee and a member of the Finance Committee of AHRC of Nassau County (2006-present). |
Albert R. Gamper, Jr. (64) |
| Year of Election or Appointment: 2006 Prior to his retirement in December 2004, Mr. Gamper served as Chairman of the Board of CIT Group Inc. (commercial finance). During his tenure with CIT Group Inc. Mr. Gamper served in numerous senior management positions, including Chairman (1987-1989; 1999-2001; 2002-2004), Chief Executive Officer (1987-2004), and President (1989-2002). He currently serves as a member of the Board of Directors of Public Service Enterprise Group (utilities, 2001-present), Chairman of the Board of Governors, Rutgers University (2004-present), and Chairman of the Board of Saint Barnabas Health Care System. |
George H. Heilmeier (70) |
| Year of Election or Appointment: 2004 Dr. Heilmeier is Chairman Emeritus of Telcordia Technologies (communication software and systems), where prior to his retirement, he served as company Chairman and Chief Executive Officer. He currently serves on the Boards of Directors of The Mitre Corporation (systems engineering and information technology support for the government), and HRL Laboratories (private research and development, 2004-present). He is Chairman of the General Motors Science & Technology Advisory Board and a Life Fellow of the Institute of Electrical and Electronics Engineers (IEEE). Dr. Heilmeier is a member of the Defense Science Board and the National Security Agency Advisory Board. He is also a member of the National Academy of Engineering, the American Academy of Arts and Sciences, and the Board of Overseers of the School of Engineering and Applied Science of the University of Pennsylvania. Previously, Dr. Heilmeier served as a Director of TRW Inc. (automotive, space, defense, and information technology, 1992-2002), Compaq (1994-2002), Automatic Data Processing, Inc. (ADP) (technology-based business outsourcing, 1995-2002), INET Technologies Inc. (telecommunications network surveillance, 2001-2004), and Teletech Holdings (customer management services). He is the recipient of the 2005 Kyoto Prize in Advanced Technology for his invention of the liquid crystal display, and a member of the Consumer Electronics Hall of Fame. |
James H. Keyes (66) |
| Year of Election or Appointment: 2007 Prior to his retirement in 2003, Mr. Keyes was Chairman, President, and Chief Executive Officer of Johnson Controls, Inc. (automotive supplier, 1993-2003). He currently serves as a member of the boards of LSI Logic Corporation (semiconductor technologies), Navistar International Corporation (manufacture and sale of trucks, buses, and diesel engines, 2002-present), and Pitney Bowes, Inc. (integrated mail, messaging, and document management solutions). |
Marie L. Knowles (60) |
| Year of Election or Appointment: 2001 Prior to Ms. Knowles' retirement in June 2000, she served as Executive Vice President and Chief Financial Officer of Atlantic Richfield Company (ARCO) (diversified energy, 1996-2000). From 1993 to 1996, she was a Senior Vice President of ARCO and President of ARCO Transportation Company. She served as a Director of ARCO from 1996 to 1998. She currently serves as a Director of Phelps Dodge Corporation (copper mining and manufacturing) and McKesson Corporation (healthcare service, 2002-present). Ms. Knowles is a Trustee of the Brookings Institution and the Catalina Island Conservancy and also serves as a member of the Advisory Board for the School of Engineering of the University of Southern California. |
Ned C. Lautenbach (62) |
| Year of Election or Appointment: 2000 Mr. Lautenbach is Chairman of the Independent Trustees (2006-present). Mr. Lautenbach has been a partner of Clayton, Dubilier & Rice, Inc. (private equity investment firm) since September 1998. Previously, Mr. Lautenbach was with the International Business Machines Corporation (IBM) from 1968 until his retirement in 1998. Mr. Lautenbach serves as a Director of Sony Corporation (2006-present) and Eaton Corporation (diversified industrial) as well as the Philharmonic Center for the Arts in Naples, Florida. He also is a member of the Board of Trustees of Fairfield University (2005-present), as well as a member of the Council on Foreign Relations. |
Cornelia M. Small (62) |
| Year of Election or Appointment: 2005 Ms. Small is a member (2000-present) and Chairperson (2002-present) of the Investment Committee, and a member (2002-present) of the Board of Trustees of Smith College. Previously, she served as Chief Investment Officer (1999-2000), Director of Global Equity Investments (1996-1999), and a member of the Board of Directors of Scudder, Stevens & Clark (1990-1997) and Scudder Kemper Investments (1997-1999). In addition, Ms. Small served as Co-Chair (2000-2003) of the Annual Fund for the Fletcher School of Law and Diplomacy. |
William S. Stavropoulos (67) |
| Year of Election or Appointment: 2001 Mr. Stavropoulos is Chairman Emeritus of the Board of Directors of The Dow Chemical Company. Since joining The Dow Chemical Company in 1967, Mr. Stavropoulos served in numerous senior management positions, including President (1993-2000; 2002-2003), CEO (1995-2000; 2002-2004), and Chairman of the Executive Committee (2000-2004). Currently, he is a Director of NCR Corporation (data warehousing and technology solutions), BellSouth Corporation (telecommunications), Chemical Financial Corporation, Maersk Inc. (industrial conglomerate, 2002-present), and Metalmark Capital (private equity investment firm, 2005-present). He also serves as a member of the Board of Trustees of the American Enterprise Institute for Public Policy Research. In addition, Mr. Stavropoulos is a member of The Business Council, J.P. Morgan International Council and the University of Notre Dame Advisory Council for the College of Science. |
Kenneth L. Wolfe (67) |
| Year of Election or Appointment: 2005 Prior to his retirement in 2001, Mr. Wolfe was Chairman and Chief Executive Officer of Hershey Foods Corporation (1993-2001). He currently serves as a member of the boards of Adelphia Communications Corporation (2003-present), Bausch & Lomb, Inc., and Revlon Inc. (2004-present). |
Advisory Board Member and Executive Officers:
Correspondence intended for each executive officer and Mr. Lynch may be sent to Fidelity Investments, 82 Devonshire Street, Boston, Massachusetts 02109.
Name, Age; Principal Occupation |
Peter S. Lynch (62) |
| Year of Election or Appointment: 2003 Member of the Advisory Board of Variable Insurance Products Fund IV. Mr. Lynch is Vice Chairman and a Director of FMR, and Vice Chairman (2001-present) and a Director of FMR Co., Inc. Previously, Mr. Lynch served as a Trustee of the Fidelity funds (1990-2003). In addition, he serves as a Trustee of Boston College and as the Chairman of the Inner-City Scholarship Fund. |
Kimberley H. Monasterio (43) |
| Year of Election or Appointment: 2007 President and Treasurer of VIP FundsManager Portfolio 20%, VIP FundsManager Portfolio 50%, VIP FundsManager Portfolio 70%, and VIP FundsManager Portfolio 85%. Ms. Monasterio also serves as President and Treasurer of other Fidelity funds (2007-present) and is an employee of FMR (2004-present). Previously, Ms. Monasterio served as Deputy Treasurer of the Fidelity funds (2004-2006). Before joining Fidelity Investments, Ms. Monasterio served as Treasurer (2000-2004) and Chief Financial Officer (2002-2004) of the Franklin Templeton Funds and Senior Vice President of Franklin Templeton Services, LLC (2000-2004). |
Boyce I. Greer (50) |
| Year of Election or Appointment: 2006 Vice President of VIP FundsManager Portfolio 20%, VIP FundsManager Portfolio 50%, VIP FundsManager Portfolio 70%, and VIP FundsManager Portfolio 85%. Mr. Greer also serves as Vice President of certain Equity Funds (2005-present), certain Asset Allocation Funds (2005-present), Fixed-Income Funds (2006-present), and Money Market Funds (2006-present). Mr. Greer is also a Trustee of other investment companies advised by FMR (2003-present). He is an Executive Vice President of FMR (2005-present) and FMR Co., Inc. (2005-present), and Senior Vice President of Fidelity Investments Money Management, Inc. (2006-present). Previously, Mr. Greer served as a Director and Managing Director of Strategic Advisers, Inc. (2002-2005), and Executive Vice President (2000-2002) and Money Market Group Leader (1997-2002) of the Fidelity Investments Fixed Income Division. He also served as Vice President of Fidelity's Money Market Funds (1997-2002), Senior Vice President of FMR (1997-2002), and Vice President of FIMM (1998-2002). |
Scott Kuldell (41) |
| Year of Election or Appointment: 2006 Vice President of VIP FundsManager Portfolio 20%, VIP FundsManager Portfolio 50%, VIP FundsManager Portfolio 70%, and VIP FundsManager Portfolio 85%. Prior to assuming his current responsibilities, Mr. Kuldell worked as a quantitative analyst, currency strategist, portfolio manager, and director of Asset Management Consulting. |
Eric D. Roiter (58) |
| Year of Election or Appointment: 2006 Secretary of VIP FundsManager Portfolio 20%, VIP FundsManager Portfolio 50%, VIP FundsManager Portfolio 70%, and VIP Funds Manager Portfolio 85%. He also serves as Secretary of other Fidelity funds; Vice President, General Counsel, and Secretary of FMR Co., Inc. (2001-present) and FMR; Assistant Secretary of Fidelity Management & Research (U.K.) Inc. (2001-present), Fidelity Research & Analysis Company (2001-present), and Fidelity Investments Money Management, Inc. (2001-present). Mr. Roiter is an Adjunct Member, Faculty of Law, at Boston College Law School (2003-present). Previously, Mr. Roiter served as Vice President and Secretary of Fidelity Distributors Corporation (FDC) (1998-2005). |
Stuart Fross (47) |
| Year of Election or Appointment: 2006 Assistant Secretary of VIP FundsManager Portfolio 20%, VIP FundsManager Portfolio 50%, VIP FundsManager Portfolio 70%, and VIP FundsManager Portfolio 85%. Mr. Fross also serves as Assistant Secretary of other Fidelity funds (2003-present), Vice President and Secretary of FDC (2005-present), and is an employee of FMR. |
R. Stephen Ganis (40) |
| Year of Election or Appointment: 2006 Anti-Money Laundering (AML) officer of VIP FundsManager Portfolio 20%, VIP FundsManager Portfolio 50%, VIP FundsManager Portfolio 70%, and VIP FundsManager Portfolio 85%. Mr. Ganis also serves as AML officer of other Fidelity funds (2006-present) and FMR Corp. (2003-present). Before joining Fidelity Investments, Mr. Ganis practiced law at Goodwin Procter, LLP (2000-2002). |
Joseph B. Hollis (58) |
| Year of Election or Appointment: 2006 Chief Financial Officer of VIP FundsManager Portfolio 20%, VIP FundsManager Portfolio 50%, VIP FundsManager Portfolio 70%, and VIP FundsManager Portfolio 85%. Mr. Hollis also serves as Chief Financial Officer of other Fidelity funds. Mr. Hollis is President of Fidelity Pricing and Cash Management Services (FPCMS) (2005-present). Mr. Hollis also serves as President and Director of Fidelity Service Company, Inc. (2006-present). Previously, Mr. Hollis served as Senior Vice President of Cash Management Services (1999-2002) and Investment Management Operations (2002-2005). |
Kenneth A. Rathgeber (59) |
| Year of Election or Appointment: 2006 Chief Compliance Officer of VIP FundsManager Portfolio 20%, VIP FundsManager Portfolio 50%, VIP FundsManager Portfolio 70%, and VIP FundsManager Portfolio 85%. Mr. Rathgeber also serves as Chief Compliance Officer of other Fidelity funds (2004-present) and Executive Vice President of Risk Oversight for Fidelity Investments (2002-present). He is Chief Compliance Officer of FMR (2005-present), FMR Co., Inc. (2005-present), Fidelity Management & Research (U.K.) Inc. (2005-present), Fidelity Research & Analysis Company (2005-present), Fidelity Investments Money Management, Inc. (2005-present), and Strategic Advisers, Inc. (2005-present). Previously, Mr. Rathgeber served as Executive Vice President and Chief Operating Officer for Fidelity Investments Institutional Services Company, Inc. (1998-2002). |
Bryan A. Mehrmann (45) |
| Year of Election or Appointment: 2006 Deputy Treasurer of VIP FundsManager Portfolio 20%, VIP FundsManager Portfolio 50%, VIP FundsManager Portfolio 70%, and VIP FundsManager Portfolio 85%. Mr. Mehrmann also serves as Deputy Treasurer of other Fidelity funds (2005-present) and is an employee of FMR. Previously, Mr. Mehrmann served as Vice President of Fidelity Investments Institutional Services Group (FIIS)/Fidelity Investments Institutional Operations Corporation, Inc. (FIIOC) Client Services (1998-2004). |
Kenneth B. Robins (37) |
| Year of Election or Appointment: 2006 Deputy Treasurer of VIP FundsManager Portfolio 20%, VIP FundsManager Portfolio 50%, VIP FundsManager Portfolio 70%, and VIP FundsManager Portfolio 85%. Mr. Robins also serves as Deputy Treasurer of other Fidelity funds (2005-present) and is an employee of FMR (2004-present). Before joining Fidelity Investments, Mr. Robins worked at KPMG LLP, where he was a partner in KPMG's department of professional practice (2002-2004) and a Senior Manager (1999-2000). In addition, Mr. Robins served as Assistant Chief Accountant, United States Securities and Exchange Commission (2000-2002). |
Robert G. Byrnes (40) |
| Year of Election or Appointment: 2006 Assistant Treasurer of VIP FundsManager Portfolio 20%, VIP FundsManager Portfolio 50%, VIP FundsManager Portfolio 70%, and VIP FundsManager Portfolio 85%. Mr. Byrnes also serves as Assistant Treasurer of other Fidelity funds (2005-present) and is an employee of FMR (2005-present). Previously, Mr. Byrnes served as Vice President of FPCMS (2003-2005). Before joining Fidelity Investments, Mr. Byrnes worked at Deutsche Asset Management where he served as Vice President of the Investment Operations Group (2000-2003). |
John H. Costello (60) |
| Year of Election or Appointment: 2006 Assistant Treasurer of VIP FundsManager Portfolio 20%, VIP FundsManager Portfolio 50%, VIP FundsManager Portfolio 70%, and VIP FundsManager Portfolio 85%. Mr. Costello also serves as Assistant Treasurer of other Fidelity funds and is an employee of FMR. |
Peter L. Lydecker (52) |
| Year of Election or Appointment: 2006 Assistant Treasurer of VIP FundsManager Portfolio 20%, VIP FundsManager Portfolio 50%, VIP FundsManager Portfolio 70%, and VIP FundsManager Portfolio 85%. Mr. Lydecker also serves as Assistant Treasurer of other Fidelity funds (2004) and is an employee of FMR. |
Mark Osterheld (51) |
| Year of Election or Appointment: 2006 Assistant Treasurer of VIP FundsManager Portfolio 20%, VIP FundsManager Portfolio 50%, VIP FundsManager Portfolio 70%, and VIP FundsManager Portfolio 85%. Mr. Osterheld also serves as Assistant Treasurer of other Fidelity funds (2002) and is an employee of FMR. |
Gary W. Ryan (48) |
| Year of Election or Appointment: 2006 Assistant Treasurer of VIP FundsManager Portfolio 20%, VIP FundsManager Portfolio 50%, VIP FundsManager Portfolio 70%, and VIP FundsManager Portfolio 85%. Mr. Ryan also serves as Assistant Treasurer of other Fidelity funds (2005-present) and is an employee of FMR (2005-present). Previously, Mr. Ryan served as Vice President of Fund Reporting in FPCMS (1999-2005). |
Salvatore Schiavone (41) |
| Year of Election or Appointment: 2006 Assistant Treasurer of VIP FundsManager Portfolio 20%, VIP FundsManager Portfolio 50%, VIP FundsManager Portfolio 70%, and VIP FundsManager Portfolio 85%. Mr. Schiavone also serves as Assistant Treasurer of other Fidelity funds (2005-present) and is an employee of FMR (2005-present). Before joining Fidelity Investments, Mr. Schiavone worked at Deutsche Asset Management, where he most recently served as Assistant Treasurer (2003-2005) of the Scudder Funds and Vice President and Head of Fund Reporting (1996-2003). |
Annual Report
Distributions
The Board of Trustees of each fund voted to pay to shareholders of record at the opening of business on record date, the following distributions per share derived from capital gains realized from sales of portfolio securities, and dividends derived from net investment income:
VIP FundsManager 20% | Pay Date | Record Date | Capital Gains |
Service Class | 02/09/07 | 02/09/07 | $.05 |
Service Class 2 | 02/09/07 | 02/09/07 | $.05 |
Investor Class | 02/09/07 | 02/09/07 | $.05 |
VIP FundsManager 50% | Pay Date | Record Date | Capital Gains |
Service Class | 02/09/07 | 02/09/07 | $.15 |
Service Class 2 | 02/09/07 | 02/09/07 | $.15 |
Investor Class | 02/09/07 | 02/09/07 | $.15 |
VIP FundsManager 70% | Pay Date | Record Date | Capital Gains |
Service Class | 02/09/07 | 02/09/07 | $.15 |
Service Class 2 | 02/09/07 | 02/09/07 | $.15 |
Investor Class | 02/09/07 | 02/09/07 | $.15 |
VIP FundsManager 85% | Pay Date | Record Date | Capital Gains |
Service Class | 02/09/07 | 02/09/07 | $.205 |
Service Class 2 | 02/09/07 | 02/09/07 | $.205 |
Investor Class | 02/09/07 | 02/09/07 | $.205 |
The funds hereby designate as capital gain dividend the amounts noted below for the taxable year ended December 31, 2006, or, if subsequently determined to be different, the net capital gain of such year.
Fund | |
VIP FundsManager 20% | $ 103,249 |
VIP FundsManager 50% | $ 1,837,441 |
VIP FundsManager 70% | $ 2,906,528 |
VIP FundsManager 85% | $ 1,489,936 |
A percentage of the dividends distributed during the fiscal year for the following funds was derived from interest on U.S. Government securities which is generally exempt from state income tax:
VIP FundsManager 20% | |
Service Class | 2.39% |
Service Class 2 | 2.39% |
Investor Class | 2.39% |
A percentage of the dividends distributed during the fiscal year for the following funds qualifies for the dividends-received deduction for corporate shareholders:
VIP FundsManager 20% | |
Service Class | 8% |
Service Class 2 | 8% |
Investor Class | 8% |
VIP FundsManager 50% | |
Service Class | 18% |
Service Class 2 | 19% |
Investor Class | 18% |
VIP FundsManager 70% | |
Service Class | 23% |
Service Class 2 | 24% |
Investor Class | 23% |
VIP FundsManager 85% | |
Service Class | 32% |
Service Class 2 | 35% |
Investor Class | 32% |
The fund will notify shareholders in January 2007 of amounts for use in preparing 2006 income tax returns.
VIP FundsManager Portfolio
Proxy Voting Results
A special meeting of each fund's shareholders was held on September 20, 2006. The results of votes taken among shareholders on the proposal before them are reported below. Each vote reported represents one dollar of net asset value held on the record date for the meeting.
PROPOSAL 1 |
To elect a Board of Trustees. A |
| # of
Votes | % of
Votes |
Dennis J. Dirks |
Affirmative | 92,459,317.52 | 96.102 |
Withheld | 3,749,837.05 | 3.898 |
TOTAL | 96,209,154.57 | 100.00 |
Albert R. Gamper, Jr. |
Affirmative | 92,260,598.99 | 95.896 |
Withheld | 3,948,555.58 | 4.104 |
TOTAL | 96,209,154.57 | 100.000 |
Robert M. Gates |
Affirmative | 92,315,480.72 | 95.953 |
Withheld | 3,893,673.85 | 4.047 |
TOTAL | 96,209,154.57 | 100.000 |
George H. Heilmeier |
Affirmative | 92,208,255.41 | 95.841 |
Withheld | 4,000,899.16 | 4.159 |
TOTAL | 96,209,154.57 | 100.000 |
Edward C. Johnson 3d |
Affirmative | 91,928,267.76 | 95.550 |
Withheld | 4,280,886.81 | 4.450 |
TOTAL | 96,209,154.57 | 100.000 |
Stephen P. Jonas |
Affirmative | 92,457,628.76 | 96.101 |
Withheld | 3,751,525.81 | 3.899 |
TOTAL | 96,209,154.57 | 100.000 |
James H. KeyesB |
Affirmative | 92,432,729.82 | 96.075 |
Withheld | 3,776,424.75 | 3.925 |
TOTAL | 96,209,154.57 | 100.000 |
| # of
Votes | % of
Votes |
Marie L. Knowles |
Affirmative | 92,398,847.52 | 96.040 |
Withheld | 3,810,307.05 | 3.960 |
TOTAL | 96,209,154.57 | 100.000 |
Ned C. Lautenbach |
Affirmative | 92,423,184.47 | 96.065 |
Withheld | 3,785,970.10 | 3.935 |
TOTAL | 96,209,154.57 | 100.000 |
William O. McCoy |
Affirmative | 92,086,293.90 | 95.715 |
Withheld | 4,122,860.67 | 4.285 |
TOTAL | 96,209,154.57 | 100.000 |
Robert L. Reynolds |
Affirmative | 92,439,032.86 | 96.081 |
Withheld | 3,770,121.71 | 3.919 |
TOTAL | 96,209,154.57 | 100.000 |
Cornelia M. Small |
Affirmative | 92,415,567.29 | 96.057 |
Withheld | 3,793,587.28 | 3.943 |
TOTAL | 96,209,154.57 | 100.000 |
William S. Stavropoulos |
Affirmative | 92,135,400.08 | 95.766 |
Withheld | 4,073,754.49 | 4.234 |
TOTAL | 96,209,154.57 | 100.000 |
Kenneth L. Wolfe |
Affirmative | 92,445,865.31 | 96.088 |
Withheld | 3,763,289.26 | 3.912 |
TOTAL | 96,209,154.57 | 100.000 |
Abstain | 100,000,000.00 | 00.000 |
A Denotes trust-wide proposal and voting results. B Effective on or about January 1, 2007. |
Annual Report
Investment Adviser
Strategic Advisers, Inc.
Boston, MA
General Distributor
Fidelity Distributors Corporation
Boston, MA
Transfer and Service Agents
Fidelity Investments Institutional Operations Company, Inc.
Boston, MA
Fidelity Service Company, Inc.
Boston, MA
Custodian
The Bank of New York
New York, NY
VIPFM-ANN-0207
1.843208.100
Fidelity® Variable Insurance Products:
Growth Stock Portfolio
Annual Report
December 31, 2006
(2_fidelity_logos) (Registered_Trademark)
Contents
Performance | <Click Here> | How the fund has done over time. |
Management's Discussion | <Click Here> | The manager's review of fund performance, strategy and outlook. |
Shareholder Expense Example | <Click Here> | An example of shareholder expenses. |
Investment Changes | <Click Here> | A summary of major shifts in the fund's investments over the past six months. |
Investments | <Click Here> | A complete list of the fund's investments with their
market values. |
Financial Statements | <Click Here> | Statements of assets and liabilities, operations, and
changes in net assets, as well as financial highlights. |
Notes | <Click Here> | Notes to the financial statements. |
Report of Independent Registered Public Accounting Firm | <Click Here> | |
Trustees and Officers | <Click Here> | |
Distributions | <Click Here> | |
Proxy Voting Results | <Click Here> | |
Board Approval of Investment Advisory Contracts and Management Fees | <Click Here> | |
| | |
To view a fund's proxy voting guidelines and proxy voting record for the 12-month period ended June 30, visit www.fidelity.com/proxyvotingresults or visit the Securities and Exchange Commission's (SEC) web site at www.sec.gov. You may also call 1-877-208-0098 to request a free copy of the proxy voting guidelines.
Fidelity Variable Insurance Products are separate account options which are purchased through a variable insurance contract.
Standard & Poor's, S&P and S&P 500 are registered service marks of The McGraw-Hill Companies, Inc. and have been licensed for use by Fidelity Distributors Corporation.
Other third party marks appearing herein are the property of their respective owners.
All other marks appearing herein are registered or unregistered trademarks or service marks of FMR Corp. or an affiliated company.
This report and the financial statements contained herein are submitted for the general information of the shareholders of the fund. This report is not authorized for distribution to prospective investors in the fund unless preceded or accompanied by an effective prospectus.
A fund files its complete schedule of portfolio holdings with the SEC for the first and third quarters of each fiscal year on Form N-Q. Forms N-Q are available on the SEC's web site at http://www.sec.gov. A fund's Forms N-Q may be reviewed and copied at the SEC's Public Reference Room in Washington, DC. Information regarding the operation of the SEC's Public Reference Room may be obtained by calling 1-800-SEC-0330. For a complete list of a fund's portfolio holdings, view the most recent quarterly holdings report, semiannual report, or annual report on Fidelity's web site at http://www.advisor.fidelity.com.
NOT FDIC INSURED · MAY LOSE VALUE · NO BANK GUARANTEE
Neither the fund nor Fidelity Distributors Corporation is a bank.
VIP Growth Stock Portfolio
VIP Growth Stock Portfolio
Performance: The Bottom Line
Average annual total return reflects the change in the value of an investment, assuming reinvestment of the class' dividend income and capital gains (the profits earned upon the sale of securities that have grown in value) and assuming a constant rate of performance each year. During periods of reimbursement by Fidelity, a fund's total return will be greater than it would be had the reimbursement not occurred. Performance numbers are net of all underlying fund operating expenses, but do not include any insurance charges imposed by your insurance company's separate account. If performance information included the effect of these additional charges, the total returns would have been lower. How a fund did yesterday is no guarantee of how it will do tomorrow.
Average Annual Total Returns
Periods ended December 31, 2006 | | Past 1
year | Life of
fund A |
VIP Growth Stock - Initial Class | | 1.12% | 8.46% |
VIP Growth Stock - Service Class B | | 1.01% | 8.35% |
VIP Growth Stock - Service Class 2 C | | 0.93% | 8.20% |
VIP Growth Stock - Investor Class D | | 0.95% | 8.41% |
A From December 11, 2002
B Performance for Service Class shares reflects an asset-based service fee (12b-1 fee).
C Performance for Service Class 2 shares reflects an asset-based service fee (12b-1 fee).
D The initial offering of Investor Class shares took place on July 21, 2005. Returns prior to July 21, 2005 are those of Initial Class. If Investor Class's transfer agent fee had been reflected, returns prior to July 21, 2005 would have been lower.
$10,000 Over Life of Fund
Let's say hypothetically that $10,000 was invested in VIP Growth Stock Portfolio - Initial Class on December 11, 2002, when the fund started. The chart shows how the value of your investment would have changed, and also shows how the Russell 1000® Growth Index performed over the same period.
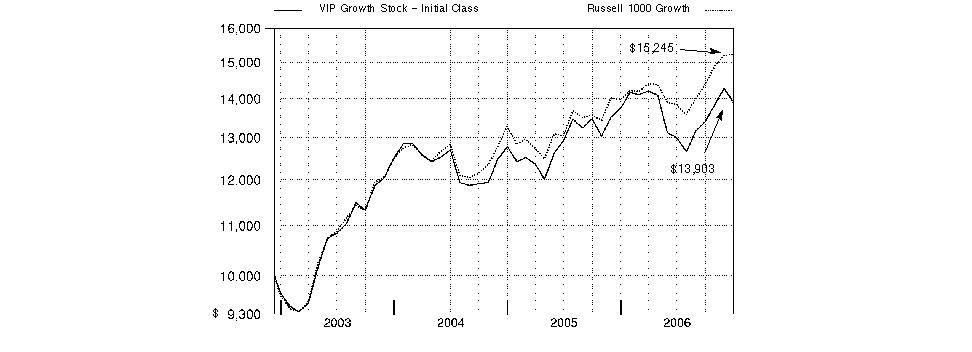
Annual Report
VIP Growth Stock Portfolio
Management's Discussion of Fund Performance
Comments from Brian Hanson, Portfolio Manager of VIP Growth Stock Fund
U.S. stock markets registered their fourth consecutive year of positive returns in 2006. Among the highlights were the performances of the Dow Jones Industrial AverageSM - a gauge of 30 mega-cap, blue-chip stocks - and the small-cap-oriented Russell 2000® Index, both of which reached new highs. The efforts of the Federal Reserve Board to contain inflation levels also dominated the investment headlines. In all, the Fed hiked short-term interest rates four times, but held rates steady after its June 29 increase, finally pausing after 17 rate hikes over a two-year period. A slowing residential housing market and moderating oil prices - the latter of which hit a record closing high of $77 per barrel in July before falling sharply - also held economic growth in check. For the year overall, the Standard & Poor's 500SM Index was up 15.79%, the Dow advanced 19.05%, the Russell 2000 Index gained 18.37% and the NASDAQ Composite® Index rose 10.39%.
For the 12 months ending December 31, 2006, the fund lagged the Russell 1000® Growth Index, which rose 9.07%. (For specific portfolio performance results, please refer to the performance section of this report.) Unproductive stock selection was the biggest drag on performance relative to the index, with the most pronounced effects in the information technology sector, especially in the tech hardware/equipment and software/services groups. Inopportune stock picking and an underweighting in the financials sector also hurt, as did a big underweighting and poor stock selection in the capital goods segment of the industrials sector. Weak stock picking in health care held back performance as well. The fund's biggest detractors included electronic contract manufacturer Jabil Circuit, radio frequency identification firm Intermec and Internet portal Yahoo. Conversely, the fund benefited from good stock selection and an overweighting in the strong performing telecommunication services sector, as well as from favorable positioning in energy. Among its best performers were Apple Computer, global energy services firm Halliburton and Cbeyond, a fast-growing provider of data and voice services for small business. The latter two positions were sold to lock in their profits.
The views expressed above reflect those of the portfolio manager(s) only through the end of the period as stated on the cover of this report and do not necessarily represent the views of Fidelity or any other person in the Fidelity organization. Any such views are subject to change at any time based upon market or other conditions and Fidelity disclaims any responsibility to update such views. These views may not be relied on as investment advice and, because investment decisions for a Fidelity fund are based on numerous factors, may not be relied on as an indication of trading intent on behalf of any Fidelity fund.
VIP Growth Stock Portfolio
VIP Growth Stock Portfolio
Shareholder Expense Example
As a shareholder of the Fund, you incur two types of costs: (1) transaction costs, and (2) ongoing costs, including management fees, distribution and/or service (12b-1) fees and other Fund expenses. This Example is intended to help you understand your ongoing costs (in dollars) of investing in the Fund and to compare these costs with the ongoing costs of investing in other mutual funds.
The Example is based on an investment of $1,000 invested at the beginning of the period and held for the entire period (July 1, 2006 to December 31, 2006).
Actual Expenses
The first line of the accompanying table for each class of the Fund provides information about actual account values and actual expenses. You may use the information in this line, together with the amount you invested, to estimate the expenses that you paid over the period. Simply divide your account value by $1,000.00 (for example, an $8,600 account value divided by $1,000.00 = 8.6), then multiply the result by the number in the first line for a class of the Fund under the heading entitled "Expenses Paid During Period" to estimate the expenses you paid on your account during this period. The estimate of expenses does not include any fees or other expenses of any variable annuity or variable life insurance product. If they were, the estimate of expenses you paid during the period would be higher, and your ending account value would be lower.
Hypothetical Example for Comparison Purposes
The second line of the accompanying table for each class of the Fund provides information about hypothetical account values and hypothetical expenses based on a Class' actual expense ratio and an assumed rate of return of 5% per year before expenses, which is not the Class' actual return. The hypothetical account values and expenses may not be used to estimate the actual ending account balance or expenses you paid for the period. You may use this information to compare the ongoing costs of investing in the Fund and other funds. To do so, compare this 5% hypothetical example with the 5% hypothetical examples that appear in the shareholder reports of the other funds. The estimate of expenses does not include any fees or other expenses of any variable annuity or variable life insurance product. If they were, the estimate of expenses you paid during the period would be higher, and your ending account value would be lower.
Please note that the expenses shown in the table are meant to highlight your ongoing costs only and do not reflect any transaction costs. Therefore, the second line of the table is useful in comparing ongoing costs only, and will not help you determine the relative total costs of owning different funds.
| Beginning
Account Value
July 1, 2006 | Ending
Account Value
December 31, 2006 | Expenses Paid
During Period*
July 1, 2006
to December 31, 2006 |
Initial Class | | | |
Actual | $ 1,000.00 | $ 1,068.10 | $ 4.48 |
HypotheticalA | $ 1,000.00 | $ 1,020.87 | $ 4.38 |
Service Class | | | |
Actual | $ 1,000.00 | $ 1,067.50 | $ 5.00 |
HypotheticalA | $ 1,000.00 | $ 1,020.37 | $ 4.89 |
Service Class 2 | | | |
Actual | $ 1,000.00 | $ 1,067.00 | $ 5.78 |
HypotheticalA | $ 1,000.00 | $ 1,019.61 | $ 5.65 |
Investor Class | | | |
Actual | $ 1,000.00 | $ 1,067.30 | $ 5.26 |
HypotheticalA | $ 1,000.00 | $ 1,020.11 | $ 5.14 |
A 5% return per year before expenses
* Expenses are equal to each Class' annualized expense ratio (shown in the table below); multiplied by the average account value over the period, multiplied by 184/365 (to reflect the one-half year period).
| Annualized
Expense Ratio |
Initial Class | .86% |
Service Class | .96% |
Service Class 2 | 1.11% |
Investor Class | 1.01% |
Annual Report
VIP Growth Stock Portfolio
Investment Changes
Top Ten Stocks as of December 31, 2006 |
| % of fund's
net assets | % of fund's net assets
6 months ago |
Apple Computer, Inc. | 5.4 | 4.5 |
Jabil Circuit, Inc. | 5.4 | 2.0 |
Nastech Pharmaceutical Co., Inc. | 4.6 | 4.7 |
Johnson & Johnson | 2.5 | 3.8 |
General Electric Co. | 2.3 | 2.9 |
Avon Products, Inc. | 2.3 | 3.5 |
Best Buy Co., Inc. | 2.1 | 3.7 |
Microsoft Corp. | 2.1 | 1.2 |
Colgate-Palmolive Co. | 2.0 | 3.6 |
Cisco Systems, Inc. | 2.0 | 1.5 |
| 30.7 | |
Top Five Market Sectors as of December 31, 2006 |
| % of fund's
net assets | % of fund's net assets
6 months ago |
Information Technology | 42.2 | 36.0 |
Health Care | 21.2 | 21.0 |
Consumer Staples | 9.8 | 12.8 |
Industrials | 8.3 | 8.4 |
Consumer Discretionary | 6.3 | 9.6 |
Asset Allocation (% of fund's net assets) |
As of December 31, 2006 * | As of June 30, 2006 ** |
 | Stocks 99.1% | | | Stocks 98.2% | |
 | Short-Term
Investments and
Net Other Assets 0.9% | | | Short-Term
Investments and
Net Other Assets 1.8% | |
* Foreign investments | 13.4% | | ** Foreign investments | 12.1% | |

VIP Growth Stock Portfolio
VIP Growth Stock Portfolio
Investments December 31, 2006
Showing Percentage of Net Assets
Common Stocks - 99.1% |
| Shares | | Value (Note 1) |
CONSUMER DISCRETIONARY - 6.3% |
Media - 1.8% |
McGraw-Hill Companies, Inc. | 1,700 | | $ 115,634 |
News Corp. Class B | 8,300 | | 184,758 |
| | 300,392 |
Specialty Retail - 4.5% |
Best Buy Co., Inc. | 7,050 | | 346,790 |
Home Depot, Inc. | 4,500 | | 180,720 |
Staples, Inc. | 8,000 | | 213,600 |
| | 741,110 |
TOTAL CONSUMER DISCRETIONARY | | 1,041,502 |
CONSUMER STAPLES - 9.8% |
Beverages - 1.5% |
PepsiCo, Inc. | 3,900 | | 243,945 |
Food & Staples Retailing - 1.6% |
Safeway, Inc. | 1,800 | | 62,208 |
Walgreen Co. | 4,300 | | 197,327 |
| | 259,535 |
Food Products - 1.5% |
Bunge Ltd. | 600 | | 43,506 |
Cosan SA Industria E Comercio (a) | 2,100 | | 43,199 |
Global Bio-Chem Technology Group Co. Ltd. | 112,000 | | 37,725 |
Nestle SA sponsored ADR | 1,000 | | 89,000 |
Tyson Foods, Inc. Class A | 2,700 | | 44,415 |
| | 257,845 |
Household Products - 2.9% |
Colgate-Palmolive Co. | 5,200 | | 339,248 |
Procter & Gamble Co. | 2,300 | | 147,821 |
| | 487,069 |
Personal Products - 2.3% |
Avon Products, Inc. | 11,500 | | 379,960 |
TOTAL CONSUMER STAPLES | | 1,628,354 |
ENERGY - 5.5% |
Energy Equipment & Services - 2.6% |
GlobalSantaFe Corp. | 1,500 | | 88,170 |
National Oilwell Varco, Inc. (a) | 2,703 | | 165,370 |
Schlumberger Ltd. (NY Shares) | 2,700 | | 170,532 |
| | 424,072 |
Oil, Gas & Consumable Fuels - 2.9% |
D1 Oils PLC (a) | 8,500 | | 28,218 |
Tesoro Corp. | 1,500 | | 98,655 |
|
| Shares | | Value (Note 1) |
Ultra Petroleum Corp. (a) | 2,500 | | $ 119,375 |
Valero Energy Corp. | 4,700 | | 240,452 |
| | 486,700 |
TOTAL ENERGY | | 910,772 |
FINANCIALS - 2.9% |
Capital Markets - 0.2% |
Harris & Harris Group, Inc. (a)(d) | 2,600 | | 31,434 |
Commercial Banks - 0.4% |
Mizuho Financial Group, Inc. | 10 | | 71,399 |
Consumer Finance - 0.9% |
American Express Co. | 2,500 | | 151,675 |
Insurance - 1.4% |
American International Group, Inc. | 3,200 | | 229,312 |
TOTAL FINANCIALS | | 483,820 |
HEALTH CARE - 21.2% |
Biotechnology - 3.0% |
Alexion Pharmaceuticals, Inc. (a) | 400 | | 16,156 |
Alkermes, Inc. (a) | 600 | | 8,022 |
Alnylam Pharmaceuticals, Inc. (a) | 7,200 | | 154,080 |
Amgen, Inc. (a) | 700 | | 47,817 |
Amylin Pharmaceuticals, Inc. (a) | 2,900 | | 104,603 |
Genentech, Inc. (a) | 900 | | 73,017 |
Telik, Inc. (a) | 3,700 | | 16,391 |
Theravance, Inc. (a) | 2,200 | | 67,958 |
| | 488,044 |
Health Care Equipment & Supplies - 3.1% |
Baxter International, Inc. | 2,500 | | 115,975 |
C.R. Bard, Inc. | 1,300 | | 107,861 |
Medtronic, Inc. | 2,300 | | 123,073 |
St. Jude Medical, Inc. (a) | 4,500 | | 164,520 |
| | 511,429 |
Health Care Providers & Services - 3.4% |
Acibadem Saglik Hizmetleri AS | 7,000 | | 75,168 |
McKesson Corp. | 4,900 | | 248,430 |
UnitedHealth Group, Inc. | 4,600 | | 247,158 |
| | 570,756 |
Life Sciences Tools & Services - 0.5% |
Ventana Medical Systems, Inc. (a) | 2,100 | | 90,363 |
Pharmaceuticals - 11.2% |
Johnson & Johnson | 6,400 | | 422,528 |
Merck & Co., Inc. | 2,900 | | 126,440 |
Nastech Pharmaceutical Co., Inc. (a)(d) | 50,100 | | 758,013 |
Novartis AG sponsored ADR | 2,800 | | 160,832 |
Schering-Plough Corp. | 7,800 | | 184,392 |
Wyeth | 4,000 | | 203,680 |
| | 1,855,885 |
TOTAL HEALTH CARE | | 3,516,477 |
Common Stocks - continued |
| Shares | | Value (Note 1) |
INDUSTRIALS - 8.3% |
Aerospace & Defense - 1.1% |
Honeywell International, Inc. | 4,200 | | $ 190,008 |
Construction & Engineering - 1.1% |
Fluor Corp. | 1,600 | | 130,640 |
Jacobs Engineering Group, Inc. (a) | 600 | | 48,924 |
| | 179,564 |
Electrical Equipment - 2.9% |
Energy Conversion Devices, Inc. (a) | 1,800 | | 61,164 |
Evergreen Solar, Inc. (a) | 9,400 | | 71,158 |
Q-Cells AG (a) | 4,400 | | 197,909 |
SolarWorld AG | 1,300 | | 81,694 |
Vestas Wind Systems AS (a) | 1,600 | | 67,629 |
| | 479,554 |
Industrial Conglomerates - 2.3% |
General Electric Co. | 10,400 | | 386,984 |
Machinery - 0.9% |
Deere & Co. | 1,500 | | 142,605 |
TOTAL INDUSTRIALS | | 1,378,715 |
INFORMATION TECHNOLOGY - 42.2% |
Communications Equipment - 6.8% |
AudioCodes Ltd. (a) | 18,900 | | 177,093 |
Cisco Systems, Inc. (a) | 12,300 | | 336,159 |
Harris Corp. | 6,900 | | 316,434 |
Juniper Networks, Inc. (a) | 10,900 | | 206,446 |
QUALCOMM, Inc. | 2,400 | | 90,696 |
| | 1,126,828 |
Computers & Peripherals - 10.5% |
Apple Computer, Inc. (a) | 10,600 | | 899,302 |
EMC Corp. (a) | 19,700 | | 260,040 |
Hewlett-Packard Co. | 2,000 | | 82,380 |
Intermec, Inc. (a) | 9,638 | | 233,914 |
Rackable Systems, Inc. (a)(d) | 5,900 | | 182,723 |
Sun Microsystems, Inc. (a) | 15,300 | | 82,926 |
| | 1,741,285 |
Electronic Equipment & Instruments - 6.4% |
Hon Hai Precision Industry Co. Ltd. (Foxconn) | 11,000 | | 78,487 |
Jabil Circuit, Inc. | 36,400 | | 893,620 |
Sunpower Corp. Class A (a)(d) | 2,400 | | 89,208 |
| | 1,061,315 |
|
| Shares | | Value (Note 1) |
Internet Software & Services - 4.9% |
Akamai Technologies, Inc. (a) | 1,700 | | $ 90,304 |
aQuantive, Inc. (a) | 5,900 | | 145,494 |
Google, Inc. Class A (sub. vtg.) (a) | 700 | | 322,336 |
ValueClick, Inc. (a) | 3,800 | | 89,794 |
Yahoo!, Inc. (a) | 5,900 | | 150,686 |
| | 798,614 |
Semiconductors & Semiconductor Equipment - 6.5% |
Cree, Inc. (a) | 700 | | 12,124 |
Cypress Semiconductor Corp. (a) | 14,100 | | 237,867 |
Intel Corp. | 6,200 | | 125,550 |
Marvell Technology Group Ltd. (a) | 8,400 | | 161,196 |
National Semiconductor Corp. | 3,600 | | 81,720 |
Renewable Energy Corp. AS | 10,450 | | 191,068 |
Teradyne, Inc. (a) | 17,900 | | 267,784 |
| | 1,077,309 |
Software - 7.1% |
Autodesk, Inc. (a) | 3,800 | | 153,748 |
Business Objects SA sponsored ADR (a) | 1,300 | | 51,285 |
Cognos, Inc. (a) | 2,100 | | 89,166 |
Hyperion Solutions Corp. (a) | 3,450 | | 123,993 |
Intuit, Inc. (a) | 2,500 | | 76,275 |
Microsoft Corp. | 11,500 | | 343,390 |
Nintendo Co. Ltd. | 400 | | 103,822 |
Oracle Corp. (a) | 13,500 | | 231,390 |
| | 1,173,069 |
TOTAL INFORMATION TECHNOLOGY | | 6,978,420 |
MATERIALS - 1.3% |
Chemicals - 0.7% |
Potash Corp. of Saskatchewan, Inc. | 600 | | 86,088 |
Tokuyama Corp. | 2,000 | | 30,441 |
| | 116,529 |
Metals & Mining - 0.6% |
Oregon Steel Mills, Inc. (a) | 1,500 | | 93,615 |
TOTAL MATERIALS | | 210,144 |
TELECOMMUNICATION SERVICES - 1.6% |
Diversified Telecommunication Services - 0.6% |
AT&T, Inc. | 2,600 | | 92,950 |
Wireless Telecommunication Services - 1.0% |
American Tower Corp. Class A (a) | 4,700 | | 175,216 |
TOTAL TELECOMMUNICATION SERVICES | | 268,166 |
TOTAL COMMON STOCKS (Cost $14,859,322) | 16,416,370 |
Money Market Funds - 2.7% |
| Shares | | Value (Note 1) |
Fidelity Cash Central Fund, 5.37% (b) | 177,653 | | $ 177,653 |
Fidelity Securities Lending Cash Central Fund, 5.38% (b)(c) | 265,340 | | 265,340 |
TOTAL MONEY MARKET FUNDS (Cost $442,993) | 442,993 |
TOTAL INVESTMENT PORTFOLIO - 101.8% (Cost $15,302,315) | 16,859,363 |
NET OTHER ASSETS - (1.8)% | | (298,447) |
NET ASSETS - 100% | $ 16,560,916 |
Legend |
(a) Non-income producing |
(b) Affiliated fund that is available only to investment companies and other accounts managed by Fidelity Investments. The rate quoted is the annualized seven-day yield of the fund at period end. A complete unaudited listing of the fund's holdings as of its most recent quarter end is available upon request. |
(c) Investment made with cash collateral received from securities on loan. |
(d) Security or a portion of the security is on loan at period end. |
Affiliated Central Funds |
Information regarding fiscal year to date income earned by the Fund from investments in Fidelity Central Funds is as follows: |
Fund | Income earned |
Fidelity Cash Central Fund | $ 25,622 |
Fidelity Securities Lending Cash Central Fund | 835 |
Total | $ 26,457 |
Other Information |
Distribution of investments by country of issue, as a percentage of total net assets, is as follows: |
United States of America | 86.6% |
Canada | 1.7% |
Germany | 1.7% |
Switzerland | 1.5% |
Bermuda | 1.3% |
Japan | 1.2% |
Norway | 1.1% |
Israel | 1.1% |
Netherlands Antilles | 1.0% |
Others (individually less than 1%) | 2.8% |
| 100.0% |
Income Tax Information |
At December 31, 2006, the fund had a capital loss carryforward of approximately $221,023 all of which will expire on December 31, 2013. |
See accompanying notes which are an integral part of the financial statements.
Annual Report
VIP Growth Stock Portfolio
Financial Statements
Statement of Assets and Liabilities
| December 31, 2006 |
| | |
Assets | | |
Investment in securities, at value
(including securities loaned
of $257,191) -
See accompanying schedule: Unaffiliated issuers (cost $14,859,322) | $ 16,416,370 | |
Fidelity Central Funds (cost $442,993) | 442,993 | |
Total Investments (cost $15,302,315) | | $ 16,859,363 |
Cash | | 6,105 |
Foreign currency held at value (cost $130) | | 130 |
Dividends receivable | | 14,268 |
Interest receivable | | 1,492 |
Prepaid expenses | | 137 |
Receivable from investment adviser for expense reductions | | 7,623 |
Other receivables | | 753 |
Total assets | | 16,889,871 |
| | |
Liabilities | | |
Accrued management fee | $ 7,833 | |
Distribution fees payable | 854 | |
Other affiliated payables | 1,851 | |
Other payables and accrued
expenses | 53,077 | |
Collateral on securities loaned, at value | 265,340 | |
Total liabilities | | 328,955 |
| | |
Net Assets | | $ 16,560,916 |
Net Assets consist of: | | |
Paid in capital | | $ 15,279,275 |
Accumulated undistributed net realized gain (loss) on investments and foreign currency transactions | | (275,407) |
Net unrealized appreciation
(depreciation) on investments | | 1,557,048 |
Net Assets | | $ 16,560,916 |
Statement of Assets and Liabilities - continued
| December 31, 2006 |
| | |
Initial Class:
Net Asset Value, offering price and redemption price per share ($7,414,448 ÷ 614,112 shares) | | $ 12.07 |
| | |
Service Class:
Net Asset Value, offering price and redemption price per share ($2,077,354 ÷ 172,770 shares) | | $ 12.02 |
| | |
Service Class 2:
Net Asset Value, offering price and redemption price per share ($3,219,984 ÷ 269,512 shares) | | $ 11.95 |
| | |
Investor Class:
Net Asset Value, offering price and redemption price per share ($3,849,130 ÷ 319,426 shares) | | $ 12.05 |
See accompanying notes which are an integral part of the financial statements.
VIP Growth Stock Portfolio
Statement of Operations
| Year ended December 31, 2006 |
| | |
Investment Income | | |
Dividends | | $ 194,734 |
Interest | | 130 |
Income from Fidelity Central Funds | | 26,457 |
Total income | | 221,321 |
| | |
Expenses | | |
Management fee | $ 141,829 | |
Transfer agent fees | 25,840 | |
Distribution fees | 9,203 | |
Accounting and security lending fees | 10,359 | |
Custodian fees and expenses | 23,821 | |
Independent trustees' compensation | 98 | |
Audit | 48,991 | |
Legal | 2,634 | |
Interest | 2,759 | |
Miscellaneous | 3,766 | |
Total expenses before reductions | 269,300 | |
Expense reductions | (40,216) | 229,084 |
Net investment income (loss) | | (7,763) |
Realized and Unrealized Gain (Loss) Net realized gain (loss) on: | | |
Investment securities: | | |
Unaffiliated issuers | (2,579) | |
Foreign currency transactions | (2,693) | |
Total net realized gain (loss) | | (5,272) |
Change in net unrealized appreciation (depreciation) on investment securities | | (328,011) |
Net gain (loss) | | (333,283) |
Net increase (decrease) in net assets resulting from operations | | $ (341,046) |
Statement of Changes in Net Assets
| Year ended
December 31,
2006 | Year ended
December 31,
2005 |
Increase (Decrease) in Net Assets | | |
Operations | | |
Net investment income (loss) | $ (7,763) | $ 8,759 |
Net realized gain (loss) | (5,272) | (234,347) |
Change in net unrealized appreciation (depreciation) | (328,011) | 1,334,662 |
Net increase (decrease) in net assets resulting from operations | (341,046) | 1,109,074 |
Distributions to shareholders from net investment income | (7,983) | (2,878) |
Distributions to shareholders from net realized gain | - | (20,148) |
Total distributions | (7,983) | (23,026) |
Share transactions - net increase (decrease) | (12,833,989) | 22,262,603 |
Total increase (decrease) in net assets | (13,183,018) | 23,348,651 |
| | |
Net Assets | | |
Beginning of period | 29,743,934 | 6,395,283 |
End of period (including undistributed net investment income of $0 and undistributed net investment income of
$6,332, respectively) | $ 16,560,916 | $ 29,743,934 |
See accompanying notes which are an integral part of the financial statements.
Annual Report
Financial Highlights - Initial Class
Years ended December 31, | 2006 | 2005 | 2004 | 2003 | 2002 J |
Selected Per-Share Data | | | | | |
Net asset value, beginning of period | $ 11.94 | $ 11.14 | $ 11.79 | $ 9.68 | $ 10.00 |
Income from Investment Operations | | | | | |
Net investment income (loss) E | - L | .01 | .04 H | (.01) | - L |
Net realized and unrealized gain (loss) | .13 I | .83 | .23 | 2.81 | (.32) |
Total from investment operations | .13 | .84 | .27 | 2.80 | (.32) |
Distributions from net investment income | - L | (.01) | (.02) | (.01) | - |
Distributions from net realized gain | - | (.04) | (.90) | (.68) | - |
Total distributions | - | (.04) M | (.92) | (.69) | - |
Net asset value, end of period | $ 12.07 | $ 11.94 | $ 11.14 | $ 11.79 | $ 9.68 |
B, C, D | 1.12% | 7.57% | 2.31% | 29.05% | (3.20)% |
Ratios to Average Net Assets F, K | | | | | |
Expenses before reductions | .98% | 1.01% | 1.94% | 2.68% | 9.76% A |
Expenses net of fee waivers, if any | .86% | .85% | 1.00% | 1.14% | 1.25% A |
Expenses net of all reductions | .86% | .81% | .95% | 1.09% | 1.22% A |
Net investment income (loss) | .03% | .12% | .35% | (.07)% | .35% A |
Supplemental Data | | | | | |
Net assets, end of period (000 omitted) | $ 7,414 | $ 22,750 | $ 1,938 | $ 1,885 | $ 1,452 |
Portfolio turnover rate G | 93% | 91% | 151% | 149% | 108% A |
A Annualized
B Total returns for periods of less than one year are not annualized.
C Total returns do not reflect charges attributable to your insurance company's separate account. Inclusion of these charges would reduce the total returns shown.
D Total returns would have been lower had certain expenses not been reduced during the periods shown.
E Calculated based on average shares outstanding during the period.
F Fees and expenses of the underlying Fidelity Central Funds are not included in the Fund's expense ratio. The Fund indirectly bears its proportionate share of the expenses of any underlying Fidelity Central Funds.
G Amount does not include the portfolio activity of any underlying Fidelity Central Funds.
H Investment income per share reflects a special dividend which amounted to $.05 per share.
I The amount shown for a share outstanding does not correspond with the aggregate net gain (loss) on investments for the period due to the timing of sales and repurchases of shares in relation to fluctuating market values of the investments of the Fund.
J For the period December 11, 2002 (commencement of operations) to December 31, 2002.
K Expense ratios reflect operating expenses of the class. Expenses before reductions do not reflect amounts reimbursed by the investment adviser or reductions from brokerage service arrangements or other expense offset arrangements and do not represent the amount paid by the class during periods when reimbursements or reductions occur. Expense ratios before reductions for start-up periods may not be representative of longer-term operating periods. Expenses net of fee waivers reflect expenses after reimbursement by the investment adviser but prior to reductions from brokerage service arrangements or other expense offset arrangements. Expenses net of all reductions represent the net expenses paid by the class.
L Amount represents less than $.01 per share.
M Total distribution of $.040 per share is comprised of distributions from net investment income of $.005 and distributions from net realized gain of $.035 per share.
Financial Highlights - Service Class
Years ended December 31, | 2006 | 2005 | 2004 | 2003 | 2002 J |
Selected Per-Share Data | | | | | |
Net asset value, beginning of period | $ 11.90 | $ 11.12 | $ 11.77 | $ 9.68 | $ 10.00 |
Income from Investment Operations | | | | | |
Net investment income (loss) E | (.01) | - | .03 H | (.02) | - L |
Net realized and unrealized gain (loss) | .13 I | .82 | .24 | 2.80 | (.32) |
Total from investment operations | .12 | .82 | .27 | 2.78 | (.32) |
Distributions from net investment income | - | (.01) | (.02) | (.01) | - |
Distributions from net realized gain | - | (.04) | (.90) | (.68) | - |
Total distributions | - | (.04) M | (.92) | (.69) | - |
Net asset value, end of period | $ 12.02 | $ 11.90 | $ 11.12 | $ 11.77 | $ 9.68 |
Total Return B, C, D | 1.01% | 7.41% | 2.32% | 28.85% | (3.20)% |
Ratios to Average Net Assets F, K | | | | | |
Expenses before reductions | 1.16% | 1.36% | 1.97% | 2.74% | 9.86% A |
Expenses net of fee waivers, if any | .96% | .97% | 1.10% | 1.24% | 1.35% A |
Expenses net of all reductions | .95% | .92% | 1.05% | 1.19% | 1.32% A |
Net investment income (loss) | (.07)% | -% | .25% | (.17)% | .25% A |
Supplemental Data | | | | | |
Net assets, end of period (000 omitted) | $ 2,077 | $ 2,056 | $ 1,914 | $ 1,871 | $ 1,452 |
Portfolio turnover rate G | 93% | 91% | 151% | 149% | 108% A |
A Annualized
B Total returns for periods of less than one year are not annualized.
C Total returns do not reflect charges attributable to your insurance company's separate account. Inclusion of these charges would reduce the total returns shown.
D Total returns would have been lower had certain expenses not been reduced during the periods shown.
E Calculated based on average shares outstanding during the period.
F Fees and expenses of the underlying Fidelity Central Funds are not included in the Fund's expense ratio. The Fund indirectly bears its proportionate share of the expenses of any underlying Fidelity Central Funds.
G Amount does not include the portfolio activity of any underlying Fidelity Central Funds.
H Investment income per share reflects a special dividend which amounted to $.05 per share.
I The amount shown for a share outstanding does not correspond with the aggregate net gain (loss) on investments for the period due to the timing of sales and repurchases of shares in relation to fluctuating market values of the investments of the Fund.
J For the period December 11, 2002 (commencement of operations) to December 31, 2002.
K Expense ratios reflect operating expenses of the class. Expenses before reductions do not reflect amounts reimbursed by the investment adviser or reductions from brokerage service arrangements or other expense offset arrangements and do not represent the amount paid by the class during periods when reimbursements or reductions occur. Expense ratios before reductions for start-up periods may not be representative of longer-term operating periods. Expenses net of fee waivers reflect expenses after reimbursement by the investment adviser but prior to reductions from brokerage service arrangements or other expense offset arrangements. Expenses net of all reductions represent the net expenses paid by the class.
L Amount represents less than $.01 per share.
M Total distribution of $.040 per share is comprised of distributions from net investment income of $.005 and distributions from net realized gain of $.035 per share.
See accompanying notes which are an integral part of the financial statements.
VIP Growth Stock Portfolio
Financial Highlights - Service Class 2
Years ended December 31, | 2006 | 2005 | 2004 | 2003 | 2002 J |
Selected Per-Share Data | | | | | |
Net asset value, beginning of period | $ 11.84 | $ 11.08 | $ 11.75 | $ 9.68 | $ 10.00 |
Income from Investment Operations | | | | | |
Net investment income (loss) E | (.03) | (.02) | .01 H | (.04) | - L |
Net realized and unrealized gain (loss) | .14 I | .82 | .24 | 2.80 | (.32) |
Total from investment operations | .11 | .80 | .25 | 2.76 | (.32) |
Distributions from net investment income | - | (.01) | (.02) | (.01) | - |
Distributions from net realized gain | - | (.04) | (.90) | (.68) | - |
Total distributions | - | (.04) M | (.92) | (.69) | - |
Net asset value, end of period | $ 11.95 | $ 11.84 | $ 11.08 | $ 11.75 | $ 9.68 |
Total Return B, C, D | .93% | 7.25% | 2.14% | 28.64% | (3.20)% |
Ratios to Average Net Assets F, K | | | | | |
Expenses before reductions | 1.35% | 1.51% | 2.12% | 2.89% | 10.01% A |
Expenses net of fee waivers, if any | 1.11% | 1.12% | 1.25% | 1.39% | 1.50% A |
Expenses net of all reductions | 1.10% | 1.07% | 1.20% | 1.34% | 1.47% A |
Net investment income (loss) | (.22)% | (.15)% | .10% | (.33)% | .10% A |
Supplemental Data | | | | | |
Net assets, end of period (000 omitted) | $ 3,220 | $ 2,729 | $ 2,544 | $ 2,491 | $ 1,936 |
Portfolio turnover rate G | 93% | 91% | 151% | 149% | 108% A |
A Annualized
B Total returns for periods of less than one year are not annualized.
C Total returns do not reflect charges attributable to your insurance company's separate account. Inclusion of these charges would reduce the total returns shown.
D Total returns would have been lower had certain expenses not been reduced during the periods shown.
E Calculated based on average shares outstanding during the period.
F Fees and expenses of the underlying Fidelity Central Funds are not included in the Fund's expense ratio. The Fund indirectly bears its proportionate share of the expenses of any underlying Fidelity Central Funds.
G Amount does not include the portfolio activity of any underlying Fidelity Central Funds.
H Investment income per share reflects a special dividend which amounted to $.05 per share.
I The amount shown for a share outstanding does not correspond with the aggregate net gain (loss) on investments for the period due to the timing of sales and repurchases of shares in relation to fluctuating market values of the investments of the Fund.
J For the period December 11, 2002 (commencement of operations) to December 31, 2002.
K Expense ratios reflect operating expenses of the class. Expenses before reductions do not reflect amounts reimbursed by the investment adviser or reductions from brokerage service arrangements or other expense offset arrangements and do not represent the amount paid by the class during periods when reimbursements or reductions occur. Expense ratios before reductions for start-up periods may not be representative of longer-term operating periods. Expenses net of fee waivers reflect expenses after reimbursement by the investment adviser but prior to reductions from brokerage service arrangements or other expense offset arrangements. Expenses net of all reductions represent the net expenses paid by the class.
L Amount represents less than $.01 per share.
M Total distribution of $.040 per share is comprised of distributions from net investment income of $.005 and distributions from net realized gain of $.035 per share.
Financial Highlights - Investor Class
Years ended December 31, | 2006 | 2005 I |
Selected Per-Share Data | | |
Net asset value, beginning of period | $ 11.94 | $ 11.64 |
Income from Investment Operations | | |
Net investment income (loss) E | (.01) | - K |
Net realized and unrealized gain (loss) | .12 H | .30 |
Total from investment operations | .11 | .30 |
Distribution from net investment income | - K | - |
Net asset value, end of period | $ 12.05 | $ 11.94 |
Total Return B, C, D | .95% | 2.58% |
Ratios to Average Net Assets F, J | | |
Expenses before reductions | 1.21% | 1.16% A |
Expenses net of fee waivers, if any | 1.01% | 1.00% A |
Expenses net of all reductions | 1.01% | .96% A |
Net investment income (loss) | (.12)% | (.03)% A |
Supplemental Data | | |
Net assets, end of period (000 omitted) | $ 3,849 | $ 2,209 |
Portfolio turnover rate G | 93% | 91% |
A Annualized
B Total returns for periods of less than one year are not annualized.
C Total returns do not reflect charges attributable to your insurance company's separate account. Inclusion of these charges would reduce the total returns shown.
D Total returns would have been lower had certain expenses not been reduced during the periods shown.
E Calculated based on average shares outstanding during the period.
F Fees and expenses of the underlying Fidelity Central Funds are not included in the Fund's expense ratio. The Fund indirectly bears its proportionate share of the expenses of any underlying Fidelity Central Funds.
G Amount does not include the portfolio activity of any underlying Fidelity Central Funds.
H The amount shown for a share outstanding does not correspond with the aggregate net gain (loss) on investments for the period due to the timing of sales and repurchases of shares in relation to fluctuating market values of the investments of the Fund.
I For the period July 21, 2005 (commencement of sale of shares) to December 31, 2005.
J Expense ratios reflect operating expenses of the class. Expenses before reductions do not reflect amounts reimbursed by the investment adviser or reductions from brokerage service arrangements or other expense offset arrangements and do not represent the amount paid by the class during periods when reimbursements or reductions occur. Expense ratios before reductions for start-up periods may not be representative of longer-term operating periods. Expenses net of fee waivers reflect expenses after reimbursement by the investment adviser but prior to reductions from brokerage service arrangements or other expense offset arrangements. Expenses net of all reductions represent the net expenses paid by the class.
K Amount represents less than $.01 per share.
See accompanying notes which are an integral part of the financial statements.
Annual Report
Notes to Financial Statements
For the period ended December 31, 2006
1. Significant Accounting Policies.
VIP Growth Stock Portfolio (the Fund) is a fund of Variable Insurance Products Fund IV (the trust) and is authorized to issue an unlimited number of shares. The trust is registered under the Investment Company Act of 1940, as amended (the 1940 Act), as an open-end management investment company organized as a Massachusetts business trust. Shares of the Fund may only be purchased by insurance companies for the purpose of funding variable annuity or variable life insurance contracts. The Fund offers the following classes of shares: Initial Class shares, Service Class shares, Service Class 2 shares, and Investor Class shares. All classes have equal rights and voting privileges, except for matters affecting a single class. Investment income, realized and unrealized capital gains and losses, the common expenses of the Fund, and certain fund-level expense reductions, if any, are allocated on a pro rata basis to each class based on the relative net assets of each class to the total net assets of the Fund. Each class differs with respect to transfer agent and distribution and service plan fees incurred. Certain expense reductions also differ by class.
The Fund may invest in Fidelity Central Funds which are open-end investment companies available to investment companies and other accounts managed by Fidelity Management & Research Company (FMR) and its affiliates. The financial statements have been prepared in conformity with accounting principles generally accepted in the United States of America, which require management to make certain estimates and assumptions at the date of the financial statements. The following summarizes the significant accounting policies of the Fund, which are also consistently followed by the Fidelity Central Funds:
Security Valuation. Investments are valued and net asset value (NAV) per share is calculated (NAV calculation) as of the close of business of the New York Stock Exchange (NYSE), normally 4:00 p.m. Eastern time. Wherever possible, the Fund uses independent pricing services approved by the Board of Trustees to value its investments.
Equity securities, including restricted securities, for which market quotations are readily available, are valued at the last reported sale price or official closing price as reported by an independent pricing service on the primary market or exchange on which they are traded. In the event there were no sales during the day or closing prices are not available, securities are valued at the last quoted bid price. Investments in open-end mutual funds, including the Fidelity Central Funds, are valued at their closing net asset value each business day. Short-term securities with remaining maturities of sixty days or less for which quotations are not readily available are valued at amortized cost, which approximates value.
When current market prices or quotations are not readily available or do not accurately reflect fair value, valuations may be determined in accordance with procedures adopted by the Board of Trustees. For example, when developments occur between the close of a market and the close of the NYSE that may materially affect the value of some or all of the securities, or when trading in a security is halted, those securities may be fair valued. Factors used in the determination of fair value may include monitoring news to identify significant market or security specific events such as changes in the value of U.S. securities markets, reviewing developments in foreign markets and evaluating the performance of ADRs, futures contracts and exchange-traded funds. Because the Fund's utilization of fair value pricing depends on market activity, the frequency with which fair value pricing is used can not be predicted and may be utilized to a significant extent. The value of securities used for NAV calculation under fair value pricing may differ from published prices for the same securities.
Foreign Currency. The Fund uses foreign currency contracts to facilitate transactions in foreign-denominated securities. Losses from these transactions may arise from changes in the value of the foreign currency or if the counterparties do not perform under the contracts' terms.
Foreign-denominated assets, including investment securities, and liabilities are translated into U.S. dollars at the exchange rate at period end. Purchases and sales of investment securities, income and dividends received and expenses denominated in foreign currencies are translated into U.S. dollars at the exchange rate in effect on the transaction date.
The effects of exchange rate fluctuations on investments are included with the net realized and unrealized gain (loss) on investment securities. Other foreign currency transactions resulting in realized and unrealized gain (loss) are disclosed separately.
Investment Transactions and Income. Security transactions, including the Fund's investment activity in the Fidelity Central Funds, are accounted for as of trade date. Gains and losses on securities sold are determined on the basis of identified cost. Dividend income is recorded on the ex-dividend date, except for certain dividends from foreign securities where the ex-dividend date may have passed, which are recorded as soon as the Fund is informed of the ex-dividend date. Non-cash dividends included in dividend income, if any, are recorded at the fair market value of the securities received. Interest income and income distributions from the Fidelity Central Funds are accrued as earned, with any income distributions receivable as of period end included in Interest Receivable on the Statement of Assets and Liabilities. Interest income includes coupon interest and amortization of premium and accretion of discount on debt securities. Investment income is recorded net of foreign taxes withheld where recovery of such taxes is uncertain.
VIP Growth Stock Portfolio
1. Significant Accounting Policies - continued
Expenses. Most expenses of the trust can be directly attributed to a fund. Expenses which cannot be directly attributed are apportioned among each Fund in the trust. Expense estimates are accrued in the period to which they relate and adjustments are made when actual amounts are known.
Income Tax Information and Distributions to Shareholders. Each year, the Fund intends to qualify as a regulated investment company by distributing all of its taxable income and realized gains under Subchapter M of the Internal Revenue Code. As a result, no provision for income taxes is required in the accompanying financial statements. Foreign taxes are provided for based on the Fund's understanding of the tax rules and rates that exist in the foreign markets in which it invests.
Distributions are recorded on the ex-dividend date. Income dividends and capital gain distributions are declared separately for each class. Income and capital gain distributions are determined in accordance with income tax regulations, which may differ from generally accepted accounting principles.
Capital accounts within the financial statements are adjusted for permanent book-tax differences. These adjustments have no impact on net assets or the results of operations. Temporary book-tax differences will reverse in a subsequent period.
Book-tax differences are primarily due to foreign currency transactions capital loss carryforward and losses deferred due to wash sales.
The tax-basis components of distributable earnings and the federal tax cost as of period end were as follows:
Unrealized appreciation | $ 2,094,873 | |
Unrealized depreciation | (592,208) | |
Net unrealized appreciation (depreciation) | 1,502,665 | |
Capital loss carryforward | (221,023) | |
| | |
Cost for federal income tax purposes | $ 15,356,698 | |
The tax character of distributions paid was as follows:
| December 31, 2006 | December 31, 2005 |
Ordinary Income | $ 7,983 | $ 23,026 |
New Accounting Pronouncements. In July 2006, Financial Accounting Standards Board Interpretation No. 48, Accounting for Uncertainty in Income Taxes - an interpretation of FASB Statement 109 (FIN 48), was issued and is effective on the last business day of the semiannual reporting period for fiscal years beginning after December 15, 2006. FIN 48 sets forth a threshold for financial statement recognition, measurement and disclosure of a tax position taken or expected to be taken on a tax return. Management is currently evaluating the impact, if any, the adoption of FIN 48 will have on the Fund's net assets, results of operations and financial statement disclosures.
In addition, in September 2006, Statement of Financial Accounting Standards No. 157, Fair Value Measurements (SFAS 157), was issued and is effective for fiscal years beginning after November 15, 2007. SFAS 157 defines fair value, establishes a framework for measuring fair value and expands disclosures about fair value measurements. Management is currently evaluating the impact the adoption of SFAS 157 will have on the Fund's financial statement disclosures.
2. Operating Policies.
Repurchase Agreements. FMR has received an Exemptive Order from the Securities and Exchange Commission (the SEC) which permits the Fund and other affiliated entities of FMR to transfer uninvested cash balances into joint trading accounts which are then invested in repurchase agreements. The Fund may also invest directly with institutions in repurchase agreements. Repurchase agreements are collateralized by government or non-government securities. Upon settlement date, collateral is held in segregated accounts with custodian banks and may be obtained in the event of a default of the counterparty. The Fund monitors, on a daily basis, the value of the collateral to ensure it is at least equal to the principal amount of the repurchase agreement (including accrued interest). In the event of a default by the counterparty, realization of the collateral proceeds could be delayed, during which time the value of the collateral may decline.
3. Purchases and Sales of Investments.
Purchases and sales of securities, other than short-term securities, aggregated $22,709,657 and $34,008,292, respectively.
Annual Report
Notes to Financial Statements - continued
4. Fees and Other Transactions with Affiliates.
Management Fee. FMR and its affiliates provide the Fund with investment management related services for which the Fund pays a monthly management fee. The management fee is the sum of an individual fund fee rate that is based on an annual rate of .30% of the Fund's average net assets and a group fee rate that averaged .27% during the period. The group fee rate is based upon the average net assets of all the mutual funds advised by FMR. The group fee rate decreases as assets under management increase and increases as assets under management decrease. For the period, the total annual management fee rate was .57% of the Fund's average net assets.
Distribution and Service Plan. In accordance with Rule 12b-1 of the 1940 Act, the Fund has adopted separate 12b-1 Plans for each Service Class of shares. Each Service Class pays Fidelity Distributors Corporation (FDC), an affiliate of FMR, a service fee. For the period, the service fee is based on an annual rate of .10% of Service Class' average net assets and .25% of Service Class 2's average net assets.
For the period, each class paid FDC the following amounts, all of which were re-allowed to insurance companies for the distribution of shares and providing shareholder support services:
Service Class | $ 2,035 | |
Service Class 2 | 7,168 | |
| $ 9,203 | |
Transfer Agent Fees. Fidelity Investments Institutional Operations Company, Inc. (FIIOC), an affiliate of FMR, is the fund's transfer, dividend disbursing, and shareholder servicing agent. FIIOC receives an asset-based fee with respect to each class. Each class with the exception of Investor Class pays a transfer agent fee, excluding out of pocket expenses, equal to an annual rate of .07% of their month end net assets. Investor Class pays a monthly asset-based transfer agent fee of .18% of its month end net assets. The total transfer agent fees paid by each class to FIIOC, including out of pocket expenses, were as follows:
Initial Class | $ 13,238 | |
Service Class | 1,348 | |
Service Class 2 | 2,710 | |
Investor Class | 8,544 | |
| $ 25,840 | |
Accounting and Security Lending Fees. Fidelity Service Company, Inc. (FSC), an affiliate of FMR, maintains the Fund's accounting records. The accounting fee is based on the level of average net assets for the month. Under a separate contract, FSC administers the security lending program. The security lending fee is based on the number and duration of lending transactions.
Investments in Fidelity Central Funds. The Fund may invest in Fidelity Central Funds. The Fund's Schedule of Investments lists each of the Fidelity Central Funds as an investment of the Fund but does not include the underlying holdings of each Fidelity Central Fund. As an Investing Fund, the Fund indirectly bears its proportionate share of the expenses of the underlying Fidelity Central Funds. A complete unaudited list of holdings for each Fidelity Central Fund is available upon request. In addition, the financial statements of the Fidelity Central Funds, which are not covered by the Fund's Report of Independent Registered Public Accounting Firm, are available on the EDGAR Database on the SEC's web site, www.sec.gov, or upon request.
The Money Market Central Funds seek preservation of capital and current income and are managed by Fidelity Investments Money Management, Inc. (FIMM), an affiliate of FMR.
Brokerage Commissions. The Fund placed a portion of its portfolio transactions with brokerage firms which are affiliates of the investment adviser. The commissions paid to these affiliated firms were $719 for the period.
5. Committed Line of Credit.
The Fund participates with other funds managed by FMR in a $4.2 billion credit facility (the "line of credit") to be utilized for temporary or emergency purposes to fund shareholder redemptions or for other short-term liquidity purposes. The Fund has agreed to pay commitment fees on its pro rata portion of the line of credit, which amounted to $78 and is reflected in Miscellaneous Expense on the Statement of Operations. During the period, there were no borrowings on this line of credit.
VIP Growth Stock Portfolio
6. Security Lending.
The Fund lends portfolio securities from time to time in order to earn additional income. On the settlement date of the loan, the Fund receives collateral (in the form of U.S. Treasury obligations, letters of credit and/or cash) against the loaned securities and maintains collateral in an amount not less than 100% of the market value of the loaned securities during the period of the loan. The market value of the loaned securities is determined at the close of business of the Fund and any additional required collateral is delivered to the Fund on the next business day. If the borrower defaults on its obligation to return the securities loaned because of insolvency or other reasons, a fund could experience delays and costs in recovering the securities loaned or in gaining access to the collateral. Any cash collateral received is invested in the Fidelity Securities Lending Cash Central Fund. The value of loaned securities and cash collateral at period end are disclosed on the Fund's Statement of Assets and Liabilities. Security lending income represents the income earned on investing cash collateral, less fees and expenses associated with the loan, plus any premium payments that may be received on the loan of certain types of securities. Security lending income is presented in the Statement of Operations as a component of income from Fidelity Central Funds. Net income from lending portfolio securities during the period amounted to $835.
7. Bank Borrowings.
The Fund is permitted to have bank borrowings for temporary or emergency purposes to fund shareholder redemptions. The Fund has established borrowing arrangements with certain banks. The interest rate on the borrowings is the bank's base rate, as revised from time to time. The average daily loan balance during the period for which loans were outstanding amounted to $3,612,400. The weighted average interest rate was 5.50%. At period end, there were no bank borrowings outstanding.
8. Expense Reductions.
FMR voluntarily agreed to reimburse each class to the extent annual operating expenses exceeded certain levels of average net assets as noted in the table below. Some expenses, for example interest expense, including commitment fees, are excluded from this reimbursement.
The following classes were in reimbursement during the period:
| Expense
Limitations | Reimbursement
from adviser |
| | |
Initial Class | .85% | $ 19,865 |
Service Class | .95% | 4,072 |
Service Class 2 | 1.10% | 6,960 |
Investor Class | 1.00 | 7,201 |
| | $ 38,098 |
Many of the brokers with whom FMR places trades on behalf of the Fund provided services to the Fund in addition to trade execution. These services included payments of certain expenses on behalf of the Fund totaling $1,718 for the period.
9. Other.
The Fund's organizational documents provide former and current trustees and officers with a limited indemnification against liabilities arising in connection with the performance of their duties to the Fund. In the normal course of business, the Fund may also enter into contracts that provide general indemnifications. The Fund's maximum exposure under these arrangements is unknown as this would be dependent on future claims that may be made against the Fund. The risk of material loss from such claims is considered remote.
At the end of the period, FMR or its affiliates were the owners of record of 97% of the total outstanding shares of the Fund.
The United States Securities and Exchange Commission ("SEC") is conducting an investigation of FMR (covering the years 2002 to 2004) arising from gifts, gratuities and business entertainment provided by certain brokers to certain individuals who were employed on FMR's domestic equity trading desk during that period. FMR is in discussions with the SEC staff regarding the possible resolution of the matter, but as of period-end no final resolution has been reached.
Annual Report
Notes to Financial Statements - continued
9. Other - continued
In December 2006, the Independent Trustees completed their own investigation of the matter with the assistance of independent counsel. The Independent Trustees and FMR agree that, despite the absence of proof that the Fidelity mutual funds experienced diminished execution quality as a result of the improper receipt of gifts and business entertainment, the conduct at issue was serious and is worthy of redress. Accordingly, the Independent Trustees have requested and FMR has agreed to pay $42 million to Fidelity mutual funds, plus interest to be determined at the time that payment is made. A method of allocating this payment among the funds has not yet been determined. The total payment to the Fund is not anticipated to have a material impact on the Fund's net assets. In addition, FMR reimbursed related legal expenses which are recorded in the accompanying Statement of Operations as an expense reduction.
10. Distributions to Shareholders.
Distributions to shareholders of each class were as follows:
| Years ended December 31, |
| 2006 | 2005A |
From net investment income | | |
Initial Class | $ 7,399 | $ 869 |
Service Class | - | 861 |
Service Class 2 | - | 1,148 |
Investor Class | 584 | - |
Total | $ 7,983 | $ 2,878 |
From net realized gain | | |
Initial Class | $ - | $ 6,088 |
Service Class | - | 6,025 |
Service Class 2 | - | 8,035 |
Total | $ - | $ 20,148 |
A Distributions for Investor Class are for the period July 21, 2005 (commencement of sale of shares) to December 31, 2005.
11. Share Transactions.
Transactions for each class of shares were as follows:
| Shares | Dollars |
| Years ended December 31, | Years ended December 31, |
| 2006 | 2005A | 2006 | 2005A |
Initial Class | | | | |
Shares sold | 205,736 | 2,058,133 | $ 2,451,301 | $ 23,884,843 |
Reinvestment of distributions | 611 | 635 | 7,399 | 6,957 |
Shares redeemed | (1,497,074) | (327,858) | (17,419,330) | (3,805,050) |
Net increase (decrease) | (1,290,727) | 1,730,910 | $ (14,960,630) | $ 20,086,750 |
Service Class | | | | |
Shares sold | - | - | $ - | $ - |
Reinvestment of distributions | - | 629 | - | 6,886 |
Shares redeemed | - | - | - | - |
Net increase (decrease) | - | 629 | $ - | $ 6,886 |
Service Class 2 | | | | |
Shares sold | 43,637 | - | $ 488,801 | $ - |
Reinvestment of distributions | - | 843 | - | 9,183 |
Shares redeemed | (4,553) | - | (51,413) | - |
Net increase (decrease) | 39,084 | 843 | $ 437,388 | $ 9,183 |
Investor Class | | | | |
Shares sold | 498,339 | 191,316 | $ 5,920,324 | $ 2,233,004 |
Reinvestment of distributions | 48 | - | 584 | - |
Shares redeemed | (364,011) | (6,266) | (4,231,655) | (73,220) |
Net increase (decrease) | 134,376 | 185,050 | $ 1,689,253 | $ 2,159,784 |
A Share transactions for Investor Class are for the period July 21, 2005 (commencement of sale of shares) to December 31, 2005.
VIP Growth Stock Portfolio
Report of Independent Registered Public Accounting Firm
To the Trustees of Variable Insurance Products Fund IV and the Shareholders of VIP Growth Stock Portfolio:
In our opinion, the accompanying statement of assets and liabilities, including the schedule of investments, and the related statements of operations and of changes in net assets and the financial highlights present fairly, in all material respects, the financial position of VIP Growth Stock Portfolio (a fund of Variable Insurance Products Fund IV) at December 31, 2006, the results of its operations for the year then ended, the changes in its net assets for each of the two years in the period then ended and the financial highlights for each of the periods indicated, in conformity with accounting principles generally accepted in the United States of America. These financial statements and financial highlights (hereafter referred to as "financial statements") are the responsibility of the VIP Growth Stock Portfolio's management; our responsibility is to express an opinion on these financial statements based on our audits. We conducted our audits of these financial statements in accordance with the standards of the Public Company Accounting Oversight Board (United States). Those standards require that we plan and perform the audit to obtain reasonable assurance about whether the financial statements are free of material misstatement. An audit includes examining, on a test basis, evidence supporting the amounts and disclosures in the financial statements, assessing the accounting principles used and significant estimates made by management, and evaluating the overall financial statement presentation. We believe that our audits, which included confirmation of securities at December 31, 2006 by correspondence with the custodian and brokers, provide a reasonable basis for our opinion.
/s/ PricewaterhouseCoopers LLP
PricewaterhouseCoopers LLP
Boston, Massachusetts
February 15, 2007
Annual Report
Trustees and Officers
The Trustees, Member of the Advisory Board, and executive officers of the trust and fund, as applicable, are listed below. The Board of Trustees governs the fund and is responsible for protecting the interests of shareholders. The Trustees are experienced executives who meet periodically throughout the year to oversee the fund's activities, review contractual arrangements with companies that provide services to the fund, and review the fund's performance. Each of the Trustees oversees 348 funds advised by FMR or an affiliate.
The Trustees hold office without limit in time except that (a) any Trustee may resign; (b) any Trustee may be removed by written instrument, signed by at least two-thirds of the number of Trustees prior to such removal; (c) any Trustee who requests to be retired or who has become incapacitated by illness or injury may be retired by written instrument signed by a majority of the other Trustees; and (d) any Trustee may be removed at any special meeting of shareholders by a two-thirds vote of the outstanding voting securities of the trust. Each Trustee who is not an interested person (as defined in the 1940 Act) (Independent Trustee), shall retire not later than the last day of the calendar year in which his or her 72nd birthday occurs. The Independent Trustees may waive this mandatory retirement age policy with respect to individual Trustees. The executive officers and Advisory Board Member hold office without limit in time, except that any officer and Advisory Board Member may resign or may be removed by a vote of a majority of the Trustees at any regular meeting or any special meeting of the Trustees. Except as indicated, each individual has held the office shown or other offices in the same company for the past five years.
The fund's Statement of Additional Information (SAI) includes more information about the Trustees. To request a free copy, call Fidelity at 1-877-208-0098.
Interested Trustees*:
Correspondence intended for each Trustee who is an interested person may be sent to Fidelity Investments, 82 Devonshire Street, Boston, Massachusetts 02109.
Name, Age; Principal Occupation |
Edward C. Johnson 3d (76) |
| Year of Election or Appointment: 1983 Mr. Johnson is Chairman of the Board of Trustees. Mr. Johnson serves as President (2006-present), Chief Executive Officer, Chairman, and a Director of FMR Corp.; Chairman and a Director of FMR; Chairman and a Director of Fidelity Research & Analysis Company (FRAC); Chairman and a Director of Fidelity Investments Money Management, Inc.; and Chairman (2001-present) and a Director of FMR Co., Inc. In addition, Mr. Johnson serves as Chairman and Director of Fidelity International Limited (FIL). |
Robert L. Reynolds (54) |
| Year of Election or Appointment: 2003 Mr. Reynolds is President and a Director of FMR (2005-present), Fidelity Investments Money Management, Inc. (2005-present), and FMR Co., Inc. (2005-present). Mr. Reynolds also serves as Vice Chairman (2006-present), a Director (2003-present), and Chief Operating Officer of FMR Corp. and a Director of Strategic Advisers, Inc. (2005-present). He also serves on the Board at Fidelity Investments Canada, Ltd. |
* Trustees have been determined to be "Interested Trustees" by virtue of, among other things, their affiliation with the trust or various entities under common control with FMR.
Independent Trustees:
Correspondence intended for each Independent Trustee (that is, the Trustees other than the Interested Trustees) may be sent to Fidelity Investments, P.O. Box 55235, Boston, Massachusetts 02205-5235.
Name, Age; Principal Occupation |
Dennis J. Dirks (58) |
| Year of Election or Appointment: 2005 Prior to his retirement in May 2003, Mr. Dirks was Chief Operating Officer and a member of the Board of The Depository Trust & Clearing Corporation (DTCC) (1999-2003). He also served as President, Chief Operating Officer, and Board member of The Depository Trust Company (DTC) (1999-2003) and President and Board member of the National Securities Clearing Corporation (NSCC) (1999-2003). In addition, Mr. Dirks served as Chief Executive Officer and Board member of the Government Securities Clearing Corporation (2001-2003) and Chief Executive Officer and Board member of the Mortgage-Backed Securities Clearing Corporation (2001-2003). Mr. Dirks also serves as a Trustee and a member of the Finance Committee of Manhattan College (2005-present) and a Trustee and a member of the Finance Committee of AHRC of Nassau County (2006-present). |
Albert R. Gamper, Jr. (64) |
| Year of Election or Appointment: 2006 Prior to his retirement in December 2004, Mr. Gamper served as Chairman of the Board of CIT Group Inc. (commercial finance). During his tenure with CIT Group Inc. Mr. Gamper served in numerous senior management positions, including Chairman (1987-1989; 1999-2001; 2002-2004), Chief Executive Officer (1987-2004), and President (1989-2002). He currently serves as a member of the Board of Directors of Public Service Enterprise Group (utilities, 2001-present), Chairman of the Board of Governors, Rutgers University (2004-present), and Chairman of the Board of Saint Barnabas Health Care System. |
George H. Heilmeier (70) |
| Year of Election or Appointment: 2004 Dr. Heilmeier is Chairman Emeritus of Telcordia Technologies (communication software and systems), where prior to his retirement, he served as company Chairman and Chief Executive Officer. He currently serves on the Boards of Directors of The Mitre Corporation (systems engineering and information technology support for the government), and HRL Laboratories (private research and development, 2004-present). He is Chairman of the General Motors Science & Technology Advisory Board and a Life Fellow of the Institute of Electrical and Electronics Engineers (IEEE). Dr. Heilmeier is a member of the Defense Science Board and the National Security Agency Advisory Board. He is also a member of the National Academy of Engineering, the American Academy of Arts and Sciences, and the Board of Overseers of the School of Engineering and Applied Science of the University of Pennsylvania. Previously, Dr. Heilmeier served as a Director of TRW Inc. (automotive, space, defense, and information technology, 1992-2002), Compaq (1994-2002), Automatic Data Processing, Inc. (ADP) (technology-based business outsourcing, 1995-2002), INET Technologies Inc. (telecommunications network surveillance, 2001-2004), and Teletech Holdings (customer management services). He is the recipient of the 2005 Kyoto Prize in Advanced Technology for his invention of the liquid crystal display, and a member of the Consumer Electronics Hall of Fame. |
James H. Keyes (66) |
| Year of Election or Appointment: 2007 Prior to his retirement in 2003, Mr. Keyes was Chairman, President, and Chief Executive Officer of Johnson Controls, Inc. (automotive supplier, 1993-2003). He currently serves as a member of the boards of LSI Logic Corporation (semiconductor technologies), Navistar International Corporation (manufacture and sale of trucks, buses, and diesel engines, 2002-present), and Pitney Bowes, Inc. (integrated mail, messaging, and document management solutions). |
Marie L. Knowles (60) |
| Year of Election or Appointment: 2001 Prior to Ms. Knowles' retirement in June 2000, she served as Executive Vice President and Chief Financial Officer of Atlantic Richfield Company (ARCO) (diversified energy, 1996-2000). From 1993 to 1996, she was a Senior Vice President of ARCO and President of ARCO Transportation Company. She served as a Director of ARCO from 1996 to 1998. She currently serves as a Director of Phelps Dodge Corporation (copper mining and manufacturing) and McKesson Corporation (healthcare service, 2002-present). Ms. Knowles is a Trustee of the Brookings Institution and the Catalina Island Conservancy and also serves as a member of the Advisory Board for the School of Engineering of the University of Southern California. |
Ned C. Lautenbach (62) |
| Year of Election or Appointment: 2000 Mr. Lautenbach is Chairman of the Independent Trustees (2006-present). Mr. Lautenbach has been a partner of Clayton, Dubilier & Rice, Inc. (private equity investment firm) since September 1998. Previously, Mr. Lautenbach was with the International Business Machines Corporation (IBM) from 1968 until his retirement in 1998. Mr. Lautenbach serves as a Director of Sony Corporation (2006-present) and Eaton Corporation (diversified industrial) as well as the Philharmonic Center for the Arts in Naples, Florida. He also is a member of the Board of Trustees of Fairfield University (2005-present), as well as a member of the Council on Foreign Relations. |
Cornelia M. Small (62) |
| Year of Election or Appointment: 2005 Ms. Small is a member (2000-present) and Chairperson (2002-present) of the Investment Committee, and a member (2002- present) of the Board of Trustees of Smith College. Previously, she served as Chief Investment Officer (1999-2000), Director of Global Equity Investments (1996-1999), and a member of the Board of Directors of Scudder, Stevens & Clark (1990-1997) and Scudder Kemper Investments (1997-1999). In addition, Ms. Small served as Co-Chair (2000-2003) of the Annual Fund for the Fletcher School of Law and Diplomacy. |
William S. Stavropoulos (67) |
| Year of Election or Appointment: 2001 Mr. Stavropoulos is Chairman Emeritus of the Board of Directors of The Dow Chemical Company. Since joining The Dow Chemical Company in 1967, Mr. Stavropoulos served in numerous senior management positions, including President (1993-2000; 2002-2003), CEO (1995-2000; 2002-2004), and Chairman of the Executive Committee (2000-2004). Currently, he is a Director of NCR Corporation (data warehousing and technology solutions), BellSouth Corporation (telecommunications), Chemical Financial Corporation, Maersk Inc. (industrial conglomerate, 2002-present), and Metalmark Capital (private equity investment firm, 2005-present). He also serves as a member of the Board of Trustees of the American Enterprise Institute for Public Policy Research. In addition, Mr. Stavropoulos is a member of The Business Council, J.P. Morgan International Council and the University of Notre Dame Advisory Council for the College of Science. |
Kenneth L. Wolfe (67) |
| Year of Election or Appointment: 2005 Prior to his retirement in 2001, Mr. Wolfe was Chairman and Chief Executive Officer of Hershey Foods Corporation (1993-2001). He currently serves as a member of the boards of Adelphia Communications Corporation (2003-present), Bausch & Lomb, Inc., and Revlon Inc. (2004-present). |
Advisory Board Member and Executive Officers:
Correspondence intended for each executive officer and Mr. Lynch may be sent to Fidelity Investments, 82 Devonshire Street, Boston, Massachusetts 02109.
Name, Age; Principal Occupation |
Peter S. Lynch (62) |
| Year of Election or Appointment: 2003 Member of the Advisory Board of Variable Insurance Products Fund IV. Mr. Lynch is Vice Chairman and a Director of FMR, and Vice Chairman (2001-present) and a Director of FMR Co., Inc. Previously, Mr. Lynch served as a Trustee of the Fidelity funds (1990-2003). In addition, he serves as a Trustee of Boston College and as the Chairman of the Inner-City Scholarship Fund. |
Kimberley H. Monasterio (43) |
| Year of Election or Appointment: 2007 President and Treasurer of VIP Growth Stock. Ms. Monasterio also serves as President and Treasurer of other Fidelity funds (2007-present) and is an employee of FMR (2004-present). Previously, Ms. Monasterio served as Deputy Treasurer of the Fidelity funds (2004-2006). Before joining Fidelity Investments, Ms. Monasterio served as Treasurer (2000-2004) and Chief Financial Officer (2002-2004) of the Franklin Templeton Funds and Senior Vice President of Franklin Templeton Services, LLC (2000-2004). |
Dwight D. Churchill (53) |
| Year of Election or Appointment: 2005 Vice President of VIP Growth Stock. Mr. Churchill also serves as Vice President of certain Equity Funds (2005-present). Mr. Churchill is Executive Vice President of FMR (2005-present) and FMR Co., Inc. (2005-present). Previously, Mr. Churchill served as Senior Vice President of Fidelity Investments Money Management, Inc. (2005-2006), Head of Fidelity's Fixed-Income Division (2000-2005), Vice President of Fidelity's Money Market Funds (2000-2005), Vice President of Fidelity's Bond Funds, and Senior Vice President of FMR. |
Bruce T. Herring (41) |
| Year of Election or Appointment: 2006 Vice President of VIP Growth Stock. Mr. Herring also serves as Vice President of certain Equity Funds (2006-present). Mr. Herring is Senior Vice President of FMR (2006-present) and Vice President of FMR Co., Inc. (2001-present). Previously, Mr. Herring served as a portfolio manager for Fidelity U.S. Equity Funds (2001-2005). |
Brian Hanson (33) |
| Year of Election or Appointment: 2004 Vice President of VIP Growth Stock. Mr. Hanson also serves as vice president of other funds advised by FMR. Prior to assuming his current responsibilities, Mr. Hanson worked as a research analyst and portfolio manager. Mr. Hanson also serves as vice president of FMR (2004) and FMR Co., Inc. (2004). |
Eric D. Roiter (58) |
| Year of Election or Appointment: 2002 Secretary of VIP Growth Stock. He also serves as Secretary of other Fidelity funds; Vice President, General Counsel, and Secretary of FMR Co., Inc. (2001-present) and FMR; Assistant Secretary of Fidelity Management & Research (U.K.) Inc. (2001-present), Fidelity Research & Analysis Company (2001-present), and Fidelity Investments Money Management, Inc. (2001-present). Mr. Roiter is an Adjunct Member, Faculty of Law, at Boston College Law School (2003-present). Previously, Mr. Roiter served as Vice President and Secretary of Fidelity Distributors Corporation (FDC) (1998-2005). |
Stuart Fross (47) |
| Year of Election or Appointment: 2003 Assistant Secretary of VIP Growth Stock. Mr. Fross also serves as Assistant Secretary of other Fidelity funds (2003-present), Vice President and Secretary of FDC (2005-present), and is an employee of FMR. |
R. Stephen Ganis (40) |
| Year of Election or Appointment: 2006 Anti-Money Laundering (AML) officer of VIP Growth Stock. Mr. Ganis also serves as AML officer of other Fidelity funds (2006-present) and FMR Corp. (2003-present). Before joining Fidelity Investments, Mr. Ganis practiced law at Goodwin Procter, LLP (2000-2002). |
Joseph B. Hollis (58) |
| Year of Election or Appointment: 2006 Chief Financial Officer of VIP Growth Stock. Mr. Hollis also serves as Chief Financial Officer of other Fidelity funds. Mr. Hollis is President of Fidelity Pricing and Cash Management Services (FPCMS) (2005-present). Mr. Hollis also serves as President and Director of Fidelity Service Company, Inc. (2006-present). Previously, Mr. Hollis served as Senior Vice President of Cash Management Services (1999-2002) and Investment Management Operations (2002-2005). |
Kenneth A. Rathgeber (59) |
| Year of Election or Appointment: 2004 Chief Compliance Officer of VIP Growth Stock. Mr. Rathgeber also serves as Chief Compliance Officer of other Fidelity funds (2004-present) and Executive Vice President of Risk Oversight for Fidelity Investments (2002-present). He is Chief Compliance Officer of FMR (2005-present), FMR Co., Inc. (2005-present), Fidelity Management & Research (U.K.) Inc. (2005-present), Fidelity Research & Analysis Company (2005-present), Fidelity Investments Money Management, Inc. (2005-present), and Strategic Advisers, Inc. (2005-present). Previously, Mr. Rathgeber served as Executive Vice President and Chief Operating Officer for Fidelity Investments Institutional Services Company, Inc. (1998-2002). |
Bryan A. Mehrmann (45) |
| Year of Election or Appointment: 2005 Deputy Treasurer of VIP Growth Stock. Mr. Mehrmann also serves as Deputy Treasurer of other Fidelity funds (2005-present) and is an employee of FMR. Previously, Mr. Mehrmann served as Vice President of Fidelity Investments Institutional Services Group (FIIS)/Fidelity Investments Institutional Operations Corporation, Inc. (FIIOC) Client Services (1998-2004). |
Kenneth B. Robins (37) |
| Year of Election or Appointment: 2005 Deputy Treasurer of VIP Growth Stock. Mr. Robins also serves as Deputy Treasurer of other Fidelity funds (2005-present) and is an employee of FMR (2004-present). Before joining Fidelity Investments, Mr. Robins worked at KPMG LLP, where he was a partner in KPMG's department of professional practice (2002-2004) and a Senior Manager (1999-2000). In addition, Mr. Robins served as Assistant Chief Accountant, United States Securities and Exchange Commission (2000-2002). |
Robert G. Byrnes (40) |
| Year of Election or Appointment: 2005 Assistant Treasurer of VIP Growth Stock. Mr. Byrnes also serves as Assistant Treasurer of other Fidelity funds (2005-present) and is an employee of FMR (2005-present). Previously, Mr. Byrnes served as Vice President of FPCMS (2003-2005). Before joining Fidelity Investments, Mr. Byrnes worked at Deutsche Asset Management where he served as Vice President of the Investment Operations Group (2000-2003). |
John H. Costello (60) |
| Year of Election or Appointment: 2002 Assistant Treasurer of VIP Growth Stock. Mr. Costello also serves as Assistant Treasurer of other Fidelity funds and is an employee of FMR. |
Peter L. Lydecker (52) |
| Year of Election or Appointment: 2004 Assistant Treasurer of VIP Growth Stock. Mr. Lydecker also serves as Assistant Treasurer of other Fidelity funds (2004) and is an employee of FMR. |
Mark Osterheld (51) |
| Year of Election or Appointment: 2002 Assistant Treasurer of VIP Growth Stock. Mr. Osterheld also serves as Assistant Treasurer of other Fidelity funds (2002) and is an employee of FMR. |
Gary W. Ryan (48) |
| Year of Election or Appointment: 2005 Assistant Treasurer of VIP Growth Stock. Mr. Ryan also serves as Assistant Treasurer of other Fidelity funds (2005-present) and is an employee of FMR (2005-present). Previously, Mr. Ryan served as Vice President of Fund Reporting in FPCMS (1999-2005). |
Salvatore Schiavone (41) |
| Year of Election or Appointment: 2005 Assistant Treasurer of VIP Growth Stock. Mr. Schiavone also serves as Assistant Treasurer of other Fidelity funds (2005-present) and is an employee of FMR (2005-present). Before joining Fidelity Investments, Mr. Schiavone worked at Deutsche Asset Management, where he most recently served as Assistant Treasurer (2003-2005) of the Scudder Funds and Vice President and Head of Fund Reporting (1996-2003). |
VIP Growth Stock Portfolio
Distributions
Investor class, and Initial class designates 100% of the dividends distributed in February during the fiscal year as qualifying for the dividends-received deduction for corporate shareholders.
The fund will notify shareholders in January 2007 of amounts for use in preparing 2006 income tax returns.
Annual Report
Proxy Voting Results
A special meeting of the fund's shareholders was held on September 20, 2006. The results of votes taken among shareholders on the proposal before them are reported below. Each vote reported represents one dollar of net asset value held on the record date for the meeting.
PROPOSAL 1 |
To elect a Board of Trustees. A |
| # of
Votes | % of
Votes |
Dennis J. Dirks |
Affirmative | 92,459,317.52 | 96.102 |
Withheld | 3,749,837.05 | 3.898 |
TOTAL | 96,209,154.57 | 100.00 |
Albert R. Gamper, Jr. |
Affirmative | 92,260,598.99 | 95.896 |
Withheld | 3,948,555.58 | 4.104 |
TOTAL | 96,209,154.57 | 100.000 |
Robert M. Gates |
Affirmative | 92,315,480.72 | 95.953 |
Withheld | 3,893,673.85 | 4.047 |
TOTAL | 96,209,154.57 | 100.000 |
George H. Heilmeier |
Affirmative | 92,208,255.41 | 95.841 |
Withheld | 4,000,899.16 | 4.159 |
TOTAL | 96,209,154.57 | 100.000 |
Edward C. Johnson 3d |
Affirmative | 91,928,267.76 | 95.550 |
Withheld | 4,280,886.81 | 4.450 |
TOTAL | 96,209,154.57 | 100.000 |
Stephen P. Jonas |
Affirmative | 92,457,628.76 | 96.101 |
Withheld | 3,751,525.81 | 3.899 |
TOTAL | 96,209,154.57 | 100.000 |
James H. KeyesB |
Affirmative | 92,432,729.82 | 96.075 |
Withheld | 3,776,424.75 | 3.925 |
TOTAL | 96,209,154.57 | 100.000 |
| # of
Votes | % of
Votes |
Marie L. Knowles |
Affirmative | 92,398,847.52 | 96.040 |
Withheld | 3,810,307.05 | 3.960 |
TOTAL | 96,209,154.57 | 100.000 |
Ned C. Lautenbach |
Affirmative | 92,423,184.47 | 96.065 |
Withheld | 3,785,970.10 | 3.935 |
TOTAL | 96,209,154.57 | 100.000 |
William O. McCoy |
Affirmative | 92,086,293.90 | 95.715 |
Withheld | 4,122,860.67 | 4.285 |
TOTAL | 96,209,154.57 | 100.000 |
Robert L. Reynolds |
Affirmative | 92,439,032.86 | 96.081 |
Withheld | 3,770,121.71 | 3.919 |
TOTAL | 96,209,154.57 | 100.000 |
Cornelia M. Small |
Affirmative | 92,415,567.29 | 96.057 |
Withheld | 3,793,587.28 | 3.943 |
TOTAL | 96,209,154.57 | 100.000 |
William S. Stavropoulos |
Affirmative | 92,135,400.08 | 95.766 |
Withheld | 4,073,754.49 | 4.234 |
TOTAL | 96,209,154.57 | 100.000 |
Kenneth L. Wolfe |
Affirmative | 92,445,865.31 | 96.088 |
Withheld | 3,763,289.26 | 3.912 |
TOTAL | 96,209,154.57 | 100.000 |
Abstain | 100,000,000.00 | 00.000 |
A Denotes trust-wide proposal and voting results. B Effective on or about January 1, 2007. |
VIP Growth Stock Portfolio
Board Approval of Investment Advisory Contracts and Management Fees
VIP Growth Stock Portfolio
Each year, typically in July, the Board of Trustees, including the Independent Trustees (together, the Board), votes on the renewal of the management contract and sub-advisory agreements (together, the Advisory Contracts) for the fund. The Board, assisted by the advice of fund counsel and Independent Trustees' counsel, requests and considers a broad range of information throughout the year.
The Board meets regularly each month except August and takes into account throughout the year matters bearing on Advisory Contracts. The Board, acting directly and through its separate committees, considers at each of its meetings factors that are relevant to the annual renewal of the fund's Advisory Contracts, including the services and support provided to the fund and its shareholders. At the time of the renewal, the Board had 12 standing committees, each composed of Independent Trustees with varying backgrounds, to which the Board has assigned specific subject matter responsibilities in order to enhance effective decision-making by the Board. Each committee has adopted a written charter outlining the structure and purposes of the committee. One such committee, the Equity Contract Committee, meets periodically as needed throughout the year to consider matters specifically related to the annual renewal of Advisory Contracts. The committee requests and receives information on, and makes recommendations to the Independent Trustees concerning, the approval and annual review of the Advisory Contracts.
At its July 2006 meeting, the Board of Trustees, including the Independent Trustees, unanimously determined to renew the Advisory Contracts for the fund. In reaching its determination, the Board considered all factors it believed relevant, including (i) the nature, extent, and quality of the services to be provided to the fund and its shareholders (including the investment performance of the fund); (ii) the competitiveness of the management fee and total expenses of the fund; (iii) the total costs of the services to be provided by and the profits to be realized by the investment adviser and its affiliates from the relationship with the fund; (iv) the extent to which economies of scale would be realized as the fund grows; and (v) whether fee levels reflect these economies of scale, if any, for the benefit of fund shareholders.
In determining whether to renew the Advisory Contracts for the fund, the Board ultimately reached a determination, with the assistance of fund counsel and Independent Trustees' counsel, that the renewal of the Advisory Contracts and the compensation to be received by Fidelity under the management contract is consistent with Fidelity's fiduciary duty under applicable law. In addition to evaluating the specific factors noted above, the Board, in reaching its determination, is aware that shareholders in the fund have a broad range of investment choices available to them, including a wide choice among mutual funds offered by competitors to Fidelity, and that the fund's shareholders, with the opportunity to review and weigh the disclosure provided by the fund in its prospectus and other public disclosures, have chosen to invest in this fund, managed by Fidelity.
Nature, Extent, and Quality of Services Provided. The Board considered staffing within the investment adviser, FMR, and the sub-advisers (together, the Investment Advisers), including the background of the fund's portfolio manager and the fund's investment objective and discipline. The Independent Trustees also had discussions with senior management of Fidelity's investment operations and investment groups. The Board considered the structure of the portfolio manager compensation program and whether this structure provides appropriate incentives.
Resources Dedicated to Investment Management and Support Services. The Board reviewed the size, education, and experience of the Investment Advisers' investment staff, their use of technology, and the Investment Advisers' approach to recruiting, training, and retaining portfolio managers and other research, advisory, and management personnel. The Board considered Fidelity's extensive global research capabilities that enable the Investment Advisers to aggregate data from various sources in an effort to produce positive investment results. The Board noted that Fidelity's analysts have access to a variety of technological tools that enable them to perform both fundamental and quantitative analysis and to specialize in various disciplines. The Board also considered that Fidelity's portfolio managers and analysts have access to daily portfolio attribution that allows for monitoring of a fund's portfolio, as well as an electronic communication system that provides immediate real-time access to research concerning issuers and credit enhancers.
Shareholder and Administrative Services. The Board considered (i) the nature, extent, quality, and cost of administrative, distribution, and shareholder services performed by the Investment Advisers and their affiliates under the Advisory Contracts and under separate agreements covering transfer agency, pricing and bookkeeping, and securities lending services for the fund; (ii) the nature and extent of the Investment Advisers' supervision of third party service providers, principally custodians and subcustodians; and (iii) the resources devoted to, and the record of compliance with, the fund's compliance policies and procedures. The Board reviewed the allocation of fund brokerage, including allocations to brokers affiliated with the Investment Advisers, the use of brokerage commissions to pay fund expenses, and the use of "soft" commission dollars to pay for research services. The Board also considered that Fidelity voluntarily pays for market data out of its own resources.
The Board noted that the growth of fund assets across the complex allows Fidelity to reinvest in the development of services designed to enhance the value or convenience of the Fidelity funds as investment vehicles. These services include 24-hour access to account information and market information through phone representatives and over the Internet, and investor education materials and asset allocation tools.
Investment in a Large Fund Family. The Board considered the benefits to shareholders of investing in a Fidelity fund, including the benefits of investing in a fund that is part of a large family of funds offering a variety of investment disciplines and providing for a large variety of mutual fund investor services. The Board noted that, since the last Advisory Contract renewals in July 2005, Fidelity has taken a number of actions that benefited particular funds, including (i) dedicating additional resources to investment research and to restructure the investment research teams; (ii) voluntarily entering into contractual arrangements with certain brokers pursuant to which Fidelity pays for research products and services separately out of its own resources, rather than bundling with fund commissions; (iii) launching the Fidelity Advantage Class of its five Spartan stock index funds and three Spartan bond index funds, which is a lower-fee class available to shareholders with higher account balances; (iv) contractually agreeing to impose expense limitations on Fidelity U.S. Bond Index Fund and reducing the fund's initial investment minimum; and (v) offering shareholders of each of the Fidelity Institutional Money Market Funds the privilege of exchanging shares of the fund for shares of other Fidelity funds.
Annual Report
Board Approval of Investment Advisory Contracts and Management Fees - continued
Investment Performance and Compliance. The Board considered whether the fund has operated within its investment objective, as well as its record of compliance with its investment restrictions. It also reviewed the fund's absolute investment performance for each class (except Investor Class), as well as the fund's relative investment performance for each class (except Investor Class) measured against (i) a broad-based securities market index, and (ii) a peer group of mutual funds deemed appropriate by the Board over multiple periods. Because the fund had been in existence less than five calendar years, the following charts considered by the Board show, over the one- and three-year periods ended December 31, 2005, the cumulative total returns of Service Class 2 and Initial Class of the fund, the cumulative total returns of a broad-based securities market index ("benchmark"), and a range of cumulative total returns of a peer group of mutual funds identified by Lipper Inc. as having an investment objective similar to that of the fund. The returns of Service Class 2 and Initial Class represent the performance of classes with the highest and lowest 12b-1 fees, respectively (not necessarily with the highest and lowest total expenses). (Investor Class of the fund, which has no 12b-1 fee, had less than one year of performance as of December 31, 2005.) The box within each chart shows the 25th percentile return (bottom of box) and the 75th percentile return (top of box) of the Lipper peer group. Returns shown above the box are in the first quartile and returns shown below the box are in the fourth quartile. The percentage beaten numbers noted below each chart correspond to the percentile box and represent the percentage of funds in the Lipper peer group whose performance was equal to or lower than that of the class indicated.
VIP Growth Stock Portfolio
The Board reviewed the fund's relative investment performance against its Lipper peer group and stated that the performance of Initial Class of the fund was in the second quartile for the one-year period and the fourth quartile for the three-year period. The Board also stated that the relative investment performance of Initial Class of the fund compared favorably to its benchmark for the one-year period, although the fund's three-year cumulative total return was lower than its benchmark. The Board considered that the variations in performance among the fund's classes reflect the variations in class expenses, which result in lower performance for higher expense classes. The Board also reviewed the fund's relative investment performance against a peer group defined by Morningstar.
The Board considered that FMR has taken steps to refocus and strengthen equity research, equity portfolio management, and compliance. The Board noted with favor FMR's reorganization of its senior management team in 2005 and FMR's dedication of additional resources to investment research, and participated in the process that led to those changes.
Based on its review, and giving particular weight to the nature and quality of the resources dedicated by the Investment Advisers to maintain and improve relative performance, the Board concluded that the nature, extent, and quality of the services provided to the fund will benefit the fund's shareholders, particularly in light of the Board's view that the fund's shareholders benefit from investing in a fund that is part of a large family of funds offering a variety of investment disciplines and services.
VIP Growth Stock Portfolio
Competitiveness of Management Fee and Total Fund Expenses. The Board considered the fund's management fee and total expenses compared to "mapped groups" of competitive funds and classes. Fidelity creates "mapped groups" by combining similar Lipper investment objective categories that have comparable management fee characteristics. Combining Lipper investment objective categories aids the Board's management fee and total expense comparisons by broadening the competitive group used for comparison and by reducing the number of universes to which various Fidelity funds are compared.
The Board considered two proprietary management fee comparisons for the 12-month (or shorter) periods shown in the chart below. The group of Lipper funds used by the Board for management fee comparisons is referred to below as the "Total Mapped Group" and, for the reasons explained above, is broader than the Lipper peer group used by the Board for performance comparisons. The Total Mapped Group comparison focuses on a fund's standing relative to the total universe of comparable funds available to investors, in terms of gross management fees before expense reimbursements or caps. "TMG %" represents the percentage of funds in the Total Mapped Group that had management fees that were lower than the fund's. For example, a TMG % of 6% means that 94% of the funds in the Total Mapped Group had higher management fees than the fund. The "Asset-Size Peer Group" (ASPG) comparison focuses on a fund's standing relative to non-Fidelity funds similar in size to the fund within the Total Mapped Group. The ASPG represents at least 15% of the funds in the Total Mapped Group with comparable asset size and management fee characteristics, subject to a minimum of 50 funds (or all funds in the Total Mapped Group if fewer than 50). Additional information, such as the ASPG quartile in which the fund's management fee ranked, is also included in the chart and considered by the Board.
VIP Growth Stock Portfolio

The Board noted that the fund's management fee ranked below the median of its Total Mapped Group and below the median of its ASPG for 2005.
Based on its review, the Board concluded that the fund's management fee was fair and reasonable in light of the services that the fund receives and the other factors considered.
In its review of each class's total expenses, the Board considered the fund's management fee as well as other fund or class expenses, as applicable, such as transfer agent fees, pricing and bookkeeping fees, fund-paid 12b-1 fees, and custodial, legal, and audit fees. The Board also noted the effects of any waivers and reimbursements on fees and expenses. As part of its review, the Board also considered current and historical total expenses of each class of the fund compared to competitive fund median expenses. Each class of the fund is compared to those funds and classes in the Total Mapped Group (used by the Board for management fee comparisons) that have a similar sales load structure.
The Board noted that the total expenses of each of Initial Class and Service Class ranked below its competitive median for 2005, and the total expenses of each of Investor Class and Service Class 2 ranked above its competitive median for 2005. The Board noted that the fund offers multiple classes, each of which has a different 12b-1 fee structure, and that the multiple structures are intended to offer a range of pricing options for the intermediary market. The Board also noted that the total expenses of the classes vary primarily by the level of their 12b-1 fees, although differences in transfer agent fees may also cause expenses to vary from class to class. The Board considered that Investor Class was above median primarily due to its higher transfer agent fee.
In its review of total expenses, the Board also considered Fidelity fee structures and other information on clients that FMR and its affiliates service in other competitive markets, such as other mutual funds advised or subadvised by FMR or its affiliates, pension plan clients, and other institutional clients.
Annual Report
Board Approval of Investment Advisory Contracts and Management Fees - continued
Based on its review, the Board concluded that the total expenses of each class of the fund were reasonable, although in some cases above the median of the universe presented for comparison, in light of the services that the fund and its shareholders receive and the other factors considered.
Costs of the Services and Profitability. The Board considered the revenues earned and the expenses incurred by Fidelity in conducting the business of developing, marketing, distributing, managing, administering and servicing the fund and its shareholders. The Board also considered the level of Fidelity's profits in respect of all the Fidelity funds.
On an annual basis, FMR presents to the Board Fidelity's profitability for the fund. Fidelity calculates the profitability for each fund, as well as aggregate profitability for groups of Fidelity funds and all Fidelity funds, using a series of detailed revenue and cost allocation methodologies which originate with the audited books and records of Fidelity. The Audit Committee of the Board reviews any significant changes from the prior year's methodologies.
PricewaterhouseCoopers LLP (PwC), independent registered accounting firm and auditor to Fidelity and certain Fidelity funds, has been engaged annually by the Board as part of the Board's assessment of the results of Fidelity's profitability analysis. PwC's engagement includes the review and assessment of Fidelity's methodologies used in determining the revenues and expenses attributable to Fidelity's mutual fund business, and completion of agreed-upon procedures surrounding the mathematical accuracy of fund profitability and its conformity to allocation methodologies. After considering PwC's reports issued under the engagement and information provided by Fidelity, the Board believes that while other allocation methods may also be reasonable, Fidelity's profitability methodologies are reasonable in all material respects.
The Board has also reviewed Fidelity's non-fund businesses and any fall-out benefits related to the mutual fund business as well as cases where Fidelity's affiliates may benefit from or be related to the fund's business.
The Board considered the costs of the services provided by and the profits realized by Fidelity in connection with the operation of the fund and determined that the amount of profit is a fair entrepreneurial profit for the management of the fund.
Economies of Scale. The Board considered whether there have been economies of scale in respect of the management of the Fidelity funds, whether the Fidelity funds (including the fund) have appropriately benefited from any such economies of scale, and whether there is potential for realization of any further economies of scale. The Board considered the extent to which the fund will benefit from economies of scale through increased services to the fund, through waivers or reimbursements, or through fee or expense reductions.
The Board recognized that the fund's management contract incorporates a "group fee" structure, which provides for lower fee rates as total fund assets under FMR's management increase, and for higher fee rates as total fund assets under FMR's management decrease. The Board considered that the group fee is designed to deliver the benefits of economies of scale to fund shareholders when total fund assets increase, even if assets of any particular fund are unchanged or have declined, because some portion of Fidelity's costs are attributable to services provided to all Fidelity funds, and all funds benefit if those costs can be allocated among more assets. The Board concluded that, given the group fee structure, fund shareholders will achieve a certain level of economies of scale as assets under FMR's management increase at the fund complex level, regardless of whether Fidelity achieves any such economies of scale.
The Board further concluded that any potential economies of scale are being shared between fund shareholders and Fidelity in an appropriate manner.
Additional Information Requested by the Board. In order to develop fully the factual basis for consideration of the Advisory Contracts, the Board requested additional information on several topics, including (i) Fidelity's fund profitability methodology and profitability trends within certain funds; (ii) portfolio manager compensation; (iii) the extent to which any economies of scale exist and are shared between the funds and Fidelity; (iv) the total expenses of certain funds and classes relative to competitors, including the extent to which the expenses of certain funds have been or could be capped; (v) fund performance trends; and (vi) Fidelity's fee structures, including use of performance fees.
Based on its evaluation of all of the conclusions noted above, and after considering all material factors, the Board ultimately concluded that the advisory fee structures are fair and reasonable, and that the fund's Advisory Contracts should be renewed.
VIP Growth Stock Portfolio
Annual Report
Investment Adviser
Fidelity Management & Research Company
Boston, MA
Investment Sub-Advisers
FMR Co., Inc.
Fidelity Management & Research (U.K.) Inc.
Fidelity Research & Analysis Company
(formerly Fidelity Management & Research (Far East) Inc.)
Fidelity Investments Japan Limited
Fidelity International Investment Advisors
Fidelity International Investment Advisors
(U.K.) Limited
General Distributor
Fidelity Distributors Corporation
Boston, MA
Transfer and Service Agents
Fidelity Investments Institutional Operations Company, Inc.
Boston, MA
Fidelity Service Company, Inc.
Boston, MA
Custodian
Mellon Bank, N.A.
Pittsburgh, PA
VIPGR-ANN-0207
1.781993.104
Fidelity® Variable Insurance Products:
Health Care Portfolio
Annual Report
December 31, 2006
(2_fidelity_logos) (Registered_Trademark)
Contents
Note to Shareholders | <Click Here> | An explanation of the changes to the fund. |
Performance | <Click Here> | How the fund has done over time. |
Management's Discussion | <Click Here> | The manager's review of fund performance, strategy and outlook. |
Shareholder Expense Example | <Click Here> | An example of shareholder expenses. |
Investment Changes | <Click Here> | A summary of major shifts in the fund's investments over the past six months. |
Investments | <Click Here> | A complete list of the fund's investments with their
market values. |
Financial Statements | <Click Here> | Statements of assets and liabilities, operations, and
changes in net assets, as well as financial highlights. |
Notes | <Click Here> | Notes to the financial statements. |
Report of Independent Registered Public Accounting Firm | <Click Here> | |
Trustees and Officers | <Click Here> | |
Distributions | <Click Here> | |
Proxy Voting Results | <Click Here> | |
Board Approval of Investment Advisory Contracts and Management Fees | <Click Here> | |
| | |
To view a fund's proxy voting guidelines and proxy voting record for the 12-month period ended June 30, visit www.fidelity.com/proxyvotingresults or visit the Securities and Exchange Commission's (SEC) web site at www.sec.gov. You may also call 1-877-208-0098 to request a free copy of the proxy voting guidelines.
Fidelity Variable Insurance Products are separate account options which are purchased through a variable insurance contract.
Standard & Poor's, S&P and S&P 500 are registered service marks of The McGraw-Hill Companies, Inc. and have been licensed for use by Fidelity Distributors Corporation.
Other third party marks appearing herein are the property of their respective owners.
All other marks appearing herein are registered or unregistered trademarks or service marks of FMR Corp. or an affiliated company.
This report and the financial statements contained herein are submitted for the general information of the shareholders of the fund. This report is not authorized for distribution to prospective investors in the fund unless preceded or accompanied by an effective prospectus.
The fund files its complete schedule of portfolio holdings with the SEC for the first and third quarters of each fiscal year on Form N-Q. Forms N-Q are available on the SEC's web site at http://www.sec.gov. The fund's Forms N-Q may be reviewed and copied at the SEC's Public Reference Room in Washington, DC. Information regarding the operation of the SEC's Public Reference Room may be obtained by calling 1-800-SEC-0330. For a complete list of the fund's portfolio holdings, view the most recent quarterly holdings report, semiannual report, or annual report on Fidelity's web site at http://www.advisor.fidelity.com.
NOT FDIC INSURED · MAY LOSE VALUE · NO BANK GUARANTEE
Neither the fund nor Fidelity Distributors Corporation is a bank.
VIP Health Care Portfolio
Note to Shareholders:
Effective October 1, 2006, Fidelity restructured the VIP Sector product line. The restructuring aligned the funds' investment goals more closely with standard industry classifications and facilitated adoption of more-specific benchmark indexes to evaluate fund performance. As restructured, the funds generally align under seven sectors in the widely recognized Global Industry Classification Standard (GICS), developed by Standard & Poor's® (S&P®) and Morgan Stanley Capital InternationalSM (MSCI®): Consumer Discretionary, Energy, Financials, Health Care, Industrials, Information Technology and Utilities. Changes to the funds ranged from simply adopting a new supplemental benchmark to, in some cases, changing investment policies and fund names.
For VIP Consumer Discretionary (formerly VIP Consumer Industries), VIP Energy (formerly VIP Natural Resources), VIP Industrials (formerly VIP Cyclical Industries), and VIP Utilities (formerly VIP Telecommunications & Utilities Growth), shareholders approved certain fundamental investment policy changes related to the restructuring at a special meeting of shareholders held September 20, 2006. All the funds adopted new benchmark indexes from MSCI. Taken together, the name, policy and benchmark changes will make it easier for investors to distinguish funds in the product line and to evaluate Fidelity Management & Research Company's skill in managing the funds.
For VIP Health Care, the fund is now benchmarked to the MSCI US Investable Market Health Care Index.
Annual Report
VIP Health Care Portfolio
Performance: The Bottom Line
Average annual total return reflects the change in the value of an investment, assuming reinvestment of the class' dividend income and capital gains (the profits earned upon the sale of securities that have grown in value) and assuming a constant rate of performance each year. During periods of reimbursement by Fidelity, a fund's total return will be greater than it would be had the reimbursement not occurred. Performance numbers are net of all underlying fund operating expenses, but do not include any insurance charges imposed by your insurance company's separate account. If performance information included the effect of these additional charges, the total returns would have been lower. How a fund did yesterday is no guarantee of how it will do tomorrow.
Average Annual Total Returns
Periods ended December 31, 2006 | Past 1
year | Past 5
years | Life of fund A |
VIP Health Care - Initial Class | 6.34% | 5.49% | 5.42% |
VIP Health Care - Investor Class B | 6.30% | 5.45% | 5.38% |
A From July 18, 2001.
B The initial offering of Investor Class took place on July 21, 2005. Returns prior to July 21, 2005 are those of Initial Class. If Investor Class's transfer agent fee had been reflected, returns prior to July 21, 2005 would have been lower.
$10,000 Life of Fund
Let's say hypothetically that $10,000 was invested in VIP Health Care Portfolio - Initial Class on July 18, 2001, when the fund started. The chart shows how the value of your investment would have changed, and also shows how the Standard & Poor's 500SM Index (S&P 500®) performed over the same period.
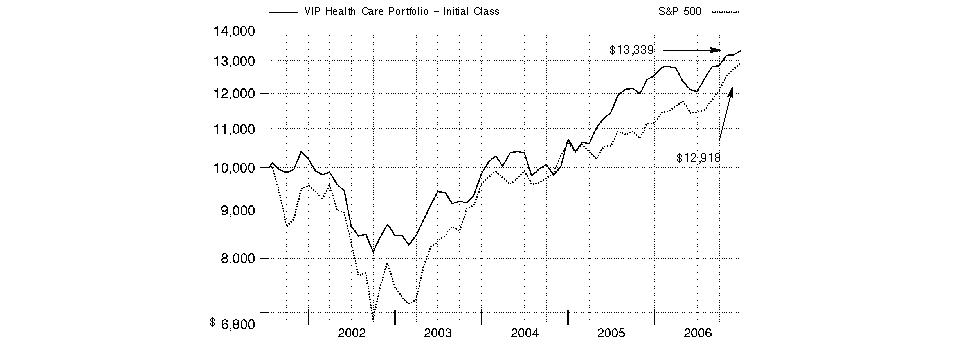
VIP Health Care Portfolio
VIP Health Care Portfolio
Management's Discussion of Fund Performance
Comments from Aaron Cooper, Portfolio Manager of VIP Health Care Portfolio
U.S. stock markets registered their fourth consecutive year of positive returns in 2006. Among the highlights were the performances of the Dow Jones Industrial AverageSM - a gauge of 30 mega-cap, blue-chip stocks - and the small-cap-oriented Russell 2000® Index, both of which reached new highs. The efforts of the Federal Reserve Board to contain inflation levels also dominated the investment headlines. In all, the Fed hiked short-term interest rates four times, but held rates steady after its June 29 increase, finally pausing after 17 rate hikes over a two-year period. A slowing residential housing market and moderating oil prices - the latter of which hit a record closing high of $77 per barrel in July before falling sharply - also held economic growth in check. For the year overall, the Standard & Poor's 500SM Index was up 15.79%, the Dow advanced 19.05%, the Russell 2000 Index gained 18.37% and the NASDAQ Composite® Index rose 10.39%.
For the year ending December 31, 2006, the fund underperformed the 6.85% gain of the Morgan Stanley Capital InternationalSM (MSCI®) US Investable Market Health Care Index, but outperformed the 5.48% advance of a blended index specific to this fund. This blended index is a combination of the Goldman Sachs® Health Care Index, to which the fund was compared through September, and the new MSCI benchmark mentioned above, to which the fund was compared during the period's final three months.1 During the year ending December 31, 2006, the fund trailed the S&P 500®. (For specific portfolio performance results, please refer to the performance section of this report.) For the first nine months of the year, the fund underperformed the benchmark Goldman Sachs index. Underweighted positions in pharmaceutical stocks such as Pfizer and Abbott Laboratories detracted from performance during a period when drug sales were boosted by the introduction of Medicare Part D. Stock selection and overweightings in health care services and managed care detracted as well. However, underexposure to cardiology equipment stocks, such as Medtronic, helped performance as sales growth slowed in their mature product lines. Stock selection in health care facilities and health care supplies also contributed to performance. In the final quarter of the year, the fund outperformed its new MSCI benchmark. During this period, underweighted positions in large-cap pharmaceutical stocks such as Pfizer and Eli Lilly contributed to fund performance, as the Democrats' victory in Congressional elections raised the specter of increasing pressure on drug prices. We also made good stock picks in health care services. Detracting from performance were our choices among health care equipment stocks, including not owning any shares of Medtronic, which rebounded nicely. Some of the stocks I've mentioned were not in the portfolio at the end of the period.
1 The fund's blended index is a customized index developed by Fidelity for the limited purpose of discussing the fund's performance for the 12-month period ending December 31, 2006. From January 1, 2006, through September 30, 2006, the fund compared its performance to the Goldman Sachs Health Care Index, which returned 3.62% during that period. On October 1, 2006, the fund began comparing its performance to a different index, the MSCI US Investable Market Health Care Index, which returned 1.79% from October 1, 2006, through December 31, 2006. For the 12-month period ending December 31, 2006, the blended index (Goldman Sachs and MSCI) returned 5.48%.
The views expressed above reflect those of the portfolio manager(s) only through the end of the period as stated on the cover of this report and do not necessarily represent the views of Fidelity or any other person in the Fidelity organization. Any such views are subject to change at any time based upon market or other conditions and Fidelity disclaims any responsibility to update such views. These views may not be relied on as investment advice and, because investment decisions for a Fidelity fund are based on numerous factors, may not be relied on as an indication of trading intent on behalf of any Fidelity fund.
Annual Report
VIP Health Care Portfolio
Shareholder Expense Example
As a shareholder of the Fund, you incur two types of costs: (1) transaction costs, including redemption fees, and (2) ongoing costs, including management fees and other Fund expenses. This Example is intended to help you understand your ongoing costs (in dollars) of investing in the Fund and to compare these costs with the ongoing costs of investing in other mutual funds.
The Example is based on an investment of $1,000 invested at the beginning of the period and held for the entire period (July 1, 2006 to December 31, 2006).
Actual Expenses
The first line of the accompanying table for each class of the Fund provides information about actual account values and actual expenses. You may use the information in this line, together with the amount you invested, to estimate the expenses that you paid over the period. Simply divide your account value by $1,000.00 (for example, an $8,600 account value divided by $1,000.00 = 8.6), then multiply the result by the number in the first line for a class of the Fund under the heading entitled "Expenses Paid During Period" to estimate the expenses you paid on your account during this period. The estimate of expenses does not include any fees or other expenses of any variable annuity or variable life insurance product. If they were, the estimate of expenses you paid during the period would be higher, and your ending account value would be lower.
Hypothetical Example for Comparison Purposes
The second line of the accompanying table for each class of the Fund provides information about hypothetical account values and hypothetical expenses based on a Class' actual expense ratio and an assumed rate of return of 5% per year before expenses, which is not the Class' actual return. The hypothetical account values and expenses may not be used to estimate the actual ending account balance or expenses you paid for the period. You may use this information to compare the ongoing costs of investing in the Fund and other funds. To do so, compare this 5% hypothetical example with the 5% hypothetical examples that appear in the shareholder reports of the other funds. The estimate of expenses does not include any fees or other expenses of any variable annuity or variable life insurance product. If they were, the estimate of expenses you paid during the period would be higher, and your ending account value would be lower.
Please note that the expenses shown in the table are meant to highlight your ongoing costs only and do not reflect any transaction costs. Therefore, the second line of the table is useful in comparing ongoing costs only, and will not help you determine the relative total costs of owning different funds. In addition, if these transactional costs were included, your costs would have been higher.
| Beginning
Account Value
July 1, 2006 | Ending
Account Value
December 31, 2006 | Expenses Paid
During Period*
July 1, 2006 to
December 31, 2006 |
Initial Class | | | |
Actual | $ 1,000.00 | $ 1,106.70 | $ 4.09 |
Hypothetical A | $ 1,000.00 | $ 1,021.32 | $ 3.92 |
Investor Class | | | |
Actual | $ 1,000.00 | $ 1,107.00 | $ 4.78 |
Hypothetical A | $ 1,000.00 | $ 1,020.67 | $ 4.58 |
A 5% return per year before expenses
* Expenses are equal to each Class' annualized expense ratio (shown in the table below); multiplied by the average account value over the period, multiplied by 184/365 (to reflect the one-half year period).
| Annualized
Expense Ratio |
Initial Class | .77% |
Investor Class | .90% |
VIP Health Care Portfolio
VIP Health Care Portfolio
Investment Changes
Top Ten Stocks as of December 31, 2006 |
| % of fund's
net assets | % of fund's net assets
6 months ago |
Johnson & Johnson | 10.5 | 8.1 |
Merck & Co., Inc. | 5.7 | 5.0 |
Brookdale Senior Living, Inc. | 5.3 | 1.7 |
Healthways, Inc. | 4.7 | 0.5 |
Allergan, Inc. | 4.4 | 2.8 |
Cerner Corp. | 3.9 | 0.1 |
C.R. Bard, Inc. | 3.6 | 0.7 |
Pfizer, Inc. | 3.5 | 7.5 |
UnitedHealth Group, Inc. | 3.1 | 3.7 |
Amgen, Inc. | 2.6 | 4.1 |
| 47.3 | |
Top Industries (% of fund's net assets) |
As of December 31, 2006 |
| Pharmaceuticals | 30.9% | |
| Health Care Providers & Services | 24.1% | |
| Health Care Equipment & Supplies | 18.3% | |
| Biotechnology | 11.3% | |
| Health Care Technology | 5.1% | |
| All Others* | 10.3% | |

|
As of June 30, 2006 |
| Pharmaceuticals | 37.3% | |
| Health Care Providers & Services | 26.7% | |
| Health Care Equipment & Supplies | 14.9% | |
| Biotechnology | 14.4% | |
| Life Sciences Tools & Services | 3.4% | |
| All Others* | 3.3% | |

* Includes short-term investments and net other assets. |
Prior period industry classifications reflect the categories in place as of the date indicated and have not been adjusted to reflect current industry classifications. |
Annual Report
VIP Health Care Portfolio
Investments December 31, 2006
Showing Percentage of Net Assets
Common Stocks - 99.4% |
| Shares | | Value (Note 1) |
BIOTECHNOLOGY - 11.3% |
Biotechnology - 11.3% |
Advanced Cell Technology, Inc. (a) | 24,300 | | $ 14,094 |
Alexion Pharmaceuticals, Inc. (a) | 400 | | 16,156 |
Alnylam Pharmaceuticals, Inc. (a)(d) | 16,200 | | 346,680 |
Amgen, Inc. (a) | 32,896 | | 2,247,126 |
Amylin Pharmaceuticals, Inc. (a) | 16,800 | | 605,976 |
Celgene Corp. (a) | 32,200 | | 1,852,466 |
deCODE genetics, Inc. (a) | 59,338 | | 268,801 |
Genentech, Inc. (a) | 6,200 | | 503,006 |
Gilead Sciences, Inc. (a) | 25,500 | | 1,655,715 |
GTx, Inc. (a) | 17,700 | | 315,768 |
Human Genome Sciences, Inc. (a) | 7,200 | | 89,568 |
MannKind Corp. (a) | 2,400 | | 39,576 |
Medarex, Inc. (a) | 12,100 | | 178,959 |
Omrix Biopharmaceuticals, Inc. (a) | 8,300 | | 251,158 |
PDL BioPharma, Inc. (a) | 14,500 | | 292,030 |
Senomyx, Inc. (a) | 5,800 | | 75,342 |
Solexa, Inc. (a) | 22,345 | | 293,837 |
Tercica, Inc. (a) | 25,800 | | 129,000 |
Transition Therapeutics, Inc. (a) | 41,600 | | 55,300 |
Trubion Pharmaceuticals, Inc. | 7,202 | | 129,708 |
Vertex Pharmaceuticals, Inc. (a) | 8,500 | | 318,070 |
| | 9,678,336 |
CHEMICALS - 1.7% |
Diversified Chemicals - 0.3% |
Bayer AG | 4,400 | | 234,784 |
Fertilizers & Agricultural Chemicals - 1.4% |
Fertilizantes Fosfatados SA (PN) | 8,600 | | 137,664 |
Monsanto Co. | 16,300 | | 856,239 |
Potash Corp. of Saskatchewan, Inc. | 1,800 | | 258,264 |
| | 1,252,167 |
TOTAL CHEMICALS | | 1,486,951 |
COMMERCIAL SERVICES & SUPPLIES - 0.3% |
Diversified Commercial & Professional Services - 0.3% |
Healthcare Services Group, Inc. | 10,291 | | 298,027 |
DIVERSIFIED CONSUMER SERVICES - 0.3% |
Specialized Consumer Services - 0.3% |
Service Corp. International | 9,600 | | 98,400 |
Weight Watchers International, Inc. | 3,700 | | 194,361 |
| | 292,761 |
FOOD PRODUCTS - 1.5% |
Agricultural Products - 0.6% |
Biomar Holdings AS | 5,500 | | 239,533 |
Nutreco Holding NV | 4,100 | | 267,339 |
| | 506,872 |
Packaged Foods & Meats - 0.9% |
Cermaq ASA | 12,600 | | 183,899 |
|
| Shares | | Value (Note 1) |
Groupe Danone | 1,100 | | $ 166,715 |
Koninklijke Numico NV | 5,000 | | 268,991 |
PAN Fish ASA (a) | 205,000 | | 187,411 |
| | 807,016 |
TOTAL FOOD PRODUCTS | | 1,313,888 |
HEALTH CARE EQUIPMENT & SUPPLIES - 18.3% |
Health Care Equipment - 14.4% |
Advanced Medical Optics, Inc. (a) | 7,300 | | 256,960 |
ArthroCare Corp. (a) | 5,400 | | 215,568 |
Aspect Medical Systems, Inc. (a) | 11,900 | | 223,839 |
Baxter International, Inc. | 41,720 | | 1,935,391 |
Becton, Dickinson & Co. | 19,200 | | 1,346,880 |
Biosite, Inc. (a) | 23,232 | | 1,134,883 |
C.R. Bard, Inc. | 36,700 | | 3,044,999 |
Cochlear Ltd. | 5,000 | | 228,926 |
DexCom, Inc. (a)(d) | 11,200 | | 110,432 |
Electro-Optical Sciences, Inc. (a)(e) | 50,420 | | 328,991 |
Electro-Optical Sciences, Inc. warrants 11/2/11 (a)(e) | 7,563 | | 27,914 |
Imaging Dynamics Co. Ltd. (a) | 32,200 | | 59,926 |
Intuitive Surgical, Inc. (a) | 1,800 | | 172,620 |
IRIS International, Inc. (a)(d) | 7,709 | | 97,519 |
Kyphon, Inc. (a) | 6,100 | | 246,440 |
Meridian Bioscience, Inc. | 3,600 | | 88,308 |
NeuroMetrix, Inc. (a) | 7,900 | | 117,789 |
Nobel Biocare Holding AG (Switzerland) | 645 | | 190,624 |
Northstar Neuroscience, Inc. | 21,600 | | 310,608 |
Respironics, Inc. (a) | 7,400 | | 279,350 |
Restore Medical, Inc. | 5,800 | | 24,418 |
Sirona Dental Systems, Inc. | 3,265 | | 125,735 |
St. Jude Medical, Inc. (a) | 4,520 | | 165,251 |
Stereotaxis, Inc. (a)(d) | 37,064 | | 382,500 |
The Spectranetics Corp. (a) | 6,300 | | 71,127 |
Thermogenesis Corp. (a) | 264,949 | | 1,141,930 |
| | 12,328,928 |
Health Care Supplies - 3.9% |
Alcon, Inc. | 8,200 | | 916,514 |
Align Technology, Inc. (a) | 3,300 | | 46,101 |
Cooper Companies, Inc. | 25,557 | | 1,137,287 |
DJO, Inc. (a) | 7,123 | | 305,007 |
Gen-Probe, Inc. (a) | 2,200 | | 115,214 |
Inverness Medical Innovations, Inc. (a) | 12,700 | | 491,490 |
Inverness Medical Innovations, Inc. (a)(e) | 2,231 | | 86,340 |
Merit Medical Systems, Inc. (a) | 14,600 | | 231,264 |
| | 3,329,217 |
TOTAL HEALTH CARE EQUIPMENT & SUPPLIES | | 15,658,145 |
Common Stocks - continued |
| Shares | | Value (Note 1) |
HEALTH CARE PROVIDERS & SERVICES - 24.1% |
Health Care Distributors & Services - 2.6% |
Cardinal Health, Inc. | 19,600 | | $ 1,262,828 |
McKesson Corp. | 19,000 | | 963,300 |
| | 2,226,128 |
Health Care Facilities - 7.1% |
Acibadem Saglik Hizmetleri AS | 9,000 | | 96,644 |
Brookdale Senior Living, Inc. (d) | 95,200 | | 4,569,600 |
Bumrungrad Hospital PCL (For. Reg.) | 179,200 | | 187,035 |
Capital Senior Living Corp. (a) | 36,500 | | 388,360 |
Community Health Systems, Inc. (a) | 8,900 | | 325,028 |
Emeritus Corp. (a) | 5,700 | | 141,645 |
Sun Healthcare Group, Inc. (a) | 8,800 | | 111,144 |
VCA Antech, Inc. (a) | 7,780 | | 250,438 |
| | 6,069,894 |
Health Care Services - 9.6% |
AMN Healthcare Services, Inc. (a) | 7,800 | | 214,812 |
Caremark Rx, Inc. | 22,700 | | 1,296,397 |
Cross Country Healthcare, Inc. (a) | 12,366 | | 269,826 |
Diagnosticos da America SA (a) | 7,000 | | 148,519 |
Emergency Medical Services Corp. Class A | 8,100 | | 169,938 |
Express Scripts, Inc. (a) | 4,700 | | 336,520 |
HAPC, Inc. unit | 29,700 | | 178,200 |
Health Grades, Inc. (a) | 52,161 | | 234,203 |
Healthways, Inc. (a) | 84,404 | | 4,026,915 |
HMS Holdings Corp. (a) | 14,500 | | 219,675 |
Medco Health Solutions, Inc. (a) | 15,600 | | 833,664 |
Nighthawk Radiology Holdings, Inc. | 5,290 | | 134,895 |
Providence Service Corp. (a) | 5,000 | | 125,650 |
| | 8,189,214 |
Managed Health Care - 4.8% |
Health Net, Inc. (a) | 6,100 | | 296,826 |
Humana, Inc. (a) | 7,900 | | 436,949 |
UnitedHealth Group, Inc. | 48,570 | | 2,609,666 |
WellPoint, Inc. (a) | 9,900 | | 779,031 |
| | 4,122,472 |
TOTAL HEALTH CARE PROVIDERS & SERVICES | | 20,607,708 |
HEALTH CARE TECHNOLOGY - 5.1% |
Health Care Technology - 5.1% |
Allscripts Healthcare Solutions, Inc. (a) | 6,300 | | 170,037 |
Cerner Corp. (a)(d) | 74,070 | | 3,370,185 |
Eclipsys Corp. (a) | 8,533 | | 175,438 |
IMS Health, Inc. | 6,600 | | 181,368 |
Vital Images, Inc. (a) | 7,800 | | 271,440 |
WebMD Health Corp. Class A (a)(d) | 5,222 | | 208,984 |
| | 4,377,452 |
|
| Shares | | Value (Note 1) |
HOTELS, RESTAURANTS & LEISURE - 0.6% |
Leisure Facilities - 0.6% |
Life Time Fitness, Inc. (a) | 4,200 | | $ 203,742 |
Town Sports International Holdings, Inc. | 18,900 | | 311,472 |
| | 515,214 |
LEISURE EQUIPMENT & PRODUCTS - 0.4% |
Leisure Products - 0.4% |
Cybex International, Inc. (a) | 54,303 | | 326,361 |
LIFE SCIENCES TOOLS & SERVICES - 4.2% |
Life Sciences Tools & Services - 4.2% |
Advanced Magnetics, Inc. (a) | 11,293 | | 674,418 |
Affymetrix, Inc. (a) | 9,300 | | 214,458 |
Charles River Laboratories International, Inc. (a) | 8,100 | | 350,325 |
Covance, Inc. (a) | 9,500 | | 559,645 |
Exelixis, Inc. (a) | 45,900 | | 413,100 |
Illumina, Inc. (a) | 1,618 | | 63,604 |
Millipore Corp. (a) | 8,000 | | 532,800 |
Pharmaceutical Product Development, Inc. | 4,700 | | 151,434 |
QIAGEN NV (a) | 30,200 | | 456,926 |
Thermo Fisher Scientific, Inc. (a) | 4,000 | | 181,160 |
| | 3,597,870 |
PERSONAL PRODUCTS - 0.3% |
Personal Products - 0.3% |
Herbalife Ltd. (a) | 5,400 | | 216,864 |
PHARMACEUTICALS - 30.9% |
Pharmaceuticals - 30.9% |
Adams Respiratory Therapeutics, Inc. (a) | 11,095 | | 452,787 |
Allergan, Inc. | 31,150 | | 3,729,901 |
Barr Pharmaceuticals, Inc. (a) | 9,100 | | 456,092 |
BioMimetics Therapeutics, Inc. | 39,145 | | 516,323 |
Bristol-Myers Squibb Co. | 20,100 | | 529,032 |
Cadence Pharmaceuticals, Inc. | 200 | | 2,464 |
Cipla Ltd. | 17,416 | | 99,230 |
Elan Corp. PLC sponsored ADR (a) | 6,100 | | 89,975 |
Endo Pharmaceuticals Holdings, Inc. (a) | 11,500 | | 317,170 |
Inyx, Inc. (a) | 104,000 | | 242,320 |
Javelin Pharmaceuticals, Inc. (a) | 4,600 | | 23,920 |
Johnson & Johnson | 136,319 | | 8,999,780 |
Merck & Co., Inc. | 111,080 | | 4,843,088 |
Novartis AG sponsored ADR | 3,200 | | 183,808 |
Pfizer, Inc. | 115,940 | | 3,002,846 |
Roche Holding AG (participation certificate) | 1,441 | | 258,303 |
Schering-Plough Corp. | 7,400 | | 174,936 |
Shire PLC sponsored ADR | 4,400 | | 271,744 |
Wyeth | 40,520 | | 2,063,278 |
Xenoport, Inc. (a) | 7,000 | | 171,850 |
| | 26,428,847 |
Common Stocks - continued |
| Shares | | Value (Note 1) |
SOFTWARE - 0.2% |
Systems Software - 0.2% |
Quality Systems, Inc. | 4,452 | | $ 165,926 |
TEXTILES, APPAREL & LUXURY GOODS - 0.2% |
Apparel, Accessories & Luxury Goods - 0.2% |
Under Armour, Inc. Class A (sub. vtg.) (a) | 3,100 | | 156,395 |
TOTAL COMMON STOCKS (Cost $70,743,593) | 85,120,745 |
Money Market Funds - 3.9% |
| | | |
Fidelity Cash Central Fund, 5.37% (b) | 760,065 | | 760,065 |
Fidelity Securities Lending Cash Central Fund, 5.38% (b)(c) | 2,570,315 | | 2,570,315 |
TOTAL MONEY MARKET FUNDS (Cost $3,330,380) | 3,330,380 |
TOTAL INVESTMENT PORTFOLIO - 103.3% (Cost $74,073,973) | | 88,451,125 |
NET OTHER ASSETS - (3.3)% | | (2,804,153) |
NET ASSETS - 100% | $ 85,646,972 |
Legend |
(a) Non-income producing |
(b) Affiliated fund that is available only to investment companies and other accounts managed by Fidelity Investments. The rate quoted is the annualized seven-day yield of the fund at period end. A complete unaudited listing of the fund's holdings as of its most recent quarter end is available upon request. |
(c) Investment made with cash collateral received from securities on loan. |
(d) Security or a portion of the security is on loan at period end. |
(e) Restricted securities - Investment in securities not registered under the Securities Act of 1933 (excluding 144A issues). At the end of the period, the value of restricted securities (excluding 144A issues) amounted to $443,245 or 0.5% of net assets. |
Additional information on each holding is as follows: |
Security | Acquisition Date | Acquisition Cost |
Electro-Optical Sciences, Inc. | 11/1/06 | $ 287,394 |
Electro-Optical Sciences, Inc. warrants 11/2/11 | 11/1/06 | $ 1 |
Inverness Medical Innovations, Inc. | 2/8/06 | $ 54,459 |
Affiliated Central Funds |
Information regarding fiscal year to date income earned by the Fund from investments in Fidelity Central Funds is as follows: |
Fund | Income earned |
Fidelity Cash Central Fund | $ 19,603 |
Fidelity Securities Lending Cash Central Fund | 37,439 |
Total | $ 57,042 |
See accompanying notes which are an integral part of the financial statements.
VIP Health Care Portfolio
VIP Health Care Portfolio
Financial Statements
Statement of Assets and Liabilities
| December 31, 2006 |
| | |
Assets | | |
Investment in securities, at value (including securities loaned of $2,488,765) - See accompanying schedule: Unaffiliated issuers
(cost $70,743,593) | $ 85,120,745 | |
Fidelity Central Funds
(cost $3,330,380) | 3,330,380 | |
Total Investments (cost $74,073,973) | | $ 88,451,125 |
Receivable for investments sold | | 60,676 |
Dividends receivable | | 122,902 |
Interest receivable | | 637 |
Prepaid expenses | | 442 |
Other receivables | | 4,755 |
Total assets | | 88,640,537 |
| | |
Liabilities | | |
Payable to custodian bank | $ 137,131 | |
Payable for investments purchased | 193,534 | |
Accrued management fee | 41,202 | |
Other affiliated payables | 9,309 | |
Other payables and accrued expenses | 42,074 | |
Collateral on securities loaned,
at value | 2,570,315 | |
Total liabilities | | 2,993,565 |
| | |
Net Assets | | $ 85,646,972 |
Net Assets consist of: | | |
Paid in capital | | $ 66,020,901 |
Undistributed net investment income | | 303,622 |
Accumulated undistributed net realized gain (loss) on investments and foreign currency transactions | | 4,946,780 |
Net unrealized appreciation (depreciation) on investments and assets and liabilities in foreign currencies | | 14,375,669 |
Net Assets | | $ 85,646,972 |
Statement of Assets and Liabilities - continued
| December 31, 2006 |
| | |
Initial Class:
Net Asset Value, offering price and redemption price per share ($69,418,120 ÷ 5,268,965 shares) | | $ 13.17 |
| | |
Investor Class:
Net Asset Value, offering price and redemption price per share ($16,228,852 ÷ 1,235,349 shares) | | $ 13.14 |
See accompanying notes which are an integral part of the financial statements.
Annual Report
VIP Health Care Portfolio
Financial Statements - continued
Statement of Operations
| Year ended December 31, 2006 |
| | |
Investment Income | | |
Dividends | | $ 1,040,695 |
Interest | | 84 |
Income from Fidelity Central Funds | | 57,042 |
Total income | | 1,097,821 |
| | |
Expenses | | |
Management fee | $ 568,676 | |
Transfer agent fees | 86,044 | |
Accounting and security lending fees | 39,567 | |
Custodian fees and expenses | 39,880 | |
Independent trustees' compensation | 388 | |
Audit | 38,691 | |
Legal | 2,726 | |
Interest | 5,149 | |
Miscellaneous | 12,300 | |
Total expenses before reductions | 793,421 | |
Expense reductions | (10,918) | 782,503 |
Net investment income (loss) | | 315,318 |
Realized and Unrealized Gain (Loss) Net realized gain (loss) on: | | |
Investment securities: | | |
Unaffiliated issuers | 10,232,514 | |
Foreign currency transactions | (895) | |
Total net realized gain (loss) | | 10,231,619 |
Change in net unrealized appreciation (depreciation) on: Investment securities (net of increase in deferred foreign taxes of $1,012) | (5,490,461) | |
Assets and liabilities in foreign currencies | (471) | |
Total change in net unrealized appreciation (depreciation) | | (5,490,932) |
Net gain (loss) | | 4,740,687 |
Net increase (decrease) in net assets resulting from operations | | $ 5,056,005 |
Statement of Changes in Net Assets
| Year ended
December 31, 2006 | Year ended
December 31, 2005 |
Increase (Decrease) in Net Assets | | |
Operations | | |
Net investment income (loss) | $ 315,318 | $ 55,999 |
Net realized gain (loss) | 10,231,619 | 4,460,592 |
Change in net unrealized appreciation (depreciation) | (5,490,932) | 10,191,871 |
Net increase (decrease) in net assets resulting from operations | 5,056,005 | 14,708,462 |
Distributions to shareholders from net investment income | (52,605) | (148,996) |
Share transactions - net increase (decrease) | (45,672,265) | 45,974,918 |
Redemption fees | 27,198 | 35,950 |
Total increase (decrease) in net assets | (40,641,667) | 60,570,334 |
| | |
Net Assets | | |
Beginning of period | 126,288,639 | 65,718,305 |
End of period (including undistributed net investment income of $303,622 and undistributed net investment income of $40,533, respectively) | $ 85,646,972 | $ 126,288,639 |
See accompanying notes which are an integral part of the financial statements.
VIP Health Care Portfolio
Financial Highlights - Initial Class
Years ended December 31, | 2006 | 2005 | 2004 | 2003 | 2002 |
Selected Per-Share Data | | | | | |
Net asset value, beginning of period | $ 12.39 | $ 10.61 | $ 9.77 | $ 8.41 | $ 10.19 |
Income from Investment Operations | | | | | |
Net investment income (loss) C | .04 | .01 | .03 | .03 | .04 |
Net realized and unrealized gain (loss) | .75 | 1.80 | .84 | 1.33 | (1.79) |
Total from investment operations | .79 | 1.81 | .87 | 1.36 | (1.75) |
Distributions from net investment income | (.01) | (.03) | (.04) | - | (.03) |
Distributions from net realized gain | - | - | - | - | (.01) |
Total distributions | (.01) | (.03) | (.04) | - | (.04) |
Redemption fees added to paid in capital C | - G | -G | .01 | -G | .01 |
Net asset value, end of period | $ 13.17 | $ 12.39 | $ 10.61 | $ 9.77 | $ 8.41 |
Total Return A, B | 6.34% | 17.05% | 8.97% | 16.17% | (17.08)% |
Ratios to Average Net Assets D, F | | | | | |
Expenses before reductions | .77% | .75% | .77% | .89% | .84% |
Expenses net of fee waivers, if any | .77% | .75% | .77% | .89% | .84% |
Expenses net of all reductions | .76% | .70% | .76% | .85% | .79% |
Net investment income (loss) | .33% | .06% | .26% | .32% | .39% |
Supplemental Data | | | | | |
Net assets, end of period (000 omitted) | $ 69,418 | $ 118,928 | $ 65,718 | $ 52,603 | $ 47,471 |
Portfolio turnover rate E | 106% | 122% | 56% | 124% | 166% |
A Total returns do not reflect charges attributable to your insurance company's separate account. Inclusion of these charges would reduce the total returns shown.
B Total returns would have been lower had certain expenses not been reduced during the periods shown.
C Calculated based on average shares outstanding during the period.
D Fees and expenses of the underlying Fidelity Central Funds are not included in the Fund's expense ratio. The Fund indirectly bears its proportionate share of the expenses of any underlying Fidelity Central Funds.
E Amount does not include the portfolio activity of any underlying Fidelity Central Funds.
F Expense ratios reflect operating expenses of the class. Expenses before reductions do not reflect amounts reimbursed by the investment adviser or reductions from brokerage service arrangements or other expense offset arrangements and do not represent the amount paid by the class during periods when reimbursements or reductions occur. Expenses net of fee waivers reflect expenses after reimbursement by the investment adviser but prior to reductions from brokerage service arrangements or other expense offset arrangements. Expenses net of all reductions represent the net expenses paid by the class.
G Amount represents less than $.01 per share.
Financial Highlights - Investor Class
Years ended December 31, | 2006 | 2005 H |
Selected Per-Share Data | | |
Net asset value, beginning of period | $ 12.37 | $ 11.64 |
Income from Investment Operations | | |
Net investment income (loss) E | .03 | (.01) |
Net realized and unrealized gain (loss) | .75 | .74 |
Total from investment operations | .78 | .73 |
Distributions from net investment income | (.01) | - |
Redemption fees added to paid in capital E, J | - | - |
Net asset value, end of period | $ 13.14 | $ 12.37 |
Total Return B, C, D | 6.30% | 6.27% |
Ratios to Average Net Assets F, I | | |
Expenses before reductions | .90% | .93% A |
Expenses net of fee waivers, if any | .90% | .93% A |
Expenses net of all reductions | .89% | .89% A |
Net investment income (loss) | .20% | (.25)% A |
Supplemental Data | | |
Net assets, end of period (000 omitted) | $ 16,229 | $ 7,360 |
Portfolio turnover rate G | 106% | 122% |
A Annualized
B Total returns for periods of less than one year are not annualized.
C Total returns do not reflect charges attributable to your insurance company's separate account. Inclusion of these charges would reduce the total returns shown.
D Total returns would have been lower had certain expenses not been reduced during the periods shown.
E Calculated based on average shares outstanding during the period.
F Fees and expenses of the underlying Fidelity Central Funds are not included in the Fund's expense ratio. The Fund indirectly bears its proportionate share of the expenses of any underlying Fidelity Central Funds.
G Amount does not include the portfolio activity of any underlying Fidelity Central Funds.
H For the period July 21, 2005 (commencement of sale of shares) to December 31, 2005.
I Expense ratios reflect operating expenses of the class. Expenses before reductions do not reflect amounts reimbursed by the investment adviser or reductions from brokerage service arrangements or other expense offset arrangements and do not represent the amount paid by the class during periods when reimbursements or reductions occur. Expense ratios before reductions for start-up periods may not be representative of longer-term operating periods. Expenses net of fee waivers reflect expenses after reimbursement by the investment adviser but prior to reductions from brokerage service arrangements or other expense offset arrangements. Expenses net of all reductions represent the net expenses paid by the class.
J Amount represents less than $.01 per share.
See accompanying notes which are an integral part of the financial statements.
Annual Report
Notes to Financial Statements
For the period ended December 31, 2006
1. Significant Accounting Policies.
VIP Health Care Portfolio (the Fund) is a non-diversified fund of Variable Insurance Products Fund IV (the trust) and is authorized to issue an unlimited number of shares. The trust is registered under the Investment Company Act of 1940, as amended (the 1940 Act), as an open-end management investment company organized as a Massachusetts business trust. Shares of the Fund may only be purchased by insurance companies for the purpose of funding variable annuity or variable life insurance contracts. The Fund offers the following classes of shares: Initial Class shares and Investor Class shares. All classes have equal rights and voting privileges, except for matters affecting a single class. Investment income, realized and unrealized capital gains and losses, the common expenses of the Fund, and certain fund-level expense reductions, if any, are allocated on a pro rata basis to each class based on the relative net assets of each class to the total net assets of the Fund. Each class differs with respect to transfer agent fees incurred. Certain expense reductions also differ by class.
The Fund may invest in Fidelity Central Funds which are open-end investment companies available to investment companies and other accounts managed by Fidelity Management & Research Company (FMR) and its affiliates. The financial statements have been prepared in conformity with accounting principles generally accepted in the United States of America, which require management to make certain estimates and assumptions at the date of the financial statements. The following summarizes the significant accounting policies of the Fund, which are also consistently followed by the Fidelity Central Funds:
Security Valuation. Investments are valued and net asset value (NAV) per share is calculated (NAV calculation) as of the close of business of the New York Stock Exchange (NYSE), normally 4:00 p.m. Eastern time. Wherever possible, the Fund uses independent pricing services approved by the Board of Trustees to value its investments.
Equity securities, including restricted securities, for which market quotations are readily available, are valued at the last reported sale price or official closing price as reported by an independent pricing service on the primary market or exchange on which they are traded. In the event there were no sales during the day or closing prices are not available, securities are valued at the last quoted bid price. Investments in open-end mutual funds, including the Fidelity Central Funds, are valued at their closing net asset value each business day. Short-term securities with remaining maturities of sixty days or less for which quotations are not readily available are valued at amortized cost, which approximates value.
When current market prices or quotations are not readily available or do not accurately reflect fair value, valuations may be determined in accordance with procedures adopted by the Board of Trustees. For example, when developments occur between the close of a market and the close of the NYSE that may materially affect the value of some or all of the securities, or when trading in a security is halted, those securities may be fair valued. Factors used in the determination of fair value may include monitoring news to identify significant market or security specific events such as changes in the value of U.S. securities markets, reviewing developments in foreign markets and evaluating the performance of ADRs, futures contracts and exchange-traded funds. Because the Fund's utilization of fair value pricing depends on market activity, the frequency with which fair value pricing is used can not be predicted and may be utilized to a significant extent. The value of securities used for NAV calculation under fair value pricing may differ from published prices for the same securities.
Foreign Currency. The Fund uses foreign currency contracts to facilitate transactions in foreign-denominated securities. Losses from these transactions may arise from changes in the value of the foreign currency or if the counterparties do not perform under the contracts' terms.
Foreign-denominated assets, including investment securities, and liabilities are translated into U.S. dollars at the exchange rate at period end. Purchases and sales of investment securities, income and dividends received and expenses denominated in foreign currencies are translated into U.S. dollars at the exchange rate in effect on the transaction date.
The effects of exchange rate fluctuations on investments are included with the net realized and unrealized gain (loss) on investment securities. Other foreign currency transactions resulting in realized and unrealized gain (loss) are disclosed separately.
Investment Transactions and Income. Security transactions, including the Fund's investment activity in the Fidelity Central Funds, are accounted for as of trade date. Gains and losses on securities sold are determined on the basis of identified cost and may include proceeds received from litigation. Dividend income is recorded on the ex-dividend date, except for certain dividends from foreign securities where the ex-dividend date may have passed, which are recorded as soon as the Fund is informed of the ex-dividend date. Non-cash dividends included in dividend income, if any, are recorded at the fair market value of the securities received. Distributions received on securities that represent a return of capital or capital gain are recorded as a reduction of cost of investments and/or as a realized gain. The Fund estimates the components of distributions received that may be considered return of capital distributions or capital gain distributions. Interest income and income distributions from the Fidelity Central Funds are accrued as earned, with any income distributions receivable as of period end included in Interest Receivable on the Statement of Assets and Liabilities. Interest income includes coupon interest and amortization of premium and accretion of discount on debt securities. Investment income is recorded net of foreign taxes withheld where recovery of such taxes is uncertain.
Expenses. Most expenses of the trust can be directly attributed to a fund. Expenses which cannot be directly attributed are apportioned among each Fund in the trust. Expense estimates are accrued in the period to which they relate and adjustments are made when actual amounts are known.
VIP Health Care Portfolio
1. Significant Accounting Policies - continued
Income Tax Information and Distributions to Shareholders. Each year, the Fund intends to qualify as a regulated investment company by distributing all of its taxable income and realized gains under Subchapter M of the Internal Revenue Code. As a result, no provision for income taxes is required in the accompanying financial statements. Foreign taxes are provided for based on the Fund's understanding of the tax rules and rates that exist in the foreign markets in which it invests.
Distributions are recorded on the ex-dividend date. Income dividends and capital gain distributions are declared separately for each class. Income and capital gain distributions are determined in accordance with income tax regulations, which may differ from generally accepted accounting principles.
Capital accounts within the financial statements are adjusted for permanent book-tax differences. These adjustments have no impact on net assets or the results of operations. Temporary book-tax differences will reverse in a subsequent period.
Book-tax differences are primarily due to foreign currency transactions, capital loss carryforwards and losses deferred due to wash sales.
The tax-basis components of distributable earnings and the federal tax cost as of period end were as follows:
Unrealized appreciation | $ 15,110,601 | |
Unrealized depreciation | (946,153) | |
Net unrealized appreciation (depreciation) | 14,164,448 | |
Undistributed ordinary income | 1,053,425 | |
Undistributed long-term capital gain | 4,408,200 | |
| | |
Cost for federal income tax purposes | $ 74,286,677 | |
The tax character of distributions paid was as follows:
| December 31, 2006 | December 31, 2005 |
Ordinary Income | $ 52,605 | $ 148,996 |
Trading (Redemption) Fees. Initial Class shares and Investor Class shares held less than 60 days are subject to a redemption fee equal to 1% of the proceeds of the redeemed shares. All redemption fees, including any estimated redemption fees paid by FMR, are retained by the Fund and accounted for as an addition to paid in capital.
New Accounting Pronouncements. In July 2006, Financial Accounting Standards Board Interpretation No. 48, Accounting for Uncertainty in Income Taxes - an interpretation of FASB Statement 109 (FIN 48), was issued and is effective on the last business day of the semiannual reporting period for fiscal years beginning after December 15, 2006. FIN 48 sets forth a threshold for financial statement recognition, measurement and disclosure of a tax position taken or expected to be taken on a tax return. Management is currently evaluating the impact, if any, the adoption of FIN 48 will have on the Fund's net assets, results of operations and financial statement disclosures.
In addition, in September 2006, Statement of Financial Accounting Standards No. 157, Fair Value Measurements (SFAS 157), was issued and is effective for fiscal years beginning after November 15, 2007. SFAS 157 defines fair value, establishes a framework for measuring fair value and expands disclosures about fair value measurements. Management is currently evaluating the impact the adoption of SFAS 157 will have on the Fund's financial statement disclosures.
2. Operating Policies.
Repurchase Agreements. FMR has received an Exemptive Order from the Securities and Exchange Commission (the SEC) which permits the Fund and other affiliated entities of FMR to transfer uninvested cash balances into joint trading accounts which are then invested in repurchase agreements. The Fund may also invest directly with institutions in repurchase agreements. Repurchase agreements are collateralized by government or non-government securities. Upon settlement date, collateral is held in segregated accounts with custodian banks and may be obtained in the event of a default of the counterparty. The Fund monitors, on a daily basis, the value of the collateral to ensure it is at least equal to the principal amount of the repurchase agreement (including accrued interest). In the event of a default by the counterparty, realization of the collateral proceeds could be delayed, during which time the value of the collateral may decline.
Restricted Securities. The Fund may invest in securities that are subject to legal or contractual restrictions on resale. These securities generally may be resold in transactions exempt from registration or to the public if the securities are registered. Disposal of these securities may involve time-consuming negotiations and expense, and prompt sale at an acceptable price may be difficult. Information regarding restricted securities is included at the end of the Fund's Schedule of Investments.
Annual Report
Notes to Financial Statements - continued
3. Purchases and Sales of Investments.
Purchases and sales of securities, other than short-term securities, aggregated $106,766,204 and $151,461,884, respectively.
4. Fees and Other Transactions with Affiliates.
Management Fee. FMR and its affiliates provide the Fund with investment management related services for which the Fund pays a monthly management fee. The management fee is the sum of an individual fund fee rate that is based on an annual rate of .30% of the Fund's average net assets and a group fee rate that averaged .27% during the period. The group fee rate is based upon the average net assets of all the mutual funds advised by FMR. The group fee rate decreases as assets under management increase and increases as assets under management decrease. For the period, the total annual management fee rate was .57% of the Fund's average net assets.
Transfer Agent Fees. Fidelity Investments Institutional Operations Company, Inc. (FIIOC), an affiliate of FMR, is the fund's transfer, dividend disbursing, and shareholder servicing agent. FIIOC receives an asset-based fee with respect to each class. Each class with the exception of Investor Class pays a transfer agent fee, excluding out of pocket expenses, equal to an annual rate of .07% of their month end net assets. Investor Class pays a monthly asset-based transfer agent fee of .18% of its month end net assets. The total transfer agent fees paid by each class to FIIOC, including out of pocket expenses, were as follows:
Initial Class | $ 60,948 |
Investor Class | 25,096 |
| $ 86,044 |
Accounting and Security Lending Fees. Fidelity Service Company, Inc. (FSC), an affiliate of FMR, maintains the Fund's accounting records. The accounting fee is based on the level of average net assets for the month. Under a separate contract, FSC administers the security lending program. The security lending fee is based on the number and duration of lending transactions.
Investments in Fidelity Central Funds. The Fund may invest in Fidelity Central Funds. The Fund's Schedule of Investments lists each of the Fidelity Central Funds as an investment of the Fund but does not include the underlying holdings of each Fidelity Central Fund. As an Investing Fund, the Fund indirectly bears its proportionate share of the expenses of the underlying Fidelity Central Funds. A complete unaudited list of holdings for each Fidelity Central Fund is available upon request. In addition, the financial statements of the Fidelity Central Funds, which are not covered by the Fund's Report of Independent Registered Public Accounting Firm, are available on the EDGAR Database on the SEC's web site, www.sec.gov, or upon request.
The Money Market Central Funds seek preservation of capital and current income and are managed by Fidelity Investments Money Management, Inc. (FIMM), an affiliate of FMR.
Brokerage Commissions. The Fund placed a portion of its portfolio transactions with brokerage firms which are affiliates of the investment adviser. The commissions paid to these affiliated firms were $754 for the period.
Interfund Lending Program. Pursuant to an Exemptive Order issued by the SEC, the Fund, along with other registered investment companies having management contracts with FMR, may participate in an interfund lending program. This program provides an alternative credit facility allowing the funds to borrow from, or lend money to, other participating affiliated funds. At period end, there were no interfund loans outstanding. The Fund's activity in this program during the period for which loans were outstanding was as follows:
Borrower or Lender | Average Daily Loan Balance | Weighted Average Interest Rate | Interest Expense |
Borrower | $ 5,355,429 | 4.94% | $ 5,149 |
5. Committed Line of Credit.
The Fund participates with other funds managed by FMR in a $4.2 billion credit facility (the "line of credit") to be utilized for temporary or emergency purposes to fund shareholder redemptions or for other short-term liquidity purposes. The Fund has agreed to pay commitment fees on its pro rata portion of the line of credit, which amounted to $301 and is reflected in Miscellaneous Expense on the Statement of Operations. During the period, there were no borrowings on this line of credit.
6. Security Lending.
The Fund lends portfolio securities from time to time in order to earn additional income. On the settlement date of the loan, the Fund receives collateral (in the form of U.S. Treasury obligations, letters of credit and/or cash) against the loaned securities and maintains collateral in an amount not less than 100% of the market value of the loaned securities during the period of the loan. The market value of the loaned securities is determined at the
VIP Health Care Portfolio
6. Security Lending - continued
close of business of the Fund and any additional required collateral is delivered to the Fund on the next business day. If the borrower defaults on its obligation to return the securities loaned because of insolvency or other reasons, a fund could experience delays and costs in recovering the securities loaned or in gaining access to the collateral. Any cash collateral received is invested in the Fidelity Securities Lending Cash Central Fund. The value of loaned securities and cash collateral at period end are disclosed on the Fund's Statement of Assets and Liabilities. Security lending income represents the income earned on investing cash collateral, less fees and expenses associated with the loan, plus any premium payments that may be received on the loan of certain types of securities. Security lending income is presented in the Statement of Operations as a component of income from Fidelity Central Funds. Net income from lending portfolio securities during the period amounted to $37,439.
7. Expense Reductions.
Many of the brokers with whom FMR places trades on behalf of the Fund provided services to the Fund in addition to trade execution. These services included payments of certain expenses on behalf of the Fund totaling $9,313 for the period.
8. Other.
The Fund's organizational documents provide former and current trustees and officers with a limited indemnification against liabilities arising in connection with the performance of their duties to the Fund. In the normal course of business, the Fund may also enter into contracts that provide general indemnifications. The Fund's maximum exposure under these arrangements is unknown as this would be dependent on future claims that may be made against the Fund. The risk of material loss from such claims is considered remote.
At the end of the period, FMR or its affiliates were the owners of record of 100% of the total outstanding shares of the fund.
The United States Securities and Exchange Commission ("SEC") is conducting an investigation of FMR (covering the years 2002 to 2004) arising from gifts, gratuities and business entertainment provided by certain brokers to certain individuals who were employed on FMR's domestic equity trading desk during that period. FMR is in discussions with the SEC staff regarding the possible resolution of the matter, but as of period-end no final resolution has been reached.
In December 2006, the Independent Trustees completed their own investigation of the matter with the assistance of independent counsel. The Independent Trustees and FMR agree that, despite the absence of proof that the Fidelity mutual funds experienced diminished execution quality as a result of the improper receipt of gifts and business entertainment, the conduct at issue was serious and is worthy of redress. Accordingly, the Independent Trustees have requested and FMR has agreed to pay $42 million to Fidelity mutual funds, plus interest to be determined at the time that payment is made. A method of allocating this payment among the funds has not yet been determined. The total payment to the Fund is not anticipated to have a material impact on the Fund's net assets. In addition, FMR reimbursed related legal expenses which are recorded in the accompanying Statement of Operations as an expense reduction.
9. Distributions to Shareholders.
Distributions to shareholders of each class were as follows:
| Years ended December 31, |
| 2006 | 2005 |
From net investment income | | |
Initial Class | $ 45,607 | $ 148,996 |
Investor Class | 6,998 | - |
Total | $ 52,605 | $ 148,996 |
Annual Report
Notes to Financial Statements - continued
10. Share Transactions.
Transactions for each class of shares were as follows:
| Shares | Dollars |
| Years ended December 31, | Years ended December 31, |
| 2006 | 2005 A | 2006 | 2005 A |
Initial Class | | | | |
Shares sold | 473,551 | 4,761,850 | $ 5,954,403 | $ 53,913,583 |
Reinvestment of distributions | 3,681 | 14,204 | 45,607 | 148,996 |
Shares redeemed | (4,806,260) | (1,373,502) | (59,742,246) | (15,341,849) |
Net increase (decrease) | (4,329,028) | 3,402,552 | $ (53,742,236) | $ 38,720,730 |
Investor Class | | | | |
Shares sold | 994,136 | 603,209 | $ 12,464,919 | $ 7,355,143 |
Reinvestment of distributions | 566 | - | 6,998 | - |
Shares redeemed | (354,157) | (8,405) | (4,401,946) | (100,955) |
Net increase (decrease) | 640,545 | 594,804 | $ 8,069,971 | $ 7,254,188 |
A Share transactions for Investor Class are for the period July 21, 2005 (commencement of sale of shares) to December 31, 2005.
VIP Health Care Portfolio
Report of Independent Registered Public Accounting Firm
To the Trustees of Variable Insurance Products Fund IV and the Shareholders of VIP Health Care Portfolio:
In our opinion, the accompanying statement of assets and liabilities, including the schedule of investments, and the related statements of operations and of changes in net assets and the financial highlights present fairly, in all material respects, the financial position of VIP Health Care Portfolio (a fund of Variable Insurance Products Fund IV) at December 31, 2006, the results of its operations for the year then ended, the changes in its net assets for each of the two years in the period then ended and the financial highlights for each of the periods indicated, in conformity with accounting principles generally accepted in the United States of America. These financial statements and financial highlights (hereafter referred to as "financial statements") are the responsibility of the VIP Health Care Portfolio's management; our responsibility is to express an opinion on these financial statements based on our audits. We conducted our audits of these financial statements in accordance with the standards of the Public Company Accounting Oversight Board (United States). Those standards require that we plan and perform the audit to obtain reasonable assurance about whether the financial statements are free of material misstatement. An audit includes examining, on a test basis, evidence supporting the amounts and disclosures in the financial statements, assessing the accounting principles used and significant estimates made by management, and evaluating the overall financial statement presentation. We believe that our audits, which included confirmation of securities at December 31, 2006 by correspondence with the custodian and brokers, provide a reasonable basis for our opinion.
/s/ PricewaterhouseCoopers LLP
PricewaterhouseCoopers LLP
Boston, Massachusetts
February 13, 2007
Annual Report
Trustees and Officers
The Trustees, Member of the Advisory Board, and executive officers of the trust and funds, as applicable, are listed below. The Board of Trustees governs the fund and is responsible for protecting the interests of shareholders. The Trustees are experienced executives who meet periodically throughout the year to oversee the fund's activities, review contractual arrangements with companies that provide services to the fund, and review the fund's performance. Each of the Trustees oversees 348 funds advised by FMR or an affiliate.
The Trustees hold office without limit in time except that (a) any Trustee may resign; (b) any Trustee may be removed by written instrument, signed by at least two-thirds of the number of Trustees prior to such removal; (c) any Trustee who requests to be retired or who has become incapacitated by illness or injury may be retired by written instrument signed by a majority of the other Trustees; and (d) any Trustee may be removed at any special meeting of shareholders by a two-thirds vote of the outstanding voting securities of the trust. Each Trustee who is not an interested person (as defined in the 1940 Act) (Independent Trustee), shall retire not later than the last day of the calendar year in which his or her 72nd birthday occurs. The Independent Trustees may waive this mandatory retirement age policy with respect to individual Trustees. The executive officers and Advisory Board Member hold office without limit in time, except that any officer and Advisory Board Member may resign or may be removed by a vote of a majority of the Trustees at any regular meeting or any special meeting of the Trustees. Except as indicated, each individual has held the office shown or other offices in the same company for the past five years.
The fund's Statement of Additional Information (SAI) includes more information about the Trustees. To request a free copy, call Fidelity at 1-877-208-0098.
Interested Trustees*:
Correspondence intended for each Trustee who is an interested person may be sent to Fidelity Investments, 82 Devonshire Street, Boston, Massachusetts 02109.
Name, Age; Principal Occupation |
Edward C. Johnson 3d (76) |
| Year of Election or Appointment: 1983 Mr. Johnson is Chairman of the Board of Trustees. Mr. Johnson serves as President (2006-present), Chief Executive Officer, Chairman, and a Director of FMR Corp.; Chairman and a Director of FMR; Chairman and a Director of Fidelity Research & Analysis Company (FRAC); Chairman and a Director of Fidelity Investments Money Management, Inc.; and Chairman (2001-present) and a Director of FMR Co., Inc. In addition, Mr. Johnson serves as Chairman and Director of Fidelity International Limited (FIL). |
Robert L. Reynolds (54) |
| Year of Election or Appointment: 2003 Mr. Reynolds is President and a Director of FMR (2005-present), Fidelity Investments Money Management, Inc. (2005-present), and FMR Co., Inc. (2005-present). Mr. Reynolds also serves as Vice Chairman (2006-present), a Director (2003-present), and Chief Operating Officer of FMR Corp. and a Director of Strategic Advisers, Inc. (2005-present). He also serves on the Board at Fidelity Investments Canada, Ltd. |
* Trustees have been determined to be "Interested Trustees" by virtue of, among other things, their affiliation with the trust or various entities under common control with FMR.
Independent Trustees:
Correspondence intended for each Independent Trustee (that is, the Trustees other than the Interested Trustees) may be sent to Fidelity Investments, P.O. Box 55235, Boston, Massachusetts 02205-5235.
Name, Age; Principal Occupation |
Dennis J. Dirks (58) |
| Year of Election or Appointment: 2005 Prior to his retirement in May 2003, Mr. Dirks was Chief Operating Officer and a member of the Board of The Depository Trust & Clearing Corporation (DTCC) (1999-2003). He also served as President, Chief Operating Officer, and Board member of The Depository Trust Company (DTC) (1999-2003) and President and Board member of the National Securities Clearing Corporation (NSCC) (1999-2003). In addition, Mr. Dirks served as Chief Executive Officer and Board member of the Government Securities Clearing Corporation (2001-2003) and Chief Executive Officer and Board member of the Mortgage-Backed Securities Clearing Corporation (2001-2003). Mr. Dirks also serves as a Trustee and a member of the Finance Committee of Manhattan College (2005-present) and a Trustee and a member of the Finance Committee of AHRC of Nassau County (2006-present). |
Albert R. Gamper, Jr. (64) |
| Year of Election or Appointment: 2006 Prior to his retirement in December 2004, Mr. Gamper served as Chairman of the Board of CIT Group Inc. (commercial finance). During his tenure with CIT Group Inc. Mr. Gamper served in numerous senior management positions, including Chairman (1987-1989; 1999-2001; 2002-2004), Chief Executive Officer (1987-2004), and President (1989-2002). He currently serves as a member of the Board of Directors of Public Service Enterprise Group (utilities, 2001-present), Chairman of the Board of Governors, Rutgers University (2004-present), and Chairman of the Board of Saint Barnabas Health Care System. |
George H. Heilmeier (70) |
| Year of Election or Appointment: 2004 Dr. Heilmeier is Chairman Emeritus of Telcordia Technologies (communication software and systems), where prior to his retirement, he served as company Chairman and Chief Executive Officer. He currently serves on the Boards of Directors of The Mitre Corporation (systems engineering and information technology support for the government), and HRL Laboratories (private research and development, 2004-present). He is Chairman of the General Motors Science & Technology Advisory Board and a Life Fellow of the Institute of Electrical and Electronics Engineers (IEEE). Dr. Heilmeier is a member of the Defense Science Board and the National Security Agency Advisory Board. He is also a member of the National Academy of Engineering, the American Academy of Arts and Sciences, and the Board of Overseers of the School of Engineering and Applied Science of the University of Pennsylvania. Previously, Dr. Heilmeier served as a Director of TRW Inc. (automotive, space, defense, and information technology, 1992-2002), Compaq (1994-2002), Automatic Data Processing, Inc. (ADP) (technology-based business outsourcing, 1995-2002), INET Technologies Inc. (telecommunications network surveillance, 2001-2004), and Teletech Holdings (customer management services). He is the recipient of the 2005 Kyoto Prize in Advanced Technology for his invention of the liquid crystal display, and a member of the Consumer Electronics Hall of Fame. |
James H. Keyes (66) |
| Year of Election or Appointment: 2007 Prior to his retirement in 2003, Mr. Keyes was Chairman, President, and Chief Executive Officer of Johnson Controls, Inc. (automotive supplier, 1993-2003). He currently serves as a member of the boards of LSI Logic Corporation (semiconductor technologies), Navistar International Corporation (manufacture and sale of trucks, buses, and diesel engines, 2002-present), and Pitney Bowes, Inc. (integrated mail, messaging, and document management solutions). |
Marie L. Knowles (60) |
| Year of Election or Appointment: 2001 Prior to Ms. Knowles' retirement in June 2000, she served as Executive Vice President and Chief Financial Officer of Atlantic Richfield Company (ARCO) (diversified energy, 1996-2000). From 1993 to 1996, she was a Senior Vice President of ARCO and President of ARCO Transportation Company. She served as a Director of ARCO from 1996 to 1998. She currently serves as a Director of Phelps Dodge Corporation (copper mining and manufacturing) and McKesson Corporation (healthcare service, 2002-present). Ms. Knowles is a Trustee of the Brookings Institution and the Catalina Island Conservancy and also serves as a member of the Advisory Board for the School of Engineering of the University of Southern California. |
Ned C. Lautenbach (62) |
| Year of Election or Appointment: 2000 Mr. Lautenbach is Chairman of the Independent Trustees (2006-present). Mr. Lautenbach has been a partner of Clayton, Dubilier & Rice, Inc. (private equity investment firm) since September 1998. Previously, Mr. Lautenbach was with the International Business Machines Corporation (IBM) from 1968 until his retirement in 1998. Mr. Lautenbach serves as a Director of Sony Corporation (2006-present) and Eaton Corporation (diversified industrial) as well as the Philharmonic Center for the Arts in Naples, Florida. He also is a member of the Board of Trustees of Fairfield University (2005-present), as well as a member of the Council on Foreign Relations. |
Cornelia M. Small (62) |
| Year of Election or Appointment: 2005 Ms. Small is a member (2000-present) and Chairperson (2002-present) of the Investment Committee, and a member (2002-
present) of the Board of Trustees of Smith College. Previously, she served as Chief Investment Officer (1999-2000), Director of Global Equity Investments (1996-1999), and a member of the Board of Directors of Scudder, Stevens & Clark (1990-1997) and Scudder Kemper Investments (1997-1999). In addition, Ms. Small served as Co-Chair (2000-2003) of the Annual Fund for the Fletcher School of Law and Diplomacy. |
William S. Stavropoulos (67) |
| Year of Election or Appointment: 2001 Mr. Stavropoulos is Chairman Emeritus of the Board of Directors of The Dow Chemical Company. Since joining The Dow Chemical Company in 1967, Mr. Stavropoulos served in numerous senior management positions, including President (1993-2000; 2002-2003), CEO (1995-2000; 2002-2004), and Chairman of the Executive Committee (2000-2004). Currently, he is a Director of NCR Corporation (data warehousing and technology solutions), BellSouth Corporation (telecommunications), Chemical Financial Corporation, Maersk Inc. (industrial conglomerate, 2002-present), and Metalmark Capital (private equity investment firm, 2005-present). He also serves as a member of the Board of Trustees of the American Enterprise Institute for Public Policy Research. In addition, Mr. Stavropoulos is a member of The Business Council, J.P. Morgan International Council and the University of Notre Dame Advisory Council for the College of Science. |
Kenneth L. Wolfe (67) |
| Year of Election or Appointment: 2005 Prior to his retirement in 2001, Mr. Wolfe was Chairman and Chief Executive Officer of Hershey Foods Corporation (1993-2001). He currently serves as a member of the boards of Adelphia Communications Corporation (2003-present), Bausch & Lomb, Inc., and Revlon Inc. (2004-present). |
Advisory Board Member and Executive Officers:
Correspondence intended for each executive officer and Mr. Lynch may be sent to Fidelity Investments, 82 Devonshire Street, Boston, Massachusetts 02109.
Name, Age; Principal Occupation |
Peter S. Lynch (62) |
| Year of Election or Appointment: 2003 Member of the Advisory Board of Variable Insurance Products Fund IV. Mr. Lynch is Vice Chairman and a Director of FMR, and Vice Chairman (2001-present) and a Director of FMR Co., Inc. Previously, Mr. Lynch served as a Trustee of the Fidelity funds (1990-2003). In addition, he serves as a Trustee of Boston College and as the Chairman of the Inner-City Scholarship Fund. |
Kimberley H. Monasterio (43) |
| Year of Election or Appointment: 2007 President and Treasurer of VIP Health Care. Ms. Monasterio also serves as President and Treasurer of other Fidelity funds (2007-present) and is an employee of FMR (2004-present). Previously, Ms. Monasterio served as Deputy Treasurer of the Fidelity funds (2004-2006). Before joining Fidelity Investments, Ms. Monasterio served as Treasurer (2000-2004) and Chief Financial Officer (2002-2004) of the Franklin Templeton Funds and Senior Vice President of Franklin Templeton Services, LLC (2000-2004). |
Boyce I. Greer (50) |
| Year of Election or Appointment: 2005 Vice President of VIP Health Care. Mr. Greer also serves as Vice President of certain Equity Funds (2005-present), certain Asset Allocation Funds (2005-present), Fixed-Income Funds (2006-present), and Money Market Funds (2006-present). Mr. Greer is also a Trustee of other investment companies advised by FMR (2003-present). He is an Executive Vice President of FMR (2005-present) and FMR Co., Inc. (2005-present), and Senior Vice President of Fidelity Investments Money Management, Inc. (2006-present). Previously, Mr. Greer served as a Director and Managing Director of Strategic Advisers, Inc. (2002-2005), and Executive Vice President (2000-2002) and Money Market Group Leader (1997-2002) of the Fidelity Investments Fixed Income Division. He also served as Vice President of Fidelity's Money Market Funds (1997-2002), Senior Vice President of FMR (1997-2002), and Vice President of FIMM (1998-2002). |
Eric D. Roiter (58) |
| Year of Election or Appointment: 2001 Secretary of VIP Health Care. He also serves as Secretary of other Fidelity funds; Vice President, General Counsel, and Secretary of FMR Co., Inc. (2001-present) and FMR; Assistant Secretary of Fidelity Management & Research (U.K.) Inc. (2001-present), Fidelity Research & Analysis Company (2001-present), and Fidelity Investments Money Management, Inc. (2001-present). Mr. Roiter is an Adjunct Member, Faculty of Law, at Boston College Law School (2003-present). Previously, Mr. Roiter served as Vice President and Secretary of Fidelity Distributors Corporation (FDC) (1998-2005). |
Stuart Fross (47) |
| Year of Election or Appointment: 2003 Assistant Secretary of VIP Health Care. Mr. Fross also serves as Assistant Secretary of other Fidelity funds (2003-present), Vice President and Secretary of FDC (2005-present), and is an employee of FMR. |
R. Stephen Ganis (40) |
| Year of Election or Appointment: 2006 Anti-Money Laundering (AML) officer of VIP Health Care. Mr. Ganis also serves as AML officer of other Fidelity funds (2006-
present) and FMR Corp. (2003-present). Before joining Fidelity Investments, Mr. Ganis practiced law at Goodwin Procter, LLP (2000-2002). |
Joseph B. Hollis (58) |
| Year of Election or Appointment: 2006 Chief Financial Officer of VIP Health Care. Mr. Hollis also serves as Chief Financial Officer of other Fidelity funds. Mr. Hollis is President of Fidelity Pricing and Cash Management Services (FPCMS) (2005-present). Mr. Hollis also serves as President and Director of Fidelity Service Company, Inc. (2006-present). Previously, Mr. Hollis served as Senior Vice President of Cash Management Services (1999-2002) and Investment Management Operations (2002-2005). |
Kenneth A. Rathgeber (59) |
| Year of Election or Appointment: 2004 Chief Compliance Officer of VIP Health Care. Mr. Rathgeber also serves as Chief Compliance Officer of other Fidelity funds (2004-present) and Executive Vice President of Risk Oversight for Fidelity Investments (2002-present). He is Chief Compliance Officer of FMR (2005-present), FMR Co., Inc. (2005-present), Fidelity Management & Research (U.K.) Inc. (2005-present), Fidelity Research & Analysis Company (2005-present), Fidelity Investments Money Management, Inc. (2005-present), and Strategic Advisers, Inc. (2005-present). Previously, Mr. Rathgeber served as Executive Vice President and Chief Operating Officer for Fidelity Investments Institutional Services Company, Inc. (1998-2002). |
Bryan A. Mehrmann (45) |
| Year of Election or Appointment: 2005 Deputy Treasurer of VIP Health Care. Mr. Mehrmann also serves as Deputy Treasurer of other Fidelity funds (2005-present) and is an employee of FMR. Previously, Mr. Mehrmann served as Vice President of Fidelity Investments Institutional Services Group (FIIS)/Fidelity Investments Institutional Operations Corporation, Inc. (FIIOC) Client Services (1998-2004). |
Kenneth B. Robins (37) |
| Year of Election or Appointment: 2005 Deputy Treasurer of VIP Health Care. Mr. Robins also serves as Deputy Treasurer of other Fidelity funds (2005-present) and is an employee of FMR (2004-present). Before joining Fidelity Investments, Mr. Robins worked at KPMG LLP, where he was a partner in KPMG's department of professional practice (2002-2004) and a Senior Manager (1999-2000). In addition, Mr. Robins served as Assistant Chief Accountant, United States Securities and Exchange Commission (2000-2002). |
Robert G. Byrnes (40) |
| Year of Election or Appointment: 2005 Assistant Treasurer of VIP Health Care. Mr. Byrnes also serves as Assistant Treasurer of other Fidelity funds (2005-present) and is an employee of FMR (2005-present). Previously, Mr. Byrnes served as Vice President of FPCMS (2003-2005). Before joining Fidelity Investments, Mr. Byrnes worked at Deutsche Asset Management where he served as Vice President of the Investment Operations Group (2000-2003). |
John H. Costello (60) |
| Year of Election or Appointment: 1991 Assistant Treasurer of VIP Health Care. Mr. Costello also serves as Assistant Treasurer of other Fidelity funds and is an employee of FMR. |
Peter L. Lydecker (52) |
| Year of Election or Appointment: 2004 Assistant Treasurer of VIP Health Care. Mr. Lydecker also serves as Assistant Treasurer of other Fidelity funds (2004) and is an employee of FMR. |
Mark Osterheld (51) |
| Year of Election or Appointment: 2002 Assistant Treasurer of VIP Health Care. Mr. Osterheld also serves as Assistant Treasurer of other Fidelity funds (2002) and is an employee of FMR. |
Gary W. Ryan (48) |
| Year of Election or Appointment: 2005 Assistant Treasurer of VIP Health Care. Mr. Ryan also serves as Assistant Treasurer of other Fidelity funds (2005-present) and is an employee of FMR (2005-present). Previously, Mr. Ryan served as Vice President of Fund Reporting in FPCMS (1999-2005). |
Salvatore Schiavone (41) |
| Year of Election or Appointment: 2005 Assistant Treasurer of VIP Health Care. Mr. Schiavone also serves as Assistant Treasurer of other Fidelity funds (2005-present) and is an employee of FMR (2005-present). Before joining Fidelity Investments, Mr. Schiavone worked at Deutsche Asset Management, where he most recently served as Assistant Treasurer (2003-2005) of the Scudder Funds and Vice President and Head of Fund Reporting (1996-2003). |
VIP Health Care Portfolio
Distributions
The Board of Trustees of VIP Health Care Portfolio voted to pay to shareholders of record at the opening of business on record date, the following distributions per share derived from capital gains realized from sales of portfolio securities, and dividends derived from net investment income:
| Pay Date | Record Date | Dividends | Capital Gains |
Initial Class | 02/09/07 | 02/09/07 | $0.049 | $0.812 |
Investor Class | 02/09/07 | 02/09/07 | $0.043 | $0.812 |
The fund hereby designates as a capital gain dividend with respect to the taxable year ended December 31, 2006, $4,408,200, or, if subsequently determined to be different, the net capital gain of such year.
Initial Class and Investor Class designate 100% of the dividends distributed in February 2006, as qualifying for the dividends-received deduction for corporate shareholders.
The fund will notify shareholders in January 2007 of amounts for use in preparing 2006 income tax returns.
Annual Report
Proxy Voting Results
A special meeting of the fund's shareholders was held on September 20, 2006. The results of votes taken among shareholders on the proposal before them are reported below. Each vote reported represents one dollar of net asset value held on the record date for the meeting.
PROPOSAL 1 |
To elect a Board of Trustees.A |
| # of
Votes | % of
Votes |
Dennis J. Dirks |
Affirmative | 92,459,317.52 | 96.102 |
Withheld | 3,749,837.05 | 3.898 |
TOTAL | 96,209,154.57 | 100.000 |
Albert R. Gamper, Jr. |
Affirmative | 92,260,598.99 | 95.896 |
Withheld | 3,948,555.58 | 4.104 |
TOTAL | 96,209,154.57 | 100.000 |
Robert M. Gates |
Affirmative | 92,315,480.72 | 95.953 |
Withheld | 3,893,673.85 | 4.047 |
TOTAL | 96,209,154.57 | 100.000 |
George H. Heilmeier |
Affirmative | 92,208,255.41 | 95.841 |
Withheld | 4,000,899.16 | 4.159 |
TOTAL | 96,209,154.57 | 100.000 |
Edward C. Johnson 3d |
Affirmative | 91,928,267.76 | 95.550 |
Withheld | 4,280,886.81 | 4.450 |
TOTAL | 96,209,154.57 | 100.000 |
Stephen P. Jonas |
Affirmative | 92,457,628.76 | 96.101 |
Withheld | 3,751,525.81 | 3.899 |
TOTAL | 96,209,154.57 | 100.000 |
James H. KeyesB |
Affirmative | 92,432,729.82 | 96.075 |
Withheld | 3,776,424.75 | 3.925 |
TOTAL | 96,209,154.57 | 100.000 |
Marie L. Knowles |
Affirmative | 92,398,847.52 | 96.040 |
Withheld | 3,810,307.05 | 3.960 |
TOTAL | 96,209,154.57 | 100.000 |
Ned C. Lautenbach |
Affirmative | 92,423,184.47 | 96.065 |
Withheld | 3,785,970.10 | 3.935 |
TOTAL | 96,209,154.57 | 100.000 |
William O. McCoy |
Affirmative | 92,086,293.90 | 95.715 |
Withheld | 4,122,860.67 | 4.285 |
TOTAL | 96,209,154.57 | 100.000 |
| # of
Votes | % of
Votes |
Robert L. Reynolds |
Affirmative | 92,439,032.86 | 96.081 |
Withheld | 3,770,121.71 | 3.919 |
TOTAL | 96,209,154.57 | 100.000 |
Cornelia M. Small |
Affirmative | 92,415,567.29 | 96.057 |
Withheld | 3,793,587.28 | 3.943 |
TOTAL | 96,209,154.57 | 100.000 |
William S. Stavropoulos |
Affirmative | 92,135,400.08 | 95.766 |
Withheld | 4,073,754.49 | 4.234 |
TOTAL | 96,209,154.57 | 100.000 |
Kenneth L. Wolfe |
Affirmative | 92,445,865.31 | 96.088 |
Withheld | 3,763,289.26 | 3.912 |
TOTAL | 96,209,154.57 | 100.000 |
A Denotes trust-wide proposal and voting results. B Effective on or about January 1, 2007. |
VIP Health Care Portfolio
Board Approval of Investment Advisory Contracts and Management Fees
VIP Health Care Portfolio
Each year, typically in July, the Board of Trustees, including the Independent Trustees (together, the Board), votes on the renewal of the management contract and sub-advisory agreements (together, the Advisory Contracts) for the fund. The Board, assisted by the advice of fund counsel and Independent Trustees' counsel, requests and considers a broad range of information throughout the year.
The Board meets regularly each month except August and takes into account throughout the year matters bearing on Advisory Contracts. The Board, acting directly and through its separate committees, considers at each of its meetings factors that are relevant to the annual renewal of the fund's Advisory Contracts, including the services and support provided to the fund and its shareholders. At the time of the renewal, the Board had 12 standing committees, each composed of Independent Trustees with varying backgrounds, to which the Board has assigned specific subject matter responsibilities in order to enhance effective decision-making by the Board. Each committee has adopted a written charter outlining the structure and purposes of the committee. One such committee, the Equity Contract Committee, meets periodically as needed throughout the year to consider matters specifically related to the annual renewal of Advisory Contracts. The committee requests and receives information on, and makes recommendations to the Independent Trustees concerning, the approval and annual review of the Advisory Contracts.
At its July 2006 meeting, the Board of Trustees, including the Independent Trustees, unanimously determined to renew the Advisory Contracts for the fund. In reaching its determination, the Board considered all factors it believed relevant, including (i) the nature, extent, and quality of the services to be provided to the fund and its shareholders (including the investment performance of the fund); (ii) the competitiveness of the management fee and total expenses of the fund; (iii) the total costs of the services to be provided by and the profits to be realized by the investment adviser and its affiliates from the relationship with the fund; (iv) the extent to which economies of scale would be realized as the fund grows; and (v) whether fee levels reflect these economies of scale, if any, for the benefit of fund shareholders.
In determining whether to renew the Advisory Contracts for the fund, the Board ultimately reached a determination, with the assistance of fund counsel and Independent Trustees' counsel, that the renewal of the Advisory Contracts and the compensation to be received by Fidelity under the management contract is consistent with Fidelity's fiduciary duty under applicable law. In addition to evaluating the specific factors noted above, the Board, in reaching its determination, is aware that shareholders in the fund have a broad range of investment choices available to them, including a wide choice among mutual funds offered by competitors to Fidelity, and that the fund's shareholders, with the opportunity to review and weigh the disclosure provided by the fund in its prospectus and other public disclosures, have chosen to invest in this fund, managed by Fidelity.
Nature, Extent, and Quality of Services Provided. The Board considered staffing within the investment adviser, FMR, and the sub-advisers (together, the Investment Advisers), including the background of the fund's portfolio manager and the fund's investment objective and discipline. The Independent Trustees also had discussions with senior management of Fidelity's investment operations and investment groups. The Board considered the structure of the portfolio manager compensation program and whether this structure provides appropriate incentives.
Resources Dedicated to Investment Management and Support Services. The Board reviewed the size, education, and experience of the Investment Advisers' investment staff, their use of technology, and the Investment Advisers' approach to recruiting, training, and retaining portfolio managers and other research, advisory, and management personnel. The Board considered Fidelity's extensive global research capabilities that enable the Investment Advisers to aggregate data from various sources in an effort to produce positive investment results. The Board noted that Fidelity's analysts have access to a variety of technological tools that enable them to perform both fundamental and quantitative analysis and to specialize in various disciplines. The Board also considered that Fidelity's portfolio managers and analysts have access to daily portfolio attribution that allows for monitoring of a fund's portfolio, as well as an electronic communication system that provides immediate real-time access to research concerning issuers and credit enhancers.
Shareholder and Administrative Services. The Board considered (i) the nature, extent, quality, and cost of administrative, distribution, and shareholder services performed by the Investment Advisers and their affiliates under the Advisory Contracts and under separate agreements covering transfer agency, pricing and bookkeeping, and securities lending services for the fund; (ii) the nature and extent of the Investment Advisers' supervision of third party service providers, principally custodians and subcustodians; and (iii) the resources devoted to, and the record of compliance with, the fund's compliance policies and procedures. The Board reviewed the allocation of fund brokerage, including allocations to brokers affiliated with the Investment Advisers, the use of brokerage commissions to pay fund expenses, and the use of "soft" commission dollars to pay for research services. The Board also considered that Fidelity voluntarily pays for market data out of its own resources.
The Board noted that the growth of fund assets across the complex allows Fidelity to reinvest in the development of services designed to enhance the value or convenience of the Fidelity funds as investment vehicles. These services include 24-hour access to account information and market information through phone representatives and over the Internet, and investor education materials and asset allocation tools.
Investment in a Large Fund Family. The Board considered the benefits to shareholders of investing in a Fidelity fund, including the benefits of investing in a fund that is part of a large family of funds offering a variety of investment disciplines and providing for a large variety of mutual fund investor services. The Board noted that, since the last Advisory Contract renewals in July 2005, Fidelity has taken a number of actions that benefited particular funds, including (i) dedicating additional resources to investment research and to restructure the investment research teams; (ii) voluntarily entering into contractual arrangements with certain brokers pursuant to which Fidelity pays for research products and services separately out of its own resources, rather than bundling with fund commissions; (iii) launching the Fidelity Advantage Class of its five Spartan stock index funds and three Spartan bond index funds, which is a lower-fee class available to shareholders with higher account balances; (iv) contractually agreeing to impose expense limitations on Fidelity U.S. Bond Index Fund and reducing the fund's initial investment minimum; and (v) offering shareholders of each of the Fidelity Institutional Money Market Funds the privilege of exchanging shares of the fund for shares of other Fidelity funds.
Annual Report
Board Approval of Investment Advisory Contracts and Management Fees - continued
Investment Performance and Compliance. The Board considered whether the fund has operated within its investment objective, as well as its record of compliance with its investment restrictions. It also reviewed the fund's absolute investment performance for Initial Class, as well as the fund's relative investment performance for Initial Class measured against (i) a Goldman Sachs index that reflects the market sector in which the fund invests, and (ii) a peer group of mutual funds over multiple periods. Because the fund had been in existence less than five calendar years, the following charts considered by the Board show, over the one- and three-year periods ended December 31, 2005, the cumulative total returns of Initial Class of the fund, the cumulative total returns of a Goldman Sachs index ( "benchmark"), and a range of cumulative total returns of a peer group of mutual funds identified by Lipper Inc. as having an investment objective similar to that of the fund. (Investor Class of the fund had less than one year of performance as of December 31, 2005.) The box within each chart shows the 25th percentile return (bottom of box) and the 75th percentile return (top of box) of the Lipper peer group. Returns shown above the box are in the first quartile and returns shown below the box are in the fourth quartile. The percentage beaten number noted below each chart corresponds to the percentile box and represents the percentage of funds in the Lipper peer group whose performance was equal to or lower than that of Initial Class.
VIP Health Care Portfolio
The Board reviewed the fund's relative investment performance against its Lipper peer group and stated that the performance of Initial Class of the fund was in the first quartile for the one-year period and the fourth quartile for the three-year period. The Board noted that FMR does not consider that Lipper peer group to be a meaningful comparison for the fund, however, because the peer group includes funds that focus on different industries and sectors than the fund. The Board also stated that the relative investment performance of Initial Class of the fund compared favorably to its benchmark for all the periods shown.
The Board considered that FMR has taken steps to refocus and strengthen equity research, equity portfolio management, and compliance. The Board noted with favor FMR's reorganization of its senior management team in 2005 and FMR's dedication of additional resources to investment research, and participated in the process that led to those changes.
Based on its review, and giving particular weight to the nature and quality of the resources dedicated by the Investment Advisers to maintain and improve relative performance, the Board concluded that the nature, extent, and quality of the services provided to the fund will benefit the fund's shareholders, particularly in light of the Board's view that the fund's shareholders benefit from investing in a fund that is part of a large family of funds offering a variety of investment disciplines and services.
Competitiveness of Management Fee and Total Fund Expenses. The Board considered the fund's management fee and total expenses compared to "mapped groups" of competitive funds and classes. Fidelity creates "mapped groups" by combining similar Lipper investment objective categories that have comparable management fee characteristics. Combining Lipper investment objective categories aids the Board's management fee and total expense comparisons by broadening the competitive group used for comparison and by reducing the number of universes to which various Fidelity funds are compared.
VIP Health Care Portfolio
The Board considered two proprietary management fee comparisons for the 12-month (or shorter) periods shown in the chart below. The group of Lipper funds used by the Board for management fee comparisons is referred to below as the "Total Mapped Group" and, for the reasons explained above, is broader than the Lipper peer group used by the Board for performance comparisons. The Total Mapped Group comparison focuses on a fund's standing relative to the total universe of comparable funds available to investors, in terms of gross management fees before expense reimbursements or caps. "TMG %" represents the percentage of funds in the Total Mapped Group that had management fees that were lower than the fund's. For example, a TMG % of 8% means that 92% of the funds in the Total Mapped Group had higher management fees than the fund. The "Asset-Size Peer Group" (ASPG) comparison focuses on a fund's standing relative to non-Fidelity funds similar in size to the fund within the Total Mapped Group. The ASPG represents at least 15% of the funds in the Total Mapped Group with comparable asset size and management fee characteristics, subject to a minimum of 50 funds (or all funds in the Total Mapped Group if fewer than 50). Additional information, such as the ASPG quartile in which the fund's management fee ranked, is also included in the chart and considered by the Board.
VIP Health Care Portfolio
The Board noted that the fund's management fee ranked below the median of its Total Mapped Group and below the median of its ASPG for 2005.
Based on its review, the Board concluded that the fund's management fee was fair and reasonable in light of the services that the fund receives and the other factors considered.
In its review of each class's total expenses, the Board considered the fund's management fee as well as other fund or class expenses, as applicable, such as transfer agent fees, pricing and bookkeeping fees, and custodial, legal, and audit fees. The Board also noted the effects of any waivers and reimbursements on fees and expenses. As part of its review, the Board also considered current and historical total expenses of each class of the fund compared to competitive fund median expenses. Each class of the fund is compared to those funds and classes in the Total Mapped Group (used by the Board for management fee comparisons) that have a similar sales load structure.
The Board noted that the total expenses of each class ranked below its competitive median for 2005.
In its review of total expenses, the Board also considered Fidelity fee structures and other information on clients that FMR and its affiliates service in other competitive markets, such as other mutual funds advised or subadvised by FMR or its affiliates, pension plan clients, and other institutional clients.
Based on its review, the Board concluded that the total expenses of each class of the fund were reasonable in light of the services that the fund and its shareholders receive and the other factors considered.
Costs of the Services and Profitability. The Board considered the revenues earned and the expenses incurred by Fidelity in conducting the business of developing, marketing, distributing, managing, administering and servicing the fund and its shareholders. The Board also considered the level of Fidelity's profits in respect of all the Fidelity funds.
Annual Report
Board Approval of Investment Advisory Contracts and Management Fees - continued
On an annual basis, FMR presents to the Board Fidelity's profitability for the fund. Fidelity calculates the profitability for each fund, as well as aggregate profitability for groups of Fidelity funds and all Fidelity funds, using a series of detailed revenue and cost allocation methodologies which originate with the audited books and records of Fidelity. The Audit Committee of the Board reviews any significant changes from the prior year's methodologies.
PricewaterhouseCoopers LLP (PwC), independent registered accounting firm and auditor to Fidelity and certain Fidelity funds, has been engaged annually by the Board as part of the Board's assessment of the results of Fidelity's profitability analysis. PwC's engagement includes the review and assessment of Fidelity's methodologies used in determining the revenues and expenses attributable to Fidelity's mutual fund business, and completion of agreed-upon procedures surrounding the mathematical accuracy of fund profitability and its conformity to allocation methodologies. After considering PwC's reports issued under the engagement and information provided by Fidelity, the Board believes that while other allocation methods may also be reasonable, Fidelity's profitability methodologies are reasonable in all material respects.
The Board has also reviewed Fidelity's non-fund businesses and any fall-out benefits related to the mutual fund business as well as cases where Fidelity's affiliates may benefit from or be related to the fund's business.
The Board considered the costs of the services provided by and the profits realized by Fidelity in connection with the operation of the fund and determined that the amount of profit is a fair entrepreneurial profit for the management of the fund.
Economies of Scale. The Board considered whether there have been economies of scale in respect of the management of the Fidelity funds, whether the Fidelity funds (including the fund) have appropriately benefited from any such economies of scale, and whether there is potential for realization of any further economies of scale. The Board considered the extent to which the fund will benefit from economies of scale through increased services to the fund, through waivers or reimbursements, or through fee or expense reductions.
The Board recognized that the fund's management contract incorporates a "group fee" structure, which provides for lower fee rates as total fund assets under FMR's management increase, and for higher fee rates as total fund assets under FMR's management decrease. The Board considered that the group fee is designed to deliver the benefits of economies of scale to fund shareholders when total fund assets increase, even if assets of any particular fund are unchanged or have declined, because some portion of Fidelity's costs are attributable to services provided to all Fidelity funds, and all funds benefit if those costs can be allocated among more assets. The Board concluded that, given the group fee structure, fund shareholders will achieve a certain level of economies of scale as assets under FMR's management increase at the fund complex level, regardless of whether Fidelity achieves any such economies of scale.
The Board further concluded that any potential economies of scale are being shared between fund shareholders and Fidelity in an appropriate manner.
Additional Information Requested by the Board. In order to develop fully the factual basis for consideration of the Advisory Contracts, the Board requested additional information on several topics, including (i) Fidelity's fund profitability methodology and profitability trends within certain funds; (ii) portfolio manager compensation; (iii) the extent to which any economies of scale exist and are shared between the funds and Fidelity; (iv) the total expenses of certain funds and classes relative to competitors, including the extent to which the expenses of certain funds have been or could be capped; (v) fund performance trends; and (vi) Fidelity's fee structures, including use of performance fees.
Based on its evaluation of all of the conclusions noted above, and after considering all material factors, the Board ultimately concluded that the advisory fee structures are fair and reasonable, and that the fund's Advisory Contracts should be renewed.
VIP Health Care Portfolio
Annual Report
Investment Adviser
Fidelity Management & Research Company
Boston, MA
Investment Sub-Advisers
FMR Co., Inc.
Fidelity Management & Research (U.K.) Inc.
Fidelity Research & Analysis Company (formerly Fidelity Management & Research (Far East) Inc.)
Fidelity Investments Japan Limited
Fidelity International Investment Advisors
Fidelity International Investment Advisors
(U.K.) Limited
General Distributor
Fidelity Distributors Corporation
Boston, MA
Transfer and Service Agents
Fidelity Investments Institutional Operations Company, Inc.
Boston, MA
Fidelity Service Company, Inc.
Boston, MA
Custodians
JPMorgan Chase Bank
New York, NY
VHCIC-ANN-0207
1.817373.101
Fidelity® Variable Insurance Products:
Industrials Portfolio
(formerly Cyclical Industries Portfolio)
Annual Report
December 31, 2006
(2_fidelity_logos) (Registered_Trademark)
Contents
Notes to Shareholders | <Click Here> | An explanation of the changes to the fund. |
Performance | <Click Here> | How the fund has done over time. |
Management's Discussion | <Click Here> | The manager's review of fund performance, strategy and outlook. |
Shareholder Expense Example | <Click Here> | An example of shareholder expenses. |
Investment Changes | <Click Here> | A summary of major shifts in the fund's investments over the past six months. |
Investments | <Click Here> | A complete list of the fund's investments with their
market values. |
Financial Statements | <Click Here> | Statements of assets and liabilities, operations, and
changes in net assets, as well as financial highlights. |
Notes | <Click Here> | Notes to the financial statements. |
Report of Independent Registered Public Accounting Firm | <Click Here> | |
Trustees and Officers | <Click Here> | |
Distributions | <Click Here> | |
Proxy Voting Results | <Click Here> | |
Board Approval of Investment Advisory Contracts and Management Fees | <Click Here> | |
| | |
To view a fund's proxy voting guidelines and proxy voting record for the 12-month period ended June 30, visit www.fidelity.com/proxyvotingresults or visit the Securities and Exchange Commission's (SEC) web site at www.sec.gov. You may also call 1-877-208-0098 to request a free copy of the proxy voting guidelines.
Fidelity Variable Insurance Products are separate account options which are purchased through a variable insurance contract.
Standard & Poor's, S&P and S&P 500 are registered service marks of The McGraw-Hill Companies, Inc. and have been licensed for use by Fidelity Distributors Corporation.
Other third party marks appearing herein are the property of their respective owners.
All other marks appearing herein are registered or unregistered trademarks or service marks of FMR Corp. or an affiliated company.
This report and the financial statements contained herein are submitted for the general information of the shareholders of the fund. This report is not authorized for distribution to prospective investors in the fund unless preceded or accompanied by an effective prospectus.
A fund files its complete schedule of portfolio holdings with the SEC for the first and third quarters of each fiscal year on Form N-Q. Forms N-Q are available on the SEC's web site at http://www.sec.gov. A fund's Forms N-Q may be reviewed and copied at the SEC's Public Reference Room in Washington, DC. Information regarding the operation of the SEC's Public Reference Room may be obtained by calling 1-800-SEC-0330. For a complete list of the fund's portfolio holdings, view the most recent quarterly holdings report, semiannual report, or annual report on Fidelity's web site at http://www.advisor.fidelity.com.
NOT FDIC INSURED · MAY LOSE VALUE · NO BANK GUARANTEE
Neither the fund nor Fidelity Distributors Corporation is a bank.
VIP Industrials Portfolio
Notes to Shareholders:
Effective October 1, 2006, Fidelity restructured the VIP Sector product line. The restructuring aligned the funds' investment goals more closely with standard industry classifications and facilitated adoption of more-specific benchmark indexes to evaluate fund performance. As restructured, the funds generally align under seven sectors in the widely recognized Global Industry Classification Standard (GICS), developed by Standard & Poor's® (S&P®) and Morgan Stanley Capital InternationalSM (MSCI®): Consumer Discretionary, Energy, Financials, Health Care, Industrials, Information Technology and Utilities. Changes to the funds ranged from simply adopting a new supplemental benchmark to, in some cases, changing investment policies and fund names.
For VIP Consumer Discretionary (formerly VIP Consumer Industries), VIP Energy (formerly VIP Natural Resources), VIP Industrials (formerly VIP Cyclical Industries), and VIP Utilities (formerly VIP Telecommunications & Utilities Growth), shareholders approved certain fundamental investment policy changes related to the restructuring at a special meeting of shareholders held September 20, 2006. All the funds adopted new benchmark indexes from MSCI. Taken together, the name, policy and benchmark changes will make it easier for investors to distinguish funds in the product line and to evaluate Fidelity Management & Research Company's skill in managing the funds.
For VIP Industrials, shareholders approved narrowing the fund's policies to invest primarily in companies engaged in the research, development, manufacture, distribution, supply or sale of industrial products, services or equipment. The industrials and materials industries are considered subsets of the cyclical industries sector. The fund is now benchmarked to the MSCI US Investable Market Industrials Index.
Annual Report
VIP Industrials Portfolio
Performance: The Bottom Line
Average annual total return reflects the change in the value of an investment, assuming reinvestment of the class' dividend income and capital gains (the profits earned upon the sale of securities that have grown in value) and assuming a constant rate of performance each year. During periods of reimbursement by Fidelity, a fund's total return will be greater than it would be had the reimbursement not occurred. Performance numbers are net of all underlying fund operating expenses, but do not include any insurance charges imposed by your insurance company's separate account. If performance information included the effect of these additional charges, the total returns would have been lower. How a fund did yesterday is no guarantee of how it will do tomorrow.
Average Annual Total Returns
Periods ended December 31, 2006 | Past 1
year | Past 5
years | Life of fund A |
VIP Industrials - Initial Class | 15.71% | 12.52% | 11.53% |
VIP Industrials - Investor Class B | 15.43% | 12.46% | 11.48% |
A From July 18, 2001.
B The initial offering of Investor Class shares took place on July 21, 2005. Returns prior to July 21, 2005, are those of Initial Class. If Investor Class's transfer agent fee had been reflected, returns prior to July 21, 2005 would have been lower.
$10,000 Over Life of Fund
Let's say hypothetically that $10,000 was invested in VIP Industrials Portfolio - Initial Class on July 18, 2001, when the fund started. The chart shows how the value of your investment would have changed, and also shows how the Standard & Poor's 500SM Index (S&P 500®) performed over the same period.
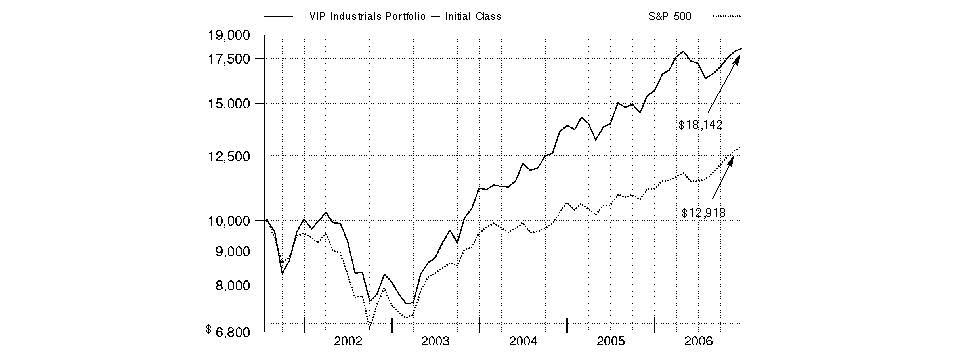
VIP Industrials Portfolio
VIP Industrials Portfolio
Management's Discussion of Fund Performance
Comments from Christopher Bartel, who managed VIP Industrials Portfolio during the period covered by this report
U.S. stock markets registered their fourth consecutive year of positive returns in 2006. Among the highlights were the performances of the Dow Jones Industrial AverageSM - a gauge of 30 mega-cap, blue-chip stocks - and the small-cap-oriented Russell 2000® Index, both of which reached new highs. The efforts of the Federal Reserve Board to contain inflation levels also dominated the investment headlines. In all, the Fed hiked short-term interest rates four times, but held rates steady after its June 29 increase, finally pausing after 17 rate hikes over a two-year period. A slowing residential housing market and moderating oil prices - the latter of which hit a record closing high of $77 per barrel in July before falling sharply - also held economic growth in check. For the year overall, the Standard & Poor's 500SM Index was up 15.79%, the Dow advanced 19.05%, the Russell 2000 Index gained 18.37% and the NASDAQ Composite® Index rose 10.39%.
For the 12 months ending December 31, 2006, the fund outperformed the 14.73% gain of the Morgan Stanley Capital InternationalSM (MSCI®) US Investable Market Industrials Index and the 15.10% advance of a blended index specific to this fund. This blended index is a combination of the Goldman Sachs® Cyclical Industries Index, which the fund was compared with through September, and the new MSCI benchmark mentioned above, which the fund was compared with during the period's final three months 1. During the same 12-month period, the fund performed about in line with the S&P 500®. (For specific portfolio performance results, please refer to the performance section of this report.) During the first nine months, the fund edged the Goldman Sachs index, with steel stocks providing the biggest boost, attributable in roughly equal measure to favorable stock selection and an overweighted exposure to that very strong group. Overweighting construction and engineering stocks also was beneficial, but those gains were offset by unfavorable stock picking in the group. WESCO International, an electrical distributor in the commercial space, was the top contributor, benefiting from the continued strength in nonresidential construction markets. Also aiding our results was steel producer Allegheny Technologies. I sold all of our steel holdings by the end of the nine-month period because the new MSCI Industrials benchmark - reflecting the fund's narrower focus - does not have a materials component. Conversely, stock selection in aerospace and defense had a negative impact on the fund's results. Among individual holdings, AirTran Holdings - another stock I sold - hurt performance, as competition with another carrier and high fuel prices hampered the stock. During the final three months, the fund performed about in line with the MSCI index. The biggest positive factor was stock selection in construction/engineering and heavy electrical equipment, with Switzerland-based ABB - - a provider of power transmission and automation equipment for utility and industrial customers - taking honors as the top contributor. Conversely, stock picking in trucking held back our results. Individual detractors included aerospace and defense stock United Technologies, which suffered from weak results at its helicopter and heating/air conditioning divisions. Not owning index component Boeing hurt as well.
Note to shareholders: Tobias Welo became Portfolio Manager of the fund on January 4, 2007.
1 The fund's blended index is a customized index developed by Fidelity for the limited purpose of discussing the fund's performance for the 12-month period ending December 31, 2006. From January 1, 2006, through September 30, 2006, the fund compared its performance to the Goldman Sachs Cyclical Industries Index, which returned 7.65% during that period. On October 1, 2006, the fund began comparing its performance to a different index, the MSCI US Investable Market Industrials Index, which returned 6.93% from October 1, 2006, through December 31, 2006. For the 12-month period ending December 31, 2006, the blended index (Goldman Sachs and MSCI) returned 15.10%.
The views expressed above reflect those of the portfolio manager(s) only through the end of the period as stated on the cover of this report and do not necessarily represent the views of Fidelity or any other person in the Fidelity organization. Any such views are subject to change at any time based upon market or other conditions and Fidelity disclaims any responsibility to update such views. These views may not be relied on as investment advice and, because investment decisions for a Fidelity fund are based on numerous factors, may not be relied on as an indication of trading intent on behalf of any Fidelity fund.
Annual Report
VIP Industrials Portfolio
Shareholder Expense Example
As a shareholder of the Fund, you incur two types of costs: (1) transaction costs, including redemption fees, and (2) ongoing costs, including management fees and other Fund expenses. This Example is intended to help you understand your ongoing costs (in dollars) of investing in the Fund and to compare these costs with the ongoing costs of investing in other mutual funds.
The Example is based on an investment of $1,000 invested at the beginning of the period and held for the entire period (July 1, 2006 to December 31, 2006).
Actual Expenses
The first line of the accompanying table for each class of the Fund provides information about actual account values and actual expenses. You may use the information in this line, together with the amount you invested, to estimate the expenses that you paid over the period. Simply divide your account value by $1,000.00 (for example, an $8,600 account value divided by $1,000.00 = 8.6), then multiply the result by the number in the first line for a class of the Fund under the heading entitled "Expenses Paid During Period" to estimate the expenses you paid on your account during this period. The estimate of expenses does not include any fees or other expenses of any variable annuity or variable life insurance product. If they were, the estimate of expenses you paid during the period would be higher, and your ending account value would be lower.
Hypothetical Example for Comparison Purposes
The second line of the accompanying table for each class of the Fund provides information about hypothetical account values and hypothetical expenses based on a Class' actual expense ratio and an assumed rate of return of 5% per year before expenses, which is not the Class' actual return. The hypothetical account values and expenses may not be used to estimate the actual ending account balance or expenses you paid for the period. You may use this information to compare the ongoing costs of investing in the Fund and other funds. To do so, compare this 5% hypothetical example with the 5% hypothetical examples that appear in the shareholder reports of the other funds. The estimate of expenses does not include any fees or other expenses of any variable annuity or variable life insurance product. If they were, the estimate of expenses you paid during the period would be higher, and your ending account value would be lower.
Please note that the expenses shown in the table are meant to highlight your ongoing costs only and do not reflect any transaction costs. Therefore, the second line of the table is useful in comparing ongoing costs only, and will not help you determine the relative total costs of owning different funds. In addition, if these transactional costs were included, your costs would have been higher.
| Beginning
Account Value
July 1, 2006 | Ending
Account Value
December 31, 2006 | Expenses Paid
During Period*
July 1, 2006
to December 31, 2006 |
Initial Class | | | |
Actual | $ 1,000.00 | $ 1,053.90 | $ 4.09 |
HypotheticalA | $ 1,000.00 | $ 1,021.22 | $ 4.02 |
Investor Class | | | |
Actual | $ 1,000.00 | $ 1,052.70 | $ 4.76 |
HypotheticalA | $ 1,000.00 | $ 1,020.57 | $ 4.69 |
A 5% return per year before expenses
* Expenses are equal to each Class' annualized expense ratio (shown in the table below); multiplied by the average account value over the period, multiplied by 184/365 (to reflect the one-half year period).
| Annualized
Expense Ratio |
Initial Class | .79% |
Investor Class | .92% |
VIP Industrials Portfolio
VIP Industrials Portfolio
Investment Changes
Top Ten Stocks as of December 31, 2006 |
| % of fund's
net assets | % of fund's net assets
6 months ago |
General Electric Co. | 23.4 | 6.6 |
United Technologies Corp. | 7.2 | 4.7 |
Honeywell International, Inc. | 5.3 | 3.2 |
Tyco International Ltd. | 5.1 | 3.1 |
Danaher Corp. | 4.2 | 0.9 |
3M Co. | 3.8 | 3.5 |
Caterpillar, Inc. | 3.2 | 2.2 |
Burlington Northern Santa Fe Corp. | 2.7 | 1.2 |
Illinois Tool Works, Inc. | 2.3 | 1.6 |
Raytheon Co. | 2.2 | 0.8 |
| 59.4 | |
Top Industries (% of fund's net assets) |
As of December 31, 2006 |
| Industrial
Conglomerates | 33.7% | |
| Aerospace & Defense | 17.0% | |
| Machinery | 15.8% | |
| Road & Rail | 8.9% | |
| Electrical Equipment | 7.4% | |
| All Others* | 17.2% | |

|
As of June 30, 2006 |
| Aerospace & Defense | 17.0% | |
| Industrial
Conglomerates | 15.1% | |
| Chemicals | 14.4% | |
| Machinery | 10.7% | |
| Road & Rail | 6.4% | |
| All Others* | 36.4% | |

* Includes short-term investments and net other assets. |
Prior period industry classifications reflect the categories in place as of the date indicated and have not been adjusted to reflect current industry classifications. |
Annual Report
VIP Industrials Portfolio
Investments December 31, 2006
Showing Percentage of Net Assets
Common Stocks - 98.1% |
| Shares | | Value (Note 1) |
AEROSPACE & DEFENSE - 17.0% |
Aerospace & Defense - 17.0% |
DRS Technologies, Inc. | 1,400 | | $ 73,752 |
Goodrich Corp. | 12,300 | | 560,265 |
Honeywell International, Inc. | 74,900 | | 3,388,476 |
KBR, Inc. | 300 | | 7,848 |
Precision Castparts Corp. | 10,300 | | 806,284 |
Raytheon Co. | 26,700 | | 1,409,760 |
Spirit AeroSystems Holdings, Inc. Class A | 900 | | 30,123 |
United Technologies Corp. | 74,000 | | 4,626,480 |
| | 10,902,988 |
AIR FREIGHT & LOGISTICS - 2.4% |
Air Freight & Logistics - 2.4% |
Expeditors International of Washington, Inc. | 11,200 | | 453,600 |
Hub Group, Inc. Class A | 26,306 | | 724,730 |
UTI Worldwide, Inc. | 12,352 | | 369,325 |
| | 1,547,655 |
AIRLINES - 0.2% |
Airlines - 0.2% |
US Airways Group, Inc. (a) | 2,700 | | 145,395 |
AUTO COMPONENTS - 0.3% |
Auto Parts & Equipment - 0.3% |
Amerigon, Inc. (a) | 17,764 | | 171,600 |
BUILDING PRODUCTS - 2.5% |
Building Products - 2.5% |
American Standard Companies, Inc. (d) | 21,010 | | 963,309 |
Masco Corp. | 22,220 | | 663,711 |
| | 1,627,020 |
COMMERCIAL SERVICES & SUPPLIES - 2.5% |
Environmental & Facility Services - 1.9% |
Waste Management, Inc. | 34,000 | | 1,250,180 |
Office Services & Supplies - 0.6% |
Avery Dennison Corp. | 5,300 | | 360,029 |
TOTAL COMMERCIAL SERVICES & SUPPLIES | | 1,610,209 |
CONSTRUCTION & ENGINEERING - 5.6% |
Construction & Engineering - 5.6% |
Chicago Bridge & Iron Co. NV (NY Shares) | 6,600 | | 180,444 |
Foster Wheeler Ltd. (a) | 14,500 | | 799,530 |
Infrasource Services, Inc. (a) | 23,500 | | 511,595 |
Jacobs Engineering Group, Inc. (a) | 8,000 | | 652,320 |
Shaw Group, Inc. (a) | 24,300 | | 814,050 |
SNC-Lavalin Group, Inc. | 22,600 | | 609,967 |
| | 3,567,906 |
|
| Shares | | Value (Note 1) |
ELECTRICAL EQUIPMENT - 7.4% |
Electrical Components & Equipment - 5.4% |
AMETEK, Inc. | 10,350 | | $ 329,544 |
Cooper Industries Ltd. Class A | 12,900 | | 1,166,547 |
Emerson Electric Co. | 29,600 | | 1,305,064 |
Rockwell Automation, Inc. | 5,600 | | 342,048 |
Roper Industries, Inc. | 6,840 | | 343,642 |
| | 3,486,845 |
Heavy Electrical Equipment - 2.0% |
ABB Ltd. sponsored ADR | 70,700 | | 1,271,186 |
TOTAL ELECTRICAL EQUIPMENT | | 4,758,031 |
ENERGY EQUIPMENT & SERVICES - 0.5% |
Oil & Gas Equipment & Services - 0.5% |
Halliburton Co. | 10,100 | | 313,605 |
INDUSTRIAL CONGLOMERATES - 33.7% |
Industrial Conglomerates - 33.7% |
3M Co. | 31,460 | | 2,451,678 |
General Electric Co. | 402,960 | | 14,994,142 |
Textron, Inc. | 9,800 | | 918,946 |
Tyco International Ltd. | 106,625 | | 3,241,400 |
| | 21,606,166 |
MACHINERY - 15.8% |
Construction & Farm Machinery & Heavy Trucks - 6.3% |
Caterpillar, Inc. | 33,300 | | 2,042,289 |
Deere & Co. | 12,400 | | 1,178,868 |
Manitowoc Co., Inc. | 13,400 | | 796,362 |
| | 4,017,519 |
Industrial Machinery - 9.5% |
Danaher Corp. (d) | 37,300 | | 2,702,012 |
Dover Corp. | 12,500 | | 612,750 |
Illinois Tool Works, Inc. (d) | 31,600 | | 1,459,604 |
ITT Corp. | 17,700 | | 1,005,714 |
SPX Corp. | 5,200 | | 318,032 |
| | 6,098,112 |
TOTAL MACHINERY | | 10,115,631 |
ROAD & RAIL - 8.9% |
Railroads - 6.8% |
Burlington Northern Santa Fe Corp. | 23,100 | | 1,705,011 |
CSX Corp. | 17,400 | | 599,082 |
Norfolk Southern Corp. | 16,360 | | 822,744 |
Union Pacific Corp. | 12,900 | | 1,187,058 |
| | 4,313,895 |
Trucking - 2.1% |
Knight Transportation, Inc. | 18,200 | | 310,310 |
Landstar System, Inc. | 12,756 | | 487,024 |
Common Stocks - continued |
| Shares | | Value (Note 1) |
ROAD & RAIL - CONTINUED |
Trucking - continued |
Old Dominion Freight Lines, Inc. (a) | 10,500 | | $ 252,735 |
YRC Worldwide, Inc. (a) | 8,200 | | 309,386 |
| | 1,359,455 |
TOTAL ROAD & RAIL | | 5,673,350 |
TRADING COMPANIES & DISTRIBUTORS - 1.3% |
Trading Companies & Distributors - 1.3% |
MSC Industrial Direct Co., Inc. Class A | 13,200 | | 516,780 |
WESCO International, Inc. (a) | 5,200 | | 305,812 |
| | 822,592 |
TOTAL COMMON STOCKS (Cost $55,252,581) | 62,862,148 |
Money Market Funds - 5.5% |
| Shares | | Value (Note 1) |
Fidelity Cash Central Fund, 5.37% (b) | 841,274 | | $ 841,274 |
Fidelity Securities Lending Cash Central Fund, 5.38% (b)(c) | 2,678,275 | | 2,678,275 |
TOTAL MONEY MARKET FUNDS (Cost $3,519,549) | 3,519,549 |
TOTAL INVESTMENT PORTFOLIO - 103.6% (Cost $58,772,130) | | 66,381,697 |
NET OTHER ASSETS - (3.6)% | | (2,292,044) |
NET ASSETS - 100% | $ 64,089,653 |
Legend |
(a) Non-income producing |
(b) Affiliated fund that is available only to investment companies and other accounts managed by Fidelity Investments. The rate quoted is the annualized seven-day yield of the fund at period end. A complete unaudited listing of the fund's holdings as of its most recent quarter end is available upon request. |
(c) Investment made with cash collateral received from securities on loan. |
(d) Security or a portion of the security is on loan at period end. |
Affiliated Central Funds |
Information regarding fiscal year to date income earned by the Fund from investments in Fidelity Central Funds is as follows: |
Fund | Income earned |
Fidelity Cash Central Fund | $ 55,198 |
Fidelity Securities Lending Cash Central Fund | 25,205 |
Total | $ 80,403 |
See accompanying notes which are an integral part of the financial statements.
Annual Report
VIP Industrials Portfolio
Financial Statements
Statement of Assets and Liabilities
| December 31, 2006 |
| | |
Assets | | |
Investment in securities, at value (including securities loaned of $2,597,675) - See accompanying schedule: Unaffiliated issuers
(cost $55,252,581) | $ 62,862,148 | |
Fidelity Central Funds
(cost $3,519,549) | 3,519,549 | |
Total Investments (cost $58,772,130) | | $ 66,381,697 |
Receivable for investments sold | | 290,369 |
Dividends receivable | | 168,033 |
Interest receivable | | 2,424 |
Prepaid expenses | | 330 |
Other receivables | | 2,383 |
Total assets | | 66,845,236 |
| | |
Liabilities | | |
Payable to custodian bank | $ 168 | |
Accrued management fee | 30,175 | |
Other affiliated payables | 6,973 | |
Other payables and accrued expenses | 39,992 | |
Collateral on securities loaned,
at value | 2,678,275 | |
Total liabilities | | 2,755,583 |
| | |
Net Assets | | $ 64,089,653 |
Net Assets consist of: | | |
Paid in capital | | $ 56,381,945 |
Undistributed net investment income | | 641 |
Accumulated undistributed net realized gain (loss) on investments and foreign currency transactions | | 97,465 |
Net unrealized appreciation (depreciation) on investments and assets and liabilities in foreign currencies | | 7,609,602 |
Net Assets | | $ 64,089,653 |
Statement of Assets and Liabilities - continued
| December 31, 2006 |
| | |
Initial Class:
Net Asset Value, offering price
and redemption price
per share ($51,331,740 ÷ 3,694,136 shares) | | $ 13.90 |
| | |
Investor Class:
Net Asset Value, offering price
and redemption price
per share ($12,757,913 ÷ 920,382 shares) | | $ 13.86 |
See accompanying notes which are an integral part of the financial statements.
VIP Industrials Portfolio
Statement of Operations
| Year ended December 31, 2006 |
| | |
Investment Income | | |
Dividends | | $ 1,007,338 |
Interest | | 52 |
Income from Fidelity Central Funds | | 80,403 |
Total income | | 1,087,793 |
| | |
Expenses | | |
Management fee | $ 356,110 | |
Transfer agent fees | 57,907 | |
Accounting and security lending fees | 24,869 | |
Custodian fees and expenses | 18,341 | |
Independent trustees' compensation | 231 | |
Audit | 40,611 | |
Legal | 1,904 | |
Miscellaneous | 6,840 | |
Total expenses before reductions | 506,813 | |
Expense reductions | (4,405) | 502,408 |
Net investment income (loss) | | 585,385 |
Realized and Unrealized Gain (Loss) Net realized gain (loss) on: | | |
Investment securities: | | |
Unaffiliated issuers | 7,682,226 | |
Foreign currency transactions | (273) | |
Total net realized gain (loss) | | 7,681,953 |
Change in net unrealized appreciation (depreciation) on: Investment securities | (718,846) | |
Assets and liabilities in foreign currencies | (1,851) | |
Total change in net unrealized appreciation (depreciation) | | (720,697) |
Net gain (loss) | | 6,961,256 |
Net increase (decrease) in net assets resulting from operations | | $ 7,546,641 |
Statement of Changes in Net Assets
| Year ended
December 31,
2006 | Year ended
December 31,
2005 |
Increase (Decrease) in Net Assets | | |
Operations | | |
Net investment income (loss) | $ 585,385 | $ 312,263 |
Net realized gain (loss) | 7,681,953 | 5,980,847 |
Change in net unrealized appreciation (depreciation) | (720,697) | 16,157 |
Net increase (decrease) in net assets resulting from operations | 7,546,641 | 6,309,267 |
Distributions to shareholders from net investment income | (587,778) | (330,845) |
Distributions to shareholders from net realized gain | (9,197,294) | (4,422,000) |
Total distributions | (9,785,072) | (4,752,845) |
Share transactions - net increase (decrease) | 14,031,048 | (11,610,444) |
Redemption fees | 29,081 | 22,880 |
Total increase (decrease) in net assets | 11,821,698 | (10,031,142) |
| | |
Net Assets | | |
Beginning of period | 52,267,955 | 62,299,097 |
End of period (including undistributed net investment income of $641 and undistributed net investment income of $4,930, respectively) | $ 64,089,653 | $ 52,267,955 |
See accompanying notes which are an integral part of the financial statements.
Annual Report
Financial Highlights - Initial Class
Years ended December 31, | 2006 | 2005 | 2004 | 2003 | 2002 |
Selected Per-Share Data | | | | | |
Net asset value, beginning of period | $ 14.20 | $ 13.81 | $ 11.16 | $ 8.08 | $ 10.06 |
Income from Investment Operations | | | | | |
Net investment income (loss) C | .14 | .08 | .08 G | .03 | (.01) |
Net realized and unrealized gain (loss) | 2.02 | 1.70 | 2.59 | 3.06 | (1.98) |
Total from investment operations | 2.16 | 1.78 | 2.67 | 3.09 | (1.99) |
Distributions from net investment income | (.15) | (.10) | (.04) | (.02) | (.01) |
Distributions from net realized gain | (2.33) | (1.30) | - | - | - |
Total distributions | (2.47) H | (1.40) | (.04) | (.02) | (.01) |
Redemption fees added to paid in capital C | .01 | .01 | .02 | .01 | .02 |
Net asset value, end of period | $ 13.90 | $ 14.20 | $ 13.81 | $ 11.16 | $ 8.08 |
Total Return A, B | 15.71% | 12.88% | 24.10% | 38.37% | (19.60)% |
Ratios to Average Net Assets D, F | | | | | |
Expenses before reductions | .79% | .81% | .95% | 1.85% | 1.44% |
Expenses net of fee waivers, if any | .79% | .81% | .95% | 1.50% | 1.44% |
Expenses net of all reductions | .78% | .76% | .90% | 1.47% | 1.42% |
Net investment income (loss) | .95% | .53% | .63% G | .35% | (.06)% |
Supplemental Data | | | | | |
Net assets, end of period (000 omitted) | $ 51,332 | $ 50,332 | $ 62,299 | $ 19,618 | $ 8,284 |
Portfolio turnover rate E | 137% | 160% | 121% | 117% | 143% |
A Total returns do not reflect charges attributable to your insurance company's separate account. Inclusion of these charges would reduce the total returns shown.
B Total returns would have been lower had certain expenses not been reduced during the periods shown.
C Calculated based on average shares outstanding during the period.
D Fees and expenses of the underlying Fidelity Central Funds are not included in the Fund's expense ratio. The Fund indirectly bears its proportionate share of the expenses of any underlying Fidelity Central Funds.
E Amount does not include the portfolio activity of any underlying Fidelity Central Funds.
F Expense ratios reflect operating expenses of the class. Expenses before reductions do not reflect amounts reimbursed by the investment adviser or reductions from brokerage service arrangements or other expense offset arrangements and do not represent the amount paid by the class during periods when reimbursements or reductions occur. Expenses net of fee waivers reflect expenses after reimbursement by the investment adviser but prior to reductions from brokerage service arrangements or other expense offset arrangements. Expenses net of all reductions represent the net expenses paid by the class.
G As a result in the change in the estimate of the return of capital components of dividend income realized in the year ended December 31, 2003, net investment income per share and the ratio of net investment income to average net assets for the year ended December 31, 2004 have been reduced by $.00 per share and .04%, respectively. The change in estimate has no impact on total net assets or total return of the class.
H Total distribution of $2.47 per share is comprised of distributions from net investment income of $.147 and distributions from net realized gain of $2.325 per share.
Financial Highlights - Investor Class
Years ended December 31, | 2006 | 2005 H |
Selected Per-Share Data | | |
Net asset value, beginning of period | $ 14.19 | $ 14.55 |
Income from Investment Operations | | |
Net investment income (loss) E | .12 | .02 |
Net realized and unrealized gain (loss) | 2.00 | .96 |
Total from investment operations | 2.12 | .98 |
Distributions from net investment income | (.14) | (.09) |
Distributions from net realized gain | (2.33) | (1.25) |
Total distributions | (2.46) K | (1.34) |
Redemption fees added to paid in capital E | .01 | - J |
Net asset value, end of period | $ 13.86 | $ 14.19 |
Total Return B, C, D | 15.43% | 6.65% |
Ratios to Average Net Assets F, I | | |
Expenses before reductions | .92% | 1.08% A |
Expenses net of fee waivers, if any | .92% | 1.08% A |
Expenses net of all reductions | .92% | 1.03% A |
Net investment income (loss) | .81% | .31% A |
Supplemental Data | | |
Net assets, end of period (000 omitted) | $ 12,758 | $ 1,936 |
Portfolio turnover rate G | 137% | 160% |
A Annualized
B Total returns for periods of less than one year are not annualized.
C Total returns do not reflect charges attributable to your insurance company's separate account. Inclusion of these charges would reduce the total returns shown.
D Total returns would have been lower had certain expenses not been reduced during the periods shown.
E Calculated based on average shares outstanding during the period.
F Fees and expenses of the underlying Fidelity Central Funds are not included in the Fund's expense ratio. The Fund indirectly bears its proportionate share of the expenses of any underlying Fidelity Central Funds.
G Amount does not include the portfolio activity of any underlying Fidelity Central Funds.
H For the period July 21, 2005 (commencement of sale of shares) to December 31, 2005.
I Expense ratios reflect operating expenses of the class. Expenses before reductions do not reflect amounts reimbursed by the investment adviser or reductions from brokerage service arrangements or other expense offset arrangements and do not represent the amount paid by the class during periods when reimbursements or reductions occur. Expense ratios before reductions for start-up periods may not be representative of longer-term operating periods. Expenses net of fee waivers reflect expenses after reimbursement by the investment adviser but prior to reductions from brokerage service arrangements or other expense offset arrangements. Expenses net of all reductions represent the net expenses paid by the class.
J Amount represents less than $.01 per share.
K Total distribution of $2.46 per share is comprised of distributions from net investment income of $.138 and distributions from net realized gain of $2.325 per share.
See accompanying notes which are an integral part of the financial statements.
VIP Industrials Portfolio
Notes to Financial Statements
For the period ended December 31, 2006
1. Significant Accounting Policies.
VIP Industrials Portfolio (the Fund) (formerly VIP Cyclical Industries Portfolio) is a non-diversified fund of Variable Insurance Products Fund IV (the trust) and is authorized to issue an unlimited number of shares. The trust is registered under the Investment Company Act of 1940, as amended (the 1940 Act), as an open-end management investment company organized as a Massachusetts business trust. Shares of the Fund may only be purchased by insurance companies for the purpose of funding variable annuity or variable life insurance contracts. The Fund offers the following classes of shares: Initial Class shares, and Investor Class shares. All classes have equal rights and voting privileges, except for matters affecting a single class. Investment income, realized and unrealized capital gains and losses, the common expenses of the Fund, and certain fund-level expense reductions, if any, are allocated on a pro rata basis to each class based on the relative net assets of each class to the total net assets of the Fund. Each class differs with respect to transfer agent fees incurred. Certain expense reductions also differ by class.
The Fund may invest in Fidelity Central Funds which are open-end investment companies available to investment companies and other accounts managed by Fidelity Management & Research Company (FMR) and its affiliates.The financial statements have been prepared in conformity with accounting principles generally accepted in the United States of America, which require management to make certain estimates and assumptions at the date of the financial statements. The following summarizes the significant accounting policies of the Fund, which are also consistently followed by the Fidelity Central Funds:
Security Valuation. Investments are valued and net asset value (NAV) per share is calculated (NAV calculation) as of the close of business of the New York Stock Exchange (NYSE), normally 4:00 p.m. Eastern time. Wherever possible, the Fund uses independent pricing services approved by the Board of Trustees to value its investments.
Equity securities, including restricted securities, for which market quotations are readily available, are valued at the last reported sale price or official closing price as reported by an independent pricing service on the primary market or exchange on which they are traded. In the event there were no sales during the day or closing prices are not available, securities are valued at the last quoted bid price. Investments in open-end mutual funds, including the Fidelity Central Funds, are valued at their closing net asset value each business day. Short-term securities with remaining maturities of sixty days or less for which quotations are not readily available are valued at amortized cost, which approximates value.
When current market prices or quotations are not readily available or do not accurately reflect fair value, valuations may be determined in accordance with procedures adopted by the Board of Trustees. For example, when developments occur between the close of a market and the close of the NYSE that may materially affect the value of some or all of the securities, or when trading in a security is halted, those securities may be fair valued. Factors used in the determination of fair value may include monitoring news to identify significant market or security specific events such as changes in the value of U.S. securities markets, reviewing developments in foreign markets and evaluating the performance of ADRs, futures contracts and exchange-traded funds. Because the Fund's utilization of fair value pricing depends on market activity, the frequency with which fair value pricing is used can not be predicted and may be utilized to a significant extent. The value of securities used for NAV calculation under fair value pricing may differ from published prices for the same securities.
Foreign Currency. The Fund uses foreign currency contracts to facilitate transactions in foreign-denominated securities. Losses from these transactions may arise from changes in the value of the foreign currency or if the counterparties do not perform under the contracts' terms.
Foreign-denominated assets, including investment securities, and liabilities are translated into U.S. dollars at the exchange rate at period end. Purchases and sales of investment securities, income and dividends received and expenses denominated in foreign currencies are translated into U.S. dollars at the exchange rate in effect on the transaction date.
The effects of exchange rate fluctuations on investments are included with the net realized and unrealized gain (loss) on investment securities. Other foreign currency transactions resulting in realized and unrealized gain (loss) are disclosed separately.
Investment Transactions and Income. Security transactions, including the Fund's investment activity in the Fidelity Central Funds, are accounted for as of trade date. Gains and losses on securities sold are determined on the basis of identified cost. Dividend income is recorded on the ex-dividend date, except for certain dividends from foreign securities where the ex-dividend date may have passed, which are recorded as soon as the Fund is informed of the ex-dividend date. Non-cash dividends included in dividend income, if any, are recorded at the fair market value of the securities received. Distributions received on securities that represent a return of capital or capital gain are recorded as a reduction of cost of investments and/or as a realized gain. The Fund estimates the components of distributions received that may be considered return of capital distributions or capital gain distributions. Interest income and income distributions from the Fidelity Central Funds are accrued as earned, with any income distributions receivable as of period end included in Interest Receivable on the Statement of Assets and Liabilities. Interest income includes coupon interest and amortization of premium and accretion of discount on debt securities. Investment income is recorded net of foreign taxes withheld where recovery of such taxes is uncertain.
Expenses. Most expenses of the trust can be directly attributed to a fund. Expenses which cannot be directly attributed are apportioned among each Fund in the trust. Expense estimates are accrued in the period to which they relate and adjustments are made when actual amounts are known.
Annual Report
Notes to Financial Statements - continued
1. Significant Accounting Policies - continued
Income Tax Information and Distributions to Shareholders. Each year, the Fund intends to qualify as a regulated investment company by distributing all of its taxable income and realized gains under Subchapter M of the Internal Revenue Code. As a result, no provision for income taxes is required in the accompanying financial statements. Foreign taxes are provided for based on the Fund's understanding of the tax rules and rates that exist in the foreign markets in which it invests.
Distributions are recorded on the ex-dividend date. Income dividends and capital gain distributions are declared separately for each class. Income and capital gain distributions are determined in accordance with income tax regulations, which may differ from generally accepted accounting principles.
Capital accounts within the financial statements are adjusted for permanent book-tax differences. These adjustments have no impact on net assets or the results of operations. Temporary book-tax differences will reverse in a subsequent period.
Book-tax differences are primarily due to foreign currency transactions and losses deferred due to wash sales.
The tax-basis components of distributable earnings and the federal tax cost as of period end were as follows:
Unrealized appreciation | $ 8,145,124 | |
Unrealized depreciation | (605,554) | |
Net unrealized appreciation (depreciation) | 7,539,570 | |
Undistributed ordinary income | 130,697 | |
Undistributed long-term capital gain | 37,445 | |
| | |
Cost for federal income tax purposes | $ 58,842,127 | |
The tax character of distributions paid was as follows:
| December 31, 2006 | December 31, 2005 |
Ordinary Income | $ 3,917,105 | $ 2,446,631 |
Long-term Capital Gains | 5,867,967 | 2,306,214 |
Total | $ 9,785,072 | $ 4,752,845 |
Trading (Redemption) Fees. Shares held less than 60 days are subject to a redemption fee equal to 1% of the proceeds of the redeemed shares. All redemption fees, including any estimated redemption fees paid by FMR, are retained by the Fund and accounted for as an addition to paid in capital.
New Accounting Pronouncements. In July 2006, Financial Accounting Standards Board Interpretation No. 48, Accounting for Uncertainty in Income Taxes - an interpretation of FASB Statement 109 (FIN 48), was issued and is effective on the last business day of the semiannual reporting period for fiscal years beginning after December 15, 2006. FIN 48 sets forth a threshold for financial statement recognition, measurement and disclosure of a tax position taken or expected to be taken on a tax return. Management is currently evaluating the impact, if any, the adoption of FIN 48 will have on the Fund's net assets, results of operations and financial statement disclosures.
In addition, in September 2006, Statement of Financial Accounting Standards No. 157, Fair Value Measurements (SFAS 157), was issued and is effective for fiscal years beginning after November 15, 2007. SFAS 157 defines fair value, establishes a framework for measuring fair value and expands disclosures about fair value measurements. Management is currently evaluating the impact the adoption of SFAS 157 will have on the Fund's financial statement disclosures.
2. Operating Policies.
Repurchase Agreements. FMR has received an Exemptive Order from the Securities and Exchange Commission (the SEC) which permits the Fund and other affiliated entities of FMR to transfer uninvested cash balances into joint trading accounts which are then invested in repurchase agreements. The Fund may also invest directly with institutions in repurchase agreements. Repurchase agreements are collateralized by government or non-government securities. Upon settlement date, collateral is held in segregated accounts with custodian banks and may be obtained in the event of a default of the counterparty. The Fund monitors, on a daily basis, the value of the collateral to ensure it is at least equal to the principal amount of the repurchase agreement (including accrued interest). In the event of a default by the counterparty, realization of the collateral proceeds could be delayed, during which time the value of the collateral may decline.
3. Purchases and Sales of Investments.
Purchases and sales of securities, other than short-term securities, aggregated $89,285,764 and $84,502,584, respectively.
VIP Industrials Portfolio
4. Fees and Other Transactions with Affiliates.
Management Fee. FMR and its affiliates provide the Fund with investment management related services for which the Fund pays a monthly management fee. The management fee is the sum of an individual fund fee rate that is based on an annual rate of .30% of the Fund's average net assets and a group fee rate that averaged .27% during the period. The group fee rate is based upon the average net assets of all the mutual funds advised by FMR. The group fee rate decreases as assets under management increase and increases as assets under management decrease. For the period, the total annual management fee rate was .56% of the Fund's average net assets.
Transfer Agent Fees. Fidelity Investments Institutional Operations Company, Inc. (FIIOC), an affiliate of FMR, is the fund's transfer, dividend disbursing, and shareholder servicing agent. FIIOC receives an asset-based fee with respect to each class. Each class with the exception of Investor Class pays a transfer agent fee, excluding out of pocket expenses, equal to an annual rate of .07% of their month end net assets. Investor Class pays a monthly asset-based transfer agent fee of .18% of its month end net assets. The total transfer agent fees paid by each class to FIIOC, including out of pocket expenses, were as follows:
Initial Class | $ 40,239 |
Investor Class | 17,668 |
| $ 57,907 |
Accounting and Security Lending Fees. Fidelity Service Company, Inc. (FSC), an affiliate of FMR, maintains the Fund's accounting records. The accounting fee is based on the level of average net assets for the month. Under a separate contract, FSC administers the security lending program. The security lending fee is based on the number and duration of lending transactions.
Investments in Fidelity Central Funds. The Fund may invest in Fidelity Central Funds. The Fund's Schedule of Investments lists each of the Fidelity Central Funds as an investment of the Fund but does not include the underlying holdings of each Fidelity Central Fund. As an Investing Fund, the Fund indirectly bears its proportionate share of the expenses of the underlying Fidelity Central Funds. A complete unaudited list of holdings for each Fidelity Central Fund is available upon request. In addition, the financial statements of the Fidelity Central Funds, which are not covered by the Fund's Report of Independent Registered Public Accounting Firm, are available on the EDGAR Database on the SEC's web site, www.sec.gov, or upon request.
The Money Market Central Funds seek preservation of capital and current income and are managed by Fidelity Investments Money Management, Inc. (FIMM), an affiliate of FMR.
Brokerage Commissions. The Fund placed a portion of its portfolio transactions with brokerage firms which are affiliates of the investment adviser. The commissions paid to these affiliated firms were $991 for the period.
5. Committed Line of Credit.
The Fund participates with other funds managed by FMR in a $4.2 billion credit facility (the "line of credit") to be utilized for temporary or emergency purposes to fund shareholder redemptions or for other short-term liquidity purposes. The Fund has agreed to pay commitment fees on its pro rata portion of the line of credit, which amounted to $164 and is reflected in Miscellaneous Expense on the Statement of Operations. During the period, there were no borrowings on this line of credit.
6. Security Lending.
The Fund lends portfolio securities from time to time in order to earn additional income. On the settlement date of the loan, the Fund receives collateral (in the form of U.S. Treasury obligations, letters of credit and/or cash) against the loaned securities and maintains collateral in an amount not less than 100% of the market value of the loaned securities during the period of the loan. The market value of the loaned securities is determined at the close of business of the Fund and any additional required collateral is delivered to the Fund on the next business day. If the borrower defaults on its obligation to return the securities loaned because of insolvency or other reasons, a fund could experience delays and costs in recovering the securities loaned or in gaining access to the collateral. Any cash collateral received is invested in the Fidelity Securities Lending Cash Central Fund. The value of loaned securities and cash collateral at period end are disclosed on the Fund's Statement of Assets and Liabilities. Security lending income represents the income earned on investing cash collateral, less fees and expenses associated with the loan, plus any premium payments that may be received on the loan of certain types of securities. Security lending income is presented in the Statement of Operations as a component of interest income from Fidelity Central Funds. Net income from lending portfolio securities during the period amounted to $25,205.
7. Expense Reductions.
Many of the brokers with whom FMR places trades on behalf of the Fund provided services to the Fund in addition to trade execution. These services included payments of certain expenses on behalf of the Fund totaling $3,466 for the period.
Annual Report
Notes to Financial Statements - continued
8. Other.
The Fund's organizational documents provide former and current trustees and officers with a limited indemnification against liabilities arising in connection with the performance of their duties to the Fund. In the normal course of business, the Fund may also enter into contracts that provide general indemnifications. The Fund's maximum exposure under these arrangements is unknown as this would be dependent on future claims that may be made against the Fund. The risk of material loss from such claims is considered remote.
At the end of the period, FMR or its affiliates were the owners of record of 100% of the total outstanding shares of the Fund.
The United States Securities and Exchange Commission ("SEC") is conducting an investigation of FMR (covering the years 2002 to 2004) arising from gifts, gratuities and business entertainment provided by certain brokers to certain individuals who were employed on FMR's domestic equity trading desk during that period. FMR is in discussions with the SEC staff regarding the possible resolution of the matter, but as of period-end no final resolution has been reached.
In December 2006, the Independent Trustees completed their own investigation of the matter with the assistance of independent counsel. The Independent Trustees and FMR agree that, despite the absence of proof that the Fidelity mutual funds experienced diminished execution quality as a result of the improper receipt of gifts and business entertainment, the conduct at issue was serious and is worthy of redress. Accordingly, the Independent Trustees have requested and FMR has agreed to pay $42 million to Fidelity mutual funds, plus interest to be determined at the time that payment is made. A method of allocating this payment among the funds has not yet been determined. The total payment to the Fund is not anticipated to have a material impact on the Fund's net assets. In addition, FMR reimbursed related legal expenses which are recorded in the accompanying Statement of Operations as an expense reduction.
9. Distributions to Shareholders.
Distributions to shareholders of each class were as follows:
| Years ended December 31, |
| 2006 | 2005A |
From net investment income | | |
Initial Class | $ 477,491 | $ 320,409 |
Investor Class | 110,287 | 10,436 |
Total | $ 587,778 | $ 330,845 |
From net realized gain | | |
Initial Class | $ 7,633,932 | $ 4,277,055 |
Investor Class | 1,563,362 | 144,945 |
Total | $ 9,197,294 | $ 4,422,000 |
A Distributions for Investor Class are for the period July 21, 2005 (commencement of sale of shares) to December 31, 2005.
10. Share Transactions.
Transactions for each class of shares were as follows:
| Shares | Dollars |
| Years ended December 31, | Years ended December 31, |
| 2006 | 2005A | 2006 | 2005A |
Initial Class | | | | |
Shares sold | 971,069 | 823,449 | $ 14,819,374 | $ 11,500,259 |
Reinvestment of distributions | 581,159 | 321,225 | 8,111,423 | 4,597,464 |
Shares redeemed | (1,401,453) | (2,110,942) | (20,744,056) | (29,696,282) |
Net increase (decrease) | 150,775 | (966,268) | $ 2,186,741 | $ (13,598,559) |
Investor Class | | | | |
Shares sold | 853,271 | 127,583 | $ 12,967,127 | $ 1,862,351 |
Reinvestment of distributions | 120,766 | 10,851 | 1,673,649 | 155,381 |
Shares redeemed | (190,154) | (1,935) | (2,796,469) | (29,617) |
Net increase (decrease) | 783,883 | 136,499 | $ 11,844,307 | $ 1,988,115 |
A Share transactions for Investor Class are for the period July 21, 2005 (commencement of sale of shares) to December 31, 2005.
VIP Industrials Portfolio
Report of Independent Registered Public Accounting Firm
To the Trustees of Variable Insurance Products Fund IV and the Shareholders of VIP Industrials Portfolio (formerly VIP Cyclical Industries Portfolio):
In our opinion, the accompanying statement of assets and liabilities, including the schedule of investments, and the related statements of operations and of changes in net assets and the financial highlights present fairly, in all material respects, the financial position of VIP Industrials Portfolio (formerly VIP Cyclical Industries Portfolio)(a fund of Variable Insurance Products Fund IV) at December 31, 2006, the results of its operations for the year then ended, the changes in its net assets for each of the two years in the period then ended and the financial highlights for each of the periods indicated, in conformity with accounting principles generally accepted in the United States of America. These financial statements and financial highlights (hereafter referred to as "financial statements") are the responsibility of the VIP Industrials Portfolio's management; our responsibility is to express an opinion on these financial statements based on our audits. We conducted our audits of these financial statements in accordance with the standards of the Public Company Accounting Oversight Board (United States). Those standards require that we plan and perform the audit to obtain reasonable assurance about whether the financial statements are free of material misstatement. An audit includes examining, on a test basis, evidence supporting the amounts and disclosures in the financial statements, assessing the accounting principles used and significant estimates made by management, and evaluating the overall financial statement presentation. We believe that our audits, which included confirmation of securities at December 31, 2006 by correspondence with the custodian and brokers, provide a reasonable basis for our opinion.
/s/ PricewaterhouseCoopers LLP
PricewaterhouseCoopers LLP
Boston, Massachusetts
February 16, 2007
Annual Report
Trustees and Officers
The Trustees, Member of the Advisory Board, and executive officers of the trust and funds, as applicable, are listed below. The Board of Trustees governs the fund and is responsible for protecting the interests of shareholders. The Trustees are experienced executives who meet periodically throughout the year to oversee the fund's activities, review contractual arrangements with companies that provide services to the fund, and review the fund's performance. Each of the Trustees oversees 348 funds advised by FMR or an affiliate.
The Trustees hold office without limit in time except that (a) any Trustee may resign; (b) any Trustee may be removed by written instrument, signed by at least two-thirds of the number of Trustees prior to such removal; (c) any Trustee who requests to be retired or who has become incapacitated by illness or injury may be retired by written instrument signed by a majority of the other Trustees; and (d) any Trustee may be removed at any special meeting of shareholders by a two-thirds vote of the outstanding voting securities of the trust. Each Trustee who is not an interested person (as defined in the 1940 Act) (Independent Trustee), shall retire not later than the last day of the calendar year in which his or her 72nd birthday occurs. The Independent Trustees may waive this mandatory retirement age policy with respect to individual Trustees. The executive officers and Advisory Board Member hold office without limit in time, except that any officer and Advisory Board Member may resign or may be removed by a vote of a majority of the Trustees at any regular meeting or any special meeting of the Trustees. Except as indicated, each individual has held the office shown or other offices in the same company for the past five years.
The fund's Statement of Additional Information (SAI) includes more information about the Trustees. To request a free copy, call Fidelity at 1-877-208-0098.
Interested Trustees*:
Correspondence intended for each Trustee who is an interested person may be sent to Fidelity Investments, 82 Devonshire Street, Boston, Massachusetts 02109.
Name, Age; Principal Occupation |
Edward C. Johnson 3d (76) |
| Year of Election or Appointment: 1983 Mr. Johnson is Chairman of the Board of Trustees. Mr. Johnson serves as President (2006-present), Chief Executive Officer, Chairman, and a Director of FMR Corp.; Chairman and a Director of FMR; Chairman and a Director of Fidelity Research & Analysis Company (FRAC); Chairman and a Director of Fidelity Investments Money Management, Inc.; and Chairman (2001-present) and a Director of FMR Co., Inc. In addition, Mr. Johnson serves as Chairman and Director of Fidelity International Limited (FIL). |
Robert L. Reynolds (54) |
| Year of Election or Appointment: 2003 Mr. Reynolds is President and a Director of FMR (2005-present), Fidelity Investments Money Management, Inc. (2005-present), and FMR Co., Inc. (2005-present). Mr. Reynolds also serves as Vice Chairman (2006-present), a Director (2003-present), and Chief Operating Officer of FMR Corp. and a Director of Strategic Advisers, Inc. (2005-present). He also serves on the Board at Fidelity Investments Canada, Ltd. |
* Trustees have been determined to be "Interested Trustees" by virtue of, among other things, their affiliation with the trust or various entities under common control with FMR.
Independent Trustees:
Correspondence intended for each Independent Trustee (that is, the Trustees other than the Interested Trustees) may be sent to Fidelity Investments, P.O. Box 55235, Boston, Massachusetts 02205-5235.
Name, Age; Principal Occupation |
Dennis J. Dirks (58) |
| Year of Election or Appointment: 2005 Prior to his retirement in May 2003, Mr. Dirks was Chief Operating Officer and a member of the Board of The Depository Trust & Clearing Corporation (DTCC) (1999-2003). He also served as President, Chief Operating Officer, and Board member of The Depository Trust Company (DTC) (1999-2003) and President and Board member of the National Securities Clearing Corporation (NSCC) (1999-2003). In addition, Mr. Dirks served as Chief Executive Officer and Board member of the Government Securities Clearing Corporation (2001-2003) and Chief Executive Officer and Board member of the Mortgage-Backed Securities Clearing Corporation (2001-2003). Mr. Dirks also serves as a Trustee and a member of the Finance Committee of Manhattan College (2005-present) and a Trustee and a member of the Finance Committee of AHRC of Nassau County (2006-present). |
Albert R. Gamper, Jr. (64) |
| Year of Election or Appointment: 2006 Prior to his retirement in December 2004, Mr. Gamper served as Chairman of the Board of CIT Group Inc. (commercial finance). During his tenure with CIT Group Inc. Mr. Gamper served in numerous senior management positions, including Chairman (1987-1989; 1999-2001; 2002-2004), Chief Executive Officer (1987-2004), and President (1989-2002). He currently serves as a member of the Board of Directors of Public Service Enterprise Group (utilities, 2001-present), Chairman of the Board of Governors, Rutgers University (2004-present), and Chairman of the Board of Saint Barnabas Health Care System. |
George H. Heilmeier (70) |
| Year of Election or Appointment: 2004 Dr. Heilmeier is Chairman Emeritus of Telcordia Technologies (communication software and systems), where prior to his retirement, he served as company Chairman and Chief Executive Officer. He currently serves on the Boards of Directors of The Mitre Corporation (systems engineering and information technology support for the government), and HRL Laboratories (private research and development, 2004-present). He is Chairman of the General Motors Science & Technology Advisory Board and a Life Fellow of the Institute of Electrical and Electronics Engineers (IEEE). Dr. Heilmeier is a member of the Defense Science Board and the National Security Agency Advisory Board. He is also a member of the National Academy of Engineering, the American Academy of Arts and Sciences, and the Board of Overseers of the School of Engineering and Applied Science of the University of Pennsylvania. Previously, Dr. Heilmeier served as a Director of TRW Inc. (automotive, space, defense, and information technology, 1992-2002), Compaq (1994-2002), Automatic Data Processing, Inc. (ADP) (technology-based business outsourcing, 1995-2002), INET Technologies Inc. (telecommunications network surveillance, 2001-2004), and Teletech Holdings (customer management services). He is the recipient of the 2005 Kyoto Prize in Advanced Technology for his invention of the liquid crystal display, and a member of the Consumer Electronics Hall of Fame. |
James H. Keyes (66) |
| Year of Election or Appointment: 2007 Prior to his retirement in 2003, Mr. Keyes was Chairman, President, and Chief Executive Officer of Johnson Controls, Inc. (automotive supplier, 1993-2003). He currently serves as a member of the boards of LSI Logic Corporation (semiconductor technologies), Navistar International Corporation (manufacture and sale of trucks, buses, and diesel engines, 2002-present), and Pitney Bowes, Inc. (integrated mail, messaging, and document management solutions). |
Marie L. Knowles (60) |
| Year of Election or Appointment: 2001 Prior to Ms. Knowles' retirement in June 2000, she served as Executive Vice President and Chief Financial Officer of Atlantic Richfield Company (ARCO) (diversified energy, 1996-2000). From 1993 to 1996, she was a Senior Vice President of ARCO and President of ARCO Transportation Company. She served as a Director of ARCO from 1996 to 1998. She currently serves as a Director of Phelps Dodge Corporation (copper mining and manufacturing) and McKesson Corporation (healthcare service, 2002-present). Ms. Knowles is a Trustee of the Brookings Institution and the Catalina Island Conservancy and also serves as a member of the Advisory Board for the School of Engineering of the University of Southern California. |
Ned C. Lautenbach (62) |
| Year of Election or Appointment: 2000 Mr. Lautenbach is Chairman of the Independent Trustees (2006-present). Mr. Lautenbach has been a partner of Clayton, Dubilier & Rice, Inc. (private equity investment firm) since September 1998. Previously, Mr. Lautenbach was with the International Business Machines Corporation (IBM) from 1968 until his retirement in 1998. Mr. Lautenbach serves as a Director of Sony Corporation (2006-present) and Eaton Corporation (diversified industrial) as well as the Philharmonic Center for the Arts in Naples, Florida. He also is a member of the Board of Trustees of Fairfield University (2005-present), as well as a member of the Council on Foreign Relations. |
Cornelia M. Small (62) |
| Year of Election or Appointment: 2005 Ms. Small is a member (2000-present) and Chairperson (2002-present) of the Investment Committee, and a member (2002- present) of the Board of Trustees of Smith College. Previously, she served as Chief Investment Officer (1999-2000), Director of Global Equity Investments (1996-1999), and a member of the Board of Directors of Scudder, Stevens & Clark (1990-1997) and Scudder Kemper Investments (1997-1999). In addition, Ms. Small served as Co-Chair (2000-2003) of the Annual Fund for the Fletcher School of Law and Diplomacy. |
William S. Stavropoulos (67) |
| Year of Election or Appointment: 2001 Mr. Stavropoulos is Chairman Emeritus of the Board of Directors of The Dow Chemical Company. Since joining The Dow Chemical Company in 1967, Mr. Stavropoulos served in numerous senior management positions, including President (1993-2000; 2002-2003), CEO (1995-2000; 2002-2004), and Chairman of the Executive Committee (2000-2004). Currently, he is a Director of NCR Corporation (data warehousing and technology solutions), BellSouth Corporation (telecommunications), Chemical Financial Corporation, Maersk Inc. (industrial conglomerate, 2002-present), and Metalmark Capital (private equity investment firm, 2005-present). He also serves as a member of the Board of Trustees of the American Enterprise Institute for Public Policy Research. In addition, Mr. Stavropoulos is a member of The Business Council, J.P. Morgan International Council and the University of Notre Dame Advisory Council for the College of Science. |
Kenneth L. Wolfe (67) |
| Year of Election or Appointment: 2005 Prior to his retirement in 2001, Mr. Wolfe was Chairman and Chief Executive Officer of Hershey Foods Corporation (1993-2001). He currently serves as a member of the boards of Adelphia Communications Corporation (2003-present), Bausch & Lomb, Inc., and Revlon Inc. (2004-present). |
Advisory Board Member and Executive Officers:
Correspondence intended for each executive officer and Mr. Lynch may be sent to Fidelity Investments, 82 Devonshire Street, Boston, Massachusetts 02109.
Name, Age; Principal Occupation |
Peter S. Lynch (62) |
| Year of Election or Appointment: 2003 Member of the Advisory Board of Variable Insurance Products Fund IV. Mr. Lynch is Vice Chairman and a Director of FMR, and Vice Chairman (2001-present) and a Director of FMR Co., Inc. Previously, Mr. Lynch served as a Trustee of the Fidelity funds (1990-2003). In addition, he serves as a Trustee of Boston College and as the Chairman of the Inner-City Scholarship Fund. |
Kimberley H. Monasterio (43) |
| Year of Election or Appointment: 2007 President and Treasurer of VIP Industrials. Ms. Monasterio also serves as President and Treasurer of other Fidelity funds (2007-present) and is an employee of FMR (2004-present). Previously, Ms. Monasterio served as Deputy Treasurer of the Fidelity funds (2004-2006). Before joining Fidelity Investments, Ms. Monasterio served as Treasurer (2000-2004) and Chief Financial Officer (2002-2004) of the Franklin Templeton Funds and Senior Vice President of Franklin Templeton Services, LLC (2000-2004). |
Boyce I. Greer (50) |
| Year of Election or Appointment: 2005 Vice President of VIP Industrials. Mr. Greer also serves as Vice President of certain Equity Funds (2005-present), certain Asset Allocation Funds (2005-present), Fixed-Income Funds (2006-present), and Money Market Funds (2006-present). Mr. Greer is also a Trustee of other investment companies advised by FMR (2003-present). He is an Executive Vice President of FMR (2005-present) and FMR Co., Inc. (2005-present), and Senior Vice President of Fidelity Investments Money Management, Inc. (2006-present). Previously, Mr. Greer served as a Director and Managing Director of Strategic Advisers, Inc. (2002-2005), and Executive Vice President (2000-2002) and Money Market Group Leader (1997-2002) of the Fidelity Investments Fixed Income Division. He also served as Vice President of Fidelity's Money Market Funds (1997-2002), Senior Vice President of FMR (1997-2002), and Vice President of FIMM (1998-2002). |
Eric D. Roiter (58) |
| Year of Election or Appointment: 2001 Secretary of VIP Industrials. He also serves as Secretary of other Fidelity funds; Vice President, General Counsel, and Secretary of FMR Co., Inc. (2001-present) and FMR; Assistant Secretary of Fidelity Management & Research (U.K.) Inc. (2001-present), Fidelity Research & Analysis Company (2001-present), and Fidelity Investments Money Management, Inc. (2001-present). Mr. Roiter is an Adjunct Member, Faculty of Law, at Boston College Law School (2003-present). Previously, Mr. Roiter served as Vice President and Secretary of Fidelity Distributors Corporation (FDC) (1998-2005). |
Stuart Fross (47) |
| Year of Election or Appointment: 2003 Assistant Secretary of VIP Industrials. Mr. Fross also serves as Assistant Secretary of other Fidelity funds (2003-present), Vice President and Secretary of FDC (2005-present), and is an employee of FMR. |
R. Stephen Ganis (40) |
| Year of Election or Appointment: 2006 Anti-Money Laundering (AML) officer of VIP Industrials. Mr. Ganis also serves as AML officer of other Fidelity funds (2006-present) and FMR Corp. (2003-present). Before joining Fidelity Investments, Mr. Ganis practiced law at Goodwin Procter, LLP (2000-2002). |
Joseph B. Hollis (58) |
| Year of Election or Appointment: 2006 Chief Financial Officer of VIP Industrials. Mr. Hollis also serves as Chief Financial Officer of other Fidelity funds. Mr. Hollis is President of Fidelity Pricing and Cash Management Services (FPCMS) (2005-present). Mr. Hollis also serves as President and Director of Fidelity Service Company, Inc. (2006-present). Previously, Mr. Hollis served as Senior Vice President of Cash Management Services (1999-2002) and Investment Management Operations (2002-2005). |
Kenneth A. Rathgeber (59) |
| Year of Election or Appointment: 2004 Chief Compliance Officer of VIP Industrials. Mr. Rathgeber also serves as Chief Compliance Officer of other Fidelity funds (2004-present) and Executive Vice President of Risk Oversight for Fidelity Investments (2002-present). He is Chief Compliance Officer of FMR (2005-present), FMR Co., Inc. (2005-present), Fidelity Management & Research (U.K.) Inc. (2005-present), Fidelity Research & Analysis Company (2005-present), Fidelity Investments Money Management, Inc. (2005-present), and Strategic Advisers, Inc. (2005-present). Previously, Mr. Rathgeber served as Executive Vice President and Chief Operating Officer for Fidelity Investments Institutional Services Company, Inc. (1998-2002). |
Bryan A. Mehrmann (45) |
| Year of Election or Appointment: 2005 Deputy Treasurer of VIP Industrials. Mr. Mehrmann also serves as Deputy Treasurer of other Fidelity funds (2005-present) and is an employee of FMR. Previously, Mr. Mehrmann served as Vice President of Fidelity Investments Institutional Services Group (FIIS)/ Fidelity Investments Institutional Operations Corporation, Inc. (FIIOC) Client Services (1998-2004). |
Kenneth B. Robins (37) |
| Year of Election or Appointment: 2005 Deputy Treasurer of VIP Industrials. Mr. Robins also serves as Deputy Treasurer of other Fidelity funds (2005-present) and is an employee of FMR (2004-present). Before joining Fidelity Investments, Mr. Robins worked at KPMG LLP, where he was a partner in KPMG's department of professional practice (2002-2004) and a Senior Manager (1999-2000). In addition, Mr. Robins served as Assistant Chief Accountant, United States Securities and Exchange Commission (2000-2002). |
Robert G. Byrnes (40) |
| Year of Election or Appointment: 2005 Assistant Treasurer of VIP Industrials. Mr. Byrnes also serves as Assistant Treasurer of other Fidelity funds (2005-present) and is an employee of FMR (2005-present). Previously, Mr. Byrnes served as Vice President of FPCMS (2003-2005). Before joining Fidelity Investments, Mr. Byrnes worked at Deutsche Asset Management where he served as Vice President of the Investment Operations Group (2000-2003). |
John H. Costello (60) |
| Year of Election or Appointment: 1991 Assistant Treasurer of VIP Industrials. Mr. Costello also serves as Assistant Treasurer of other Fidelity funds and is an employee of FMR. |
Peter L. Lydecker (52) |
| Year of Election or Appointment: 2004 Assistant Treasurer of VIP Industrials. Mr. Lydecker also serves as Assistant Treasurer of other Fidelity funds (2004) and is an employee of FMR. |
Mark Osterheld (51) |
| Year of Election or Appointment: 2002 Assistant Treasurer of VIP Industrials. Mr. Osterheld also serves as Assistant Treasurer of other Fidelity funds (2002) and is an employee of FMR. |
Gary W. Ryan (48) |
| Year of Election or Appointment: 2005 Assistant Treasurer of VIP Industrials. Mr. Ryan also serves as Assistant Treasurer of other Fidelity funds (2005-present) and is an employee of FMR (2005-present). Previously, Mr. Ryan served as Vice President of Fund Reporting in FPCMS (1999-2005). |
Salvatore Schiavone (41) |
| Year of Election or Appointment: 2005 Assistant Treasurer of VIP Industrials. Mr. Schiavone also serves as Assistant Treasurer of other Fidelity funds (2005-present) and is an employee of FMR (2005-present). Before joining Fidelity Investments, Mr. Schiavone worked at Deutsche Asset Management, where he most recently served as Assistant Treasurer (2003-2005) of the Scudder Funds and Vice President and Head of Fund Reporting (1996-2003). |
VIP Industrials Portfolio
Distributions
The Board of Trustees of VIP Industrials Portfolio (formerly VIP Cyclical Industries Portfolio) voted to pay to shareholders of record at the opening of business on record date, the following distributions per share derived from capital gains realized from sales of portfolio securities:
Fund | Pay Date | Record Date | Capital Gains |
Initial Class | 02/09/07 | 02/09/07 | $.04 |
Investor Class | 02/09/07 | 02/09/07 | $.04 |
The fund hereby designates as a capital gain dividend with respect to the taxable year ended December 31, 2006, $5,237,342, or, if subsequently determined to be different, the net capital gain of such year.
Initial Class designates 30%; and Investor Class designates 30% of the dividends distributed during the fiscal year as qualifying for the dividends-received deduction for corporate shareholders.
The fund will notify shareholders in January 2007 of amounts for use in preparing 2006 income tax returns.
Annual Report
Proxy Voting Results
A special meeting of the fund's shareholders was held on September 20, 2006. The results of votes taken among shareholders on the proposals before them are reported below. Each vote reported represents one dollar of net asset value held on the record date for the meeting.
PROPOSAL 1 |
To elect a Board of Trustees. A |
| # of
Votes | % of
Votes |
Dennis J. Dirks |
Affirmative | 92,459,317.52 | 96.102 |
Withheld | 3,749,837.05 | 3.898 |
TOTAL | 96,209,154.57 | 100.00 |
Albert R. Gamper, Jr. |
Affirmative | 92,260,598.99 | 95.896 |
Withheld | 3,948,555.58 | 4.104 |
TOTAL | 96,209,154.57 | 100.000 |
Robert M. Gates |
Affirmative | 92,315,480.72 | 95.953 |
Withheld | 3,893,673.85 | 4.047 |
TOTAL | 96,209,154.57 | 100.000 |
George H. Heilmeier |
Affirmative | 92,208,255.41 | 95.841 |
Withheld | 4,000,899.16 | 4.159 |
TOTAL | 96,209,154.57 | 100.000 |
Edward C. Johnson 3d |
Affirmative | 91,928,267.76 | 95.550 |
Withheld | 4,280,886.81 | 4.450 |
TOTAL | 96,209,154.57 | 100.000 |
Stephen P. Jonas |
Affirmative | 92,457,628.76 | 96.101 |
Withheld | 3,751,525.81 | 3.899 |
TOTAL | 96,209,154.57 | 100.000 |
James H. KeyesB |
Affirmative | 92,432,729.82 | 96.075 |
Withheld | 3,776,424.75 | 3.925 |
TOTAL | 96,209,154.57 | 100.000 |
Marie L. Knowles |
Affirmative | 92,398,847.52 | 96.040 |
Withheld | 3,810,307.05 | 3.960 |
TOTAL | 96,209,154.57 | 100.000 |
Ned C. Lautenbach |
Affirmative | 92,423,184.47 | 96.065 |
Withheld | 3,785,970.10 | 3.935 |
TOTAL | 96,209,154.57 | 100.000 |
William O. McCoy |
Affirmative | 92,086,293.90 | 95.715 |
Withheld | 4,122,860.67 | 4.285 |
TOTAL | 96,209,154.57 | 100.000 |
| # of
Votes | % of
Votes |
Robert L. Reynolds |
Affirmative | 92,439,032.86 | 96.081 |
Withheld | 3,770,121.71 | 3.919 |
TOTAL | 96,209,154.57 | 100.000 |
Cornelia M. Small |
Affirmative | 92,415,567.29 | 96.057 |
Withheld | 3,793,587.28 | 3.943 |
TOTAL | 96,209,154.57 | 100.000 |
William S. Stavropoulos |
Affirmative | 92,135,400.08 | 95.766 |
Withheld | 4,073,754.49 | 4.234 |
TOTAL | 96,209,154.57 | 100.000 |
Kenneth L. Wolfe |
Affirmative | 92,445,865.31 | 96.088 |
Withheld | 3,763,289.26 | 3.912 |
TOTAL | 96,209,154.57 | 100.000 |
PROPOSAL 3A |
To modify the fundamental "invests primarily" policy (the investment policy concerning the fund's primary investments). |
| # of
Votes | % of
Votes |
Affirmative | 4,053,444.71 | 89.683 |
Against | 295,431.08 | 6.536 |
Abstain | 170,882.15 | 3.781 |
TOTAL | 4,519,757.94 | 100.000 |
PROPOSAL 3B |
To modify the fund's fundamental concentration policy. |
| # of
Votes | % of
Votes |
Affirmative | 4,099,229.32 | 90.696 |
Against | 232,095.07 | 5.135 |
Abstain | 188,433.55 | 4.169 |
TOTAL | 4,519,757.94 | 100.000 |
A Denotes trust-wide proposal and voting results. B Effective on or about January 1, 2007. |
VIP Industrials Portfolio
Board Approval of Investment Advisory Contracts and Management Fees
VIP Industrials Portfolio (formerly Cyclical Industries Portfolio)
Each year, typically in July, the Board of Trustees, including the Independent Trustees (together, the Board), votes on the renewal of the management contract and sub-advisory agreements (together, the Advisory Contracts) for the fund. The Board, assisted by the advice of fund counsel and Independent Trustees' counsel, requests and considers a broad range of information throughout the year.
The Board meets regularly each month except August and takes into account throughout the year matters bearing on Advisory Contracts. The Board, acting directly and through its separate committees, considers at each of its meetings factors that are relevant to the annual renewal of the fund's Advisory Contracts, including the services and support provided to the fund and its shareholders. At the time of the renewal, the Board had 12 standing committees, each composed of Independent Trustees with varying backgrounds, to which the Board has assigned specific subject matter responsibilities in order to enhance effective decision-making by the Board. Each committee has adopted a written charter outlining the structure and purposes of the committee. One such committee, the Equity Contract Committee, meets periodically as needed throughout the year to consider matters specifically related to the annual renewal of Advisory Contracts. The committee requests and receives information on, and makes recommendations to the Independent Trustees concerning, the approval and annual review of the Advisory Contracts.
At its July 2006 meeting, the Board of Trustees, including the Independent Trustees, unanimously determined to renew the Advisory Contracts for the fund. In reaching its determination, the Board considered all factors it believed relevant, including (i) the nature, extent, and quality of the services to be provided to the fund and its shareholders (including the investment performance of the fund); (ii) the competitiveness of the management fee and total expenses of the fund; (iii) the total costs of the services to be provided by and the profits to be realized by the investment adviser and its affiliates from the relationship with the fund; (iv) the extent to which economies of scale would be realized as the fund grows; and (v) whether fee levels reflect these economies of scale, if any, for the benefit of fund shareholders.
In determining whether to renew the Advisory Contracts for the fund, the Board ultimately reached a determination, with the assistance of fund counsel and Independent Trustees' counsel, that the renewal of the Advisory Contracts and the compensation to be received by Fidelity under the management contract is consistent with Fidelity's fiduciary duty under applicable law. In addition to evaluating the specific factors noted above, the Board, in reaching its determination, is aware that shareholders in the fund have a broad range of investment choices available to them, including a wide choice among mutual funds offered by competitors to Fidelity, and that the fund's shareholders, with the opportunity to review and weigh the disclosure provided by the fund in its prospectus and other public disclosures, have chosen to invest in this fund, managed by Fidelity.
Nature, Extent, and Quality of Services Provided. The Board considered staffing within the investment adviser, FMR, and the sub-advisers (together, the Investment Advisers), including the background of the fund's portfolio manager and the fund's investment objective and discipline. The Independent Trustees also had discussions with senior management of Fidelity's investment operations and investment groups. The Board considered the structure of the portfolio manager compensation program and whether this structure provides appropriate incentives.
Resources Dedicated to Investment Management and Support Services. The Board reviewed the size, education, and experience of the Investment Advisers' investment staff, their use of technology, and the Investment Advisers' approach to recruiting, training, and retaining portfolio managers and other research, advisory, and management personnel. The Board considered Fidelity's extensive global research capabilities that enable the Investment Advisers to aggregate data from various sources in an effort to produce positive investment results. The Board noted that Fidelity's analysts have access to a variety of technological tools that enable them to perform both fundamental and quantitative analysis and to specialize in various disciplines. The Board also considered that Fidelity's portfolio managers and analysts have access to daily portfolio attribution that allows for monitoring of a fund's portfolio, as well as an electronic communication system that provides immediate real-time access to research concerning issuers and credit enhancers.
Shareholder and Administrative Services. The Board considered (i) the nature, extent, quality, and cost of administrative, distribution, and shareholder services performed by the Investment Advisers and their affiliates under the Advisory Contracts and under separate agreements covering transfer agency, pricing and bookkeeping, and securities lending services for the fund; (ii) the nature and extent of the Investment Advisers' supervision of third party service providers, principally custodians and subcustodians; and (iii) the resources devoted to, and the record of compliance with, the fund's compliance policies and procedures. The Board reviewed the allocation of fund brokerage, including allocations to brokers affiliated with the Investment Advisers, the use of brokerage commissions to pay fund expenses, and the use of "soft" commission dollars to pay for research services. The Board also considered that Fidelity voluntarily pays for market data out of its own resources.
The Board noted that the growth of fund assets across the complex allows Fidelity to reinvest in the development of services designed to enhance the value or convenience of the Fidelity funds as investment vehicles. These services include 24-hour access to account information and market information through phone representatives and over the Internet, and investor education materials and asset allocation tools.
Investment in a Large Fund Family. The Board considered the benefits to shareholders of investing in a Fidelity fund, including the benefits of investing in a fund that is part of a large family of funds offering a variety of investment disciplines and providing for a large variety of mutual fund investor services. The Board noted that, since the last Advisory Contract renewals in July 2005, Fidelity has taken a number of actions that benefited particular funds, including (i) dedicating additional resources to investment research and to restructure the investment research teams; (ii) voluntarily entering into contractual arrangements with certain brokers pursuant to which Fidelity pays for research products and services separately out of its own resources, rather than bundling with fund commissions; (iii) launching the Fidelity Advantage Class of its five Spartan stock index funds and three Spartan bond index funds, which is a lower-fee class available to shareholders with higher account balances; (iv) contractually agreeing to impose expense limitations on Fidelity U.S. Bond Index Fund and reducing the fund's initial investment minimum; and (v) offering shareholders of each of the Fidelity Institutional Money Market Funds the privilege of exchanging shares of the fund for shares of other Fidelity funds.
Annual Report
Board Approval of Investment Advisory Contracts and Management Fees - continued
Investment Performance and Compliance. The Board considered whether the fund has operated within its investment objective, as well as its record of compliance with its investment restrictions. It also reviewed the fund's absolute investment performance for Initial Class, as well as the fund's relative investment performance for Initial Class measured against (i) a Goldman Sachs index that reflects the market sector in which the fund invests, and (ii) a peer group of mutual funds over multiple periods. Because the fund had been in existence less than five calendar years, the following charts considered by the Board show, over the one- and three-year periods ended December 31, 2005, the cumulative total returns of Initial Class of the fund, the cumulative total returns of a Goldman Sachs index ("benchmark"), and a range of cumulative total returns of a peer group of mutual funds identified by Lipper Inc. as having an investment objective similar to that of the fund. (Investor Class of the fund had less than one year of performance as of December 31, 2005.) The box within each chart shows the 25th percentile return (bottom of box) and the 75th percentile return (top of box) of the Lipper peer group. Returns shown above the box are in the first quartile and returns shown below the box are in the fourth quartile. The percentage beaten number noted below each chart corresponds to the percentile box and represents the percentage of funds in the Lipper peer group whose performance was equal to or lower than that of Initial Class.
VIP Industrials Portfolio
The Board reviewed the fund's relative investment performance against its Lipper peer group and stated that the performance of Initial Class of the fund was in the first quartile for all the periods shown. The Board noted that FMR does not consider that Lipper peer group to be a meaningful comparison for the fund, however, because the peer group includes funds that focus on different industries and sectors than the fund. The Board also stated that the relative investment performance of Initial Class of the fund compared favorably to its benchmark for all the periods shown.
The Board considered that FMR has taken steps to refocus and strengthen equity research, equity portfolio management, and compliance. The Board noted with favor FMR's reorganization of its senior management team in 2005 and FMR's dedication of additional resources to investment research, and participated in the process that led to those changes.
Based on its review, and giving particular weight to the nature and quality of the resources dedicated by the Investment Advisers to maintain and improve relative performance, the Board concluded that the nature, extent, and quality of the services provided to the fund will benefit the fund's shareholders, particularly in light of the Board's view that the fund's shareholders benefit from investing in a fund that is part of a large family of funds offering a variety of investment disciplines and services.
Competitiveness of Management Fee and Total Fund Expenses. The Board considered the fund's management fee and total expenses compared to "mapped groups" of competitive funds and classes. Fidelity creates "mapped groups" by combining similar Lipper investment objective categories that have comparable management fee characteristics. Combining Lipper investment objective categories aids the Board's management fee and total expense comparisons by broadening the competitive group used for comparison and by reducing the number of universes to which various Fidelity funds are compared.
VIP Industrials Portfolio
The Board considered two proprietary management fee comparisons for the 12-month (or shorter) periods shown in the chart below. The group of Lipper funds used by the Board for management fee comparisons is referred to below as the "Total Mapped Group" and, for the reasons explained above, is broader than the Lipper peer group used by the Board for performance comparisons. The Total Mapped Group comparison focuses on a fund's standing relative to the total universe of comparable funds available to investors, in terms of gross management fees before expense reimbursements or caps. "TMG %" represents the percentage of funds in the Total Mapped Group that had management fees that were lower than the fund's. For example, a TMG % of 8% means that 92% of the funds in the Total Mapped Group had higher management fees than the fund. The "Asset-Size Peer Group" (ASPG) comparison focuses on a fund's standing relative to non-Fidelity funds similar in size to the fund within the Total Mapped Group. The ASPG represents at least 15% of the funds in the Total Mapped Group with comparable asset size and management fee characteristics, subject to a minimum of 50 funds (or all funds in the Total Mapped Group if fewer than 50). Additional information, such as the ASPG quartile in which the fund's management fee ranked, is also included in the chart and considered by the Board.
VIP Industrials Portfolio
The Board noted that the fund's management fee ranked below the median of its Total Mapped Group and below the median of its ASPG for 2005.
Based on its review, the Board concluded that the fund's management fee was fair and reasonable in light of the services that the fund receives and the other factors considered.
In its review of each class's total expenses, the Board considered the fund's management fee as well as other fund or class expenses, as applicable, such as transfer agent fees, pricing and bookkeeping fees, and custodial, legal, and audit fees. The Board also noted the effects of any waivers and reimbursements on fees and expenses. As part of its review, the Board also considered current and historical total expenses of each class of the fund compared to competitive fund median expenses. Each class of the fund is compared to those funds and classes in the Total Mapped Group (used by the Board for management fee comparisons) that have a similar sales load structure.
The Board noted that the total expenses of each class ranked below its competitive median for 2005.
In its review of total expenses, the Board also considered Fidelity fee structures and other information on clients that FMR and its affiliates service in other competitive markets, such as other mutual funds advised or subadvised by FMR or its affiliates, pension plan clients, and other institutional clients.
Based on its review, the Board concluded that the total expenses of each class of the fund were reasonable in light of the services that the fund and its shareholders receive and the other factors considered.
Costs of the Services and Profitability. The Board considered the revenues earned and the expenses incurred by Fidelity in conducting the business of developing, marketing, distributing, managing, administering and servicing the fund and its shareholders. The Board also considered the level of Fidelity's profits in respect of all the Fidelity funds.
On an annual basis, FMR presents to the Board Fidelity's profitability for the fund. Fidelity calculates the profitability for each fund, as well as aggregate profitability for groups of Fidelity funds and all Fidelity funds, using a series of detailed revenue and cost allocation methodologies which originate with the audited books and records of Fidelity. The Audit Committee of the Board reviews any significant changes from the prior year's methodologies.
Annual Report
Board Approval of Investment Advisory Contracts and Management Fees - continued
PricewaterhouseCoopers LLP (PwC), independent registered accounting firm and auditor to Fidelity and certain Fidelity funds, has been engaged annually by the Board as part of the Board's assessment of the results of Fidelity's profitability analysis. PwC's engagement includes the review and assessment of Fidelity's methodologies used in determining the revenues and expenses attributable to Fidelity's mutual fund business, and completion of agreed-upon procedures surrounding the mathematical accuracy of fund profitability and its conformity to allocation methodologies. After considering PwC's reports issued under the engagement and information provided by Fidelity, the Board believes that while other allocation methods may also be reasonable, Fidelity's profitability methodologies are reasonable in all material respects.
The Board has also reviewed Fidelity's non-fund businesses and any fall-out benefits related to the mutual fund business as well as cases where Fidelity's affiliates may benefit from or be related to the fund's business.
The Board considered the costs of the services provided by and the profits realized by Fidelity in connection with the operation of the fund and determined that the amount of profit is a fair entrepreneurial profit for the management of the fund.
Economies of Scale. The Board considered whether there have been economies of scale in respect of the management of the Fidelity funds, whether the Fidelity funds (including the fund) have appropriately benefited from any such economies of scale, and whether there is potential for realization of any further economies of scale. The Board considered the extent to which the fund will benefit from economies of scale through increased services to the fund, through waivers or reimbursements, or through fee or expense reductions.
The Board recognized that the fund's management contract incorporates a "group fee" structure, which provides for lower fee rates as total fund assets under FMR's management increase, and for higher fee rates as total fund assets under FMR's management decrease. The Board considered that the group fee is designed to deliver the benefits of economies of scale to fund shareholders when total fund assets increase, even if assets of any particular fund are unchanged or have declined, because some portion of Fidelity's costs are attributable to services provided to all Fidelity funds, and all funds benefit if those costs can be allocated among more assets. The Board concluded that, given the group fee structure, fund shareholders will achieve a certain level of economies of scale as assets under FMR's management increase at the fund complex level, regardless of whether Fidelity achieves any such economies of scale.
The Board further concluded that any potential economies of scale are being shared between fund shareholders and Fidelity in an appropriate manner.
Additional Information Requested by the Board. In order to develop fully the factual basis for consideration of the Advisory Contracts, the Board requested additional information on several topics, including (i) Fidelity's fund profitability methodology and profitability trends within certain funds; (ii) portfolio manager compensation; (iii) the extent to which any economies of scale exist and are shared between the funds and Fidelity; (iv) the total expenses of certain funds and classes relative to competitors, including the extent to which the expenses of certain funds have been or could be capped; (v) fund performance trends; and (vi) Fidelity's fee structures, including use of performance fees.
Based on its evaluation of all of the conclusions noted above, and after considering all material factors, the Board ultimately concluded that the advisory fee structures are fair and reasonable, and that the fund's Advisory Contracts should be renewed.
VIP Industrials Portfolio
Annual Report
VIP Industrials Portfolio
Annual Report
Investment Adviser
Fidelity Management & Research Company
Boston, MA
Investment Sub-Advisers
FMR Co., Inc.
Fidelity Management & Research (U.K.) Inc.
Fidelity Research & Analysis Company
(formerly Fidelity Management &
Research (Far East) Inc.)
Fidelity Investments Japan Limited
Fidelity International Investment Advisors
Fidelity International Investment Advisors
(U.K.) Limited
General Distributor
Fidelity Distributors Corporation
Boston, MA
Transfer and Service Agents
Fidelity Investments Institutional Operations Company, Inc.
Boston, MA
Fidelity Service Company, Inc.
Boston, MA
Custodian
JPMorgan Chase Bank
New York, NY
VCYLIC-ANN-0207
1.817361.101
Fidelity® Variable Insurance Products:
International Capital Appreciation Portfolio
Annual Report
December 31, 2006
(2_fidelity_logos) (Registered_Trademark)
Contents
Performance | <Click Here> | How the fund has done over time. |
Management's Discussion | <Click Here> | The managers' review of fund performance, strategy and outlook. |
Shareholder Expense Example | <Click Here> | An example of shareholder expenses. |
Investment Changes | <Click Here> | A summary of major shifts in the fund's investments over
the past six months. |
Investments | <Click Here> | A complete list of the fund's investments with their
market values. |
Financial Statements | <Click Here> | Statements of assets and liabilities, operations, and
changes in net assets, as well as financial highlights. |
Notes | <Click Here> | Notes to the financial statements. |
Report of Independent Registered Public Accounting Firm | <Click Here> | |
Trustees and Officers | <Click Here> | |
Distributions | <Click Here> | |
Proxy Voting Results | <Click Here> | |
Board Approval of Investment Advisory Contracts and Management Fees | <Click Here> | |
To view a fund's proxy voting guidelines and proxy voting record for the 12-month period ended June 30, visit www.fidelity.com/proxyvotingresults or visit the Securities and Exchange Commission's (SEC) web site at www.sec.gov. You may also call 1-877-208-0098 to request a free copy of the proxy voting guidelines.
Fidelity Variable Insurance Products are separate account options which are purchased through a variable insurance contract.
Standard & Poor's, S&P and S&P 500 are registered service marks of The McGraw-Hill Companies, Inc. and have been licensed for use by Fidelity Distributors Corporation.
Other third party marks appearing herein are the property of their respective owners.
All other marks appearing herein are registered or unregistered trademarks or service marks of FMR Corp. or an affiliated company.
This report and the financial statements contained herein are submitted for the general information of the shareholders of the fund. This report is not authorized for distribution to prospective investors in the fund unless preceded or accompanied by an effective prospectus.
A fund files its complete schedule of portfolio holdings with the SEC for the first and third quarters of each fiscal year on Form N-Q. Forms N-Q are available on the SEC's web site at http://www.sec.gov. A fund's Forms N-Q may be reviewed and copied at the SEC's Public Reference Room in Washington, DC. Information regarding the operation of the SEC's Public Reference Room may be obtained by calling 1-800-SEC-0330. For a complete list of a fund's portfolio holdings, view the most recent quarterly holdings report, semiannual report, or annual report on Fidelity's web site at http://www.advisor.fidelity.com.
NOT FDIC INSURED · MAY LOSE VALUE · NO BANK GUARANTEE
Neither the fund nor Fidelity Distributors Corporation is a bank.
VIP International Capital Appreciation Portfolio
VIP International Capital Appreciation Portfolio
Performance: The Bottom Line
Average annual total return reflects the change in the value of an investment, assuming reinvestment of a class' dividend income and capital gains (the profits earned upon the sale of securities that have grown in value) and assuming a constant rate of performance each year. During periods of reimbursement by Fidelity, a fund's total return will be greater than it would be had the reimbursement not occurred. Performance numbers are net of all underlying fund operating expenses, but do not include any insurance charges imposed by your insurance company's separate account. If performance information included the effect of these additional charges, the total returns would be lower. How a fund did yesterday is no guarantee of how it will do tomorrow.
Average Annual Total Returns
Periods ended December 31, 2006 | Past 1 Year | Life of
FundA |
VIP International Capital Appreciation - Initial Class | 14.49% | 14.58% |
VIP International Capital Appreciation - Service Class | 14.30% | 14.44% |
VIP International Capital Appreciation - Service Class 2 | 14.14% | 14.29% |
VIP International Capital Appreciation - Initial Class R | 14.50% | 14.59% |
VIP International Capital Appreciation - Service Class R | 14.30% | 14.44% |
VIP International Capital Appreciation - Service Class 2R | 14.14% | 14.29% |
VIP International Capital Appreciation - Investor Class R B | 14.23% | 14.45% |
A From December 22, 2004.
B The initial offering of Investor Class R shares took place on July 21, 2005. Returns prior to July 21, 2005 are those of Initial Class R. If Investor Class R's transfer agent fee had been reflected, returns prior to July 21, 2005 would have been lower.
$10,000 Over Life of Fund
Let's say hypothetically that $10,000 was invested in VIP International Capital Appreciation Portfolio - Initial Class on December 22, 2004, when the fund started. The chart shows how the value of your investment would have changed, and also shows how the Morgan Stanley Capital InternationalSM All Country World (MSCI ACWI) ex USA Index performed over the same period.

Annual Report
VIP International Capital Appreciation Portfolio
Management's Discussion of Fund Performance
Comments from Darren Maupin, who became Portfolio Manager of VIP International Capital Appreciation Fund on October 2, 2006
International equity markets as a whole outpaced their U.S. counterparts for the 12 months ending December 31, 2006 - partly as a result of favorable currency exchanges that boosted returns for U.S. investors in foreign stocks. The Morgan Stanley Capital InternationalSM Europe, Australasia, Far East (MSCI® EAFE®) Index - a gauge of developed stock markets outside the United States and Canada - gained 26.53% during that time. This marked the fifth year in a row that the MSCI EAFE outperformed the Standard & Poor's 500SM Index, a popular barometer of the U.S. equity market, which returned 15.79% in 2006. The European component of the MSCI EAFE, representing two-thirds of the index on average during the period, was up roughly 34%, riding the tail winds of strong profit growth and booming merger-and-acquisition activity. Japan, on the other hand, accounting for roughly one-fourth of the index, was up only modestly, struggling with a weak yen and slowing consumer spending.
For the year ending December 31, 2006, the fund trailed the Morgan Stanley Capital InternationalSM All Country World ex USA Index (MSCI ACWI), which rose 26.83%. (For specific portfolio performance results, please refer to the performance section of this report.) This shortfall came mostly from unfavorable stock selection. Inopportune picks in the financials sector hurt the most, followed by weak selection in energy, industrials and materials. Regionally, the fund's weakest picks were in the United States, Japan, Europe, and several of the emerging markets. The biggest individual detractors included Japanese brokerage firm Nikko Cordial, Japanese materials company Nitto Denko and U.S.-listed cable operator NTL, which is a British firm. With the exception of NTL, none of these detractors was held in the portfolio at period end. The fund's cash position increased to about 9% by period end - much of this coming as I repositioned the fund - and that uninvested cash cost the fund some performance as well. Conversely, favorable market selection in information technology and energy, plus good stock selection in the software/services group, helped. Beneficial holdings included Italian manufacturing conglomerate Fiat and French energy services firm Geophysique. Favorable currency movements caused by a weakening U.S. dollar contributed to the fund's absolute return.
The views expressed above reflect those of the portfolio manager(s) only through the end of the period as stated on the cover of this report and do not necessarily represent the views of Fidelity or any other person in the Fidelity organization. Any such views are subject to change at any time based upon market or other conditions and Fidelity disclaims any responsibility to update such views. These views may not be relied on as investment advice and, because investment decisions for a Fidelity fund are based on numerous factors, may not be relied on as an indication of trading intent on behalf of any Fidelity fund.
VIP International Capital Appreciation Portfolio
VIP International Capital Appreciation Portfolio
Shareholder Expense Example
As a shareholder of the Fund, you incur two types of costs: (1) transaction costs, including redemption fees, and (2) ongoing costs, including management fees, distribution and/or service (12b-1) fees and other Fund expenses. This Example is intended to help you understand your ongoing costs (in dollars) of investing in the Fund and to compare these costs with the ongoing costs of investing in other mutual funds.
The Example is based on an investment of $1,000 invested at the beginning of the period and held for the entire period (July 1, 2006 to December 31, 2006).
Actual Expenses
The first line of the accompanying table for each class of the Fund provides information about actual account values and actual expenses. You may use the information in this line, together with the amount you invested, to estimate the expenses that you paid over the period. Simply divide your account value by $1,000.00 (for example, an $8,600 account value divided by $1,000.00 = 8.6), then multiply the result by the number in the first line for a class of the Fund under the heading entitled "Expenses Paid During Period" to estimate the expenses you paid on your account during this period. The estimate of expenses does not include any fees or other expenses of any variable annuity or variable life insurance product. If they were, the estimate of expenses you paid during the period would be higher, and your ending account value would be lower.
Hypothetical Example for Comparison Purposes
The second line of the accompanying table for each class of the Fund provides information about hypothetical account values and hypothetical expenses based on a Class' actual expense ratio and an assumed rate of return of 5% per year before expenses, which is not the Class' actual return. The hypothetical account values and expenses may not be used to estimate the actual ending account balance or expenses you paid for the period. You may use this information to compare the ongoing costs of investing in the Fund and other funds. To do so, compare this 5% hypothetical example with the 5% hypothetical examples that appear in the shareholder reports of the other funds. The estimate of expenses does not include any fees or other expenses of any variable annuity or variable life insurance product. If they were, the estimate of expenses you paid during the period would be higher, and your ending account value would be lower.
Please note that the expenses shown in the table are meant to highlight your ongoing costs only and do not reflect any transaction costs. Therefore, the second line of the table is useful in comparing ongoing costs only, and will not help you determine the relative total costs of owning different funds. In addition, if these transactional costs were included, your costs would have been higher.
| Beginning
Account Value
July 1, 2006 | Ending
Account Value
December 31, 2006 | Expenses Paid
During Period*
July 1, 2006 to
December 31, 2006 |
Initial Class | | | |
Actual | $ 1,000.00 | $ 1,125.70 | $ 5.89 |
Hypothetical A | $ 1,000.00 | $ 1,019.66 | $ 5.60 |
Service Class | | | |
Actual | $ 1,000.00 | $ 1,123.90 | $ 6.42 |
Hypothetical A | $ 1,000.00 | $ 1,019.16 | $ 6.11 |
Service Class 2 | | | |
Actual | $ 1,000.00 | $ 1,124.30 | $ 7.23 |
Hypothetical A | $ 1,000.00 | $ 1,018.40 | $ 6.87 |
Initial Class R | | | |
Actual | $ 1,000.00 | $ 1,124.90 | $ 5.89 |
Hypothetical A | $ 1,000.00 | $ 1,019.66 | $ 5.60 |
Service Class R | | | |
Actual | $ 1,000.00 | $ 1,123.90 | $ 6.42 |
Hypothetical A | $ 1,000.00 | $ 1,019.16 | $ 6.11 |
Service Class 2R | | | |
Actual | $ 1,000.00 | $ 1,124.30 | $ 7.23 |
Hypothetical A | $ 1,000.00 | $ 1,018.40 | $ 6.87 |
Investor Class R | | | |
Actual | $ 1,000.00 | $ 1,124.10 | $ 6.69 |
Hypothetical A | $ 1,000.00 | $ 1,018.90 | $ 6.36 |
A 5% return per year before expenses
* Expenses are equal to each Class' annualized expense ratio (shown in the table below); multiplied by the average account value over the period, multiplied by 184/365 (to reflect the one-half year period).
Annual Report
VIP International Capital Appreciation Portfolio
Shareholder Expense Example - continued
| Annualized
Expense Ratio |
Initial Class | 1.10% |
Service Class | 1.20% |
Service Class 2 | 1.35% |
Initial Class R | 1.10% |
Service Class R | 1.20% |
Service Class 2R | 1.35% |
Investor Class R | 1.25% |
VIP International Capital Appreciation Portfolio
VIP International Capital Appreciation Portfolio
Investment Changes
Geographic Diversification (% of fund's net assets) |
As of December 31, 2006 |
| United States of America | 24.1% | |
 | Canada | 12.6% | |
| France | 10.2% | |
| Netherlands | 9.7% | |
| United Kingdom | 8.4% | |
| Germany | 8.1% | |
| Argentina | 3.9% | |
| Luxembourg | 3.6% | |
| Switzerland | 3.5% | |
| Other | 15.9% | |

Percentages are adjusted for the effect of futures contracts, if applicable. |
|
As of June 30, 2006 |
| Japan | 18.4% | |
| France | 17.0% | |
| United States of America | 12.6% | |
| Germany | 10.2% | |
| Switzerland | 9.5% | |
| Canada | 4.9% | |
| Korea (South) | 4.3% | |
| United Kingdom | 4.2% | |
| Netherlands | 4.2% | |
| Other | 14.7% | |

Percentages are adjusted for the effect of futures contracts, if applicable. |
Asset Allocation |
| % of fund's
net assets | % of fund's net assets
6 months ago |
Stocks | 90.8 | 93.2 |
Short-Term Investments and Net Other Assets | 9.2 | 6.8 |
Top Ten Stocks as of December 31, 2006 |
| % of fund's
net assets | % of fund's net assets
6 months ago |
SES Global SA FDR unit (Luxembourg, Media) | 3.6 | 0.0 |
Deere & Co. (United States of America, Machinery) | 3.4 | 0.0 |
Canadian Natural Resources Ltd. (Canada, Oil, Gas & Consumable Fuels) | 3.4 | 2.1 |
Synthes, Inc. (United States of America, Health Care Equipment & Supplies) | 3.4 | 2.1 |
Lanxess AG (Germany, Chemicals) | 3.4 | 0.0 |
Renault SA (France, Automobiles) | 3.3 | 1.1 |
Tesco PLC (United Kingdom, Food & Staples Retailing) | 2.9 | 0.0 |
Koninklijke Philips Electronics NV (Netherlands, Household Durables) | 2.8 | 0.0 |
Pearson PLC (United Kingdom, Media) | 2.8 | 0.0 |
Nintendo Co. Ltd. (Japan, Software) | 2.8 | 0.0 |
| 31.8 | |
Market Sectors as of December 31, 2006 |
| % of fund's
net assets | % of fund's net assets
6 months ago |
Consumer Discretionary | 22.8 | 8.1 |
Materials | 17.1 | 5.2 |
Energy | 12.6 | 11.8 |
Consumer Staples | 12.1 | 6.8 |
Industrials | 8.7 | 10.1 |
Financials | 6.8 | 30.6 |
Health Care | 4.5 | 8.9 |
Information Technology | 3.7 | 9.2 |
Utilities | 2.5 | 2.5 |
Annual Report
VIP International Capital Appreciation Portfolio
Investments December 31, 2006
Showing Percentage of Net Assets
Common Stocks - 90.8% |
| Shares | | Value (Note 1) |
Argentina - 3.9% |
Cresud S.A.C.I.F. y A. sponsored ADR | 44,000 | | $ 770,000 |
Inversiones y Representaciones SA sponsored GDR (a) | 46,500 | | 786,315 |
Pampa Holding SA (a) | 244,400 | | 182,567 |
TOTAL ARGENTINA | | 1,738,882 |
Austria - 2.1% |
Flughafen Wien AG | 9,700 | | 952,762 |
Canada - 12.6% |
Abitibi-Consolidated, Inc. | 397,100 | | 1,018,292 |
Aquiline Resources, Inc. (a) | 25,700 | | 162,664 |
Aquiline Resources, Inc. (a)(e) | 32,400 | | 184,563 |
Canadian Natural Resources Ltd. | 28,700 | | 1,529,764 |
Catalyst Paper Corp. (a) | 146,300 | | 445,425 |
NuVista Energy Ltd. (a) | 31,400 | | 350,086 |
ProEx Energy Ltd. (a) | 37,300 | | 411,068 |
Saskatchewan Wheat Pool, Inc. (a) | 64,400 | | 489,904 |
Suncor Energy, Inc. | 13,700 | | 1,078,493 |
TOTAL CANADA | | 5,670,259 |
Cayman Islands - 2.7% |
GlobalSantaFe Corp. | 21,000 | | 1,234,380 |
Czech Republic - 1.6% |
Philip Morris CR AS | 1,350 | | 702,443 |
France - 10.2% |
Compagnie Generale de Geophysique SA (a)(d) | 3,300 | | 715,364 |
Icade SA | 13,546 | | 855,722 |
Neopost SA | 3,273 | | 411,145 |
Pernod Ricard SA | 4,769 | | 1,095,510 |
Renault SA | 12,396 | | 1,489,233 |
TOTAL FRANCE | | 4,566,974 |
Germany - 8.1% |
E.ON AG | 8,400 | | 1,138,788 |
KarstadtQuelle AG (a)(d) | 34,300 | | 994,412 |
Lanxess AG (a) | 26,800 | | 1,503,000 |
TOTAL GERMANY | | 3,636,200 |
Italy - 2.7% |
Fiat Spa (a)(d) | 63,600 | | 1,214,802 |
Japan - 2.8% |
Nintendo Co. Ltd. | 4,800 | | 1,245,863 |
Luxembourg - 3.6% |
SES Global SA FDR unit | 93,058 | | 1,621,687 |
Netherlands - 9.7% |
CNH Global NV | 30,600 | | 835,380 |
Koninklijke Philips Electronics NV | 34,000 | | 1,277,720 |
Nutreco Holding NV | 16,100 | | 1,049,795 |
Reed Elsevier NV | 71,300 | | 1,216,163 |
TOTAL NETHERLANDS | | 4,379,058 |
|
| Shares | | Value (Note 1) |
Philippines - 0.8% |
DMCI Holdings, Inc. | 1,328,000 | | $ 165,154 |
Semirara Mining Corp. | 519,100 | | 193,141 |
TOTAL PHILIPPINES | | 358,295 |
South Africa - 2.1% |
Gold Fields Ltd. sponsored ADR | 49,800 | | 940,224 |
Sweden - 1.1% |
Atlas Copco AB (A Shares) | 15,400 | | 517,405 |
Switzerland - 3.5% |
Actelion Ltd. (Reg.) (a) | 2,263 | | 497,546 |
Bucher Holding AG | 860 | | 93,341 |
Syngenta AG sponsored ADR | 26,300 | | 976,782 |
TOTAL SWITZERLAND | | 1,567,669 |
United Kingdom - 8.4% |
Benfield Group PLC | 174,000 | | 1,218,316 |
Pearson PLC | 82,900 | | 1,252,637 |
Tesco PLC | 162,600 | | 1,288,172 |
TOTAL UNITED KINGDOM | | 3,759,125 |
United States of America - 14.9% |
Deere & Co. | 16,300 | | 1,549,641 |
Monsanto Co. | 22,000 | | 1,155,660 |
Newmont Mining Corp. | 27,500 | | 1,241,625 |
NTL, Inc. | 48,150 | | 1,215,306 |
Synthes, Inc. | 12,663 | | 1,509,442 |
TOTAL UNITED STATES OF AMERICA | | 6,671,674 |
TOTAL COMMON STOCKS (Cost $36,176,403) | 40,777,702 |
Money Market Funds - 14.5% |
| | | |
Fidelity Cash Central Fund, 5.37% (b) | 4,024,953 | | 4,024,953 |
Fidelity Securities Lending Cash Central Fund, 5.38% (b)(c) | 2,478,800 | | 2,478,800 |
TOTAL MONEY MARKET FUNDS (Cost $6,503,753) | 6,503,753 |
TOTAL INVESTMENT PORTFOLIO - 105.3% (Cost $42,680,156) | | 47,281,455 |
NET OTHER ASSETS - (5.3)% | | (2,363,570) |
NET ASSETS - 100% | $ 44,917,885 |
Legend |
(a) Non-income producing |
(b) Affiliated fund that is available only to investment companies and other accounts managed by Fidelity Investments. The rate quoted is the annualized seven-day yield of the fund at period end. A complete unaudited listing of the fund's holdings as of its most recent quarter end is available upon request. |
(c) Investment made with cash collateral received from securities on loan. |
(d) Security or a portion of the security is on loan at period end. |
(e) Restricted securities - Investment in securities not registered under the Securities Act of 1933 (excluding 144A issues). At the end of the period, the value of restricted securities (excluding 144A issues) amounted to $184,563 or 0.4% of net assets. |
Additional information on each holding is as follows: |
Security | Acquisition Date | Acquisition Cost |
Aquiline Resources, Inc. | 10/31/06 | $ 134,200 |
Affiliated Central Funds |
Information regarding fiscal year to date income earned by the Fund from investments in Fidelity Central Funds is as follows: |
Fund | Income earned |
Fidelity Cash Central Fund | $ 115,596 |
Fidelity Securities Lending Cash Central Fund | 17,084 |
Total | $ 132,680 |
See accompanying notes which are an integral part of the financial statements.
Annual Report
VIP International Capital Appreciation Portfolio
Financial Statements
Statement of Assets and Liabilities
| December 31, 2006 |
| | |
Assets | | |
Investment in securities, at value (including securities loaned of $2,369,091) - See accompanying schedule: Unaffiliated issuers
(cost $36,176,403) | $ 40,777,702 | |
Fidelity Central Funds
(cost $6,503,753) | 6,503,753 | |
Total Investments (cost $42,680,156) | | $ 47,281,455 |
Foreign currency held at value
(cost $35) | | 35 |
Receivable for investments sold | | 112,619 |
Dividends receivable | | 36,540 |
Interest receivable | | 15,911 |
Prepaid expenses | | 196 |
Receivable from investment adviser for expense reductions | | 17,897 |
Other receivables | | 21,394 |
Total assets | | 47,486,047 |
| | |
Liabilities | | |
Payable for investments purchased | $ 747 | |
Accrued management fee | 26,184 | |
Distribution fees payable | 280 | |
Other affiliated payables | 6,804 | |
Other payables and accrued expenses | 55,347 | |
Collateral on securities loaned,
at value | 2,478,800 | |
Total liabilities | | 2,568,162 |
| | |
Net Assets | | $ 44,917,885 |
Net Assets consist of: | | |
Paid in capital | | $ 40,056,323 |
Undistributed net investment income | | 1,561 |
Accumulated undistributed net realized gain (loss) on investments and foreign currency transactions | | 257,578 |
Net unrealized appreciation (depreciation) on investments and assets and liabilities in foreign currencies | | 4,602,423 |
Net Assets | | $ 44,917,885 |
Statement of Assets and Liabilities - continued
| December 31, 2006 |
| | |
Initial Class:
Net Asset Value, offering price and redemption price per share ($1,356,944 ÷ 107,019 shares) | | $ 12.68 |
| | |
Service Class:
Net Asset Value, offering price and redemption price per share ($394,317 ÷ 31,116 shares) | | $ 12.67 |
| | |
Service Class 2:
Net Asset Value, offering price and redemption price per share ($524,155 ÷ 41,376 shares) | | $ 12.67 |
| | |
Initial Class R:
Net Asset Value, offering price and redemption price per share ($17,219,299 ÷ 1,357,964 shares) | | $ 12.68 |
| | |
Service Class R:
Net Asset Value, offering price and redemption price per share ($394,317 ÷ 31,116 shares) | | $ 12.67 |
| | |
Service Class 2R:
Net Asset Value, offering price and redemption price per share ($524,156 ÷ 41,376 shares) | | $ 12.67 |
| | |
Investor Class R:
Net Asset Value, offering price and redemption price per share ($24,504,697 ÷ 1,936,828 shares) | | $ 12.65 |
See accompanying notes which are an integral part of the financial statements.
VIP International Capital Appreciation Portfolio
Statement of Operations
| Year ended December 31, 2006 |
| | |
Investment Income | | |
Dividends | | $ 680,994 |
Interest | | 170 |
Income from Fidelity Central Funds | | 132,680 |
| | 813,844 |
Less foreign taxes withheld | | (76,733) |
Total income | | 737,111 |
| | |
Expenses | | |
Management fee | $ 269,846 | |
Transfer agent fees | 53,646 | |
Distribution fees | 3,116 | |
Accounting and security lending fees | 20,848 | |
Custodian fees and expenses | 164,983 | |
Independent trustees' compensation | 132 | |
Audit | 68,331 | |
Legal | 11,579 | |
Miscellaneous | 4,482 | |
Total expenses before reductions | 596,963 | |
Expense reductions | (185,574) | 411,389 |
Net investment income (loss) | | 325,722 |
Realized and Unrealized Gain (Loss) Net realized gain (loss) on: | | |
Investment securities: | | |
Unaffiliated issuers (net of foreign taxes of $17,965) | 1,341,632 | |
Foreign currency transactions | (29,882) | |
Total net realized gain (loss) | | 1,311,750 |
Change in net unrealized appreciation (depreciation) on: Investment securities (net of decrease in deferred foreign taxes of $4,289) | 3,054,187 | |
Assets and liabilities in foreign currencies | 1,343 | |
Total change in net unrealized appreciation (depreciation) | | 3,055,530 |
Net gain (loss) | | 4,367,280 |
Net increase (decrease) in net assets resulting from operations | | $ 4,693,002 |
Statement of Changes in Net Assets
| Year ended
December 31, 2006 | Year ended
December 31, 2005 |
Increase (Decrease) in Net Assets | | |
Operations | | |
Net investment income (loss) | $ 325,722 | $ 36,898 |
Net realized gain (loss) | 1,311,750 | 75,776 |
Change in net unrealized appreciation (depreciation) | 3,055,530 | 1,498,698 |
Net increase (decrease) in net assets resulting from operations | 4,693,002 | 1,611,372 |
Distributions to shareholders from net investment income | (324,160) | (36,055) |
Distributions to shareholders from net realized gain | (1,106,887) | (24,458) |
Total distributions | (1,431,047) | (60,513) |
Share transactions - net increase (decrease) | 20,509,608 | 17,530,687 |
Redemption fees | 15,654 | 310 |
Total increase (decrease) in net assets | 23,787,217 | 19,081,856 |
| | |
Net Assets | | |
Beginning of period | 21,130,668 | 2,048,812 |
End of period (including undistributed net investment income of $1,561, and undistributed net investment income of $0, respectively) | $ 44,917,885 | $ 21,130,668 |
See accompanying notes which are an integral part of the financial statements.
Annual Report
Financial Highlights - Initial Class
Years ended December 31, | 2006 | 2005 | 2004 H |
Selected Per-Share Data | | | |
Net asset value, beginning of period | $ 11.46 | $ 10.24 | $ 10.00 |
Income from Investment Operations | | | |
Net investment income (loss) E | .11 | .06 | - J |
Net realized and unrealized gain (loss) | 1.54 | 1.21 | .24 |
Total from investment operations | 1.65 | 1.27 | .24 |
Distributions from net investment income | (.10) | (.02) | - |
Distributions from net realized gain | (.34) | (.02) | - |
Total distributions | (.43) L | (.05) K | - |
Redemption fees added to paid in capital E | - J | - J | - |
Net asset value, end of period | $ 12.68 | $ 11.46 | $ 10.24 |
Total Return B, C, D | 14.49% | 12.37% | 2.40% |
Ratios to Average Net Assets F, I | | | |
Expenses before reductions | 1.80% | 3.55% | 43.27% A |
Expenses net of fee waivers, if any | 1.10% | 1.10% | 1.10% A |
Expenses net of all reductions | 1.00% | .91% | .92% A |
Net investment income (loss) | .95% | .53% | .80% A |
Supplemental Data | | | |
Net assets, end of period (000 omitted) | $ 1,357 | $ 9,367 | $ 307 |
Portfolio turnover rate G | 185% | 176% | 52% A |
A Annualized
B Total returns for periods of less than one year are not annualized.
C Total returns do not reflect charges attributable to your insurance company's separate account. Inclusion of these charges would reduce the total returns shown.
D Total returns would have been lower had certain expenses not been reduced during the periods shown.
E Calculated based on average shares outstanding during the period.
F Fees and expenses of the underlying Fidelity Central Funds are not included in the Fund's expense ratio. The Fund indirectly bears its proportionate share of the expenses of any underlying Fidelity Central Funds.
G Amount does not include the portfolio activity of any underlying Fidelity Central Funds.
H For the period December 22, 2004 (commencement of operations) to December 31, 2004.
I Expense ratios reflect operating expenses of the class. Expenses before reductions do not reflect amounts reimbursed by the investment adviser or reductions from brokerage service arrangements or other expense offset arrangements and do not represent the amount paid by the class during periods when reimbursements or reductions occur. Expense ratios before reductions for start-up periods may not be representative of longer-term operating periods. Expenses net of fee waivers reflect expenses after reimbursement by the investment adviser but prior to reductions from brokerage service arrangements or other expense offset arrangements. Expenses net of all reductions represent the net expenses paid by the class.
J Amount represents less than $.01 per share.
K Total distribution of $.05 per share is comprised of distributions from net investment income of $.022 and distributions from net realized gain of $.023 per share.
L Total distribution of $.43 per share is comprised of distributions from net investment income of $.095 and distributions from net realized gain of $.335 per share.
Financial Highlights - Service Class
Years ended December 31, | 2006 | 2005 | 2004 H |
Selected Per-Share Data | | | |
Net asset value, beginning of period | $ 11.46 | $ 10.24 | $ 10.00 |
Income from Investment Operations | | | |
Net investment income (loss) E | .10 | .10 | - J |
Net realized and unrealized gain (loss) | 1.53 | 1.16 | .24 |
Total from investment operations | 1.63 | 1.26 | .24 |
Distributions from net investment income | (.08) | (.01) | - |
Distributions from net realized gain | (.34) | (.02) | - |
Total distributions | (.42) L | (.04) K | - |
Redemption fees added to paid in capital E | - J | - J | - |
Net asset value, end of period | $ 12.67 | $ 11.46 | $ 10.24 |
Total Return B, C, D | 14.30% | 12.27% | 2.40% |
Ratios to Average Net Assets F, I | | | |
Expenses before reductions | 1.62% | 4.35% | 43.36% A |
Expenses net of fee waivers, if any | 1.20% | 1.20% | 1.20% A |
Expenses net of all reductions | 1.10% | 1.01% | 1.01% A |
Net investment income (loss) | .85% | .98% | .71% A |
Supplemental Data | | | |
Net assets, end of period (000 omitted) | $ 394 | $ 345 | $ 307 |
Portfolio turnover rate G | 185% | 176% | 52% A |
A Annualized
B Total returns for periods of less than one year are not annualized.
C Total returns do not reflect charges attributable to your insurance company's separate account. Inclusion of these charges would reduce the total returns shown.
D Total returns would have been lower had certain expenses not been reduced during the periods shown.
E Calculated based on average shares outstanding during the period.
F Fees and expenses of the underlying Fidelity Central Funds are not included in the Fund's expense ratio. The Fund indirectly bears its proportionate share of the expenses of any underlying Fidelity Central Funds.
G Amount does not include the portfolio activity of any underlying Fidelity Central Funds.
H For the period December 22, 2004 (commencement of operations) to December 31, 2004.
I Expense ratios reflect operating expenses of the class. Expenses before reductions do not reflect amounts reimbursed by the investment adviser or reductions from brokerage service arrangements or other expense offset arrangements and do not represent the amount paid by the class during periods when reimbursements or reductions occur. Expense ratios before reductions for start-up periods may not be representative of longer-term operating periods. Expenses net of fee waivers reflect expenses after reimbursement by the investment adviser but prior to reductions from brokerage service arrangements or other expense offset arrangements. Expenses net of all reductions represent the net expenses paid by the class.
J Amount represents less than $.01 per share.
K Total distribution of $.04 per share is comprised of distributions from net investment income of $.012 and distributions from net realized gain of $.023 per share.
L Total distribution of $.42 per share is comprised of distributions from net investment income of $.084 and distributions from net realized gain of $.335 per share.
See accompanying notes which are an integral part of the financial statements.
VIP International Capital Appreciation Portfolio
Financial Highlights - Service Class 2
Years ended December 31, | 2006 | 2005 | 2004 H |
Selected Per-Share Data | | | |
Net asset value, beginning of period | $ 11.46 | $ 10.24 | $ 10.00 |
Income from Investment Operations | | | |
Net investment income (loss) E | .08 | .09 | - J |
Net realized and unrealized gain (loss) | 1.53 | 1.15 | .24 |
Total from investment operations | 1.61 | 1.24 | .24 |
Distributions from net investment income | (.07) | - | - |
Distributions from net realized gain | (.34) | (.02) | - |
Total distributions | (.40) L | (.02) K | - |
Redemption fees added to paid in capital E | - J | - J | - |
Net asset value, end of period | $ 12.67 | $ 11.46 | $ 10.24 |
Total Return B, C, D | 14.14% | 12.12% | 2.40% |
Ratios to Average Net Assets F, I | | | |
Expenses before reductions | 1.77% | 4.50% | 43.51% A |
Expenses net of fee waivers, if any | 1.35% | 1.35% | 1.35% A |
Expenses net of all reductions | 1.25% | 1.16% | 1.17% A |
Net investment income (loss) | .70% | .83% | .55% A |
Supplemental Data | | | |
Net assets, end of period (000 omitted) | $ 524 | $ 459 | $ 410 |
Portfolio turnover rate G | 185% | 176% | 52% A |
A Annualized
B Total returns for periods of less than one year are not annualized.
C Total returns do not reflect charges attributable to your insurance company's separate account. Inclusion of these charges would reduce the total returns shown.
D Total returns would have been lower had certain expenses not been reduced during the periods shown.
E Calculated based on average shares outstanding during the period.
F Fees and expenses of the underlying Fidelity Central Funds are not included in the Fund's expense ratio. The Fund indirectly bears its proportionate share of the expenses of any underlying Fidelity Central Funds.
G Amount does not include the portfolio activity of any underlying Fidelity Central Funds.
H For the period December 22, 2004 (commencement of operations) to December 31, 2004.
I Expense ratios reflect operating expenses of the class. Expenses before reductions do not reflect amounts reimbursed by the investment adviser or reductions from brokerage service arrangements or other expense offset arrangements and do not represent the amount paid by the class during periods when reimbursements or reductions occur. Expense ratios before reductions for start-up periods may not be representative of longer-term operating periods. Expenses net of fee waivers reflect expenses after reimbursement by the investment adviser but prior to reductions from brokerage service arrangements or other expense offset arrangements. Expenses net of all reductions represent the net expenses paid by the class.
J Amount represents less than $.01 per share.
K Total distribution of $.02 per share is comprised of distributions from net investment income of $.00 and distributions from net realized gain of $.02 per share.
L Total distribution of $.40 per share is comprised of distributions from net investment income of $.066 and distributions from net realized gain of $.335 per share.
Financial Highlights - Initial Class R
Years ended December 31, | 2006 | 2005 | 2004 H |
Selected Per-Share Data | | | |
Net asset value, beginning of period | $ 11.46 | $ 10.24 | $ 10.00 |
Income from Investment Operations | | | |
Net investment income (loss) E | .11 | .11 | - J |
Net realized and unrealized gain (loss) | 1.54 | 1.16 | .24 |
Total from investment operations | 1.65 | 1.27 | .24 |
Distributions from net investment income | (.10) | (.02) | - |
Distributions from net realized gain | (.34) | (.02) | - |
Total distributions | (.43) L | (.05) K | - |
Redemption fees added to paid in capital E | - J | - J | - |
Net asset value, end of period | $ 12.68 | $ 11.46 | $ 10.24 |
Total Return B, C, D | 14.50% | 12.37% | 2.40% |
Ratios to Average Net Assets F, I | | | |
Expenses before reductions | 1.46% | 4.25% | 43.27% A |
Expenses net of fee waivers, if any | 1.10% | 1.10% | 1.10% A |
Expenses net of all reductions | 1.00% | .91% | .92% A |
Net investment income (loss) | .95% | 1.08% | .80% A |
Supplemental Data | | | |
Net assets, end of period (000 omitted) | $ 17,219 | $ 345 | $ 307 |
Portfolio turnover rate G | 185% | 176% | 52% A |
A Annualized
B Total returns for periods of less than one year are not annualized.
C Total returns do not reflect charges attributable to your insurance company's separate account. Inclusion of these charges would reduce the total returns shown.
D Total returns would have been lower had certain expenses not been reduced during the periods shown.
E Calculated based on average shares outstanding during the period.
F Fees and expenses of the underlying Fidelity Central Funds are not included in the Fund's expense ratio. The Fund indirectly bears its proportionate share of the expenses of any underlying Fidelity Central Funds.
G Amount does not include the portfolio activity of any underlying Fidelity Central Funds.
H For the period December 22, 2004 (commencement of operations) to December 31, 2004.
I Expense ratios reflect operating expenses of the class. Expenses before reductions do not reflect amounts reimbursed by the investment adviser or reductions from brokerage service arrangements or other expense offset arrangements and do not represent the amount paid by the class during periods when reimbursements or reductions occur. Expense ratios before reductions for start-up periods may not be representative of longer-term operating periods. Expenses net of fee waivers reflect expenses after reimbursement by the investment adviser but prior to reductions from brokerage service arrangements or other expense offset arrangements. Expenses net of all reductions represent the net expenses paid by the class.
J Amount represents less than $.01 per share.
K Total distribution of $.05 per share is comprised of distributions from net investment income of $.022 and distributions from net realized gain of $.023 per share.
L Total distribution of $.43 per share is comprised of distributions from net investment income of $.096 and distributions from net realized gain of $.335 per share.
See accompanying notes which are an integral part of the financial statements.
Annual Report
Financial Highlights - Service Class R
Years ended December 31, | 2006 | 2005 | 2004 H |
Selected Per-Share Data | | | |
Net asset value, beginning of period | $ 11.46 | $ 10.24 | $ 10.00 |
Income from Investment Operations | | | |
Net investment income (loss) E | .10 | .10 | - J |
Net realized and unrealized gain (loss) | 1.53 | 1.16 | .24 |
Total from investment operations | 1.63 | 1.26 | .24 |
Distributions from net investment income | (.08) | (.01) | - |
Distributions from net realized gain | (.34) | (.02) | - |
Total distributions | (.42) L | (.04) K | - |
Redemption fees added to paid in capital E | - J | - J | - |
Net asset value, end of period | $ 12.67 | $ 11.46 | $ 10.24 |
Total Return B, C, D | 14.30% | 12.27% | 2.40% |
Ratios to Average Net Assets F, I | | | |
Expenses before reductions | 1.62% | 4.35% | 43.36% A |
Expenses net of fee waivers, if any | 1.20% | 1.20% | 1.20% A |
Expenses net of all reductions | 1.10% | 1.01% | 1.01% A |
Net investment income (loss) | .85% | .98% | .71% A |
Supplemental Data | | | |
Net assets, end of period (000 omitted) | $ 394 | $ 345 | $ 307 |
Portfolio turnover rate G | 185% | 176% | 52% A |
A Annualized
B Total returns for periods of less than one year are not annualized.
C Total returns do not reflect charges attributable to your insurance company's separate account. Inclusion of these charges would reduce the total returns shown.
D Total returns would have been lower had certain expenses not been reduced during the periods shown.
E Calculated based on average shares outstanding during the period.
F Fees and expenses of the underlying Fidelity Central Funds are not included in the Fund's expense ratio. The Fund indirectly bears its proportionate share of the expenses of any underlying Fidelity Central Funds.
G Amount does not include the portfolio activity of any underlying Fidelity Central Funds.
H For the period December 22, 2004 (commencement of operations) to December 31, 2004.
I Expense ratios reflect operating expenses of the class. Expenses before reductions do not reflect amounts reimbursed by the investment adviser or reductions from brokerage service arrangements or other expense offset arrangements and do not represent the amount paid by the class during periods when reimbursements or reductions occur. Expense ratios before reductions for start-up periods may not be representative of longer-term operating periods. Expenses net of fee waivers reflect expenses after reimbursement by the investment adviser but prior to reductions from brokerage service arrangements or other expense offset arrangements. Expenses net of all reductions represent the net expenses paid by the class.
J Amount represents less than $.01 per share.
K Total distribution of $.04 per share is comprised of distributions from net investment income of $.012 and distributions from net realized gain of $.023 per share.
L Total distribution of $.42 per share is comprised of distributions from net investment income of $.084 and distributions from net realized gain of $.335 per share.
Financial Highlights - Service Class 2R
Years ended December 31, | 2006 | 2005 | 2004 H |
Selected Per-Share Data | | | |
Net asset value, beginning of period | $ 11.46 | $ 10.24 | $ 10.00 |
Income from Investment Operations | | | |
Net investment income (loss) E | .08 | .09 | - J |
Net realized and unrealized gain (loss) | 1.53 | 1.15 | .24 |
Total from investment operations | 1.61 | 1.24 | .24 |
Distributions from net investment income | (.07) | - | - |
Distributions from net realized gain | (.34) | (.02) | - |
Total distributions | (.40) L | (.02) K | - |
Redemption fees added to paid in capital E | - J | - J | - |
Net asset value, end of period | $ 12.67 | $ 11.46 | $ 10.24 |
Total Return B, C, D | 14.14% | 12.12% | 2.40% |
Ratios to Average Net Assets F, I | | | |
Expenses before reductions | 1.77% | 4.50% | 43.51% A |
Expenses net of fee waivers, if any | 1.35% | 1.35% | 1.35% A |
Expenses net of all reductions | 1.25% | 1.16% | 1.17% A |
Net investment income (loss) | .70% | .83% | .55% A |
Supplemental Data | | | |
Net assets, end of period (000 omitted) | $ 524 | $ 459 | $ 410 |
Portfolio turnover rate G | 185% | 176% | 52% A |
A Annualized
B Total returns for periods of less than one year are not annualized.
C Total returns do not reflect charges attributable to your insurance company's separate account. Inclusion of these charges would reduce the total returns shown.
D Total returns would have been lower had certain expenses not been reduced during the periods shown.
E Calculated based on average shares outstanding during the period.
F Fees and expenses of the underlying Fidelity Central Funds are not included in the Fund's expense ratio. The Fund indirectly bears its proportionate share of the expenses of any underlying Fidelity Central Funds.
G Amount does not include the portfolio activity of any underlying Fidelity Central Funds.
H For the period December 22, 2004 (commencement of operations) to December 31, 2004.
I Expense ratios reflect operating expenses of the class. Expenses before reductions do not reflect amounts reimbursed by the investment adviser or reductions from brokerage service arrangements or other expense offset arrangements and do not represent the amount paid by the class during periods when reimbursements or reductions occur. Expense ratios before reductions for start-up periods may not be representative of longer-term operating periods. Expenses net of fee waivers reflect expenses after reimbursement by the investment adviser but prior to reductions from brokerage service arrangements or other expense offset arrangements. Expenses net of all reductions represent the net expenses paid by the class.
J Amount represents less than $.01 per share.
K Total distribution of $.02 per share is comprised of distributions from net investment income of $.00 and distributions from net realized gain of $.02 per share.
L Total distribution of $.40 per share is comprised of distributions from net investment income of $.066 and distributions from net realized gain of $.335 per share.
See accompanying notes which are an integral part of the financial statements.
VIP International Capital Appreciation Portfolio
Financial Highlights - Investor Class R
Years ended December 31, | 2006 | 2005 H |
Selected Per-Share Data | | |
Net asset value, beginning of period | $ 11.46 | $ 10.32 |
Income from Investment Operations | | |
Net investment income (loss) E | .09 | .01 |
Net realized and unrealized gain (loss) | 1.53 | 1.16 |
Total from investment operations | 1.62 | 1.17 |
Distributions from net investment income | (.10) | (.02) |
Distributions from net realized gain | (.34) | (.01) |
Total distributions | (.43) L | (.03) K |
Redemption fees added to paid in capital E, J | - | - |
Net asset value, end of period | $ 12.65 | $ 11.46 |
Total Return B, C, D | 14.23% | 11.39% |
Ratios to Average Net Assets F, I | | |
Expenses before reductions | 1.61% | 2.19% A |
Expenses net of fee waivers, if any | 1.25% | 1.25% A |
Expenses net of all reductions | 1.15% | 1.06% A |
Net investment income (loss) | .80% | .31% A |
Supplemental Data | | |
Net assets, end of period (000 omitted) | $ 24,505 | $ 9,810 |
Portfolio turnover rate G | 185% | 176% |
A Annualized
B Total returns for periods of less than one year are not annualized.
C Total returns do not reflect charges attributable to your insurance company's separate account. Inclusion of these charges would reduce the total returns shown.
D Total returns would have been lower had certain expenses not been reduced during the periods shown.
E Calculated based on average shares outstanding during the period.
F Fees and expenses of the underlying Fidelity Central Funds are not included in the Fund's expense ratio. The Fund indirectly bears its proportionate share of the expenses of any underlying Fidelity Central Funds.
G Amount does not include the portfolio activity of any underlying Fidelity Central Funds.
H For the period July 21, 2005 (commencement of sale of shares) to December 31, 2005.
I Expense ratios reflect operating expenses of the class. Expenses before reductions do not reflect amounts reimbursed by the investment adviser or reductions from brokerage service arrangements or other expense offset arrangements and do not represent the amount paid by the class during periods when reimbursements or reductions occur. Expense ratios before reductions for start-up periods may not be representative of longer-term operating periods. Expenses net of fee waivers reflect expenses after reimbursement by the investment adviser but prior to reductions from brokerage service arrangements or other expense offset arrangements. Expenses net of all reductions represent the net expenses paid by the class.
J Amount represents less than $.01 per share.
K Total distribution of $.03 per share is comprised of distributions from net investment income of $.022 and distributions from net realized gain of $.013 per share.
L Total distribution of $.43 per share is comprised of distributions from net investment income of $.095 and distributions from net realized gain of $.335 per share.
See accompanying notes which are an integral part of the financial statements.
Annual Report
Notes to Financial Statements
For the period ended December 31, 2006
1. Significant Accounting Policies.
VIP International Capital Appreciation Portfolio (the Fund) is a fund of Variable Insurance Products Fund IV (the trust) and is authorized to issue an unlimited number of shares. The trust is registered under the Investment Company Act of 1940, as amended (the 1940 Act), as an open-end management investment company organized as a Massachusetts business trust. Shares of the Fund may only be purchased by insurance companies for the purpose of funding variable annuity or variable life insurance contracts. The Fund offers the following classes of shares: Initial Class shares, Service Class shares, Service Class 2 shares, Initial Class R shares, Service Class R shares, Service Class 2R shares, and Investor Class R shares. All classes have equal rights and voting privileges, except for matters affecting a single class. Investment income, realized and unrealized capital gains and losses, the common expenses of the Fund, and certain fund-level expense reductions, if any, are allocated on a pro rata basis to each class based on the relative net assets of each class to the total net assets of the Fund. Each class differs with respect to transfer agent and distribution and service plan fees incurred. Certain expense reductions also differ by class.
The Fund's investments in emerging markets can be subject to social, economic, regulatory, and political uncertainties and can be extremely volatile. The Fund may invest in Fidelity Central Funds which are open-end investment companies available to investment companies and other accounts managed by Fidelity Management & Research Company (FMR) and its affiliates. The financial statements have been prepared in conformity with accounting principles generally accepted in the United States of America, which require management to make certain estimates and assumptions at the date of the financial statements. The following summarizes the significant accounting policies of the Fund, which are also consistently followed by the Fidelity Central Funds:
Security Valuation. Investments are valued and net asset value (NAV) per share is calculated (NAV calculation) as of the close of business of the New York Stock Exchange (NYSE), normally 4:00 p.m. Eastern time. Wherever possible, the Fund uses independent pricing services approved by the Board of Trustees to value its investments.
Equity securities, including restricted securities, for which market quotations are readily available, are valued at the last reported sale price or official closing price as reported by an independent pricing service on the primary market or exchange on which they are traded. In the event there were no sales during the day or closing prices are not available, securities are valued at the last quoted bid price. Investments in open-end mutual funds, including the Fidelity Central Funds, are valued at their closing net asset value each business day. Short-term securities with remaining maturities of sixty days or less for which quotations are not readily available are valued at amortized cost, which approximates value. When current market prices or quotations are not readily available or do not accurately reflect fair value, valuations may be determined in accordance with procedures adopted by the Board of Trustees. For example, when developments occur between the close of a market and the close of the NYSE that may materially affect the value of some or all of the securities, or when trading in a security is halted, those securities may be fair valued. Factors used in the determination of fair value may include monitoring news to identify significant market or security specific events such as changes in the value of U.S. securities markets, reviewing developments in foreign markets and evaluating the performance of ADRs, futures contracts and exchange-traded funds. Because the Fund's utilization of fair value pricing depends on market activity, the frequency with which fair value pricing is used can not be predicted and may be utilized to a significant extent. The value of securities used for NAV calculation under fair value pricing may differ from published prices for the same securities.
Foreign Currency. The Fund uses foreign currency contracts to facilitate transactions in foreign-denominated securities. Losses from these transactions may arise from changes in the value of the foreign currency or if the counterparties do not perform under the contracts' terms.
Foreign-denominated assets, including investment securities, and liabilities are translated into U.S. dollars at the exchange rate at period end. Purchases and sales of investment securities, income and dividends received and expenses denominated in foreign currencies are translated into U.S. dollars at the exchange rate in effect on the transaction date.
The effects of exchange rate fluctuations on investments are included with the net realized and unrealized gain (loss) on investment securities. Other foreign currency transactions resulting in realized and unrealized gain (loss) are disclosed separately.
Investment Transactions and Income. Security transactions, including the Fund's investment activity in the Fidelity Central Funds, are accounted for as of trade date. Gains and losses on securities sold are determined on the basis of identified cost. Dividend income is recorded on the ex-dividend date, except for certain dividends from foreign securities where the ex-dividend date may have passed, which are recorded as soon as the Fund is informed of the ex-dividend date. Non-cash dividends included in dividend income, if any, are recorded at the fair market value of the securities received. Interest income and income distributions from the Fidelity Central Funds are accrued as earned, with any income distributions receivable as of period end included in Interest Receivable on the Statement of Assets and Liabilities. Interest income includes coupon interest and amortization of premium and accretion of discount on debt securities. Investment income is recorded net of foreign taxes withheld where recovery of such taxes is uncertain.
VIP International Capital Appreciation Portfolio
1. Significant Accounting Policies - continued
Expenses. Most expenses of the trust can be directly attributed to a fund. Expenses which cannot be directly attributed are apportioned among each Fund in the trust. Expense estimates are accrued in the period to which they relate and adjustments are made when actual amounts are known.
Income Tax Information and Distributions to Shareholders. Each year, the Fund intends to qualify as a regulated investment company by distributing all of its taxable income and realized gains under Subchapter M of the Internal Revenue Code. As a result, no provision for income taxes is required in the accompanying financial statements. Foreign taxes are provided for based on the Fund's understanding of the tax rules and rates that exist in the foreign markets in which it invests.
Distributions are recorded on the ex-dividend date. Income dividends and capital gain distributions are declared separately for each class. Income and capital gain distributions are determined in accordance with income tax regulations, which may differ from generally accepted accounting principles.
Capital accounts within the financial statements are adjusted for permanent book-tax differences. These adjustments have no impact on net assets or the results of operations. Temporary book-tax differences will reverse in a subsequent period.
Book-tax differences are primarily due to foreign currency transactions, certain foreign taxes, passive foreign investment companies (PFIC) and losses deferred due to wash sales.
The tax-basis components of distributable earnings and the federal tax cost as of period end were as follows:
Unrealized appreciation | $ 4,681,132 | |
Unrealized depreciation | (263,567) | |
Net unrealized appreciation (depreciation) | 4,417,565 | |
Undistributed ordinary income | 396,868 | |
Undistributed long-term capital gain | 47,130 | |
| | |
Cost for federal income tax purposes | $ 42,863,890 | |
The tax character of distributions paid was as follows:
| December 31, 2006 | December 31, 2005 |
Ordinary Income | $ 779,358 | $ 60,513 |
Long-term Capital Gains | 651,689 | - |
Total | $ 1,431,047 | $ 60,513 |
Trading (Redemption) Fees. Initial Class R shares, Service Class R shares, Service Class 2 R shares and Investor Class R shares held less than 60 days are subject to a redemption fee equal to 1% of the proceeds of the redeemed shares. All redemption fees, including any estimated redemption fees paid by FMR, are retained by the Fund and accounted for as an addition to paid in capital.
New Accounting Pronouncements. In July 2006, Financial Accounting Standards Board Interpretation No. 48, Accounting for Uncertainty in Income Taxes - an interpretation of FASB Statement 109 (FIN 48), was issued and is effective on the last business day of the semiannual reporting period for fiscal years beginning after December 15, 2006. FIN 48 sets forth a threshold for financial statement recognition, measurement and disclosure of a tax position taken or expected to be taken on a tax return. Management is currently evaluating the impact, if any, the adoption of FIN 48 will have on the Fund's net assets, results of operations and financial statement disclosures.
In addition, in September 2006, Statement of Financial Accounting Standards No. 157, Fair Value Measurements (SFAS 157), was issued and is effective for fiscal years beginning after November 15, 2007. SFAS 157 defines fair value, establishes a framework for measuring fair value and expands disclosures about fair value measurements. Management is currently evaluating the impact the adoption of SFAS 157 will have on the Fund's financial statement disclosures.
2. Operating Policies.
Repurchase Agreements. FMR has received an Exemptive Order from the Securities and Exchange Commission (the SEC) which permits the Fund and other affiliated entities of FMR to transfer uninvested cash balances into joint trading accounts which are then invested in repurchase agreements. The Fund may also invest directly with institutions in repurchase agreements. Repurchase agreements are collateralized by government or non-government securities. Upon settlement date, collateral is held in segregated accounts with custodian banks and may be obtained in the event of a default of the counterparty. The Fund monitors, on a daily basis, the value of the collateral to ensure it is at least equal to the principal amount of the repurchase agreement (including accrued interest). In the event of a default by the counterparty, realization of the collateral proceeds could be delayed, during which time the value of the collateral may decline.
Annual Report
Notes to Financial Statements - continued
2. Operating Policies - continued
Restricted Securities. The Fund may invest in securities that are subject to legal or contractual restrictions on resale. These securities generally may be resold in transactions exempt from registration or to the public if the securities are registered. Disposal of these securities may involve time-consuming negotiations and expense, and prompt sale at an acceptable price may be difficult. Information regarding restricted securities is included at the end of the Fund's Schedule of Investments.
3. Purchases and Sales of Investments.
Purchases and sales of securities, other than short-term securities, aggregated $81,746,007 and $65,476,684, respectively.
4. Fees and Other Transactions with Affiliates.
Management Fee. FMR and its affiliates provide the Fund with investment management related services for which the Fund pays a monthly management fee. The management fee is the sum of an individual fund fee rate that is based on an annual rate of .45% of the Fund's average net assets and a group fee rate that averaged .27% during the period. The group fee rate is based upon the average net assets of all the mutual funds advised by FMR. The group fee rate decreases as assets under management increase and increases as assets under management decrease. For the period, the total annual management fee rate was .71% of the Fund's average net assets.
Distribution and Service Plan. In accordance with Rule 12b-1 of the 1940 Act, the Fund has adopted separate 12b-1 Plans for each Service Class of shares. Each Service Class pays Fidelity Distributors Corporation (FDC), an affiliate of FMR, a service fee. For the period, the service fee is based on an annual rate of .10% of Service Class' and Service Class R's average net assets and .25% of Service Class 2's and Service Class 2R's average net assets.
For the period, each class paid FDC the following amounts, all of which were re-allowed to insurance companies for the distribution of shares and providing shareholder support services:
Service Class | $ 361 | |
Service Class 2 | 1,197 | |
Service Class R | 361 | |
Service Class 2 R | 1,197 | |
| $ 3,116 | |
Transfer Agent Fees. Fidelity Investments Institutional Operations Company, Inc. (FIIOC), an affiliate of FMR, is the fund's transfer, dividend disbursing, and shareholder servicing agent. FIIOC receives an asset-based fee with respect to each class. Each class with the exception of Investor Class R pays a transfer agent fee, excluding out of pocket expenses, equal to an annual rate of .07% of their month end net assets. Investor Class R pays a monthly asset-based transfer agent fee of .18% of its month end net assets. The total transfer agent fees paid by each class to FIIOC, including out of pocket expenses, were as follows:
Initial Class | $ 3,361 | |
Service Class | 241 | |
Service Class 2 | 321 | |
Initial Class R | 10,268 | |
Service Class R | 241 | |
Service Class 2R | 321 | |
Investor Class R | 38,893 | |
| $ 53,646 | |
Accounting and Security Lending Fees. Fidelity Service Company, Inc. (FSC), an affiliate of FMR, maintains the Fund's accounting records. The accounting fee is based on the level of average net assets for the month. Under a separate contract, FSC administers the security lending program. The security lending fee is based on the number and duration of lending transactions.
Investments in Fidelity Central Funds. The Fund may invest in Fidelity Central Funds. The Fund's Schedule of Investments lists each of the Fidelity Central Funds as an investment of the Fund but does not include the underlying holdings of each Fidelity Central Fund. As an Investing Fund, the Fund indirectly bears its proportionate share of the expenses of the underlying Fidelity Central Funds. A complete unaudited list of holdings for each Fidelity Central Fund is available upon request . In addition, the financial statements of the Fidelity Central Funds, which are not covered by the Fund's Report of Independent Registered Public Accounting Firm, are available on the EDGAR Database on the SEC's web site, www.sec.gov, or upon request.
The Money Market Central Funds seek preservation of capital and current income and are managed by Fidelity Investments Money Management, Inc. (FIMM), an affiliate of FMR.
VIP International Capital Appreciation Portfolio
4. Fees and Other Transactions with Affiliates - continued
Brokerage Commissions. The Fund placed a portion of its portfolio transactions with brokerage firms which are affiliates of the investment adviser. The commissions paid to these affiliated firms were $313 for the period.
5. Committed Line of Credit.
The Fund participates with other funds managed by FMR in a $4.2 billion credit facility (the "line of credit") to be utilized for temporary or emergency purposes to fund shareholder redemptions or for other short-term liquidity purposes. The Fund has agreed to pay commitment fees on its pro rata portion of the line of credit, which amounted to $83 and is reflected in Miscellaneous Expense on the Statement of Operations. During the period, there were no borrowings on this line of credit.
6. Security Lending.
The Fund lends portfolio securities from time to time in order to earn additional income. On the settlement date of the loan, the Fund receives collateral (in the form of U.S. Treasury obligations, letters of credit and/or cash) against the loaned securities and maintains collateral in an amount not less than 100% of the market value of the loaned securities during the period of the loan. The market value of the loaned securities is determined at the close of business of the Fund and any additional required collateral is delivered to the Fund on the next business day. If the borrower defaults on its obligation to return the securities loaned because of insolvency or other reasons, a fund could experience delays and costs in recovering the securities loaned or in gaining access to the collateral. Any cash collateral received is invested in the Fidelity Securities Lending Cash Central Fund. The value of loaned securities and cash collateral at period end are disclosed on the Fund's Statement of Assets and Liabilities. Security lending income represents the income earned on investing cash collateral, less fees and expenses associated with the loan, plus any premium payments that may be received on the loan of certain types of securities. Security lending income is presented in the Statement of Operations as a component of income from Fidelity Central Funds. Net income from lending portfolio securities during the period amounted to $17,084.
7. Expense Reductions.
FMR voluntarily agreed to reimburse each class to the extent annual operating expenses exceeded certain levels of average net assets as noted in the table below. Some expenses, for example interest expense, including commitment fees, are excluded from this reimbursement.
The following classes were in reimbursement during the period:
| Expense
Limitations | Reimbursement
from adviser |
| | |
Initial Class | 1.10% | $ 22,307 |
Service Class | 1.20% | 1,504 |
Service Class 2 | 1.35% | 2,003 |
Initial Class R | 1.10% | 46,535 |
Service Class R | 1.20% | 1,504 |
Service Class 2R | 1.35% | 2,002 |
Investor Class R | 1.25% | 72,427 |
| | $ 148,282 |
Many of the brokers with whom FMR places trades on behalf of the Fund provided services to the Fund in addition to trade execution. These services included payments of certain expenses on behalf of the Fund totaling $37,292 for the period.
8. Other.
The Fund's organizational documents provide former and current trustees and officers with a limited indemnification against liabilities arising in connection with the performance of their duties to the Fund. In the normal course of business, the Fund may also enter into contracts that provide general indemnifications. The Fund's maximum exposure under these arrangements is unknown as this would be dependent on future claims that may be made against the Fund. The risk of material loss from such claims is considered remote.
At the end of the period, FMR or its affiliates were the owners of record of 98% of the total outstanding shares of the fund.
Annual Report
Notes to Financial Statements - continued
9. Distributions to Shareholders.
Distributions to shareholders of each class were as follows:
| Years ended December 31, |
| 2006 | 2005 A |
From net investment income | | |
Initial Class | $ 9,863 | $ 17,173 |
Service Class | 2,538 | 360 |
Service Class 2 | 2,655 | - |
Initial Class R | 126,136 | 661 |
Service Class R | 2,538 | 360 |
Service Class 2R | 2,655 | - |
Investor Class R | 177,775 | 17,501 |
Total | $ 324,160 | $ 36,055 |
From net realized gain | | |
Initial Class | $ 82,024 | $ 10,447 |
Service Class | 10,116 | 690 |
Service Class 2 | 13,470 | 800 |
Initial Class R | 382,391 | 690 |
Service Class R | 10,116 | 690 |
Service Class 2R | 13,470 | 800 |
Investor Class R | 595,300 | 10,341 |
Total | $ 1,106,887 | $ 24,458 |
A Distributions for Investor Class R are for the period July 21, 2005 (commencement of sale of shares) to December 31, 2005.
10. Share Transactions.
Transactions for each class of shares were as follows:
| Shares | Dollars |
| Years ended December 31, | Years ended December 31, |
| 2006 | 2005 A | 2006 | 2005 A |
Initial Class | | | | |
Shares sold | 551,473 | 921,874 | $ 6,530,542 | $ 9,755,347 |
Reinvestment of distributions | 7,645 | 2,426 | 91,887 | 27,620 |
Shares redeemed | (1,269,330) | (137,070) | (14,879,275) | (1,461,993) |
Net increase (decrease) | (710,212) | 787,230 | $ (8,256,846) | $ 8,320,974 |
Service Class | | | | |
Reinvestment of distributions | 1,019 | 96 | 12,654 | 1,051 |
Net increase (decrease) | 1,019 | 96 | $ 12,654 | $ 1,051 |
Service Class 2 | | | | |
Reinvestment of distributions | 1,300 | 75 | 16,125 | 800 |
Net increase (decrease) | 1,300 | 75 | $ 16,125 | $ 800 |
Initial Class R | | | | |
Shares sold | 1,743,214 | - | $ 20,660,149 | $ - |
Reinvestment of distributions | 40,625 | 122 | 508,527 | 1,351 |
Shares redeemed | (455,998) | - | (5,371,545) | - |
Net increase (decrease) | 1,327,841 | 122 | $ 15,797,131 | $ 1,351 |
Service Class R | | | | |
Reinvestment of distributions | 1,019 | 96 | 12,654 | 1,051 |
Net increase (decrease) | 1,019 | 96 | $ 12,654 | $ 1,051 |
Service Class 2R | | | | |
Reinvestment of distributions | 1,300 | 75 | 16,125 | 800 |
Net increase (decrease) | 1,300 | 75 | $ 16,125 | $ 800 |
Investor Class R | | | | |
Shares sold | 1,447,148 | 854,371 | $ 17,211,509 | $ 9,182,604 |
Reinvestment of distributions | 62,199 | 2,444 | 773,075 | 27,842 |
Shares redeemed | (428,813) | (521) | (5,072,819) | (5,786) |
Net increase (decrease) | 1,080,534 | 856,294 | $ 12,911,765 | $ 9,204,660 |
A Share transactions for Investor Class R are for the period July 21, 2005 (commencement of sale of shares) to December 31, 2005.
VIP International Capital Appreciation Portfolio
Report of Independent Registered Public Accounting Firm
To the Trustees of Variable Insurance Products Fund IV and the Shareholders of VIP International Capital Appreciation Portfolio:
In our opinion, the accompanying statement of assets and liabilities, including the schedule of investments, and the related statements of operations and of changes in net assets and the financial highlights present fairly, in all material respects, the financial position of VIP International Capital Appreciation Portfolio (a fund of Variable Insurance Products Fund IV) at December 31, 2006, the results of its operations for the year then ended, the changes in its net assets for each of the two years in the period then ended and the financial highlights for each of the periods indicated, in conformity with accounting principles generally accepted in the United States of America. These financial statements and financial highlights (hereafter referred to as "financial statements") are the responsibility of the VIP International Capital Appreciation Portfolio's management; our responsibility is to express an opinion on these financial statements based on our audits. We conducted our audits of these financial statements in accordance with the standards of the Public Company Accounting Oversight Board (United States). Those standards require that we plan and perform the audit to obtain reasonable assurance about whether the financial statements are free of material misstatement. An audit includes examining, on a test basis, evidence supporting the amounts and disclosures in the financial statements, assessing the accounting principles used and significant estimates made by management, and evaluating the overall financial statement presentation. We believe that our audits, which included confirmation of securities at December 31, 2006 by correspondence with the custodian and brokers, provide a reasonable basis for our opinion.
/s/ PricewaterhouseCoopers LLP
PricewaterhouseCoopers LLP
Boston, Massachusetts
February 16, 2007
Annual Report
Trustees and Officers
The Trustees, Member of the Advisory Board, and executive officers of the trust and fund, as applicable, are listed below. The Board of Trustees governs the fund and is responsible for protecting the interests of shareholders. The Trustees are experienced executives who meet periodically throughout the year to oversee the fund's activities, review contractual arrangements with companies that provide services to the fund, and review the fund's performance. Each of the Trustees oversees 348 funds advised by FMR or an affiliate.
The Trustees hold office without limit in time except that (a) any Trustee may resign; (b) any Trustee may be removed by written instrument, signed by at least two-thirds of the number of Trustees prior to such removal; (c) any Trustee who requests to be retired or who has become incapacitated by illness or injury may be retired by written instrument signed by a majority of the other Trustees; and (d) any Trustee may be removed at any special meeting of shareholders by a two-thirds vote of the outstanding voting securities of the trust. Each Trustee who is not an interested person (as defined in the 1940 Act) (Independent Trustee), shall retire not later than the last day of the calendar year in which his or her 72nd birthday occurs. The Independent Trustees may waive this mandatory retirement age policy with respect to individual Trustees. The executive officers and Advisory Board Member hold office without limit in time, except that any officer and Advisory Board Member may resign or may be removed by a vote of a majority of the Trustees at any regular meeting or any special meeting of the Trustees. Except as indicated, each individual has held the office shown or other offices in the same company for the past five years.
The fund's Statement of Additional Information (SAI) includes more information about the Trustees. To request a free copy, call Fidelity at 1-877-208-0098.
Interested Trustees*:
Correspondence intended for each Trustee who is an interested person may be sent to Fidelity Investments, 82 Devonshire Street, Boston, Massachusetts 02109.
Name, Age; Principal Occupation |
Edward C. Johnson 3d (76) |
| Year of Election or Appointment: 1983 Mr. Johnson is Chairman of the Board of Trustees. Mr. Johnson serves as President (2006-present), Chief Executive Officer, Chairman, and a Director of FMR Corp.; Chairman and a Director of FMR; Chairman and a Director of Fidelity Research & Analysis Company (FRAC); Chairman and a Director of Fidelity Investments Money Management, Inc.; and Chairman (2001-present) and a Director of FMR Co., Inc. In addition, Mr. Johnson serves as Chairman and Director of Fidelity International Limited (FIL). |
Robert L. Reynolds (54) |
| Year of Election or Appointment: 2003 Mr. Reynolds is President and a Director of FMR (2005-present), Fidelity Investments Money Management, Inc. (2005-present), and FMR Co., Inc. (2005-present). Mr. Reynolds also serves as Vice Chairman (2006-present), a Director (2003-present), and Chief Operating Officer of FMR Corp. and a Director of Strategic Advisers, Inc. (2005-present). He also serves on the Board at Fidelity Investments Canada, Ltd. |
* Trustees have been determined to be "Interested Trustees" by virtue of, among other things, their affiliation with the trust or various entities under common control with FMR.
Independent Trustees:
Correspondence intended for each Independent Trustee (that is, the Trustees other than the Interested Trustees) may be sent to Fidelity Investments, P.O. Box 55235, Boston, Massachusetts 02205-5235.
Name, Age; Principal Occupation |
Dennis J. Dirks (58) |
| Year of Election or Appointment: 2005 Prior to his retirement in May 2003, Mr. Dirks was Chief Operating Officer and a member of the Board of The Depository Trust & Clearing Corporation (DTCC) (1999-2003). He also served as President, Chief Operating Officer, and Board member of The Depository Trust Company (DTC) (1999-2003) and President and Board member of the National Securities Clearing Corporation (NSCC) (1999-2003). In addition, Mr. Dirks served as Chief Executive Officer and Board member of the Government Securities Clearing Corporation (2001-2003) and Chief Executive Officer and Board member of the Mortgage-Backed Securities Clearing Corporation (2001-2003). Mr. Dirks also serves as a Trustee and a member of the Finance Committee of Manhattan College (2005-present) and a Trustee and a member of the Finance Committee of AHRC of Nassau County (2006-present). |
Albert R. Gamper, Jr. (64) |
| Year of Election or Appointment: 2006 Prior to his retirement in December 2004, Mr. Gamper served as Chairman of the Board of CIT Group Inc. (commercial finance). During his tenure with CIT Group Inc. Mr. Gamper served in numerous senior management positions, including Chairman (1987-1989; 1999-2001; 2002-2004), Chief Executive Officer (1987-2004), and President (1989-2002). He currently serves as a member of the Board of Directors of Public Service Enterprise Group (utilities, 2001-present), Chairman of the Board of Governors, Rutgers University (2004-present), and Chairman of the Board of Saint Barnabas Health Care System. |
George H. Heilmeier (70) |
| Year of Election or Appointment: 2004 Dr. Heilmeier is Chairman Emeritus of Telcordia Technologies (communication software and systems), where prior to his retirement, he served as company Chairman and Chief Executive Officer. He currently serves on the Boards of Directors of The Mitre Corporation (systems engineering and information technology support for the government), and HRL Laboratories (private research and development, 2004-present). He is Chairman of the General Motors Science & Technology Advisory Board and a Life Fellow of the Institute of Electrical and Electronics Engineers (IEEE). Dr. Heilmeier is a member of the Defense Science Board and the National Security Agency Advisory Board. He is also a member of the National Academy of Engineering, the American Academy of Arts and Sciences, and the Board of Overseers of the School of Engineering and Applied Science of the University of Pennsylvania. Previously, Dr. Heilmeier served as a Director of TRW Inc. (automotive, space, defense, and information technology, 1992-2002), Compaq (1994-2002), Automatic Data Processing, Inc. (ADP) (technology-based business outsourcing, 1995-2002), INET Technologies Inc. (telecommunications network surveillance, 2001-2004), and Teletech Holdings (customer management services). He is the recipient of the 2005 Kyoto Prize in Advanced Technology for his invention of the liquid crystal display, and a member of the Consumer Electronics Hall of Fame. |
James H. Keyes (66) |
| Year of Election or Appointment: 2007 Prior to his retirement in 2003, Mr. Keyes was Chairman, President, and Chief Executive Officer of Johnson Controls, Inc. (automotive supplier, 1993-2003). He currently serves as a member of the boards of LSI Logic Corporation (semiconductor technologies), Navistar International Corporation (manufacture and sale of trucks, buses, and diesel engines, 2002-present), and Pitney Bowes, Inc. (integrated mail, messaging, and document management solutions). |
Marie L. Knowles (60) |
| Year of Election or Appointment: 2001 Prior to Ms. Knowles' retirement in June 2000, she served as Executive Vice President and Chief Financial Officer of Atlantic Richfield Company (ARCO) (diversified energy, 1996-2000). From 1993 to 1996, she was a Senior Vice President of ARCO and President of ARCO Transportation Company. She served as a Director of ARCO from 1996 to 1998. She currently serves as a Director of Phelps Dodge Corporation (copper mining and manufacturing) and McKesson Corporation (healthcare service, 2002-present). Ms. Knowles is a Trustee of the Brookings Institution and the Catalina Island Conservancy and also serves as a member of the Advisory Board for the School of Engineering of the University of Southern California. |
Ned C. Lautenbach (62) |
| Year of Election or Appointment: 2000 Mr. Lautenbach is Chairman of the Independent Trustees (2006-present). Mr. Lautenbach has been a partner of Clayton, Dubilier & Rice, Inc. (private equity investment firm) since September 1998. Previously, Mr. Lautenbach was with the International Business Machines Corporation (IBM) from 1968 until his retirement in 1998. Mr. Lautenbach serves as a Director of Sony Corporation (2006-present) and Eaton Corporation (diversified industrial) as well as the Philharmonic Center for the Arts in Naples, Florida. He also is a member of the Board of Trustees of Fairfield University (2005-present), as well as a member of the Council on Foreign Relations. |
Cornelia M. Small (62) |
| Year of Election or Appointment: 2005 Ms. Small is a member (2000-present) and Chairperson (2002-present) of the Investment Committee, and a member (2002-
present) of the Board of Trustees of Smith College. Previously, she served as Chief Investment Officer (1999-2000), Director of Global Equity Investments (1996-1999), and a member of the Board of Directors of Scudder, Stevens & Clark (1990-1997) and Scudder Kemper Investments (1997-1999). In addition, Ms. Small served as Co-Chair (2000-2003) of the Annual Fund for the Fletcher School of Law and Diplomacy. |
William S. Stavropoulos (67) |
| Year of Election or Appointment: 2001 Mr. Stavropoulos is Chairman Emeritus of the Board of Directors of The Dow Chemical Company. Since joining The Dow Chemical Company in 1967, Mr. Stavropoulos served in numerous senior management positions, including President (1993-2000; 2002-2003), CEO (1995-2000; 2002-2004), and Chairman of the Executive Committee (2000-2004). Currently, he is a Director of NCR Corporation (data warehousing and technology solutions), BellSouth Corporation (telecommunications), Chemical Financial Corporation, Maersk Inc. (industrial conglomerate, 2002-present), and Metalmark Capital (private equity investment firm, 2005-present). He also serves as a member of the Board of Trustees of the American Enterprise Institute for Public Policy Research. In addition, Mr. Stavropoulos is a member of The Business Council, J.P. Morgan International Council and the University of Notre Dame Advisory Council for the College of Science. |
Kenneth L. Wolfe (67) |
| Year of Election or Appointment: 2005 Prior to his retirement in 2001, Mr. Wolfe was Chairman and Chief Executive Officer of Hershey Foods Corporation (1993-2001). He currently serves as a member of the boards of Adelphia Communications Corporation (2003-present), Bausch & Lomb, Inc., and Revlon Inc. (2004-present). |
Advisory Board Member and Executive Officers:
Correspondence intended for each executive officer and Mr. Lynch may be sent to Fidelity Investments, 82 Devonshire Street, Boston, Massachusetts 02109.
Name, Age; Principal Occupation |
Peter S. Lynch (62) |
| Year of Election or Appointment: 2003 Member of the Advisory Board of Variable Insurance Products Fund IV. Mr. Lynch is Vice Chairman and a Director of FMR, and Vice Chairman (2001-present) and a Director of FMR Co., Inc. Previously, Mr. Lynch served as a Trustee of the Fidelity funds (1990-2003). In addition, he serves as a Trustee of Boston College and as the Chairman of the Inner-City Scholarship Fund. |
Kimberley H. Monasterio (43) |
| Year of Election or Appointment: 2007 President and Treasurer of VIP International Capital Appreciation. Ms. Monasterio also serves as President and Treasurer of other Fidelity funds (2007-present) and is an employee of FMR (2004-present). Previously, Ms. Monasterio served as Deputy Treasurer of the Fidelity funds (2004-2006). Before joining Fidelity Investments, Ms. Monasterio served as Treasurer (2000-2004) and Chief Financial Officer (2002-2004) of the Franklin Templeton Funds and Senior Vice President of Franklin Templeton Services, LLC (2000-2004). |
Dwight D. Churchill (53) |
| Year of Election or Appointment: 2005 Vice President of VIP International Capital Appreciation. Mr. Churchill also serves as Vice President of certain Equity Funds (2005-present). Mr. Churchill is Executive Vice President of FMR (2005-present) and FMR Co., Inc. (2005-present). Previously, Mr. Churchill served as Senior Vice President of Fidelity Investments Money Management, Inc. (2005-2006), Head of Fidelity's Fixed-Income Division (2000-2005), Vice President of Fidelity's Money Market Funds (2000-2005), Vice President of Fidelity's Bond Funds, and Senior Vice President of FMR. |
Eric M. Wetlaufer (44) |
| Year of Election or Appointment: 2006 Vice President of VIP International Capital Appreciation. Mr. Wetlaufer also serves as Vice President of certain International Equity Funds (2006-present). Mr. Wetlaufer is Senior Vice President of FMR (2006-present) and FMR Co., Inc. (2006-present), and President and Director of Fidelity Management & Research (U.K.) Inc. (2006-present) and Fidelity Research & Analysis Company (2006-present). Before joining Fidelity Investments in 2005, Mr. Wetlaufer was a partner in Oxhead Capital Management (2004-2005). Previously, Mr. Wetlaufer served as a Chief Investment Officer of Putnam Investments (1997-2003). |
Darren Maupin (30) |
| Year of Election or Appointment: 2006 Vice President of VIP International Capital Appreciation. Mr. Maupin also serves as Vice President of other funds advised by FMR. Prior to assuming his current responsibilities, Mr. Maupin worked as a research analyst and a portfolio manager. Mr. Maupin also serves as a Vice President of FMR and FMR Co., Inc. (2006). |
Eric D. Roiter (58) |
| Year of Election or Appointment: 2004 Secretary of VIP International Capital Appreciation. He also serves as Secretary of other Fidelity funds; Vice President, General Counsel, and Secretary of FMR Co., Inc. (2001-present) and FMR; Assistant Secretary of Fidelity Management & Research (U.K.) Inc. (2001-present), Fidelity Research & Analysis Company (2001-present), and Fidelity Investments Money Management, Inc. (2001-present). Mr. Roiter is an Adjunct Member, Faculty of Law, at Boston College Law School (2003-present). Previously, Mr. Roiter served as Vice President and Secretary of Fidelity Distributors Corporation (FDC) (1998-2005). |
Stuart Fross (47) |
| Year of Election or Appointment: 2004 Assistant Secretary of VIP International Capital Appreciation. Mr. Fross also serves as Assistant Secretary of other Fidelity funds (2003-present), Vice President and Secretary of FDC (2005-present), and is an employee of FMR. |
R. Stephen Ganis (40) |
| Year of Election or Appointment: 2006 Anti-Money Laundering (AML) officer of VIP International Capital Appreciation. Mr. Ganis also serves as AML officer of other Fidelity funds (2006-present) and FMR Corp. (2003-present). Before joining Fidelity Investments, Mr. Ganis practiced law at Goodwin Procter, LLP (2000-2002). |
Joseph B. Hollis (58) |
| Year of Election or Appointment: 2006 Chief Financial Officer of VIP International Capital Appreciation. Mr. Hollis also serves as Chief Financial Officer of other Fidelity funds. Mr. Hollis is President of Fidelity Pricing and Cash Management Services (FPCMS) (2005-present). Mr. Hollis also serves as President and Director of Fidelity Service Company, Inc. (2006-present). Previously, Mr. Hollis served as Senior Vice President of Cash Management Services (1999-2002) and Investment Management Operations (2002-2005). |
Kenneth A. Rathgeber (59) |
| Year of Election or Appointment: 2004 Chief Compliance Officer of VIP International Capital Appreciation. Mr. Rathgeber also serves as Chief Compliance Officer of other Fidelity funds (2004-present) and Executive Vice President of Risk Oversight for Fidelity Investments (2002-present). He is Chief Compliance Officer of FMR (2005-present), FMR Co., Inc. (2005-present), Fidelity Management & Research (U.K.) Inc. (2005-present), Fidelity Research & Analysis Company (2005-present), Fidelity Investments Money Management, Inc. (2005-
present), and Strategic Advisers, Inc. (2005-present). Previously, Mr. Rathgeber served as Executive Vice President and Chief Operating Officer for Fidelity Investments Institutional Services Company, Inc. (1998-2002). |
Bryan A. Mehrmann (45) |
| Year of Election or Appointment: 2005 Deputy Treasurer of VIP International Capital Appreciation. Mr. Mehrmann also serves as Deputy Treasurer of other Fidelity funds (2005-present) and is an employee of FMR. Previously, Mr. Mehrmann served as Vice President of Fidelity Investments Institutional Services Group (FIIS)/Fidelity Investments Institutional Operations Corporation, Inc. (FIIOC) Client Services (1998-2004). |
Kenneth B. Robins (37) |
| Year of Election or Appointment: 2005 Deputy Treasurer of VIP International Capital Appreciation. Mr. Robins also serves as Deputy Treasurer of other Fidelity funds (2005-present) and is an employee of FMR (2004-present). Before joining Fidelity Investments, Mr. Robins worked at KPMG LLP, where he was a partner in KPMG's department of professional practice (2002-2004) and a Senior Manager (1999-2000). In addition, Mr. Robins served as Assistant Chief Accountant, United States Securities and Exchange Commission (2000-2002). |
Robert G. Byrnes (40) |
| Year of Election or Appointment: 2005 Assistant Treasurer of VIP International Capital Appreciation. Mr. Byrnes also serves as Assistant Treasurer of other Fidelity funds (2005-present) and is an employee of FMR (2005-present). Previously, Mr. Byrnes served as Vice President of FPCMS (2003-2005). Before joining Fidelity Investments, Mr. Byrnes worked at Deutsche Asset Management where he served as Vice President of the Investment Operations Group (2000-2003). |
John H. Costello (60) |
| Year of Election or Appointment: 2004 Assistant Treasurer of VIP International Capital Appreciation. Mr. Costello also serves as Assistant Treasurer of other Fidelity funds and is an employee of FMR. |
Peter L. Lydecker (52) |
| Year of Election or Appointment: 2004 Assistant Treasurer of VIP International Capital Appreciation. Mr. Lydecker also serves as Assistant Treasurer of other Fidelity funds (2004) and is an employee of FMR. |
Mark Osterheld (51) |
| Year of Election or Appointment: 2004 Assistant Treasurer of VIP International Capital Appreciation. Mr. Osterheld also serves as Assistant Treasurer of other Fidelity funds (2002) and is an employee of FMR. |
Gary W. Ryan (48) |
| Year of Election or Appointment: 2005 Assistant Treasurer of VIP International Capital Appreciation. Mr. Ryan also serves as Assistant Treasurer of other Fidelity funds (2005-present) and is an employee of FMR (2005-present). Previously, Mr. Ryan served as Vice President of Fund Reporting in FPCMS (1999-2005). |
Salvatore Schiavone (41) |
| Year of Election or Appointment: 2005 Assistant Treasurer of VIP International Capital Appreciation. Mr. Schiavone also serves as Assistant Treasurer of other Fidelity funds (2005-present) and is an employee of FMR (2005-present). Before joining Fidelity Investments, Mr. Schiavone worked at Deutsche Asset Management, where he most recently served as Assistant Treasurer (2003-2005) of the Scudder Funds and Vice President and Head of Fund Reporting (1996-2003). |
VIP International Capital Appreciation Portfolio
Distributions
The Board of Trustees of VIP International Capital Appreciation Portfolio voted to pay to shareholders of record at the opening of business on record date, the following distributions per share derived from capital gains realized from sales of portfolio securities:
| Pay Date | Record Date | Capital Gains |
Initial Class | 02/09/07 | 02/09/07 | $0.125 |
Service Class | 02/09/07 | 02/09/07 | $0.125 |
Service Class 2 | 02/09/07 | 02/09/07 | $0.125 |
The fund hereby designates as a capital gain dividend with respect to the taxable year ended December 31, 2006 $698,819, or, if subsequently determined to be different, the net capital gain of such year.
The amounts per share which represent income derived from sources within, and taxes paid to, foreign countries or possessions of the United States are as follows:
| Pay Date | Income | Taxes |
Initial Class | 12/22/06 | $0.185 | $0.028 |
Service Class | 12/22/06 | $0.176 | $0.028 |
Service Class 2 | 12/22/06 | $0.161 | $0.028 |
The fund will notify shareholders in January 2007 of amounts for use in preparing 2006 income tax returns.
Annual Report
Proxy Voting Results
A special meeting of the fund's shareholders was held on September 20, 2006. The results of votes taken among shareholders on the proposal before them are reported below. Each vote reported represents one dollar of net asset value held on the record date for the meeting.
PROPOSAL 1 |
To elect a Board of Trustees. A |
| # of
Votes | % of
Votes |
Dennis J. Dirks |
Affirmative | 92,459,317.52 | 96.102 |
Withheld | 3,749,837.05 | 3.898 |
TOTAL | 96,209,154.57 | 100.00 |
Albert R. Gamper, Jr. |
Affirmative | 92,260,598.99 | 95.896 |
Withheld | 3,948,555.58 | 4.104 |
TOTAL | 96,209,154.57 | 100.000 |
Robert M. Gates |
Affirmative | 92,315,480.72 | 95.953 |
Withheld | 3,893,673.85 | 4.047 |
TOTAL | 96,209,154.57 | 100.000 |
George H. Heilmeier |
Affirmative | 92,208,255.41 | 95.841 |
Withheld | 4,000,899.16 | 4.159 |
TOTAL | 96,209,154.57 | 100.000 |
Edward C. Johnson 3d |
Affirmative | 91,928,267.76 | 95.550 |
Withheld | 4,280,886.81 | 4.450 |
TOTAL | 96,209,154.57 | 100.000 |
Stephen P. Jonas |
Affirmative | 92,457,628.76 | 96.101 |
Withheld | 3,751,525.81 | 3.899 |
TOTAL | 96,209,154.57 | 100.000 |
James H. KeyesB |
Affirmative | 92,432,729.82 | 96.075 |
Withheld | 3,776,424.75 | 3.925 |
TOTAL | 96,209,154.57 | 100.000 |
Marie L. Knowles |
Affirmative | 92,398,847.52 | 96.040 |
Withheld | 3,810,307.05 | 3.960 |
TOTAL | 96,209,154.57 | 100.000 |
| # of
Votes | % of
Votes |
Ned C. Lautenbach |
Affirmative | 92,423,184.47 | 96.065 |
Withheld | 3,785,970.10 | 3.935 |
TOTAL | 96,209,154.57 | 100.000 |
William O. McCoy |
Affirmative | 92,086,293.90 | 95.715 |
Withheld | 4,122,860.67 | 4.285 |
TOTAL | 96,209,154.57 | 100.000 |
Robert L. Reynolds |
Affirmative | 92,439,032.86 | 96.081 |
Withheld | 3,770,121.71 | 3.919 |
TOTAL | 96,209,154.57 | 100.000 |
Cornelia M. Small |
Affirmative | 92,415,567.29 | 96.057 |
Withheld | 3,793,587.28 | 3.943 |
TOTAL | 96,209,154.57 | 100.000 |
William S. Stavropoulos |
Affirmative | 92,135,400.08 | 95.766 |
Withheld | 4,073,754.49 | 4.234 |
TOTAL | 96,209,154.57 | 100.000 |
Kenneth L. Wolfe |
Affirmative | 92,445,865.31 | 96.088 |
Withheld | 3,763,289.26 | 3.912 |
TOTAL | 96,209,154.57 | 100.000 |
A Denotes trust-wide proposal and voting results. B Effective on or about January 1, 2007. |
VIP International Capital Appreciation Portfolio
Board Approval of Investment Advisory Contracts and Management Fees
VIP International Capital Appreciation Portfolio
Each year, typically in July, the Board of Trustees, including the Independent Trustees (together, the Board), votes on the renewal of the management contract and sub-advisory agreements (together, the Advisory Contracts) for the fund. The Board, assisted by the advice of fund counsel and Independent Trustees' counsel, requests and considers a broad range of information throughout the year.
The Board meets regularly each month except August and takes into account throughout the year matters bearing on Advisory Contracts. The Board, acting directly and through its separate committees, considers at each of its meetings factors that are relevant to the annual renewal of the fund's Advisory Contracts, including the services and support provided to the fund and its shareholders. At the time of the renewal, the Board had 12 standing committees, each composed of Independent Trustees with varying backgrounds, to which the Board has assigned specific subject matter responsibilities in order to enhance effective decision-making by the Board. Each committee has adopted a written charter outlining the structure and purposes of the committee. One such committee, the Equity Contract Committee, meets periodically as needed throughout the year to consider matters specifically related to the annual renewal of Advisory Contracts. The committee requests and receives information on, and makes recommendations to the Independent Trustees concerning, the approval and annual review of the Advisory Contracts.
At its July 2006 meeting, the Board of Trustees, including the Independent Trustees, unanimously determined to renew the Advisory Contracts for the fund. In reaching its determination, the Board considered all factors it believed relevant, including (i) the nature, extent, and quality of the services to be provided to the fund and its shareholders (including the investment performance of the fund); (ii) the competitiveness of the management fee and total expenses of the fund; (iii) the total costs of the services to be provided by and the profits to be realized by the investment adviser and its affiliates from the relationship with the fund; (iv) the extent to which economies of scale would be realized as the fund grows; and (v) whether fee levels reflect these economies of scale, if any, for the benefit of fund shareholders.
In determining whether to renew the Advisory Contracts for the fund, the Board ultimately reached a determination, with the assistance of fund counsel and Independent Trustees' counsel, that the renewal of the Advisory Contracts and the compensation to be received by Fidelity under the management contract is consistent with Fidelity's fiduciary duty under applicable law. In addition to evaluating the specific factors noted above, the Board, in reaching its determination, is aware that shareholders in the fund have a broad range of investment choices available to them, including a wide choice among mutual funds offered by competitors to Fidelity, and that the fund's shareholders, with the opportunity to review and weigh the disclosure provided by the fund in its prospectus and other public disclosures, have chosen to invest in this fund, managed by Fidelity.
Nature, Extent, and Quality of Services Provided. The Board considered staffing within the investment adviser, FMR, and the sub-advisers (together, the Investment Advisers), including the backgrounds of the fund's portfolio managers and the fund's investment objective and discipline. The Independent Trustees also had discussions with senior management of Fidelity's investment operations and investment groups. The Board considered the structure of the portfolio manager compensation program and whether this structure provides appropriate incentives.
Resources Dedicated to Investment Management and Support Services. The Board reviewed the size, education, and experience of the Investment Advisers' investment staff, their use of technology, and the Investment Advisers' approach to recruiting, training, and retaining portfolio managers and other research, advisory, and management personnel. The Board considered Fidelity's extensive global research capabilities that enable the Investment Advisers to aggregate data from various sources in an effort to produce positive investment results. The Board noted that Fidelity's analysts have access to a variety of technological tools that enable them to perform both fundamental and quantitative analysis and to specialize in various disciplines. The Board also considered that Fidelity's portfolio managers and analysts have access to daily portfolio attribution that allows for monitoring of a fund's portfolio, as well as an electronic communication system that provides immediate real-time access to research concerning issuers and credit enhancers.
Shareholder and Administrative Services. The Board considered (i) the nature, extent, quality, and cost of administrative, distribution, and shareholder services performed by the Investment Advisers and their affiliates under the Advisory Contracts and under separate agreements covering transfer agency, pricing and bookkeeping, and securities lending services for the fund; (ii) the nature and extent of the Investment Advisers' supervision of third party service providers, principally custodians and subcustodians; and (iii) the resources devoted to, and the record of compliance with, the fund's compliance policies and procedures. The Board reviewed the allocation of fund brokerage, including allocations to brokers affiliated with the Investment Advisers, the use of brokerage commissions to pay fund expenses, and the use of "soft" commission dollars to pay for research services. The Board also considered that Fidelity voluntarily pays for market data out of its own resources.
The Board noted that the growth of fund assets across the complex allows Fidelity to reinvest in the development of services designed to enhance the value or convenience of the Fidelity funds as investment vehicles. These services include 24-hour access to account information and market information through phone representatives and over the Internet, and investor education materials and asset allocation tools.
Investment in a Large Fund Family. The Board considered the benefits to shareholders of investing in a Fidelity fund, including the benefits of investing in a fund that is part of a large family of funds offering a variety of investment disciplines and providing for a large variety of mutual fund investor services. The Board noted that, since the last Advisory Contract renewals in July 2005, Fidelity has taken a number of actions that benefited particular funds, including (i) dedicating additional resources to investment research and to restructure the investment research teams; (ii) voluntarily entering into contractual arrangements with certain brokers pursuant to which Fidelity pays for research products and services separately out of its own resources, rather than bundling with fund commissions; (iii) launching the Fidelity Advantage Class of its five Spartan stock index funds and three Spartan bond index funds, which is a lower-fee class available to shareholders with higher account balances; (iv) contractually agreeing to impose expense limitations on Fidelity U.S. Bond Index Fund and reducing the fund's initial investment minimum; and (v) offering shareholders of each of the Fidelity Institutional Money Market Funds the privilege of exchanging shares of the fund for shares of other Fidelity funds.
Annual Report
Board Approval of Investment Advisory Contracts and Management Fees - continued
Investment Performance and Compliance. The Board considered whether the fund has operated within its investment objective, as well as its record of compliance with its investment restrictions. It also reviewed the fund's absolute investment performance for each class (except Investor Class R), as well as the fund's relative investment performance for each class (except Investor Class R) measured against (i) a broad-based securities market index, and (ii) a peer group of mutual funds deemed appropriate by the Board. Because the fund had been in existence less than three calendar years, the following chart considered by the Board shows, for the one-year period ended December 31, 2005, the total returns of Service Class 2 and Initial Class of the fund, the total returns of a broad-based securities market index ("benchmark"), and a range of total returns of a peer group of mutual funds identified by Lipper Inc. as having an investment objective similar to that of the fund. The returns of Service Class 2 and Initial Class represent the performance of classes with the highest and lowest 12b-1 fees, respectively (not necessarily with the highest and lowest total expenses). (Investor Class R of the fund, which has no 12b-1 fee, had less than one year of performance as of December 31, 2005.) The box within the chart shows the 25th percentile return (bottom of box) and the 75th percentile return (top of box) of the Lipper peer group. Returns shown above the box are in the first quartile and returns shown below the box are in the fourth quartile. The percentage beaten numbers noted below the chart correspond to the percentile box and represent the percentage of funds in the Lipper peer group whose performance was equal to or lower than that of the class indicated.
VIP International Capital Appreciation Portfolio
The Board reviewed the fund's relative investment performance against its Lipper peer group and stated that the performance of Initial Class of the fund was in the third quartile for the period shown. The Board also stated that the relative investment performance of the fund was lower than its benchmark for the period shown. The Board considered that the variations in performance among the fund's classes reflect the variations in class expenses, which result in lower performance for higher expense classes. The Board stated that it is difficult to evaluate in any comprehensive fashion the performance of the fund, in light of its relatively recent launch. The Board also reviewed the fund's relative investment performance against a customized peer group based on a combination of categories defined by Morningstar.
The Board considered that FMR has taken steps to refocus and strengthen equity research, equity portfolio management, and compliance. The Board noted with favor FMR's reorganization of its senior management team in 2005 and FMR's dedication of additional resources to investment research, and participated in the process that led to those changes.
Based on its review, and giving particular weight to the nature and quality of the resources dedicated by the Investment Advisers to maintain and improve relative performance, the Board concluded that the nature, extent, and quality of the services provided to the fund will benefit the fund's shareholders, particularly in light of the Board's view that the fund's shareholders benefit from investing in a fund that is part of a large family of funds offering a variety of investment disciplines and services.
Competitiveness of Management Fee and Total Fund Expenses. The Board considered the fund's management fee and total expenses compared to "mapped groups" of competitive funds and classes. Fidelity creates "mapped groups" by combining similar Lipper investment objective categories that have comparable management fee characteristics. Combining Lipper investment objective categories aids the Board's management fee and total expense comparisons by broadening the competitive group used for comparison and by reducing the number of universes to which various Fidelity funds are compared.
VIP International Capital Appreciation Portfolio
The Board considered two proprietary management fee comparisons for the 12-month (or shorter) periods shown in the chart below. The group of Lipper funds used by the Board for management fee comparisons is referred to below as the "Total Mapped Group" and, for the reasons explained above, is broader than the Lipper peer group used by the Board for performance comparisons. The Total Mapped Group comparison focuses on a fund's standing relative to the total universe of comparable funds available to investors, in terms of gross management fees before expense reimbursements or caps. "TMG %" represents the percentage of funds in the Total Mapped Group that had management fees that were lower than the fund's. For example, a TMG % of 12% means that 88% of the funds in the Total Mapped Group had higher management fees than the fund. The "Asset-Size Peer Group" (ASPG) comparison focuses on a fund's standing relative to non-Fidelity funds similar in size to the fund within the Total Mapped Group. The ASPG represents at least 15% of the funds in the Total Mapped Group with comparable asset size and management fee characteristics, subject to a minimum of 50 funds (or all funds in the Total Mapped Group if fewer than 50). Additional information, such as the ASPG quartile in which the fund's management fee ranked, is also included in the chart and considered by the Board.
VIP International Capital Appreciation Portfolio
The Board noted that the fund's management fee ranked below the median of its Total Mapped Group and below the median of its ASPG for 2005.
Based on its review, the Board concluded that the fund's management fee was fair and reasonable in light of the services that the fund receives and the other factors considered.
In its review of each class's total expenses, the Board considered the fund's management fee as well as other fund or class expenses, as applicable, such as transfer agent fees, pricing and bookkeeping fees, fund-paid 12b-1 fees, and custodial, legal, and audit fees. The Board also noted the effects of any waivers and reimbursements on fees and expenses. As part of its review, the Board also considered current and historical total expenses of each class of the fund compared to competitive fund median expenses. Each class of the fund is compared to those funds and classes in the Total Mapped Group (used by the Board for management fee comparisons) that have a similar sales load structure.
The Board noted that the total expenses of each of Initial Class and Initial Class R ranked below its competitive median for 2005, and the total expenses of each of Investor Class R, Service Class, Service Class 2, Service Class R and Service Class 2 R ranked above its competitive median for 2005. The Board noted that the fund offers multiple classes, each of which has a different 12b-1 fee structure, and that the multiple structures are intended to offer a range of pricing options for the intermediary market. The Board also noted that the total expenses of the classes vary primarily by the level of their 12b-1 fees, although differences in transfer agent fees may also cause expenses to vary from class to class. The Board considered that Investor Class R was above median primarily due to its higher transfer agent fee.
In its review of total expenses, the Board also considered Fidelity fee structures and other information on clients that FMR and its affiliates service in other competitive markets, such as other mutual funds advised or subadvised by FMR or its affiliates, pension plan clients, and other institutional clients.
Annual Report
Board Approval of Investment Advisory Contracts and Management Fees - continued
Based on its review, the Board concluded that the total expenses of each class of the fund were reasonable, although in some cases above the median of the universe presented for comparison, in light of the services that the fund and its shareholders receive and the other factors considered.
Costs of the Services and Profitability. The Board considered the revenues earned and the expenses incurred by Fidelity in conducting the business of developing, marketing, distributing, managing, administering and servicing the fund and its shareholders. The Board also considered the level of Fidelity's profits in respect of all the Fidelity funds.
On an annual basis, FMR presents to the Board Fidelity's profitability for the fund. Fidelity calculates the profitability for each fund, as well as aggregate profitability for groups of Fidelity funds and all Fidelity funds, using a series of detailed revenue and cost allocation methodologies which originate with the audited books and records of Fidelity. The Audit Committee of the Board reviews any significant changes from the prior year's methodologies.
PricewaterhouseCoopers LLP (PwC), independent registered accounting firm and auditor to Fidelity and certain Fidelity funds, has been engaged annually by the Board as part of the Board's assessment of the results of Fidelity's profitability analysis. PwC's engagement includes the review and assessment of Fidelity's methodologies used in determining the revenues and expenses attributable to Fidelity's mutual fund business, and completion of agreed-upon procedures surrounding the mathematical accuracy of fund profitability and its conformity to allocation methodologies. After considering PwC's reports issued under the engagement and information provided by Fidelity, the Board believes that while other allocation methods may also be reasonable, Fidelity's profitability methodologies are reasonable in all material respects.
The Board has also reviewed Fidelity's non-fund businesses and any fall-out benefits related to the mutual fund business as well as cases where Fidelity's affiliates may benefit from or be related to the fund's business.
The Board considered the costs of the services provided by and the profits realized by Fidelity in connection with the operation of the fund and determined that the amount of profit is a fair entrepreneurial profit for the management of the fund.
Economies of Scale. The Board considered whether there have been economies of scale in respect of the management of the Fidelity funds, whether the Fidelity funds (including the fund) have appropriately benefited from any such economies of scale, and whether there is potential for realization of any further economies of scale. The Board considered the extent to which the fund will benefit from economies of scale through increased services to the fund, through waivers or reimbursements, or through fee or expense reductions.
The Board recognized that the fund's management contract incorporates a "group fee" structure, which provides for lower fee rates as total fund assets under FMR's management increase, and for higher fee rates as total fund assets under FMR's management decrease. The Board considered that the group fee is designed to deliver the benefits of economies of scale to fund shareholders when total fund assets increase, even if assets of any particular fund are unchanged or have declined, because some portion of Fidelity's costs are attributable to services provided to all Fidelity funds, and all funds benefit if those costs can be allocated among more assets. The Board concluded that, given the group fee structure, fund shareholders will achieve a certain level of economies of scale as assets under FMR's management increase at the fund complex level, regardless of whether Fidelity achieves any such economies of scale.
The Board further concluded that any potential economies of scale are being shared between fund shareholders and Fidelity in an appropriate manner.
Additional Information Requested by the Board. In order to develop fully the factual basis for consideration of the Advisory Contracts, the Board requested additional information on several topics, including (i) Fidelity's fund profitability methodology and profitability trends within certain funds; (ii) portfolio manager compensation; (iii) the extent to which any economies of scale exist and are shared between the funds and Fidelity; (iv) the total expenses of certain funds and classes relative to competitors, including the extent to which the expenses of certain funds have been or could be capped; (v) fund performance trends; and (vi) Fidelity's fee structures, including use of performance fees.
Based on its evaluation of all of the conclusions noted above, and after considering all material factors, the Board ultimately concluded that the advisory fee structures are fair and reasonable, and that the fund's Advisory Contracts should be renewed.
VIP International Capital Appreciation Portfolio
Annual Report
VIP International Capital Appreciation Portfolio
Annual Report
Investment Adviser
Fidelity Management & Research Company
Boston, MA
Investment Sub-Advisers
FMR Co., Inc.
Fidelity Management & Research (U.K.) Inc.
Fidelity Research & Analysis Company
(formerly Fidelity Management & Research (Far East) Inc.)
Fidelity International Investment Advisors
Fidelity International Investment Advisors (U.K.) Limited
Fidelity Investments Japan Limited
General Distributor
Fidelity Distributors Corporation
Boston, MA
Transfer and Shareholder Servicing Agents
Fidelity Investments Institutional Operations Company, Inc.
Boston, MA
Fidelity Service Company, Inc.
Boston, MA
Custodian
Brown Brothers Harriman & Co.
Boston, MA
VIPCAP-ANN-0207
1.811843.102
Fidelity® Variable Insurance Products:
International Capital Appreciation Portfolio - Class R
Annual Report
December 31, 2006
(2_fidelity_logos) (Registered_Trademark)
Contents
Performance | <Click Here> | How the fund has done over time. |
Management's Discussion | <Click Here> | The manager's review of fund performance, strategy and outlook. |
Shareholder Expense Example | <Click Here> | An example of shareholder expenses. |
Investment Changes | <Click Here> | A summary of major shifts in the fund's investments over
the past six months. |
Investments | <Click Here> | A complete list of the fund's investments with their
market values. |
Financial Statements | <Click Here> | Statements of assets and liabilities, operations, and
changes in net assets, as well as financial highlights. |
Notes | <Click Here> | Notes to the financial statements. |
Report of Independent Registered Public Accounting Firm | <Click Here> | |
Trustees and Officers | <Click Here> | |
Distributions | <Click Here> | |
Proxy Voting Results | <Click Here> | |
Board Approval of Investment Advisory Contracts and Management Fees | <Click Here> | |
| | |
To view a fund's proxy voting guidelines and proxy voting record for the 12-month period ended June 30, visit www.fidelity.com/proxyvotingresults or visit the Securities and Exchange Commission's (SEC) web site at www.sec.gov. You may also call 1-877-208-0098 to request a free copy of the proxy voting guidelines.
Fidelity Variable Insurance Products are separate account options which are purchased through a variable insurance contract.
Standard & Poor's, S&P and S&P 500 are registered service marks of The McGraw-Hill Companies, Inc. and have been licensed for use by Fidelity Distributors Corporation.
Other third party marks appearing herein are the property of their respective owners.
All other marks appearing herein are registered or unregistered trademarks or service marks of FMR Corp. or an affiliated company.
This report and the financial statements contained herein are submitted for the general information of the shareholders of the fund. This report is not authorized for distribution to prospective investors in the fund unless preceded or accompanied by an effective prospectus.
A fund files its complete schedule of portfolio holdings with the SEC for the first and third quarters of each fiscal year on Form N-Q. Forms N-Q are available on the SEC's web site at http://www.sec.gov. A fund's Forms N-Q may be reviewed and copied at the SEC's Public Reference Room in Washington, DC. Information regarding the operation of the SEC's Public Reference Room may be obtained by calling 1-800-SEC-0330. For a complete list of a fund's portfolio holdings, view the most recent quarterly holdings report, semiannual report, or annual report on Fidelity's web site at http://www.advisor.fidelity.com.
NOT FDIC INSURED · MAY LOSE VALUE · NO BANK GUARANTEE
Neither the fund nor Fidelity Distributors Corporation is a bank.
VIP International Capital Appreciation Portfolio
VIP International Capital Appreciation Portfolio
Performance: The Bottom Line
Average annual total return reflects the change in the value of an investment, assuming reinvestment of a class' dividend income and capital gains (the profits earned upon the sale of securities that have grown in value) and assuming a constant rate of performance each year. During periods of reimbursement by Fidelity, a fund's total return will be greater than it would be had the reimbursement not occurred. Performance numbers are net of all underlying fund operating expenses, but do not include any insurance charges imposed by your insurance company's separate account. If performance information included the effect of these additional charges, the total returns would be lower. How a fund did yesterday is no guarantee of how it will do tomorrow.
Average Annual Total Returns
Periods ended December 31, 2006 | Past 1 Year | Life of
FundA |
VIP International Capital Appreciation - Initial Class | 14.49% | 14.58% |
VIP International Capital Appreciation - Service Class | 14.30% | 14.44% |
VIP International Capital Appreciation - Service Class 2 | 14.14% | 14.29% |
VIP International Capital Appreciation - Initial Class R | 14.50% | 14.59% |
VIP International Capital Appreciation - Service Class R | 14.30% | 14.44% |
VIP International Capital Appreciation - Service Class 2R | 14.14% | 14.29% |
VIP International Capital Appreciation - Investor Class R B | 14.23% | 14.45% |
A From December 22, 2004.
B The initial offering of Investor Class R shares took place on July 21, 2005. Returns prior to July 21, 2005 are those of Initial Class R. If Investor Class R's transfer agent fee had been reflected, returns prior to July 21, 2005 would have been lower.
$10,000 Over Life of Fund
Let's say hypothetically that $10,000 was invested in VIP International Capital Appreciation Portfolio - Initial Class R on December 22, 2004, when the fund started. The chart shows how the value of your investment would have changed, and also shows how the Morgan Stanley Capital InternationalSM All Country World (MSCI ACWI) ex USA Index performed over the same period.

Annual Report
VIP International Capital Appreciation Portfolio
Management's Discussion of Fund Performance
Comments from Darren Maupin, who became Portfolio Manager of VIP International Capital Appreciation Fund on October 2, 2006
International equity markets as a whole outpaced their U.S. counterparts for the 12 months ending December 31, 2006 - partly as a result of favorable currency exchanges that boosted returns for U.S. investors in foreign stocks. The Morgan Stanley Capital InternationalSM Europe, Australasia, Far East (MSCI® EAFE®) Index - a gauge of developed stock markets outside the United States and Canada - gained 26.53% during that time. This marked the fifth year in a row that the MSCI EAFE outperformed the Standard & Poor's 500SM Index, a popular barometer of the U.S. equity market, which returned 15.79% in 2006. The European component of the MSCI EAFE, representing two-thirds of the index on average during the period, was up roughly 34%, riding the tail winds of strong profit growth and booming merger-and-acquisition activity. Japan, on the other hand, accounting for roughly one-fourth of the index, was up only modestly, struggling with a weak yen and slowing consumer spending.
For the year ending December 31, 2006, the fund trailed the Morgan Stanley Capital InternationalSM All Country World ex USA Index (MSCI ACWI), which rose 26.83%. (For specific portfolio performance results, please refer to the performance section of this report.) This shortfall came mostly from unfavorable stock selection. Inopportune picks in the financials sector hurt the most, followed by weak selection in energy, industrials and materials. Regionally, the fund's weakest picks were in the United States, Japan, Europe, and several of the emerging markets. The biggest individual detractors included Japanese brokerage firm Nikko Cordial, Japanese materials company Nitto Denko and U.S.-listed cable operator NTL, which is a British firm. With the exception of NTL, none of these detractors was held in the portfolio at period end. The fund's cash position increased to about 9% by period end - much of this coming as I repositioned the fund - and that uninvested cash cost the fund some performance as well. Conversely, favorable market selection in information technology and energy, plus good stock selection in the software/services group, helped. Beneficial holdings included Italian manufacturing conglomerate Fiat and French energy services firm Geophysique. Favorable currency movements caused by a weakening U.S. dollar contributed to the fund's absolute return.
The views expressed above reflect those of the portfolio manager(s) only through the end of the period as stated on the cover of this report and do not necessarily represent the views of Fidelity or any other person in the Fidelity organization. Any such views are subject to change at any time based upon market or other conditions and Fidelity disclaims any responsibility to update such views. These views may not be relied on as investment advice and, because investment decisions for a Fidelity fund are based on numerous factors, may not be relied on as an indication of trading intent on behalf of any Fidelity fund.
VIP International Capital Appreciation Portfolio
VIP International Capital Appreciation Portfolio
Shareholder Expense Example
As a shareholder of the Fund, you incur two types of costs: (1) transaction costs, including redemption fees, and (2) ongoing costs, including management fees, distribution and/or service (12b-1) fees and other Fund expenses. This Example is intended to help you understand your ongoing costs (in dollars) of investing in the Fund and to compare these costs with the ongoing costs of investing in other mutual funds.
The Example is based on an investment of $1,000 invested at the beginning of the period and held for the entire period (July 1, 2006 to December 31, 2006).
Actual Expenses
The first line of the accompanying table for each class of the Fund provides information about actual account values and actual expenses. You may use the information in this line, together with the amount you invested, to estimate the expenses that you paid over the period. Simply divide your account value by $1,000.00 (for example, an $8,600 account value divided by $1,000.00 = 8.6), then multiply the result by the number in the first line for a class of the Fund under the heading entitled "Expenses Paid During Period" to estimate the expenses you paid on your account during this period. The estimate of expenses does not include any fees or other expenses of any variable annuity or variable life insurance product. If they were, the estimate of expenses you paid during the period would be higher, and your ending account value would be lower.
Hypothetical Example for Comparison Purposes
The second line of the accompanying table for each class of the Fund provides information about hypothetical account values and hypothetical expenses based on a Class' actual expense ratio and an assumed rate of return of 5% per year before expenses, which is not the Class' actual return. The hypothetical account values and expenses may not be used to estimate the actual ending account balance or expenses you paid for the period. You may use this information to compare the ongoing costs of investing in the Fund and other funds. To do so, compare this 5% hypothetical example with the 5% hypothetical examples that appear in the shareholder reports of the other funds. The estimate of expenses does not include any fees or other expenses of any variable annuity or variable life insurance product. If they were, the estimate of expenses you paid during the period would be higher, and your ending account value would be lower.
Please note that the expenses shown in the table are meant to highlight your ongoing costs only and do not reflect any transaction costs. Therefore, the second line of the table is useful in comparing ongoing costs only, and will not help you determine the relative total costs of owning different funds. In addition, if these transactional costs were included, your costs would have been higher.
| Beginning
Account Value
July 1, 2006 | Ending
Account Value
December 31, 2006 | Expenses Paid
During Period*
July 1, 2006 to
December 31, 2006 |
Initial Class | | | |
Actual | $ 1,000.00 | $ 1,125.70 | $ 5.89 |
Hypothetical A | $ 1,000.00 | $ 1,019.66 | $ 5.60 |
Service Class | | | |
Actual | $ 1,000.00 | $ 1,123.90 | $ 6.42 |
Hypothetical A | $ 1,000.00 | $ 1,019.16 | $ 6.11 |
Service Class 2 | | | |
Actual | $ 1,000.00 | $ 1,124.30 | $ 7.23 |
Hypothetical A | $ 1,000.00 | $ 1,018.40 | $ 6.87 |
Initial Class R | | | |
Actual | $ 1,000.00 | $ 1,124.90 | $ 5.89 |
Hypothetical A | $ 1,000.00 | $ 1,019.66 | $ 5.60 |
Service Class R | | | |
Actual | $ 1,000.00 | $ 1,123.90 | $ 6.42 |
Hypothetical A | $ 1,000.00 | $ 1,019.16 | $ 6.11 |
Service Class 2R | | | |
Actual | $ 1,000.00 | $ 1,124.30 | $ 7.23 |
Hypothetical A | $ 1,000.00 | $ 1,018.40 | $ 6.87 |
Investor Class R | | | |
Actual | $ 1,000.00 | $ 1,124.10 | $ 6.69 |
Hypothetical A | $ 1,000.00 | $ 1,018.90 | $ 6.36 |
A 5% return per year before expenses
* Expenses are equal to each Class' annualized expense ratio (shown in the table below); multiplied by the average account value over the period, multiplied by 184/365 (to reflect the one-half year period).
Annual Report
VIP International Capital Appreciation Portfolio
Shareholder Expense Example - continued
| Annualized
Expense Ratio |
Initial Class | 1.10% |
Service Class | 1.20% |
Service Class 2 | 1.35% |
Initial Class R | 1.10% |
Service Class R | 1.20% |
Service Class 2R | 1.35% |
Investor Class R | 1.25% |
VIP International Capital Appreciation Portfolio
VIP International Capital Appreciation Portfolio
Investment Changes
Geographic Diversification (% of fund's net assets) |
As of December 31, 2006 |
| United States of America | 24.1% | |
| Canada | 12.6% | |
| France | 10.2% | |
| Netherlands | 9.7% | |
| United Kingdom | 8.4% | |
| Germany | 8.1% | |
| Argentina | 3.9% | |
| Luxembourg | 3.6% | |
| Switzerland | 3.5% | |
| Other | 15.9% | |

Percentages are adjusted for the effect of futures contracts, if applicable. |
|
As of June 30, 2006 |
| Japan | 18.4% | |
| France | 17.0% | |
| United States of America | 12.6% | |
| Germany | 10.2% | |
| Switzerland | 9.5% | |
| Canada | 4.9% | |
| Korea (South) | 4.3% | |
| United Kingdom | 4.2% | |
| Netherlands | 4.2% | |
| Other | 14.7% | |

Percentages are adjusted for the effect of futures contracts, if applicable. |
Asset Allocation |
| % of fund's
net assets | % of fund's net assets
6 months ago |
Stocks | 90.8 | 93.2 |
Short-Term Investments and Net Other Assets | 9.2 | 6.8 |
Top Ten Stocks as of December 31, 2006 |
| % of fund's
net assets | % of fund's net assets
6 months ago |
SES Global SA FDR unit (Luxembourg, Media) | 3.6 | 0.0 |
Deere & Co. (United States of America, Machinery) | 3.4 | 0.0 |
Canadian Natural Resources Ltd. (Canada, Oil, Gas & Consumable Fuels) | 3.4 | 2.1 |
Synthes, Inc. (United States of America, Health Care Equipment & Supplies) | 3.4 | 2.1 |
Lanxess AG (Germany, Chemicals) | 3.4 | 0.0 |
Renault SA (France, Automobiles) | 3.3 | 1.1 |
Tesco PLC (United Kingdom, Food & Staples Retailing) | 2.9 | 0.0 |
Koninklijke Philips Electronics NV (Netherlands, Household Durables) | 2.8 | 0.0 |
Pearson PLC (United Kingdom, Media) | 2.8 | 0.0 |
Nintendo Co. Ltd. (Japan, Software) | 2.8 | 0.0 |
| 31.8 | |
Market Sectors as of December 31, 2006 |
| % of fund's
net assets | % of fund's net assets
6 months ago |
Consumer Discretionary | 22.8 | 8.1 |
Materials | 17.1 | 5.2 |
Energy | 12.6 | 11.8 |
Consumer Staples | 12.1 | 6.8 |
Industrials | 8.7 | 10.1 |
Financials | 6.8 | 30.6 |
Health Care | 4.5 | 8.9 |
Information Technology | 3.7 | 9.2 |
Utilities | 2.5 | 2.5 |
Annual Report
VIP International Capital Appreciation Portfolio
Investments December 31, 2006
Showing Percentage of Net Assets
Common Stocks - 90.8% |
| Shares | | Value (Note 1) |
Argentina - 3.9% |
Cresud S.A.C.I.F. y A. sponsored ADR | 44,000 | | $ 770,000 |
Inversiones y Representaciones SA sponsored GDR (a) | 46,500 | | 786,315 |
Pampa Holding SA (a) | 244,400 | | 182,567 |
TOTAL ARGENTINA | | 1,738,882 |
Austria - 2.1% |
Flughafen Wien AG | 9,700 | | 952,762 |
Canada - 12.6% |
Abitibi-Consolidated, Inc. | 397,100 | | 1,018,292 |
Aquiline Resources, Inc. (a) | 25,700 | | 162,664 |
Aquiline Resources, Inc. (a)(e) | 32,400 | | 184,563 |
Canadian Natural Resources Ltd. | 28,700 | | 1,529,764 |
Catalyst Paper Corp. (a) | 146,300 | | 445,425 |
NuVista Energy Ltd. (a) | 31,400 | | 350,086 |
ProEx Energy Ltd. (a) | 37,300 | | 411,068 |
Saskatchewan Wheat Pool, Inc. (a) | 64,400 | | 489,904 |
Suncor Energy, Inc. | 13,700 | | 1,078,493 |
TOTAL CANADA | | 5,670,259 |
Cayman Islands - 2.7% |
GlobalSantaFe Corp. | 21,000 | | 1,234,380 |
Czech Republic - 1.6% |
Philip Morris CR AS | 1,350 | | 702,443 |
France - 10.2% |
Compagnie Generale de Geophysique SA (a)(d) | 3,300 | | 715,364 |
Icade SA | 13,546 | | 855,722 |
Neopost SA | 3,273 | | 411,145 |
Pernod Ricard SA | 4,769 | | 1,095,510 |
Renault SA | 12,396 | | 1,489,233 |
TOTAL FRANCE | | 4,566,974 |
Germany - 8.1% |
E.ON AG | 8,400 | | 1,138,788 |
KarstadtQuelle AG (a)(d) | 34,300 | | 994,412 |
Lanxess AG (a) | 26,800 | | 1,503,000 |
TOTAL GERMANY | | 3,636,200 |
Italy - 2.7% |
Fiat Spa (a)(d) | 63,600 | | 1,214,802 |
Japan - 2.8% |
Nintendo Co. Ltd. | 4,800 | | 1,245,863 |
Luxembourg - 3.6% |
SES Global SA FDR unit | 93,058 | | 1,621,687 |
Netherlands - 9.7% |
CNH Global NV | 30,600 | | 835,380 |
Koninklijke Philips Electronics NV | 34,000 | | 1,277,720 |
Nutreco Holding NV | 16,100 | | 1,049,795 |
Reed Elsevier NV | 71,300 | | 1,216,163 |
TOTAL NETHERLANDS | | 4,379,058 |
|
| Shares | | Value (Note 1) |
Philippines - 0.8% |
DMCI Holdings, Inc. | 1,328,000 | | $ 165,154 |
Semirara Mining Corp. | 519,100 | | 193,141 |
TOTAL PHILIPPINES | | 358,295 |
South Africa - 2.1% |
Gold Fields Ltd. sponsored ADR | 49,800 | | 940,224 |
Sweden - 1.1% |
Atlas Copco AB (A Shares) | 15,400 | | 517,405 |
Switzerland - 3.5% |
Actelion Ltd. (Reg.) (a) | 2,263 | | 497,546 |
Bucher Holding AG | 860 | | 93,341 |
Syngenta AG sponsored ADR | 26,300 | | 976,782 |
TOTAL SWITZERLAND | | 1,567,669 |
United Kingdom - 8.4% |
Benfield Group PLC | 174,000 | | 1,218,316 |
Pearson PLC | 82,900 | | 1,252,637 |
Tesco PLC | 162,600 | | 1,288,172 |
TOTAL UNITED KINGDOM | | 3,759,125 |
United States of America - 14.9% |
Deere & Co. | 16,300 | | 1,549,641 |
Monsanto Co. | 22,000 | | 1,155,660 |
Newmont Mining Corp. | 27,500 | | 1,241,625 |
NTL, Inc. | 48,150 | | 1,215,306 |
Synthes, Inc. | 12,663 | | 1,509,442 |
TOTAL UNITED STATES OF AMERICA | | 6,671,674 |
TOTAL COMMON STOCKS (Cost $36,176,403) | 40,777,702 |
Money Market Funds - 14.5% |
| | | |
Fidelity Cash Central Fund, 5.37% (b) | 4,024,953 | | 4,024,953 |
Fidelity Securities Lending Cash Central Fund, 5.38% (b)(c) | 2,478,800 | | 2,478,800 |
TOTAL MONEY MARKET FUNDS (Cost $6,503,753) | 6,503,753 |
TOTAL INVESTMENT PORTFOLIO - 105.3% (Cost $42,680,156) | | 47,281,455 |
NET OTHER ASSETS - (5.3)% | | (2,363,570) |
NET ASSETS - 100% | $ 44,917,885 |
Legend |
(a) Non-income producing |
(b) Affiliated fund that is available only to investment companies and other accounts managed by Fidelity Investments. The rate quoted is the annualized seven-day yield of the fund at period end. A complete unaudited listing of the fund's holdings as of its most recent quarter end is available upon request. |
(c) Investment made with cash collateral received from securities on loan. |
(d) Security or a portion of the security is on loan at period end. |
(e) Restricted securities - Investment in securities not registered under the Securities Act of 1933 (excluding 144A issues). At the end of the period, the value of restricted securities (excluding 144A issues) amounted to $184,563 or 0.4% of net assets. |
Additional information on each holding is as follows: |
Security | Acquisition Date | Acquisition Cost |
Aquiline Resources, Inc. | 10/31/06 | $ 134,200 |
Affiliated Central Funds |
Information regarding fiscal year to date income earned by the Fund from investments in Fidelity Central Funds is as follows: |
Fund | Income earned |
Fidelity Cash Central Fund | $ 115,596 |
Fidelity Securities Lending Cash Central Fund | 17,084 |
Total | $ 132,680 |
See accompanying notes which are an integral part of the financial statements.
Annual Report
VIP International Capital Appreciation Portfolio
Financial Statements
Statement of Assets and Liabilities
| December 31, 2006 |
| | |
Assets | | |
Investment in securities, at value (including securities loaned of $2,369,091) - See accompanying schedule: Unaffiliated issuers
(cost $36,176,403) | $ 40,777,702 | |
Fidelity Central Funds
(cost $6,503,753) | 6,503,753 | |
Total Investments (cost $42,680,156) | | $ 47,281,455 |
Foreign currency held at value
(cost $35) | | 35 |
Receivable for investments sold | | 112,619 |
Dividends receivable | | 36,540 |
Interest receivable | | 15,911 |
Prepaid expenses | | 196 |
Receivable from investment adviser for expense reductions | | 17,897 |
Other receivables | | 21,394 |
Total assets | | 47,486,047 |
| | |
Liabilities | | |
Payable for investments purchased | $ 747 | |
Accrued management fee | 26,184 | |
Distribution fees payable | 280 | |
Other affiliated payables | 6,804 | |
Other payables and accrued expenses | 55,347 | |
Collateral on securities loaned,
at value | 2,478,800 | |
Total liabilities | | 2,568,162 |
| | |
Net Assets | | $ 44,917,885 |
Net Assets consist of: | | |
Paid in capital | | $ 40,056,323 |
Undistributed net investment income | | 1,561 |
Accumulated undistributed net realized gain (loss) on investments and foreign currency transactions | | 257,578 |
Net unrealized appreciation (depreciation) on investments and assets and liabilities in foreign currencies | | 4,602,423 |
Net Assets | | $ 44,917,885 |
Statement of Assets and Liabilities - continued
| December 31, 2006 |
| | |
Initial Class:
Net Asset Value, offering price and redemption price per share ($1,356,944 ÷ 107,019 shares) | | $ 12.68 |
| | |
Service Class:
Net Asset Value, offering price and redemption price per share ($394,317 ÷ 31,116 shares) | | $ 12.67 |
| | |
Service Class 2:
Net Asset Value, offering price and redemption price per share ($524,155 ÷ 41,376 shares) | | $ 12.67 |
| | |
Initial Class R:
Net Asset Value, offering price and redemption price per share ($17,219,299 ÷ 1,357,964 shares) | | $ 12.68 |
| | |
Service Class R:
Net Asset Value, offering price and redemption price per share ($394,317 ÷ 31,116 shares) | | $ 12.67 |
| | |
Service Class 2R:
Net Asset Value, offering price and redemption price per share ($524,156 ÷ 41,376 shares) | | $ 12.67 |
| | |
Investor Class R:
Net Asset Value, offering price and redemption price per share ($24,504,697 ÷ 1,936,828 shares) | | $ 12.65 |
See accompanying notes which are an integral part of the financial statements.
VIP International Capital Appreciation Portfolio
Statement of Operations
| Year ended December 31, 2006 |
| | |
Investment Income | | |
Dividends | | $ 680,994 |
Interest | | 170 |
Income from Fidelity Central Funds | | 132,680 |
| | 813,844 |
Less foreign taxes withheld | | (76,733) |
Total income | | 737,111 |
| | |
Expenses | | |
Management fee | $ 269,846 | |
Transfer agent fees | 53,646 | |
Distribution fees | 3,116 | |
Accounting and security lending fees | 20,848 | |
Custodian fees and expenses | 164,983 | |
Independent trustees' compensation | 132 | |
Audit | 68,331 | |
Legal | 11,579 | |
Miscellaneous | 4,482 | |
Total expenses before reductions | 596,963 | |
Expense reductions | (185,574) | 411,389 |
Net investment income (loss) | | 325,722 |
Realized and Unrealized Gain (Loss) Net realized gain (loss) on: | | |
Investment securities: | | |
Unaffiliated issuers (net of foreign taxes of $17,965) | 1,341,632 | |
Foreign currency transactions | (29,882) | |
Total net realized gain (loss) | | 1,311,750 |
Change in net unrealized appreciation (depreciation) on: Investment securities (net of decrease in deferred foreign taxes of $4,289) | 3,054,187 | |
Assets and liabilities in foreign currencies | 1,343 | |
Total change in net unrealized appreciation (depreciation) | | 3,055,530 |
Net gain (loss) | | 4,367,280 |
Net increase (decrease) in net assets resulting from operations | | $ 4,693,002 |
Statement of Changes in Net Assets
| Year ended
December 31, 2006 | Year ended
December 31, 2005 |
Increase (Decrease) in Net Assets | | |
Operations | | |
Net investment income (loss) | $ 325,722 | $ 36,898 |
Net realized gain (loss) | 1,311,750 | 75,776 |
Change in net unrealized appreciation (depreciation) | 3,055,530 | 1,498,698 |
Net increase (decrease) in net assets resulting from operations | 4,693,002 | 1,611,372 |
Distributions to shareholders from net investment income | (324,160) | (36,055) |
Distributions to shareholders from net realized gain | (1,106,887) | (24,458) |
Total distributions | (1,431,047) | (60,513) |
Share transactions - net increase (decrease) | 20,509,608 | 17,530,687 |
Redemption fees | 15,654 | 310 |
Total increase (decrease) in net assets | 23,787,217 | 19,081,856 |
| | |
Net Assets | | |
Beginning of period | 21,130,668 | 2,048,812 |
End of period (including undistributed net investment income of $1,561, and undistributed net investment income of $0, respectively) | $ 44,917,885 | $ 21,130,668 |
See accompanying notes which are an integral part of the financial statements.
Annual Report
Financial Highlights - Initial Class
Years ended December 31, | 2006 | 2005 | 2004 H |
Selected Per-Share Data | | | |
Net asset value, beginning of period | $ 11.46 | $ 10.24 | $ 10.00 |
Income from Investment Operations | | | |
Net investment income (loss) E | .11 | .06 | - J |
Net realized and unrealized gain (loss) | 1.54 | 1.21 | .24 |
Total from investment operations | 1.65 | 1.27 | .24 |
Distributions from net investment income | (.10) | (.02) | - |
Distributions from net realized gain | (.34) | (.02) | - |
Total distributions | (.43) L | (.05) K | - |
Redemption fees added to paid in capital E | - J | - J | - |
Net asset value, end of period | $ 12.68 | $ 11.46 | $ 10.24 |
Total Return B, C, D | 14.49% | 12.37% | 2.40% |
Ratios to Average Net Assets F, I | | | |
Expenses before reductions | 1.80% | 3.55% | 43.27% A |
Expenses net of fee waivers, if any | 1.10% | 1.10% | 1.10% A |
Expenses net of all reductions | 1.00% | .91% | .92% A |
Net investment income (loss) | .95% | .53% | .80% A |
Supplemental Data | | | |
Net assets, end of period (000 omitted) | $ 1,357 | $ 9,367 | $ 307 |
Portfolio turnover rate G | 185% | 176% | 52% A |
A Annualized
B Total returns for periods of less than one year are not annualized.
C Total returns do not reflect charges attributable to your insurance company's separate account. Inclusion of these charges would reduce the total returns shown.
D Total returns would have been lower had certain expenses not been reduced during the periods shown.
E Calculated based on average shares outstanding during the period.
F Fees and expenses of the underlying Fidelity Central Funds are not included in the Fund's expense ratio. The Fund indirectly bears its proportionate share of the expenses of any underlying Fidelity Central Funds.
G Amount does not include the portfolio activity of any underlying Fidelity Central Funds.
H For the period December 22, 2004 (commencement of operations) to December 31, 2004.
I Expense ratios reflect operating expenses of the class. Expenses before reductions do not reflect amounts reimbursed by the investment adviser or reductions from brokerage service arrangements or other expense offset arrangements and do not represent the amount paid by the class during periods when reimbursements or reductions occur. Expense ratios before reductions for start-up periods may not be representative of longer-term operating periods. Expenses net of fee waivers reflect expenses after reimbursement by the investment adviser but prior to reductions from brokerage service arrangements or other expense offset arrangements. Expenses net of all reductions represent the net expenses paid by the class.
J Amount represents less than $.01 per share.
K Total distribution of $.05 per share is comprised of distributions from net investment income of $.022 and distributions from net realized gain of $.023 per share.
L Total distribution of $.43 per share is comprised of distributions from net investment income of $.095 and distributions from net realized gain of $.335 per share.
Financial Highlights - Service Class
Years ended December 31, | 2006 | 2005 | 2004 H |
Selected Per-Share Data | | | |
Net asset value, beginning of period | $ 11.46 | $ 10.24 | $ 10.00 |
Income from Investment Operations | | | |
Net investment income (loss) E | .10 | .10 | - J |
Net realized and unrealized gain (loss) | 1.53 | 1.16 | .24 |
Total from investment operations | 1.63 | 1.26 | .24 |
Distributions from net investment income | (.08) | (.01) | - |
Distributions from net realized gain | (.34) | (.02) | - |
Total distributions | (.42) L | (.04) K | - |
Redemption fees added to paid in capital E | - J | - J | - |
Net asset value, end of period | $ 12.67 | $ 11.46 | $ 10.24 |
Total Return B, C, D | 14.30% | 12.27% | 2.40% |
Ratios to Average Net Assets F, I | | | |
Expenses before reductions | 1.62% | 4.35% | 43.36% A |
Expenses net of fee waivers, if any | 1.20% | 1.20% | 1.20% A |
Expenses net of all reductions | 1.10% | 1.01% | 1.01% A |
Net investment income (loss) | .85% | .98% | .71% A |
Supplemental Data | | | |
Net assets, end of period (000 omitted) | $ 394 | $ 345 | $ 307 |
Portfolio turnover rate G | 185% | 176% | 52% A |
A Annualized
B Total returns for periods of less than one year are not annualized.
C Total returns do not reflect charges attributable to your insurance company's separate account. Inclusion of these charges would reduce the total returns shown.
D Total returns would have been lower had certain expenses not been reduced during the periods shown.
E Calculated based on average shares outstanding during the period.
F Fees and expenses of the underlying Fidelity Central Funds are not included in the Fund's expense ratio. The Fund indirectly bears its proportionate share of the expenses of any underlying Fidelity Central Funds.
G Amount does not include the portfolio activity of any underlying Fidelity Central Funds.
H For the period December 22, 2004 (commencement of operations) to December 31, 2004.
I Expense ratios reflect operating expenses of the class. Expenses before reductions do not reflect amounts reimbursed by the investment adviser or reductions from brokerage service arrangements or other expense offset arrangements and do not represent the amount paid by the class during periods when reimbursements or reductions occur. Expense ratios before reductions for start-up periods may not be representative of longer-term operating periods. Expenses net of fee waivers reflect expenses after reimbursement by the investment adviser but prior to reductions from brokerage service arrangements or other expense offset arrangements. Expenses net of all reductions represent the net expenses paid by the class.
J Amount represents less than $.01 per share.
K Total distribution of $.04 per share is comprised of distributions from net investment income of $.012 and distributions from net realized gain of $.023 per share.
L Total distribution of $.42 per share is comprised of distributions from net investment income of $.084 and distributions from net realized gain of $.335 per share.
See accompanying notes which are an integral part of the financial statements.
VIP International Capital Appreciation Portfolio
Financial Highlights - Service Class 2
Years ended December 31, | 2006 | 2005 | 2004 H |
Selected Per-Share Data | | | |
Net asset value, beginning of period | $ 11.46 | $ 10.24 | $ 10.00 |
Income from Investment Operations | | | |
Net investment income (loss) E | .08 | .09 | - J |
Net realized and unrealized gain (loss) | 1.53 | 1.15 | .24 |
Total from investment operations | 1.61 | 1.24 | .24 |
Distributions from net investment income | (.07) | - | - |
Distributions from net realized gain | (.34) | (.02) | - |
Total distributions | (.40) L | (.02) K | - |
Redemption fees added to paid in capital E | - J | - J | - |
Net asset value, end of period | $ 12.67 | $ 11.46 | $ 10.24 |
Total Return B, C, D | 14.14% | 12.12% | 2.40% |
Ratios to Average Net Assets F, I | | | |
Expenses before reductions | 1.77% | 4.50% | 43.51% A |
Expenses net of fee waivers, if any | 1.35% | 1.35% | 1.35% A |
Expenses net of all reductions | 1.25% | 1.16% | 1.17% A |
Net investment income (loss) | .70% | .83% | .55% A |
Supplemental Data | | | |
Net assets, end of period (000 omitted) | $ 524 | $ 459 | $ 410 |
Portfolio turnover rate G | 185% | 176% | 52% A |
A Annualized
B Total returns for periods of less than one year are not annualized.
C Total returns do not reflect charges attributable to your insurance company's separate account. Inclusion of these charges would reduce the total returns shown.
D Total returns would have been lower had certain expenses not been reduced during the periods shown.
E Calculated based on average shares outstanding during the period.
F Fees and expenses of the underlying Fidelity Central Funds are not included in the Fund's expense ratio. The Fund indirectly bears its proportionate share of the expenses of any underlying Fidelity Central Funds.
G Amount does not include the portfolio activity of any underlying Fidelity Central Funds.
H For the period December 22, 2004 (commencement of operations) to December 31, 2004.
I Expense ratios reflect operating expenses of the class. Expenses before reductions do not reflect amounts reimbursed by the investment adviser or reductions from brokerage service arrangements or other expense offset arrangements and do not represent the amount paid by the class during periods when reimbursements or reductions occur. Expense ratios before reductions for start-up periods may not be representative of longer-term operating periods. Expenses net of fee waivers reflect expenses after reimbursement by the investment adviser but prior to reductions from brokerage service arrangements or other expense offset arrangements. Expenses net of all reductions represent the net expenses paid by the class.
J Amount represents less than $.01 per share.
K Total distribution of $.02 per share is comprised of distributions from net investment income of $.00 and distributions from net realized gain of $.02 per share.
L Total distribution of $.40 per share is comprised of distributions from net investment income of $.066 and distributions from net realized gain of $.335 per share.
Financial Highlights - Initial Class R
Years ended December 31, | 2006 | 2005 | 2004 H |
Selected Per-Share Data | | | |
Net asset value, beginning of period | $ 11.46 | $ 10.24 | $ 10.00 |
Income from Investment Operations | | | |
Net investment income (loss) E | .11 | .11 | - J |
Net realized and unrealized gain (loss) | 1.54 | 1.16 | .24 |
Total from investment operations | 1.65 | 1.27 | .24 |
Distributions from net investment income | (.10) | (.02) | - |
Distributions from net realized gain | (.34) | (.02) | - |
Total distributions | (.43) L | (.05) K | - |
Redemption fees added to paid in capital E | - J | - J | - |
Net asset value, end of period | $ 12.68 | $ 11.46 | $ 10.24 |
Total Return B, C, D | 14.50% | 12.37% | 2.40% |
Ratios to Average Net Assets F, I | | | |
Expenses before reductions | 1.46% | 4.25% | 43.27% A |
Expenses net of fee waivers, if any | 1.10% | 1.10% | 1.10% A |
Expenses net of all reductions | 1.00% | .91% | .92% A |
Net investment income (loss) | .95% | 1.08% | .80% A |
Supplemental Data | | | |
Net assets, end of period (000 omitted) | $ 17,219 | $ 345 | $ 307 |
Portfolio turnover rate G | 185% | 176% | 52% A |
A Annualized
B Total returns for periods of less than one year are not annualized.
C Total returns do not reflect charges attributable to your insurance company's separate account. Inclusion of these charges would reduce the total returns shown.
D Total returns would have been lower had certain expenses not been reduced during the periods shown.
E Calculated based on average shares outstanding during the period.
F Fees and expenses of the underlying Fidelity Central Funds are not included in the Fund's expense ratio. The Fund indirectly bears its proportionate share of the expenses of any underlying Fidelity Central Funds.
G Amount does not include the portfolio activity of any underlying Fidelity Central Funds.
H For the period December 22, 2004 (commencement of operations) to December 31, 2004.
I Expense ratios reflect operating expenses of the class. Expenses before reductions do not reflect amounts reimbursed by the investment adviser or reductions from brokerage service arrangements or other expense offset arrangements and do not represent the amount paid by the class during periods when reimbursements or reductions occur. Expense ratios before reductions for start-up periods may not be representative of longer-term operating periods. Expenses net of fee waivers reflect expenses after reimbursement by the investment adviser but prior to reductions from brokerage service arrangements or other expense offset arrangements. Expenses net of all reductions represent the net expenses paid by the class.
J Amount represents less than $.01 per share.
K Total distribution of $.05 per share is comprised of distributions from net investment income of $.022 and distributions from net realized gain of $.023 per share.
L Total distribution of $.43 per share is comprised of distributions from net investment income of $.096 and distributions from net realized gain of $.335 per share.
See accompanying notes which are an integral part of the financial statements.
Annual Report
Financial Highlights - Service Class R
Years ended December 31, | 2006 | 2005 | 2004 H |
Selected Per-Share Data | | | |
Net asset value, beginning of period | $ 11.46 | $ 10.24 | $ 10.00 |
Income from Investment Operations | | | |
Net investment income (loss) E | .10 | .10 | - J |
Net realized and unrealized gain (loss) | 1.53 | 1.16 | .24 |
Total from investment operations | 1.63 | 1.26 | .24 |
Distributions from net investment income | (.08) | (.01) | - |
Distributions from net realized gain | (.34) | (.02) | - |
Total distributions | (.42) L | (.04) K | - |
Redemption fees added to paid in capital E | - J | - J | - |
Net asset value, end of period | $ 12.67 | $ 11.46 | $ 10.24 |
Total Return B, C, D | 14.30% | 12.27% | 2.40% |
Ratios to Average Net Assets F, I | | | |
Expenses before reductions | 1.62% | 4.35% | 43.36% A |
Expenses net of fee waivers, if any | 1.20% | 1.20% | 1.20% A |
Expenses net of all reductions | 1.10% | 1.01% | 1.01% A |
Net investment income (loss) | .85% | .98% | .71% A |
Supplemental Data | | | |
Net assets, end of period (000 omitted) | $ 394 | $ 345 | $ 307 |
Portfolio turnover rate G | 185% | 176% | 52% A |
A Annualized
B Total returns for periods of less than one year are not annualized.
C Total returns do not reflect charges attributable to your insurance company's separate account. Inclusion of these charges would reduce the total returns shown.
D Total returns would have been lower had certain expenses not been reduced during the periods shown.
E Calculated based on average shares outstanding during the period.
F Fees and expenses of the underlying Fidelity Central Funds are not included in the Fund's expense ratio. The Fund indirectly bears its proportionate share of the expenses of any underlying Fidelity Central Funds.
G Amount does not include the portfolio activity of any underlying Fidelity Central Funds.
H For the period December 22, 2004 (commencement of operations) to December 31, 2004.
I Expense ratios reflect operating expenses of the class. Expenses before reductions do not reflect amounts reimbursed by the investment adviser or reductions from brokerage service arrangements or other expense offset arrangements and do not represent the amount paid by the class during periods when reimbursements or reductions occur. Expense ratios before reductions for start-up periods may not be representative of longer-term operating periods. Expenses net of fee waivers reflect expenses after reimbursement by the investment adviser but prior to reductions from brokerage service arrangements or other expense offset arrangements. Expenses net of all reductions represent the net expenses paid by the class.
J Amount represents less than $.01 per share.
K Total distribution of $.04 per share is comprised of distributions from net investment income of $.012 and distributions from net realized gain of $.023 per share.
L Total distribution of $.42 per share is comprised of distributions from net investment income of $.084 and distributions from net realized gain of $.335 per share.
Financial Highlights - Service Class 2R
Years ended December 31, | 2006 | 2005 | 2004 H |
Selected Per-Share Data | | | |
Net asset value, beginning of period | $ 11.46 | $ 10.24 | $ 10.00 |
Income from Investment Operations | | | |
Net investment income (loss) E | .08 | .09 | - J |
Net realized and unrealized gain (loss) | 1.53 | 1.15 | .24 |
Total from investment operations | 1.61 | 1.24 | .24 |
Distributions from net investment income | (.07) | - | - |
Distributions from net realized gain | (.34) | (.02) | - |
Total distributions | (.40) L | (.02) K | - |
Redemption fees added to paid in capital E | - J | - J | - |
Net asset value, end of period | $ 12.67 | $ 11.46 | $ 10.24 |
Total Return B, C, D | 14.14% | 12.12% | 2.40% |
Ratios to Average Net Assets F, I | | | |
Expenses before reductions | 1.77% | 4.50% | 43.51% A |
Expenses net of fee waivers, if any | 1.35% | 1.35% | 1.35% A |
Expenses net of all reductions | 1.25% | 1.16% | 1.17% A |
Net investment income (loss) | .70% | .83% | .55% A |
Supplemental Data | | | |
Net assets, end of period (000 omitted) | $ 524 | $ 459 | $ 410 |
Portfolio turnover rate G | 185% | 176% | 52% A |
A Annualized
B Total returns for periods of less than one year are not annualized.
C Total returns do not reflect charges attributable to your insurance company's separate account. Inclusion of these charges would reduce the total returns shown.
D Total returns would have been lower had certain expenses not been reduced during the periods shown.
E Calculated based on average shares outstanding during the period.
F Fees and expenses of the underlying Fidelity Central Funds are not included in the Fund's expense ratio. The Fund indirectly bears its proportionate share of the expenses of any underlying Fidelity Central Funds.
G Amount does not include the portfolio activity of any underlying Fidelity Central Funds.
H For the period December 22, 2004 (commencement of operations) to December 31, 2004.
I Expense ratios reflect operating expenses of the class. Expenses before reductions do not reflect amounts reimbursed by the investment adviser or reductions from brokerage service arrangements or other expense offset arrangements and do not represent the amount paid by the class during periods when reimbursements or reductions occur. Expense ratios before reductions for start-up periods may not be representative of longer-term operating periods. Expenses net of fee waivers reflect expenses after reimbursement by the investment adviser but prior to reductions from brokerage service arrangements or other expense offset arrangements. Expenses net of all reductions represent the net expenses paid by the class.
J Amount represents less than $.01 per share.
K Total distribution of $.02 per share is comprised of distributions from net investment income of $.00 and distributions from net realized gain of $.02 per share.
L Total distribution of $.40 per share is comprised of distributions from net investment income of $.066 and distributions from net realized gain of $.335 per share.
See accompanying notes which are an integral part of the financial statements.
VIP International Capital Appreciation Portfolio
Financial Highlights - Investor Class R
Years ended December 31, | 2006 | 2005 H |
Selected Per-Share Data | | |
Net asset value, beginning of period | $ 11.46 | $ 10.32 |
Income from Investment Operations | | |
Net investment income (loss) E | .09 | .01 |
Net realized and unrealized gain (loss) | 1.53 | 1.16 |
Total from investment operations | 1.62 | 1.17 |
Distributions from net investment income | (.10) | (.02) |
Distributions from net realized gain | (.34) | (.01) |
Total distributions | (.43) L | (.03) K |
Redemption fees added to paid in capital E, J | - | - |
Net asset value, end of period | $ 12.65 | $ 11.46 |
Total Return B, C, D | 14.23% | 11.39% |
Ratios to Average Net Assets F, I | | |
Expenses before reductions | 1.61% | 2.19% A |
Expenses net of fee waivers, if any | 1.25% | 1.25% A |
Expenses net of all reductions | 1.15% | 1.06% A |
Net investment income (loss) | .80% | .31% A |
Supplemental Data | | |
Net assets, end of period (000 omitted) | $ 24,505 | $ 9,810 |
Portfolio turnover rate G | 185% | 176% |
A Annualized
B Total returns for periods of less than one year are not annualized.
C Total returns do not reflect charges attributable to your insurance company's separate account. Inclusion of these charges would reduce the total returns shown.
D Total returns would have been lower had certain expenses not been reduced during the periods shown.
E Calculated based on average shares outstanding during the period.
F Fees and expenses of the underlying Fidelity Central Funds are not included in the Fund's expense ratio. The Fund indirectly bears its proportionate share of the expenses of any underlying Fidelity Central Funds.
G Amount does not include the portfolio activity of any underlying Fidelity Central Funds.
H For the period July 21, 2005 (commencement of sale of shares) to December 31, 2005.
I Expense ratios reflect operating expenses of the class. Expenses before reductions do not reflect amounts reimbursed by the investment adviser or reductions from brokerage service arrangements or other expense offset arrangements and do not represent the amount paid by the class during periods when reimbursements or reductions occur. Expense ratios before reductions for start-up periods may not be representative of longer-term operating periods. Expenses net of fee waivers reflect expenses after reimbursement by the investment adviser but prior to reductions from brokerage service arrangements or other expense offset arrangements. Expenses net of all reductions represent the net expenses paid by the class.
J Amount represents less than $.01 per share.
K Total distribution of $.03 per share is comprised of distributions from net investment income of $.022 and distributions from net realized gain of $.013 per share.
L Total distribution of $.43 per share is comprised of distributions from net investment income of $.095 and distributions from net realized gain of $.335 per share.
See accompanying notes which are an integral part of the financial statements.
Annual Report
Notes to Financial Statements
For the period ended December 31, 2006
1. Significant Accounting Policies.
VIP International Capital Appreciation Portfolio (the Fund) is a fund of Variable Insurance Products Fund IV (the trust) and is authorized to issue an unlimited number of shares. The trust is registered under the Investment Company Act of 1940, as amended (the 1940 Act), as an open-end management investment company organized as a Massachusetts business trust. Shares of the Fund may only be purchased by insurance companies for the purpose of funding variable annuity or variable life insurance contracts. The Fund offers the following classes of shares: Initial Class shares, Service Class shares, Service Class 2 shares, Initial Class R shares, Service Class R shares, Service Class 2R shares, and Investor Class R shares. All classes have equal rights and voting privileges, except for matters affecting a single class. Investment income, realized and unrealized capital gains and losses, the common expenses of the Fund, and certain fund-level expense reductions, if any, are allocated on a pro rata basis to each class based on the relative net assets of each class to the total net assets of the Fund. Each class differs with respect to transfer agent and distribution and service plan fees incurred. Certain expense reductions also differ by class.
The Fund's investments in emerging markets can be subject to social, economic, regulatory, and political uncertainties and can be extremely volatile. The Fund may invest in Fidelity Central Funds which are open-end investment companies available to investment companies and other accounts managed by Fidelity Management & Research Company (FMR) and its affiliates. The financial statements have been prepared in conformity with accounting principles generally accepted in the United States of America, which require management to make certain estimates and assumptions at the date of the financial statements. The following summarizes the significant accounting policies of the Fund, which are also consistently followed by the Fidelity Central Funds:
Security Valuation. Investments are valued and net asset value (NAV) per share is calculated (NAV calculation) as of the close of business of the New York Stock Exchange (NYSE), normally 4:00 p.m. Eastern time. Wherever possible, the Fund uses independent pricing services approved by the Board of Trustees to value its investments.
Equity securities, including restricted securities, for which market quotations are readily available, are valued at the last reported sale price or official closing price as reported by an independent pricing service on the primary market or exchange on which they are traded. In the event there were no sales during the day or closing prices are not available, securities are valued at the last quoted bid price. Investments in open-end mutual funds, including the Fidelity Central Funds, are valued at their closing net asset value each business day. Short-term securities with remaining maturities of sixty days or less for which quotations are not readily available are valued at amortized cost, which approximates value. When current market prices or quotations are not readily available or do not accurately reflect fair value, valuations may be determined in accordance with procedures adopted by the Board of Trustees. For example, when developments occur between the close of a market and the close of the NYSE that may materially affect the value of some or all of the securities, or when trading in a security is halted, those securities may be fair valued. Factors used in the determination of fair value may include monitoring news to identify significant market or security specific events such as changes in the value of U.S. securities markets, reviewing developments in foreign markets and evaluating the performance of ADRs, futures contracts and exchange-traded funds. Because the Fund's utilization of fair value pricing depends on market activity, the frequency with which fair value pricing is used can not be predicted and may be utilized to a significant extent. The value of securities used for NAV calculation under fair value pricing may differ from published prices for the same securities.
Foreign Currency. The Fund uses foreign currency contracts to facilitate transactions in foreign-denominated securities. Losses from these transactions may arise from changes in the value of the foreign currency or if the counterparties do not perform under the contracts' terms.
Foreign-denominated assets, including investment securities, and liabilities are translated into U.S. dollars at the exchange rate at period end. Purchases and sales of investment securities, income and dividends received and expenses denominated in foreign currencies are translated into U.S. dollars at the exchange rate in effect on the transaction date.
The effects of exchange rate fluctuations on investments are included with the net realized and unrealized gain (loss) on investment securities. Other foreign currency transactions resulting in realized and unrealized gain (loss) are disclosed separately.
Investment Transactions and Income. Security transactions, including the Fund's investment activity in the Fidelity Central Funds, are accounted for as of trade date. Gains and losses on securities sold are determined on the basis of identified cost. Dividend income is recorded on the ex-dividend date, except for certain dividends from foreign securities where the ex-dividend date may have passed, which are recorded as soon as the Fund is informed of the ex-dividend date. Non-cash dividends included in dividend income, if any, are recorded at the fair market value of the securities received. Interest income and income distributions from the Fidelity Central Funds are accrued as earned, with any income distributions receivable as of period end included in Interest Receivable on the Statement of Assets and Liabilities. Interest income includes coupon interest and amortization of premium and accretion of discount on debt securities. Investment income is recorded net of foreign taxes withheld where recovery of such taxes is uncertain.
VIP International Capital Appreciation Portfolio
1. Significant Accounting Policies - continued
Expenses. Most expenses of the trust can be directly attributed to a fund. Expenses which cannot be directly attributed are apportioned among each Fund in the trust. Expense estimates are accrued in the period to which they relate and adjustments are made when actual amounts are known.
Income Tax Information and Distributions to Shareholders. Each year, the Fund intends to qualify as a regulated investment company by distributing all of its taxable income and realized gains under Subchapter M of the Internal Revenue Code. As a result, no provision for income taxes is required in the accompanying financial statements. Foreign taxes are provided for based on the Fund's understanding of the tax rules and rates that exist in the foreign markets in which it invests.
Distributions are recorded on the ex-dividend date. Income dividends and capital gain distributions are declared separately for each class. Income and capital gain distributions are determined in accordance with income tax regulations, which may differ from generally accepted accounting principles.
Capital accounts within the financial statements are adjusted for permanent book-tax differences. These adjustments have no impact on net assets or the results of operations. Temporary book-tax differences will reverse in a subsequent period.
Book-tax differences are primarily due to foreign currency transactions, certain foreign taxes, passive foreign investment companies (PFIC) and losses deferred due to wash sales.
The tax-basis components of distributable earnings and the federal tax cost as of period end were as follows:
Unrealized appreciation | $ 4,681,132 | |
Unrealized depreciation | (263,567) | |
Net unrealized appreciation (depreciation) | 4,417,565 | |
Undistributed ordinary income | 396,868 | |
Undistributed long-term capital gain | 47,130 | |
| | |
Cost for federal income tax purposes | $ 42,863,890 | |
The tax character of distributions paid was as follows:
| December 31, 2006 | December 31, 2005 |
Ordinary Income | $ 779,358 | $ 60,513 |
Long-term Capital Gains | 651,689 | - |
Total | $ 1,431,047 | $ 60,513 |
Trading (Redemption) Fees. Initial Class R shares, Service Class R shares, Service Class 2 R shares and Investor Class R shares held less than 60 days are subject to a redemption fee equal to 1% of the proceeds of the redeemed shares. All redemption fees, including any estimated redemption fees paid by FMR, are retained by the Fund and accounted for as an addition to paid in capital.
New Accounting Pronouncements. In July 2006, Financial Accounting Standards Board Interpretation No. 48, Accounting for Uncertainty in Income Taxes - an interpretation of FASB Statement 109 (FIN 48), was issued and is effective on the last business day of the semiannual reporting period for fiscal years beginning after December 15, 2006. FIN 48 sets forth a threshold for financial statement recognition, measurement and disclosure of a tax position taken or expected to be taken on a tax return. Management is currently evaluating the impact, if any, the adoption of FIN 48 will have on the Fund's net assets, results of operations and financial statement disclosures.
In addition, in September 2006, Statement of Financial Accounting Standards No. 157, Fair Value Measurements (SFAS 157), was issued and is effective for fiscal years beginning after November 15, 2007. SFAS 157 defines fair value, establishes a framework for measuring fair value and expands disclosures about fair value measurements. Management is currently evaluating the impact the adoption of SFAS 157 will have on the Fund's financial statement disclosures.
2. Operating Policies.
Repurchase Agreements. FMR has received an Exemptive Order from the Securities and Exchange Commission (the SEC) which permits the Fund and other affiliated entities of FMR to transfer uninvested cash balances into joint trading accounts which are then invested in repurchase agreements. The Fund may also invest directly with institutions in repurchase agreements. Repurchase agreements are collateralized by government or non-government securities. Upon settlement date, collateral is held in segregated accounts with custodian banks and may be obtained in the event of a default of the counterparty. The Fund monitors, on a daily basis, the value of the collateral to ensure it is at least equal to the principal amount of the repurchase agreement (including accrued interest). In the event of a default by the counterparty, realization of the collateral proceeds could be delayed, during which time the value of the collateral may decline.
Annual Report
Notes to Financial Statements - continued
2. Operating Policies - continued
Restricted Securities. The Fund may invest in securities that are subject to legal or contractual restrictions on resale. These securities generally may be resold in transactions exempt from registration or to the public if the securities are registered. Disposal of these securities may involve time-consuming negotiations and expense, and prompt sale at an acceptable price may be difficult. Information regarding restricted securities is included at the end of the Fund's Schedule of Investments.
3. Purchases and Sales of Investments.
Purchases and sales of securities, other than short-term securities, aggregated $81,746,007 and $65,476,684, respectively.
4. Fees and Other Transactions with Affiliates.
Management Fee. FMR and its affiliates provide the Fund with investment management related services for which the Fund pays a monthly management fee. The management fee is the sum of an individual fund fee rate that is based on an annual rate of .45% of the Fund's average net assets and a group fee rate that averaged .27% during the period. The group fee rate is based upon the average net assets of all the mutual funds advised by FMR. The group fee rate decreases as assets under management increase and increases as assets under management decrease. For the period, the total annual management fee rate was .71% of the Fund's average net assets.
Distribution and Service Plan. In accordance with Rule 12b-1 of the 1940 Act, the Fund has adopted separate 12b-1 Plans for each Service Class of shares. Each Service Class pays Fidelity Distributors Corporation (FDC), an affiliate of FMR, a service fee. For the period, the service fee is based on an annual rate of .10% of Service Class' and Service Class R's average net assets and .25% of Service Class 2's and Service Class 2R's average net assets.
For the period, each class paid FDC the following amounts, all of which were re-allowed to insurance companies for the distribution of shares and providing shareholder support services:
Service Class | $ 361 | |
Service Class 2 | 1,197 | |
Service Class R | 361 | |
Service Class 2 R | 1,197 | |
| $ 3,116 | |
Transfer Agent Fees. Fidelity Investments Institutional Operations Company, Inc. (FIIOC), an affiliate of FMR, is the fund's transfer, dividend disbursing, and shareholder servicing agent. FIIOC receives an asset-based fee with respect to each class. Each class with the exception of Investor Class R pays a transfer agent fee, excluding out of pocket expenses, equal to an annual rate of .07% of their month end net assets. Investor Class R pays a monthly asset-based transfer agent fee of .18% of its month end net assets. The total transfer agent fees paid by each class to FIIOC, including out of pocket expenses, were as follows:
Initial Class | $ 3,361 | |
Service Class | 241 | |
Service Class 2 | 321 | |
Initial Class R | 10,268 | |
Service Class R | 241 | |
Service Class 2R | 321 | |
Investor Class R | 38,893 | |
| $ 53,646 | |
Accounting and Security Lending Fees. Fidelity Service Company, Inc. (FSC), an affiliate of FMR, maintains the Fund's accounting records. The accounting fee is based on the level of average net assets for the month. Under a separate contract, FSC administers the security lending program. The security lending fee is based on the number and duration of lending transactions.
Investments in Fidelity Central Funds. The Fund may invest in Fidelity Central Funds. The Fund's Schedule of Investments lists each of the Fidelity Central Funds as an investment of the Fund but does not include the underlying holdings of each Fidelity Central Fund. As an Investing Fund, the Fund indirectly bears its proportionate share of the expenses of the underlying Fidelity Central Funds. A complete unaudited list of holdings for each Fidelity Central Fund is available upon request . In addition, the financial statements of the Fidelity Central Funds, which are not covered by the Fund's Report of Independent Registered Public Accounting Firm, are available on the EDGAR Database on the SEC's web site, www.sec.gov, or upon request.
The Money Market Central Funds seek preservation of capital and current income and are managed by Fidelity Investments Money Management, Inc. (FIMM), an affiliate of FMR.
VIP International Capital Appreciation Portfolio
4. Fees and Other Transactions with Affiliates - continued
Brokerage Commissions. The Fund placed a portion of its portfolio transactions with brokerage firms which are affiliates of the investment adviser. The commissions paid to these affiliated firms were $313 for the period.
5. Committed Line of Credit.
The Fund participates with other funds managed by FMR in a $4.2 billion credit facility (the "line of credit") to be utilized for temporary or emergency purposes to fund shareholder redemptions or for other short-term liquidity purposes. The Fund has agreed to pay commitment fees on its pro rata portion of the line of credit, which amounted to $83 and is reflected in Miscellaneous Expense on the Statement of Operations. During the period, there were no borrowings on this line of credit.
6. Security Lending.
The Fund lends portfolio securities from time to time in order to earn additional income. On the settlement date of the loan, the Fund receives collateral (in the form of U.S. Treasury obligations, letters of credit and/or cash) against the loaned securities and maintains collateral in an amount not less than 100% of the market value of the loaned securities during the period of the loan. The market value of the loaned securities is determined at the close of business of the Fund and any additional required collateral is delivered to the Fund on the next business day. If the borrower defaults on its obligation to return the securities loaned because of insolvency or other reasons, a fund could experience delays and costs in recovering the securities loaned or in gaining access to the collateral. Any cash collateral received is invested in the Fidelity Securities Lending Cash Central Fund. The value of loaned securities and cash collateral at period end are disclosed on the Fund's Statement of Assets and Liabilities. Security lending income represents the income earned on investing cash collateral, less fees and expenses associated with the loan, plus any premium payments that may be received on the loan of certain types of securities. Security lending income is presented in the Statement of Operations as a component of income from Fidelity Central Funds. Net income from lending portfolio securities during the period amounted to $17,084.
7. Expense Reductions.
FMR voluntarily agreed to reimburse each class to the extent annual operating expenses exceeded certain levels of average net assets as noted in the table below. Some expenses, for example interest expense, including commitment fees, are excluded from this reimbursement.
The following classes were in reimbursement during the period:
| Expense
Limitations | Reimbursement
from adviser |
| | |
Initial Class | 1.10% | $ 22,307 |
Service Class | 1.20% | 1,504 |
Service Class 2 | 1.35% | 2,003 |
Initial Class R | 1.10% | 46,535 |
Service Class R | 1.20% | 1,504 |
Service Class 2R | 1.35% | 2,002 |
Investor Class R | 1.25% | 72,427 |
| | $ 148,282 |
Many of the brokers with whom FMR places trades on behalf of the Fund provided services to the Fund in addition to trade execution. These services included payments of certain expenses on behalf of the Fund totaling $37,292 for the period.
8. Other.
The Fund's organizational documents provide former and current trustees and officers with a limited indemnification against liabilities arising in connection with the performance of their duties to the Fund. In the normal course of business, the Fund may also enter into contracts that provide general indemnifications. The Fund's maximum exposure under these arrangements is unknown as this would be dependent on future claims that may be made against the Fund. The risk of material loss from such claims is considered remote.
At the end of the period, FMR or its affiliates were the owners of record of 98% of the total outstanding shares of the fund.
Annual Report
Notes to Financial Statements - continued
9. Distributions to Shareholders.
Distributions to shareholders of each class were as follows:
| Years ended December 31, |
| 2006 | 2005 A |
From net investment income | | |
Initial Class | $ 9,863 | $ 17,173 |
Service Class | 2,538 | 360 |
Service Class 2 | 2,655 | - |
Initial Class R | 126,136 | 661 |
Service Class R | 2,538 | 360 |
Service Class 2R | 2,655 | - |
Investor Class R | 177,775 | 17,501 |
Total | $ 324,160 | $ 36,055 |
From net realized gain | | |
Initial Class | $ 82,024 | $ 10,447 |
Service Class | 10,116 | 690 |
Service Class 2 | 13,470 | 800 |
Initial Class R | 382,391 | 690 |
Service Class R | 10,116 | 690 |
Service Class 2R | 13,470 | 800 |
Investor Class R | 595,300 | 10,341 |
Total | $ 1,106,887 | $ 24,458 |
A Distributions for Investor Class R are for the period July 21, 2005 (commencement of sale of shares) to December 31, 2005.
10. Share Transactions.
Transactions for each class of shares were as follows:
| Shares | Dollars |
| Years ended December 31, | Years ended December 31, |
| 2006 | 2005 A | 2006 | 2005 A |
Initial Class | | | | |
Shares sold | 551,473 | 921,874 | $ 6,530,542 | $ 9,755,347 |
Reinvestment of distributions | 7,645 | 2,426 | 91,887 | 27,620 |
Shares redeemed | (1,269,330) | (137,070) | (14,879,275) | (1,461,993) |
Net increase (decrease) | (710,212) | 787,230 | $ (8,256,846) | $ 8,320,974 |
Service Class | | | | |
Reinvestment of distributions | 1,019 | 96 | 12,654 | 1,051 |
Net increase (decrease) | 1,019 | 96 | $ 12,654 | $ 1,051 |
Service Class 2 | | | | |
Reinvestment of distributions | 1,300 | 75 | 16,125 | 800 |
Net increase (decrease) | 1,300 | 75 | $ 16,125 | $ 800 |
Initial Class R | | | | |
Shares sold | 1,743,214 | - | $ 20,660,149 | $ - |
Reinvestment of distributions | 40,625 | 122 | 508,527 | 1,351 |
Shares redeemed | (455,998) | - | (5,371,545) | - |
Net increase (decrease) | 1,327,841 | 122 | $ 15,797,131 | $ 1,351 |
Service Class R | | | | |
Reinvestment of distributions | 1,019 | 96 | 12,654 | 1,051 |
Net increase (decrease) | 1,019 | 96 | $ 12,654 | $ 1,051 |
Service Class 2R | | | | |
Reinvestment of distributions | 1,300 | 75 | 16,125 | 800 |
Net increase (decrease) | 1,300 | 75 | $ 16,125 | $ 800 |
Investor Class R | | | | |
Shares sold | 1,447,148 | 854,371 | $ 17,211,509 | $ 9,182,604 |
Reinvestment of distributions | 62,199 | 2,444 | 773,075 | 27,842 |
Shares redeemed | (428,813) | (521) | (5,072,819) | (5,786) |
Net increase (decrease) | 1,080,534 | 856,294 | $ 12,911,765 | $ 9,204,660 |
A Share transactions for Investor Class R are for the period July 21, 2005 (commencement of sale of shares) to December 31, 2005.
VIP International Capital Appreciation Portfolio
Report of Independent Registered Public Accounting Firm
To the Trustees of Variable Insurance Products Fund IV and the Shareholders of VIP International Capital Appreciation Portfolio:
In our opinion, the accompanying statement of assets and liabilities, including the schedule of investments, and the related statements of operations and of changes in net assets and the financial highlights present fairly, in all material respects, the financial position of VIP International Capital Appreciation Portfolio (a fund of Variable Insurance Products Fund IV) at December 31, 2006, the results of its operations for the year then ended, the changes in its net assets for each of the two years in the period then ended and the financial highlights for each of the periods indicated, in conformity with accounting principles generally accepted in the United States of America. These financial statements and financial highlights (hereafter referred to as "financial statements") are the responsibility of the VIP International Capital Appreciation Portfolio's management; our responsibility is to express an opinion on these financial statements based on our audits. We conducted our audits of these financial statements in accordance with the standards of the Public Company Accounting Oversight Board (United States). Those standards require that we plan and perform the audit to obtain reasonable assurance about whether the financial statements are free of material misstatement. An audit includes examining, on a test basis, evidence supporting the amounts and disclosures in the financial statements, assessing the accounting principles used and significant estimates made by management, and evaluating the overall financial statement presentation. We believe that our audits, which included confirmation of securities at December 31, 2006 by correspondence with the custodian and brokers, provide a reasonable basis for our opinion.
/s/ PricewaterhouseCoopers LLP
PricewaterhouseCoopers LLP
Boston, Massachusetts
February 16, 2007
Annual Report
Trustees and Officers
The Trustees, Member of the Advisory Board, and executive officers of the trust and fund, as applicable, are listed below. The Board of Trustees governs the fund and is responsible for protecting the interests of shareholders. The Trustees are experienced executives who meet periodically throughout the year to oversee the fund's activities, review contractual arrangements with companies that provide services to the fund, and review the fund's performance. Each of the Trustees oversees 348 funds advised by FMR or an affiliate.
The Trustees hold office without limit in time except that (a) any Trustee may resign; (b) any Trustee may be removed by written instrument, signed by at least two-thirds of the number of Trustees prior to such removal; (c) any Trustee who requests to be retired or who has become incapacitated by illness or injury may be retired by written instrument signed by a majority of the other Trustees; and (d) any Trustee may be removed at any special meeting of shareholders by a two-thirds vote of the outstanding voting securities of the trust. Each Trustee who is not an interested person (as defined in the 1940 Act) (Independent Trustee), shall retire not later than the last day of the calendar year in which his or her 72nd birthday occurs. The Independent Trustees may waive this mandatory retirement age policy with respect to individual Trustees. The executive officers and Advisory Board Member hold office without limit in time, except that any officer and Advisory Board Member may resign or may be removed by a vote of a majority of the Trustees at any regular meeting or any special meeting of the Trustees. Except as indicated, each individual has held the office shown or other offices in the same company for the past five years.
The fund's Statement of Additional Information (SAI) includes more information about the Trustees. To request a free copy, call Fidelity at 1-877-208-0098.
Interested Trustees*:
Correspondence intended for each Trustee who is an interested person may be sent to Fidelity Investments, 82 Devonshire Street, Boston, Massachusetts 02109.
Name, Age; Principal Occupation |
Edward C. Johnson 3d (76) |
| Year of Election or Appointment: 1983 Mr. Johnson is Chairman of the Board of Trustees. Mr. Johnson serves as President (2006-present), Chief Executive Officer, Chairman, and a Director of FMR Corp.; Chairman and a Director of FMR; Chairman and a Director of Fidelity Research & Analysis Company (FRAC); Chairman and a Director of Fidelity Investments Money Management, Inc.; and Chairman (2001-present) and a Director of FMR Co., Inc. In addition, Mr. Johnson serves as Chairman and Director of Fidelity International Limited (FIL). |
Robert L. Reynolds (54) |
| Year of Election or Appointment: 2003 Mr. Reynolds is President and a Director of FMR (2005-present), Fidelity Investments Money Management, Inc. (2005-present), and FMR Co., Inc. (2005-present). Mr. Reynolds also serves as Vice Chairman (2006-present), a Director (2003-present), and Chief Operating Officer of FMR Corp. and a Director of Strategic Advisers, Inc. (2005-present). He also serves on the Board at Fidelity Investments Canada, Ltd. |
* Trustees have been determined to be "Interested Trustees" by virtue of, among other things, their affiliation with the trust or various entities under common control with FMR.
Independent Trustees:
Correspondence intended for each Independent Trustee (that is, the Trustees other than the Interested Trustees) may be sent to Fidelity Investments, P.O. Box 55235, Boston, Massachusetts 02205-5235.
Name, Age; Principal Occupation |
Dennis J. Dirks (58) |
| Year of Election or Appointment: 2005 Prior to his retirement in May 2003, Mr. Dirks was Chief Operating Officer and a member of the Board of The Depository Trust & Clearing Corporation (DTCC) (1999-2003). He also served as President, Chief Operating Officer, and Board member of The Depository Trust Company (DTC) (1999-2003) and President and Board member of the National Securities Clearing Corporation (NSCC) (1999-2003). In addition, Mr. Dirks served as Chief Executive Officer and Board member of the Government Securities Clearing Corporation (2001-2003) and Chief Executive Officer and Board member of the Mortgage-Backed Securities Clearing Corporation (2001-2003). Mr. Dirks also serves as a Trustee and a member of the Finance Committee of Manhattan College (2005-present) and a Trustee and a member of the Finance Committee of AHRC of Nassau County (2006-present). |
Albert R. Gamper, Jr. (64) |
| Year of Election or Appointment: 2006 Prior to his retirement in December 2004, Mr. Gamper served as Chairman of the Board of CIT Group Inc. (commercial finance). During his tenure with CIT Group Inc. Mr. Gamper served in numerous senior management positions, including Chairman (1987-1989; 1999-2001; 2002-2004), Chief Executive Officer (1987-2004), and President (1989-2002). He currently serves as a member of the Board of Directors of Public Service Enterprise Group (utilities, 2001-present), Chairman of the Board of Governors, Rutgers University (2004-present), and Chairman of the Board of Saint Barnabas Health Care System. |
George H. Heilmeier (70) |
| Year of Election or Appointment: 2004 Dr. Heilmeier is Chairman Emeritus of Telcordia Technologies (communication software and systems), where prior to his retirement, he served as company Chairman and Chief Executive Officer. He currently serves on the Boards of Directors of The Mitre Corporation (systems engineering and information technology support for the government), and HRL Laboratories (private research and development, 2004-present). He is Chairman of the General Motors Science & Technology Advisory Board and a Life Fellow of the Institute of Electrical and Electronics Engineers (IEEE). Dr. Heilmeier is a member of the Defense Science Board and the National Security Agency Advisory Board. He is also a member of the National Academy of Engineering, the American Academy of Arts and Sciences, and the Board of Overseers of the School of Engineering and Applied Science of the University of Pennsylvania. Previously, Dr. Heilmeier served as a Director of TRW Inc. (automotive, space, defense, and information technology, 1992-2002), Compaq (1994-2002), Automatic Data Processing, Inc. (ADP) (technology-based business outsourcing, 1995-2002), INET Technologies Inc. (telecommunications network surveillance, 2001-2004), and Teletech Holdings (customer management services). He is the recipient of the 2005 Kyoto Prize in Advanced Technology for his invention of the liquid crystal display, and a member of the Consumer Electronics Hall of Fame. |
James H. Keyes (66) |
| Year of Election or Appointment: 2007 Prior to his retirement in 2003, Mr. Keyes was Chairman, President, and Chief Executive Officer of Johnson Controls, Inc. (automotive supplier, 1993-2003). He currently serves as a member of the boards of LSI Logic Corporation (semiconductor technologies), Navistar International Corporation (manufacture and sale of trucks, buses, and diesel engines, 2002-present), and Pitney Bowes, Inc. (integrated mail, messaging, and document management solutions). |
Marie L. Knowles (60) |
| Year of Election or Appointment: 2001 Prior to Ms. Knowles' retirement in June 2000, she served as Executive Vice President and Chief Financial Officer of Atlantic Richfield Company (ARCO) (diversified energy, 1996-2000). From 1993 to 1996, she was a Senior Vice President of ARCO and President of ARCO Transportation Company. She served as a Director of ARCO from 1996 to 1998. She currently serves as a Director of Phelps Dodge Corporation (copper mining and manufacturing) and McKesson Corporation (healthcare service, 2002-present). Ms. Knowles is a Trustee of the Brookings Institution and the Catalina Island Conservancy and also serves as a member of the Advisory Board for the School of Engineering of the University of Southern California. |
Ned C. Lautenbach (62) |
| Year of Election or Appointment: 2000 Mr. Lautenbach is Chairman of the Independent Trustees (2006-present). Mr. Lautenbach has been a partner of Clayton, Dubilier & Rice, Inc. (private equity investment firm) since September 1998. Previously, Mr. Lautenbach was with the International Business Machines Corporation (IBM) from 1968 until his retirement in 1998. Mr. Lautenbach serves as a Director of Sony Corporation (2006-present) and Eaton Corporation (diversified industrial) as well as the Philharmonic Center for the Arts in Naples, Florida. He also is a member of the Board of Trustees of Fairfield University (2005-present), as well as a member of the Council on Foreign Relations. |
Cornelia M. Small (62) |
| Year of Election or Appointment: 2005 Ms. Small is a member (2000-present) and Chairperson (2002-present) of the Investment Committee, and a member (2002-
present) of the Board of Trustees of Smith College. Previously, she served as Chief Investment Officer (1999-2000), Director of Global Equity Investments (1996-1999), and a member of the Board of Directors of Scudder, Stevens & Clark (1990-1997) and Scudder Kemper Investments (1997-1999). In addition, Ms. Small served as Co-Chair (2000-2003) of the Annual Fund for the Fletcher School of Law and Diplomacy. |
William S. Stavropoulos (67) |
| Year of Election or Appointment: 2001 Mr. Stavropoulos is Chairman Emeritus of the Board of Directors of The Dow Chemical Company. Since joining The Dow Chemical Company in 1967, Mr. Stavropoulos served in numerous senior management positions, including President (1993-2000; 2002-2003), CEO (1995-2000; 2002-2004), and Chairman of the Executive Committee (2000-2004). Currently, he is a Director of NCR Corporation (data warehousing and technology solutions), BellSouth Corporation (telecommunications), Chemical Financial Corporation, Maersk Inc. (industrial conglomerate, 2002-present), and Metalmark Capital (private equity investment firm, 2005-present). He also serves as a member of the Board of Trustees of the American Enterprise Institute for Public Policy Research. In addition, Mr. Stavropoulos is a member of The Business Council, J.P. Morgan International Council and the University of Notre Dame Advisory Council for the College of Science. |
Kenneth L. Wolfe (67) |
| Year of Election or Appointment: 2005 Prior to his retirement in 2001, Mr. Wolfe was Chairman and Chief Executive Officer of Hershey Foods Corporation (1993-2001). He currently serves as a member of the boards of Adelphia Communications Corporation (2003-present), Bausch & Lomb, Inc., and Revlon Inc. (2004-present). |
Advisory Board Member and Executive Officers:
Correspondence intended for each executive officer and Mr. Lynch may be sent to Fidelity Investments, 82 Devonshire Street, Boston, Massachusetts 02109.
Name, Age; Principal Occupation |
Peter S. Lynch (62) |
| Year of Election or Appointment: 2003 Member of the Advisory Board of Variable Insurance Products Fund IV. Mr. Lynch is Vice Chairman and a Director of FMR, and Vice Chairman (2001-present) and a Director of FMR Co., Inc. Previously, Mr. Lynch served as a Trustee of the Fidelity funds (1990-2003). In addition, he serves as a Trustee of Boston College and as the Chairman of the Inner-City Scholarship Fund. |
Kimberley H. Monasterio (43) |
| Year of Election or Appointment: 2007 President and Treasurer of VIP International Capital Appreciation. Ms. Monasterio also serves as President and Treasurer of other Fidelity funds (2007-present) and is an employee of FMR (2004-present). Previously, Ms. Monasterio served as Deputy Treasurer of the Fidelity funds (2004-2006). Before joining Fidelity Investments, Ms. Monasterio served as Treasurer (2000-2004) and Chief Financial Officer (2002-2004) of the Franklin Templeton Funds and Senior Vice President of Franklin Templeton Services, LLC (2000-2004). |
Dwight D. Churchill (53) |
| Year of Election or Appointment: 2005 Vice President of VIP International Capital Appreciation. Mr. Churchill also serves as Vice President of certain Equity Funds (2005-present). Mr. Churchill is Executive Vice President of FMR (2005-present) and FMR Co., Inc. (2005-present). Previously, Mr. Churchill served as Senior Vice President of Fidelity Investments Money Management, Inc. (2005-2006), Head of Fidelity's Fixed-Income Division (2000-2005), Vice President of Fidelity's Money Market Funds (2000-2005), Vice President of Fidelity's Bond Funds, and Senior Vice President of FMR. |
Eric M. Wetlaufer (44) |
| Year of Election or Appointment: 2006 Vice President of VIP International Capital Appreciation. Mr. Wetlaufer also serves as Vice President of certain International Equity Funds (2006-present). Mr. Wetlaufer is Senior Vice President of FMR (2006-present) and FMR Co., Inc. (2006-present), and President and Director of Fidelity Management & Research (U.K.) Inc. (2006-present) and Fidelity Research & Analysis Company (2006-present). Before joining Fidelity Investments in 2005, Mr. Wetlaufer was a partner in Oxhead Capital Management (2004-2005). Previously, Mr. Wetlaufer served as a Chief Investment Officer of Putnam Investments (1997-2003). |
Darren Maupin (30) |
| Year of Election or Appointment: 2006 Vice President of VIP International Capital Appreciation. Mr. Maupin also serves as Vice President of other funds advised by FMR. Prior to assuming his current responsibilities, Mr. Maupin worked as a research analyst and a portfolio manager. Mr. Maupin also serves as a Vice President of FMR and FMR Co., Inc. (2006). |
Eric D. Roiter (58) |
| Year of Election or Appointment: 2004 Secretary of VIP International Capital Appreciation. He also serves as Secretary of other Fidelity funds; Vice President, General Counsel, and Secretary of FMR Co., Inc. (2001-present) and FMR; Assistant Secretary of Fidelity Management & Research (U.K.) Inc. (2001-present), Fidelity Research & Analysis Company (2001-present), and Fidelity Investments Money Management, Inc. (2001-present). Mr. Roiter is an Adjunct Member, Faculty of Law, at Boston College Law School (2003-present). Previously, Mr. Roiter served as Vice President and Secretary of Fidelity Distributors Corporation (FDC) (1998-2005). |
Stuart Fross (47) |
| Year of Election or Appointment: 2004 Assistant Secretary of VIP International Capital Appreciation. Mr. Fross also serves as Assistant Secretary of other Fidelity funds (2003-present), Vice President and Secretary of FDC (2005-present), and is an employee of FMR. |
R. Stephen Ganis (40) |
| Year of Election or Appointment: 2006 Anti-Money Laundering (AML) officer of VIP International Capital Appreciation. Mr. Ganis also serves as AML officer of other Fidelity funds (2006-present) and FMR Corp. (2003-present). Before joining Fidelity Investments, Mr. Ganis practiced law at Goodwin Procter, LLP (2000-2002). |
Joseph B. Hollis (58) |
| Year of Election or Appointment: 2006 Chief Financial Officer of VIP International Capital Appreciation. Mr. Hollis also serves as Chief Financial Officer of other Fidelity funds. Mr. Hollis is President of Fidelity Pricing and Cash Management Services (FPCMS) (2005-present). Mr. Hollis also serves as President and Director of Fidelity Service Company, Inc. (2006-present). Previously, Mr. Hollis served as Senior Vice President of Cash Management Services (1999-2002) and Investment Management Operations (2002-2005). |
Kenneth A. Rathgeber (59) |
| Year of Election or Appointment: 2004 Chief Compliance Officer of VIP International Capital Appreciation. Mr. Rathgeber also serves as Chief Compliance Officer of other Fidelity funds (2004-present) and Executive Vice President of Risk Oversight for Fidelity Investments (2002-present). He is Chief Compliance Officer of FMR (2005-present), FMR Co., Inc. (2005-present), Fidelity Management & Research (U.K.) Inc. (2005-present), Fidelity Research & Analysis Company (2005-present), Fidelity Investments Money Management, Inc. (2005-
present), and Strategic Advisers, Inc. (2005-present). Previously, Mr. Rathgeber served as Executive Vice President and Chief Operating Officer for Fidelity Investments Institutional Services Company, Inc. (1998-2002). |
Bryan A. Mehrmann (45) |
| Year of Election or Appointment: 2005 Deputy Treasurer of VIP International Capital Appreciation. Mr. Mehrmann also serves as Deputy Treasurer of other Fidelity funds (2005-present) and is an employee of FMR. Previously, Mr. Mehrmann served as Vice President of Fidelity Investments Institutional Services Group (FIIS)/Fidelity Investments Institutional Operations Corporation, Inc. (FIIOC) Client Services (1998-2004). |
Kenneth B. Robins (37) |
| Year of Election or Appointment: 2005 Deputy Treasurer of VIP International Capital Appreciation. Mr. Robins also serves as Deputy Treasurer of other Fidelity funds (2005-present) and is an employee of FMR (2004-present). Before joining Fidelity Investments, Mr. Robins worked at KPMG LLP, where he was a partner in KPMG's department of professional practice (2002-2004) and a Senior Manager (1999-2000). In addition, Mr. Robins served as Assistant Chief Accountant, United States Securities and Exchange Commission (2000-2002). |
Robert G. Byrnes (40) |
| Year of Election or Appointment: 2005 Assistant Treasurer of VIP International Capital Appreciation. Mr. Byrnes also serves as Assistant Treasurer of other Fidelity funds (2005-present) and is an employee of FMR (2005-present). Previously, Mr. Byrnes served as Vice President of FPCMS (2003-2005). Before joining Fidelity Investments, Mr. Byrnes worked at Deutsche Asset Management where he served as Vice President of the Investment Operations Group (2000-2003). |
John H. Costello (60) |
| Year of Election or Appointment: 2004 Assistant Treasurer of VIP International Capital Appreciation. Mr. Costello also serves as Assistant Treasurer of other Fidelity funds and is an employee of FMR. |
Peter L. Lydecker (52) |
| Year of Election or Appointment: 2004 Assistant Treasurer of VIP International Capital Appreciation. Mr. Lydecker also serves as Assistant Treasurer of other Fidelity funds (2004) and is an employee of FMR. |
Mark Osterheld (51) |
| Year of Election or Appointment: 2004 Assistant Treasurer of VIP International Capital Appreciation. Mr. Osterheld also serves as Assistant Treasurer of other Fidelity funds (2002) and is an employee of FMR. |
Gary W. Ryan (48) |
| Year of Election or Appointment: 2005 Assistant Treasurer of VIP International Capital Appreciation. Mr. Ryan also serves as Assistant Treasurer of other Fidelity funds (2005-present) and is an employee of FMR (2005-present). Previously, Mr. Ryan served as Vice President of Fund Reporting in FPCMS (1999-2005). |
Salvatore Schiavone (41) |
| Year of Election or Appointment: 2005 Assistant Treasurer of VIP International Capital Appreciation. Mr. Schiavone also serves as Assistant Treasurer of other Fidelity funds (2005-present) and is an employee of FMR (2005-present). Before joining Fidelity Investments, Mr. Schiavone worked at Deutsche Asset Management, where he most recently served as Assistant Treasurer (2003-2005) of the Scudder Funds and Vice President and Head of Fund Reporting (1996-2003). |
VIP International Capital Appreciation Portfolio
Distributions
The Board of Trustees of VIP International Capital Appreciation Portfolio voted to pay to shareholders of record at the opening of business on record date, the following distributions per share derived from capital gains realized from sales of portfolio securities:
| Pay Date | Record Date | Capital Gains |
Initial Class R | 02/09/07 | 02/09/07 | $0.125 |
Service Class R | 02/09/07 | 02/09/07 | $0.125 |
Service Class 2R | 02/09/07 | 02/09/07 | $0.125 |
Investor Class R | 02/09/07 | 02/09/07 | $0.125 |
The fund hereby designates as a capital gain dividend with respect to the taxable year ended December 31, 2006 $698,819, or, if subsequently determined to be different, the net capital gain of such year.
The amounts per share which represent income derived from sources within, and taxes paid to, foreign countries or possessions of the United States are as follows:
| Pay Date | Income | Taxes |
Initial Class R | 12/22/06 | $0.185 | $0.028 |
Service Class R | 12/22/06 | $0.176 | $0.028 |
Service Class 2R | 12/22/06 | $0.161 | $0.028 |
Investor Class R | 12/22/06 | $0.185 | $0.028 |
The fund will notify shareholders in January 2007 of amounts for use in preparing 2006 income tax returns.
Annual Report
Proxy Voting Results
A special meeting of the fund's shareholders was held on September 20, 2006. The results of votes taken among shareholders on the proposal before them are reported below. Each vote reported represents one dollar of net asset value held on the record date for the meeting.
PROPOSAL 1 |
To elect a Board of Trustees. A |
| # of
Votes | % of
Votes |
Dennis J. Dirks |
Affirmative | 92,459,317.52 | 96.102 |
Withheld | 3,749,837.05 | 3.898 |
TOTAL | 96,209,154.57 | 100.00 |
Albert R. Gamper, Jr. |
Affirmative | 92,260,598.99 | 95.896 |
Withheld | 3,948,555.58 | 4.104 |
TOTAL | 96,209,154.57 | 100.000 |
Robert M. Gates |
Affirmative | 92,315,480.72 | 95.953 |
Withheld | 3,893,673.85 | 4.047 |
TOTAL | 96,209,154.57 | 100.000 |
George H. Heilmeier |
Affirmative | 92,208,255.41 | 95.841 |
Withheld | 4,000,899.16 | 4.159 |
TOTAL | 96,209,154.57 | 100.000 |
Edward C. Johnson 3d |
Affirmative | 91,928,267.76 | 95.550 |
Withheld | 4,280,886.81 | 4.450 |
TOTAL | 96,209,154.57 | 100.000 |
Stephen P. Jonas |
Affirmative | 92,457,628.76 | 96.101 |
Withheld | 3,751,525.81 | 3.899 |
TOTAL | 96,209,154.57 | 100.000 |
James H. KeyesB |
Affirmative | 92,432,729.82 | 96.075 |
Withheld | 3,776,424.75 | 3.925 |
TOTAL | 96,209,154.57 | 100.000 |
Marie L. Knowles |
Affirmative | 92,398,847.52 | 96.040 |
Withheld | 3,810,307.05 | 3.960 |
TOTAL | 96,209,154.57 | 100.000 |
| # of
Votes | % of
Votes |
Ned C. Lautenbach |
Affirmative | 92,423,184.47 | 96.065 |
Withheld | 3,785,970.10 | 3.935 |
TOTAL | 96,209,154.57 | 100.000 |
William O. McCoy |
Affirmative | 92,086,293.90 | 95.715 |
Withheld | 4,122,860.67 | 4.285 |
TOTAL | 96,209,154.57 | 100.000 |
Robert L. Reynolds |
Affirmative | 92,439,032.86 | 96.081 |
Withheld | 3,770,121.71 | 3.919 |
TOTAL | 96,209,154.57 | 100.000 |
Cornelia M. Small |
Affirmative | 92,415,567.29 | 96.057 |
Withheld | 3,793,587.28 | 3.943 |
TOTAL | 96,209,154.57 | 100.000 |
William S. Stavropoulos |
Affirmative | 92,135,400.08 | 95.766 |
Withheld | 4,073,754.49 | 4.234 |
TOTAL | 96,209,154.57 | 100.000 |
Kenneth L. Wolfe |
Affirmative | 92,445,865.31 | 96.088 |
Withheld | 3,763,289.26 | 3.912 |
TOTAL | 96,209,154.57 | 100.000 |
A Denotes trust-wide proposal and voting results. B Effective on or about January 1, 2007. |
VIP International Capital Appreciation Portfolio
Board Approval of Investment Advisory Contracts and Management Fees
VIP International Capital Appreciation Portfolio
Each year, typically in July, the Board of Trustees, including the Independent Trustees (together, the Board), votes on the renewal of the management contract and sub-advisory agreements (together, the Advisory Contracts) for the fund. The Board, assisted by the advice of fund counsel and Independent Trustees' counsel, requests and considers a broad range of information throughout the year.
The Board meets regularly each month except August and takes into account throughout the year matters bearing on Advisory Contracts. The Board, acting directly and through its separate committees, considers at each of its meetings factors that are relevant to the annual renewal of the fund's Advisory Contracts, including the services and support provided to the fund and its shareholders. At the time of the renewal, the Board had 12 standing committees, each composed of Independent Trustees with varying backgrounds, to which the Board has assigned specific subject matter responsibilities in order to enhance effective decision-making by the Board. Each committee has adopted a written charter outlining the structure and purposes of the committee. One such committee, the Equity Contract Committee, meets periodically as needed throughout the year to consider matters specifically related to the annual renewal of Advisory Contracts. The committee requests and receives information on, and makes recommendations to the Independent Trustees concerning, the approval and annual review of the Advisory Contracts.
At its July 2006 meeting, the Board of Trustees, including the Independent Trustees, unanimously determined to renew the Advisory Contracts for the fund. In reaching its determination, the Board considered all factors it believed relevant, including (i) the nature, extent, and quality of the services to be provided to the fund and its shareholders (including the investment performance of the fund); (ii) the competitiveness of the management fee and total expenses of the fund; (iii) the total costs of the services to be provided by and the profits to be realized by the investment adviser and its affiliates from the relationship with the fund; (iv) the extent to which economies of scale would be realized as the fund grows; and (v) whether fee levels reflect these economies of scale, if any, for the benefit of fund shareholders.
In determining whether to renew the Advisory Contracts for the fund, the Board ultimately reached a determination, with the assistance of fund counsel and Independent Trustees' counsel, that the renewal of the Advisory Contracts and the compensation to be received by Fidelity under the management contract is consistent with Fidelity's fiduciary duty under applicable law. In addition to evaluating the specific factors noted above, the Board, in reaching its determination, is aware that shareholders in the fund have a broad range of investment choices available to them, including a wide choice among mutual funds offered by competitors to Fidelity, and that the fund's shareholders, with the opportunity to review and weigh the disclosure provided by the fund in its prospectus and other public disclosures, have chosen to invest in this fund, managed by Fidelity.
Nature, Extent, and Quality of Services Provided. The Board considered staffing within the investment adviser, FMR, and the sub-advisers (together, the Investment Advisers), including the backgrounds of the fund's portfolio managers and the fund's investment objective and discipline. The Independent Trustees also had discussions with senior management of Fidelity's investment operations and investment groups. The Board considered the structure of the portfolio manager compensation program and whether this structure provides appropriate incentives.
Resources Dedicated to Investment Management and Support Services. The Board reviewed the size, education, and experience of the Investment Advisers' investment staff, their use of technology, and the Investment Advisers' approach to recruiting, training, and retaining portfolio managers and other research, advisory, and management personnel. The Board considered Fidelity's extensive global research capabilities that enable the Investment Advisers to aggregate data from various sources in an effort to produce positive investment results. The Board noted that Fidelity's analysts have access to a variety of technological tools that enable them to perform both fundamental and quantitative analysis and to specialize in various disciplines. The Board also considered that Fidelity's portfolio managers and analysts have access to daily portfolio attribution that allows for monitoring of a fund's portfolio, as well as an electronic communication system that provides immediate real-time access to research concerning issuers and credit enhancers.
Shareholder and Administrative Services. The Board considered (i) the nature, extent, quality, and cost of administrative, distribution, and shareholder services performed by the Investment Advisers and their affiliates under the Advisory Contracts and under separate agreements covering transfer agency, pricing and bookkeeping, and securities lending services for the fund; (ii) the nature and extent of the Investment Advisers' supervision of third party service providers, principally custodians and subcustodians; and (iii) the resources devoted to, and the record of compliance with, the fund's compliance policies and procedures. The Board reviewed the allocation of fund brokerage, including allocations to brokers affiliated with the Investment Advisers, the use of brokerage commissions to pay fund expenses, and the use of "soft" commission dollars to pay for research services. The Board also considered that Fidelity voluntarily pays for market data out of its own resources.
The Board noted that the growth of fund assets across the complex allows Fidelity to reinvest in the development of services designed to enhance the value or convenience of the Fidelity funds as investment vehicles. These services include 24-hour access to account information and market information through phone representatives and over the Internet, and investor education materials and asset allocation tools.
Investment in a Large Fund Family. The Board considered the benefits to shareholders of investing in a Fidelity fund, including the benefits of investing in a fund that is part of a large family of funds offering a variety of investment disciplines and providing for a large variety of mutual fund investor services. The Board noted that, since the last Advisory Contract renewals in July 2005, Fidelity has taken a number of actions that benefited particular funds, including (i) dedicating additional resources to investment research and to restructure the investment research teams; (ii) voluntarily entering into contractual arrangements with certain brokers pursuant to which Fidelity pays for research products and services separately out of its own resources, rather than bundling with fund commissions; (iii) launching the Fidelity Advantage Class of its five Spartan stock index funds and three Spartan bond index funds, which is a lower-fee class available to shareholders with higher account balances; (iv) contractually agreeing to impose expense limitations on Fidelity U.S. Bond Index Fund and reducing the fund's initial investment minimum; and (v) offering shareholders of each of the Fidelity Institutional Money Market Funds the privilege of exchanging shares of the fund for shares of other Fidelity funds.
Annual Report
Board Approval of Investment Advisory Contracts and Management Fees - continued
Investment Performance and Compliance. The Board considered whether the fund has operated within its investment objective, as well as its record of compliance with its investment restrictions. It also reviewed the fund's absolute investment performance for each class (except Investor Class R), as well as the fund's relative investment performance for each class (except Investor Class R) measured against (i) a broad-based securities market index, and (ii) a peer group of mutual funds deemed appropriate by the Board. Because the fund had been in existence less than three calendar years, the following chart considered by the Board shows, for the one-year period ended December 31, 2005, the total returns of Service Class 2 and Initial Class of the fund, the total returns of a broad-based securities market index ("benchmark"), and a range of total returns of a peer group of mutual funds identified by Lipper Inc. as having an investment objective similar to that of the fund. The returns of Service Class 2 and Initial Class represent the performance of classes with the highest and lowest 12b-1 fees, respectively (not necessarily with the highest and lowest total expenses). (Investor Class R of the fund, which has no 12b-1 fee, had less than one year of performance as of December 31, 2005.) The box within the chart shows the 25th percentile return (bottom of box) and the 75th percentile return (top of box) of the Lipper peer group. Returns shown above the box are in the first quartile and returns shown below the box are in the fourth quartile. The percentage beaten numbers noted below the chart correspond to the percentile box and represent the percentage of funds in the Lipper peer group whose performance was equal to or lower than that of the class indicated.
VIP International Capital Appreciation Portfolio

The Board reviewed the fund's relative investment performance against its Lipper peer group and stated that the performance of Initial Class of the fund was in the third quartile for the period shown. The Board also stated that the relative investment performance of the fund was lower than its benchmark for the period shown. The Board considered that the variations in performance among the fund's classes reflect the variations in class expenses, which result in lower performance for higher expense classes. The Board stated that it is difficult to evaluate in any comprehensive fashion the performance of the fund, in light of its relatively recent launch. The Board also reviewed the fund's relative investment performance against a customized peer group based on a combination of categories defined by Morningstar.
The Board considered that FMR has taken steps to refocus and strengthen equity research, equity portfolio management, and compliance. The Board noted with favor FMR's reorganization of its senior management team in 2005 and FMR's dedication of additional resources to investment research, and participated in the process that led to those changes.
Based on its review, and giving particular weight to the nature and quality of the resources dedicated by the Investment Advisers to maintain and improve relative performance, the Board concluded that the nature, extent, and quality of the services provided to the fund will benefit the fund's shareholders, particularly in light of the Board's view that the fund's shareholders benefit from investing in a fund that is part of a large family of funds offering a variety of investment disciplines and services.
Competitiveness of Management Fee and Total Fund Expenses. The Board considered the fund's management fee and total expenses compared to "mapped groups" of competitive funds and classes. Fidelity creates "mapped groups" by combining similar Lipper investment objective categories that have comparable management fee characteristics. Combining Lipper investment objective categories aids the Board's management fee and total expense comparisons by broadening the competitive group used for comparison and by reducing the number of universes to which various Fidelity funds are compared.
VIP International Capital Appreciation Portfolio
The Board considered two proprietary management fee comparisons for the 12-month (or shorter) periods shown in the chart below. The group of Lipper funds used by the Board for management fee comparisons is referred to below as the "Total Mapped Group" and, for the reasons explained above, is broader than the Lipper peer group used by the Board for performance comparisons. The Total Mapped Group comparison focuses on a fund's standing relative to the total universe of comparable funds available to investors, in terms of gross management fees before expense reimbursements or caps. "TMG %" represents the percentage of funds in the Total Mapped Group that had management fees that were lower than the fund's. For example, a TMG % of 12% means that 88% of the funds in the Total Mapped Group had higher management fees than the fund. The "Asset-Size Peer Group" (ASPG) comparison focuses on a fund's standing relative to non-Fidelity funds similar in size to the fund within the Total Mapped Group. The ASPG represents at least 15% of the funds in the Total Mapped Group with comparable asset size and management fee characteristics, subject to a minimum of 50 funds (or all funds in the Total Mapped Group if fewer than 50). Additional information, such as the ASPG quartile in which the fund's management fee ranked, is also included in the chart and considered by the Board.
VIP International Capital Appreciation Portfolio

The Board noted that the fund's management fee ranked below the median of its Total Mapped Group and below the median of its ASPG for 2005.
Based on its review, the Board concluded that the fund's management fee was fair and reasonable in light of the services that the fund receives and the other factors considered.
In its review of each class's total expenses, the Board considered the fund's management fee as well as other fund or class expenses, as applicable, such as transfer agent fees, pricing and bookkeeping fees, fund-paid 12b-1 fees, and custodial, legal, and audit fees. The Board also noted the effects of any waivers and reimbursements on fees and expenses. As part of its review, the Board also considered current and historical total expenses of each class of the fund compared to competitive fund median expenses. Each class of the fund is compared to those funds and classes in the Total Mapped Group (used by the Board for management fee comparisons) that have a similar sales load structure.
The Board noted that the total expenses of each of Initial Class and Initial Class R ranked below its competitive median for 2005, and the total expenses of each of Investor Class R, Service Class, Service Class 2, Service Class R and Service Class 2 R ranked above its competitive median for 2005. The Board noted that the fund offers multiple classes, each of which has a different 12b-1 fee structure, and that the multiple structures are intended to offer a range of pricing options for the intermediary market. The Board also noted that the total expenses of the classes vary primarily by the level of their 12b-1 fees, although differences in transfer agent fees may also cause expenses to vary from class to class. The Board considered that Investor Class R was above median primarily due to its higher transfer agent fee.
In its review of total expenses, the Board also considered Fidelity fee structures and other information on clients that FMR and its affiliates service in other competitive markets, such as other mutual funds advised or subadvised by FMR or its affiliates, pension plan clients, and other institutional clients.
Annual Report
Board Approval of Investment Advisory Contracts and Management Fees - continued
Based on its review, the Board concluded that the total expenses of each class of the fund were reasonable, although in some cases above the median of the universe presented for comparison, in light of the services that the fund and its shareholders receive and the other factors considered.
Costs of the Services and Profitability. The Board considered the revenues earned and the expenses incurred by Fidelity in conducting the business of developing, marketing, distributing, managing, administering and servicing the fund and its shareholders. The Board also considered the level of Fidelity's profits in respect of all the Fidelity funds.
On an annual basis, FMR presents to the Board Fidelity's profitability for the fund. Fidelity calculates the profitability for each fund, as well as aggregate profitability for groups of Fidelity funds and all Fidelity funds, using a series of detailed revenue and cost allocation methodologies which originate with the audited books and records of Fidelity. The Audit Committee of the Board reviews any significant changes from the prior year's methodologies.
PricewaterhouseCoopers LLP (PwC), independent registered accounting firm and auditor to Fidelity and certain Fidelity funds, has been engaged annually by the Board as part of the Board's assessment of the results of Fidelity's profitability analysis. PwC's engagement includes the review and assessment of Fidelity's methodologies used in determining the revenues and expenses attributable to Fidelity's mutual fund business, and completion of agreed-upon procedures surrounding the mathematical accuracy of fund profitability and its conformity to allocation methodologies. After considering PwC's reports issued under the engagement and information provided by Fidelity, the Board believes that while other allocation methods may also be reasonable, Fidelity's profitability methodologies are reasonable in all material respects.
The Board has also reviewed Fidelity's non-fund businesses and any fall-out benefits related to the mutual fund business as well as cases where Fidelity's affiliates may benefit from or be related to the fund's business.
The Board considered the costs of the services provided by and the profits realized by Fidelity in connection with the operation of the fund and determined that the amount of profit is a fair entrepreneurial profit for the management of the fund.
Economies of Scale. The Board considered whether there have been economies of scale in respect of the management of the Fidelity funds, whether the Fidelity funds (including the fund) have appropriately benefited from any such economies of scale, and whether there is potential for realization of any further economies of scale. The Board considered the extent to which the fund will benefit from economies of scale through increased services to the fund, through waivers or reimbursements, or through fee or expense reductions.
The Board recognized that the fund's management contract incorporates a "group fee" structure, which provides for lower fee rates as total fund assets under FMR's management increase, and for higher fee rates as total fund assets under FMR's management decrease. The Board considered that the group fee is designed to deliver the benefits of economies of scale to fund shareholders when total fund assets increase, even if assets of any particular fund are unchanged or have declined, because some portion of Fidelity's costs are attributable to services provided to all Fidelity funds, and all funds benefit if those costs can be allocated among more assets. The Board concluded that, given the group fee structure, fund shareholders will achieve a certain level of economies of scale as assets under FMR's management increase at the fund complex level, regardless of whether Fidelity achieves any such economies of scale.
The Board further concluded that any potential economies of scale are being shared between fund shareholders and Fidelity in an appropriate manner.
Additional Information Requested by the Board. In order to develop fully the factual basis for consideration of the Advisory Contracts, the Board requested additional information on several topics, including (i) Fidelity's fund profitability methodology and profitability trends within certain funds; (ii) portfolio manager compensation; (iii) the extent to which any economies of scale exist and are shared between the funds and Fidelity; (iv) the total expenses of certain funds and classes relative to competitors, including the extent to which the expenses of certain funds have been or could be capped; (v) fund performance trends; and (vi) Fidelity's fee structures, including use of performance fees.
Based on its evaluation of all of the conclusions noted above, and after considering all material factors, the Board ultimately concluded that the advisory fee structures are fair and reasonable, and that the fund's Advisory Contracts should be renewed.
VIP International Capital Appreciation Portfolio
Annual Report
VIP International Capital Appreciation Portfolio
Annual Report
Investment Adviser
Fidelity Management & Research Company
Boston, MA
Investment Sub-Advisers
FMR Co., Inc.
Fidelity Management & Research (U.K.) Inc.
Fidelity Research & Analysis Company
(formerly Fidelity Management & Research (Far East) Inc.)
Fidelity International Investment Advisors
Fidelity International Investment Advisors (U.K.) Limited
Fidelity Investments Japan Limited
General Distributor
Fidelity Distributors Corporation
Boston, MA
Transfer and Service Agents
Fidelity Investments Institutional Operations Company, Inc.
Boston, MA
Fidelity Service Company, Inc.
Boston, MA
Custodian
Brown Brothers Harriman & Co.
Boston, MA
VIPCAPR-ANN-0207
1.805787.102
Fidelity® Variable Insurance Products:
Investor Freedom Funds -
Income, 2005, 2010, 2015, 2020, 2025, 2030
Annual Report
December 31, 2006
(2_fidelity_logos) (Registered_Trademark)
Contents
To view a fund's proxy voting guidelines and proxy voting record for the 12-month period ended June 30, visit www.fidelity.com/proxyvotingresults or visit the Securities and Exchange Commission's (SEC) web site at www.sec.gov. You may also call 1-877-208-0098 to request a free copy of the proxy voting guidelines.
Fidelity Variable Insurance Products are separate account options which are purchased through a variable insurance contract.
Standard & Poor's, S&P and S&P 500 are registered service marks of The McGraw-Hill Companies, Inc. and have been licensed for use by Fidelity Distributors Corporation.
Other third party marks appearing herein are the property of their respective owners.
All other marks appearing herein are registered or unregistered trademarks or service marks of FMR Corp. or an affiliated company.
This report and the financial statements contained herein are submitted for the general information of the shareholders of the funds. This report is not authorized for distribution to prospective investors in the funds unless preceded or accompanied by an effective prospectus.
A fund files its complete schedule of portfolio holdings with the SEC for the first and third quarters of each fiscal year on Form N-Q. Forms N-Q are available on the SEC's web site at http://www.sec.gov. A fund's Forms N-Q may be reviewed and copied at the SEC's Public Reference Room in Washington, DC. Information regarding the operation of the SEC's Public Reference Room may be obtained by calling 1-800-SEC-0330. For a complete list of a fund's portfolio holdings, view the most recent quarterly holdings report, semiannual report, or annual report on Fidelity's web site at http://www.advisor.fidelity.com.
NOT FDIC INSURED · MAY LOSE VALUE · NO BANK GUARANTEE
Neither the fund nor Fidelity Distributors Corporation is a bank.
VIP Investor Freedom Portfolios
VIP Investor Freedom Portfolios
Management's Discussion of Fund Performance
Comments from Ren Cheng and Christopher Sharpe, Co-Portfolio Managers of VIP Investor Freedom Funds
It was a positive year for stocks around the globe and for investment-grade and high-yield bonds in the United States. International equity markets as a whole outpaced their U.S. counterparts for the 12 months ending December 31, 2006 - partly as a result of favorable currency exchanges that boosted returns for U.S. investors in foreign stocks. The Morgan Stanley Capital InternationalSM Europe, Australasia, Far East (MSCI® EAFE®) Index - a gauge of developed stock markets outside the United States and Canada - gained 26.53% during that time. This marked the fifth year in a row that the MSCI EAFE outperformed the Standard & Poor's 500SM Index, a popular barometer of the U.S. equity market, which returned 15.79% in 2006. In the domestic debt markets, high yield outperformed high quality. Junk bonds' lower sensitivity to interest rate movements and investors' thirst for higher yields drove the Merrill Lynch® U.S. High Yield Master II Constrained Index up 10.76%. Investment-grade bonds rallied in the second half of the year but performed less than half as well as their riskier counterparts, finishing with a 4.33% return as measured by the Lehman Brothers® Aggregate Bond Index.
During the past year, VIP Investor Freedom Funds' absolute returns were in line with what one might expect from a series of portfolios with different age-appropriate, asset-allocation risk levels. On a relative basis, all of the Funds slightly underperformed their composite benchmarks during the period. (For specific portfolio performance results, please refer to the performance section of this report.) The Funds underperformed mainly as a result of lagging returns in the domestic and international equities asset classes, both of which had generally strong absolute returns, but fell short of their corresponding benchmarks - - the Dow Jones Wilshire 5000 Composite IndexSM, which rose 15.77%, and the MSCI EAFE. Among the seven underlying U.S. equity funds in the lineup, only VIP Mid Cap Portfolio produced a return in excess of its benchmark, led higher by productive stock picking, especially in the capital goods segment. Inopportune security selection in VIP Overseas Portfolio - mainly in the financials sector - was responsible for our underperformance in the international equities asset class, and this underlying portfolio was a big drag on the overall equity return. In fixed-income, the returns for our underlying funds in the investment-grade, high-yield and short-term bond asset classes all performed roughly in line with their individual benchmarks.
Notes to shareholders:
- In order to better accommodate investors' increasing life expectancies and high inflation pressures due to rising health care and other costs, the "roll-down" into the VIP Investor Freedom Income Fund - previously expected to occur between five and 10 years after an investor's target retirement date - - has been extended to approximately 10 to 15 years after the target retirement date. This change will have the effect of increasing the equity exposure of the VIP Investor Freedom Funds with target dates closest to retirement - currently VIP Investor Freedom 2005 and 2010 - by up to five percentage points, allowing for the possibility of greater investment growth.
- Additionally, to help increase portfolio diversification and capitalize on investment opportunities presented by an increasingly global economy, the allocation to international equity funds was increased by up to five percentage points. The allocation to domestic equity funds was reduced by a corresponding amount.
- Lastly, the benchmark for the VIP Investor Freedom Funds' underlying high-yield bond fund changed to the Merrill Lynch U.S. High Yield Master II Constrained Index, effective July 1, 2006, concurrent with the scheduled rebalancing of the Funds' composite indexes. In Fidelity's view, the Constrained index - which replaces the Merrill Lynch U.S. High Yield Master II Index - represents a better measure of the high-yield market, as it limits issuer allocations to no more than 2% of the index and thus is more diversified than the previous benchmark and less likely to be disrupted by rapid market changes.
The views expressed above reflect those of the portfolio manager(s) only through the end of the period as stated on the cover of this report and do not necessarily represent the views of Fidelity or any other person in the Fidelity organization. Any such views are subject to change at any time based upon market or other conditions and Fidelity disclaims any responsibility to update such views. These views may not be relied on as investment advice and, because investment decisions for a Fidelity fund are based on numerous factors, may not be relied on as an indication of trading intent on behalf of any Fidelity fund.
Annual Report
VIP Investor Freedom Income Portfolio
Performance: The Bottom Line
Average annual total return reflects the change in the value of an investment, assuming reinvestment of the class' dividend income and capital gains (the profits earned upon the sale of securities that have grown in value) and assuming a constant rate of performance each year. During periods of reimbursement by Fidelity, a fund's total return will be greater than it would be had the reimbursement not occurred. Performance numbers are net of all underlying fund operating expenses, but do not include any insurance charges imposed by your insurance company's separate account. If performance information included the effect of these additional charges, the total returns would have been lower. How a fund did yesterday is no guarantee of how it will do tomorrow.
Average Annual Total Returns
Periods ended December 31, 2006 | | Past 1
year | Life of fund A |
VIP Investor Freedom Income | | 6.83% | 5.83% |
A From August 3, 2005.
$10,000 Over Life of Fund
Let's say hypothetically that $10,000 was invested in VIP Investor Freedom Income Portfolio on August 3, 2005, when the fund started. The chart shows how the value of your investment would have changed, and also shows how the Lehman Brothers Aggregate Bond Index performed over the same period.
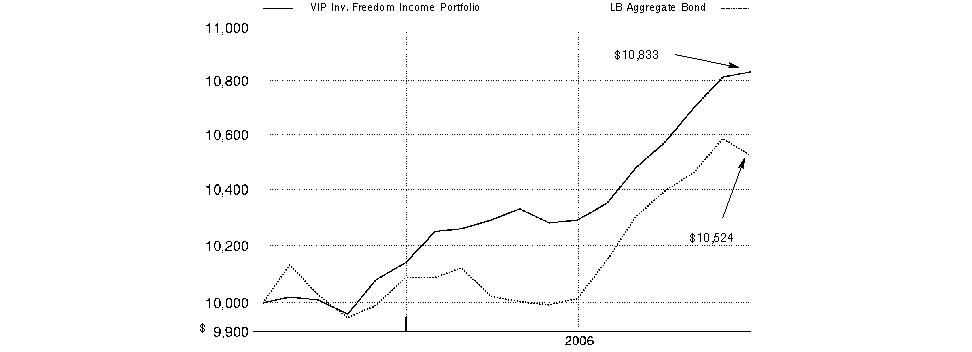
VIP Investor Freedom Portfolios
VIP Investor Freedom 2005 Portfolio
Performance: The Bottom Line
Average annual total return reflects the change in the value of an investment, assuming reinvestment of the class' dividend income and capital gains (the profits earned upon the sale of securities that have grown in value) and assuming a constant rate of performance each year. During periods of reimbursement by Fidelity, a fund's total return will be greater than it would be had the reimbursement not occurred. Performance numbers are net of all underlying fund operating expenses, but do not include any insurance charges imposed by your insurance company's separate account. If performance information included the effect of these additional charges, the total returns would have been lower. How a fund did yesterday is no guarantee of how it will do tomorrow.
Average Annual Total Returns
Periods ended December 31, 2006 | | Past 1
year | Life of fund A |
VIP Investor Freedom 2005 | | 9.72% | 8.60% |
A From August 3, 2005.
$10,000 Over Life of Fund
Let's say hypothetically that $10,000 was invested in VIP Investor Freedom 2005 Portfolio on August 3, 2005, when the fund started. The chart shows how the value of your investment would have changed, and also shows how the Lehman Brothers Aggregate Bond Index performed over the same period.

Annual Report
VIP Investor Freedom 2010 Portfolio
Performance: The Bottom Line
Average annual total return reflects the change in the value of an investment, assuming reinvestment of the class' dividend income and capital gains (the profits earned upon the sale of securities that have grown in value) and assuming a constant rate of performance each year. During periods of reimbursement by Fidelity, a fund's total return will be greater than it would be had the reimbursement not occurred. Performance numbers are net of all underlying fund operating expenses, but do not include any insurance charges imposed by your insurance company's separate account. If performance information included the effect of these additional charges, the total returns would have been lower. How a fund did yesterday is no guarantee of how it will do tomorrow.
Average Annual Total Returns
Periods ended December 31, 2006 | | Past 1
year | Life of fund A |
VIP Investor Freedom 2010 | | 9.49% | 8.59% |
A From August 3, 2005.
$10,000 Over Life of Fund
Let's say hypothetically that $10,000 was invested in VIP Investor Freedom 2010 Portfolio on August 3, 2005, when the fund started. The chart shows how the value of your investment would have changed, and also shows how the Lehman Brothers Aggregate Bond Index performed over the same period.
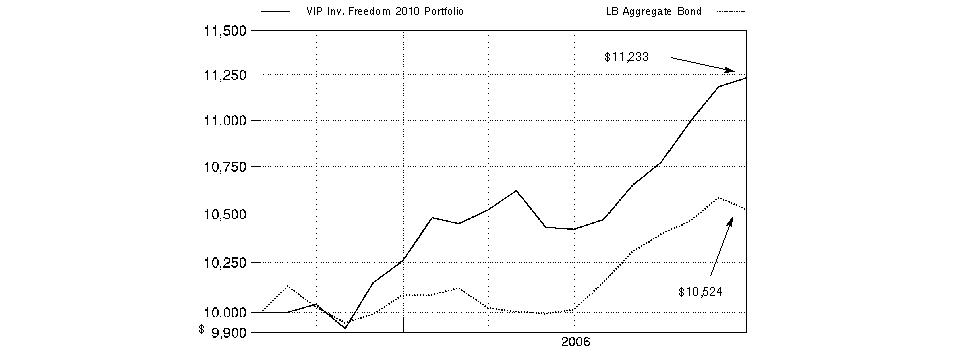
VIP Investor Freedom Portfolios
VIP Investor Freedom 2015 Portfolio
Performance: The Bottom Line
Average annual total return reflects the change in the value of an investment, assuming reinvestment of the class' dividend income and capital gains (the profits earned upon the sale of securities that have grown in value) and assuming a constant rate of performance each year. During periods of reimbursement by Fidelity, a fund's total return will be greater than it would be had the reimbursement not occurred. Performance numbers are net of all underlying fund operating expenses, but do not include any insurance charges imposed by your insurance company's separate account. If performance information included the effect of these additional charges, the total returns would have been lower. How a fund did yesterday is no guarantee of how it will do tomorrow.
Average Annual Total Returns
Periods ended December 31, 2006 | | Past 1
year | Life of fund A |
VIP Investor Freedom 2015 | | 10.89% | 10.03% |
A From August 3, 2005.
$10,000 Over Life of Fund
Let's say hypothetically that $10,000 was invested in VIP Investor Freedom 2015 Portfolio on August 3, 2005, when the fund started. The chart shows how the value of your investment would have changed, and also shows how the Standard & Poor's 500 Index performed over the same period.
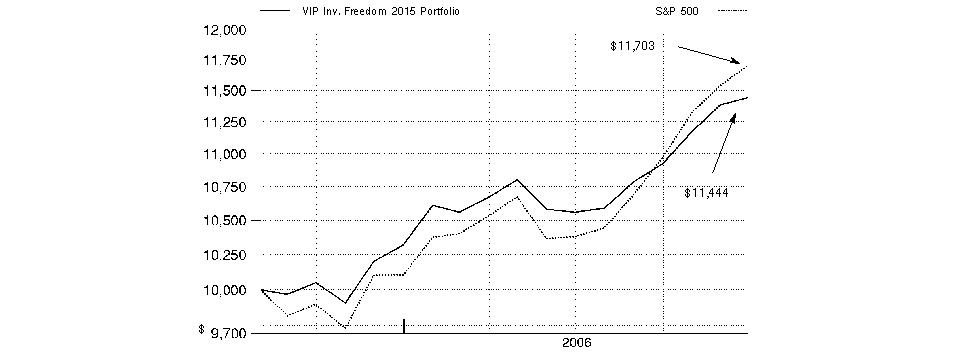
Annual Report
VIP Investor Freedom 2020 Portfolio
Performance: The Bottom Line
Average annual total return reflects the change in the value of an investment, assuming reinvestment of the class' dividend income and capital gains (the profits earned upon the sale of securities that have grown in value) and assuming a constant rate of performance each year. During periods of reimbursement by Fidelity, a fund's total return will be greater than it would be had the reimbursement not occurred. Performance numbers are net of all underlying fund operating expenses, but do not include any insurance charges imposed by your insurance company's separate account. If performance information included the effect of these additional charges, the total returns would have been lower. How a fund did yesterday is no guarantee of how it will do tomorrow.
Average Annual Total Returns
Periods ended December 31, 2006 | | Past 1
year | Life of fund A |
VIP Investor Freedom 2020 | | 11.82% | 10.99% |
A From August 3, 2005.
$10,000 Over Life of Fund
Let's say hypothetically that $10,000 was invested in VIP Investor Freedom 2020 Portfolio on August 3, 2005, when the fund started. The chart shows how the value of your investment would have changed, and also shows how the Standard & Poor's 500 Index performed over the same period.
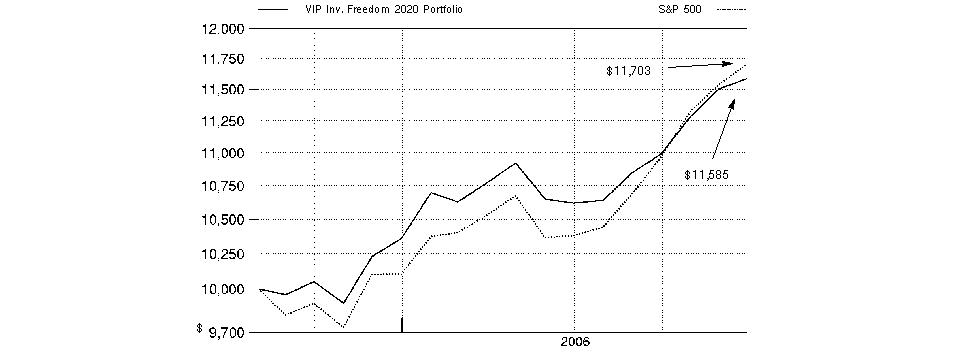
VIP Investor Freedom Portfolios
VIP Investor Freedom 2025 Portfolio
Performance: The Bottom Line
Average annual total return reflects the change in the value of an investment, assuming reinvestment of the class' dividend income and capital gains (the profits earned upon the sale of securities that have grown in value) and assuming a constant rate of performance each year. During periods of reimbursement by Fidelity, a fund's total return will be greater than it would be had the reimbursement not occurred. Performance numbers are net of all underlying fund operating expenses, but do not include any insurance charges imposed by your insurance company's separate account. If performance information included the effect of these additional charges, the total returns would have been lower. How a fund did yesterday is no guarantee of how it will do tomorrow.
Average Annual Total Returns
Periods ended December 31, 2006 | | Past 1
year | Life of fund A |
VIP Investor Freedom 2025 | | 12.26% | 11.53% |
A From August 3, 2005.
$10,000 Over Life of Fund
Let's say hypothetically that $10,000 was invested in VIP Investor Freedom 2025 Portfolio on August 3, 2005, when the fund started. The chart shows how the value of your investment would have changed, and also shows how the Standard & Poor's 500 Index performed over the same period.
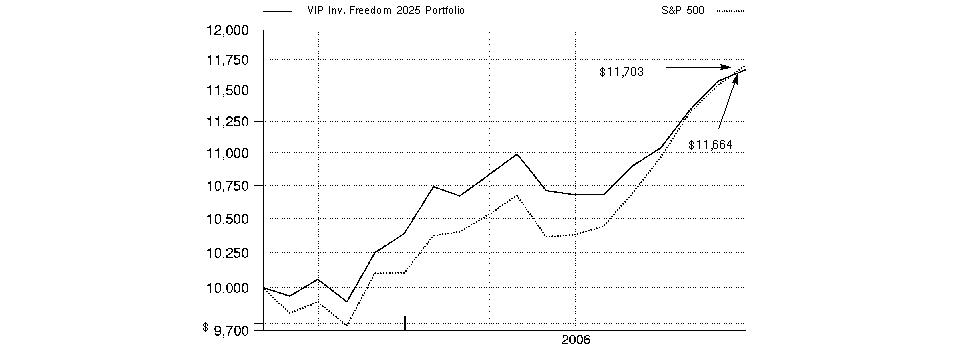
Annual Report
VIP Investor Freedom 2030 Portfolio
Performance: The Bottom Line
Average annual total return reflects the change in the value of an investment, assuming reinvestment of the class' dividend income and capital gains (the profits earned upon the sale of securities that have grown in value) and assuming a constant rate of performance each year. During periods of reimbursement by Fidelity, a fund's total return will be greater than it would be had the reimbursement not occurred. Performance numbers are net of all underlying fund operating expenses, but do not include any insurance charges imposed by your insurance company's separate account. If performance information included the effect of these additional charges, the total returns would have been lower. How a fund did yesterday is no guarantee of how it will do tomorrow.
Average Annual Total Returns
Periods ended December 31, 2006 | | Past 1
year | Life of fund A |
VIP Investor Freedom 2030 | | 13.12% | 12.36% |
A From August 3, 2005.
$10,000 Over Life of Fund
Let's say hypothetically that $10,000 was invested in VIP Investor Freedom 2030 Portfolio on August 3, 2005, when the fund started. The chart shows how the value of your investment would have changed, and also shows how the Standard & Poor's 500 Index performed over the same period.
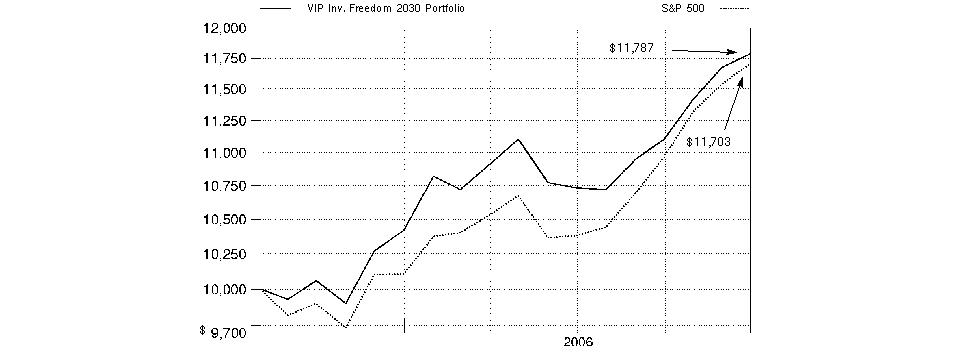
VIP Investor Freedom Portfolios
VIP Investor Freedom Portfolios
Shareholder Expense Example
As a shareholder of a Fund, you incur two types of costs: (1) transaction costs, and (2) ongoing costs, including other Fund expenses. This Example is intended to help you understand your ongoing costs (in dollars) of investing in the Funds and to compare these costs with the ongoing costs of investing in other mutual funds.
The Example is based on an investment of $1,000 invested at the beginning of the period and held for the entire period (July 1, 2006 to December 31, 2006).
Actual Expenses
The first line of the accompanying table for each fund provides information about actual account values and actual expenses. You may use the information in this line, together with the amount you invested, to estimate the expenses that you paid over the period. Simply divide your account value by $1,000.00 (for example, an $8,600 account value divided by $1,000.00 = 8.6), then multiply the result by the number in the first line for a fund under the heading entitled "Expenses Paid During Period" to estimate the expenses you paid on your account during this period. The estimate of expenses does not include any fees or other expenses of any variable annuity or variable life insurance product. If they were, the estimate of expenses you paid during the period would be higher, and your ending account value would be lower. In addition, each Fund, as a shareholder in underlying Fidelity Funds, will indirectly bear its pro rata share of the fees and expenses incurred by the underlying Fidelity Funds. These fees and expenses are not included in each Fund's annualized expense ratio used to calculate the expense estimates in the table below.
Hypothetical Example for Comparison Purposes
The second line of the accompanying table for each fund provides information about hypothetical account values and hypothetical expenses based on a fund's actual expense ratio and an assumed rate of return of 5% per year before expenses, which is not the Fund's actual return. The hypothetical account values and expenses may not be used to estimate the actual ending account balance or expenses you paid for the period. You may use this information to compare the ongoing costs of investing in the Fund and other funds. To do so, compare this 5% hypothetical example with the 5% hypothetical examples that appear in the shareholder reports of the other funds. The estimate of expenses does not include any fees or other expenses of any variable annuity or variable life insurance product. If they were, the estimate of expenses you paid during the period would be higher, and your ending account value would be lower. In addition, each Fund, as a shareholder in underlying Fidelity Funds, will indirectly bear its pro rata share of the fees and expenses incurred by the underlying Fidelity Funds. These fees and expenses are not included in each Fund's annualized expense ratio used to calculate the expense estimates in the table below.
Please note that the expenses shown in the table are meant to highlight your ongoing costs only and do not reflect any transaction costs. Therefore, the second line of the table is useful in comparing ongoing costs only, and will not help you determine the relative total costs of owning different funds.
| Beginning
Account Value
July 1, 2006 | Ending
Account Value
December 31, 2006 | Expenses Paid
During Period*
July 1, 2006
to December 31, 2006 |
VIP Investor Freedom Income | | | |
Actual | $ 1,000.00 | $ 1,052.70 | $ .00 |
HypotheticalA | $ 1,000.00 | $ 1,025.21 | $ .00 |
VIP Investor Freedom 2005 | | | |
Actual | $ 1,000.00 | $ 1,079.20 | $ .00 |
HypotheticalA | $ 1,000.00 | $ 1,025.21 | $ .00 |
VIP Investor Freedom 2010 | | | |
Actual | $ 1,000.00 | $ 1,078.00 | $ .00 |
HypotheticalA | $ 1,000.00 | $ 1,025.21 | $ .00 |
VIP Investor Freedom 2015 | | | |
Actual | $ 1,000.00 | $ 1,083.70 | $ .00 |
HypotheticalA | $ 1,000.00 | $ 1,025.21 | $ .00 |
VIP Investor Freedom 2020 | | | |
Actual | $ 1,000.00 | $ 1,090.80 | $ .00 |
HypotheticalA | $ 1,000.00 | $ 1,025.21 | $ .00 |
VIP Investor Freedom 2025 | | | |
Actual | $ 1,000.00 | $ 1,092.10 | $ .00 |
HypotheticalA | $ 1,000.00 | $ 1,025.21 | $ .00 |
VIP Investor Freedom 2030 | | | |
Actual | $ 1,000.00 | $ 1,098.40 | $ .00 |
HypotheticalA | $ 1,000.00 | $ 1,025.21 | $ .00 |
A 5% return per year before expenses
* Expenses are equal to each Fund's annualized expense ratio of .00%; multiplied by the average account value over the period, multiplied by 184/365 (to reflect the one-half year period). The fees and expenses of the underlying Fidelity Funds in which the Fund invests are not included in the Fund's annualized expense ratio.
Annual Report
VIP Investor Freedom Income Portfolio
Investment Changes
Fund Holdings as of December 31, 2006 |
| % of fund's
investments | % of fund's investments
6 months ago |
Domestic Equity Funds | | |
VIP Contrafund Portfolio
Investor Class | 3.2 | 3.1 |
VIP Equity-Income Portfolio Investor Class | 3.8 | 3.6 |
VIP Growth & Income Portfolio Investor Class | 3.8 | 3.6 |
VIP Growth Portfolio Investor Class | 3.7 | 3.5 |
VIP Mid Cap Portfolio Investor Class | 1.3 | 1.2 |
VIP Value Portfolio Investor Class | 3.2 | 3.0 |
VIP Value Strategies Portfolio Investor Class | 1.4 | 1.3 |
| 20.4 | 19.3 |
High Yield Fixed-Income Funds | | |
VIP High Income Portfolio
Investor Class | 5.1 | 5.0 |
Investment Grade Fixed-Income Funds | | |
VIP Investment Grade Bond Portfolio Investor Class | 34.6 | 35.2 |
Short-Term Funds | | |
VIP Money Market Portfolio Investor Class | 39.9 | 40.5 |
| 100.0 | 100.0 |
Asset Allocation (% of fund's investments) |
Current |
| Domestic Equity Funds | 20.4% | |
| Investment Grade Fixed-Income Funds | 34.6% | |
| High Yield Fixed-Income Funds | 5.1% | |
| Short-Term Funds | 39.9% | |

Six months ago |
| Domestic Equity Funds | 19.3% | |
| Investment Grade Fixed-Income Funds | 35.2% | |
| High Yield Fixed-Income Funds | 5.0% | |
| Short-Term Funds | 40.5% | |

The six months ago allocation is based on the fund's holdings as of June 30, 2006. The current allocation is based on the fund's holdings as of December 31, 2006. |
VIP Investor Freedom Portfolios
VIP Investor Freedom Income Portfolio
Investments December 31, 2006
Showing Percentage of Total Value of Investment in Securities
Equity Funds - 20.4% |
| Shares | | Value (Note 1) |
Domestic Equity Funds - 20.4% |
VIP Contrafund Portfolio Investor Class | 11,471 | | $ 360,294 |
VIP Equity-Income Portfolio Investor Class | 16,233 | | 424,482 |
VIP Growth & Income Portfolio
Investor Class | 26,140 | | 420,076 |
VIP Growth Portfolio Investor Class | 11,487 | | 410,991 |
VIP Mid Cap Portfolio Investor Class | 4,351 | | 150,923 |
VIP Value Portfolio Investor Class | 25,270 | | 360,356 |
VIP Value Strategies Portfolio
Investor Class | 11,365 | | 152,630 |
TOTAL EQUITY FUNDS (Cost $2,142,314) | 2,279,752 |
Fixed-Income Funds - 39.7% |
| | | |
High Yield Fixed-Income Funds - 5.1% |
VIP High Income Portfolio Investor Class | 89,212 | | 565,604 |
Investment Grade Fixed-Income Funds - 34.6% |
VIP Investment Grade Bond Portfolio Investor Class | 303,623 | | 3,868,149 |
TOTAL FIXED-INCOME FUNDS (Cost $4,319,285) | 4,433,753 |
Short-Term Funds - 39.9% |
| | | |
VIP Money Market Portfolio
Investor Class
(Cost $4,462,131) | 4,462,131 | | 4,462,131 |
TOTAL INVESTMENT IN SECURITIES - 100% (Cost $10,923,730) | $ 11,175,636 |
See accompanying notes which are an integral part of the financial statements.
Annual Report
VIP Investor Freedom Income Portfolio
Financial Statements
Statement of Assets and Liabilities
| December 31, 2006 |
| | |
Assets | | |
Investment in securities, at value
(cost $10,923,730) - See accompanying schedule | | $ 11,175,636 |
Cash | | 25 |
Dividends receivable | | 1,231 |
Total assets | | 11,176,892 |
| | |
Net Assets | | $ 11,176,892 |
Net Assets consist of: | | |
Paid in capital | | $ 10,610,379 |
Undistributed net investment income | | 257,810 |
Accumulated undistributed net realized gain (loss) on investments | | 56,797 |
Net unrealized appreciation (depreciation) on investments | | 251,906 |
Net Assets, for 1,036,988 shares outstanding | | $ 11,176,892 |
Net Asset Value, offering price and redemption price per share ($11,176,892 ÷ 1,036,988 shares) | | $ 10.78 |
Statement of Operations
| Year ended December 31, 2006 |
| | |
Investment Income | | |
Income distributions from underlying funds | | $ 258,208 |
| | |
Expenses | | |
Independent trustees' compensation | $ 25 | |
Total expenses before reductions | 25 | |
Expense reductions | (25) | 0 |
Net investment income (loss) | | 258,208 |
Realized and Unrealized Gain (Loss) Realized gain (loss) on sale of underlying fund shares | (28,167) | |
Capital gain distributions from underlying funds | 84,993 | 56,826 |
Change in net unrealized appreciation (depreciation) on underlying funds | | 232,797 |
Net gain (loss) | | 289,623 |
Net increase (decrease) in net assets resulting from operations | | $ 547,831 |
See accompanying notes which are an integral part of the financial statements.
VIP Investor Freedom Portfolios
Statement of Changes in Net Assets
| Year ended
December 31,
2006 | For the period
August 3, 2005 (commencement
of operations) to
December 31, 2005 |
Increase (Decrease) in Net Assets | | |
Operations | | |
Net investment income (loss) | $ 258,208 | $ 17,826 |
Net realized gain (loss) | 56,826 | (29) |
Change in net unrealized appreciation (depreciation) | 232,797 | 19,109 |
Net increase (decrease) in net assets resulting from operations | 547,831 | 36,906 |
Distributions to shareholders from net investment income | (18,224) | - |
Share transactions
Proceeds from sales of shares | 10,394,809 | 2,914,583 |
Reinvestment of distributions | 18,224 | - |
Cost of shares redeemed | (2,701,539) | (15,698) |
Net increase (decrease) in net assets resulting from share transactions | 7,711,494 | 2,898,885 |
Total increase (decrease) in net assets | 8,241,101 | 2,935,791 |
| | |
Net Assets | | |
Beginning of period | 2,935,791 | - |
End of period (including undistributed net investment income of $257,810 and undistributed net investment income of $17,826, respectively) | $ 11,176,892 | $ 2,935,791 |
Other Information Shares | | |
Sold | 1,005,357 | 291,011 |
Issued in reinvestment of distributions | 1,794 | - |
Redeemed | (259,623) | (1,551) |
Net increase (decrease) | 747,528 | 289,460 |
Financial Highlights
Years ended December 31, | 2006 | 2005 H |
Selected Per-Share Data | | |
Net asset value, beginning of period | $ 10.14 | $ 10.00 |
Income from Investment Operations | | |
Net investment income (loss) E | .35 | .16 |
Net realized and unrealized gain (loss) | .34 | (.02) G |
Total from investment operations | .69 | .14 |
Distributions from net investment income | (.05) | - |
Net asset value, end of period | $ 10.78 | $ 10.14 |
Total Return B, C, D | 6.83% | 1.40% |
Ratios to Average Net Assets F, I | | |
Expenses before reductions | .00% | .00% A |
Expenses net of fee waivers, if any | .00% | .00% A |
Expenses net of all reductions | .00% | .00% A |
Net investment income (loss) | 3.39% | 4.04% A |
Supplemental Data | | |
Net assets, end of period (000 omitted) | $ 11,177 | $ 2,936 |
Portfolio turnover rate | 40% | 1% |
A Annualized
B Total returns for periods of less than one year are not annualized.
C Total returns do not reflect charges attributable to your insurance company's separate account. Inclusion of these charges would reduce the total returns shown.
D Total returns would have been lower had certain expenses not been reduced during the periods shown.
E Calculated based on average shares outstanding during the period.
F Amounts do not include the activity of the underlying funds.
G The amount shown for a share outstanding does not correspond with the aggregate net gain (loss) on investments for the period due to the timing of sales and repurchases of shares in relation to fluctuating market values of the investments of the Fund.
H For the period August 3, 2005 (commencement of operations) to December 31, 2005.
I Expense ratios reflect operating expenses of the Fund. Expenses before reductions do not reflect amounts reimbursed by the investment adviser or expense offset arrangements and do not represent the amount paid by the Fund during periods when reimbursements or reductions occur. Expense ratios before reductions for start-up periods may not be representative of longer term operating periods. Expenses net of fee waivers reflect expenses after reimbursement by the investment adviser but prior to reductions from expense offset arrangements. Expenses net of all reductions represent the net expenses paid by the Fund but do not include expenses of the investment companies in which the Fund invests.
See accompanying notes which are an integral part of the financial statements.
Annual Report
VIP Investor Freedom 2005 Portfolio
Investment Changes
Fund Holdings as of December 31, 2006 |
| % of fund's
investments | % of fund's investments
6 months ago |
Domestic Equity Funds | | |
VIP Contrafund Portfolio
Investor Class | 6.3 | 6.2 |
VIP Equity-Income Portfolio Investor Class | 7.4 | 7.2 |
VIP Growth & Income Portfolio Investor Class | 7.4 | 7.2 |
VIP Growth Portfolio Investor Class | 7.2 | 7.2 |
VIP Mid Cap Portfolio
Investor Class | 2.6 | 2.5 |
VIP Value Portfolio Investor Class | 6.3 | 6.2 |
VIP Value Strategies Portfolio Investor Class | 2.7 | 2.6 |
| 39.9 | 39.1 |
International Equity Funds | | |
VIP Overseas Portfolio
Investor Class R | 10.0 | 6.4 |
High Yield Fixed-Income Funds | | |
VIP High Income Portfolio
Investor Class | 5.1 | 5.1 |
Investment Grade Fixed-Income Funds | | |
VIP Investment Grade Bond Portfolio Investor Class | 34.0 | 37.4 |
Short-Term Funds | | |
VIP Money Market Portfolio Investor Class | 11.0 | 12.0 |
| 100.0 | 100.0 |
Asset Allocation (% of fund's investments) |
Current |
| Domestic Equity Funds | 39.9% | |
| International Equity Funds | 10.0% | |
| Investment Grade Fixed-Income Funds | 34.0% | |
| High Yield Fixed-Income Funds | 5.1% | |
| Short-Term Funds | 11.0% | |

Six months ago |
| Domestic Equity Funds | 39.1% | |
| International Equity Funds | 6.4% | |
| Investment Grade Fixed-Income Funds | 37.4% | |
| High Yield Fixed-Income Funds | 5.1% | |
| Short-Term Funds | 12.0% | |

Expected |
 | Domestic Equity Funds | 39.4% | |
| International Equity Funds | 9.4% | |
| Investment Grade Fixed-Income Funds | 34.4% | |
| High Yield Fixed-Income Funds | 5.0% | |
| Short-Term Funds | 11.8% | |

The current allocation is based on the fund's holdings as of December 31, 2006. The expected allocation represents the fund's anticipated allocation at June 30, 2007. In March 2006, the target date for combining the fund with the VIP Investor Freedom Income Fund was extended by approximately five years resulting in a greater allocation to equity funds. Also, beginning in March 2006, the fund increased its allocation to international equity. The six months ago allocation is based on the fund's holdings as of June 30, 2006. |
VIP Investor Freedom Portfolios
VIP Investor Freedom 2005 Portfolio
Investments December 31, 2006
Showing Percentage of Total Value of Investment in Securities
Equity Funds - 49.9% |
| Shares | | Value (Note 1) |
Domestic Equity Funds - 39.9% |
VIP Contrafund Portfolio Investor Class | 9,751 | | $ 306,287 |
VIP Equity-Income Portfolio Investor Class | 13,796 | | 360,766 |
VIP Growth & Income Portfolio
Investor Class | 22,223 | | 357,130 |
VIP Growth Portfolio Investor Class | 9,774 | | 349,715 |
VIP Mid Cap Portfolio Investor Class | 3,697 | | 128,243 |
VIP Value Portfolio Investor Class | 21,484 | | 306,363 |
VIP Value Strategies Portfolio
Investor Class | 9,656 | | 129,676 |
TOTAL DOMESTIC EQUITY FUNDS | | 1,938,180 |
International Equity Funds - 10.0% |
VIP Overseas Portfolio Investor Class R | 20,247 | | 484,101 |
TOTAL EQUITY FUNDS (Cost $2,228,069) | 2,422,281 |
Fixed-Income Funds - 39.1% |
| | | |
High Yield Fixed-Income Funds - 5.1% |
VIP High Income Portfolio Investor Class | 38,567 | | 244,517 |
Investment Grade Fixed-Income Funds - 34.0% |
VIP Investment Grade Bond Portfolio Investor Class | 129,487 | | 1,649,669 |
TOTAL FIXED-INCOME FUNDS (Cost $1,835,186) | 1,894,186 |
Short-Term Funds - 11.0% |
| | | |
VIP Money Market Portfolio
Investor Class
(Cost $533,870) | 533,870 | | 533,870 |
TOTAL INVESTMENT IN SECURITIES - 100% (Cost $4,597,125) | $ 4,850,337 |
See accompanying notes which are an integral part of the financial statements.
Annual Report
VIP Investor Freedom 2005 Portfolio
Financial Statements
Statement of Assets and Liabilities
| December 31, 2006 |
| | |
Assets | | |
Investment in securities, at value
(cost $4,597,125) - See accompanying schedule | | $ 4,850,337 |
Cash | | 22 |
Dividends receivable | | 144 |
Total assets | | 4,850,503 |
| | |
Net Assets | | $ 4,850,503 |
Net Assets consist of: | | |
Paid in capital | | $ 4,460,507 |
Undistributed net investment income | | 80,117 |
Accumulated undistributed net realized gain (loss) on investments | | 56,667 |
Net unrealized appreciation (depreciation) on investments | | 253,212 |
Net Assets, for 434,237 shares outstanding | | $ 4,850,503 |
Net Asset Value, offering price and redemption price per share ($4,850,503 ÷ 434,237 shares) | | $ 11.17 |
Statement of Operations
| Year ended December 31, 2006 |
| | |
Investment Income | | |
Income distributions from underlying funds | | $ 81,825 |
Interest | | 23 |
Total income | | 81,848 |
| | |
Expenses | | |
Independent trustees' compensation | $ 11 | |
Total expenses before reductions | 11 | |
Expense reductions | (11) | 0 |
Net investment income (loss) | | 81,848 |
Realized and Unrealized Gain (Loss) Realized gain (loss) on sale of underlying fund shares | (18,456) | |
Capital gain distributions from underlying funds | 76,859 | 58,403 |
Change in net unrealized appreciation (depreciation) on underlying funds | | 213,905 |
Net gain (loss) | | 272,308 |
Net increase (decrease) in net assets resulting from operations | | $ 354,156 |
VIP Investor Freedom Portfolios
See accompanying notes which are an integral part of the financial statements.
Statement of Changes in Net Assets
| Year ended
December 31,
2006 | For the period
August 3, 2005 (commencement
of operations) to
December 31, 2005 |
Increase (Decrease) in Net Assets | | |
Operations | | |
Net investment income (loss) | $ 81,848 | $ 9,490 |
Net realized gain (loss) | 58,403 | (1,736) |
Change in net unrealized appreciation (depreciation) | 213,905 | 39,307 |
Net increase (decrease) in net assets resulting from operations | 354,156 | 47,061 |
Distributions to shareholders from net investment income | (11,222) | - |
Share transactions
Proceeds from sales of shares | 3,971,659 | 2,399,461 |
Reinvestment of distributions | 11,222 | - |
Cost of shares redeemed | (1,494,728) | (427,106) |
Net increase (decrease) in net assets resulting from share transactions | 2,488,153 | 1,972,355 |
Total increase (decrease) in net assets | 2,831,087 | 2,019,416 |
| | |
Net Assets | | |
Beginning of period | 2,019,416 | - |
End of period (including undistributed net investment income of $80,117 and undistributed net investment income of $9,490, respectively) | $ 4,850,503 | $ 2,019,416 |
Other Information Shares | | |
Sold | 378,785 | 239,845 |
Issued in reinvestment of distributions | 1,090 | - |
Redeemed | (142,775) | (42,708) |
Net increase (decrease) | 237,100 | 197,137 |
Financial Highlights
Years ended December 31, | 2006 | 2005 G |
Selected Per-Share Data | | |
Net asset value, beginning of period | $ 10.24 | $ 10.00 |
Income from Investment Operations | | |
Net investment income (loss) E | .26 | .10 |
Net realized and unrealized gain (loss) | .73 | .14 |
Total from investment operations | .99 | .24 |
Distributions from net investment income | (.06) | - |
Net asset value, end of period | $ 11.17 | $ 10.24 |
Total Return B, C, D | 9.72% | 2.40% |
Ratios to Average Net Assets F, H | | |
Expenses before reductions | .00% | .00% A |
Expenses net of fee waivers, if any | .00% | .00% A |
Expenses net of all reductions | .00% | .00% A |
Net investment income (loss) | 2.47% | 2.45% A |
Supplemental Data | | |
Net assets, end of period (000 omitted) | $ 4,851 | $ 2,019 |
Portfolio turnover rate | 55% | 39% |
A Annualized
B Total returns for periods of less than one year are not annualized.
C Total returns do not reflect charges attributable to your insurance company's separate account. Inclusion of these charges would reduce the total returns shown.
D Total returns would have been lower had certain expenses not been reduced during the periods shown.
E Calculated based on average shares outstanding during the period.
F Amounts do not include the activity of the underlying funds.
G For the period August 3, 2005 (commencement of operations) to December 31, 2005.
H Expense ratios reflect operating expenses of the Fund. Expenses before reductions do not reflect amounts reimbursed by the investment adviser or expense offset arrangements and do not represent the amount paid by the Fund during periods when reimbursements or reductions occur. Expense ratios before reductions for start-up periods may not be representative of longer term operating periods. Expenses net of fee waivers reflect expenses after reimbursement by the investment adviser but prior to reductions from expense offset arrangements. Expenses net of all reductions represent the net expenses paid by the Fund but do not include expenses of the investment companies in which the Fund invests.
See accompanying notes which are an integral part of the financial statements.
Annual Report
VIP Investor Freedom 2010 Portfolio
Investment Changes
Fund Holdings as of December 31, 2006 |
| % of fund's investments | % of fund's investments 6 months ago |
Domestic Equity Funds | | |
VIP Contrafund Portfolio
Investor Class | 6.5 | 6.3 |
VIP Equity-Income Portfolio Investor Class | 7.6 | 7.4 |
VIP Growth & Income Portfolio Investor Class | 7.5 | 7.3 |
VIP Growth Portfolio Investor Class | 7.4 | 7.2 |
VIP Mid Cap Portfolio
Investor Class | 2.7 | 2.5 |
VIP Value Portfolio Investor Class | 6.4 | 6.3 |
VIP Value Strategies Portfolio Investor Class | 2.7 | 2.6 |
| 40.8 | 39.6 |
International Equity Funds | | |
VIP Overseas Portfolio
Investor Class R | 10.4 | 7.5 |
High Yield Fixed-Income Funds | | |
VIP High Income Portfolio
Investor Class | 5.1 | 5.1 |
Investment Grade Fixed-Income Funds | | |
VIP Investment Grade Bond Portfolio Investor Class | 34.1 | 37.9 |
Short-Term Funds | | |
VIP Money Market Portfolio Investor Class | 9.6 | 9.9 |
| 100.0 | 100.0 |
Asset Allocation (% of fund's investments) |
Current |
| Domestic Equity Funds | 40.8% | |
| International Equity Funds | 10.4% | |
| Investment Grade Fixed-Income Funds | 34.1% | |
| High Yield Fixed-Income Funds | 5.1% | |
| Short-Term Funds | 9.6% | |

Six months ago |
| Domestic Equity Funds | 39.6% | |
| International Equity Funds | 7.5% | |
| Investment Grade Fixed-Income Funds | 37.9% | |
| High Yield Fixed-Income Funds | 5.1% | |
| Short-Term Funds | 9.9% | |

Expected |
| Domestic Equity Funds | 40.2% | |
| International Equity Funds | 10.1% | |
| Investment Grade Fixed-Income Funds | 34.8% | |
| High Yield Fixed-Income Funds | 5.0% | |
| Short-Term Funds | 9.9% | |

The current allocation is based on the fund's holdings as of December 31, 2006. The expected allocation represents the fund's anticipated allocation at June 30, 2007. In March 2006, the target date for combining the fund with the VIP Investor Freedom Income Fund was extended by approximately five years resulting in a greater allocation to equity funds. Also, beginning in March 2006, the fund increased its allocation to international equity. The six months ago allocation is based on the fund's holdings as of June 30, 2006. |
VIP Investor Freedom Portfolios
VIP Investor Freedom 2010 Portfolio
Investments December 31, 2006
Showing Percentage of Total Value of Investment in Securities
Equity Funds - 51.2% |
| Shares | | Value (Note 1) |
Domestic Equity Funds - 40.8% |
VIP Contrafund Portfolio Investor Class | 64,554 | | $ 2,027,644 |
VIP Equity-Income Portfolio Investor Class | 91,243 | | 2,386,004 |
VIP Growth & Income Portfolio Investor Class | 147,057 | | 2,363,204 |
VIP Growth Portfolio Investor Class | 64,686 | | 2,314,452 |
VIP Mid Cap Portfolio Investor Class | 24,441 | | 847,867 |
VIP Value Portfolio Investor Class | 142,139 | | 2,026,902 |
VIP Value Strategies Portfolio
Investor Class | 63,816 | | 857,054 |
TOTAL DOMESTIC EQUITY FUNDS | | 12,823,127 |
International Equity Funds - 10.4% |
VIP Overseas Portfolio Investor Class R | 137,637 | | 3,290,909 |
TOTAL EQUITY FUNDS (Cost $15,006,858) | 16,114,036 |
Fixed-Income Funds - 39.2% |
| | | |
High Yield Fixed-Income Funds - 5.1% |
VIP High Income Portfolio Investor Class | 249,649 | | 1,582,774 |
Investment Grade Fixed-Income Funds - 34.1% |
VIP Investment Grade Bond Portfolio Investor Class | 842,542 | | 10,733,991 |
TOTAL FIXED-INCOME FUNDS (Cost $12,027,424) | 12,316,765 |
Short-Term Funds - 9.6% |
| | | |
VIP Money Market Portfolio
Investor Class
(Cost $3,028,192) | 3,028,192 | | 3,028,192 |
TOTAL INVESTMENT IN SECURITIES - 100% (Cost $30,062,474) | $ 31,458,993 |
See accompanying notes which are an integral part of the financial statements.
Annual Report
VIP Investor Freedom 2010 Portfolio
Financial Statements
Statement of Assets and Liabilities
| December 31, 2006 |
| | |
Assets | | |
Investment in securities, at value
(cost $30,062,474) - See accompanying schedule | | $ 31,458,993 |
Dividends receivable | | 822 |
Total assets | | 31,459,815 |
| | |
Net Assets | | $ 31,459,815 |
Net Assets consist of: | | |
Paid in capital | | $ 29,175,907 |
Undistributed net investment income | | 511,501 |
Accumulated undistributed net realized gain (loss) on investments | | 375,888 |
Net unrealized appreciation (depreciation) on investments | | 1,396,519 |
Net Assets, for 2,811,055 shares outstanding | | $ 31,459,815 |
Net Asset Value, offering price and redemption price per share ($31,459,815 ÷ 2,811,055 shares) | | $ 11.19 |
Statement of Operations
| Year ended December 31, 2006 |
| | |
Investment Income | | |
Income distributions from underlying funds | | $ 517,120 |
Interest | | 118 |
Total income | | 517,238 |
| | |
Expenses | | |
Independent trustees' compensation | $ 76 | |
Total expenses before reductions | 76 | |
Expense reductions | (76) | 0 |
Net investment income (loss) | | 517,238 |
Realized and Unrealized Gain (Loss) Realized gain (loss) on sale of underlying fund shares | (123,708) | |
Capital gain distributions from underlying funds | 499,613 | 375,905 |
Change in net unrealized appreciation (depreciation) on underlying funds | | 1,261,094 |
Net gain (loss) | | 1,636,999 |
Net increase (decrease) in net assets resulting from operations | | $ 2,154,237 |
See accompanying notes which are an integral part of the financial statements.
VIP Investor Freedom Portfolios
Statement of Changes in Net Assets
| Year ended
December 31,
2006 | For the period
August 3, 2005 (commencement
of operations) to
December 31, 2005 |
Increase (Decrease) in Net Assets | | |
Operations | | |
Net investment income (loss) | $ 517,238 | $ 41,821 |
Net realized gain (loss) | 375,905 | (17) |
Change in net unrealized appreciation (depreciation) | 1,261,094 | 135,425 |
Net increase (decrease) in net assets resulting from operations | 2,154,237 | 177,229 |
Distributions to shareholders from net investment income | (47,558) | - |
Share transactions
Proceeds from sales of shares | 24,173,995 | 9,818,002 |
Reinvestment of distributions | 47,558 | - |
Cost of shares redeemed | (4,860,534) | (3,114) |
Net increase (decrease) in net assets resulting from share transactions | 19,361,019 | 9,814,888 |
Total increase (decrease) in net assets | 21,467,698 | 9,992,117 |
| | |
Net Assets | | |
Beginning of period | 9,992,117 | - |
End of period (including undistributed net investment income of $511,501 and undistributed net investment income of $41,821, respectively) | $ 31,459,815 | $ 9,992,117 |
Other Information Shares | | |
Sold | 2,296,621 | 974,435 |
Issued in reinvestment of distributions | 4,604 | - |
Redeemed | (464,300) | (305) |
Net increase (decrease) | 1,836,925 | 974,130 |
Financial Highlights
Years ended December 31, | 2006 | 2005 G |
Selected Per-Share Data | | |
Net asset value, beginning of period | $ 10.26 | $ 10.00 |
Income from Investment Operations | | |
Net investment income (loss) E | .24 | .13 |
Net realized and unrealized gain (loss) | .73 | .13 |
Total from investment operations | .97 | .26 |
Distributions from net investment income | (.04) | - |
Net asset value, end of period | $ 11.19 | $ 10.26 |
Total Return B, C, D | 9.49% | 2.60% |
Ratios to Average Net Assets F, H | | |
Expenses before reductions | .00% | .00% A |
Expenses net of fee waivers, if any | .00% | .00% A |
Expenses net of all reductions | .00% | .00% A |
Net investment income (loss) | 2.29% | 3.14% A |
Supplemental Data | | |
Net assets, end of period (000 omitted) | $ 31,460 | $ 9,992 |
Portfolio turnover rate | 29% | 0% |
A Annualized
B Total returns for periods of less than one year are not annualized.
C Total returns do not reflect charges attributable to your insurance company's separate account. Inclusion of these charges would reduce the total returns shown.
D Total returns would have been lower had certain expenses not been reduced during the periods shown.
E Calculated based on average shares outstanding during the period.
F Amounts do not include the activity of the underlying funds.
G For the period August 3, 2005 (commencement of operations) to December 31, 2005.
H Expense ratios reflect operating expenses of the Fund. Expenses before reductions do not reflect amounts reimbursed by the investment adviser or expense offset arrangements and do not represent the amount paid by the Fund during periods when reimbursements or reductions occur. Expense ratios before reductions for start-up periods may not be representative of longer term operating periods. Expenses net of fee waivers reflect expenses after reimbursement by the investment adviser but prior to reductions from expense offset arrangements. Expenses net of all reductions represent the net expenses paid by the Fund but do not include expenses of the investment companies in which the Fund invests.
See accompanying notes which are an integral part of the financial statements.
Annual Report
VIP Investor Freedom 2015 Portfolio
Investment Changes
Fund Holdings as of December 31, 2006 |
| % of fund's investments | % of fund's investments 6 months ago |
Domestic Equity Funds | | |
VIP Contrafund Portfolio
Investor Class | 7.4 | 7.6 |
VIP Equity-Income Portfolio Investor Class | 8.7 | 8.9 |
VIP Growth & Income Portfolio Investor Class | 8.6 | 8.8 |
VIP Growth Portfolio Investor Class | 8.5 | 8.8 |
VIP Mid Cap Portfolio
Investor Class | 3.1 | 3.1 |
VIP Value Portfolio Investor Class | 7.4 | 7.6 |
VIP Value Strategies Portfolio Investor Class | 3.2 | 3.1 |
| 46.9 | 47.9 |
International Equity Funds | | |
VIP Overseas Portfolio
Investor Class R | 12.0 | 9.7 |
High Yield Fixed-Income Funds | | |
VIP High Income Portfolio
Investor Class | 6.3 | 6.7 |
Investment Grade Fixed-Income Funds | | |
VIP Investment Grade Bond Portfolio Investor Class | 29.9 | 31.5 |
Short-Term Funds | | |
VIP Money Market Portfolio Investor Class | 4.9 | 4.2 |
| 100.0 | 100.0 |
Asset Allocation (% of fund's investments) |
Current |
| Domestic Equity Funds | 46.9% | |
| International Equity Funds | 12.0% | |
| Investment Grade Fixed-Income Funds | 29.9% | |
| High Yield Fixed-Income Funds | 6.3% | |
| Short-Term Funds | 4.9% | |

Six months ago |
| Domestic Equity Funds | 47.9% | |
| International Equity Funds | 9.7% | |
| Investment Grade Fixed-Income Funds | 31.5% | |
| High Yield Fixed-Income Funds | 6.7% | |
| Short-Term Funds | 4.2% | |

Expected |
| Domestic Equity Funds | 45.1% | |
| International Equity Funds | 11.3% | |
| Investment Grade Fixed-Income Funds | 31.6% | |
| High Yield Fixed-Income Funds | 6.0% | |
| Short-Term Funds | 6.0% | |

The fund invests according to an asset allocation strategy that becomes increasingly conservative over time. The six months ago allocation is based on the fund's holdings as of June 30, 2006. The current allocation is based on the fund's holdings as of December 31, 2006. The expected allocation represents the fund's anticipated allocation at June 30, 2007. Beginning in March 2006, the fund changed its asset allocation strategy, resulting in an increased emphasis on international equity. |
VIP Investor Freedom Portfolios
VIP Investor Freedom 2015 Portfolio
Investments December 31, 2006
Showing Percentage of Total Value of Investment in Securities
Equity Funds - 58.9% |
| Shares | | Value (Note 1) |
Domestic Equity Funds - 46.9% |
VIP Contrafund Portfolio Investor Class | 93,988 | | $ 2,952,164 |
VIP Equity-Income Portfolio Investor Class | 132,866 | | 3,474,436 |
VIP Growth & Income Portfolio
Investor Class | 214,098 | | 3,440,556 |
VIP Growth Portfolio Investor Class | 94,170 | | 3,369,416 |
VIP Mid Cap Portfolio Investor Class | 35,651 | | 1,236,739 |
VIP Value Portfolio Investor Class | 207,003 | | 2,951,856 |
VIP Value Strategies Portfolio
Investor Class | 93,084 | | 1,250,116 |
TOTAL DOMESTIC EQUITY FUNDS | | 18,675,283 |
International Equity Funds - 12.0% |
VIP Overseas Portfolio Investor Class R | 200,843 | | 4,802,168 |
TOTAL EQUITY FUNDS (Cost $21,860,469) | 23,477,451 |
Fixed-Income Funds - 36.2% |
| | | |
High Yield Fixed-Income Funds - 6.3% |
VIP High Income Portfolio Investor Class | 394,156 | | 2,498,952 |
Investment Grade Fixed-Income Funds - 29.9% |
VIP Investment Grade Bond Portfolio Investor Class | 936,552 | | 11,931,674 |
TOTAL FIXED-INCOME FUNDS (Cost $14,072,611) | 14,430,626 |
Short-Term Funds - 4.9% |
| | | |
VIP Money Market Portfolio
Investor Class
(Cost $1,929,165) | 1,929,165 | | 1,929,165 |
TOTAL INVESTMENT IN SECURITIES - 100% (Cost $37,862,245) | $ 39,837,242 |
See accompanying notes which are an integral part of the financial statements.
Annual Report
VIP Investor Freedom 2015 Portfolio
Financial Statements
Statement of Assets and Liabilities
| December 31, 2006 |
| | |
Assets | | |
Investment in securities, at value
(cost $37,862,245) - See accompanying schedule | | $ 39,837,242 |
Cash | | 59 |
Dividends receivable | | 526 |
Total assets | | 39,837,827 |
| | |
Net Assets | | $ 39,837,827 |
Net Assets consist of: | | |
Paid in capital | | $ 36,785,138 |
Undistributed net investment income | | 494,279 |
Accumulated undistributed net realized gain (loss) on investments | | 583,413 |
Net unrealized appreciation (depreciation) on investments | | 1,974,997 |
Net Assets, for 3,495,201 shares outstanding | | $ 39,837,827 |
Net Asset Value, offering price and redemption price per share ($39,837,827 ÷ 3,495,201 shares) | | $ 11.40 |
Statement of Operations
| Year ended December 31, 2006 |
| | |
Investment Income | | |
Income distributions from underlying funds | | $ 497,866 |
Interest | | 61 |
Total income | | 497,927 |
| | |
Expenses | | |
Independent trustees' compensation | $ 89 | |
Total expenses before reductions | 89 | |
Expense reductions | (89) | 0 |
Net investment income (loss) | | 497,927 |
Realized and Unrealized Gain (Loss) Realized gain (loss) on sale of underlying fund shares | (55,664) | |
Capital gain distributions from underlying funds | 643,090 | 587,426 |
Change in net unrealized appreciation (depreciation) on underlying funds | | 1,825,450 |
Net gain (loss) | | 2,412,876 |
Net increase (decrease) in net assets resulting from operations | | $ 2,910,803 |
See accompanying notes which are an integral part of the financial statements.
VIP Investor Freedom Portfolios
Statement of Changes in Net Assets
| Year ended
December 31,
2006 | For the period
August 3, 2005 (commencement
of operations) to
December 31, 2005 |
Increase (Decrease) in Net Assets | | |
Operations | | |
Net investment income (loss) | $ 497,927 | $ 34,268 |
Net realized gain (loss) | 587,426 | (4,013) |
Change in net unrealized appreciation (depreciation) | 1,825,450 | 149,547 |
Net increase (decrease) in net assets resulting from operations | 2,910,803 | 179,802 |
Distributions to shareholders from net investment income | (37,916) | - |
Share transactions
Proceeds from sales of shares | 31,577,174 | 7,055,503 |
Reinvestment of distributions | 37,916 | - |
Cost of shares redeemed | (1,589,486) | (295,969) |
Net increase (decrease) in net assets resulting from share transactions | 30,025,604 | 6,759,534 |
Total increase (decrease) in net assets | 32,898,491 | 6,939,336 |
| | |
Net Assets | | |
Beginning of period | 6,939,336 | - |
End of period (including undistributed net investment income of $494,279 and undistributed net investment income of $34,268, respectively) | $ 39,837,827 | $ 6,939,336 |
Other Information Shares | | |
Sold | 2,966,727 | 701,801 |
Issued in reinvestment of distributions | 3,635 | - |
Redeemed | (147,393) | (29,569) |
Net increase (decrease) | 2,822,969 | 672,232 |
Financial Highlights
Years ended December 31, | 2006 | 2005 G |
Selected Per-Share Data | | |
Net asset value, beginning of period | $ 10.32 | $ 10.00 |
Income from Investment Operations | | |
Net investment income (loss) E | .20 | .13 |
Net realized and unrealized gain (loss) | .92 | .19 |
Total from investment operations | 1.12 | .32 |
Distributions from net investment income | (.04) | - |
Net asset value, end of period | $ 11.40 | $ 10.32 |
Total Return B, C, D | 10.89% | 3.20% |
Ratios to Average Net Assets F, H | | |
Expenses before reductions | .00% | .00% A |
Expenses net of fee waivers, if any | .00% | .00% A |
Expenses net of all reductions | .00% | .00% A |
Net investment income (loss) | 1.83% | 3.24% A |
Supplemental Data | | |
Net assets, end of period (000 omitted) | $ 39,838 | $ 6,939 |
Portfolio turnover rate | 15% | 9% |
A Annualized
B Total returns for periods of less than one year are not annualized.
C Total returns do not reflect charges attributable to your insurance company's separate account. Inclusion of these charges would reduce the total returns shown.
D Total returns would have been lower had certain expenses not been reduced during the periods shown.
E Calculated based on average shares outstanding during the period.
F Amounts do not include the activity of the underlying funds.
G For the period August 3, 2005 (commencement of operations) to December 31, 2005.
H Expense ratios reflect operating expenses of the Fund. Expenses before reductions do not reflect amounts reimbursed by the investment adviser or expense offset arrangements and do not represent the amount paid by the Fund during periods when reimbursements or reductions occur. Expense ratios before reductions for start-up periods may not be representative of longer term operating periods. Expenses net of fee waivers reflect expenses after reimbursement by the investment adviser but prior to reductions from expense offset arrangements. Expenses net of all reductions represent the net expenses paid by the Fund but do not include expenses of the investment companies in which the Fund invests.
See accompanying notes which are an integral part of the financial statements.
Annual Report
VIP Investor Freedom 2020 Portfolio
Investment Changes
Fund Holdings as of December 31, 2006 |
| % of fund's investments | % of fund's investments 6 months ago |
Domestic Equity Funds | | |
VIP Contrafund Portfolio
Investor Class | 8.7 | 9.0 |
VIP Equity-Income Portfolio Investor Class | 10.3 | 10.5 |
VIP Growth & Income Portfolio Investor Class | 10.2 | 10.5 |
VIP Growth Portfolio Investor Class | 10.0 | 10.4 |
VIP Mid Cap Portfolio
Investor Class | 3.6 | 3.6 |
VIP Value Portfolio Investor Class | 8.7 | 9.0 |
VIP Value Strategies Portfolio Investor Class | 3.7 | 3.7 |
| 55.2 | 56.7 |
International Equity Funds | | |
VIP Overseas Portfolio
Investor Class R | 14.2 | 11.4 |
High Yield Fixed-Income Funds | | |
VIP High Income Portfolio
Investor Class | 7.5 | 7.8 |
Investment Grade Fixed-Income Funds | | |
VIP Investment Grade Bond Portfolio Investor Class | 22.9 | 24.0 |
Short-Term Funds | | |
VIP Money Market Portfolio Investor Class | 0.2 | 0.1 |
| 100.0 | 100.0 |
Asset Allocation (% of fund's investments) |
Current |
| Domestic Equity Funds | 55.2% | |
| International Equity Funds | 14.2% | |
| Investment Grade Fixed-Income Funds | 22.9% | |
| High Yield Fixed-Income Funds | 7.5% | |
| Short-Term Funds | 0.2% | |

Six months ago |
| Domestic Equity Funds | 56.7% | |
| International Equity Funds | 11.4% | |
| Investment Grade Fixed-Income Funds | 24.0% | |
| High Yield Fixed-Income Funds | 7.8% | |
| Short-Term Funds | 0.1% | |

Expected |
| Domestic Equity Funds | 54.4% | |
| International Equity Funds | 13.6% | |
| Investment Grade Fixed-Income Funds | 24.1% | |
| High Yield Fixed-Income Funds | 7.5% | |
| Short-Term Funds | 0.4% | |

The fund invests according to an asset allocation strategy that becomes increasingly conservative over time. The six months ago allocation is based on the fund's holdings as of June 30, 2006. The current allocation is based on the fund's holdings as of December 31, 2006. The expected allocation represents the fund's anticipated allocation at June 30, 2007. Beginning in March 2006, the fund changed its asset allocation strategy, resulting in an increased emphasis on international equity. |
VIP Investor Freedom Portfolios
VIP Investor Freedom 2020 Portfolio
Investments December 31, 2006
Showing Percentage of Total Value of Investment in Securities
Equity Funds - 69.4% |
| Shares | | Value (Note 1) |
Domestic Equity Funds - 55.2% |
VIP Contrafund Portfolio Investor Class | 131,568 | | $ 4,132,562 |
VIP Equity-Income Portfolio Investor Class | 186,044 | | 4,865,059 |
VIP Growth & Income Portfolio
Investor Class | 299,714 | | 4,816,400 |
VIP Growth Portfolio Investor Class | 131,823 | | 4,716,611 |
VIP Mid Cap Portfolio Investor Class | 49,883 | | 1,730,456 |
VIP Value Portfolio Investor Class | 289,865 | | 4,133,471 |
VIP Value Strategies Portfolio
Investor Class | 130,270 | | 1,749,524 |
TOTAL DOMESTIC EQUITY FUNDS | | 26,144,083 |
International Equity Funds - 14.2% |
VIP Overseas Portfolio Investor Class R | 280,432 | | 6,705,121 |
TOTAL EQUITY FUNDS (Cost $30,814,955) | 32,849,204 |
Fixed-Income Funds - 30.4% |
| | | |
High Yield Fixed-Income Funds - 7.5% |
VIP High Income Portfolio Investor Class | 554,984 | | 3,518,597 |
Investment Grade Fixed-Income Funds - 22.9% |
VIP Investment Grade Bond Portfolio Investor Class | 851,807 | | 10,852,028 |
TOTAL FIXED-INCOME FUNDS (Cost $14,135,448) | 14,370,625 |
Short-Term Funds - 0.2% |
| | | |
VIP Money Market Portfolio
Investor Class
(Cost $109,106) | 109,106 | | 109,106 |
TOTAL INVESTMENT IN SECURITIES - 100% (Cost $45,059,509) | $ 47,328,935 |
See accompanying notes which are an integral part of the financial statements.
Annual Report
VIP Investor Freedom 2020 Portfolio
Financial Statements
Statement of Assets and Liabilities
| December 31, 2006 |
| | |
Assets | | |
Investment in securities, at value
(cost $45,059,509) - See accompanying schedule | | $ 47,328,935 |
Cash | | 26 |
Dividends receivable | | 31 |
Total assets | | 47,328,992 |
| | |
Net Assets | | $ 47,328,992 |
Net Assets consist of: | | |
Paid in capital | | $ 43,631,900 |
Undistributed net investment income | | 599,942 |
Accumulated undistributed net realized gain (loss) on investments | | 827,724 |
Net unrealized appreciation (depreciation) on investments | | 2,269,426 |
Net Assets, for 4,103,622 shares outstanding | | $ 47,328,992 |
Net Asset Value, offering price and redemption price per share ($47,328,992 ÷ 4,103,622 shares) | | $ 11.53 |
Statement of Operations
| Year ended December 31, 2006 |
| | |
Investment Income | | |
Income distributions from underlying funds | | $ 611,372 |
Interest | | 17 |
Total income | | 611,389 |
| | |
Expenses | | |
Independent trustees' compensation | $ 99 | |
Total expenses before reductions | 99 | |
Expense reductions | (99) | 0 |
Net investment income (loss) | | 611,389 |
Realized and Unrealized Gain (Loss) Realized gain (loss) on sale of underlying fund shares | (137,884) | |
Capital gain distributions from underlying funds | 966,117 | 828,233 |
Change in net unrealized appreciation (depreciation) on underlying funds | | 2,045,711 |
Net gain (loss) | | 2,873,944 |
Net increase (decrease) in net assets resulting from operations | | $ 3,485,333 |
See accompanying notes which are an integral part of the financial statements.
VIP Investor Freedom Portfolios
Statement of Changes in Net Assets
| Year ended
December 31,
2006 | For the period
August 3, 2005 (commencement
of operations) to
December 31, 2005 |
Increase (Decrease) in Net Assets | | |
Operations | | |
Net investment income (loss) | $ 611,389 | $ 60,264 |
Net realized gain (loss) | 828,233 | (509) |
Change in net unrealized appreciation (depreciation) | 2,045,711 | 223,715 |
Net increase (decrease) in net assets resulting from operations | 3,485,333 | 283,470 |
Distributions to shareholders from net investment income | (71,710) | - |
Share transactions
Proceeds from sales of shares | 35,011,966 | 10,848,487 |
Reinvestment of distributions | 71,710 | - |
Cost of shares redeemed | (2,226,832) | (73,432) |
Net increase (decrease) in net assets resulting from share transactions | 32,856,844 | 10,775,055 |
Total increase (decrease) in net assets | 36,270,467 | 11,058,525 |
| | |
Net Assets | | |
Beginning of period | 11,058,525 | - |
End of period (including undistributed net investment income of $599,942 and undistributed net investment income of $60,264, respectively) | $ 47,328,992 | $ 11,058,525 |
Other Information Shares | | |
Sold | 3,240,573 | 1,074,181 |
Issued in reinvestment of distributions | 6,843 | - |
Redeemed | (210,880) | (7,095) |
Net increase (decrease) | 3,036,536 | 1,067,086 |
Financial Highlights
Years ended December 31, | 2006 | 2005 G |
Selected Per-Share Data | | |
Net asset value, beginning of period | $ 10.36 | $ 10.00 |
Income from Investment Operations | | |
Net investment income (loss) E | .22 | .17 |
Net realized and unrealized gain (loss) | 1.00 | .19 |
Total from investment operations | 1.22 | .36 |
Distributions from net investment income | (.05) | - |
Net asset value, end of period | $ 11.53 | $ 10.36 |
Total Return B, C, D | 11.82% | 3.60% |
Ratios to Average Net Assets F, H | | |
Expenses before reductions | .00% | .00% A |
Expenses net of fee waivers, if any | .00% | .00% A |
Expenses net of all reductions | .00% | .00% A |
Net investment income (loss) | 2.04% | 4.07% A |
Supplemental Data | | |
Net assets, end of period (000 omitted) | $ 47,329 | $ 11,059 |
Portfolio turnover rate | 15% | 2% |
A Annualized
B Total returns for periods of less than one year are not annualized.
C Total returns do not reflect charges attributable to your insurance company's separate account. Inclusion of these charges would reduce the total returns shown.
D Total returns would have been lower had certain expenses not been reduced during the periods shown.
E Calculated based on average shares outstanding during the period.
F Amounts do not include the activity of the underlying funds.
G For the period August 3, 2005 (commencement of operations) to December 31, 2005.
H Expense ratios reflect operating expenses of the Fund. Expenses before reductions do not reflect amounts reimbursed by the investment adviser or expense offset arrangements and do not represent the amount paid by the Fund during periods when reimbursements or reductions occur. Expense ratios before reductions for start-up periods may not be representative of longer term operating periods. Expenses net of fee waivers reflect expenses after reimbursement by the investment adviser but prior to reductions from expense offset arrangements. Expenses net of all reductions represent the net expenses paid by the Fund but do not include expenses of the investment companies in which the Fund invests.
See accompanying notes which are an integral part of the financial statements.
Annual Report
VIP Investor Freedom 2025 Portfolio
Investment Changes
Fund Holdings as of December 31, 2006 |
| % of fund's investments | % of fund's investments 6 months ago |
Domestic Equity Funds | | |
VIP Contrafund Portfolio
Investor Class | 9.1 | 9.6 |
VIP Equity-Income Portfolio Investor Class | 10.8 | 11.2 |
VIP Growth & Income Portfolio Investor Class | 10.7 | 11.1 |
VIP Growth Portfolio Investor Class | 10.4 | 11.0 |
VIP Mid Cap Portfolio
Investor Class | 3.8 | 3.9 |
VIP Value Portfolio Investor Class | 9.1 | 9.5 |
VIP Value Strategies Portfolio Investor Class | 3.9 | 4.0 |
| 57.8 | 60.3 |
International Equity Funds | | |
VIP Overseas Portfolio
Investor Class R | 14.8 | 12.2 |
High Yield Fixed-Income Funds | | |
VIP High Income Portfolio
Investor Class | 7.5 | 7.7 |
Investment Grade Fixed-Income Funds | | |
VIP Investment Grade Bond Portfolio Investor Class | 19.9 | 19.8 |
| 100.0 | 100.0 |
Asset Allocation (% of fund's investments) |
Current |
| Domestic Equity Funds | 57.8% | |
| International Equity Funds | 14.8% | |
| Investment Grade Fixed-Income Funds | 19.9% | |
| High Yield Fixed-Income Funds | 7.5% | |

Six months ago |
| Domestic Equity Funds | 60.3% | |
| International Equity Funds | 12.2% | |
| Investment Grade Fixed-Income Funds | 19.8% | |
| High Yield Fixed-Income Funds | 7.7% | |

Expected |
| Domestic Equity Funds | 56.8% | |
| International Equity Funds | 14.2% | |
| Investment Grade Fixed-Income Funds | 21.5% | |
| High Yield Fixed-Income Funds | 7.5% | |

The fund invests according to an asset allocation strategy that becomes increasingly conservative over time. The six months ago allocation is based on the fund's holdings as of June 30, 2006. The current allocation is based on the fund's holdings as of December 31, 2006. The expected allocation represents the fund's anticipated allocation at June 30, 2007. Beginning in March 2006, the fund changed its asset allocation strategy, resulting in an increased emphasis on international equity. |
VIP Investor Freedom Portfolios
VIP Investor Freedom 2025 Portfolio
Investments December 31, 2006
Showing Percentage of Total Value of Investment in Securities
Equity Funds - 72.6% |
| Shares | | Value (Note 1) |
Domestic Equity Funds - 57.8% |
VIP Contrafund Portfolio Investor Class | 42,541 | | $ 1,336,209 |
VIP Equity-Income Portfolio Investor Class | 60,142 | | 1,572,725 |
VIP Growth & Income Portfolio
Investor Class | 96,918 | | 1,557,473 |
VIP Growth Portfolio Investor Class | 42,632 | | 1,525,370 |
VIP Mid Cap Portfolio Investor Class | 16,130 | | 559,532 |
VIP Value Portfolio Investor Class | 93,689 | | 1,336,012 |
VIP Value Strategies Portfolio
Investor Class | 42,114 | | 565,595 |
TOTAL DOMESTIC EQUITY FUNDS | | 8,452,916 |
International Equity Funds - 14.8% |
VIP Overseas Portfolio Investor Class R | 90,863 | | 2,172,534 |
TOTAL EQUITY FUNDS (Cost $9,922,452) | 10,625,450 |
Fixed-Income Funds - 27.4% |
| | | |
High Yield Fixed-Income Funds - 7.5% |
VIP High Income Portfolio Investor Class | 171,952 | | 1,090,174 |
Investment Grade Fixed-Income Funds - 19.9% |
VIP Investment Grade Bond Portfolio Investor Class | 228,765 | | 2,914,470 |
TOTAL FIXED-INCOME FUNDS (Cost $3,940,788) | 4,004,644 |
TOTAL INVESTMENT IN SECURITIES - 100% (Cost $13,863,240) | $ 14,630,094 |
See accompanying notes which are an integral part of the financial statements.
Annual Report
VIP Investor Freedom 2025 Portfolio
Financial Statements
Statement of Assets and Liabilities
| December 31, 2006 |
| | |
Assets | | |
Investment in securities, at value
(cost $13,863,240) - See accompanying schedule | | $ 14,630,094 |
Cash | | 9 |
Total assets | | 14,630,103 |
| | |
Net Assets | | $ 14,630,103 |
Net Assets consist of: | | |
Paid in capital | | $ 13,421,547 |
Undistributed net investment income | | 174,692 |
Accumulated undistributed net realized gain (loss) on investments | | 267,010 |
Net unrealized appreciation (depreciation) on investments | | 766,854 |
Net Assets, for 1,259,216 shares outstanding | | $ 14,630,103 |
Net Asset Value, offering price and redemption price per share ($14,630,103 ÷ 1,259,216 shares) | | $ 11.62 |
Statement of Operations
| Year ended December 31, 2006 |
| | |
Investment Income | | |
Income distributions from underlying funds | | $ 177,339 |
| | |
Expenses | | |
Independent trustees' compensation | $ 29 | |
Total expenses before reductions | 29 | |
Expense reductions | (29) | 0 |
Net investment income (loss) | | 177,339 |
Realized and Unrealized Gain (Loss) Realized gain (loss) on sale of underlying fund shares | (37,267) | |
Capital gain distributions from underlying funds | 304,579 | 267,312 |
Change in net unrealized appreciation (depreciation) on underlying funds | | 708,052 |
Net gain (loss) | | 975,364 |
Net increase (decrease) in net assets resulting from operations | | $ 1,152,703 |
See accompanying notes which are an integral part of the financial statements.
VIP Investor Freedom Portfolios
Statement of Changes in Net Assets
| Year ended
December 31,
2006 | For the period
August 3, 2005 (commencement
of operations) to
December 31, 2005 |
Increase (Decrease) in Net Assets | | |
Operations | | |
Net investment income (loss) | $ 177,339 | $ 13,821 |
Net realized gain (loss) | 267,312 | (302) |
Change in net unrealized appreciation (depreciation) | 708,052 | 58,802 |
Net increase (decrease) in net assets resulting from operations | 1,152,703 | 72,321 |
Distributions to shareholders from net investment income | (16,468) | - |
Share transactions
Proceeds from sales of shares | 11,868,095 | 2,377,249 |
Reinvestment of distributions | 16,468 | - |
Cost of shares redeemed | (814,667) | (25,598) |
Net increase (decrease) in net assets resulting from share transactions | 11,069,896 | 2,351,651 |
Total increase (decrease) in net assets | 12,206,131 | 2,423,972 |
| | |
Net Assets | | |
Beginning of period | 2,423,972 | - |
End of period (including undistributed net investment income of $174,692 and undistributed net investment income of $13,821, respectively) | $ 14,630,103 | $ 2,423,972 |
Other Information Shares | | |
Sold | 1,099,971 | 235,917 |
Issued in reinvestment of distributions | 1,564 | - |
Redeemed | (75,678) | (2,558) |
Net increase (decrease) | 1,025,857 | 233,359 |
Financial Highlights
Years ended December 31, | 2006 | 2005 G |
Selected Per-Share Data | | |
Net asset value, beginning of period | $ 10.39 | $ 10.00 |
Income from Investment Operations | | |
Net investment income (loss) E | .21 | .14 |
Net realized and unrealized gain (loss) | 1.06 | .25 |
Total from investment operations | 1.27 | .39 |
Distributions from net investment income | (.04) | - |
Net asset value, end of period | $ 11.62 | $ 10.39 |
Total Return B, C, D | 12.26% | 3.90% |
Ratios to Average Net Assets F, H | | |
Expenses before reductions | .00% | .00% A |
Expenses net of fee waivers, if any | .00% | .00% A |
Expenses net of all reductions | .00% | .00% A |
Net investment income (loss) | 1.95% | 3.47% A |
Supplemental Data | | |
Net assets, end of period (000 omitted) | $ 14,630 | $ 2,424 |
Portfolio turnover rate | 18% | 2% |
A Annualized
B Total returns for periods of less than one year are not annualized.
C Total returns do not reflect charges attributable to your insurance company's separate account. Inclusion of these charges would reduce the total returns shown.
D Total returns would have been lower had certain expenses not been reduced during the periods shown.
E Calculated based on average shares outstanding during the period.
F Amounts do not include the activity of the underlying funds.
G For the period August 3, 2005 (commencement of operations) to December 31, 2005.
H Expense ratios reflect operating expenses of the Fund. Expenses before reductions do not reflect amounts reimbursed by the investment adviser or expense offset arrangements and do not represent the amount paid by the Fund during periods when reimbursements or reductions occur. Expense ratios before reductions for start-up periods may not be representative of longer term operating periods. Expenses net of fee waivers reflect expenses after reimbursement by the investment adviser but prior to reductions from expense offset arrangements. Expenses net of all reductions represent the net expenses paid by the Fund but do not include expenses of the investment companies in which the Fund invests.
See accompanying notes which are an integral part of the financial statements.
Annual Report
VIP Investor Freedom 2030 Portfolio
Investment Changes
Fund Holdings as of December 31, 2006 |
| % of fund's investments | % of fund's investments 6 months ago |
Domestic Equity Funds | | |
VIP Contrafund Portfolio
Investor Class | 10.4 | 10.7 |
VIP Equity-Income Portfolio Investor Class | 12.2 | 12.6 |
VIP Growth & Income Portfolio Investor Class | 12.1 | 12.5 |
VIP Growth Portfolio Investor Class | 11.9 | 12.4 |
VIP Mid Cap Portfolio
Investor Class | 4.4 | 4.3 |
VIP Value Portfolio Investor Class | 10.4 | 10.7 |
VIP Value Strategies Portfolio Investor Class | 4.4 | 4.4 |
| 65.8 | 67.6 |
International Equity Funds | | |
VIP Overseas Portfolio
Investor Class R | 16.9 | 14.0 |
High Yield Fixed-Income Funds | | |
VIP High Income Portfolio
Investor Class | 7.4 | 7.8 |
Investment Grade Fixed-Income Funds | | |
VIP Investment Grade Bond Portfolio Investor Class | 9.9 | 10.6 |
| 100.0 | 100.0 |
Asset Allocation (% of fund's investments) |
Current |
| Domestic Equity Funds | 65.8% | |
| International Equity Funds | 16.9% | |
| Investment Grade Fixed-Income Funds | 9.9% | |
| High Yield Fixed-Income Funds | 7.4% | |

Six months ago |
| Domestic Equity Funds | 67.6% | |
| International Equity Funds | 14.0% | |
| Investment Grade Fixed-Income Funds | 10.6% | |
| High Yield Fixed-Income Funds | 7.8% | |

Expected |
| Domestic Equity Funds | 65.6% | |
| International Equity Funds | 16.4% | |
| Investment Grade Fixed-Income Funds | 10.5% | |
| High Yield Fixed-Income Funds | 7.5% | |

The fund invests according to an asset allocation strategy that becomes increasingly conservative over time. The six months ago allocation is based on the fund's holdings as of June 30, 2006. The current allocation is based on the fund's holdings as of December 31, 2006. The expected allocation represents the fund's anticipated allocation at June 30, 2007. Beginning in March 2006, the fund changed its asset allocation strategy, resulting in an increased emphasis on international equity. |
VIP Investor Freedom Portfolio
VIP Investor Freedom 2030 Portfolio
Investments December 31, 2006
Showing Percentage of Total Value of Investment in Securities
Equity Funds - 82.7% |
| Shares | | Value (Note 1) |
Domestic Equity Funds - 65.8% |
VIP Contrafund Portfolio Investor Class | 48,750 | | $ 1,531,248 |
VIP Equity-Income Portfolio Investor Class | 68,969 | | 1,803,538 |
VIP Growth & Income Portfolio
Investor Class | 111,131 | | 1,785,881 |
VIP Growth Portfolio Investor Class | 48,894 | | 1,749,415 |
VIP Mid Cap Portfolio Investor Class | 18,508 | | 642,055 |
VIP Value Portfolio Investor Class | 107,390 | | 1,531,378 |
VIP Value Strategies Portfolio
Investor Class | 48,328 | | 649,043 |
TOTAL DOMESTIC EQUITY FUNDS | | 9,692,558 |
International Equity Funds - 16.9% |
VIP Overseas Portfolio Investor Class R | 103,985 | | 2,486,272 |
TOTAL EQUITY FUNDS (Cost $11,384,344) | 12,178,830 |
Fixed-Income Funds - 17.3% |
| | | |
High Yield Fixed-Income Funds - 7.4% |
VIP High Income Portfolio Investor Class | 172,346 | | 1,092,673 |
Investment Grade Fixed-Income Funds - 9.9% |
VIP Investment Grade Bond Portfolio Investor Class | 114,283 | | 1,455,967 |
TOTAL FIXED-INCOME FUNDS (Cost $2,517,327) | 2,548,640 |
TOTAL INVESTMENT IN SECURITIES - 100% (Cost $13,901,671) | $ 14,727,470 |
See accompanying notes which are an integral part of the financial statements.
Annual Report
VIP Investor Freedom 2030 Portfolio
Financial Statements
Statement of Assets and Liabilities
| December 31, 2006 |
| | |
Assets | | |
Investment in securities, at value
(cost $13,901,671) - See accompanying schedule | | $ 14,727,470 |
Cash | | 47 |
Total assets | | 14,727,517 |
| | |
Net Assets | | $ 14,727,517 |
Net Assets consist of: | | |
Paid in capital | | $ 13,396,815 |
Undistributed net investment income | | 179,319 |
Accumulated undistributed net realized gain (loss) on investments | | 325,584 |
Net unrealized appreciation (depreciation) on investments | | 825,799 |
Net Assets, for 1,256,691 shares outstanding | | $ 14,727,517 |
Net Asset Value, offering price and redemption price per share ($14,727,517 ÷ 1,256,691 shares) | | $ 11.72 |
Statement of Operations
| Year ended December 31, 2006 |
| | |
Investment Income | | |
Income distributions from underlying funds | | $ 179,739 |
Interest | | 33 |
Total income | | 179,772 |
| | |
Expenses | | |
Independent trustees' compensation | $ 33 | |
Total expenses before reductions | 33 | |
Expense reductions | (33) | 0 |
Net investment income (loss) | | 179,772 |
Realized and Unrealized Gain (Loss) Realized gain (loss) on sale of underlying fund shares | (31,975) | |
Capital gain distributions from underlying funds | 357,777 | 325,802 |
Change in net unrealized appreciation (depreciation) on underlying funds | | 707,059 |
Net gain (loss) | | 1,032,861 |
Net increase (decrease) in net assets resulting from operations | | $ 1,212,633 |
See accompanying notes which are an integral part of the financial statements.
VIP Investor Freedom Portfolios
Statement of Changes in Net Assets
| Year ended
December 31,
2006 | For the period
August 3, 2005 (commencement
of operations) to
December 31, 2005 |
Increase (Decrease) in Net Assets | | |
Operations | | |
Net investment income (loss) | $ 179,772 | $ 27,025 |
Net realized gain (loss) | 325,802 | (218) |
Change in net unrealized appreciation (depreciation) | 707,059 | 118,740 |
Net increase (decrease) in net assets resulting from operations | 1,212,633 | 145,547 |
Distributions to shareholders from net investment income | (27,477) | - |
Share transactions
Proceeds from sales of shares | 11,916,673 | 4,576,828 |
Reinvestment of distributions | 27,477 | - |
Cost of shares redeemed | (3,100,146) | (24,018) |
Net increase (decrease) in net assets resulting from share transactions | 8,844,004 | 4,552,810 |
Total increase (decrease) in net assets | 10,029,160 | 4,698,357 |
| | |
Net Assets | | |
Beginning of period | 4,698,357 | - |
End of period (including undistributed net investment income of $179,319 and undistributed net investment income of $27,025, respectively) | $ 14,727,517 | $ 4,698,357 |
Other Information Shares | | |
Sold | 1,090,895 | 453,189 |
Issued in reinvestment of distributions | 2,602 | - |
Redeemed | (287,600) | (2,395) |
Net increase (decrease) | 805,897 | 450,794 |
Financial Highlights
Years ended December 31, | 2006 | 2005 G |
Selected Per-Share Data | | |
Net asset value, beginning of period | $ 10.42 | $ 10.00 |
Income from Investment Operations | | |
Net investment income (loss) E | .20 | .15 |
Net realized and unrealized gain (loss) | 1.16 | .27 |
Total from investment operations | 1.36 | .42 |
Distributions from net investment income | (.06) | - |
Net asset value, end of period | $ 11.72 | $ 10.42 |
Total Return B, C, D | 13.12% | 4.20% |
Ratios to Average Net Assets F, H | | |
Expenses before reductions | .00% | .00% A |
Expenses net of fee waivers, if any | .00% | .00% A |
Expenses net of all reductions | .00% | .00% A |
Net investment income (loss) | 1.84% | 3.69% A |
Supplemental Data | | |
Net assets, end of period (000 omitted) | $ 14,728 | $ 4,698 |
Portfolio turnover rate | 36% | 1% |
A Annualized
B Total returns for periods of less than one year are not annualized.
C Total returns do not reflect charges attributable to your insurance company's separate account. Inclusion of these charges would reduce the total returns shown.
D Total returns would have been lower had certain expenses not been reduced during the periods shown.
E Calculated based on average shares outstanding during the period.
F Amounts do not include the activity of the underlying funds.
G For the period August 3, 2005 (commencement of operations) to December 31, 2005.
H Expense ratios reflect operating expenses of the Fund. Expenses before reductions do not reflect amounts reimbursed by the investment adviser or expense offset arrangements and do not represent the amount paid by the Fund during periods when reimbursements or reductions occur. Expense ratios before reductions for start-up periods may not be representative of longer term operating periods. Expenses net of fee waivers reflect expenses after reimbursement by the investment adviser but prior to reductions from expense offset arrangements. Expenses net of all reductions represent the net expenses paid by the Fund but do not include expenses of the investment companies in which the Fund invests.
See accompanying notes which are an integral part of the financial statements.
Annual Report
Notes to Financial Statements
For the period ended December 31, 2006
1. Significant Accounting Policies.
VIP Investor Freedom Income Portfolio, VIP Investor Freedom 2005 Portfolio, VIP Investor Freedom 2010 Portfolio, VIP Investor Freedom 2015 Portfolio, VIP Investor Freedom 2020 Portfolio, VIP Investor Freedom 2025 Portfolio and VIP Investor Freedom 2030 Portfolio (the Funds) are funds of Variable Insurance Products Fund IV. The Variable Insurance Products Fund IV (the trust) (referred to in this report as Fidelity Variable Insurance Products) is registered under the Investment Company Act of 1940, as amended (the 1940 Act), as an open-end management investment company organized as a Massachusetts business trust. Each Fund is authorized to issue an unlimited number of shares. The Funds invest primarily in a combination of other VIP equity, fixed income, and money market funds (the Underlying Funds) managed by Fidelity Management & Research Company (FMR). Shares of each Fund may only be purchased by insurance companies for the purpose of funding variable annuity or variable life insurance contracts.
The financial statements have been prepared in conformity with accounting principles generally accepted in the United States of America, which require management to make certain estimates and assumptions at the date of the financial statements. The following summarizes the significant accounting policies of the Funds:
Security Valuation. Net asset value per share is calculated as of the close of business of the New York Stock Exchange, normally 4:00 p.m. Eastern time. Investments in the Underlying Funds are valued at their closing net asset value each business day. Short-term securities with remaining maturities of sixty days or less for which quotations are not readily available are valued on the basis of amortized cost, which approximates value.
Investment Transactions and Income. Security transactions, normally shares of the Underlying Funds, are accounted for as of trade date. Gains and losses on securities sold are determined on the basis of identified cost. Income and capital gain distributions from the Underlying Funds, if any, are recorded on the ex-dividend date. Interest income is accrued as earned. Interest income includes coupon interest and amortization of premium and accretion of discount on debt securities.
Expenses. Most expenses of the trust can be directly attributed to a fund. Expenses which cannot be directly attributed are apportioned among each fund in the trust. Expenses included in the accompanying financial statements reflect the expenses of each Fund and do not include any expenses associated with the Underlying Funds. Expense estimates are accrued in the period to which they relate and adjustments are made when actual amounts are known.
Income Tax Information and Distributions to Shareholders. Each year, each Fund intends to qualify as a regulated investment company by distributing all of its taxable income and realized gains under Subchapter M of the Internal Revenue Code. As a result, no provision for income taxes is required in the accompanying financial statements.
Distributions are recorded on the ex-dividend date. Income and capital gain distributions are determined in accordance with income tax regulations, which may differ from generally accepted accounting principles.
Capital accounts within the financial statements are adjusted for permanent book-tax differences. These adjustments have no impact on net assets or the results of operations. Temporary book-tax differences will reverse in a subsequent period.
Book-tax differences are primarily due to short-term gain distributions from Underlying Funds, capital loss carryforwards and losses deferred due to wash sales and excise tax regulations.
The tax-basis components of distributable earnings and the federal tax cost as of period end were as follows for each Fund:
| Cost for Federal
Income Tax Purposes | Unrealized
Appreciation | Unrealized
Depreciation | Net Unrealized
Appreciation/
(Depreciation) |
VIP Investor Freedom Income | $ 10,923,729 | $ 262,759 | $ (10,852) | $ 251,907 |
VIP Investor Freedom 2005 | 4,597,136 | 260,072 | (6,871) | 253,201 |
VIP Investor Freedom 2010 | 30,062,480 | 1,444,586 | (48,073) | 1,396,513 |
VIP Investor Freedom 2015 | 37,862,246 | 2,041,859 | (66,863) | 1,974,996 |
VIP Investor Freedom 2020 | 45,059,809 | 2,446,244 | (177,118) | 2,269,126 |
VIP Investor Freedom 2025 | 13,863,240 | 806,573 | (39,719) | 766,854 |
VIP Investor Freedom 2030 | 13,901,736 | 883,372 | (57,638) | 825,734 |
VIP Investor Freedom Portfolios
1. Significant Accounting Policies - continued
Income Tax Information and Distributions to Shareholders - continued
| Undistributed
Ordinary Income | Undistributed Long-term Capital Gain |
VIP Investor Freedom Income | $ 262,481 | $ 52,126 |
VIP Investor Freedom 2005 | 85,241 | 51,554 |
VIP Investor Freedom 2010 | 544,810 | 342,585 |
VIP Investor Freedom 2015 | 535,567 | 542,125 |
VIP Investor Freedom 2020 | 664,249 | 763,715 |
VIP Investor Freedom 2025 | 194,824 | 246,878 |
VIP Investor Freedom 2030 | 203,695 | 301,273 |
The tax character of distributions paid was as follows:
December 31, 2006 | Ordinary Income |
VIP Investor Freedom Income | $ 18,224 |
VIP Investor Freedom 2005 | 11,222 |
VIP Investor Freedom 2010 | 47,558 |
VIP Investor Freedom 2015 | 37,916 |
VIP Investor Freedom 2020 | 71,710 |
VIP Investor Freedom 2025 | 16,468 |
VIP Investor Freedom 2030 | 27,477 |
New Accounting Pronouncements. In July 2006, Financial Accounting Standards Board Interpretation No. 48, Accounting for Uncertainty in Income Taxes - an interpretation of FASB Statement 109 (FIN 48), was issued and is effective on the last business day of the semiannual reporting period for fiscal years beginning after December 15, 2006. FIN 48 sets forth a threshold for financial statement recognition, measurement and disclosure of a tax position taken or expected to be taken on a tax return. Management is currently evaluating the impact, if any, the adoption of FIN 48 will have on the Funds' net assets, results of operations and financial statement disclosures.
In addition, in September 2006, Statement of Financial Accounting Standards No. 157, Fair Value Measurements (SFAS 157), was issued and is effective for fiscal years beginning after November 15, 2007. SFAS 157 defines fair value, establishes a framework for measuring fair value and expands disclosures about fair value measurements. Management is currently evaluating the impact the adoption of SFAS 157 will have on the Funds' financial statement disclosures.
2. Operating Policies.
Repurchase Agreements. FMR has received an Exemptive Order from the Securities and Exchange Commission (the SEC) which permits certain Funds and other affiliated entities of FMR to transfer uninvested cash balances into joint trading accounts which are then invested in repurchase agreements. Certain Funds may also invest directly with institutions in repurchase agreements. Repurchase agreements are collateralized by government or non-government securities. Upon settlement date, collateral is held in segregated accounts with custodian banks and may be obtained in the event of a default of the counterparty. Each applicable Fund monitors, on a daily basis, the value of the collateral to ensure it is at least equal to the principal amount of the repurchase agreement (including accrued interest). In the event of a default by the counterparty, realization of the collateral proceeds could be delayed, during which time the value of the collateral may decline.
3. Purchases and Sales of Investments.
Purchases and redemptions of the underlying fund shares are noted in the table below.
| Purchases ($) | Redemptions ($) |
VIP Investor Freedom Income | 11,018,393 | 2,983,021 |
VIP Investor Freedom 2005 | 4,453,367 | 1,817,870 |
VIP Investor Freedom 2010 | 26,871,637 | 6,542,045 |
VIP Investor Freedom 2015 | 35,176,220 | 4,048,077 |
VIP Investor Freedom 2020 | 38,743,052 | 4,380,460 |
VIP Investor Freedom 2025 | 13,157,112 | 1,621,764 |
VIP Investor Freedom 2030 | 12,865,542 | 3,511,499 |
Annual Report
Notes to Financial Statements - continued
4. Fees and Other Transactions with Affiliates.
Management Fee. Strategic Advisers, Inc. (Strategic Advisers), an affiliate of FMR, provides the Funds with investment management related services. The Funds do not pay any fees for these services.
Other Transactions. Strategic Advisers, Inc. (Strategic Advisers) has entered into an administration agreement with FMR under which FMR provides management and administrative services (other than investment advisory services) necessary for the operation of each Fund. Pursuant to this agreement, FMR pays all expenses of each Fund, excluding the compensation of the independent Trustees and certain other expenses such as interest expense. FMR also contracts with other Fidelity companies to perform the services necessary for the operation of each Fund. The Funds do not pay any fees for these services.
5. Expense Reductions.
FMR voluntarily agreed to reimburse the funds to the extent annual operating expenses exceeded certain levels of average net assets. Total expenses are limited to 0.00% of average net assets. Some expenses, for example interest expense, are excluded from this reimbursement.
The following amounts were reimbursed during the period:
| Reimbursement
from adviser |
VIP Investor Freedom Income | $ 25 |
VIP Investor Freedom 2005 | 11 |
VIP Investor Freedom 2010 | 76 |
VIP Investor Freedom 2015 | 89 |
VIP Investor Freedom 2020 | 99 |
VIP Investor Freedom 2025 | 29 |
VIP Investor Freedom 2030 | 33 |
6. Other.
The Funds' organizational documents provide former and current trustees and officers with a limited indemnification against liabilities arising in connection with the performance of their duties to the Funds. In the normal course of business, the Funds may also enter into contracts that provide general indemnifications. The Funds' maximum exposure under these arrangements is unknown as this would be dependent on future claims that may be made against the Funds. The risk of material loss from such claims is considered remote.
At the end of the period, FMR or its affiliates were owners of record of more than 10% of the outstanding shares of the following funds:
| Affiliated % |
VIP Investor Freedom Income | 100% |
VIP Investor Freedom 2005 | 100% |
VIP Investor Freedom 2010 | 100% |
VIP Investor Freedom 2015 | 100% |
VIP Investor Freedom 2020 | 100% |
VIP Investor Freedom 2025 | 100% |
VIP Investor Freedom 2030 | 100% |
VIP Investor Freedom Portfolios
Report of Independent Registered Public Accounting Firm
To the Trustees of Variable Insurance Products IV and the Shareholders of VIP Investor Freedom Income Portfolio, VIP Investor Freedom 2005 Portfolio, VIP Investor Freedom 2010 Portfolio, VIP Investor Freedom 2015 Portfolio, VIP Investor Freedom 2020 Portfolio, VIP Investor Freedom 2025 Portfolio, VIP Investor Freedom 2030 Portfolio:
In our opinion, the accompanying statements of assets and liabilities, including the schedules of investments, and the related statements of operations and of changes in net assets and the financial highlights present fairly, in all material respects, the financial position of VIP Investor Freedom Income Portfolio, VIP Investor Freedom 2005 Portfolio, VIP Investor Freedom 2010 Portfolio, VIP Investor Freedom 2015 Portfolio, VIP Investor Freedom 2020 Portfolio, VIP Investor Freedom 2025 Portfolio and VIP Investor Freedom 2030 Portfolio (the Funds), each a fund of Variable Insurance Products IV Trust at December 31, 2006, the results of each of their operations for the year then ended, the changes in each of their net assets and the financial highlights for the periods indicated, in conformity with accounting principles generally accepted in the United States of America. These financial statements and financial highlights (hereafter referred to as "financial statements") are the responsibility of the Funds' management; our responsibility is to express an opinion on these financial statements based on our audits. We conducted our audits of these financial statements in accordance with the standards of the Public Company Accounting Oversight Board (United States). Those standards require that we plan and perform the audit to obtain reasonable assurance about whether the financial statements are free of material misstatement. An audit includes examining, on a test basis, evidence supporting the amounts and disclosures in the financial statements, assessing the accounting principles used and significant estimates made by management, and evaluating the overall financial statement presentation. We believe that our audits, which included confirmation of securities at December 31, 2006 by correspondence with the transfer agent, provide a reasonable basis for our opinion.
/s/ PricewaterhouseCoopers LLP
PricewaterhouseCoopers LLP
Boston, Massachusetts
February 16, 2007
Annual Report
Trustees and Officers
The Trustees, Member of the Advisory Board, and executive officers of the trust and funds, as applicable, are listed below. The Board of Trustees governs each fund and is responsible for protecting the interests of shareholders. The Trustees are experienced executives who meet periodically throughout the year to oversee each fund's activities, review contractual arrangements with companies that provide services to each fund, and review each fund's performance. Each of the Trustees oversees 348 funds advised by FMR or an affiliate.
The Trustees hold office without limit in time except that (a) any Trustee may resign; (b) any Trustee may be removed by written instrument, signed by at least two-thirds of the number of Trustees prior to such removal; (c) any Trustee who requests to be retired or who has become incapacitated by illness or injury may be retired by written instrument signed by a majority of the other Trustees; and (d) any Trustee may be removed at any special meeting of shareholders by a two-thirds vote of the outstanding voting securities of the trust. Each Trustee who is not an interested person (as defined in the 1940 Act) (Independent Trustee), shall retire not later than the last day of the calendar year in which his or her 72nd birthday occurs. The Independent Trustees may waive this mandatory retirement age policy with respect to individual Trustees. The executive officers and Advisory Board Member hold office without limit in time, except that any officer and Advisory Board Member may resign or may be removed by a vote of a majority of the Trustees at any regular meeting or any special meeting of the Trustees. Except as indicated, each individual has held the office shown or other offices in the same company for the past five years.
The fund's Statement of Additional Information (SAI) includes more information about the Trustees. To request a free copy, call Fidelity at 1-800-208-0098.
Interested Trustees*:
Correspondence intended for each Trustee who is an interested person may be sent to Fidelity Investments, 82 Devonshire Street, Boston, Massachusetts 02109.
Name, Age; Principal Occupation |
Edward C. Johnson 3d (76) |
| Year of Election or Appointment: 1983 Mr. Johnson is Chairman of the Board of Trustees. Mr. Johnson serves as President (2006-present), Chief Executive Officer, Chairman, and a Director of FMR Corp.; Chairman and a Director of FMR; Chairman and a Director of Fidelity Research & Analysis Company (FRAC); Chairman and a Director of Fidelity Investments Money Management, Inc.; and Chairman (2001-present) and a Director of FMR Co., Inc. In addition, Mr. Johnson serves as Chairman and Director of Fidelity International Limited (FIL). |
Robert L. Reynolds (54) |
| Year of Election or Appointment: 2003 Mr. Reynolds is President and a Director of FMR (2005-present), Fidelity Investments Money Management, Inc. (2005-present), and FMR Co., Inc. (2005-present). Mr. Reynolds also serves as Vice Chairman (2006-present), a Director (2003-present), and Chief Operating Officer of FMR Corp. and a Director of Strategic Advisers, Inc. (2005-present). He also serves on the Board at Fidelity Investments Canada, Ltd. |
* Trustees have been determined to be "Interested Trustees" by virtue of, among other things, their affiliation with the trust or various entities under common control with FMR.
Independent Trustees:
Correspondence intended for each Independent Trustee (that is, the Trustees other than the Interested Trustees) may be sent to Fidelity Investments, P.O. Box 55235, Boston, Massachusetts 02205-5235.
Name, Age; Principal Occupation |
Dennis J. Dirks (58) |
| Year of Election or Appointment: 2005 Prior to his retirement in May 2003, Mr. Dirks was Chief Operating Officer and a member of the Board of The Depository Trust & Clearing Corporation (DTCC) (1999-2003). He also served as President, Chief Operating Officer, and Board member of The Depository Trust Company (DTC) (1999-2003) and President and Board member of the National Securities Clearing Corporation (NSCC) (1999-2003). In addition, Mr. Dirks served as Chief Executive Officer and Board member of the Government Securities Clearing Corporation (2001-2003) and Chief Executive Officer and Board member of the Mortgage-Backed Securities Clearing Corporation (2001-2003). Mr. Dirks also serves as a Trustee and a member of the Finance Committee of Manhattan College (2005-present) and a Trustee and a member of the Finance Committee of AHRC of Nassau County (2006-present). |
Albert R. Gamper, Jr. (64) |
| Year of Election or Appointment: 2006 Prior to his retirement in December 2004, Mr. Gamper served as Chairman of the Board of CIT Group Inc. (commercial finance). During his tenure with CIT Group Inc. Mr. Gamper served in numerous senior management positions, including Chairman (1987-1989; 1999-2001; 2002-2004), Chief Executive Officer (1987-2004), and President (1989-2002). He currently serves as a member of the Board of Directors of Public Service Enterprise Group (utilities, 2001-present), Chairman of the Board of Governors, Rutgers University (2004-present), and Chairman of the Board of Saint Barnabas Health Care System. |
George H. Heilmeier (70) |
| Year of Election or Appointment: 2004 Dr. Heilmeier is Chairman Emeritus of Telcordia Technologies (communication software and systems), where prior to his retirement, he served as company Chairman and Chief Executive Officer. He currently serves on the Boards of Directors of The Mitre Corporation (systems engineering and information technology support for the government), and HRL Laboratories (private research and development, 2004-present). He is Chairman of the General Motors Science & Technology Advisory Board and a Life Fellow of the Institute of Electrical and Electronics Engineers (IEEE). Dr. Heilmeier is a member of the Defense Science Board and the National Security Agency Advisory Board. He is also a member of the National Academy of Engineering, the American Academy of Arts and Sciences, and the Board of Overseers of the School of Engineering and Applied Science of the University of Pennsylvania. Previously, Dr. Heilmeier served as a Director of TRW Inc. (automotive, space, defense, and information technology, 1992-2002), Compaq (1994-2002), Automatic Data Processing, Inc. (ADP) (technology-based business outsourcing, 1995-2002), INET Technologies Inc. (telecommunications network surveillance, 2001-2004), and Teletech Holdings (customer management services). He is the recipient of the 2005 Kyoto Prize in Advanced Technology for his invention of the liquid crystal display, and a member of the Consumer Electronics Hall of Fame. |
James H. Keyes (66) |
| Year of Election or Appointment: 2007 Prior to his retirement in 2003, Mr. Keyes was Chairman, President, and Chief Executive Officer of Johnson Controls, Inc. (automotive supplier, 1993-2003). He currently serves as a member of the boards of LSI Logic Corporation (semiconductor technologies), Navistar International Corporation (manufacture and sale of trucks, buses, and diesel engines, 2002-present), and Pitney Bowes, Inc. (integrated mail, messaging, and document management solutions). |
Marie L. Knowles (60) |
| Year of Election or Appointment: 2001 Prior to Ms. Knowles' retirement in June 2000, she served as Executive Vice President and Chief Financial Officer of Atlantic Richfield Company (ARCO) (diversified energy, 1996-2000). From 1993 to 1996, she was a Senior Vice President of ARCO and President of ARCO Transportation Company. She served as a Director of ARCO from 1996 to 1998. She currently serves as a Director of Phelps Dodge Corporation (copper mining and manufacturing) and McKesson Corporation (healthcare service, 2002-present). Ms. Knowles is a Trustee of the Brookings Institution and the Catalina Island Conservancy and also serves as a member of the Advisory Board for the School of Engineering of the University of Southern California. |
Ned C. Lautenbach (62) |
| Year of Election or Appointment: 2000 Mr. Lautenbach is Chairman of the Independent Trustees (2006-present). Mr. Lautenbach has been a partner of Clayton, Dubilier & Rice, Inc. (private equity investment firm) since September 1998. Previously, Mr. Lautenbach was with the International Business Machines Corporation (IBM) from 1968 until his retirement in 1998. Mr. Lautenbach serves as a Director of Sony Corporation (2006-present) and Eaton Corporation (diversified industrial) as well as the Philharmonic Center for the Arts in Naples, Florida. He also is a member of the Board of Trustees of Fairfield University (2005-present), as well as a member of the Council on Foreign Relations. |
Cornelia M. Small (62) |
| Year of Election or Appointment: 2005 Ms. Small is a member (2000-present) and Chairperson (2002-present) of the Investment Committee, and a member (2002-present) of the Board of Trustees of Smith College. Previously, she served as Chief Investment Officer (1999-2000), Director of Global Equity Investments (1996-1999), and a member of the Board of Directors of Scudder, Stevens & Clark (1990-1997) and Scudder Kemper Investments (1997-1999). In addition, Ms. Small served as Co-Chair (2000-2003) of the Annual Fund for the Fletcher School of Law and Diplomacy. |
William S. Stavropoulos (67) |
| Year of Election or Appointment: 2001 Mr. Stavropoulos is Chairman Emeritus of the Board of Directors of The Dow Chemical Company. Since joining The Dow Chemical Company in 1967, Mr. Stavropoulos served in numerous senior management positions, including President (1993-2000; 2002-2003), CEO (1995-2000; 2002-2004), and Chairman of the Executive Committee (2000-2004). Currently, he is a Director of NCR Corporation (data warehousing and technology solutions), BellSouth Corporation (telecommunications), Chemical Financial Corporation, Maersk Inc. (industrial conglomerate, 2002-present), and Metalmark Capital (private equity investment firm, 2005-present). He also serves as a member of the Board of Trustees of the American Enterprise Institute for Public Policy Research. In addition, Mr. Stavropoulos is a member of The Business Council, J.P. Morgan International Council and the University of Notre Dame Advisory Council for the College of Science. |
Kenneth L. Wolfe (67) |
| Year of Election or Appointment: 2005 Prior to his retirement in 2001, Mr. Wolfe was Chairman and Chief Executive Officer of Hershey Foods Corporation (1993-2001). He currently serves as a member of the boards of Adelphia Communications Corporation (2003-present), Bausch & Lomb, Inc., and Revlon Inc. (2004-present). |
Advisory Board Member and Executive Officers:
Correspondence intended for each executive officer and Mr. Lynch may be sent to Fidelity Investments, 82 Devonshire Street, Boston, Massachusetts 02109.
Name, Age; Principal Occupation |
Peter S. Lynch (62) |
| Year of Election or Appointment: 2003 Member of the Advisory Board of Variable Insurance Products Fund IV. Mr. Lynch is Vice Chairman and a Director of FMR, and Vice Chairman (2001-present) and a Director of FMR Co., Inc. Previously, Mr. Lynch served as a Trustee of the Fidelity funds (1990-2003). In addition, he serves as a Trustee of Boston College and as the Chairman of the Inner-City Scholarship Fund. |
Kimberley H. Monasterio (43) |
| Year of Election or Appointment: 2007 President and Treasurer of VIP Investor Freedom Income, VIP Investor Freedom 2005, VIP Investor Freedom 2010, VIP Investor Freedom 2015, VIP Investor Freedom 2020, VIP Investor Freedom 2025, and VIP Investor Freedom 2030. Ms. Monasterio also serves as President and Treasurer of other Fidelity funds (2007-present) and is an employee of FMR (2004-present). Previously, Ms. Monasterio served as Deputy Treasurer of the Fidelity funds (2004-2006). Before joining Fidelity Investments, Ms. Monasterio served as Treasurer (2000-2004) and Chief Financial Officer (2002-2004) of the Franklin Templeton Funds and Senior Vice President of Franklin Templeton Services, LLC (2000-2004). |
Boyce I. Greer (50) |
| Year of Election or Appointment: 2005 Vice President of VIP Investor Freedom Income, VIP Investor Freedom 2005, VIP Investor Freedom 2010, VIP Investor Freedom 2015, VIP Investor Freedom 2020, VIP Investor Freedom 2025, and VIP Investor Freedom 2030. Mr. Greer also serves as Vice President of certain Equity Funds (2005-present), certain Asset Allocation Funds (2005-present), Fixed-Income Funds (2006-present), and Money Market Funds (2006-present). Mr. Greer is also a Trustee of other investment companies advised by FMR (2003-present). He is an Executive Vice President of FMR (2005-present) and FMR Co., Inc. (2005-present), and Senior Vice President of Fidelity Investments Money Management, Inc. (2006-present). Previously, Mr. Greer served as a Director and Managing Director of Strategic Advisers, Inc. (2002-2005), and Executive Vice President (2000-2002) and Money Market Group Leader (1997-2002) of the Fidelity Investments Fixed Income Division. He also served as Vice President of Fidelity's Money Market Funds (1997-2002), Senior Vice President of FMR (1997-2002), and Vice President of FIMM (1998-2002). |
Ren Cheng (49) |
| Year of Election or Appointment: 2005 Vice President of VIP Investor Freedom Income, VIP Investor Freedom 2005, VIP Investor Freedom 2010, VIP Investor Freedom 2015, VIP Investor Freedom 2020, VIP Investor Freedom 2025, and VIP Investor Freedom 2030. Mr. Cheng also serves as Vice President for other funds advised by FMR. Prior to asuming his current responsibilities, Mr. Cheng worked as a portfolio manager. Mr. Cheng also serves as Vice President of FMR and FMR Co., Inc (2002). |
Christopher L. Sharpe (38) |
| Year of Election or Appointment: 2006 Vice President of VIP Investor Freedom Income, VIP Investor Freedom 2005, VIP Investor Freedom 2010, VIP Investor Freedom 2015, VIP Investor Freedom 2020, VIP Investor Freedom 2025, and VIP Investor Freedom 2030. Mr. Sharpe also serves as Vice President of other funds advised by FMR. Prior to assuming his current responsibilities, Mr. Sharpe worked as an associate investment policy officer for John Hancock Financial Services, Inc. in Boston. From 1990 to 2000 he was with William M. Mercer, Inc. in Boston. Mr. Sharpe also serves as Vice President of FMR and FMR Co., Inc. (2006). |
Eric D. Roiter (58) |
| Year of Election or Appointment: 2005 Secretary of VIP Investor Freedom Income, VIP Investor Freedom 2005, VIP Investor Freedom 2010, VIP Investor Freedom 2015, VIP Investor Freedom 2020, VIP Investor Freedom 2025, and VIP Investor Freedom 2030. He also serves as Secretary of other Fidelity funds; Vice President, General Counsel, and Secretary of FMR Co., Inc. (2001-present) and FMR; Assistant Secretary of Fidelity Management & Research (U.K.) Inc. (2001-present), Fidelity Research & Analysis Company (2001-present), and Fidelity Investments Money Management, Inc. (2001-present). Mr. Roiter is an Adjunct Member, Faculty of Law, at Boston College Law School (2003-present). Previously, Mr. Roiter served as Vice President and Secretary of Fidelity Distributors Corporation (FDC) (1998-2005). |
Stuart Fross (47) |
| Year of Election or Appointment: 2005 Assistant Secretary of VIP Investor Freedom Income, VIP Investor Freedom 2005, VIP Investor Freedom 2010, VIP Investor Freedom 2015, VIP Investor Freedom 2020, VIP Investor Freedom 2025, and VIP Investor Freedom 2030. Mr. Fross also serves as Assistant Secretary of other Fidelity funds (2003-present), Vice President and Secretary of FDC (2005-present), and is an employee of FMR. |
R. Stephen Ganis (40) |
| Year of Election or Appointment: 2006 Anti-Money Laundering (AML) officer of VIP Investor Freedom Income, VIP Investor Freedom 2005, VIP Investor Freedom 2010, VIP Investor Freedom 2015, VIP Investor Freedom 2020, VIP Investor Freedom 2025, and VIP Investor Freedom 2030. Mr. Ganis also serves as AML officer of other Fidelity funds (2006-present) and FMR Corp. (2003-present). Before joining Fidelity Investments, Mr. Ganis practiced law at Goodwin Procter, LLP (2000-2002). |
Joseph B. Hollis (58) |
| Year of Election or Appointment: 2006 Chief Financial Officer of VIP Investor Freedom Income, VIP Investor Freedom 2005, VIP Investor Freedom 2010, VIP Investor Freedom 2015, VIP Investor Freedom 2020, VIP Investor Freedom 2025, and VIP Investor Freedom 2030. Mr. Hollis also serves as Chief Financial Officer of other Fidelity funds. Mr. Hollis is President of Fidelity Pricing and Cash Management Services (FPCMS) (2005-present). Mr. Hollis also serves as President and Director of Fidelity Service Company, Inc. (2006-present). Previously, Mr. Hollis served as Senior Vice President of Cash Management Services (1999-2002) and Investment Management Operations (2002-2005). |
Kenneth A. Rathgeber (59) |
| Year of Election or Appointment: 2005 Chief Compliance Officer of VIP Investor Freedom Income, VIP Investor Freedom 2005, VIP Investor Freedom 2010, VIP Investor Freedom 2015, VIP Investor Freedom 2020, VIP Investor Freedom 2025, and VIP Investor Freedom 2030. Mr. Rathgeber also serves as Chief Compliance Officer of other Fidelity funds (2004-present) and Executive Vice President of Risk Oversight for Fidelity Investments (2002-present). He is Chief Compliance Officer of FMR (2005-present), FMR Co., Inc. (2005-present), Fidelity Management & Research (U.K.) Inc. (2005-present), Fidelity Research & Analysis Company (2005-present), Fidelity Investments Money Management, Inc. (2005-present), and Strategic Advisers, Inc. (2005-present). Previously, Mr. Rathgeber served as Executive Vice President and Chief Operating Officer for Fidelity Investments Institutional Services Company, Inc. (1998-2002). |
Bryan A. Mehrmann (45) |
| Year of Election or Appointment: 2005 Deputy Treasurer of VIP Investor Freedom Income, VIP Investor Freedom 2005, VIP Investor Freedom 2010, VIP Investor Freedom 2015, VIP Investor Freedom 2020, VIP Investor Freedom 2025, and VIP Investor Freedom 2030. Mr. Mehrmann also serves as Deputy Treasurer of other Fidelity funds (2005-present) and is an employee of FMR. Previously, Mr. Mehrmann served as Vice President of Fidelity Investments Institutional Services Group (FIIS)/Fidelity Investments Institutional Operations Corporation, Inc. (FIIOC) Client Services (1998-2004). |
Kenneth B. Robins (37) |
| Year of Election or Appointment: 2005 Deputy Treasurer of VIP Investor Freedom Income, VIP Investor Freedom 2005, VIP Investor Freedom 2010, VIP Investor Freedom 2015, VIP Investor Freedom 2020, VIP Investor Freedom 2025, and VIP Investor Freedom 2030. Mr. Robins also serves as Deputy Treasurer of other Fidelity funds (2005-present) and is an employee of FMR (2004-present). Before joining Fidelity Investments, Mr. Robins worked at KPMG LLP, where he was a partner in KPMG's department of professional practice (2002-2004) and a Senior Manager (1999-2000). In addition, Mr. Robins served as Assistant Chief Accountant, United States Securities and Exchange Commission (2000-2002). |
Robert G. Byrnes (40) |
| Year of Election or Appointment: 2005 Assistant Treasurer of VIP Investor Freedom Income, VIP Investor Freedom 2005, VIP Investor Freedom 2010, VIP Investor Freedom 2015, VIP Investor Freedom 2020, VIP Investor Freedom 2025, and VIP Investor Freedom 2030. Mr. Byrnes also serves as Assistant Treasurer of other Fidelity funds (2005-present) and is an employee of FMR (2005-present). Previously, Mr. Byrnes served as Vice President of FPCMS (2003-2005). Before joining Fidelity Investments, Mr. Byrnes worked at Deutsche Asset Management where he served as Vice President of the Investment Operations Group (2000-2003). |
John H. Costello (60) |
| Year of Election or Appointment: 2005 Assistant Treasurer of VIP Investor Freedom Income, VIP Investor Freedom 2005, VIP Investor Freedom 2010, VIP Investor Freedom 2015, VIP Investor Freedom 2020, VIP Investor Freedom 2025, and VIP Investor Freedom 2030. Mr. Costello also serves as Assistant Treasurer of other Fidelity funds and is an employee of FMR. |
Peter L. Lydecker (52) |
| Year of Election or Appointment: 2005 Assistant Treasurer of VIP Investor Freedom Income, VIP Investor Freedom 2005, VIP Investor Freedom 2010, VIP Investor Freedom 2015, VIP Investor Freedom 2020, VIP Investor Freedom 2025, and VIP Investor Freedom 2030. Mr. Lydecker also serves as Assistant Treasurer of other Fidelity funds (2004) and is an employee of FMR. |
Mark Osterheld (51) |
| Year of Election or Appointment: 2005 Assistant Treasurer of VIP Investor Freedom Income, VIP Investor Freedom 2005, VIP Investor Freedom 2010, VIP Investor Freedom 2015, VIP Investor Freedom 2020, VIP Investor Freedom 2025, and VIP Investor Freedom 2030. Mr. Osterheld also serves as Assistant Treasurer of other Fidelity funds (2002) and is an employee of FMR. |
Gary W. Ryan (48) |
| Year of Election or Appointment: 2005 Assistant Treasurer of VIP Investor Freedom Income, VIP Investor Freedom 2005, VIP Investor Freedom 2010, VIP Investor Freedom 2015, VIP Investor Freedom 2020, VIP Investor Freedom 2025, and VIP Investor Freedom 2030. Mr. Ryan also serves as Assistant Treasurer of other Fidelity funds (2005-present) and is an employee of FMR (2005-present). Previously, Mr. Ryan served as Vice President of Fund Reporting in FPCMS (1999-2005). |
Salvatore Schiavone (41) |
| Year of Election or Appointment: 2005 Assistant Treasurer of VIP Investor Freedom Income, VIP Investor Freedom 2005, VIP Investor Freedom 2010, VIP Investor Freedom 2015, VIP Investor Freedom 2020, VIP Investor Freedom 2025, and VIP Investor Freedom 2030. Mr. Schiavone also serves as Assistant Treasurer of other Fidelity funds (2005-present) and is an employee of FMR (2005-present). Before joining Fidelity Investments, Mr. Schiavone worked at Deutsche Asset Management, where he most recently served as Assistant Treasurer (2003-2005) of the Scudder Funds and Vice President and Head of Fund Reporting (1996-2003). |
VIP Investor Freedom Portfolios
Distributions
The Board of Trustees of each fund voted to pay to shareholders of record at the opening of business on record date, the following distributions per share derived from capital gains realized from sales of portfolio securities and dividends derived from net investment income:
| Pay Date | Record Date | Dividends | Capital Gains |
VIP Investor Freedom Income | 02/09/07 | 02/09/07 | $0.235 | $0.055 |
VIP Investor Freedom 2005 | 02/09/07 | 02/09/07 | $0.175 | $0.12 |
VIP Investor Freedom 2010 | 02/09/07 | 02/09/07 | $0.18 | $0.135 |
VIP Investor Freedom 2015 | 02/09/07 | 02/09/07 | $0.135 | $0.16 |
VIP Investor Freedom 2020 | 02/09/07 | 02/09/07 | $0.14 | $0.19 |
VIP Investor Freedom 2025 | 02/09/07 | 02/09/07 | $0.13 | $0.21 |
VIP Investor Freedom 2030 | 02/09/07 | 02/09/07 | $0.13 | $0.24 |
The funds hereby designate as capital gain dividend the amounts noted below for the taxable year ended December 31, 2006, or, if subsequently determined to be different, the net capital gain of such year.
Fund |
|
VIP Investor Freedom Income | $52,126 |
VIP Investor Freedom 2005 | $51,554 |
VIP Investor Freedom 2010 | $342,585 |
VIP Investor Freedom 2015 | $542,125 |
VIP Investor Freedom 2020 | $763,715 |
VIP Investor Freedom 2025 | $246,878 |
VIP Investor Freedom 2030 | $301,273 |
A percentage of the dividends distributed during the fiscal year for the following funds qualifies for the dividends-received deduction for corporate shareholders:
VIP Investor Freedom Income | 2% |
VIP Investor Freedom 2005 | 15% |
VIP Investor Freedom 2010 | 12% |
VIP Investor Freedom 2015 | 10% |
VIP Investor Freedom 2020 | 16% |
VIP Investor Freedom 2025 | 16% |
VIP Investor Freedom 2030 | 2% |
The fund will notify shareholders in January 2007 of amounts for use in preparing 2006 income tax returns.
Annual Report
Proxy Voting Results
A special meeting of each fund's shareholders was held on September 20, 2006. The results of votes taken among shareholders on the proposal before them are reported below. Each vote reported represents one dollar of net asset value held on the record date for the meeting.
PROPOSAL 1 |
To elect a Board of Trustees. A |
| # of
Votes | % of
Votes |
Dennis J. Dirks |
Affirmative | 92,459,317.52 | 96.102 |
Withheld | 3,749,837.05 | 3.898 |
TOTAL | 96,209,154.57 | 100.00 |
Albert R. Gamper, Jr. |
Affirmative | 92,260,598.99 | 95.896 |
Withheld | 3,948,555.58 | 4.104 |
TOTAL | 96,209,154.57 | 100.000 |
Robert M. Gates |
Affirmative | 92,315,480.72 | 95.953 |
Withheld | 3,893,673.85 | 4.047 |
TOTAL | 96,209,154.57 | 100.000 |
George H. Heilmeier |
Affirmative | 92,208,255.41 | 95.841 |
Withheld | 4,000,899.16 | 4.159 |
TOTAL | 96,209,154.57 | 100.000 |
Edward C. Johnson 3d |
Affirmative | 91,928,267.76 | 95.550 |
Withheld | 4,280,886.81 | 4.450 |
TOTAL | 96,209,154.57 | 100.000 |
Stephen P. Jonas |
Affirmative | 92,457,628.76 | 96.101 |
Withheld | 3,751,525.81 | 3.899 |
TOTAL | 96,209,154.57 | 100.000 |
James H. KeyesB |
Affirmative | 92,432,729.82 | 96.075 |
Withheld | 3,776,424.75 | 3.925 |
TOTAL | 96,209,154.57 | 100.000 |
| # of
Votes | % of
Votes |
Marie L. Knowles |
Affirmative | 92,398,847.52 | 96.040 |
Withheld | 3,810,307.05 | 3.960 |
TOTAL | 96,209,154.57 | 100.000 |
Ned C. Lautenbach |
Affirmative | 92,423,184.47 | 96.065 |
Withheld | 3,785,970.10 | 3.935 |
TOTAL | 96,209,154.57 | 100.000 |
William O. McCoy |
Affirmative | 92,086,293.90 | 95.715 |
Withheld | 4,122,860.67 | 4.285 |
TOTAL | 96,209,154.57 | 100.000 |
Robert L. Reynolds |
Affirmative | 92,439,032.86 | 96.081 |
Withheld | 3,770,121.71 | 3.919 |
TOTAL | 96,209,154.57 | 100.000 |
Cornelia M. Small |
Affirmative | 92,415,567.29 | 96.057 |
Withheld | 3,793,587.28 | 3.943 |
TOTAL | 96,209,154.57 | 100.000 |
William S. Stavropoulos |
Affirmative | 92,135,400.08 | 95.766 |
Withheld | 4,073,754.49 | 4.234 |
TOTAL | 96,209,154.57 | 100.000 |
Kenneth L. Wolfe |
Affirmative | 92,445,865.31 | 96.088 |
Withheld | 3,763,289.26 | 3.912 |
TOTAL | 96,209,154.57 | 100.000 |
A Denotes trust-wide proposal and voting results. B Effective on or about January 1, 2007. |
VIP Investor Freedom Portfolios
Board Approval of Investment Advisory Contracts and Management Fees
VIP Investor Freedom Funds
Each year, typically in July, the Board of Trustees, including the Independent Trustees (together, the Board), votes on the renewal of the management contract and administration agreement (together, the Advisory Contracts) for each fund. The Board, assisted by the advice of fund counsel and Independent Trustees' counsel, requests and considers a broad range of information throughout the year.
The Board meets regularly each month except August and takes into account throughout the year matters bearing on Advisory Contracts. The Board, acting directly and through its separate committees, considers at each of its meetings factors that are relevant to the annual renewal of each fund's Advisory Contracts, including the services and support provided to each fund and its shareholders. At the time of the renewal, the Board had 12 standing committees, each composed of Independent Trustees with varying backgrounds, to which the Board has assigned specific subject matter responsibilities in order to enhance effective decision-making by the Board. Each committee has adopted a written charter outlining the structure and purposes of the committee. One such committee, the Equity Contract Committee, meets periodically as needed throughout the year to consider matters specifically related to the annual renewal of Advisory Contracts. The committee requests and receives information on, and makes recommendations to the Independent Trustees concerning, the approval and annual review of the Advisory Contracts.
At its July 2006 meeting, the Board of Trustees, including the Independent Trustees, unanimously determined to renew the Advisory Contracts for each fund. In reaching its determination, the Board considered all factors it believed relevant and ultimately reached a determination, with the assistance of fund counsel and Independent Trustees' counsel, that the renewal of the Advisory Contracts and the compensation to be received by Fidelity under the management contracts is consistent with Fidelity's fiduciary duty under applicable law.
Nature, Extent, and Quality of Services Provided. The Board considered staffing within the investment adviser, Strategic Advisers, Inc. (Strategic Advisers), and the administrator, FMR, including the backgrounds of the funds' portfolio managers and the funds' investment objectives and disciplines. The Independent Trustees also had discussions with senior management of Fidelity's investment operations and investment groups. The Board considered the structure of the portfolio manager compensation program and whether this structure provides appropriate incentives.
Resources Dedicated to Investment Management and Support Services. The Board reviewed the size, education, and experience of Strategic Advisers' investment staff, their use of technology, and Strategic Advisers' and FMR's approach to recruiting, training, and retaining portfolio managers and other research, advisory, and management personnel. The Board noted that Fidelity's analysts have access to a variety of technological tools that enable them to perform both fundamental and quantitative analysis and to specialize in various disciplines.
Shareholder and Administrative Services. The Board considered (i) the nature, extent, quality, and cost of administrative, distribution, and shareholder services performed by FMR and its affiliates under the Advisory Contracts and under separate agreements covering transfer agency, pricing and bookkeeping, and securities lending services for each fund; (ii) the nature and extent of FMR's supervision of third party service providers, principally custodians and subcustodians; and (iii) the resources devoted to, and the record of compliance with, each fund's compliance policies and procedures.
The Board noted that the growth of fund assets across the complex allows Fidelity to reinvest in the development of services designed to enhance the value or convenience of the Fidelity funds as investment vehicles. These services include 24-hour access to account information and market information through phone representatives and over the Internet, and investor education materials and asset allocation tools.
Investment in a Large Fund Family. The Board considered the benefits to shareholders of investing in a Fidelity fund, including the benefits of investing in a fund that is part of a large family of funds offering a variety of investment disciplines and providing for a large variety of mutual fund investor services. The Board noted that, since July 2005, Fidelity has taken a number of actions that benefited particular funds, including (i) dedicating additional resources to investment research and to restructure the investment research teams; (ii) voluntarily entering into contractual arrangements with certain brokers pursuant to which Fidelity pays for research products and services separately out of its own resources, rather than bundling with fund commissions; (iii) launching the Fidelity Advantage Class of its five Spartan stock index funds and three Spartan bond index funds, which is a lower-fee class available to shareholders with higher account balances; (iv) contractually agreeing to impose expense limitations on Fidelity U.S. Bond Index Fund and reducing the fund's initial investment minimum; and (v) offering shareholders of each of the Fidelity Institutional Money Market Funds the privilege of exchanging shares of the fund for shares of other Fidelity funds.
Investment Performance and Compliance. The Board considered whether each fund has operated within its investment objective, as well as its record of compliance with its investment restrictions. The Board noted that it is not possible to evaluate performance in any comprehensive fashion because each fund had been in operation for less than one calendar year. Once a fund has been in operation for at least one calendar year, the Board will review the fund's absolute investment performance, as well as the fund's relative investment performance measured against a proprietary custom index and a peer group of mutual funds.
The Board considered that FMR has taken steps to refocus and strengthen equity research, equity portfolio management, and compliance. The Board noted with favor FMR's reorganization of its senior management team in 2005 and FMR's dedication of additional resources to investment research, and participated in the process that led to those changes.
Annual Report
Board Approval of Investment Advisory Contracts and Management Fees - continued
Based on its review, and giving particular weight to the nature and quality of the resources dedicated by Strategic Advisers and FMR to maintain and improve relative performance, the Board concluded that the nature, extent, and quality of the services provided to each fund will benefit each fund's shareholders, particularly in light of the Board's view that each fund's shareholders benefit from investing in a fund that is part of a large family of funds offering a variety of investment disciplines and services.
Competitiveness of Management Fee and Total Fund Expenses. The Board noted that the funds do not pay Strategic Advisers a management fee for investment advisory services.
The Board considered each fund's management fee and total expenses compared to "mapped groups" of competitive funds and classes. Fidelity creates "mapped groups" by combining similar Lipper investment objective categories that have comparable management fee characteristics. Combining Lipper investment objective categories aids the Board's management fee and total expense comparisons by broadening the competitive group used for comparison and by reducing the number of universes to which various Fidelity funds are compared.
The Board considered two proprietary management fee comparisons for the period of each fund's operations shown in the charts below. The group of Lipper funds used by the Board for management fee comparisons is referred to below as the "Total Mapped Group" and, for the reasons explained above, is broader than the Lipper peer group used by the Board for performance comparisons. The Total Mapped Group comparison focuses on a fund's standing relative to the total universe of comparable funds available to investors, in terms of gross management fees before expense reimbursements or caps. "TMG %" represents the percentage of funds in the Total Mapped Group that had management fees that were lower than a fund's. For example, a TMG % of 0% means that 100% of the funds in the Total Mapped Group had higher management fees than a fund. The "Asset-Size Peer Group" (ASPG) comparison focuses on a fund's standing relative to non-Fidelity funds similar in size to the fund within the Total Mapped Group. The ASPG represents at least 15% of the funds in the Total Mapped Group with comparable asset size and management fee characteristics, subject to a minimum of 50 funds (or all funds in the Total Mapped Group if fewer than 50). Additional information, such as the ASPG quartile in which a fund's management fee ranked, is also included in the charts and considered by the Board.
VIP Investor Freedom 2005 Fund
VIP Investor Freedom Portfolios
VIP Investor Freedom 2010 Fund
VIP Investor Freedom 2015 Fund

Annual Report
Board Approval of Investment Advisory Contracts and Management Fees - continued
VIP Investor Freedom 2020 Fund
VIP Investor Freedom 2025 Fund
VIP Investor Freedom Portfolios
VIP Investor Freedom 2030 Fund
VIP Investor Freedom Income Fund
The Board noted that each fund's management fee ranked below the median of its Total Mapped Group and below the median of its ASPG for the period.
In its review of each fund's total expenses, the Board noted that each fund invests in Investor Class of the underlying fund to avoid charging fund-paid 12b-1 fees at both fund levels. The Board considered that the funds do not pay transfer agency fees. Instead, Investor Class of each underlying fund bears its pro rata portion of the VIP transfer agency fee according to the percentage of each fund's assets invested in that underlying fund. The Board further noted that FMR pays all other expenses of each fund, with limited exceptions.
The Board noted that each fund's total expenses ranked below its competitive median for the period.
In its review of total expenses, the Board also considered Fidelity fee structures and other information on clients that FMR and its affiliates service in other competitive markets, such as other mutual funds advised or subadvised by FMR or its affiliates, pension plan clients, and other institutional clients.
Based on its review, the Board concluded that each fund's management fee and total expenses were fair and reasonable in light of the services that the fund and its shareholders receive and the other factors considered.
Annual Report
Board Approval of Investment Advisory Contracts and Management Fees - continued
Costs of the Services and Profitability. The Board considered the level of Fidelity's profits in respect of all the Fidelity funds, as well as the profitability of each underlying fund.
PricewaterhouseCoopers LLP (PwC), independent registered accounting firm and auditor to Fidelity and certain Fidelity funds, has been engaged annually by the Board as part of the Board's assessment of the results of Fidelity's profitability analysis. PwC's engagement includes the review and assessment of Fidelity's methodologies used in determining the revenues and expenses attributable to Fidelity's mutual fund business, and completion of agreed-upon procedures surrounding the mathematical accuracy of fund profitability and its conformity to allocation methodologies. After considering PwC's reports issued under the engagement and information provided by Fidelity, the Board believes that while other allocation methods may also be reasonable, Fidelity's profitability methodologies are reasonable in all material respects.
The Board has also reviewed Fidelity's non-fund businesses and any fall-out benefits related to the mutual fund business as well as cases where Fidelity's affiliates may benefit from or be related to the funds' business.
The Board concluded that the costs of the services provided by and the profits realized by Fidelity in connection with the operation of each fund were not relevant to the renewal of each fund's Advisory Contracts because the funds do not pay management fees and FMR pays all other expenses of each fund, with limited exceptions.
Economies of Scale. The Board concluded that the realization of economies of scale was not relevant to the renewal of each fund's Advisory Contracts because the funds do not pay management fees and FMR pays all other expenses of each fund, with limited exceptions.
Additional Information Requested by the Board. In order to develop fully the factual basis for consideration of the Advisory Contracts, the Board requested additional information on several topics, including (i) Fidelity's fund profitability methodology and profitability trends within certain funds; (ii) portfolio manager compensation; (iii) the extent to which any economies of scale exist and are shared between the funds and Fidelity; (iv) the total expenses of certain funds and classes relative to competitors, including the extent to which the expenses of certain funds have been or could be capped; (v) fund performance trends; and (vi) Fidelity's fee structures, including use of performance fees.
Based on its evaluation of all of the conclusions noted above, and after considering all material factors, the Board ultimately concluded that the advisory fee structures are fair and reasonable, and that each fund's Advisory Contracts should be renewed.
VIP Investor Freedom Portfolios
Annual Report
VIP Investor Freedom Portfolios
Annual Report
Investment Adviser
Strategic Advisers, Inc.
Boston, MA
General Distributor
Fidelity Distributors Corporation
Boston, MA
Transfer and Service Agents
Fidelity Investments Institutional Operations Company, Inc.
Boston, MA
Fidelity Service Company, Inc.
Boston, MA
Custodian
Mellon Bank, N.A.
Pittsburgh, PA
VIPIFF-ANN-0207
1.814507.101
Fidelity® Variable Insurance Products:
Real Estate Portfolio
Annual Report
December 31, 2006
(2_fidelity_logos) (Registered_Trademark)
Contents
Performance | <Click Here> | How the fund has done over time. |
Management's Discussion | <Click Here> | The manager's review of fund performance, strategy and outlook. |
Shareholder Expense Example | <Click Here> | An example of shareholder expenses. |
Investment Changes | <Click Here> | A summary of major shifts in the fund's investments over the past six months. |
Investments | <Click Here> | A complete list of the fund's investments with their
market values. |
Financial Statements | <Click Here> | Statements of assets and liabilities, operations, and
changes in net assets, as well as financial highlights. |
Notes | <Click Here> | Notes to the financial statements. |
Report of Independent Registered Public Accounting Firm | <Click Here> | |
Trustees and Officers | <Click Here> | |
Distributions | <Click Here> | |
Proxy Voting Results | <Click Here> | |
Board Approval of Investment Advisory Contracts and Management Fees | <Click Here> | |
| | |
To view a fund's proxy voting guidelines and proxy voting record for the 12-month period ended June 30, visit www.fidelity.com/proxyvotingresults or visit the Securities and Exchange Commission's (SEC) web site at www.sec.gov. You may also call 1-877-208-0098 to request a free copy of the proxy voting guidelines.
Fidelity Variable Insurance Products are separate account options which are purchased through a variable insurance contract.
Standard & Poor's, S&P and S&P 500 are registered service marks of The McGraw-Hill Companies, Inc. and have been licensed for use by Fidelity Distributors Corporation.
Other third party marks appearing herein are the property of their respective owners.
All other marks appearing herein are registered or unregistered trademarks or service marks of FMR Corp. or an affiliated company.
This report and the financial statements contained herein are submitted for the general information of the shareholders of the fund. This report is not authorized for distribution to prospective investors in the fund unless preceded or accompanied by an effective prospectus.
A fund files its complete schedule of portfolio holdings with the SEC for the first and third quarters of each fiscal year on Form N-Q. Forms N-Q are available on the SEC's web site at http://www.sec.gov. A fund's Forms N-Q may be reviewed and copied at the SEC's Public Reference Room in Washington, DC. Information regarding the operation of the SEC's Public Reference Room may be obtained by calling 1-800-SEC-0330. For a complete list of a fund's portfolio holdings, view the most recent quarterly holdings report, semiannual report, or annual report on Fidelity's web site at http://www.advisor.fidelity.com.
NOT FDIC INSURED · MAY LOSE VALUE · NO BANK GUARANTEE
Neither the fund nor Fidelity Distributors Corporation is a bank.
VIP Real Estate Portfolio
VIP Real Estate Portfolio
Performance: The Bottom Line
Average annual total return reflects the change in the value of an investment, assuming reinvestment of the class' dividend income and capital gains (the profits earned upon the sale of securities that have grown in value) and assuming a constant rate of performance each year. During periods of reimbursement by Fidelity, a fund's total return will be greater than it would be had the reimbursement not occurred. Performance numbers are net of all underlying fund operating expenses, but do not include any insurance charges imposed by your insurance company's separate account. If performance information included the effect of these additional charges, the total returns would have been lower. How a fund did yesterday is no guarantee of how it will do tomorrow.
Average Annual Total Returns
Periods ended December 31, 2006 | | Past 1
year | Life of fund A |
VIP Real Estate - Initial Class | | 36.71% | 29.07% |
VIP Real Estate - Service Class B | | 36.61% | 28.94% |
VIP Real Estate - Service Class 2 C | | 36.35% | 28.75% |
VIP Real Estate - Investor Class D | | 36.53% | 29.01% |
A From November 6, 2002.
B Performance for Service Class shares reflects an asset-based service fee (12b-1 fee).
C Performance for Service Class 2 shares reflects an asset-based service fee (12b-1 fee).
D The initial offering of Investor Class shares took place on July 21, 2005. Returns prior to July 21, 2005 are those of Initial Class. If Investor Class's transfer agent fee had been reflected, returns prior to July 21, 2005 would have been lower.
$10,000 Over Life of Fund
Let's say hypothetically that $10,000 was invested in VIP Real Estate Portfolio - Initial Class on November 6, 2002, when the fund started. The chart shows how the value of your investment would have changed, and also shows how the Standard & Poor's 500SM Index performed over the same period.

Annual Report
VIP Real Estate Portfolio
Management's Discussion of Fund Performance
Comments from Samuel Wald, Portfolio Manager of VIP Real Estate Portfolio
U.S. stock markets registered their fourth consecutive year of positive returns in 2006. Among the highlights were the performances of the Dow Jones Industrial AverageSM - a gauge of 30 mega-cap, blue-chip stocks - and the small-cap-oriented Russell 2000® Index, both of which reached new highs. The efforts of the Federal Reserve Board to contain inflation levels also dominated the investment headlines. In all, the Fed hiked short-term interest rates four times, but held rates steady after its June 29 increase, finally pausing after 17 rate hikes over a two-year period. A slowing residential housing market and moderating oil prices - the latter of which hit a record closing high of $77 per barrel in July before falling sharply - also held economic growth in check. For the year overall, the Standard & Poor's 500SM Index was up 15.79%, the Dow advanced 19.05%, the Russell 2000 Index gained 18.37% and the NASDAQ Composite® Index rose 10.39%. For the seventh consecutive year, real estate investment trusts (REITs) outpaced the broad stock market, as measured by the S&P 500®, with the Dow Jones Wilshire® Real Estate Securities Index returning 35.67%.
For the 12 months ending December 31, 2006, the fund outpaced the Dow Jones Wilshire index and the S&P 500. (For specific portfolio performance results, please refer to the performance section of this report.) Improving real estate fundamentals and continued capital flows into real estate helped results relative to the broad stock market. Compared with the Dow Jones Wilshire benchmark, the fund benefited from good stock selection, especially in the strong performing office subsector, with SL Green Realty a standout. My choices within the hotels segment also contributed. In contrast, stock selection in apartments detracted, while the fund's modest cash weighting - reflecting the lag between when assets came into the fund and when I could find suitable investments to buy - was a drag on relative performance in a strong environment for real estate securities. The fund's top individual relative performer was Mills, in which I was underweighted and which was no longer in the portfolio at period end. This mall operator underperformed as it faced a series of accounting questions. Another positive was Starwood Hotels & Resorts Worldwide, which exited the benchmark during the year. Starwood, of which I owned various amounts at opportune times during the year, benefited from having a relatively inexpensive valuation. Among the disappointments were CBL & Associates and General Growth Properties, both mid-scale mall REITs that underperformed as the market became concerned about weaker consumer spending. Also lagging was HomeBanc Mortgage, a REIT that struggled as the housing market in the southeastern United States weakened.
The views expressed above reflect those of the portfolio manager(s) only through the end of the period as stated on the cover of this report and do not necessarily represent the views of Fidelity or any other person in the Fidelity organization. Any such views are subject to change at any time based upon market or other conditions and Fidelity disclaims any responsibility to update such views. These views may not be relied on as investment advice and, because investment decisions for a Fidelity fund are based on numerous factors, may not be relied on as an indication of trading intent on behalf of any Fidelity fund.
VIP Real Estate Portfolio
VIP Real Estate Portfolio
Shareholder Expense Example
As a shareholder of the Fund, you incur two types of costs: (1) transaction costs, and (2) ongoing costs, including management fees, distribution and/or service (12b-1) fees and other Fund expenses. This Example is intended to help you understand your ongoing costs (in dollars) of investing in the Fund and to compare these costs with the ongoing costs of investing in other mutual funds.
The Example is based on an investment of $1,000 invested at the beginning of the period and held for the entire period (July 1, 2006 to December 31, 2006).
Actual Expenses
The first line of the accompanying table for each class of the Fund provides information about actual account values and actual expenses. You may use the information in this line, together with the amount you invested, to estimate the expenses that you paid over the period. Simply divide your account value by $1,000.00 (for example, an $8,600 account value divided by $1,000.00 = 8.6), then multiply the result by the number in the first line for a class of the Fund under the heading entitled "Expenses Paid During Period" to estimate the expenses you paid on your account during this period. The estimate of expenses does not include any fees or other expenses of any variable annuity or variable life insurance product. If they were, the estimate of expenses you paid during the period would be higher, and your ending account value would be lower.
Hypothetical Example for Comparison Purposes
The second line of the accompanying table for each class of the Fund provides information about hypothetical account values and hypothetical expenses based on a Class' actual expense ratio and an assumed rate of return of 5% per year before expenses, which is not the Class' actual return. The hypothetical account values and expenses may not be used to estimate the actual ending account balance or expenses you paid for the period. You may use this information to compare the ongoing costs of investing in the Fund and other funds. To do so, compare this 5% hypothetical example with the 5% hypothetical examples that appear in the shareholder reports of the other funds. The estimate of expenses does not include any fees or other expenses of any variable annuity or variable life insurance product. If they were, the estimate of expenses you paid during the period would be higher, and your ending account value would be lower.
Please note that the expenses shown in the table are meant to highlight your ongoing costs only and do not reflect any transaction costs. Therefore, the second line of the table is useful in comparing ongoing costs only, and will not help you determine the relative total costs of owning different funds.
| Beginning
Account Value
July 1, 2006 | Ending
Account Value
December 31, 2006 | Expenses Paid
During Period*
July 1, 2006 to
December 31, 2006 |
Initial Class | | | |
Actual | $ 1,000.00 | $ 1,194.60 | $ 3.93 |
Hypothetical A | $ 1,000.00 | $ 1,021.63 | $ 3.62 |
Service Class | | | |
Actual | $ 1,000.00 | $ 1,193.90 | $ 4.48 |
Hypothetical A | $ 1,000.00 | $ 1,021.12 | $ 4.13 |
Service Class 2 | | | |
Actual | $ 1,000.00 | $ 1,193.10 | $ 5.31 |
Hypothetical A | $ 1,000.00 | $ 1,020.37 | $ 4.89 |
Investor Class | | | |
Actual | $ 1,000.00 | $ 1,193.40 | $ 4.70 |
Hypothetical A | $ 1,000.00 | $ 1,020.92 | $ 4.33 |
A 5% return per year before expenses
* Expenses are equal to each Class' annualized expense ratio (shown in the table below); multiplied by the average account value over the period, multiplied by 184/365 (to reflect the one-half year period).
| Annualized
Expense Ratio |
Initial Class | .71% |
Service Class | .81% |
Service Class 2 | .96% |
Investor Class | .85% |
Annual Report
VIP Real Estate Portfolio
Investment Changes
Top Ten Stocks as of December 31, 2006 |
| % of fund's
net assets | % of fund's net assets
6 months ago |
Equity Residential (SBI) | 7.2 | 6.2 |
Equity Office Properties Trust | 6.0 | 5.4 |
General Growth Properties, Inc. | 5.9 | 6.1 |
Vornado Realty Trust | 5.8 | 3.8 |
Public Storage, Inc. | 5.7 | 2.6 |
Host Hotels & Resorts, Inc. | 4.7 | 6.3 |
Simon Property Group, Inc. | 4.6 | 5.3 |
ProLogis Trust | 4.5 | 6.5 |
Duke Realty LP | 4.4 | 4.2 |
United Dominion Realty Trust, Inc. (SBI) | 3.9 | 5.0 |
| 52.7 | |
Top Five REIT Sectors as of December 31, 2006 |
| % of fund's
net assets | % of fund's net assets
6 months ago |
REITs - Office Buildings | 22.5 | 22.3 |
REITs - Apartments | 17.3 | 15.8 |
REITs - Industrial Buildings | 16.2 | 13.3 |
REITs - Malls | 13.7 | 15.4 |
REITs - Shopping Centers | 13.1 | 13.6 |
Asset Allocation (% of fund's net assets) |
As of December 31, 2006 * | As of June 30, 2006 ** |
| Stocks 97.9% | | | Stocks 96.6% | |
| Short-Term
Investments and
Net Other Assets 2.1% | | | Short-Term
Investments and
Net Other Assets 3.4% | |
* Foreign investments | 1.6% | | ** Foreign investments | 0.3% | |

Annual Report
VIP Real Estate Portfolio
Investments December 31, 2006
Showing Percentage of Net Assets
Common Stocks - 97.9% |
| Shares | | Value (Note 1) |
COMMERCIAL SERVICES & SUPPLIES - 0.5% |
Diversified Commercial & Professional Services - 0.5% |
The Geo Group, Inc. (a) | 37,050 | | $ 1,390,116 |
HEALTH CARE PROVIDERS & SERVICES - 1.2% |
Health Care Facilities - 1.2% |
Brookdale Senior Living, Inc. | 48,200 | | 2,313,600 |
Capital Senior Living Corp. (a) | 40,200 | | 427,728 |
Sun Healthcare Group, Inc. (a) | 30,000 | | 378,900 |
TOTAL HEALTH CARE FACILITIES | | 3,120,228 |
HOTELS, RESTAURANTS & LEISURE - 2.8% |
Hotels, Resorts & Cruise Lines - 2.8% |
Gaylord Entertainment Co. (a) | 5,500 | | 280,115 |
Hilton Hotels Corp. | 19,600 | | 684,040 |
Starwood Hotels & Resorts Worldwide, Inc. | 104,130 | | 6,508,125 |
TOTAL HOTELS, RESORTS & CRUISE LINES | | 7,472,280 |
REAL ESTATE INVESTMENT TRUSTS - 91.8% |
REITs - Apartments - 17.3% |
AvalonBay Communities, Inc. | 58,100 | | 7,555,905 |
BRE Properties, Inc. Class A | 39,700 | | 2,581,294 |
Equity Residential (SBI) | 377,300 | | 19,147,975 |
GMH Communities Trust | 144,900 | | 1,470,735 |
Home Properties of New York, Inc. | 78,100 | | 4,628,987 |
United Dominion Realty Trust, Inc. (SBI) | 323,200 | | 10,274,528 |
TOTAL REITS - APARTMENTS | | 45,659,424 |
REITs - Factory Outlets - 1.8% |
Tanger Factory Outlet Centers, Inc. | 123,700 | | 4,834,196 |
REITs - Hotels - 5.1% |
Host Hotels & Resorts, Inc. | 507,347 | | 12,455,369 |
Innkeepers USA Trust (SBI) | 62,200 | | 964,100 |
TOTAL REITS - HOTELS | | 13,419,469 |
REITs - Industrial Buildings - 16.2% |
AMB Property Corp. (SBI) | 28,300 | | 1,658,663 |
DCT Industrial Trust, Inc. | 227,900 | | 2,689,220 |
Duke Realty LP | 281,520 | | 11,514,168 |
ProLogis Trust | 197,116 | | 11,978,739 |
Public Storage, Inc. | 154,740 | | 15,087,150 |
TOTAL REITS - INDUSTRIAL BUILDINGS | | 42,927,940 |
|
| Shares | | Value (Note 1) |
REITs - Malls - 13.7% |
CBL & Associates Properties, Inc. | 144,920 | | $ 6,282,282 |
General Growth Properties, Inc. | 300,451 | | 15,692,556 |
Simon Property Group, Inc. | 120,640 | | 12,219,626 |
Taubman Centers, Inc. | 42,300 | | 2,151,378 |
TOTAL REITS - MALLS | | 36,345,842 |
REITs - Management/Investment - 1.9% |
Equity Lifestyle Properties, Inc. | 38,241 | | 2,081,458 |
Mission West Properties, Inc. | 97,200 | | 1,273,320 |
Washington (REIT) (SBI) | 40,100 | | 1,604,000 |
TOTAL REITS - MANAGEMENT/INVESTMENT | | 4,958,778 |
REITs - Mortgage - 0.2% |
HomeBanc Mortgage Corp., Georgia | 157,800 | | 667,494 |
REITs - Office Buildings - 22.5% |
Alexandria Real Estate Equities, Inc. | 81,200 | | 8,152,480 |
American Financial Realty Trust (SBI) | 211,300 | | 2,417,272 |
Boston Properties, Inc. | 86,400 | | 9,666,432 |
Corporate Office Properties Trust (SBI) | 150,600 | | 7,600,782 |
Douglas Emmett, Inc. | 110,700 | | 2,943,513 |
Equity Office Properties Trust | 329,400 | | 15,867,198 |
Kilroy Realty Corp. | 26,500 | | 2,067,000 |
SL Green Realty Corp. | 55,900 | | 7,422,402 |
Sovran Self Storage, Inc. | 57,800 | | 3,310,784 |
TOTAL REITS - OFFICE BUILDINGS | | 59,447,863 |
REITs - Shopping Centers - 13.1% |
Cedar Shopping Centers, Inc. | 15,900 | | 252,969 |
Developers Diversified Realty Corp. | 54,300 | | 3,418,185 |
Federal Realty Investment Trust (SBI) | 32,900 | | 2,796,500 |
Inland Real Estate Corp. | 170,800 | | 3,197,376 |
Kimco Realty Corp. | 157,615 | | 7,084,794 |
Vornado Realty Trust | 127,300 | | 15,466,950 |
Weingarten Realty Investors (SBI) | 53,900 | | 2,485,329 |
TOTAL REITS - SHOPPING CENTERS | | 34,702,103 |
TOTAL REAL ESTATE INVESTMENT TRUSTS | | 242,963,109 |
REAL ESTATE MANAGEMENT & DEVELOPMENT - 1.6% |
Real Estate Management & Development - 1.6% |
Brookfield Properties Corp. | 88,200 | | 3,468,906 |
GAGFAH SA | 21,200 | | 672,557 |
TOTAL REAL ESTATE MANAGEMENT & DEVELOPMENT | | 4,141,463 |
TOTAL COMMON STOCKS (Cost $194,339,047) | 259,087,196 |
Money Market Funds - 1.4% |
| Shares | | Value (Note 1) |
Fidelity Cash Central Fund, 5.37% (b) (Cost $3,580,391) | 3,580,391 | | $ 3,580,391 |
TOTAL INVESTMENT PORTFOLIO - 99.3% (Cost $197,919,438) | | 262,667,587 |
NET OTHER ASSETS - 0.7% | | 1,927,913 |
NET ASSETS - 100% | $ 264,595,500 |
Legend |
(a) Non-income producing |
(b) Affiliated fund that is available only to investment companies and other accounts managed by Fidelity Investments. The rate quoted is the annualized seven-day yield of the fund at period end. A complete unaudited listing of the fund's holdings as of its most recent quarter end is available upon request. |
Affiliated Central Funds |
Information regarding fiscal year to date income earned by the Fund from investments in Fidelity Central Funds is as follows: |
Fund | Income earned |
Fidelity Cash Central Fund | $ 296,660 |
See accompanying notes which are an integral part of the financial statements.
VIP Real Estate Portfolio
VIP Real Estate Portfolio
Financial Statements
Statement of Assets and Liabilities
| December 31, 2006 |
| | |
Assets | | |
Investment in securities, at value - See accompanying schedule: Unaffiliated issuers
(cost $194,339,047) | $ 259,087,196 | |
Fidelity Central Funds
(cost $3,580,391) | 3,580,391 | |
Total Investments
(cost $197,919,438) | | $ 262,667,587 |
Cash | | 1,001 |
Foreign currency held at value
(cost $4,268) | | 4,268 |
Receivable for investments sold | | 2,402,448 |
Receivable for fund shares sold | | 41 |
Dividends receivable | | 1,501,867 |
Interest receivable | | 21,924 |
Prepaid expenses | | 913 |
Other receivables | | 3,198 |
Total assets | | 266,603,247 |
| | |
Liabilities | | |
Payable for investments purchased | $ 1,800,460 | |
Accrued management fee | 124,503 | |
Distribution fees payable | 1,251 | |
Other affiliated payables | 28,474 | |
Other payables and accrued expenses | 53,059 | |
Total liabilities | | 2,007,747 |
| | |
Net Assets | | $ 264,595,500 |
Net Assets consist of: | | |
Paid in capital | | $ 195,520,664 |
Accumulated undistributed net realized gain (loss) on investments and foreign currency transactions | | 4,326,671 |
Net unrealized appreciation (depreciation) on investments and assets and liabilities in foreign currencies | | 64,748,165 |
Net Assets | | $ 264,595,500 |
Statement of Assets and Liabilities - continued
| December 31, 2006 |
| | |
Initial Class:
Net Asset Value, offering price and redemption price per share ($205,801,961 ÷ 9,050,140 shares) | | $ 22.74 |
| | |
Service Class:
Net Asset Value, offering price and redemption price per share ($4,311,032 ÷ 190,000 shares) | | $ 22.69 |
| | |
Service Class 2:
Net Asset Value, offering price and redemption price per share ($4,284,231 ÷ 189,397 shares) | | $ 22.62 |
| | |
Investor Class:
Net Asset Value, offering price and redemption price per share ($50,198,276 ÷ 2,212,151 shares) | | $ 22.69 |
See accompanying notes which are an integral part of the financial statements.
Annual Report
VIP Real Estate Portfolio
Financial Statements - continued
Statement of Operations
| Year ended December 31, 2006 |
| | |
Investment Income | | |
Dividends | | $ 4,544,935 |
Interest | | 172 |
Income from Fidelity Central Funds | | 296,660 |
Total income | | 4,841,767 |
| | |
Expenses | | |
Management fee | $ 1,107,272 | |
Transfer agent fees | 166,111 | |
Distribution fees | 12,957 | |
Accounting fees and expenses | 80,836 | |
Custodian fees and expenses | 17,187 | |
Independent trustees' compensation | 693 | |
Audit | 49,272 | |
Legal | 5,413 | |
Miscellaneous | 16,834 | |
Total expenses before reductions | 1,456,575 | |
Expense reductions | (13,624) | 1,442,951 |
Net investment income (loss) | | 3,398,816 |
Realized and Unrealized Gain (Loss) Net realized gain (loss) on: | | |
Investment securities: | | |
Unaffiliated issuers | 21,787,858 | |
Foreign currency transactions | 499 | |
Total net realized gain (loss) | | 21,788,357 |
Change in net unrealized appreciation (depreciation) on: Investment securities | 34,798,464 | |
Assets and liabilities in foreign currencies | 16 | |
Total change in net unrealized appreciation (depreciation) | | 34,798,480 |
Net gain (loss) | | 56,586,837 |
Net increase (decrease) in net assets resulting from operations | | $ 59,985,653 |
Statement of Changes in Net Assets
| Year ended
December 31, 2006 | Year ended
December 31, 2005 |
Increase (Decrease) in Net Assets | | |
Operations | | |
Net investment income (loss) | $ 3,398,816 | $ 3,330,065 |
Net realized gain (loss) | 21,788,357 | 12,249,418 |
Change in net unrealized appreciation (depreciation) | 34,798,480 | 4,991,406 |
Net increase (decrease) in net assets resulting from operations | 59,985,653 | 20,570,889 |
Distributions to shareholders from net investment income | (3,481,178) | (3,279,073) |
Distributions to shareholders from net realized gain | (20,674,753) | (9,657,127) |
Total distributions | (24,155,931) | (12,936,200) |
Share transactions - net increase (decrease) | 70,269,294 | (2,396,377) |
Total increase (decrease) in net assets | 106,099,016 | 5,238,312 |
| | |
Net Assets | | |
Beginning of period | 158,496,484 | 153,258,172 |
End of period | $ 264,595,500 | $ 158,496,484 |
See accompanying notes which are an integral part of the financial statements.
VIP Real Estate Portfolio
Financial Highlights - Initial Class
Years ended December 31, | 2006 | 2005 | 2004 | 2003 | 2002 I |
Selected Per-Share Data | | | | | |
Net asset value, beginning of period | $ 18.48 | $ 17.46 | $ 13.30 | $ 10.15 | $ 10.00 |
Income from Investment Operations | | | | | |
Net investment income (loss) E | .38 | .38 | .45 | .48 H | .08 |
Net realized and unrealized gain (loss) | 6.23 | 2.25 | 4.08 | 2.89 | .18 |
Total from investment operations | 6.61 | 2.63 | 4.53 | 3.37 | .26 |
Distributions from net investment income | (.33) | (.41) | (.31) | (.15) | (.11) |
Distributions from net realized gain | (2.02) | (1.20) | (.06) | (.07) | - |
Total distributions | (2.35) | (1.61) K | (.37) | (.22) | (.11) |
Net asset value, end of period | $ 22.74 | $ 18.48 | $ 17.46 | $ 13.30 | $ 10.15 |
Total Return B, C, D | 36.71% | 15.12% | 34.14% | 33.21% | 2.61% |
Ratios to Average Net Assets F, J | | | | | |
Expenses before reductions | .72% | .74% | .77% | 1.72% | 4.89% A |
Expenses net of fee waivers, if any | .72% | .74% | .77% | 1.03% | 1.25% A |
Expenses net of all reductions | .71% | .71% | .74% | 1.00% | 1.22% A |
Net investment income (loss) | 1.76% | 2.13% | 3.02% | 4.44% | 5.38% A |
Supplemental Data | | | | | |
Net assets, end of period (000 omitted) | $ 205,802 | $ 145,065 | $ 147,779 | $ 45,320 | $ 2,052 |
Portfolio turnover rate G | 70% | 75% | 66% | 46% | 44% A |
A Annualized
B Total returns for periods of less than one year are not annualized.
C Total returns do not reflect charges attributable to your insurance company's separate account. Inclusion of these charges would reduce the total returns shown.
D Total returns would have been lower had certain expenses not been reduced during the periods shown.
E Calculated based on average shares outstanding during the period.
F Fees and expenses of the underlying Fidelity Central Funds are not included in the Fund's expense ratio. The Fund indirectly bears its proportionate share of the expenses of any underlying Fidelity Central Funds.
G Amount does not include the portfolio activity of any underlying Fidelity Central Funds.
H Investment income per share reflects a special dividend which amounted to $.11 per share.
I For the period November 6, 2002 (commencement of operations) to December 31, 2002.
J Expense ratios reflect operating expenses of the class. Expenses before reductions do not reflect amounts reimbursed by the investment adviser or reductions from brokerage service arrangements or other expense offset arrangements and do not represent the amount paid by the class during periods when reimbursements or reductions occur. Expense ratios before reductions for start-up periods may not be representative of longer-term operating periods. Expenses net of fee waivers reflect expenses after reimbursement by the investment adviser but prior to reductions from brokerage service arrangements or other expense offset arrangements. Expenses net of all reductions represent the net expenses paid by the class.
K Total distribution of $1.61 per share is comprised of distributions from net investment income of $.413 and distributions from net realized gain of $1.195 per share.
Financial Highlights - Service Class
Years ended December 31, | 2006 | 2005 | 2004 | 2003 | 2002 I |
Selected Per-Share Data | | | | | |
Net asset value, beginning of period | $ 18.44 | $ 17.43 | $ 13.28 | $ 10.15 | $ 10.00 |
Income from Investment Operations | | | | | |
Net investment income (loss) E | .35 | .37 | .43 | .49 H | .08 |
Net realized and unrealized gain (loss) | 6.22 | 2.23 | 4.08 | 2.86 | .18 |
Total from investment operations | 6.57 | 2.60 | 4.51 | 3.35 | .26 |
Distributions from net investment income | (.30) | (.40) | (.30) | (.15) | (.11) |
Distributions from net realized gain | (2.02) | (1.20) | (.06) | (.07) | - |
Total distributions | (2.32) | (1.59) K | (.36) | (.22) | (.11) |
Net asset value, end of period | $ 22.69 | $ 18.44 | $ 17.43 | $ 13.28 | $ 10.15 |
Total Return B, C, D | 36.61% | 15.00% | 34.04% | 33.01% | 2.61% |
Ratios to Average Net Assets F, J | | | | | |
Expenses before reductions | .82% | .84% | .86% | 1.80% | 4.99% A |
Expenses net of fee waivers, if any | .82% | .84% | .86% | 1.24% | 1.35% A |
Expenses net of all reductions | .81% | .81% | .84% | 1.22% | 1.31% A |
Net investment income (loss) | 1.66% | 2.03% | 2.92% | 4.23% | 5.28% A |
Supplemental Data | | | | | |
Net assets, end of period (000 omitted) | $ 4,311 | $ 3,156 | $ 2,744 | $ 2,048 | $ 1,539 |
Portfolio turnover rate G | 70% | 75% | 66% | 46% | 44% A |
A Annualized
B Total returns for periods of less than one year are not annualized.
C Total returns do not reflect charges attributable to your insurance company's separate account. Inclusion of these charges would reduce the total returns shown.
D Total returns would have been lower had certain expenses not been reduced during the periods shown.
E Calculated based on average shares outstanding during the period.
F Fees and expenses of the underlying Fidelity Central Funds are not included in the Fund's expense ratio. The Fund indirectly bears its proportionate share of the expenses of any underlying Fidelity Central Funds.
G Amount does not include the portfolio activity of any underlying Fidelity Central Funds.
H Investment income per share reflects a special dividend which amounted to $.11 per share.
I For the period November 6, 2002 (commencement of operations) to December 31, 2002.
J Expense ratios reflect operating expenses of the class. Expenses before reductions do not reflect amounts reimbursed by the investment adviser or reductions from brokerage service arrangements or other expense offset arrangements and do not represent the amount paid by the class during periods when reimbursements or reductions occur. Expense ratios before reductions for start-up periods may not be representative of longer-term operating periods. Expenses net of fee waivers reflect expenses after reimbursement by the investment adviser but prior to reductions from brokerage service arrangements or other expense offset arrangements. Expenses net of all reductions represent the net expenses paid by the class.
K Total distribution of $1.59 per share is comprised of distributions from net investment income of $.397 and distributions from net realized gain of $1.195 per share.
See accompanying notes which are an integral part of the financial statements.
Annual Report
Financial Highlights - Service Class 2
Years ended December 31, | 2006 | 2005 | 2004 | 2003 | 2002 I |
Selected Per-Share Data | | | | | |
Net asset value, beginning of period | $ 18.40 | $ 17.39 | $ 13.26 | $ 10.15 | $ 10.00 |
Income from Investment Operations | | | | | |
Net investment income (loss) E | .32 | .34 | .41 | .47 H | .08 |
Net realized and unrealized gain (loss) | 6.19 | 2.24 | 4.06 | 2.86 | .18 |
Total from investment operations | 6.51 | 2.58 | 4.47 | 3.33 | .26 |
Distributions from net investment income | (.27) | (.37) | (.28) | (.15) | (.11) |
Distributions from net realized gain | (2.02) | (1.20) | (.06) | (.07) | - |
Total distributions | (2.29) | (1.57) K | (.34) | (.22) | (.11) |
Net asset value, end of period | $ 22.62 | $ 18.40 | $ 17.39 | $ 13.26 | $ 10.15 |
Total Return B, C, D | 36.35% | 14.88% | 33.79% | 32.81% | 2.61% |
Ratios to Average Net Assets F, J | | | | | |
Expenses before reductions | .97% | .99% | 1.01% | 1.95% | 5.14% A |
Expenses net of fee waivers, if any | .97% | .99% | 1.01% | 1.39% | 1.50% A |
Expenses net of all reductions | .96% | .96% | .99% | 1.37% | 1.46% A |
Net investment income (loss) | 1.51% | 1.88% | 2.77% | 4.08% | 5.13% A |
Supplemental Data | | | | | |
Net assets, end of period (000 omitted) | $ 4,284 | $ 3,141 | $ 2,735 | $ 2,044 | $ 1,539 |
Portfolio turnover rate G | 70% | 75% | 66% | 46% | 44% A |
A Annualized
B Total returns for periods of less than one year are not annualized.
C Total returns do not reflect charges attributable to your insurance company's separate account. Inclusion of these charges would reduce the total returns shown.
D Total returns would have been lower had certain expenses not been reduced during the periods shown.
E Calculated based on average shares outstanding during the period.
F Fees and expenses of the underlying Fidelity Central Funds are not included in the Fund's expense ratio. The Fund indirectly bears its proportionate share of the expenses of any underlying Fidelity Central Funds.
G Amount does not include the portfolio activity of any underlying Fidelity Central Funds.
H Investment income per share reflects a special dividend which amounted to $.11 per share.
I For the period November 6, 2002 (commencement of operations) to December 31, 2002.
J Expense ratios reflect operating expenses of the class. Expenses before reductions do not reflect amounts reimbursed by the investment adviser or reductions from brokerage service arrangements or other expense offset arrangements and do not represent the amount paid by the class during periods when reimbursements or reductions occur. Expense ratios before reductions for start-up periods may not be representative of longer-term operating periods. Expenses net of fee waivers reflect expenses after reimbursement by the investment adviser but prior to reductions from brokerage service arrangements or other expense offset arrangements. Expenses net of all reductions represent the net expenses paid by the class.
K Total distribution of $1.57 per share is comprised of distributions from net investment income of $.37 and distributions from net realized gain of $1.195 per share.
Financial Highlights - Investor Class
Years ended December 31, | 2006 | 2005 H |
Selected Per-Share Data | | |
Net asset value, beginning of period | $ 18.46 | $ 19.25 |
Income from Investment Operations | | |
Net investment income (loss) E | .35 | .17 |
Net realized and unrealized gain (loss) | 6.22 | .52 |
Total from investment operations | 6.57 | .69 |
Distributions from net investment income | (.32) | (.42) |
Distributions from net realized gain | (2.02) | (1.06) |
Total distributions | (2.34) | (1.48) J |
Net asset value, end of period | $ 22.69 | $ 18.46 |
Total Return B, C, D | 36.53% | 3.52% |
Ratios to Average Net Assets F, I | | |
Expenses before reductions | .85% | .99% A |
Expenses net of fee waivers, if any | .85% | .99% A |
Expenses net of all reductions | .85% | .96% A |
Net investment income (loss) | 1.62% | 1.98% A |
Supplemental Data | | |
Net assets, end of period (000 omitted) | $ 50,198 | $ 7,134 |
Portfolio turnover rate G | 70% | 75% |
A Annualized
B Total returns for periods of less than one year are not annualized.
C Total returns do not reflect charges attributable to your insurance company's separate account. Inclusion of these charges would reduce the total returns shown.
D Total returns would have been lower had certain expenses not been reduced during the periods shown.
E Calculated based on average shares outstanding during the period.
F Fees and expenses of the underlying Fidelity Central Funds are not included in the Fund's expense ratio. The Fund indirectly bears its proportionate share of the expenses of any underlying Fidelity Central Funds.
G Amount does not include the portfolio activity of any underlying Fidelity Central Funds.
H For the period July 21, 2005 (commencement of sale of shares) to December 31, 2005.
I Expense ratios reflect operating expenses of the class. Expenses before reductions do not reflect amounts reimbursed by the investment adviser or reductions from brokerage service arrangements or other expense offset arrangements and do not represent the amount paid by the class during periods when reimbursements or reductions occur. Expense ratios before reductions for start-up periods may not be representative of longer-term operating periods. Expenses net of fee waivers reflect expenses after reimbursement by the investment adviser but prior to reductions from brokerage service arrangements or other expense offset arrangements. Expenses net of all reductions represent the net expenses paid by the class.
J Total distribution of $1.48 per share is comprised of distributions from net investment income of $.419 and distributions from net realized gain of $1.06 per share.
See accompanying notes which are an integral part of the financial statements.
VIP Real Estate Portfolio
Notes to Financial Statements
For the period ended December 31, 2006
1. Significant Accounting Policies.
VIP Real Estate Portfolio (the Fund) is a non-diversified fund of Variable Insurance Products Fund IV (the trust) and is authorized to issue an unlimited number of shares. The trust is registered under the Investment Company Act of 1940, as amended (the 1940 Act), as an open-end management investment company organized as a Massachusetts business trust. Shares of the Fund may only be purchased by insurance companies for the purpose of funding variable annuity or variable life insurance contracts. The Fund offers the following classes of shares: Initial Class shares, Service Class shares, Service Class 2 shares, and Investor Class shares. All classes have equal rights and voting privileges, except for matters affecting a single class. Investment income, realized and unrealized capital gains and losses, the common expenses of the Fund, and certain fund-level expense reductions, if any, are allocated on a pro rata basis to each class based on the relative net assets of each class to the total net assets of the Fund. Each class differs with respect to transfer agent and distribution and service plan fees incurred. Certain expense reductions also differ by class.
The Fund may invest in Fidelity Central Funds which are open-end investment companies available to investment companies and other accounts managed by Fidelity Management & Research Company (FMR) and its affiliates. The financial statements have been prepared in conformity with accounting principles generally accepted in the United States of America, which require management to make certain estimates and assumptions at the date of the financial statements. The following summarizes the significant accounting policies of the Fund, which are also consistently followed by the Fidelity Central Funds:
Security Valuation. Investments are valued and net asset value (NAV) per share is calculated (NAV calculation) as of the close of business of the New York Stock Exchange (NYSE), normally 4:00 p.m. Eastern time. Wherever possible, the Fund uses independent pricing services approved by the Board of Trustees to value its investments.
Equity securities, including restricted securities, for which market quotations are readily available, are valued at the last reported sale price or official closing price as reported by an independent pricing service on the primary market or exchange on which they are traded. In the event there were no sales during the day or closing prices are not available, securities are valued at the last quoted bid price. Investments in open-end mutual funds, including the Fidelity Central Funds, are valued at their closing net asset value each business day. Short-term securities with remaining maturities of sixty days or less for which quotations are not readily available are valued at amortized cost, which approximates value.
When current market prices or quotations are not readily available or do not accurately reflect fair value, valuations may be determined in accordance with procedures adopted by the Board of Trustees. For example, when developments occur between the close of a market and the close of the NYSE that may materially affect the value of some or all of the securities, or when trading in a security is halted, those securities may be fair valued. Factors used in the determination of fair value may include monitoring news to identify significant market or security specific events such as changes in the value of U.S. securities markets, reviewing developments in foreign markets and evaluating the performance of ADRs, futures contracts and exchange-traded funds. Because the Fund's utilization of fair value pricing depends on market activity, the frequency with which fair value pricing is used can not be predicted and may be utilized to a significant extent. The value of securities used for NAV calculation under fair value pricing may differ from published prices for the same securities.
Foreign Currency. The Fund uses foreign currency contracts to facilitate transactions in foreign-denominated securities. Losses from these transactions may arise from changes in the value of the foreign currency or if the counterparties do not perform under the contracts' terms.
Foreign-denominated assets, including investment securities, and liabilities are translated into U.S. dollars at the exchange rate at period end. Purchases and sales of investment securities, income and dividends received and expenses denominated in foreign currencies are translated into U.S. dollars at the exchange rate in effect on the transaction date.
The effects of exchange rate fluctuations on investments are included with the net realized and unrealized gain (loss) on investment securities. Other foreign currency transactions resulting in realized and unrealized gain (loss) are disclosed separately.
Investment Transactions and Income. Security transactions, including the Fund's investment activity in the Fidelity Central Funds, are accounted for as of trade date. Gains and losses on securities sold are determined on the basis of identified cost. Dividend income is recorded on the ex-dividend date, except for certain dividends from foreign securities where the ex-dividend date may have passed, which are recorded as soon as the Fund is informed of the ex-dividend date. Non-cash dividends included in dividend income, if any, are recorded at the fair market value of the securities received. Distributions received on securities that represent a return of capital or capital gain are recorded as a reduction of cost of investments and/or as a realized gain. The Fund estimates the components of distributions received that may be considered return of capital distributions or capital gain distributions. Interest income and income distributions from the Fidelity Central Funds are accrued as earned, with any income distributions receivable as of period end included in Interest Receivable on the Statement of Assets and Liabilities. Interest income includes coupon interest and amortization of premium and accretion of discount on debt securities. Investment income is recorded net of foreign taxes withheld where recovery of such taxes is uncertain.
Annual Report
Notes to Financial Statements - continued
1. Significant Accounting Policies - continued
Expenses. Most expenses of the trust can be directly attributed to a fund. Expenses which cannot be directly attributed are apportioned among each Fund in the trust. Expense estimates are accrued in the period to which they relate and adjustments are made when actual amounts are known.
Income Tax Information and Distributions to Shareholders. Each year, the Fund intends to qualify as a regulated investment company by distributing all of its taxable income and realized gains under Subchapter M of the Internal Revenue Code. As a result, no provision for income taxes is required in the accompanying financial statements. Foreign taxes are provided for based on the Fund's understanding of the tax rules and rates that exist in the foreign markets in which it invests.
Distributions are recorded on the ex-dividend date. Income dividends and capital gain distributions are declared separately for each class. Income and capital gain distributions are determined in accordance with income tax regulations, which may differ from generally accepted accounting principles.
Capital accounts within the financial statements are adjusted for permanent book-tax differences. These adjustments have no impact on net assets or the results of operations. Temporary book-tax differences will reverse in a subsequent period.
Book-tax differences are primarily due to foreign currency transactions, passive foreign investment companies (PFIC), and losses deferred due to wash sales.
The tax-basis components of distributable earnings and the federal tax cost as of period end were as follows:
Unrealized appreciation | $ 65,961,626 | |
Unrealized depreciation | (1,493,531) | |
Net unrealized appreciation (depreciation) | 64,468,095 | |
Undistributed ordinary income | 1,342,211 | |
Undistributed long-term capital gain | 3,264,528 | |
| | |
Cost for federal income tax purposes | $ 198,199,492 | |
The tax character of distributions paid was as follows:
| December 31, 2006 | December 31, 2005 |
Ordinary Income | $ 6,598,896 | $ 5,357,485 |
Long-term Capital Gains | 17,557,035 | 7,578,715 |
Total | $ 24,155,931 | $ 12,936,200 |
New Accounting Pronouncements. In July 2006, Financial Accounting Standards Board Interpretation No. 48, Accounting for Uncertainty in Income Taxes - an interpretation of FASB Statement 109 (FIN 48), was issued and is effective on the last business day of the semiannual reporting period for fiscal years beginning after December 15, 2006. FIN 48 sets forth a threshold for financial statement recognition, measurement and disclosure of a tax position taken or expected to be taken on a tax return. Management is currently evaluating the impact, if any, the adoption of FIN 48 will have on the Fund's net assets, results of operations and financial statement disclosures.
In addition, in September 2006, Statement of Financial Accounting Standards No. 157, Fair Value Measurements (SFAS 157), was issued and is effective for fiscal years beginning after November 15, 2007. SFAS 157 defines fair value, establishes a framework for measuring fair value and expands disclosures about fair value measurements. Management is currently evaluating the impact the adoption of SFAS 157 will have on the Fund's financial statement disclosures.
2. Operating Policies.
Repurchase Agreements. FMR has received an Exemptive Order from the Securities and Exchange Commission (the SEC) which permits the Fund and other affiliated entities of FMR to transfer uninvested cash balances into joint trading accounts which are then invested in repurchase agreements. The Fund may also invest directly with institutions in repurchase agreements. Repurchase agreements are collateralized by government or non-government securities. Upon settlement date, collateral is held in segregated accounts with custodian banks and may be obtained in the event of a default of the counterparty. The Fund monitors, on a daily basis, the value of the collateral to ensure it is at least equal to the principal amount of the repurchase agreement (including accrued interest). In the event of a default by the counterparty, realization of the collateral proceeds could be delayed, during which time the value of the collateral may decline.
3. Purchases and Sales of Investments.
Purchases and sales of securities , other than short-term securities, aggregated $184,443,069 and $133,646,291, respectively.
VIP Real Estate Portfolio
4. Fees and Other Transactions with Affiliates.
Management Fee. FMR and its affiliates provide the Fund with investment management related services for which the Fund pays a monthly management fee. The management fee is the sum of an individual fund fee rate that is based on an annual rate of .30% of the Fund's average net assets and a group fee rate that averaged .27% during the period. The group fee rate is based upon the average net assets of all the mutual funds advised by FMR. The group fee rate decreases as assets under management increase and increases as assets under management decrease. For the period, the total annual management fee rate was .57% of the Fund's average net assets.
Distribution and Service Plan. In accordance with Rule 12b-1 of the 1940 Act, the Fund has adopted separate 12b-1 Plans for each Service Class of shares. Each Service Class pays Fidelity Distributors Corporation (FDC), an affiliate of FMR, a service fee. For the period, the service fee is based on an annual rate of .10% of Service Class' average net assets and .25% of Service Class 2's average net assets.
For the period, each class paid FDC the following amounts, all of which were re-allowed to insurance companies for the distribution of shares and providing shareholder support services:
Service Class | $ 3,717 | |
Service Class 2 | 9,240 | |
| $ 12,957 | |
Transfer Agent Fees. Fidelity Investments Institutional Operations Company, Inc. (FIIOC), an affiliate of FMR, is the fund's transfer, dividend disbursing, and shareholder servicing agent. FIIOC receives an asset-based fee with respect to each class. Each class with the exception of Investor Class pays a transfer agent fee, excluding out of pocket expenses, equal to an annual rate of .07% of their month end net assets. Investor Class pays a monthly asset-based transfer agent fee of .18% of its month end net assets. The total transfer agent fees paid by each class to FIIOC, including out of pocket expenses, were as follows:
Initial Class | $ 114,492 | |
Service Class | 2,499 | |
Service Class 2 | 2,485 | |
Investor Class | 46,635 | |
| $ 166,111 | |
Accounting Fees. Fidelity Service Company, Inc. (FSC), an affiliate of FMR, maintains the Fund's accounting records. The fee is based on the level of average net assets for the month.
Investments in Fidelity Central Funds. The Fund may invest in Fidelity Central Funds. The Fund's Schedule of Investments lists each of the Fidelity Central Funds as an investment of the Fund but does not include the underlying holdings of each Fidelity Central Fund. As an Investing Fund, the Fund indirectly bears its proportionate share of the expenses of the underlying Fidelity Central Funds. A complete unaudited list of holdings for each Fidelity Central Fund is available upon request. In addition, the financial statements of the Fidelity Central Funds, which are not covered by the Fund's Report of Independent Registered Public Accounting Firm, are available on the EDGAR Database on the SEC's web site, www.sec.gov, or upon request.
The Money Market Central Funds seek preservation of capital and current income and are managed by Fidelity Investments Money Management, Inc. (FIMM), an affiliate of FMR.
Brokerage Commissions. The Fund placed a portion of its portfolio transactions with brokerage firms which are affiliates of the investment adviser. The commissions paid to these affiliated firms were $4,094 for the period.
5. Committed Line of Credit.
The Fund participates with other funds managed by FMR in a $4.2 billion credit facility (the "line of credit") to be utilized for temporary or emergency purposes to fund shareholder redemptions or for other short-term liquidity purposes. The Fund has agreed to pay commitment fees on its pro rata portion of the line of credit, which amounted to $395 and is reflected in Miscellaneous Expense on the Statement of Operations. During the period, there were no borrowings on this line of credit.
6. Expense Reductions.
Many of the brokers with whom FMR places trades on behalf of the Fund provided services to the Fund in addition to trade execution. These services included payments of certain expenses on behalf of the Fund totaling $10,536 for the period. In addition, through arrangements with the fund's custodian, credits realized as a result of uninvested cash balances were used to reduce the Fund's expenses. During the period, these credits reduced the Fund's custody expenses by $263.
Annual Report
Notes to Financial Statements - continued
7. Other.
The Fund's organizational documents provide former and current trustees and officers with a limited indemnification against liabilities arising in connection with the performance of their duties to the Fund. In the normal course of business, the Fund may also enter into contracts that provide general indemnifications. The Fund's maximum exposure under these arrangements is unknown as this would be dependent on future claims that may be made against the Fund. The risk of material loss from such claims is considered remote.
At the end of the period, FMR or its affiliates were the owners of record of 99% of the total outstanding shares of the Fund.
The United States Securities and Exchange Commission ("SEC") is conducting an investigation of FMR (covering the years 2002 to 2004) arising from gifts, gratuities and business entertainment provided by certain brokers to certain individuals who were employed on FMR's domestic equity trading desk during that period. FMR is in discussions with the SEC staff regarding the possible resolution of the matter, but as of period-end no final resolution has been reached.
In December 2006, the Independent Trustees completed their own investigation of the matter with the assistance of independent counsel. The Independent Trustees and FMR agree that, despite the absence of proof that the Fidelity mutual funds experienced diminished execution quality as a result of the improper receipt of gifts and business entertainment, the conduct at issue was serious and is worthy of redress. Accordingly, the Independent Trustees have requested and FMR has agreed to pay $42 million to Fidelity mutual funds, plus interest to be determined at the time that payment is made. A method of allocating this payment among the funds has not yet been determined. The total payment to the Fund is not anticipated to have a material impact on the Fund's net assets. In addition, FMR reimbursed related legal expenses which are recorded in the accompanying Statement of Operations as an expense reduction.
8. Distributions to Shareholders.
Distributions to shareholders of each class were as follows:
| Years ended December 31, |
| 2006 | 2005 A |
From net investment income | | |
Initial Class | $ 2,781,183 | $ 3,020,030 |
Service Class | 53,234 | 62,886 |
Service Class 2 | 47,704 | 58,539 |
Investor Class | 599,057 | 137,618 |
Total | $ 3,481,178 | $ 3,279,073 |
From net realized gain | | |
Initial Class | $ 16,767,387 | $ 8,929,110 |
Service Class | 351,979 | 189,597 |
Service Class 2 | 351,224 | 189,399 |
Investor Class | 3,204,163 | 349,021 |
Total | $ 20,674,753 | $ 9,657,127 |
A Distributions for Investor Class are for the period July 21, 2005 (commencement of sale of shares) to December 31, 2005.
VIP Real Estate Portfolio
9. Share Transactions.
Transactions for each class of shares were as follows:
| Shares | Dollars |
| Years ended December 31, | Years ended December 31, |
| 2006 | 2005 A | 2006 | 2005 A |
Initial Class | | | | |
Shares sold | 2,250,474 | 2,576,804 | $ 50,672,505 | $ 46,365,764 |
Reinvestment of distributions | 905,495 | 647,839 | 19,548,570 | 11,949,140 |
Shares redeemed | (1,956,218) | (3,839,690) | (40,657,830) | (68,577,036) |
Net increase (decrease) | 1,199,751 | (615,047) | $ 29,563,245 | $ (10,262,132) |
Service Class | | | | |
Reinvestment of distributions | 18,859 | 13,700 | $ 405,213 | $ 252,483 |
Net increase (decrease) | 18,859 | 13,700 | $ 405,213 | $ 252,483 |
Service Class 2 | | | | |
Reinvestment of distributions | 18,633 | 13,491 | $ 398,928 | $ 247,938 |
Net increase (decrease) | 18,633 | 13,491 | $ 398,928 | $ 247,938 |
Investor Class | | | | |
Shares sold | 1,835,126 | 381,682 | $ 40,039,439 | $ 7,301,211 |
Reinvestment of distributions | 173,210 | 26,149 | 3,803,220 | 486,639 |
Shares redeemed | (182,665) | (21,351) | (3,940,751) | (422,516) |
Net increase (decrease) | 1,825,671 | 386,480 | $ 39,901,908 | $ 7,365,334 |
A Share transactions for Investor Class are for the period July 21, 2005 (commencement of sale of shares) to December 31, 2005.
Annual Report
Report of Independent Registered Public Accounting Firm
To the Trustees of Variable Insurance Products Fund IV and the Shareholders of VIP Real Estate Portfolio:
In our opinion, the accompanying statement of assets and liabilities, including the schedule of investments, and the related statements of operations and of changes in net assets and the financial highlights present fairly, in all material respects, the financial position of VIP Real Estate Portfolio (a fund of Variable Insurance Products Fund IV) at December 31, 2006, the results of its operations for the year then ended, the changes in its net assets for each of the two years in the period then ended and the financial highlights for each of the periods indicated, in conformity with accounting principles generally accepted in the United States of America. These financial statements and financial highlights (hereafter referred to as "financial statements") are the responsibility of the VIP Real Estate Portfolio's management; our responsibility is to express an opinion on these financial statements based on our audits. We conducted our audits of these financial statements in accordance with the standards of the Public Company Accounting Oversight Board (United States). Those standards require that we plan and perform the audit to obtain reasonable assurance about whether the financial statements are free of material misstatement. An audit includes examining, on a test basis, evidence supporting the amounts and disclosures in the financial statements, assessing the accounting principles used and significant estimates made by management, and evaluating the overall financial statement presentation. We believe that our audits, which included confirmation of securities at December 31, 2006 by correspondence with the custodian and brokers, provide a reasonable basis for our opinion.
/s/ PricewaterhouseCoopers LLP
PricewaterhouseCoopers LLP
Boston, Massachusetts
February 14, 2007
VIP Real Estate Portfolio
Trustees and Officers
The Trustees, Member of the Advisory Board, and executive officers of the trust and fund, as applicable, are listed below. The Board of Trustees governs the fund and is responsible for protecting the interests of shareholders. The Trustees are experienced executives who meet periodically throughout the year to oversee the fund's activities, review contractual arrangements with companies that provide services to the fund, and review the fund's performance. Each of the Trustees oversees 348 funds advised by FMR or an affiliate.
The Trustees hold office without limit in time except that (a) any Trustee may resign; (b) any Trustee may be removed by written instrument, signed by at least two-thirds of the number of Trustees prior to such removal; (c) any Trustee who requests to be retired or who has become incapacitated by illness or injury may be retired by written instrument signed by a majority of the other Trustees; and (d) any Trustee may be removed at any special meeting of shareholders by a two-thirds vote of the outstanding voting securities of the trust. Each Trustee who is not an interested person (as defined in the 1940 Act) (Independent Trustee), shall retire not later than the last day of the calendar year in which his or her 72nd birthday occurs. The Independent Trustees may waive this mandatory retirement age policy with respect to individual Trustees. The executive officers and Advisory Board Member hold office without limit in time, except that any officer and Advisory Board Member may resign or may be removed by a vote of a majority of the Trustees at any regular meeting or any special meeting of the Trustees. Except as indicated, each individual has held the office shown or other offices in the same company for the past five years.
The fund's Statement of Additional Information (SAI) includes more information about the Trustees. To request a free copy, call Fidelity at 1-877-208-0098.
Interested Trustees*:
Correspondence intended for each Trustee who is an interested person may be sent to Fidelity Investments, 82 Devonshire Street, Boston, Massachusetts 02109.
Name, Age; Principal Occupation |
Edward C. Johnson 3d (76) |
| Year of Election or Appointment: 1983 Mr. Johnson is Chairman of the Board of Trustees. Mr. Johnson serves as President (2006-present), Chief Executive Officer, Chairman, and a Director of FMR Corp.; Chairman and a Director of FMR; Chairman and a Director of Fidelity Research & Analysis Company (FRAC); Chairman and a Director of Fidelity Investments Money Management, Inc.; and Chairman (2001-present) and a Director of FMR Co., Inc. In addition, Mr. Johnson serves as Chairman and Director of Fidelity International Limited (FIL). |
Robert L. Reynolds (54) |
| Year of Election or Appointment: 2003 Mr. Reynolds is President and a Director of FMR (2005-present), Fidelity Investments Money Management, Inc. (2005-present), and FMR Co., Inc. (2005-present). Mr. Reynolds also serves as Vice Chairman (2006-present), a Director (2003-present), and Chief Operating Officer of FMR Corp. and a Director of Strategic Advisers, Inc. (2005-present). He also serves on the Board at Fidelity Investments Canada, Ltd. |
* Trustees have been determined to be "Interested Trustees" by virtue of, among other things, their affiliation with the trust or various entities under common control with FMR.
Independent Trustees:
Correspondence intended for each Independent Trustee (that is, the Trustees other than the Interested Trustees) may be sent to Fidelity Investments, P.O. Box 55235, Boston, Massachusetts 02205-5235.
Name, Age; Principal Occupation |
Dennis J. Dirks (58) |
| Year of Election or Appointment: 2005 Prior to his retirement in May 2003, Mr. Dirks was Chief Operating Officer and a member of the Board of The Depository Trust & Clearing Corporation (DTCC) (1999-2003). He also served as President, Chief Operating Officer, and Board member of The Depository Trust Company (DTC) (1999-2003) and President and Board member of the National Securities Clearing Corporation (NSCC) (1999-2003). In addition, Mr. Dirks served as Chief Executive Officer and Board member of the Government Securities Clearing Corporation (2001-2003) and Chief Executive Officer and Board member of the Mortgage-Backed Securities Clearing Corporation (2001-2003). Mr. Dirks also serves as a Trustee and a member of the Finance Committee of Manhattan College (2005-present) and a Trustee and a member of the Finance Committee of AHRC of Nassau County (2006-present). |
Albert R. Gamper, Jr. (64) |
| Year of Election or Appointment: 2006 Prior to his retirement in December 2004, Mr. Gamper served as Chairman of the Board of CIT Group Inc. (commercial finance). During his tenure with CIT Group Inc. Mr. Gamper served in numerous senior management positions, including Chairman (1987-1989; 1999-2001; 2002-2004), Chief Executive Officer (1987-2004), and President (1989-2002). He currently serves as a member of the Board of Directors of Public Service Enterprise Group (utilities, 2001-present), Chairman of the Board of Governors, Rutgers University (2004-present), and Chairman of the Board of Saint Barnabas Health Care System. |
George H. Heilmeier (70) |
| Year of Election or Appointment: 2004 Dr. Heilmeier is Chairman Emeritus of Telcordia Technologies (communication software and systems), where prior to his retirement, he served as company Chairman and Chief Executive Officer. He currently serves on the Boards of Directors of The Mitre Corporation (systems engineering and information technology support for the government), and HRL Laboratories (private research and development, 2004-present). He is Chairman of the General Motors Science & Technology Advisory Board and a Life Fellow of the Institute of Electrical and Electronics Engineers (IEEE). Dr. Heilmeier is a member of the Defense Science Board and the National Security Agency Advisory Board. He is also a member of the National Academy of Engineering, the American Academy of Arts and Sciences, and the Board of Overseers of the School of Engineering and Applied Science of the University of Pennsylvania. Previously, Dr. Heilmeier served as a Director of TRW Inc. (automotive, space, defense, and information technology, 1992-2002), Compaq (1994-2002), Automatic Data Processing, Inc. (ADP) (technology-based business outsourcing, 1995-2002), INET Technologies Inc. (telecommunications network surveillance, 2001-2004), and Teletech Holdings (customer management services). He is the recipient of the 2005 Kyoto Prize in Advanced Technology for his invention of the liquid crystal display, and a member of the Consumer Electronics Hall of Fame. |
James H. Keyes (66) |
| Year of Election or Appointment: 2007 Prior to his retirement in 2003, Mr. Keyes was Chairman, President, and Chief Executive Officer of Johnson Controls, Inc. (automotive supplier, 1993-2003). He currently serves as a member of the boards of LSI Logic Corporation (semiconductor technologies), Navistar International Corporation (manufacture and sale of trucks, buses, and diesel engines, 2002-present), and Pitney Bowes, Inc. (integrated mail, messaging, and document management solutions). |
Marie L. Knowles (60) |
| Year of Election or Appointment: 2001 Prior to Ms. Knowles' retirement in June 2000, she served as Executive Vice President and Chief Financial Officer of Atlantic Richfield Company (ARCO) (diversified energy, 1996-2000). From 1993 to 1996, she was a Senior Vice President of ARCO and President of ARCO Transportation Company. She served as a Director of ARCO from 1996 to 1998. She currently serves as a Director of Phelps Dodge Corporation (copper mining and manufacturing) and McKesson Corporation (healthcare service, 2002-present). Ms. Knowles is a Trustee of the Brookings Institution and the Catalina Island Conservancy and also serves as a member of the Advisory Board for the School of Engineering of the University of Southern California. |
Ned C. Lautenbach (62) |
| Year of Election or Appointment: 2000 Mr. Lautenbach is Chairman of the Independent Trustees (2006-present). Mr. Lautenbach has been a partner of Clayton, Dubilier & Rice, Inc. (private equity investment firm) since September 1998. Previously, Mr. Lautenbach was with the International Business Machines Corporation (IBM) from 1968 until his retirement in 1998. Mr. Lautenbach serves as a Director of Sony Corporation (2006-present) and Eaton Corporation (diversified industrial) as well as the Philharmonic Center for the Arts in Naples, Florida. He also is a member of the Board of Trustees of Fairfield University (2005-present), as well as a member of the Council on Foreign Relations. |
Cornelia M. Small (62) |
| Year of Election or Appointment: 2005 Ms. Small is a member (2000-present) and Chairperson (2002-present) of the Investment Committee, and a member (2002-
present) of the Board of Trustees of Smith College. Previously, she served as Chief Investment Officer (1999-2000), Director of Global Equity Investments (1996-1999), and a member of the Board of Directors of Scudder, Stevens & Clark (1990-1997) and Scudder Kemper Investments (1997-1999). In addition, Ms. Small served as Co-Chair (2000-2003) of the Annual Fund for the Fletcher School of Law and Diplomacy. |
William S. Stavropoulos (67) |
| Year of Election or Appointment: 2001 Mr. Stavropoulos is Chairman Emeritus of the Board of Directors of The Dow Chemical Company. Since joining The Dow Chemical Company in 1967, Mr. Stavropoulos served in numerous senior management positions, including President (1993-2000; 2002-2003), CEO (1995-2000; 2002-2004), and Chairman of the Executive Committee (2000-2004). Currently, he is a Director of NCR Corporation (data warehousing and technology solutions), BellSouth Corporation (telecommunications), Chemical Financial Corporation, Maersk Inc. (industrial conglomerate, 2002-present), and Metalmark Capital (private equity investment firm, 2005-present). He also serves as a member of the Board of Trustees of the American Enterprise Institute for Public Policy Research. In addition, Mr. Stavropoulos is a member of The Business Council, J.P. Morgan International Council and the University of Notre Dame Advisory Council for the College of Science. |
Kenneth L. Wolfe (67) |
| Year of Election or Appointment: 2005 Prior to his retirement in 2001, Mr. Wolfe was Chairman and Chief Executive Officer of Hershey Foods Corporation (1993-2001). He currently serves as a member of the boards of Adelphia Communications Corporation (2003-present), Bausch & Lomb, Inc., and Revlon Inc. (2004-present). |
Advisory Board Member and Executive Officers:
Correspondence intended for each executive officer and Mr. Lynch may be sent to Fidelity Investments, 82 Devonshire Street, Boston, Massachusetts 02109.
Name, Age; Principal Occupation |
Peter S. Lynch (62) |
| Year of Election or Appointment: 2003 Member of the Advisory Board of Variable Insurance Products Fund IV. Mr. Lynch is Vice Chairman and a Director of FMR, and Vice Chairman (2001-present) and a Director of FMR Co., Inc. Previously, Mr. Lynch served as a Trustee of the Fidelity funds (1990-2003). In addition, he serves as a Trustee of Boston College and as the Chairman of the Inner-City Scholarship Fund. |
Kimberley H. Monasterio (43) |
| Year of Election or Appointment: 2007 President and Treasurer of VIP Real Estate. Ms. Monasterio also serves as President and Treasurer of other Fidelity funds (2007-present) and is an employee of FMR (2004-present). Previously, Ms. Monasterio served as Deputy Treasurer of the Fidelity funds (2004-2006). Before joining Fidelity Investments, Ms. Monasterio served as Treasurer (2000-2004) and Chief Financial Officer (2002-2004) of the Franklin Templeton Funds and Senior Vice President of Franklin Templeton Services, LLC (2000-2004). |
Dwight D. Churchill (53) |
| Year of Election or Appointment: 2005 Vice President of VIP Real Estate. Mr. Churchill also serves as Vice President of certain Equity Funds (2005-present). Mr. Churchill is Executive Vice President of FMR (2005-present) and FMR Co., Inc. (2005-present). Previously, Mr. Churchill served as Senior Vice President of Fidelity Investments Money Management, Inc. (2005-2006), Head of Fidelity's Fixed-Income Division (2000-2005), Vice President of Fidelity's Money Market Funds (2000-2005), Vice President of Fidelity's Bond Funds, and Senior Vice President of FMR. |
Eric M. Wetlaufer (44) |
| Year of Election or Appointment: 2006 Vice President of VIP Real Estate. Mr. Wetlaufer also serves as Vice President of certain International Equity Funds (2006-present). Mr. Wetlaufer is Senior Vice President of FMR (2006-present) and FMR Co., Inc. (2006-present), and President and Director of Fidelity Management & Research (U.K.) Inc. (2006-present) and Fidelity Research & Analysis Company (2006-present). Before joining Fidelity Investments in 2005, Mr. Wetlaufer was a partner in Oxhead Capital Management (2004-2005). Previously, Mr. Wetlaufer served as a Chief Investment Officer of Putnam Investments (1997-2003). |
Samuel Wald (32) |
| Year of Election or Appointment: 2005 Vice President of VIP Real Estate. Mr. Wald also serves as Vice President of other funds advised by FMR. Prior to assuming his current responsibilities, Mr. Wald worked as a research analyst, associate portfolio manager, and manager. |
Eric D. Roiter (58) |
| Year of Election or Appointment: 2002 Secretary of VIP Real Estate. He also serves as Secretary of other Fidelity funds; Vice President, General Counsel, and Secretary of FMR Co., Inc. (2001-present) and FMR; Assistant Secretary of Fidelity Management & Research (U.K.) Inc. (2001-present), Fidelity Research & Analysis Company (2001-present), and Fidelity Investments Money Management, Inc. (2001-present). Mr. Roiter is an Adjunct Member, Faculty of Law, at Boston College Law School (2003-present). Previously, Mr. Roiter served as Vice President and Secretary of Fidelity Distributors Corporation (FDC) (1998-2005). |
Stuart Fross (47) |
| Year of Election or Appointment: 2003 Assistant Secretary of VIP Real Estate. Mr. Fross also serves as Assistant Secretary of other Fidelity funds (2003-present), Vice President and Secretary of FDC (2005-present), and is an employee of FMR. |
R. Stephen Ganis (40) |
| Year of Election or Appointment: 2006 Anti-Money Laundering (AML) officer of VIP Real Estate. Mr. Ganis also serves as AML officer of other Fidelity funds (2006-
present) and FMR Corp. (2003-present). Before joining Fidelity Investments, Mr. Ganis practiced law at Goodwin Procter, LLP (2000-2002). |
Joseph B. Hollis (58) |
| Year of Election or Appointment: 2006 Chief Financial Officer of VIP Real Estate. Mr. Hollis also serves as Chief Financial Officer of other Fidelity funds. Mr. Hollis is President of Fidelity Pricing and Cash Management Services (FPCMS) (2005-present). Mr. Hollis also serves as President and Director of Fidelity Service Company, Inc. (2006-present). Previously, Mr. Hollis served as Senior Vice President of Cash Management Services (1999-2002) and Investment Management Operations (2002-2005). |
Kenneth A. Rathgeber (59) |
| Year of Election or Appointment: 2004 Chief Compliance Officer of VIP Real Estate. Mr. Rathgeber also serves as Chief Compliance Officer of other Fidelity funds (2004-present) and Executive Vice President of Risk Oversight for Fidelity Investments (2002-present). He is Chief Compliance Officer of FMR (2005-present), FMR Co., Inc. (2005-present), Fidelity Management & Research (U.K.) Inc. (2005-present), Fidelity Research & Analysis Company (2005-present), Fidelity Investments Money Management, Inc. (2005-present), and Strategic Advisers, Inc. (2005-present). Previously, Mr. Rathgeber served as Executive Vice President and Chief Operating Officer for Fidelity Investments Institutional Services Company, Inc. (1998-2002). |
Bryan A. Mehrmann (45) |
| Year of Election or Appointment: 2005 Deputy Treasurer of VIP Real Estate. Mr. Mehrmann also serves as Deputy Treasurer of other Fidelity funds (2005-present) and is an employee of FMR. Previously, Mr. Mehrmann served as Vice President of Fidelity Investments Institutional Services Group (FIIS)/Fidelity Investments Institutional Operations Corporation, Inc. (FIIOC) Client Services (1998-2004). |
Kenneth B. Robins (37) |
| Year of Election or Appointment: 2005 Deputy Treasurer of VIP Real Estate. Mr. Robins also serves as Deputy Treasurer of other Fidelity funds (2005-present) and is an employee of FMR (2004-present). Before joining Fidelity Investments, Mr. Robins worked at KPMG LLP, where he was a partner in KPMG's department of professional practice (2002-2004) and a Senior Manager (1999-2000). In addition, Mr. Robins served as Assistant Chief Accountant, United States Securities and Exchange Commission (2000-2002). |
Robert G. Byrnes (40) |
| Year of Election or Appointment: 2005 Assistant Treasurer of VIP Real Estate. Mr. Byrnes also serves as Assistant Treasurer of other Fidelity funds (2005-present) and is an employee of FMR (2005-present). Previously, Mr. Byrnes served as Vice President of FPCMS (2003-2005). Before joining Fidelity Investments, Mr. Byrnes worked at Deutsche Asset Management where he served as Vice President of the Investment Operations Group (2000-2003). |
John H. Costello (60) |
| Year of Election or Appointment: 2002 Assistant Treasurer of VIP Real Estate. Mr. Costello also serves as Assistant Treasurer of other Fidelity funds and is an employee of FMR. |
Peter L. Lydecker (52) |
| Year of Election or Appointment: 2004 Assistant Treasurer of VIP Real Estate. Mr. Lydecker also serves as Assistant Treasurer of other Fidelity funds (2004) and is an employee of FMR. |
Mark Osterheld (51) |
| Year of Election or Appointment: 2002 Assistant Treasurer of VIP Real Estate. Mr. Osterheld also serves as Assistant Treasurer of other Fidelity funds (2002) and is an employee of FMR. |
Gary W. Ryan (48) |
| Year of Election or Appointment: 2005 Assistant Treasurer of VIP Real Estate. Mr. Ryan also serves as Assistant Treasurer of other Fidelity funds (2005-present) and is an employee of FMR (2005-present). Previously, Mr. Ryan served as Vice President of Fund Reporting in FPCMS (1999-2005). |
Salvatore Schiavone (41) |
| Year of Election or Appointment: 2005 Assistant Treasurer of VIP Real Estate. Mr. Schiavone also serves as Assistant Treasurer of other Fidelity funds (2005-present) and is an employee of FMR (2005-present). Before joining Fidelity Investments, Mr. Schiavone worked at Deutsche Asset Management, where he most recently served as Assistant Treasurer (2003-2005) of the Scudder Funds and Vice President and Head of Fund Reporting (1996-2003). |
Annual Report
Distributions
The Board of Trustees of VIP Real Estate Portfolio voted to pay to shareholders of record at the opening of business on record date, the following distributions per share derived from capital gains realized from sales of portfolio securities:
Fund | Pay Date | Record Date | Capital Gains |
Initial Class | 02/09/07 | 02/09/07 | $.370 |
Service Class | 02/09/07 | 02/09/07 | $.370 |
Service Class 2 | 02/09/07 | 02/09/07 | $.370 |
Investor Class | 02/09/07 | 02/09/07 | $.370 |
The fund hereby designates as a capital gain dividend with respect to the taxable year ended December 31, 2006, $17,223,223, or, if subsequently determined to be different, the net capital gain of such year.
The fund will notify shareholders in January 2007 of amounts for use in preparing 2006 income tax returns.
VIP Real Estate Portfolio
Proxy Voting Results
A special meeting of the fund's shareholders was held on September 20, 2006. The results of votes taken among shareholders on the proposal before them are reported below. Each vote reported represents one dollar of net asset value held on the record date for the meeting.
PROPOSAL 1 |
To elect a Board of Trustees. A |
| # of
Votes | % of
Votes |
Dennis J. Dirks |
Affirmative | 92,459,317.52 | 96.102 |
Withheld | 3,749,837.05 | 3.898 |
TOTAL | 96,209,154.57 | 100.00 |
Albert R. Gamper, Jr. |
Affirmative | 92,260,598.99 | 95.896 |
Withheld | 3,948,555.58 | 4.104 |
TOTAL | 96,209,154.57 | 100.000 |
Robert M. Gates |
Affirmative | 92,315,480.72 | 95.953 |
Withheld | 3,893,673.85 | 4.047 |
TOTAL | 96,209,154.57 | 100.000 |
George H. Heilmeier |
Affirmative | 92,208,255.41 | 95.841 |
Withheld | 4,000,899.16 | 4.159 |
TOTAL | 96,209,154.57 | 100.000 |
Edward C. Johnson 3d |
Affirmative | 91,928,267.76 | 95.550 |
Withheld | 4,280,886.81 | 4.450 |
TOTAL | 96,209,154.57 | 100.000 |
Stephen P. Jonas |
Affirmative | 92,457,628.76 | 96.101 |
Withheld | 3,751,525.81 | 3.899 |
TOTAL | 96,209,154.57 | 100.000 |
James H. KeyesB |
Affirmative | 92,432,729.82 | 96.075 |
Withheld | 3,776,424.75 | 3.925 |
TOTAL | 96,209,154.57 | 100.000 |
Marie L. Knowles |
Affirmative | 92,398,847.52 | 96.040 |
Withheld | 3,810,307.05 | 3.960 |
TOTAL | 96,209,154.57 | 100.000 |
Ned C. Lautenbach |
Affirmative | 92,423,184.47 | 96.065 |
Withheld | 3,785,970.10 | 3.935 |
TOTAL | 96,209,154.57 | 100.000 |
William O. McCoy |
Affirmative | 92,086,293.90 | 95.715 |
Withheld | 4,122,860.67 | 4.285 |
TOTAL | 96,209,154.57 | 100.000 |
| # of
Votes | % of
Votes |
Robert L. Reynolds |
Affirmative | 92,439,032.86 | 96.081 |
Withheld | 3,770,121.71 | 3.919 |
TOTAL | 96,209,154.57 | 100.000 |
Cornelia M. Small |
Affirmative | 92,415,567.29 | 96.057 |
Withheld | 3,793,587.28 | 3.943 |
TOTAL | 96,209,154.57 | 100.000 |
William S. Stavropoulos |
Affirmative | 92,135,400.08 | 95.766 |
Withheld | 4,073,754.49 | 4.234 |
TOTAL | 96,209,154.57 | 100.000 |
Kenneth L. Wolfe |
Affirmative | 92,445,865.31 | 96.088 |
Withheld | 3,763,289.26 | 3.912 |
TOTAL | 96,209,154.57 | 100.000 |
A Denotes trust-wide proposal and voting results. B Effective on or about January 1, 2007. |
Annual Report
Board Approval of Investment Advisory Contracts and Management Fees
VIP Real Estate Portfolio
Each year, typically in July, the Board of Trustees, including the Independent Trustees (together, the Board), votes on the renewal of the management contract and sub-advisory agreements (together, the Advisory Contracts) for the fund. The Board, assisted by the advice of fund counsel and Independent Trustees' counsel, requests and considers a broad range of information throughout the year.
The Board meets regularly each month except August and takes into account throughout the year matters bearing on Advisory Contracts. The Board, acting directly and through its separate committees, considers at each of its meetings factors that are relevant to the annual renewal of the fund's Advisory Contracts, including the services and support provided to the fund and its shareholders. At the time of the renewal, the Board had 12 standing committees, each composed of Independent Trustees with varying backgrounds, to which the Board has assigned specific subject matter responsibilities in order to enhance effective decision-making by the Board. Each committee has adopted a written charter outlining the structure and purposes of the committee. One such committee, the Equity Contract Committee, meets periodically as needed throughout the year to consider matters specifically related to the annual renewal of Advisory Contracts. The committee requests and receives information on, and makes recommendations to the Independent Trustees concerning, the approval and annual review of the Advisory Contracts.
At its July 2006 meeting, the Board of Trustees, including the Independent Trustees, unanimously determined to renew the Advisory Contracts for the fund. In reaching its determination, the Board considered all factors it believed relevant, including (i) the nature, extent, and quality of the services to be provided to the fund and its shareholders (including the investment performance of the fund); (ii) the competitiveness of the management fee and total expenses of the fund; (iii) the total costs of the services to be provided by and the profits to be realized by the investment adviser and its affiliates from the relationship with the fund; (iv) the extent to which economies of scale would be realized as the fund grows; and (v) whether fee levels reflect these economies of scale, if any, for the benefit of fund shareholders.
In determining whether to renew the Advisory Contracts for the fund, the Board ultimately reached a determination, with the assistance of fund counsel and Independent Trustees' counsel, that the renewal of the Advisory Contracts and the compensation to be received by Fidelity under the management contract is consistent with Fidelity's fiduciary duty under applicable law. In addition to evaluating the specific factors noted above, the Board, in reaching its determination, is aware that shareholders in the fund have a broad range of investment choices available to them, including a wide choice among mutual funds offered by competitors to Fidelity, and that the fund's shareholders, with the opportunity to review and weigh the disclosure provided by the fund in its prospectus and other public disclosures, have chosen to invest in this fund, managed by Fidelity.
Nature, Extent, and Quality of Services Provided. The Board considered staffing within the investment adviser, FMR, and the sub-advisers (together, the Investment Advisers), including the background of the fund's portfolio manager and the fund's investment objective and discipline. The Independent Trustees also had discussions with senior management of Fidelity's investment operations and investment groups. The Board considered the structure of the portfolio manager compensation program and whether this structure provides appropriate incentives.
Resources Dedicated to Investment Management and Support Services. The Board reviewed the size, education, and experience of the Investment Advisers' investment staff, their use of technology, and the Investment Advisers' approach to recruiting, training, and retaining portfolio managers and other research, advisory, and management personnel. The Board considered Fidelity's extensive global research capabilities that enable the Investment Advisers to aggregate data from various sources in an effort to produce positive investment results. The Board noted that Fidelity's analysts have access to a variety of technological tools that enable them to perform both fundamental and quantitative analysis and to specialize in various disciplines. The Board also considered that Fidelity's portfolio managers and analysts have access to daily portfolio attribution that allows for monitoring of a fund's portfolio, as well as an electronic communication system that provides immediate real-time access to research concerning issuers and credit enhancers.
Shareholder and Administrative Services. The Board considered (i) the nature, extent, quality, and cost of administrative, distribution, and shareholder services performed by the Investment Advisers and their affiliates under the Advisory Contracts and under separate agreements covering transfer agency, pricing and bookkeeping, and securities lending services for the fund; (ii) the nature and extent of the Investment Advisers' supervision of third party service providers, principally custodians and subcustodians; and (iii) the resources devoted to, and the record of compliance with, the fund's compliance policies and procedures. The Board reviewed the allocation of fund brokerage, including allocations to brokers affiliated with the Investment Advisers, the use of brokerage commissions to pay fund expenses, and the use of "soft" commission dollars to pay for research services. The Board also considered that Fidelity voluntarily pays for market data out of its own resources.
The Board noted that the growth of fund assets across the complex allows Fidelity to reinvest in the development of services designed to enhance the value or convenience of the Fidelity funds as investment vehicles. These services include 24-hour access to account information and market information through phone representatives and over the Internet, and investor education materials and asset allocation tools.
Investment in a Large Fund Family. The Board considered the benefits to shareholders of investing in a Fidelity fund, including the benefits of investing in a fund that is part of a large family of funds offering a variety of investment disciplines and providing for a large variety of mutual fund investor services. The Board noted that, since the last Advisory Contract renewals in July 2005, Fidelity has taken a number of actions that benefited particular funds, including (i) dedicating additional resources to investment research and to restructure the investment research teams; (ii) voluntarily entering into contractual arrangements with certain brokers pursuant to which Fidelity pays for research products and services separately out of its own resources, rather than bundling with fund commissions; (iii) launching the Fidelity Advantage Class of its five Spartan stock index funds and three Spartan bond index funds, which is a lower-fee class available to shareholders with higher account balances; (iv) contractually agreeing to impose expense limitations on Fidelity U.S. Bond Index Fund and reducing the fund's initial investment minimum; and (v) offering shareholders of each of the Fidelity Institutional Money Market Funds the privilege of exchanging shares of the fund for shares of other Fidelity funds.
VIP Real Estate Portfolio
Investment Performance and Compliance. The Board considered whether the fund has operated within its investment objective, as well as its record of compliance with its investment restrictions. It also reviewed the fund's absolute investment performance for each class (except Investor Class), as well as the fund's relative investment performance for each class (except Investor Class) measured against (i) a broad-based securities market index, and (ii) a peer group of mutual funds deemed appropriate by the Board over multiple periods. Because the fund had been in existence less than five calendar years, the following charts considered by the Board show, over the one- and three-year periods ended December 31, 2005, the cumulative total returns of Service Class 2 and Initial Class of the fund, the cumulative total returns of a broad-based securities market index ("benchmark"), and a range of cumulative total returns of a peer group of mutual funds identified by Lipper Inc. as having an investment objective similar to that of the fund. The returns of Service Class 2 and Initial Class represent the performance of classes with the highest and lowest 12b-1 fees, respectively (not necessarily with the highest and lowest total expenses). (Investor Class of the fund, which has no 12b-1 fee, had less than one year of performance as of December 31, 2005.) The box within each chart shows the 25th percentile return (bottom of box) and the 75th percentile return (top of box) of the Lipper peer group. Returns shown above the box are in the first quartile and returns shown below the box are in the fourth quartile. The percentage beaten numbers noted below each chart correspond to the percentile box and represent the percentage of funds in the Lipper peer group whose performance was equal to or lower than that of the class indicated.
VIP Real Estate Portfolio
The Board reviewed the fund's relative investment performance against its Lipper peer group and stated that the performance of Initial Class of the fund was in the first quartile for the one-year period and the third quartile for the three-year period. The Board also stated that the relative investment performance of Initial Class of the fund compared favorably to its benchmark for the one-year period, although the fund's three-year cumulative total return was lower than its benchmark. The Board considered that the variations in performance among the fund's classes reflect the variations in class expenses, which result in lower performance for higher expense classes.
The Board considered that FMR has taken steps to refocus and strengthen equity research, equity portfolio management, and compliance. The Board noted with favor FMR's reorganization of its senior management team in 2005 and FMR's dedication of additional resources to investment research, and participated in the process that led to those changes.
Based on its review, and giving particular weight to the nature and quality of the resources dedicated by the Investment Advisers to maintain and improve relative performance, the Board concluded that the nature, extent, and quality of the services provided to the fund will benefit the fund's shareholders, particularly in light of the Board's view that the fund's shareholders benefit from investing in a fund that is part of a large family of funds offering a variety of investment disciplines and services.
Competitiveness of Management Fee and Total Fund Expenses. The Board considered the fund's management fee and total expenses compared to "mapped groups" of competitive funds and classes. Fidelity creates "mapped groups" by combining similar Lipper investment objective categories that have comparable management fee characteristics. Combining Lipper investment objective categories aids the Board's management fee and total expense comparisons by broadening the competitive group used for comparison and by reducing the number of universes to which various Fidelity funds are compared.
Annual Report
Board Approval of Investment Advisory Contracts and Management Fees - continued
The Board considered two proprietary management fee comparisons for the 12-month (or shorter) periods shown in the chart below. The group of Lipper funds used by the Board for management fee comparisons is referred to below as the "Total Mapped Group" and, for the reasons explained above, is broader than the Lipper peer group used by the Board for performance comparisons. The Total Mapped Group comparison focuses on a fund's standing relative to the total universe of comparable funds available to investors, in terms of gross management fees before expense reimbursements or caps. "TMG %" represents the percentage of funds in the Total Mapped Group that had management fees that were lower than the fund's. For example, a TMG % of 19% means that 81% of the funds in the Total Mapped Group had higher management fees than the fund. The "Asset-Size Peer Group" (ASPG) comparison focuses on a fund's standing relative to non-Fidelity funds similar in size to the fund within the Total Mapped Group. The ASPG represents at least 15% of the funds in the Total Mapped Group with comparable asset size and management fee characteristics, subject to a minimum of 50 funds (or all funds in the Total Mapped Group if fewer than 50). Additional information, such as the ASPG quartile in which the fund's management fee ranked, is also included in the chart and considered by the Board.
VIP Real Estate Portfolio
The Board noted that the fund's management fee ranked below the median of its Total Mapped Group and below the median of its ASPG for 2005.
Based on its review, the Board concluded that the fund's management fee was fair and reasonable in light of the services that the fund receives and the other factors considered.
In its review of each class's total expenses, the Board considered the fund's management fee as well as other fund or class expenses, as applicable, such as transfer agent fees, pricing and bookkeeping fees, fund-paid 12b-1 fees, and custodial, legal, and audit fees. The Board also noted the effects of any waivers and reimbursements on fees and expenses. As part of its review, the Board also considered current and historical total expenses of each class of the fund compared to competitive fund median expenses. Each class of the fund is compared to those funds and classes in the Total Mapped Group (used by the Board for management fee comparisons) that have a similar sales load structure.
The Board noted that the total expenses of each of Initial Class and Service Class ranked below its competitive median for 2005, the total expenses of Investor Class ranked equal to its competitive median for 2005, and the total expenses of Service Class 2 ranked above its competitive median for 2005. The Board noted that the fund offers multiple classes, each of which has a different 12b-1 fee structure, and that the multiple structures are intended to offer a range of pricing options for the intermediary market. The Board also noted that the total expenses of the classes vary primarily by the level of their 12b-1 fees, although differences in transfer agent fees may also cause expenses to vary from class to class.
In its review of total expenses, the Board also considered Fidelity fee structures and other information on clients that FMR and its affiliates service in other competitive markets, such as other mutual funds advised or subadvised by FMR or its affiliates, pension plan clients, and other institutional clients.
Based on its review, the Board concluded that the total expenses of each class of the fund were reasonable, although in one case above the median of the universe presented for comparison, in light of the services that the fund and its shareholders receive and the other factors considered.
VIP Real Estate Portfolio
Costs of the Services and Profitability. The Board considered the revenues earned and the expenses incurred by Fidelity in conducting the business of developing, marketing, distributing, managing, administering and servicing the fund and its shareholders. The Board also considered the level of Fidelity's profits in respect of all the Fidelity funds.
On an annual basis, FMR presents to the Board Fidelity's profitability for the fund. Fidelity calculates the profitability for each fund, as well as aggregate profitability for groups of Fidelity funds and all Fidelity funds, using a series of detailed revenue and cost allocation methodologies which originate with the audited books and records of Fidelity. The Audit Committee of the Board reviews any significant changes from the prior year's methodologies.
PricewaterhouseCoopers LLP (PwC), independent registered accounting firm and auditor to Fidelity and certain Fidelity funds, has been engaged annually by the Board as part of the Board's assessment of the results of Fidelity's profitability analysis. PwC's engagement includes the review and assessment of Fidelity's methodologies used in determining the revenues and expenses attributable to Fidelity's mutual fund business, and completion of agreed-upon procedures surrounding the mathematical accuracy of fund profitability and its conformity to allocation methodologies. After considering PwC's reports issued under the engagement and information provided by Fidelity, the Board believes that while other allocation methods may also be reasonable, Fidelity's profitability methodologies are reasonable in all material respects.
The Board has also reviewed Fidelity's non-fund businesses and any fall-out benefits related to the mutual fund business as well as cases where Fidelity's affiliates may benefit from or be related to the fund's business.
The Board considered the costs of the services provided by and the profits realized by Fidelity in connection with the operation of the fund and determined that the amount of profit is a fair entrepreneurial profit for the management of the fund.
Economies of Scale. The Board considered whether there have been economies of scale in respect of the management of the Fidelity funds, whether the Fidelity funds (including the fund) have appropriately benefited from any such economies of scale, and whether there is potential for realization of any further economies of scale. The Board considered the extent to which the fund will benefit from economies of scale through increased services to the fund, through waivers or reimbursements, or through fee or expense reductions.
The Board recognized that the fund's management contract incorporates a "group fee" structure, which provides for lower fee rates as total fund assets under FMR's management increase, and for higher fee rates as total fund assets under FMR's management decrease. The Board considered that the group fee is designed to deliver the benefits of economies of scale to fund shareholders when total fund assets increase, even if assets of any particular fund are unchanged or have declined, because some portion of Fidelity's costs are attributable to services provided to all Fidelity funds, and all funds benefit if those costs can be allocated among more assets. The Board concluded that, given the group fee structure, fund shareholders will achieve a certain level of economies of scale as assets under FMR's management increase at the fund complex level, regardless of whether Fidelity achieves any such economies of scale.
The Board further concluded that any potential economies of scale are being shared between fund shareholders and Fidelity in an appropriate manner.
Additional Information Requested by the Board. In order to develop fully the factual basis for consideration of the Advisory Contracts, the Board requested additional information on several topics, including (i) Fidelity's fund profitability methodology and profitability trends within certain funds; (ii) portfolio manager compensation; (iii) the extent to which any economies of scale exist and are shared between the funds and Fidelity; (iv) the total expenses of certain funds and classes relative to competitors, including the extent to which the expenses of certain funds have been or could be capped; (v) fund performance trends; and (vi) Fidelity's fee structures, including use of performance fees.
Based on its evaluation of all of the conclusions noted above, and after considering all material factors, the Board ultimately concluded that the advisory fee structures are fair and reasonable, and that the fund's Advisory Contracts should be renewed.
Annual Report
VIP Real Estate Portfolio
Annual Report
Investment Adviser
Fidelity Management & Research Company
Boston, MA
Investment Sub-Advisers
FMR Co., Inc.
Fidelity Management & Research (U.K.) Inc.
Fidelity Research & Analysis Company
(formerly Fidelity Management &
Research (Far East) Inc.)
Fidelity Investments Japan Limited
Fidelity International Investment Advisors
Fidelity International Investment Advisors (U.K.) Ltd.
General Distributor
Fidelity Distributors Corporation
Boston, MA
Transfer and Service Agents
Fidelity Investments Institutional Operations Company, Inc.
Boston, MA
Fidelity Service Company, Inc.
Boston, MA
Custodian
Mellon Bank, N.A.
Pittsburgh, PA
VIPRE-ANN-0207
1.781992.104
Fidelity® Variable Insurance Products:
Strategic Income Portfolio
Annual Report
December 31, 2006
(2_fidelity_logos) (Registered_Trademark)
Contents
Performance | <Click Here> | How the fund has done over time. |
Management's Discussion | <Click Here> | The managers' review of fund performance, strategy and outlook. |
Shareholder Expense Example | <Click Here> | An example of shareholder expenses. |
Investment Changes | <Click Here> | A summary of major shifts in the fund's investments over the past six months. |
Investments | <Click Here> | A complete list of the fund's investments with their
market values. |
Financial Statements | <Click Here> | Statements of assets and liabilities, operations, and
changes in net assets, as well as financial highlights. |
Notes | <Click Here> | Notes to the financial statements. |
Report of Independent Registered Public Accounting Firm | <Click Here> | |
Trustees and Officers | <Click Here> | |
Distributions | <Click Here> | |
Proxy Voting Results | <Click Here> | |
To view a fund's proxy voting guidelines and proxy voting record for the 12-month period ended June 30, visit www.fidelity.com/proxyvotingresults or visit the Securities and Exchange Commission's (SEC) web site at www.sec.gov. You may also call 1-877-208-0098 to request a free copy of the proxy voting guidelines.
Fidelity Variable Insurance Products are separate account options which are purchased through a variable insurance contract.
Standard & Poor's, S&P and S&P 500 are registered service marks of The McGraw-Hill Companies, Inc. and have been licensed for use by Fidelity Distributors Corporation.
Other third party marks appearing herein are the property of their respective owners.
All other marks appearing herein are registered or unregistered trademarks or service marks of FMR Corp. or an affiliated company.
This report and the financial statements contained herein are submitted for the general information of the shareholders of the fund. This report is not authorized for distribution to prospective investors in the fund unless preceded or accompanied by an effective prospectus.
A fund files its complete schedule of portfolio holdings with the SEC for the first and third quarters of each fiscal year on Form N-Q. Forms N-Q are available on the SEC's web site at http://www.sec.gov. A fund's Forms N-Q may be reviewed and copied at the SEC's Public Reference Room in Washington, DC. Information regarding the operation of the SEC's Public Reference Room may be obtained by calling 1-800-SEC-0330. For a complete list of a fund's portfolio holdings, view the most recent quarterly holdings report, semiannual report, or annual report on Fidelity's web site at http://www.advisor.fidelity.com.
NOT FDIC INSURED · MAY LOSE VALUE · NO BANK GUARANTEE
Neither the fund nor Fidelity Distributors Corporation is a bank.
VIP Strategic Income Portfolio
VIP Strategic Income Portfolio
Performance: The Bottom Line
Average annual total return reflects the change in the value of an investment, assuming reinvestment of the class' dividend income and capital gains (the profits earned upon the sale of securities that have grown in value) and assuming a constant rate of performance each year. During periods of reimbursement by Fidelity, a fund's total return will be greater than it would be had the reimbursement not occurred. Performance numbers are net of all underlying fund operating expenses, but do not include any insurance charges imposed by your insurance company's separate account. If performance information included the effect of these additional charges, the total returns would have been lower. How a fund did yesterday is no guarantee of how it will do tomorrow.
Average Annual Total Returns
Periods ended December 31, 2006 | | Past 1
year | Life of
fund A |
VIP Strategic Income - Initial Class | | 7.87% | 6.46% |
VIP Strategic Income - Service Class B | | 7.78% | 6.32% |
VIP Strategic Income - Service Class 2 C | | 7.54% | 6.14% |
VIP Strategic Income - Investor Class D | | 7.85% | 6.43% |
A From December 23, 2003.
B Performance for Service Class shares reflects an asset-based service fee (12b-1 fee).
C Performance for Service Class 2 shares reflects an asset-based service fee (12b-1 fee).
D The initial offering of Investor Class shares took place on July 21, 2005. Returns prior to July 21, 2005 are those of Initial Class. If Investor Class's transfer agent fee had been reflected, returns prior to July 21, 2005 would have been lower.
$10,000 Over Life of Fund
Let's say hypothetically that $10,000 was invested in VIP Strategic Income Portfolio - Initial Class on December 23, 2003, when the fund started. The chart shows how the value of your investment would have changed, and also shows how the Merrill Lynch U.S. High Yield Master II Constrained Index and the Merrill Lynch U.S. High Yield Master II Index performed over the same period.
Beginning on January 1, 2006, the Merrill Lynch U.S. High Yield Master II Constrained Index replaced the Merrill Lynch U.S. High Yield Master II Index as the fund's primary index for all time periods because the Merrill Lynch U.S. High Yield Master II Constrained Index conforms more closely to the fund's investment strategy.
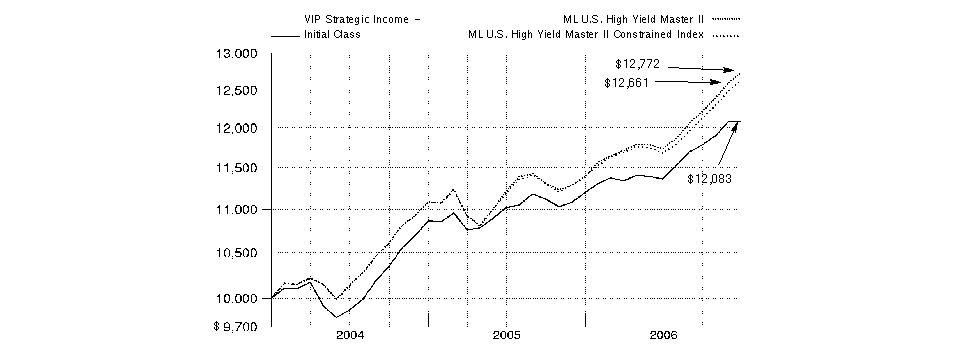
Annual Report
VIP Strategic Income Portfolio
Management's Discussion of Fund Performance
Comments from Derek Young and Christopher Sharpe, Lead Co-Managers of VIP Strategic Income Portfolio
Rising global interest rates and inflation concerns tempered the performance of investment-grade and higher-risk debt in first half of 2006. But the second half proved much kinder, thanks to a sharp decline in oil prices, continued strong corporate earnings and the U.S. central bank's pause in its two-year campaign of interest rate hikes. Against this backdrop, U.S. high-yield bonds fared best. Their lower sensitivity to interest rate movements and investors' thirst for higher yields drove the Merrill Lynch® U.S. High Yield Master II Constrained Index up 10.76%. Emerging-markets debt had the next-best showing in 2006, as the J.P. Morgan Emerging Markets Bond Index Global rose 9.88%. The Citigroup® Non-U.S. Group of 7 Index - representing the debt performance of major global economies, excluding the United States - rose 8.53%. In general, international securities benefited from the U.S. dollar's decline against most major foreign currencies. The U.S. government debt market had only a modest return of 3.48% as measured by the Lehman Brothers® Government Bond Index.
During the past year, the fund lagged slightly behind the Fidelity Strategic Income Composite Index, which returned 8.10%. (For specific portfolio performance results, please refer to the performance section of this report.) Each of the asset classes in the fund had positive absolute returns, and most of the fund's performance versus the index came from favorable security selection. Our subportfolio managers beat their individual benchmarks in each of the asset classes except developed-country debt, which had strong absolute results but fell just short of its benchmark. A defensive asset allocation strategy of modestly underweighting all of the asset classes created a cash position that was more than 6% of assets at period end, which contributed to the portfolio's absolute results and improved its risk profile, but had a negative impact on relative performance. The biggest boosts came from the high-yield and emerging-markets subportfolios, led by productive security selection and market selection, respectively. The U.S. government debt category benefited from strong demand for U.S. debt from foreign investors. The developed-markets subportfolio had strong absolute returns, aided in part by favorable currency movements, but fell short of its benchmark because of ineffective issue selection in Japan.
Note to shareholders:
As of January 1, 2006, the fund's primary benchmark - and the high-yield component of its Composite index - changed to the Merrill Lynch U.S. High Yield Master II Constrained Index, which conforms more closely to the high-yield subportfolio's investment strategy.
The views expressed above reflect those of the portfolio manager(s) only through the end of the period as stated on the cover of this report and do not necessarily represent the views of Fidelity or any other person in the Fidelity organization. Any such views are subject to change at any time based upon market or other conditions and Fidelity disclaims any responsibility to update such views. These views may not be relied on as investment advice and, because investment decisions for a Fidelity fund are based on numerous factors, may not be relied on as an indication of trading intent on behalf of any Fidelity fund.
VIP Strategic Income Portfolio
VIP Strategic Income Portfolio
Shareholder Expense Example
As a shareholder of the Fund, you incur two types of costs: (1) transaction costs, and (2) ongoing costs, including management fees, distribution and/or service (12b-1) fees and other Fund expenses. This Example is intended to help you understand your ongoing costs (in dollars) of investing in the Fund and to compare these costs with the ongoing costs of investing in other mutual funds.
The Example is based on an investment of $1,000 invested at the beginning of the period and held for the entire period (July 1, 2006 to December 31, 2006).
Actual Expenses
The first line of the accompanying table for each class of the Fund provides information about actual account values and actual expenses. You may use the information in this line, together with the amount you invested, to estimate the expenses that you paid over the period. Simply divide your account value by $1,000.00 (for example, an $8,600 account value divided by $1,000.00 = 8.6), then multiply the result by the number in the first line for a class of the Fund under the heading entitled "Expenses Paid During Period" to estimate the expenses you paid on your account during this period. The estimate of expenses does not include any fees or other expenses of any variable annuity or variable life insurance product. If they were, the estimate of expenses you paid during the period would be higher, and your ending account value would be lower. In addition, the Fund, as a shareholder in the underlying Fidelity Central Funds, will indirectly bear its pro rata share of the fees and expenses incurred by the underlying Fidelity Central Funds. These fees and expenses are not included in the Fund's annualized expense ratio used to calculate the expense estimate in the table below.
Hypothetical Example for Comparison Purposes
The second line of the accompanying table for each class of the Fund provides information about hypothetical account values and hypothetical expenses based on a Class' actual expense ratio and an assumed rate of return of 5% per year before expenses, which is not the Class' actual return. The hypothetical account values and expenses may not be used to estimate the actual ending account balance or expenses you paid for the period. You may use this information to compare the ongoing costs of investing in the Fund and other funds. To do so, compare this 5% hypothetical example with the 5% hypothetical examples that appear in the shareholder reports of the other funds. The estimate of expenses does not include any fees or other expenses of any variable annuity or variable life insurance product. If they were, the estimate of expenses you paid during the period would be higher, and your ending account value would be lower. In addition, the Fund, as a shareholder in the underlying Fidelity Central Funds, will indirectly bear its pro rata share of the fees and expenses incurred by the underlying Fidelity Central Funds. These fees and expenses are not included in the Fund's annualized expense ratio used to calculate the expense estimate in the table below.
Please note that the expenses shown in the table are meant to highlight your ongoing costs only and do not reflect any transaction costs. Therefore, the second line of the table is useful in comparing ongoing costs only, and will not help you determine the relative total costs of owning different funds.
| Beginning
Account Value
July 1, 2006 | Ending
Account Value
December 31, 2006 | Expenses Paid
During Period*
July 1, 2006 to
December 31, 2006 |
Initial Class | | | |
Actual | $ 1,000.00 | $ 1,063.30 | $ 3.80 |
HypotheticalA | $ 1,000.00 | $ 1,021.53 | $ 3.72 |
Service Class | | | |
Actual | $ 1,000.00 | $ 1,062.50 | $ 4.31 |
HypotheticalA | $ 1,000.00 | $ 1,021.02 | $ 4.23 |
Service Class 2 | | | |
Actual | $ 1,000.00 | $ 1,061.10 | $ 5.09 |
HypotheticalA | $ 1,000.00 | $ 1,020.27 | $ 4.99 |
Investor Class | | | |
Actual | $ 1,000.00 | $ 1,063.20 | $ 4.26 |
HypotheticalA | $ 1,000.00 | $ 1,021.07 | $ 4.18 |
A 5% return per year before expenses
* Expenses are equal to each Class' annualized expense ratio (shown in the table below); multiplied by the average account value over the period, multiplied by 184/365 (to reflect the one-half year period). The fees and expenses of the underlying Fidelity Central Funds in which the Fund invests are not included in the Fund's annualized expense ratio.
| Annualized
Expense Ratio |
Initial Class | .73% |
Service Class | .83% |
Service Class 2 | .98% |
Investor Class | .82% |
Annual Report
VIP Strategic Income Portfolio
Investment Changes
The information in the following tables is based on the combined investments of the Fund and its pro-rata share of its investments in each Fidelity Central Fund.
Top Five Holdings as of December 31, 2006 |
(by issuer, excluding cash equivalents) | % of fund's net assets | % of fund's net assets 6 months ago |
U.S. Treasury Obligations | 13.0 | 13.9 |
Fannie Mae | 11.9 | 9.4 |
French Government | 3.9 | 2.4 |
Japan Government | 2.6 | 2.2 |
United Kingdom, Great Britain & Northern Ireland | 2.3 | 2.2 |
| 33.7 | |
Top Five Market Sectors as of December 31, 2006 |
| % of fund's net assets | % of fund's net assets 6 months ago |
Consumer Discretionary | 8.6 | 9.5 |
Telecommunication Services | 6.1 | 6.7 |
Financials | 5.1 | 4.2 |
Information Technology | 4.8 | 4.8 |
Energy | 4.5 | 4.7 |
Quality Diversification (% of fund's net assets) |
As of December 31, 2006 | As of June 30, 2006 |
| U.S.Government and U.S.Government Agency
Obligations 28.7% | | | U.S.Government and U.S.Government Agency
Obligations 26.8% | |
 | AAA,AA,A 14.3% | | | AAA,AA,A 13.5% | |
 | BBB 3.7% | | | BBB 4.0% | |
 | BB 18.3% | | | BB 17.8% | |
 | B 19.8% | | | B 20.3% | |
 | CCC,CC,C 4.5% | | | CCC,CC,C 5.6% | |
 | D 0.2% | | | D 0.1% | |
 | Not Rated 2.6% | | | Not Rated 2.1% | |
 | Equities 0.2% | | | Equities 0.4% | |
| Short-Term Investments
and Net Other Assets 7.7% | | | Short-Term Investments
and Net Other Assets 9.4% | |

We have used ratings from Moody's® Investors Services, Inc. Where Moody's ratings are not available, we have used S&P® ratings. Percentages are adjusted for the effect of futures contracts, if applicable. |
Asset Allocation (% of fund's net assets) |
As of December 31, 2006* | As of June 30, 2006** |
| Corporate Bonds 33.5% | | | Corporate Bonds 34.7% | |
| U.S.Government and U.S.Government Agency
Obligations 28.7% | | | U.S.Government and U.S.Government Agency
Obligations 26.8% | |
| Foreign Government & Government Agency Obligations 23.1% | | | Foreign Government & Government Agency Obligations 23.7% | |
| Floating Rate Loans 6.7% | | | Floating Rate Loans 4.9% | |
| Stocks 0.2% | | | Stocks 0.4% | |
 | Other Investments 0.1% | | | Other Investments 0.1% | |
| Short-Term Investments
and Net Other Assets 7.7% | | | Short-Term Investments
and Net Other Assets 9.4% | |
* Foreign
investments | 32.1% | | ** Foreign investments | 32.3% | |

For an unaudited list of holdings for each Fidelity Equity and Fixed-Income Central Fund, visit advisor.fidelity.com. The reports are located just after the Fund's financial statements and quarterly reports.
VIP Strategic Income Portfolio
VIP Strategic Income Portfolio
Investments December 31, 2006
Showing Percentage of Net Assets
Corporate Bonds - 33.1% |
| Principal Amount (d) | | Value
(Note 1) |
Convertible Bonds - 0.1% |
CONSUMER DISCRETIONARY - 0.1% |
Media - 0.1% |
Liberty Media Corp. (Sprint Corp. PCS Series 1) 3.75% 2/15/30 | | $ 315,000 | | $ 196,088 |
INFORMATION TECHNOLOGY - 0.0% |
Semiconductors & Semiconductor Equipment - 0.0% |
ON Semiconductor Corp. 0% 4/15/24 | | 20,000 | | 19,748 |
TOTAL CONVERTIBLE BONDS | | 215,836 |
Nonconvertible Bonds - 33.0% |
CONSUMER DISCRETIONARY - 5.9% |
Auto Components - 0.4% |
Affinia Group, Inc. 9% 11/30/14 | | 345,000 | | 338,100 |
Delco Remy International, Inc.: | | | | |
9.375% 4/15/12 | | 25,000 | | 9,125 |
11% 5/1/09 | | 40,000 | | 16,200 |
TRW Automotive Acquisition Corp.: | | | | |
9.375% 2/15/13 | | 185,000 | | 197,719 |
11% 2/15/13 | | 38,000 | | 41,563 |
Visteon Corp. 7% 3/10/14 | | 400,000 | | 349,000 |
| | 951,707 |
Automobiles - 0.3% |
General Motors Corp.: | | | | |
8.375% 7/5/33 | EUR | 50,000 | | 63,568 |
8.375% 7/15/33 | | 765,000 | | 705,713 |
| | 769,281 |
Diversified Consumer Services - 0.1% |
Affinion Group, Inc. 11.5% 10/15/15 | | 175,000 | | 185,063 |
Hotels, Restaurants & Leisure - 1.2% |
Carrols Corp. 9% 1/15/13 | | 355,000 | | 362,100 |
Gaylord Entertainment Co.: | | | | |
6.75% 11/15/14 | | 130,000 | | 129,025 |
8% 11/15/13 | | 100,000 | | 104,000 |
Landry's Seafood Restaurants, Inc. 7.5% 12/15/14 | | 245,000 | | 239,488 |
Mandalay Resort Group: | | | | |
6.375% 12/15/11 | | 80,000 | | 79,600 |
6.5% 7/31/09 | | 20,000 | | 20,200 |
MGM Mirage, Inc.: | | | | |
6% 10/1/09 | | 40,000 | | 39,950 |
6.625% 7/15/15 | | 450,000 | | 433,688 |
6.75% 9/1/12 | | 45,000 | | 44,100 |
6.75% 4/1/13 | | 110,000 | | 107,525 |
6.875% 4/1/16 | | 310,000 | | 296,825 |
8.5% 9/15/10 | | 50,000 | | 53,500 |
Mohegan Tribal Gaming Authority 6.875% 2/15/15 | | 100,000 | | 100,250 |
|
| Principal Amount (d) | | Value
(Note 1) |
Penn National Gaming, Inc. 6.75% 3/1/15 | | $ 80,000 | | $ 78,700 |
Scientific Games Corp. 6.25% 12/15/12 | | 40,000 | | 38,900 |
Six Flags, Inc.: | | | | |
9.625% 6/1/14 | | 20,000 | | 18,550 |
9.75% 4/15/13 | | 160,000 | | 150,000 |
Speedway Motorsports, Inc. 6.75% 6/1/13 | | 95,000 | | 95,000 |
Town Sports International Holdings, Inc. 0% 2/1/14 (e) | | 23,000 | | 20,010 |
Universal City Development Partners Ltd./UCDP Finance, Inc. 11.75% 4/1/10 | | 45,000 | | 48,206 |
Vail Resorts, Inc. 6.75% 2/15/14 | | 225,000 | | 225,281 |
Virgin River Casino Corp./RBG LLC/B&BB, Inc.: | | | | |
0% 1/15/13 (e) | | 230,000 | | 162,725 |
9% 1/15/12 | | 30,000 | | 31,050 |
| | 2,878,673 |
Household Durables - 0.2% |
K. Hovnanian Enterprises, Inc.: | | | | |
6.25% 1/15/15 | | 50,000 | | 47,375 |
7.75% 5/15/13 | | 65,000 | | 64,188 |
Meritage Homes Corp. 6.25% 3/15/15 | | 90,000 | | 85,500 |
Urbi, Desarrollos Urbanos, SA de CV 8.5% 4/19/16 (g) | | 155,000 | | 167,400 |
| | 364,463 |
Leisure Equipment & Products - 0.0% |
Riddell Bell Holdings, Inc. 8.375% 10/1/12 | | 40,000 | | 39,600 |
Media - 2.8% |
AMC Entertainment, Inc. 11% 2/1/16 | | 120,000 | | 134,400 |
Cablemas SA de CV 9.375% 11/15/15 | | 200,000 | | 219,750 |
CanWest Media, Inc. 8% 9/15/12 | | 40,000 | | 41,700 |
Charter Communications Holdings I LLC 11.75% 5/15/14 | | 80,000 | | 71,600 |
Charter Communications Holdings I LLC/Charter Communications Holdings I Capital Corp. 11% 10/1/15 | | 155,000 | | 158,100 |
Charter Communications Holdings II LLC/Charter Communications Holdings II Capital Corp.: | | | | |
Series B, 10.25% 9/15/10 | | 180,000 | | 188,775 |
10.25% 9/15/10 | | 130,000 | | 135,525 |
CSC Holdings, Inc.: | | | | |
7.25% 4/15/12 (g)(h) | | 170,000 | | 167,025 |
7.625% 4/1/11 | | 40,000 | | 40,900 |
7.625% 7/15/18 | | 545,000 | | 530,694 |
7.875% 2/15/18 | | 655,000 | | 658,275 |
Corporate Bonds - continued |
| Principal Amount (d) | | Value
(Note 1) |
Nonconvertible Bonds - continued |
CONSUMER DISCRETIONARY - continued |
Media - continued |
EchoStar Communications Corp.: | | | | |
6.375% 10/1/11 | | $ 45,000 | | $ 44,663 |
6.625% 10/1/14 | | 790,000 | | 769,302 |
7.125% 2/1/16 | | 270,000 | | 269,676 |
Globo Communicacoes e Partcipacoes LTDA 9.375% | | 700,000 | | 718,375 |
Haights Cross Communications, Inc. 0% 8/15/11 (e) | | 20,000 | | 12,700 |
iesy Repository GmbH 10.375% 2/15/15 (g) | | 130,000 | | 124,475 |
Liberty Media Corp.: | | | | |
5.7% 5/15/13 | | 300,000 | | 284,250 |
8.25% 2/1/30 | | 80,000 | | 78,418 |
8.5% 7/15/29 | | 480,000 | | 482,619 |
MediMedia USA, Inc. 11.375% 11/15/14 (g) | | 50,000 | | 52,375 |
Net Servicos de Communicacao SA 9.25% 12/31/49 (g) | | 100,000 | | 102,150 |
PanAmSat Corp.: | | | | |
9% 8/15/14 | | 165,000 | | 175,313 |
9% 6/15/16 (g) | | 120,000 | | 127,050 |
Rainbow National LLC & RNS Co. Corp.: | | | | |
8.75% 9/1/12 (g) | | 110,000 | | 115,500 |
10.375% 9/1/14 (g) | | 595,000 | | 661,938 |
Vertis, Inc. 10.875% 6/15/09 | | 60,000 | | 60,150 |
Videotron Ltee 6.875% 1/15/14 | | 125,000 | | 125,313 |
WPP Group plc 4.375% 12/5/13 | EUR | 50,000 | | 64,749 |
| | 6,615,760 |
Specialty Retail - 0.6% |
AutoNation, Inc.: | | | | |
7% 4/15/14 | | 255,000 | | 255,638 |
7.3738% 4/15/13 (h) | | 60,000 | | 60,225 |
Burlington Coat Factory Warehouse Corp. 11.125% 4/15/14 (g) | | 115,000 | | 112,700 |
Michaels Stores, Inc.: | | | | |
10% 11/1/14 (g) | | 260,000 | | 268,450 |
11.375% 11/1/16 (g) | | 435,000 | | 449,681 |
Sally Holdings LLC: | | | | |
9.25% 11/15/14 (g) | | 80,000 | | 81,800 |
10.5% 11/15/16 (g) | | 120,000 | | 122,700 |
| | 1,351,194 |
Textiles, Apparel & Luxury Goods - 0.3% |
Levi Strauss & Co.: | | | | |
8.875% 4/1/16 | | 385,000 | | 400,400 |
9.75% 1/15/15 | | 290,000 | | 311,750 |
| | 712,150 |
TOTAL CONSUMER DISCRETIONARY | | 13,867,891 |
|
| Principal Amount (d) | | Value
(Note 1) |
CONSUMER STAPLES - 0.4% |
Food Products - 0.3% |
Gruma SA de CV 7.75% | | $ 200,000 | | $ 206,000 |
Hines Nurseries, Inc. 10.25% 10/1/11 | | 120,000 | | 105,600 |
National Beef Packing Co. LLC/National Beef Finance Corp. 10.5% 8/1/11 | | 25,000 | | 26,188 |
NPI Merger Corp.: | | | | |
9.4% 10/15/13 (g)(h) | | 50,000 | | 51,563 |
10.75% 4/15/14 (g) | | 55,000 | | 60,088 |
Reddy Ice Holdings, Inc. 0% 11/1/12 (e) | | 130,000 | | 109,200 |
Swift & Co.: | | | | |
10.125% 10/1/09 | | 70,000 | | 71,400 |
12.5% 1/1/10 | | 112,000 | | 114,240 |
| | 744,279 |
Household Products - 0.1% |
Central Garden & Pet Co. 9.125% 2/1/13 | | 75,000 | | 78,188 |
Personal Products - 0.0% |
Elizabeth Arden, Inc. 7.75% 1/15/14 | | 40,000 | | 40,000 |
TOTAL CONSUMER STAPLES | | 862,467 |
ENERGY - 4.1% |
Energy Equipment & Services - 0.5% |
CHC Helicopter Corp. 7.375% 5/1/14 | | 240,000 | | 232,200 |
Complete Production Services, Inc. 8% 12/15/16 (g) | | 240,000 | | 245,400 |
Hanover Compressor Co.: | | | | |
7.5% 4/15/13 | | 40,000 | | 40,200 |
9% 6/1/14 | | 125,000 | | 134,375 |
Ocean Rig Norway AS 8.375% 7/1/13 (g) | | 60,000 | | 64,350 |
Petroliam Nasional BHD (Petronas) 7.625% 10/15/26 (Reg. S) | | 305,000 | | 372,832 |
Seabulk International, Inc. 9.5% 8/15/13 | | 135,000 | | 146,138 |
| | 1,235,495 |
Oil, Gas & Consumable Fuels - 3.6% |
ANR Pipeline, Inc.: | | | | |
7.375% 2/15/24 | | 115,000 | | 128,800 |
8.875% 3/15/10 | | 110,000 | | 115,363 |
Atlas Pipeline Partners LP 8.125% 12/15/15 | | 70,000 | | 72,275 |
Berry Petroleum Co. 8.25% 11/1/16 | | 150,000 | | 149,250 |
Chaparral Energy, Inc. 8.5% 12/1/15 | | 130,000 | | 129,025 |
Chesapeake Energy Corp.: | | | | |
6.5% 8/15/17 | | 460,000 | | 447,925 |
Corporate Bonds - continued |
| Principal Amount (d) | | Value
(Note 1) |
Nonconvertible Bonds - continued |
ENERGY - continued |
Oil, Gas & Consumable Fuels - continued |
Chesapeake Energy Corp.: - continued | | | | |
6.875% 11/15/20 | | $ 390,000 | | $ 383,175 |
7.5% 9/15/13 | | 40,000 | | 41,450 |
7.5% 6/15/14 | | 35,000 | | 36,400 |
7.625% 7/15/13 | | 430,000 | | 453,113 |
Colorado Interstate Gas Co. 6.8% 11/15/15 | | 260,000 | | 270,075 |
Drummond Co., Inc. 7.375% 2/15/16 (g) | | 140,000 | | 134,400 |
Energy Partners Ltd. 8.75% 8/1/10 | | 155,000 | | 159,263 |
EXCO Resources, Inc. 7.25% 1/15/11 | | 10,000 | | 9,850 |
Harvest Operations Corp. 7.875% 10/15/11 | | 50,000 | | 47,000 |
InterNorth, Inc. 9.625% 3/15/06 (c) | | 100,000 | | 33,250 |
Massey Energy Co. 6.875% 12/15/13 | | 425,000 | | 399,500 |
Pan American Energy LLC 7.75% 2/9/12 (g) | | 345,000 | | 356,213 |
Peabody Energy Corp.: | | | | |
7.375% 11/1/16 | | 300,000 | | 319,500 |
7.875% 11/1/26 | | 300,000 | | 322,500 |
Pemex Project Funding Master Trust: | | | | |
6.625% 6/15/35 | | 95,000 | | 97,185 |
7.75% | | 804,000 | | 838,572 |
8.625% 2/1/22 | | 260,000 | | 323,050 |
Petrobras Energia SA 9.375% 10/30/13 | | 65,000 | | 73,206 |
Petrohawk Energy Corp. 9.125% 7/15/13 | | 310,000 | | 323,950 |
Petrozuata Finance, Inc.: | | | | |
7.63% 4/1/09 (g) | | 320,718 | | 319,516 |
8.22% 4/1/17 (g) | | 200,000 | | 199,000 |
Pogo Producing Co.: | | | | |
6.875% 10/1/17 | | 210,000 | | 201,600 |
7.875% 5/1/13 | | 135,000 | | 137,025 |
Range Resources Corp. 7.375% 7/15/13 | | 100,000 | | 102,000 |
Ship Finance International Ltd. 8.5% 12/15/13 | | 145,000 | | 144,638 |
Southern Star Central Corp. 6.75% 3/1/16 | | 90,000 | | 90,788 |
Targa Resources, Inc./Targa Resources Finance Corp. 8.5% 11/1/13 (g) | | 70,000 | | 70,525 |
Tennessee Gas Pipeline Co.: | | | | |
7% 10/15/28 | | 20,000 | | 21,080 |
7.5% 4/1/17 | | 445,000 | | 484,160 |
7.625% 4/1/37 | | 50,000 | | 55,500 |
|
| Principal Amount (d) | | Value
(Note 1) |
8.375% 6/15/32 | | $ 40,000 | | $ 47,650 |
Venoco, Inc. 8.75% 12/15/11 | | 70,000 | | 69,125 |
Williams Companies, Inc.: | | | | |
7.5% 1/15/31 | | 180,000 | | 185,400 |
7.625% 7/15/19 | | 140,000 | | 149,450 |
7.75% 6/15/31 | | 20,000 | | 20,900 |
7.875% 9/1/21 | | 15,000 | | 16,050 |
8.75% 3/15/32 | | 90,000 | | 101,250 |
YPF SA: | | | | |
10% 11/2/28 | | 200,000 | | 238,250 |
yankee 9.125% 2/24/09 | | 65,000 | | 68,494 |
| | 8,386,691 |
TOTAL ENERGY | | 9,622,186 |
FINANCIALS - 4.6% |
Capital Markets - 0.1% |
E*TRADE Financial Corp. 7.375% 9/15/13 | | 240,000 | | 247,200 |
Commercial Banks - 1.4% |
Banca Popolare di Lodi Investment Trust 6.742% (h) | EUR | 50,000 | | 71,614 |
Banco Nacional de Desenvolvimento Economico e Social 5.167% 6/16/08 (h) | | 575,000 | | 569,250 |
BIE Bank & Trust Ltd. 16.8% 3/13/07 | BRL | 55,000 | | 25,743 |
Development Bank of Philippines 8.375% 12/31/49 (h) | | 200,000 | | 211,500 |
Dresdner Bank AG 10.375% 8/17/09 (g) | | 400,000 | | 437,520 |
European Investment Bank 4% 10/15/37 | EUR | 100,000 | | 127,399 |
Inter-American Development Bank 6.625% 4/17/17 | PEN | 400,000 | | 127,050 |
JPMorgan Chase Bank 4.375% 11/30/21 (h) | EUR | 100,000 | | 129,908 |
Kyivstar GSM 7.75% 4/27/12 (Issued by Dresdner Bank AG for Kyivstar GSM) (g) | | 200,000 | | 208,620 |
Oesterreichische Kontrollbank 3.875% 9/15/16 | EUR | 325,000 | | 421,127 |
Russian Standard Finance SA 6.825% 9/16/09 | EUR | 50,000 | | 65,977 |
Shinsei Bank Ltd. 3.75% 2/23/16 (h) | EUR | 50,000 | | 64,017 |
SMFG Finance Ltd. 6.164% 12/18/49 (h) | GBP | 50,000 | | 97,103 |
Standard Chartered Bank 4.016% 3/28/18 (h) | EUR | 100,000 | | 131,756 |
UBS Luxembourg SA: | | | | |
8% 2/11/10 | | 300,000 | | 311,550 |
Corporate Bonds - continued |
| Principal Amount (d) | | Value
(Note 1) |
Nonconvertible Bonds - continued |
FINANCIALS - continued |
Commercial Banks - continued |
UBS Luxembourg SA: - continued | | | | |
8.25% 5/23/16 | | $ 200,000 | | $ 210,000 |
Vimpel Communications 10% 6/16/09 (Issued by UBS Luxembourg SA for Vimpel Communications) | | 100,000 | | 107,800 |
| | 3,317,934 |
Consumer Finance - 1.6% |
ACE Cash Express, Inc. 10.25% 10/1/14 (g) | | 80,000 | | 81,000 |
Ford Motor Credit Co.: | | | | |
6.625% 6/16/08 | | 375,000 | | 374,744 |
9.875% 8/10/11 | | 380,000 | | 406,420 |
General Motors Acceptance Corp.: | | | | |
6.75% 12/1/14 | | 505,000 | | 520,150 |
6.875% 9/15/11 | | 295,000 | | 302,375 |
6.875% 8/28/12 | | 360,000 | | 369,657 |
8% 11/1/31 | | 1,420,000 | | 1,625,900 |
| | 3,680,246 |
Diversified Financial Services - 0.7% |
Canada Housing Trust No.1 4.65% 9/15/09 | CAD | 550,000 | | 478,330 |
CCO Holdings LLC/CCO Holdings Capital Corp. 8.75% 11/15/13 | | 185,000 | | 190,550 |
DEPFA ACS Bank 3.875% 11/14/16 | EUR | 200,000 | | 257,043 |
Global Cash Access LLC/Global Cash Access Finance Corp. 8.75% 3/15/12 | | 238,000 | | 249,900 |
MUFG Capital Finance 2 Ltd. 4.85% (h) | EUR | 50,000 | | 64,500 |
Red Arrow International Leasing 8.375% 6/30/12 | RUB | 2,098,729 | | 82,413 |
TMK Capital SA 8.5% 9/29/09 | | 300,000 | | 310,500 |
| | 1,633,236 |
Insurance - 0.0% |
Eureko BV 5.125% (h) | EUR | 100,000 | | 131,505 |
Real Estate Investment Trusts - 0.4% |
BF Saul REIT 7.5% 3/1/14 | | 95,000 | | 95,356 |
Crescent Real Estate Equities LP/Crescent Finance Co. 9.25% 4/15/09 | | 50,000 | | 51,500 |
Rouse Co. LP/TRC, Inc. 6.75% 5/1/13 (g) | | 330,000 | | 336,534 |
Senior Housing Properties Trust: | | | | |
7.875% 4/15/15 | | 180,000 | | 186,300 |
8.625% 1/15/12 | | 280,000 | | 303,800 |
| | 973,490 |
|
| Principal Amount (d) | | Value
(Note 1) |
Real Estate Management & Development - 0.2% |
American Real Estate Partners/American Real Estate Finance Corp.: | | | | |
7.125% 2/15/13 | | $ 310,000 | | $ 310,000 |
8.125% 6/1/12 | | 190,000 | | 195,700 |
WT Finance (Aust) Pty Ltd./Westfield Europe Finance PLC/WEA Finance 3.625% 6/27/12 | EUR | 75,000 | | 94,559 |
| | 600,259 |
Thrifts & Mortgage Finance - 0.2% |
Residential Capital Corp. 6.875% 6/30/15 | | 385,000 | | 399,124 |
TOTAL FINANCIALS | | 10,982,994 |
HEALTH CARE - 1.2% |
Health Care Providers & Services - 1.1% |
AmeriPath, Inc. 10.5% 4/1/13 | | 150,000 | | 162,375 |
CRC Health Group, Inc. 10.75% 2/1/16 | | 90,000 | | 97,650 |
Fresenius Medical Care Capital Trust IV 7.875% 6/15/11 | | 125,000 | | 130,625 |
HCA, Inc.: | | | | |
9.125% 11/15/14 (g) | | 230,000 | | 245,525 |
9.25% 11/15/16 (g) | | 230,000 | | 245,813 |
9.625% 11/15/16 pay-in-kind (g) | | 580,000 | | 623,500 |
IASIS Healthcare LLC/IASIS Capital Corp. 8.75% 6/15/14 | | 90,000 | | 91,013 |
Rural/Metro Corp. 9.875% 3/15/15 | | 80,000 | | 83,100 |
Skilled Healthcare Group, Inc. 11% 1/15/14 (g) | | 120,000 | | 132,000 |
Team Finance LLC/Health Finance Corp. 11.25% 12/1/13 | | 150,000 | | 155,250 |
U.S. Oncology, Inc. 9% 8/15/12 | | 150,000 | | 157,125 |
Vanguard Health Holding Co. I 0% 10/1/15 (e) | | 65,000 | | 50,375 |
Vanguard Health Holding Co. II LLC 9% 10/1/14 | | 335,000 | | 338,769 |
| | 2,513,120 |
Life Sciences Tools & Services - 0.0% |
Bio-Rad Laboratories, Inc. 7.5% 8/15/13 | | 70,000 | | 72,800 |
Pharmaceuticals - 0.1% |
Elan Finance PLC/Elan Finance Corp. 7.75% 11/15/11 | | 65,000 | | 63,213 |
Leiner Health Products, Inc. 11% 6/1/12 | | 90,000 | | 92,250 |
Corporate Bonds - continued |
| Principal Amount (d) | | Value
(Note 1) |
Nonconvertible Bonds - continued |
HEALTH CARE - continued |
Pharmaceuticals - continued |
VWR International, Inc.: | | | | |
6.875% 4/15/12 | | $ 30,000 | | $ 30,188 |
8% 4/15/14 | | 180,000 | | 185,400 |
| | 371,051 |
TOTAL HEALTH CARE | | 2,956,971 |
INDUSTRIALS - 2.7% |
Aerospace & Defense - 0.1% |
Bombardier, Inc. 8% 11/15/14 (g) | | 80,000 | | 81,800 |
Hexcel Corp. 6.75% 2/1/15 | | 100,000 | | 97,000 |
Orbimage Holdings, Inc. 15.14% 7/1/12 (h) | | 100,000 | | 112,250 |
| | 291,050 |
Airlines - 0.4% |
Continental Airlines, Inc. pass thru trust certificates 6.9% 7/2/18 | | 20,539 | | 20,539 |
Delta Air Lines, Inc.: | | | | |
7.9% 12/15/09 (c) | | 750,000 | | 502,500 |
8.3% 12/15/29 (c) | | 130,000 | | 87,100 |
Northwest Airlines Corp. 10% 2/1/09 (c) | | 205,000 | | 193,725 |
Northwest Airlines, Inc.: | | | | |
7.875% 3/15/08 (c) | | 90,000 | | 84,150 |
8.875% 6/1/06 (c) | | 80,000 | | 74,400 |
Northwest Airlines, Inc. pass thru trust certificates 7.248% 7/2/14 | | 10,671 | | 8,857 |
| | 971,271 |
Commercial Services & Supplies - 0.8% |
ALH Finance LLC/ALH Finance Corp. 8.5% 1/15/13 | | 10,000 | | 9,875 |
Allied Security Escrow Corp. 11.375% 7/15/11 | | 100,000 | | 102,000 |
Allied Waste North America, Inc. 7.125% 5/15/16 | | 295,000 | | 292,050 |
Browning-Ferris Industries, Inc.: | | | | |
7.4% 9/15/35 | | 75,000 | | 70,125 |
9.25% 5/1/21 | | 100,000 | | 102,000 |
FTI Consulting, Inc.: | | | | |
7.625% 6/15/13 | | 50,000 | | 51,250 |
7.75% 10/1/16 (g) | | 80,000 | | 82,800 |
Mac-Gray Corp. 7.625% 8/15/15 | | 40,000 | | 40,500 |
NCO Group, Inc. 11.875% 11/15/14 (g) | | 160,000 | | 162,000 |
R.H. Donnelley Finance Corp. I 10.875% 12/15/12 | | 75,000 | | 81,750 |
West Corp.: | | | | |
9.5% 10/15/14 (g) | | 300,000 | | 300,000 |
|
| Principal Amount (d) | | Value
(Note 1) |
11% 10/15/16 (g) | | $ 300,000 | | $ 303,000 |
Williams Scotsman, Inc. 8.5% 10/1/15 | | 340,000 | | 354,875 |
| | 1,952,225 |
Construction & Engineering - 0.0% |
Blount, Inc. 8.875% 8/1/12 | | 50,000 | | 51,000 |
Electrical Equipment - 0.1% |
General Cable Corp. 9.5% 11/15/10 | | 125,000 | | 132,500 |
Polypore, Inc. 0% 10/1/12 (e) | | 100,000 | | 79,750 |
Sensus Metering Systems, Inc. 8.625% 12/15/13 | | 60,000 | | 60,000 |
| | 272,250 |
Machinery - 0.2% |
Chart Industries, Inc. 9.125% 10/15/15 (g) | | 60,000 | | 63,300 |
Invensys PLC 9.875% 3/15/11 (g) | | 4,000 | | 4,290 |
RBS Global, Inc. / Rexnord Corp.: | | | | |
9.5% 8/1/14 (g) | | 150,000 | | 156,000 |
11.75% 8/1/16 (g) | | 205,000 | | 214,225 |
| | 437,815 |
Marine - 0.4% |
American Commercial Lines LLC/ACL Finance Corp. 9.5% 2/15/15 | | 26,000 | | 28,860 |
H-Lines Finance Holding Corp. 0% 4/1/13 (e) | | 71,000 | | 66,030 |
Navios Maritime Holdings, Inc. 9.5% 12/15/14 (g) | | 230,000 | | 230,575 |
OMI Corp. 7.625% 12/1/13 | | 190,000 | | 194,750 |
Ultrapetrol (Bahamas) Ltd. 9% 11/24/14 | | 80,000 | | 77,600 |
US Shipping Partners LP 13% 8/15/14 (g) | | 170,000 | | 178,500 |
| | 776,315 |
Road & Rail - 0.4% |
Hertz Corp. 8.875% 1/1/14 (g) | | 190,000 | | 199,500 |
Kansas City Southern de Mexico SA de CV 7.625% 12/1/13 (g) | | 100,000 | | 99,875 |
Kansas City Southern Railway Co.: | | | | |
7.5% 6/15/09 | | 340,000 | | 343,400 |
9.5% 10/1/08 | | 45,000 | | 46,800 |
TFM SA de CV 9.375% 5/1/12 | | 300,000 | | 320,250 |
| | 1,009,825 |
Trading Companies & Distributors - 0.2% |
Ahern Rentals, Inc. 9.25% 8/15/13 | | 40,000 | | 41,700 |
Ashtead Holdings PLC 8.625% 8/1/15 (g) | | 75,000 | | 78,188 |
Glencore Finance (Europe) SA 5.375% 9/30/11 | EUR | 50,000 | | 66,736 |
Corporate Bonds - continued |
| Principal Amount (d) | | Value
(Note 1) |
Nonconvertible Bonds - continued |
INDUSTRIALS - continued |
Trading Companies & Distributors - continued |
Neff Rent LLC/Neff Finance Corp. 11.25% 6/15/12 | | $ 165,000 | | $ 179,850 |
Penhall International Corp. 12% 8/1/14 (g) | | 80,000 | | 86,800 |
| | 453,274 |
Transportation Infrastructure - 0.1% |
HIT Finance BV 4.875% 10/27/21 | EUR | 50,000 | | 64,327 |
TOTAL INDUSTRIALS | | 6,279,352 |
INFORMATION TECHNOLOGY - 4.0% |
Communications Equipment - 0.9% |
Hughes Network Systems LLC / HNS Finance Corp. 9.5% 4/15/14 | | 320,000 | | 333,600 |
L-3 Communications Corp. 6.375% 10/15/15 | | 190,000 | | 187,625 |
Lucent Technologies, Inc.: | | | | |
6.45% 3/15/29 | | 620,000 | | 573,500 |
6.5% 1/15/28 | | 415,000 | | 383,875 |
Nortel Networks Corp.: | | | | |
9.6238% 7/15/11 (g)(h) | | 190,000 | | 200,213 |
10.125% 7/15/13 (g) | | 190,000 | | 205,675 |
10.75% 7/15/16 (g) | | 190,000 | | 207,575 |
| | 2,092,063 |
Electronic Equipment & Instruments - 0.4% |
Altra Industrial Motion, Inc. 9% 12/1/11 | | 50,000 | | 51,500 |
Celestica, Inc. 7.875% 7/1/11 | | 495,000 | | 491,288 |
NXP BV: | | | | |
7.875% 10/15/14 (g) | | 120,000 | | 123,900 |
8.118% 10/15/13 (g)(h) | | 120,000 | | 121,650 |
Sanmina-SCI Corp. 8.125% 3/1/16 | | 180,000 | | 172,800 |
| | 961,138 |
IT Services - 0.7% |
Iron Mountain, Inc.: | | | | |
6.625% 1/1/16 | | 480,000 | | 458,400 |
7.75% 1/15/15 | | 180,000 | | 183,600 |
8.625% 4/1/13 | | 185,000 | | 190,550 |
8.75% 7/15/18 | | 190,000 | | 201,875 |
SunGard Data Systems, Inc.: | | | | |
9.125% 8/15/13 | | 260,000 | | 273,000 |
9.9725% 8/15/13 (h) | | 140,000 | | 144,900 |
10.25% 8/15/15 | | 180,000 | | 191,925 |
| | 1,644,250 |
Office Electronics - 0.7% |
Xerox Capital Trust I 8% 2/1/27 | | 480,000 | | 492,000 |
|
| Principal Amount (d) | | Value
(Note 1) |
Xerox Corp.: | | | | |
6.4% 3/15/16 | | $ 600,000 | | $ 610,806 |
7.2% 4/1/16 | | 180,000 | | 191,250 |
7.625% 6/15/13 | | 300,000 | | 315,000 |
| | 1,609,056 |
Semiconductors & Semiconductor Equipment - 1.3% |
Amkor Technology, Inc. 9.25% 6/1/16 | | 290,000 | | 283,475 |
Avago Technologies Finance Ltd.: | | | | |
10.8694% 6/1/13 (g)(h) | | 220,000 | | 228,800 |
11.875% 12/1/15 (g) | | 285,000 | | 308,513 |
Freescale Semiconductor, Inc.: | | | | |
8.875% 12/15/14 (g) | | 280,000 | | 279,664 |
9.125% 12/15/14 pay-in-kind (g) | | 865,000 | | 859,637 |
10.125% 12/15/16 (g) | | 870,000 | | 871,131 |
MagnaChip Semiconductor SA/MagnaChip Semiconductor Finance Co.: | | | | |
6.875% 12/15/11 | | 195,000 | | 163,800 |
8.61% 12/15/11 (h) | | 40,000 | | 34,400 |
New ASAT Finance Ltd. 9.25% 2/1/11 | | 105,000 | | 85,575 |
Viasystems, Inc. 10.5% 1/15/11 | | 140,000 | | 140,000 |
| | 3,254,995 |
TOTAL INFORMATION TECHNOLOGY | | 9,561,502 |
MATERIALS - 3.1% |
Chemicals - 1.1% |
America Rock Salt Co. LLC 9.5% 3/15/14 | | 225,000 | | 231,750 |
BCP Crystal U.S. Holdings Corp. 9.625% 6/15/14 | | 348,000 | | 384,540 |
Crystal US Holding 3 LLC/Crystal US Sub 3 Corp.: | | | | |
Series A, 0% 10/1/14 (e) | | 58,000 | | 49,010 |
Series B, 0% 10/1/14 (e) | | 569,000 | | 480,805 |
Huntsman LLC 11.625% 10/15/10 | | 182,000 | | 201,565 |
JohnsonDiversey Holdings, Inc. 0% 5/15/13 (e) | | 365,000 | | 350,400 |
Lyondell Chemical Co. 11.125% 7/15/12 | | 50,000 | | 54,188 |
Momentive Performance Materials, Inc.: | | | | |
9.75% 12/1/14 (g) | | 230,000 | | 230,288 |
10.125% 12/1/14 (g) | | 230,000 | | 232,300 |
11.5% 12/1/16 (g) | | 320,000 | | 316,000 |
Phibro Animal Health Corp. 10% 8/1/13 (g) | | 150,000 | | 155,625 |
SABIC Europe BV 4.5% 11/28/13 | EUR | 50,000 | | 64,657 |
| | 2,751,128 |
Corporate Bonds - continued |
| Principal Amount (d) | | Value
(Note 1) |
Nonconvertible Bonds - continued |
MATERIALS - continued |
Containers & Packaging - 0.5% |
AEP Industries, Inc. 7.875% 3/15/13 | | $ 40,000 | | $ 40,600 |
BWAY Corp. 10% 10/15/10 | | 90,000 | | 94,050 |
Constar International, Inc. 11% 12/1/12 | | 185,000 | | 171,125 |
Crown Cork & Seal, Inc.: | | | | |
7.5% 12/15/96 | | 160,000 | | 129,600 |
8% 4/15/23 | | 235,000 | | 228,538 |
Owens-Brockway Glass Container, Inc.: | | | | |
6.75% 12/1/14 | | 105,000 | | 101,850 |
8.25% 5/15/13 | | 195,000 | | 201,825 |
8.75% 11/15/12 | | 55,000 | | 58,300 |
8.875% 2/15/09 | | 36,000 | | 36,765 |
Tekni-Plex, Inc. 10.875% 8/15/12 (g) | | 60,000 | | 66,750 |
| | 1,129,403 |
Metals & Mining - 1.4% |
Aleris International, Inc.: | | | | |
9% 12/15/14 (g) | | 150,000 | | 151,313 |
10% 12/15/16 (g) | | 150,000 | | 151,313 |
Compass Minerals International, Inc. 0% 6/1/13 (e) | | 360,000 | | 342,900 |
Corporacion Nacional del Cobre (Codelco) 6.15% 10/24/36 (g) | | 100,000 | | 102,412 |
CSN Islands VIII Corp. 9.75% 12/16/13 (g) | | 315,000 | | 353,588 |
CSN Islands X Corp. (Reg. S) 9.5% | | 89,000 | | 92,560 |
Edgen Acquisition Corp. 9.875% 2/1/11 | | 60,000 | | 60,900 |
Evraz Group SA 8.25% 11/10/15 | | 100,000 | | 102,625 |
Evraz Securities SA 10.875% 8/3/09 | | 300,000 | | 328,875 |
FMG Finance Property Ltd.: | | | | |
10% 9/1/13 (g) | | 120,000 | | 123,600 |
10.625% 9/1/16 (g) | | 120,000 | | 128,400 |
Freeport-McMoRan Copper & Gold, Inc.: | | | | |
6.875% 2/1/14 | | 370,000 | | 376,475 |
10.125% 2/1/10 | | 5,000 | | 5,250 |
Gerdau AmeriSteel Corp./GUSAP Partners 10.375% 7/15/11 | | 70,000 | | 75,075 |
Gerdau SA 8.875% (g) | | 125,000 | | 132,813 |
International Steel Group, Inc. 6.5% 4/15/14 | | 445,000 | | 459,463 |
Ispat Inland ULC 9.75% 4/1/14 | | 20,000 | | 22,300 |
RathGibson, Inc. 11.25% 2/15/14 | | 305,000 | | 326,350 |
| | 3,336,212 |
Paper & Forest Products - 0.1% |
Glatfelter 7.125% 5/1/16 | | 40,000 | | 40,400 |
|
| Principal Amount (d) | | Value
(Note 1) |
Millar Western Forest Products Ltd. 7.75% 11/15/13 | | $ 95,000 | | $ 85,025 |
NewPage Corp. 11.6213% 5/1/12 (h) | | 90,000 | | 97,200 |
| | 222,625 |
TOTAL MATERIALS | | 7,439,368 |
TELECOMMUNICATION SERVICES - 5.4% |
Diversified Telecommunication Services - 3.7% |
Citizens Communications Co.: | | | | |
7.875% 1/15/27 (g) | | 200,000 | | 202,000 |
9% 8/15/31 | | 215,000 | | 232,200 |
Deutsche Telekom International Finance BV 4.5% 10/25/13 | EUR | 35,000 | | 45,606 |
Embarq Corp.: | | | | |
7.082% 6/1/16 | | 55,000 | | 55,991 |
7.995% 6/1/36 | | 668,000 | | 695,138 |
Eschelon Operating Co. 8.375% 3/15/10 | | 132,000 | | 127,545 |
Hanarotelecom, Inc. 7% 2/1/12 (g) | | 110,000 | | 110,275 |
Intelsat Ltd.: | | | | |
7.625% 4/15/12 | | 85,000 | | 78,625 |
9.25% 6/15/16 (g) | | 120,000 | | 128,100 |
11.25% 6/15/16 (g) | | 475,000 | | 523,688 |
Level 3 Financing, Inc.: | | | | |
11.8% 3/15/11 (h) | | 150,000 | | 158,625 |
12.25% 3/15/13 | | 490,000 | | 555,562 |
Mobifon Holdings BV 12.5% 7/31/10 | | 280,000 | | 308,350 |
Nordic Telephone Co. Holdings ApS 8.875% 5/1/16 (g) | | 285,000 | | 304,950 |
NTL Cable PLC: | | | | |
8.75% 4/15/14 | | 245,000 | | 256,025 |
9.125% 8/15/16 | | 175,000 | | 184,188 |
Ote PLC 4.625% 5/20/16 | EUR | 50,000 | | 64,657 |
PT Indosat International Finance Co. BV 7.125% 6/22/12 (g) | | 90,000 | | 90,450 |
Qwest Capital Funding, Inc.: | | | | |
7.625% 8/3/21 | | 25,000 | | 24,813 |
7.75% 2/15/31 | | 25,000 | | 24,594 |
Qwest Corp.: | | | | |
7.5% 10/1/14 | | 50,000 | | 53,250 |
7.875% 9/1/11 | | 320,000 | | 340,800 |
8.61% 6/15/13 (h) | | 350,000 | | 379,155 |
8.875% 3/15/12 | | 1,370,000 | | 1,525,838 |
Telecom Egypt SAE: | | | | |
9.672% 2/4/10 (h) | EGP | 196,300 | | 33,195 |
10.95% 2/4/10 | EGP | 196,300 | | 34,323 |
Telefonica de Argentina SA 9.125% 11/7/10 | | 115,000 | | 124,200 |
Telenet Group Holding NV 0% 6/15/14 (e)(g) | | 363,000 | | 330,330 |
Corporate Bonds - continued |
| Principal Amount (d) | | Value
(Note 1) |
Nonconvertible Bonds - continued |
TELECOMMUNICATION SERVICES - continued |
Diversified Telecommunication Services - continued |
U.S. West Capital Funding, Inc.: | | | | |
6.5% 11/15/18 | | $ 20,000 | | $ 18,700 |
6.875% 7/15/28 | | 120,000 | | 110,100 |
U.S. West Communications: | | | | |
6.875% 9/15/33 | | 870,000 | | 835,200 |
7.2% 11/10/26 | | 30,000 | | 29,775 |
7.25% 9/15/25 | | 35,000 | | 35,963 |
7.25% 10/15/35 | | 90,000 | | 89,550 |
7.5% 6/15/23 | | 25,000 | | 25,375 |
8.875% 6/1/31 | | 5,000 | | 5,263 |
Wind Acquisition Finance SA 10.75% 12/1/15 (g) | | 365,000 | | 418,838 |
Windstream Corp. 8.625% 8/1/16 (g) | | 105,000 | | 115,238 |
| | 8,676,475 |
Wireless Telecommunication Services - 1.7% |
American Tower Corp. 7.125% 10/15/12 | | 685,000 | | 702,125 |
Centennial Cellular Operating Co./Centennial Communications Corp. 10.125% 6/15/13 | | 440,000 | | 475,728 |
Centennial Communications Corp./Centennial Cellular Operating Co. LLC/Centennial Puerto Rico Operations Corp. 8.125% 2/1/14 | | 270,000 | | 275,400 |
Digicel Ltd. 9.25% 9/1/12 (g) | | 300,000 | | 319,500 |
Intelsat Subsidiary Holding Co. Ltd. 10.4844% 1/15/12 (h) | | 200,000 | | 201,750 |
Megafon SA 8% 12/10/09 | | 100,000 | | 104,000 |
MetroPCS Wireless, Inc. 9.25% 11/1/14 (g) | | 300,000 | | 311,250 |
Millicom International Cellular SA 10% 12/1/13 | | 480,000 | | 523,200 |
Mobile Telesystems Finance SA: | | | | |
8% 1/28/12 (g) | | 152,000 | | 159,600 |
8.375% 10/14/10 (g) | | 475,000 | | 501,125 |
Pakistan Mobile Communcations Ltd. 8.625% 11/13/13 (g) | | 100,000 | | 104,500 |
Telecom Personal SA 9.25% 12/22/10 (g) | | 320,000 | | 336,800 |
UbiquiTel Operating Co. 9.875% 3/1/11 | | 80,000 | | 86,250 |
| | 4,101,228 |
TOTAL TELECOMMUNICATION SERVICES | | 12,777,703 |
UTILITIES - 1.6% |
Electric Utilities - 0.6% |
Abu Dhabi National Energy Co. Pjsc 4.375% 10/28/13 | EUR | 50,000 | | 65,185 |
|
| Principal Amount (d) | | Value
(Note 1) |
AES Gener SA 7.5% 3/25/14 | | $ 200,000 | | $ 211,500 |
Chivor SA E.S.P. 9.75% 12/30/14 (g) | | 200,000 | | 227,750 |
Compania de Transporte de Energia Electrica en Alta Tension Transener SA 8.875% 12/15/16 (g) | | 80,000 | | 80,200 |
Edison Mission Energy: | | | | |
7.5% 6/15/13 | | 380,000 | | 396,625 |
7.75% 6/15/16 | | 190,000 | | 200,925 |
MSW Energy Holdings II LLC/MSW Finance Co. II, Inc. 7.375% 9/1/10 | | 120,000 | | 122,400 |
| | 1,304,585 |
Gas Utilities - 0.8% |
Dynegy Holdings, Inc. 8.375% 5/1/16 | | 285,000 | | 299,963 |
Southern Natural Gas Co.: | | | | |
7.35% 2/15/31 | | 190,000 | | 207,575 |
8% 3/1/32 | | 410,000 | | 475,600 |
8.875% 3/15/10 | | 230,000 | | 240,925 |
Transportadora de Gas del Sur SA: | | | | |
(Reg. S) 7.2% 12/15/10 (f) | | 444,254 | | 443,144 |
8% 12/15/13 (f) | | 150,000 | | 153,375 |
8% 12/15/13 (f)(g) | | 42,000 | | 42,945 |
8% 12/15/13 (f) | | 108,230 | | 108,771 |
| | 1,972,298 |
Independent Power Producers & Energy Traders - 0.1% |
Enron Corp. 7.625% 9/10/04 (c) | | 400,000 | | 134,000 |
Tenaska Alabama Partners LP 7% 6/30/21 (g) | | 96,112 | | 95,391 |
| | 229,391 |
Multi-Utilities - 0.1% |
Aquila, Inc. 14.875% 7/1/12 | | 120,000 | | 156,000 |
TECO Energy, Inc. 6.75% 5/1/15 | | 60,000 | | 63,000 |
Utilicorp United, Inc. 9.95% 2/1/11 (h) | | 3,000 | | 3,293 |
| | 222,293 |
TOTAL UTILITIES | | 3,728,567 |
TOTAL NONCONVERTIBLE BONDS | | 78,079,001 |
TOTAL CORPORATE BONDS (Cost $75,302,901) | 78,294,837 |
U.S. Government and Government Agency Obligations - 24.4% |
|
U.S. Government Agency Obligations - 11.4% |
Fannie Mae: | | | | |
3.25% 1/15/08 | | 3,800,000 | | 3,725,866 |
3.25% 2/15/09 | | 4,956,000 | | 4,781,826 |
4.25% 5/15/09 | | 650,000 | | 639,594 |
U.S. Government and Government Agency Obligations - continued |
| Principal Amount (d) | | Value
(Note 1) |
U.S. Government Agency Obligations - continued |
Fannie Mae: - continued | | | | |
4.625% 10/15/13 | | $ 3,500,000 | | $ 3,428,947 |
4.75% 12/15/10 | | 7,156,000 | | 7,110,223 |
4.875% 4/15/09 | | 2,563,000 | | 2,555,939 |
5% 9/15/08 | | 1,200,000 | | 1,198,666 |
5.25% 9/15/16 | | 200,000 | | 203,616 |
6.375% 6/15/09 | | 90,000 | | 92,854 |
Freddie Mac: | | | | |
4% 8/17/07 | | 58,000 | | 57,556 |
4.125% 10/18/10 | | 2,050,000 | | 1,993,668 |
5.25% 7/18/11 | | 655,000 | | 662,839 |
5.75% 3/15/09 | | 500,000 | | 507,698 |
TOTAL U.S. GOVERNMENT AGENCY OBLIGATIONS | | 26,959,292 |
U.S. Treasury Inflation Protected Obligations - 1.7% |
U.S. Treasury Inflation-Indexed Notes: | | | | |
1.875% 7/15/13 | | 407,707 | | 394,071 |
2% 1/15/14 | | 1,420,042 | | 1,380,157 |
2.375% 4/15/11 | | 2,287,958 | | 2,280,004 |
TOTAL U.S. TREASURY INFLATION PROTECTED OBLIGATIONS | | 4,054,232 |
U.S. Treasury Obligations - 11.3% |
U.S. Treasury Bonds: | | | | |
6.125% 8/15/29 | | 4,571,000 | | 5,342,356 |
6.25% 8/15/23 | | 1,200,000 | | 1,381,219 |
U.S. Treasury Notes: | | | | |
4.25% 11/15/13 | | 3,438,000 | | 3,347,216 |
4.25% 8/15/14 | | 1,650,000 | | 1,601,660 |
4.25% 11/15/14 | | 700,000 | | 679,055 |
4.25% 8/15/15 | | 1,000,000 | | 967,656 |
4.5% 11/15/15 | | 7,050,000 | | 6,941,493 |
4.75% 5/15/14 | | 599,000 | | 600,544 |
4.875% 4/30/08 | | 3,000,000 | | 2,997,186 |
5% 7/31/08 | | 2,750,000 | | 2,754,513 |
TOTAL U.S. TREASURY OBLIGATIONS | | 26,612,898 |
TOTAL U.S. GOVERNMENT AND GOVERNMENT AGENCY OBLIGATIONS (Cost $57,985,023) | 57,626,422 |
U.S. Government Agency - Mortgage Securities - 2.0% |
|
Fannie Mae - 1.5% |
3.907% 5/1/33 (h) | | 48,879 | | 48,440 |
4% 9/1/13 to 10/1/20 | | 219,421 | | 208,213 |
4.49% 11/1/33 (h) | | 15,045 | | 14,923 |
4.493% 5/1/33 (h) | | 12,185 | | 12,227 |
|
| Principal Amount (d) | | Value
(Note 1) |
4.786% 12/1/35 (h) | | $ 48,761 | | $ 48,571 |
4.787% 6/1/35 (h) | | 78,506 | | 77,721 |
4.876% 7/1/34 (h) | | 71,430 | | 71,019 |
4.892% 11/1/35 (h) | | 122,056 | | 121,752 |
4.893% 10/1/35 (h) | | 19,495 | | 19,461 |
5% 6/1/14 to 9/1/35 | | 122,451 | | 118,613 |
5.034% 5/1/35 (h) | | 146,203 | | 145,385 |
5.049% 12/1/32 (h) | | 111,646 | | 111,114 |
5.11% 7/1/34 (h) | | 27,062 | | 27,014 |
5.151% 7/1/35 (h) | | 176,228 | | 175,768 |
5.267% 11/1/36 (h) | | 24,946 | | 24,973 |
5.408% 7/1/35 (h) | | 32,776 | | 32,800 |
5.409% 2/1/36 (h) | | 20,835 | | 20,892 |
5.5% 11/1/17 to 4/1/20 | | 1,707,018 | | 1,709,456 |
5.541% 11/1/36 (h) | | 48,112 | | 48,257 |
5.84% 3/1/36 (h) | | 85,462 | | 86,223 |
5.849% 6/1/35 (h) | | 154,632 | | 156,078 |
5.881% 1/1/36 (h) | | 38,765 | | 38,984 |
6.5% 9/1/21 | | 214,998 | | 219,848 |
TOTAL FANNIE MAE | | 3,537,732 |
Freddie Mac - 0.5% |
4.5% 8/1/18 to 9/1/19 | | 123,328 | | 119,130 |
4.704% 9/1/35 (h) | | 236,490 | | 234,807 |
5% 7/1/18 to 9/1/18 | | 309,135 | | 305,392 |
5.021% 4/1/35 (h) | | 4,704 | | 4,644 |
5.5% 8/1/14 to 11/1/19 | | 68,962 | | 69,081 |
6% 10/1/16 to 4/1/17 | | 58,965 | | 59,862 |
6.5% 5/1/18 | | 292,455 | | 299,006 |
TOTAL FREDDIE MAC | | 1,091,922 |
Government National Mortgage Association - 0.0% |
3.75% 1/20/34 (h) | | 45,749 | | 45,452 |
TOTAL U.S. GOVERNMENT AGENCY - MORTGAGE SECURITIES (Cost $4,711,071) | 4,675,106 |
Collateralized Mortgage Obligations - 2.3% |
|
U.S. Government Agency - 2.3% |
Fannie Mae planned amortization class: | | | | |
Series 2002-83 Class ME, 5% 12/25/17 | | 450,000 | | 437,406 |
Series 2003-24 Class PB, 4.5% 12/25/12 | | 72,811 | | 72,414 |
Series 2006-64 Class PA, 5.5% 2/25/30 | | 336,035 | | 336,056 |
Fannie Mae Grantor Trust sequential payer Series 2005-93 Class HD, 4.5% 11/25/19 | | 16,115 | | 15,681 |
Collateralized Mortgage Obligations - continued |
| Principal Amount (d) | | Value
(Note 1) |
U.S. Government Agency - continued |
Fannie Mae guaranteed REMIC pass thru certificates: | | | | |
floater Series 2005-45 Class XA, 5.69% 6/25/35 (h) | | $ 738,599 | | $ 740,714 |
planned amortization class: | | | | |
Series 2003-70 Class BJ, 5% 7/25/33 | | 45,000 | | 42,277 |
Series 2006-4 Class PB, 6% 9/25/35 | | 315,000 | | 318,129 |
Series 2006-49 Class CA, 6% 2/25/31 | | 232,543 | | 234,265 |
sequential payer: | | | | |
Series 2003-18 Class EY, 5% 6/25/17 | | 212,168 | | 209,609 |
Series 2005-117, Class JN, 4.5% 1/25/36 | | 40,000 | | 35,146 |
Series 2005-47 Class AK, 5% 6/25/20 | | 370,000 | | 356,964 |
Freddie Mac Multi-class participation certificates guaranteed: | | | | |
floater Series 2630 Class FL, 5.85% 6/15/18 (h) | | 4,163 | | 4,215 |
planned amortization class: | | | | |
Series 2378 Class PE, 5.5% 11/15/16 | | 193,275 | | 193,702 |
Series 2622 Class PE, 4.5% 5/15/18 | | 475,000 | | 455,990 |
Series 2628 Class OP, 3.5% 11/15/13 | | 136,214 | | 134,340 |
Series 2760: | | | | |
Class EB, 4.5% 9/15/16 | | 300,000 | | 294,180 |
Class LB, 4.5% 1/15/33 | | 200,000 | | 192,202 |
Series 2773 Class EG, 4.5% 4/15/19 | | 100,000 | | 95,529 |
Series 2996 Class MK, 5.5% 6/15/35 | | 49,236 | | 49,238 |
Series 3013 Class AF, 5.6% 5/15/35 (h) | | 890,321 | | 892,168 |
sequential payer: | | | | |
Series 2570 Class CU, 4.5% 7/15/17 | | 21,452 | | 20,974 |
Series 2572 Class HK, 4% 2/15/17 | | 32,019 | | 31,057 |
Series 2773 Class TA, 4% 11/15/17 | | 172,127 | | 165,621 |
Series 2849 Class AL, 5% 5/15/18 | | 84,673 | | 83,527 |
Series 2937 Class HJ, 5% 10/15/19 | | 100,780 | | 99,615 |
TOTAL COLLATERALIZED MORTGAGE OBLIGATIONS (Cost $5,494,224) | 5,511,019 |
Foreign Government and Government Agency Obligations - 23.6% |
| Principal Amount (d) | | Value
(Note 1) |
Arab Republic 8.0203% to 9.4689% 2/27/07 to 3/20/07 | EGP | 510,000 | | $ 87,801 |
Argentine Republic: | | | | |
discount (with partial capitalization through 12/31/13) 8.28% 12/31/33 | | 164,788 | | 179,207 |
5.589% 8/3/12 (h) | | 903,750 | | 853,934 |
7% 3/28/11 | | 505,000 | | 499,459 |
7% 9/12/13 | | 615,000 | | 591,630 |
12.4375% 3/5/08 (h) | ARS | 497,000 | | 163,402 |
Brazilian Federative Republic: | | | | |
6% 9/15/13 | | 233,333 | | 235,130 |
8% 1/15/18 | | 145,000 | | 161,240 |
8.25% 1/20/34 | | 280,000 | | 339,640 |
8.75% 2/4/25 | | 255,000 | | 316,200 |
10.5% 7/14/14 | | 95,000 | | 120,983 |
11% 8/17/40 | | 1,250,000 | | 1,658,125 |
12.25% 3/6/30 | | 395,000 | | 655,700 |
12.5% 1/5/16 | BRL | 250,000 | | 132,811 |
12.75% 1/15/20 | | 235,000 | | 366,600 |
Canadian Government: | | | | |
4.5% 9/1/07 | CAD | 900,000 | | 773,467 |
5.25% 6/1/12 | CAD | 3,250,000 | | 2,954,267 |
5.5% 6/1/09 | CAD | 720,000 | | 638,799 |
5.75% 6/1/29 | CAD | 500,000 | | 526,690 |
Central Bank of Nigeria promissory note 5.092% 1/5/10 | | 102,900 | | 97,535 |
City of Kiev 8.75% 8/8/08 | | 100,000 | | 103,650 |
Colombian Republic: | | | | |
7.375% 9/18/37 | | 100,000 | | 107,350 |
11.75% 2/25/20 | | 90,000 | | 130,725 |
Dominican Republic: | | | | |
Brady 6.2725% 8/30/09 (h) | | 77,490 | | 77,335 |
6.1875% 8/30/24 (h) | | 750,000 | | 746,250 |
9.04% 1/23/18 (g) | | 92,903 | | 106,328 |
9.5% 9/27/11 | | 301,908 | | 324,249 |
Ecuador Republic: | | | | |
10% 8/15/30 (Reg. S) | | 590,000 | | 436,600 |
12% 11/15/12 (Reg. S) | | 128,520 | | 100,246 |
euro par 5% 2/28/25 | | 76,000 | | 55,480 |
Finnish Government 3.875% 9/15/17 | EUR | 3,100,000 | | 4,052,922 |
French Government: | | | | |
OAT 5.5% 4/25/29 | EUR | 60,000 | | 94,936 |
3.25% 4/25/16 | EUR | 2,610,000 | | 3,251,039 |
3.5% 7/12/11 | EUR | 4,400,000 | | 5,701,416 |
4% 4/25/55 | EUR | 100,000 | | 130,172 |
German Federal Republic 3.5% 9/12/08 | EUR | 200,000 | | 262,324 |
Greek Government 3.25% 6/21/07 | EUR | 1,500,000 | | 1,974,953 |
Indonesian Republic: | | | | |
6.75% 3/10/14 | | 165,000 | | 172,640 |
Foreign Government and Government Agency Obligations - continued |
| Principal Amount (d) | | Value
(Note 1) |
Indonesian Republic: - continued | | | | |
7.25% 4/20/15 (g) | | $ 80,000 | | $ 86,704 |
7.25% 4/20/15 | | 60,000 | | 65,028 |
Islamic Republic of Pakistan 7.125% 3/31/16 (g) | | 100,000 | | 105,250 |
Japan Government: | | | | |
0.4454% to 0.4554% 3/5/07 to 3/12/07 | JPY | 150,000,000 | | 1,259,095 |
1% 11/20/20 (h) | JPY | 50,000,000 | | 404,368 |
1.03% 7/20/20 (h) | JPY | 75,000,000 | | 591,810 |
1.4% 3/21/11 | JPY | 60,000,000 | | 509,337 |
1.5% 3/20/14 | JPY | 95,000,000 | | 799,540 |
1.8% 3/20/16 | JPY | 45,000,000 | | 383,587 |
2.4% 12/20/34 | JPY | 130,000,000 | | 1,117,203 |
Real Return Bond 1.1% 12/10/16 | JPY | 125,000,000 | | 1,043,154 |
Lebanon, Republic of: | | | | |
7.125% 3/5/10 | | 20,000 | | 19,100 |
7.875% 5/20/11 (Reg. S) | | 255,000 | | 249,900 |
8.6044% 11/30/09 (g)(h) | | 115,000 | | 113,413 |
8.6044% 11/30/09 (h) | | 435,000 | | 428,997 |
Pakistan International Sukuk Co. Ltd. 7.76% 1/27/10 (h) | | 200,000 | | 206,750 |
Peruvian Republic: | | | | |
6.25% 3/7/27 (h) | | 70,000 | | 68,600 |
7.35% 7/21/25 | | 100,000 | | 112,750 |
euro Brady past due interest 5% 3/7/17 (h) | | 467,400 | | 463,661 |
Philippine Republic: | | | | |
8.25% 1/15/14 | | 345,000 | | 388,988 |
8.375% 2/15/11 | | 155,000 | | 169,725 |
8.875% 3/17/15 | | 240,000 | | 284,112 |
9% 2/15/13 | | 350,000 | | 403,375 |
9.875% 1/15/19 | | 345,000 | | 450,225 |
10.625% 3/16/25 | | 225,000 | | 322,605 |
Republic of Serbia 3.75% 11/1/24 (f)(g) | | 50,000 | | 46,500 |
Russian Federation: | | | | |
5% 3/31/30 (Reg. S) (f) | | 1,755,000 | | 1,983,150 |
12.75% 6/24/28 (Reg. S) | | 285,000 | | 515,850 |
State of Qatar 9.75% 6/15/30 (Reg. S) | | 275,000 | | 408,788 |
Turkish Republic: | | | | |
0% 4/9/08 | TRY | 255,000 | | 141,566 |
6.875% 3/17/36 | | 90,000 | | 86,288 |
7% 9/26/16 | | 500,000 | | 510,000 |
7.375% 2/5/25 | | 105,000 | | 107,625 |
11% 1/14/13 | | 830,000 | | 1,020,900 |
11.75% 6/15/10 | | 420,000 | | 495,600 |
11.875% 1/15/30 | | 440,000 | | 679,250 |
Ukraine Cabinet of Ministers 6.58% 11/21/16 (g) | | 225,000 | | 224,793 |
|
| Principal Amount (d) | | Value
(Note 1) |
Ukraine Government: | | | | |
6.875% 3/4/11 (Reg. S) | | $ 100,000 | | $ 102,880 |
8.9025% 8/5/09 (h) | | 500,000 | | 529,500 |
United Kingdom, Great Britain & Northern Ireland: | | | | |
4.25% 3/7/11 | GBP | 600,000 | | 1,140,252 |
4.25% 6/7/32 | GBP | 50,000 | | 97,448 |
4.25% 3/7/36 | GBP | 330,000 | | 651,221 |
4.75% 9/7/15 | GBP | 590,000 | | 1,152,459 |
5% 3/7/08 | GBP | 260,000 | | 508,169 |
5% 9/7/14 | GBP | 331,000 | | 654,867 |
5% 3/7/25 | GBP | 250,000 | | 520,078 |
8% 6/7/21 | GBP | 265,000 | | 699,888 |
United Mexican States: | | | | |
7.5% 4/8/33 | | 390,000 | | 459,225 |
8.3% 8/15/31 | | 625,000 | | 799,063 |
9% 12/20/12 | MXN | 1,325,000 | | 132,445 |
11.5% 5/15/26 | | 125,000 | | 202,188 |
Uruguay Republic: | | | | |
5% 9/14/18 | UYU | 1,978,216 | | 89,175 |
7.625% 3/21/36 | | 100,000 | | 110,000 |
8% 11/18/22 | | 303,878 | | 344,902 |
Venezuelan Republic: | | | | |
5.75% 2/26/16 | | 260,000 | | 245,700 |
6% 12/9/20 | | 115,000 | | 107,238 |
6.3738% 4/20/11 (h) | | 305,000 | | 301,950 |
7% 12/1/18 (Reg. S) | | 80,000 | | 82,400 |
7.65% 4/21/25 | | 125,000 | | 136,375 |
9.25% 9/15/27 | | 205,000 | | 261,785 |
9.375% 1/13/34 | | 160,000 | | 212,160 |
10.75% 9/19/13 | | 270,000 | | 334,125 |
13.625% 8/15/18 | | 296,000 | | 453,620 |
Vietnamese Socialist Republic Brady par 3.75% 3/12/28 (f) | | 90,000 | | 77,625 |
TOTAL FOREIGN GOVERNMENT AND GOVERNMENT AGENCY OBLIGATIONS (Cost $53,282,736) | 55,855,560 |
Common Stocks - 0.2% |
| | Shares | | |
CONSUMER DISCRETIONARY - 0.2% |
Auto Components - 0.0% |
Intermet Corp. (a)(j) | | 6,092 | | 11,027 |
Diversified Consumer Services - 0.1% |
Coinmach Service Corp. unit | | 13,000 | | 239,200 |
Hotels, Restaurants & Leisure - 0.1% |
Centerplate, Inc. unit | | 10,000 | | 190,000 |
TOTAL COMMON STOCKS (Cost $431,126) | | 440,227 |
Preferred Stocks - 0.0% |
| | Shares | | Value (Note 1) |
Convertible Preferred Stocks - 0.0% |
MATERIALS - 0.0% |
Chemicals - 0.0% |
Celanese Corp. 4.25% | | 300 | | $ 10,875 |
Nonconvertible Preferred Stocks - 0.0% |
CONSUMER DISCRETIONARY - 0.0% |
Media - 0.0% |
Spanish Broadcasting System, Inc. Class B, 10.75% | | 68 | | 75,480 |
TOTAL PREFERRED STOCKS (Cost $72,781) | | 86,355 |
Floating Rate Loans - 4.2% |
| Principal Amount (d) | | |
CONSUMER DISCRETIONARY - 1.6% |
Auto Components - 0.2% |
Dana Corp. term loan 7.55% 4/13/08 (h) | | $ 30,000 | | 30,000 |
Lear Corp. term loan 7.8656% 4/25/12 (h) | | 129,610 | | 129,772 |
The Goodyear Tire & Rubber Co.: | | | | |
Tranche 2, term loan 8.14% 4/30/10 (h) | | 105,000 | | 106,575 |
Tranche 3, term loan 8.89% 3/1/11 (h) | | 190,000 | | 192,850 |
| | 459,197 |
Automobiles - 0.7% |
AM General LLC: | | | | |
LOC 8.35% 9/30/12 (h) | | 6,774 | | 6,825 |
term loan B 8.3633% 9/30/13 (h) | | 203,226 | | 204,750 |
Ford Motor Co. term loan 8.36% 12/15/13 (h) | | 1,270,000 | | 1,271,588 |
General Motors Corp. term loan 7.745% 11/29/13 (h) | | 60,000 | | 60,150 |
| | 1,543,313 |
Media - 0.3% |
Charter Communications Operating LLC Tranche B, term loan 8.005% 4/28/13 (h) | | 306,000 | | 307,530 |
CSC Holdings, Inc. Tranche B, term loan 7.1228% 3/29/13 (h) | | 308,450 | | 308,257 |
Riverdeep Interactive Learning USA, Inc. term loan: | | | | |
8.1% 12/21/13 (h) | | 40,000 | | 40,150 |
11.0656% 12/21/07 (h) | | 110,000 | | 110,000 |
|
| Principal Amount (d) | | Value
(Note 1) |
UPC Broadband Holding BV: | | | | |
Tranche J2, term loan 7.64% 3/31/13 (h) | | $ 25,000 | | $ 25,031 |
Tranche K2, term loan 7.64% 12/31/13 (h) | | 25,000 | | 25,031 |
| | 815,999 |
Multiline Retail - 0.1% |
Neiman Marcus Group, Inc. term loan 7.6022% 4/6/13 (h) | | 113,924 | | 114,494 |
Specialty Retail - 0.2% |
Michaels Stores, Inc. Tranche B, term loan 8.375% 10/31/13 (h) | | 190,000 | | 187,437 |
Sally Holdings LLC Tranche B, term loan 7.87% 11/10/13 (h) | | 49,875 | | 50,000 |
Toys 'R' US, Inc. term loan 8.3494% 12/9/08 (h) | | 290,000 | | 291,813 |
| | 529,250 |
Textiles, Apparel & Luxury Goods - 0.1% |
Hanesbrands, Inc.: | | | | |
term loan 9.1875% 3/5/14 (h) | | 90,000 | | 92,588 |
term loan B1 7.681% 9/5/13 (h) | | 250,039 | | 252,852 |
| | 345,440 |
TOTAL CONSUMER DISCRETIONARY | | 3,807,693 |
CONSUMER STAPLES - 0.0% |
Beverages - 0.0% |
Constellation Brands, Inc. Tranche B, term loan 6.875% 6/5/13 (h) | | 66,667 | | 66,917 |
ENERGY - 0.3% |
Oil, Gas & Consumable Fuels - 0.3% |
Coffeyville Resources LLC: | | | | |
Credit-Linked Deposit 8.36% 12/21/13 (h) | | 27,568 | | 27,740 |
Tranche D, term loan 8.36% 12/21/13 (h) | | 142,432 | | 143,323 |
Helix Energy Solutions Group, Inc. term loan 7.4524% 7/1/13 (h) | | 79,799 | | 79,899 |
Sandridge Energy, Inc. term loan 10.1904% 11/21/07 (h) | | 280,000 | | 282,100 |
Targa Resources, Inc./Targa Resources Finance Corp.: | | | | |
Credit-Linked Deposit 7.4888% 10/31/12 (h) | | 29,032 | | 29,105 |
term loan: | | | | |
7.6% 10/31/07 (h) | | 80,000 | | 80,000 |
7.6237% 10/31/12 (h) | | 119,456 | | 119,754 |
| | 761,921 |
Floating Rate Loans - continued |
| Principal Amount (d) | | Value
(Note 1) |
FINANCIALS - 0.2% |
Diversified Financial Services - 0.1% |
The NASDAQ Stock Market, Inc.: | | | | |
Tranche B, term loan 7.1001% 4/18/12 (h) | | $ 175,274 | | $ 175,055 |
Tranche C, term loan 7.1004% 4/18/12 (h) | | 101,602 | | 101,475 |
| | 276,530 |
Real Estate Investment Trusts - 0.1% |
Capital Automotive (REIT) Tranche B, term loan 7.1% 12/16/10 (h) | | 167,447 | | 168,494 |
Newkirk Master LP Tranche B, term loan 7.0994% 8/11/08 (h) | | 14,592 | | 14,574 |
| | 183,068 |
TOTAL FINANCIALS | | 459,598 |
HEALTH CARE - 0.3% |
Health Care Providers & Services - 0.3% |
HCA, Inc. Tranche B, term loan 7.8638% 11/17/13 (h) | | 750,000 | | 759,375 |
INDUSTRIALS - 0.3% |
Aerospace & Defense - 0.0% |
Wesco Aircraft Hardware Corp.: | | | | |
Tranche 1LN, term loan 7.6% 9/29/13 (h) | | 20,000 | | 20,150 |
Tranche 2LN, term loan 11.125% 3/28/14 (h) | | 10,000 | | 10,250 |
| | 30,400 |
Airlines - 0.2% |
Delta Air Lines, Inc.: | | | | |
Tranche B, term loan 10.1181% 3/16/08 (h) | | 20,000 | | 20,325 |
Tranche C, term loan 12.8681% 3/16/08 (h) | | 205,000 | | 210,638 |
UAL Corp.: | | | | |
Tranche B, term loan 9.12% 2/1/12 (h) | | 165,419 | | 166,453 |
Tranche DD, term loan 9.125% 2/1/12 (h) | | 23,631 | | 23,779 |
| | 421,195 |
Building Products - 0.0% |
Mueller Group, Inc. term loan 7.373% 10/3/12 (h) | | 15,081 | | 15,156 |
Commercial Services & Supplies - 0.0% |
Allied Waste Industries, Inc.: | | | | |
term loan 7.1623% 1/15/12 (h) | | 64,279 | | 64,520 |
Tranche A, Credit-Linked Deposit 7.0725% 1/15/12 (h) | | 28,504 | | 28,611 |
| | 93,131 |
|
| Principal Amount (d) | | Value
(Note 1) |
Industrial Conglomerates - 0.0% |
Walter Industries, Inc. term loan 7.3305% 10/3/12 (h) | | $ 11,054 | | $ 11,054 |
Machinery - 0.0% |
Chart Industries, Inc. Tranche B, term loan 7.4323% 10/17/12 (h) | | 13,333 | | 13,383 |
Road & Rail - 0.1% |
Hertz Corp.: | | | | |
Credit-Linked Deposit 7.365% 12/21/12 (h) | | 7,778 | | 7,836 |
Tranche B, term loan 7.5054% 12/21/12 (h) | | 61,796 | | 62,259 |
Laidlaw International, Inc. Class B, term loan 7.11% 7/31/13 (h) | | 39,900 | | 40,100 |
| | 110,195 |
TOTAL INDUSTRIALS | | 694,514 |
INFORMATION TECHNOLOGY - 0.5% |
Electronic Equipment & Instruments - 0.0% |
Sanmina-SCI Corp. term loan 7.9375% 1/31/08 (h) | | 40,000 | | 40,050 |
IT Services - 0.3% |
Affiliated Computer Services, Inc. Tranche B2, term loan 7.3597% 3/20/13 (h) | | 189,050 | | 189,286 |
SunGard Data Systems, Inc. Tranche B, term loan 7.8753% 2/10/13 (h) | | 522,050 | | 527,923 |
| | 717,209 |
Semiconductors & Semiconductor Equipment - 0.2% |
Advanced Micro Devices, Inc. term loan 7.62% 12/31/13 (h) | | 221,623 | | 223,563 |
Freescale Semiconductor, Inc. term loan 7.3694% 12/1/13 (h) | | 270,000 | | 271,688 |
| | 495,251 |
TOTAL INFORMATION TECHNOLOGY | | 1,252,510 |
MATERIALS - 0.4% |
Chemicals - 0.1% |
Lyondell Chemical Co. term loan 7.1213% 8/13/13 (h) | | 249,375 | | 250,622 |
Momentive Performance Materials, Inc. Tranche B1, term loan 7.625% 12/4/13 (h) | | 60,000 | | 60,075 |
| | 310,697 |
Metals & Mining - 0.1% |
Aleris International, Inc. term loan 8.125% 12/19/13 (h) | | 150,000 | | 150,563 |
Floating Rate Loans - continued |
| Principal Amount (d) | | Value
(Note 1) |
MATERIALS - continued |
Paper & Forest Products - 0.2% |
Georgia-Pacific Corp. Tranche B1, term loan 7.3561% 12/23/12 (h) | | $ 564,300 | | $ 567,827 |
TOTAL MATERIALS | | 1,029,087 |
TELECOMMUNICATION SERVICES - 0.4% |
Diversified Telecommunication Services - 0.3% |
Wind Telecomunicazioni Spa: | | | | |
term loan 12.54% 12/21/11 (h) | | 180,000 | | 182,475 |
Tranche 2, term loan 11.62% 3/21/15 (h) | | 140,000 | | 145,600 |
Tranche B, term loan 8.1684% 9/21/13 (h) | | 70,000 | | 70,350 |
Tranche C, term loan 8.6684% 9/21/14 (h) | | 70,000 | | 70,350 |
Windstream Corp. Class B, term loan 7.12% 7/17/13 (h) | | 230,000 | | 231,438 |
| | 700,213 |
Wireless Telecommunication Services - 0.1% |
Leap Wireless International, Inc. Tranche B, term loan 8.1138% 6/16/13 (h) | | 39,800 | | 40,148 |
MetroPCS Wireless, Inc. Tranche B, term loan 7.875% 11/3/13 (h) | | 79,800 | | 80,199 |
| | 120,347 |
TOTAL TELECOMMUNICATION SERVICES | | 820,560 |
UTILITIES - 0.2% |
Independent Power Producers & Energy Traders - 0.2% |
Boston Generating LLC: | | | | |
Credit-Linked Deposit 7.6156% 12/21/13 (h) | | 12,069 | | 12,114 |
Tranche 1LN, revolver loan 7.6156% 12/21/13 (h) | | 3,379 | | 3,392 |
Tranche 2LN, term loan 9.6% 6/20/14 (h) | | 20,000 | | 20,450 |
Tranche B 1LN, term loan 7.6% 12/21/13 (h) | | 54,552 | | 54,756 |
NRG Energy, Inc.: | | | | |
Credit-Linked Deposit 7.3637% 2/1/13 (h) | | 115,276 | | 115,996 |
term loan 7.3638% 2/1/13 (h) | | 136,252 | | 137,103 |
| | 343,811 |
TOTAL FLOATING RATE LOANS (Cost $9,925,964) | 9,995,986 |
Sovereign Loan Participations - 0.1% |
| Principal Amount (d) | | Value
(Note 1) |
Indonesian Republic loan participation: | | | | |
- Citibank 6.25% 3/28/13 (h) | | $ 42,955 | | $ 42,418 |
- Credit Suisse First Boston 6.25% 3/28/13 (h) | | 170,818 | | 168,682 |
- Deutsche Bank 1.407% 3/28/13 (h) | JPY | 2,397,075 | | 18,927 |
TOTAL SOVEREIGN LOAN PARTICIPATIONS (Cost $213,956) | 230,027 |
Commercial Paper - 0.1% |
|
GPB Finance Public Ltd. 4.4% 6/5/07
(Cost $129,020) | EUR | 100,000 | | 129,593 |
Fixed-Income Funds - 2.9% |
| Shares | | |
Fidelity Floating Rate Central Fund (i)
(Cost $6,906,044) | 68,866 | | 6,927,920 |
Money Market Funds - 6.4% |
| | | |
Fidelity Cash Central Fund, 5.37% (b)
(Cost $15,166,773) | 15,166,773 | | 15,166,773 |
Cash Equivalents - 0.0% |
| Maturity Amount | | |
Investments in repurchase agreements in a joint trading account at 4.8%, dated 12/29/06 due 1/2/07 (Collateralized by U.S. Treasury Obligations) #
(Cost $43,000) | $ 43,023 | | 43,000 |
TOTAL INVESTMENT PORTFOLIO - 99.3% (Cost $229,664,619) | | 234,982,825 |
NET OTHER ASSETS - 0.7% | | 1,573,788 |
NET ASSETS - 100% | $ 236,556,613 |
Currency Abbreviations |
ARS | - | Argentine peso |
BRL | - | Brazilian real |
CAD | - | Canadian dollar |
EGP | - | Egyptian pound |
EUR | - | European Monetary Unit |
GBP | - | British pound |
JPY | - | Japanese yen |
MXN | - | Mexican peso |
PEN | - | Peruvian new sol |
RUB | - | Russian ruble |
TRY | - | New Turkish Lira |
UYU | - | Uruguay peso |
Legend |
(a) Non-income producing |
(b) Affiliated fund that is available only to investment companies and other accounts managed by Fidelity Investments. The rate quoted is the annualized seven-day yield of the fund at period end. A complete unaudited listing of the fund's holdings as of its most recent quarter end is available upon request. |
(c) Non-income producing - Issuer is in default. |
(d) Principal amount is stated in United States dollars unless otherwise noted. |
(e) Security initially issued in zero coupon form which converts to coupon form at a specified rate and date. The rate shown is the rate at period end. |
(f) Security initially issued at one coupon which converts to a higher coupon at a specified date. The rate shown is the rate at period end. |
(g) Security exempt from registration under Rule 144A of the Securities Act of 1933. These securities may be resold in transactions exempt from registration, normally to qualified institutional buyers. At the end of the period, the value of these securities amounted to $19,242,742 or 8.1% of net assets. |
(h) The coupon rate shown on floating or adjustable rate securities represents the rate at period end. |
(i) Affiliated fund that is available only to investment companies and other accounts managed by Fidelity Investments. A complete unaudited list of holdings for each Fidelity Central Fund, as of the Investing Fund's report date, is available upon request or at advisor.fidelity.com. The reports are located just after the Investing Fund's financial statements and quarterly reports but are not part of the financial statements or quarterly reports. In addition, each Fidelity Central Fund's financial statements, which are not covered by the investing fund's Report of Independent Registered Public Accounting Firm, are available on the EDGAR Database on the SEC's web site, www.sec.gov, or upon request. |
(j) Restricted securities - Investment in securities not registered under the Securities Act of 1933 (excluding 144A issues). At the end of the period, the value of restricted securities (excluding 144A issues) amounted to $11,027 or 0.0% of net assets. |
Additional information on each holding is as follows: |
Security | Acquisition Date | Acquisition Cost |
Intermet Corp. | 1/7/05 - 1/13/05 | $ 115,372 |
# Additional Information on each counterparty to the repurchase agreement is as follows: |
Repurchase Agreement / Counterparty | Value |
$43,000 due 1/02/07 at 4.8% |
BNP Paribas Securities Corp. | $ 40,916 |
Morgan Stanley & Co., Inc. | 2,084 |
| $ 43,000 |
Affiliated Central Funds |
Information regarding fiscal year to date income earned by the Fund from investments in Fidelity Central Funds is as follows: |
Fund | Income earned |
Fidelity Cash Central Fund | $ 669,443 |
Fidelity Floating Rate Central Fund | 380,367 |
Total | $ 1,049,810 |
|
Additional information regarding the Fund's fiscal year to date purchases and sales, including the ownership percentage, of the non Money Market Central Funds is as follows: |
Fund | Value,
beginning of
period | Purchases | Sales
Proceeds | Value,
end of
period | % ownership, end of
period |
Fidelity Floating Rate Central Fund | $ 8,278,993 | $ 2,618,281 | $ 4,001,195 | $ 6,927,920 | 0.4% |
Other Information |
Distribution of investments by country of issue, as a percentage of total net assets, is as follows: |
United States of America | 67.9% |
France | 3.9% |
Canada | 3.0% |
United Kingdom | 2.6% |
Japan | 2.6% |
Brazil | 2.4% |
Argentina | 1.9% |
Finland | 1.7% |
Turkey | 1.3% |
Luxembourg | 1.2% |
Russia | 1.1% |
Mexico | 1.1% |
Venezuela | 1.0% |
Philippines | 1.0% |
Others (individually less than 1%) | 7.3% |
| 100.0% |
See accompanying notes which are an integral part of the financial statements.
VIP Strategic Income Portfolio
VIP Strategic Income Portfolio
Financial Statements
Statement of Assets and Liabilities
| December 31, 2006 |
| | |
Assets | | |
Investment in securities, at value (including repurchase agreements of $43,000) - See accompanying schedule: Unaffiliated issuers (cost $207,591,802) | $ 212,888,132 | |
Fidelity Central Funds (cost $22,072,817) | 22,094,693 | |
Total Investments (cost $229,664,619) | | $ 234,982,825 |
Cash | | 262,623 |
Foreign currency held at value (cost $10,834) | | 10,831 |
Receivable for investments sold | | 577,994 |
Dividends receivable | | 46,129 |
Interest receivable | | 3,240,273 |
Prepaid expenses | | 992 |
Other receivables | | 549 |
Total assets | | 239,122,216 |
| | |
Liabilities | | |
Payable for investments purchased | $ 2,362,243 | |
Payable for fund shares redeemed | 1,648 | |
Accrued management fee | 112,109 | |
Distribution fees payable | 1,224 | |
Other affiliated payables | 28,115 | |
Other payables and accrued expenses | 60,264 | |
Total liabilities | | 2,565,603 |
| | |
Net Assets | | $ 236,556,613 |
Net Assets consist of: | | |
Paid in capital | | $ 230,490,799 |
Undistributed net investment income | | 434,688 |
Accumulated undistributed net realized gain (loss) on investments and foreign currency transactions | | 304,653 |
Net unrealized appreciation (depreciation) on investments and assets and liabilities in foreign currencies | | 5,326,473 |
Net Assets | | $ 236,556,613 |
Statement of Assets and Liabilities - continued
| December 31, 2006 |
| | |
Initial Class:
Net Asset Value, offering price and redemption price per share ($123,870,047 ÷ 11,578,989 shares) | | $ 10.70 |
| | |
Service Class:
Net Asset Value, offering price and redemption price per share ($4,211,424 ÷ 394,443 shares) | | $ 10.68 |
| | |
Service Class 2:
Net Asset Value, offering price and redemption price per share ($4,191,899 ÷ 392,788 shares) | | $ 10.67 |
| | |
Investor Class:
Net Asset Value, offering price and redemption price per share ($104,283,243 ÷ 9,758,307 shares) | | $ 10.69 |
See accompanying notes which are an integral part of the financial statements.
Annual Report
VIP Strategic Income Portfolio
Financial Statements - continued
Statement of Operations
| Year ended December 31, 2006 |
| | |
Investment Income | | |
Dividends | | $ 45,333 |
Interest | | 11,033,766 |
Income from Fidelity Central Funds | | 1,049,810 |
Total income | | 12,128,909 |
| | |
Expenses | | |
Management fee | $ 1,124,276 | |
Transfer agent fees | 183,914 | |
Distribution fees | 14,062 | |
Accounting fees and expenses | 86,808 | |
Custodian fees and expenses | 51,785 | |
Independent trustees' compensation | 710 | |
Audit | 51,832 | |
Legal | 3,306 | |
Miscellaneous | 12,889 | |
Total expenses before reductions | 1,529,582 | |
Expense reductions | (2,377) | 1,527,205 |
Net investment income | | 10,601,704 |
Realized and Unrealized Gain (Loss) Net realized gain (loss) on: | | |
Investment securities: | | |
Unaffiliated issuers | 876,306 | |
Fidelity Central Funds | 3,514 | |
Foreign currency transactions | 1,236 | |
Total net realized gain (loss) | | 881,056 |
Change in net unrealized appreciation (depreciation) on: Investment securities | 3,781,398 | |
Assets and liabilities in foreign currencies | 11,187 | |
Total change in net unrealized appreciation (depreciation) | | 3,792,585 |
Net gain (loss) | | 4,673,641 |
Net increase (decrease) in net assets resulting from operations | | $ 15,275,345 |
Statement of Changes in Net Assets
| Year ended
December 31,
2006 | Year ended
December 31,
2005 |
Increase (Decrease) in Net Assets | | |
Operations | | |
Net investment income | $ 10,601,704 | $ 7,309,222 |
Net realized gain (loss) | 881,056 | (180,263) |
Change in net unrealized appreciation (depreciation) | 3,792,585 | (2,767,365) |
Net increase (decrease) in net assets resulting from operations | 15,275,345 | 4,361,594 |
Distributions to shareholders from net investment income | (10,266,586) | (6,828,359) |
Distributions to shareholders from net realized gain | (522,209) | (1,052,214) |
Total distributions | (10,788,795) | (7,880,573) |
Share transactions - net increase (decrease) | 66,412,828 | 67,438,055 |
Total increase (decrease) in net assets | 70,899,378 | 63,919,076 |
| | |
Net Assets | | |
Beginning of period | 165,657,235 | 101,738,159 |
End of period (including undistributed net investment income of $434,688 and undistributed net investment income
of $120,192, respectively) | $ 236,556,613 | $ 165,657,235 |
See accompanying notes which are an integral part of the financial statements.
VIP Strategic Income Portfolio
Financial Highlights - Initial Class
Years ended December 31, | 2006 | 2005 | 2004 | 2003 H |
Selected Per-Share Data | | | | |
Net asset value, beginning of period | $ 10.40 | $ 10.61 | $ 10.00 | $ 10.00 |
Income from Investment Operations | | | | |
Net investment income E | .579 | .552 | .510 | .003 |
Net realized and unrealized gain (loss) | .239 | (.226) | .355 | (.003) |
Total from investment operations | .818 | .326 | .865 | - |
Distributions from net investment income | (.493) | (.451) | (.245) | - |
Distributions from net realized gain | (.025) | (.085) | (.010) | - |
Total distributions | (.518) | (.536) | (.255) | - |
Net asset value, end of period | $ 10.70 | $ 10.40 | $ 10.61 | $ 10.00 |
Total Return B, C, D | 7.87% | 3.10% | 8.66% | .00% |
Ratios to Average Net Assets F, I | | | | |
Expenses before reductions | .74% | .75% | .85% | 10.00% A |
Expenses net of fee waivers, if any | .74% | .75% | .85% | 1.00% A |
Expenses net of all reductions | .74% | .75% | .84% | 1.00% A |
Net investment income | 5.40% | 5.19% | 5.02% | 1.36% A |
Supplemental Data | | | | |
Net assets, end of period (000 omitted) | $ 123,870 | $ 135,352 | $ 94,154 | $ 3,001 |
Portfolio turnover rate G | 83% | 100% | 78% | 0% |
A Annualized
B Total returns for periods of less than one year are not annualized.
C Total returns do not reflect charges attributable to your insurance company's separate account. Inclusion of these charges would reduce the total returns shown.
D Total returns would have been lower had certain expenses not been reduced during the periods shown.
E Calculated based on average shares outstanding during the period.
F Fees and expenses of the underlying Fidelity Central Funds are not included in the Fund's expense ratio. The Fund indirectly bears its proportionate share of the expenses of any underlying Fidelity Central Funds.
G Amount does not include the portfolio activity of any underlying Fidelity Central Funds.
H For the period December 23, 2003 (commencement of operations) to December 31, 2003.
I Expense ratios reflect operating expenses of the class. Expenses before reductions do not reflect amounts reimbursed by the investment adviser or reductions from brokerage service arrangements or other expense offset arrangements and do not represent the amount paid by the class during periods when reimbursements or reductions occur. Expense ratios before reductions for start-up periods may not be representative of longer-term operating periods. Expenses net of fee waivers reflect expenses after reimbursement by the investment adviser but prior to reductions from brokerage service arrangements or other expense offset arrangements. Expenses net of all reductions represent the net expenses paid by the class.
Financial Highlights - Service Class
Years ended December 31, | 2006 | 2005 | 2004 | 2003 H |
Selected Per-Share Data | | | | |
Net asset value, beginning of period | $ 10.38 | $ 10.59 | $ 10.00 | $ 10.00 |
Income from Investment Operations | | | | |
Net investment income E | .567 | .541 | .485 | .003 |
Net realized and unrealized gain (loss) | .241 | (.225) | .355 | (.003) |
Total from investment operations | .808 | .316 | .840 | - |
Distributions from net investment income | (.483) | (.441) | (.240) | - |
Distributions from net realized gain | (.025) | (.085) | (.010) | - |
Total distributions | (.508) | (.526) | (.250) | - |
Net asset value, end of period | $ 10.68 | $ 10.38 | $ 10.59 | $ 10.00 |
Total Return B, C, D | 7.78% | 3.01% | 8.41% | .00% |
Ratios to Average Net Assets F, I | | | | |
Expenses before reductions | .84% | .85% | 1.15% | 10.10% A |
Expenses net of fee waivers, if any | .84% | .85% | 1.10% | 1.10% A |
Expenses net of all reductions | .84% | .85% | 1.10% | 1.10% A |
Net investment income | 5.30% | 5.09% | 4.77% | 1.26% A |
Supplemental Data | | | | |
Net assets, end of period (000 omitted) | $ 4,211 | $ 3,907 | $ 3,795 | $ 3,501 |
Portfolio turnover rate G | 83% | 100% | 78% | 0% |
A Annualized
B Total returns for periods of less than one year are not annualized.
C Total returns do not reflect charges attributable to your insurance company's separate account. Inclusion of these charges would reduce the total returns shown.
D Total returns would have been lower had certain expenses not been reduced during the periods shown.
E Calculated based on average shares outstanding during the period.
F Fees and expenses of the underlying Fidelity Central Funds are not included in the Fund's expense ratio. The Fund indirectly bears its proportionate share of the expenses of any underlying Fidelity Central Funds.
G Amount does not include the portfolio activity of any underlying Fidelity Central Funds.
H For the period December 23, 2003 (commencement of operations) to December 31, 2003.
I Expense ratios reflect operating expenses of the class. Expenses before reductions do not reflect amounts reimbursed by the investment adviser or reductions from brokerage service arrangements or other expense offset arrangements and do not represent the amount paid by the class during periods when reimbursements or reductions occur. Expense ratios before reductions for start-up periods may not be representative of longer-term operating periods. Expenses net of fee waivers reflect expenses after reimbursement by the investment adviser but prior to reductions from brokerage service arrangements or other expense offset arrangements. Expenses net of all reductions represent the net expenses paid by the class.
See accompanying notes which are an integral part of the financial statements.
Annual Report
Financial Highlights - Service Class 2
Years ended December 31, | 2006 | 2005 | 2004 | 2003 H |
Selected Per-Share Data | | | | |
Net asset value, beginning of period | $ 10.38 | $ 10.59 | $ 10.00 | $ 10.00 |
Income from Investment Operations | | | | |
Net investment income E | .551 | .524 | .469 | .003 |
Net realized and unrealized gain (loss) | .232 | (.224) | .356 | (.003) |
Total from investment operations | .783 | .300 | .825 | - |
Distributions from net investment income | (.468) | (.425) | (.225) | - |
Distributions from net realized gain | (.025) | (.085) | (.010) | - |
Total distributions | (.493) | (.510) | (.235) | - |
Net asset value, end of period | $ 10.67 | $ 10.38 | $ 10.59 | $ 10.00 |
Total Return B, C, D | 7.54% | 2.86% | 8.26% | .00% |
Ratios to Average Net Assets F, I | | | | |
Expenses before reductions | .99% | 1.00% | 1.30% | 10.25% A |
Expenses net of fee waivers, if any | .99% | 1.00% | 1.25% | 1.25% A |
Expenses net of all reductions | .99% | 1.00% | 1.25% | 1.25% A |
Net investment income | 5.15% | 4.94% | 4.62% | 1.11% A |
Supplemental Data | | | | |
Net assets, end of period (000 omitted) | $ 4,192 | $ 3,895 | $ 3,789 | $ 3,500 |
Portfolio turnover rate G | 83% | 100% | 78% | 0% |
A Annualized
B Total returns for periods of less than one year are not annualized.
C Total returns do not reflect charges attributable to your insurance company's separate account. Inclusion of these charges would reduce the total returns shown.
D Total returns would have been lower had certain expenses not been reduced during the periods shown.
E Calculated based on average shares outstanding during the period.
F Fees and expenses of the underlying Fidelity Central Funds are not included in the Fund's expense ratio. The Fund indirectly bears its proportionate share of the expenses of any underlying Fidelity Central Funds.
G Amount does not include the portfolio activity of any underlying Fidelity Central Funds.
H For the period December 23, 2003 (commencement of operations) to December 31, 2003.
I Expense ratios reflect operating expenses of the class. Expenses before reductions do not reflect amounts reimbursed by the investment adviser or reductions from brokerage service arrangements or other expense offset arrangements and do not represent the amount paid by the class during periods when reimbursements or reductions occur. Expense ratios before reductions for start-up periods may not be representative of longer-term operating periods. Expenses net of fee waivers reflect expenses after reimbursement by the investment adviser but prior to reductions from brokerage service arrangements or other expense offset arrangements. Expenses net of all reductions represent the net expenses paid by the class.
Financial Highlights - Investor Class
Years ended December 31, | 2006 | 2005 H |
Selected Per-Share Data | | |
Net asset value, beginning of period | $ 10.39 | $ 10.69 |
Income from Investment Operations | | |
Net investment income E | .570 | .235 |
Net realized and unrealized gain (loss) | .246 | (.065) |
Total from investment operations | .816 | .170 |
Distributions from net investment income | (.491) | (.450) |
Distributions from net realized gain | (.025) | (.020) |
Total distributions | (.516) | (.470) |
Net asset value, end of period | $ 10.69 | $ 10.39 |
Total Return B, C, D | 7.85% | 1.59% |
Ratios to Average Net Assets F, I | | |
Expenses before reductions | .82% | .86% A |
Expenses net of fee waivers, if any | .82% | .85% A |
Expenses net of all reductions | .82% | .85% A |
Net investment income | 5.32% | 5.09% A |
Supplemental Data | | |
Net assets, end of period (000 omitted) | $ 104,283 | $ 22,502 |
Portfolio turnover rate G | 83% | 100% |
A Annualized
B Total returns for periods of less than one year are not annualized.
C Total returns do not reflect charges attributable to your insurance company's separate account. Inclusion of these charges would reduce the total returns shown.
D Total returns would have been lower had certain expenses not been reduced during the periods shown.
E Calculated based on average shares outstanding during the period.
F Fees and expenses of the underlying Fidelity Central Funds are not included in the Fund's expense ratio. The Fund indirectly bears its proportionate share of the expenses of any underlying Fidelity Central Funds.
G Amount does not include the portfolio activity of any underlying Fidelity Central Funds.
H For the period July 21, 2005 (commencement of sale of shares) to December 31, 2005.
I Expense ratios reflect operating expenses of the class. Expenses before reductions do not reflect amounts reimbursed by the investment adviser or reductions from brokerage service arrangements or other expense offset arrangements and do not represent the amount paid by the class during periods when reimbursements or reductions occur. Expense ratios before reductions for start-up periods may not be representative of longer-term operating periods. Expenses net of fee waivers reflect expenses after reimbursement by the investment adviser but prior to reductions from brokerage service arrangements or other expense offset arrangements. Expenses net of all reductions represent the net expenses paid by the class.
See accompanying notes which are an integral part of the financial statements.
VIP Strategic Income Portfolio
Notes to Financial Statements
For the period ended December 31, 2006
1. Significant Accounting Policies.
VIP Strategic Income Portfolio (the Fund) is a non-diversified fund of Variable Insurance Products Fund IV (the trust) and is authorized to issue an unlimited number of shares. The trust is registered under the Investment Company Act of 1940, as amended (the 1940 Act), as an open-end management investment company organized as a Massachusetts business trust. Shares of the Fund may only be purchased by insurance companies for the purpose of funding variable annuity or variable life insurance contracts. The Fund offers the following classes of shares: Initial Class shares, Service Class shares, Service Class 2 shares, and Investor Class shares. All classes have equal rights and voting privileges, except for matters affecting a single class. Investment income, realized and unrealized capital gains and losses, the common expenses of the Fund, and certain fund-level expense reductions, if any, are allocated on a pro rata basis to each class based on the relative net assets of each class to the total net assets of the Fund. Each class differs with respect to transfer agent and distribution and service plan fees incurred. Certain expense reductions also differ by class.
The Fund may invest in Fidelity Central Funds which are open-end investment companies available to investment companies and other accounts managed by Fidelity Management & Research Company (FMR) and its affiliates. The financial statements have been prepared in conformity with accounting principles generally accepted in the United States of America, which require management to make certain estimates and assumptions at the date of the financial statements. The following summarizes the significant accounting policies of the Fund, which are also consistently followed by the Fidelity Central Funds:
Security Valuation. Investments are valued and net asset value per share is calculated (NAV calculation) as of the close of business of the New York Stock Exchange, normally 4:00 p.m. Eastern time. Wherever possible, the Fund uses independent pricing services approved by the Board of Trustees to value its investments.
Debt securities, including restricted securities, for which quotations are readily available, are valued by independent pricing services or by dealers who make markets in such securities. Pricing services consider yield or price of bonds of comparable quality, coupon, maturity and type as well as dealer supplied prices. Equity securities, including restricted securities, for which market quotations are readily available, are valued at the last reported sale price or official closing price as reported by an independent pricing service on the primary market or exchange on which they are traded. In the event there were no sales during the day or closing prices are not available, securities are valued at the last quoted bid price.
When current market prices or quotations are not readily available or do not accurately reflect fair value, valuations may be determined in accordance with procedures adopted by the Board of Trustees. The frequency of when fair value pricing is used is unpredictable. The value of securities used for NAV calculation under fair value pricing may differ from published prices for the same securities. Investments in open-end mutual funds, including the Fidelity Central Funds, are valued at their closing net asset value each business day. Short-term securities with remaining maturities of sixty days or less for which quotations are not readily available are valued at amortized cost, which approximates value.
Foreign Currency. The Fund uses foreign currency contracts to facilitate transactions in foreign-denominated securities. Losses from these transactions may arise from changes in the value of the foreign currency or if the counterparties do not perform under the contracts' terms.
Foreign-denominated assets, including investment securities, and liabilities are translated into U.S. dollars at the exchange rate at period end. Purchases and sales of investment securities, income and dividends received and expenses denominated in foreign currencies are translated into U.S. dollars at the exchange rate in effect on the transaction date.
The effects of exchange rate fluctuations on investments are included with the net realized and unrealized gain (loss) on investment securities. Other foreign currency transactions resulting in realized and unrealized gain (loss) are disclosed separately.
Investment Transactions and Income. Security transactions, including the Fund's investment activity in the Fidelity Central Funds, are accounted for as of trade date. Gains and losses on securities sold are determined on the basis of identified cost. Dividend income is recorded on the ex-dividend date, except for certain dividends from foreign securities where the ex-dividend date may have passed, which are recorded as soon as the Fund is informed of the ex-dividend date. Non-cash dividends included in dividend income, if any, are recorded at the fair market value of the securities received. Distributions received on securities that represent a return of capital or capital gain are recorded as a reduction of cost of investments and/or as a realized gain. The Fund estimates the components of distributions received that may be considered return of capital distributions or capital gain distributions. Interest income and income distributions from the Fidelity Central Funds is accrued as earned, with any income distributions receivable as of period end included in Interest Receivable on the Statement of Assets and Liabilities. Interest income includes coupon interest and amortization of premium and accretion of discount on debt securities. Inflation-indexed bonds are fixed-income securities whose principal value is periodically adjusted according to the rate of inflation. Interest is accrued based on the principal value which is adjusted for inflation. Any increase in the principal amount of an inflation-indexed bond is recorded as interest income, even though the principal is not received until maturity. Investment income is recorded net of foreign taxes withheld where recovery of such taxes is uncertain. Debt obligations may be placed on non-accrual status and related interest income may be reduced by ceasing current accruals and writing off interest receivables when the collection of all or a portion of interest has become doubtful based on consistently applied procedures. A debt obligation is removed from non-accrual status when the issuer resumes interest payments or when collectibility of interest is reasonably assured. The Fund earns certain fees in connection with its floating rate loan purchasing
Annual Report
Notes to Financial Statements - continued
1. Significant Accounting Policies - continued
Investment Transactions and Income - continued
activities. These fees are in addition to interest payments earned and may include amendment fees, consent fees and prepayment fees. These fees are recorded as Income in the accompanying financial statements.
Expenses. Most expenses of the trust can be directly attributed to a fund. Expenses which cannot be directly attributed are apportioned among each Fund in the trust. Expense estimates are accrued in the period to which they relate and adjustments are made when actual amounts are known.
Income Tax Information and Distributions to Shareholders. Each year, the Fund intends to qualify as a regulated investment company by distributing all of its taxable income and realized gains under Subchapter M of the Internal Revenue Code. As a result, no provision for income taxes is required in the accompanying financial statements. Foreign taxes are provided for based on the Fund's understanding of the tax rules and rates that exist in the foreign markets in which it invests.
Distributions are recorded on the ex-dividend date. Income dividends and capital gain distributions are declared separately for each class. Income and capital gain distributions are determined in accordance with income tax regulations, which may differ from generally accepted accounting principles.
Capital accounts within the financial statements are adjusted for permanent book-tax differences. These adjustments have no impact on net assets or the results of operations. Temporary book-tax differences will reverse in a subsequent period.
Book-tax differences are primarily due to foreign currency transactions, certain foreign taxes, defaulted bonds, market discount, partnerships (including allocations from Fidelity Central Funds), financing transactions and losses deferred due to wash sales and excise tax regulations.
The tax-basis components of distributable earnings and the federal tax cost as of period end were as follows:
Unrealized appreciation | $ 7,033,539 |
Unrealized depreciation | (1,327,026) |
Net unrealized appreciation (depreciation) | 5,706,513 |
Undistributed ordinary income | 81,768 |
Undistributed long-term capital gain | 277,533 |
| |
Cost for federal income tax purposes | $ 229,276,312 |
The tax character of distributions paid was as follows:
| December 31, 2006 | December 31, 2005 |
Ordinary Income | $ 10,475,470 | $ 7,576,726 |
Long-term Capital Gains | 313,325 | 303,847 |
Total | $ 10,788,795 | $ 7,880,573 |
New Accounting Pronouncements. In July 2006, Financial Accounting Standards Board Interpretation No. 48, Accounting for Uncertainty in Income Taxes - an interpretation of FASB Statement 109 (FIN 48), was issued and is effective on the last business day of the semiannual reporting period for fiscal years beginning after December 15, 2006. FIN 48 sets forth a threshold for financial statement recognition, measurement and disclosure of a tax position taken or expected to be taken on a tax return. Management is currently evaluating the impact, if any, the adoption of FIN 48 will have on the Fund's net assets, results of operations and financial statement disclosures.
In addition, in September 2006, Statement of Financial Accounting Standards No. 157, Fair Value Measurements (SFAS 157), was issued and is effective for fiscal years beginning after November 15, 2007. SFAS 157 defines fair value, establishes a framework for measuring fair value and expands disclosures about fair value measurements. Management is currently evaluating the impact the adoption of SFAS 157 will have on the Fund's financial statement disclosures.
2. Operating Policies.
Repurchase Agreements. FMR has received an Exemptive Order from the Securities and Exchange Commission (the SEC) which permits the Fund and other affiliated entities of FMR to transfer uninvested cash balances into joint trading accounts which are then invested in repurchase agreements. The Fund may also invest directly with institutions in repurchase agreements. Repurchase agreements are collateralized by government or non-government securities. Upon settlement date, collateral is held in segregated accounts with custodian banks and may be obtained in the event of a default of the counterparty. The Fund monitors, on a daily basis, the value of the collateral to ensure it is at least equal to the principal amount of the repurchase agreement (including accrued interest). In the event of a default by the counterparty, realization of the collateral proceeds could be delayed, during which time the value of the collateral may decline.
VIP Strategic Income Portfolio
2. Operating Policies - continued
Restricted Securities. The Fund may invest in securities that are subject to legal or contractual restrictions on resale. These securities generally may be resold in transactions exempt from registration or to the public if the securities are registered. Disposal of these securities may involve time-consuming negotiations and expense, and prompt sale at an acceptable price may be difficult. Information regarding restricted securities is included at the end of the Fund's Schedule of Investments.
Loans and Other Direct Debt Instruments. The Fund may invest in loans and loan participations, trade claims or other receivables. These investments may include standby financing commitments, including revolving credit facilities, that obligate the Fund to supply additional cash to the borrower on demand. Loan participations involve a risk of insolvency of the lending bank or other financial intermediary. The Fund may be contractually obligated to receive approval from the agent bank and/or borrower prior to the sale of these investments.
Mortgage Dollar Rolls. To earn additional income, the Fund may employ trading strategies which involve the sale and simultaneous agreement to repurchase similar securities ("mortgage dollar rolls") or the purchase and simultaneous agreement to sell similar securities ("reverse mortgage dollar rolls"). The securities traded are mortgage securities and bear the same interest rate but may be collateralized by different pools of mortgages. During the period between the sale and repurchase in a mortgage dollar roll transaction, a fund will not be entitled to receive interest and principal payments on the securities sold but will invest the proceeds of the sale in other securities which may enhance the yield and total return. In addition, the difference between the sale price and the future purchase price is recorded as an adjustment to investment income. During the period between the purchase and subsequent sale in a reverse mortgage dollar roll transaction a fund is entitled to interest and principal payments on the securities purchased. The price differential between the purchase and sale is recorded as an adjustment to investment income. Losses may arise due to changes in the value of the securities or if the counterparty does not perform under the terms of the agreement. If the counterparty files for bankruptcy or becomes insolvent, a fund's right to repurchase or sell securities may be limited.
3. Purchases and Sales of Investments.
Purchases and sales of securities (including non Money Market Central Funds), other than short-term securities and U.S. government securities, aggregated $131,454,546 and $97,599,453, respectively.
4. Fees and Other Transactions with Affiliates.
Management Fee. FMR and its affiliates provide the Fund with investment management related services for which the Fund pays a monthly management fee. The management fee is the sum of an individual fund fee rate that is based on an annual rate of .45% of the Fund's average net assets and a group fee rate that averaged .12% during the period. The group fee rate is based upon the average net assets of all the mutual funds advised by FMR. The group fee rate decreases as assets under management increase and increases as assets under management decrease. For the period, the total annual management fee rate was .57% of the Fund's average net assets.
Distribution and Service Plan. In accordance with Rule 12b-1 of the 1940 Act, the Fund has adopted separate 12b-1 Plans for each Service Class of shares. Each Service Class pays Fidelity Distributors Corporation (FDC), an affiliate of FMR, a service fee. For the period, the service fee is based on an annual rate of .10% of Service Class' average net assets and .25% of Service Class 2's average net assets.
For the period, each class paid FDC the following amounts, all of which were re-allowed to insurance companies for the distribution of shares and providing shareholder support services:
Service Class | $ 4,028 |
Service Class 2 | 10,034 |
| $ 14,062 |
Transfer Agent Fees. Fidelity Investments Institutional Operations Company, Inc. (FIIOC), an affiliate of FMR, is the fund's transfer, dividend disbursing, and shareholder servicing agent. FIIOC receives an asset-based fee with respect to each class. Each class with the exception of Investor Class pays a transfer agent fee, excluding out of pocket expenses, equal to an annual rate of .07% of their month end net assets. Investor Class pays a monthly asset-based transfer agent fee of .14% of its month end net assets. The total transfer agent fees paid by each class to FIIOC, including out of pocket expenses, were as follows:
Initial Class | $ 87,668 |
Service Class | 2,671 |
Service Class 2 | 2,660 |
Investor Class | 90,915 |
| $ 183,914 |
Accounting Fees. Fidelity Service Company, Inc. (FSC), an affiliate of FMR, maintains the Fund's accounting records. The fee is based on the level of average net assets for the month.
Annual Report
Notes to Financial Statements - continued
4. Fees and Other Transactions with Affiliates - continued
Investments in Fidelity Central Funds. The Fund may invest in Fidelity Central Funds. The Fund's Schedule of Investments lists each of the Fidelity Central Funds as an investment of the Fund but does not include the underlying holdings of each Fidelity Central Fund. As an Investing Fund, the Fund indirectly bears its proportionate share of the expenses of the underlying Fidelity Central Funds. A complete unaudited list of holdings for each Fidelity Central Fund is available upon request or, for each non Money Market Central Fund, at advisor.fidelity.com. The reports are located just after the Fund's financial statements and quarterly reports but are not part of the financial statements or quarterly reports. In addition, the financial statements of the Fidelity Central Funds, which are not covered by the Fund's Report of Independent Registered Public Accounting Firm, are available on the EDGAR Database on the SEC's web site, www.sec.gov, or upon request.
Based on their investment objective, each Fidelity Central Fund may invest or participate in various investment vehicles or strategies that are similar to those of the Fund. These strategies are consistent with the investment objectives of the Fund and may involve certain economic risks which may cause a decline in value of each of the Fidelity Central Funds and thus a decline in the value of the Fund. The Money Market Central Funds seek preservation of capital and current income and are managed by Fidelity Investments Money Management, Inc. (FIMM), an affiliate of FMR. The following summarizes the Fund's investment in each Fidelity Fixed-Income Central Fund.
Central Fund | Investment Adviser | | Investment Objective | | Investment Practices |
Fidelity Floating Rate Central Fund | Fidelity Management and Research Company, Inc. (FMRC) | | Seeks a high level of income by normally investing in floating rate loans and other floating rate securities. | | Loans & Direct Debt Instruments Repurchase Agreements Restricted Securities |
5. Committed Line of Credit.
The Fund participates with other funds managed by FMR in a $4.2 billion credit facility (the "line of credit") to be utilized for temporary or emergency purposes to fund shareholder redemptions or for other short-term liquidity purposes. The Fund has agreed to pay commitment fees on its pro rata portion of the line of credit, which amounted to $498 and is reflected in Miscellaneous Expense on the Statement of Operations. During the period, there were no borrowings on this line of credit.
6. Expense Reductions.
Through arrangements with the fund's custodian, credits realized as a result of uninvested cash balances were used to reduce the Fund's expenses. During the period, these credits reduced the Fund's custody expenses by $1,808.
7. Credit Risk.
The Fund's relatively large investment in countries with limited or developing capital markets may involve greater risks than investments in more developed markets and the prices of such investments may be volatile. The yields of emerging market debt obligations reflect, among other things, perceived credit risk. The consequences of political, social or economic changes in these markets may have disruptive effects on the market prices of the Fund's investments and the income they generate, as well as the Fund's ability to repatriate such amounts.
8. Other.
The Fund's organizational documents provide former and current trustees and officers with a limited indemnification against liabilities arising in connection with the performance of their duties to the Fund. In the normal course of business, the Fund may also enter into contracts that provide general indemnifications. The Fund's maximum exposure under these arrangements is unknown as this would be dependent on future claims that may be made against the Fund. The risk of material loss from such claims is considered remote.
At the end of the period, FMR or its affiliates were the owners of record of 99% of the total outstanding shares of the Fund.
The United States Securities and Exchange Commission ("SEC") is conducting an investigation of FMR (covering the years 2002 to 2004) arising from gifts, gratuities and business entertainment provided by certain brokers to certain individuals who were employed on FMR's domestic equity trading desk during that period. FMR is in discussions with the SEC staff regarding the possible resolution of the matter, but as of period-end no final resolution has been reached.
In December 2006, the Independent Trustees completed their own investigation of the matter with the assistance of independent counsel. The Independent Trustees and FMR agree that, despite the absence of proof that the Fidelity mutual funds experienced diminished execution quality as a result of the improper receipt of gifts and business entertainment, the conduct at issue was serious and is worthy of redress. Accordingly, the Independent Trustees have requested and FMR has agreed to pay $42 million to Fidelity mutual funds, plus interest to be determined at the time that payment is made. A method of allocating this payment among the funds has not yet been determined. The total payment to the Fund is not anticipated to have a material impact on the Fund's net assets. In addition, FMR reimbursed related legal expenses which are recorded in the accompanying Statement of Operations as an expense reduction.
VIP Strategic Income Portfolio
9. Distributions to Shareholders.
Distributions to shareholders of each class were as follows:
Years ended December 31, | 2006 | 2005 A |
From net investment income | | |
Initial Class | $ 5,433,880 | $ 5,620,016 |
Service Class | 181,865 | 159,039 |
Service Class 2 | 175,714 | 153,056 |
Investor Class | 4,475,127 | 896,248 |
Total | $ 10,266,586 | $ 6,828,359 |
From net realized gain | | |
Initial Class | $ 275,552 | $ 951,419 |
Service Class | 9,413 | 30,502 |
Service Class 2 | 9,386 | 30,460 |
Investor Class | 227,858 | 39,833 |
Total | $ 522,209 | $ 1,052,214 |
A Distributions for Investor Class are for the period July 21, 2005 (commencement of sale of shares) to December 31, 2005.
10. Share Transactions.
Transactions for each class of shares were as follows:
| Shares | Dollars |
Years ended December 31, | 2006 | 2005 A | 2006 | 2005 A |
Initial Class | | | | |
Shares sold | 1,325,177 | 6,103,515 | $ 14,237,932 | $ 64,922,576 |
Reinvestment of distributions | 533,592 | 631,508 | 5,709,432 | 6,571,436 |
Shares redeemed | (3,298,485) | (2,589,246) | (35,422,894) | (27,644,411) |
Net increase (decrease) | (1,439,716) | 4,145,777 | $ (15,475,530) | $ 43,849,601 |
Service Class | | | | |
Reinvestment of distributions | 17,910 | 18,243 | $ 191,278 | $ 189,541 |
Net increase (decrease) | 17,910 | 18,243 | $ 191,278 | $ 189,541 |
Service Class 2 | | | | |
Reinvestment of distributions | 17,331 | 17,664 | $ 185,100 | $ 183,516 |
Net increase (decrease) | 17,331 | 17,664 | $ 185,100 | $ 183,516 |
Investor Class | | | | |
Shares sold | 7,406,250 | 2,103,938 | $ 79,510,385 | $ 22,592,967 |
Reinvestment of distributions | 439,942 | 90,181 | 4,702,985 | 936,082 |
Shares redeemed | (252,931) | (29,073) | (2,701,390) | (313,652) |
Net increase (decrease) | 7,593,261 | 2,165,046 | $ 81,511,980 | $ 23,215,397 |
A Share transactions for Investor Class are for the period July 21, 2005 (commencement of sale of shares) to December 31, 2005.
Annual Report
Report of Independent Registered Public Accounting Firm
To the Trustees of Variable Insurance Products Fund IV and the Shareholders of VIP Strategic Income Portfolio:
In our opinion, the accompanying statement of assets and liabilities, including the schedule of investments, and the related statements of operations and of changes in net assets and the financial highlights present fairly, in all material respects, the financial position of VIP Strategic Income Portfolio (a fund of Variable Insurance Products Fund IV) at December 31, 2006, the results of its operations for the year then ended, the changes in its net assets for each of the two years in the period then ended and the financial highlights for each of the periods indicated, in conformity with accounting principles generally accepted in the United States of America. These financial statements and financial highlights (hereafter referred to as "financial statements") are the responsibility of the VIP Strategic Income Portfolio's management; our responsibility is to express an opinion on these financial statements based on our audits. We conducted our audits of these financial statements in accordance with the standards of the Public Company Accounting Oversight Board (United States). Those standards require that we plan and perform the audit to obtain reasonable assurance about whether the financial statements are free of material misstatement. An audit includes examining, on a test basis, evidence supporting the amounts and disclosures in the financial statements, assessing the accounting principles used and significant estimates made by management, and evaluating the overall financial statement presentation. We believe that our audits, which included confirmation of securities at December 31, 2006 by correspondence with the custodian and brokers, provide a reasonable basis for our opinion.
/s/ PricewaterhouseCoopers LLP
PricewaterhouseCoopers LLP
Boston, Massachusetts
February 16, 2007
VIP Strategic Income Portfolio
Trustees and Officers
The Trustees, Member of the Advisory Board, and executive officers of the trust and funds, as applicable, are listed below. The Board of Trustees governs the fund and is responsible for protecting the interests of shareholders. The Trustees are experienced executives who meet periodically throughout the year to oversee the fund's activities, review contractual arrangements with companies that provide services to the fund, and review the fund's performance. Each of the Trustees oversees 348 funds advised by FMR or an affiliate.
The Trustees hold office without limit in time except that (a) any Trustee may resign; (b) any Trustee may be removed by written instrument, signed by at least two-thirds of the number of Trustees prior to such removal; (c) any Trustee who requests to be retired or who has become incapacitated by illness or injury may be retired by written instrument signed by a majority of the other Trustees; and (d) any Trustee may be removed at any special meeting of shareholders by a two-thirds vote of the outstanding voting securities of the trust. Each Trustee who is not an interested person (as defined in the 1940 Act) (Independent Trustee), shall retire not later than the last day of the calendar year in which his or her 72nd birthday occurs. The Independent Trustees may waive this mandatory retirement age policy with respect to individual Trustees. The executive officers and Advisory Board Member hold office without limit in time, except that any officer and Advisory Board Member may resign or may be removed by a vote of a majority of the Trustees at any regular meeting or any special meeting of the Trustees. Except as indicated, each individual has held the office shown or other offices in the same company for the past five years.
The fund's Statement of Additional Information (SAI) includes more information about the Trustees. To request a free copy, call Fidelity at 1-877-208-0098.
Interested Trustees*:
Correspondence intended for each Trustee who is an interested person may be sent to Fidelity Investments, 82 Devonshire Street, Boston, Massachusetts 02109.
Name, Age; Principal Occupation |
Edward C. Johnson 3d (76) |
| Year of Election or Appointment: 1983 Mr. Johnson is Chairman of the Board of Trustees. Mr. Johnson serves as President (2006-present), Chief Executive Officer, Chairman, and a Director of FMR Corp.; Chairman and a Director of FMR; Chairman and a Director of Fidelity Research & Analysis Company (FRAC); Chairman and a Director of Fidelity Investments Money Management, Inc.; and Chairman (2001- present) and a Director of FMR Co., Inc. In addition, Mr. Johnson serves as Chairman and Director of Fidelity International Limited (FIL). |
Robert L. Reynolds (54) |
| Year of Election or Appointment: 2003 Mr. Reynolds is President and a Director of FMR (2005-present), Fidelity Investments Money Management, Inc. (2005-present), and FMR Co., Inc. (2005-present). Mr. Reynolds also serves as Vice Chairman (2006-present), a Director (2003-present), and Chief Operating Officer of FMR Corp. and a Director of Strategic Advisers, Inc. (2005-present). He also serves on the Board at Fidelity Investments Canada, Ltd. |
* Trustees have been determined to be "Interested Trustees" by virtue of, among other things, their affiliation with the trust or various entities under common control with FMR.
Independent Trustees:
Correspondence intended for each Independent Trustee (that is, the Trustees other than the Interested Trustees) may be sent to Fidelity Investments, P.O. Box 55235, Boston, Massachusetts 02205-5235.
Name, Age; Principal Occupation |
Dennis J. Dirks (58) |
| Year of Election or Appointment: 2005 Prior to his retirement in May 2003, Mr. Dirks was Chief Operating Officer and a member of the Board of The Depository Trust & Clearing Corporation (DTCC) (1999-2003). He also served as President, Chief Operating Officer, and Board member of The Depository Trust Company (DTC) (1999-2003) and President and Board member of the National Securities Clearing Corporation (NSCC) (1999-2003). In addition, Mr. Dirks served as Chief Executive Officer and Board member of the Government Securities Clearing Corporation (2001-2003) and Chief Executive Officer and Board member of the Mortgage-Backed Securities Clearing Corporation (2001-2003). Mr. Dirks also serves as a Trustee and a member of the Finance Committee of Manhattan College (2005-present) and a Trustee and a member of the Finance Committee of AHRC of Nassau County (2006-present). |
Albert R. Gamper, Jr. (64) |
| Year of Election or Appointment: 2006 Prior to his retirement in December 2004, Mr. Gamper served as Chairman of the Board of CIT Group Inc. (commercial finance). During his tenure with CIT Group Inc. Mr. Gamper served in numerous senior management positions, including Chairman (1987-1989; 1999-2001; 2002-2004), Chief Executive Officer (1987-2004), and President (1989-2002). He currently serves as a member of the Board of Directors of Public Service Enterprise Group (utilities, 2001-present), Chairman of the Board of Governors, Rutgers University (2004-present), and Chairman of the Board of Saint Barnabas Health Care System. |
George H. Heilmeier (70) |
| Year of Election or Appointment: 2004 Dr. Heilmeier is Chairman Emeritus of Telcordia Technologies (communication software and systems), where prior to his retirement, he served as company Chairman and Chief Executive Officer. He currently serves on the Boards of Directors of The Mitre Corporation (systems engineering and information technology support for the government), and HRL Laboratories (private research and development, 2004-present). He is Chairman of the General Motors Science & Technology Advisory Board and a Life Fellow of the Institute of Electrical and Electronics Engineers (IEEE). Dr. Heilmeier is a member of the Defense Science Board and the National Security Agency Advisory Board. He is also a member of the National Academy of Engineering, the American Academy of Arts and Sciences, and the Board of Overseers of the School of Engineering and Applied Science of the University of Pennsylvania. Previously, Dr. Heilmeier served as a Director of TRW Inc. (automotive, space, defense, and information technology, 1992-2002), Compaq (1994-2002), Automatic Data Processing, Inc. (ADP) (technology-based business outsourcing, 1995-2002), INET Technologies Inc. (telecommunications network surveillance, 2001-2004), and Teletech Holdings (customer management services). He is the recipient of the 2005 Kyoto Prize in Advanced Technology for his invention of the liquid crystal display, and a member of the Consumer Electronics Hall of Fame. |
James H. Keyes (66) |
| Year of Election or Appointment: 2007 Prior to his retirement in 2003, Mr. Keyes was Chairman, President, and Chief Executive Officer of Johnson Controls, Inc. (automotive supplier, 1993-2003). He currently serves as a member of the boards of LSI Logic Corporation (semiconductor technologies), Navistar International Corporation (manufacture and sale of trucks, buses, and diesel engines, 2002-present), and Pitney Bowes, Inc. (integrated mail, messaging, and document management solutions). |
Marie L. Knowles (60) |
| Year of Election or Appointment: 2001 Prior to Ms. Knowles' retirement in June 2000, she served as Executive Vice President and Chief Financial Officer of Atlantic Richfield Company (ARCO) (diversified energy, 1996-2000). From 1993 to 1996, she was a Senior Vice President of ARCO and President of ARCO Transportation Company. She served as a Director of ARCO from 1996 to 1998. She currently serves as a Director of Phelps Dodge Corporation (copper mining and manufacturing) and McKesson Corporation (healthcare service, 2002-present). Ms. Knowles is a Trustee of the Brookings Institution and the Catalina Island Conservancy and also serves as a member of the Advisory Board for the School of Engineering of the University of Southern California. |
Ned C. Lautenbach (62) |
| Year of Election or Appointment: 2000 Mr. Lautenbach is Chairman of the Independent Trustees (2006-present). Mr. Lautenbach has been a partner of Clayton, Dubilier & Rice, Inc. (private equity investment firm) since September 1998. Previously, Mr. Lautenbach was with the International Business Machines Corporation (IBM) from 1968 until his retirement in 1998. Mr. Lautenbach serves as a Director of Sony Corporation (2006-present) and Eaton Corporation (diversified industrial) as well as the Philharmonic Center for the Arts in Naples, Florida. He also is a member of the Board of Trustees of Fairfield University (2005-present), as well as a member of the Council on Foreign Relations. |
Cornelia M. Small (62) |
| Year of Election or Appointment: 2005 Ms. Small is a member (2000-present) and Chairperson (2002-present) of the Investment Committee, and a member (2002- present) of the Board of Trustees of Smith College. Previously, she served as Chief Investment Officer (1999-2000), Director of Global Equity Investments (1996-1999), and a member of the Board of Directors of Scudder, Stevens & Clark (1990-1997) and Scudder Kemper Investments (1997-1999). In addition, Ms. Small served as Co-Chair (2000-2003) of the Annual Fund for the Fletcher School of Law and Diplomacy. |
William S. Stavropoulos (67) |
| Year of Election or Appointment: 2001 Mr. Stavropoulos is Chairman Emeritus of the Board of Directors of The Dow Chemical Company. Since joining The Dow Chemical Company in 1967, Mr. Stavropoulos served in numerous senior management positions, including President (1993-2000; 2002-2003), CEO (1995-2000; 2002-2004), and Chairman of the Executive Committee (2000-2004). Currently, he is a Director of NCR Corporation (data warehousing and technology solutions), BellSouth Corporation (telecommunications), Chemical Financial Corporation, Maersk Inc. (industrial conglomerate, 2002-present), and Metalmark Capital (private equity investment firm, 2005-present). He also serves as a member of the Board of Trustees of the American Enterprise Institute for Public Policy Research. In addition, Mr. Stavropoulos is a member of The Business Council, J.P. Morgan International Council and the University of Notre Dame Advisory Council for the College of Science. |
Kenneth L. Wolfe (67) |
| Year of Election or Appointment: 2005 Prior to his retirement in 2001, Mr. Wolfe was Chairman and Chief Executive Officer of Hershey Foods Corporation (1993-2001). He currently serves as a member of the boards of Adelphia Communications Corporation (2003-present), Bausch & Lomb, Inc., and Revlon Inc. (2004-present). |
Advisory Board Member and Executive Officers:
Correspondence intended for each executive officer and Mr. Lynch may be sent to Fidelity Investments, 82 Devonshire Street, Boston, Massachusetts 02109.
Name, Age; Principal Occupation |
Peter S. Lynch (62) |
| Year of Election or Appointment: 2003 Member of the Advisory Board of Variable Insurance Products Fund IV. Mr. Lynch is Vice Chairman and a Director of FMR, and Vice Chairman (2001-present) and a Director of FMR Co., Inc. Previously, Mr. Lynch served as a Trustee of the Fidelity funds (1990-2003). In addition, he serves as a Trustee of Boston College and as the Chairman of the Inner-City Scholarship Fund. |
Kimberley H. Monasterio (43) |
| Year of Election or Appointment: 2007 President and Treasurer of VIP Strategic Income. Ms. Monasterio also serves as President and Treasurer of other Fidelity funds (2007-present) and is an employee of FMR (2004-present). Previously, Ms. Monasterio served as Deputy Treasurer of the Fidelity funds (2004-2006). Before joining Fidelity Investments, Ms. Monasterio served as Treasurer (2000-2004) and Chief Financial Officer (2002-2004) of the Franklin Templeton Funds and Senior Vice President of Franklin Templeton Services, LLC (2000-2004). |
Walter C. Donovan (44) |
| Year of Election or Appointment: 2005 Vice President of VIP Strategic Income. Mr. Donovan also serves as Vice President of Fidelity's High Income Funds (2005-present). Mr. Donovan also serves as Executive Vice President of FMR (2005-present) and FMR Co., Inc. (2005-present). Previously, Mr. Donovan served as Vice President of Fidelity's Fixed-Income Funds (2005-2006), certain Asset Allocation Funds (2005-2006), certain Balanced Funds (2005-2006), and as Vice President and Director of Fidelity's International Equity Trading group (1998-2005). |
Boyce I. Greer (50) |
| Year of Election or Appointment: 2006 Vice President of VIP Strategic Income. Mr. Greer also serves as Vice President of certain Equity Funds (2005-present), certain Asset Allocation Funds (2005-present), Fixed-Income Funds (2006-present), and Money Market Funds (2006-present). Mr. Greer is also a Trustee of other investment companies advised by FMR (2003-present). He is an Executive Vice President of FMR (2005-present) and FMR Co., Inc. (2005-present), and Senior Vice President of Fidelity Investments Money Management, Inc. (2006-present). Previously, Mr. Greer served as a Director and Managing Director of Strategic Advisers, Inc. (2002-2005), and Executive Vice President (2000-2002) and Money Market Group Leader (1997-2002) of the Fidelity Investments Fixed Income Division. He also served as Vice President of Fidelity's Money Market Funds (1997-2002), Senior Vice President of FMR (1997-2002), and Vice President of FIMM (1998-2002).] |
Robert A. Lawrence (54) |
| Year of Election or Appointment: 2006 Vice President of VIP Strategic Income. Mr. Lawrence also serves as Vice President of the High Income Funds. Mr. Lawrence is Senior Vice President of FMR (2006-present) and FMR Co., Inc. (2006-present). Previously, Mr. Lawrence served as President of Fidelity Strategic Investments (2002-2005). |
David L. Murphy (58) |
| Year of Election or Appointment: 2005 Vice President of VIP Strategic Income. Mr. Murphy also serves as Vice President of Fidelity's Money Market Funds (2002-present), certain Asset Allocation Funds (2003-present), Fixed-Income Funds (2005-present), and Balanced Funds (2005-present). He serves as Senior Vice President (2000-present) and Head (2004-present) of the Fidelity Investments Fixed Income Division. Mr. Murphy is also a Senior Vice President of Fidelity Investments Money Management, Inc. (2003-present) and an Executive Vice President of FMR (2005-present). Previously, Mr. Murphy served as Money Market Group Leader (2002-2004), Bond Group Leader (2000-2002), and Vice President of Fidelity's Taxable Bond Funds (2000-2002) and Fidelity's Municipal Bond Funds (2001-2002). |
Thomas J. Silvia (45) |
| Year of Election or Appointment: 2005 Vice President of VIP Strategic Income. Mr. Silvia also serves as Vice President of Fidelity's Fixed-Income Funds (2005-present), certain Balanced Funds (2005-present), certain Asset Allocation Funds (2005-present), and Senior Vice President and Bond Group Leader of the Fidelity Investments Fixed-Income Division (2005-present). Previously, Mr. Silvia served as Director of Fidelity's Taxable Bond portfolio managers (2002-2004) and a portfolio manager in the Bond Group (1997-2004). |
Christopher L. Sharpe (38) |
| Year of Election or Appointment: 2005 Vice President and lead co-manager of VIP Strategic Income. Mr. Sharpe also serves as Vice President of other funds advised by FMR. Prior to assuming his current responsibilities, Mr. Sharpe worked as an associate investment policy officer for John Hancock Financial Services, Inc. in Boston. From 1990 to 2000 he was with William M. Mercer, Inc. in Boston. Mr. Sharpe also serves as Vice President of FMR (2006) and FMR Co., Inc. (2006). |
Derek L. Young (42) |
| Year of Election or Appointment: 2005 Vice President and lead co-manager of VIP Strategic Income. Mr. Young also serves as Vice President of other funds advised by FMR. Prior to assuming his current responsibilities, Mr. Young worked as director of Risk Management, senior vice president of Strategic Services and portfolio manager. Mr. Young also serves as Vice President of FMR and FMR Co., Inc (2004). |
Eric D. Roiter (58) |
| Year of Election or Appointment: 2003 Secretary of VIP Strategic Income. He also serves as Secretary of other Fidelity funds; Vice President, General Counsel, and Secretary of FMR Co., Inc. (2001-present) and FMR; Assistant Secretary of Fidelity Management & Research (U.K.) Inc. (2001-present), Fidelity Research & Analysis Company (2001-present), and Fidelity Investments Money Management, Inc. (2001-present). Mr. Roiter is an Adjunct Member, Faculty of Law, at Boston College Law School (2003-present). Previously, Mr. Roiter served as Vice President and Secretary of Fidelity Distributors Corporation (FDC) (1998-2005). |
Stuart Fross (47) |
| Year of Election or Appointment: 2003 Assistant Secretary of VIP Strategic Income. Mr. Fross also serves as Assistant Secretary of other Fidelity funds (2003-present), Vice President and Secretary of FDC (2005-present), and is an employee of FMR. |
R. Stephen Ganis (40) |
| Year of Election or Appointment: 2006 Anti-Money Laundering (AML) officer of VIP Strategic Income. Mr. Ganis also serves as AML officer of other Fidelity funds (2006-present) and FMR Corp. (2003-present). Before joining Fidelity Investments, Mr. Ganis practiced law at Goodwin Procter, LLP (2000-2002). |
Joseph B. Hollis (58) |
| Year of Election or Appointment: 2006 Chief Financial Officer of VIP Strategic Income. Mr. Hollis also serves as Chief Financial Officer of other Fidelity funds. Mr. Hollis is President of Fidelity Pricing and Cash Management Services (FPCMS) (2005-present). Mr. Hollis also serves as President and Director of Fidelity Service Company, Inc. (2006-present). Previously, Mr. Hollis served as Senior Vice President of Cash Management Services (1999-2002) and Investment Management Operations (2002-2005). |
Kenneth A. Rathgeber (59) |
| Year of Election or Appointment: 2004 Chief Compliance Officer of VIP Strategic Income. Mr. Rathgeber also serves as Chief Compliance Officer of other Fidelity funds (2004-present) and Executive Vice President of Risk Oversight for Fidelity Investments (2002-present). He is Chief Compliance Officer of FMR (2005-present), FMR Co., Inc. (2005-present), Fidelity Management & Research (U.K.) Inc. (2005-present), Fidelity Research & Analysis Company (2005-present), Fidelity Investments Money Management, Inc. (2005-present), and Strategic Advisers, Inc. (2005-present). Previously, Mr. Rathgeber served as Executive Vice President and Chief Operating Officer for Fidelity Investments Institutional Services Company, Inc. (1998-2002). |
Bryan A. Mehrmann (45) |
| Year of Election or Appointment: 2005 Deputy Treasurer of VIP Strategic Income. Mr. Mehrmann also serves as Deputy Treasurer of other Fidelity funds (2005-present) and is an employee of FMR. Previously, Mr. Mehrmann served as Vice President of Fidelity Investments Institutional Services Group (FIIS)/Fidelity Investments Institutional Operations Corporation, Inc. (FIIOC) Client Services (1998-2004). |
Kenneth B. Robins (37) |
| Year of Election or Appointment: 2005 Deputy Treasurer of VIP Strategic Income. Mr. Robins also serves as Deputy Treasurer of other Fidelity funds (2005-present) and is an employee of FMR (2004-present). Before joining Fidelity Investments, Mr. Robins worked at KPMG LLP, where he was a partner in KPMG's department of professional practice (2002-2004) and a Senior Manager (1999-2000). In addition, Mr. Robins served as Assistant Chief Accountant, United States Securities and Exchange Commission (2000-2002). |
Robert G. Byrnes (40) |
| Year of Election or Appointment: 2005 Assistant Treasurer of VIP Strategic Income. Mr. Byrnes also serves as Assistant Treasurer of other Fidelity funds (2005-present) and is an employee of FMR (2005-present). Previously, Mr. Byrnes served as Vice President of FPCMS (2003-2005). Before joining Fidelity Investments, Mr. Byrnes worked at Deutsche Asset Management where he served as Vice President of the Investment Operations Group (2000-2003). |
John H. Costello (60) |
| Year of Election or Appointment: 2003 Assistant Treasurer of VIP Strategic Income. Mr. Costello also serves as Assistant Treasurer of other Fidelity funds and is an employee of FMR. |
Peter L. Lydecker (52) |
| Year of Election or Appointment: 2004 Assistant Treasurer of VIP Strategic Income. Mr. Lydecker also serves as Assistant Treasurer of other Fidelity funds (2004) and is an employee of FMR. |
Mark Osterheld (51) |
| Year of Election or Appointment: 2003 Assistant Treasurer of VIP Strategic Income. Mr. Osterheld also serves as Assistant Treasurer of other Fidelity funds (2002) and is an employee of FMR. |
Gary W. Ryan (48) |
| Year of Election or Appointment: 2005 Assistant Treasurer of VIP Strategic Income. Mr. Ryan also serves as Assistant Treasurer of other Fidelity funds (2005-present) and is an employee of FMR (2005-present). Previously, Mr. Ryan served as Vice President of Fund Reporting in FPCMS (1999-2005). |
Salvatore Schiavone (41) |
| Year of Election or Appointment: 2005 Assistant Treasurer of VIP Strategic Income. Mr. Schiavone also serves as Assistant Treasurer of other Fidelity funds (2005-present) and is an employee of FMR (2005-present). Before joining Fidelity Investments, Mr. Schiavone worked at Deutsche Asset Management, where he most recently served as Assistant Treasurer (2003-2005) of the Scudder Funds and Vice President and Head of Fund Reporting (1996-2003). |
Annual Report
Distributions
The Board of Trustees of VIP IV Strategic Income Portfolio voted to pay to shareholders of record at the opening of business on record date, the following distributions per share derived from capital gains realized from sales of portfolio securities
| Pay Date | Record Date | Capital Gains |
Initial Class | 02/09/07 | 02/09/07 | $0.020 |
Service Class | 02/09/07 | 02/09/07 | $0.020 |
Service Class 2 | 02/09/07 | 02/09/07 | $0.020 |
Investor Class | 02/09/07 | 02/09/07 | $0.020 |
A total of 10.36% of the dividends distributed during the fiscal year was derived from interest on U.S. Government securities which is generally exempt from state income tax.
The fund hereby designates as a capital gain dividend with respect to the taxable year ended December 31, 2006, $590,859, or, if subsequently determined to be different, the net capital gain of such year.
The fund will notify shareholders in January 2007 of amounts for use in preparing 2006 income tax returns.
VIP Strategic Income Portfolio
Proxy Voting Results
A special meeting of the fund's shareholders was held on September 20, 2006. The results of votes taken among shareholders on the proposal before them are reported below. Each vote reported represents one dollar of net asset value held on the record date for the meeting.
PROPOSAL 1 |
To elect a Board of Trustees. A |
| # of
Votes | % of
Votes |
Dennis J. Dirks |
Affirmative | 92,459,317.52 | 96.102 |
Withheld | 3,749,837.05 | 3.898 |
TOTAL | 96,209,154.57 | 100.000 |
Albert R. Gamper, Jr. |
Affirmative | 92,260,598.99 | 95.896 |
Withheld | 3,948,555.58 | 4.104 |
TOTAL | 96,209,154.57 | 100.000 |
Robert M. Gates |
Affirmative | 92,315,480.72 | 95.953 |
Withheld | 3,893,673.85 | 4.047 |
TOTAL | 96,209,154.57 | 100.000 |
George H. Heilmeier |
Affirmative | 92,208,255.41 | 95.841 |
Withheld | 4,000,899.16 | 4.159 |
TOTAL | 96,209,154.57 | 100.000 |
Edward C. Johnson 3d |
Affirmative | 91,928,267.76 | 95.550 |
Withheld | 4,280,886.81 | 4.450 |
TOTAL | 96,209,154.57 | 100.000 |
Stephen P. Jonas |
Affirmative | 92,457,628.76 | 96.101 |
Withheld | 3,751,525.81 | 3.899 |
TOTAL | 96,209,154.57 | 100.000 |
James H. KeyesB |
Affirmative | 92,432,729.82 | 96.075 |
Withheld | 3,776,424.75 | 3.925 |
TOTAL | 96,209,154.57 | 100.000 |
Marie L. Knowles |
Affirmative | 92,398,847.52 | 96.040 |
Withheld | 3,810,307.05 | 3.960 |
TOTAL | 96,209,154.57 | 100.000 |
Ned C. Lautenbach |
Affirmative | 92,423,184.47 | 96.065 |
Withheld | 3,785,970.10 | 3.935 |
TOTAL | 96,209,154.57 | 100.000 |
| # of
Votes | % of
Votes |
William O. McCoy |
Affirmative | 92,086,293.90 | 95.715 |
Withheld | 4,122,860.67 | 4.285 |
TOTAL | 96,209,154.57 | 100.000 |
Robert L. Reynolds |
Affirmative | 92,439,032.86 | 96.081 |
Withheld | 3,770,121.71 | 3.919 |
TOTAL | 96,209,154.57 | 100.000 |
Cornelia M. Small |
Affirmative | 92,415,567.29 | 96.057 |
Withheld | 3,793,587.28 | 3.943 |
TOTAL | 96,209,154.57 | 100.000 |
William S. Stavropoulos |
Affirmative | 92,135,400.08 | 95.766 |
Withheld | 4,073,754.49 | 4.234 |
TOTAL | 96,209,154.57 | 100.000 |
Kenneth L. Wolfe |
Affirmative | 92,445,865.31 | 96.088 |
Withheld | 3,763,289.26 | 3.912 |
TOTAL | 96,209,154.57 | 100.000 |
A Denotes trust-wide proposal and voting results. B Effective on or about January 1, 2007. |
Annual Report
Investment Adviser
Fidelity Management & Research Company
Boston, MA
Investment Sub-Advisers
FMR Co., Inc.
Fidelity Research & Analysis Company
(formerly Fidelity Management & Research (Far East) Inc.)
Fidelity Investments Money Management, Inc.
Fidelity Investments Japan Limited
Fidelity International Investment Advisors
Fidelity International Investment Advisors (U.K.) Limited
General Distributor
Fidelity Distributors Corporation
Boston, MA
Transfer and Service Agents
Fidelity Investments Institutional Operations Company, Inc.
Boston, MA
Fidelity Service Company, Inc.
Boston, MA
Custodian
Mellon Bank, N.A.
Pittsburgh, PA
VIPSI-ANN-0207
1.796350.104
Fidelity® Variable Insurance Products:
Technology Portfolio
Annual Report
December 31, 2006
(2_fidelity_logos) (Registered_Trademark)
Contents
Note to Shareholders | <Click Here> | An explanation of the changes to the fund. |
Performance | <Click Here> | How the fund has done over time. |
Management's Discussion | <Click Here> | The manager's review of fund performance, strategy and outlook. |
Shareholder Expense Example | <Click Here> | An example of shareholder expenses. |
Investment Changes | <Click Here> | A summary of major shifts in the fund's investments over the past six months. |
Investments | <Click Here> | A complete list of the fund's investments with their
market values. |
Financial Statements | <Click Here> | Statements of assets and liabilities, operations, and
changes in net assets, as well as financial highlights. |
Notes | <Click Here> | Notes to the financial statements. |
Report of Independent Registered Public Accounting Firm | <Click Here> | |
Trustees and Officers | <Click Here> | |
Distributions | <Click Here> | |
Proxy Voting Results | <Click Here> | |
Board Approval of Investment Advisory Contracts and Management Fees | <Click Here> | |
To view a fund's proxy voting guidelines and proxy voting record for the 12-month period ended June 30, visit www.fidelity.com/proxyvotingresults or visit the Securities and Exchange Commission's (SEC) web site at www.sec.gov. You may also call 1-877-208-0098 to request a free copy of the proxy voting guidelines.
Fidelity Variable Insurance Products are separate account options which are purchased through a variable insurance contract.
Standard & Poor's, S&P and S&P 500 are registered service marks of The McGraw-Hill Companies, Inc. and have been licensed for use by Fidelity Distributors Corporation.
Other third party marks appearing herein are the property of their respective owners.
All other marks appearing herein are registered or unregistered trademarks or service marks of FMR Corp. or an affiliated company.
This report and the financial statements contained herein are submitted for the general information of the shareholders of the fund. This report is not authorized for distribution to prospective investors in the fund unless preceded or accompanied by an effective prospectus.
The fund files its complete schedule of portfolio holdings with the SEC for the first and third quarters of each fiscal year on Form N-Q. Forms N-Q are available on the SEC's web site at http://www.sec.gov. The fund's Forms N-Q may be reviewed and copied at the SEC's Public Reference Room in Washington, DC. Information regarding the operation of the SEC's Public Reference Room may be obtained by calling 1-800-SEC-0330. For a complete list of the fund's portfolio holdings, view the most recent quarterly holdings report, semiannual report, or annual report on Fidelity's web site at http://www.advisor.fidelity.com.
NOT FDIC INSURED · MAY LOSE VALUE · NO BANK GUARANTEE
Neither the fund nor Fidelity Distributors Corporation is a bank.
VIP Technology Portfolio
Note to Shareholders:
Effective October 1, 2006, Fidelity restructured the VIP Sector product line. The restructuring aligned the funds' investment goals more closely with standard industry classifications and facilitated adoption of more-specific benchmark indexes to evaluate fund performance. As restructured, the funds generally align under seven sectors in the widely recognized Global Industry Classification Standard (GICS), developed by Standard & Poor's® (S&P®) and Morgan Stanley Capital InternationalSM (MSCI®): Consumer Discretionary, Energy, Financials, Health Care, Industrials, Information Technology and Utilities. Changes to the funds ranged from simply adopting a new supplemental benchmark to, in some cases, changing investment policies and fund names.
For VIP Consumer Discretionary (formerly VIP Consumer Industries), VIP Energy (formerly VIP Natural Resources), VIP Industrials (formerly VIP Cyclical Industries), and VIP Utilities (formerly VIP Telecommunications & Utilities Growth), shareholders approved certain fundamental investment policy changes related to the restructuring at a special meeting of shareholders held September 20, 2006. All the funds adopted new benchmark indexes from MSCI. Taken together, the name, policy and benchmark changes will make it easier for investors to distinguish funds in the product line and to evaluate Fidelity Management & Research Company's skill in managing the funds.
For VIP Technology, the fund is now benchmarked to the MSCI US Investable Market Information Technology Index.
Annual Report
VIP Technology Portfolio
Performance: The Bottom Line
Average annual total return reflects the change in the value of an investment, assuming reinvestment of the class' dividend income and capital gains (the profits earned upon the sale of securities that have grown in value) and assuming a constant rate of performance each year. During periods of reimbursement by Fidelity, a fund's total return will be greater than it would be had the reimbursement not occurred. Performance numbers are net of all underlying fund operating expenses, but do not include any insurance charges imposed by your insurance company's separate account. If performance information included the effect of these additional charges, the total returns would have been lower. How a fund did yesterday is no guarantee of how it will do tomorrow.
Average Annual Total Returns
Periods ended December 31, 2006 | Past 1
year | Past 5
years | Life of fund A |
VIP Technology - Initial Class | 8.19% | 3.60% | 2.17% |
VIP Technology - Investor Class B | 8.10% | 3.54% | 2.12% |
A From July 19, 2001.
B The initial offering of Investor Class shares took place on July 21, 2005. Returns prior to July 21, 2005 are those of Initial Class. If Investor Class's transfer agent fee had been reflected, returns prior to July 21, 2005 would have been lower.
$10,000 Over Life of Fund
Let's say hypothetically that $10,000 was invested in VIP Technology Portfolio - Initial Class on July 19, 2001, when the fund started. The chart shows how the value of your investment would have changed, and also shows how the Standard & Poor's 500SM Index (S&P 500®) performed over the same period.
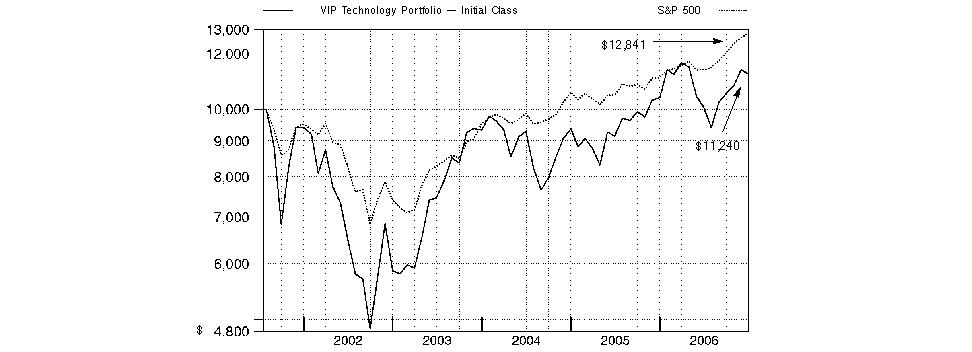
VIP Technology Portfolio
VIP Technology Portfolio
Management's Discussion of Fund Performance
Comments from Charlie Chai, Portfolio Manager of VIP Technology Portfolio
U.S. stock markets registered their fourth consecutive year of positive returns in 2006. Among the highlights were the performances of the Dow Jones Industrial AverageSM - a gauge of 30 mega-cap, blue-chip stocks - and the small-cap-oriented Russell 2000® Index, both of which reached new highs. The efforts of the Federal Reserve Board to contain inflation levels also dominated the investment headlines. In all, the Fed hiked short-term interest rates four times, but held rates steady after its June 29 increase, finally pausing after 17 rate hikes over a two-year period. A slowing residential housing market and moderating oil prices - the latter of which hit a record closing high of $77 per barrel in July before falling sharply - also held economic growth in check. For the year overall, the Standard & Poor's 500SM Index was up 15.79%, the Dow advanced 19.05%, the Russell 2000 Index gained 18.37% and the NASDAQ Composite® Index rose 10.39%.
During the year, the fund underperformed the 9.21% gain of the Morgan Stanley Capital InternationalSM (MSCI®) US Investable Market Information Technology Index and performed about in line with the 8.31% advance of a blended index specific to this fund. This blended index is a combination of the Goldman Sachs® Technology Index, which the fund was compared with through September, and the new MSCI benchmark mentioned above, which the fund was compared with during the period's final three months1. During the same 12-month period, the fund also trailed the S&P 500®. (For specific portfolio performance results, please refer to the performance section of this report.) For the first nine months of the period, stock selection in communications equipment represented the biggest head wind to the fund's performance versus the Goldman Sachs index. Underweighting the relatively strong performing systems software segment also played a part in the fund slightly trailing the Goldman Sachs index. Among individual holdings, underweighting strong performing networking equipment stock Cisco Systems, a major index component, hurt performance. Also detracting was Canada-based Nortel Networks, a wireline telecom equipment company. Conversely, our results benefited from my picks in semiconductors, Internet software/services and semiconductor equipment, along with a significant overweighting in communications equipment. Underweighting personal computer semiconductor maker Intel - another large index component - was a particularly good decision, given the stock's double-digit loss. China-based communications equipment stock Comtech Group also aided performance. During the fourth quarter, the fund edged the MSCI index, aided by stock selection in semiconductors and communications equipment, although overweightings in both relatively weak groups offset some of those benefits. F5 Networks was the top three-month contributor. The applications networking solutions provider advanced smartly after beating its fiscal fourth-quarter revenue target and upping expectations for its first quarter. Canada's Research In Motion, maker of the popular BlackBerry device, further aided our results. Conversely, underweighting the computer hardware segment diminished performance, along with a large overweighting in communications equipment. Our underweighting in Cisco Systems again held back performance.
1 The fund's blended index is a customized index developed by Fidelity for the limited purpose of discussing the fund's performance for the 12-month period ending December 31, 2006. From January 1, 2006, through September 30, 2006, the fund compared its performance to the Goldman Sachs Technology Index, which returned 1.76% during that period. On October 1, 2006, the fund began comparing its performance to a different index, the MSCI US Investable Market Information Technology Index, which returned 6.44% from October 1, 2006, through December 31, 2006. For the 12-month period ending December 31, 2006, the blended index (Goldman Sachs and MSCI) returned 8.31%.
The views expressed above reflect those of the portfolio manager(s) only through the end of the period as stated on the cover of this report and do not necessarily represent the views of Fidelity or any other person in the Fidelity organization. Any such views are subject to change at any time based upon market or other conditions and Fidelity disclaims any responsibility to update such views. These views may not be relied on as investment advice and, because investment decisions for a Fidelity fund are based on numerous factors, may not be relied on as an indication of trading intent on behalf of any Fidelity fund.
Annual Report
VIP Technology Portfolio
Shareholder Expense Example
As a shareholder of the Fund, you incur two types of costs: (1) transaction costs, including redemption fees, and (2) ongoing costs, including management fees and other Fund expenses. This Example is intended to help you understand your ongoing costs (in dollars) of investing in the Fund and to compare these costs with the ongoing costs of investing in other mutual funds.
The Example is based on an investment of $1,000 invested at the beginning of the period and held for the entire period (July 1, 2006 to December 31, 2006).
Actual Expenses
The first line of the accompanying table for each class of the Fund provides information about actual account values and actual expenses. You may use the information in this line, together with the amount you invested, to estimate the expenses that you paid over the period. Simply divide your account value by $1,000.00 (for example, an $8,600 account value divided by $1,000.00 = 8.6), then multiply the result by the number in the first line for a class of the Fund under the heading entitled "Expenses Paid During Period" to estimate the expenses you paid on your account during this period. The estimate of expenses does not include any fees or other expenses of any variable annuity or variable life insurance product. If they were, the estimate of expenses you paid during the period would be higher, and your ending account value would be lower.
Hypothetical Example for Comparison Purposes
The second line of the accompanying table for each class of the Fund provides information about hypothetical account values and hypothetical expenses based on a Class' actual expense ratio and an assumed rate of return of 5% per year before expenses, which is not the Class' actual return. The hypothetical account values and expenses may not be used to estimate the actual ending account balance or expenses you paid for the period. You may use this information to compare the ongoing costs of investing in the Fund and other funds. To do so, compare this 5% hypothetical example with the 5% hypothetical examples that appear in the shareholder reports of the other funds. The estimate of expenses does not include any fees or other expenses of any variable annuity or variable life insurance product. If they were, the estimate of expenses you paid during the period would be higher, and your ending account value would be lower.
Please note that the expenses shown in the table are meant to highlight your ongoing costs only and do not reflect any transaction costs. Therefore, the second line of the table is useful in comparing ongoing costs only, and will not help you determine the relative total costs of owning different funds. In addition, if these transactional costs were included, your costs would have been higher.
| Beginning
Account Value
July 1, 2006 | Ending
Account Value
December 31, 2006 | Expenses Paid
During Period*
July 1, 2006
to December 31, 2006 |
Initial Class | | | |
Actual | $ 1,000.00 | $ 1,116.30 | $ 4.53 |
HypotheticalA | $ 1,000.00 | $ 1,020.92 | $ 4.33 |
Investor Class | | | |
Actual | $ 1,000.00 | $ 1,115.40 | $ 5.12 |
HypotheticalA | $ 1,000.00 | $ 1,020.37 | $ 4.89 |
A 5% return per year before expenses
* Expenses are equal to each Class' annualized expense ratio (shown in the table below); multiplied by the average account value over the period, multiplied by 184/365 (to reflect the one-half year period).
| Annualized
Expense Ratio |
Initial Class | .85% |
Investor Class | .96% |
VIP Technology Portfolio
VIP Technology Portfolio
Investment Changes
Top Ten Stocks as of December 31, 2006 |
| % of fund's
net assets | % of fund's net assets
6 months ago |
QUALCOMM, Inc. | 5.4 | 5.3 |
Research In Motion Ltd. | 5.4 | 1.0 |
Google, Inc. Class A (sub. vtg.) | 5.1 | 3.0 |
Marvell Technology Group Ltd. | 4.1 | 1.0 |
Apple Computer, Inc. | 2.9 | 3.2 |
Intel Corp. | 2.8 | 2.5 |
Motorola, Inc. | 2.5 | 4.2 |
Cisco Systems, Inc. | 2.5 | 0.0 |
Sun Microsystems, Inc. | 2.2 | 0.5 |
Hewlett-Packard Co. | 2.1 | 2.0 |
| 35.0 | |
Top Industries (% of fund's net assets) |
As of December 31, 2006 |
| Communications Equipment | 34.4% | |
| Semiconductors & Semiconductor Equipment | 24.8% | |
| Software | 12.7% | |
| Computers & Peripherals | 10.1% | |
| Internet Software & Services | 9.0% | |
| All Others* | 9.0% | |

|
As of June 30, 2006 |
| Communications Equipment | 39.1% | |
| Semiconductors & Semiconductor Equipment | 23.2% | |
| Computers & Peripherals | 13.7% | |
| Software | 8.8% | |
| Internet Software & Services | 6.2% | |
| All Others* | 9.0% | |

* Includes short-term investments and net other assets. |
Prior period industry classifications reflect the categories in place as of the date indicated and have not been adjusted to reflect current industry classifications. |
Annual Report
VIP Technology Portfolio
Investments December 31, 2006
Showing Percentage of Net Assets
Common Stocks - 99.4% |
| Shares | | Value (Note 1) |
BUILDING PRODUCTS - 0.2% |
Building Products - 0.2% |
Asahi Glass Co. Ltd. | 13,000 | | $ 156,153 |
COMMERCIAL SERVICES & SUPPLIES - 1.4% |
Diversified Commercial & Professional Services - 1.3% |
Equifax, Inc. | 1,000 | | 40,600 |
Tele Atlas NV (a) | 49,744 | | 1,042,215 |
| | 1,082,815 |
Human Resource & Employment Services - 0.1% |
Kenexa Corp. (a) | 2,100 | | 69,846 |
TOTAL COMMERCIAL SERVICES & SUPPLIES | | 1,152,661 |
COMMUNICATIONS EQUIPMENT - 34.2% |
Communications Equipment - 34.2% |
Acme Packet, Inc. | 15,600 | | 321,984 |
ADC Telecommunications, Inc. (a) | 8,385 | | 121,834 |
ADVA AG Optical Networking (a) | 28,877 | | 327,861 |
Alcatel-Lucent SA sponsored ADR | 23,000 | | 327,060 |
AudioCodes Ltd. (a) | 74,550 | | 698,534 |
Bookham, Inc. (a) | 60,612 | | 246,691 |
China Techfaith Wireless Communication Technology Ltd. sponsored ADR (a)(d) | 21,800 | | 235,004 |
Ciena Corp. (a) | 11,863 | | 328,724 |
Cisco Systems, Inc. (a) | 72,500 | | 1,981,425 |
Comtech Group, Inc. (a)(d) | 61,499 | | 1,118,667 |
Comverse Technology, Inc. (a) | 77,370 | | 1,633,281 |
Corning, Inc. (a) | 49,200 | | 920,532 |
ECI Telecom Ltd. (a) | 29,882 | | 258,778 |
F5 Networks, Inc. (a) | 20,513 | | 1,522,270 |
Finisar Corp. (a) | 110,429 | | 356,686 |
Foundry Networks, Inc. (a) | 29,400 | | 440,412 |
Foxconn International Holdings Ltd. (a) | 40,000 | | 130,877 |
JDS Uniphase Corp. (a) | 4,562 | | 76,003 |
Juniper Networks, Inc. (a) | 75,396 | | 1,428,000 |
Mogem Co. Ltd. | 31,554 | | 588,669 |
Motorola, Inc. | 98,430 | | 2,023,721 |
Nortel Networks Corp. (a) | 16,160 | | 433,520 |
Optium Corp. | 4,200 | | 104,748 |
Powerwave Technologies, Inc. (a) | 112,800 | | 727,560 |
QUALCOMM, Inc. | 114,796 | | 4,338,138 |
Research In Motion Ltd. (a) | 33,930 | | 4,335,575 |
Riverbed Technology, Inc. | 100 | | 3,070 |
Sandvine Corp. | 142,488 | | 234,419 |
Sandvine Corp. (a) | 214,400 | | 349,365 |
Sonus Networks, Inc. (a) | 143,100 | | 943,029 |
Stratex Networks, Inc. (a) | 38,394 | | 185,443 |
Tekelec (a) | 25,800 | | 382,614 |
Terayon Communication Systems, Inc. (a) | 139,300 | | 310,639 |
TomTom Group BV (a)(d) | 2,800 | | 120,951 |
| | 27,556,084 |
|
| Shares | | Value (Note 1) |
COMPUTERS & PERIPHERALS - 10.1% |
Computer Hardware - 8.7% |
Apple Computer, Inc. (a) | 28,100 | | $ 2,384,004 |
Concurrent Computer Corp. (a) | 206,236 | | 373,287 |
Hewlett-Packard Co. | 40,400 | | 1,664,076 |
NCR Corp. (a) | 15,700 | | 671,332 |
Palm, Inc. (a)(d) | 12,300 | | 173,307 |
Sun Microsystems, Inc. (a) | 321,900 | | 1,744,698 |
| | 7,010,704 |
Computer Storage & Peripherals - 1.4% |
Brocade Communications Systems, Inc. (a) | 500 | | 4,105 |
EMC Corp. (a) | 17,300 | | 228,360 |
Network Appliance, Inc. (a) | 5,500 | | 216,040 |
Rackable Systems, Inc. (a) | 1,200 | | 37,164 |
SanDisk Corp. (a) | 13,100 | | 563,693 |
Seagate Technology | 3,300 | | 87,450 |
| | 1,136,812 |
TOTAL COMPUTERS & PERIPHERALS | | 8,147,516 |
ELECTRICAL EQUIPMENT - 0.5% |
Electrical Components & Equipment - 0.5% |
Evergreen Solar, Inc. (a)(d) | 34,703 | | 262,702 |
Q-Cells AG (a) | 200 | | 8,996 |
Suntech Power Holdings Co. Ltd. sponsored ADR | 3,700 | | 125,837 |
| | 397,535 |
ELECTRONIC EQUIPMENT & INSTRUMENTS - 2.3% |
Electronic Equipment & Instruments - 0.3% |
Cognex Corp. | 1,400 | | 33,348 |
Photon Dynamics, Inc. (a) | 14,694 | | 171,773 |
| | 205,121 |
Electronic Manufacturing Services - 1.7% |
Hon Hai Precision Industry Co. Ltd. (Foxconn) | 28,540 | | 203,638 |
Jabil Circuit, Inc. | 44,100 | | 1,082,655 |
Trimble Navigation Ltd. (a) | 1,100 | | 55,803 |
| | 1,342,096 |
Technology Distributors - 0.3% |
Arrow Electronics, Inc. (a) | 2,200 | | 69,410 |
Avnet, Inc. (a) | 300 | | 7,659 |
Wolfson Microelectronics PLC (a) | 38,100 | | 208,192 |
| | 285,261 |
TOTAL ELECTRONIC EQUIPMENT & INSTRUMENTS | | 1,832,478 |
HOUSEHOLD DURABLES - 0.9% |
Consumer Electronics - 0.9% |
Garmin Ltd. | 10,200 | | 567,732 |
Common Stocks - continued |
| Shares | | Value (Note 1) |
HOUSEHOLD DURABLES - CONTINUED |
Consumer Electronics - continued |
ReignCom Ltd. (a) | 3,226 | | $ 19,842 |
Thomson SA | 6,500 | | 127,089 |
| | 714,663 |
Household Appliances - 0.0% |
iRobot Corp. (a) | 100 | | 1,806 |
TOTAL HOUSEHOLD DURABLES | | 716,469 |
INTERNET & CATALOG RETAIL - 0.2% |
Internet Retail - 0.2% |
Gmarket, Inc. sponsored ADR | 100 | | 2,396 |
GSI Commerce, Inc. (a) | 7,099 | | 133,106 |
| | 135,502 |
INTERNET SOFTWARE & SERVICES - 9.0% |
Internet Software & Services - 9.0% |
Akamai Technologies, Inc. (a) | 400 | | 21,248 |
Ariba, Inc. (a) | 4,500 | | 34,830 |
DivX, Inc. (d) | 5,800 | | 133,806 |
Google, Inc. Class A (sub. vtg.) (a) | 8,850 | | 4,075,248 |
Liquidity Services, Inc. | 7,100 | | 122,191 |
Marchex, Inc. Class B | 18,800 | | 251,544 |
Openwave Systems, Inc. (a) | 80,233 | | 740,551 |
RADVision Ltd. (a) | 24,471 | | 491,378 |
WebSideStory, Inc. (a) | 50,205 | | 635,595 |
Yahoo!, Inc. (a) | 28,600 | | 730,444 |
| | 7,236,835 |
IT SERVICES - 2.7% |
Data Processing & Outsourced Services - 1.5% |
First Data Corp. | 16,400 | | 418,528 |
The Western Union Co. | 35,500 | | 795,910 |
| | 1,214,438 |
IT Consulting & Other Services - 1.2% |
Cognizant Technology Solutions Corp. Class A (a) | 4,700 | | 362,652 |
Infosys Technologies Ltd. sponsored ADR | 1,700 | | 92,752 |
Isilon Systems, Inc. | 100 | | 2,760 |
RightNow Technologies, Inc. (a) | 23,452 | | 403,843 |
Satyam Computer Services Ltd. sponsored ADR | 5,000 | | 120,050 |
| | 982,057 |
TOTAL IT SERVICES | | 2,196,495 |
REAL ESTATE MANAGEMENT & DEVELOPMENT - 0.2% |
Real Estate Management & Development - 0.2% |
Move, Inc. | 27,500 | | 151,525 |
|
| Shares | | Value (Note 1) |
SEMICONDUCTORS & SEMICONDUCTOR EQUIPMENT - 24.8% |
Semiconductor Equipment - 4.4% |
Applied Materials, Inc. | 13,000 | | $ 239,850 |
ASE Test Ltd. (a) | 7,500 | | 75,675 |
ASML Holding NV (NY Shares) (a) | 24,800 | | 610,824 |
Axcelis Technologies, Inc. (a) | 15,100 | | 88,033 |
Credence Systems Corp. (a) | 24,800 | | 128,960 |
EMCORE Corp. (a)(d) | 21,802 | | 120,565 |
Entegris, Inc. (a) | 22,055 | | 238,635 |
FormFactor, Inc. (a) | 6,600 | | 245,850 |
ICOS Vision Systems NV (a) | 900 | | 38,032 |
KLA-Tencor Corp. | 4,300 | | 213,925 |
Kulicke & Soffa Industries, Inc. (a) | 24,000 | | 201,600 |
Lam Research Corp. (a) | 4,200 | | 212,604 |
LTX Corp. (a) | 40,300 | | 225,680 |
Rudolph Technologies, Inc. (a) | 4,180 | | 66,546 |
Tessera Technologies, Inc. (a) | 8,300 | | 334,822 |
Varian Semiconductor Equipment Associates, Inc. (a) | 6,050 | | 275,396 |
Verigy Ltd. | 11,920 | | 211,580 |
| | 3,528,577 |
Semiconductors - 20.4% |
Advanced Micro Devices, Inc. (a) | 1,864 | | 37,932 |
Altera Corp. (a) | 4,300 | | 84,624 |
AMIS Holdings, Inc. (a) | 19,000 | | 200,830 |
Analog Devices, Inc. | 11,600 | | 381,292 |
Applied Micro Circuits Corp. (a) | 101,300 | | 360,628 |
Atheros Communications, Inc. (a) | 11,100 | | 236,652 |
Atmel Corp. (a) | 27,600 | | 166,980 |
Broadcom Corp. Class A (a) | 15,477 | | 500,062 |
Chartered Semiconductor Manufacturing Ltd. (a) | 161,000 | | 134,416 |
Chartered Semiconductor Manufacturing Ltd. sponsored ADR (a) | 49,100 | | 409,985 |
Conexant Systems, Inc. (a) | 38,400 | | 78,336 |
CSR PLC (a) | 10,000 | | 127,306 |
Cypress Semiconductor Corp. (a) | 36,800 | | 620,816 |
Ikanos Communications, Inc. (a) | 17,700 | | 153,813 |
Infineon Technologies AG sponsored ADR (a) | 6,000 | | 84,180 |
Integrated Device Technology, Inc. (a) | 9,400 | | 145,512 |
Intel Corp. | 112,100 | | 2,270,025 |
Intersil Corp. Class A | 21,100 | | 504,712 |
LSI Logic Corp. (a) | 22,400 | | 201,600 |
Marvell Technology Group Ltd. (a) | 173,500 | | 3,329,465 |
Maxim Integrated Products, Inc. | 13,300 | | 407,246 |
Microtune, Inc. (a) | 57,660 | | 271,002 |
Mindspeed Technologies, Inc. (a) | 77,984 | | 148,949 |
Monolithic Power Systems, Inc. (a) | 13,300 | | 147,763 |
MoSys, Inc. (a)(d) | 3,300 | | 30,525 |
National Semiconductor Corp. | 40,200 | | 912,540 |
NVIDIA Corp. (a) | 11,600 | | 429,316 |
Common Stocks - continued |
| Shares | | Value (Note 1) |
SEMICONDUCTORS & SEMICONDUCTOR EQUIPMENT - CONTINUED |
Semiconductors - continued |
O2Micro International Ltd. sponsored ADR (a) | 10,054 | | $ 85,962 |
Pericom Semiconductor Corp. (a) | 10,400 | | 119,288 |
PixArt Imaging, Inc. | 34,000 | | 511,278 |
PLX Technology, Inc. (a) | 4,600 | | 59,984 |
PMC-Sierra, Inc. (a) | 14,100 | | 94,611 |
Saifun Semiconductors Ltd. (a) | 14,100 | | 262,260 |
Semiconductor Manufacturing International Corp. sponsored ADR (a) | 11,400 | | 73,416 |
Semtech Corp. (a) | 8,900 | | 116,323 |
Silicon Laboratories, Inc. (a) | 6,200 | | 214,830 |
Silicon On Insulator Technologies SA (SOITEC) (a) | 8,400 | | 298,867 |
SiRF Technology Holdings, Inc. (a) | 27,900 | | 712,008 |
Skyworks Solutions, Inc. (a) | 23,500 | | 166,380 |
Spansion, Inc. Class A | 25,300 | | 375,958 |
STATS ChipPAC Ltd. sponsored ADR (a) | 66,800 | | 513,024 |
Vimicro International Corp. sponsored ADR (a) | 41,100 | | 419,220 |
Xilinx, Inc. | 3,200 | | 76,192 |
| | 16,476,108 |
TOTAL SEMICONDUCTORS & SEMICONDUCTOR EQUIPMENT | | 20,004,685 |
SOFTWARE - 12.7% |
Application Software - 9.2% |
Adobe Systems, Inc. (a) | 34,450 | | 1,416,584 |
Altiris, Inc. (a) | 5,200 | | 131,976 |
Ansys, Inc. (a) | 13,300 | | 578,417 |
Autodesk, Inc. (a) | 6,400 | | 258,944 |
BEA Systems, Inc. (a) | 20,313 | | 255,538 |
Cognos, Inc. (a) | 4,300 | | 182,578 |
Hyperion Solutions Corp. (a) | 4,550 | | 163,527 |
Informatica Corp. (a) | 103,655 | | 1,265,628 |
Kronos, Inc. (a) | 15,000 | | 551,100 |
NAVTEQ Corp. (a) | 11,700 | | 409,149 |
Opsware, Inc. (a) | 35,446 | | 312,634 |
Quest Software, Inc. (a) | 11,600 | | 169,940 |
Salesforce.com, Inc. (a) | 28,600 | | 1,042,470 |
Ulticom, Inc. (a) | 72,693 | | 697,126 |
| | 7,435,611 |
Home Entertainment Software - 0.7% |
Electronic Arts, Inc. (a) | 2,900 | | 146,044 |
Gameloft (a)(d) | 46,500 | | 278,094 |
THQ, Inc. (a) | 3,900 | | 126,828 |
| | 550,966 |
|
| Shares | | Value (Note 1) |
Systems Software - 2.8% |
Allot Communications Ltd. | 2,200 | | $ 25,762 |
Double-Take Software, Inc. | 9,800 | | 126,224 |
Oracle Corp. (a) | 89,600 | | 1,535,744 |
Red Hat, Inc. (a) | 19,360 | | 445,280 |
Wind River Systems, Inc. (a) | 16,000 | | 164,000 |
| | 2,297,010 |
TOTAL SOFTWARE | | 10,283,587 |
SPECIALTY RETAIL - 0.2% |
Computer & Electronics Retail - 0.2% |
Gamestop Corp. Class B (a) | 3,900 | | 213,564 |
TOTAL COMMON STOCKS (Cost $69,942,182) | 80,181,089 |
Convertible Bonds - 0.2% |
| Principal
Amount | | |
COMMUNICATIONS EQUIPMENT - 0.2% |
Communications Equipment - 0.2% |
Ciena Corp. 0.25% 5/1/13
(Cost $130,000) | $ 130,000 | | 119,496 |
Money Market Funds - 3.1% |
| Shares | | |
Fidelity Securities Lending Cash Central Fund, 5.38% (b)(c)
(Cost $2,488,243) | 2,488,243 | | 2,488,243 |
TOTAL INVESTMENT PORTFOLIO - 102.7% (Cost $72,560,425) | | 82,788,828 |
NET OTHER ASSETS - (2.7)% | | (2,160,549) |
NET ASSETS - 100% | $ 80,628,279 |
Legend |
(a) Non-income producing |
(b) Affiliated fund that is available only to investment companies and other accounts managed by Fidelity Investments. The rate quoted is the annualized seven-day yield of the fund at period end. A complete unaudited listing of the fund's holdings as of its most recent quarter end is available upon request. |
(c) Investment made with cash collateral received from securities on loan. |
(d) Security or a portion of the security is on loan at period end. |
Affiliated Central Funds |
Information regarding fiscal year to date income earned by the Fund from investments in Fidelity Central Funds is as follows: |
Fund | Income earned |
Fidelity Cash Central Fund | $ 45,337 |
Fidelity Securities Lending Cash Central Fund | 59,183 |
Total | $ 104,520 |
Other Information |
Distribution of investments by country of issue, as a percentage of total net assets, is as follows: |
United States of America | 76.6% |
Canada | 6.8% |
Bermuda | 4.1% |
Netherlands | 2.3% |
Israel | 2.1% |
Cayman Islands | 1.9% |
Singapore | 1.6% |
France | 1.3% |
Taiwan | 1.0% |
Others (individually less than 1%) | 2.3% |
| 100.0% |
See accompanying notes which are an integral part of the financial statements.
Annual Report
VIP Technology Portfolio
Financial Statements
Statement of Assets and Liabilities
| December 31, 2006 |
| | |
Assets | | |
Investment in securities, at value (including securities loaned of $2,377,558) -
See accompanying schedule: Unaffiliated issuers
(cost $70,072,182) | $ 80,300,585 | |
Fidelity Central Funds
(cost $2,488,243) | 2,488,243 | |
Total Investments (cost $72,560,425) | | $ 82,788,828 |
Receivable for investments sold | | 522,937 |
Dividends receivable | | 29,495 |
Interest receivable | | 2,580 |
Prepaid expenses | | 369 |
Other receivables | | 10,937 |
Total assets | | 83,355,146 |
| | |
Liabilities | | |
Payable to custodian bank | $ 111,470 | |
Payable for investments purchased | 30,222 | |
Accrued management fee | 38,755 | |
Other affiliated payables | 8,792 | |
Other payables and accrued expenses | 49,385 | |
Collateral on securities loaned, at value | 2,488,243 | |
Total liabilities | | 2,726,867 |
| | |
Net Assets | | $ 80,628,279 |
Net Assets consist of: | | |
Paid in capital | | $ 65,006,818 |
Accumulated undistributed net realized gain (loss) on investments and foreign currency transactions | | 5,393,029 |
Net unrealized appreciation (depreciation) on investments and assets and liabilities in foreign currencies | | 10,228,432 |
Net Assets | | $ 80,628,279 |
Statement of Assets and Liabilities - continued
| December 31, 2006 |
Initial Class:
Net Asset Value, offering price and redemption price per share ($64,689,016 ÷ 6,237,885 shares) | | $ 10.37 |
| | |
Investor Class:
Net Asset Value, offering price and redemption price per share ($15,939,263 ÷ 1,542,065 shares) | | $ 10.34 |
See accompanying notes which are an integral part of the financial statements.
VIP Technology Portfolio
Statement of Operations
| Year ended December 31, 2006 |
| | |
Investment Income | | |
Dividends | | $ 192,990 |
Interest | | 583 |
Income from Fidelity Central Funds (including $59,183 from security lending) | | 104,520 |
Total income | | 298,093 |
| | |
Expenses | | |
Management fee | $ 489,706 | |
Transfer agent fees | 76,592 | |
Accounting and security lending fees | 34,450 | |
Custodian fees and expenses | 47,093 | |
Independent trustees' compensation | 324 | |
Audit | 39,511 | |
Legal | 2,529 | |
Miscellaneous | 15,644 | |
Total expenses before reductions | 705,849 | |
Expense reductions | (23,995) | 681,854 |
Net investment income (loss) | | (383,761) |
Realized and Unrealized Gain (Loss) Net realized gain (loss) on: | | |
Investment securities: | | |
Unaffiliated issuers | 6,390,785 | |
Foreign currency transactions | (10,394) | |
Total net realized gain (loss) | | 6,380,391 |
Change in net unrealized appreciation (depreciation) on: Investment securities | (755,171) | |
Assets and liabilities in foreign currencies | 4 | |
Total change in net unrealized appreciation (depreciation) | | (755,167) |
Net gain (loss) | | 5,625,224 |
Net increase (decrease) in net assets resulting from operations | | $ 5,241,463 |
Statement of Changes in Net Assets
| Year ended
December 31,
2006 | Year ended
December 31,
2005 |
Increase (Decrease) in Net Assets | | |
Operations | | |
Net investment income (loss) | $ (383,761) | $ (195,851) |
Net realized gain (loss) | 6,380,391 | 15,639,986 |
Change in net unrealized appreciation (depreciation) | (755,167) | (10,091,877) |
Net increase (decrease) in net assets resulting from operations | 5,241,463 | 5,352,258 |
Distributions to shareholders from net investment income | - | (365,699) |
Distributions to shareholders from net realized gain | (7,082,577) | - |
Total distributions | (7,082,577) | (365,699) |
Share transactions - net increase (decrease) | (2,276,220) | (37,159,453) |
Redemption fees | 45,151 | 42,532 |
Total increase (decrease) in net assets | (4,072,183) | (32,130,362) |
| | |
Net Assets | | |
Beginning of period | 84,700,462 | 116,830,824 |
End of period (including undistributed net investment income of $0 and undistributed net investment income of $36,447, respectively) | $ 80,628,279 | $ 84,700,462 |
See accompanying notes which are an integral part of the financial statements.
Annual Report
Financial Highlights - Initial Class
Years ended December 31, | 2006 | 2005 | 2004 | 2003 | 2002 |
Selected Per-Share Data | | | | | |
Net asset value, beginning of period | $ 10.35 | $ 9.37 | $ 9.33 | $ 5.86 | $ 9.42 |
Income from Investment Operations | | | | | |
Net investment income (loss) C | (.04) | (.02) | .02 F | (.03) | (.04) |
Net realized and unrealized gain (loss) | .88 | 1.04 | .01 | 3.49 | (3.54) |
Total from investment operations | .84 | 1.02 | .03 | 3.46 | (3.58) |
Distributions from net investment income | - | (.04) | - | - | - |
Distributions from net realized gain | (.83) | - | - | - | - |
Redemption fees added to paid in capital C | .01 | - H | .01 | .01 | .02 |
Net asset value, end of period | $ 10.37 | $ 10.35 | $ 9.37 | $ 9.33 | $ 5.86 |
Total Return A, B | 8.19% | 10.88% | .43% | 59.22% | (37.79)% |
Ratios to Average Net Assets D, G | | | | | |
Expenses before reductions | .80% | .79% | .75% | .83% | .99% |
Expenses net of fee waivers, if any | .80% | .79% | .75% | .83% | .99% |
Expenses net of all reductions | .77% | .62% | .68% | .75% | .86% |
Net investment income (loss) | (.43)% | (.24)% | .24% | (.34)% | (.52)% |
Supplemental Data | | | | | |
Net assets, end of period (000 omitted) | $ 64,689 | $ 78,892 | $ 116,831 | $ 167,274 | $ 32,955 |
Portfolio turnover rate E | 269% | 249% | 118% | 129% | 217% |
A Total returns do not reflect charges attributable to your insurance company's separate account. Inclusion of these charges would reduce the total returns shown.
B Total returns would have been lower had certain expenses not been reduced during the periods shown.
C Calculated based on average shares outstanding during the period.
D Fees and expenses of the underlying Fidelity Central Funds are not included in the Fund's expense ratio. The Fund indirectly bears its proportionate share of the expenses of any underlying Fidelity Central Funds.
E Amount does not include the portfolio activity of any underlying Fidelity Central Funds.
F Investment income per share reflects a special dividend which amounted to $.06 per share.
G Expense ratios reflect operating expenses of the class. Expenses before reductions do not reflect amounts reimbursed by the investment adviser or reductions from brokerage service arrangements or other expense offset arrangements and do not represent the amount paid by the class during periods when reimbursements or reductions occur. Expenses net of fee waivers reflect expenses after reimbursement by the investment adviser but prior to reductions from brokerage service arrangements or other expense offset arrangements. Expenses net of all reductions represent the net expenses paid by the class.
H Amount represents less than $.01 per share.
Financial Highlights - Investor Class
Years ended December 31, | 2006 | 2005H |
Selected Per-Share Data | | |
Net asset value, beginning of period | $ 10.33 | $ 9.71 |
Income from Investment Operations | | |
Net investment income (loss)E | (.06) | (.02) |
Net realized and unrealized gain (loss) | .89 | .64 |
Total from investment operations | .83 | .62 |
Distributions from net realized gain | (.83) | - |
Redemption fees added to paid in capital E | .01 | -J |
Net asset value, end of period | $ 10.34 | $ 10.33 |
Total Return B, C, D | 8.10% | 6.39% |
Ratios to Average Net Assets F, I | | |
Expenses before reductions | .93% | .97% A |
Expenses net of fee waivers, if any | .93% | .97% A |
Expenses net of all reductions | .90% | .80% A |
Net investment income (loss) | (.56)% | (.45)% A |
Supplemental Data | | |
Net assets, end of period (000 omitted) | $ 15,939 | $ 5,809 |
Portfolio turnover rate G | 269% | 249% |
A Annualized
B Total returns for periods of less than one year are not annualized.
C Total returns do not reflect charges attributable to your insurance company's separate account. Inclusion of these charges would reduce the total returns shown.
D Total returns would have been lower had certain expenses not been reduced during the periods shown.
E Calculated based on average shares outstanding during the period.
F Fees and expenses of the underlying Fidelity Central Funds are not included in the Fund's expense ratio. The Fund indirectly bears its proportionate share of the expenses of any underlying Fidelity Central Funds.
G Amount does not include the portfolio activity of any underlying Fidelity Central Funds.
H For the period July 21, 2005 (commencement of sale of shares) to December 31, 2005.
I Expense ratios reflect operating expenses of the class. Expenses before reductions do not reflect amounts reimbursed by the investment adviser or reductions from brokerage service arrangements or other expense offset arrangements and do not represent the amount paid by the class during periods when reimbursements or reductions occur. Expense ratios before reductions for start-up periods may not be representative of longer-term operating periods. Expenses net of fee waivers reflect expenses after reimbursement by the investment adviser but prior to reductions from brokerage service arrangements or other expense offset arrangements. Expenses net of all reductions represent the net expenses paid by the class.
J Amount represents less than $.01 per share.
See accompanying notes which are an integral part of the financial statements.
VIP Technology Portfolio
Notes to Financial Statements
For the period ended December 31, 2006
1. Significant Accounting Policies.
VIP Technology Portfolio (the Fund) is a non-diversified fund of Variable Insurance Products Fund IV (the trust) and is authorized to issue an unlimited number of shares. The trust is registered under the Investment Company Act of 1940, as amended (the 1940 Act), as an open-end management investment company organized as a Massachusetts business trust. Shares of the Fund may only be purchased by insurance companies for the purpose of funding variable annuity or variable life insurance contracts. The Fund offers the following classes of shares: Initial Class shares and Investor Class shares. All classes have equal rights and voting privileges, except for matters affecting a single class. Investment income, realized and unrealized capital gains and losses, the common expenses of the Fund, and certain fund-level expense reductions, if any, are allocated on a pro rata basis to each class based on the relative net assets of each class to the total net assets of the Fund. Each class differs with respect to transfer agent fees incurred. Certain expense reductions also differ by class.
The Fund's investments in emerging markets can be subject to social, economic, regulatory, and political uncertainties and can be extremely volatile. The Fund may invest in Fidelity Central Funds which are open-end investment companies available to investment companies and other accounts managed by Fidelity Management & Research Company (FMR) and its affiliates. The financial statements have been prepared in conformity with accounting principles generally accepted in the United States of America, which require management to make certain estimates and assumptions at the date of the financial statements. The following summarizes the significant accounting policies of the Fund, which are also consistently followed by the Fidelity Central Funds:
Security Valuation. Investments are valued and net asset value (NAV) per share is calculated (NAV calculation) as of the close of business of the New York Stock Exchange (NYSE), normally 4:00 p.m. Eastern time. Wherever possible, the Fund uses independent pricing services approved by the Board of Trustees to value its investments.
Equity securities, including restricted securities, for which market quotations are readily available, are valued at the last reported sale price or official closing price as reported by an independent pricing service on the primary market or exchange on which they are traded. In the event there were no sales during the day or closing prices are not available, securities are valued at the last quoted bid price. Debt securities, including restricted securities, for which quotations are readily available, are valued by independent pricing services or by dealers who make markets in such securities. Pricing services consider yield or price of bonds of comparable quality, coupon, maturity and type as well as dealer supplied prices. Investments in open-end mutual funds, including the Fidelity Central Funds, are valued at their closing net asset value each business day. Short-term securities with remaining maturities of sixty days or less for which quotations are not readily available are valued at amortized cost, which approximates value.
When current market prices or quotations are not readily available or do not accurately reflect fair value, valuations may be determined in accordance with procedures adopted by the Board of Trustees. For example, when developments occur between the close of a market and the close of the NYSE that may materially affect the value of some or all of the securities, or when trading in a security is halted, those securities may be fair valued. Factors used in the determination of fair value may include monitoring news to identify significant market or security specific events such as changes in the value of U.S. securities markets, reviewing developments in foreign markets and evaluating the performance of ADRs, futures contracts and exchange-traded funds. Because the Fund's utilization of fair value pricing depends on market activity, the frequency with which fair value pricing is used can not be predicted and may be utilized to a significant extent. The value of securities used for NAV calculation under fair value pricing may differ from published prices for the same securities.
Foreign Currency. The Fund uses foreign currency contracts to facilitate transactions in foreign-denominated securities. Losses from these transactions may arise from changes in the value of the foreign currency or if the counterparties do not perform under the contracts' terms.
Foreign-denominated assets, including investment securities, and liabilities are translated into U.S. dollars at the exchange rate at period end. Purchases and sales of investment securities, income and dividends received and expenses denominated in foreign currencies are translated into U.S. dollars at the exchange rate in effect on the transaction date.
The effects of exchange rate fluctuations on investments are included with the net realized and unrealized gain (loss) on investment securities. Other foreign currency transactions resulting in realized and unrealized gain (loss) are disclosed separately.
Investment Transactions and Income. Security transactions, including the Fund's investment activity in the Fidelity Central Funds, are accounted for as of trade date. Gains and losses on securities sold are determined on the basis of identified cost and may include proceeds received from litigation. Dividend income is recorded on the ex-dividend date, except for certain dividends from foreign securities where the ex-dividend date may have passed, which are recorded as soon as the Fund is informed of the ex-dividend date. Non-cash dividends included in dividend income, if any, are recorded at the fair market value of the securities received.
Annual Report
Notes to Financial Statements - continued
1. Significant Accounting Policies - continued
Investment Transactions and Income - continued
Distributions received on securities that represent a return of capital or capital gain are recorded as a reduction of cost of investments and/or as a realized gain. The Fund estimates the components of distributions received that may be considered return of capital distributions or capital gain distributions. Interest income and income distributions from the Fidelity Central Funds are accrued as earned, with any income distributions receivable as of period end included in Interest Receivable on the Statement of Assets and Liabilities. Interest income includes coupon interest and amortization of premium and accretion of discount on debt securities. Investment income is recorded net of foreign taxes withheld where recovery of such taxes is uncertain.
Expenses. Most expenses of the trust can be directly attributed to a fund. Expenses which cannot be directly attributed are apportioned among each Fund in the trust. Expense estimates are accrued in the period to which they relate and adjustments are made when actual amounts are known.
Income Tax Information and Distributions to Shareholders. Each year, the Fund intends to qualify as a regulated investment company by distributing all of its taxable income and realized gains under Subchapter M of the Internal Revenue Code. As a result, no provision for income taxes is required in the accompanying financial statements. Foreign taxes are provided for based on the Fund's understanding of the tax rules and rates that exist in the foreign markets in which it invests.
Distributions are recorded on the ex-dividend date. Income dividends and capital gain distributions are declared separately for each class. Income and capital gain distributions are determined in accordance with income tax regulations, which may differ from generally accepted accounting principles. In addition, the Fund will claim a portion of the payment made to redeeming shareholders as a distribution for income tax purposes.
Capital accounts within the financial statements are adjusted for permanent book-tax differences. These adjustments have no impact on net assets or the results of operations. Temporary book-tax differences will reverse in a subsequent period.
Book-tax differences are primarily due to foreign currency transactions, net operating losses and losses deferred due to wash sales.
The tax-basis components of distributable earnings and the federal tax cost as of period end were as follows:
Unrealized appreciation | $ 12,988,276 | |
Unrealized depreciation | (3,458,743) | |
Net unrealized appreciation (depreciation) | 9,529,533 | |
Undistributed ordinary income | 3,672,437 | |
Undistributed long-term capital gain | 2,419,486 | |
| | |
Cost for federal income tax purposes | $ 73,259,295 | |
The tax character of distributions paid was as follows:
| December 31, 2006 | December 31, 2005 |
Ordinary Income | $ - | $ 365,699 |
Long-term Capital Gains | 7,082,577 | - |
Total | $ 7,082,577 | $ 365,699 |
Trading (Redemption) Fees. Shares held less than 60 days are subject to a redemption fee equal to 1% of the proceeds of the redeemed shares. All redemption fees, including any estimated redemption fees paid by FMR, are retained by the Fund and accounted for as an addition to paid in capital.
New Accounting Pronouncements. In July 2006, Financial Accounting Standards Board Interpretation No. 48, Accounting for Uncertainty in Income Taxes - an interpretation of FASB Statement 109 (FIN 48), was issued and is effective on the last business day of the semiannual reporting period for fiscal years beginning after December 15, 2006. FIN 48 sets forth a threshold for financial statement recognition, measurement and disclosure of a tax position taken or expected to be taken on a tax return. Management is currently evaluating the impact, if any, the adoption of FIN 48 will have on the Fund's net assets, results of operations and financial statement disclosures.
In addition, in September 2006, Statement of Financial Accounting Standards No. 157, Fair Value Measurements (SFAS 157), was issued and is effective for fiscal years beginning after November 15, 2007. SFAS 157 defines fair value, establishes a framework for measuring fair value and expands disclosures about fair value measurements. Management is currently evaluating the impact the adoption of SFAS 157 will have on the Fund's financial statement disclosures.
VIP Technology Portfolio
2. Operating Policies.
Repurchase Agreements. FMR has received an Exemptive Order from the Securities and Exchange Commission (the SEC) which permits the Fund and other affiliated entities of FMR to transfer uninvested cash balances into joint trading accounts which are then invested in repurchase agreements. The Fund may also invest directly with institutions in repurchase agreements. Repurchase agreements are collateralized by government or non-government securities. Upon settlement date, collateral is held in segregated accounts with custodian banks and may be obtained in the event of a default of the counterparty. The Fund monitors, on a daily basis, the value of the collateral to ensure it is at least equal to the principal amount of the repurchase agreement (including accrued interest). In the event of a default by the counterparty, realization of the collateral proceeds could be delayed, during which time the value of the collateral may decline.
3. Purchases and Sales of Investments.
Purchases and sales of securities, other than short-term securities, aggregated $231,352,912 and $239,465,444, respectively.
4. Fees and Other Transactions with Affiliates.
Management Fee. FMR and its affiliates provide the Fund with investment management related services for which the Fund pays a monthly management fee. The management fee is the sum of an individual fund fee rate that is based on an annual rate of .30% of the Fund's average net assets and a group fee rate that averaged .27% during the period. The group fee rate is based upon the average net assets of all the mutual funds advised by FMR. The group fee rate decreases as assets under management increase and increases as assets under management decrease. For the period, the total annual management fee rate was .57% of the Fund's average net assets.
Transfer Agent Fees. Fidelity Investments Institutional Operations Company, Inc. (FIIOC), an affiliate of FMR, is the fund's transfer, dividend disbursing, and shareholder servicing agent. FIIOC receives an asset-based fee with respect to each class. Each class with the exception of Investor Class pays a transfer agent fee, excluding out of pocket expenses, equal to an annual rate of .07% of their month end net assets. Investor Class pays a monthly asset-based transfer agent fee of .18% of its month end net assets. The total transfer agent fees paid by each class to FIIOC, including out of pocket expenses, were as follows:
Initial Class | $ 53,719 |
Investor Class | 22,873 |
| $ 76,592 |
Accounting and Security Lending Fees. Fidelity Service Company, Inc. (FSC), an affiliate of FMR, maintains the Fund's accounting records. The accounting fee is based on the level of average net assets for the month. Under a separate contract, FSC administers the security lending program. The security lending fee is based on the number and duration of lending transactions.
Investments in Fidelity Central Funds. The Fund may invest in Fidelity Central Funds. The Fund's Schedule of Investments lists each of the Fidelity Central Funds as an investment of the Fund but does not include the underlying holdings of each Fidelity Central Fund. As an Investing Fund, the Fund indirectly bears its proportionate share of the expenses of the underlying Fidelity Central Funds. A complete unaudited list of holdings for each Fidelity Central Fund is available upon request. In addition, the financial statements of the Fidelity Central Funds, which are not covered by the Fund's Report of Independent Registered Public Accounting Firm, are available on the EDGAR Database on the SEC's web site, www.sec.gov, or upon request.
The Money Market Central Funds seek preservation of capital and current income and are managed by Fidelity Investments Money Management, Inc. (FIMM), an affiliate of FMR.
Brokerage Commissions. The Fund placed a portion of its portfolio transactions with brokerage firms which are affiliates of the investment adviser. The commissions paid to these affiliated firms were $13,434 for the period.
5. Committed Line of Credit.
The Fund participates with other funds managed by FMR in a $4.2 billion credit facility (the "line of credit") to be utilized for temporary or emergency purposes to fund shareholder redemptions or for other short-term liquidity purposes. The Fund has agreed to pay commitment fees on its pro rata portion of the line of credit, which amounted to $239 and is reflected in Miscellaneous Expense on the Statement of Operations. During the period, there were no borrowings on this line of credit.
Annual Report
Notes to Financial Statements - continued
6. Security Lending.
The Fund lends portfolio securities from time to time in order to earn additional income. On the settlement date of the loan, the Fund receives collateral (in the form of U.S. Treasury obligations, letters of credit and/or cash) against the loaned securities and maintains collateral in an amount not less than 100% of the market value of the loaned securities during the period of the loan. The market value of the loaned securities is determined at the close of business of the Fund and any additional required collateral is delivered to the Fund on the next business day. If the borrower defaults on its obligation to return the securities loaned because of insolvency or other reasons, a fund could experience delays and costs in recovering the securities loaned or in gaining access to the collateral. Any cash collateral received is invested in the Fidelity Securities Lending Cash Central Fund. The value of loaned securities and cash collateral at period end are disclosed on the Fund's Statement of Assets and Liabilities. Security lending income represents the income earned on investing cash collateral, less fees and expenses associated with the loan, plus any premium payments that may be received on the loan of certain types of securities. Security lending income is presented in the Statement of Operations as a component of income from Fidelity Central Funds.
7. Expense Reductions.
Many of the brokers with whom FMR places trades on behalf of the Fund provided services to the Fund in addition to trade execution. These services included payments of certain expenses on behalf of the Fund totaling $22,684 for the period.
8. Other.
The Fund's organizational documents provide former and current trustees and officers with a limited indemnification against liabilities arising in connection with the performance of their duties to the Fund. In the normal course of business, the Fund may also enter into contracts that provide general indemnifications. The Fund's maximum exposure under these arrangements is unknown as this would be dependent on future claims that may be made against the Fund. The risk of material loss from such claims is considered remote.
At the end of the period, FMR or its affiliates were the owners of record of 100% of the total outstanding shares of the fund.
The United States Securities and Exchange Commission ("SEC") is conducting an investigation of FMR (covering the years 2002 to 2004) arising from gifts, gratuities and business entertainment provided by certain brokers to certain individuals who were employed on FMR's domestic equity trading desk during that period. FMR is in discussions with the SEC staff regarding the possible resolution of the matter, but as of period-end no final resolution has been reached.
In December 2006, the Independent Trustees completed their own investigation of the matter with the assistance of independent counsel. The Independent Trustees and FMR agree that, despite the absence of proof that the Fidelity mutual funds experienced diminished execution quality as a result of the improper receipt of gifts and business entertainment, the conduct at issue was serious and is worthy of redress. Accordingly, the Independent Trustees have requested and FMR has agreed to pay $42 million to Fidelity mutual funds, plus interest to be determined at the time that payment is made. A method of allocating this payment among the funds has not yet been determined. The total payment to the Fund is not anticipated to have a material impact on the Fund's net assets. In addition, FMR reimbursed related legal expenses which are recorded in the accompanying Statement of Operations as an expense reduction.
9. Distributions to Shareholders.
Distributions to shareholders of each class were as follows:
| Years ended December 31, |
| 2006 | 2005 A |
From net investment income | | |
Initial Class | $ - | $ 365,699 |
From net realized gain | | |
Initial Class | 6,484,203 | - |
Investor Class | 598,374 | - |
Total | $ 7,082,577 | $ - |
A Distributions for Investor Class are for the period July 21, 2005 (commencement of sale of shares) to December 31, 2005.
VIP Technology Portfolio
10. Share Transactions.
Transactions for each class of shares were as follows:
| Shares | Dollars |
| Years ended December 31, | Years ended December 31, |
| 2006 | 2005 A | 2006 | 2005 A |
Initial Class | | | | |
Shares sold | 2,223,212 | 1,621,445 | $ 22,500,191 | $ 15,369,798 |
Reinvestment of distributions | 627,099 | 40,187 | 6,484,203 | 365,699 |
Shares redeemed | (4,236,430) | (6,504,388) | (41,717,781) | (58,554,599) |
Net increase (decrease) | (1,386,119) | (4,842,756) | $ (12,733,387) | $ (42,819,102) |
Investor Class | | | | |
Shares sold | 1,405,935 | 575,481 | $ 14,461,192 | $ 5,789,709 |
Reinvestment of distributions | 57,982 | - | 598,374 | - |
Shares redeemed | (484,054) | (13,279) | (4,602,399) | (130,060) |
Net increase (decrease) | 979,863 | 562,202 | $ 10,457,167 | $ 5,659,649 |
A Share transactions for Investor Class are for the period July 21, 2005 (commencement of sale of shares) to December 31, 2005.
Annual Report
Report of Independent Registered Public Accounting Firm
To the Trustees of Variable Insurance Products Fund IV and the Shareholders of VIP Technology Portfolio:
In our opinion, the accompanying statement of assets and liabilities, including the schedule of investments, and the related statements of operations and of changes in net assets and the financial highlights present fairly, in all material respects, the financial position of VIP Technology Portfolio (a fund of Variable Insurance Products Fund IV) at December 31, 2006, the results of its operations for the year then ended, the changes in its net assets for each of the two years in the period then ended and the financial highlights for each of the periods indicated, in conformity with accounting principles generally accepted in the United States of America. These financial statements and financial highlights (hereafter referred to as "financial statements") are the responsibility of the VIP Technology Portfolio's management; our responsibility is to express an opinion on these financial statements based on our audits. We conducted our audits of these financial statements in accordance with the standards of the Public Company Accounting Oversight Board (United States). Those standards require that we plan and perform the audit to obtain reasonable assurance about whether the financial statements are free of material misstatement. An audit includes examining, on a test basis, evidence supporting the amounts and disclosures in the financial statements, assessing the accounting principles used and significant estimates made by management, and evaluating the overall financial statement presentation. We believe that our audits, which included confirmation of securities at December 31, 2006 by correspondence with the custodian and brokers, provide a reasonable basis for our opinion.
/s/ PricewaterhouseCoopers LLP
PricewaterhouseCoopers LLP
Boston, Massachusetts
February 12, 2007
VIP Technology Portfolio
Trustees and Officers
The Trustees, Member of the Advisory Board, and executive officers of the trust and fund, as applicable, are listed below. The Board of Trustees governs the fund and is responsible for protecting the interests of shareholders. The Trustees are experienced executives who meet periodically throughout the year to oversee the fund's activities, review contractual arrangements with companies that provide services to the fund, and review the fund's performance. Each of the Trustees oversees 348 funds advised by FMR or an affiliate.
The Trustees hold office without limit in time except that (a) any Trustee may resign; (b) any Trustee may be removed by written instrument, signed by at least two-thirds of the number of Trustees prior to such removal; (c) any Trustee who requests to be retired or who has become incapacitated by illness or injury may be retired by written instrument signed by a majority of the other Trustees; and (d) any Trustee may be removed at any special meeting of shareholders by a two-thirds vote of the outstanding voting securities of the trust. Each Trustee who is not an interested person (as defined in the 1940 Act) (Independent Trustee), shall retire not later than the last day of the calendar year in which his or her 72nd birthday occurs. The Independent Trustees may waive this mandatory retirement age policy with respect to individual Trustees. The executive officers and Advisory Board Member hold office without limit in time, except that any officer and Advisory Board Member may resign or may be removed by a vote of a majority of the Trustees at any regular meeting or any special meeting of the Trustees. Except as indicated, each individual has held the office shown or other offices in the same company for the past five years.
The fund's Statement of Additional Information (SAI) includes more information about the Trustees. To request a free copy, call Fidelity at 1-877-208-0098.
Interested Trustees*:
Correspondence intended for each Trustee who is an interested person may be sent to Fidelity Investments, 82 Devonshire Street, Boston, Massachusetts 02109.
Name, Age; Principal Occupation |
Edward C. Johnson 3d (76) |
| Year of Election or Appointment: 1983 Mr. Johnson is Chairman of the Board of Trustees. Mr. Johnson serves as President (2006-present), Chief Executive Officer, Chairman, and a Director of FMR Corp.; Chairman and a Director of FMR; Chairman and a Director of Fidelity Research & Analysis Company (FRAC); Chairman and a Director of Fidelity Investments Money Management, Inc.; and Chairman (2001-present) and a Director of FMR Co., Inc. In addition, Mr. Johnson serves as Chairman and Director of Fidelity International Limited (FIL). |
Robert L. Reynolds (54) |
| Year of Election or Appointment: 2003 Mr. Reynolds is President and a Director of FMR (2005-present), Fidelity Investments Money Management, Inc. (2005-present), and FMR Co., Inc. (2005-present). Mr. Reynolds also serves as Vice Chairman (2006-present), a Director (2003-present), and Chief Operating Officer of FMR Corp. and a Director of Strategic Advisers, Inc. (2005-present). He also serves on the Board at Fidelity Investments Canada, Ltd. |
* Trustees have been determined to be "Interested Trustees" by virtue of, among other things, their affiliation with the trust or various entities under common control with FMR.
Independent Trustees:
Correspondence intended for each Independent Trustee (that is, the Trustees other than the Interested Trustees) may be sent to Fidelity Investments, P.O. Box 55235, Boston, Massachusetts 02205-5235.
Name, Age; Principal Occupation |
Dennis J. Dirks (58) |
| Year of Election or Appointment: 2005 Prior to his retirement in May 2003, Mr. Dirks was Chief Operating Officer and a member of the Board of The Depository Trust & Clearing Corporation (DTCC) (1999-2003). He also served as President, Chief Operating Officer, and Board member of The Depository Trust Company (DTC) (1999-2003) and President and Board member of the National Securities Clearing Corporation (NSCC) (1999-2003). In addition, Mr. Dirks served as Chief Executive Officer and Board member of the Government Securities Clearing Corporation (2001-2003) and Chief Executive Officer and Board member of the Mortgage-Backed Securities Clearing Corporation (2001-2003). Mr. Dirks also serves as a Trustee and a member of the Finance Committee of Manhattan College (2005-present) and a Trustee and a member of the Finance Committee of AHRC of Nassau County (2006-present). |
Albert R. Gamper, Jr. (64) |
| Year of Election or Appointment: 2006 Prior to his retirement in December 2004, Mr. Gamper served as Chairman of the Board of CIT Group Inc. (commercial finance). During his tenure with CIT Group Inc. Mr. Gamper served in numerous senior management positions, including Chairman (1987-1989; 1999-2001; 2002-2004), Chief Executive Officer (1987-2004), and President (1989-2002). He currently serves as a member of the Board of Directors of Public Service Enterprise Group (utilities, 2001-present), Chairman of the Board of Governors, Rutgers University (2004-present), and Chairman of the Board of Saint Barnabas Health Care System. |
George H. Heilmeier (70) |
| Year of Election or Appointment: 2004 Dr. Heilmeier is Chairman Emeritus of Telcordia Technologies (communication software and systems), where prior to his retirement, he served as company Chairman and Chief Executive Officer. He currently serves on the Boards of Directors of The Mitre Corporation (systems engineering and information technology support for the government), and HRL Laboratories (private research and development, 2004-present). He is Chairman of the General Motors Science & Technology Advisory Board and a Life Fellow of the Institute of Electrical and Electronics Engineers (IEEE). Dr. Heilmeier is a member of the Defense Science Board and the National Security Agency Advisory Board. He is also a member of the National Academy of Engineering, the American Academy of Arts and Sciences, and the Board of Overseers of the School of Engineering and Applied Science of the University of Pennsylvania. Previously, Dr. Heilmeier served as a Director of TRW Inc. (automotive, space, defense, and information technology, 1992-2002), Compaq (1994-2002), Automatic Data Processing, Inc. (ADP) (technology-based business outsourcing, 1995-2002), INET Technologies Inc. (telecommunications network surveillance, 2001-2004), and Teletech Holdings (customer management services). He is the recipient of the 2005 Kyoto Prize in Advanced Technology for his invention of the liquid crystal display, and a member of the Consumer Electronics Hall of Fame. |
James H. Keyes (66) |
| Year of Election or Appointment: 2007 Prior to his retirement in 2003, Mr. Keyes was Chairman, President, and Chief Executive Officer of Johnson Controls, Inc. (automotive supplier, 1993-2003). He currently serves as a member of the boards of LSI Logic Corporation (semiconductor technologies), Navistar International Corporation (manufacture and sale of trucks, buses, and diesel engines, 2002-present), and Pitney Bowes, Inc. (integrated mail, messaging, and document management solutions). |
Marie L. Knowles (60) |
| Year of Election or Appointment: 2001 Prior to Ms. Knowles' retirement in June 2000, she served as Executive Vice President and Chief Financial Officer of Atlantic Richfield Company (ARCO) (diversified energy, 1996-2000). From 1993 to 1996, she was a Senior Vice President of ARCO and President of ARCO Transportation Company. She served as a Director of ARCO from 1996 to 1998. She currently serves as a Director of Phelps Dodge Corporation (copper mining and manufacturing) and McKesson Corporation (healthcare service, 2002-present). Ms. Knowles is a Trustee of the Brookings Institution and the Catalina Island Conservancy and also serves as a member of the Advisory Board for the School of Engineering of the University of Southern California. |
Ned C. Lautenbach (62) |
| Year of Election or Appointment: 2000 Mr. Lautenbach is Chairman of the Independent Trustees (2006-present). Mr. Lautenbach has been a partner of Clayton, Dubilier & Rice, Inc. (private equity investment firm) since September 1998. Previously, Mr. Lautenbach was with the International Business Machines Corporation (IBM) from 1968 until his retirement in 1998. Mr. Lautenbach serves as a Director of Sony Corporation (2006-present) and Eaton Corporation (diversified industrial) as well as the Philharmonic Center for the Arts in Naples, Florida. He also is a member of the Board of Trustees of Fairfield University (2005-present), as well as a member of the Council on Foreign Relations. |
Cornelia M. Small (62) |
| Year of Election or Appointment: 2005 Ms. Small is a member (2000-present) and Chairperson (2002-present) of the Investment Committee, and a member (2002-present) of the Board of Trustees of Smith College. Previously, she served as Chief Investment Officer (1999-2000), Director of Global Equity Investments (1996-1999), and a member of the Board of Directors of Scudder, Stevens & Clark (1990-1997) and Scudder Kemper Investments (1997-1999). In addition, Ms. Small served as Co-Chair (2000-2003) of the Annual Fund for the Fletcher School of Law and Diplomacy. |
William S. Stavropoulos (67) |
| Year of Election or Appointment: 2001 Mr. Stavropoulos is Chairman Emeritus of the Board of Directors of The Dow Chemical Company. Since joining The Dow Chemical Company in 1967, Mr. Stavropoulos served in numerous senior management positions, including President (1993-2000; 2002-2003), CEO (1995-2000; 2002-2004), and Chairman of the Executive Committee (2000-2004). Currently, he is a Director of NCR Corporation (data warehousing and technology solutions), BellSouth Corporation (telecommunications), Chemical Financial Corporation, Maersk Inc. (industrial conglomerate, 2002-present), and Metalmark Capital (private equity investment firm, 2005-present). He also serves as a member of the Board of Trustees of the American Enterprise Institute for Public Policy Research. In addition, Mr. Stavropoulos is a member of The Business Council, J.P. Morgan International Council and the University of Notre Dame Advisory Council for the College of Science. |
Kenneth L. Wolfe (67) |
| Year of Election or Appointment: 2005 Prior to his retirement in 2001, Mr. Wolfe was Chairman and Chief Executive Officer of Hershey Foods Corporation (1993-2001). He currently serves as a member of the boards of Adelphia Communications Corporation (2003-present), Bausch & Lomb, Inc., and Revlon Inc. (2004-present). |
Advisory Board Member and Executive Officers:
Correspondence intended for each executive officer and Mr. Lynch may be sent to Fidelity Investments, 82 Devonshire Street, Boston, Massachusetts 02109.
Name, Age; Principal Occupation |
Peter S. Lynch (62) |
| Year of Election or Appointment: 2003 Member of the Advisory Board of Variable Insurance Products Fund IV. Mr. Lynch is Vice Chairman and a Director of FMR, and Vice Chairman (2001-present) and a Director of FMR Co., Inc. Previously, Mr. Lynch served as a Trustee of the Fidelity funds (1990-2003). In addition, he serves as a Trustee of Boston College and as the Chairman of the Inner-City Scholarship Fund. |
Kimberley H. Monasterio (43) |
| Year of Election or Appointment: 2007 President and Treasurer of VIP Technology. Ms. Monasterio also serves as President and Treasurer of other Fidelity funds (2007-present) and is an employee of FMR (2004-present). Previously, Ms. Monasterio served as Deputy Treasurer of the Fidelity funds (2004-2006). Before joining Fidelity Investments, Ms. Monasterio served as Treasurer (2000-2004) and Chief Financial Officer (2002-2004) of the Franklin Templeton Funds and Senior Vice President of Franklin Templeton Services, LLC (2000-2004). |
Boyce I. Greer (50) |
| Year of Election or Appointment: 2005 Vice President of VIP Technology. Mr. Greer also serves as Vice President of certain Equity Funds (2005-present), certain Asset Allocation Funds (2005-present), Fixed-Income Funds (2006-present), and Money Market Funds (2006-present). Mr. Greer is also a Trustee of other investment companies advised by FMR (2003-present). He is an Executive Vice President of FMR (2005-present) and FMR Co., Inc. (2005-present), and Senior Vice President of Fidelity Investments Money Management, Inc. (2006-present). Previously, Mr. Greer served as a Director and Managing Director of Strategic Advisers, Inc. (2002-2005), and Executive Vice President (2000-2002) and Money Market Group Leader (1997-2002) of the Fidelity Investments Fixed Income Division. He also served as Vice President of Fidelity's Money Market Funds (1997-2002), Senior Vice President of FMR (1997-2002), and Vice President of FIMM (1998-2002). |
Eric D. Roiter (58) |
| Year of Election or Appointment: 2001 Secretary of VIP Technology. He also serves as Secretary of other Fidelity funds; Vice President, General Counsel, and Secretary of FMR Co., Inc. (2001-present) and FMR; Assistant Secretary of Fidelity Management & Research (U.K.) Inc. (2001-present), Fidelity Research & Analysis Company (2001-present), and Fidelity Investments Money Management, Inc. (2001-present). Mr. Roiter is an Adjunct Member, Faculty of Law, at Boston College Law School (2003-present). Previously, Mr. Roiter served as Vice President and Secretary of Fidelity Distributors Corporation (FDC) (1998-2005). |
Stuart Fross (47) |
| Year of Election or Appointment: 2003 Assistant Secretary of VIP Technology. Mr. Fross also serves as Assistant Secretary of other Fidelity funds (2003-present), Vice President and Secretary of FDC (2005-present), and is an employee of FMR. |
R. Stephen Ganis (40) |
| Year of Election or Appointment: 2006 Anti-Money Laundering (AML) officer of VIP Technology. Mr. Ganis also serves as AML officer of other Fidelity funds (2006-present) and FMR Corp. (2003-present). Before joining Fidelity Investments, Mr. Ganis practiced law at Goodwin Procter, LLP (2000-2002). |
Joseph B. Hollis (58) |
| Year of Election or Appointment: 2006 Chief Financial Officer of VIP Technology. Mr. Hollis also serves as Chief Financial Officer of other Fidelity funds. Mr. Hollis is President of Fidelity Pricing and Cash Management Services (FPCMS) (2005-present). Mr. Hollis also serves as President and Director of Fidelity Service Company, Inc. (2006-present). Previously, Mr. Hollis served as Senior Vice President of Cash Management Services (1999-2002) and Investment Management Operations (2002-2005). |
Kenneth A. Rathgeber (59) |
| Year of Election or Appointment: 2004 Chief Compliance Officer of VIP Technology. Mr. Rathgeber also serves as Chief Compliance Officer of other Fidelity funds (2004-present) and Executive Vice President of Risk Oversight for Fidelity Investments (2002-present). He is Chief Compliance Officer of FMR (2005-present), FMR Co., Inc. (2005-present), Fidelity Management & Research (U.K.) Inc. (2005-present), Fidelity Research & Analysis Company (2005-present), Fidelity Investments Money Management, Inc. (2005-present), and Strategic Advisers, Inc. (2005-present). Previously, Mr. Rathgeber served as Executive Vice President and Chief Operating Officer for Fidelity Investments Institutional Services Company, Inc. (1998-2002). |
Bryan A. Mehrmann (45) |
| Year of Election or Appointment: 2005 Deputy Treasurer of VIP Technology. Mr. Mehrmann also serves as Deputy Treasurer of other Fidelity funds (2005-present) and is an employee of FMR. Previously, Mr. Mehrmann served as Vice President of Fidelity Investments Institutional Services Group (FIIS)/Fidelity Investments Institutional Operations Corporation, Inc. (FIIOC) Client Services (1998-2004). |
Kenneth B. Robins (37) |
| Year of Election or Appointment: 2005 Deputy Treasurer of VIP Technology. Mr. Robins also serves as Deputy Treasurer of other Fidelity funds (2005-present) and is an employee of FMR (2004-present). Before joining Fidelity Investments, Mr. Robins worked at KPMG LLP, where he was a partner in KPMG's department of professional practice (2002-2004) and a Senior Manager (1999-2000). In addition, Mr. Robins served as Assistant Chief Accountant, United States Securities and Exchange Commission (2000-2002). |
Robert G. Byrnes (40) |
| Year of Election or Appointment: 2005 Assistant Treasurer of VIP Technology. Mr. Byrnes also serves as Assistant Treasurer of other Fidelity funds (2005-present) and is an employee of FMR (2005-present). Previously, Mr. Byrnes served as Vice President of FPCMS (2003-2005). Before joining Fidelity Investments, Mr. Byrnes worked at Deutsche Asset Management where he served as Vice President of the Investment Operations Group (2000-2003). |
John H. Costello (60) |
| Year of Election or Appointment: 1991 Assistant Treasurer of VIP Technology. Mr. Costello also serves as Assistant Treasurer of other Fidelity funds and is an employee of FMR. |
Peter L. Lydecker (52) |
| Year of Election or Appointment: 2004 Assistant Treasurer of VIP Technology. Mr. Lydecker also serves as Assistant Treasurer of other Fidelity funds (2004) and is an employee of FMR. |
Mark Osterheld (51) |
| Year of Election or Appointment: 2002 Assistant Treasurer of VIP Technology. Mr. Osterheld also serves as Assistant Treasurer of other Fidelity funds (2002) and is an employee of FMR. |
Gary W. Ryan (48) |
| Year of Election or Appointment: 2005 Assistant Treasurer of VIP Technology. Mr. Ryan also serves as Assistant Treasurer of other Fidelity funds (2005-present) and is an employee of FMR (2005-present). Previously, Mr. Ryan served as Vice President of Fund Reporting in FPCMS (1999-2005). |
Salvatore Schiavone (41) |
| Year of Election or Appointment: 2005 Assistant Treasurer of VIP Technology. Mr. Schiavone also serves as Assistant Treasurer of other Fidelity funds (2005-present) and is an employee of FMR (2005-present). Before joining Fidelity Investments, Mr. Schiavone worked at Deutsche Asset Management, where he most recently served as Assistant Treasurer (2003-2005) of the Scudder Funds and Vice President and Head of Fund Reporting (1996-2003). |
Annual Report
Distributions
The Board of Trustees of VIP Technology Portfolio voted to pay to shareholders of record at the opening of business on record date, the following distributions per share derived from capital gains realized from sales of portfolio securities:
Fund | Pay Date | Record Date | Capital Gains |
Initial Class | 02/09/07 | 02/09/07 | $0.828 |
Investor Class | 02/09/07 | 02/09/07 | $0.824 |
The fund hereby designates as a capital gain dividend with respect to the taxable year ended December 31, 2006, $2,463,077, or, if subsequently determined to be different, the net capital gain of such year.
The fund will notify shareholders in January 2007 of amounts for use in preparing 2006 income tax returns.
VIP Technology Portfolio
Proxy Voting Results
A special meeting of the fund's shareholders was held on September 20, 2006. The results of votes taken among shareholders on the proposal before them are reported below. Each vote reported represents one dollar of net asset value held on the record date for the meeting.
PROPOSAL 1 |
To elect a Board of Trustees.A |
| # of
Votes | % of
Votes |
Dennis J. Dirks |
Affirmative | 92,459,317.52 | 96.102 |
Withheld | 3,749,837.05 | 3.898 |
TOTAL | 96,209,154.57 | 100.000 |
Albert R. Gamper, Jr. |
Affirmative | 92,260,598.99 | 95.896 |
Withheld | 3,948,555.58 | 4.104 |
TOTAL | 96,209,154.57 | 100.000 |
Robert M. Gates |
Affirmative | 92,315,480.72 | 95.953 |
Withheld | 3,893,673.85 | 4.047 |
TOTAL | 96,209,154.57 | 100.000 |
George H. Heilmeier |
Affirmative | 92,208,255.41 | 95.841 |
Withheld | 4,000,899.16 | 4.159 |
TOTAL | 96,209,154.57 | 100.000 |
Edward C. Johnson 3d |
Affirmative | 91,928,267.76 | 95.550 |
Withheld | 4,280,886.81 | 4.450 |
TOTAL | 96,209,154.57 | 100.000 |
Stephen P. Jonas |
Affirmative | 92,457,628.76 | 96.101 |
Withheld | 3,751,525.81 | 3.899 |
TOTAL | 96,209,154.57 | 100.000 |
James H. KeyesB |
Affirmative | 92,432,729.82 | 96.075 |
Withheld | 3,776,424.75 | 3.925 |
TOTAL | 96,209,154.57 | 100.000 |
Marie L. Knowles |
Affirmative | 92,398,847.52 | 96.040 |
Withheld | 3,810,307.05 | 3.960 |
TOTAL | 96,209,154.57 | 100.000 |
Ned C. Lautenbach |
Affirmative | 92,423,184.47 | 96.065 |
Withheld | 3,785,970.10 | 3.935 |
TOTAL | 96,209,154.57 | 100.000 |
William O. McCoy |
Affirmative | 92,086,293.90 | 95.715 |
Withheld | 4,122,860.67 | 4.285 |
TOTAL | 96,209,154.57 | 100.000 |
| # of
Votes | % of
Votes |
Robert L. Reynolds |
Affirmative | 92,439,032.86 | 96.081 |
Withheld | 3,770,121.71 | 3.919 |
TOTAL | 96,209,154.57 | 100.000 |
Cornelia M. Small |
Affirmative | 92,415,567.29 | 96.057 |
Withheld | 3,793,587.28 | 3.943 |
TOTAL | 96,209,154.57 | 100.000 |
William S. Stavropoulos |
Affirmative | 92,135,400.08 | 95.766 |
Withheld | 4,073,754.49 | 4.234 |
TOTAL | 96,209,154.57 | 100.000 |
Kenneth L. Wolfe |
Affirmative | 92,445,865.31 | 96.088 |
Withheld | 3,763,289.26 | 3.912 |
TOTAL | 96,209,154.57 | 100.000 |
A Denotes trust-wide proposal and voting results. B Effective on or about January 1, 2007. |
Annual Report
Board Approval of Investment Advisory Contracts and Management Fees
VIP Technology Portfolio
Each year, typically in July, the Board of Trustees, including the Independent Trustees (together, the Board), votes on the renewal of the management contract and sub-advisory agreements (together, the Advisory Contracts) for the fund. The Board, assisted by the advice of fund counsel and Independent Trustees' counsel, requests and considers a broad range of information throughout the year.
The Board meets regularly each month except August and takes into account throughout the year matters bearing on Advisory Contracts. The Board, acting directly and through its separate committees, considers at each of its meetings factors that are relevant to the annual renewal of the fund's Advisory Contracts, including the services and support provided to the fund and its shareholders. At the time of the renewal, the Board had 12 standing committees, each composed of Independent Trustees with varying backgrounds, to which the Board has assigned specific subject matter responsibilities in order to enhance effective decision-making by the Board. Each committee has adopted a written charter outlining the structure and purposes of the committee. One such committee, the Equity Contract Committee, meets periodically as needed throughout the year to consider matters specifically related to the annual renewal of Advisory Contracts. The committee requests and receives information on, and makes recommendations to the Independent Trustees concerning, the approval and annual review of the Advisory Contracts.
At its July 2006 meeting, the Board of Trustees, including the Independent Trustees, unanimously determined to renew the Advisory Contracts for the fund. In reaching its determination, the Board considered all factors it believed relevant, including (i) the nature, extent, and quality of the services to be provided to the fund and its shareholders (including the investment performance of the fund); (ii) the competitiveness of the management fee and total expenses of the fund; (iii) the total costs of the services to be provided by and the profits to be realized by the investment adviser and its affiliates from the relationship with the fund; (iv) the extent to which economies of scale would be realized as the fund grows; and (v) whether fee levels reflect these economies of scale, if any, for the benefit of fund shareholders.
In determining whether to renew the Advisory Contracts for the fund, the Board ultimately reached a determination, with the assistance of fund counsel and Independent Trustees' counsel, that the renewal of the Advisory Contracts and the compensation to be received by Fidelity under the management contract is consistent with Fidelity's fiduciary duty under applicable law. In addition to evaluating the specific factors noted above, the Board, in reaching its determination, is aware that shareholders in the fund have a broad range of investment choices available to them, including a wide choice among mutual funds offered by competitors to Fidelity, and that the fund's shareholders, with the opportunity to review and weigh the disclosure provided by the fund in its prospectus and other public disclosures, have chosen to invest in this fund, managed by Fidelity.
Nature, Extent, and Quality of Services Provided. The Board considered staffing within the investment adviser, FMR, and the sub-advisers (together, the Investment Advisers), including the background of the fund's portfolio manager and the fund's investment objective and discipline. The Independent Trustees also had discussions with senior management of Fidelity's investment operations and investment groups. The Board considered the structure of the portfolio manager compensation program and whether this structure provides appropriate incentives.
Resources Dedicated to Investment Management and Support Services. The Board reviewed the size, education, and experience of the Investment Advisers' investment staff, their use of technology, and the Investment Advisers' approach to recruiting, training, and retaining portfolio managers and other research, advisory, and management personnel. The Board considered Fidelity's extensive global research capabilities that enable the Investment Advisers to aggregate data from various sources in an effort to produce positive investment results. The Board noted that Fidelity's analysts have access to a variety of technological tools that enable them to perform both fundamental and quantitative analysis and to specialize in various disciplines. The Board also considered that Fidelity's portfolio managers and analysts have access to daily portfolio attribution that allows for monitoring of a fund's portfolio, as well as an electronic communication system that provides immediate real-time access to research concerning issuers and credit enhancers.
Shareholder and Administrative Services. The Board considered (i) the nature, extent, quality, and cost of administrative, distribution, and shareholder services performed by the Investment Advisers and their affiliates under the Advisory Contracts and under separate agreements covering transfer agency, pricing and bookkeeping, and securities lending services for the fund; (ii) the nature and extent of the Investment Advisers' supervision of third party service providers, principally custodians and subcustodians; and (iii) the resources devoted to, and the record of compliance with, the fund's compliance policies and procedures. The Board reviewed the allocation of fund brokerage, including allocations to brokers affiliated with the Investment Advisers, the use of brokerage commissions to pay fund expenses, and the use of "soft" commission dollars to pay for research services. The Board also considered that Fidelity voluntarily pays for market data out of its own resources.
The Board noted that the growth of fund assets across the complex allows Fidelity to reinvest in the development of services designed to enhance the value or convenience of the Fidelity funds as investment vehicles. These services include 24-hour access to account information and market information through phone representatives and over the Internet, and investor education materials and asset allocation tools.
Investment in a Large Fund Family. The Board considered the benefits to shareholders of investing in a Fidelity fund, including the benefits of investing in a fund that is part of a large family of funds offering a variety of investment disciplines and providing for a large variety of mutual fund investor services. The Board noted that, since the last Advisory Contract renewals in July 2005, Fidelity has taken a number of actions that benefited particular funds, including (i) dedicating additional resources to investment research and to restructure the investment research teams; (ii) voluntarily entering into contractual arrangements with certain brokers pursuant to which Fidelity pays for research products and services separately out of its own resources, rather than bundling with fund commissions; (iii) launching the Fidelity Advantage Class of its five Spartan stock index funds and three Spartan bond index funds, which is a lower-fee class available to shareholders with higher account balances; (iv) contractually agreeing to impose expense limitations on Fidelity U.S. Bond Index Fund and reducing the fund's initial investment minimum; and (v) offering shareholders of each of the Fidelity Institutional Money Market Funds the privilege of exchanging shares of the fund for shares of other Fidelity funds.
VIP Technology Portfolio
Investment Performance and Compliance. The Board considered whether the fund has operated within its investment objective, as well as its record of compliance with its investment restrictions. It also reviewed the fund's absolute investment performance for Initial Class, as well as the fund's relative investment performance for Initial Class measured against (i) a Goldman Sachs index that reflects the market sector in which the fund invests, and (ii) a peer group of mutual funds over multiple periods. Because the fund had been in existence less than five calendar years, the following charts considered by the Board show, over the one- and three-year periods ended December 31, 2005, the cumulative total returns of Initial Class of the fund, the cumulative total returns of a Goldman Sachs index ("benchmark"), and a range of cumulative total returns of a peer group of mutual funds identified by Lipper Inc. as having an investment objective similar to that of the fund. (Investor Class of the fund had less than one year of performance as of December 31, 2005.) The box within each chart shows the 25th percentile return (bottom of box) and the 75th percentile return (top of box) of the Lipper peer group. Returns shown above the box are in the first quartile and returns shown below the box are in the fourth quartile. The percentage beaten number noted below each chart corresponds to the percentile box and represents the percentage of funds in the Lipper peer group whose performance was equal to or lower than that of Initial Class.
VIP Technology Portfolio
The Board reviewed the fund's relative investment performance against its Lipper peer group and stated that the performance of Initial Class of the fund was in the second quartile for the one-year period and the first quartile for the three-year period. The Board noted that FMR does not consider that Lipper peer group to be a meaningful comparison for the fund, however, because the peer group includes funds that focus on different industries and sectors than the fund. The Board also stated that the relative investment performance of Initial Class of the fund compared favorably to its benchmark for all the periods shown.
The Board considered that FMR has taken steps to refocus and strengthen equity research, equity portfolio management, and compliance. The Board noted with favor FMR's reorganization of its senior management team in 2005 and FMR's dedication of additional resources to investment research, and participated in the process that led to those changes.
Based on its review, and giving particular weight to the nature and quality of the resources dedicated by the Investment Advisers to maintain and improve relative performance, the Board concluded that the nature, extent, and quality of the services provided to the fund will benefit the fund's shareholders, particularly in light of the Board's view that the fund's shareholders benefit from investing in a fund that is part of a large family of funds offering a variety of investment disciplines and services.
Competitiveness of Management Fee and Total Fund Expenses. The Board considered the fund's management fee and total expenses compared to "mapped groups" of competitive funds and classes. Fidelity creates "mapped groups" by combining similar Lipper investment objective categories that have comparable management fee characteristics. Combining Lipper investment objective categories aids the Board's management fee and total expense comparisons by broadening the competitive group used for comparison and by reducing the number of universes to which various Fidelity funds are compared.
Annual Report
Board Approval of Investment Advisory Contracts and Management Fees - continued
The Board considered two proprietary management fee comparisons for the 12-month (or shorter) periods shown in the chart below. The group of Lipper funds used by the Board for management fee comparisons is referred to below as the "Total Mapped Group" and, for the reasons explained above, is broader than the Lipper peer group used by the Board for performance comparisons. The Total Mapped Group comparison focuses on a fund's standing relative to the total universe of comparable funds available to investors, in terms of gross management fees before expense reimbursements or caps. "TMG %" represents the percentage of funds in the Total Mapped Group that had management fees that were lower than the fund's. For example, a TMG % of 8% means that 92% of the funds in the Total Mapped Group had higher management fees than the fund. The "Asset-Size Peer Group" (ASPG) comparison focuses on a fund's standing relative to non-Fidelity funds similar in size to the fund within the Total Mapped Group. The ASPG represents at least 15% of the funds in the Total Mapped Group with comparable asset size and management fee characteristics, subject to a minimum of 50 funds (or all funds in the Total Mapped Group if fewer than 50). Additional information, such as the ASPG quartile in which the fund's management fee ranked, is also included in the chart and considered by the Board.
VIP Technology Portfolio

The Board noted that the fund's management fee ranked below the median of its Total Mapped Group and below the median of its ASPG for 2005.
Based on its review, the Board concluded that the fund's management fee was fair and reasonable in light of the services that the fund receives and the other factors considered.
In its review of each class's total expenses, the Board considered the fund's management fee as well as other fund or class expenses, as applicable, such as transfer agent fees, pricing and bookkeeping fees, and custodial, legal, and audit fees. The Board also noted the effects of any waivers and reimbursements on fees and expenses. As part of its review, the Board also considered current and historical total expenses of each class of the fund compared to competitive fund median expenses. Each class of the fund is compared to those funds and classes in the Total Mapped Group (used by the Board for management fee comparisons) that have a similar sales load structure.
The Board noted that the total expenses of each class ranked below its competitive median for 2005.
In its review of total expenses, the Board also considered Fidelity fee structures and other information on clients that FMR and its affiliates service in other competitive markets, such as other mutual funds advised or subadvised by FMR or its affiliates, pension plan clients, and other institutional clients.
Based on its review, the Board concluded that the total expenses of each class of the fund were reasonable in light of the services that the fund and its shareholders receive and the other factors considered.
Costs of the Services and Profitability. The Board considered the revenues earned and the expenses incurred by Fidelity in conducting the business of developing, marketing, distributing, managing, administering and servicing the fund and its shareholders. The Board also considered the level of Fidelity's profits in respect of all the Fidelity funds.
VIP Technology Portfolio
On an annual basis, FMR presents to the Board Fidelity's profitability for the fund. Fidelity calculates the profitability for each fund, as well as aggregate profitability for groups of Fidelity funds and all Fidelity funds, using a series of detailed revenue and cost allocation methodologies which originate with the audited books and records of Fidelity. The Audit Committee of the Board reviews any significant changes from the prior year's methodologies.
PricewaterhouseCoopers LLP (PwC), independent registered accounting firm and auditor to Fidelity and certain Fidelity funds, has been engaged annually by the Board as part of the Board's assessment of the results of Fidelity's profitability analysis. PwC's engagement includes the review and assessment of Fidelity's methodologies used in determining the revenues and expenses attributable to Fidelity's mutual fund business, and completion of agreed-upon procedures surrounding the mathematical accuracy of fund profitability and its conformity to allocation methodologies. After considering PwC's reports issued under the engagement and information provided by Fidelity, the Board believes that while other allocation methods may also be reasonable, Fidelity's profitability methodologies are reasonable in all material respects.
The Board has also reviewed Fidelity's non-fund businesses and any fall-out benefits related to the mutual fund business as well as cases where Fidelity's affiliates may benefit from or be related to the fund's business.
The Board considered the costs of the services provided by and the profits realized by Fidelity in connection with the operation of the fund and determined that the amount of profit is a fair entrepreneurial profit for the management of the fund.
Economies of Scale. The Board considered whether there have been economies of scale in respect of the management of the Fidelity funds, whether the Fidelity funds (including the fund) have appropriately benefited from any such economies of scale, and whether there is potential for realization of any further economies of scale. The Board considered the extent to which the fund will benefit from economies of scale through increased services to the fund, through waivers or reimbursements, or through fee or expense reductions.
The Board recognized that the fund's management contract incorporates a "group fee" structure, which provides for lower fee rates as total fund assets under FMR's management increase, and for higher fee rates as total fund assets under FMR's management decrease. The Board considered that the group fee is designed to deliver the benefits of economies of scale to fund shareholders when total fund assets increase, even if assets of any particular fund are unchanged or have declined, because some portion of Fidelity's costs are attributable to services provided to all Fidelity funds, and all funds benefit if those costs can be allocated among more assets. The Board concluded that, given the group fee structure, fund shareholders will achieve a certain level of economies of scale as assets under FMR's management increase at the fund complex level, regardless of whether Fidelity achieves any such economies of scale.
The Board further concluded that any potential economies of scale are being shared between fund shareholders and Fidelity in an appropriate manner.
Additional Information Requested by the Board. In order to develop fully the factual basis for consideration of the Advisory Contracts, the Board requested additional information on several topics, including (i) Fidelity's fund profitability methodology and profitability trends within certain funds; (ii) portfolio manager compensation; (iii) the extent to which any economies of scale exist and are shared between the funds and Fidelity; (iv) the total expenses of certain funds and classes relative to competitors, including the extent to which the expenses of certain funds have been or could be capped; (v) fund performance trends; and (vi) Fidelity's fee structures, including use of performance fees.
Based on its evaluation of all of the conclusions noted above, and after considering all material factors, the Board ultimately concluded that the advisory fee structures are fair and reasonable, and that the fund's Advisory Contracts should be renewed.
Annual Report
Investment Adviser
Fidelity Management & Research Company
Boston, MA
Investment Sub-Advisers
FMR Co., Inc.
Fidelity Management & Research (U.K.) Inc.
Fidelity Research & Analysis Company (formerly Fidelity
Management & Research (Far East) Inc.)
Fidelity Investments Japan Limited
Fidelity International Investment Advisors
Fidelity International Investment Advisors
(U.K.) Limited
General Distributor
Fidelity Distributors Corporation
Boston, MA
Transfer and Service Agents
Fidelity Investments Institutional Operations Company, Inc.
Boston, MA
Fidelity Service Company, Inc.
Boston, MA
Custodian
JPMorgan Chase Bank
New York, NY
VTECIC-ANN-0207
1.817385.101
Fidelity® Variable Insurance Products:
Utilities Portfolio
(formerly Telecommunications & Utilities Growth Portfolio)
Annual Report
December 31, 2006
(2_fidelity_logos) (Registered_Trademark)
Contents
Note to Shareholders | <Click Here> | An explanation of the changes to the fund. |
Performance | <Click Here> | How the fund has done over time. |
Management's Discussion | <Click Here> | The manager's review of fund performance, strategy and outlook. |
Shareholder Expense Example | <Click Here> | An example of shareholder expenses. |
Investment Changes | <Click Here> | A summary of major shifts in the fund's investments over the past six months. |
Investments | <Click Here> | A complete list of the fund's investments with their
market values. |
Financial Statements | <Click Here> | Statements of assets and liabilities, operations, and
changes in net assets, as well as financial highlights. |
Notes | <Click Here> | Notes to the financial statements. |
Report of Independent Registered Public Accounting Firm | <Click Here> | |
Trustees and Officers | <Click Here> | |
Distributions | <Click Here> | |
Proxy Voting Results | <Click Here> | |
Board Approval of Investment Advisory Contracts and Management Fees | <Click Here> | |
| | |
To view a fund's proxy voting guidelines and proxy voting record for the 12-month period ended June 30, visit www.fidelity.com/proxyvotingresults or visit the Securities and Exchange Commission's (SEC) web site at www.sec.gov. You may also call 1-877-208-0098 to request a free copy of the proxy voting guidelines.
Fidelity Variable Insurance Products are separate account options which are purchased through a variable insurance contract.
Standard & Poor's, S&P and S&P 500 are registered service marks of The McGraw-Hill Companies, Inc. and have been licensed for use by Fidelity Distributors Corporation.
Other third party marks appearing herein are the property of their respective owners.
All other marks appearing herein are registered or unregistered trademarks or service marks of FMR Corp. or an affiliated company.
This report and the financial statements contained herein are submitted for the general information of the shareholders of the fund. This report is not authorized for distribution to prospective investors in the fund unless preceded or accompanied by an effective prospectus.
A fund files its complete schedule of portfolio holdings with the SEC for the first and third quarters of each fiscal year on Form N-Q. Forms N-Q are available on the SEC's web site at http://www.sec.gov. A fund's Forms N-Q may be reviewed and copied at the SEC's Public Reference Room in Washington, DC. Information regarding the operation of the SEC's Public Reference Room may be obtained by calling 1-800-SEC-0330. For a complete list of the fund's portfolio holdings, view the most recent quarterly holdings report, semiannual report, or annual report on Fidelity's web site at http://www.advisor.fidelity.com.
NOT FDIC INSURED · MAY LOSE VALUE · NO BANK GUARANTEE
Neither the fund nor Fidelity Distributors Corporation is a bank.
VIP Utilities Portfolio
VIP Utilities Portfolio
Note to Shareholders:
Effective October 1, 2006, Fidelity restructured the VIP Sector product line. The restructuring aligned the funds' investment goals more closely with standard industry classifications and facilitated adoption of more-specific benchmark indexes to evaluate fund performance. As restructured, the funds generally align under seven sectors in the widely recognized Global Industry Classification Standard (GICS), developed by Standard & Poor's® (S&P®) and Morgan Stanley Capital InternationalSM (MSCI®): Consumer Discretionary, Energy, Financials, Health Care, Industrials, Information Technology and Utilities. Changes to the funds ranged from simply adopting a new supplemental benchmark to, in some cases, changing investment policies and fund names.
For VIP Consumer Discretionary (formerly VIP Consumer Industries), VIP Energy (formerly VIP Natural Resources), VIP Industrials (formerly VIP Cyclical Industries), and VIP Utilities (formerly VIP Telecommunications & Utilities Growth), shareholders approved certain fundamental investment policy changes related to the restructuring at a special meeting of shareholders held September 20, 2006. All the funds adopted new benchmark indexes from MSCI. Taken together, the name, policy and benchmark changes will make it easier for investors to distinguish funds in the product line and to evaluate Fidelity Management & Research Company's skill in managing the funds.
For VIP Utilities, shareholders approved narrowing the fund's policies to focus on utilities and to exclude telecommunications. The fund is now benchmarked to the MSCI US Investable Market Utilities Index, generally emphasizing power and gas utilities and not telephone companies and telecommunications utilities.
Annual Report
VIP Utilities Portfolio
Performance: The Bottom Line
Average annual total return reflects the change in the value of an investment, assuming reinvestment of the class' dividend income and capital gains (the profits earned upon the sale of securities that have grown in value) and assuming a constant rate of performance each year. During periods of reimbursement by Fidelity, a fund's total return will be greater than it would be had the reimbursement not occurred. Performance numbers are net of all underlying fund operating expenses, but do not include any insurance charges imposed by your insurance company's separate account. If performance information included the effect of these additional charges, the total returns would have been lower. How a fund did yesterday is no guarantee of how it will do tomorrow.
Average Annual Total Returns
Periods ended December 31, 2006 | Past 1
year | Past 5
years | Life of fund A |
VIP Utilities - Initial Class | 31.79% | 9.73% | 5.94% |
VIP Utilities - Investor ClassB | 31.56% | 9.68% | 5.89% |
A From July 19, 2001.
B The initial offering of Investor Class shares took place on July 21, 2005. Returns prior to July 21, 2005 are those of Initial Class. If Investor Class's transfer agent fee had been reflected, returns prior to July 21, 2005 would have been lower.
$10,000 Over Life of Fund
Let's say hypothetically that $10,000 was invested in VIP Utilities Portfolio - Initial Class on July 19, 2001, when the fund started. The chart shows how the value of your investment would have changed, and also shows how the Standard & Poor's 500SM (S&P 500®) performed over the same period.
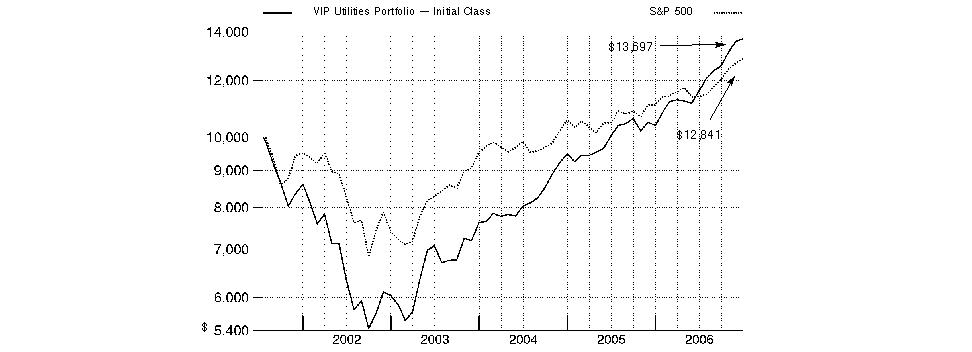
VIP Utilities Portfolio
VIP Utilities Portfolio
Management's Discussion of Fund Performance
Comments from Douglas Simmons, who became Portfolio Manager of VIP Utilities Portfolio on October 2, 2006
U.S. stock markets registered their fourth consecutive year of positive returns in 2006. Among the highlights were the performances of the Dow Jones Industrial AverageSM - a gauge of 30 mega-cap, blue-chip stocks-and the small-cap-oriented Russell 2000® Index, both of which reached new highs. The efforts of the Federal Reserve Board to contain inflation levels also dominated the investment headlines. In all, the Fed hiked short-term interest rates four times, but held rates steady after its June 29 increase, finally pausing after 17 rate hikes over a two-year period. A slowing residential housing market and moderating oil prices - the latter of which hit a record closing high of $77 per barrel in July before falling sharply - also held economic growth in check. For the year overall, the Standard & Poor's 500SM Index was up 15.79%, the Dow advanced 19.05%, the Russell 2000 Index gained 18.37% and the NASDAQ Composite® Index rose 10.39%.
For the 12 months ending December 31, 2006, the fund outperformed the 21.71% gain of the Morgan Stanley Capital InternationalSM (MSCI®) US Investable Market Utilities Index and the 25.58% advance of a blended index specific to this fund. This blended index is a combination of the Goldman Sachs® Utilities Index, which the fund was compared to through September, and the new MSCI benchmark mentioned above, which the fund was compared to during the period's final three months.1 During the overall 12-month period, the fund also outpaced the S&P 500®. (For specific performance results, please refer to the performance section of this shareholder report.) The main contributor to the fund's outperformance of the Goldman Sachs index during the first nine months was positive security selection in and an overweighting of the integrated telecommunication services industry. The principal detractor during that period was poor security selection in wireless telecom services. Top performers included BellSouth, Qwest Communications, Level 3 Communications and AT&T. Not owning broadcast and cable provider NTL, an index component, also contributed. Sprint Nextel, Public Service Enterprise Group and Vonage were detractors. During the last quarter of the period, the fund slightly underperformed its new MSCI Utilities index due to declines among residual holdings in the telecommunications industry that were acquired prior to the fund's restructuring on October 1, 2006, and were not part of the new benchmark. Detractors during this time frame included Level 3 Communications, AT&T and BellSouth, all of which declined at the very beginning of the period. The telecom stocks I've mentioned are no longer in the fund. Electric utilities FPL Group and Entergy, and gas utility Equitable Resources were the main contributors to performance relative to the MSCI index.
1 The fund's blended index is a customized index developed by Fidelity for the limited purpose of discussing the fund's performance for the 12-month period ending December 31, 2006. From January 1, 2006, through September 30, 2006, the fund compared its performance to the Goldman Sachs Utilities Index, which returned 14.68% during that period. On October 1, 2006, the fund began comparing its performance to a different index, the MSCI US Investable Market Utilities Index, which returned 9.50% from October 1, 2006, through December 31, 2006. For the 12-month period ending December 31, 2006, the blended index (Goldman Sachs and MSCI) returned 25.58%.
The views expressed above reflect those of the portfolio manager(s) only through the end of the period as stated on the cover of this report and do not necessarily represent the views of Fidelity or any other person in the Fidelity organization. Any such views are subject to change at any time based upon market or other conditions and Fidelity disclaims any responsibility to update such views. These views may not be relied on as investment advice and, because investment decisions for a Fidelity fund are based on numerous factors, may not be relied on as an indication of trading intent on behalf of any Fidelity fund.
Annual Report
VIP Utilities Portfolio
Shareholder Expense Example
As a shareholder of the Fund, you incur two types of costs: (1) transaction costs, including redemption fees, and (2) ongoing costs, including management fees and other Fund expenses. This Example is intended to help you understand your ongoing costs (in dollars) of investing in the Fund and to compare these costs with the ongoing costs of investing in other mutual funds.
The Example is based on an investment of $1,000 invested at the beginning of the period and held for the entire period (July 1, 2006 to December 31, 2006).
Actual Expenses
The first line of the accompanying table for each class of the Fund provides information about actual account values and actual expenses. You may use the information in this line, together with the amount you invested, to estimate the expenses that you paid over the period. Simply divide your account value by $1,000.00 (for example, an $8,600 account value divided by $1,000.00 = 8.6), then multiply the result by the number in the first line for a class of the Fund under the heading entitled "Expenses Paid During Period" to estimate the expenses you paid on your account during this period. The estimate of expenses does not include any fees or other expenses of any variable annuity or variable life insurance product. If they were, the estimate of expenses you paid during the period would be higher, and your ending account value would be lower.
Hypothetical Example for Comparison Purposes
The second line of the accompanying table for each class of the Fund provides information about hypothetical account values and hypothetical expenses based on a Class' actual expense ratio and an assumed rate of return of 5% per year before expenses, which is not the Class' actual return. The hypothetical account values and expenses may not be used to estimate the actual ending account balance or expenses you paid for the period. You may use this information to compare the ongoing costs of investing in the Fund and other funds. To do so, compare this 5% hypothetical example with the 5% hypothetical examples that appear in the shareholder reports of the other funds. The estimate of expenses does not include any fees or other expenses of any variable annuity or variable life insurance product. If they were, the estimate of expenses you paid during the period would be higher, and your ending account value would be lower.
Please note that the expenses shown in the table are meant to highlight your ongoing costs only and do not reflect any transaction costs. Therefore, the second line of the table is useful in comparing ongoing costs only, and will not help you determine the relative total costs of owning different funds. In addition, if these transactional costs were included, your costs would have been higher.
| Beginning
Account Value
July 1, 2006 | Ending
Account Value
December 31, 2006 | Expenses Paid
During Period*
July 1, 2006
to December 31, 2006 |
Initial Class | | | |
Actual | $ 1,000.00 | $ 1,183.70 | $ 4.29 |
HypotheticalA | $ 1,000.00 | $ 1,021.27 | $ 3.97 |
Investor Class | | | |
Actual | $ 1,000.00 | $ 1,182.70 | $ 5.23 |
HypotheticalA | $ 1,000.00 | $ 1,020.42 | $ 4.84 |
A 5% return per year before expenses
* Expenses are equal to each Class' annualized expense ratio (shown in the table below); multiplied by the average account value over the period, multiplied by 184/365 (to reflect the one-half year period).
| Annualized
Expense Ratio |
Initial Class | .78% |
Investor Class | .95% |
VIP Utilities Portfolio
VIP Utilities Portfolio
Investment Changes
Top Ten Stocks as of December 31, 2006 |
| % of fund's
net assets | % of fund's net assets
6 months ago |
Duke Energy Corp. | 8.7 | 2.0 |
Entergy Corp. | 6.0 | 3.1 |
Constellation Energy Group, Inc. | 5.7 | 0.0 |
FPL Group, Inc. | 5.2 | 3.6 |
Sempra Energy | 5.0 | 1.3 |
Exelon Corp. | 4.5 | 4.6 |
Public Service Enterprise Group, Inc. | 4.5 | 1.9 |
TXU Corp. | 4.3 | 2.7 |
AES Corp. | 4.2 | 3.1 |
American Electric Power Co., Inc. | 3.7 | 0.0 |
| 51.8 | |
Top Industries (% of fund's net assets) |
As of December 31, 2006 |
| Electric Utilities | 41.0% | |
| Multi-utilities | 30.7% | |
| Independent Power Producers & Energy Traders | 16.3% | |
| Gas Utilities | 5.3% | |
| Oil, Gas & Consumable Fuels | 0.8% | |
| All Others* | 5.9% | |

|
As of June 30, 2006 |
| Diversified Telecommunication Services | 49.9% | |
| Electric Utilities | 20.1% | |
| Wireless Telecommunication Services | 11.4% | |
| Independent Power Producers & Energy Traders | 9.5% | |
| Multi-utilities | 7.4% | |
| All Others* | 1.7% | |

* Includes short-term investments and net other assets. |
Prior period industry classifications reflect the categories in place as of the date indicated and have not been adjusted to reflect current industry classifications. |
Annual Report
VIP Utilities Portfolio
Investments December 31, 2006
Showing Percentage of Net Assets
Common Stocks - 94.1% |
| Shares | | Value (Note 1) |
ELECTRIC UTILITIES - 41.0% |
Electric Utilities - 41.0% |
Allegheny Energy, Inc. (a) | 34,200 | | $ 1,570,122 |
American Electric Power Co., Inc. | 82,300 | | 3,504,334 |
DPL, Inc. | 77,500 | | 2,152,950 |
Edison International | 48,000 | | 2,183,040 |
Entergy Corp. | 62,200 | | 5,742,304 |
Exelon Corp. | 70,400 | | 4,357,056 |
FirstEnergy Corp. | 51,620 | | 3,112,686 |
FPL Group, Inc. | 91,100 | | 4,957,662 |
Northeast Utilities | 85,100 | | 2,396,416 |
Pepco Holdings, Inc. | 42,700 | | 1,110,627 |
Pinnacle West Capital Corp. | 11,200 | | 567,728 |
PPL Corp. | 94,600 | | 3,390,464 |
Progress Energy, Inc. | 35,600 | | 1,747,248 |
Reliant Energy, Inc. (a) | 59,700 | | 848,337 |
Sierra Pacific Resources (a) | 104,700 | | 1,762,101 |
| | 39,403,075 |
GAS UTILITIES - 5.3% |
Gas Utilities - 5.3% |
Equitable Resources, Inc. | 64,200 | | 2,680,350 |
ONEOK, Inc. | 13,600 | | 586,432 |
Questar Corp. | 13,400 | | 1,112,870 |
Southern Union Co. | 24,300 | | 679,185 |
| | 5,058,837 |
INDEPENDENT POWER PRODUCERS & ENERGY TRADERS - 16.3% |
Independent Power Producers & Energy Traders - 16.3% |
AES Corp. (a) | 180,950 | | 3,988,138 |
Constellation Energy Group, Inc. | 79,400 | | 5,468,278 |
Dynegy, Inc. Class A (a) | 46,000 | | 333,040 |
NRG Energy, Inc. | 29,700 | | 1,663,497 |
TXU Corp. | 76,880 | | 4,167,665 |
| | 15,620,618 |
MULTI-UTILITIES - 30.7% |
Multi-Utilities - 30.7% |
Alliant Energy Corp. | 14,300 | | 540,111 |
Ameren Corp. | 24,100 | | 1,294,893 |
CenterPoint Energy, Inc. (d) | 79,000 | | 1,309,820 |
CMS Energy Corp. (a) | 82,910 | | 1,384,597 |
|
| Shares | | Value (Note 1) |
DTE Energy Co. | 27,800 | | $ 1,345,798 |
Duke Energy Corp. | 251,200 | | 8,342,352 |
PG&E Corp. | 45,700 | | 2,162,981 |
Public Service Enterprise Group, Inc. | 64,600 | | 4,288,148 |
Puget Energy, Inc. | 28,200 | | 715,152 |
SCANA Corp. | 12,600 | | 511,812 |
Sempra Energy | 85,000 | | 4,763,400 |
Wisconsin Energy Corp. | 53,750 | | 2,550,975 |
WPS Resources Corp. | 5,200 | | 280,956 |
| | 29,490,995 |
OIL, GAS & CONSUMABLE FUELS - 0.8% |
Coal & Consumable Fuels - 0.8% |
Cameco Corp. | 19,600 | | 793,413 |
TOTAL COMMON STOCKS (Cost $81,292,929) | 90,366,938 |
Money Market Funds - 9.8% |
| | | |
Fidelity Cash Central Fund, 5.37% (b) | 8,069,143 | | 8,069,143 |
Fidelity Securities Lending Cash Central Fund, 5.38% (b)(c) | 1,345,500 | | 1,345,500 |
TOTAL MONEY MARKET FUNDS (Cost $9,414,643) | 9,414,643 |
TOTAL INVESTMENT PORTFOLIO - 103.9% (Cost $90,707,572) | | 99,781,581 |
NET OTHER ASSETS - (3.9)% | | (3,739,157) |
NET ASSETS - 100% | $ 96,042,424 |
Legend |
(a) Non-income producing |
(b) Affiliated fund that is available only to investment companies and other accounts managed by Fidelity Investments. The rate quoted is the annualized seven-day yield of the fund at period end. A complete unaudited listing of the fund's holdings as of its most recent quarter end is available upon request. |
(c) Investment made with cash collateral received from securities on loan. |
(d) Security or a portion of the security is on loan at period end. |
Affiliated Central Funds |
Information regarding fiscal year to date income earned by the Fund from investments in Fidelity Central Funds is as follows: |
Fund | Income earned |
Fidelity Cash Central Fund | $ 133,123 |
Fidelity Securities Lending Cash Central Fund | 2,413 |
Total | $ 135,536 |
See accompanying notes which are an integral part of the financial statements.
VIP Utilities Portfolio
VIP Utilities Portfolio
Financial Statements
Statement of Assets and Liabilities
| December 31, 2006 |
| | |
Assets | | |
Investment in securities, at value (including securities loaned of $1,293,240) - See accompanying schedule: Unaffiliated issuers (cost $81,292,929) | $ 90,366,938 | |
Fidelity Central Funds (cost $9,414,643) | 9,414,643 | |
Total Investments (cost $90,707,572) | | $ 99,781,581 |
Dividends receivable | | 150,758 |
Interest receivable | | 30,750 |
Prepaid expenses | | 178 |
Other receivables | | 9,814 |
Total assets | | 99,973,081 |
| | |
Liabilities | | |
Payable for investments purchased | $ 2,492,647 | |
Accrued management fee | 43,612 | |
Other affiliated payables | 10,233 | |
Other payables and accrued expenses | 38,665 | |
Collateral on securities loaned, at value | 1,345,500 | |
Total liabilities | | 3,930,657 |
| | |
Net Assets | | $ 96,042,424 |
Net Assets consist of: | | |
Paid in capital | | $ 87,011,542 |
Accumulated undistributed net realized gain (loss) on investments and foreign currency transactions | | (43,124) |
Net unrealized appreciation (depreciation) on investments and assets and liabilities in foreign currencies | | 9,074,006 |
Net Assets | | $ 96,042,424 |
Statement of Assets and Liabilities - continued
| December 31, 2006 |
| | |
Initial Class:
Net Asset Value, offering price and redemption price per share ($77,153,308 ÷ 6,834,931 shares) | | $ 11.29 |
| | |
Investor Class:
Net Asset Value, offering price and redemption price per share ($18,889,116 ÷ 1,677,936 shares) | | $ 11.26 |
See accompanying notes which are an integral part of the financial statements.
Annual Report
VIP Utilities Portfolio
Financial Statements - continued
Statement of Operations
| Year ended December 31, 2006 |
| | |
Investment Income | | |
Dividends | | $ 1,345,710 |
Interest | | 77 |
Income from Fidelity Central Funds | | 135,536 |
Total income | | 1,481,323 |
| | |
Expenses | | |
Management fee | $ 278,861 | |
Transfer agent fees | 47,299 | |
Accounting and security lending fees | 19,737 | |
Custodian fees and expenses | 10,909 | |
Independent trustees' compensation | 166 | |
Audit | 41,044 | |
Legal | 3,185 | |
Miscellaneous | 5,147 | |
Total expenses before reductions | 406,348 | |
Expense reductions | (2,654) | 403,694 |
Net investment income (loss) | | 1,077,629 |
Realized and Unrealized Gain (Loss) Net realized gain (loss) on: | | |
Investment securities: | | |
Unaffiliated issuers | 7,786,611 | |
Foreign currency transactions | (1,834) | |
Total net realized gain (loss) | | 7,784,777 |
Change in net unrealized appreciation (depreciation) on: Investment securities | 4,940,014 | |
Assets and liabilities in foreign currencies | (773) | |
Total change in net unrealized appreciation (depreciation) | | 4,939,241 |
Net gain (loss) | | 12,724,018 |
Net increase (decrease) in net assets resulting from operations | | $ 13,801,647 |
Statement of Changes in Net Assets
| Year ended
December 31,
2006 | Year ended
December 31,
2005 |
Increase (Decrease) in Net Assets | | |
Operations | | |
Net investment income (loss) | $ 1,077,629 | $ 685,766 |
Net realized gain (loss) | 7,784,777 | 4,408,599 |
Change in net unrealized appreciation (depreciation) | 4,939,241 | (1,870,390) |
Net increase (decrease) in net assets resulting from operations | 13,801,647 | 3,223,975 |
Distributions to shareholders from net investment income | (1,059,729) | (745,747) |
Distributions to shareholders from net realized gain | (8,079,817) | (1,139,378) |
Total distributions | (9,139,546) | (1,885,125) |
Share transactions - net increase (decrease) | 53,765,431 | (1,939,663) |
Redemption fees | 20,707 | 12,823 |
Total increase (decrease) in net assets | 58,448,239 | (587,990) |
| | |
Net Assets | | |
Beginning of period | 37,594,185 | 38,182,175 |
End of period | $ 96,042,424 | $ 37,594,185 |
See accompanying notes which are an integral part of the financial statements.
VIP Utilities Portfolio
Financial Highlights - Initial Class
Years ended December 31, | 2006 | 2005 | 2004 | 2003 | 2002 |
Selected Per-Share Data | | | | | |
Net asset value, beginning of period | $ 9.53 | $ 9.14 | $ 7.42 | $ 5.95 | $ 8.60 |
Income from Investment Operations | | | | | |
Net investment income (loss) C | .24 | .17 | .17 F | .08 | .09 |
Net realized and unrealized gain (loss) | 2.76 | .71 | 1.65 | 1.45 | (2.67) |
Total from investment operations | 3.00 | .88 | 1.82 | 1.53 | (2.58) |
Distributions from net investment income | (.14) | (.19) | (.11) | (.08) | (.08) |
Distributions from net realized gain | (1.10) | (.30) | - | - | - |
Total distributions | (1.24) J | (.49) I | (.11) | (.08) | (.08) |
Redemption fees added to paid in capital C | - H | - H | .01 | .02 | .01 |
Net asset value, end of period | $ 11.29 | $ 9.53 | $ 9.14 | $ 7.42 | $ 5.95 |
Total Return A, B | 31.79% | 9.54% | 24.61% | 26.17% | (29.91) % |
Ratios to Average Net Assets D, G | | | | | |
Expenses before reductions | .81% | .83% | 1.04% | 1.71% | 1.82% |
Expenses net of fee waivers, if any | .81% | .83% | 1.04% | 1.50% | 1.50% |
Expenses net of all reductions | .80% | .80% | 1.00% | 1.46% | 1.39% |
Net investment income (loss) | 2.20% | 1.81% | 2.03% | 1.19% | 1.30% |
Supplemental Data | | | | | |
Net assets, end of period (000 omitted) | $ 77,153 | $ 36,444 | $ 38,182 | $ 11,700 | $ 8,270 |
Portfolio turnover rate E | 139% | 100% | 84% | 123% | 154% |
A Total returns do not reflect charges attributable to your insurance company's separate account. Inclusion of these charges would reduce the total returns shown.
B Total returns would have been lower had certain expenses not been reduced during the periods shown.
C Calculated based on average shares outstanding during the period.
D Fees and expenses of the underlying Fidelity Central Funds are not included in the Fund's expense ratio. The Fund indirectly bears its proportionate share of the expenses of any underlying Fidelity Central Funds.
E Amount does not include the portfolio activity of any underlying Fidelity Central Funds.
F Investment income per share reflects a special dividend which amounted to $.05 per share.
G Expense ratios reflect operating expenses of the class. Expenses before reductions do not reflect amounts reimbursed by the investment adviser or reductions from brokerage service arrangements or other expense offset arrangements and do not represent the amount paid by the class during periods when reimbursements or reductions occur. Expenses net of fee waivers reflect expenses after reimbursement by the investment adviser but prior to reductions from brokerage service arrangements or other expense offset arrangements. Expenses net of all reductions represent the net expenses paid by the class.
H Amount represents less than $.01 per share.
I Total distributions of $.49 per share is comprised of distributions from net investment income of $.193 and distributions from net realized gain of $.295 per share.
J Total distributions of $1.24 per share is comprised of distributions from net investment income of $.139 and distributions from net realized gain of $1.105 per share.
Financial Highlights - Investor Class
Years ended December 31, | 2006 | 2005 H |
Selected Per-Share Data | | |
Net asset value, beginning of period | $ 9.52 | $ 9.72 |
Income from Investment Operations | | |
Net investment income (loss) E | .23 | .05 |
Net realized and unrealized gain (loss) | 2.75 | .24 |
Total from investment operations | 2.98 | .29 |
Distributions from net investment income | (.13) | (.20) |
Distributions from net realized gain | (1.10) | (.30) |
Total distributions | (1.24) L | (.49) K |
Redemption fees added to paid in capital E,J | - | - |
Net asset value, end of period | $ 11.26 | $ 9.52 |
Total Return B, C, D | 31.56% | 2.94% |
Ratios to Average Net Assets F, I | | |
Expenses before reductions | .96% | 1.16% A |
Expenses net of fee waivers, if any | .96% | 1.16% A |
Expenses net of all reductions | .96% | 1.12% A |
Net investment income (loss) | 2.04% | 1.09% A |
Supplemental Data | | |
Net assets, end of period (000 omitted) | $ 18,889 | $ 1,150 |
Portfolio turnover rate G | 139% | 100% |
A Annualized
B Total returns for periods of less than one year are not annualized.
C Total returns do not reflect charges attributable to your insurance company's separate account. Inclusion of these charges would reduce the total returns shown.
D Total returns would have been lower had certain expenses not been reduced during the periods shown.
E Calculated based on average shares outstanding during the period.
F Fees and expenses of the underlying Fidelity Central Funds are not included in the Fund's expense ratio. The Fund indirectly bears its proportionate share of the expenses of any underlying Fidelity Central Funds.
G Amount does not include the portfolio activity of any underlying Fidelity Central Funds.
H For the period July 21, 2005 (commencement of sale of shares) to December 31, 2005.
I Expense ratios reflect operating expenses of the class. Expenses before reductions do not reflect amounts reimbursed by the investment adviser or reductions from brokerage service arrangements or other expense offset arrangements and do not represent the amount paid by the class during periods when reimbursements or reductions occur. Expense ratios before reductions for start-up periods may not be representative of longer-term operating periods. Expenses net of fee waivers reflect expenses after reimbursement by the investment adviser but prior to reductions from brokerage service arrangements or other expense offset arrangements. Expenses net of all reductions represent the net expenses paid by the class.
J Amount represents less than $.01 per share.
K Total distributions of $.49 per share is comprised of distributions from net investment income of $.196 and distributions from net realized gain of $.295 per share.
L Total distributions of $1.24 per share is comprised of distributions from net investment income of $.134 and distributions from net realized gain of $1.105 per share.
Annual Report
See accompanying notes which are an integral part of the financial statements.
Notes to Financial Statements
For the period ended December 31, 2006
1. Significant Accounting Policies.
VIP Utilities Portfolio (the Fund) (formerly VIP Telecommunications & Utilities Growth Portfolio) is a non-diversified fund of Variable Insurance Products IV (the trust) and is authorized to issue an unlimited number of shares. The trust is registered under the Investment Company Act of 1940, as amended (the 1940 Act), as an open-end management investment company organized as a Massachusetts business trust. Shares of the Fund may only be purchased by insurance companies for the purpose of funding variable annuity or variable life insurance contracts. The Fund offers the following classes of shares: Initial Class shares and Investor Class shares. All classes have equal rights and voting privileges, except for matters affecting a single class. Investment income, realized and unrealized capital gains and losses, the common expenses of the Fund, and certain fund-level expense reductions, if any, are allocated on a pro rata basis to each class based on the relative net assets of each class to the total net assets of the Fund. Each class differs with respect to transfer agent fees incurred. Certain expense reductions also differ by class.
The Fund may invest in Fidelity Central Funds which are open-end investment companies available to investment companies and other accounts managed by Fidelity Management & Research Company (FMR) and its affiliates. The financial statements have been prepared in conformity with accounting principles generally accepted in the United States of America, which require management to make certain estimates and assumptions at the date of the financial statements. The following summarizes the significant accounting policies of the Fund, which are also consistently followed by the Fidelity Central Funds:
Security Valuation. Investments are valued and net asset value (NAV) per share is calculated (NAV calculation) as of the close of business of the New York Stock Exchange (NYSE), normally 4:00 p.m. Eastern time. Wherever possible, the Fund uses independent pricing services approved by the Board of Trustees to value its investments.
Equity securities, including restricted securities, for which market quotations are readily available, are valued at the last reported sale price or official closing price as reported by an independent pricing service on the primary market or exchange on which they are traded. In the event there were no sales during the day or closing prices are not available, securities are valued at the last quoted bid price. Investments in open-end mutual funds, including the Fidelity Central Funds, are valued at their closing net asset value each business day. Short-term securities with remaining maturities of sixty days or less for which quotations are not readily available are valued at amortized cost, which approximates value.
When current market prices or quotations are not readily available or do not accurately reflect fair value, valuations may be determined in accordance with procedures adopted by the Board of Trustees. For example, when developments occur between the close of a market and the close of the NYSE that may materially affect the value of some or all of the securities, or when trading in a security is halted, those securities may be fair valued. Factors used in the determination of fair value may include monitoring news to identify significant market or security specific events such as changes in the value of U.S. securities markets, reviewing developments in foreign markets and evaluating the performance of ADRs, futures contracts and exchange-traded funds. Because the Fund's utilization of fair value pricing depends on market activity, the frequency with which fair value pricing is used can not be predicted and may be utilized to a significant extent. The value of securities used for NAV calculation under fair value pricing may differ from published prices for the same securities.
Foreign Currency. The Fund uses foreign currency contracts to facilitate transactions in foreign-denominated securities. Losses from these transactions may arise from changes in the value of the foreign currency or if the counterparties do not perform under the contracts' terms.
Foreign-denominated assets, including investment securities, and liabilities are translated into U.S. dollars at the exchange rate at period end. Purchases and sales of investment securities, income and dividends received and expenses denominated in foreign currencies are translated into U.S. dollars at the exchange rate in effect on the transaction date.
The effects of exchange rate fluctuations on investments are included with the net realized and unrealized gain (loss) on investment securities. Other foreign currency transactions resulting in realized and unrealized gain (loss) are disclosed separately.
Investment Transactions and Income. Security transactions, including the Fund's investment activity in the Fidelity Central Funds, are accounted for as of trade date. Gains and losses on securities sold are determined on the basis of identified cost and may include proceeds received from litigation. Dividend income is recorded on the ex-dividend date, except for certain dividends from foreign securities where the ex-dividend date may have passed, which are recorded as soon as the Fund is informed of the ex-dividend date. Non-cash dividends included in dividend income, if any, are recorded at the fair market value of the securities received. Distributions received on securities that represent a return of capital or capital gain are recorded as a reduction of cost of investments and/or as a realized gain. The Fund estimates the components of distributions received that may be considered return of capital distributions or capital gain distributions. Interest income and income distributions from the Fidelity Central Funds are accrued as earned, with any income distributions receivable as of period end included in Interest Receivable on the Statement of Assets and Liabilities. Interest income includes coupon interest and amortization of premium and accretion of discount on debt securities. Investment income is recorded net of foreign taxes withheld where recovery of such taxes is uncertain.
VIP Utilities Portfolio
1. Significant Accounting Policies - continued
Expenses. Most expenses of the trust can be directly attributed to a fund. Expenses which cannot be directly attributed are apportioned among each Fund in the trust. Expense estimates are accrued in the period to which they relate and adjustments are made when actual amounts are known.
Income Tax Information and Distributions to Shareholders. Each year, the Fund intends to qualify as a regulated investment company by distributing all of its taxable income and realized gains under Subchapter M of the Internal Revenue Code. As a result, no provision for income taxes is required in the accompanying financial statements. Foreign taxes are provided for based on the Fund's understanding of the tax rules and rates that exist in the foreign markets in which it invests.
Distributions are recorded on the ex-dividend date. Income dividends and capital gain distributions are declared separately for each class. Income and capital gain distributions are determined in accordance with income tax regulations, which may differ from generally accepted accounting principles.
Capital accounts within the financial statements are adjusted for permanent book-tax differences. These adjustments have no impact on net assets or the results of operations. Temporary book-tax differences will reverse in a subsequent period.
Book-tax differences are primarily due to foreign currency transactions and losses deferred due to wash sales.
The tax-basis components of distributable earnings and the federal tax cost as of period end were as follows:
Unrealized appreciation | $ 9,519,938 | |
Unrealized depreciation | (592,347) | |
Net unrealized appreciation (depreciation) | 8,927,591 | |
Undistributed ordinary income | 103,295 | |
| | |
Cost for federal income tax purposes | $ 90,853,990 | |
The tax character of distributions paid was as follows:
| December 31, 2006 | December 31, 2005 |
Ordinary Income | $ 1,980,340 | $ 745,747 |
Long-term Capital Gains | 7,159,206 | 1,139,378 |
Total | $ 9,139,546 | $ 1,885,125 |
Trading (Redemption) Fees. Shares held less than 60 days are subject to a redemption fee equal to 1% of the proceeds of the redeemed shares. All redemption fees, including any estimated redemption fees paid by FMR, are retained by the Fund and accounted for as an addition to paid in capital.
New Accounting Pronouncements. In July 2006, Financial Accounting Standards Board Interpretation No. 48, Accounting for Uncertainty in Income Taxes - an interpretation of FASB Statement 109 (FIN 48), was issued and is effective on the last business day of the semiannual reporting period for fiscal years beginning after December 15, 2006. FIN 48 sets forth a threshold for financial statement recognition, measurement and disclosure of a tax position taken or expected to be taken on a tax return. Management is currently evaluating the impact, if any, the adoption of FIN 48 will have on the Fund's net assets, results of operations and financial statement disclosures.
In addition, in September 2006, Statement of Financial Accounting Standards No. 157, Fair Value Measurements (SFAS 157), was issued and is effective for fiscal years beginning after November 15, 2007. SFAS 157 defines fair value, establishes a framework for measuring fair value and expands disclosures about fair value measurements. Management is currently evaluating the impact the adoption of SFAS 157 will have on the Fund's financial statement disclosures.
2. Operating Policies.
Repurchase Agreements. FMR has received an Exemptive Order from the Securities and Exchange Commission (the SEC) which permits the Fund and other affiliated entities of FMR to transfer uninvested cash balances into joint trading accounts which are then invested in repurchase agreements. The Fund may also invest directly with institutions in repurchase agreements. Repurchase agreements are collateralized by government or non-government securities. Upon settlement date, collateral is held in segregated accounts with custodian banks and may be obtained in the event of a default of the counterparty. The Fund monitors, on a daily basis, the value of the collateral to ensure it is at least equal to the principal amount of the repurchase agreement (including accrued interest). In the event of a default by the counterparty, realization of the collateral proceeds could be delayed, during which time the value of the collateral may decline.
Annual Report
Notes to Financial Statements - continued
3. Purchases and Sales of Investments.
Purchases and sales of securities, other than short-term securities, aggregated $108,720,759 and $68,396,970, respectively.
4. Fees and Other Transactions with Affiliates.
Management Fee. FMR and its affiliates provide the Fund with investment management related services for which the Fund pays a monthly management fee. The management fee is the sum of an individual fund fee rate that is based on an annual rate of .30% of the Fund's average net assets and a group fee rate that averaged .27% during the period. The group fee rate is based upon the average net assets of all the mutual funds advised by FMR. The group fee rate decreases as assets under management increase and increases as assets under management decrease. For the period, the total annual management fee rate was .57% of the Fund's average net assets.
Transfer Agent Fees. Fidelity Investments Institutional Operations Company, Inc. (FIIOC), an affiliate of FMR, is the fund's transfer, dividend disbursing, and shareholder servicing agent. FIIOC receives an asset-based fee with respect to each class. Each class with the exception of Investor Class pays a transfer agent fee, excluding out of pocket expenses, equal to an annual rate of .07% of their month end net assets. Investor Class pays a monthly asset-based transfer agent fee of .18% of its month end net assets. The total transfer agent fees paid by each class to FIIOC, including out of pocket expenses, were as follows:
Initial Class | $ 34,142 |
Investor Class | 13,157 |
| $ 47,299 |
Accounting and Security Lending Fees. Fidelity Service Company, Inc. (FSC), an affiliate of FMR, maintains the Fund's accounting records. The accounting fee is based on the level of average net assets for the month. Under a separate contract, FSC administers the security lending program. The security lending fee is based on the number and duration of lending transactions.
Investments in Fidelity Central Funds. The Fund may invest in Fidelity Central Funds. The Fund's Schedule of Investments lists each of the Fidelity Central Funds as an investment of the Fund but does not include the underlying holdings of each Fidelity Central Fund. As an Investing Fund, the Fund indirectly bears its proportionate share of the expenses of the underlying Fidelity Central Funds. A complete unaudited list of holdings for each Fidelity Central Fund is available upon request. In addition, the financial statements of the Fidelity Central Funds, which are not covered by the Fund's Report of Independent Registered Public Accounting Firm, are available on the EDGAR Database on the SEC's web site, www.sec.gov, or upon request.
The Money Market Central Funds seek preservation of capital and current income and are managed by Fidelity Investments Money Management, Inc. (FIMM), an affiliate of FMR.
Brokerage Commissions. The Fund placed a portion of its portfolio transactions with brokerage firms which are affiliates of the investment adviser. The commissions paid to these affiliated firms were $890 for the period.
5. Committed Line of Credit.
The Fund participates with other funds managed by FMR in a $4.2 billion credit facility (the "line of credit") to be utilized for temporary or emergency purposes to fund shareholder redemptions or for other short-term liquidity purposes. The Fund has agreed to pay commitment fees on its pro rata portion of the line of credit, which amounted to $109 and is reflected in Miscellaneous Expense on the Statement of Operations. During the period, there were no borrowings on this line of credit.
6. Security Lending.
The Fund lends portfolio securities from time to time in order to earn additional income. On the settlement date of the loan, the Fund receives collateral (in the form of U.S. Treasury obligations, letters of credit and/or cash) against the loaned securities and maintains collateral in an amount not less than 100% of the market value of the loaned securities during the period of the loan. The market value of the loaned securities is determined at the close of business of the Fund and any additional required collateral is delivered to the Fund on the next business day. If the borrower defaults on its obligation to return the securities loaned because of insolvency or other reasons, a fund could experience delays and costs in recovering the securities loaned or in gaining access to the collateral. Any cash collateral received is invested in the Fidelity Securities Lending Cash Central Fund. The value of loaned securities and cash collateral at period end are disclosed on the Fund's Statement of Assets and Liabilities. Security lending income represents the income earned on investing cash collateral, less fees and expenses associated with the loan, plus any premium payments that may be received on the loan of certain types of securities. Security lending income is presented in the Statement of Operations as a component of income from Fidelity Central Funds. Net income from lending portfolio securities during the period amounted to $2,413.
VIP Utilities Portfolio
7. Expense Reductions.
Many of the brokers with whom FMR places trades on behalf of the Fund provided services to the Fund in addition to trade execution. These services included payments of certain expenses on behalf of the Fund totaling $1,984 for the period.
8. Other.
The Fund's organizational documents provide former and current trustees and officers with a limited indemnification against liabilities arising in connection with the performance of their duties to the Fund. In the normal course of business, the Fund may also enter into contracts that provide general indemnifications. The Fund's maximum exposure under these arrangements is unknown as this would be dependent on future claims that may be made against the Fund. The risk of material loss from such claims is considered remote.
At the end of the period, FMR or its affiliates were the owners of record of 100% of the total outstanding shares of the fund.
The United States Securities and Exchange Commission ("SEC") is conducting an investigation of FMR (covering the years 2002 to 2004) arising from gifts, gratuities and business entertainment provided by certain brokers to certain individuals who were employed on FMR's domestic equity trading desk during that period. FMR is in discussions with the SEC staff regarding the possible resolution of the matter, but as of period-end no final resolution has been reached.
In December 2006, the Independent Trustees completed their own investigation of the matter with the assistance of independent counsel. The Independent Trustees and FMR agree that, despite the absence of proof that the Fidelity mutual funds experienced diminished execution quality as a result of the improper receipt of gifts and business entertainment, the conduct at issue was serious and is worthy of redress. Accordingly, the Independent Trustees have requested and FMR has agreed to pay $42 million to Fidelity mutual funds, plus interest to be determined at the time that payment is made. A method of allocating this payment among the funds has not yet been determined. The total payment to the Fund is not anticipated to have a material impact on the Fund's net assets. In addition, FMR reimbursed related legal expenses which are recorded in the accompanying Statement of Operations as an expense reduction.
9. Distributions to Shareholders.
Distributions to shareholders of each class were as follows:
| Years ended December 31, |
| 2006 | 2005 A |
From net investment income | | |
Initial Class | $ 881,642 | $ 724,667 |
Investor Class | 178,087 | 21,080 |
Total | $ 1,059,729 | $ 745,747 |
From net realized gain | | |
Initial Class | $ 6,721,805 | $ 1,107,650 |
Investor Class | 1,358,012 | 31,728 |
Total | $ 8,079,817 | $ 1,139,378 |
A Distributions for Investor Class are for the period July 21, 2005 (commencement of sale of shares) to December 31, 2005.
10. Share Transactions.
Transactions for each class of shares were as follows:
| Shares | Dollars |
| Years ended December 31, | Years ended December 31, |
| 2006 | 2005 A | 2006 | 2005 A |
Initial Class | | | | |
Shares sold | 4,066,520 | 1,608,723 | $ 46,447,146 | $ 15,391,071 |
Reinvestment of distributions | 678,442 | 189,877 | 7,603,447 | 1,832,317 |
Shares redeemed | (1,733,462) | (2,153,835) | (18,008,301) | (20,362,931) |
Net increase (decrease) | 3,011,500 | (355,235) | $ 36,042,292 | $ (3,139,543) |
Investor Class | | | | |
Shares sold | 1,466,057 | 116,195 | $ 16,671,927 | $ 1,155,544 |
Reinvestment of distributions | 136,851 | 5,484 | 1,536,099 | 52,808 |
Shares redeemed | (45,800) | (851) | (484,887) | (8,472) |
Net increase (decrease) | 1,557,108 | 120,828 | $ 17,723,139 | $ 1,199,880 |
A Share transactions for Investor Class are for the period July 21, 2005 (commencement of sale of shares) to December 31, 2005.
Annual Report
Report of Independent Registered Public Accounting Firm
To the Trustees of Variable Insurance Products Fund IV and the Shareholders of VIP Utilities Portfolio (formerly VIP Telecommunications & Utilities Growth Portfolio):
In our opinion, the accompanying statement of assets and liabilities, including the schedule of investments, and the related statements of operations and of changes in net assets and the financial highlights present fairly, in all material respects, the financial position of VIP Utilities Portfolio (formerly VIP Telecommunications & Utilities Growth Portfolio) (a fund of Variable Insurance Products Fund IV) at December 31, 2006, the results of its operations for the year then ended, the changes in its net assets for each of the two years in the period then ended and the financial highlights for each of the periods indicated, in conformity with accounting principles generally accepted in the United States of America. These financial statements and financial highlights (hereafter referred to as "financial statements") are the responsibility of the VIP Utilities Portfolio's management; our responsibility is to express an opinion on these financial statements based on our audits. We conducted our audits of these financial statements in accordance with the standards of the Public Company Accounting Oversight Board (United States). Those standards require that we plan and perform the audit to obtain reasonable assurance about whether the financial statements are free of material misstatement. An audit includes examining, on a test basis, evidence supporting the amounts and disclosures in the financial statements, assessing the accounting principles used and significant estimates made by management, and evaluating the overall financial statement presentation. We believe that our audits, which included confirmation of securities at December 31, 2006 by correspondence with the custodian and brokers, provide a reasonable basis for our opinion.
/s/ PricewaterhouseCoopers LLP
PricewaterhouseCoopers LLP
Boston, Massachusetts
February 13, 2007
VIP Utilities Portfolio
Trustees and Officers
The Trustees, Member of the Advisory Board, and executive officers of the trust and fund, as applicable, are listed below. The Board of Trustees governs the fund and is responsible for protecting the interests of shareholders. The Trustees are experienced executives who meet periodically throughout the year to oversee the fund's activities, review contractual arrangements with companies that provide services to the fund, and review the fund's performance. Each of the Trustees oversees 348 funds advised by FMR or an affiliate.
The Trustees hold office without limit in time except that (a) any Trustee may resign; (b) any Trustee may be removed by written instrument, signed by at least two-thirds of the number of Trustees prior to such removal; (c) any Trustee who requests to be retired or who has become incapacitated by illness or injury may be retired by written instrument signed by a majority of the other Trustees; and (d) any Trustee may be removed at any special meeting of shareholders by a two-thirds vote of the outstanding voting securities of the trust. Each Trustee who is not an interested person (as defined in the 1940 Act) (Independent Trustee), shall retire not later than the last day of the calendar year in which his or her 72nd birthday occurs. The Independent Trustees may waive this mandatory retirement age policy with respect to individual Trustees. The executive officers and Advisory Board Member hold office without limit in time, except that any officer and Advisory Board Member may resign or may be removed by a vote of a majority of the Trustees at any regular meeting or any special meeting of the Trustees. Except as indicated, each individual has held the office shown or other offices in the same company for the past five years.
The fund's Statement of Additional Information (SAI) includes more information about the Trustees. To request a free copy, call Fidelity at 1-877-208-0098.
Interested Trustees*:
Correspondence intended for each Trustee who is an interested person may be sent to Fidelity Investments, 82 Devonshire Street, Boston, Massachusetts 02109.
Name, Age; Principal Occupation |
Edward C. Johnson 3d (76) |
| Year of Election or Appointment: 1983 Mr. Johnson is Chairman of the Board of Trustees. Mr. Johnson serves as President (2006-present), Chief Executive Officer, Chairman, and a Director of FMR Corp.; Chairman and a Director of FMR; Chairman and a Director of Fidelity Research & Analysis Company (FRAC); Chairman and a Director of Fidelity Investments Money Management, Inc.; and Chairman (2001-present) and a Director of FMR Co., Inc. In addition, Mr. Johnson serves as Chairman and Director of Fidelity International Limited (FIL). |
Robert L. Reynolds (54) |
| Year of Election or Appointment: 2003 Mr. Reynolds is President and a Director of FMR (2005-present), Fidelity Investments Money Management, Inc. (2005-present), and FMR Co., Inc. (2005-present). Mr. Reynolds also serves as Vice Chairman (2006-present), a Director (2003-present), and Chief Operating Officer of FMR Corp. and a Director of Strategic Advisers, Inc. (2005-present). He also serves on the Board at Fidelity Investments Canada, Ltd. |
* Trustees have been determined to be "Interested Trustees" by virtue of, among other things, their affiliation with the trust or various entities under common control with FMR.
Independent Trustees:
Correspondence intended for each Independent Trustee (that is, the Trustees other than the Interested Trustees) may be sent to Fidelity Investments, P.O. Box 55235, Boston, Massachusetts 02205-5235.
Name, Age; Principal Occupation |
Dennis J. Dirks (58) |
| Year of Election or Appointment: 2005 Prior to his retirement in May 2003, Mr. Dirks was Chief Operating Officer and a member of the Board of The Depository Trust & Clearing Corporation (DTCC) (1999-2003). He also served as President, Chief Operating Officer, and Board member of The Depository Trust Company (DTC) (1999-2003) and President and Board member of the National Securities Clearing Corporation (NSCC) (1999-2003). In addition, Mr. Dirks served as Chief Executive Officer and Board member of the Government Securities Clearing Corporation (2001-2003) and Chief Executive Officer and Board member of the Mortgage-Backed Securities Clearing Corporation (2001-2003). Mr. Dirks also serves as a Trustee and a member of the Finance Committee of Manhattan College (2005-present) and a Trustee and a member of the Finance Committee of AHRC of Nassau County (2006-present). |
Albert R. Gamper, Jr. (64) |
| Year of Election or Appointment: 2006 Prior to his retirement in December 2004, Mr. Gamper served as Chairman of the Board of CIT Group Inc. (commercial finance). During his tenure with CIT Group Inc. Mr. Gamper served in numerous senior management positions, including Chairman (1987-1989; 1999-2001; 2002-2004), Chief Executive Officer (1987-2004), and President (1989-2002). He currently serves as a member of the Board of Directors of Public Service Enterprise Group (utilities, 2001-present), Chairman of the Board of Governors, Rutgers University (2004-present), and Chairman of the Board of Saint Barnabas Health Care System. |
George H. Heilmeier (70) |
| Year of Election or Appointment: 2004 Dr. Heilmeier is Chairman Emeritus of Telcordia Technologies (communication software and systems), where prior to his retirement, he served as company Chairman and Chief Executive Officer. He currently serves on the Boards of Directors of The Mitre Corporation (systems engineering and information technology support for the government), and HRL Laboratories (private research and development, 2004-present). He is Chairman of the General Motors Science & Technology Advisory Board and a Life Fellow of the Institute of Electrical and Electronics Engineers (IEEE). Dr. Heilmeier is a member of the Defense Science Board and the National Security Agency Advisory Board. He is also a member of the National Academy of Engineering, the American Academy of Arts and Sciences, and the Board of Overseers of the School of Engineering and Applied Science of the University of Pennsylvania. Previously, Dr. Heilmeier served as a Director of TRW Inc. (automotive, space, defense, and information technology, 1992-2002), Compaq (1994-2002), Automatic Data Processing, Inc. (ADP) (technology-based business outsourcing, 1995-2002), INET Technologies Inc. (telecommunications network surveillance, 2001-2004), and Teletech Holdings (customer management services). He is the recipient of the 2005 Kyoto Prize in Advanced Technology for his invention of the liquid crystal display, and a member of the Consumer Electronics Hall of Fame. |
James H. Keyes (66) |
| Year of Election or Appointment: 2007 Prior to his retirement in 2003, Mr. Keyes was Chairman, President, and Chief Executive Officer of Johnson Controls, Inc. (automotive supplier, 1993-2003). He currently serves as a member of the boards of LSI Logic Corporation (semiconductor technologies), Navistar International Corporation (manufacture and sale of trucks, buses, and diesel engines, 2002-present), and Pitney Bowes, Inc. (integrated mail, messaging, and document management solutions). |
Marie L. Knowles (60) |
| Year of Election or Appointment: 2001 Prior to Ms. Knowles' retirement in June 2000, she served as Executive Vice President and Chief Financial Officer of Atlantic Richfield Company (ARCO) (diversified energy, 1996-2000). From 1993 to 1996, she was a Senior Vice President of ARCO and President of ARCO Transportation Company. She served as a Director of ARCO from 1996 to 1998. She currently serves as a Director of Phelps Dodge Corporation (copper mining and manufacturing) and McKesson Corporation (healthcare service, 2002-present). Ms. Knowles is a Trustee of the Brookings Institution and the Catalina Island Conservancy and also serves as a member of the Advisory Board for the School of Engineering of the University of Southern California. |
Ned C. Lautenbach (62) |
| Year of Election or Appointment: 2000 Mr. Lautenbach is Chairman of the Independent Trustees (2006-present). Mr. Lautenbach has been a partner of Clayton, Dubilier & Rice, Inc. (private equity investment firm) since September 1998. Previously, Mr. Lautenbach was with the International Business Machines Corporation (IBM) from 1968 until his retirement in 1998. Mr. Lautenbach serves as a Director of Sony Corporation (2006-present) and Eaton Corporation (diversified industrial) as well as the Philharmonic Center for the Arts in Naples, Florida. He also is a member of the Board of Trustees of Fairfield University (2005-present), as well as a member of the Council on Foreign Relations. |
Cornelia M. Small (62) |
| Year of Election or Appointment: 2005 Ms. Small is a member (2000-present) and Chairperson (2002-present) of the Investment Committee, and a member (2002-present) of the Board of Trustees of Smith College. Previously, she served as Chief Investment Officer (1999-2000), Director of Global Equity Investments (1996-1999), and a member of the Board of Directors of Scudder, Stevens & Clark (1990-1997) and Scudder Kemper Investments (1997-1999). In addition, Ms. Small served as Co-Chair (2000-2003) of the Annual Fund for the Fletcher School of Law and Diplomacy. |
William S. Stavropoulos (67) |
| Year of Election or Appointment: 2001 Mr. Stavropoulos is Chairman Emeritus of the Board of Directors of The Dow Chemical Company. Since joining The Dow Chemical Company in 1967, Mr. Stavropoulos served in numerous senior management positions, including President (1993-2000; 2002-2003), CEO (1995-2000; 2002-2004), and Chairman of the Executive Committee (2000-2004). Currently, he is a Director of NCR Corporation (data warehousing and technology solutions), BellSouth Corporation (telecommunications), Chemical Financial Corporation, Maersk Inc. (industrial conglomerate, 2002-present), and Metalmark Capital (private equity investment firm, 2005-present). He also serves as a member of the Board of Trustees of the American Enterprise Institute for Public Policy Research. In addition, Mr. Stavropoulos is a member of The Business Council, J.P. Morgan International Council and the University of Notre Dame Advisory Council for the College of Science. |
Kenneth L. Wolfe (67) |
| Year of Election or Appointment: 2005 Prior to his retirement in 2001, Mr. Wolfe was Chairman and Chief Executive Officer of Hershey Foods Corporation (1993-2001). He currently serves as a member of the boards of Adelphia Communications Corporation (2003-present), Bausch & Lomb, Inc., and Revlon Inc. (2004-present). |
Advisory Board Member and Executive Officers:
Correspondence intended for each executive officer and Mr. Lynch may be sent to Fidelity Investments, 82 Devonshire Street, Boston, Massachusetts 02109.
Name, Age; Principal Occupation |
Peter S. Lynch (62) |
| Year of Election or Appointment: 2003 Member of the Advisory Board of Variable Insurance Products Fund IV. Mr. Lynch is Vice Chairman and a Director of FMR, and Vice Chairman (2001-present) and a Director of FMR Co., Inc. Previously, Mr. Lynch served as a Trustee of the Fidelity funds (1990-2003). In addition, he serves as a Trustee of Boston College and as the Chairman of the Inner-City Scholarship Fund. |
Kimberley H. Monasterio (43) |
| Year of Election or Appointment: 2007 President and Treasurer of VIP Utilities. Ms. Monasterio also serves as President and Treasurer of other Fidelity funds (2007-present) and is an employee of FMR (2004-present). Previously, Ms. Monasterio served as Deputy Treasurer of the Fidelity funds (2004-2006). Before joining Fidelity Investments, Ms. Monasterio served as Treasurer (2000-2004) and Chief Financial Officer (2002-2004) of the Franklin Templeton Funds and Senior Vice President of Franklin Templeton Services, LLC (2000-2004). |
Boyce I. Greer (50) |
| Year of Election or Appointment: 2005 Vice President of VIP Utilities. Mr. Greer also serves as Vice President of certain Equity Funds (2005-present), certain Asset Allocation Funds (2005-present), Fixed-Income Funds (2006-present), and Money Market Funds (2006-present). Mr. Greer is also a Trustee of other investment companies advised by FMR (2003-present). He is an Executive Vice President of FMR (2005-present) and FMR Co., Inc. (2005-present), and Senior Vice President of Fidelity Investments Money Management, Inc. (2006-present). Previously, Mr. Greer served as a Director and Managing Director of Strategic Advisers, Inc. (2002-2005), and Executive Vice President (2000-2002) and Money Market Group Leader (1997-2002) of the Fidelity Investments Fixed Income Division. He also served as Vice President of Fidelity's Money Market Funds (1997-2002), Senior Vice President of FMR (1997-2002), and Vice President of FIMM (1998-2002). |
Eric D. Roiter (58) |
| Year of Election or Appointment: 2001 Secretary of VIP Utilities. He also serves as Secretary of other Fidelity funds; Vice President, General Counsel, and Secretary of FMR Co., Inc. (2001-present) and FMR; Assistant Secretary of Fidelity Management & Research (U.K.) Inc. (2001-present), Fidelity Research & Analysis Company (2001-present), and Fidelity Investments Money Management, Inc. (2001-present). Mr. Roiter is an Adjunct Member, Faculty of Law, at Boston College Law School (2003-present). Previously, Mr. Roiter served as Vice President and Secretary of Fidelity Distributors Corporation (FDC) (1998-2005). |
Stuart Fross (47) |
| Year of Election or Appointment: 2003 Assistant Secretary of VIP Utilities. Mr. Fross also serves as Assistant Secretary of other Fidelity funds (2003-present), Vice President and Secretary of FDC (2005-present), and is an employee of FMR. |
R. Stephen Ganis (40) |
| Year of Election or Appointment: 2006 Anti-Money Laundering (AML) officer of VIP Utilities. Mr. Ganis also serves as AML officer of other Fidelity funds (2006-present) and FMR Corp. (2003-present). Before joining Fidelity Investments, Mr. Ganis practiced law at Goodwin Procter, LLP (2000-2002). |
Joseph B. Hollis (58) |
| Year of Election or Appointment: 2006 Chief Financial Officer of VIP Utilities. Mr. Hollis also serves as Chief Financial Officer of other Fidelity funds. Mr. Hollis is President of Fidelity Pricing and Cash Management Services (FPCMS) (2005-present). Mr. Hollis also serves as President and Director of Fidelity Service Company, Inc. (2006-present). Previously, Mr. Hollis served as Senior Vice President of Cash Management Services (1999-2002) and Investment Management Operations (2002-2005). |
Kenneth A. Rathgeber (59) |
| Year of Election or Appointment: 2004 Chief Compliance Officer of VIP Utilities. Mr. Rathgeber also serves as Chief Compliance Officer of other Fidelity funds (2004-present) and Executive Vice President of Risk Oversight for Fidelity Investments (2002-present). He is Chief Compliance Officer of FMR (2005-present), FMR Co., Inc. (2005-present), Fidelity Management & Research (U.K.) Inc. (2005-present), Fidelity Research & Analysis Company (2005-present), Fidelity Investments Money Management, Inc. (2005-present), and Strategic Advisers, Inc. (2005-present). Previously, Mr. Rathgeber served as Executive Vice President and Chief Operating Officer for Fidelity Investments Institutional Services Company, Inc. (1998-2002). |
Bryan A. Mehrmann (45) |
| Year of Election or Appointment: 2005 Deputy Treasurer of VIP Utilities. Mr. Mehrmann also serves as Deputy Treasurer of other Fidelity funds (2005-present) and is an employee of FMR. Previously, Mr. Mehrmann served as Vice President of Fidelity Investments Institutional Services Group (FIIS)/ Fidelity Investments Institutional Operations Corporation, Inc. (FIIOC) Client Services (1998-2004). |
Kenneth B. Robins (37) |
| Year of Election or Appointment: 2005 Deputy Treasurer of VIP Utilities. Mr. Robins also serves as Deputy Treasurer of other Fidelity funds (2005-present) and is an employee of FMR (2004-present). Before joining Fidelity Investments, Mr. Robins worked at KPMG LLP, where he was a partner in KPMG's department of professional practice (2002-2004) and a Senior Manager (1999-2000). In addition, Mr. Robins served as Assistant Chief Accountant, United States Securities and Exchange Commission (2000-2002). |
Robert G. Byrnes (40) |
| Year of Election or Appointment: 2005 Assistant Treasurer of VIP Utilities. Mr. Byrnes also serves as Assistant Treasurer of other Fidelity funds (2005-present) and is an employee of FMR (2005-present). Previously, Mr. Byrnes served as Vice President of FPCMS (2003-2005). Before joining Fidelity Investments, Mr. Byrnes worked at Deutsche Asset Management where he served as Vice President of the Investment Operations Group (2000-2003). |
John H. Costello (60) |
| Year of Election or Appointment: 1991 Assistant Treasurer of VIP Utilities. Mr. Costello also serves as Assistant Treasurer of other Fidelity funds and is an employee of FMR. |
Peter L. Lydecker (52) |
| Year of Election or Appointment: 2004 Assistant Treasurer of VIP Utilities. Mr. Lydecker also serves as Assistant Treasurer of other Fidelity funds (2004) and is an employee of FMR. |
Mark Osterheld (51) |
| Year of Election or Appointment: 2002 Assistant Treasurer of VIP Utilities. Mr. Osterheld also serves as Assistant Treasurer of other Fidelity funds (2002) and is an employee of FMR. |
Gary W. Ryan (48) |
| Year of Election or Appointment: 2005 Assistant Treasurer of VIP Utilities. Mr. Ryan also serves as Assistant Treasurer of other Fidelity funds (2005-present) and is an employee of FMR (2005-present). Previously, Mr. Ryan served as Vice President of Fund Reporting in FPCMS (1999-2005). |
Salvatore Schiavone (41) |
| Year of Election or Appointment: 2005 Assistant Treasurer of VIP Utilities. Mr. Schiavone also serves as Assistant Treasurer of other Fidelity funds (2005-present) and is an employee of FMR (2005-present). Before joining Fidelity Investments, Mr. Schiavone worked at Deutsche Asset Management, where he most recently served as Assistant Treasurer (2003-2005) of the Scudder Funds and Vice President and Head of Fund Reporting (1996-2003). |
Annual Report
Distributions
The Board of Trustees of VIP Utilities Portfolio voted to pay to shareholders of record at the opening of business on record date, the following distributions per share derived from capital gains realized from sales of portfolio securities:
| Pay Date | Record Date | Capital Gains |
Initial Class | 02/09/07 | 02/09/07 | $.015 |
Investors Class | 02/09/07 | 02/09/07 | $.015 |
The fund hereby designates as a capital gain dividend with respect to the taxable year ended December 31, 2006, $6,800,274, or, if subsequently determined to be different, the net capital gain of such year.
Initial Class and Investor Class designates 64% and 65% of the dividends distributed in December 2006, respectively during the fiscal year as qualifying for the dividends-received deduction for corporate shareholders.
The fund will notify shareholders in January 2007 of amounts for use in preparing 2006 income tax returns.
VIP Utilities Portfolio
Proxy Voting Results
A special meeting of the fund's shareholders was held on September 20, 2006. The results of votes taken among shareholders on the proposals before them are reported below. Each vote reported represents one dollar of net asset value held on the record date for the meeting.
PROPOSAL 1 |
To elect a Board of Trustees. A |
| # of
Votes | % of
Votes |
Dennis J. Dirks |
Affirmative | 92,459,317.52 | 96.102 |
Withheld | 3,749,837.05 | 3.898 |
TOTAL | 96,209,154.57 | 100.00 |
Albert R. Gamper, Jr. |
Affirmative | 92,260,598.99 | 95.896 |
Withheld | 3,948,555.58 | 4.104 |
TOTAL | 96,209,154.57 | 100.000 |
Robert M. Gates |
Affirmative | 92,315,480.72 | 95.953 |
Withheld | 3,893,673.85 | 4.047 |
TOTAL | 96,209,154.57 | 100.000 |
George H. Heilmeier |
Affirmative | 92,208,255.41 | 95.841 |
Withheld | 4,000,899.16 | 4.159 |
TOTAL | 96,209,154.57 | 100.000 |
Edward C. Johnson 3d |
Affirmative | 91,928,267.76 | 95.550 |
Withheld | 4,280,886.81 | 4.450 |
TOTAL | 96,209,154.57 | 100.000 |
Stephen P. Jonas |
Affirmative | 92,457,628.76 | 96.101 |
Withheld | 3,751,525.81 | 3.899 |
TOTAL | 96,209,154.57 | 100.000 |
James H. KeyesB |
Affirmative | 92,432,729.82 | 96.075 |
Withheld | 3,776,424.75 | 3.925 |
TOTAL | 96,209,154.57 | 100.000 |
Marie L. Knowles |
Affirmative | 92,398,847.52 | 96.040 |
Withheld | 3,810,307.05 | 3.960 |
TOTAL | 96,209,154.57 | 100.000 |
Ned C. Lautenbach |
Affirmative | 92,423,184.47 | 96.065 |
Withheld | 3,785,970.10 | 3.935 |
TOTAL | 96,209,154.57 | 100.000 |
William O. McCoy |
Affirmative | 92,086,293.90 | 95.715 |
Withheld | 4,122,860.67 | 4.285 |
TOTAL | 96,209,154.57 | 100.000 |
| # of
Votes | % of
Votes |
Robert L. Reynolds |
Affirmative | 92,439,032.86 | 96.081 |
Withheld | 3,770,121.71 | 3.919 |
TOTAL | 96,209,154.57 | 100.000 |
Cornelia M. Small |
Affirmative | 92,415,567.29 | 96.057 |
Withheld | 3,793,587.28 | 3.943 |
TOTAL | 96,209,154.57 | 100.000 |
William S. Stavropoulos |
Affirmative | 92,135,400.08 | 95.766 |
Withheld | 4,073,754.49 | 4.234 |
TOTAL | 96,209,154.57 | 100.000 |
Kenneth L. Wolfe |
Affirmative | 92,445,865.31 | 96.088 |
Withheld | 3,763,289.26 | 3.912 |
TOTAL | 96,209,154.57 | 100.000 |
PROPOSAL 4A |
To modify the fund's fundamental concentration policy. |
| # of
Votes | % of
Votes |
Affirmative | 3,029,752.26 | 89.629 |
Against | 191,022.69 | 5.651 |
Abstain | 159,539.16 | 4.720 |
TOTAL | 3,380,314.11 | 100.000 |
A Denotes trust-wide proposal and voting results. B Effective on or about January 1, 2007. |
Annual Report
Board Approval of Investment Advisory Contracts and Management Fees
VIP Utilities Portfolio (formerly Telecommunications & Utilities Growth Portfolio)
Each year, typically in July, the Board of Trustees, including the Independent Trustees (together, the Board), votes on the renewal of the management contract and sub-advisory agreements (together, the Advisory Contracts) for the fund. The Board, assisted by the advice of fund counsel and Independent Trustees' counsel, requests and considers a broad range of information throughout the year.
The Board meets regularly each month except August and takes into account throughout the year matters bearing on Advisory Contracts. The Board, acting directly and through its separate committees, considers at each of its meetings factors that are relevant to the annual renewal of the fund's Advisory Contracts, including the services and support provided to the fund and its shareholders. At the time of the renewal, the Board had 12 standing committees, each composed of Independent Trustees with varying backgrounds, to which the Board has assigned specific subject matter responsibilities in order to enhance effective decision-making by the Board. Each committee has adopted a written charter outlining the structure and purposes of the committee. One such committee, the Equity Contract Committee, meets periodically as needed throughout the year to consider matters specifically related to the annual renewal of Advisory Contracts. The committee requests and receives information on, and makes recommendations to the Independent Trustees concerning, the approval and annual review of the Advisory Contracts.
At its July 2006 meeting, the Board of Trustees, including the Independent Trustees, unanimously determined to renew the Advisory Contracts for the fund. In reaching its determination, the Board considered all factors it believed relevant, including (i) the nature, extent, and quality of the services to be provided to the fund and its shareholders (including the investment performance of the fund); (ii) the competitiveness of the management fee and total expenses of the fund; (iii) the total costs of the services to be provided by and the profits to be realized by the investment adviser and its affiliates from the relationship with the fund; (iv) the extent to which economies of scale would be realized as the fund grows; and (v) whether fee levels reflect these economies of scale, if any, for the benefit of fund shareholders.
In determining whether to renew the Advisory Contracts for the fund, the Board ultimately reached a determination, with the assistance of fund counsel and Independent Trustees' counsel, that the renewal of the Advisory Contracts and the compensation to be received by Fidelity under the management contract is consistent with Fidelity's fiduciary duty under applicable law. In addition to evaluating the specific factors noted above, the Board, in reaching its determination, is aware that shareholders in the fund have a broad range of investment choices available to them, including a wide choice among mutual funds offered by competitors to Fidelity, and that the fund's shareholders, with the opportunity to review and weigh the disclosure provided by the fund in its prospectus and other public disclosures, have chosen to invest in this fund, managed by Fidelity.
Nature, Extent, and Quality of Services Provided. The Board considered staffing within the investment adviser, FMR, and the sub-advisers (together, the Investment Advisers), including the background of the fund's portfolio manager and the fund's investment objective and discipline. The Independent Trustees also had discussions with senior management of Fidelity's investment operations and investment groups. The Board considered the structure of the portfolio manager compensation program and whether this structure provides appropriate incentives.
Resources Dedicated to Investment Management and Support Services. The Board reviewed the size, education, and experience of the Investment Advisers' investment staff, their use of technology, and the Investment Advisers' approach to recruiting, training, and retaining portfolio managers and other research, advisory, and management personnel. The Board considered Fidelity's extensive global research capabilities that enable the Investment Advisers to aggregate data from various sources in an effort to produce positive investment results. The Board noted that Fidelity's analysts have access to a variety of technological tools that enable them to perform both fundamental and quantitative analysis and to specialize in various disciplines. The Board also considered that Fidelity's portfolio managers and analysts have access to daily portfolio attribution that allows for monitoring of a fund's portfolio, as well as an electronic communication system that provides immediate real-time access to research concerning issuers and credit enhancers.
Shareholder and Administrative Services. The Board considered (i) the nature, extent, quality, and cost of administrative, distribution, and shareholder services performed by the Investment Advisers and their affiliates under the Advisory Contracts and under separate agreements covering transfer agency, pricing and bookkeeping, and securities lending services for the fund; (ii) the nature and extent of the Investment Advisers' supervision of third party service providers, principally custodians and subcustodians; and (iii) the resources devoted to, and the record of compliance with, the fund's compliance policies and procedures. The Board reviewed the allocation of fund brokerage, including allocations to brokers affiliated with the Investment Advisers, the use of brokerage commissions to pay fund expenses, and the use of "soft" commission dollars to pay for research services. The Board also considered that Fidelity voluntarily pays for market data out of its own resources.
The Board noted that the growth of fund assets across the complex allows Fidelity to reinvest in the development of services designed to enhance the value or convenience of the Fidelity funds as investment vehicles. These services include 24-hour access to account information and market information through phone representatives and over the Internet, and investor education materials and asset allocation tools.
Investment in a Large Fund Family. The Board considered the benefits to shareholders of investing in a Fidelity fund, including the benefits of investing in a fund that is part of a large family of funds offering a variety of investment disciplines and providing for a large variety of mutual fund investor services. The Board noted that, since the last Advisory Contract renewals in July 2005, Fidelity has taken a number of actions that benefited particular funds, including (i) dedicating additional resources to investment research and to restructure the investment research teams; (ii) voluntarily entering into contractual arrangements with certain brokers pursuant to which Fidelity pays for research products and services separately out of its own resources, rather than bundling with fund commissions; (iii) launching the Fidelity Advantage Class of its five Spartan stock index funds and three Spartan bond index funds, which is a lower-fee class available to shareholders with higher account balances; (iv) contractually agreeing to impose expense limitations on Fidelity U.S. Bond Index Fund and reducing the fund's initial investment minimum; and (v) offering shareholders of each of the Fidelity Institutional Money Market Funds the privilege of exchanging shares of the fund for shares of other Fidelity funds.
VIP Utilities Portfolio
Investment Performance and Compliance. The Board considered whether the fund has operated within its investment objective, as well as its record of compliance with its investment restrictions. It also reviewed the fund's absolute investment performance for Initial Class, as well as the fund's relative investment performance for Initial Class measured against (i) a Goldman Sachs index that reflects the market sector in which the fund invests, and (ii) a peer group of mutual funds deemed appropriate by the Board over multiple periods. Because the fund had been in existence less than five calendar years, the following charts considered by the Board show, over the one- and three-year periods ended December 31, 2005, the cumulative total returns of Initial Class of the fund, the cumulative total returns of a Goldman Sachs index ("benchmark"), and a range of cumulative total returns of a peer group of mutual funds identified by Lipper Inc. as having an investment objective similar to that of the fund. (Investor Class of the fund had less than one year of performance as of December 31, 2005.) The box within each chart shows the 25th percentile return (bottom of box) and the 75th percentile return (top of box) of the Lipper peer group. Returns shown above the box are in the first quartile and returns shown below the box are in the fourth quartile. The percentage beaten number noted below each chart corresponds to the percentile box and represents the percentage of funds in the Lipper peer group whose performance was equal to or lower than that of Initial Class.
VIP Utilities Portfolio
The Board reviewed the fund's relative investment performance against its Lipper peer group and stated that the performance of Initial Class of the fund was in the third quartile for the one-year period and the second quartile for the three-year period. The Board also stated that the relative investment performance of Initial Class of the fund compared favorably to its benchmark for all the periods shown.
The Board considered that FMR has taken steps to refocus and strengthen equity research, equity portfolio management, and compliance. The Board noted with favor FMR's reorganization of its senior management team in 2005 and FMR's dedication of additional resources to investment research, and participated in the process that led to those changes.
Based on its review, and giving particular weight to the nature and quality of the resources dedicated by the Investment Advisers to maintain and improve relative performance, the Board concluded that the nature, extent, and quality of the services provided to the fund will benefit the fund's shareholders, particularly in light of the Board's view that the fund's shareholders benefit from investing in a fund that is part of a large family of funds offering a variety of investment disciplines and services.
Competitiveness of Management Fee and Total Fund Expenses. The Board considered the fund's management fee and total expenses compared to "mapped groups" of competitive funds and classes. Fidelity creates "mapped groups" by combining similar Lipper investment objective categories that have comparable management fee characteristics. Combining Lipper investment objective categories aids the Board's management fee and total expense comparisons by broadening the competitive group used for comparison and by reducing the number of universes to which various Fidelity funds are compared.
Annual Report
Board Approval of Investment Advisory Contracts and Management Fees - continued
The Board considered two proprietary management fee comparisons for the 12-month (or shorter) periods shown in the chart below. The group of Lipper funds used by the Board for management fee comparisons is referred to below as the "Total Mapped Group" and, for the reasons explained above, is broader than the Lipper peer group used by the Board for performance comparisons. The Total Mapped Group comparison focuses on a fund's standing relative to the total universe of comparable funds available to investors, in terms of gross management fees before expense reimbursements or caps. "TMG %" represents the percentage of funds in the Total Mapped Group that had management fees that were lower than the fund's. For example, a TMG % of 19% means that 81% of the funds in the Total Mapped Group had higher management fees than the fund. The "Asset-Size Peer Group" (ASPG) comparison focuses on a fund's standing relative to non-Fidelity funds similar in size to the fund within the Total Mapped Group. The ASPG represents at least 15% of the funds in the Total Mapped Group with comparable asset size and management fee characteristics, subject to a minimum of 50 funds (or all funds in the Total Mapped Group if fewer than 50). Additional information, such as the ASPG quartile in which the fund's management fee ranked, is also included in the chart and considered by the Board.
VIP Utilities Portfolio
The Board noted that the fund's management fee ranked below the median of its Total Mapped Group and below the median of its ASPG for 2005.
Based on its review, the Board concluded that the fund's management fee was fair and reasonable in light of the services that the fund receives and the other factors considered.
In its review of each class's total expenses, the Board considered the fund's management fee as well as other fund or class expenses, as applicable, such as transfer agent fees, pricing and bookkeeping fees, and custodial, legal, and audit fees. The Board also noted the effects of any waivers and reimbursements on fees and expenses. As part of its review, the Board also considered current and historical total expenses of each class of the fund compared to competitive fund median expenses. Each class of the fund is compared to those funds and classes in the Total Mapped Group (used by the Board for management fee comparisons) that have a similar sales load structure.
The Board noted that the total expenses of Initial Class ranked below its competitive median for 2005, and the total expenses of Investor Class ranked above its competitive median for 2005. The Board noted that the fund offers multiple classes and that the multiple structures are intended to offer pricing options for the intermediary market. The Board also noted that the total expenses of the classes vary primarily due to differences in transfer agent fees. The Board considered that Investor Class was above median primarily due to its higher transfer agent fee.
In its review of total expenses, the Board also considered Fidelity fee structures and other information on clients that FMR and its affiliates service in other competitive markets, such as other mutual funds advised or subadvised by FMR or its affiliates, pension plan clients, and other institutional clients.
Based on its review, the Board concluded that the total expenses of each class of the fund were reasonable, although in one case above the median of the universe presented for comparison, in light of the services that the fund and its shareholders receive and the other factors considered.
Costs of the Services and Profitability. The Board considered the revenues earned and the expenses incurred by Fidelity in conducting the business of developing, marketing, distributing, managing, administering and servicing the fund and its shareholders. The Board also considered the level of Fidelity's profits in respect of all the Fidelity funds.
VIP Utilities Portfolio
On an annual basis, FMR presents to the Board Fidelity's profitability for the fund. Fidelity calculates the profitability for each fund, as well as aggregate profitability for groups of Fidelity funds and all Fidelity funds, using a series of detailed revenue and cost allocation methodologies which originate with the audited books and records of Fidelity. The Audit Committee of the Board reviews any significant changes from the prior year's methodologies.
PricewaterhouseCoopers LLP (PwC), independent registered accounting firm and auditor to Fidelity and certain Fidelity funds, has been engaged annually by the Board as part of the Board's assessment of the results of Fidelity's profitability analysis. PwC's engagement includes the review and assessment of Fidelity's methodologies used in determining the revenues and expenses attributable to Fidelity's mutual fund business, and completion of agreed-upon procedures surrounding the mathematical accuracy of fund profitability and its conformity to allocation methodologies. After considering PwC's reports issued under the engagement and information provided by Fidelity, the Board believes that while other allocation methods may also be reasonable, Fidelity's profitability methodologies are reasonable in all material respects.
The Board has also reviewed Fidelity's non-fund businesses and any fall-out benefits related to the mutual fund business as well as cases where Fidelity's affiliates may benefit from or be related to the fund's business.
The Board considered the costs of the services provided by and the profits realized by Fidelity in connection with the operation of the fund and determined that the amount of profit is a fair entrepreneurial profit for the management of the fund.
Economies of Scale. The Board considered whether there have been economies of scale in respect of the management of the Fidelity funds, whether the Fidelity funds (including the fund) have appropriately benefited from any such economies of scale, and whether there is potential for realization of any further economies of scale. The Board considered the extent to which the fund will benefit from economies of scale through increased services to the fund, through waivers or reimbursements, or through fee or expense reductions.
The Board recognized that the fund's management contract incorporates a "group fee" structure, which provides for lower fee rates as total fund assets under FMR's management increase, and for higher fee rates as total fund assets under FMR's management decrease. The Board considered that the group fee is designed to deliver the benefits of economies of scale to fund shareholders when total fund assets increase, even if assets of any particular fund are unchanged or have declined, because some portion of Fidelity's costs are attributable to services provided to all Fidelity funds, and all funds benefit if those costs can be allocated among more assets. The Board concluded that, given the group fee structure, fund shareholders will achieve a certain level of economies of scale as assets under FMR's management increase at the fund complex level, regardless of whether Fidelity achieves any such economies of scale.
The Board further concluded that any potential economies of scale are being shared between fund shareholders and Fidelity in an appropriate manner.
Additional Information Requested by the Board. In order to develop fully the factual basis for consideration of the Advisory Contracts, the Board requested additional information on several topics, including (i) Fidelity's fund profitability methodology and profitability trends within certain funds; (ii) portfolio manager compensation; (iii) the extent to which any economies of scale exist and are shared between the funds and Fidelity; (iv) the total expenses of certain funds and classes relative to competitors, including the extent to which the expenses of certain funds have been or could be capped; (v) fund performance trends; and (vi) Fidelity's fee structures, including use of performance fees.
Based on its evaluation of all of the conclusions noted above, and after considering all material factors, the Board ultimately concluded that the advisory fee structures are fair and reasonable, and that the fund's Advisory Contracts should be renewed.
Annual Report
Investment Adviser
Fidelity Management & Research Company
Boston, MA
Investment Sub-Advisers
FMR Co., Inc.
Fidelity Management & Research (U.K.) Inc.
Fidelity Research & Analysis Company
(formerly Fidelity Management
& Research (Far East) Inc.)
Fidelity Investments Japan Limited
Fidelity International Investment Advisors
Fidelity International Investment Advisors
(U.K.) Limited
General Distributor
Fidelity Distributors Corporation
Boston, MA
Transfer and Service Agents
Fidelity Investments Institutional Operations Company, Inc.
Boston, MA
Fidelity Service Company, Inc.
Boston, MA
Custodian
JPMorgan Chase Bank
New York, NY
VTELIC-ANN-0207
1.817391.101
Fidelity® Variable Insurance Products:
Value Leaders Portfolio
Annual Report
December 31, 2006
(2_fidelity_logos) (Registered_Trademark)
Contents
Performance | <Click Here> | How the fund has done over time. |
Management's Discussion | <Click Here> | The manager's review of fund performance, strategy and outlook. |
Shareholder Expense Example | <Click Here> | An example of shareholder expenses. |
Investment Changes | <Click Here> | A summary of major shifts in the fund's investments over
the past six months. |
Investments | <Click Here> | A complete list of the fund's investments with their
market values. |
Financial Statements | <Click Here> | Statements of assets and liabilities, operations, and
changes in net assets, as well as financial highlights. |
Notes | <Click Here> | Notes to the financial statements. |
Report of Independent Registered Public Accounting Firm | <Click Here> | |
Trustees and Officers | <Click Here> | |
Distributions | <Click Here> | |
Proxy Voting Results | <Click Here> | |
Board Approval of Investment Advisory Contracts and Management Fees | <Click Here> | |
| | |
To view a fund's proxy voting guidelines and proxy voting record for the 12-month period ended June 30, visit www.fidelity.com/proxyvotingresults or visit the Securities and Exchange Commission's (SEC) web site at www.sec.gov. You may also call 1-877-208-0098 to request a free copy of the proxy voting guidelines.
Fidelity Variable Insurance Products are separate account options which are purchased through a variable insurance contract.
Standard & Poor's, S&P and S&P 500 are registered service marks of The McGraw-Hill Companies, Inc. and have been licensed for use by Fidelity Distributors Corporation.
Other third party marks appearing herein are the property of their respective owners.
All other marks appearing herein are registered or unregistered trademarks or service marks of FMR Corp. or an affiliated company.
This report and the financial statements contained herein are submitted for the general information of the shareholders of the fund. This report is not authorized for distribution to prospective investors in the fund unless preceded or accompanied by an effective prospectus.
A fund files its complete schedule of portfolio holdings with the SEC for the first and third quarters of each fiscal year on Form N-Q. Forms N-Q are available on the SEC's web site at http://www.sec.gov. A fund's Forms N-Q may be reviewed and copied at the SEC's Public Reference Room in Washington, DC. Information regarding the operation of the SEC's Public Reference Room may be obtained by calling 1-800-SEC-0330. For a complete list of a fund's portfolio holdings, view the most recent quarterly holdings report, semiannual report, or annual report on Fidelity's web site at http://www.advisor.fidelity.com.
NOT FDIC INSURED · MAY LOSE VALUE · NO BANK GUARANTEE
Neither the fund nor Fidelity Distributors Corporation is a bank.
VIP Value Leaders Portfolio
VIP Value Leaders Portfolio
Performance: The Bottom Line
Average annual total return reflects the change in the value of an investment, assuming reinvestment of the class' dividend income and capital gains (the profits earned upon the sale of securities that have grown in value) and assuming a constant rate of performance each year. During periods of reimbursement by Fidelity, a fund's total return will be greater than it would be had the reimbursement not occurred. Performance numbers are net of all underlying fund operating expenses, but do not include any insurance charges imposed by your insurance company's separate account. If performance information included the effect of these additional charges, the total returns would have been lower. How a fund did yesterday is no guarantee of how it will do tomorrow.
Average Annual Total Returns
Periods ended December 31, 2006 | | Past 1
year | Life of fund A |
VIP® Value Leaders - Initial Class | | 15.18% | 15.07% |
VIP Value Leaders - Service Class B | | 15.11% | 14.98% |
VIP Value Leaders - Service Class 2 C | | 14.86% | 14.80% |
VIP Value Leaders - Investor Class D | | 15.06% | 15.03% |
A From June 17, 2003.
B Performance for Service Class shares reflects an asset-based service fee (12b-1 fee).
C Performance for Service Class 2 shares reflects an asset-based service fee (12b-1 fee).
D The initial offering of Investor Class shares took place on July 21, 2005. Returns prior to July 21, 2005 are those of Initial Class. If Investor Class's transfer agent fee had been reflected, returns prior to July 21, 2005 would have been lower.
$10,000 Over Life of Fund
Let's say hypothetically that $10,000 was invested in VIP Value Leaders Portfolio - Initial Class on June 17, 2003, when the fund started. The chart shows how the value of your investment would have changed, and also shows how the Russell 1000® Value Index performed over the same period.
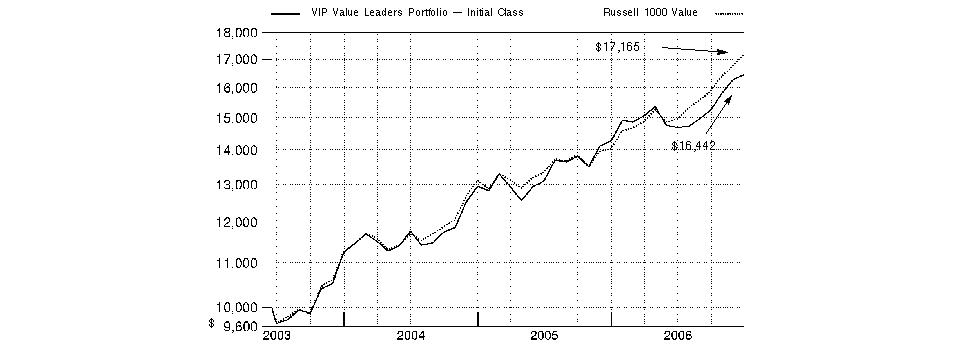
Annual Report
VIP Value Leaders Portfolio
Management's Discussion of Fund Performance
Comments from Charles Hebard, who became Portfolio Manager of VIP Value Leaders Portfolio on September 15, 2006
U.S. stock markets registered their fourth consecutive year of positive returns in 2006. Among the highlights were the performances of the Dow Jones Industrial AverageSM - a gauge of 30 mega-cap, blue-chip stocks - and the small-cap-oriented Russell 2000® Index, both of which reached new highs. The efforts of the Federal Reserve Board to contain inflation levels also dominated the investment headlines. In all, the Fed hiked short-term interest rates four times in 2006, but held rates steady after its June 29 increase, finally pausing after 17 rate hikes over a two-year period. A slowing residential housing market and moderating oil prices - the latter of which hit a record closing high of $77 per barrel in July before falling sharply - also held economic growth in check. For the year overall, the Standard & Poor's 500SM Index was up 15.79%, the Dow advanced 19.05%, the Russell 2000 Index gained 18.37% and the NASDAQ Composite® Index rose 10.39%.
For the 12-month period ending December 31, 2006, the fund underperformed the Russell 1000® Value Index, which returned 22.25%. (For specific portfolio performance results, please refer to the performance section of this report.) Positioning in the energy sector was particularly detrimental to relative performance. The fund was underweighted in integrated energy firms Exxon Mobil and Chevron, whose stocks rose sharply. Meanwhile, our holdings in oil field services companies BJ Services, which was not an index component, and National Oilwell Varco lost ground as investors worried that their customers would cut back on spending as oil prices fell. Elsewhere, positions in insurance giant American International Group and conglomerate General Electric dragged on results in financials and industrials, respectively. Gold producer Newmont Mining detracted as well. On the positive side, a number of fund holdings benefited from mergers and acquisitions. Oregon Steel Mills, which was not represented in the index, rose sharply on the news of its pending acquisition, and I sold our position to lock in profits. In the telecommunication services sector, AT&T stock was boosted by strong earnings and received a further boost when the market viewed its pending acquisition of BellSouth favorably. BellSouth's stock rose as well, however, and owning virtually none of it hurt relative results. The fund also benefited from owning Thermo Electron when it was announced that Thermo would acquire Fisher Scientific to form Thermo Fisher Scientific, a provider of medical measurement instruments. Owning integrated oil company ConocoPhillips and oil field services firm Schlumberger, which was not in the index, aided results as well. Some contributors and detractors I've mentioned were not held at period end.
The views expressed above reflect those of the portfolio manager only through the end of the period as stated on the cover of this report and do not necessarily represent the views of Fidelity or any other person in the Fidelity organization. Any such views are subject to change at any time based upon market or other conditions and Fidelity disclaims any responsibility to update such views. These views may not be relied on as investment advice and, because investment decisions for a Fidelity fund are based on numerous factors, may not be relied on as an indication of trading intent on behalf of any Fidelity fund.
VIP Value Leaders Portfolio
VIP Value Leaders Portfolio
Shareholder Expense Example
As a shareholder of the Fund, you incur two types of costs: (1) transaction costs, and (2) ongoing costs, including management fees, distribution and/or service (12b-1) fees and other Fund expenses. This Example is intended to help you understand your ongoing costs (in dollars) of investing in the Fund and to compare these costs with the ongoing costs of investing in other mutual funds.
The Example is based on an investment of $1,000 invested at the beginning of the period and held for the entire period (July 1, 2006 to December 31, 2006).
Actual Expenses
The first line of the accompanying table for each class of the Fund provides information about actual account values and actual expenses. You may use the information in this line, together with the amount you invested, to estimate the expenses that you paid over the period. Simply divide your account value by $1,000.00 (for example, an $8,600 account value divided by $1,000.00 = 8.6), then multiply the result by the number in the first line for a class of the Fund under the heading entitled "Expenses Paid During Period" to estimate the expenses you paid on your account during this period. The estimate of expenses does not include any fees or other expenses of any variable annuity or variable life insurance product. If they were, the estimate of expenses you paid during the period would be higher, and your ending account value would be lower.
Hypothetical Example for Comparison Purposes
The second line of the accompanying table for each class of the Fund provides information about hypothetical account values and hypothetical expenses based on a Class' actual expense ratio and an assumed rate of return of 5% per year before expenses, which is not the Class' actual return. The hypothetical account values and expenses may not be used to estimate the actual ending account balance or expenses you paid for the period. You may use this information to compare the ongoing costs of investing in the Fund and other funds. To do so, compare this 5% hypothetical example with the 5% hypothetical examples that appear in the shareholder reports of the other funds. The estimate of expenses does not include any fees or other expenses of any variable annuity or variable life insurance product. If they were, the estimate of expenses you paid during the period would be higher, and your ending account value would be lower.
Please note that the expenses shown in the table are meant to highlight your ongoing costs only and do not reflect any transaction costs. Therefore, the second line of the table is useful in comparing ongoing costs only, and will not help you determine the relative total costs of owning different funds.
| Beginning
Account Value
July 1, 2006 | Ending
Account Value
December 31, 2006 | Expenses Paid
During Period*
July 1, 2006
to December 31, 2006 |
Initial Class | | | |
Actual | $ 1,000.00 | $ 1,119.40 | $ 4.43 |
HypotheticalA | $ 1,000.00 | $ 1,021.02 | $ 4.23 |
Service Class | | | |
Actual | $ 1,000.00 | $ 1,118.70 | $ 4.91 |
HypotheticalA | $ 1,000.00 | $ 1,020.57 | $ 4.69 |
Service Class 2 | | | |
Actual | $ 1,000.00 | $ 1,117.80 | $ 5.87 |
HypotheticalA | $ 1,000.00 | $ 1,019.66 | $ 5.60 |
Investor Class | | | |
Actual | $ 1,000.00 | $ 1,119.10 | $ 5.13 |
HypotheticalA | $ 1,000.00 | $ 1,020.37 | $ 4.89 |
A 5% return per year before expenses
* Expenses are equal to each Class' annualized expense ratio (shown in the table below); multiplied by the average account value over the period, multiplied by 184/365 (to reflect the one-half year period).
| Annualized
Expense Ratio |
Initial Class | .83% |
Service Class | .92% |
Service Class 2 | 1.10% |
Investor Class | .96% |
Annual Report
VIP Value Leaders Portfolio
Investment Changes
Top Ten Stocks as of December 31, 2006 |
| % of fund's
net assets | % of fund's net assets
6 months ago |
General Electric Co. | 3.7 | 3.7 |
AT&T, Inc. | 3.5 | 2.5 |
American International Group, Inc. | 3.4 | 3.4 |
Bank of America Corp. | 3.1 | 2.0 |
Exxon Mobil Corp. | 2.9 | 2.5 |
JPMorgan Chase & Co. | 2.5 | 2.4 |
Wachovia Corp. | 2.3 | 0.9 |
Pfizer, Inc. | 2.0 | 1.7 |
ConocoPhillips | 1.9 | 0.3 |
Honeywell International, Inc. | 1.8 | 3.9 |
| 27.1 | |
Top Five Market Sectors as of December 31, 2006 |
| % of fund's
net assets | % of fund's net assets
6 months ago |
Financials | 31.1 | 23.0 |
Energy | 14.6 | 12.7 |
Industrials | 10.4 | 15.4 |
Health Care | 7.8 | 11.3 |
Consumer Discretionary | 7.6 | 10.3 |
Asset Allocation (% of fund's net assets) |
As of December 31, 2006* | As of June 30, 2006** |
| Stocks 99.4% | | | Stocks 98.4% | |
| Short-Term Investments
and Net Other Assets 0.6% | | | Short-Term Investments
and Net Other Assets 1.6% | |
* Foreign investments | 14.7% | | ** Foreign investments | 9.3% | |

VIP Value Leaders Portfolio
VIP Value Leaders Portfolio
Investments December 31, 2006
Showing Percentage of Net Assets
Common Stocks - 99.4% |
| Shares | | Value (Note 1) |
CONSUMER DISCRETIONARY - 7.6% |
Automobiles - 0.2% |
Renault SA | 1,500 | | $ 180,207 |
Diversified Consumer Services - 0.7% |
Apollo Group, Inc. Class A (a) | 14,700 | | 572,859 |
Hotels, Restaurants & Leisure - 0.5% |
McDonald's Corp. | 8,340 | | 369,712 |
Household Durables - 1.6% |
D.R. Horton, Inc. | 8,400 | | 222,516 |
KB Home | 3,400 | | 174,352 |
M.D.C. Holdings, Inc. (d) | 7,700 | | 439,285 |
Sony Corp. sponsored ADR | 6,900 | | 295,527 |
Toll Brothers, Inc. (a) | 3,300 | | 106,359 |
| | 1,238,039 |
Leisure Equipment & Products - 0.4% |
Eastman Kodak Co. | 11,920 | | 307,536 |
Media - 1.3% |
Comcast Corp. Class A | 8,700 | | 368,271 |
Live Nation, Inc. (a) | 2,729 | | 61,130 |
The Walt Disney Co. | 16,330 | | 559,629 |
| | 989,030 |
Multiline Retail - 1.2% |
Federated Department Stores, Inc. | 11,800 | | 449,934 |
Saks, Inc. | 8,500 | | 151,470 |
Sears Holdings Corp. (a) | 1,800 | | 302,274 |
Tuesday Morning Corp. | 4,000 | | 62,200 |
| | 965,878 |
Specialty Retail - 1.7% |
Best Buy Co., Inc. | 4,150 | | 204,139 |
Home Depot, Inc. | 8,350 | | 335,336 |
OfficeMax, Inc. | 3,600 | | 178,740 |
Staples, Inc. | 7,600 | | 202,920 |
TJX Companies, Inc. | 4,800 | | 136,896 |
Williams-Sonoma, Inc. | 7,700 | | 242,088 |
| | 1,300,119 |
TOTAL CONSUMER DISCRETIONARY | | 5,923,380 |
CONSUMER STAPLES - 7.2% |
Beverages - 1.1% |
Diageo PLC sponsored ADR | 4,700 | | 372,757 |
PepsiAmericas, Inc. | 7,300 | | 153,154 |
The Coca-Cola Co. | 6,900 | | 332,925 |
| | 858,836 |
Food & Staples Retailing - 1.8% |
CVS Corp. | 3,800 | | 117,458 |
Kroger Co. | 18,100 | | 417,567 |
Rite Aid Corp. (d) | 53,300 | | 289,952 |
Wal-Mart Stores, Inc. | 12,000 | | 554,160 |
| | 1,379,137 |
|
| Shares | | Value (Note 1) |
Food Products - 1.3% |
Chiquita Brands International, Inc. | 9,000 | | $ 143,730 |
Nestle SA (Reg.) | 1,504 | | 534,257 |
PAN Fish ASA (a) | 135,000 | | 123,417 |
Tyson Foods, Inc. Class A | 12,000 | | 197,400 |
| | 998,804 |
Household Products - 0.6% |
Colgate-Palmolive Co. | 8,000 | | 521,920 |
Personal Products - 0.8% |
Avon Products, Inc. | 18,700 | | 617,848 |
Tobacco - 1.6% |
Altria Group, Inc. | 10,820 | | 928,572 |
British American Tobacco PLC sponsored ADR | 5,300 | | 300,298 |
| | 1,228,870 |
TOTAL CONSUMER STAPLES | | 5,605,415 |
ENERGY - 14.6% |
Energy Equipment & Services - 5.7% |
Baker Hughes, Inc. | 9,700 | | 724,202 |
GlobalSantaFe Corp. | 13,300 | | 781,774 |
National Oilwell Varco, Inc. (a) | 16,263 | | 994,970 |
Noble Corp. | 5,300 | | 403,595 |
Pride International, Inc. (a) | 7,300 | | 219,073 |
Smith International, Inc. | 19,700 | | 809,079 |
Transocean, Inc. (a) | 6,600 | | 533,874 |
| | 4,466,567 |
Oil, Gas & Consumable Fuels - 8.9% |
Apache Corp. | 2,900 | | 192,879 |
Chesapeake Energy Corp. | 7,800 | | 226,590 |
ConocoPhillips | 20,480 | | 1,473,536 |
CONSOL Energy, Inc. | 11,100 | | 356,643 |
Exxon Mobil Corp. | 29,000 | | 2,222,270 |
Noble Energy, Inc. | 5,500 | | 269,885 |
OAO Gazprom sponsored ADR | 3,700 | | 171,680 |
Occidental Petroleum Corp. | 11,300 | | 551,779 |
Quicksilver Resources, Inc. (a) | 10,400 | | 380,536 |
SK Corp. | 2,280 | | 178,968 |
Ultra Petroleum Corp. (a) | 6,800 | | 324,700 |
Valero Energy Corp. | 11,000 | | 562,760 |
| | 6,912,226 |
TOTAL ENERGY | | 11,378,793 |
FINANCIALS - 31.1% |
Capital Markets - 3.0% |
Charles Schwab Corp. | 9,268 | | 179,243 |
Investors Financial Services Corp. | 9,500 | | 405,365 |
KKR Private Equity Investors, LP | 14,538 | | 319,836 |
KKR Private Equity Investors, LP Restricted Depositary Units (e) | 1,700 | | 37,400 |
Morgan Stanley | 8,100 | | 659,583 |
Common Stocks - continued |
| Shares | | Value (Note 1) |
FINANCIALS - continued |
Capital Markets - continued |
Nomura Holdings, Inc. | 10,200 | | $ 192,348 |
State Street Corp. | 4,000 | | 269,760 |
UBS AG (NY Shares) | 5,200 | | 313,716 |
| | 2,377,251 |
Commercial Banks - 6.5% |
Banco Bilbao Vizcaya Argentaria SA | 12,600 | | 303,156 |
Bank Hapoalim BM (Reg.) | 31,100 | | 146,415 |
Colonial Bancgroup, Inc. | 8,700 | | 223,938 |
HSBC Holdings PLC sponsored ADR | 5,200 | | 476,580 |
Kookmin Bank sponsored ADR | 2,500 | | 201,600 |
Mizuho Financial Group, Inc. | 26 | | 185,636 |
U.S. Bancorp, Delaware | 31,800 | | 1,150,842 |
Unicredito Italiano Spa | 36,200 | | 317,334 |
Wachovia Corp. | 31,601 | | 1,799,677 |
Wells Fargo & Co. | 8,040 | | 285,902 |
| | 5,091,080 |
Diversified Financial Services - 5.6% |
Bank of America Corp. | 44,908 | | 2,397,638 |
JPMorgan Chase & Co. | 40,196 | | 1,941,467 |
| | 4,339,105 |
Insurance - 10.4% |
ACE Ltd. | 13,520 | | 818,906 |
AFLAC, Inc. | 6,200 | | 285,200 |
American International Group, Inc. | 37,360 | | 2,677,218 |
Aspen Insurance Holdings Ltd. | 16,000 | | 421,760 |
Everest Re Group Ltd. | 2,400 | | 235,464 |
Genworth Financial, Inc. Class A (non-vtg.) | 5,900 | | 201,839 |
Hartford Financial Services Group, Inc. | 7,700 | | 718,487 |
IPC Holdings Ltd. | 14,938 | | 469,800 |
Max Re Capital Ltd. | 15,649 | | 388,408 |
MBIA, Inc. | 2,200 | | 160,732 |
Montpelier Re Holdings Ltd. | 17,100 | | 318,231 |
Platinum Underwriters Holdings Ltd. | 14,000 | | 433,160 |
The Chubb Corp. | 5,100 | | 269,841 |
The St. Paul Travelers Companies, Inc. | 13,800 | | 740,922 |
| | 8,139,968 |
Real Estate Investment Trusts - 1.7% |
Annaly Capital Management, Inc. | 12,900 | | 179,439 |
Equity Residential (SBI) | 10,700 | | 543,025 |
General Growth Properties, Inc. | 11,070 | | 578,186 |
| | 1,300,650 |
Real Estate Management & Development - 0.5% |
Mitsubishi Estate Co. Ltd. | 14,000 | | 362,201 |
Thrifts & Mortgage Finance - 3.4% |
Countrywide Financial Corp. | 17,000 | | 721,650 |
Fannie Mae | 19,210 | | 1,140,882 |
|
| Shares | | Value (Note 1) |
Freddie Mac | 2,700 | | $ 183,330 |
Hudson City Bancorp, Inc. | 10,600 | | 147,128 |
Washington Mutual, Inc. | 10,300 | | 468,547 |
| | 2,661,537 |
TOTAL FINANCIALS | | 24,271,792 |
HEALTH CARE - 7.8% |
Biotechnology - 0.4% |
Biogen Idec, Inc. (a) | 2,500 | | 122,975 |
Cephalon, Inc. (a) | 3,169 | | 223,129 |
| | 346,104 |
Health Care Equipment & Supplies - 1.0% |
Baxter International, Inc. | 7,880 | | 365,553 |
C.R. Bard, Inc. | 1,500 | | 124,455 |
Cooper Companies, Inc. | 2,700 | | 120,150 |
Inverness Medical Innovations, Inc. (a) | 3,700 | | 143,190 |
| | 753,348 |
Health Care Providers & Services - 0.8% |
Brookdale Senior Living, Inc. | 7,400 | | 355,200 |
UnitedHealth Group, Inc. | 5,300 | | 284,769 |
| | 639,969 |
Life Sciences Tools & Services - 0.7% |
Thermo Fisher Scientific, Inc. (a) | 6,100 | | 276,269 |
Waters Corp. (a) | 5,100 | | 249,747 |
| | 526,016 |
Pharmaceuticals - 4.9% |
Bristol-Myers Squibb Co. | 11,300 | | 297,416 |
Johnson & Johnson | 3,600 | | 237,672 |
Merck & Co., Inc. | 30,300 | | 1,321,080 |
Pfizer, Inc. | 59,320 | | 1,536,388 |
Schering-Plough Corp. | 7,650 | | 180,846 |
Wyeth | 4,460 | | 227,103 |
| | 3,800,505 |
TOTAL HEALTH CARE | | 6,065,942 |
INDUSTRIALS - 10.4% |
Aerospace & Defense - 2.9% |
General Dynamics Corp. | 7,200 | | 535,320 |
Hexcel Corp. (a) | 9,300 | | 161,913 |
Honeywell International, Inc. | 31,900 | | 1,443,156 |
Raytheon Co. | 2,900 | | 153,120 |
| | 2,293,509 |
Air Freight & Logistics - 0.3% |
United Parcel Service, Inc. Class B | 3,500 | | 262,430 |
Airlines - 0.2% |
AirTran Holdings, Inc. (a) | 15,900 | | 186,666 |
Building Products - 0.4% |
Masco Corp. | 9,000 | | 268,830 |
Common Stocks - continued |
| Shares | | Value (Note 1) |
INDUSTRIALS - continued |
Commercial Services & Supplies - 0.4% |
Cintas Corp. | 3,100 | | $ 123,101 |
The Brink's Co. | 3,100 | | 198,152 |
| | 321,253 |
Construction & Engineering - 0.5% |
Chicago Bridge & Iron Co. NV (NY Shares) | 3,300 | | 90,222 |
Fluor Corp. | 3,600 | | 293,940 |
| | 384,162 |
Electrical Equipment - 0.3% |
SolarWorld AG | 3,400 | | 213,661 |
Industrial Conglomerates - 4.5% |
General Electric Co. | 76,540 | | 2,848,053 |
Textron, Inc. | 1,400 | | 131,278 |
Tyco International Ltd. | 16,030 | | 487,312 |
| | 3,466,643 |
Machinery - 0.7% |
Caterpillar, Inc. | 1,700 | | 104,261 |
Deere & Co. | 1,650 | | 156,866 |
Oshkosh Truck Co. | 5,300 | | 256,626 |
| | 517,753 |
Road & Rail - 0.2% |
CSX Corp. | 5,100 | | 175,593 |
TOTAL INDUSTRIALS | | 8,090,500 |
INFORMATION TECHNOLOGY - 7.0% |
Communications Equipment - 1.1% |
Harris Corp. | 7,800 | | 357,708 |
Motorola, Inc. | 16,600 | | 341,296 |
Nokia Corp. sponsored ADR | 7,700 | | 156,464 |
| | 855,468 |
Computers & Peripherals - 2.0% |
Dell, Inc. (a) | 6,000 | | 150,540 |
Hewlett-Packard Co. | 16,800 | | 691,992 |
International Business Machines Corp. | 6,200 | | 602,330 |
Seagate Technology | 5,600 | | 148,400 |
| | 1,593,262 |
Electronic Equipment & Instruments - 0.9% |
Agilent Technologies, Inc. (a) | 6,700 | | 233,495 |
Amphenol Corp. Class A | 1,100 | | 68,288 |
Flextronics International Ltd. (a) | 22,100 | | 253,708 |
Motech Industries, Inc. | 14,000 | | 172,717 |
| | 728,208 |
IT Services - 0.6% |
First Data Corp. | 7,100 | | 181,192 |
Infosys Technologies Ltd. sponsored ADR | 2,100 | | 114,576 |
The Western Union Co. | 6,500 | | 145,730 |
| | 441,498 |
|
| Shares | | Value (Note 1) |
Office Electronics - 0.2% |
Zebra Technologies Corp. Class A (a) | 3,900 | | $ 135,681 |
Semiconductors & Semiconductor Equipment - 1.5% |
Analog Devices, Inc. | 5,000 | | 164,350 |
Applied Materials, Inc. | 8,400 | | 154,980 |
Intel Corp. | 11,700 | | 236,925 |
Marvell Technology Group Ltd. (a) | 8,900 | | 170,791 |
National Semiconductor Corp. | 9,900 | | 224,730 |
Spansion, Inc. Class A | 12,200 | | 181,292 |
| | 1,133,068 |
Software - 0.7% |
Compuware Corp. (a) | 14,500 | | 120,785 |
Electronic Arts, Inc. (a) | 2,700 | | 135,972 |
Symantec Corp. (a) | 13,200 | | 275,220 |
| | 531,977 |
TOTAL INFORMATION TECHNOLOGY | | 5,419,162 |
MATERIALS - 3.2% |
Chemicals - 0.5% |
Chemtura Corp. | 18,600 | | 179,118 |
Ecolab, Inc. | 5,300 | | 239,560 |
| | 418,678 |
Containers & Packaging - 0.3% |
Smurfit-Stone Container Corp. (a) | 17,846 | | 188,454 |
Metals & Mining - 2.2% |
Alcoa, Inc. | 6,300 | | 189,063 |
Allegheny Technologies, Inc. | 1,080 | | 97,934 |
Carpenter Technology Corp. | 2,100 | | 215,292 |
Freeport-McMoRan Copper & Gold, Inc. Class B | 7,100 | | 395,683 |
Mittal Steel Co. NV Class A (NY Shares) | 4,200 | | 177,156 |
Newmont Mining Corp. | 10,050 | | 453,758 |
Reliance Steel & Aluminum Co. | 4,800 | | 189,024 |
| | 1,717,910 |
Paper & Forest Products - 0.2% |
Weyerhaeuser Co. | 2,400 | | 169,560 |
TOTAL MATERIALS | | 2,494,602 |
TELECOMMUNICATION SERVICES - 5.9% |
Diversified Telecommunication Services - 5.6% |
AT&T, Inc. | 74,990 | | 2,680,893 |
BellSouth Corp. | 10,000 | | 471,100 |
Verizon Communications, Inc. | 31,900 | | 1,187,956 |
| | 4,339,949 |
Wireless Telecommunication Services - 0.3% |
American Tower Corp. Class A (a) | 7,250 | | 270,280 |
TOTAL TELECOMMUNICATION SERVICES | | 4,610,229 |
Common Stocks - continued |
| Shares | | Value (Note 1) |
UTILITIES - 4.6% |
Electric Utilities - 1.6% |
E.ON AG sponsored ADR | 6,600 | | $ 298,254 |
Edison International | 11,900 | | 541,212 |
FPL Group, Inc. | 7,300 | | 397,266 |
| | 1,236,732 |
Independent Power Producers & Energy Traders - 1.2% |
AES Corp. (a) | 19,200 | | 423,168 |
Constellation Energy Group, Inc. | 7,900 | | 544,073 |
| | 967,241 |
Multi-Utilities - 1.8% |
CMS Energy Corp. (a) | 12,400 | | 207,080 |
Duke Energy Corp. | 17,200 | | 571,212 |
Public Service Enterprise Group, Inc. | 9,200 | | 610,696 |
| | 1,388,988 |
TOTAL UTILITIES | | 3,592,961 |
TOTAL COMMON STOCKS (Cost $69,042,377) | 77,452,776 |
Money Market Funds - 1.4% |
| Shares | | Value (Note 1) |
Fidelity Cash Central Fund, 5.37% (b) | 537,755 | | $ 537,755 |
Fidelity Securities Lending Cash Central Fund, 5.38% (b)(c) | 544,100 | | 544,100 |
TOTAL MONEY MARKET FUNDS (Cost $1,081,855) | 1,081,855 |
TOTAL INVESTMENT PORTFOLIO - 100.8% (Cost $70,124,232) | | 78,534,631 |
NET OTHER ASSETS - (0.8)% | | (609,634) |
NET ASSETS - 100% | $ 77,924,997 |
Legend |
(a) Non-income producing |
(b) Affiliated fund that is available only to investment companies and other accounts managed by Fidelity Investments. The rate quoted is the annualized seven-day yield of the fund at period end. A complete unaudited listing of the fund's holdings as of its most recent quarter end is available upon request. |
(c) Investment made with cash collateral received from securities on loan. |
(d) Security or a portion of the security is on loan at period end. |
(e) Security exempt from registration under Rule 144A of the Securities Act of 1933. These securities may be resold in transactions exempt from registration, normally to qualified institutional buyers. At the end of the period, the value of these securities amounted to $37,400 or 0.0% of net assets. |
Affiliated Central Funds |
Information regarding fiscal year to date income earned by the Fund from investments in Fidelity Central Funds is as follows: |
Fund | Income earned |
Fidelity Cash Central Fund | $ 70,178 |
Fidelity Securities Lending Cash Central Fund | 2,546 |
Total | $ 72,724 |
Other Information |
Distribution of investments by country of issue, as a percentage of total net assets, is as follows: |
United States of America | 85.3% |
Bermuda | 3.1% |
Cayman Islands | 2.8% |
United Kingdom | 2.0% |
Japan | 1.4% |
Switzerland | 1.1% |
Others (individually less than 1%) | 4.3% |
| 100.0% |
See accompanying notes which are an integral part of the financial statements.
VIP Value Leaders Portfolio
VIP Value Leaders Portfolio
Financial Statements
Statement of Assets and Liabilities
| December 31, 2006 |
| | |
Assets | | |
Investment in securities, at value (including securities loaned of $532,867) - See accompanying schedule: Unaffiliated issuers
(cost $69,042,377) | $ 77,452,776 | |
Fidelity Central Funds (cost $1,081,855) | 1,081,855 | |
Total Investments (cost $70,124,232) | | $ 78,534,631 |
Dividends receivable | | 124,509 |
Interest receivable | | 2,786 |
Prepaid expenses | | 305 |
Receivable from investment adviser for expense reductions | | 356 |
Other receivables | | 2,200 |
Total assets | | 78,664,787 |
| | |
Liabilities | | |
Payable to custodian bank | $ 39,236 | |
Payable for investments purchased | 56,824 | |
Accrued management fee | 36,016 | |
Distribution fees payable | 1,128 | |
Other affiliated payables | 9,616 | |
Other payables and accrued expenses | 52,870 | |
Collateral on securities loaned, at value | 544,100 | |
Total liabilities | | 739,790 |
| | |
Net Assets | | $ 77,924,997 |
Net Assets consist of: | | |
Paid in capital | | $ 68,441,042 |
Undistributed net investment income | | 13,644 |
Accumulated undistributed net realized gain (loss) on investments and foreign currency transactions | | 1,059,850 |
Net unrealized appreciation (depreciation) on investments and assets and liabilities in foreign currencies | | 8,410,461 |
Net Assets | | $ 77,924,997 |
Statement of Assets and Liabilities - continued
| December 31, 2006 |
| | |
Initial Class:
Net Asset Value, offering price and redemption price per share ($42,725,430 ÷ 2,882,775 shares) | | $ 14.82 |
| | |
Service Class:
Net Asset Value, offering price and redemption price per share ($2,458,389 ÷ 166,159 shares) | | $ 14.80 |
| | |
Service Class 2:
Net Asset Value, offering price and redemption price per share ($4,466,992 ÷ 302,917 shares) | | $ 14.75 |
| | |
Investor Class:
Net Asset Value, offering price and redemption price per share ($28,274,186 ÷ 1,909,750 shares) | | $ 14.81 |
See accompanying notes which are an integral part of the financial statements.
Annual Report
VIP Value Leaders Portfolio
Financial Statements - continued
Statement of Operations
| Year ended December 31, 2006 |
| | |
Investment Income | | |
Dividends | | $ 1,119,649 |
Interest | | 98 |
Income from Fidelity Central Funds | | 72,724 |
Total income | | 1,192,471 |
| | |
Expenses | | |
Management fee | $ 349,764 | |
Transfer agent fees | 65,381 | |
Distribution fees | 11,114 | |
Accounting and security lending fees | 25,601 | |
Custodian fees and expenses | 32,571 | |
Independent trustees' compensation | 220 | |
Audit | 47,233 | |
Legal | 2,545 | |
Miscellaneous | 17,348 | |
Total expenses before reductions | 551,777 | |
Expense reductions | (5,829) | 545,948 |
Net investment income (loss) | | 646,523 |
Realized and Unrealized Gain (Loss) Net realized gain (loss) on: | | |
Investment securities: | | |
Unaffiliated issuers (net of foreign taxes of $20) | 2,928,706 | |
Foreign currency transactions | 425 | |
Total net realized gain (loss) | | 2,929,131 |
Change in net unrealized appreciation (depreciation) on: Investment securities | 5,333,734 | |
Assets and liabilities in foreign currencies | 59 | |
Total change in net unrealized appreciation (depreciation) | | 5,333,793 |
Net gain (loss) | | 8,262,924 |
Net increase (decrease) in net assets resulting from operations | | $ 8,909,447 |
Statement of Changes in Net Assets
| Year ended
December 31,
2006 | Year ended
December 31,
2005 |
Increase (Decrease) in Net Assets | | |
Operations | | |
Net investment income (loss) | $ 646,523 | $ 186,499 |
Net realized gain (loss) | 2,929,131 | 70,602 |
Change in net unrealized appreciation (depreciation) | 5,333,793 | 1,998,748 |
Net increase (decrease) in net assets resulting from operations | 8,909,447 | 2,255,849 |
Distributions to shareholders from net investment income | (632,567) | (191,000) |
Distributions to shareholders from net realized gain | (1,820,096) | (170,524) |
Total distributions | (2,452,663) | (361,524) |
Share transactions - net increase (decrease) | 24,630,755 | 38,477,642 |
Total increase (decrease) in net assets | 31,087,539 | 40,371,967 |
| | |
Net Assets | | |
Beginning of period | 46,837,458 | 6,465,491 |
End of period (including undistributed net investment income of $13,644 and $0, respectively) | $ 77,924,997 | $ 46,837,458 |
See accompanying notes which are an integral part of the financial statements.
VIP Value Leaders Portfolio
Financial Highlights - Initial Class
Years ended December 31, | 2006 | 2005 | 2004 | 2003 I |
Selected Per-Share Data | | | | |
Net asset value, beginning of period | $ 13.30 | $ 12.28 | $ 11.20 | $ 10.00 |
Income from Investment Operations | | | | |
Net investment income (loss) E | .15 | .13 | .10 H | .04 |
Net realized and unrealized gain (loss) | 1.86 | 1.11 | 1.59 | 1.21 |
Total from investment operations | 2.01 | 1.24 | 1.69 | 1.25 |
Distributions from net investment income | (.13) | (.07) | (.08) | (.04) |
Distributions from net realized gain | (.37) | (.16) | (.53) | (.01) |
Total distributions | (.49) L | (.22) K | (.61) | (.05) |
Net asset value, end of period | $ 14.82 | $ 13.30 | $ 12.28 | $ 11.20 |
Total Return B, C, D | 15.18% | 10.18% | 15.15% | 12.51% |
Ratios to Average Net Assets F, J | | | | |
Expenses before reductions | .84% | .98% | 2.07% | 3.63% A |
Expenses net of fee waivers, if any | .84% | .85% | 1.00% | 1.06% A |
Expenses net of all reductions | .83% | .81% | .96% | 1.04% A |
Net investment income (loss) | 1.09% | 1.00% | .88% | .78% A |
Supplemental Data | | | | |
Net assets, end of period (000 omitted) | $ 42,725 | $ 37,465 | $ 1,944 | $ 1,687 |
Portfolio turnover rate G | 94% | 75% | 121% | 119% A |
A Annualized
B Total returns for periods of less than one year are not annualized.
C Total returns do not reflect charges attributable to your insurance company's separate account. Inclusion of these charges would reduce the total returns shown.
D Total returns would have been lower had certain expenses not been reduced during the periods shown.
E Calculated based on average shares outstanding during the period.
F Fees and expenses of the underlying Fidelity Central Funds are not included in the Fund's expense ratio. The Fund indirectly bears its proportionate share of the expenses of any underlying Fidelity Central Funds.
G Amount does not include the portfolio activity of any underlying Fidelity Central Funds.
H Investment income per share reflects a special dividend which amounted to $.02 per share.
I For the period June 17, 2003 (commencement of operations) to December 31, 2003.
J Expense ratios reflect operating expenses of the class. Expenses before reductions do not reflect amounts reimbursed by the investment adviser or reductions from brokerage service arrangements or other expense offset arrangements and do not represent the amount paid by the class during periods when reimbursements or reductions occur. Expense ratios before reductions for start-up periods may not be representative of longer-term operating periods. Expenses net of fee waivers reflect expenses after reimbursement by the investment adviser but prior to reductions from brokerage service arrangements or other expense offset arrangements. Expenses net of all reductions represent the net expenses paid by the class.
K Total distributions of $.22 per share is comprised of distributions from net investment income of $.066 and distributions from net realized gain of $.155 per share.
L Total distributions of $.49 per share is comprised of distributions from net investment income of $.129 and distributions from net realized gain of $.365 per share.
Financial Highlights - Service Class
Years ended December 31, | 2006 | 2005 | 2004 | 2003 I |
Selected Per-Share Data | | | | |
Net asset value, beginning of period | $ 13.28 | $ 12.26 | $ 11.19 | $ 10.00 |
Income from Investment Operations | | | | |
Net investment income (loss) E | .14 | .10 | .09 H | .04 |
Net realized and unrealized gain (loss) | 1.86 | 1.13 | 1.59 | 1.20 |
Total from investment operations | 2.00 | 1.23 | 1.68 | 1.24 |
Distributions from net investment income | (.12) | (.05) | (.08) | (.04) |
Distributions from net realized gain | (.37) | (.16) | (.53) | (.01) |
Total distributions | (.48) L | (.21) K | (.61) | (.05) |
Net asset value, end of period | $ 14.80 | $ 13.28 | $ 12.26 | $ 11.19 |
Total Return B, C, D | 15.11% | 10.10% | 15.08% | 12.41% |
Ratios to Average Net Assets F, J | | | | |
Expenses before reductions | .93% | 1.42% | 2.17% | 3.73% A |
Expenses net of fee waivers, if any | .93% | .97% | 1.10% | 1.16% A |
Expenses net of all reductions | .93% | .93% | 1.06% | 1.14% A |
Net investment income (loss) | 1.00% | .78% | .78% | .68% A |
Supplemental Data | | | | |
Net assets, end of period (000 omitted) | $ 2,458 | $ 2,137 | $ 1,941 | $ 1,687 |
Portfolio turnover rate G | 94% | 75% | 121% | 119% A |
A Annualized
B Total returns for periods of less than one year are not annualized.
C Total returns do not reflect charges attributable to your insurance company's separate account. Inclusion of these charges would reduce the total returns shown.
D Total returns would have been lower had certain expenses not been reduced during the periods shown.
E Calculated based on average shares outstanding during the period.
F Fees and expenses of the underlying Fidelity Central Funds are not included in the Fund's expense ratio. The Fund indirectly bears its proportionate share of the expenses of any underlying Fidelity Central Funds.
G Amount does not include the portfolio activity of any underlying Fidelity Central Funds.
H Investment income per share reflects a special dividend which amounted to $.02 per share.
I For the period June 17, 2003 (commencement of operations) to December 31, 2003.
J Expense ratios reflect operating expenses of the class. Expenses before reductions do not reflect amounts reimbursed by the investment adviser or reductions from brokerage service arrangements or other expense offset arrangements and do not represent the amount paid by the class during periods when reimbursements or reductions occur. Expense ratios before reductions for start-up periods may not be representative of longer-term operating periods. Expenses net of fee waivers reflect expenses after reimbursement by the investment adviser but prior to reductions from brokerage service arrangements or other expense offset arrangements. Expenses net of all reductions represent the net expenses paid by the class.
K Total distributions of $.21 per share is comprised of distributions from net investment income of $.054 and distributions from net realized gain of $.155 per share.
L Total distributions of $.48 per share is comprised of distributions from net investment income of $.116 and distributions from net realized gain of $.365 per share.
See accompanying notes which are an integral part of the financial statements.
Annual Report
Financial Highlights - Service Class 2
Years ended December 31, | 2006 | 2005 | 2004 | 2003 I |
Selected Per-Share Data | | | | |
Net asset value, beginning of period | $ 13.25 | $ 12.23 | $ 11.18 | $ 10.00 |
Income from Investment Operations | | | | |
Net investment income (loss) E | .12 | .08 | .07 H | .03 |
Net realized and unrealized gain (loss) | 1.84 | 1.13 | 1.59 | 1.20 |
Total from investment operations | 1.96 | 1.21 | 1.66 | 1.23 |
Distributions from net investment income | (.10) | (.04) | (.08) | (.04) |
Distributions from net realized gain | (.37) | (.16) | (.53) | (.01) |
Total distributions | (.46) L | (.19) K | (.61) | (.05) |
Net asset value, end of period | $ 14.75 | $ 13.25 | $ 12.23 | $ 11.18 |
Total Return B, C, D | 14.86% | 9.98% | 14.91% | 12.31% |
Ratios to Average Net Assets F, J | | | | |
Expenses before reductions | 1.14% | 1.60% | 2.32% | 3.88% A |
Expenses net of fee waivers, if any | 1.10% | 1.12% | 1.25% | 1.32% A |
Expenses net of all reductions | 1.09% | 1.08% | 1.21% | 1.29% A |
Net investment income (loss) | .83% | .63% | .63% | .52% A |
Supplemental Data | | | | |
Net assets, end of period (000 omitted) | $ 4,467 | $ 2,957 | $ 2,581 | $ 2,247 |
Portfolio turnover rate G | 94% | 75% | 121% | 119% A |
A Annualized
B Total returns for periods of less than one year are not annualized.
C Total returns do not reflect charges attributable to your insurance company's separate account. Inclusion of these charges would reduce the total returns shown.
D Total returns would have been lower had certain expenses not been reduced during the periods shown.
E Calculated based on average shares outstanding during the period.
F Fees and expenses of the underlying Fidelity Central Funds are not included in the Fund's expense ratio. The Fund indirectly bears its proportionate share of the expenses of any underlying Fidelity Central Funds.
G Amount does not include the portfolio activity of any underlying Fidelity Central Funds.
H Investment income per share reflects a special dividend which amounted to $.02 per share.
I For the period June 17, 2003 (commencement of operations) to December 31, 2003.
J Expense ratios reflect operating expenses of the class. Expenses before reductions do not reflect amounts reimbursed by the investment adviser or reductions from brokerage service arrangements or other expense offset arrangements and do not represent the amount paid by the class during periods when reimbursements or reductions occur. Expense ratios before reductions for start-up periods may not be representative of longer-term operating periods. Expenses net of fee waivers reflect expenses after reimbursement by the investment adviser but prior to reductions from brokerage service arrangements or other expense offset arrangements. Expenses net of all reductions represent the net expenses paid by the class.
K Total distributions of $.19 per share is comprised of distributions from net investment income of $.036 and distributions from net realized gain of $.155 per share.
L Total distributions of $.46 per share is comprised of distributions from net investment income of $.099 and distributions from net realized gain of $.365 per share.
Financial Highlights - Investor Class
Years ended December 31, | 2006 | 2005 H |
Selected Per-Share Data | | |
Net asset value, beginning of period | $ 13.30 | $ 12.72 |
Income from Investment Operations | | |
Net investment income (loss) E | .14 | .05 |
Net realized and unrealized gain (loss) | 1.86 | .61 |
Total from investment operations | 2.00 | .66 |
Distributions from net investment income | (.12) | (.05) |
Distributions from net realized gain | (.37) | (.03) |
Total distributions | (.49) K | (.08) J |
Net asset value, end of period | $ 14.81 | $ 13.30 |
Total Return B, C, D | 15.06% | 5.20% |
Ratios to Average Net Assets F, I | | |
Expenses before reductions | .97% | 1.15% A |
Expenses net of fee waivers, if any | .97% | 1.00% A |
Expenses net of all reductions | .96% | .96% A |
Net investment income (loss) | .96% | .87% A |
Supplemental Data | | |
Net assets, end of period (000 omitted) | $ 28,274 | $ 4,279 |
Portfolio turnover rate G | 94% | 75% |
A Annualized
B Total returns for periods of less than one year are not annualized.
C Total returns do not reflect charges attributable to your insurance company's separate account. Inclusion of these charges would reduce the total returns shown.
D Total returns would have been lower had certain expenses not been reduced during the periods shown.
E Calculated based on average shares outstanding during the period.
F Fees and expenses of the underlying Fidelity Central Funds are not included in the Fund's expense ratio. The Fund indirectly bears its proportionate share of the expenses of any underlying Fidelity Central Funds.
G Amount does not include the portfolio activity of any underlying Fidelity Central Funds.
H For the period July 21, 2005 (commencement of sale of shares) to December 31, 2005.
I Expense ratios reflect operating expenses of the class. Expenses before reductions do not reflect amounts reimbursed by the investment adviser or reductions from brokerage service arrangements or other expense offset arrangements and do not represent the amount paid by the class during periods when reimbursements or reductions occur. Expense ratios before reductions for start-up periods may not be representative of longer-term operating periods. Expenses net of fee waivers reflect expenses after reimbursement by the investment adviser but prior to reductions from brokerage service arrangements or other expense offset arrangements. Expenses net of all reductions represent the net expenses paid by the class.
J Total distributions of $.08 per share is comprised of distributions from net investment income of $.053 and distributions from net realized gain of $.030 per share.
K Total distributions of $.49 per share is comprised of distributions from net investment income of $.123 and distributions from net realized gain of $.365 per share.
See accompanying notes which are an integral part of the financial statements.
VIP Value Leaders Portfolio
Notes to Financial Statements
For the period ended December 31, 2006
1. Significant Accounting Policies.
VIP Value Leaders Portfolio (the Fund) is a fund of Variable Insurance Products Fund IV (the trust) and is authorized to issue an unlimited number of shares. The trust is registered under the Investment Company Act of 1940, as amended (the 1940 Act), as an open-end management investment company organized as a Massachusetts business trust. Shares of the Fund may only be purchased by insurance companies for the purpose of funding variable annuity or variable life insurance contracts. The Fund offers the following classes of shares: Initial Class shares, Service Class shares, Service Class 2 shares, and Investor Class shares. All classes have equal rights and voting privileges, except for matters affecting a single class. Investment income, realized and unrealized capital gains and losses, the common expenses of the Fund, and certain fund-level expense reductions, if any, are allocated on a pro rata basis to each class based on the relative net assets of each class to the total net assets of the Fund. Each class differs with respect to transfer agent and distribution and service plan fees incurred. Certain expense reductions also differ by class.
The Fund may invest in Fidelity Central Funds which are open-end investment companies available to investment companies and other accounts managed by Fidelity Management & Research Company (FMR) and its affiliates. The financial statements have been prepared in conformity with accounting principles generally accepted in the United States of America, which require management to make certain estimates and assumptions at the date of the financial statements. The following summarizes the significant accounting policies of the Fund, which are also consistently followed by the Fidelity Central Funds:
Security Valuation. Investments are valued and net asset value (NAV) per share is calculated (NAV calculation) as of the close of business of the New York Stock Exchange (NYSE), normally 4:00 p.m. Eastern time. Wherever possible, the Fund uses independent pricing services approved by the Board of Trustees to value its investments.
Equity securities, including restricted securities, for which market quotations are readily available, are valued at the last reported sale price or official closing price as reported by an independent pricing service on the primary market or exchange on which they are traded. In the event there were no sales during the day or closing prices are not available, securities are valued at the last quoted bid price. Investments in open-end mutual funds, including the Fidelity Central Funds, are valued at their closing net asset value each business day. Short-term securities with remaining maturities of sixty days or less for which quotations are not readily available are valued at amortized cost, which approximates value.
When current market prices or quotations are not readily available or do not accurately reflect fair value, valuations may be determined in accordance with procedures adopted by the Board of Trustees. For example, when developments occur between the close of a market and the close of the NYSE that may materially affect the value of some or all of the securities, or when trading in a security is halted, those securities may be fair valued. Factors used in the determination of fair value may include monitoring news to identify significant market or security specific events such as changes in the value of U.S. securities markets, reviewing developments in foreign markets and evaluating the performance of ADRs, futures contracts and exchange-traded funds. Because the Fund's utilization of fair value pricing depends on market activity, the frequency with which fair value pricing is used can not be predicted and may be utilized to a significant extent. The value of securities used for NAV calculation under fair value pricing may differ from published prices for the same securities.
Foreign Currency. The Fund uses foreign currency contracts to facilitate transactions in foreign-denominated securities. Losses from these transactions may arise from changes in the value of the foreign currency or if the counterparties do not perform under the contracts' terms.
Foreign-denominated assets, including investment securities, and liabilities are translated into U.S. dollars at the exchange rate at period end. Purchases and sales of investment securities, income and dividends received and expenses denominated in foreign currencies are translated into U.S. dollars at the exchange rate in effect on the transaction date.
The effects of exchange rate fluctuations on investments are included with the net realized and unrealized gain (loss) on investment securities. Other foreign currency transactions resulting in realized and unrealized gain (loss) are disclosed separately.
Investment Transactions and Income. Security transactions, including the Fund's investment activity in the Fidelity Central Funds, are accounted for as of trade date. Gains and losses on securities sold are determined on the basis of identified cost and may include proceeds received from litigation. Dividend income is recorded on the ex-dividend date, except for certain dividends from foreign securities where the ex-dividend date may have passed, which are recorded as soon as the Fund is informed of the ex-dividend date. Non-cash dividends included in dividend income, if any, are recorded at the fair market value of the securities received. Distributions received on securities that represent a return of capital or capital gain are recorded as a reduction of cost of investments and/or as a realized gain. The Fund estimates the components of distributions received that may be considered return of capital distributions or capital gain distributions. Interest income and income distributions from the Fidelity Central Funds are accrued as earned, with any income distributions receivable as of period end included in Interest Receivable on the Statement of Assets and Liabilities. Interest income includes coupon interest and amortization of premium and accretion of discount on debt securities. Investment income is recorded net of foreign taxes withheld where recovery of such taxes is uncertain.
Annual Report
Notes to Financial Statements - continued
1. Significant Accounting Policies - continued
Expenses. Most expenses of the trust can be directly attributed to a fund. Expenses which cannot be directly attributed are apportioned among each Fund in the trust. Expense estimates are accrued in the period to which they relate and adjustments are made when actual amounts are known.
Income Tax Information and Distributions to Shareholders. Each year, the Fund intends to qualify as a regulated investment company by distributing all of its taxable income and realized gains under Subchapter M of the Internal Revenue Code. As a result, no provision for income taxes is required in the accompanying financial statements. Foreign taxes are provided for based on the Fund's understanding of the tax rules and rates that exist in the foreign markets in which it invests.
Distributions are recorded on the ex-dividend date. Income dividends and capital gain distributions are declared separately for each class. Income and capital gain distributions are determined in accordance with income tax regulations, which may differ from generally accepted accounting principles.
Capital accounts within the financial statements are adjusted for permanent book-tax differences. These adjustments have no impact on net assets or the results of operations. Temporary book-tax differences will reverse in a subsequent period.
Book-tax differences are primarily due to foreign currency transactions, certain foreign taxes, partnerships, and losses deferred due to wash sales.
The tax-basis components of distributable earnings and the federal tax cost as of period end were as follows:
Unrealized appreciation | $ 8,959,318 | |
Unrealized depreciation | (632,483) | |
Net unrealized appreciation (depreciation) | 8,326,835 | |
Undistributed ordinary income | 520,231 | |
Undistributed long-term capital gain | 636,891 | |
| | |
Cost for federal income tax purposes | $ 70,207,796 | |
The tax character of distributions paid was as follows:
| December 31, 2006 | December 31, 2005 |
Ordinary Income | $ 943,513 | $ 209,464 |
Long-term Capital Gains | 1,509,150 | 152,060 |
Total | $ 2,452,663 | $ 361,524 |
New Accounting Pronouncements. In July 2006, Financial Accounting Standards Board Interpretation No. 48, Accounting for Uncertainty in Income Taxes - an interpretation of FASB Statement 109 (FIN 48), was issued and is effective on the last business day of the semiannual reporting period for fiscal years beginning after December 15, 2006. FIN 48 sets forth a threshold for financial statement recognition, measurement and disclosure of a tax position taken or expected to be taken on a tax return. Management is currently evaluating the impact, if any, the adoption of FIN 48 will have on the Fund's net assets, results of operations and financial statement disclosures.
In addition, in September 2006, Statement of Financial Accounting Standards No. 157, Fair Value Measurements (SFAS 157), was issued and is effective for fiscal years beginning after November 15, 2007. SFAS 157 defines fair value, establishes a framework for measuring fair value and expands disclosures about fair value measurements. Management is currently evaluating the impact the adoption of SFAS 157 will have on the Fund's financial statement disclosures.
2. Operating Policies.
Repurchase Agreements. FMR has received an Exemptive Order from the Securities and Exchange Commission (the SEC) which permits the Fund and other affiliated entities of FMR to transfer uninvested cash balances into joint trading accounts which are then invested in repurchase agreements. The Fund may also invest directly with institutions in repurchase agreements. Repurchase agreements are collateralized by government or non-government securities. Upon settlement date, collateral is held in segregated accounts with custodian banks and may be obtained in the event of a default of the counterparty. The Fund monitors, on a daily basis, the value of the collateral to ensure it is at least equal to the principal amount of the repurchase agreement (including accrued interest). In the event of a default by the counterparty, realization of the collateral proceeds could be delayed, during which time the value of the collateral may decline.
Restricted Securities. The Fund may invest in securities that are subject to legal or contractual restrictions on resale. These securities generally may be resold in transactions exempt from registration or to the public if the securities are registered. Disposal of these securities may involve time-consuming negotiations and expense, and prompt sale at an acceptable price may be difficult. Information regarding restricted securities is included at the end of the Fund's Schedule of Investments.
VIP Value Leaders Portfolio
3. Purchases and Sales of Investments.
Purchases and sales of securities, other than short-term securities, aggregated $81,882,791 and $57,042,046, respectively.
4. Fees and Other Transactions with Affiliates.
Management Fee. FMR and its affiliates provide the Fund with investment management related services for which the Fund pays a monthly management fee. The management fee is the sum of an individual fund fee rate that is based on an annual rate of .30% of the Fund's average net assets and a group fee rate that averaged .27% during the period. The group fee rate is based upon the average net assets of all the mutual funds advised by FMR. The group fee rate decreases as assets under management increase and increases as assets under management decrease. For the period, the total annual management fee rate was .56% of the Fund's average net assets.
Distribution and Service Plan. In accordance with Rule 12b-1 of the 1940 Act, the Fund has adopted separate 12b-1 Plans for each Service Class of shares. Each Service Class pays Fidelity Distributors Corporation (FDC), an affiliate of FMR, a service fee. For the period, the service fee is based on an annual rate of .10% of Service Class' average net assets and .25% of Service Class 2's average net assets.
For the period, each class paid FDC the following amounts, all of which were re-allowed to insurance companies for the distribution of shares and providing shareholder support services:
Service Class | $ 2,266 | |
Service Class 2 | 8,848 | |
| $ 11,114 | |
Transfer Agent Fees. Fidelity Investments Institutional Operations Company, Inc. (FIIOC), an affiliate of FMR, is the fund's transfer, dividend disbursing, and shareholder servicing agent. FIIOC receives an asset-based fee with respect to each class. Each class with the exception of Investor Class pays a transfer agent fee, excluding out of pocket expenses, equal to an annual rate of .07% of their month end net assets. Investor Class pays a monthly asset-based transfer agent fee of .18% of its month end net assets. The total transfer agent fees paid by each class to FIIOC, including out of pocket expenses, were as follows:
Initial Class | $ 30,076 | |
Service Class | 1,507 | |
Service Class 2 | 4,417 | |
Investor Class | 29,381 | |
| $ 65,381 | |
Accounting and Security Lending Fees. Fidelity Service Company, Inc. (FSC), an affiliate of FMR, maintains the Fund's accounting records. The accounting fee is based on the level of average net assets for the month. Under a separate contract, FSC administers the security lending program. The security lending fee is based on the number and duration of lending transactions.
Investments in Fidelity Central Funds. The Fund may invest in Fidelity Central Funds. The Fund's Schedule of Investments lists each of the Fidelity Central Funds as an investment of the Fund but does not include the underlying holdings of each Fidelity Central Fund. As an Investing Fund, the Fund indirectly bears its proportionate share of the expenses of the underlying Fidelity Central Funds. A complete unaudited list of holdings for each Fidelity Central Fund is available upon request. In addition, the financial statements of the Fidelity Central Funds, which are not covered by the Fund's Report of Independent Registered Public Accounting Firm, are available on the EDGAR Database on the SEC's web site, www.sec.gov, or upon request.
The Money Market Central Funds seek preservation of capital and current income and are managed by Fidelity Investments Money Management, Inc. (FIMM), an affiliate of FMR.
Brokerage Commissions. The Fund placed a portion of its portfolio transactions with brokerage firms which are affiliates of the investment adviser. The commissions paid to these affiliated firms were $665 for the period.
5. Committed Line of Credit.
The Fund participates with other funds managed by FMR in a $4.2 billion credit facility (the "line of credit") to be utilized for temporary or emergency purposes to fund shareholder redemptions or for other short-term liquidity purposes. The Fund has agreed to pay commitment fees on its pro rata portion of the line of credit, which amounted to $149 and is reflected in Miscellaneous Expense on the Statement of Operations. During the period, there were no borrowings on this line of credit.
Annual Report
Notes to Financial Statements - continued
6. Security Lending.
The Fund lends portfolio securities from time to time in order to earn additional income. On the settlement date of the loan, the Fund receives collateral (in the form of U.S. Treasury obligations, letters of credit and/or cash) against the loaned securities and maintains collateral in an amount not less than 100% of the market value of the loaned securities during the period of the loan. The market value of the loaned securities is determined at the close of business of the Fund and any additional required collateral is delivered to the Fund on the next business day. If the borrower defaults on its obligation to return the securities loaned because of insolvency or other reasons, a fund could experience delays and costs in recovering the securities loaned or in gaining access to the collateral. Any cash collateral received is invested in the Fidelity Securities Lending Cash Central Fund. The value of loaned securities and cash collateral at period end are disclosed on the Fund's Statement of Assets and Liabilities. Security lending income represents the income earned on investing cash collateral, less fees and expenses associated with the loan, plus any premium payments that may be received on the loan of certain types of securities. Security lending income is presented in the Statement of Operations as a component of income from Fidelity Central Funds. Net income from lending portfolio securities during the period amounted to $2,546.
7. Expense Reductions.
FMR voluntarily agreed to reimburse each class to the extent annual operating expenses exceeded certain levels of average net assets as noted in the table below. Some expenses, for example interest expense, including commitment fees, are excluded from this reimbursement.
The following classes were in reimbursement during the period:
| Expense
Limitations | Reimbursement
from adviser |
Service Class 2 | 1.10% | $ 1,460 |
Many of the brokers with whom FMR places trades on behalf of the Fund provided services to the Fund in addition to trade execution. These services included payments of certain expenses on behalf of the Fund totaling $3,515 for the period.
8. Other.
The Fund's organizational documents provide former and current trustees and officers with a limited indemnification against liabilities arising in connection with the performance of their duties to the Fund. In the normal course of business, the Fund may also enter into contracts that provide general indemnifications. The Fund's maximum exposure under these arrangements is unknown as this would be dependent on future claims that may be made against the Fund. The risk of material loss from such claims is considered remote.
At the end of the period, FMR or its affiliates were the owners of record of 98% of the total outstanding shares of the Fund.
The United States Securities and Exchange Commission ("SEC") is conducting an investigation of FMR (covering the years 2002 to 2004) arising from gifts, gratuities and business entertainment provided by certain brokers to certain individuals who were employed on FMR's domestic equity trading desk during that period. FMR is in discussions with the SEC staff regarding the possible resolution of the matter, but as of period-end no final resolution has been reached.
In December 2006, the Independent Trustees completed their own investigation of the matter with the assistance of independent counsel. The Independent Trustees and FMR agree that, despite the absence of proof that the Fidelity mutual funds experienced diminished execution quality as a result of the improper receipt of gifts and business entertainment, the conduct at issue was serious and is worthy of redress. Accordingly, the Independent Trustees have requested and FMR has agreed to pay $42 million to Fidelity mutual funds, plus interest to be determined at the time that payment is made. A method of allocating this payment among the funds has not yet been determined. The total payment to the Fund is not anticipated to have a material impact on the Fund's net assets. In addition, FMR reimbursed related legal expenses which are recorded in the accompanying Statement of Operations as an expense reduction.
VIP Value Leaders Portfolio
9. Distributions to Shareholders.
Distributions to shareholders of each class were as follows:
| Years ended December 31, |
| 2006 | 2005A |
From net investment income | | |
Initial Class | $ 362,794 | $ 158,554 |
Service Class | 18,695 | 8,622 |
Service Class 2 | 29,094 | 7,890 |
Investor Class | 221,984 | 15,934 |
Total | $ 632,567 | $ 191,000 |
From net realized gain | | |
Initial Class | $ 1,031,629 | $ 103,874 |
Service Class | 58,819 | 24,583 |
Service Class 2 | 105,568 | 33,048 |
Investor Class | 624,080 | 9,019 |
Total | $ 1,820,096 | $ 170,524 |
A Distributions for Investor Class are for the period July 21, 2005 (commencement of sale of shares) to December 31, 2005.
10. Share Transactions.
Transactions for each class of shares were as follows:
| Shares | Dollars |
| Years ended December 31, | Years ended December 31, |
| 2006 | 2005A | 2006 | 2005A |
Initial Class | | | | |
Shares sold | 995,302 | 2,848,457 | $ 14,048,028 | $ 36,555,934 |
Reinvestment of distributions | 94,957 | 19,605 | 1,394,423 | 262,428 |
Shares redeemed | (1,023,701) | (210,100) | (14,501,975) | (2,730,317) |
Net increase (decrease) | 66,558 | 2,657,962 | $ 940,476 | $ 34,088,045 |
Service Class | | | | |
Reinvestment of distributions | 5,288 | 2,604 | $ 77,514 | $ 33,205 |
Net increase (decrease) | 5,288 | 2,604 | $ 77,514 | $ 33,205 |
Service Class 2 | | | | |
Shares sold | 80,992 | 9,541 | $ 1,131,528 | $ 121,450 |
Reinvestment of distributions | 9,211 | 3,234 | 134,662 | 40,938 |
Shares redeemed | (10,524) | (576) | (147,206) | (7,325) |
Net increase (decrease) | 79,679 | 12,199 | $ 1,118,984 | $ 155,063 |
Investor Class | | | | |
Shares sold | 1,712,304 | 325,108 | $ 24,221,597 | $ 4,247,331 |
Reinvestment of distributions | 57,496 | 1,851 | 846,064 | 24,953 |
Shares redeemed | (181,703) | (5,306) | (2,573,880) | (70,955) |
Net increase (decrease) | 1,588,097 | 321,653 | $ 22,493,781 | $ 4,201,329 |
A Share transactions for Investor Class are for the period July 21, 2005 (commencement of sale of shares) to December 31, 2005.
Annual Report
Report of Independent Registered Public Accounting Firm
To the Trustees of Variable Insurance Products Fund IV and the Shareholders of VIP Value Leaders Portfolio:
In our opinion, the accompanying statement of assets and liabilities, including the schedule of investments, and the related statements of operations and of changes in net assets and the financial highlights present fairly, in all material respects, the financial position of VIP Value Leaders Portfolio (a fund of Variable Insurance Products Fund IV) at December 31, 2006, the results of its operations for the year then ended, the changes in its net assets for each of the two years in the period then ended and the financial highlights for each of the periods indicated, in conformity with accounting principles generally accepted in the United States of America. These financial statements and financial highlights (hereafter referred to as "financial statements") are the responsibility of the VIP Value Leaders Portfolio's management; our responsibility is to express an opinion on these financial statements based on our audits. We conducted our audits of these financial statements in accordance with the standards of the Public Company Accounting Oversight Board (United States). Those standards require that we plan and perform the audit to obtain reasonable assurance about whether the financial statements are free of material misstatement. An audit includes examining, on a test basis, evidence supporting the amounts and disclosures in the financial statements, assessing the accounting principles used and significant estimates made by management, and evaluating the overall financial statement presentation. We believe that our audits, which included confirmation of securities at December 31, 2006 by correspondence with the custodian and brokers, provide a reasonable basis for our opinion.
/s/ PricewaterhouseCoopers LLP
PricewaterhouseCoopers LLP
Boston, Massachusetts
February 15, 2007
VIP Value Leaders Portfolio
Trustees and Officers
The Trustees, Member of the Advisory Board, and executive officers of the trust and fund, as applicable, are listed below. The Board of Trustees governs the fund and is responsible for protecting the interests of shareholders. The Trustees are experienced executives who meet periodically throughout the year to oversee the fund's activities, review contractual arrangements with companies that provide services to the fund, and review the fund's performance. Each of the Trustees oversees 348 funds advised by FMR or an affiliate.
The Trustees hold office without limit in time except that (a) any Trustee may resign; (b) any Trustee may be removed by written instrument, signed by at least two-thirds of the number of Trustees prior to such removal; (c) any Trustee who requests to be retired or who has become incapacitated by illness or injury may be retired by written instrument signed by a majority of the other Trustees; and (d) any Trustee may be removed at any special meeting of shareholders by a two-thirds vote of the outstanding voting securities of the trust. Each Trustee who is not an interested person (as defined in the 1940 Act) (Independent Trustee), shall retire not later than the last day of the calendar year in which his or her 72nd birthday occurs. The Independent Trustees may waive this mandatory retirement age policy with respect to individual Trustees. The executive officers and Advisory Board Member hold office without limit in time, except that any officer and Advisory Board Member may resign or may be removed by a vote of a majority of the Trustees at any regular meeting or any special meeting of the Trustees. Except as indicated, each individual has held the office shown or other offices in the same company for the past five years.
The fund's Statement of Additional Information (SAI) includes more information about the Trustees. To request a free copy, call Fidelity at 1-877-208-0098.
Interested Trustees*:
Correspondence intended for each Trustee who is an interested person may be sent to Fidelity Investments, 82 Devonshire Street, Boston, Massachusetts 02109.
Name, Age; Principal Occupation |
Edward C. Johnson 3d (76) |
| Year of Election or Appointment: 1983 Mr. Johnson is Chairman of the Board of Trustees. Mr. Johnson serves as President (2006-present), Chief Executive Officer, Chairman, and a Director of FMR Corp.; Chairman and a Director of FMR; Chairman and a Director of Fidelity Research & Analysis Company (FRAC); Chairman and a Director of Fidelity Investments Money Management, Inc.; and Chairman (2001-present) and a Director of FMR Co., Inc. In addition, Mr. Johnson serves as Chairman and Director of Fidelity International Limited (FIL). |
Robert L. Reynolds (54) |
| Year of Election or Appointment: 2003 Mr. Reynolds is President and a Director of FMR (2005-present), Fidelity Investments Money Management, Inc. (2005-present), and FMR Co., Inc. (2005-present). Mr. Reynolds also serves as Vice Chairman (2006-present), a Director (2003-present), and Chief Operating Officer of FMR Corp. and a Director of Strategic Advisers, Inc. (2005-present). He also serves on the Board at Fidelity Investments Canada, Ltd. |
* Trustees have been determined to be "Interested Trustees" by virtue of, among other things, their affiliation with the trust or various entities under common control with FMR.
Independent Trustees:
Correspondence intended for each Independent Trustee (that is, the Trustees other than the Interested Trustees) may be sent to Fidelity Investments, P.O. Box 55235, Boston, Massachusetts 02205-5235.
Name, Age; Principal Occupation |
Dennis J. Dirks (58) |
| Year of Election or Appointment: 2005 Prior to his retirement in May 2003, Mr. Dirks was Chief Operating Officer and a member of the Board of The Depository Trust & Clearing Corporation (DTCC) (1999-2003). He also served as President, Chief Operating Officer, and Board member of The Depository Trust Company (DTC) (1999-2003) and President and Board member of the National Securities Clearing Corporation (NSCC) (1999-2003). In addition, Mr. Dirks served as Chief Executive Officer and Board member of the Government Securities Clearing Corporation (2001-2003) and Chief Executive Officer and Board member of the Mortgage-Backed Securities Clearing Corporation (2001-2003). Mr. Dirks also serves as a Trustee and a member of the Finance Committee of Manhattan College (2005-present) and a Trustee and a member of the Finance Committee of AHRC of Nassau County (2006-present). |
Albert R. Gamper, Jr. (64) |
| Year of Election or Appointment: 2006 Prior to his retirement in December 2004, Mr. Gamper served as Chairman of the Board of CIT Group Inc. (commercial finance). During his tenure with CIT Group Inc. Mr. Gamper served in numerous senior management positions, including Chairman (1987-1989; 1999-2001; 2002-2004), Chief Executive Officer (1987-2004), and President (1989-2002). He currently serves as a member of the Board of Directors of Public Service Enterprise Group (utilities, 2001-present), Chairman of the Board of Governors, Rutgers University (2004-present), and Chairman of the Board of Saint Barnabas Health Care System. |
George H. Heilmeier (70) |
| Year of Election or Appointment: 2004 Dr. Heilmeier is Chairman Emeritus of Telcordia Technologies (communication software and systems), where prior to his retirement, he served as company Chairman and Chief Executive Officer. He currently serves on the Boards of Directors of The Mitre Corporation (systems engineering and information technology support for the government), and HRL Laboratories (private research and development, 2004-present). He is Chairman of the General Motors Science & Technology Advisory Board and a Life Fellow of the Institute of Electrical and Electronics Engineers (IEEE). Dr. Heilmeier is a member of the Defense Science Board and the National Security Agency Advisory Board. He is also a member of the National Academy of Engineering, the American Academy of Arts and Sciences, and the Board of Overseers of the School of Engineering and Applied Science of the University of Pennsylvania. Previously, Dr. Heilmeier served as a Director of TRW Inc. (automotive, space, defense, and information technology, 1992-2002), Compaq (1994-2002), Automatic Data Processing, Inc. (ADP) (technology-based business outsourcing, 1995-2002), INET Technologies Inc. (telecommunications network surveillance, 2001-2004), and Teletech Holdings (customer management services). He is the recipient of the 2005 Kyoto Prize in Advanced Technology for his invention of the liquid crystal display, and a member of the Consumer Electronics Hall of Fame. |
James H. Keyes (66) |
| Year of Election or Appointment: 2007 Prior to his retirement in 2003, Mr. Keyes was Chairman, President, and Chief Executive Officer of Johnson Controls, Inc. (automotive supplier, 1993-2003). He currently serves as a member of the boards of LSI Logic Corporation (semiconductor technologies), Navistar International Corporation (manufacture and sale of trucks, buses, and diesel engines, 2002-present), and Pitney Bowes, Inc. (integrated mail, messaging, and document management solutions). |
Marie L. Knowles (60) |
| Year of Election or Appointment: 2001 Prior to Ms. Knowles' retirement in June 2000, she served as Executive Vice President and Chief Financial Officer of Atlantic Richfield Company (ARCO) (diversified energy, 1996-2000). From 1993 to 1996, she was a Senior Vice President of ARCO and President of ARCO Transportation Company. She served as a Director of ARCO from 1996 to 1998. She currently serves as a Director of Phelps Dodge Corporation (copper mining and manufacturing) and McKesson Corporation (healthcare service, 2002-present). Ms. Knowles is a Trustee of the Brookings Institution and the Catalina Island Conservancy and also serves as a member of the Advisory Board for the School of Engineering of the University of Southern California. |
Ned C. Lautenbach (62) |
| Year of Election or Appointment: 2000 Mr. Lautenbach is Chairman of the Independent Trustees (2006-present). Mr. Lautenbach has been a partner of Clayton, Dubilier & Rice, Inc. (private equity investment firm) since September 1998. Previously, Mr. Lautenbach was with the International Business Machines Corporation (IBM) from 1968 until his retirement in 1998. Mr. Lautenbach serves as a Director of Sony Corporation (2006-present) and Eaton Corporation (diversified industrial) as well as the Philharmonic Center for the Arts in Naples, Florida. He also is a member of the Board of Trustees of Fairfield University (2005-present), as well as a member of the Council on Foreign Relations. |
Cornelia M. Small (62) |
| Year of Election or Appointment: 2005 Ms. Small is a member (2000-present) and Chairperson (2002-present) of the Investment Committee, and a member (2002- present) of the Board of Trustees of Smith College. Previously, she served as Chief Investment Officer (1999-2000), Director of Global Equity Investments (1996-1999), and a member of the Board of Directors of Scudder, Stevens & Clark (1990-1997) and Scudder Kemper Investments (1997-1999). In addition, Ms. Small served as Co-Chair (2000-2003) of the Annual Fund for the Fletcher School of Law and Diplomacy. |
William S. Stavropoulos (67) |
| Year of Election or Appointment: 2001 Mr. Stavropoulos is Chairman Emeritus of the Board of Directors of The Dow Chemical Company. Since joining The Dow Chemical Company in 1967, Mr. Stavropoulos served in numerous senior management positions, including President (1993-2000; 2002-2003), CEO (1995-2000; 2002-2004), and Chairman of the Executive Committee (2000-2004). Currently, he is a Director of NCR Corporation (data warehousing and technology solutions), BellSouth Corporation (telecommunications), Chemical Financial Corporation, Maersk Inc. (industrial conglomerate, 2002-present), and Metalmark Capital (private equity investment firm, 2005-present). He also serves as a member of the Board of Trustees of the American Enterprise Institute for Public Policy Research. In addition, Mr. Stavropoulos is a member of The Business Council, J.P. Morgan International Council and the University of Notre Dame Advisory Council for the College of Science. |
Kenneth L. Wolfe (67) |
| Year of Election or Appointment: 2005 Prior to his retirement in 2001, Mr. Wolfe was Chairman and Chief Executive Officer of Hershey Foods Corporation (1993-2001). He currently serves as a member of the boards of Adelphia Communications Corporation (2003-present), Bausch & Lomb, Inc., and Revlon Inc. (2004-present). |
Advisory Board Member and Executive Officers:
Correspondence intended for each executive officer and Mr. Lynch may be sent to Fidelity Investments, 82 Devonshire Street, Boston, Massachusetts 02109.
Name, Age; Principal Occupation |
Peter S. Lynch (62) |
| Year of Election or Appointment: 2003 Member of the Advisory Board of Variable Insurance Products Fund IV. Mr. Lynch is Vice Chairman and a Director of FMR, and Vice Chairman (2001-present) and a Director of FMR Co., Inc. Previously, Mr. Lynch served as a Trustee of the Fidelity funds (1990-2003). In addition, he serves as a Trustee of Boston College and as the Chairman of the Inner-City Scholarship Fund. |
Kimberley H. Monasterio (43) |
| Year of Election or Appointment: 2007 President and Treasurer of VIP Value Leaders. Ms. Monasterio also serves as President and Treasurer of other Fidelity funds (2007-present) and is an employee of FMR (2004-present). Previously, Ms. Monasterio served as Deputy Treasurer of the Fidelity funds (2004-2006). Before joining Fidelity Investments, Ms. Monasterio served as Treasurer (2000-2004) and Chief Financial Officer (2002-2004) of the Franklin Templeton Funds and Senior Vice President of Franklin Templeton Services, LLC (2000-2004). |
Dwight D. Churchill (53) |
| Year of Election or Appointment: 2005 Vice President of VIP Value Leaders. Mr. Churchill also serves as Vice President of certain Equity Funds (2005-present). Mr. Churchill is Executive Vice President of FMR (2005-present) and FMR Co., Inc. (2005-present). Previously, Mr. Churchill served as Senior Vice President of Fidelity Investments Money Management, Inc. (2005-2006), Head of Fidelity's Fixed-Income Division (2000-2005), Vice President of Fidelity's Money Market Funds (2000-2005), Vice President of Fidelity's Bond Funds, and Senior Vice President of FMR. |
Bruce T. Herring (41) |
| Year of Election or Appointment: 2006 Vice President of VIP Value Leaders. Mr. Herring also serves as Vice President of certain Equity Funds (2006-present). Mr. Herring is Senior Vice President of FMR (2006-present) and Vice President of FMR Co., Inc. (2001-present). Previously, Mr. Herring served as a portfolio manager for Fidelity U.S. Equity Funds (2001-2005). |
Eric M. Wetlaufer (44) |
| Year of Election or Appointment: 2006 Vice President of VIP Value Leaders. Mr. Wetlaufer also serves as Vice President of certain International Equity Funds (2006-present). Mr. Wetlaufer is Senior Vice President of FMR (2006-present) and FMR Co., Inc. (2006-present), and President and Director of Fidelity Management & Research (U.K.) Inc. (2006-present) and Fidelity Research & Analysis Company (2006-present). Before joining Fidelity Investments in 2005, Mr. Wetlaufer was a partner in Oxhead Capital Management (2004-2005). Previously, Mr. Wetlaufer served as a Chief Investment Officer of Putnam Investments (1997-2003). |
Charles Hebard (37) |
| Year of Election or Appointment: 2006 Vice President of VIP Value Leaders. Mr. Hebard also serves as Vice President of other funds advised by FMR. Prior to assuming his current responsibilities, Mr. Hebard worked as a research analyst in 1999, after receiving an MBA from the Wharton School at the University of Pennsylvania. Previously, he was an assistant vice president for Citicorp Securities Inc. in the Global Media and Communications division from 1996-1997. |
Eric D. Roiter (58) |
| Year of Election or Appointment: 2003 Secretary of VIP Value Leaders. He also serves as Secretary of other Fidelity funds; Vice President, General Counsel, and Secretary of FMR Co., Inc. (2001-present) and FMR; Assistant Secretary of Fidelity Management & Research (U.K.) Inc. (2001-present), Fidelity Research & Analysis Company (2001-present), and Fidelity Investments Money Management, Inc. (2001-present). Mr. Roiter is an Adjunct Member, Faculty of Law, at Boston College Law School (2003-present). Previously, Mr. Roiter served as Vice President and Secretary of Fidelity Distributors Corporation (FDC) (1998-2005). |
Stuart Fross (47) |
| Year of Election or Appointment: 2003 Assistant Secretary of VIP Value Leaders. Mr. Fross also serves as Assistant Secretary of other Fidelity funds (2003-present), Vice President and Secretary of FDC (2005-present), and is an employee of FMR. |
R. Stephen Ganis (40) |
| Year of Election or Appointment: 2006 Anti-Money Laundering (AML) officer of VIP Value Leaders. Mr. Ganis also serves as AML officer of other Fidelity funds (2006-present) and FMR Corp. (2003-present). Before joining Fidelity Investments, Mr. Ganis practiced law at Goodwin Procter, LLP (2000-2002). |
Joseph B. Hollis (58) |
| Year of Election or Appointment: 2006 Chief Financial Officer of VIP Value Leaders. Mr. Hollis also serves as Chief Financial Officer of other Fidelity funds. Mr. Hollis is President of Fidelity Pricing and Cash Management Services (FPCMS) (2005-present). Mr. Hollis also serves as President and Director of Fidelity Service Company, Inc. (2006-present). Previously, Mr. Hollis served as Senior Vice President of Cash Management Services (1999-2002) and Investment Management Operations (2002-2005). |
Kenneth A. Rathgeber (59) |
| Year of Election or Appointment: 2004 Chief Compliance Officer of VIP Value Leaders. Mr. Rathgeber also serves as Chief Compliance Officer of other Fidelity funds (2004-present) and Executive Vice President of Risk Oversight for Fidelity Investments (2002-present). He is Chief Compliance Officer of FMR (2005-present), FMR Co., Inc. (2005-present), Fidelity Management & Research (U.K.) Inc. (2005-present), Fidelity Research & Analysis Company (2005-present), Fidelity Investments Money Management, Inc. (2005-present), and Strategic Advisers, Inc. (2005-present). Previously, Mr. Rathgeber served as Executive Vice President and Chief Operating Officer for Fidelity Investments Institutional Services Company, Inc. (1998-2002). |
Bryan A. Mehrmann (45) |
| Year of Election or Appointment: 2005 Deputy Treasurer of VIP Value Leaders. Mr. Mehrmann also serves as Deputy Treasurer of other Fidelity funds (2005-present) and is an employee of FMR. Previously, Mr. Mehrmann served as Vice President of Fidelity Investments Institutional Services Group (FIIS)/Fidelity Investments Institutional Operations Corporation, Inc. (FIIOC) Client Services (1998-2004). |
Kenneth B. Robins (37) |
| Year of Election or Appointment: 2005 Deputy Treasurer of VIP Value Leaders. Mr. Robins also serves as Deputy Treasurer of other Fidelity funds (2005-present) and is an employee of FMR (2004-present). Before joining Fidelity Investments, Mr. Robins worked at KPMG LLP, where he was a partner in KPMG's department of professional practice (2002-2004) and a Senior Manager (1999-2000). In addition, Mr. Robins served as Assistant Chief Accountant, United States Securities and Exchange Commission (2000-2002). |
Robert G. Byrnes (40) |
| Year of Election or Appointment: 2005 Assistant Treasurer of VIP Value Leaders. Mr. Byrnes also serves as Assistant Treasurer of other Fidelity funds (2005-present) and is an employee of FMR (2005-present). Previously, Mr. Byrnes served as Vice President of FPCMS (2003-2005). Before joining Fidelity Investments, Mr. Byrnes worked at Deutsche Asset Management where he served as Vice President of the Investment Operations Group (2000-2003). |
John H. Costello (60) |
| Year of Election or Appointment: 2003 Assistant Treasurer of VIP Value Leaders. Mr. Costello also serves as Assistant Treasurer of other Fidelity funds and is an employee of FMR. |
Peter L. Lydecker (52) |
| Year of Election or Appointment: 2004 Assistant Treasurer of VIP Value Leaders. Mr. Lydecker also serves as Assistant Treasurer of other Fidelity funds (2004) and is an employee of FMR. |
Mark Osterheld (51) |
| Year of Election or Appointment: 2003 Assistant Treasurer of VIP Value Leaders. Mr. Osterheld also serves as Assistant Treasurer of other Fidelity funds (2002) and is an employee of FMR. |
Gary W. Ryan (48) |
| Year of Election or Appointment: 2005 Assistant Treasurer of VIP Value Leaders. Mr. Ryan also serves as Assistant Treasurer of other Fidelity funds (2005-present) and is an employee of FMR (2005-present). Previously, Mr. Ryan served as Vice President of Fund Reporting in FPCMS (1999-2005). |
Salvatore Schiavone (41) |
| Year of Election or Appointment: 2005 Assistant Treasurer of VIP Value Leaders. Mr. Schiavone also serves as Assistant Treasurer of other Fidelity funds (2005-present) and is an employee of FMR (2005-present). Before joining Fidelity Investments, Mr. Schiavone worked at Deutsche Asset Management, where he most recently served as Assistant Treasurer (2003-2005) of the Scudder Funds and Vice President and Head of Fund Reporting (1996-2003). |
Annual Report
Distributions
The Board of Trustees of VIP Value Leaders Portfolio voted to pay to shareholders of record at the opening of business on record date, the following distributions per share derived from capital gains realized from sales of portfolio securities.
Fund | Pay Date | Record Date | Capital Gains |
Initial Class | 02/09/07 | 02/09/07 | $.22 |
Service Class | 02/09/07 | 02/09/07 | $.22 |
Service Class 2 | 02/09/07 | 02/09/07 | $.22 |
Investor Class | 02/09/07 | 02/09/07 | $.22 |
The fund hereby designates as a capital gain dividend with respect to the taxable year ended December 31, 2006, $2,107,682, or, if subsequently determined to be different, the net capital gain of such year.
Initial Class, Service Class, Service Class 2, and Investor Class designate 100% of the dividends distributed during the fiscal year as qualifying for the dividends-received deduction for corporate shareholders.
The fund will notify shareholders in January 2007 of amounts for use in preparing 2006 income tax returns.
VIP Value Leaders Portfolio
Proxy Voting Results
A special meeting of the fund's shareholders was held on September 20, 2006. The results of votes taken among shareholders on the proposal before them are reported below. Each vote reported represents one dollar of net asset value held on the record date for the meeting.
PROPOSAL 1 |
To elect a Board of Trustees. A |
| # of
Votes | % of
Votes |
Dennis J. Dirks |
Affirmative | 92,459,317.52 | 96.102 |
Withheld | 3,749,837.05 | 3.898 |
TOTAL | 96,209,154.57 | 100.000 |
Albert R. Gamper, Jr. |
Affirmative | 92,260,598.99 | 95.896 |
Withheld | 3,948,555.58 | 4.104 |
TOTAL | 96,209,154.57 | 100.000 |
Robert M. Gates |
Affirmative | 92,315,480.72 | 95.953 |
Withheld | 3,893,673.85 | 4.047 |
TOTAL | 96,209,154.57 | 100.000 |
George H. Heilmeier |
Affirmative | 92,208,255.41 | 95.841 |
Withheld | 4,000,899.16 | 4.159 |
TOTAL | 96,209,154.57 | 100.000 |
Edward C. Johnson 3d |
Affirmative | 91,928,267.76 | 95.550 |
Withheld | 4,280,886.81 | 4.450 |
TOTAL | 96,209,154.57 | 100.000 |
Stephen P. Jonas |
Affirmative | 92,457,628.76 | 96.101 |
Withheld | 3,751,525.81 | 3.899 |
TOTAL | 96,209,154.57 | 100.000 |
James H. KeyesB |
Affirmative | 92,432,729.82 | 96.075 |
Withheld | 3,776,424.75 | 3.925 |
TOTAL | 96,209,154.57 | 100.000 |
Marie L. Knowles |
Affirmative | 92,398,847.52 | 96.040 |
Withheld | 3,810,307.05 | 3.960 |
TOTAL | 96,209,154.57 | 100.000 |
Ned C. Lautenbach |
Affirmative | 92,423,184.47 | 96.065 |
Withheld | 3,785,970.10 | 3.935 |
TOTAL | 96,209,154.57 | 100.000 |
William O. McCoy |
Affirmative | 92,086,293.90 | 95.715 |
Withheld | 4,122,860.67 | 4.285 |
TOTAL | 96,209,154.57 | 100.000 |
| # of
Votes | % of
Votes |
Robert L. Reynolds |
Affirmative | 92,439,032.86 | 96.081 |
Withheld | 3,770,121.71 | 3.919 |
TOTAL | 96,209,154.57 | 100.000 |
Cornelia M. Small |
Affirmative | 92,415,567.29 | 96.057 |
Withheld | 3,793,587.28 | 3.943 |
TOTAL | 96,209,154.57 | 100.000 |
William S. Stavropoulos |
Affirmative | 92,135,400.08 | 95.766 |
Withheld | 4,073,754.49 | 4.234 |
TOTAL | 96,209,154.57 | 100.000 |
Kenneth L. Wolfe |
Affirmative | 92,445,865.31 | 96.088 |
Withheld | 3,763,289.26 | 3.912 |
TOTAL | 96,209,154.57 | 100.000 |
Abstain | 100,000,000.00 | 100.000 |
A Denotes trust-wide proposal and voting results. B Effective on or about January 1, 2007. |
Annual Report
Board Approval of Investment Advisory Contracts and Management Fees
VIP Value Leaders Portfolio
Each year, typically in July, the Board of Trustees, including the Independent Trustees (together, the Board), votes on the renewal of the management contract and sub-advisory agreements (together, the Advisory Contracts) for the fund. The Board, assisted by the advice of fund counsel and Independent Trustees' counsel, requests and considers a broad range of information throughout the year.
The Board meets regularly each month except August and takes into account throughout the year matters bearing on Advisory Contracts. The Board, acting directly and through its separate committees, considers at each of its meetings factors that are relevant to the annual renewal of the fund's Advisory Contracts, including the services and support provided to the fund and its shareholders. At the time of the renewal, the Board had 12 standing committees, each composed of Independent Trustees with varying backgrounds, to which the Board has assigned specific subject matter responsibilities in order to enhance effective decision-making by the Board. Each committee has adopted a written charter outlining the structure and purposes of the committee. One such committee, the Equity Contract Committee, meets periodically as needed throughout the year to consider matters specifically related to the annual renewal of Advisory Contracts. The committee requests and receives information on, and makes recommendations to the Independent Trustees concerning, the approval and annual review of the Advisory Contracts.
At its July 2006 meeting, the Board of Trustees, including the Independent Trustees, unanimously determined to renew the Advisory Contracts for the fund. In reaching its determination, the Board considered all factors it believed relevant, including (i) the nature, extent, and quality of the services to be provided to the fund and its shareholders (including the investment performance of the fund); (ii) the competitiveness of the management fee and total expenses of the fund; (iii) the total costs of the services to be provided by and the profits to be realized by the investment adviser and its affiliates from the relationship with the fund; (iv) the extent to which economies of scale would be realized as the fund grows; and (v) whether fee levels reflect these economies of scale, if any, for the benefit of fund shareholders.
In determining whether to renew the Advisory Contracts for the fund, the Board ultimately reached a determination, with the assistance of fund counsel and Independent Trustees' counsel, that the renewal of the Advisory Contracts and the compensation to be received by Fidelity under the management contract is consistent with Fidelity's fiduciary duty under applicable law. In addition to evaluating the specific factors noted above, the Board, in reaching its determination, is aware that shareholders in the fund have a broad range of investment choices available to them, including a wide choice among mutual funds offered by competitors to Fidelity, and that the fund's shareholders, with the opportunity to review and weigh the disclosure provided by the fund in its prospectus and other public disclosures, have chosen to invest in this fund, managed by Fidelity.
Nature, Extent, and Quality of Services Provided. The Board considered staffing within the investment adviser, FMR, and the sub-advisers (together, the Investment Advisers), including the background of the fund's portfolio manager and the fund's investment objective and discipline. The Independent Trustees also had discussions with senior management of Fidelity's investment operations and investment groups. The Board considered the structure of the portfolio manager compensation program and whether this structure provides appropriate incentives.
Resources Dedicated to Investment Management and Support Services. The Board reviewed the size, education, and experience of the Investment Advisers' investment staff, their use of technology, and the Investment Advisers' approach to recruiting, training, and retaining portfolio managers and other research, advisory, and management personnel. The Board considered Fidelity's extensive global research capabilities that enable the Investment Advisers to aggregate data from various sources in an effort to produce positive investment results. The Board noted that Fidelity's analysts have access to a variety of technological tools that enable them to perform both fundamental and quantitative analysis and to specialize in various disciplines. The Board also considered that Fidelity's portfolio managers and analysts have access to daily portfolio attribution that allows for monitoring of a fund's portfolio, as well as an electronic communication system that provides immediate real-time access to research concerning issuers and credit enhancers.
Shareholder and Administrative Services. The Board considered (i) the nature, extent, quality, and cost of administrative, distribution, and shareholder services performed by the Investment Advisers and their affiliates under the Advisory Contracts and under separate agreements covering transfer agency, pricing and bookkeeping, and securities lending services for the fund; (ii) the nature and extent of the Investment Advisers' supervision of third party service providers, principally custodians and subcustodians; and (iii) the resources devoted to, and the record of compliance with, the fund's compliance policies and procedures. The Board reviewed the allocation of fund brokerage, including allocations to brokers affiliated with the Investment Advisers, the use of brokerage commissions to pay fund expenses, and the use of "soft" commission dollars to pay for research services. The Board also considered that Fidelity voluntarily pays for market data out of its own resources.
The Board noted that the growth of fund assets across the complex allows Fidelity to reinvest in the development of services designed to enhance the value or convenience of the Fidelity funds as investment vehicles. These services include 24-hour access to account information and market information through phone representatives and over the Internet, and investor education materials and asset allocation tools.
Investment in a Large Fund Family. The Board considered the benefits to shareholders of investing in a Fidelity fund, including the benefits of investing in a fund that is part of a large family of funds offering a variety of investment disciplines and providing for a large variety of mutual fund investor services. The Board noted that, since the last Advisory Contract renewals in July 2005, Fidelity has taken a number of actions that benefited particular funds, including (i) dedicating additional resources to investment research and to restructure the investment research teams; (ii) voluntarily entering into contractual arrangements with certain brokers pursuant to which Fidelity pays for research products and services separately out of its own resources, rather than bundling with fund commissions; (iii) launching the Fidelity Advantage Class of its five Spartan stock index funds and three Spartan bond index funds, which is a lower-fee class available to shareholders with higher account balances; (iv) contractually agreeing to impose expense limitations on Fidelity U.S. Bond Index Fund and reducing the fund's initial investment minimum; and (v) offering shareholders of each of the Fidelity Institutional Money Market Funds the privilege of exchanging shares of the fund for shares of other Fidelity funds.
VIP Value Leaders Portfolio
Investment Performance and Compliance. The Board considered whether the fund has operated within its investment objective, as well as its record of compliance with its investment restrictions. It also reviewed the fund's absolute investment performance for each class (except Investor Class), as well as the fund's relative investment performance for each class (except Investor Class) measured against (i) a broad-based securities market index, and (ii) a peer group of mutual funds. Because the fund had been in existence less than three calendar years, the following chart considered by the Board shows, for the one-year period ended December 31, 2005, the total returns of Service Class 2 and Initial Class of the fund, the total return of a broad-based securities market index ("benchmark"), and a range of total returns of a peer group of mutual funds identified by Lipper Inc. as having an investment objective similar to that of the fund. The returns of Service Class 2 and Initial Class represent the performance of classes with the highest and lowest 12b-1 fees, respectively (not necessarily with the highest and lowest total expenses). (Investor Class of the fund, which has no 12b-1 fee, had less than one year of performance as of December 31, 2005.) The box within the chart shows the 25th percentile return (bottom of box) and the 75th percentile return (top of box) of the Lipper peer group. Returns shown above the box are in the first quartile and returns shown below the box are in the fourth quartile. The percentage beaten numbers noted below the chart correspond to the percentile box and represent the percentage of funds in the Lipper peer group whose performance was equal to or lower than that of the class indicated.
VIP Value Leaders Portfolio
The Board reviewed the fund's relative investment performance against its Lipper peer group and stated that the performance of Initial Class of the fund was in the second quartile for the period shown. The Board noted that FMR does not consider that Lipper peer group to be a meaningful comparison for the fund, however, because the peer group includes funds with different investment mandates (some broader, some narrower) than the fund. For example, the peer group includes funds that are not limited to a particular investment style, funds that focus on growth-oriented stocks, and funds that (like the fund) focus their investments on value-oriented securities. The Board also stated that the relative investment performance of the fund compared favorably to its benchmark for the period shown. The Board considered that the variations in performance among the fund's classes reflect the variations in class expenses, which result in lower performance for higher expense classes. The Board stated that it is difficult to evaluate in any comprehensive fashion the performance of the fund, in light of its relatively recent launch. The Board also reviewed the fund's relative investment performance against a peer group defined by Morningstar.
The Board considered that FMR has taken steps to refocus and strengthen equity research, equity portfolio management, and compliance. The Board noted with favor FMR's reorganization of its senior management team in 2005 and FMR's dedication of additional resources to investment research, and participated in the process that led to those changes.
Based on its review, and giving particular weight to the nature and quality of the resources dedicated by the Investment Advisers to maintain and improve relative performance, the Board concluded that the nature, extent, and quality of the services provided to the fund will benefit the fund's shareholders, particularly in light of the Board's view that the fund's shareholders benefit from investing in a fund that is part of a large family of funds offering a variety of investment disciplines and services.
Annual Report
Board Approval of Investment Advisory Contracts and Management Fees - continued
Competitiveness of Management Fee and Total Fund Expenses. The Board considered the fund's management fee and total expenses compared to "mapped groups" of competitive funds and classes. Fidelity creates "mapped groups" by combining similar Lipper investment objective categories that have comparable management fee characteristics. Combining Lipper investment objective categories aids the Board's management fee and total expense comparisons by broadening the competitive group used for comparison and by reducing the number of universes to which various Fidelity funds are compared.
The Board considered two proprietary management fee comparisons for the 12-month (or shorter) periods shown in the chart below. The group of Lipper funds used by the Board for management fee comparisons is referred to below as the "Total Mapped Group" and, for the reasons explained above, is broader than the Lipper peer group used by the Board for performance comparisons. The Total Mapped Group comparison focuses on a fund's standing relative to the total universe of comparable funds available to investors, in terms of gross management fees before expense reimbursements or caps. "TMG %" represents the percentage of funds in the Total Mapped Group that had management fees that were lower than the fund's. For example, a TMG % of 6% means that 94% of the funds in the Total Mapped Group had higher management fees than the fund. The "Asset-Size Peer Group" (ASPG) comparison focuses on a fund's standing relative to non-Fidelity funds similar in size to the fund within the Total Mapped Group. The ASPG represents at least 15% of the funds in the Total Mapped Group with comparable asset size and management fee characteristics, subject to a minimum of 50 funds (or all funds in the Total Mapped Group if fewer than 50). Additional information, such as the ASPG quartile in which the fund's management fee ranked, is also included in the chart and considered by the Board.
VIP Value Leaders Portfolio

The Board noted that the fund's management fee ranked below the median of its Total Mapped Group and below the median of its ASPG for 2005.
Based on its review, the Board concluded that the fund's management fee was fair and reasonable in light of the services that the fund receives and the other factors considered.
In its review of each class's total expenses, the Board considered the fund's management fee as well as other fund or class expenses, as applicable, such as transfer agent fees, pricing and bookkeeping fees, fund-paid 12b-1 fees, and custodial, legal, and audit fees. The Board also noted the effects of any waivers and reimbursements on fees and expenses. As part of its review, the Board also considered current and historical total expenses of each class of the fund compared to competitive fund median expenses. Each class of the fund is compared to those funds and classes in the Total Mapped Group (used by the Board for management fee comparisons) that have a similar sales load structure.
The Board noted that the total expenses of each of Initial Class and Service Class ranked below its competitive median for 2005, and the total expenses of each of Investor Class and Service Class 2 ranked above its competitive median for 2005. The Board noted that the fund offers multiple classes, each of which has a different 12b-1 fee structure, and that the multiple structures are intended to offer a range of pricing options for the intermediary market. The Board also noted that the total expenses of the classes vary primarily by the level of their 12b-1 fees, although differences in transfer agent fees may also cause expenses to vary from class to class. The Board considered that Investor Class was above median primarily due to its higher transfer agent fee.
In its review of total expenses, the Board also considered Fidelity fee structures and other information on clients that FMR and its affiliates service in other competitive markets, such as other mutual funds advised or subadvised by FMR or its affiliates, pension plan clients, and other institutional clients.
VIP Value Leaders Portfolio
Based on its review, the Board concluded that the total expenses of each class of the fund were reasonable, although in some cases above the median of the universe presented for comparison, in light of the services that the fund and its shareholders receive and the other factors considered.
Costs of the Services and Profitability. The Board considered the revenues earned and the expenses incurred by Fidelity in conducting the business of developing, marketing, distributing, managing, administering and servicing the fund and its shareholders. The Board also considered the level of Fidelity's profits in respect of all the Fidelity funds.
On an annual basis, FMR presents to the Board Fidelity's profitability for the fund. Fidelity calculates the profitability for each fund, as well as aggregate profitability for groups of Fidelity funds and all Fidelity funds, using a series of detailed revenue and cost allocation methodologies which originate with the audited books and records of Fidelity. The Audit Committee of the Board reviews any significant changes from the prior year's methodologies.
PricewaterhouseCoopers LLP (PwC), independent registered accounting firm and auditor to Fidelity and certain Fidelity funds, has been engaged annually by the Board as part of the Board's assessment of the results of Fidelity's profitability analysis. PwC's engagement includes the review and assessment of Fidelity's methodologies used in determining the revenues and expenses attributable to Fidelity's mutual fund business, and completion of agreed-upon procedures surrounding the mathematical accuracy of fund profitability and its conformity to allocation methodologies. After considering PwC's reports issued under the engagement and information provided by Fidelity, the Board believes that while other allocation methods may also be reasonable, Fidelity's profitability methodologies are reasonable in all material respects.
The Board has also reviewed Fidelity's non-fund businesses and any fall-out benefits related to the mutual fund business as well as cases where Fidelity's affiliates may benefit from or be related to the fund's business.
The Board considered the costs of the services provided by and the profits realized by Fidelity in connection with the operation of the fund and determined that the amount of profit is a fair entrepreneurial profit for the management of the fund.
Economies of Scale. The Board considered whether there have been economies of scale in respect of the management of the Fidelity funds, whether the Fidelity funds (including the fund) have appropriately benefited from any such economies of scale, and whether there is potential for realization of any further economies of scale. The Board considered the extent to which the fund will benefit from economies of scale through increased services to the fund, through waivers or reimbursements, or through fee or expense reductions.
The Board recognized that the fund's management contract incorporates a "group fee" structure, which provides for lower fee rates as total fund assets under FMR's management increase, and for higher fee rates as total fund assets under FMR's management decrease. The Board considered that the group fee is designed to deliver the benefits of economies of scale to fund shareholders when total fund assets increase, even if assets of any particular fund are unchanged or have declined, because some portion of Fidelity's costs are attributable to services provided to all Fidelity funds, and all funds benefit if those costs can be allocated among more assets. The Board concluded that, given the group fee structure, fund shareholders will achieve a certain level of economies of scale as assets under FMR's management increase at the fund complex level, regardless of whether Fidelity achieves any such economies of scale.
The Board further concluded that any potential economies of scale are being shared between fund shareholders and Fidelity in an appropriate manner.
Additional Information Requested by the Board. In order to develop fully the factual basis for consideration of the Advisory Contracts, the Board requested additional information on several topics, including (i) Fidelity's fund profitability methodology and profitability trends within certain funds; (ii) portfolio manager compensation; (iii) the extent to which any economies of scale exist and are shared between the funds and Fidelity; (iv) the total expenses of certain funds and classes relative to competitors, including the extent to which the expenses of certain funds have been or could be capped; (v) fund performance trends; and (vi) Fidelity's fee structures, including use of performance fees.
Based on its evaluation of all of the conclusions noted above, and after considering all material factors, the Board ultimately concluded that the advisory fee structures are fair and reasonable, and that the fund's Advisory Contracts should be renewed.
Annual Report
Investment Adviser
Fidelity Management & Research Company
Boston, MA
Investment Sub-Advisers
FMR Co., Inc.
Fidelity Management & Research (U.K.) Inc.
Fidelity Research & Analysis Company
(formerly Fidelity Management & Research (Far East) Inc.)
Fidelity Investments Japan Limited
Fidelity International Investment Advisors
Fidelity International Investment Advisors (U.K.) Limited
General Distributor
Fidelity Distributors Corporation
Boston, MA
Transfer and Service Agents
Fidelity Investments Institutional Operations Company, Inc.
Boston, MA
Fidelity Service Company, Inc.
Boston, MA
Custodian
Brown Brothers Harriman & Co.
Boston, MA
VVL-ANN-0207
1.796594.103
Item 2. Code of Ethics
As of the end of the period, December 31, 2006, Variable Insurance Products Fund IV (the trust) has adopted a code of ethics, as defined in Item 2 of Form N-CSR, that applies to its President and Treasurer and its Chief Financial Officer. A copy of the code of ethics is filed as an exhibit to this Form N-CSR.
Item 3. Audit Committee Financial Expert
The Board of Trustees of the trust has determined that Marie L. Knowles is an audit committee financial expert, as defined in Item 3 of Form N-CSR. Ms. Knowles is independent for purposes of Item 3 of Form N-CSR.
Item 4. Principal Accountant Fees and Services
(a) Audit Fees.
For the fiscal years ended December 31, 2006 and December 31, 2005, the aggregate Audit Fees billed by PricewaterhouseCoopers LLP (PwC) for professional services rendered for the audits of the financial statements, or services that are normally provided in connection with statutory and regulatory filings or engagements for those fiscal years, for Consumer Discretionary Portfolio, Energy Portfolio, Financial Services Portfolio, FundsManager 20% Portfolio, FundsManager 50% Portfolio, FundsManager 70% Portfolio, FundsManager 85% Portfolio, Growth Stock Portfolio, Health Care Portfolio, Industrials Portfolio, International Capital Appreciation Portfolio, Investor Freedom 2005 Portfolio, Investor Freedom 2010 Portfolio, Investor Freedom 2015 Portfolio, Investor Freedom 2020 Portfolio, Investor Freedom 2025 Portfolio, Investor Freedom 2030 Portfolio, Investor Freedom Income Portfolio, Real Estate Portfolio, Strategic Income Portfolio, Technology Portfolio, Utilities Portfolio, and Value Leaders Portfolio, (the funds) and for all funds in the Fidelity Group of Funds are shown in the table below.
Fund | 2006A | 2005A,B, C |
Consumer Discretionary Portfolio | $35,000 | $33,000 |
Energy Portfolio | $35,000 | $32,000 |
Financial Services Portfolio | $31,000 | $34,000 |
FundsManager 20% Portfolio | $22,000 | $0 |
FundsManager 50% Portfolio | $22,000 | $0 |
FundsManager 70% Portfolio | $22,000 | $0 |
FundsManager 85% Portfolio | $22,000 | $0 |
Growth Stock Portfolio | $43,000 | $40,000 |
Health Care Portfolio | $34,000 | $28,000 |
Industrials Portfolio | $36,000 | $33,000 |
International Capital Appreciation Portfolio | $46,000 | $27,000 |
Investor Freedom 2005 Portfolio | $21,000 | $15,000 |
Investor Freedom 2010 Portfolio | $21,000 | $15,000 |
Investor Freedom 2015 Portfolio | $21,000 | $15,000 |
Investor Freedom 2020 Portfolio | $21,000 | $15,000 |
Investor Freedom 2025 Portfolio | $21,000 | $15,000 |
Investor Freedom 2030 Portfolio | $21,000 | $15,000 |
Investor Freedom Income Portfolio | $21,000 | $15,000 |
Real Estate Portfolio | $43,000 | $40,000 |
Strategic Income Portfolio | $46,000 | $34,000 |
Technology Portfolio | $31,000 | $32,000 |
Utilities Portfolio | $34,000 | $32,000 |
Value Leaders Portfolio | $41,000 | $38,000 |
All funds in the Fidelity Group of Funds audited by PwC | $13,900,000 | $12,300,000 |
A | Aggregate amounts may reflect rounding. |
B | No Audit Fees were billed by PwC for professional services rendered for the audit of the annual financial statements, or services that are normally provided in connection with statutory and regulatory filings or engagements to FundsManager 20% Portfolio, FundsManager 50% Portfolio, FundsManager 70% Portfolio, and FundsManager 85% Portfolio, as the funds did not commence operations until April 13, 2006. |
C | Investor Freedom 2005 Portfolio, Investor Freedom 2010 Portfolio, Investor Freedom 2015 Portfolio, Investor Freedom 2020 Portfolio, Investor Freedom 2025 Portfolio, Investor Freedom 2030 Portfolio and Investor Freedom Income Portfolio commenced operations on August 3, 2005. |
For the fiscal years ended December 31, 2006 and December 31, 2005, the aggregate Audit Fees billed by Deloitte & Touche LLP, the member firms of Deloitte Touche Tohmatsu, and their respective affiliates (collectively, "Deloitte Entities") for professional services rendered for the audits of the financial statements, or services that are normally provided in connection with statutory and regulatory filings or engagements for those fiscal years, for Freedom 2005 Portfolio, Freedom 2010 Portfolio, Freedom 2015 Portfolio, Freedom 2020 Portfolio, Freedom 2025 Portfolio, Freedom 2030 Portfolio, Freedom Income Portfolio, Freedom Lifetime Income I Portfolio, Freedom Lifetime Income II Portfolio and Freedom Lifetime Income III Portfolio (the funds) and for all funds in the Fidelity Group of Funds are shown in the table below.
Fund | 2006A | 2005A, B, C |
Freedom 2005 Portfolio | $17,000 | $15,000 |
Freedom 2010 Portfolio | $17,000 | $15,000 |
Freedom 2015 Portfolio | $17,000 | $15,000 |
Freedom 2020 Portfolio | $17,000 | $15,000 |
Freedom 2025 Portfolio | $17,000 | $15,000 |
Freedom 2030 Portfolio | $17,000 | $15,000 |
Freedom Income Portfolio | $18,000 | $16,000 |
Freedom Lifetime Income I Portfolio | $14,000 | $12,000 |
Freedom Lifetime Income II Portfolio | $14,000 | $12,000 |
Freedom Lifetime Income III Portfolio | $14,000 | $12,000 |
All funds in the Fidelity Group of Funds audited by Deloitte Entities | $6,700,000 | $5,700,0000 |
A | Aggregate amounts may reflect rounding. |
B | Freedom 2005 Portfolio, Freedom 2010 Portfolio, Freedom 2015 Portfolio, Freedom 2020 Portfolio, Freedom 2025 Portfolio, Freedom 2030 Portfolio and Freedom Income Portfolio, commenced operations on April 26, 2005. |
C | Freedom Lifetime Income I Portfolio, Freedom Lifetime Income II Portfolio and Freedom Lifetime Income III Portfolio, commenced operations on July 26, 2005. |
(b) Audit-Related Fees.
In each of the fiscal years ended December 31, 2006 and December 31, 2005, the aggregate Audit-Related Fees billed by PwC for services rendered for assurance and related services to each fund that are reasonably related to the performance of the audit or review of the fund's financial statements, but not reported as Audit Fees, are shown in the table below.
Fund | 2006A | 2005 A,B, C |
Consumer Discretionary Portfolio | $0 | $0 |
Energy Portfolio | $0 | $0 |
Financial Services Portfolio | $0 | $0 |
FundsManager 20% Portfolio | $0 | $0 |
FundsManager 50% Portfolio | $0 | $0 |
FundsManager 70% Portfolio | $0 | $0 |
FundsManager 85% Portfolio | $0 | $0 |
Growth Stock Portfolio | $0 | $0 |
Health Care Portfolio | $0 | $0 |
Industrials Portfolio | $0 | $0 |
International Capital Appreciation Portfolio | $0 | $0 |
Investor Freedom 2005 Portfolio | $0 | $0 |
Investor Freedom 2010 Portfolio | $0 | $0 |
Investor Freedom 2015 Portfolio | $0 | $0 |
Investor Freedom 2020 Portfolio | $0 | $0 |
Investor Freedom 2025 Portfolio | $0 | $0 |
Investor Freedom 2030 Portfolio | $0 | $0 |
Investor Freedom Income Portfolio | $0 | $0 |
Real Estate Portfolio | $0 | $0 |
Strategic Income Portfolio | $0 | $0 |
Technology Portfolio | $0 | $0 |
Utilities Portfolio | $0 | $0 |
Value Leaders Portfolio | $0 | $0 |
A | Aggregate amounts may reflect rounding. |
B | No Audit-Related Fees were billed by PwC for services rendered for assurance and related services to FundsManager 20% Portfolio, FundsManager 50% Portfolio, FundsManager 70% Portfolio, and FundsManager 85% Portfolio that are reasonably related to the performance of the audit or review of the funds' financial statements, but not reported as Audit Fees, as the funds did not commence operations until April 13, 2006. |
C | Investor Freedom 2005 Portfolio, Investor Freedom 2010 Portfolio, Investor Freedom 2015 Portfolio, Investor Freedom 2020 Portfolio, Investor Freedom 2025 Portfolio, Investor Freedom 2030 Portfolio and Investor Freedom Income Portfolio commenced operations on August 3, 2005. |
In each of the fiscal years ended December 31, 2006 and December 31, 2005, the aggregate Audit-Related Fees billed by Deloitte Entities for services rendered for assurance and related services to each fund that are reasonably related to the performance of the audit or review of the fund's financial statements, but not reported as Audit Fees, are shown in the table below.
Fund | 2006A | 2005 A, B, C |
Freedom 2005 Portfolio | $0 | $0 |
Freedom 2010 Portfolio | $0 | $0 |
Freedom 2015 Portfolio | $0 | $0 |
Freedom 2020 Portfolio | $0 | $0 |
Freedom 2025 Portfolio | $0 | $0 |
Freedom 2030 Portfolio | $0 | $0 |
Freedom Income Portfolio | $0 | $0 |
Freedom Lifetime Income I Portfolio | $0 | $0 |
Freedom Lifetime Income II Portfolio | $0 | $0 |
Freedom Lifetime Income III Portfolio | $0 | $0 |
A | Aggregate amounts may reflect rounding. |
B | Freedom 2005 Portfolio, Freedom 2010 Portfolio, Freedom 2015 Portfolio, Freedom 2020 Portfolio, Freedom 2025 Portfolio, Freedom 2030 Portfolio and Freedom Income Portfolio commenced operations on April 26, 2005. |
C | Freedom Lifetime Income I Portfolio, Freedom Lifetime Income II Portfolio and Freedom Lifetime Income III Portfolio commenced operations on July 26, 2005. |
In each of the fiscal years ended December 31, 2006 and December 31, 2005, the aggregate Audit-Related Fees that were billed by PwC and Deloitte Entities that were required to be approved by the Audit Committee for services rendered on behalf of Fidelity Management & Research Company (FMR) and entities controlling, controlled by, or under common control with FMR (not including any sub-adviser whose role is primarily portfolio management and is subcontracted with or overseen by another investment adviser) that provide ongoing services to the funds ("Fund Service Providers") for assurance and related services that relate directly to the operations and financial reporting of each fund that are reasonably related to the performance of the audit or review of the fund's financial statements, but not reported as Audit Fees, are shown in the table below.
Billed By | 2006 A | 2005A |
PwC | $0 | $0 |
Deloitte Entities | $0 | $0 |
A | Aggregate amounts may reflect rounding. |
Fees included in the audit-related category comprise assurance and related services (e.g., due diligence services) that are traditionally performed by the independent registered public accounting firm. These audit-related services include due diligence related to mergers and acquisitions, accounting consultations and audits in connection with acquisitions, internal control reviews, attest services that are not required by statute or regulation and consultation concerning financial accounting and reporting standards.
(c) Tax Fees.
In each of the fiscal years ended December 31, 2006 and December 31, 2005, the aggregate Tax Fees billed by PwC for professional services rendered for tax compliance, tax advice, and tax planning for each fund is shown in the table below.
Fund | 2006A | 2005A,B,C |
Consumer Discretionary Portfolio | $2,000 | $1,900 |
Energy Portfolio | $2,000 | $1,900 |
Financial Services Portfolio | $2,000 | $1,900 |
FundsManager 20% Portfolio | $1,600 | $0 |
FundsManager 50% Portfolio | $1,600 | $0 |
FundsManager 70% Portfolio | $1,600 | $0 |
FundsManager 85% Portfolio | $1,600 | $0 |
Growth Stock Portfolio | $2,700 | $2,500 |
Health Care Portfolio | $2,000 | $1,900 |
Industrials Portfolio | $2,000 | $1,900 |
International Capital Appreciation Portfolio | $2,500 | $2,400 |
Investor Freedom 2005 Portfolio | $1,500 | $1,500 |
Investor Freedom 2010 Portfolio | $1,500 | $1,500 |
Investor Freedom 2015 Portfolio | $1,500 | $1,500 |
Investor Freedom 2020 Portfolio | $1,500 | $1,500 |
Investor Freedom 2025 Portfolio | $1,500 | $1,500 |
Investor Freedom 2030 Portfolio | $1,500 | $1,500 |
Investor Freedom Income Portfolio | $1,500 | $1,500 |
Real Estate Portfolio | $2,700 | $2,500 |
Strategic Income Portfolio | $2,600 | $2,200 |
Technology Portfolio | $2,000 | $1,900 |
Utilities Portfolio | $2,000 | $1,900 |
Value Leaders Portfolio | $2,700 | $2,500 |
A | Aggregate amounts may reflect rounding. |
B | No Tax Fees were billed by PwC for services rendered for tax compliance, tax advice, and tax planning for FundsManager 20% Portfolio, FundsManager 50% Portfolio, FundsManager 70% Portfolio, and FundsManager 85% Portfolio as the funds did not commence operations until April 13, 2006. |
C | Investor Freedom 2005 Portfolio, Investor Freedom 2010 Portfolio, Investor Freedom 2015 Portfolio, Investor Freedom 2020 Portfolio, Investor Freedom 2025 Portfolio, Investor Freedom 2030 Portfolio and Investor Freedom Income Portfolio commenced operations on August 3, 2005. |
In each of the fiscal years ended December 31, 2006 and December 31, 2005, the aggregate Tax Fees billed by Deloitte Entities for professional services rendered for tax compliance, tax advice, and tax planning for each fund is shown in the table below.
Fund | 2006A | 2005A,B,C |
Freedom 2005 Portfolio | $1,800 | $1,800 |
Freedom 2010 Portfolio | $1,800 | $1,800 |
Freedom 2015 Portfolio | $1,800 | $1,800 |
Freedom 2020 Portfolio | $1,800 | $1,800 |
Freedom 2025 Portfolio | $1,800 | $1,800 |
Freedom 2030 Portfolio | $1,800 | $1,800 |
Freedom Income Portfolio | $2,000 | $2,000 |
Freedom Lifetime Income I Portfolio | $1,800 | $2,000 |
Freedom Lifetime Income II Portfolio | $1,800 | $2,000 |
Freedom Lifetime Income III Portfolio | $1,800 | $2,000 |
A | Aggregate amounts may reflect rounding. |
B | Freedom 2005 Portfolio, Freedom 2010 Portfolio, Freedom 2015 Portfolio, Freedom 2020 Portfolio, Freedom 2025 Portfolio, Freedom 2030 Portfolio and Freedom Income Portfolio commenced operations on April 26, 2005. |
C | Freedom Lifetime Income I Portfolio, Freedom Lifetime Income II Portfolio and Freedom Lifetime Income III Portfolio commenced operations on July 26, 2005. |
In each of the fiscal years ended December 31, 2006 and December 31, 2005, the aggregate Tax Fees billed by PwC and Deloitte Entities that were required to be approved by the Audit Committee for professional services rendered on behalf of the Fund Service Providers for tax compliance, tax advice, and tax planning that relate directly to the operations and financial reporting of each fund is shown in the table below.
Billed By | 2006A | 2005A |
PwC | $0 | $0 |
Deloitte Entities | $0 | $0 |
A | Aggregate amounts may reflect rounding. |
Fees included in the Tax Fees category comprise all services performed by professional staff in the independent registered public accounting firm's tax division except those services related to the audit. Typically, this category would include fees for tax compliance, tax planning, and tax advice. Tax compliance, tax advice, and tax planning services include preparation of original and amended tax returns, claims for refund and tax payment-planning services, assistance with tax audits and appeals, tax advice related to mergers and acquisitions and requests for rulings or technical advice from taxing authorities.
(d) All Other Fees.
In each of the fiscal years ended December 31, 2006 and December 31, 2005, the aggregate Other Fees billed by PwC for all other non-audit services rendered to the funds is shown in the table below.
Fund | 2006A | 2005A,B,C |
Consumer Discretionary Portfolio | $1,200 | $1,400 |
Energy Portfolio | $1,500 | $1,500 |
Financial Services Portfolio | $1,200 | $1,400 |
FundsManager 20% Portfolio | $500 | $0 |
FundsManager 50% Portfolio | $500 | $0 |
FundsManager 70% Portfolio | $500 | $0 |
FundsManager 85% Portfolio | $500 | $0 |
Growth Stock Portfolio | $1,200 | $1,300 |
Health Care Portfolio | $1,300 | $1,400 |
Industrials Portfolio | $1,200 | $1,400 |
International Capital Appreciation Portfolio | $1,200 | $1,300 |
Investor Freedom 2005 Portfolio | $1,200 | $300 |
Investor Freedom 2010 Portfolio | $1,200 | $300 |
Investor Freedom 2015 Portfolio | $1,200 | $300 |
Investor Freedom 2020 Portfolio | $1,200 | $300 |
Investor Freedom 2025 Portfolio | $1,200 | $300 |
Investor Freedom 2030 Portfolio | $1,200 | $300 |
Investor Freedom Income Portfolio | $1,200 | $300 |
Real Estate Portfolio | $1,300 | $1,500 |
Strategic Income Portfolio | $1,300 | $1,500 |
Technology Portfolio | $1,200 | $1,400 |
Utilities Portfolio | $1,200 | $1,400 |
Value Leaders Portfolio | $1,200 | $1,400 |
A | Aggregate amounts may reflect rounding. |
B | No Other Fees were billed by PwC for all other non-audit services rendered to FundsManager 20% Portfolio, FundsManager 50% Portfolio, FundsManager 70% Portfolio, and FundsManager 85% Portfolio as the funds did not commence operations until April 13, 2006. |
C | Investor Freedom 2005 Portfolio, Investor Freedom 2010 Portfolio, Investor Freedom 2015 Portfolio, Investor Freedom 2020 Portfolio, Investor Freedom 2025 Portfolio, Investor Freedom 2030 Portfolio and Investor Freedom Income Portfolio commenced operations on August 3, 2005. |
In each of the fiscal years ended December 31, 2006 and December 31, 2005, the aggregate Other Fees billed by Deloitte Entities for all other non-audit services rendered to the funds is shown in the table below.
Fund | 2006A | 2005A,B,C |
Freedom 2005 Portfolio | $0 | $0 |
Freedom 2010 Portfolio | $0 | $0 |
Freedom 2015 Portfolio | $0 | $0 |
Freedom 2020 Portfolio | $0 | $0 |
Freedom 2025 Portfolio | $0 | $0 |
Freedom 2030 Portfolio | $0 | $0 |
Freedom Income Portfolio | $0 | $0 |
Freedom Lifetime Income I Portfolio | $0 | $0 |
Freedom Lifetime Income II Portfolio | $0 | $0 |
Freedom Lifetime Income III Portfolio | $0 | $0 |
A | Aggregate amounts may reflect rounding. |
B | Freedom 2005 Portfolio, Freedom 2010 Portfolio, Freedom 2015 Portfolio, Freedom 2020 Portfolio, Freedom 2025 Portfolio, Freedom 2030 Portfolio and Freedom Income Portfolio commenced operations on April 26, 2005. |
C | Freedom Lifetime Income I Portfolio, Freedom Lifetime Income II Portfolio and Freedom Lifetime Income III Portfolio commenced operations on July 26, 2005. |
In each of the fiscal years ended December 31, 2006 and December 31, 2005, the aggregate Other Fees billed by PwC and Deloitte Entities that were required to be approved by the Audit Committee for all other non-audit services rendered on behalf of the Fund Service Providers that relate directly to the operations and financial reporting of each fund is shown in the table below.
Billed By | 2006A | 2005A |
PwC | $125,000 | $190,000 |
Deloitte Entities | $180,000 | $160,000 |
A | Aggregate amounts may reflect rounding. |
Fees included in the All Other Fees category include services related to internal control reviews, strategy and other consulting, financial information systems design and implementation, consulting on other information systems, and other tax services unrelated to the fund.
(e) (1) | Audit Committee Pre-Approval Policies and Procedures: |
The trust's Audit Committee must pre-approve all audit and non-audit services provided by the independent registered public accounting firm relating to the operations or financial reporting of the funds. Prior to the commencement of any audit or non-audit services to a fund, the Audit Committee reviews the services to determine whether they are appropriate and permissible under applicable law.
The trust's Audit Committee has adopted policies and procedures to, among other purposes, provide a framework for the Committee's consideration of non-audit services by the audit firms that audit the Fidelity funds. The policies and procedures require that any non-audit service provided by a fund audit firm to a Fidelity Fund and any non-audit service provided by a fund auditor to a Fund Service Provider that relates directly to the operations and financial reporting of a Fidelity fund (Covered Service) are subject to approval by the Audit Committee before such service is provided. Non-audit services provided by a fund audit firm for a Fund Service Provider that do not relate directly to the operations and financial reporting of a Fidelity fund (Non-Covered Service) but that are expected to exceed $50,000 are also subject to pre-approval by the Audit Committee.
All Covered Services, as well as Non-Covered Services that are expected to exceed $50,000, must be approved in advance of provision of the service either: (i) by formal resolution of the Audit Committee, or (ii) by oral or written approval of the service by the Chair of the Audit Committee (or if the Chair is unavailable, such other member of the Audit Committee as may be designated by the Chair to act in the Chair's absence). The approval contemplated by (ii) above is permitted where the Treasurer determines that action on such an engagement is necessary before the next meeting of the Audit Committee. Neither pre-approval nor advance notice of Non-Covered Service engagements for which fees are not expected to exceed $50,000 is required; such engagements are to be reported to the Audit Committee monthly.
(e) (2) | Services approved pursuant to paragraph (c)(7)(i)(C) of Rule 2-01 of Regulation S-X: |
Audit-Related Fees:
There were no amounts that were approved by the Audit Committee pursuant to the de minimis exception for the fiscal years ended December 31, 2006 and December 31, 2005 on behalf of each fund.
There were no amounts that were required to be approved by the Audit Committee pursuant to the de minimis exception for the fiscal years ended December 31, 2006 and December 31, 2005 on behalf of the Fund Service Providers that relate directly to the operations and financial reporting of each fund.
Tax Fees:
There were no amounts that were approved by the Audit Committee pursuant to the de minimis exception for the fiscal years ended December 31, 2006 and December 31, 2005 on behalf of each fund.
There were no amounts that were required to be approved by the Audit Committee pursuant to the de minimis exception for the fiscal years ended December 31, 2006 and December 31, 2005 on behalf of the Fund Service Providers that relate directly to the operations and financial reporting of each fund.
All Other Fees:
There were no amounts that were approved by the Audit Committee pursuant to the de minimis exception for the fiscal years ended December 31, 2006 and December 31, 2005 on behalf of each fund.
There were no amounts that were required to be approved by the Audit Committee pursuant to the de minimis exception for the fiscal years ended December 31, 2006 and December 31, 2005 on behalf of the Fund Service Providers that relate directly to the operations and financial reporting of each fund.
(f) Not applicable.
(g) For the fiscal years ended December 31, 2006 and December 31, 2005, the aggregate fees billed by PwC of $1,385,000A and $1,340,000A,B for non-audit services rendered on behalf of the funds, FMR (not including any sub-adviser whose role is primarily portfolio management and is subcontracted with or overseen by another investment adviser) and Fund Service Providers relating to Covered Services and Non-Covered Services are shown in the table below.
| 2006A | 2005A |
Covered Services | $195,000 | $250,000 |
Non-Covered Services | $1,190,000 | $1,090,000B |
A | Aggregate amounts may reflect rounding. |
B | Reflects current period presentation. |
For the fiscal years ended December 31, 2006 and December 31, 2005, the aggregate fees billed by Deloitte Entities of $735,000A and $400,000A,B for non-audit services rendered on behalf of the fund, FMR (not including any sub-adviser whose role is primarily portfolio management and is subcontracted with or overseen by another investment adviser) and Fund Service Providers relating to Covered Services and Non-Covered Services are shown in the table below.
| 2006A | 2005A |
Covered Services | $200,000 | $150,000 |
Non-Covered Services | $535,000 | $250,000 B |
A | Aggregate amounts may reflect rounding. |
B | Reflects current period presentation. |
(h) The trust's Audit Committee has considered Non-Covered Services that were not pre-approved that were provided by PwC and Deloitte Entities to Fund Service Providers to be compatible with maintaining the independence of PwC and Deloitte Entities in their audit of the funds, taking into account representations from PwC and Deloitte Entities, in accordance with Independence Standards Board Standard No.1, regarding their independence from the funds and their related entities.
Item 5. Audit Committee of Listed Registrants
Not applicable.
Item 6. Schedule of Investments
Not applicable.
Item 7. Disclosure of Proxy Voting Policies and Procedures for Closed-End Management Investment Companies
Not applicable.
Item 8. Portfolio Managers of Closed-End Management Investment Companies
Not applicable.
Item 9. Purchase of Equity Securities by Closed-End Management Investment Company and Affiliated Purchasers
Not applicable.
Item 10. Submission of Matters to a Vote of Security Holders
There were no material changes to the procedures by which shareholders may recommend nominees to the trust's Board of Trustees.
Item 11. Controls and Procedures
(a)(i) The President and Treasurer and the Chief Financial Officer have concluded that the trust's disclosure controls and procedures (as defined in Rule 30a-3(c) under the Investment Company Act) provide reasonable assurances that material information relating to the trust is made known to them by the appropriate persons, based on their evaluation of these controls and procedures as of a date within 90 days of the filing date of this report.
(a)(ii) There was no change in the trust's internal control over financial reporting (as defined in Rule 30a-3(d) under the Investment Company Act) that occurred during the second fiscal quarter of the period covered by this report that has materially affected, or is reasonably likely to materially affect, the trust's internal control over financial reporting.
Item 12. Exhibits
(a) | (1) | Code of Ethics pursuant to Item 2 of Form N-CSR is filed and attached hereto as EX-99.CODE ETH. |
(a) | (2) | Certification pursuant to Rule 30a-2(a) under the Investment Company Act of 1940 (17 CFR 270.30a-2(a)) is filed and attached hereto as Exhibit 99.CERT. |
(a) | (3) | Not applicable. |
(b) | | Certification pursuant to Rule 30a-2(b) under the Investment Company Act of 1940 (17 CFR 270.30a-2(b)) is furnished and attached hereto as Exhibit 99.906CERT. |
SIGNATURES
Pursuant to the requirements of the Securities Exchange Act of 1934 and the Investment Company Act of 1940, the registrant has duly caused this report to be signed on its behalf by the undersigned, thereunto duly authorized.
Variable Insurance Products Fund IV
By: | /s/Kimberley Monasterio |
| Kimberley Monasterio |
| President and Treasurer |
| |
Date: | February 26, 2007 |
Pursuant to the requirements of the Securities Exchange Act of 1934 and the Investment Company Act of 1940, this report has been signed below by the following persons on behalf of the registrant and in the capacities and on the dates indicated.
By: | /s/Kimberley Monasterio |
| Kimberley Monasterio |
| President and Treasurer |
| |
Date: | February 26, 2007 |
By: | /s/Joseph B. Hollis |
| Joseph B. Hollis |
| Chief Financial Officer |
| |
Date: | February 26, 2007 |