UNITED STATES
SECURITIES AND EXCHANGE COMMISSION
Washington, D.C. 20549
FORM N-CSR
CERTIFIED SHAREHOLDER REPORT OF REGISTERED
MANAGEMENT INVESTMENT COMPANIES
Investment Company Act file number 811-3759
Variable Insurance Products Fund IV
(Exact name of registrant as specified in charter)
245 Summer St., Boston, MA 02210
(Address of principal executive offices) (Zip code)
Marc Bryant, Secretary
245 Summer St.
Boston, Massachusetts 02210
(Name and address of agent for service)
Registrant's telephone number, including area code:
617-563-7000
| |
Date of fiscal year end: | December 31 |
|
|
Date of reporting period: | June 30, 2016 |
Item 1.
Reports to Stockholders
Fidelity® Variable Insurance Products: Consumer Discretionary Portfolio
Semi-Annual Report June 30, 2016 |
 |
Contents
To view a fund's proxy voting guidelines and proxy voting record for the 12-month period ended June 30, visit http://www.fidelity.com/proxyvotingresults or visit the Securities and Exchange Commission's (SEC) web site at http://www.sec.gov.
You may also call 1-877-208-0098 to request a free copy of the proxy voting guidelines.
Fidelity® Variable Insurance Products are separate account options which are purchased through a variable insurance contract.
Standard & Poor's, S&P and S&P 500 are registered service marks of The McGraw-Hill Companies, Inc. and have been licensed for use by Fidelity Distributors Corporation.
Other third-party marks appearing herein are the property of their respective owners.
All other marks appearing herein are registered or unregistered trademarks or service marks of FMR LLC or an affiliated company. © 2016 FMR LLC. All rights reserved.
This report and the financial statements contained herein are submitted for the general information of the shareholders of the Fund. This report is not authorized for distribution to prospective investors in the Fund unless preceded or accompanied by an effective prospectus.
A fund files its complete schedule of portfolio holdings with the SEC for the first and third quarters of each fiscal year on Form N-Q. Forms N-Q are available on the SEC’s web site at http://www.sec.gov. A fund's Forms N-Q may be reviewed and copied at the SEC’s Public Reference Room in Washington, DC. Information regarding the operation of the SEC's Public Reference Room may be obtained by calling 1-800-SEC-0330.
For a complete list of a fund's portfolio holdings, view the most recent holdings listing, semiannual report, or annual report on Fidelity's web site at http://www.fidelity.com, http://www.institutional.fidelity.com, or http://www.401k.com, as applicable.
NOT FDIC INSURED •MAY LOSE VALUE •NO BANK GUARANTEE
Neither the Fund nor Fidelity Distributors Corporation is a bank.
Investment Summary (Unaudited)
Top Ten Stocks as of June 30, 2016
| | % of fund's net assets | % of fund's net assets 6 months ago |
| Amazon.com, Inc. | 15.2 | 9.9 |
| The Walt Disney Co. | 8.4 | 7.1 |
| Home Depot, Inc. | 8.0 | 4.1 |
| Charter Communications, Inc. Class A | 7.1 | 3.8 |
| Starbucks Corp. | 5.2 | 4.1 |
| NIKE, Inc. Class B | 5.1 | 4.1 |
| Ross Stores, Inc. | 4.8 | 3.4 |
| L Brands, Inc. | 4.4 | 4.7 |
| Hilton Worldwide Holdings, Inc. | 4.1 | 3.1 |
| AutoZone, Inc. | 3.5 | 2.1 |
| | 65.8 | |
Top Industries (% of fund's net assets)
| As of June 30, 2016 |
| | Specialty Retail | 25.1% |
| | Media | 24.2% |
| | Internet & Catalog Retail | 17.0% |
| | Hotels, Restaurants & Leisure | 13.5% |
| | Textiles, Apparel & Luxury Goods | 8.5% |
| | All Others* | 11.7% |

* Includes Short-Term investments and Net Other Assets (Liabilities).
| As of December 31, 2015 |
| | Specialty Retail | 19.4% |
| | Media | 19.3% |
| | Hotels, Restaurants & Leisure | 16.5% |
| | Internet & Catalog Retail | 11.9% |
| | Textiles, Apparel & Luxury Goods | 9.0% |
| | All Others* | 23.9% |

* Includes Short-Term investments and Net Other Assets (Liabilities).
Investments June 30, 2016 (Unaudited)
Showing Percentage of Net Assets
| Common Stocks - 98.0% | | | |
| | | Shares | Value |
| Auto Components - 2.0% | | | |
| Auto Parts & Equipment - 2.0% | | | |
| Tenneco, Inc. (a) | | 50,451 | $2,351,521 |
| Visteon Corp. | | 13,401 | 881,920 |
| | | | 3,233,441 |
| Automobiles - 0.3% | | | |
| Automobile Manufacturers - 0.3% | | | |
| Ferrari NV (b) | | 9,600 | 392,928 |
| Beverages - 1.5% | | | |
| Distillers & Vintners - 0.5% | | | |
| Constellation Brands, Inc. Class A (sub. vtg.) | | 4,660 | 770,764 |
| Soft Drinks - 1.0% | | | |
| Monster Beverage Corp. | | 9,830 | 1,579,779 |
|
| TOTAL BEVERAGES | | | 2,350,543 |
|
| Food & Staples Retailing - 0.9% | | | |
| Hypermarkets & Super Centers - 0.9% | | | |
| Costco Wholesale Corp. | | 9,400 | 1,476,176 |
| Hotels, Restaurants & Leisure - 13.5% | | | |
| Casinos & Gaming - 1.0% | | | |
| Las Vegas Sands Corp. | | 36,359 | 1,581,253 |
| Hotels, Resorts & Cruise Lines - 4.6% | | | |
| Accor SA | | 21,400 | 819,965 |
| Hilton Worldwide Holdings, Inc. | | 289,940 | 6,532,348 |
| | | | 7,352,313 |
| Leisure Facilities - 1.0% | | | |
| Vail Resorts, Inc. | | 11,860 | 1,639,408 |
| Restaurants - 6.9% | | | |
| Buffalo Wild Wings, Inc. (a) | | 5,000 | 694,750 |
| Del Frisco's Restaurant Group, Inc. (a) | | 22,100 | 316,472 |
| Domino's Pizza, Inc. | | 6,500 | 853,970 |
| McDonald's Corp. | | 7,550 | 908,567 |
| Starbucks Corp. | | 146,970 | 8,394,926 |
| | | | 11,168,685 |
|
| TOTAL HOTELS, RESTAURANTS & LEISURE | | | 21,741,659 |
|
| Household Durables - 1.4% | | | |
| Household Appliances - 1.4% | | | |
| Techtronic Industries Co. Ltd. | | 535,908 | 2,237,952 |
| Household Products - 2.0% | | | |
| Household Products - 2.0% | | | |
| Spectrum Brands Holdings, Inc. | | 26,780 | 3,195,122 |
| Internet & Catalog Retail - 17.0% | | | |
| Catalog Retail - 0.5% | | | |
| Liberty Interactive Corp. QVC Group Series A (a) | | 29,500 | 748,415 |
| Internet Retail - 16.5% | | | |
| Amazon.com, Inc. (a) | | 34,098 | 24,401,212 |
| Netflix, Inc. (a) | | 4,200 | 384,216 |
| Ocado Group PLC (a)(b) | | 543,209 | 1,676,076 |
| | | | 26,461,504 |
|
| TOTAL INTERNET & CATALOG RETAIL | | | 27,209,919 |
|
| Leisure Products - 0.8% | | | |
| Leisure Products - 0.8% | | | |
| Mattel, Inc. | | 42,100 | 1,317,309 |
| Media - 24.2% | | | |
| Advertising - 2.8% | | | |
| Interpublic Group of Companies, Inc. | | 193,157 | 4,461,927 |
| Cable & Satellite - 11.5% | | | |
| Charter Communications, Inc. Class A | | 49,977 | 11,426,741 |
| Comcast Corp. Class A | | 52,240 | 3,405,526 |
| DISH Network Corp. Class A (a) | | 5,500 | 288,200 |
| Naspers Ltd. Class N | | 15,940 | 2,433,959 |
| Sirius XM Holdings, Inc. (a) | | 214,800 | 848,460 |
| | | | 18,402,886 |
| Movies & Entertainment - 9.9% | | | |
| The Walt Disney Co. | | 137,957 | 13,494,954 |
| Time Warner, Inc. | | 33,800 | 2,485,652 |
| | | | 15,980,606 |
|
| TOTAL MEDIA | | | 38,845,419 |
|
| Multiline Retail - 0.8% | | | |
| General Merchandise Stores - 0.8% | | | |
| B&M European Value Retail S.A. | | 386,784 | 1,317,989 |
| Specialty Retail - 25.1% | | | |
| Apparel Retail - 11.3% | | | |
| Inditex SA | | 34,149 | 1,147,200 |
| L Brands, Inc. | | 104,100 | 6,988,233 |
| Ross Stores, Inc. | | 136,900 | 7,760,861 |
| TJX Companies, Inc. | | 27,717 | 2,140,584 |
| Zumiez, Inc. (a) | | 8,700 | 124,497 |
| | | | 18,161,375 |
| Automotive Retail - 5.4% | | | |
| Advance Auto Parts, Inc. | | 4,100 | 662,683 |
| AutoZone, Inc. (a) | | 7,090 | 5,628,326 |
| O'Reilly Automotive, Inc. (a) | | 8,860 | 2,401,946 |
| | | | 8,692,955 |
| Home Improvement Retail - 8.0% | | | |
| Home Depot, Inc. | | 100,500 | 12,832,845 |
| Specialty Stores - 0.4% | | | |
| Sally Beauty Holdings, Inc. (a) | | 21,100 | 620,551 |
|
| TOTAL SPECIALTY RETAIL | | | 40,307,726 |
|
| Textiles, Apparel & Luxury Goods - 8.5% | | | |
| Apparel, Accessories & Luxury Goods - 3.4% | | | |
| G-III Apparel Group Ltd. (a) | | 22,252 | 1,017,361 |
| Regina Miracle International Holdings Ltd. | | 90,019 | 119,455 |
| VF Corp. | | 69,600 | 4,279,704 |
| | | | 5,416,520 |
| Footwear - 5.1% | | | |
| NIKE, Inc. Class B | | 148,770 | 8,212,104 |
|
| TOTAL TEXTILES, APPAREL & LUXURY GOODS | | | 13,628,624 |
|
| TOTAL COMMON STOCKS | | | |
| (Cost $135,551,271) | | | 157,254,807 |
|
| Money Market Funds - 3.5% | | | |
| Fidelity Cash Central Fund, 0.43% (c) | | 3,611,990 | 3,611,990 |
| Fidelity Securities Lending Cash Central Fund, 0.46% (c)(d) | | 2,104,152 | 2,104,152 |
| TOTAL MONEY MARKET FUNDS | | | |
| (Cost $5,716,142) | | | 5,716,142 |
| TOTAL INVESTMENT PORTFOLIO - 101.5% | | | |
| (Cost $141,267,413) | | | 162,970,949 |
| NET OTHER ASSETS (LIABILITIES) - (1.5)% | | | (2,452,623) |
| NET ASSETS - 100% | | | $160,518,326 |
Legend
(a) Non-income producing
(b) Security or a portion of the security is on loan at period end.
(c) Affiliated fund that is generally available only to investment companies and other accounts managed by Fidelity Investments. The rate quoted is the annualized seven-day yield of the fund at period end. A complete unaudited listing of the fund's holdings as of its most recent quarter end is available upon request. In addition, each Fidelity Central Fund's financial statements are available on the SEC's website or upon request.
(d) Investment made with cash collateral received from securities on loan.
Affiliated Central Funds
Information regarding fiscal year to date income earned by the Fund from investments in Fidelity Central Funds is as follows:
| Fund | Income earned |
| Fidelity Cash Central Fund | $4,712 |
| Fidelity Securities Lending Cash Central Fund | 128,017 |
| Total | $132,729 |
Investment Valuation
The following is a summary of the inputs used, as of June 30, 2016, involving the Fund's assets and liabilities carried at fair value. The inputs or methodology used for valuing securities may not be an indication of the risk associated with investing in those securities. For more information on valuation inputs, and their aggregation into the levels used below, please refer to the Investment Valuation section in the accompanying Notes to Financial Statements.
| | Valuation Inputs at Reporting Date: |
| Description | Total | Level 1 | Level 2 | Level 3 |
| Investments in Securities: | | | | |
| Common Stocks | $157,254,807 | $147,502,211 | $9,752,596 | $-- |
| Money Market Funds | 5,716,142 | 5,716,142 | -- | -- |
| Total Investments in Securities: | $162,970,949 | $153,218,353 | $9,752,596 | $-- |
The following is a summary of transfers between Level 1 and Level 2 for the period ended June 30, 2016. Transfers are assumed to have occurred at the beginning of the period, and are primarily attributable to the valuation techniques used for foreign equity securities, as discussed in the accompanying Notes to Financial Statements:
| Transfers | Total |
| Level 1 to Level 2 | $6,640,106 |
| Level 2 to Level 1 | $0 |
See accompanying notes which are an integral part of the financial statements.
Financial Statements
Statement of Assets and Liabilities
| | | June 30, 2016 (Unaudited) |
| Assets | | |
Investment in securities, at value (including securities loaned of $2,041,923) — See accompanying schedule:
Unaffiliated issuers (cost $135,551,271) | $157,254,807 | |
| Fidelity Central Funds (cost $5,716,142) | 5,716,142 | |
| Total Investments (cost $141,267,413) | | $162,970,949 |
| Receivable for investments sold | | 324,432 |
| Dividends receivable | | 113,624 |
| Distributions receivable from Fidelity Central Funds | | 10,082 |
| Prepaid expenses | | 95 |
| Other receivables | | 7,165 |
| Total assets | | 163,426,347 |
| Liabilities | | |
| Payable for investments purchased | $352,104 | |
| Payable for fund shares redeemed | 331,512 | |
| Accrued management fee | 74,715 | |
| Other affiliated payables | 23,617 | |
| Other payables and accrued expenses | 21,921 | |
| Collateral on securities loaned, at value | 2,104,152 | |
| Total liabilities | | 2,908,021 |
| Net Assets | | $160,518,326 |
| Net Assets consist of: | | |
| Paid in capital | | $145,566,509 |
| Undistributed net investment income | | 912,245 |
| Accumulated undistributed net realized gain (loss) on investments and foreign currency transactions | | (7,656,730) |
| Net unrealized appreciation (depreciation) on investments and assets and liabilities in foreign currencies | | 21,696,302 |
| Net Assets | | $160,518,326 |
| Initial Class: | | |
| Net Asset Value, offering price and redemption price per share ($26,420,672 ÷ 1,497,255 shares) | | $17.65 |
| Investor Class: | | |
| Net Asset Value, offering price and redemption price per share ($134,097,654 ÷ 7,621,741 shares) | | $17.59 |
See accompanying notes which are an integral part of the financial statements.
Statement of Operations
| | | Six months ended June 30, 2016 (Unaudited) |
| Investment Income | | |
| Dividends | | $1,446,171 |
| Income from Fidelity Central Funds (including $128,017 from security lending) | | 132,729 |
| Total income | | 1,578,900 |
| Expenses | | |
| Management fee | $482,669 | |
| Transfer agent fees | 116,395 | |
| Accounting and security lending fees | 35,709 | |
| Custodian fees and expenses | 5,635 | |
| Independent trustees' fees and expenses | 2,007 | |
| Audit | 32,317 | |
| Legal | 1,570 | |
| Miscellaneous | 767 | |
| Total expenses before reductions | 677,069 | |
| Expense reductions | (10,414) | 666,655 |
| Net investment income (loss) | | 912,245 |
| Realized and Unrealized Gain (Loss) | | |
| Net realized gain (loss) on: | | |
| Investment securities: | | |
| Unaffiliated issuers | (6,523,774) | |
| Foreign currency transactions | 5,321 | |
| Total net realized gain (loss) | | (6,518,453) |
Change in net unrealized appreciation (depreciation) on:
Investment securities | 4,491,642 | |
| Assets and liabilities in foreign currencies | (6,143) | |
| Total change in net unrealized appreciation (depreciation) | | 4,485,499 |
| Net gain (loss) | | (2,032,954) |
| Net increase (decrease) in net assets resulting from operations | | $(1,120,709) |
See accompanying notes which are an integral part of the financial statements.
Statement of Changes in Net Assets
| | Six months ended June 30, 2016 (Unaudited) | Year ended December 31, 2015 |
| Increase (Decrease) in Net Assets | | |
| Operations | | |
| Net investment income (loss) | $912,245 | $912,511 |
| Net realized gain (loss) | (6,518,453) | 2,600,750 |
| Change in net unrealized appreciation (depreciation) | 4,485,499 | 267,905 |
| Net increase (decrease) in net assets resulting from operations | (1,120,709) | 3,781,166 |
| Distributions to shareholders from net investment income | – | (888,137) |
| Distributions to shareholders from net realized gain | (3,068,756) | (12,074,620) |
| Total distributions | (3,068,756) | (12,962,757) |
| Share transactions - net increase (decrease) | (43,308,875) | 108,756,640 |
| Redemption fees | 41,345 | 73,024 |
| Total increase (decrease) in net assets | (47,456,995) | 99,648,073 |
| Net Assets | | |
| Beginning of period | 207,975,321 | 108,327,248 |
| End of period | $160,518,326 | $207,975,321 |
| Other Information | | |
| Undistributed net investment income end of period | $912,245 | $– |
See accompanying notes which are an integral part of the financial statements.
Financial Highlights — VIP Consumer Discretionary Portfolio Initial Class
| | Six months ended (Unaudited) June 30, | Years ended December 31, | | | | |
| | 2016 | 2015 | 2014 | 2013 | 2012 | 2011 |
| Selected Per–Share Data | | | | | | |
| Net asset value, beginning of period | $17.88 | $19.01 | $18.54 | $14.24 | $12.26 | $12.56 |
| Income from Investment Operations | | | | | | |
| Net investment income (loss)A | .10 | .13 | .08 | .03 | .07 | .06 |
| Net realized and unrealized gain (loss) | (.03) | .73 | 1.59 | 5.58 | 2.55 | (.29) |
| Total from investment operations | .07 | .86 | 1.67 | 5.61 | 2.62 | (.23) |
| Distributions from net investment income | – | (.09) | (.10) | (.02) | (.05) | (.08) |
| Distributions from net realized gain | (.30) | (1.91) | (1.11) | (1.30) | (.60) | – |
| Total distributions | (.30) | (2.00) | (1.20)B | (1.32) | (.65) | (.08) |
| Redemption fees added to paid in capitalA | –C | .01 | –C | .01 | .01 | .01 |
| Net asset value, end of period | $17.65 | $17.88 | $19.01 | $18.54 | $14.24 | $12.26 |
| Total ReturnD,E,F | .59% | 4.71% | 9.64% | 41.10% | 21.67% | (1.75)% |
| Ratios to Average Net AssetsG,H | | | | | | |
| Expenses before reductions | .71%I | .70% | .72% | .76% | .89% | .97% |
| Expenses net of fee waivers, if any | .70%I | .70% | .72% | .75% | .89% | .97% |
| Expenses net of all reductions | .69%I | .69% | .71% | .75% | .88% | .96% |
| Net investment income (loss) | 1.11%I | .69% | .45% | .16% | .53% | .49% |
| Supplemental Data | | | | | | |
| Net assets, end of period (000 omitted) | $26,421 | $42,048 | $21,446 | $32,004 | $11,950 | $7,462 |
| Portfolio turnover rateJ | 52%I | 46% | 129% | 122% | 190% | 182% |
A Calculated based on average shares outstanding during the period.
B Total distributions of $1.20 per share is comprised of distributions from net investment income of $0.097 and distributions from net realized gain of $1.106 per share.
C Amount represents less than $.005 per share.
D Total returns for periods of less than one year are not annualized.
E Total returns do not reflect charges attributable to your insurance company's separate account. Inclusion of these charges would reduce the total returns shown.
F Total returns would have been lower if certain expenses had not been reduced during the applicable periods shown.
G Fees and expenses of any underlying Fidelity Central Funds are not included in the Fund's expense ratio. The Fund indirectly bears its proportionate share of the expenses of any underlying Fidelity Central Funds.
H Expense ratios reflect operating expenses of the class. Expenses before reductions do not reflect amounts reimbursed by the investment adviser or reductions from brokerage service arrangements or reductions from other expense offset arrangements and do not represent the amount paid by the class during periods when reimbursements or reductions occur. Expenses net of fee waivers reflect expenses after reimbursement by the investment adviser but prior to reductions from brokerage service arrangements or other expense offset arrangements. Expenses net of all reductions represent the net expenses paid by the class.
I Annualized
J Amount does not include the portfolio activity of any underlying Fidelity Central Funds.
See accompanying notes which are an integral part of the financial statements.
Financial Highlights — VIP Consumer Discretionary Portfolio Investor Class
| | Six months ended (Unaudited) June 30, | Years ended December 31, | | | | |
| | 2016 | 2015 | 2014 | 2013 | 2012 | 2011 |
| Selected Per–Share Data | | | | | | |
| Net asset value, beginning of period | $17.84 | $18.97 | $18.50 | $14.21 | $12.25 | $12.54 |
| Income from Investment Operations | | | | | | |
| Net investment income (loss)A | .09 | .11 | .07 | .01 | .06 | .05 |
| Net realized and unrealized gain (loss) | (.04) | .74 | 1.59 | 5.58 | 2.53 | (.28) |
| Total from investment operations | .05 | .85 | 1.66 | 5.59 | 2.59 | (.23) |
| Distributions from net investment income | – | (.08) | (.08) | (.01) | (.04) | (.07) |
| Distributions from net realized gain | (.30) | (1.91) | (1.11) | (1.30) | (.60) | – |
| Total distributions | (.30) | (1.99) | (1.19) | (1.31) | (.64) | (.07) |
| Redemption fees added to paid in capitalA | –B | .01 | –B | .01 | .01 | .01 |
| Net asset value, end of period | $17.59 | $17.84 | $18.97 | $18.50 | $14.21 | $12.25 |
| Total ReturnC,D,E | .48% | 4.66% | 9.58% | 41.05% | 21.45% | (1.76)% |
| Ratios to Average Net AssetsF,G | | | | | | |
| Expenses before reductions | .79%H | .78% | .80% | .83% | .96% | 1.04% |
| Expenses net of fee waivers, if any | .79%H | .77% | .79% | .83% | .96% | 1.04% |
| Expenses net of all reductions | .77%H | .77% | .78% | .83% | .94% | 1.03% |
| Net investment income (loss) | 1.03%H | .61% | .38% | .08% | .46% | .42% |
| Supplemental Data | | | | | | |
| Net assets, end of period (000 omitted) | $134,098 | $165,927 | $86,882 | $109,697 | $27,563 | $14,654 |
| Portfolio turnover rateI | 52%H | 46% | 129% | 122% | 190% | 182% |
A Calculated based on average shares outstanding during the period.
B Amount represents less than $.005 per share.
C Total returns for periods of less than one year are not annualized.
D Total returns do not reflect charges attributable to your insurance company's separate account. Inclusion of these charges would reduce the total returns shown.
E Total returns would have been lower if certain expenses had not been reduced during the applicable periods shown.
F Fees and expenses of any underlying Fidelity Central Funds are not included in the Fund's expense ratio. The Fund indirectly bears its proportionate share of the expenses of any underlying Fidelity Central Funds.
G Expense ratios reflect operating expenses of the class. Expenses before reductions do not reflect amounts reimbursed by the investment adviser or reductions from brokerage service arrangements or reductions from other expense offset arrangements and do not represent the amount paid by the class during periods when reimbursements or reductions occur. Expenses net of fee waivers reflect expenses after reimbursement by the investment adviser but prior to reductions from brokerage service arrangements or other expense offset arrangements. Expenses net of all reductions represent the net expenses paid by the class.
H Annualized
I Amount does not include the portfolio activity of any underlying Fidelity Central Funds.
See accompanying notes which are an integral part of the financial statements.
Notes to Financial Statements (Unaudited)
For the period ended June 30, 2016
1. Organization.
VIP Consumer Discretionary Portfolio (the Fund) is a non-diversified fund of Variable Insurance Products Fund IV (the Trust) and is authorized to issue an unlimited number of shares. The Trust is registered under the Investment Company Act of 1940, as amended (the 1940 Act), as an open-end management investment company organized as a Massachusetts business trust. Shares of the Fund may only be purchased by insurance companies for the purpose of funding variable annuity or variable life insurance contracts. The Fund offers the following classes of shares: Initial Class shares and Investor Class shares. All classes have equal rights and voting privileges, except for matters affecting a single class.
2. Investments in Fidelity Central Funds.
The Fund invests in Fidelity Central Funds, which are open-end investment companies generally available only to other investment companies and accounts managed by the investment adviser and its affiliates. The Fund's Schedule of Investments lists each of the Fidelity Central Funds held as of period end, if any, as an investment of the Fund, but does not include the underlying holdings of each Fidelity Central Fund. As an Investing Fund, the Fund indirectly bears its proportionate share of the expenses of the underlying Fidelity Central Funds.
The Money Market Central Funds seek preservation of capital and current income and are managed by Fidelity Investments Money Management, Inc. (FIMM), an affiliate of the investment adviser. Annualized expenses of the Money Market Central Funds as of their most recent shareholder report date are less than .005%.
A complete unaudited list of holdings for each Fidelity Central Fund is available upon request or at the Securities and Exchange Commission (the SEC) website at www.sec.gov. In addition, the financial statements of the Fidelity Central Funds are available on the SEC website or upon request.
3. Significant Accounting Policies.
The financial statements have been prepared in conformity with accounting principles generally accepted in the United States of America (GAAP), which require management to make certain estimates and assumptions at the date of the financial statements. Actual results could differ from those estimates. Subsequent events, if any, through the date that the financial statements were issued have been evaluated in the preparation of the financial statements. The following summarizes the significant accounting policies of the Fund:
Investment Valuation. Investments are valued as of 4:00 p.m. Eastern time on the last calendar day of the period. The Board of Trustees (the Board) has delegated the day to day responsibility for the valuation of the Fund's investments to the Fidelity SelectCo, LLC (SelectCo) Fair Value Committee (the Committee). In accordance with valuation policies and procedures approved by the Board, the Fund attempts to obtain prices from one or more third party pricing vendors or brokers to value its investments. When current market prices, quotations or currency exchange rates are not readily available or reliable, investments will be fair valued in good faith by the Committee, in accordance with procedures adopted by the Board. Factors used in determining fair value vary by investment type and may include market or investment specific events. The frequency with which these procedures are used cannot be predicted and they may be utilized to a significant extent. The Committee oversees the Fund's valuation policies and procedures and reports to the Board on the Committee's activities and fair value determinations. The Board monitors the appropriateness of the procedures used in valuing the Fund's investments and ratifies the fair value determinations of the Committee.
The Fund categorizes the inputs to valuation techniques used to value its investments into a disclosure hierarchy consisting of three levels as shown below:
- Level 1 – quoted prices in active markets for identical investments
- Level 2 – other significant observable inputs (including quoted prices for similar investments, interest rates, prepayment speeds, etc.)
- Level 3 – unobservable inputs (including the Fund's own assumptions based on the best information available)
Valuation techniques used to value the Fund's investments by major category are as follows:
Equity securities, including restricted securities, for which market quotations are readily available, are valued at the last reported sale price or official closing price as reported by a third party pricing vendor on the primary market or exchange on which they are traded and are categorized as Level 1 in the hierarchy. In the event there were no sales during the day or closing prices are not available, securities are valued at the last quoted bid price or may be valued using the last available price and are generally categorized as Level 2 in the hierarchy. For foreign equity securities, when market or security specific events arise, comparisons to the valuation of American Depositary Receipts (ADRs), futures contracts, Exchange-Traded Funds (ETFs) and certain indexes as well as quoted prices for similar securities may be used and would be categorized as Level 2 in the hierarchy. Utilizing these techniques may result in transfers between Level 1 and Level 2. For equity securities, including restricted securities, where observable inputs are limited, assumptions about market activity and risk are used and these securities may be categorized as Level 3 in the hierarchy.
Investments in open-end mutual funds, including the Fidelity Central Funds, are valued at their closing net asset value (NAV) each business day and are categorized as Level 1 in the hierarchy.
Changes in valuation techniques may result in transfers in or out of an assigned level within the disclosure hierarchy. The aggregate value of investments by input level as of June 30, 2016, including information on transfers between Levels 1 and 2, is included at the end of the Fund's Schedule of Investments.
Foreign Currency. The Fund may use foreign currency contracts to facilitate transactions in foreign-denominated securities. Gains and losses from these transactions may arise from changes in the value of the foreign currency or if the counterparties do not perform under the contracts' terms.
Foreign-denominated assets, including investment securities, and liabilities are translated into U.S. dollars at the exchange rates at period end. Purchases and sales of investment securities, income and dividends received and expenses denominated in foreign currencies are translated into U.S. dollars at the exchange rate in effect on the transaction date.
The effects of exchange rate fluctuations on investments are included with the net realized and unrealized gain (loss) on investment securities. Other foreign currency transactions resulting in realized and unrealized gain (loss) are disclosed separately.
Investment Transactions and Income. For financial reporting purposes, the Fund's investment holdings and NAV include trades executed through the end of the last business day of the period. The NAV per share for processing shareholder transactions is calculated as of the close of business of the New York Stock Exchange (NYSE), normally 4:00 p.m. Eastern time and includes trades executed through the end of the prior business day. Gains and losses on securities sold are determined on the basis of identified cost and may include proceeds received from litigation. Dividend income is recorded on the ex-dividend date, except for certain dividends from foreign securities where the ex-dividend date may have passed, which are recorded as soon as the Fund is informed of the ex-dividend date. Non-cash dividends included in dividend income, if any, are recorded at the fair market value of the securities received. Income and capital gain distributions from Fidelity Central Funds, if any, are recorded on the ex-dividend date. Distributions received on securities that represent a return of capital or capital gain are recorded as a reduction of cost of investments and/or as a realized gain. Subsequent to ex-dividend date the Fund determines the components of these distributions, based upon receipt of tax filings or other correspondence relating to the underlying investment. Investment income is recorded net of foreign taxes withheld where recovery of such taxes is uncertain.
Class Allocations and Expenses. Investment income, realized and unrealized capital gains and losses, common expenses of the Fund, and certain fund-level expense reductions, if any, are allocated daily on a pro-rata basis to each class based on the relative net assets of each class to the total net assets of the Fund. Each class differs with respect to transfer agent fees incurred. Certain expense reductions may also differ by class. For the reporting period, the allocated portion of income and expenses to each class as a percent of its average net assets may vary due to the timing of recording these transactions in relation to fluctuating net assets of the classes. Expenses directly attributable to a fund are charged to that fund. Expenses attributable to more than one fund are allocated among the respective funds on the basis of relative net assets or other appropriate methods. Expense estimates are accrued in the period to which they relate and adjustments are made when actual amounts are known.
Income Tax Information and Distributions to Shareholders. Each year, the Fund intends to qualify as a regulated investment company under Subchapter M of the Internal Revenue Code, including distributing substantially all of its taxable income and realized gains. As a result, no provision for U.S. Federal income taxes is required. The Fund files a U.S. federal tax return, in addition to state and local tax returns as required. The Fund's federal income tax returns are subject to examination by the Internal Revenue Service (IRS) for a period of three fiscal years after they are filed. State and local tax returns may be subject to examination for an additional fiscal year depending on the jurisdiction. Foreign taxes are provided for based on the Fund's understanding of the tax rules and rates that exist in the foreign markets in which it invests. The Fund is subject to a tax imposed on capital gains by certain countries in which it invests.
Distributions are declared and recorded on the ex-dividend date. Income dividends and capital gain distributions are declared separately for each class. Income and capital gain distributions are determined in accordance with income tax regulations, which may differ from GAAP.
Capital accounts within the financial statements are adjusted for permanent book-tax differences. These adjustments have no impact on net assets or the results of operations. Capital accounts are not adjusted for temporary book-tax differences which will reverse in a subsequent period.
Book-tax differences are primarily due to foreign currency transactions, certain foreign taxes, losses deferred due to wash sales and excise tax regulations.
The federal tax cost of investment securities and unrealized appreciation (depreciation) as of period end were as follows:
| Gross unrealized appreciation | $28,127,374 |
| Gross unrealized depreciation | (6,537,640) |
| Net unrealized appreciation (depreciation) on securities | $21,589,734 |
| Tax cost | $141,381,215 |
The Fund elected to defer to its next fiscal year approximately $805,036 of capital losses recognized during the period November 1, 2015 to December 31, 2015.
Trading (Redemption) Fees. Shares held by investors less than 60 days may be subject to a redemption fee equal to 1% of the NAV of shares redeemed. All redemption fees, which reduce the proceeds of the shareholder redemption, are retained by the Fund and accounted for as an addition to paid in capital.
4. Purchases and Sales of Investments.
Purchases and sales of securities, other than short-term securities, aggregated $45,211,993 and $83,808,856, respectively.
5. Fees and Other Transactions with Affiliates.
Management Fee. Fidelity SelectCo, LLC (the investment adviser) and its affiliates provide the Fund with investment management related services for which the Fund pays a monthly management fee. The management fee is the sum of an individual fund fee rate that is based on an annual rate of .30% of the Fund's average net assets and an annualized group fee rate that averaged .25% during the period. The group fee rate is based upon the average net assets of all the mutual funds advised by Fidelity Management & Research Company (FMR) and the investment adviser. The group fee rate decreases as assets under management increase and increases as assets under management decrease. For the reporting period, the total annualized management fee rate was .55% of the Fund's average net assets.
Transfer Agent Fees. Fidelity Investments Institutional Operations Company, Inc. (FIIOC), an affiliate of the investment adviser, is the Fund's transfer, dividend disbursing, and shareholder servicing agent. FIIOC receives an asset-based fee with respect to each class. Each class (with the exception of Investor Class) pays a fee for transfer agent services, typesetting and printing and mailing of shareholder reports, excluding mailing of proxy statements, equal to an annual rate of .07% (.15% for Investor Class) of class-level average net assets. For the period, transfer agent fees for each class were as follows:
| Initial Class | $10,358 |
| Investor Class | 106,037 |
| | $116,395 |
Accounting and Security Lending Fees. Fidelity Service Company, Inc. (FSC), an affiliate of the investment adviser, maintains the Fund's accounting records. The accounting fee is based on the level of average net assets for each month. Under a separate contract, FSC administers the security lending program. The security lending fee is based on the number and duration of lending transactions.
Brokerage Commissions. The Fund placed a portion of its portfolio transactions with brokerage firms which are affiliates of the investment adviser. Brokerage commissions are included in net realized gain (loss) and change in net unrealized appreciation (depreciation) in the Statement of Operations. The commissions paid to these affiliated firms were $1,266 for the period.
Interfund Trades. The Fund may purchase from or sell securities to other Fidelity Funds under procedures adopted by the Board. The procedures have been designed to ensure these interfund trades are executed in accordance with Rule 17a-7 of the 1940 Act. Interfund trades are included within the respective purchases and sales amounts shown in the Purchases and Sales of Investments note.
6. Committed Line of Credit.
The Fund participates with other funds managed by the investment adviser or an affiliate in a $4.25 billion credit facility (the "line of credit") to be utilized for temporary or emergency purposes to fund shareholder redemptions or for other short-term liquidity purposes. The Fund has agreed to pay commitment fees on its pro-rata portion of the line of credit, which amounted to $163 and is reflected in Miscellaneous expenses on the Statement of Operations. During the period, the Fund did not borrow on this line of credit.
7. Security Lending.
The Fund lends portfolio securities through a lending agent from time to time in order to earn additional income. On the settlement date of the loan, the Fund receives collateral (in the form of U.S. Treasury obligations, letters of credit and/or cash) against the loaned securities and maintains collateral in an amount not less than 100% of the market value of the loaned securities during the period of the loan. The market value of the loaned securities is determined at the close of business of the Fund and any additional required collateral is delivered to the Fund on the next business day. The Fund or borrower may terminate the loan at any time, and if the borrower defaults on its obligation to return the securities loaned because of insolvency or other reasons, the Fund may apply collateral received from the borrower against the obligation. The Fund may experience delays and costs in recovering the securities loaned. Any cash collateral received is invested in the Fidelity Securities Lending Cash Central Fund. The value of loaned securities and cash collateral at period end are disclosed on the Fund's Statement of Assets and Liabilities. Security lending income represents the income earned on investing cash collateral, less rebates paid to borrowers and any lending agent fees associated with the loan, plus any premium payments received for lending certain types of securities. Security lending income is presented in the Statement of Operations as a component of income from Fidelity Central Funds.
8. Expense Reductions.
Commissions paid to certain brokers with whom the investment adviser, or its affiliates, places trades on behalf of the Fund include an amount in addition to trade execution, which may be rebated back to the Fund to offset certain expenses. This amount totaled $9,684 for the period.
In addition, during the period the investment adviser reimbursed and/or waived a portion of fund-level operating expenses in the amount of $730.
9. Distributions to Shareholders.
Distributions to shareholders of each class were as follows:
| | Six months ended
June 30, 2016 | Year ended December 31, 2015 |
| From net investment income | | |
| Initial Class | $– | $201,826 |
| Investor Class | – | 686,311 |
| Total | $– | $888,137 |
| From net realized gain | | |
| Initial Class | $586,354 | $2,248,126 |
| Investor Class | 2,482,402 | 9,826,494 |
| Total | $3,068,756 | $12,074,620 |
10. Share Transactions.
Transactions for each class of shares were as follows:
| | Shares | Shares | Dollars | Dollars |
| | Six months ended
June 30, 2016 | Year ended December 31, 2015 | Six months ended
June 30, 2016 | Year ended December 31, 2015 |
| Initial Class | | | | |
| Shares sold | 63,171 | 1,350,232 | $1,090,654 | $24,894,236 |
| Reinvestment of distributions | 37,443 | 138,025 | 586,354 | 2,449,952 |
| Shares redeemed | (954,729) | (265,236) | (16,312,842) | (4,757,952) |
| Net increase (decrease) | (854,115) | 1,223,021 | $(14,635,834) | $22,586,236 |
| Investor Class | | | | |
| Shares sold | 362,888 | 4,742,177 | $6,236,424 | $86,676,987 |
| Reinvestment of distributions | 158,925 | 593,909 | 2,482,402 | 10,512,805 |
| Shares redeemed | (2,202,136) | (614,917) | (37,391,867) | (11,019,388) |
| Net increase (decrease) | (1,680,323) | 4,721,169 | $(28,673,041) | $86,170,404 |
11. Other.
The Fund's organizational documents provide former and current trustees and officers with a limited indemnification against liabilities arising in connection with the performance of their duties to the Fund. In the normal course of business, the Fund may also enter into contracts that provide general indemnifications. The Fund's maximum exposure under these arrangements is unknown as this would be dependent on future claims that may be made against the Fund. The risk of material loss from such claims is considered remote.
At the end of the period, the investment adviser or its affiliates were the owners of record of 100% of the total outstanding shares of the Fund.
Shareholder Expense Example
As a shareholder of the Fund, you incur two types of costs: (1) transaction costs, including redemption fees and (2) ongoing costs, including management fees and other Fund expenses. This Example is intended to help you understand your ongoing costs (in dollars) of investing in the Fund and to compare these costs with the ongoing costs of investing in other mutual funds.
The Example is based on an investment of $1,000 invested at the beginning of the period and held for the entire period (January 1, 2016 to June 30, 2016).
Actual Expenses
The first line of the accompanying table for each class of the Fund provides information about actual account values and actual expenses. You may use the information in this line, together with the amount you invested, to estimate the expenses that you paid over the period. Simply divide your account value by $1,000.00 (for example, an $8,600 account value divided by $1,000.00 = 8.6), then multiply the result by the number in the first line for a class of the Fund under the heading entitled "Expenses Paid During Period" to estimate the expenses you paid on your account during this period. The estimate of expenses does not include any fees or other expenses of any variable annuity or variable life insurance product. If they were, the estimate of expenses you paid during the period would be higher, and your ending account value would be lower. In addition, the Fund, as a shareholder in the underlying Fidelity Central Funds, will indirectly bear its pro-rata share of the fees and expenses incurred by the underlying Fidelity Central Funds. These fees and expenses are not included in the Fund's annualized expense ratio used to calculate the expense estimate in the table below.
Hypothetical Example for Comparison Purposes
The second line of the accompanying table for each class of the Fund provides information about hypothetical account values and hypothetical expenses based on a Class' actual expense ratio and an assumed rate of return of 5% per year before expenses, which is not the Class' actual return. The hypothetical account values and expenses may not be used to estimate the actual ending account balance or expenses you paid for the period. You may use this information to compare the ongoing costs of investing in the Fund and other funds. To do so, compare this 5% hypothetical example with the 5% hypothetical examples that appear in the shareholder reports of the other funds. The estimate of expenses does not include any fees or other expenses of any variable annuity or variable life insurance product. If they were, the estimate of expenses you paid during the period would be higher, and your ending account value would be lower. In addition, the Fund, as a shareholder in the underlying Fidelity Central Funds, will indirectly bear its pro-rata share of the fees and expenses incurred by the underlying Fidelity Central Funds. These fees and expenses are not included in the Fund's annualized expense ratio used to calculate the expense estimate in the table below.
Please note that the expenses shown in the table are meant to highlight your ongoing costs only and do not reflect any transaction costs. Therefore, the second line of the table is useful in comparing ongoing costs only, and will not help you determine the relative total costs of owning different funds. In addition, if these transactional costs were included, your costs would have been higher.
| | Annualized Expense Ratio-A | Beginning
Account Value
January 1, 2016 | Ending
Account Value
June 30, 2016 | Expenses Paid
During Period-B
January 1, 2016
to June 30, 2016 |
| Initial Class | .70% | | | |
| Actual | | $1,000.00 | $1,005.90 | $3.49 |
| Hypothetical-C | | $1,000.00 | $1,021.38 | $3.52 |
| Investor Class | .79% | | | |
| Actual | | $1,000.00 | $1,004.80 | $3.94 |
| Hypothetical-C | | $1,000.00 | $1,020.93 | $3.97 |
A Annualized expense ratio reflects expenses net of applicable fee waivers.
B Expenses are equal to each Class' annualized expense ratio, multiplied by the average account value over the period, multiplied by 182/366 (to reflect the one-half year period).
C 5% return per year before expenses
Board Approval of Investment Advisory Contracts and Management Fees
VIP Consumer Discretionary Portfolio
Each year, the Board of Trustees, including the Independent Trustees (together, the Board), votes on the renewal of the management contract with Fidelity SelectCo, LLC (SelectCo), an affiliate of Fidelity Management & Research Company (FMR), and the sub-advisory agreements with affiliates of FMR (together, the Advisory Contracts) for the fund. The Board, assisted by the advice of fund counsel and Independent Trustees' counsel, requests and considers a broad range of information relevant to the renewal of the Advisory Contracts throughout the year.
The Board meets regularly and, at each of its meetings, covers an extensive agenda of topics and materials and considers factors that are relevant to its annual consideration of the renewal of the fund's Advisory Contracts, including the services and support provided to the fund and its shareholders. The Board has established four standing committees (Committees) — Operations, Audit, Fair Valuation, and Governance and Nominating — each composed of and chaired by Independent Trustees with varying backgrounds, to which the Board has assigned specific subject matter responsibilities in order to enhance effective decision-making by the Board. The Operations Committee, of which all of the Independent Trustees are members, meets regularly throughout the year and considers, among other matters, information specifically related to the annual consideration of the renewal of the fund's Advisory Contracts. The Board, acting directly and through its Committees, requests and receives information concerning the annual consideration of the renewal of the fund's Advisory Contracts. The Board also meets as needed to consider matters specifically related to the Board's annual consideration of the renewal of the Advisory Contracts. Members of the Board may also meet with trustees of other Fidelity funds through ad hoc joint committees to discuss certain matters relevant to all of the Fidelity funds.
At its January 2016 meeting, the Board unanimously determined to renew the fund's Advisory Contracts. In reaching its determination, the Board considered all factors it believed relevant, including (i) the nature, extent, and quality of the services to be provided to the fund and its shareholders (including the investment performance of the fund); (ii) the competitiveness of the fund's management fee and total expense ratio relative to peer funds; (iii) the total costs of the services to be provided by and the profits to be realized by Fidelity from its relationships with the fund; and (iv) the extent to which, if any, economies of scale exist and would be realized as the fund grows, and whether any economies of scale are appropriately shared with fund shareholders.
In considering whether to renew the Advisory Contracts for the fund, the Board reached a determination, with the assistance of fund counsel and Independent Trustees' counsel and through the exercise of its business judgment, that the renewal of the Advisory Contracts was in the best interests of the fund and its shareholders and that the compensation payable under the Advisory Contracts was fair and reasonable. The Board's decision to renew the Advisory Contracts was not based on any single factor, but rather was based on a comprehensive consideration of all the information provided to the Board at its meetings throughout the year. The Board, in reaching its determination to renew the Advisory Contracts, was aware that shareholders of the fund have a broad range of investment choices available to them, including a wide choice among funds offered by Fidelity's competitors, and that the fund's shareholders, who have the opportunity to review and weigh the disclosure provided by the fund in its prospectus and other public disclosures, have chosen to invest in this fund, which is part of the Fidelity family of funds.
Nature, Extent, and Quality of Services Provided. The Board considered the staffing of SelectCo and the sub-advisers (together with SelectCo, the Investment Advisers) as it relates to the fund, including the backgrounds of investment personnel of SelectCo, and also considered the fund's investment objective, strategies, and related investment philosophy. The Independent Trustees also had discussions with senior management of Fidelity's investment operations and investment groups. The Board considered the structure of the investment personnel compensation program and whether this structure provides appropriate incentives to act in the best interests of the fund. Additionally, the Board considered the portfolio managers' investments, if any, in the funds that they manage.
Resources Dedicated to Investment Management and Support Services. The Board reviewed the general qualifications and capabilities of the investment staff of the Investment Advisers, including their size, education, experience, and resources, as well as Fidelity's approach to recruiting, training, managing, and compensating investment personnel. The Board noted that Fidelity has continued to increase the resources devoted to non-U.S. offices, including expansion of Fidelity's global investment organization. The Board also noted that Fidelity's analysts have extensive resources, tools and capabilities that allow them to conduct sophisticated quantitative and fundamental analysis, as well as credit analysis of issuers, counterparties and guarantors. Further, the Board considered that Fidelity's investment professionals have sufficient access to global information and data so as to provide competitive investment results over time, and that those professionals also have access to sophisticated tools that permit them to assess portfolio construction and risk and performance attribution characteristics continuously, as well as to transmit new information and research conclusions rapidly around the world. Additionally, in its deliberations, the Board considered Fidelity's trading, risk management, compliance, and technology and operations capabilities and resources, which are integral parts of the investment management process.
Shareholder and Administrative Services. The Board considered (i) the nature, extent, quality, and cost of advisory, administrative, and shareholder services performed by the Investment Advisers and their affiliates under the Advisory Contracts and under separate agreements covering transfer agency, pricing and bookkeeping, and securities lending services for the fund; (ii) the nature and extent of the supervision of third party service providers, principally custodians, subcustodians, and pricing vendors; and (iii) the resources devoted to, and the record of compliance with, the fund's compliance policies and procedures. The Board also reviewed the allocation of fund brokerage, including allocations to brokers affiliated with the Investment Advisers, the use of brokerage commissions to pay fund expenses, and the use of "soft" commission dollars to pay for research services.
The Board noted that the growth of fund assets over time across the complex allows Fidelity to reinvest in the development of services designed to enhance the value or convenience of the Fidelity funds as investment vehicles. These services include 24-hour access to account information and market information through telephone representatives and over the Internet, investor education materials and asset allocation tools, and the expanded availability of Fidelity Investor Centers.
The Board noted that in 2014 the ad hoc Committee on Transfer Agency Fees was formed by it and the boards of certain other Fidelity funds to review the variety of transfer agency services and fee structures throughout the mutual fund industry compared to Fidelity's.
Investment in a Large Fund Family. The Board considered the benefits to shareholders of investing in a Fidelity fund, including the benefits of investing in a fund that is part of a large family of funds offering a variety of investment disciplines and providing a large variety of mutual fund investor services. The Board noted that Fidelity had taken, or had made recommendations that resulted in the Fidelity funds taking, a number of actions over the previous year that benefited particular funds, including (i) continuing to dedicate additional resources to investment research and to the support of the senior management team that oversees asset management; (ii) continuing efforts to enhance Fidelity's global research capabilities; (iii) launching new funds and making other enhancements to meet client needs; (iv) reducing management fees and total expenses for certain index funds; (v) continuing to launch dedicated lower cost underlying funds to meet portfolio construction needs related to expanding underlying fund options for Fidelity funds of funds, specifically for the Freedom Fund product lines; (vi) rationalizing product lines and gaining increased efficiencies through fund mergers; (vii) continuing to develop, acquire and implement systems and technology to improve services to the funds and shareholders, strengthen information security, and increase efficiency; (viii) implementing investment enhancements to further strengthen Fidelity's target date product line to increase investors' probability of success in achieving their goals; (ix) modifying the eligibility criteria for certain share classes to accommodate roll-over assets from employer-sponsored retirement plans; (x) launching a new Class W of the Freedom Index Funds to attract and retain Fidelity record-kept retirement plan assets; and (xi) implementing changes to Fidelity's money market fund product line in response to recent regulatory reforms.
Investment Performance. The Board considered whether the fund has operated in accordance with its investment objective, as well as its record of compliance with its investment restrictions and its performance history.
The Board took into account discussions with representatives of the Investment Advisers about fund investment performance that occur at Board meetings throughout the year. In this regard the Board noted that as part of regularly scheduled fund reviews and other reports to the Board on fund performance, the Board considers annualized return information for the fund, for different time periods, measured against a securities market index ("benchmark index"). In its evaluation of fund investment performance at meetings throughout the year, the Board gave particular attention to information indicating underperformance of certain Fidelity funds for specific time periods and discussed with the Investment Advisers the reasons for such underperformance. The fund underperformed its benchmark for the one-, three-, and five-year periods ended June 30, 2015, and as a result, the Board will continue to discuss with SelectCo the steps it is taking to address the fund's performance.
In addition to reviewing absolute and relative fund performance, the Independent Trustees periodically consider the appropriateness of fund performance metrics in evaluating the results achieved. In general, the Independent Trustees believe that fund performance should be evaluated based on net performance (after fees and expenses) of both the highest performing and lowest performing fund share classes, where applicable, compared to appropriate benchmark indices, over appropriate time periods that may include full market cycles, taking into account relevant factors, including the following: general market conditions; issuer-specific information; and fund cash flows and other factors. Depending on the circumstances, the Independent Trustees may be satisfied with a fund's performance notwithstanding that it lags its benchmark index for certain periods.
The Independent Trustees recognize that shareholders evaluate performance on a net basis over their own holding periods, for which one-, three-, and five-year periods are often used as a proxy. For this reason, the performance information reviewed by the Board also included net cumulative total return information for the fund and an appropriate benchmark index for the most recent one-, three-, and five-year periods ended June 30, 2015.
Based on its review, the Board concluded that the nature, extent, and quality of services provided to the fund under the Advisory Contracts should benefit the shareholders of the fund.
Competitiveness of Management Fee and Total Expense Ratio. The Board considered the fund's management fee and total expense ratio compared to "mapped groups" of competitive funds and classes created for the purpose of facilitating the Trustees' analysis of the competitiveness of management fees and total expenses. Fidelity creates "mapped groups" by combining similar Lipper investment objective categories that have comparable investment mandates. For this purpose, all sector focused equity funds are grouped in the same mapped group. Combining Lipper investment objective categories aids the Board's management fee and total expense ratio comparisons by broadening the competitive group used for comparison.
Management Fee. The Board considered two proprietary management fee comparisons for the 12-month periods ended June 30 shown in basis points (BP) in the chart below. The group of Lipper funds used by the Board for management fee comparisons is referred to below as the "Total Mapped Group." The Total Mapped Group comparison focuses on a fund's standing in terms of gross management fees before expense reimbursements or caps relative to the total universe of funds with comparable investment mandates (
i.e., sector equities), regardless of whether their management fee structures also are comparable. Funds with comparable management fee structures have similar management fee contractual arrangements (
e.g., flat rate charged for advisory services, all-inclusive fee rate,
etc.). "TMG %" represents the percentage of funds in the Total Mapped Group that had management fees that were lower than the fund's. For example, a hypothetical TMG % of 20% would mean that 80% of the funds in the Total Mapped Group had higher, and 20% had lower, management fees than the fund. The fund's actual TMG %s and the number of funds in the Total Mapped Group are in the chart below. The "Asset-Size Peer Group" (ASPG) comparison focuses on a fund's standing relative to a subset of non-Fidelity funds within the Total Mapped Group that are similar in size and management fee structure. For example, if a fund is in the first quartile of the ASPG, the fund's management fee ranks in the least expensive or lowest 25% of funds in the ASPG. The ASPG represents at least 15% of the funds in the Total Mapped Group with comparable asset size and management fee structures, subject to a minimum of 50 funds (or all funds in the Total Mapped Group if fewer than 50). Additional information, such as the ASPG quartile in which the fund's management fee rate ranked, is also included in the chart and considered by the Board.
VIP Consumer Discretionary Portfolio

The Board noted that the fund's management fee rate ranked below the median of its Total Mapped Group and below the median of its ASPG for the 12-month period ended June 30, 2015.
The Board noted that, in 2014, the ad hoc Committee on Group Fee was formed by it and the boards of other Fidelity funds to conduct an in-depth review of the "group fee" component of the management fee of funds with such management fee structures. Committee focus included the mechanics of the group fee, the competitive landscape of group fee structures, Fidelity funds with no group fee component and investment products not included in group fee assets. The Board also considered that, for funds subject to the group fee, FMR agreed to voluntarily waive fees over a specified period of time in amounts designed to account for assets converted from certain funds to certain collective investment trusts.
Based on its review, the Board concluded that the fund's management fee is fair and reasonable in light of the services that the fund receives and the other factors considered.
Total Expense Ratio. In its review of each class's total expense ratio, the Board considered the fund's management fee rate as well as other fund or class expenses, as applicable, such as transfer agent fees, pricing and bookkeeping fees, and custodial, legal, and audit fees. The Board also noted that Fidelity may agree to waive fees and expenses from time to time, and the extent to which, if any, it has done so for the fund. As part of its review, the Board also considered the current and historical total expense ratios of each class of the fund compared to competitive fund median expenses. Each class of the fund is compared to those funds and classes in the Total Mapped Group (used by the Board for management fee comparisons) that have a similar sales load structure.
The Board noted that the total expense ratio of each class ranked below the competitive median for the 12-month period ended June 30, 2015.
Fees Charged to Other Fidelity Clients. The Board also considered Fidelity fee structures and other information with respect to clients of Fidelity, such as other funds advised or subadvised by Fidelity, pension plan clients, and other institutional clients with similar mandates. The Board noted the findings of the 2013 ad hoc joint committee (created with the boards of other Fidelity funds), which reviewed and compared Fidelity's institutional investment advisory business with its business of providing services to the Fidelity funds, including the differences in services provided, fees charged, and costs incurred, as well as competition in their respective marketplaces.
Based on its review of total expense ratios and fees charged to other Fidelity clients, the Board concluded that the total expense ratio of each class of the fund was reasonable in light of the services that the fund and its shareholders receive and the other factors considered.
Costs of the Services and Profitability. The Board considered the revenues earned and the expenses incurred by Fidelity in conducting the business of developing, marketing, distributing, managing, administering and servicing the fund and servicing the fund's shareholders. The Board also considered the level of Fidelity's profits in respect of all the Fidelity funds.
On an annual basis, Fidelity presents to the Board information about the profitability of its relationship with the fund. Fidelity calculates profitability information for each fund, as well as aggregate profitability information for groups of Fidelity funds and all Fidelity funds, using a series of detailed revenue and cost allocation methodologies which originate with the books and records of Fidelity on which Fidelity's audited financial statements are based. The Audit Committee of the Board reviews any significant changes from the prior year's methodologies.
PricewaterhouseCoopers LLP (PwC), independent registered public accounting firm and auditor to Fidelity and certain Fidelity funds, has been engaged annually by the Board as part of the Board's assessment of the profitability analysis used by Fidelity. PwC's engagement includes the review and assessment of Fidelity's methodologies used in determining the revenues and expenses attributable to Fidelity's mutual fund business, and completion of agreed-upon procedures in respect of the mathematical accuracy of fund profitability and its conformity to established allocation methodologies. After considering PwC's reports issued under the engagement and information provided by Fidelity, the Board concluded that while other allocation methods may also be reasonable, Fidelity's profitability methodologies are reasonable in all material respects.
The Board also reviewed Fidelity's non-fund businesses and fall-out benefits related to the mutual fund business as well as cases where Fidelity's affiliates may benefit from or be related to the fund's business.
The Board considered the costs of the services provided by and the profits realized by Fidelity in connection with the operation of the fund and was satisfied that the profitability was not excessive.
Economies of Scale. The Board considered whether there have been economies of scale in respect of the management of the Fidelity funds, whether the Fidelity funds (including the fund) have appropriately benefited from any such economies of scale, and whether there is potential for realization of any further economies of scale. The Board considered the extent to which the fund will benefit from economies of scale as assets grow through increased services to the fund, through waivers or reimbursements, or through fee or expense ratio reductions. The Board also noted that in 2013, it and the boards of other Fidelity funds created an ad hoc committee (the Economies of Scale Committee) to analyze whether Fidelity attains economies of scale in respect of the management and servicing of the Fidelity funds, whether the Fidelity funds have appropriately benefited from such economies of scale, and whether there is potential for realization of any further economies of scale.
The Board recognized that the fund's management contract incorporates a "group fee" structure, which provides for lower group fee rates as total group assets increase, and for higher group fee rates as total group assets decrease (with "group assets" defined to include fund assets under SelectCo's management plus assets under FMR's management). SelectCo calculates the group fee rates based on a tiered asset "breakpoint" schedule that varies based on asset class. The Board considered that the group fee is designed to deliver the benefits of economies of scale to fund shareholders when total group assets increase, even if assets of any particular fund are unchanged or have declined, because some portion of Fidelity's costs are attributable to services provided to all Fidelity funds, and all funds benefit if those costs can be allocated among more assets. The Board concluded that, given the group fee structure, fund shareholders will benefit from lower management fees as group assets increase at the fund complex level, regardless of whether Fidelity achieves any such economies of scale.
The Board concluded, taking into account the analysis of the Economies of Scale Committee, that economies of scale, if any, are being appropriately shared between fund shareholders and Fidelity.
Additional Information Requested by the Board. In order to develop fully the factual basis for consideration of the Fidelity funds' Advisory Contracts, the Board requested and received additional information on certain topics, including: (i) Fidelity's fund profitability methodology, profitability trends for certain funds, and the impact of certain factors on fund profitability results; (ii) portfolio manager changes that have occurred during the past year and the amount of the investment that each portfolio manager has made in the Fidelity fund(s) that he or she manages; (iii) Fidelity's compensation structure for portfolio managers, research analysts, and other key personnel, including its effects on fund profitability; (iv) the arrangements with and compensation paid to certain fund sub-advisers on behalf of the Fidelity funds; (v) Fidelity's long-term expectations for its offerings in the workplace investing channel; (vi) the methodology with respect to competitive fund data and peer group classifications; (vii) Fidelity's transfer agent fee, expense, and service structures for different funds and classes, and the impact of outsourcing, the increased use of omnibus accounts, and lower pricing in the retirement channel; and (viii) explanations regarding the relative total expense ratios of certain funds and classes, total expense competitive trends and methodologies for total expense competitive comparisons, and actions that might be taken by Fidelity to reduce total expense ratios for certain funds and classes or to achieve further economies of scale.
Based on its evaluation of all of the conclusions noted above, and after considering all factors it believed relevant, the Board concluded that the advisory fee structures are fair and reasonable, and that the fund's Advisory Contracts should be renewed.

VCONIC-SANN-0816
1.817358.111
Fidelity® Variable Insurance Products: Consumer Staples Portfolio
Semi-Annual Report June 30, 2016 |
|
Contents
To view a fund's proxy voting guidelines and proxy voting record for the 12-month period ended June 30, visit http://www.fidelity.com/proxyvotingresults or visit the Securities and Exchange Commission's (SEC) web site at http://www.sec.gov.
You may also call 1-877-208-0098 to request a free copy of the proxy voting guidelines.
Fidelity® Variable Insurance Products are separate account options which are purchased through a variable insurance contract.
Standard & Poor's, S&P and S&P 500 are registered service marks of The McGraw-Hill Companies, Inc. and have been licensed for use by Fidelity Distributors Corporation.
Other third-party marks appearing herein are the property of their respective owners.
All other marks appearing herein are registered or unregistered trademarks or service marks of FMR LLC or an affiliated company. © 2016 FMR LLC. All rights reserved.
This report and the financial statements contained herein are submitted for the general information of the shareholders of the Fund. This report is not authorized for distribution to prospective investors in the Fund unless preceded or accompanied by an effective prospectus.
A fund files its complete schedule of portfolio holdings with the SEC for the first and third quarters of each fiscal year on Form N-Q. Forms N-Q are available on the SEC’s web site at http://www.sec.gov. A fund's Forms N-Q may be reviewed and copied at the SEC’s Public Reference Room in Washington, DC. Information regarding the operation of the SEC's Public Reference Room may be obtained by calling 1-800-SEC-0330.
For a complete list of a fund's portfolio holdings, view the most recent holdings listing, semiannual report, or annual report on Fidelity's web site at http://www.fidelity.com, http://www.institutional.fidelity.com, or http://www.401k.com, as applicable.
NOT FDIC INSURED •MAY LOSE VALUE •NO BANK GUARANTEE
Neither the Fund nor Fidelity Distributors Corporation is a bank.
Investment Summary (Unaudited)
Top Ten Stocks as of June 30, 2016
| | % of fund's net assets | % of fund's net assets 6 months ago |
| Procter & Gamble Co. | 10.8 | 11.5 |
| The Coca-Cola Co. | 10.4 | 11.2 |
| Philip Morris International, Inc. | 7.5 | 1.9 |
| CVS Health Corp. | 4.9 | 6.5 |
| Monster Beverage Corp. | 4.0 | 3.2 |
| Walgreens Boots Alliance, Inc. | 3.8 | 4.2 |
| Mead Johnson Nutrition Co. Class A | 3.8 | 4.3 |
| Mondelez International, Inc. | 2.9 | 3.4 |
| Altria Group, Inc. | 2.9 | 4.0 |
| PepsiCo, Inc. | 2.8 | 2.3 |
| | 53.8 | |
Top Industries (% of fund's net assets)
| As of June 30, 2016 |
| | Beverages | 24.4% |
| | Food Products | 16.6% |
| | Household Products | 16.5% |
| | Tobacco | 15.7% |
| | Food & Staples Retailing | 14.6% |
| | All Others* | 12.2% |

* Includes Short-Term Investments and Net Other Assets (Liabilities)
| As of December 31, 2015 |
| | Beverages | 23.5% |
| | Food Products | 20.6% |
| | Food & Staples Retailing | 17.5% |
| | Household Products | 16.4% |
| | Tobacco | 11.3% |
| | All Others* | 10.7% |

* Includes Short-Term Investments and Net Other Assets (Liabilities)
Investments June 30, 2016 (Unaudited)
Showing Percentage of Net Assets
| Common Stocks - 99.0% | | | |
| | | Shares | Value |
| Beverages - 24.4% | | | |
| Brewers - 1.5% | | | |
| Anheuser-Busch InBev SA NV | | 8,036 | $1,062,652 |
| Carlsberg A/S Series B | | 8,000 | 763,264 |
| China Resources Beer Holdings Co. Ltd. | | 14,000 | 30,600 |
| Molson Coors Brewing Co. Class B | | 37,400 | 3,782,262 |
| | | | 5,638,778 |
| Distillers & Vintners - 1.6% | | | |
| Constellation Brands, Inc. Class A (sub. vtg.) | | 33,100 | 5,474,740 |
| Kweichow Moutai Co. Ltd. | | 9,950 | 437,508 |
| | | | 5,912,248 |
| Soft Drinks - 21.3% | | | |
| Britvic PLC | | 48,500 | 379,524 |
| Coca-Cola Bottling Co. Consolidated | | 38,930 | 5,741,007 |
| Coca-Cola Central Japan Co. Ltd. | | 86,800 | 1,661,314 |
| Coca-Cola European Partners PLC | | 141,300 | 5,042,997 |
| Coca-Cola HBC AG | | 85,540 | 1,730,859 |
| Fomento Economico Mexicano S.A.B. de CV sponsored ADR | | 3,285 | 303,830 |
| Monster Beverage Corp. | | 90,700 | 14,576,397 |
| PepsiCo, Inc. | | 98,506 | 10,435,726 |
| The Coca-Cola Co. | | 839,938 | 38,074,390 |
| | | | 77,946,044 |
|
| TOTAL BEVERAGES | | | 89,497,070 |
|
| Biotechnology - 0.2% | | | |
| Biotechnology - 0.2% | | | |
| Enzymotec Ltd. (a) | | 84,900 | 709,764 |
| Chemicals - 0.7% | | | |
| Fertilizers & Agricultural Chemicals - 0.7% | | | |
| Monsanto Co. | | 6,100 | 630,801 |
| Syngenta AG (Switzerland) | | 5,439 | 2,087,752 |
| | | | 2,718,553 |
| Diversified Financial Services - 0.1% | | | |
| Other Diversified Financial Services - 0.1% | | | |
| Scandinavian Tobacco Group A/S | | 20,027 | 328,239 |
| Food & Staples Retailing - 14.6% | | | |
| Drug Retail - 8.7% | | | |
| CVS Health Corp. | | 186,839 | 17,887,966 |
| Walgreens Boots Alliance, Inc. | | 167,500 | 13,947,725 |
| | | | 31,835,691 |
| Food Distributors - 0.6% | | | |
| Sysco Corp. | | 27,400 | 1,390,276 |
| United Natural Foods, Inc. (a) | | 19,000 | 889,200 |
| | | | 2,279,476 |
| Food Retail - 1.5% | | | |
| Kroger Co. | | 88,752 | 3,265,186 |
| Natural Grocers by Vitamin Cottage, Inc. (a) | | 12,700 | 165,735 |
| Sprouts Farmers Market LLC (a) | | 79,900 | 1,829,710 |
| Whole Foods Market, Inc. | | 3,600 | 115,272 |
| | | | 5,375,903 |
| Hypermarkets & Super Centers - 3.8% | | | |
| Costco Wholesale Corp. | | 65,400 | 10,270,416 |
| Wal-Mart Stores, Inc. | | 51,704 | 3,775,426 |
| | | | 14,045,842 |
|
| TOTAL FOOD & STAPLES RETAILING | | | 53,536,912 |
|
| Food Products - 16.6% | | | |
| Packaged Foods & Meats - 16.6% | | | |
| Blue Buffalo Pet Products, Inc. (a)(b) | | 175,900 | 4,105,506 |
| ConAgra Foods, Inc. | | 64,900 | 3,102,869 |
| Danone SA | | 13,550 | 948,265 |
| Greencore Group PLC | | 83,800 | 344,867 |
| JBS SA | | 717,700 | 2,234,225 |
| Mead Johnson Nutrition Co. Class A | | 150,800 | 13,685,100 |
| Mondelez International, Inc. | | 234,100 | 10,653,891 |
| Post Holdings, Inc. (a) | | 19,300 | 1,595,917 |
| The Hain Celestial Group, Inc. (a) | | 127,380 | 6,337,155 |
| The Hershey Co. | | 29,100 | 3,302,559 |
| The J.M. Smucker Co. | | 29,700 | 4,526,577 |
| The Kraft Heinz Co. | | 65,800 | 5,821,984 |
| TreeHouse Foods, Inc. (a) | | 39,200 | 4,023,880 |
| | | | 60,682,795 |
| Health Care Providers & Services - 0.2% | | | |
| Health Care Services - 0.2% | | | |
| Diplomat Pharmacy, Inc. (a)(b) | | 19,300 | 675,500 |
| Household Durables - 1.0% | | | |
| Housewares & Specialties - 1.0% | | | |
| Newell Brands, Inc. | | 73,172 | 3,553,964 |
| Household Products - 16.0% | | | |
| Household Products - 16.0% | | | |
| Colgate-Palmolive Co. | | 57,290 | 4,193,628 |
| Procter & Gamble Co. | | 469,636 | 39,764,081 |
| Spectrum Brands Holdings, Inc. | | 81,800 | 9,759,558 |
| Svenska Cellulosa AB (SCA) (B Shares) | | 159,300 | 5,118,415 |
| | | | 58,835,682 |
| Personal Products - 9.2% | | | |
| Personal Products - 9.2% | | | |
| Asaleo Care Ltd. | | 21,521 | 34,051 |
| Avon Products, Inc. | | 2,068,300 | 7,818,174 |
| Coty, Inc. Class A (b) | | 294,600 | 7,656,654 |
| Estee Lauder Companies, Inc. Class A | | 65,200 | 5,934,504 |
| Herbalife Ltd. (a) | | 83,900 | 4,910,667 |
| Nu Skin Enterprises, Inc. Class A (b) | | 101,388 | 4,683,112 |
| Ontex Group NV | | 32,700 | 1,030,995 |
| Unilever NV (Certificaten Van Aandelen) (Bearer) | | 35,217 | 1,644,725 |
| | | | 33,712,882 |
| Specialty Retail - 0.3% | | | |
| Specialty Stores - 0.3% | | | |
| GNC Holdings, Inc. | | 42,100 | 1,022,609 |
| Tobacco - 15.7% | | | |
| Tobacco - 15.7% | | | |
| Altria Group, Inc. | | 153,896 | 10,612,668 |
| British American Tobacco PLC sponsored ADR | | 59,059 | 7,646,959 |
| Imperial Tobacco Group PLC | | 19,368 | 1,050,380 |
| Japan Tobacco, Inc. | | 23,000 | 926,951 |
| Philip Morris International, Inc. | | 269,634 | 27,427,170 |
| Reynolds American, Inc. | | 182,600 | 9,847,618 |
| | | | 57,511,746 |
| TOTAL COMMON STOCKS | | | |
| (Cost $299,741,337) | | | 362,785,716 |
|
| Preferred Stocks - 0.9% | | | |
| Convertible Preferred Stocks - 0.4% | | | |
| Internet & Catalog Retail - 0.4% | | | |
| Internet Retail - 0.4% | | | |
| The Honest Co., Inc. Series D (c) | | 32,783 | 1,283,936 |
| Nonconvertible Preferred Stocks - 0.5% | | | |
| Household Products - 0.5% | | | |
| Household Products - 0.5% | | | |
| Henkel AG & Co. KGaA | | 15,600 | 1,906,485 |
| TOTAL PREFERRED STOCKS | | | |
| (Cost $3,309,400) | | | 3,190,421 |
|
| Money Market Funds - 3.9% | | | |
| Fidelity Cash Central Fund, 0.43% (d) | | 1,645,551 | 1,645,551 |
| Fidelity Securities Lending Cash Central Fund, 0.46% (d)(e) | | 12,659,450 | 12,659,450 |
| TOTAL MONEY MARKET FUNDS | | | |
| (Cost $14,305,001) | | | 14,305,001 |
| TOTAL INVESTMENT PORTFOLIO - 103.8% | | | |
| (Cost $317,355,738) | | | 380,281,138 |
| NET OTHER ASSETS (LIABILITIES) - (3.8)% | | | (14,062,003) |
| NET ASSETS - 100% | | | $366,219,135 |
Legend
(a) Non-income producing
(b) Security or a portion of the security is on loan at period end.
(c) Restricted securities - Investment in securities not registered under the Securities Act of 1933 (excluding 144A issues). At the end of the period, the value of restricted securities (excluding 144A issues) amounted to $1,283,936 or 0.4% of net assets.
(d) Affiliated fund that is generally available only to investment companies and other accounts managed by Fidelity Investments. The rate quoted is the annualized seven-day yield of the fund at period end. A complete unaudited listing of the fund's holdings as of its most recent quarter end is available upon request. In addition, each Fidelity Central Fund's financial statements are available on the SEC's website or upon request.
(e) Investment made with cash collateral received from securities on loan.
Additional information on each restricted holding is as follows:
| Security | Acquisition Date | Acquisition Cost |
| The Honest Co., Inc. Series D | 8/3/15 | $1,499,986 |
Affiliated Central Funds
Information regarding fiscal year to date income earned by the Fund from investments in Fidelity Central Funds is as follows:
| Fund | Income earned |
| Fidelity Cash Central Fund | $8,261 |
| Fidelity Securities Lending Cash Central Fund | 188,810 |
| Total | $197,071 |
Investment Valuation
The following is a summary of the inputs used, as of June 30, 2016, involving the Fund's assets and liabilities carried at fair value. The inputs or methodology used for valuing securities may not be an indication of the risk associated with investing in those securities. For more information on valuation inputs, and their aggregation into the levels used below, please refer to the Investment Valuation section in the accompanying Notes to Financial Statements.
| | Valuation Inputs at Reporting Date: |
| Description | Total | Level 1 | Level 2 | Level 3 |
| Investments in Securities: | | | | |
| Common Stocks | $362,785,716 | $343,205,355 | $19,580,361 | $-- |
| Preferred Stocks | 3,190,421 | -- | 1,906,485 | 1,283,936 |
| Money Market Funds | 14,305,001 | 14,305,001 | -- | -- |
| Total Investments in Securities: | $380,281,138 | $357,510,356 | $21,486,846 | $1,283,936 |
The following is a summary of transfers between Level 1 and Level 2 for the period ended June 30, 2016. Transfers are assumed to have occurred at the beginning of the period, and are primarily attributable to the valuation techniques used for foreign equity securities, as discussed in the accompanying Notes to Financial Statements:
| Transfers | Total |
| Level 1 to Level 2 | $4,862,510 |
| Level 2 to Level 1 | $0 |
Other Information
Distribution of investments by country or territory of incorporation, as a percentage of Total Net Assets, is as follows (Unaudited):
| United States of America | 88.5% |
| United Kingdom | 3.9% |
| Sweden | 1.4% |
| Cayman Islands | 1.3% |
| Switzerland | 1.0% |
| Others (Individually Less Than 1%) | 3.9% |
| | 100.0% |
See accompanying notes which are an integral part of the financial statements.
Financial Statements
Statement of Assets and Liabilities
| | | June 30, 2016 (Unaudited) |
| Assets | | |
Investment in securities, at value (including securities loaned of $12,636,415) — See accompanying schedule:
Unaffiliated issuers (cost $303,050,737) | $365,976,137 | |
| Fidelity Central Funds (cost $14,305,001) | 14,305,001 | |
| Total Investments (cost $317,355,738) | | $380,281,138 |
| Foreign currency held at value (cost $6,059) | | 6,059 |
| Receivable for investments sold | | 2,935,543 |
| Receivable for fund shares sold | | 938,590 |
| Dividends receivable | | 962,518 |
| Distributions receivable from Fidelity Central Funds | | 40,631 |
| Prepaid expenses | | 138 |
| Other receivables | | 1,439 |
| Total assets | | 385,166,056 |
| Liabilities | | |
| Payable for investments purchased | $6,041,119 | |
| Payable for fund shares redeemed | 12,244 | |
| Accrued management fee | 160,809 | |
| Other affiliated payables | 51,390 | |
| Other payables and accrued expenses | 21,909 | |
| Collateral on securities loaned, at value | 12,659,450 | |
| Total liabilities | | 18,946,921 |
| Net Assets | | $366,219,135 |
| Net Assets consist of: | | |
| Paid in capital | | $296,500,453 |
| Undistributed net investment income | | 2,965,459 |
| Accumulated undistributed net realized gain (loss) on investments and foreign currency transactions | | 3,833,676 |
| Net unrealized appreciation (depreciation) on investments and assets and liabilities in foreign currencies | | 62,919,547 |
| Net Assets | | $366,219,135 |
| Initial Class: | | |
| Net Asset Value, offering price and redemption price per share ($50,609,950 ÷ 2,632,098 shares) | | $19.23 |
| Investor Class: | | |
| Net Asset Value, offering price and redemption price per share ($315,609,185 ÷ 16,477,248 shares) | | $19.15 |
See accompanying notes which are an integral part of the financial statements.
Statement of Operations
| | | Six months ended June 30, 2016 (Unaudited) |
| Investment Income | | |
| Dividends | | $3,878,465 |
| Income from Fidelity Central Funds | | 197,071 |
| Total income | | 4,075,536 |
| Expenses | | |
| Management fee | $813,688 | |
| Transfer agent fees | 202,177 | |
| Accounting and security lending fees | 58,545 | |
| Custodian fees and expenses | 6,449 | |
| Independent trustees' fees and expenses | 3,043 | |
| Audit | 27,852 | |
| Legal | 1,735 | |
| Miscellaneous | 1,094 | |
| Total expenses before reductions | 1,114,583 | |
| Expense reductions | (4,506) | 1,110,077 |
| Net investment income (loss) | | 2,965,459 |
| Realized and Unrealized Gain (Loss) | | |
| Net realized gain (loss) on: | | |
| Investment securities: | | |
| Unaffiliated issuers | 5,499,429 | |
| Foreign currency transactions | (2,916) | |
| Total net realized gain (loss) | | 5,496,513 |
Change in net unrealized appreciation (depreciation) on:
Investment securities | 20,946,185 | |
| Assets and liabilities in foreign currencies | (5,403) | |
| Total change in net unrealized appreciation (depreciation) | | 20,940,782 |
| Net gain (loss) | | 26,437,295 |
| Net increase (decrease) in net assets resulting from operations | | $29,402,754 |
See accompanying notes which are an integral part of the financial statements.
Statement of Changes in Net Assets
| | Six months ended June 30, 2016 (Unaudited) | Year ended December 31, 2015 |
| Increase (Decrease) in Net Assets | | |
| Operations | | |
| Net investment income (loss) | $2,965,459 | $3,176,828 |
| Net realized gain (loss) | 5,496,513 | 10,517,975 |
| Change in net unrealized appreciation (depreciation) | 20,940,782 | 5,432,519 |
| Net increase (decrease) in net assets resulting from operations | 29,402,754 | 19,127,322 |
| Distributions to shareholders from net investment income | – | (3,318,744) |
| Distributions to shareholders from net realized gain | (10,257,767) | (12,937,830) |
| Total distributions | (10,257,767) | (16,256,574) |
| Share transactions - net increase (decrease) | 105,394,310 | 55,231,623 |
| Redemption fees | 27,697 | 15,606 |
| Total increase (decrease) in net assets | 124,566,994 | 58,117,977 |
| Net Assets | | |
| Beginning of period | 241,652,141 | 183,534,164 |
| End of period | $366,219,135 | $241,652,141 |
| Other Information | | |
| Undistributed net investment income end of period | $2,965,459 | $– |
See accompanying notes which are an integral part of the financial statements.
Financial Highlights — VIP Consumer Staples Portfolio Initial Class
| | Six months ended (Unaudited) June 30, | Years ended December 31, | | | | |
| | 2016 | 2015 | 2014 | 2013 | 2012 | 2011 |
| Selected Per–Share Data | | | | | | |
| Net asset value, beginning of period | $18.25 | $18.08 | $16.44 | $14.03 | $12.42 | $11.61 |
| Income from Investment Operations | | | | | | |
| Net investment income (loss)A | .19 | .28 | .28 | .31 | .27 | .21 |
| Net realized and unrealized gain (loss) | 1.51 | 1.34 | 2.21 | 2.73 | 1.64 | .73 |
| Total from investment operations | 1.70 | 1.62 | 2.49 | 3.04 | 1.91 | .94 |
| Distributions from net investment income | – | (.27) | (.24) | (.31) | (.22) | (.14) |
| Distributions from net realized gain | (.72) | (1.18) | (.61) | (.32) | (.09) | – |
| Total distributions | (.72) | (1.45) | (.85) | (.63) | (.31) | (.14) |
| Redemption fees added to paid in capitalA | –B | –B | –B | –B | .01 | .01 |
| Net asset value, end of period | $19.23 | $18.25 | $18.08 | $16.44 | $14.03 | $12.42 |
| Total ReturnC,D,E | 9.87% | 9.46% | 15.66% | 21.80% | 15.40% | 8.18% |
| Ratios to Average Net AssetsF,G | | | | | | |
| Expenses before reductions | .68%H | .69% | .71% | .73% | .75% | .87% |
| Expenses net of fee waivers, if any | .68%H | .69% | .70% | .72% | .75% | .87% |
| Expenses net of all reductions | .67%H | .68% | .70% | .72% | .74% | .87% |
| Net investment income (loss) | 2.06%H | 1.61% | 1.66% | 1.94% | 1.95% | 1.76% |
| Supplemental Data | | | | | | |
| Net assets, end of period (000 omitted) | $50,610 | $28,077 | $22,943 | $25,736 | $24,123 | $13,965 |
| Portfolio turnover rateI | 35%H | 38% | 78% | 36% | 20% | 18% |
A Calculated based on average shares outstanding during the period.
B Amount represents less than $.005 per share.
C Total returns for periods of less than one year are not annualized.
D Total returns do not reflect charges attributable to your insurance company's separate account. Inclusion of these charges would reduce the total returns shown.
E Total returns would have been lower if certain expenses had not been reduced during the applicable periods shown.
F Fees and expenses of any underlying Fidelity Central Funds are not included in the Fund's expense ratio. The Fund indirectly bears its proportionate share of the expenses of any underlying Fidelity Central Funds.
G Expense ratios reflect operating expenses of the class. Expenses before reductions do not reflect amounts reimbursed by the investment adviser or reductions from brokerage service arrangements or reductions from other expense offset arrangements and do not represent the amount paid by the class during periods when reimbursements or reductions occur. Expenses net of fee waivers reflect expenses after reimbursement by the investment adviser but prior to reductions from brokerage service arrangements or other expense offset arrangements. Expenses net of all reductions represent the net expenses paid by the class.
H Annualized
I Amount does not include the portfolio activity of any underlying Fidelity Central Funds.
See accompanying notes which are an integral part of the financial statements.
Financial Highlights — VIP Consumer Staples Portfolio Investor Class
| | Six months ended (Unaudited) June 30, | Years ended December 31, | | | | |
| | 2016 | 2015 | 2014 | 2013 | 2012 | 2011 |
| Selected Per–Share Data | | | | | | |
| Net asset value, beginning of period | $18.19 | $18.02 | $16.40 | $13.99 | $12.39 | $11.59 |
| Income from Investment Operations | | | | | | |
| Net investment income (loss)A | .18 | .27 | .26 | .30 | .25 | .20 |
| Net realized and unrealized gain (loss) | 1.50 | 1.34 | 2.20 | 2.73 | 1.64 | .72 |
| Total from investment operations | 1.68 | 1.61 | 2.46 | 3.03 | 1.89 | .92 |
| Distributions from net investment income | – | (.26) | (.23) | (.30) | (.21) | (.13) |
| Distributions from net realized gain | (.72) | (1.18) | (.61) | (.32) | (.09) | – |
| Total distributions | (.72) | (1.44) | (.84) | (.62) | (.30) | (.13) |
| Redemption fees added to paid in capitalA | –B | –B | –B | –B | .01 | .01 |
| Net asset value, end of period | $19.15 | $18.19 | $18.02 | $16.40 | $13.99 | $12.39 |
| Total ReturnC,D,E | 9.79% | 9.41% | 15.52% | 21.79% | 15.30% | 8.07% |
| Ratios to Average Net AssetsF,G | | | | | | |
| Expenses before reductions | .76%H | .77% | .78% | .80% | .82% | .94% |
| Expenses net of fee waivers, if any | .76%H | .76% | .78% | .80% | .82% | .94% |
| Expenses net of all reductions | .76%H | .76% | .77% | .80% | .82% | .93% |
| Net investment income (loss) | 1.98%H | 1.53% | 1.59% | 1.86% | 1.87% | 1.69% |
| Supplemental Data | | | | | | |
| Net assets, end of period (000 omitted) | $315,609 | $213,575 | $160,591 | $140,485 | $89,648 | $45,307 |
| Portfolio turnover rateI | 35%H | 38% | 78% | 36% | 20% | 18% |
A Calculated based on average shares outstanding during the period.
B Amount represents less than $.005 per share.
C Total returns for periods of less than one year are not annualized.
D Total returns do not reflect charges attributable to your insurance company's separate account. Inclusion of these charges would reduce the total returns shown.
E Total returns would have been lower if certain expenses had not been reduced during the applicable periods shown.
F Fees and expenses of any underlying Fidelity Central Funds are not included in the Fund's expense ratio. The Fund indirectly bears its proportionate share of the expenses of any underlying Fidelity Central Funds.
G Expense ratios reflect operating expenses of the class. Expenses before reductions do not reflect amounts reimbursed by the investment adviser or reductions from brokerage service arrangements or reductions from other expense offset arrangements and do not represent the amount paid by the class during periods when reimbursements or reductions occur. Expenses net of fee waivers reflect expenses after reimbursement by the investment adviser but prior to reductions from brokerage service arrangements or other expense offset arrangements. Expenses net of all reductions represent the net expenses paid by the class.
H Annualized
I Amount does not include the portfolio activity of any underlying Fidelity Central Funds.
See accompanying notes which are an integral part of the financial statements.
Notes to Financial Statements (Unaudited)
For the period ended June 30, 2016
1. Organization.
VIP Consumer Staples Portfolio (the Fund) is a non-diversified fund of Variable Insurance Products Fund IV (the Trust) and is authorized to issue an unlimited number of shares. The Trust is registered under the Investment Company Act of 1940, as amended (the 1940 Act), as an open-end management investment company organized as a Massachusetts business trust. Shares of the Fund may only be purchased by insurance companies for the purpose of funding variable annuity or variable life insurance contracts. The Fund offers the following classes of shares: Initial Class shares and Investor Class shares. All classes have equal rights and voting privileges, except for matters affecting a single class.
2. Investments in Fidelity Central Funds.
The Fund invests in Fidelity Central Funds, which are open-end investment companies generally available only to other investment companies and accounts managed by the investment adviser and its affiliates. The Fund's Schedule of Investments lists each of the Fidelity Central Funds held as of period end, if any, as an investment of the Fund, but does not include the underlying holdings of each Fidelity Central Fund. As an Investing Fund, the Fund indirectly bears its proportionate share of the expenses of the underlying Fidelity Central Funds.
The Money Market Central Funds seek preservation of capital and current income and are managed by Fidelity Investments Money Management, Inc. (FIMM), an affiliate of the investment adviser. Annualized expenses of the Money Market Central Funds as of their most recent shareholder report date are less than .005%.
A complete unaudited list of holdings for each Fidelity Central Fund is available upon request or at the Securities and Exchange Commission (the SEC) website at www.sec.gov. In addition, the financial statements of the Fidelity Central Funds are available on the SEC website or upon request.
3. Significant Accounting Policies.
The financial statements have been prepared in conformity with accounting principles generally accepted in the United States of America (GAAP), which require management to make certain estimates and assumptions at the date of the financial statements. Actual results could differ from those estimates. Subsequent events, if any, through the date that the financial statements were issued have been evaluated in the preparation of the financial statements. The following summarizes the significant accounting policies of the Fund:
Investment Valuation. Investments are valued as of 4:00 p.m. Eastern time on the last calendar day of the period. The Board of Trustees (the Board) has delegated the day to day responsibility for the valuation of the Fund's investments to the Fidelity SelectCo, LLC (SelectCo) Fair Value Committee (the Committee). In accordance with valuation policies and procedures approved by the Board, the Fund attempts to obtain prices from one or more third party pricing vendors or brokers to value its investments. When current market prices, quotations or currency exchange rates are not readily available or reliable, investments will be fair valued in good faith by the Committee, in accordance with procedures adopted by the Board. Factors used in determining fair value vary by investment type and may include market or investment specific events. The frequency with which these procedures are used cannot be predicted and they may be utilized to a significant extent. The Committee oversees the Fund's valuation policies and procedures and reports to the Board on the Committee's activities and fair value determinations. The Board monitors the appropriateness of the procedures used in valuing the Fund's investments and ratifies the fair value determinations of the Committee.
The Fund categorizes the inputs to valuation techniques used to value its investments into a disclosure hierarchy consisting of three levels as shown below:
- Level 1 – quoted prices in active markets for identical investments
- Level 2 – other significant observable inputs (including quoted prices for similar investments, interest rates, prepayment speeds, etc.)
- Level 3 – unobservable inputs (including the Fund's own assumptions based on the best information available)
Valuation techniques used to value the Fund's investments by major category are as follows:
Equity securities, including restricted securities, for which market quotations are readily available, are valued at the last reported sale price or official closing price as reported by a third party pricing vendor on the primary market or exchange on which they are traded and are categorized as Level 1 in the hierarchy. In the event there were no sales during the day or closing prices are not available, securities are valued at the last quoted bid price or may be valued using the last available price and are generally categorized as Level 2 in the hierarchy. For foreign equity securities, when market or security specific events arise, comparisons to the valuation of American Depositary Receipts (ADRs), futures contracts, Exchange-Traded Funds (ETFs) and certain indexes as well as quoted prices for similar securities may be used and would be categorized as Level 2 in the hierarchy. Utilizing these techniques may result in transfers between Level 1 and Level 2. For equity securities, including restricted securities, where observable inputs are limited, assumptions about market activity and risk are used and these securities may be categorized as Level 3 in the hierarchy.
Investments in open-end mutual funds, including the Fidelity Central Funds, are valued at their closing net asset value (NAV) each business day and are categorized as Level 1 in the hierarchy.
Changes in valuation techniques may result in transfers in or out of an assigned level within the disclosure hierarchy. The aggregate value of investments by input level as of June 30, 2016, including information on transfers between Levels 1 and 2 is included at the end of the Fund's Schedule of Investments.
Foreign Currency. The Fund may use foreign currency contracts to facilitate transactions in foreign-denominated securities. Gains and losses from these transactions may arise from changes in the value of the foreign currency or if the counterparties do not perform under the contracts' terms.
Foreign-denominated assets, including investment securities, and liabilities are translated into U.S. dollars at the exchange rates at period end. Purchases and sales of investment securities, income and dividends received and expenses denominated in foreign currencies are translated into U.S. dollars at the exchange rate in effect on the transaction date.
The effects of exchange rate fluctuations on investments are included with the net realized and unrealized gain (loss) on investment securities. Other foreign currency transactions resulting in realized and unrealized gain (loss) are disclosed separately.
Investment Transactions and Income. For financial reporting purposes, the Fund's investment holdings and NAV include trades executed through the end of the last business day of the period. The NAV per share for processing shareholder transactions is calculated as of the close of business of the New York Stock Exchange (NYSE), normally 4:00 p.m. Eastern time and includes trades executed through the end of the prior business day. Gains and losses on securities sold are determined on the basis of identified cost and may include proceeds from litigation. Dividend income is recorded on the ex-dividend date, except for certain dividends from foreign securities where the ex-dividend date may have passed, which are recorded as soon as the Fund is informed of the ex-dividend date. Non-cash dividends included in dividend income, if any, are recorded at the fair market value of the securities received. Income and capital gain distributions from Fidelity Central Funds, if any, are recorded on the ex-dividend date. Distributions received on securities that represent a return of capital or capital gain are recorded as a reduction of cost of investments and/or as a realized gain. Subsequent to ex-dividend date the Fund determines the components of these distributions, based upon receipt of tax filings or other correspondence relating to the underlying investment. Investment income is recorded net of foreign taxes withheld where recovery of such taxes is uncertain.
Class Allocations and Expenses. Investment income, realized and unrealized capital gains and losses, common expenses of the Fund, and certain fund-level expense reductions, if any, are allocated daily on a pro-rata basis to each class based on the relative net assets of each class to the total net assets of the Fund. Each class differs with respect to transfer agent fees incurred. Certain expense reductions may also differ by class. For the reporting period, the allocated portion of income and expenses to each class as a percent of its average net assets may vary due to the timing of recording these transactions in relation to fluctuating net assets of the classes. Expenses directly attributable to a fund are charged to that fund. Expenses attributable to more than one fund are allocated among the respective funds on the basis of relative net assets or other appropriate methods. Expense estimates are accrued in the period to which they relate and adjustments are made when actual amounts are known.
Income Tax Information and Distributions to Shareholders. Each year, the Fund intends to qualify as a regulated investment company under Subchapter M of the Internal Revenue Code, including distributing substantially all of its taxable income and realized gains. As a result, no provision for U.S. Federal income taxes is required. The Fund files a U.S. federal tax return, in addition to state and local tax returns as required. The Fund's federal income tax returns are subject to examination by the Internal Revenue Service (IRS) for a period of three fiscal years after they are filed. State and local tax returns may be subject to examination for an additional fiscal year depending on the jurisdiction. Foreign taxes are provided for based on the Fund's understanding of the tax rules and rates that exist in the foreign markets in which it invests.
Distributions are declared and recorded on the ex-dividend date. Income dividends and capital gain distributions are declared separately for each class. Income and capital gain distributions are determined in accordance with income tax regulations, which may differ from GAAP.
Capital accounts within the financial statements are adjusted for permanent book-tax differences. These adjustments have no impact on net assets or the results of operations. Capital accounts are not adjusted for temporary book-tax differences which will reverse in a subsequent period.
Book-tax differences are primarily due to foreign currency transactions and losses deferred due to wash sales and excise tax regulations.
The federal tax cost of investment securities and unrealized appreciation (depreciation) as of period end were as follows:
| Gross unrealized appreciation | $66,281,644 |
| Gross unrealized depreciation | (4,247,280) |
| Net unrealized appreciation (depreciation) on securities | $62,034,364 |
| Tax cost | $318,246,774 |
The Fund elected to defer to its next fiscal year approximately $360,664 of capital losses recognized during the period November 1, 2015 to December 31, 2015.
Trading (Redemption) Fees. Shares held by investors less than 60 days may be subject to a redemption fee equal to 1% of the NAV of shares redeemed. All redemption fees, which reduce the proceeds of the shareholder redemption, are retained by the Fund and accounted for as an addition to paid in capital.
Restricted Securities. The Fund may invest in securities that are subject to legal or contractual restrictions on resale. These securities generally may be resold in transactions exempt from registration or to the public if the securities are registered. Disposal of these securities may involve time-consuming negotiations and expense, and prompt sale at an acceptable price may be difficult. Information regarding restricted securities is included at the end of the Fund's Schedule of Investments.
4. Purchases and Sales of Investments.
Purchases and sales of securities, other than short-term securities, aggregated $148,719,859 and $51,666,409, respectively.
5. Fees and Other Transactions with Affiliates.
Management Fee. Fidelity SelectCo, LLC (the investment adviser) and its affiliates provide the Fund with investment management related services for which the Fund pays a monthly management fee. The management fee is the sum of an individual fund fee rate that is based on an annual rate of .30% of the Fund's average net assets and an annualized group fee rate that averaged .25% during the period. The group fee rate is based upon the average net assets of all the mutual funds advised by Fidelity Management & Research Company (FMR) and the investment adviser. The group fee rate decreases as assets under management increase and increases as assets under management decrease. For the reporting period, the total annualized management fee rate was .55% of the Fund's average net assets.
Transfer Agent Fees. Fidelity Investments Institutional Operations Company, Inc. (FIIOC), an affiliate of the investment adviser, is the Fund's transfer, dividend disbursing, and shareholder servicing agent. FIIOC receives an asset-based fee with respect to each class. Each class (with the exception of Investor Class) pays a fee for transfer agent services, typesetting, and printing and mailing of shareholder reports, excluding mailing of proxy statements, equal to an annual rate of .07% ( .15% for Investor Class) of class-level average net assets. For the period, transfer agent fees for each class were as follows:
| Initial Class | $12,746 |
| Investor Class | 189,431 |
| | $202,177 |
Accounting and Security Lending Fees. Fidelity Service Company, Inc. (FSC), an affiliate of the investment adviser, maintains the Fund's accounting records. The accounting fee is based on the level of average net assets for each month. Under a separate contract, FSC administers the security lending program. The security lending fee is based on the number and duration of lending transactions.
Brokerage Commissions. The Fund placed a portion of its portfolio transactions with brokerage firms which are affiliates of the investment adviser. Brokerage commissions are included in net realized gain (loss) and change in net unrealized appreciation (depreciation) in the Statement of Operations. The commissions paid to these affiliated firms were $2,617 for the period.
Interfund Trades. The Fund may purchase from or sell securities to other Fidelity Funds under procedures adopted by the Board. The procedures have been designed to ensure these interfund trades are executed in accordance with Rule 17a-7 of the 1940 Act. Interfund trades are included within the respective purchases and sales amounts shown in the Purchases and Sales of Investments note.
6. Committed Line of Credit.
The Fund participates with other funds managed by the investment adviser or an affiliate in a $4.25 billion credit facility (the "line of credit") to be utilized for temporary or emergency purposes to fund shareholder redemptions or for other short-term liquidity purposes. The Fund has agreed to pay commitment fees on its pro-rata portion of the line of credit, which amounted to $214 and is reflected in Miscellaneous expenses on the Statement of Operations. During the period, the Fund did not borrow on this line of credit.
7. Security Lending.
The Fund lends portfolio securities through a lending agent from time to time in order to earn additional income. On the settlement date of the loan, the Fund receives collateral (in the form of U.S. Treasury obligations, letters of credit and/or cash) against the loaned securities and maintains collateral in an amount not less than 100% of the market value of the loaned securities during the period of the loan. The market value of the loaned securities is determined at the close of business of the Fund and any additional required collateral is delivered to the Fund on the next business day. The Fund or borrower may terminate the loan at any time, and if the borrower defaults on its obligation to return the securities loaned because of insolvency or other reasons, the Fund may apply collateral received from the borrower against the obligation. The Fund may experience delays and costs in recovering the securities loaned. Any cash collateral received is invested in the Fidelity Securities Lending Cash Central Fund. The value of loaned securities and cash collateral at period end are disclosed on the Fund's Statement of Assets and Liabilities. Security lending income represents the income earned on investing cash collateral, less rebates paid to borrowers and any lending agent fees associated with the loan, plus any premium payments received for lending certain types of securities. Security lending income is presented in the Statement of Operations as a component of income from Fidelity Central Funds. Total security lending income during the period amounted to $188,810.
8. Expense Reductions.
Commissions paid to certain brokers with whom the investment adviser, or its affiliates, places trades on behalf of the Fund include an amount in addition to trade execution, which may be rebated back to the Fund to offset certain expenses. This amount totaled $3,661 for the period.
In addition, during the period the investment adviser reimbursed and/or waived a portion of fund-level operating expenses in the amount of $845.
9. Distributions to Shareholders.
Distributions to shareholders of each class were as follows:
| | Six months ended
June 30, 2016 | Year ended December 31, 2015 |
| From net investment income | | |
| Initial Class | $– | $400,995 |
| Investor Class | – | 2,917,749 |
| Total | $– | $3,318,744 |
| From net realized gain | | |
| Initial Class | $1,206,512 | $1,614,521 |
| Investor Class | 9,051,255 | 11,323,309 |
| Total | $10,257,767 | $12,937,830 |
10. Share Transactions.
Transactions for each class of shares were as follows:
| | Shares | Shares | Dollars | Dollars |
| | Six months ended
June 30, 2016 | Year ended December 31, 2015 | Six months ended
June 30, 2016 | Year ended December 31, 2015 |
| Initial Class | | | | |
| Shares sold | 1,131,800 | 441,760 | $20,706,786 | $7,883,291 |
| Reinvestment of distributions | 71,139 | 115,112 | 1,206,512 | 2,015,516 |
| Shares redeemed | (109,706) | (287,181) | (2,008,312) | (5,040,290) |
| Net increase (decrease) | 1,093,233 | 269,691 | $19,904,986 | $4,858,517 |
| Investor Class | | | | |
| Shares sold | 4,454,051 | 2,935,553 | $81,053,222 | $52,128,879 |
| Reinvestment of distributions | 535,577 | 815,517 | 9,051,255 | 14,241,058 |
| Shares redeemed | (256,711) | (916,976) | (4,615,153) | (15,996,831) |
| Net increase (decrease) | 4,732,917 | 2,834,094 | $85,489,324 | $50,373,106 |
11. Other.
The Fund's organizational documents provide former and current trustees and officers with a limited indemnification against liabilities arising in connection with the performance of their duties to the Fund. In the normal course of business, the Fund may also enter into contracts that provide general indemnifications. The Fund's maximum exposure under these arrangements is unknown as this would be dependent on future claims that may be made against the Fund. The risk of material loss from such claims is considered remote.
At the end of the period, the investment adviser or its affiliates were the owners of record of 100% of the total outstanding shares of the Fund.
Shareholder Expense Example
As a shareholder of the Fund, you incur two types of costs: (1) transaction costs, including redemption fees and (2) ongoing costs, including management fees and other Fund expenses. This Example is intended to help you understand your ongoing costs (in dollars) of investing in the Fund and to compare these costs with the ongoing costs of investing in other mutual funds.
The Example is based on an investment of $1,000 invested at the beginning of the period and held for the entire period (January 1, 2016 to June 30, 2016).
Actual Expenses
The first line of the accompanying table for each class of the Fund provides information about actual account values and actual expenses. You may use the information in this line, together with the amount you invested, to estimate the expenses that you paid over the period. Simply divide your account value by $1,000.00 (for example, an $8,600 account value divided by $1,000.00 = 8.6), then multiply the result by the number in the first line for a class of the Fund under the heading entitled "Expenses Paid During Period" to estimate the expenses you paid on your account during this period. The estimate of expenses does not include any fees or other expenses of any variable annuity or variable life insurance product. If they were, the estimate of expenses you paid during the period would be higher, and your ending account value would be lower. In addition, the Fund, as a shareholder in the underlying Fidelity Central Funds, will indirectly bear its pro-rata share of the fees and expenses incurred by the underlying Fidelity Central Funds. These fees and expenses are not included in the Fund's annualized expense ratio used to calculate the expense estimate in the table below.
Hypothetical Example for Comparison Purposes
The second line of the accompanying table for each class of the Fund provides information about hypothetical account values and hypothetical expenses based on a Class' actual expense ratio and an assumed rate of return of 5% per year before expenses, which is not the Class' actual return. The hypothetical account values and expenses may not be used to estimate the actual ending account balance or expenses you paid for the period. You may use this information to compare the ongoing costs of investing in the Fund and other funds. To do so, compare this 5% hypothetical example with the 5% hypothetical examples that appear in the shareholder reports of the other funds. The estimate of expenses does not include any fees or other expenses of any variable annuity or variable life insurance product. If they were, the estimate of expenses you paid during the period would be higher, and your ending account value would be lower. In addition, the Fund, as a shareholder in the underlying Fidelity Central Funds, will indirectly bear its pro-rata share of the fees and expenses incurred by the underlying Fidelity Central Funds. These fees and expenses are not included in the Fund's annualized expense ratio used to calculate the expense estimate in the table below.
Please note that the expenses shown in the table are meant to highlight your ongoing costs only and do not reflect any transaction costs. Therefore, the second line of the table is useful in comparing ongoing costs only, and will not help you determine the relative total costs of owning different funds. In addition, if these transactional costs were included, your costs would have been higher.
| | Annualized Expense Ratio-A | Beginning
Account Value
January 1, 2016 | Ending
Account Value
June 30, 2016 | Expenses Paid
During Period-B
January 1, 2016
to June 30, 2016 |
| Initial Class | .68% | | | |
| Actual | | $1,000.00 | $1,098.70 | $3.55 |
| Hypothetical-C | | $1,000.00 | $1,021.48 | $3.42 |
| Investor Class | .76% | | | |
| Actual | | $1,000.00 | $1,097.90 | $3.96 |
| Hypothetical-C | | $1,000.00 | $1,021.08 | $3.82 |
A Annualized expense ratio reflects expenses net of applicable fee waivers.
B Expenses are equal to each Class' annualized expense ratio, multiplied by the average account value over the period, multiplied by 182/366 (to reflect the one-half year period).
C 5% return per year before expenses
Board Approval of Investment Advisory Contracts and Management Fees
VIP Consumer Staples Portfolio
Each year, the Board of Trustees, including the Independent Trustees (together, the Board), votes on the renewal of the management contract with Fidelity SelectCo, LLC (SelectCo), an affiliate of Fidelity Management & Research Company (FMR), and the sub-advisory agreements with affiliates of FMR (together, the Advisory Contracts) for the fund. The Board, assisted by the advice of fund counsel and Independent Trustees' counsel, requests and considers a broad range of information relevant to the renewal of the Advisory Contracts throughout the year.
The Board meets regularly and, at each of its meetings, covers an extensive agenda of topics and materials and considers factors that are relevant to its annual consideration of the renewal of the fund's Advisory Contracts, including the services and support provided to the fund and its shareholders. The Board has established four standing committees (Committees) — Operations, Audit, Fair Valuation, and Governance and Nominating — each composed of and chaired by Independent Trustees with varying backgrounds, to which the Board has assigned specific subject matter responsibilities in order to enhance effective decision-making by the Board. The Operations Committee, of which all of the Independent Trustees are members, meets regularly throughout the year and considers, among other matters, information specifically related to the annual consideration of the renewal of the fund's Advisory Contracts. The Board, acting directly and through its Committees, requests and receives information concerning the annual consideration of the renewal of the fund's Advisory Contracts. The Board also meets as needed to consider matters specifically related to the Board's annual consideration of the renewal of the Advisory Contracts. Members of the Board may also meet with trustees of other Fidelity funds through ad hoc joint committees to discuss certain matters relevant to all of the Fidelity funds.
At its January 2016 meeting, the Board unanimously determined to renew the fund's Advisory Contracts. In reaching its determination, the Board considered all factors it believed relevant, including (i) the nature, extent, and quality of the services to be provided to the fund and its shareholders (including the investment performance of the fund); (ii) the competitiveness of the fund's management fee and total expense ratio relative to peer funds; (iii) the total costs of the services to be provided by and the profits to be realized by Fidelity from its relationships with the fund; and (iv) the extent to which, if any, economies of scale exist and would be realized as the fund grows, and whether any economies of scale are appropriately shared with fund shareholders.
In considering whether to renew the Advisory Contracts for the fund, the Board reached a determination, with the assistance of fund counsel and Independent Trustees' counsel and through the exercise of its business judgment, that the renewal of the Advisory Contracts was in the best interests of the fund and its shareholders and that the compensation payable under the Advisory Contracts was fair and reasonable. The Board's decision to renew the Advisory Contracts was not based on any single factor, but rather was based on a comprehensive consideration of all the information provided to the Board at its meetings throughout the year. The Board, in reaching its determination to renew the Advisory Contracts, was aware that shareholders of the fund have a broad range of investment choices available to them, including a wide choice among funds offered by Fidelity's competitors, and that the fund's shareholders, who have the opportunity to review and weigh the disclosure provided by the fund in its prospectus and other public disclosures, have chosen to invest in this fund, which is part of the Fidelity family of funds.
Nature, Extent, and Quality of Services Provided. The Board considered the staffing of SelectCo and the sub-advisers (together with SelectCo, the Investment Advisers) as it relates to the fund, including the backgrounds of investment personnel of SelectCo, and also considered the fund's investment objective, strategies, and related investment philosophy. The Independent Trustees also had discussions with senior management of Fidelity's investment operations and investment groups. The Board considered the structure of the investment personnel compensation program and whether this structure provides appropriate incentives to act in the best interests of the fund. Additionally, the Board considered the portfolio managers' investments, if any, in the funds that they manage.
Resources Dedicated to Investment Management and Support Services. The Board reviewed the general qualifications and capabilities of the investment staff of the Investment Advisers, including their size, education, experience, and resources, as well as Fidelity's approach to recruiting, training, managing, and compensating investment personnel. The Board noted that Fidelity has continued to increase the resources devoted to non-U.S. offices, including expansion of Fidelity's global investment organization. The Board also noted that Fidelity's analysts have extensive resources, tools and capabilities that allow them to conduct sophisticated quantitative and fundamental analysis, as well as credit analysis of issuers, counterparties and guarantors. Further, the Board considered that Fidelity's investment professionals have sufficient access to global information and data so as to provide competitive investment results over time, and that those professionals also have access to sophisticated tools that permit them to assess portfolio construction and risk and performance attribution characteristics continuously, as well as to transmit new information and research conclusions rapidly around the world. Additionally, in its deliberations, the Board considered Fidelity's trading, risk management, compliance, and technology and operations capabilities and resources, which are integral parts of the investment management process.
Shareholder and Administrative Services. The Board considered (i) the nature, extent, quality, and cost of advisory, administrative, and shareholder services performed by the Investment Advisers and their affiliates under the Advisory Contracts and under separate agreements covering transfer agency, pricing and bookkeeping, and securities lending services for the fund; (ii) the nature and extent of the supervision of third party service providers, principally custodians, subcustodians, and pricing vendors; and (iii) the resources devoted to, and the record of compliance with, the fund's compliance policies and procedures. The Board also reviewed the allocation of fund brokerage, including allocations to brokers affiliated with the Investment Advisers, the use of brokerage commissions to pay fund expenses, and the use of "soft" commission dollars to pay for research services.
The Board noted that the growth of fund assets over time across the complex allows Fidelity to reinvest in the development of services designed to enhance the value or convenience of the Fidelity funds as investment vehicles. These services include 24-hour access to account information and market information through telephone representatives and over the Internet, investor education materials and asset allocation tools, and the expanded availability of Fidelity Investor Centers.
The Board noted that in 2014 the ad hoc Committee on Transfer Agency Fees was formed by it and the boards of certain other Fidelity funds to review the variety of transfer agency services and fee structures throughout the mutual fund industry compared to Fidelity's.
Investment in a Large Fund Family. The Board considered the benefits to shareholders of investing in a Fidelity fund, including the benefits of investing in a fund that is part of a large family of funds offering a variety of investment disciplines and providing a large variety of mutual fund investor services. The Board noted that Fidelity had taken, or had made recommendations that resulted in the Fidelity funds taking, a number of actions over the previous year that benefited particular funds, including (i) continuing to dedicate additional resources to investment research and to the support of the senior management team that oversees asset management; (ii) continuing efforts to enhance Fidelity's global research capabilities; (iii) launching new funds and making other enhancements to meet client needs; (iv) reducing management fees and total expenses for certain index funds; (v) continuing to launch dedicated lower cost underlying funds to meet portfolio construction needs related to expanding underlying fund options for Fidelity funds of funds, specifically for the Freedom Fund product lines; (vi) rationalizing product lines and gaining increased efficiencies through fund mergers; (vii) continuing to develop, acquire and implement systems and technology to improve services to the funds and shareholders, strengthen information security, and increase efficiency; (viii) implementing investment enhancements to further strengthen Fidelity's target date product line to increase investors' probability of success in achieving their goals; (ix) modifying the eligibility criteria for certain share classes to accommodate roll-over assets from employer-sponsored retirement plans; (x) launching a new Class W of the Freedom Index Funds to attract and retain Fidelity record-kept retirement plan assets; and (xi) implementing changes to Fidelity's money market fund product line in response to recent regulatory reforms.
Investment Performance. The Board considered whether the fund has operated in accordance with its investment objective, as well as its record of compliance with its investment restrictions and its performance history.
The Board took into account discussions with representatives of the Investment Advisers about fund investment performance that occur at Board meetings throughout the year. In this regard the Board noted that as part of regularly scheduled fund reviews and other reports to the Board on fund performance, the Board considers annualized return information for the fund, for different time periods, measured against a securities market index ("benchmark index"). In its evaluation of fund investment performance at meetings throughout the year, the Board gave particular attention to information indicating underperformance of certain Fidelity funds for specific time periods and discussed with the Investment Advisers the reasons for such underperformance.
In addition to reviewing absolute and relative fund performance, the Independent Trustees periodically consider the appropriateness of fund performance metrics in evaluating the results achieved. In general, the Independent Trustees believe that fund performance should be evaluated based on net performance (after fees and expenses) of both the highest performing and lowest performing fund share classes, where applicable, compared to appropriate benchmark indices, over appropriate time periods that may include full market cycles, taking into account relevant factors, including the following: general market conditions; issuer-specific information; and fund cash flows and other factors. Depending on the circumstances, the Independent Trustees may be satisfied with a fund's performance notwithstanding that it lags its benchmark index for certain periods.
The Independent Trustees recognize that shareholders evaluate performance on a net basis over their own holding periods, for which one-, three-, and five-year periods are often used as a proxy. For this reason, the performance information reviewed by the Board also included net cumulative total return information for the fund and an appropriate benchmark index for the most recent one-, three-, and five-year periods ended June 30, 2015.
Based on its review, the Board concluded that the nature, extent, and quality of services provided to the fund under the Advisory Contracts should benefit the shareholders of the fund.
Competitiveness of Management Fee and Total Expense Ratio. The Board considered the fund's management fee and total expense ratio compared to "mapped groups" of competitive funds and classes created for the purpose of facilitating the Trustees' analysis of the competitiveness of management fees and total expenses. Fidelity creates "mapped groups" by combining similar Lipper investment objective categories that have comparable investment mandates. For this purpose, all sector focused equity funds are grouped in the same mapped group. Combining Lipper investment objective categories aids the Board's management fee and total expense ratio comparisons by broadening the competitive group used for comparison.
Management Fee. The Board considered two proprietary management fee comparisons for the 12-month periods ended June 30 shown in basis points (BP) in the chart below. The group of Lipper funds used by the Board for management fee comparisons is referred to below as the "Total Mapped Group." The Total Mapped Group comparison focuses on a fund's standing in terms of gross management fees before expense reimbursements or caps relative to the total universe of funds with comparable investment mandates (
i.e., sector equities), regardless of whether their management fee structures also are comparable. Funds with comparable management fee structures have similar management fee contractual arrangements (
e.g., flat rate charged for advisory services, all-inclusive fee rate,
etc.). "TMG %" represents the percentage of funds in the Total Mapped Group that had management fees that were lower than the fund's. For example, a hypothetical TMG % of 20% would mean that 80% of the funds in the Total Mapped Group had higher, and 20% had lower, management fees than the fund. The fund's actual TMG %s and the number of funds in the Total Mapped Group are in the chart below. The "Asset-Size Peer Group" (ASPG) comparison focuses on a fund's standing relative to a subset of non-Fidelity funds within the Total Mapped Group that are similar in size and management fee structure. For example, if a fund is in the first quartile of the ASPG, the fund's management fee ranks in the least expensive or lowest 25% of funds in the ASPG. The ASPG represents at least 15% of the funds in the Total Mapped Group with comparable asset size and management fee structures, subject to a minimum of 50 funds (or all funds in the Total Mapped Group if fewer than 50). Additional information, such as the ASPG quartile in which the fund's management fee rate ranked, is also included in the chart and considered by the Board.
VIP Consumer Staples Portfolio

The Board noted that the fund's management fee rate ranked below the median of its Total Mapped Group and below the median of its ASPG for the 12-month period ended June 30, 2015.
The Board noted that, in 2014, the ad hoc Committee on Group Fee was formed by it and the boards of other Fidelity funds to conduct an in-depth review of the "group fee" component of the management fee of funds with such management fee structures. Committee focus included the mechanics of the group fee, the competitive landscape of group fee structures, Fidelity funds with no group fee component and investment products not included in group fee assets. The Board also considered that, for funds subject to the group fee, FMR agreed to voluntarily waive fees over a specified period of time in amounts designed to account for assets converted from certain funds to certain collective investment trusts.
Based on its review, the Board concluded that the fund's management fee is fair and reasonable in light of the services that the fund receives and the other factors considered.
Total Expense Ratio. In its review of each class's total expense ratio, the Board considered the fund's management fee rate as well as other fund or class expenses, as applicable, such as transfer agent fees, pricing and bookkeeping fees, and custodial, legal, and audit fees. The Board also noted that Fidelity may agree to waive fees and expenses from time to time, and the extent to which, if any, it has done so for the fund. As part of its review, the Board also considered the current and historical total expense ratios of each class of the fund compared to competitive fund median expenses. Each class of the fund is compared to those funds and classes in the Total Mapped Group (used by the Board for management fee comparisons) that have a similar sales load structure.
The Board noted that the total expense ratio of each class ranked below the competitive median for the 12-month period ended June 30, 2015.
Fees Charged to Other Fidelity Clients. The Board also considered Fidelity fee structures and other information with respect to clients of Fidelity, such as other funds advised or subadvised by Fidelity, pension plan clients, and other institutional clients with similar mandates. The Board noted the findings of the 2013 ad hoc joint committee (created with the boards of other Fidelity funds), which reviewed and compared Fidelity's institutional investment advisory business with its business of providing services to the Fidelity funds, including the differences in services provided, fees charged, and costs incurred, as well as competition in their respective marketplaces.
Based on its review of total expense ratios and fees charged to other Fidelity clients, the Board concluded that the total expense ratio of each class of the fund was reasonable in light of the services that the fund and its shareholders receive and the other factors considered.
Costs of the Services and Profitability. The Board considered the revenues earned and the expenses incurred by Fidelity in conducting the business of developing, marketing, distributing, managing, administering and servicing the fund and servicing the fund's shareholders. The Board also considered the level of Fidelity's profits in respect of all the Fidelity funds.
On an annual basis, Fidelity presents to the Board information about the profitability of its relationship with the fund. Fidelity calculates profitability information for each fund, as well as aggregate profitability information for groups of Fidelity funds and all Fidelity funds, using a series of detailed revenue and cost allocation methodologies which originate with the books and records of Fidelity on which Fidelity's audited financial statements are based. The Audit Committee of the Board reviews any significant changes from the prior year's methodologies.
PricewaterhouseCoopers LLP (PwC), independent registered public accounting firm and auditor to Fidelity and certain Fidelity funds, has been engaged annually by the Board as part of the Board's assessment of the profitability analysis used by Fidelity. PwC's engagement includes the review and assessment of Fidelity's methodologies used in determining the revenues and expenses attributable to Fidelity's mutual fund business, and completion of agreed-upon procedures in respect of the mathematical accuracy of fund profitability and its conformity to established allocation methodologies. After considering PwC's reports issued under the engagement and information provided by Fidelity, the Board concluded that while other allocation methods may also be reasonable, Fidelity's profitability methodologies are reasonable in all material respects.
The Board also reviewed Fidelity's non-fund businesses and fall-out benefits related to the mutual fund business as well as cases where Fidelity's affiliates may benefit from or be related to the fund's business.
The Board considered the costs of the services provided by and the profits realized by Fidelity in connection with the operation of the fund and was satisfied that the profitability was not excessive.
Economies of Scale. The Board considered whether there have been economies of scale in respect of the management of the Fidelity funds, whether the Fidelity funds (including the fund) have appropriately benefited from any such economies of scale, and whether there is potential for realization of any further economies of scale. The Board considered the extent to which the fund will benefit from economies of scale as assets grow through increased services to the fund, through waivers or reimbursements, or through fee or expense ratio reductions. The Board also noted that in 2013, it and the boards of other Fidelity funds created an ad hoc committee (the Economies of Scale Committee) to analyze whether Fidelity attains economies of scale in respect of the management and servicing of the Fidelity funds, whether the Fidelity funds have appropriately benefited from such economies of scale, and whether there is potential for realization of any further economies of scale.
The Board recognized that the fund's management contract incorporates a "group fee" structure, which provides for lower group fee rates as total group assets increase, and for higher group fee rates as total group assets decrease (with "group assets" defined to include fund assets under SelectCo's management plus assets under FMR's management). SelectCo calculates the group fee rates based on a tiered asset "breakpoint" schedule that varies based on asset class. The Board considered that the group fee is designed to deliver the benefits of economies of scale to fund shareholders when total group assets increase, even if assets of any particular fund are unchanged or have declined, because some portion of Fidelity's costs are attributable to services provided to all Fidelity funds, and all funds benefit if those costs can be allocated among more assets. The Board concluded that, given the group fee structure, fund shareholders will benefit from lower management fees as group assets increase at the fund complex level, regardless of whether Fidelity achieves any such economies of scale.
The Board concluded, taking into account the analysis of the Economies of Scale Committee, that economies of scale, if any, are being appropriately shared between fund shareholders and Fidelity.
Additional Information Requested by the Board. In order to develop fully the factual basis for consideration of the Fidelity funds' Advisory Contracts, the Board requested and received additional information on certain topics, including: (i) Fidelity's fund profitability methodology, profitability trends for certain funds, and the impact of certain factors on fund profitability results; (ii) portfolio manager changes that have occurred during the past year and the amount of the investment that each portfolio manager has made in the Fidelity fund(s) that he or she manages; (iii) Fidelity's compensation structure for portfolio managers, research analysts, and other key personnel, including its effects on fund profitability; (iv) the arrangements with and compensation paid to certain fund sub-advisers on behalf of the Fidelity funds; (v) Fidelity's long-term expectations for its offerings in the workplace investing channel; (vi) the methodology with respect to competitive fund data and peer group classifications; (vii) Fidelity's transfer agent fee, expense, and service structures for different funds and classes, and the impact of outsourcing, the increased use of omnibus accounts, and lower pricing in the retirement channel; and (viii) explanations regarding the relative total expense ratios of certain funds and classes, total expense competitive trends and methodologies for total expense competitive comparisons, and actions that might be taken by Fidelity to reduce total expense ratios for certain funds and classes or to achieve further economies of scale.
Based on its evaluation of all of the conclusions noted above, and after considering all factors it believed relevant, the Board concluded that the advisory fee structures are fair and reasonable, and that the fund's Advisory Contracts should be renewed.
VCSP-SANN-0816
1.850997.109
Fidelity® Variable Insurance Products: Energy Portfolio
Semi-Annual Report June 30, 2016 |
|
Contents
To view a fund's proxy voting guidelines and proxy voting record for the 12-month period ended June 30, visit http://www.fidelity.com/proxyvotingresults or visit the Securities and Exchange Commission's (SEC) web site at http://www.sec.gov.
You may also call 1-877-208-0098 to request a free copy of the proxy voting guidelines.
Fidelity® Variable Insurance Products are separate account options which are purchased through a variable insurance contract.
Standard & Poor's, S&P and S&P 500 are registered service marks of The McGraw-Hill Companies, Inc. and have been licensed for use by Fidelity Distributors Corporation.
Other third-party marks appearing herein are the property of their respective owners.
All other marks appearing herein are registered or unregistered trademarks or service marks of FMR LLC or an affiliated company. © 2016 FMR LLC. All rights reserved.
This report and the financial statements contained herein are submitted for the general information of the shareholders of the Fund. This report is not authorized for distribution to prospective investors in the Fund unless preceded or accompanied by an effective prospectus.
A fund files its complete schedule of portfolio holdings with the SEC for the first and third quarters of each fiscal year on Form N-Q. Forms N-Q are available on the SEC’s web site at http://www.sec.gov. A fund's Forms N-Q may be reviewed and copied at the SEC’s Public Reference Room in Washington, DC. Information regarding the operation of the SEC's Public Reference Room may be obtained by calling 1-800-SEC-0330.
For a complete list of a fund's portfolio holdings, view the most recent holdings listing, semiannual report, or annual report on Fidelity's web site at http://www.fidelity.com, http://www.institutional.fidelity.com, or http://www.401k.com, as applicable.
NOT FDIC INSURED •MAY LOSE VALUE •NO BANK GUARANTEE
Neither the Fund nor Fidelity Distributors Corporation is a bank.
Investment Summary (Unaudited)
Top Ten Stocks as of June 30, 2016
| | % of fund's net assets | % of fund's net assets 6 months ago |
| Schlumberger Ltd. | 6.5 | 7.7 |
| EOG Resources, Inc. | 6.2 | 6.0 |
| Newfield Exploration Co. | 4.8 | 4.1 |
| Noble Energy, Inc. | 4.6 | 2.8 |
| Anadarko Petroleum Corp. | 4.2 | 2.9 |
| Baker Hughes, Inc. | 4.0 | 4.0 |
| Chevron Corp. | 3.5 | 4.1 |
| Hess Corp. | 3.5 | 1.9 |
| Diamondback Energy, Inc. | 3.3 | 3.1 |
| Cimarex Energy Co. | 3.0 | 3.9 |
| | 43.6 | |
Top Industries (% of fund's net assets)
| As of June 30, 2016 |
| | Oil, Gas & Consumable Fuels | 79.3% |
| | Energy Equipment & Services | 17.6% |
| | Independent Power and Renewable Electricity Producers | 0.8% |
| | Chemicals | 0.6% |
| | Metals & Mining | 0.4% |
| | All Others* | 1.3% |

* Includes Short-Term investments and Net Other Assets (Liabilities).
| As of December 31, 2015 |
| | Oil, Gas & Consumable Fuels | 77.2% |
| | Energy Equipment & Services | 18.7% |
| | Chemicals | 1.7% |
| | Independent Power and Renewable Electricity Producers | 1.0% |
| | Semiconductors & Semiconductor Equipment | 0.2% |
| | All Others* | 1.2% |

* Includes Short-Term investments and Net Other Assets (Liabilities).
Investments June 30, 2016 (Unaudited)
Showing Percentage of Net Assets
| Common Stocks - 99.0% | | | |
| | | Shares | Value |
| Chemicals - 0.6% | | | |
| Commodity Chemicals - 0.6% | | | |
| LyondellBasell Industries NV Class A | | 24,900 | $1,853,058 |
| Electric Utilities - 0.3% | | | |
| Electric Utilities - 0.3% | | | |
| DONG Energy A/S (a) | | 21,100 | 761,085 |
| Energy Equipment & Services - 17.6% | | | |
| Oil & Gas Drilling - 1.3% | | | |
| Nabors Industries Ltd. | | 288,300 | 2,897,415 |
| Odfjell Drilling A/S (a)(b) | | 239,550 | 129,081 |
| Trinidad Drilling Ltd. | | 91,100 | 179,104 |
| Xtreme Drilling & Coil Services Corp. (a) | | 345,800 | 698,586 |
| | | | 3,904,186 |
| Oil & Gas Equipment & Services - 16.3% | | | |
| Baker Hughes, Inc. | | 264,600 | 11,941,398 |
| Bristow Group, Inc. | | 9,700 | 110,677 |
| Dril-Quip, Inc. (a) | | 50,444 | 2,947,443 |
| Exterran Corp. (a) | | 16,900 | 217,165 |
| Frank's International NV (b) | | 216,700 | 3,165,987 |
| Halliburton Co. | | 117,900 | 5,339,691 |
| Newpark Resources, Inc. (a) | | 272,700 | 1,578,933 |
| Oceaneering International, Inc. | | 80,149 | 2,393,249 |
| RigNet, Inc. (a) | | 29,300 | 392,327 |
| Schlumberger Ltd. | | 249,209 | 19,707,445 |
| Superior Energy Services, Inc. | | 39,300 | 723,513 |
| Tesco Corp. | | 68,800 | 460,272 |
| Total Energy Services, Inc. | | 13,800 | 138,433 |
| U.S. Silica Holdings, Inc. | | 4,400 | 151,668 |
| | | | 49,268,201 |
|
| TOTAL ENERGY EQUIPMENT & SERVICES | | | 53,172,387 |
|
| Independent Power and Renewable Electricity Producers - 0.8% | | | |
| Renewable Electricity - 0.8% | | | |
| NextEra Energy Partners LP | | 76,800 | 2,333,184 |
| Metals & Mining - 0.4% | | | |
| Diversified Metals & Mining - 0.4% | | | |
| Hi-Crush Partners LP | | 104,200 | 1,361,894 |
| Oil, Gas & Consumable Fuels - 79.3% | | | |
| Coal & Consumable Fuels - 0.3% | | | |
| CONSOL Energy, Inc. (b) | | 61,500 | 989,535 |
| Integrated Oil & Gas - 6.9% | | | |
| Cenovus Energy, Inc. | | 19,000 | 262,804 |
| Chevron Corp. | | 100,531 | 10,538,665 |
| Exxon Mobil Corp. | | 66,448 | 6,228,836 |
| Occidental Petroleum Corp. | | 40,600 | 3,067,736 |
| Suncor Energy, Inc. | | 32,100 | 890,486 |
| | | | 20,988,527 |
| Oil & Gas Exploration & Production - 58.5% | | | |
| Anadarko Petroleum Corp. | | 236,534 | 12,595,436 |
| Apache Corp. | | 111,000 | 6,179,370 |
| ARC Resources Ltd. (b) | | 20,400 | 349,119 |
| Bankers Petroleum Ltd. (a) | | 111,300 | 177,467 |
| Black Stone Minerals LP | | 38,400 | 595,200 |
| Cabot Oil & Gas Corp. | | 87,800 | 2,259,972 |
| Callon Petroleum Co. (a) | | 130,000 | 1,459,900 |
| Carrizo Oil & Gas, Inc. (a) | | 131,400 | 4,710,690 |
| Cimarex Energy Co. | | 75,587 | 9,019,041 |
| Concho Resources, Inc. (a) | | 51,600 | 6,154,332 |
| ConocoPhillips Co. | | 156,500 | 6,823,400 |
| Continental Resources, Inc. (a)(b) | | 96,600 | 4,373,082 |
| Denbury Resources, Inc. (b) | | 57,700 | 207,143 |
| Devon Energy Corp. | | 112,700 | 4,085,375 |
| Diamondback Energy, Inc. | | 108,800 | 9,923,648 |
| EOG Resources, Inc. | | 224,442 | 18,722,952 |
| EQT Corp. | | 4,300 | 332,949 |
| Evolution Petroleum Corp. | | 15,030 | 82,214 |
| Gran Tierra Energy, Inc. (Canada) (a) | | 121,900 | 409,494 |
| Gulfport Energy Corp. (a) | | 34,300 | 1,072,218 |
| Hess Corp. | | 174,700 | 10,499,470 |
| Marathon Oil Corp. | | 355,500 | 5,336,055 |
| Matador Resources Co. (a)(b) | | 6,400 | 126,720 |
| Murphy Oil Corp. | | 40,600 | 1,289,050 |
| Newfield Exploration Co. (a) | | 326,000 | 14,402,680 |
| Noble Energy, Inc. | | 390,312 | 14,000,491 |
| Oasis Petroleum, Inc. (a) | | 95,500 | 891,970 |
| Parsley Energy, Inc. Class A (a) | | 178,930 | 4,841,846 |
| PDC Energy, Inc. (a) | | 120,934 | 6,967,008 |
| Pioneer Natural Resources Co. | | 44,065 | 6,663,069 |
| QEP Resources, Inc. | | 107,000 | 1,886,410 |
| Range Resources Corp. (b) | | 15,000 | 647,100 |
| Rice Energy, Inc. (a) | | 182,914 | 4,031,425 |
| Ring Energy, Inc. (a) | | 86,900 | 766,458 |
| RSP Permian, Inc. (a) | | 78,100 | 2,724,909 |
| Sanchez Energy Corp. (a)(b) | | 18,900 | 133,434 |
| Seven Generations Energy Ltd. (a) | | 144,300 | 2,754,316 |
| SM Energy Co. | | 178,010 | 4,806,270 |
| Southwestern Energy Co. (a) | | 78,400 | 986,272 |
| TAG Oil Ltd. (a) | | 120,900 | 78,607 |
| Whiting Petroleum Corp. (a) | | 382,100 | 3,538,246 |
| | | | 176,904,808 |
| Oil & Gas Refining & Marketing - 3.4% | | | |
| Keyera Corp. | | 39,700 | 1,214,400 |
| Phillips 66 Co. | | 36,600 | 2,903,844 |
| Valero Energy Corp. | | 98,988 | 5,048,388 |
| World Fuel Services Corp. | | 24,365 | 1,157,094 |
| | | | 10,323,726 |
| Oil & Gas Storage & Transport - 10.2% | | | |
| Cheniere Energy Partners LP Holdings LLC | | 65,400 | 1,303,422 |
| Cheniere Energy, Inc. (a) | | 118,300 | 4,442,165 |
| Enterprise Products Partners LP | | 142,000 | 4,154,920 |
| Gener8 Maritime, Inc. (a) | | 27,900 | 178,560 |
| Golar LNG Ltd. (b) | | 58,800 | 911,400 |
| Kinder Morgan, Inc. | | 375,500 | 7,029,360 |
| Magellan Midstream Partners LP | | 15,370 | 1,168,120 |
| Rice Midstream Partners LP | | 41,400 | 845,802 |
| Shell Midstream Partners LP | | 28,500 | 963,015 |
| Targa Resources Corp. | | 64,100 | 2,701,174 |
| Teekay LNG Partners LP | | 20,900 | 235,125 |
| The Williams Companies, Inc. | | 285,000 | 6,164,550 |
| Williams Partners LP | | 20,600 | 713,584 |
| | | | 30,811,197 |
|
| TOTAL OIL, GAS & CONSUMABLE FUELS | | | 240,017,793 |
|
| TOTAL COMMON STOCKS | | | |
| (Cost $265,312,407) | | | 299,499,401 |
|
| Money Market Funds - 3.5% | | | |
| Fidelity Cash Central Fund, 0.43% (c) | | 3,517,614 | 3,517,614 |
| Fidelity Securities Lending Cash Central Fund, 0.46% (c)(d) | | 7,156,315 | 7,156,315 |
| TOTAL MONEY MARKET FUNDS | | | |
| (Cost $10,673,929) | | | 10,673,929 |
| TOTAL INVESTMENT PORTFOLIO - 102.5% | | | |
| (Cost $275,986,336) | | | 310,173,330 |
| NET OTHER ASSETS (LIABILITIES) - (2.5)% | | | (7,659,631) |
| NET ASSETS - 100% | | | $302,513,699 |
Legend
(a) Non-income producing
(b) Security or a portion of the security is on loan at period end.
(c) Affiliated fund that is generally available only to investment companies and other accounts managed by Fidelity Investments. The rate quoted is the annualized seven-day yield of the fund at period end. A complete unaudited listing of the fund's holdings as of its most recent quarter end is available upon request. In addition, each Fidelity Central Fund's financial statements are available on the SEC's website or upon request.
(d) Investment made with cash collateral received from securities on loan.
Affiliated Central Funds
Information regarding fiscal year to date income earned by the Fund from investments in Fidelity Central Funds is as follows:
| Fund | Income earned |
| Fidelity Cash Central Fund | $5,955 |
| Fidelity Securities Lending Cash Central Fund | 19,000 |
| Total | $24,955 |
Investment Valuation
The following is a summary of the inputs used, as of June 30, 2016, involving the Fund's assets and liabilities carried at fair value. The inputs or methodology used for valuing securities may not be an indication of the risk associated with investing in those securities. For more information on valuation inputs, and their aggregation into the levels used below, please refer to the Investment Valuation section in the accompanying Notes to Financial Statements.
| | Valuation Inputs at Reporting Date: |
| Description | Total | Level 1 | Level 2 | Level 3 |
| Investments in Securities: | | | | |
| Common Stocks | $299,499,401 | $298,609,235 | $890,166 | $-- |
| Money Market Funds | 10,673,929 | 10,673,929 | -- | -- |
| Total Investments in Securities: | $310,173,330 | $309,283,164 | $890,166 | $-- |
Other Information
Distribution of investments by country or territory of incorporation, as a percentage of Total Net Assets, is as follows (Unaudited):
| United States of America | 87.7% |
| Curacao | 6.5% |
| Canada | 2.4% |
| Netherlands | 1.6% |
| Bermuda | 1.3% |
| Others (Individually Less Than 1%) | 0.5% |
| | 100.0% |
See accompanying notes which are an integral part of the financial statements.
Financial Statements
Statement of Assets and Liabilities
| | | June 30, 2016 (Unaudited) |
| Assets | | |
Investment in securities, at value (including securities loaned of $6,881,650) — See accompanying schedule:
Unaffiliated issuers (cost $265,312,407) | $299,499,401 | |
| Fidelity Central Funds (cost $10,673,929) | 10,673,929 | |
| Total Investments (cost $275,986,336) | | $310,173,330 |
| Cash | | 42,744 |
| Foreign currency held at value (cost $625) | | 625 |
| Receivable for investments sold | | 1,035,794 |
| Receivable for fund shares sold | | 76,117 |
| Dividends receivable | | 193,803 |
| Distributions receivable from Fidelity Central Funds | | 2,641 |
| Prepaid expenses | | 195 |
| Other receivables | | 9,694 |
| Total assets | | 311,534,943 |
| Liabilities | | |
| Payable for investments purchased | $1,550,398 | |
| Payable for fund shares redeemed | 89,610 | |
| Accrued management fee | 137,835 | |
| Distribution and service plan fees payable | 26,032 | |
| Other affiliated payables | 34,796 | |
| Other payables and accrued expenses | 26,258 | |
| Collateral on securities loaned, at value | 7,156,315 | |
| Total liabilities | | 9,021,244 |
| Net Assets | | $302,513,699 |
| Net Assets consist of: | | |
| Paid in capital | | $332,002,681 |
| Undistributed net investment income | | 880,508 |
| Accumulated undistributed net realized gain (loss) on investments and foreign currency transactions | | (64,556,463) |
| Net unrealized appreciation (depreciation) on investments and assets and liabilities in foreign currencies | | 34,186,973 |
| Net Assets | | $302,513,699 |
| Initial Class: | | |
| Net Asset Value, offering price and redemption price per share ($53,097,895 ÷ 2,934,525 shares) | | $18.09 |
| Service Class 2: | | |
| Net Asset Value, offering price and redemption price per share ($125,495,179 ÷ 6,973,010 shares) | | $18.00 |
| Investor Class: | | |
| Net Asset Value, offering price and redemption price per share ($123,920,625 ÷ 6,862,994 shares) | | $18.06 |
See accompanying notes which are an integral part of the financial statements.
Statement of Operations
| | | Six months ended June 30, 2016 (Unaudited) |
| Investment Income | | |
| Dividends | | $2,045,935 |
| Income from Fidelity Central Funds | | 24,955 |
| Total income | | 2,070,890 |
| Expenses | | |
| Management fee | $714,206 | |
| Transfer agent fees | 129,135 | |
| Distribution and service plan fees | 132,570 | |
| Accounting and security lending fees | 51,338 | |
| Custodian fees and expenses | 15,984 | |
| Independent trustees' fees and expenses | 2,761 | |
| Audit | 20,640 | |
| Legal | 1,366 | |
| Miscellaneous | 1,470 | |
| Total expenses before reductions | 1,069,470 | |
| Expense reductions | (21,705) | 1,047,765 |
| Net investment income (loss) | | 1,023,125 |
| Realized and Unrealized Gain (Loss) | | |
| Net realized gain (loss) on: | | |
| Investment securities: | | |
| Unaffiliated issuers | (22,387,883) | |
| Foreign currency transactions | 1,701 | |
| Total net realized gain (loss) | | (22,386,182) |
Change in net unrealized appreciation (depreciation) on:
Investment securities | 61,711,620 | |
| Assets and liabilities in foreign currencies | (38) | |
| Total change in net unrealized appreciation (depreciation) | | 61,711,582 |
| Net gain (loss) | | 39,325,400 |
| Net increase (decrease) in net assets resulting from operations | | $40,348,525 |
See accompanying notes which are an integral part of the financial statements.
Statement of Changes in Net Assets
| | Six months ended June 30, 2016 (Unaudited) | Year ended December 31, 2015 |
| Increase (Decrease) in Net Assets | | |
| Operations | | |
| Net investment income (loss) | $1,023,125 | $3,231,077 |
| Net realized gain (loss) | (22,386,182) | (34,613,566) |
| Change in net unrealized appreciation (depreciation) | 61,711,582 | (33,356,756) |
| Net increase (decrease) in net assets resulting from operations | 40,348,525 | (64,739,245) |
| Distributions to shareholders from net investment income | – | (3,145,334) |
| Distributions to shareholders from net realized gain | – | (8,790,082) |
| Total distributions | – | (11,935,416) |
| Share transactions - net increase (decrease) | 19,581,201 | 30,868,032 |
| Redemption fees | 29,052 | 90,979 |
| Total increase (decrease) in net assets | 59,958,778 | (45,715,650) |
| Net Assets | | |
| Beginning of period | 242,554,921 | 288,270,571 |
| End of period | $302,513,699 | $242,554,921 |
| Other Information | | |
| Undistributed net investment income end of period | $880,508 | $– |
| Distributions in excess of net investment income end of period | $– | $(142,617) |
See accompanying notes which are an integral part of the financial statements.
Financial Highlights — VIP Energy Portfolio Initial Class
| | Six months ended (Unaudited) June 30, | Years ended December 31, | | | | |
| | 2016 | 2015 | 2014 | 2013 | 2012 | 2011 |
| Selected Per–Share Data | | | | | | |
| Net asset value, beginning of period | $15.57 | $20.45 | $23.95 | $19.53 | $18.81 | $20.05 |
| Income from Investment Operations | | | | | | |
| Net investment income (loss)A | .07 | .24 | .22 | .20 | .19 | .21 |
| Net realized and unrealized gain (loss) | 2.45 | (4.30) | (3.23) | 4.58 | .74 | (1.23) |
| Total from investment operations | 2.52 | (4.06) | (3.01) | 4.78 | .93 | (1.02) |
| Distributions from net investment income | – | (.23) | (.23) | (.22) | (.21) | (.23) |
| Distributions from net realized gain | – | (.60) | (.28) | (.14) | – | – |
| Total distributions | – | (.83) | (.50)B | (.36) | (.21) | (.23) |
| Redemption fees added to paid in capitalA | –C | .01 | .01 | –C | –C | .01 |
| Net asset value, end of period | $18.09 | $15.57 | $20.45 | $23.95 | $19.53 | $18.81 |
| Total ReturnD,E,F | 16.18% | (20.54)% | (12.59)% | 24.55% | 4.94% | (4.99)% |
| Ratios to Average Net AssetsG,H | | | | | | |
| Expenses before reductions | .68%I | .68% | .68% | .70% | .69% | .69% |
| Expenses net of fee waivers, if any | .68%I | .68% | .67% | .69% | .69% | .69% |
| Expenses net of all reductions | .67%I | .67% | .67% | .69% | .68% | .68% |
| Net investment income (loss) | .92%I | 1.25% | .91% | .88% | .98% | 1.00% |
| Supplemental Data | | | | | | |
| Net assets, end of period (000 omitted) | $53,098 | $46,360 | $70,828 | $94,202 | $96,822 | $126,723 |
| Portfolio turnover rateJ | 107%I | 70% | 99% | 90% | 81% | 94% |
A Calculated based on average shares outstanding during the period.
B Total distributions of $.50 per share is comprised of distributions from net investment income of $.227 and distributions from net realized gain of $.273 per share.
C Amount represents less than $.005 per share.
D Total returns for periods of less than one year are not annualized.
E Total returns do not reflect charges attributable to your insurance company's separate account. Inclusion of these charges would reduce the total returns shown.
F Total returns would have been lower if certain expenses had not been reduced during the applicable periods shown.
G Fees and expenses of any underlying Fidelity Central Funds are not included in the Fund's expense ratio. The Fund indirectly bears its proportionate share of the expenses of any underlying Fidelity Central Funds.
H Expense ratios reflect operating expenses of the class. Expenses before reductions do not reflect amounts reimbursed by the investment adviser or reductions from brokerage service arrangements or reductions from other expense offset arrangements and do not represent the amount paid by the class during periods when reimbursements or reductions occur. Expenses net of fee waivers reflect expenses after reimbursement by the investment adviser but prior to reductions from brokerage service arrangements or other expense offset arrangements. Expenses net of all reductions represent the net expenses paid by the class.
I Annualized
J Amount does not include the portfolio activity of any underlying Fidelity Central Funds.
See accompanying notes which are an integral part of the financial statements.
Financial Highlights — VIP Energy Portfolio Service Class 2
| | Six months ended (Unaudited) June 30, | Years ended December 31, | | | | |
| | 2016 | 2015 | 2014 | 2013 | 2012 | 2011 |
| Selected Per–Share Data | | | | | | |
| Net asset value, beginning of period | $15.51 | $20.37 | $23.83 | $19.44 | $18.72 | $19.94 |
| Income from Investment Operations | | | | | | |
| Net investment income (loss)A | .05 | .19 | .16 | .14 | .14 | .16 |
| Net realized and unrealized gain (loss) | 2.44 | (4.28) | (3.19) | 4.55 | .73 | (1.21) |
| Total from investment operations | 2.49 | (4.09) | (3.03) | 4.69 | .87 | (1.05) |
| Distributions from net investment income | – | (.18) | (.16) | (.16) | (.15) | (.18) |
| Distributions from net realized gain | – | (.60) | (.28) | (.14) | – | – |
| Total distributions | – | (.78) | (.44) | (.30) | (.15) | (.18) |
| Redemption fees added to paid in capitalA | –B | .01 | .01 | –B | –B | .01 |
| Net asset value, end of period | $18.00 | $15.51 | $20.37 | $23.83 | $19.44 | $18.72 |
| Total ReturnC,D,E | 16.05% | (20.75)% | (12.76)% | 24.21% | 4.68% | (5.20)% |
| Ratios to Average Net AssetsF,G | | | | | | |
| Expenses before reductions | .93%H | .93% | .93% | .94% | .94% | .94% |
| Expenses net of fee waivers, if any | .93%H | .93% | .92% | .94% | .94% | .93% |
| Expenses net of all reductions | .92%H | .92% | .92% | .94% | .93% | .93% |
| Net investment income (loss) | .67%H | 1.00% | .66% | .64% | .74% | .75% |
| Supplemental Data | | | | | | |
| Net assets, end of period (000 omitted) | $125,495 | $97,286 | $116,228 | $130,100 | $112,819 | $127,187 |
| Portfolio turnover rateI | 107%H | 70% | 99% | 90% | 81% | 94% |
A Calculated based on average shares outstanding during the period.
B Amount represents less than $.005 per share.
C Total returns for periods of less than one year are not annualized.
D Total returns do not reflect charges attributable to your insurance company's separate account. Inclusion of these charges would reduce the total returns shown.
E Total returns would have been lower if certain expenses had not been reduced during the applicable periods shown.
F Fees and expenses of any underlying Fidelity Central Funds are not included in the Fund's expense ratio. The Fund indirectly bears its proportionate share of the expenses of any underlying Fidelity Central Funds.
G Expense ratios reflect operating expenses of the class. Expenses before reductions do not reflect amounts reimbursed by the investment adviser or reductions from brokerage service arrangements or reductions from other expense offset arrangements and do not represent the amount paid by the class during periods when reimbursements or reductions occur. Expenses net of fee waivers reflect expenses after reimbursement by the investment adviser but prior to reductions from brokerage service arrangements or other expense offset arrangements. Expenses net of all reductions represent the net expenses paid by the class.
H Annualized
I Amount does not include the portfolio activity of any underlying Fidelity Central Funds.
See accompanying notes which are an integral part of the financial statements.
Financial Highlights — VIP Energy Portfolio Investor Class
| | Six months ended (Unaudited) June 30, | Years ended December 31, | | | | |
| | 2016 | 2015 | 2014 | 2013 | 2012 | 2011 |
| Selected Per–Share Data | | | | | | |
| Net asset value, beginning of period | $15.55 | $20.42 | $23.90 | $19.49 | $18.77 | $20.01 |
| Income from Investment Operations | | | | | | |
| Net investment income (loss)A | .07 | .22 | .20 | .18 | .17 | .19 |
| Net realized and unrealized gain (loss) | 2.44 | (4.29) | (3.21) | 4.57 | .74 | (1.23) |
| Total from investment operations | 2.51 | (4.07) | (3.01) | 4.75 | .91 | (1.04) |
| Distributions from net investment income | – | (.22) | (.20) | (.20) | (.19) | (.21) |
| Distributions from net realized gain | – | (.60) | (.28) | (.14) | – | – |
| Total distributions | – | (.81)B | (.48) | (.34) | (.19) | (.21) |
| Redemption fees added to paid in capitalA | –C | .01 | .01 | –C | –C | .01 |
| Net asset value, end of period | $18.06 | $15.55 | $20.42 | $23.90 | $19.49 | $18.77 |
| Total ReturnD,E,F | 16.14% | (20.58)% | (12.65)% | 24.45% | 4.86% | (5.09)% |
| Ratios to Average Net AssetsG,H | | | | | | |
| Expenses before reductions | .76%I | .76% | .76% | .78% | .77% | .77% |
| Expenses net of fee waivers, if any | .76%I | .76% | .75% | .77% | .77% | .77% |
| Expenses net of all reductions | .75%I | .75% | .75% | .77% | .76% | .77% |
| Net investment income (loss) | .84%I | 1.17% | .83% | .80% | .90% | .92% |
| Supplemental Data | | | | | | |
| Net assets, end of period (000 omitted) | $123,921 | $98,909 | $101,214 | $108,077 | $92,334 | $107,479 |
| Portfolio turnover rateJ | 107%I | 70% | 99% | 90% | 81% | 94% |
A Calculated based on average shares outstanding during the period.
B Total distributions of $.81 per share is comprised of distributions from net investment income of $.215 and distributions from net realized gain of $.599 per share.
C Amount represents less than $.005 per share.
D Total returns for periods of less than one year are not annualized.
E Total returns do not reflect charges attributable to your insurance company's separate account. Inclusion of these charges would reduce the total returns shown.
F Total returns would have been lower if certain expenses had not been reduced during the applicable periods shown.
G Fees and expenses of any underlying Fidelity Central Funds are not included in the Fund's expense ratio. The Fund indirectly bears its proportionate share of the expenses of any underlying Fidelity Central Funds.
H Expense ratios reflect operating expenses of the class. Expenses before reductions do not reflect amounts reimbursed by the investment adviser or reductions from brokerage service arrangements or reductions from other expense offset arrangements and do not represent the amount paid by the class during periods when reimbursements or reductions occur. Expenses net of fee waivers reflect expenses after reimbursement by the investment adviser but prior to reductions from brokerage service arrangements or other expense offset arrangements. Expenses net of all reductions represent the net expenses paid by the class.
I Annualized
J Amount does not include the portfolio activity of any underlying Fidelity Central Funds.
See accompanying notes which are an integral part of the financial statements.
Notes to Financial Statements (Unaudited)
For the period ended June 30, 2016
1. Organization.
VIP Energy Portfolio (the Fund) is a non-diversified fund of Variable Insurance Products Fund IV (the Trust) and is authorized to issue an unlimited number of shares. The Trust is registered under the Investment Company Act of 1940, as amended (the 1940 Act), as an open-end management investment company organized as a Massachusetts business trust. Shares of the Fund may only be purchased by insurance companies for the purpose of funding variable annuity or variable life insurance contracts. The Fund offers the following classes of shares: Initial Class shares, Service Class 2 shares and Investor Class shares. All classes have equal rights and voting privileges, except for matters affecting a single class.
2. Investments in Fidelity Central Funds.
The Fund invests in Fidelity Central Funds, which are open-end investment companies generally available only to other investment companies and accounts managed by the investment adviser and its affiliates. The Fund's Schedule of Investments lists each of the Fidelity Central Funds held as of period end, if any, as an investment of the Fund, but does not include the underlying holdings of each Fidelity Central Fund. As an Investing Fund, the Fund indirectly bears its proportionate share of the expenses of the underlying Fidelity Central Funds.
The Money Market Central Funds seek preservation of capital and current income and are managed by Fidelity Investments Money Management, Inc. (FIMM), an affiliate of the investment adviser. Annualized expenses of the Money Market Central Funds as of their most recent shareholder report date are less than .005%.
A complete unaudited list of holdings for each Fidelity Central Fund is available upon request or at the Securities and Exchange Commission (the SEC) website at www.sec.gov. In addition, the financial statements of the Fidelity Central Funds are available on the SEC website or upon request.
3. Significant Accounting Policies.
The financial statements have been prepared in conformity with accounting principles generally accepted in the United States of America (GAAP), which require management to make certain estimates and assumptions at the date of the financial statements. Actual results could differ from those estimates. Subsequent events, if any, through the date that the financial statements were issued have been evaluated in the preparation of the financial statements. The following summarizes the significant accounting policies of the Fund:
Investment Valuation. Investments are valued as of 4:00 p.m. Eastern time on the last calendar day of the period. The Board of Trustees (the Board) has delegated the day to day responsibility for the valuation of the Fund's investments to the Fidelity SelectCo, LLC (SelectCo) Fair Value Committee (the Committee). In accordance with valuation policies and procedures approved by the Board, the Fund attempts to obtain prices from one or more third party pricing vendors or brokers to value its investments. When current market prices, quotations or currency exchange rates are not readily available or reliable, investments will be fair valued in good faith by the Committee, in accordance with procedures adopted by the Board. Factors used in determining fair value vary by investment type and may include market or investment specific events. The frequency with which these procedures are used cannot be predicted and they may be utilized to a significant extent. The Committee oversees the Fund's valuation policies and procedures and reports to the Board on the Committee's activities and fair value determinations. The Board monitors the appropriateness of the procedures used in valuing the Fund's investments and ratifies the fair value determinations of the Committee.
The Fund categorizes the inputs to valuation techniques used to value its investments into a disclosure hierarchy consisting of three levels as shown below:
- Level 1 – quoted prices in active markets for identical investments
- Level 2 – other significant observable inputs (including quoted prices for similar investments, interest rates, prepayment speeds, etc.)
- Level 3 – unobservable inputs (including the Fund's own assumptions based on the best information available)
Valuation techniques used to value the Fund's investments by major category are as follows:
Equity securities, including restricted securities, for which market quotations are readily available, are valued at the last reported sale price or official closing price as reported by a third party pricing vendor on the primary market or exchange on which they are traded and are categorized as Level 1 in the hierarchy. In the event there were no sales during the day or closing prices are not available, securities are valued at the last quoted bid price or may be valued using the last available price and are generally categorized as Level 2 in the hierarchy. For foreign equity securities, when market or security specific events arise, comparisons to the valuation of American Depositary Receipts (ADRs), futures contracts, Exchange-Traded Funds (ETFs) and certain indexes as well as quoted prices for similar securities may be used and would be categorized as Level 2 in the hierarchy. Utilizing these techniques may result in transfers between Level 1 and Level 2. For equity securities, including restricted securities, where observable inputs are limited, assumptions about market activity and risk are used and these securities may be categorized as Level 3 in the hierarchy.
Investments in open-end mutual funds, including the Fidelity Central Funds, are valued at their closing net asset value (NAV) each business day and are categorized as Level 1 in the hierarchy.
Changes in valuation techniques may result in transfers in or out of an assigned level within the disclosure hierarchy. The aggregate value of investments by input level as of June 30, 2016 is included at the end of the Fund's Schedule of Investments.
Foreign Currency. The Fund may use foreign currency contracts to facilitate transactions in foreign-denominated securities. Gains and losses from these transactions may arise from changes in the value of the foreign currency or if the counterparties do not perform under the contracts' terms.
Foreign-denominated assets, including investment securities, and liabilities are translated into U.S. dollars at the exchange rates at period end. Purchases and sales of investment securities, income and dividends received and expenses denominated in foreign currencies are translated into U.S. dollars at the exchange rate in effect on the transaction date.
The effects of exchange rate fluctuations on investments are included with the net realized and unrealized gain (loss) on investment securities. Other foreign currency transactions resulting in realized and unrealized gain (loss) are disclosed separately.
Investment Transactions and Income. For financial reporting purposes, the Fund's investment holdings and NAV include trades executed through the end of the last business day of the period. The NAV per share for processing shareholder transactions is calculated as of the close of business of the New York Stock Exchange (NYSE), normally 4:00 p.m. Eastern time and includes trades executed through the end of the prior business day. Gains and losses on securities sold are determined on the basis of identified cost and may include proceeds received from litigation. Dividend income is recorded on the ex-dividend date, except for certain dividends from foreign securities where the ex-dividend date may have passed, which are recorded as soon as the Fund is informed of the ex-dividend date. Income and capital gain distributions from Fidelity Central Funds, if any, are recorded on the ex-dividend date. Non-cash dividends included in dividend income, if any, are recorded at the fair market value of the securities received. Distributions received on securities that represent a return of capital or capital gain are recorded as a reduction of cost of investments and/or as a realized gain. Subsequent to ex-dividend date the Fund determines the components of these distributions, based upon receipt of tax filings or other correspondence relating to the underlying investment. Investment income is recorded net of foreign taxes withheld where recovery of such taxes is uncertain.
Class Allocations and Expenses. Investment income, realized and unrealized capital gains and losses, common expenses of the Fund, and certain fund-level expense reductions, if any, are allocated daily on a pro-rata basis to each class based on the relative net assets of each class to the total net assets of the Fund. Each class differs with respect to transfer agent and distribution and service plan fees incurred. Certain expense reductions may also differ by class. For the reporting period, the allocated portion of income and expenses to each class as a percent of its average net assets may vary due to the timing of recording these transactions in relation to fluctuating net assets of the classes. Expenses directly attributable to a fund are charged to that fund. Expenses attributable to more than one fund are allocated among the respective funds on the basis of relative net assets or other appropriate methods. Expense estimates are accrued in the period to which they relate and adjustments are made when actual amounts are known.
Income Tax Information and Distributions to Shareholders. Each year, the Fund intends to qualify as a regulated investment company under Subchapter M of the Internal Revenue Code, including distributing substantially all of its taxable income and realized gains. As a result, no provision for U.S. Federal income taxes is required. The Fund files a U.S. federal tax return, in addition to state and local tax returns as required. The Fund's federal income tax returns are subject to examination by the Internal Revenue Service (IRS) for a period of three fiscal years after they are filed. State and local tax returns may be subject to examination for an additional fiscal year depending on the jurisdiction. Foreign taxes are provided for based on the Fund's understanding of the tax rules and rates that exist in the foreign markets in which it invests.
Distributions are declared and recorded on the ex-dividend date. Income dividends and capital gain distributions are declared separately for each class. Income and capital gain distributions are determined in accordance with income tax regulations, which may differ from GAAP.
Capital accounts within the financial statements are adjusted for permanent book-tax differences. These adjustments have no impact on net assets or the results of operations. Capital accounts are not adjusted for temporary book-tax differences which will reverse in a subsequent period.
Book-tax differences are primarily due to foreign currency transactions, partnerships, capital loss carryforwards and losses deferred due to wash sales and excise tax regulations.
The federal tax cost of investment securities and unrealized appreciation (depreciation) as of period end were as follows:
| Gross unrealized appreciation | $49,247,742 |
| Gross unrealized depreciation | (24,320,866) |
| Net unrealized appreciation (depreciation) on securities | $24,926,876 |
| Tax cost | $285,246,454 |
Capital loss carryforwards are only available to offset future capital gains of the Fund to the extent provided by regulations and may be limited. Under the Regulated Investment Company Modernization Act of 2010 (the Act), the Fund is permitted to carry forward capital losses incurred in taxable years beginning after December 22, 2010 for an unlimited period and such capital losses are required to be used prior to any losses that expire. The capital loss carryforward information presented below, including any applicable limitation, is estimated as of prior fiscal period end and is subject to adjustment.
| No expiration | |
| Short-term | (29,233,499) |
| Long-term | (11,238,987) |
| Total capital loss carryforward | $(40,472,486) |
Trading (Redemption) Fees. Shares held by investors less than 60 days may be subject to a redemption fee equal to 1% of the NAV of shares redeemed. All redemption fees, which reduce the proceeds of the shareholder redemption, are retained by the Fund and accounted for as an addition to paid in capital.
4. Purchases and Sales of Investments.
Purchases and sales of securities, other than short-term securities, aggregated $161,402,774 and $140,593,512, respectively.
5. Fees and Other Transactions with Affiliates.
Management Fee. Fidelity SelectCo, LLC (the investment adviser) and its affiliates provide the Fund with investment management related services for which the Fund pays a monthly management fee. The management fee is the sum of an individual fund fee rate that is based on an annual rate of .30% of the Fund's average net assets and an annualized group fee rate that averaged .25% during the period. The group fee rate is based upon the average net assets of all the mutual funds advised by Fidelity Management & Research Company (FMR) and the investment adviser. The group fee rate decreases as assets under management increase and increases as assets under management decrease. For the reporting period, the total annualized management fee rate was .55% of the Fund's average net assets.
Distribution and Service Plan Fees. In accordance with Rule 12b-1 of the 1940 Act, the Fund has adopted a separate 12b-1 Plan for Service Class 2 shares. Service Class 2 pays Fidelity Distributors Corporation (FDC), an affiliate of the investment adviser, a service fee. For the period, the service fee is based on an annual rate of .25% of Service Class 2's average net assets.
For the period, total fees for Service Class 2, all of which was re-allowed to insurance companies for the distribution of shares and providing shareholder support services were $132,570.
Transfer Agent Fees. Fidelity Investments Institutional Operations Company, Inc. (FIIOC), an affiliate of the investment adviser, is the Fund's transfer, dividend disbursing, and shareholder servicing agent. FIIOC receives an asset-based fee with respect to each class. Each class (with the exception of Investor Class) pays a fee for transfer agent services, typesetting, and printing and mailing of shareholder reports, excluding mailing of proxy statements, equal to an annual rate of .07% (.15% for Investor Class) of class-level average net assets. For the period, transfer agent fees for each class were as follows:
| Initial Class | $15,516 |
| Service Class 2 | 34,999 |
| Investor Class | 78,620 |
| | $129,135 |
Accounting and Security Lending Fees. Fidelity Service Company, Inc. (FSC), an affiliate of the investment adviser, maintains the Fund's accounting records. The accounting fee is based on the level of average net assets for each month. Under a separate contract, FSC administers the security lending program. The security lending fee is based on the number and duration of lending transactions.
Brokerage Commissions. The Fund placed a portion of its portfolio transactions with brokerage firms which are affiliates of the investment adviser. Brokerage commissions are included in net realized gain (loss) and change in net unrealized appreciation (depreciation) in the Statement of Operations. The commissions paid to these affiliated firms were $5,917 for the period.
Interfund Trades. The Fund may purchase from or sell securities to other Fidelity Funds under procedures adopted by the Board. The procedures have been designed to ensure these interfund trades are executed in accordance with Rule 17a-7 of the 1940 Act. Interfund trades are included within the respective purchases and sales amounts shown in the Purchases and Sales of Investments note.
6. Committed Line of Credit.
The Fund participates with other funds managed by the investment adviser or an affiliate in a $4.25 billion credit facility (the "line of credit") to be utilized for temporary or emergency purposes to fund shareholder redemptions or for other short-term liquidity purposes. The Fund has agreed to pay commitment fees on its pro-rata portion of the line of credit, which amounted to $215 and is reflected in Miscellaneous expenses on the Statement of Operations. During the period, the Fund did not borrow on this line of credit.
7. Security Lending.
The Fund lends portfolio securities through a lending agent from time to time in order to earn additional income. On the settlement date of the loan, the Fund receives collateral (in the form of U.S. Treasury obligations, letters of credit and/or cash) against the loaned securities and maintains collateral in an amount not less than 100% of the market value of the loaned securities during the period of the loan. The market value of the loaned securities is determined at the close of business of the Fund and any additional required collateral is delivered to the Fund on the next business day. The Fund or borrower may terminate the loan at any time, and if the borrower defaults on its obligation to return the securities loaned because of insolvency or other reasons, the Fund may apply collateral received from the borrower against the obligation. The Fund may experience delays and costs in recovering the securities loaned. Any cash collateral received is invested in the Fidelity Securities Lending Cash Central Fund. The value of loaned securities and cash collateral at period end are disclosed on the Fund's Statement of Assets and Liabilities. Security lending income represents the income earned on investing cash collateral, less rebates paid to borrowers and any lending agent fees associated with the loan, plus any premium payments received for lending certain types of securities. Security lending income is presented in the Statement of Operations as a component of income from Fidelity Central Funds. Total security lending income during the period amounted to $19,000.
8. Expense Reductions.
Commissions paid to certain brokers with whom the investment adviser, or its affiliates, places trades on behalf of the Fund include an amount in addition to trade execution, which may be rebated back to the Fund to offset certain expenses. This amount totaled $20,814 for the period.
In addition, during the period the investment adviser reimbursed and/or waived a portion of fund-level operating expenses in the amount of $891.
9. Distributions to Shareholders.
Distributions to shareholders of each class were as follows:
| | Six months ended
June 30, 2016 | Year ended December 31, 2015 |
| From net investment income | | |
| Initial Class | $– | $671,471 |
| Service Class 2 | – | 1,125,062 |
| Investor Class | – | 1,348,801 |
| Total | $– | $3,145,334 |
| From net realized gain | | |
| Initial Class | $– | $2,006,215 |
| Service Class 2 | – | 3,490,558 |
| Investor Class | – | 3,293,309 |
| Total | $– | $8,790,082 |
10. Share Transactions.
Transactions for each class of shares were as follows:
| | Shares | Shares | Dollars | Dollars |
| | Six months ended
June 30, 2016 | Year ended December 31, 2015 | Six months ended
June 30, 2016 | Year ended December 31, 2015 |
| Initial Class | | | | |
| Shares sold | 248,085 | 318,964 | $4,146,764 | $6,258,167 |
| Reinvestment of distributions | – | 138,900 | – | 2,677,686 |
| Shares redeemed | (290,606) | (943,712) | (4,472,408) | (17,847,770) |
| Net increase (decrease) | (42,521) | (485,848) | $(325,644) | $(8,911,917) |
| Service Class 2 | | | | |
| Shares sold | 1,109,403 | 1,207,923 | $18,267,538 | $23,068,062 |
| Reinvestment of distributions | – | 240,121 | – | 4,615,620 |
| Shares redeemed | (409,518) | (881,739) | (6,504,866) | (16,309,856) |
| Net increase (decrease) | 699,885 | 566,305 | $11,762,672 | $11,373,826 |
| Investor Class | | | | |
| Shares sold | 1,038,956 | 2,321,424 | $17,008,030 | $45,120,504 |
| Reinvestment of distributions | – | 244,179 | – | 4,642,110 |
| Shares redeemed | (538,294) | (1,159,593) | (8,863,857) | (21,356,491) |
| Net increase (decrease) | 500,662 | 1,406,010 | $8,144,173 | $28,406,123 |
11. Other.
The Fund's organizational documents provide former and current trustees and officers with a limited indemnification against liabilities arising in connection with the performance of their duties to the Fund. In the normal course of business, the Fund may also enter into contracts that provide general indemnifications. The Fund's maximum exposure under these arrangements is unknown as this would be dependent on future claims that may be made against the Fund. The risk of material loss from such claims is considered remote.
At the end of the period, the investment adviser or its affiliates were the owners of record of 58% of the total outstanding shares of the Fund and one otherwise unaffiliated shareholder was the owner of record of 40% of the total outstanding shares of Fund.
Shareholder Expense Example
As a shareholder of the Fund, you incur two types of costs: (1) transaction costs, including redemption fees and (2) ongoing costs, including management fees, distribution and/or service (12b-1) fees and other Fund expenses. This Example is intended to help you understand your ongoing costs (in dollars) of investing in the Fund and to compare these costs with the ongoing costs of investing in other mutual funds.
The Example is based on an investment of $1,000 invested at the beginning of the period and held for the entire period (January 1, 2016 to June 30, 2016).
Actual Expenses
The first line of the accompanying table for each class of the Fund provides information about actual account values and actual expenses. You may use the information in this line, together with the amount you invested, to estimate the expenses that you paid over the period. Simply divide your account value by $1,000.00 (for example, an $8,600 account value divided by $1,000.00 = 8.6), then multiply the result by the number in the first line for a class of the Fund under the heading entitled "Expenses Paid During Period" to estimate the expenses you paid on your account during this period. The estimate of expenses does not include any fees or other expenses of any variable annuity or variable life insurance product. If they were, the estimate of expenses you paid during the period would be higher, and your ending account value would be lower. In addition, the Fund, as a shareholder in the underlying Fidelity Central Funds, will indirectly bear its pro-rata share of the fees and expenses incurred by the underlying Fidelity Central Funds. These fees and expenses are not included in the Fund's annualized expense ratio used to calculate the expense estimate in the table below.
Hypothetical Example for Comparison Purposes
The second line of the accompanying table for each class of the Fund provides information about hypothetical account values and hypothetical expenses based on a Class' actual expense ratio and an assumed rate of return of 5% per year before expenses, which is not the Class' actual return. The hypothetical account values and expenses may not be used to estimate the actual ending account balance or expenses you paid for the period. You may use this information to compare the ongoing costs of investing in the Fund and other funds. To do so, compare this 5% hypothetical example with the 5% hypothetical examples that appear in the shareholder reports of the other funds. The estimate of expenses does not include any fees or other expenses of any variable annuity or variable life insurance product. If they were, the estimate of expenses you paid during the period would be higher, and your ending account value would be lower. In addition, the Fund, as a shareholder in the underlying Fidelity Central Funds, will indirectly bear its pro-rata share of the fees and expenses incurred by the underlying Fidelity Central Funds. These fees and expenses are not included in the Fund's annualized expense ratio used to calculate the expense estimate in the table below.
Please note that the expenses shown in the table are meant to highlight your ongoing costs only and do not reflect any transaction costs. Therefore, the second line of the table is useful in comparing ongoing costs only, and will not help you determine the relative total costs of owning different funds. In addition, if these transactional costs were included, your costs would have been higher.
| | Annualized Expense Ratio-A | Beginning
Account Value
January 1, 2016 | Ending
Account Value
June 30, 2016 | Expenses Paid
During Period-B
January 1, 2016
to June 30, 2016 |
| Initial Class | .68% | | | |
| Actual | | $1,000.00 | $1,161.80 | $3.65 |
| Hypothetical-C | | $1,000.00 | $1,021.48 | $3.42 |
| Service Class 2 | .93% | | | |
| Actual | | $1,000.00 | $1,160.50 | $5.00 |
| Hypothetical-C | | $1,000.00 | $1,020.24 | $4.67 |
| Investor Class | .76% | | | |
| Actual | | $1,000.00 | $1,161.40 | $4.08 |
| Hypothetical-C | | $1,000.00 | $1,021.08 | $3.82 |
A Annualized expense ratio reflects expenses net of applicable fee waivers.
B Expenses are equal to each Class' annualized expense ratio, multiplied by the average account value over the period, multiplied by 182/366 (to reflect the one-half year period).
C 5% return per year before expenses
Board Approval of Investment Advisory Contracts and Management Fees
VIP Energy Portfolio
Each year, the Board of Trustees, including the Independent Trustees (together, the Board), votes on the renewal of the management contract with Fidelity SelectCo, LLC (SelectCo), an affiliate of Fidelity Management & Research Company (FMR), and the sub-advisory agreements with affiliates of FMR (together, the Advisory Contracts) for the fund. The Board, assisted by the advice of fund counsel and Independent Trustees' counsel, requests and considers a broad range of information relevant to the renewal of the Advisory Contracts throughout the year.
The Board meets regularly and, at each of its meetings, covers an extensive agenda of topics and materials and considers factors that are relevant to its annual consideration of the renewal of the fund's Advisory Contracts, including the services and support provided to the fund and its shareholders. The Board has established four standing committees (Committees) — Operations, Audit, Fair Valuation, and Governance and Nominating — each composed of and chaired by Independent Trustees with varying backgrounds, to which the Board has assigned specific subject matter responsibilities in order to enhance effective decision-making by the Board. The Operations Committee, of which all of the Independent Trustees are members, meets regularly throughout the year and considers, among other matters, information specifically related to the annual consideration of the renewal of the fund's Advisory Contracts. The Board, acting directly and through its Committees, requests and receives information concerning the annual consideration of the renewal of the fund's Advisory Contracts. The Board also meets as needed to consider matters specifically related to the Board's annual consideration of the renewal of the Advisory Contracts. Members of the Board may also meet with trustees of other Fidelity funds through ad hoc joint committees to discuss certain matters relevant to all of the Fidelity funds.
At its January 2016 meeting, the Board unanimously determined to renew the fund's Advisory Contracts. In reaching its determination, the Board considered all factors it believed relevant, including (i) the nature, extent, and quality of the services to be provided to the fund and its shareholders (including the investment performance of the fund); (ii) the competitiveness of the fund's management fee and total expense ratio relative to peer funds; (iii) the total costs of the services to be provided by and the profits to be realized by Fidelity from its relationships with the fund; and (iv) the extent to which, if any, economies of scale exist and would be realized as the fund grows, and whether any economies of scale are appropriately shared with fund shareholders.
In considering whether to renew the Advisory Contracts for the fund, the Board reached a determination, with the assistance of fund counsel and Independent Trustees' counsel and through the exercise of its business judgment, that the renewal of the Advisory Contracts was in the best interests of the fund and its shareholders and that the compensation payable under the Advisory Contracts was fair and reasonable. The Board's decision to renew the Advisory Contracts was not based on any single factor, but rather was based on a comprehensive consideration of all the information provided to the Board at its meetings throughout the year. The Board, in reaching its determination to renew the Advisory Contracts, was aware that shareholders of the fund have a broad range of investment choices available to them, including a wide choice among funds offered by Fidelity's competitors, and that the fund's shareholders, who have the opportunity to review and weigh the disclosure provided by the fund in its prospectus and other public disclosures, have chosen to invest in this fund, which is part of the Fidelity family of funds.
Nature, Extent, and Quality of Services Provided. The Board considered the staffing of SelectCo and the sub-advisers (together with SelectCo, the Investment Advisers) as it relates to the fund, including the backgrounds of investment personnel of SelectCo, and also considered the fund's investment objective, strategies, and related investment philosophy. The Independent Trustees also had discussions with senior management of Fidelity's investment operations and investment groups. The Board considered the structure of the investment personnel compensation program and whether this structure provides appropriate incentives to act in the best interests of the fund. Additionally, the Board considered the portfolio managers' investments, if any, in the funds that they manage.
Resources Dedicated to Investment Management and Support Services. The Board reviewed the general qualifications and capabilities of the investment staff of the Investment Advisers, including their size, education, experience, and resources, as well as Fidelity's approach to recruiting, training, managing, and compensating investment personnel. The Board noted that Fidelity has continued to increase the resources devoted to non-U.S. offices, including expansion of Fidelity's global investment organization. The Board also noted that Fidelity's analysts have extensive resources, tools and capabilities that allow them to conduct sophisticated quantitative and fundamental analysis, as well as credit analysis of issuers, counterparties and guarantors. Further, the Board considered that Fidelity's investment professionals have sufficient access to global information and data so as to provide competitive investment results over time, and that those professionals also have access to sophisticated tools that permit them to assess portfolio construction and risk and performance attribution characteristics continuously, as well as to transmit new information and research conclusions rapidly around the world. Additionally, in its deliberations, the Board considered Fidelity's trading, risk management, compliance, and technology and operations capabilities and resources, which are integral parts of the investment management process.
Shareholder and Administrative Services. The Board considered (i) the nature, extent, quality, and cost of advisory, administrative, and shareholder services performed by the Investment Advisers and their affiliates under the Advisory Contracts and under separate agreements covering transfer agency, pricing and bookkeeping, and securities lending services for the fund; (ii) the nature and extent of the supervision of third party service providers, principally custodians, subcustodians, and pricing vendors; and (iii) the resources devoted to, and the record of compliance with, the fund's compliance policies and procedures. The Board also reviewed the allocation of fund brokerage, including allocations to brokers affiliated with the Investment Advisers, the use of brokerage commissions to pay fund expenses, and the use of "soft" commission dollars to pay for research services.
The Board noted that the growth of fund assets over time across the complex allows Fidelity to reinvest in the development of services designed to enhance the value or convenience of the Fidelity funds as investment vehicles. These services include 24-hour access to account information and market information through telephone representatives and over the Internet, investor education materials and asset allocation tools, and the expanded availability of Fidelity Investor Centers.
The Board noted that in 2014 the ad hoc Committee on Transfer Agency Fees was formed by it and the boards of certain other Fidelity funds to review the variety of transfer agency services and fee structures throughout the mutual fund industry compared to Fidelity's.
Investment in a Large Fund Family. The Board considered the benefits to shareholders of investing in a Fidelity fund, including the benefits of investing in a fund that is part of a large family of funds offering a variety of investment disciplines and providing a large variety of mutual fund investor services. The Board noted that Fidelity had taken, or had made recommendations that resulted in the Fidelity funds taking, a number of actions over the previous year that benefited particular funds, including (i) continuing to dedicate additional resources to investment research and to the support of the senior management team that oversees asset management; (ii) continuing efforts to enhance Fidelity's global research capabilities; (iii) launching new funds and making other enhancements to meet client needs; (iv) reducing management fees and total expenses for certain index funds; (v) continuing to launch dedicated lower cost underlying funds to meet portfolio construction needs related to expanding underlying fund options for Fidelity funds of funds, specifically for the Freedom Fund product lines; (vi) rationalizing product lines and gaining increased efficiencies through fund mergers; (vii) continuing to develop, acquire and implement systems and technology to improve services to the funds and shareholders, strengthen information security, and increase efficiency; (viii) implementing investment enhancements to further strengthen Fidelity's target date product line to increase investors' probability of success in achieving their goals; (ix) modifying the eligibility criteria for certain share classes to accommodate roll-over assets from employer-sponsored retirement plans; (x) launching a new Class W of the Freedom Index Funds to attract and retain Fidelity record-kept retirement plan assets; and (xi) implementing changes to Fidelity's money market fund product line in response to recent regulatory reforms.
Investment Performance. The Board considered whether the fund has operated in accordance with its investment objective, as well as its record of compliance with its investment restrictions and its performance history.
The Board took into account discussions with representatives of the Investment Advisers about fund investment performance that occur at Board meetings throughout the year. In this regard the Board noted that as part of regularly scheduled fund reviews and other reports to the Board on fund performance, the Board considers annualized return information for the fund, for different time periods, measured against a securities market index ("benchmark index"). In its evaluation of fund investment performance at meetings throughout the year, the Board gave particular attention to information indicating underperformance of certain Fidelity funds for specific time periods and discussed with the Investment Advisers the reasons for such underperformance.
In addition to reviewing absolute and relative fund performance, the Independent Trustees periodically consider the appropriateness of fund performance metrics in evaluating the results achieved. In general, the Independent Trustees believe that fund performance should be evaluated based on net performance (after fees and expenses) of both the highest performing and lowest performing fund share classes, where applicable, compared to appropriate benchmark indices, over appropriate time periods that may include full market cycles, taking into account relevant factors, including the following: general market conditions; issuer-specific information; and fund cash flows and other factors. Depending on the circumstances, the Independent Trustees may be satisfied with a fund's performance notwithstanding that it lags its benchmark index for certain periods.
The Independent Trustees recognize that shareholders evaluate performance on a net basis over their own holding periods, for which one-, three-, and five-year periods are often used as a proxy. For this reason, the performance information reviewed by the Board also included net cumulative total return information for the fund and an appropriate benchmark index for the most recent one-, three-, and five-year periods ended June 30, 2015.
Based on its review, the Board concluded that the nature, extent, and quality of services provided to the fund under the Advisory Contracts should benefit the shareholders of the fund.
Competitiveness of Management Fee and Total Expense Ratio. The Board considered the fund's management fee and total expense ratio compared to "mapped groups" of competitive funds and classes created for the purpose of facilitating the Trustees' analysis of the competitiveness of management fees and total expenses. Fidelity creates "mapped groups" by combining similar Lipper investment objective categories that have comparable investment mandates. For this purpose, all sector focused equity funds are grouped in the same mapped group. Combining Lipper investment objective categories aids the Board's management fee and total expense ratio comparisons by broadening the competitive group used for comparison.
Management Fee. The Board considered two proprietary management fee comparisons for the 12-month periods ended June 30 shown in basis points (BP) in the chart below. The group of Lipper funds used by the Board for management fee comparisons is referred to below as the "Total Mapped Group." The Total Mapped Group comparison focuses on a fund's standing in terms of gross management fees before expense reimbursements or caps relative to the total universe of funds with comparable investment mandates (
i.e., sector equities), regardless of whether their management fee structures also are comparable. Funds with comparable management fee structures have similar management fee contractual arrangements (
e.g., flat rate charged for advisory services, all-inclusive fee rate,
etc.). "TMG %" represents the percentage of funds in the Total Mapped Group that had management fees that were lower than the fund's. For example, a hypothetical TMG % of 20% would mean that 80% of the funds in the Total Mapped Group had higher, and 20% had lower, management fees than the fund. The fund's actual TMG %s and the number of funds in the Total Mapped Group are in the chart below. The "Asset-Size Peer Group" (ASPG) comparison focuses on a fund's standing relative to a subset of non-Fidelity funds within the Total Mapped Group that are similar in size and management fee structure. For example, if a fund is in the first quartile of the ASPG, the fund's management fee ranks in the least expensive or lowest 25% of funds in the ASPG. The ASPG represents at least 15% of the funds in the Total Mapped Group with comparable asset size and management fee structures, subject to a minimum of 50 funds (or all funds in the Total Mapped Group if fewer than 50). Additional information, such as the ASPG quartile in which the fund's management fee rate ranked, is also included in the chart and considered by the Board.
VIP Energy Portfolio
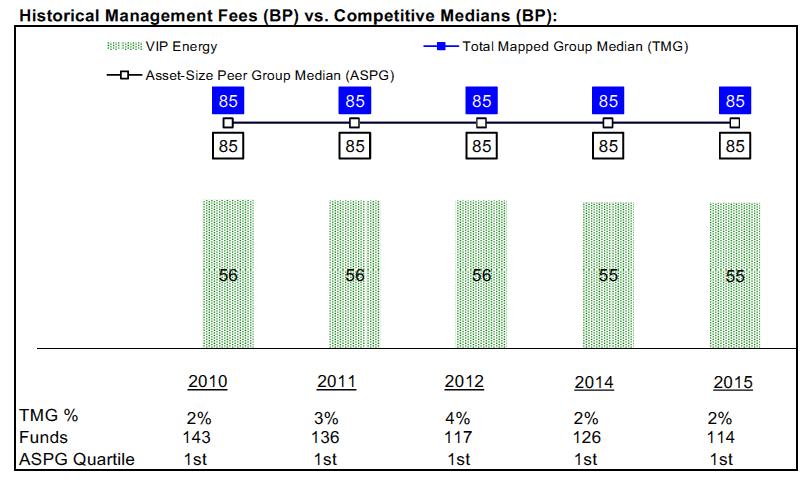
The Board noted that the fund's management fee rate ranked below the median of its Total Mapped Group and below the median of its ASPG for the 12-month period ended June 30, 2015.
The Board noted that, in 2014, the ad hoc Committee on Group Fee was formed by it and the boards of other Fidelity funds to conduct an in-depth review of the "group fee" component of the management fee of funds with such management fee structures. Committee focus included the mechanics of the group fee, the competitive landscape of group fee structures, Fidelity funds with no group fee component and investment products not included in group fee assets. The Board also considered that, for funds subject to the group fee, FMR agreed to voluntarily waive fees over a specified period of time in amounts designed to account for assets converted from certain funds to certain collective investment trusts.
Based on its review, the Board concluded that the fund's management fee is fair and reasonable in light of the services that the fund receives and the other factors considered.
Total Expense Ratio. In its review of each class's total expense ratio, the Board considered the fund's management fee rate as well as other fund or class expenses, as applicable, such as transfer agent fees, pricing and bookkeeping fees, fund-paid 12b-1 fees, and custodial, legal, and audit fees. The Board also noted that Fidelity may agree to waive fees and expenses from time to time, and the extent to which, if any, it has done so for the fund. As part of its review, the Board also considered the current and historical total expense ratios of each class of the fund compared to competitive fund median expenses. Each class of the fund is compared to those funds and classes in the Total Mapped Group (used by the Board for management fee comparisons) that have a similar sales load structure.
The Board noted that the total expense ratio of each class ranked below the competitive median for the 12-month period ended June 30, 2015.
Fees Charged to Other Fidelity Clients. The Board also considered Fidelity fee structures and other information with respect to clients of Fidelity, such as other funds advised or subadvised by Fidelity, pension plan clients, and other institutional clients with similar mandates. The Board noted the findings of the 2013 ad hoc joint committee (created with the boards of other Fidelity funds), which reviewed and compared Fidelity's institutional investment advisory business with its business of providing services to the Fidelity funds, including the differences in services provided, fees charged, and costs incurred, as well as competition in their respective marketplaces.
Based on its review of total expense ratios and fees charged to other Fidelity clients, the Board concluded that the total expense ratio of each class of the fund was reasonable in light of the services that the fund and its shareholders receive and the other factors considered.
Costs of the Services and Profitability. The Board considered the revenues earned and the expenses incurred by Fidelity in conducting the business of developing, marketing, distributing, managing, administering and servicing the fund and servicing the fund's shareholders. The Board also considered the level of Fidelity's profits in respect of all the Fidelity funds.
On an annual basis, Fidelity presents to the Board information about the profitability of its relationship with the fund. Fidelity calculates profitability information for each fund, as well as aggregate profitability information for groups of Fidelity funds and all Fidelity funds, using a series of detailed revenue and cost allocation methodologies which originate with the books and records of Fidelity on which Fidelity's audited financial statements are based. The Audit Committee of the Board reviews any significant changes from the prior year's methodologies.
PricewaterhouseCoopers LLP (PwC), independent registered public accounting firm and auditor to Fidelity and certain Fidelity funds, has been engaged annually by the Board as part of the Board's assessment of the profitability analysis used by Fidelity. PwC's engagement includes the review and assessment of Fidelity's methodologies used in determining the revenues and expenses attributable to Fidelity's mutual fund business, and completion of agreed-upon procedures in respect of the mathematical accuracy of fund profitability and its conformity to established allocation methodologies. After considering PwC's reports issued under the engagement and information provided by Fidelity, the Board concluded that while other allocation methods may also be reasonable, Fidelity's profitability methodologies are reasonable in all material respects.
The Board also reviewed Fidelity's non-fund businesses and fall-out benefits related to the mutual fund business as well as cases where Fidelity's affiliates may benefit from or be related to the fund's business.
The Board considered the costs of the services provided by and the profits realized by Fidelity in connection with the operation of the fund and was satisfied that the profitability was not excessive.
Economies of Scale. The Board considered whether there have been economies of scale in respect of the management of the Fidelity funds, whether the Fidelity funds (including the fund) have appropriately benefited from any such economies of scale, and whether there is potential for realization of any further economies of scale. The Board considered the extent to which the fund will benefit from economies of scale as assets grow through increased services to the fund, through waivers or reimbursements, or through fee or expense ratio reductions. The Board also noted that in 2013, it and the boards of other Fidelity funds created an ad hoc committee (the Economies of Scale Committee) to analyze whether Fidelity attains economies of scale in respect of the management and servicing of the Fidelity funds, whether the Fidelity funds have appropriately benefited from such economies of scale, and whether there is potential for realization of any further economies of scale.
The Board recognized that the fund's management contract incorporates a "group fee" structure, which provides for lower group fee rates as total group assets increase, and for higher group fee rates as total group assets decrease (with "group assets" defined to include fund assets under SelectCo's management plus assets under FMR's management). SelectCo calculates the group fee rates based on a tiered asset "breakpoint" schedule that varies based on asset class. The Board considered that the group fee is designed to deliver the benefits of economies of scale to fund shareholders when total group assets increase, even if assets of any particular fund are unchanged or have declined, because some portion of Fidelity's costs are attributable to services provided to all Fidelity funds, and all funds benefit if those costs can be allocated among more assets. The Board concluded that, given the group fee structure, fund shareholders will benefit from lower management fees as group assets increase at the fund complex level, regardless of whether Fidelity achieves any such economies of scale.
The Board concluded, taking into account the analysis of the Economies of Scale Committee, that economies of scale, if any, are being appropriately shared between fund shareholders and Fidelity.
Additional Information Requested by the Board. In order to develop fully the factual basis for consideration of the Fidelity funds' Advisory Contracts, the Board requested and received additional information on certain topics, including: (i) Fidelity's fund profitability methodology, profitability trends for certain funds, and the impact of certain factors on fund profitability results; (ii) portfolio manager changes that have occurred during the past year and the amount of the investment that each portfolio manager has made in the Fidelity fund(s) that he or she manages; (iii) Fidelity's compensation structure for portfolio managers, research analysts, and other key personnel, including its effects on fund profitability; (iv) the arrangements with and compensation paid to certain fund sub-advisers on behalf of the Fidelity funds; (v) Fidelity's long-term expectations for its offerings in the workplace investing channel; (vi) the methodology with respect to competitive fund data and peer group classifications; (vii) Fidelity's transfer agent fee, expense, and service structures for different funds and classes, and the impact of outsourcing, the increased use of omnibus accounts, and lower pricing in the retirement channel; and (viii) explanations regarding the relative total expense ratios of certain funds and classes, total expense competitive trends and methodologies for total expense competitive comparisons, and actions that might be taken by Fidelity to reduce total expense ratios for certain funds and classes or to achieve further economies of scale.
Based on its evaluation of all of the conclusions noted above, and after considering all factors it believed relevant, the Board concluded that the advisory fee structures are fair and reasonable, and that the fund's Advisory Contracts should be renewed.
VNRIC-SANN-0816
1.817382.111
Fidelity® Variable Insurance Products: Financial Services Portfolio
Semi-Annual Report June 30, 2016 |
|
Contents
To view a fund's proxy voting guidelines and proxy voting record for the 12-month period ended June 30, visit http://www.fidelity.com/proxyvotingresults or visit the Securities and Exchange Commission's (SEC) web site at http://www.sec.gov.
You may also call 1-877-208-0098 to request a free copy of the proxy voting guidelines.
Fidelity® Variable Insurance Products are separate account options which are purchased through a variable insurance contract.
Standard & Poor's, S&P and S&P 500 are registered service marks of The McGraw-Hill Companies, Inc. and have been licensed for use by Fidelity Distributors Corporation.
Other third-party marks appearing herein are the property of their respective owners.
All other marks appearing herein are registered or unregistered trademarks or service marks of FMR LLC or an affiliated company. © 2016 FMR LLC. All rights reserved.
This report and the financial statements contained herein are submitted for the general information of the shareholders of the Fund. This report is not authorized for distribution to prospective investors in the Fund unless preceded or accompanied by an effective prospectus.
A fund files its complete schedule of portfolio holdings with the SEC for the first and third quarters of each fiscal year on Form N-Q. Forms N-Q are available on the SEC’s web site at http://www.sec.gov. A fund's Forms N-Q may be reviewed and copied at the SEC’s Public Reference Room in Washington, DC. Information regarding the operation of the SEC's Public Reference Room may be obtained by calling 1-800-SEC-0330.
For a complete list of a fund's portfolio holdings, view the most recent holdings listing, semiannual report, or annual report on Fidelity's web site at http://www.fidelity.com, http://www.institutional.fidelity.com, or http://www.401k.com, as applicable.
NOT FDIC INSURED •MAY LOSE VALUE •NO BANK GUARANTEE
Neither the Fund nor Fidelity Distributors Corporation is a bank.
Note to Shareholders
On September 1, 2016, real estate will be recognized as a standalone sector under the S&P and MSCI Global Industry Classification Standard, used as the basis for many equity market indices. With this change, the structure of the fund’s supplemental sector benchmark will be modified to exclude real estate as an industry group from the financials sector, with the exception of mortgage-related REITs. As a result, there may be a decrease in the fund’s exposure to the real estate industry. Additionally on September 1, 2016, the fund’s sector benchmark will change to the MSCI U.S. IMI Financials 5% Capped Index. This capped index precludes any single issuer from representing more than 5% of the index at the time of quarterly rebalance.
Investment Summary (Unaudited)
Top Ten Stocks as of June 30, 2016
| | % of fund's net assets | % of fund's net assets 6 months ago |
| Berkshire Hathaway, Inc. Class B | 5.8 | 3.8 |
| Chubb Ltd. | 4.3 | 3.1 |
| Citigroup, Inc. | 3.9 | 4.9 |
| American Tower Corp. | 3.9 | 3.4 |
| Wells Fargo & Co. | 3.7 | 3.7 |
| Bank of America Corp. | 3.6 | 4.9 |
| U.S. Bancorp | 3.5 | 3.9 |
| JPMorgan Chase & Co. | 3.3 | 5.3 |
| Ventas, Inc. | 2.6 | 2.0 |
| Capital One Financial Corp. | 2.6 | 3.3 |
| | 37.2 | |
Top Industries (% of fund's net assets)
| As of June 30, 2016 |
| | Banks | 23.9% |
| | Real Estate Investment Trusts | 22.9% |
| | Insurance | 19.1% |
| | Diversified Financial Services | 9.5% |
| | Capital Markets | 6.3% |
| | All Others* | 18.3% |

* Includes Short-Term investments and Net Other Assets (Liabilities).
| As of December 31, 2015 |
| | Banks | 29.2% |
| | Real Estate Investment Trusts | 16.9% |
| | Insurance | 15.9% |
| | Capital Markets | 9.5% |
| | Consumer Finance | 6.2% |
| | All Others* | 22.3% |

* Includes Short-Term investments and Net Other Assets (Liabilities).
Investments June 30, 2016 (Unaudited)
Showing Percentage of Net Assets
| Common Stocks - 96.0% | | | |
| | | Shares | Value |
| Banks - 23.9% | | | |
| Diversified Banks - 18.6% | | | |
| Bank of America Corp. | | 252,342 | $3,348,578 |
| Citigroup, Inc. | | 83,789 | 3,551,816 |
| Comerica, Inc. | | 13,329 | 548,222 |
| JPMorgan Chase & Co. | | 49,054 | 3,048,216 |
| U.S. Bancorp | | 79,473 | 3,205,146 |
| Wells Fargo & Co. | | 71,496 | 3,383,906 |
| | | | 17,085,884 |
| Regional Banks - 5.3% | | | |
| CoBiz, Inc. | | 33,656 | 393,775 |
| Huntington Bancshares, Inc. | | 103,200 | 922,608 |
| M&T Bank Corp. | | 13,280 | 1,570,094 |
| Popular, Inc. | | 27,400 | 802,820 |
| Preferred Bank, Los Angeles | | 4,300 | 124,163 |
| SunTrust Banks, Inc. | | 26,700 | 1,096,836 |
| | | | 4,910,296 |
|
| TOTAL BANKS | | | 21,996,180 |
|
| Capital Markets - 6.3% | | | |
| Asset Management & Custody Banks - 3.1% | | | |
| Affiliated Managers Group, Inc. (a) | | 3,184 | 448,212 |
| Invesco Ltd. | | 24,977 | 637,913 |
| Northern Trust Corp. | | 15,050 | 997,213 |
| Oaktree Capital Group LLC Class A | | 17,400 | 778,824 |
| | | | 2,862,162 |
| Investment Banking & Brokerage - 3.2% | | | |
| E*TRADE Financial Corp. (a) | | 34,300 | 805,707 |
| Goldman Sachs Group, Inc. | | 11,610 | 1,725,014 |
| Virtu Financial, Inc. Class A | | 22,800 | 410,400 |
| | | | 2,941,121 |
|
| TOTAL CAPITAL MARKETS | | | 5,803,283 |
|
| Consumer Finance - 5.5% | | | |
| Consumer Finance - 5.5% | | | |
| American Express Co. | | 17,100 | 1,038,996 |
| Capital One Financial Corp. | | 37,953 | 2,410,395 |
| OneMain Holdings, Inc. (a) | | 13,650 | 311,493 |
| Synchrony Financial | | 50,800 | 1,284,224 |
| | | | 5,045,108 |
| Diversified Consumer Services - 0.6% | | | |
| Specialized Consumer Services - 0.6% | | | |
| H&R Block, Inc. | | 25,700 | 591,100 |
| Diversified Financial Services - 9.5% | | | |
| Multi-Sector Holdings - 5.8% | | | |
| Berkshire Hathaway, Inc. Class B (a) | | 36,933 | 5,347,527 |
| Specialized Finance - 3.7% | | | |
| CME Group, Inc. | | 13,700 | 1,334,380 |
| IntercontinentalExchange, Inc. | | 7,876 | 2,015,941 |
| | | | 3,350,321 |
|
| TOTAL DIVERSIFIED FINANCIAL SERVICES | | | 8,697,848 |
|
| Insurance - 19.1% | | | |
| Insurance Brokers - 4.4% | | | |
| Brown & Brown, Inc. | | 44,300 | 1,659,921 |
| Marsh & McLennan Companies, Inc. | | 35,100 | 2,402,946 |
| | | | 4,062,867 |
| Life & Health Insurance - 2.3% | | | |
| Torchmark Corp. | | 33,990 | 2,101,262 |
| Multi-Line Insurance - 0.5% | | | |
| American Financial Group, Inc. | | 6,700 | 495,331 |
| Property & Casualty Insurance - 10.9% | | | |
| Allied World Assurance Co. Holdings AG | | 37,800 | 1,328,292 |
| Allstate Corp. | | 33,870 | 2,369,207 |
| Chubb Ltd. | | 30,256 | 3,954,762 |
| FNF Group | | 62,570 | 2,346,375 |
| | | | 9,998,636 |
| Reinsurance - 1.0% | | | |
| Reinsurance Group of America, Inc. | | 9,600 | 931,104 |
|
| TOTAL INSURANCE | | | 17,589,200 |
|
| IT Services - 5.3% | | | |
| Data Processing & Outsourced Services - 5.3% | | | |
| MasterCard, Inc. Class A | | 14,300 | 1,259,258 |
| PayPal Holdings, Inc. (a) | | 4,800 | 175,248 |
| The Western Union Co. | | 59,000 | 1,131,620 |
| Visa, Inc. Class A | | 31,440 | 2,331,905 |
| | | | 4,898,031 |
| Professional Services - 0.9% | | | |
| Research & Consulting Services - 0.9% | | | |
| Verisk Analytics, Inc. (a) | | 9,600 | 778,368 |
| Real Estate Investment Trusts - 22.9% | | | |
| Diversified REITs - 1.7% | | | |
| Store Capital Corp. | | 12,800 | 376,960 |
| VEREIT, Inc. | | 113,400 | 1,149,876 |
| | | | 1,526,836 |
| Health Care REIT's - 2.6% | | | |
| Ventas, Inc. | | 33,300 | 2,424,906 |
| Industrial REITs - 1.1% | | | |
| DCT Industrial Trust, Inc. | | 15,800 | 759,032 |
| Duke Realty LP | | 11,400 | 303,924 |
| | | | 1,062,956 |
| Mortgage REITs - 2.3% | | | |
| American Capital Agency Corp. | | 51,100 | 1,012,802 |
| American Capital Mortgage Investment Corp. | | 27,300 | 431,067 |
| Redwood Trust, Inc. (b) | | 47,400 | 654,594 |
| | | | 2,098,463 |
| Office REITs - 3.2% | | | |
| Boston Properties, Inc. | | 14,480 | 1,909,912 |
| Douglas Emmett, Inc. | | 30,400 | 1,079,808 |
| | | | 2,989,720 |
| Residential REITs - 4.6% | | | |
| American Campus Communities, Inc. | | 26,700 | 1,411,629 |
| Equity Residential (SBI) | | 16,200 | 1,115,856 |
| Essex Property Trust, Inc. | | 1,900 | 433,371 |
| UDR, Inc. | | 33,700 | 1,244,204 |
| | | | 4,205,060 |
| Specialized REITs - 7.4% | | | |
| American Tower Corp. | | 31,210 | 3,545,768 |
| Outfront Media, Inc. | | 38,069 | 920,128 |
| Public Storage | | 9,090 | 2,323,313 |
| | | | 6,789,209 |
|
| TOTAL REAL ESTATE INVESTMENT TRUSTS | | | 21,097,150 |
|
| Real Estate Management & Development - 1.2% | | | |
| Real Estate Services - 1.2% | | | |
| Realogy Holdings Corp. (a) | | 37,650 | 1,092,603 |
| Thrifts & Mortgage Finance - 0.4% | | | |
| Thrifts & Mortgage Finance - 0.4% | | | |
| MGIC Investment Corp. (a) | | 44,500 | 264,775 |
| Radian Group, Inc. | | 12,900 | 134,418 |
| Washington Mutual, Inc. (a) | | 5,300 | 0 |
| | | | 399,193 |
| Trading Companies & Distributors - 0.4% | | | |
| Trading Companies & Distributors - 0.4% | | | |
| AerCap Holdings NV (a) | | 9,600 | 322,464 |
| TOTAL COMMON STOCKS | | | |
| (Cost $78,557,274) | | | 88,310,528 |
|
| Money Market Funds - 3.8% | | | |
| Fidelity Cash Central Fund, 0.43% (c) | | 3,166,595 | 3,166,595 |
| Fidelity Securities Lending Cash Central Fund, 0.46% (c)(d) | | 341,600 | 341,600 |
| TOTAL MONEY MARKET FUNDS | | | |
| (Cost $3,508,195) | | | 3,508,195 |
| TOTAL INVESTMENT PORTFOLIO - 99.8% | | | |
| (Cost $82,065,469) | | | 91,818,723 |
| NET OTHER ASSETS (LIABILITIES) - 0.2% | | | 150,621 |
| NET ASSETS - 100% | | | $91,969,344 |
Legend
(a) Non-income producing
(b) Security or a portion of the security is on loan at period end.
(c) Affiliated fund that is generally available only to investment companies and other accounts managed by Fidelity Investments. The rate quoted is the annualized seven-day yield of the fund at period end. A complete unaudited listing of the fund's holdings as of its most recent quarter end is available upon request. In addition, each Fidelity Central Fund's financial statements are available on the SEC's website or upon request.
(d) Investment made with cash collateral received from securities on loan.
Affiliated Central Funds
Information regarding fiscal year to date income earned by the Fund from investments in Fidelity Central Funds is as follows:
| Fund | Income earned |
| Fidelity Cash Central Fund | $9,163 |
| Fidelity Securities Lending Cash Central Fund | 1,198 |
| Total | $10,361 |
Investment Valuation
All investments are categorized as Level 1 under the Fair Value Hierarchy. The inputs or methodology used for valuing securities may not be an indication of the risk associated with investing in those securities. For more information on valuation inputs please refer to the Investment Valuation section in the accompanying Notes to Financial Statements.
See accompanying notes which are an integral part of the financial statements.
Financial Statements
Statement of Assets and Liabilities
| | | June 30, 2016 (Unaudited) |
| Assets | | |
Investment in securities, at value (including securities loaned of $336,964) — See accompanying schedule:
Unaffiliated issuers (cost $78,557,274) | $88,310,528 | |
| Fidelity Central Funds (cost $3,508,195) | 3,508,195 | |
| Total Investments (cost $82,065,469) | | $91,818,723 |
| Receivable for investments sold | | 900,353 |
| Receivable for fund shares sold | | 42,682 |
| Dividends receivable | | 178,515 |
| Distributions receivable from Fidelity Central Funds | | 1,431 |
| Prepaid expenses | | 73 |
| Other receivables | | 2,913 |
| Total assets | | 92,944,690 |
| Liabilities | | |
| Payable for investments purchased | $501,009 | |
| Payable for fund shares redeemed | 54,112 | |
| Accrued management fee | 42,392 | |
| Other affiliated payables | 13,279 | |
| Other payables and accrued expenses | 22,954 | |
| Collateral on securities loaned, at value | 341,600 | |
| Total liabilities | | 975,346 |
| Net Assets | | $91,969,344 |
| Net Assets consist of: | | |
| Paid in capital | | $87,027,706 |
| Undistributed net investment income | | 607,978 |
| Accumulated undistributed net realized gain (loss) on investments and foreign currency transactions | | (5,419,456) |
| Net unrealized appreciation (depreciation) on investments and assets and liabilities in foreign currencies | | 9,753,116 |
| Net Assets | | $91,969,344 |
| Initial Class: | | |
| Net Asset Value, offering price and redemption price per share ($16,756,833 ÷ 1,765,490 shares) | | $9.49 |
| Investor Class: | | |
| Net Asset Value, offering price and redemption price per share ($75,212,511 ÷ 7,957,384 shares) | | $9.45 |
See accompanying notes which are an integral part of the financial statements.
Statement of Operations
| | | Six months ended June 30, 2016 (Unaudited) |
| Investment Income | | |
| Dividends | | $964,172 |
| Income from Fidelity Central Funds | | 10,361 |
| Total income | | 974,533 |
| Expenses | | |
| Management fee | $260,781 | |
| Transfer agent fees | 62,778 | |
| Accounting and security lending fees | 18,532 | |
| Custodian fees and expenses | 6,545 | |
| Independent trustees' fees and expenses | 1,080 | |
| Audit | 20,831 | |
| Legal | 1,839 | |
| Miscellaneous | 554 | |
| Total expenses before reductions | 372,940 | |
| Expense reductions | (6,385) | 366,555 |
| Net investment income (loss) | | 607,978 |
| Realized and Unrealized Gain (Loss) | | |
| Net realized gain (loss) on: | | |
| Investment securities: | | |
| Unaffiliated issuers | (3,144,776) | |
| Foreign currency transactions | 6 | |
| Total net realized gain (loss) | | (3,144,770) |
Change in net unrealized appreciation (depreciation) on:
Investment securities | (1,269,764) | |
| Assets and liabilities in foreign currencies | 26 | |
| Total change in net unrealized appreciation (depreciation) | | (1,269,738) |
| Net gain (loss) | | (4,414,508) |
| Net increase (decrease) in net assets resulting from operations | | $(3,806,530) |
See accompanying notes which are an integral part of the financial statements.
Statement of Changes in Net Assets
| | Six months ended June 30, 2016 (Unaudited) | Year ended December 31, 2015 |
| Increase (Decrease) in Net Assets | | |
| Operations | | |
| Net investment income (loss) | $607,978 | $998,694 |
| Net realized gain (loss) | (3,144,770) | 1,794,403 |
| Change in net unrealized appreciation (depreciation) | (1,269,738) | (7,264,177) |
| Net increase (decrease) in net assets resulting from operations | (3,806,530) | (4,471,080) |
| Distributions to shareholders from net investment income | – | (1,186,136) |
| Share transactions - net increase (decrease) | (15,758,221) | 9,996,696 |
| Redemption fees | 13,891 | 12,528 |
| Total increase (decrease) in net assets | (19,550,860) | 4,352,008 |
| Net Assets | | |
| Beginning of period | 111,520,204 | 107,168,196 |
| End of period | $91,969,344 | $111,520,204 |
| Other Information | | |
| Undistributed net investment income end of period | $607,978 | $– |
See accompanying notes which are an integral part of the financial statements.
Financial Highlights — VIP Financial Services Portfolio Initial Class
| | Six months ended (Unaudited) June 30, | Years ended December 31, | | | | |
| | 2016 | 2015 | 2014 | 2013 | 2012 | 2011 |
| Selected Per–Share Data | | | | | | |
| Net asset value, beginning of period | $9.74 | $10.23 | $9.33 | $7.05 | $5.55 | $7.01 |
| Income from Investment Operations | | | | | | |
| Net investment income (loss)A | .06 | .10 | .12 | .11 | .11 | .01 |
| Net realized and unrealized gain (loss) | (.31) | (.48) | .90 | 2.27 | 1.47 | (1.44) |
| Total from investment operations | (.25) | (.38) | 1.02 | 2.38 | 1.58 | (1.43) |
| Distributions from net investment income | – | (.11) | (.12) | (.10) | (.08) | (.03) |
| Redemption fees added to paid in capitalA,B | – | – | – | – | – | – |
| Net asset value, end of period | $9.49 | $9.74 | $10.23 | $9.33 | $7.05 | $5.55 |
| Total ReturnC,D,E | (2.57)% | (3.69)% | 10.88% | 33.86% | 28.55% | (20.46)% |
| Ratios to Average Net AssetsF,G | | | | | | |
| Expenses before reductions | .72%H | .71% | .73% | .81% | .85% | .92% |
| Expenses net of fee waivers, if any | .72%H | .71% | .72% | .81% | .85% | .91% |
| Expenses net of all reductions | .71%H | .71% | .72% | .79% | .75% | .86% |
| Net investment income (loss) | 1.35%H | 1.02% | 1.21% | 1.29% | 1.66% | .22% |
| Supplemental Data | | | | | | |
| Net assets, end of period (000 omitted) | $16,757 | $20,570 | $23,351 | $27,726 | $17,438 | $11,805 |
| Portfolio turnover rateI | 52%H | 59% | 58% | 211% | 323% | 350% |
A Calculated based on average shares outstanding during the period.
B Amount represents less than $.005 per share.
C Total returns for periods of less than one year are not annualized.
D Total returns do not reflect charges attributable to your insurance company's separate account. Inclusion of these charges would reduce the total returns shown.
E Total returns would have been lower if certain expenses had not been reduced during the applicable periods shown.
F Fees and expenses of any underlying Fidelity Central Funds are not included in the Fund's expense ratio. The Fund indirectly bears its proportionate share of the expenses of any underlying Fidelity Central Funds.
G Expense ratios reflect operating expenses of the class. Expenses before reductions do not reflect amounts reimbursed by the investment adviser or reductions from brokerage service arrangements or reductions from other expense offset arrangements and do not represent the amount paid by the class during periods when reimbursements or reductions occur. Expenses net of fee waivers reflect expenses after reimbursement by the investment adviser but prior to reductions from brokerage service arrangements or other expense offset arrangements. Expenses net of all reductions represent the net expenses paid by the class.
H Annualized
I Amount does not include the portfolio activity of any underlying Fidelity Central Funds.
See accompanying notes which are an integral part of the financial statements.
Financial Highlights — VIP Financial Services Portfolio Investor Class
| | Six months ended (Unaudited) June 30, | Years ended December 31, | | | | |
| | 2016 | 2015 | 2014 | 2013 | 2012 | 2011 |
| Selected Per–Share Data | | | | | | |
| Net asset value, beginning of period | $9.71 | $10.19 | $9.30 | $7.03 | $5.54 | $6.99 |
| Income from Investment Operations | | | | | | |
| Net investment income (loss)A | .06 | .09 | .11 | .10 | .10 | .01 |
| Net realized and unrealized gain (loss) | (.32) | (.47) | .89 | 2.27 | 1.47 | (1.44) |
| Total from investment operations | (.26) | (.38) | 1.00 | 2.37 | 1.57 | (1.43) |
| Distributions from net investment income | – | (.10) | (.11) | (.10) | (.08) | (.02) |
| Redemption fees added to paid in capitalA,B | – | – | – | – | – | – |
| Net asset value, end of period | $9.45 | $9.71 | $10.19 | $9.30 | $7.03 | $5.54 |
| Total ReturnC,D,E | (2.68)% | (3.68)% | 10.75% | 33.74% | 28.36% | (20.47)% |
| Ratios to Average Net AssetsF,G | | | | | | |
| Expenses before reductions | .80%H | .79% | .80% | .89% | .92% | .99% |
| Expenses net of fee waivers, if any | .80%H | .79% | .80% | .89% | .92% | .99% |
| Expenses net of all reductions | .79%H | .78% | .79% | .87% | .82% | .93% |
| Net investment income (loss) | 1.27%H | .95% | 1.14% | 1.22% | 1.58% | .14% |
| Supplemental Data | | | | | | |
| Net assets, end of period (000 omitted) | $75,213 | $90,950 | $83,817 | $60,357 | $30,690 | $13,821 |
| Portfolio turnover rateI | 52%H | 59% | 58% | 211% | 323% | 350% |
A Calculated based on average shares outstanding during the period.
B Amount represents less than $.005 per share.
C Total returns for periods of less than one year are not annualized.
D Total returns do not reflect charges attributable to your insurance company's separate account. Inclusion of these charges would reduce the total returns shown.
E Total returns would have been lower if certain expenses had not been reduced during the applicable periods shown.
F Fees and expenses of any underlying Fidelity Central Funds are not included in the Fund's expense ratio. The Fund indirectly bears its proportionate share of the expenses of any underlying Fidelity Central Funds.
G Expense ratios reflect operating expenses of the class. Expenses before reductions do not reflect amounts reimbursed by the investment adviser or reductions from brokerage service arrangements or reductions from other expense offset arrangements and do not represent the amount paid by the class during periods when reimbursements or reductions occur. Expenses net of fee waivers reflect expenses after reimbursement by the investment adviser but prior to reductions from brokerage service arrangements or other expense offset arrangements. Expenses net of all reductions represent the net expenses paid by the class.
H Annualized
I Amount does not include the portfolio activity of any underlying Fidelity Central Funds.
See accompanying notes which are an integral part of the financial statements.
Notes to Financial Statements (Unaudited)
For the period ended June 30, 2016
1. Organization.
VIP Financial Services Portfolio (the Fund) is a fund of Variable Insurance Products Fund IV (the Trust) and is authorized to issue an unlimited number of shares. The Trust is registered under the Investment Company Act of 1940, as amended (the 1940 Act), as an open-end management investment company organized as a Massachusetts business trust. Shares of the Fund may only be purchased by insurance companies for the purpose of funding variable annuity or variable life insurance contracts. The Fund offers the following classes of shares: Initial Class shares and Investor Class Shares. All classes have equal rights and voting privileges, except for matters affecting a single class.
2. Investments in Fidelity Central Funds.
The Fund invests in Fidelity Central Funds, which are open-end investment companies generally available only to other investment companies and accounts managed by the investment adviser and its affiliates. The Fund's Schedule of Investments lists each of the Fidelity Central Funds held as of period end, if any, as an investment of the Fund, but does not include the underlying holdings of each Fidelity Central Fund. As an Investing Fund, the Fund indirectly bears its proportionate share of the expenses of the underlying Fidelity Central Funds.
The Money Market Central Funds seek preservation of capital and current income and are managed by Fidelity Investments Money Management, Inc. (FIMM), an affiliate of the investment adviser. Annualized expenses of the Money Market Central Funds as of their most recent shareholder report date are less than .005%.
A complete unaudited list of holdings for each Fidelity Central Fund is available upon request or at the Securities and Exchange Commission (the SEC) website at www.sec.gov. In addition, the financial statements of the Fidelity Central Funds are available on the SEC website or upon request.
3. Significant Accounting Policies.
The financial statements have been prepared in conformity with accounting principles generally accepted in the United States of America (GAAP), which require management to make certain estimates and assumptions at the date of the financial statements. Actual results could differ from those estimates. Subsequent events, if any, through the date that the financial statements were issued have been evaluated in the preparation of the financial statements. The following summarizes the significant accounting policies of the Fund:
Investment Valuation. Investments are valued as of 4:00 p.m. Eastern time on the last calendar day of the period. The Board of Trustees (the Board) has delegated the day to day responsibility for the valuation of the Fund's investments to the Fidelity SelectCo, LLC (SelectCo) Fair Value Committee (the Committee). In accordance with valuation policies and procedures approved by the Board, the Fund attempts to obtain prices from one or more third party pricing vendors or brokers to value its investments. When current market prices, quotations or currency exchange rates are not readily available or reliable, investments will be fair valued in good faith by the Committee, in accordance with procedures adopted by the Board. Factors used in determining fair value vary by investment type and may include market or investment specific events. The frequency with which these procedures are used cannot be predicted and they may be utilized to a significant extent. The Committee oversees the Fund's valuation policies and procedures and reports to the Board on the Committee's activities and fair value determinations. The Board monitors the appropriateness of the procedures used in valuing the Fund's investments and ratifies the fair value determinations of the Committee.
The Fund categorizes the inputs to valuation techniques used to value its investments into a disclosure hierarchy consisting of three levels as shown below:
- Level 1 – quoted prices in active markets for identical investments
- Level 2 – other significant observable inputs (including quoted prices for similar investments, interest rates, prepayment speeds, etc.)
- Level 3 – unobservable inputs (including the Fund's own assumptions based on the best information available)
Valuation techniques used to value the Fund's investments by major category are as follows:
Equity securities, including restricted securities, for which market quotations are readily available, are valued at the last reported sale price or official closing price as reported by a third party pricing vendor on the primary market or exchange on which they are traded and are categorized as Level 1 in the hierarchy. In the event there were no sales during the day or closing prices are not available, securities are valued at the last quoted bid price or may be valued using the last available price and are generally categorized as Level 2 in the hierarchy. For foreign equity securities, when market or security specific events arise, comparisons to the valuation of American Depositary Receipts (ADRs), futures contracts, Exchange-Traded Funds (ETFs) and certain indexes as well as quoted prices for similar securities may be used and would be categorized as Level 2 in the hierarchy. Utilizing these techniques may result in transfers between Level 1 and Level 2. For equity securities, including restricted securities, where observable inputs are limited, assumptions about market activity and risk are used and these securities may be categorized as Level 3 in the hierarchy.
Investments in open-end mutual funds, including the Fidelity Central Funds, are valued at their closing net asset value (NAV) each business day and are categorized as Level 1 in the hierarchy
Changes in valuation techniques may result in transfers in or out of an assigned level within the disclosure hierarchy.
Foreign Currency. The Fund may use foreign currency contracts to facilitate transactions in foreign-denominated securities. Gains and losses from these transactions may arise from changes in the value of the foreign currency or if the counterparties do not perform under the contracts' terms.
Foreign-denominated assets, including investment securities, and liabilities are translated into U.S. dollars at the exchange rates at period end. Purchases and sales of investment securities, income and dividends received and expenses denominated in foreign currencies are translated into U.S. dollars at the exchange rate in effect on the transaction date.
The effects of exchange rate fluctuations on investments are included with the net realized and unrealized gain (loss) on investment securities. Other foreign currency transactions resulting in realized and unrealized gain (loss) are disclosed separately.
Investment Transactions and Income. For financial reporting purposes, the Fund's investment holdings and NAV include trades executed through the end of the last business day of the period. The NAV per share for processing shareholder transactions is calculated as of the close of business of the New York Stock Exchange (NYSE), normally 4:00 p.m. Eastern time and includes trades executed through the end of the prior business day. Gains and losses on securities sold are determined on the basis of identified cost and may include proceeds received from litigation. Dividend income is recorded on the ex-dividend date, except for certain dividends from foreign securities where the ex-dividend date may have passed, which are recorded as soon as the Fund is informed of the ex-dividend date. Non-cash dividends included in dividend income, if any, are recorded at the fair market value of the securities received. Income and capital gain distributions from Fidelity Central Funds, if any, are recorded on the ex-dividend date. Distributions received on securities that represent a return of capital or capital gain are recorded as a reduction of cost of investments and/or as a realized gain. Subsequent to ex-dividend date the Fund determines the components of these distributions, based upon receipt of tax filings or other correspondence relating to the underlying investment. Interest income is accrued as earned and includes coupon interest and amortization of premium and accretion of discount on debt securities as applicable. Investment income is recorded net of foreign taxes withheld where recovery of such taxes is uncertain.
Class Allocations and Expenses. Investment income, realized and unrealized capital gains and losses, common expenses of the Fund, and certain fund-level expense reductions, if any, are allocated daily on a pro-rata basis to each class based on the relative net assets of each class to the total net assets of the Fund. Each class differs with respect to transfer agent fees incurred. Certain expense reductions may also differ by class. For the reporting period, the allocated portion of income and expenses to each class as a percent of its average net assets may vary due to the timing of recording these transactions in relation to fluctuating net assets of the classes. Expenses directly attributable to a fund are charged to that fund. Expenses attributable to more than one fund are allocated among the respective funds on the basis of relative net assets or other appropriate methods. Expense estimates are accrued in the period to which they relate and adjustments are made when actual amounts are known.
Income Tax Information and Distributions to Shareholders. Each year, the Fund intends to qualify as a regulated investment company under Subchapter M of the Internal Revenue Code, including distributing substantially all of its taxable income and realized gains. As a result, no provision for U.S. Federal income taxes is required. The Fund files a U.S. federal tax return, in addition to state and local tax returns as required. The Fund's federal income tax returns are subject to examination by the Internal Revenue Service (IRS) for a period of three fiscal years after they are filed. State and local tax returns may be subject to examination for an additional fiscal year depending on the jurisdiction. Foreign taxes are provided for based on the Fund's understanding of the tax rules and rates that exist in the foreign markets in which it invests.
Distributions are declared and recorded on the ex-dividend date. Income dividends and capital gain distributions are declared separately for each class. Income and capital gain distributions are determined in accordance with income tax regulations, which may differ from GAAP.
Capital accounts within the financial statements are adjusted for permanent book-tax differences. These adjustments have no impact on net assets or the results of operations. Capital accounts are not adjusted for temporary book-tax differences which will reverse in a subsequent period.
Book-tax differences are primarily due to foreign currency transactions, partnerships, capital loss carryforwards and losses deferred due to wash sales.
The federal tax cost of investment securities and unrealized appreciation (depreciation) as of period end were as follows:
| Gross unrealized appreciation | $12,186,269 |
| Gross unrealized depreciation | (2,969,872) |
| Net unrealized appreciation (depreciation) on securities | $9,216,397 |
| Tax cost | $82,602,326 |
Capital loss carryforwards are only available to offset future capital gains of the Fund to the extent provided by regulations and may be limited. Under the Regulated Investment Company Modernization Act of 2010 (the Act), the Fund is permitted to carry forward capital losses incurred in taxable years beginning after December 22, 2010 for an unlimited period and such capital losses are required to be used prior to any losses that expire. The capital loss carryforward information presented below, including any applicable limitation, is estimated as of prior fiscal period end and is subject to adjustment.
| Fiscal year of expiration | |
| 2017 | $(1,008,954) |
Trading (Redemption) Fees. Shares held by investors less than 60 days may be subject to a redemption fee equal to 1% of the NAV of shares redeemed. All redemption fees, which reduce the proceeds of the shareholder redemption, are retained by the Fund and accounted for as an addition to paid in capital.
4. Purchases and Sales of Investments.
Purchases and sales of securities, other than short-term securities, aggregated $23,783,542 and $37,144,692, respectively.
5. Fees and Other Transactions with Affiliates.
Management Fee. Fidelity SelectCo, LLC (the investment adviser) and its affiliates provide the Fund with investment management related services for which the Fund pays a monthly management fee. The management fee is the sum of an individual fund fee rate that is based on an annual rate of .30% of the Fund's average net assets and an annualized group fee rate that averaged .25% during the period. The group fee rate is based upon the average net assets of all the mutual funds advised by Fidelity Management & Research Company (FMR) and the investment adviser. The group fee rate decreases as assets under management increase and increases as assets under management decrease. For the reporting period, the total annualized management fee rate was .55% of the Fund's average net assets.
Transfer Agent Fees. Fidelity Investments Institutional Operations Company, Inc. (FIIOC), an affiliate of the investment adviser, is the Fund's transfer, dividend disbursing, and shareholder servicing agent. FIIOC receives an asset-based fee with respect to each class. Each class (with the exception of Investor Class) pays a fee for transfer agent services, typesetting and printing and mailing of shareholder reports, excluding mailing of proxy statements, equal to an annual rate of .07% (.15% for Investor Class) of class-level average net assets. For the period, transfer agent fees for each class were as follows:
| Initial Class | $5,685 |
| Investor Class | 57,093 |
| | $62,778 |
Accounting and Security Lending Fees. Fidelity Service Company, Inc. (FSC), an affiliate of the investment adviser, maintains the Fund's accounting records. The accounting fee is based on the level of average net assets for each month. Under a separate contract, FSC administers the security lending program. The security lending fee is based on the number and duration of lending transactions.
Brokerage Commissions. The Fund placed a portion of its portfolio transactions with brokerage firms which are affiliates of the investment adviser. Brokerage commissions are included in net realized gain (loss) and change in net unrealized appreciation (depreciation) in the Statement of Operations. The commissions paid to these affiliated firms were $566 for the period.
Interfund Trades. The Fund may purchase from or sell securities to other Fidelity Funds under procedures adopted by the Board. The procedures have been designed to ensure these interfund trades are executed in accordance with Rule 17a-7 of the 1940 Act. Interfund trades are included within the respective purchases and sales amounts shown in the Purchases and Sales of Investments note.
6. Committed Line of Credit.
The Fund participates with other funds managed by the investment adviser or an affiliate in a $4.25 billion credit facility (the "line of credit") to be utilized for temporary or emergency purposes to fund shareholder redemptions or for other short-term liquidity purposes. The Fund has agreed to pay commitment fees on its pro-rata portion of the line of credit, which amounted to $91 and is reflected in Miscellaneous expenses on the Statement of Operations. During the period, the Fund did not borrow on this line of credit.
7. Security Lending.
The Fund lends portfolio securities through a lending agent from time to time in order to earn additional income. On the settlement date of the loan, the Fund receives collateral (in the form of U.S. Treasury obligations, letters of credit and/or cash) against the loaned securities and maintains collateral in an amount not less than 100% of the market value of the loaned securities during the period of the loan. The market value of the loaned securities is determined at the close of business of the Fund and any additional required collateral is delivered to the Fund on the next business day. The Fund or borrower may terminate the loan at any time, and if the borrower defaults on its obligation to return the securities loaned because of insolvency or other reasons, the Fund may apply collateral received from the borrower against the obligation. The Fund may experience delays and costs in recovering the securities loaned. Any cash collateral received is invested in the Fidelity Securities Lending Cash Central Fund. The value of loaned securities and cash collateral at period end are disclosed on the Fund's Statement of Assets and Liabilities. Security lending income represents the income earned on investing cash collateral, less rebates paid to borrowers and any lending agent fees associated with the loan, plus any premium payments received for lending certain types of securities. Security lending income is presented in the Statement of Operations as a component of income from Fidelity Central Funds. Total security lending income during the period amounted to $1,198.
8. Expense Reductions.
Commissions paid to certain brokers with whom the investment adviser, or its affiliates, places trades on behalf of the Fund include an amount in addition to trade execution, which may be rebated back to the Fund to offset certain expenses. This amount totaled $5,960 for the period. Through arrangements with the Fund's custodian, credits realized as a result of certain uninvested cash balances were used to reduce the Fund's expenses. During the period, these credits reduced the Fund's custody expenses by $24.
In addition, during the period the investment adviser reimbursed and/or waived a portion of fund-level operating expenses in the amount of $401.
9. Distributions to Shareholders.
Distributions to shareholders of each class were as follows:
| | Six months ended
June 30, 2016 | Year ended December 31, 2015 |
| From net investment income | | |
| Initial Class | $– | $241,480 |
| Investor Class | – | 944,656 |
| Total | $– | $1,186,136 |
10. Share Transactions.
Transactions for each class of shares were as follows:
| | Shares | Shares | Dollars | Dollars |
| | Six months ended
June 30, 2016 | Year ended December 31, 2015 | Six months ended
June 30, 2016 | Year ended December 31, 2015 |
| Initial Class | | | | |
| Shares sold | 51,283 | 629,305 | $479,568 | $6,415,342 |
| Reinvestment of distributions | – | 25,259 | – | 241,480 |
| Shares redeemed | (396,858) | (826,883) | (3,574,216) | (8,303,234) |
| Net increase (decrease) | (345,575) | (172,319) | $(3,094,648) | $(1,646,412) |
| Investor Class | | | | |
| Shares sold | 437,939 | 3,306,441 | $4,086,628 | $33,530,950 |
| Reinvestment of distributions | – | 99,229 | – | 944,656 |
| Shares redeemed | (1,849,686) | (2,262,535) | (16,750,201) | (22,832,498) |
| Net increase (decrease) | (1,411,747) | 1,143,135 | $(12,663,573) | $11,643,108 |
11. Other.
The Fund's organizational documents provide former and current trustees and officers with a limited indemnification against liabilities arising in connection with the performance of their duties to the Fund. In the normal course of business, the Fund may also enter into contracts that provide general indemnifications. The Fund's maximum exposure under these arrangements is unknown as this would be dependent on future claims that may be made against the Fund. The risk of material loss from such claims is considered remote.
At the end of the period, the investment adviser or its affiliates were the owners of record of 100% of the total outstanding shares of the Fund.
Shareholder Expense Example
As a shareholder of the Fund, you incur two types of costs: (1) transaction costs, including redemption fees and (2) ongoing costs, including management fees and other Fund expenses. This Example is intended to help you understand your ongoing costs (in dollars) of investing in the Fund and to compare these costs with the ongoing costs of investing in other mutual funds.
The Example is based on an investment of $1,000 invested at the beginning of the period and held for the entire period (January 1, 2016 to June 30, 2016).
Actual Expenses
The first line of the accompanying table for each class of the Fund provides information about actual account values and actual expenses. You may use the information in this line, together with the amount you invested, to estimate the expenses that you paid over the period. Simply divide your account value by $1,000.00 (for example, an $8,600 account value divided by $1,000.00 = 8.6), then multiply the result by the number in the first line for a class of the Fund under the heading entitled "Expenses Paid During Period" to estimate the expenses you paid on your account during this period. The estimate of expenses does not include any fees or other expenses of any variable annuity or variable life insurance product. If they were, the estimate of expenses you paid during the period would be higher, and your ending account value would be lower. In addition, the Fund, as a shareholder in the underlying Fidelity Central Funds, will indirectly bear its pro-rata share of the fees and expenses incurred by the underlying Fidelity Central Funds. These fees and expenses are not included in the Fund's annualized expense ratio used to calculate the expense estimate in the table below.
Hypothetical Example for Comparison Purposes
The second line of the accompanying table for each class of the Fund provides information about hypothetical account values and hypothetical expenses based on a Class' actual expense ratio and an assumed rate of return of 5% per year before expenses, which is not the Class' actual return. The hypothetical account values and expenses may not be used to estimate the actual ending account balance or expenses you paid for the period. You may use this information to compare the ongoing costs of investing in the Fund and other funds. To do so, compare this 5% hypothetical example with the 5% hypothetical examples that appear in the shareholder reports of the other funds. The estimate of expenses does not include any fees or other expenses of any variable annuity or variable life insurance product. If they were, the estimate of expenses you paid during the period would be higher, and your ending account value would be lower. In addition, the Fund, as a shareholder in the underlying Fidelity Central Funds, will indirectly bear its pro-rata share of the fees and expenses incurred by the underlying Fidelity Central Funds. These fees and expenses are not included in the Fund's annualized expense ratio used to calculate the expense estimate in the table below.
Please note that the expenses shown in the table are meant to highlight your ongoing costs only and do not reflect any transaction costs. Therefore, the second line of the table is useful in comparing ongoing costs only, and will not help you determine the relative total costs of owning different funds. In addition, if these transactional costs were included, your costs would have been higher.
| | Annualized Expense Ratio-A | Beginning
Account Value
January 1, 2016 | Ending
Account Value
June 30, 2016 | Expenses Paid
During Period-B
January 1, 2016
to June 30, 2016 |
| Initial Class | .72% | | | |
| Actual | | $1,000.00 | $974.30 | $3.53 |
| Hypothetical-C | | $1,000.00 | $1,021.28 | $3.62 |
| Investor Class | .80% | | | |
| Actual | | $1,000.00 | $973.20 | $3.92 |
| Hypothetical-C | | $1,000.00 | $1,020.89 | $4.02 |
A Annualized expense ratio reflects expenses net of applicable fee waivers.
B Expenses are equal to each Class' annualized expense ratio, multiplied by the average account value over the period, multiplied by 182/366 (to reflect the one-half year period).
C 5% return per year before expenses
Board Approval of Investment Advisory Contracts and Management Fees
VIP Financial Services Portfolio
Each year, the Board of Trustees, including the Independent Trustees (together, the Board), votes on the renewal of the management contract with Fidelity SelectCo, LLC (SelectCo), an affiliate of Fidelity Management & Research Company (FMR), and the sub-advisory agreements with affiliates of FMR (together, the Advisory Contracts) for the fund. The Board, assisted by the advice of fund counsel and Independent Trustees' counsel, requests and considers a broad range of information relevant to the renewal of the Advisory Contracts throughout the year.
The Board meets regularly and, at each of its meetings, covers an extensive agenda of topics and materials and considers factors that are relevant to its annual consideration of the renewal of the fund's Advisory Contracts, including the services and support provided to the fund and its shareholders. The Board has established four standing committees (Committees) — Operations, Audit, Fair Valuation, and Governance and Nominating — each composed of and chaired by Independent Trustees with varying backgrounds, to which the Board has assigned specific subject matter responsibilities in order to enhance effective decision-making by the Board. The Operations Committee, of which all of the Independent Trustees are members, meets regularly throughout the year and considers, among other matters, information specifically related to the annual consideration of the renewal of the fund's Advisory Contracts. The Board, acting directly and through its Committees, requests and receives information concerning the annual consideration of the renewal of the fund's Advisory Contracts. The Board also meets as needed to consider matters specifically related to the Board's annual consideration of the renewal of the Advisory Contracts. Members of the Board may also meet with trustees of other Fidelity funds through ad hoc joint committees to discuss certain matters relevant to all of the Fidelity funds.
At its January 2016 meeting, the Board unanimously determined to renew the fund's Advisory Contracts. In reaching its determination, the Board considered all factors it believed relevant, including (i) the nature, extent, and quality of the services to be provided to the fund and its shareholders (including the investment performance of the fund); (ii) the competitiveness of the fund's management fee and total expense ratio relative to peer funds; (iii) the total costs of the services to be provided by and the profits to be realized by Fidelity from its relationships with the fund; and (iv) the extent to which, if any, economies of scale exist and would be realized as the fund grows, and whether any economies of scale are appropriately shared with fund shareholders.
In considering whether to renew the Advisory Contracts for the fund, the Board reached a determination, with the assistance of fund counsel and Independent Trustees' counsel and through the exercise of its business judgment, that the renewal of the Advisory Contracts was in the best interests of the fund and its shareholders and that the compensation payable under the Advisory Contracts was fair and reasonable. The Board's decision to renew the Advisory Contracts was not based on any single factor, but rather was based on a comprehensive consideration of all the information provided to the Board at its meetings throughout the year. The Board, in reaching its determination to renew the Advisory Contracts, was aware that shareholders of the fund have a broad range of investment choices available to them, including a wide choice among funds offered by Fidelity's competitors, and that the fund's shareholders, who have the opportunity to review and weigh the disclosure provided by the fund in its prospectus and other public disclosures, have chosen to invest in this fund, which is part of the Fidelity family of funds.
Nature, Extent, and Quality of Services Provided. The Board considered the staffing of SelectCo and the sub-advisers (together with SelectCo, the Investment Advisers) as it relates to the fund, including the backgrounds of investment personnel of SelectCo, and also considered the fund's investment objective, strategies, and related investment philosophy. The Independent Trustees also had discussions with senior management of Fidelity's investment operations and investment groups. The Board considered the structure of the investment personnel compensation program and whether this structure provides appropriate incentives to act in the best interests of the fund. Additionally, the Board considered the portfolio managers' investments, if any, in the funds that they manage.
Resources Dedicated to Investment Management and Support Services. The Board reviewed the general qualifications and capabilities of the investment staff of the Investment Advisers, including their size, education, experience, and resources, as well as Fidelity's approach to recruiting, training, managing, and compensating investment personnel. The Board noted that Fidelity has continued to increase the resources devoted to non-U.S. offices, including expansion of Fidelity's global investment organization. The Board also noted that Fidelity's analysts have extensive resources, tools and capabilities that allow them to conduct sophisticated quantitative and fundamental analysis, as well as credit analysis of issuers, counterparties and guarantors. Further, the Board considered that Fidelity's investment professionals have sufficient access to global information and data so as to provide competitive investment results over time, and that those professionals also have access to sophisticated tools that permit them to assess portfolio construction and risk and performance attribution characteristics continuously, as well as to transmit new information and research conclusions rapidly around the world. Additionally, in its deliberations, the Board considered Fidelity's trading, risk management, compliance, and technology and operations capabilities and resources, which are integral parts of the investment management process.
Shareholder and Administrative Services. The Board considered (i) the nature, extent, quality, and cost of advisory, administrative, and shareholder services performed by the Investment Advisers and their affiliates under the Advisory Contracts and under separate agreements covering transfer agency, pricing and bookkeeping, and securities lending services for the fund; (ii) the nature and extent of the supervision of third party service providers, principally custodians, subcustodians, and pricing vendors; and (iii) the resources devoted to, and the record of compliance with, the fund's compliance policies and procedures. The Board also reviewed the allocation of fund brokerage, including allocations to brokers affiliated with the Investment Advisers, the use of brokerage commissions to pay fund expenses, and the use of "soft" commission dollars to pay for research services.
The Board noted that the growth of fund assets over time across the complex allows Fidelity to reinvest in the development of services designed to enhance the value or convenience of the Fidelity funds as investment vehicles. These services include 24-hour access to account information and market information through telephone representatives and over the Internet, investor education materials and asset allocation tools, and the expanded availability of Fidelity Investor Centers.
The Board noted that in 2014 the ad hoc Committee on Transfer Agency Fees was formed by it and the boards of certain other Fidelity funds to review the variety of transfer agency services and fee structures throughout the mutual fund industry compared to Fidelity's.
Investment in a Large Fund Family. The Board considered the benefits to shareholders of investing in a Fidelity fund, including the benefits of investing in a fund that is part of a large family of funds offering a variety of investment disciplines and providing a large variety of mutual fund investor services. The Board noted that Fidelity had taken, or had made recommendations that resulted in the Fidelity funds taking, a number of actions over the previous year that benefited particular funds, including (i) continuing to dedicate additional resources to investment research and to the support of the senior management team that oversees asset management; (ii) continuing efforts to enhance Fidelity's global research capabilities; (iii) launching new funds and making other enhancements to meet client needs; (iv) reducing management fees and total expenses for certain index funds; (v) continuing to launch dedicated lower cost underlying funds to meet portfolio construction needs related to expanding underlying fund options for Fidelity funds of funds, specifically for the Freedom Fund product lines; (vi) rationalizing product lines and gaining increased efficiencies through fund mergers; (vii) continuing to develop, acquire and implement systems and technology to improve services to the funds and shareholders, strengthen information security, and increase efficiency; (viii) implementing investment enhancements to further strengthen Fidelity's target date product line to increase investors' probability of success in achieving their goals; (ix) modifying the eligibility criteria for certain share classes to accommodate roll-over assets from employer-sponsored retirement plans; (x) launching a new Class W of the Freedom Index Funds to attract and retain Fidelity record-kept retirement plan assets; and (xi) implementing changes to Fidelity's money market fund product line in response to recent regulatory reforms.
Investment Performance. The Board considered whether the fund has operated in accordance with its investment objective, as well as its record of compliance with its investment restrictions and its performance history.
The Board took into account discussions with representatives of the Investment Advisers about fund investment performance that occur at Board meetings throughout the year. In this regard the Board noted that as part of regularly scheduled fund reviews and other reports to the Board on fund performance, the Board considers annualized return information for the fund, for different time periods, measured against a securities market index ("benchmark index"). In its evaluation of fund investment performance at meetings throughout the year, the Board gave particular attention to information indicating underperformance of certain Fidelity funds for specific time periods and discussed with the Investment Advisers the reasons for such underperformance. The fund underperformed its benchmark for the one-, three-, and five-year periods ended June 30, 2015, and as a result, the Board will continue to discuss with SelectCo the steps it is taking to address the fund's underperformance.
In addition to reviewing absolute and relative fund performance, the Independent Trustees periodically consider the appropriateness of fund performance metrics in evaluating the results achieved. In general, the Independent Trustees believe that fund performance should be evaluated based on net performance (after fees and expenses) of both the highest performing and lowest performing fund share classes, where applicable, compared to appropriate benchmark indices, over appropriate time periods that may include full market cycles, taking into account relevant factors, including the following: general market conditions; issuer-specific information; and fund cash flows and other factors. Depending on the circumstances, the Independent Trustees may be satisfied with a fund's performance notwithstanding that it lags its benchmark index for certain periods.
The Independent Trustees recognize that shareholders evaluate performance on a net basis over their own holding periods, for which one-, three-, and five-year periods are often used as a proxy. For this reason, the performance information reviewed by the Board also included net cumulative total return information for the fund and an appropriate benchmark index for the most recent one-, three-, and five-year periods ended June 30, 2015.
Based on its review, the Board concluded that the nature, extent, and quality of services provided to the fund under the Advisory Contracts should benefit the shareholders of the fund.
Competitiveness of Management Fee and Total Expense Ratio. The Board considered the fund's management fee and total expense ratio compared to "mapped groups" of competitive funds and classes created for the purpose of facilitating the Trustees' analysis of the competitiveness of management fees and total expenses. Fidelity creates "mapped groups" by combining similar Lipper investment objective categories that have comparable investment mandates. For this purpose, all sector focused equity funds are grouped in the same mapped group. Combining Lipper investment objective categories aids the Board's management fee and total expense ratio comparisons by broadening the competitive group used for comparison.
Management Fee. The Board considered two proprietary management fee comparisons for the 12-month periods ended June 30 shown in basis points (BP) in the chart below. The group of Lipper funds used by the Board for management fee comparisons is referred to below as the "Total Mapped Group." The Total Mapped Group comparison focuses on a fund's standing in terms of gross management fees before expense reimbursements or caps relative to the total universe of funds with comparable investment mandates (
i.e., sector equities), regardless of whether their management fee structures also are comparable. Funds with comparable management fee structures have similar management fee contractual arrangements (
e.g., flat rate charged for advisory services, all-inclusive fee rate,
etc.). "TMG %" represents the percentage of funds in the Total Mapped Group that had management fees that were lower than the fund's. For example, a hypothetical TMG % of 20% would mean that 80% of the funds in the Total Mapped Group had higher, and 20% had lower, management fees than the fund. The fund's actual TMG %s and the number of funds in the Total Mapped Group are in the chart below. The "Asset-Size Peer Group" (ASPG) comparison focuses on a fund's standing relative to a subset of non-Fidelity funds within the Total Mapped Group that are similar in size and management fee structure. For example, if a fund is in the first quartile of the ASPG, the fund's management fee ranks in the least expensive or lowest 25% of funds in the ASPG. The ASPG represents at least 15% of the funds in the Total Mapped Group with comparable asset size and management fee structures, subject to a minimum of 50 funds (or all funds in the Total Mapped Group if fewer than 50). Additional information, such as the ASPG quartile in which the fund's management fee rate ranked, is also included in the chart and considered by the Board.
VIP Financial Services Portfolio

The Board noted that the fund's management fee rate ranked below the median of its Total Mapped Group and below the median of its ASPG for the 12-month period ended June 30, 2015.
The Board noted that, in 2014, the ad hoc Committee on Group Fee was formed by it and the boards of other Fidelity funds to conduct an in-depth review of the "group fee" component of the management fee of funds with such management fee structures. Committee focus included the mechanics of the group fee, the competitive landscape of group fee structures, Fidelity funds with no group fee component and investment products not included in group fee assets. The Board also considered that, for funds subject to the group fee, FMR agreed to voluntarily waive fees over a specified period of time in amounts designed to account for assets converted from certain funds to certain collective investment trusts.
Based on its review, the Board concluded that the fund's management fee is fair and reasonable in light of the services that the fund receives and the other factors considered.
Total Expense Ratio. In its review of each class's total expense ratio, the Board considered the fund's management fee rate as well as other fund or class expenses, as applicable, such as transfer agent fees, pricing and bookkeeping fees, and custodial, legal, and audit fees. The Board also noted that Fidelity may agree to waive fees and expenses from time to time, and the extent to which, if any, it has done so for the fund. As part of its review, the Board also considered the current and historical total expense ratios of each class of the fund compared to competitive fund median expenses. Each class of the fund is compared to those funds and classes in the Total Mapped Group (used by the Board for management fee comparisons) that have a similar sales load structure.
The Board noted that the total expense ratio of each class ranked below the competitive median for the 12-month period ended June 30, 2015.
Fees Charged to Other Fidelity Clients. The Board also considered Fidelity fee structures and other information with respect to clients of Fidelity, such as other funds advised or subadvised by Fidelity, pension plan clients, and other institutional clients with similar mandates. The Board noted the findings of the 2013 ad hoc joint committee (created with the boards of other Fidelity funds), which reviewed and compared Fidelity's institutional investment advisory business with its business of providing services to the Fidelity funds, including the differences in services provided, fees charged, and costs incurred, as well as competition in their respective marketplaces.
Based on its review of total expense ratios and fees charged to other Fidelity clients, the Board concluded that the total expense ratio of each class of the fund was reasonable in light of the services that the fund and its shareholders receive and the other factors considered.
Costs of the Services and Profitability. The Board considered the revenues earned and the expenses incurred by Fidelity in conducting the business of developing, marketing, distributing, managing, administering and servicing the fund and servicing the fund's shareholders. The Board also considered the level of Fidelity's profits in respect of all the Fidelity funds.
On an annual basis, Fidelity presents to the Board information about the profitability of its relationship with the fund. Fidelity calculates profitability information for each fund, as well as aggregate profitability information for groups of Fidelity funds and all Fidelity funds, using a series of detailed revenue and cost allocation methodologies which originate with the books and records of Fidelity on which Fidelity's audited financial statements are based. The Audit Committee of the Board reviews any significant changes from the prior year's methodologies.
PricewaterhouseCoopers LLP (PwC), independent registered public accounting firm and auditor to Fidelity and certain Fidelity funds, has been engaged annually by the Board as part of the Board's assessment of the profitability analysis used by Fidelity. PwC's engagement includes the review and assessment of Fidelity's methodologies used in determining the revenues and expenses attributable to Fidelity's mutual fund business, and completion of agreed-upon procedures in respect of the mathematical accuracy of fund profitability and its conformity to established allocation methodologies. After considering PwC's reports issued under the engagement and information provided by Fidelity, the Board concluded that while other allocation methods may also be reasonable, Fidelity's profitability methodologies are reasonable in all material respects.
The Board also reviewed Fidelity's non-fund businesses and fall-out benefits related to the mutual fund business as well as cases where Fidelity's affiliates may benefit from or be related to the fund's business.
The Board considered the costs of the services provided by and the profits realized by Fidelity in connection with the operation of the fund and was satisfied that the profitability was not excessive.
Economies of Scale. The Board considered whether there have been economies of scale in respect of the management of the Fidelity funds, whether the Fidelity funds (including the fund) have appropriately benefited from any such economies of scale, and whether there is potential for realization of any further economies of scale. The Board considered the extent to which the fund will benefit from economies of scale as assets grow through increased services to the fund, through waivers or reimbursements, or through fee or expense ratio reductions. The Board also noted that in 2013, it and the boards of other Fidelity funds created an ad hoc committee (the Economies of Scale Committee) to analyze whether Fidelity attains economies of scale in respect of the management and servicing of the Fidelity funds, whether the Fidelity funds have appropriately benefited from such economies of scale, and whether there is potential for realization of any further economies of scale.
The Board recognized that the fund's management contract incorporates a "group fee" structure, which provides for lower group fee rates as total group assets increase, and for higher group fee rates as total group assets decrease (with "group assets" defined to include fund assets under SelectCo's management plus assets under FMR's management). SelectCo calculates the group fee rates based on a tiered asset "breakpoint" schedule that varies based on asset class. The Board considered that the group fee is designed to deliver the benefits of economies of scale to fund shareholders when total group assets increase, even if assets of any particular fund are unchanged or have declined, because some portion of Fidelity's costs are attributable to services provided to all Fidelity funds, and all funds benefit if those costs can be allocated among more assets. The Board concluded that, given the group fee structure, fund shareholders will benefit from lower management fees as group assets increase at the fund complex level, regardless of whether Fidelity achieves any such economies of scale.
The Board concluded, taking into account the analysis of the Economies of Scale Committee, that economies of scale, if any, are being appropriately shared between fund shareholders and Fidelity.
Additional Information Requested by the Board. In order to develop fully the factual basis for consideration of the Fidelity funds' Advisory Contracts, the Board requested and received additional information on certain topics, including: (i) Fidelity's fund profitability methodology, profitability trends for certain funds, and the impact of certain factors on fund profitability results; (ii) portfolio manager changes that have occurred during the past year and the amount of the investment that each portfolio manager has made in the Fidelity fund(s) that he or she manages; (iii) Fidelity's compensation structure for portfolio managers, research analysts, and other key personnel, including its effects on fund profitability; (iv) the arrangements with and compensation paid to certain fund sub-advisers on behalf of the Fidelity funds; (v) Fidelity's long-term expectations for its offerings in the workplace investing channel; (vi) the methodology with respect to competitive fund data and peer group classifications; (vii) Fidelity's transfer agent fee, expense, and service structures for different funds and classes, and the impact of outsourcing, the increased use of omnibus accounts, and lower pricing in the retirement channel; and (viii) explanations regarding the relative total expense ratios of certain funds and classes, total expense competitive trends and methodologies for total expense competitive comparisons, and actions that might be taken by Fidelity to reduce total expense ratios for certain funds and classes or to achieve further economies of scale.
Based on its evaluation of all of the conclusions noted above, and after considering all factors it believed relevant, the Board concluded that the advisory fee structures are fair and reasonable, and that the fund's Advisory Contracts should be renewed.
VFSIC-SANN-0816
1.817370.111
Fidelity® Variable Insurance Products: Health Care Portfolio
Semi-Annual Report June 30, 2016 |
|
Contents
To view a fund's proxy voting guidelines and proxy voting record for the 12-month period ended June 30, visit http://www.fidelity.com/proxyvotingresults or visit the Securities and Exchange Commission's (SEC) web site at http://www.sec.gov.
You may also call 1-877-208-0098 to request a free copy of the proxy voting guidelines.
Fidelity® Variable Insurance Products are separate account options which are purchased through a variable insurance contract.
Standard & Poor's, S&P and S&P 500 are registered service marks of The McGraw-Hill Companies, Inc. and have been licensed for use by Fidelity Distributors Corporation.
Other third-party marks appearing herein are the property of their respective owners.
All other marks appearing herein are registered or unregistered trademarks or service marks of FMR LLC or an affiliated company. © 2016 FMR LLC. All rights reserved.
This report and the financial statements contained herein are submitted for the general information of the shareholders of the Fund. This report is not authorized for distribution to prospective investors in the Fund unless preceded or accompanied by an effective prospectus.
A fund files its complete schedule of portfolio holdings with the SEC for the first and third quarters of each fiscal year on Form N-Q. Forms N-Q are available on the SEC’s web site at http://www.sec.gov. A fund's Forms N-Q may be reviewed and copied at the SEC’s Public Reference Room in Washington, DC. Information regarding the operation of the SEC's Public Reference Room may be obtained by calling 1-800-SEC-0330.
For a complete list of a fund's portfolio holdings, view the most recent holdings listing, semiannual report, or annual report on Fidelity's web site at http://www.fidelity.com, http://www.institutional.fidelity.com, or http://www.401k.com, as applicable.
NOT FDIC INSURED •MAY LOSE VALUE •NO BANK GUARANTEE
Neither the Fund nor Fidelity Distributors Corporation is a bank.
Investment Summary (Unaudited)
Top Ten Stocks as of June 30, 2016
| | % of fund's net assets | % of fund's net assets 6 months ago |
| Medtronic PLC | 10.2 | 9.2 |
| Amgen, Inc. | 6.2 | 3.2 |
| Allergan PLC | 5.9 | 7.2 |
| Boston Scientific Corp. | 5.1 | 4.1 |
| Teva Pharmaceutical Industries Ltd. sponsored ADR | 3.9 | 5.8 |
| Vertex Pharmaceuticals, Inc. | 3.6 | 2.5 |
| McKesson Corp. | 3.2 | 2.6 |
| UnitedHealth Group, Inc. | 3.1 | 2.9 |
| Bristol-Myers Squibb Co. | 3.0 | 2.3 |
| Cigna Corp. | 2.7 | 2.5 |
| | 46.9 | |
Top Industries (% of fund's net assets)
| As of June 30, 2016 |
| | Health Care Equipment & Supplies | 28.0% |
| | Biotechnology | 26.5% |
| | Pharmaceuticals | 21.3% |
| | Health Care Providers & Services | 16.8% |
| | Health Care Technology | 3.5% |
| | All Others* | 3.9% |

* Includes Short-Term investments and Net Other Assets (Liabilities).
| As of December 31, 2015 |
| | Pharmaceuticals | 29.6% |
| | Biotechnology | 25.6% |
| | Health Care Equipment & Supplies | 22.7% |
| | Health Care Providers & Services | 13.5% |
| | Health Care Technology | 3.4% |
| | All Others* | 5.2% |

* Includes Short-Term investments and Net Other Assets (Liabilities).
Investments June 30, 2016 (Unaudited)
Showing Percentage of Net Assets
| Common Stocks - 99.7% | | | |
| | | Shares | Value |
| Biotechnology - 26.5% | | | |
| Biotechnology - 26.5% | | | |
| Ablynx NV (a) | | 218,900 | $2,865,715 |
| Acceleron Pharma, Inc. (a) | | 61,814 | 2,100,440 |
| Acorda Therapeutics, Inc. (a) | | 160,000 | 4,080,800 |
| Actelion Ltd. | | 35,000 | 5,893,916 |
| Advanced Accelerator Applications SA sponsored ADR | | 47,410 | 1,433,441 |
| Advaxis, Inc. (a)(b) | | 193,299 | 1,563,789 |
| Alexion Pharmaceuticals, Inc. (a) | | 180,000 | 21,016,800 |
| Alnylam Pharmaceuticals, Inc. (a) | | 61,810 | 3,429,837 |
| Amgen, Inc. | | 338,300 | 51,472,345 |
| Amicus Therapeutics, Inc. (a)(b) | | 283,700 | 1,549,002 |
| Arena Pharmaceuticals, Inc. (a) | | 884,999 | 1,513,348 |
| Array BioPharma, Inc. (a)(b) | | 450,020 | 1,602,071 |
| BeiGene Ltd. sponsored ADR (b) | | 32,600 | 971,480 |
| Biogen, Inc. (a) | | 40,548 | 9,805,317 |
| BioMarin Pharmaceutical, Inc. (a) | | 51,600 | 4,014,480 |
| bluebird bio, Inc. (a)(b) | | 17,300 | 748,917 |
| Blueprint Medicines Corp. (a) | | 69,300 | 1,403,325 |
| Celgene Corp. (a) | | 52,240 | 5,152,431 |
| Cellectis SA sponsored ADR (a)(b) | | 86,200 | 2,292,058 |
| Cytokinetics, Inc. (a) | | 56,305 | 534,334 |
| CytomX Therapeutics, Inc. (a)(b) | | 52,300 | 534,245 |
| Galapagos Genomics NV sponsored ADR (a)(b) | | 48,200 | 2,673,654 |
| Gilead Sciences, Inc. | | 212,990 | 17,767,626 |
| Heron Therapeutics, Inc. (a) | | 63,320 | 1,142,926 |
| Incyte Corp. (a) | | 25,000 | 1,999,500 |
| Insmed, Inc. (a) | | 300,000 | 2,958,000 |
| Intercept Pharmaceuticals, Inc. (a) | | 31,079 | 4,434,352 |
| Mirati Therapeutics, Inc. (a)(b) | | 64,200 | 350,532 |
| Neurocrine Biosciences, Inc. (a) | | 85,800 | 3,899,610 |
| Puma Biotechnology, Inc. (a)(b) | | 130,300 | 3,881,637 |
| Radius Health, Inc. (a)(b) | | 60,000 | 2,205,000 |
| Regeneron Pharmaceuticals, Inc. (a) | | 28,100 | 9,813,363 |
| Spark Therapeutics, Inc. (a) | | 56,348 | 2,881,073 |
| TESARO, Inc. (a)(b) | | 79,500 | 6,681,975 |
| Ultragenyx Pharmaceutical, Inc. (a) | | 75,000 | 3,668,250 |
| Vertex Pharmaceuticals, Inc. (a) | | 353,800 | 30,433,876 |
| Xencor, Inc. (a)(b) | | 114,600 | 2,176,254 |
| | | | 220,945,719 |
| Capital Markets - 0.3% | | | |
| Asset Management & Custody Banks - 0.3% | | | |
| RPI International Holdings LP (c) | | 21,133 | 2,807,519 |
| Diversified Consumer Services - 0.3% | | | |
| Specialized Consumer Services - 0.3% | | | |
| Carriage Services, Inc. | | 92,659 | 2,194,165 |
| Health Care Equipment & Supplies - 28.0% | | | |
| Health Care Equipment - 25.3% | | | |
| Atricure, Inc. (a) | | 220,000 | 3,108,600 |
| Boston Scientific Corp. (a) | | 1,830,000 | 42,767,100 |
| DexCom, Inc. (a) | | 121,550 | 9,642,562 |
| Edwards Lifesciences Corp. (a) | | 100,000 | 9,973,000 |
| Insulet Corp. (a) | | 135,800 | 4,106,592 |
| Integra LifeSciences Holdings Corp. (a) | | 98,000 | 7,818,440 |
| Intuitive Surgical, Inc. (a) | | 24,800 | 16,402,968 |
| Medtronic PLC | | 980,000 | 85,034,600 |
| Nevro Corp. (a)(b) | | 81,202 | 5,989,460 |
| NxStage Medical, Inc. (a) | | 81,816 | 1,773,771 |
| ResMed, Inc. | | 68,700 | 4,343,901 |
| Wright Medical Group NV (a) | | 460,000 | 7,990,200 |
| Zeltiq Aesthetics, Inc. (a)(b) | | 169,711 | 4,638,202 |
| Zimmer Biomet Holdings, Inc. | | 59,200 | 7,126,496 |
| | | | 210,715,892 |
| Health Care Supplies - 2.7% | | | |
| ICU Medical, Inc. (a) | | 33,200 | 3,743,300 |
| Penumbra, Inc. (a)(b) | | 109,029 | 6,487,226 |
| The Cooper Companies, Inc. | | 44,274 | 7,596,090 |
| The Spectranetics Corp. (a)(b) | | 250,000 | 4,677,500 |
| | | | 22,504,116 |
|
| TOTAL HEALTH CARE EQUIPMENT & SUPPLIES | | | 233,220,008 |
|
| Health Care Providers & Services - 16.6% | | | |
| Health Care Distributors & Services - 4.2% | | | |
| Amplifon SpA | | 316,600 | 2,963,023 |
| EBOS Group Ltd. | | 440,000 | 5,139,658 |
| McKesson Corp. | | 144,237 | 26,921,836 |
| | | | 35,024,517 |
| Health Care Facilities - 2.6% | | | |
| Brookdale Senior Living, Inc. (a) | | 169,450 | 2,616,308 |
| HCA Holdings, Inc. (a) | | 56,500 | 4,351,065 |
| Surgical Care Affiliates, Inc. (a) | | 122,300 | 5,830,041 |
| Universal Health Services, Inc. Class B | | 62,600 | 8,394,660 |
| | | | 21,192,074 |
| Health Care Services - 1.6% | | | |
| Adeptus Health, Inc. Class A (a)(b) | | 55,800 | 2,882,628 |
| American Renal Associates Holdings, Inc. | | 71,400 | 2,068,458 |
| Envision Healthcare Holdings, Inc. (a) | | 257,700 | 6,537,849 |
| United Drug PLC (United Kingdom) | | 251,400 | 1,989,500 |
| | | | 13,478,435 |
| Managed Health Care - 8.2% | | | |
| Aetna, Inc. | | 45,300 | 5,532,489 |
| Anthem, Inc. | | 91,400 | 12,004,476 |
| Cigna Corp. | | 175,200 | 22,423,848 |
| Humana, Inc. | | 15,700 | 2,824,116 |
| UnitedHealth Group, Inc. | | 181,207 | 25,586,428 |
| | | | 68,371,357 |
|
| TOTAL HEALTH CARE PROVIDERS & SERVICES | | | 138,066,383 |
|
| Health Care Technology - 3.5% | | | |
| Health Care Technology - 3.5% | | | |
| athenahealth, Inc. (a)(b) | | 97,000 | 13,386,970 |
| Castlight Health, Inc. (a) | | 104,900 | 415,404 |
| Evolent Health, Inc. (b) | | 100,575 | 1,931,040 |
| HealthStream, Inc. (a) | | 225,116 | 5,970,076 |
| Medidata Solutions, Inc. (a) | | 169,900 | 7,963,213 |
| | | | 29,666,703 |
| Life Sciences Tools & Services - 2.2% | | | |
| Life Sciences Tools & Services - 2.2% | | | |
| Agilent Technologies, Inc. | | 328,900 | 14,590,004 |
| Bruker Corp. | | 85,800 | 1,951,092 |
| PRA Health Sciences, Inc. (a) | | 39,400 | 1,645,344 |
| | | | 18,186,440 |
| Pharmaceuticals - 21.3% | | | |
| Pharmaceuticals - 21.3% | | | |
| Allergan PLC (a) | | 213,100 | 49,245,279 |
| Amphastar Pharmaceuticals, Inc. (a) | | 217,500 | 3,506,100 |
| Astellas Pharma, Inc. | | 300,000 | 4,704,703 |
| Bristol-Myers Squibb Co. | | 337,570 | 24,828,274 |
| Catalent, Inc. (a) | | 302,283 | 6,949,486 |
| Dechra Pharmaceuticals PLC | | 210,000 | 3,281,081 |
| Eisai Co. Ltd. | | 79,000 | 4,411,051 |
| Endo International PLC (a) | | 132,703 | 2,068,840 |
| GlaxoSmithKline PLC | | 283,200 | 6,081,723 |
| Horizon Pharma PLC (a) | | 225,700 | 3,717,279 |
| Jazz Pharmaceuticals PLC (a) | | 45,363 | 6,410,246 |
| Jiangsu Hengrui Medicine Co. Ltd. | | 616,264 | 3,732,404 |
| Lee's Pharmaceutical Holdings Ltd. | | 1,786,500 | 1,329,793 |
| Mylan N.V. (a) | | 65,000 | 2,810,600 |
| Pfizer, Inc. | | 144,600 | 5,091,366 |
| Prestige Brands Holdings, Inc. (a) | | 52,400 | 2,902,960 |
| SCYNEXIS, Inc. (a)(b) | | 400,000 | 868,000 |
| Sun Pharmaceutical Industries Ltd. | | 339,829 | 3,852,608 |
| Teva Pharmaceutical Industries Ltd. sponsored ADR | | 650,300 | 32,664,569 |
| The Medicines Company (a)(b) | | 108,500 | 3,648,855 |
| TherapeuticsMD, Inc. (a)(b) | | 700,000 | 5,950,000 |
| | | | 178,055,217 |
| Professional Services - 1.0% | | | |
| Human Resource & Employment Services - 1.0% | | | |
| WageWorks, Inc. (a) | | 135,900 | 8,128,179 |
| TOTAL COMMON STOCKS | | | |
| (Cost $736,518,473) | | | 831,270,333 |
|
| Convertible Preferred Stocks - 0.2% | | | |
| Health Care Providers & Services - 0.2% | | | |
| Health Care Services - 0.2% | | | |
| 1Life Healthcare, Inc. Series G (a)(c) | | | |
| (Cost $1,193,163) | | 181,172 | 1,530,903 |
|
| Money Market Funds - 5.5% | | | |
| Fidelity Cash Central Fund, 0.43% (d) | | 5,178,702 | 5,178,702 |
| Fidelity Securities Lending Cash Central Fund, 0.46% (d)(e) | | 40,738,172 | 40,738,172 |
| TOTAL MONEY MARKET FUNDS | | | |
| (Cost $45,916,874) | | | 45,916,874 |
| TOTAL INVESTMENT PORTFOLIO - 105.4% | | | |
| (Cost $783,628,510) | | | 878,718,110 |
| NET OTHER ASSETS (LIABILITIES) - (5.4)% | | | (45,025,401) |
| NET ASSETS - 100% | | | $833,692,709 |
Legend
(a) Non-income producing
(b) Security or a portion of the security is on loan at period end.
(c) Restricted securities - Investment in securities not registered under the Securities Act of 1933 (excluding 144A issues). At the end of the period, the value of restricted securities (excluding 144A issues) amounted to $4,338,422 or 0.5% of net assets.
(d) Affiliated fund that is generally available only to investment companies and other accounts managed by Fidelity Investments. The rate quoted is the annualized seven-day yield of the fund at period end. A complete unaudited listing of the fund's holdings as of its most recent quarter end is available upon request. In addition, each Fidelity Central Fund's financial statements are available on the SEC's website or upon request.
(e) Investment made with cash collateral received from securities on loan.
Additional information on each restricted holding is as follows:
| Security | Acquisition Date | Acquisition Cost |
| 1Life Healthcare, Inc. Series G | 4/10/14 | $1,193,163 |
| RPI International Holdings LP | 5/21/15 - 3/23/16 | $2,801,500 |
Affiliated Central Funds
Information regarding fiscal year to date income earned by the Fund from investments in Fidelity Central Funds is as follows:
| Fund | Income earned |
| Fidelity Cash Central Fund | $10,206 |
| Fidelity Securities Lending Cash Central Fund | 235,491 |
| Total | $245,697 |
Investment Valuation
The following is a summary of the inputs used, as of June 30, 2016, involving the Fund's assets and liabilities carried at fair value. The inputs or methodology used for valuing securities may not be an indication of the risk associated with investing in those securities. For more information on valuation inputs, and their aggregation into the levels used below, please refer to the Investment Valuation section in the accompanying Notes to Financial Statements.
| | Valuation Inputs at Reporting Date: |
| Description | Total | Level 1 | Level 2 | Level 3 |
| Investments in Securities: | | | | |
| Common Stocks | $831,270,333 | $787,357,297 | $41,105,517 | $2,807,519 |
| Convertible Preferred Stocks | 1,530,903 | -- | -- | 1,530,903 |
| Money Market Funds | 45,916,874 | 45,916,874 | -- | -- |
| Total Investments in Securities: | $878,718,110 | $833,274,171 | $41,105,517 | $4,338,422 |
The following is a summary of transfers between Level 1 and Level 2 for the period ended June 30, 2016. Transfers are assumed to have occurred at the beginning of the period, and are primarily attributable to the valuation techniques used for foreign equity securities, as discussed in the accompanying Notes to Financial Statements:
| Transfers | Total |
| Level 1 to Level 2 | $8,938,919 |
| Level 2 to Level 1 | $0 |
Other Information
Distribution of investments by country or territory of incorporation, as a percentage of Total Net Assets, is as follows (Unaudited):
| United States of America | 71.1% |
| Ireland | 17.8% |
| Israel | 3.9% |
| Netherlands | 1.3% |
| United Kingdom | 1.1% |
| Japan | 1.1% |
| Others (Individually Less Than 1%) | 3.7% |
| | 100.0% |
See accompanying notes which are an integral part of the financial statements.
Financial Statements
Statement of Assets and Liabilities
| | | June 30, 2016 (Unaudited) |
| Assets | | |
Investment in securities, at value (including securities loaned of $40,383,043) — See accompanying schedule:
Unaffiliated issuers (cost $737,711,636) | $832,801,236 | |
| Fidelity Central Funds (cost $45,916,874) | 45,916,874 | |
| Total Investments (cost $783,628,510) | | $878,718,110 |
| Cash | | 41,979 |
| Receivable for investments sold | | 1,626,340 |
| Dividends receivable | | 307,223 |
| Distributions receivable from Fidelity Central Funds | | 42,570 |
| Prepaid expenses | | 823 |
| Other receivables | | 17,970 |
| Total assets | | 880,755,015 |
| Liabilities | | |
| Payable for investments purchased | $5,031,634 | |
| Payable for fund shares redeemed | 759,166 | |
| Accrued management fee | 385,186 | |
| Other affiliated payables | 116,038 | |
| Other payables and accrued expenses | 32,110 | |
| Collateral on securities loaned, at value | 40,738,172 | |
| Total liabilities | | 47,062,306 |
| Net Assets | | $833,692,709 |
| Net Assets consist of: | | |
| Paid in capital | | $771,239,876 |
| Undistributed net investment income | | 259,498 |
| Accumulated undistributed net realized gain (loss) on investments and foreign currency transactions | | (32,887,635) |
| Net unrealized appreciation (depreciation) on investments and assets and liabilities in foreign currencies | | 95,080,970 |
| Net Assets | | $833,692,709 |
| Initial Class: | | |
| Net Asset Value, offering price and redemption price per share ($172,588,145 ÷ 7,791,087 shares) | | $22.15 |
| Investor Class: | | |
| Net Asset Value, offering price and redemption price per share ($661,104,564 ÷ 30,096,978 shares) | | $21.97 |
See accompanying notes which are an integral part of the financial statements.
Statement of Operations
| | | Six months ended June 30, 2016 (Unaudited) |
| Investment Income | | |
| Dividends | | $3,157,389 |
| Income from Fidelity Central Funds (including $235,491 from security lending) | | 245,697 |
| Total income | | 3,403,086 |
| Expenses | | |
| Management fee | $2,393,446 | |
| Transfer agent fees | 566,650 | |
| Accounting and security lending fees | 151,730 | |
| Custodian fees and expenses | 22,781 | |
| Independent trustees' fees and expenses | 9,954 | |
| Audit | 23,770 | |
| Legal | 6,061 | |
| Interest | 802 | |
| Miscellaneous | 6,959 | |
| Total expenses before reductions | 3,182,153 | |
| Expense reductions | (38,565) | 3,143,588 |
| Net investment income (loss) | | 259,498 |
| Realized and Unrealized Gain (Loss) | | |
| Net realized gain (loss) on: | | |
| Investment securities: | | |
| Unaffiliated issuers | (26,317,181) | |
| Foreign currency transactions | 4,178 | |
| Total net realized gain (loss) | | (26,313,003) |
Change in net unrealized appreciation (depreciation) on:
Investment securities | (52,654,302) | |
| Assets and liabilities in foreign currencies | (6,105) | |
| Total change in net unrealized appreciation (depreciation) | | (52,660,407) |
| Net gain (loss) | | (78,973,410) |
| Net increase (decrease) in net assets resulting from operations | | $(78,713,912) |
See accompanying notes which are an integral part of the financial statements.
Statement of Changes in Net Assets
| | Six months ended June 30, 2016 (Unaudited) | Year ended December 31, 2015 |
| Increase (Decrease) in Net Assets | | |
| Operations | | |
| Net investment income (loss) | $259,498 | $(622,053) |
| Net realized gain (loss) | (26,313,003) | 94,684,617 |
| Change in net unrealized appreciation (depreciation) | (52,660,407) | (49,851,177) |
| Net increase (decrease) in net assets resulting from operations | (78,713,912) | 44,211,387 |
| Distributions to shareholders from net realized gain | (68,524,802) | (123,218,031) |
| Share transactions - net increase (decrease) | (65,490,406) | 218,815,782 |
| Redemption fees | 59,853 | 224,880 |
| Total increase (decrease) in net assets | (212,669,267) | 140,034,018 |
| Net Assets | | |
| Beginning of period | 1,046,361,976 | 906,327,958 |
| End of period | $833,692,709 | $1,046,361,976 |
| Other Information | | |
| Undistributed net investment income end of period | $259,498 | $– |
See accompanying notes which are an integral part of the financial statements.
Financial Highlights — VIP Health Care Portfolio Initial Class
| | Six months ended (Unaudited) June 30, | Years ended December 31, | | | | |
| | 2016 | 2015 | 2014 | 2013 | 2012 | 2011 |
| Selected Per–Share Data | | | | | | |
| Net asset value, beginning of period | $25.92 | $27.70 | $22.56 | $15.51 | $13.69 | $12.64 |
| Income from Investment Operations | | | | | | |
| Net investment income (loss)A | .01 | –B | (.02) | –B | .07 | –B |
| Net realized and unrealized gain (loss) | (2.00) | 1.70 | 7.21 | 8.42 | 2.74 | 1.04 |
| Total from investment operations | (1.99) | 1.70 | 7.19 | 8.42 | 2.81 | 1.04 |
| Distributions from net investment income | – | – | – | – | (.06) | – |
| Distributions from net realized gain | (1.78) | (3.49) | (2.06) | (1.37) | (.92) | – |
| Total distributions | (1.78) | (3.49) | (2.06) | (1.37) | (.99)C | – |
| Redemption fees added to paid in capitalA | –B | .01 | .01 | –B | –B | .01 |
| Net asset value, end of period | $22.15 | $25.92 | $27.70 | $22.56 | $15.51 | $13.69 |
| Total ReturnD,E,F | (6.94)% | 6.37% | 32.83% | 56.12% | 20.81% | 8.31% |
| Ratios to Average Net AssetsG,H | | | | | | |
| Expenses before reductions | .67%I | .66% | .67% | .69% | .72% | .74% |
| Expenses net of fee waivers, if any | .67%I | .66% | .67% | .69% | .72% | .74% |
| Expenses net of all reductions | .66%I | .65% | .66% | .68% | .71% | .73% |
| Net investment income (loss) | .12%I | - %J | (.07)% | (.01)% | .47% | (.03)% |
| Supplemental Data | | | | | | |
| Net assets, end of period (000 omitted) | $172,588 | $226,283 | $236,566 | $167,493 | $69,363 | $52,430 |
| Portfolio turnover rateK | 68%I | 77% | 104% | 93% | 98% | 138% |
A Calculated based on average shares outstanding during the period.
B Amount represents less than $.005 per share.
C Total distributions of $.99 per share is comprised of distributions from net investment income of $.063 and distributions from net realized gain of $.924 per share.
D Total returns for periods of less than one year are not annualized.
E Total returns do not reflect charges attributable to your insurance company's separate account. Inclusion of these charges would reduce the total returns shown.
F Total returns would have been lower if certain expenses had not been reduced during the applicable periods shown.
G Fees and expenses of any underlying Fidelity Central Funds are not included in the Fund's expense ratio. The Fund indirectly bears its proportionate share of the expenses of any underlying Fidelity Central Funds.
H Expense ratios reflect operating expenses of the class. Expenses before reductions do not reflect amounts reimbursed by the investment adviser or reductions from brokerage service arrangements or reductions from other expense offset arrangements and do not represent the amount paid by the class during periods when reimbursements or reductions occur. Expenses net of fee waivers reflect expenses after reimbursement by the investment adviser but prior to reductions from brokerage service arrangements or other expense offset arrangements. Expenses net of all reductions represent the net expenses paid by the class.
I Annualized
J Amount represents less than .005%.
K Amount does not include the portfolio activity of any underlying Fidelity Central Funds.
See accompanying notes which are an integral part of the financial statements.
Financial Highlights — VIP Health Care Portfolio Investor Class
| | Six months ended (Unaudited) June 30, | Years ended December 31, | | | | |
| | 2016 | 2015 | 2014 | 2013 | 2012 | 2011 |
| Selected Per–Share Data | | | | | | |
| Net asset value, beginning of period | $25.73 | $27.52 | $22.43 | $15.44 | $13.63 | $12.59 |
| Income from Investment Operations | | | | | | |
| Net investment income (loss)A | –B | (.02) | (.04) | (.02) | .06 | (.01) |
| Net realized and unrealized gain (loss) | (1.98) | 1.69 | 7.17 | 8.37 | 2.73 | 1.04 |
| Total from investment operations | (1.98) | 1.67 | 7.13 | 8.35 | 2.79 | 1.03 |
| Distributions from net investment income | – | – | – | – | (.05) | – |
| Distributions from net realized gain | (1.78) | (3.47) | (2.05) | (1.36) | (.92) | – |
| Total distributions | (1.78) | (3.47) | (2.05) | (1.36) | (.98)C | – |
| Redemption fees added to paid in capitalA | –B | .01 | .01 | –B | –B | .01 |
| Net asset value, end of period | $21.97 | $25.73 | $27.52 | $22.43 | $15.44 | $13.63 |
| Total ReturnD,E,F | (6.99)% | 6.29% | 32.72% | 55.91% | 20.75% | 8.26% |
| Ratios to Average Net AssetsG,H | | | | | | |
| Expenses before reductions | .75%I | .74% | .75% | .77% | .80% | .82% |
| Expenses net of fee waivers, if any | .75%I | .74% | .75% | .77% | .80% | .82% |
| Expenses net of all reductions | .74%I | .73% | .74% | .76% | .79% | .81% |
| Net investment income (loss) | .04%I | (.08)% | (.15)% | (.10)% | .39% | (.11)% |
| Supplemental Data | | | | | | |
| Net assets, end of period (000 omitted) | $661,105 | $820,079 | $669,762 | $384,285 | $115,132 | $70,497 |
| Portfolio turnover rateJ | 68%I | 77% | 104% | 93% | 98% | 138% |
A Calculated based on average shares outstanding during the period.
B Amount represents less than $.005 per share.
C Total distributions of $.98 per share is comprised of distributions from net investment income of $.052 and distributions from net realized gain of $.924 per share.
D Total returns for periods of less than one year are not annualized.
E Total returns do not reflect charges attributable to your insurance company's separate account. Inclusion of these charges would reduce the total returns shown.
F Total returns would have been lower if certain expenses had not been reduced during the applicable periods shown.
G Fees and expenses of any underlying Fidelity Central Funds are not included in the Fund's expense ratio. The Fund indirectly bears its proportionate share of the expenses of any underlying Fidelity Central Funds.
H Expense ratios reflect operating expenses of the class. Expenses before reductions do not reflect amounts reimbursed by the investment adviser or reductions from brokerage service arrangements or reductions from other expense offset arrangements and do not represent the amount paid by the class during periods when reimbursements or reductions occur. Expenses net of fee waivers reflect expenses after reimbursement by the investment adviser but prior to reductions from brokerage service arrangements or other expense offset arrangements. Expenses net of all reductions represent the net expenses paid by the class.
I Annualized
J Amount does not include the portfolio activity of any underlying Fidelity Central Funds.
See accompanying notes which are an integral part of the financial statements.
Notes to Financial Statements (Unaudited)
For the period ended June 30, 2016
1. Organization.
VIP Health Care Portfolio (the Fund) is a non-diversified fund of Variable Insurance Products Fund IV (the Trust) and is authorized to issue an unlimited number of shares. The Trust is registered under the Investment Company Act of 1940, as amended (the 1940 Act), as an open-end management investment company organized as a Massachusetts business trust. Shares of the Fund may only be purchased by insurance companies for the purpose of funding variable annuity or variable life insurance contracts. The Fund offers the following classes of shares: Initial Class shares and Investor Class shares. All classes have equal rights and voting privileges, except for matters affecting a single class.
2. Investments in Fidelity Central Funds.
The Fund invests in Fidelity Central Funds, which are open-end investment companies generally available only to other investment companies and accounts managed by the investment adviser and its affiliates. The Fund's Schedule of Investments lists each of the Fidelity Central Funds held as of period end, if any, as an investment of the Fund, but does not include the underlying holdings of each Fidelity Central Fund. As an Investing Fund, the Fund indirectly bears its proportionate share of the expenses of the underlying Fidelity Central Funds.
The Money Market Central Funds seek preservation of capital and current income and are managed by Fidelity Investments Money Management, Inc. (FIMM), an affiliate of the investment adviser. Annualized expenses of the Money Market Central Funds as of their most recent shareholder report date are less than .005%.
A complete unaudited list of holdings for each Fidelity Central Fund is available upon request or at the Securities and Exchange Commission (the SEC) website at www.sec.gov. In addition, the financial statements of the Fidelity Central Funds are available on the SEC website or upon request.
3. Significant Accounting Policies.
The financial statements have been prepared in conformity with accounting principles generally accepted in the United States of America (GAAP), which require management to make certain estimates and assumptions at the date of the financial statements. Actual results could differ from those estimates. Subsequent events, if any, through the date that the financial statements were issued have been evaluated in the preparation of the financial statements. The following summarizes the significant accounting policies of the Fund:
Investment Valuation. Investments are valued as of 4:00 p.m. Eastern time on the last calendar day of the period. The Board of Trustees (the Board) has delegated the day to day responsibility for the valuation of the Fund's investments to the Fidelity SelectCo, LLC (SelectCo) Fair Value Committee (the Committee). In accordance with valuation policies and procedures approved by the Board, the Fund attempts to obtain prices from one or more third party pricing vendors or brokers to value its investments. When current market prices, quotations or currency exchange rates are not readily available or reliable, investments will be fair valued in good faith by the Committee, in accordance with procedures adopted by the Board. Factors used in determining fair value vary by investment type and may include market or investment specific events. The frequency with which these procedures are used cannot be predicted and they may be utilized to a significant extent. The Committee oversees the Fund's valuation policies and procedures and reports to the Board on the Committee's activities and fair value determinations. The Board monitors the appropriateness of the procedures used in valuing the Fund's investments and ratifies the fair value determinations of the Committee.
The Fund categorizes the inputs to valuation techniques used to value its investments into a disclosure hierarchy consisting of three levels as shown below:
- Level 1 – quoted prices in active markets for identical investments
- Level 2 – other significant observable inputs (including quoted prices for similar investments, interest rates, prepayment speeds, etc.)
- Level 3 – unobservable inputs (including the Fund's own assumptions based on the best information available)
Valuation techniques used to value the Fund's investments by major category are as follows:
Equity securities, including restricted securities, for which market quotations are readily available, are valued at the last reported sale price or official closing price as reported by a third party pricing vendor on the primary market or exchange on which they are traded and are categorized as Level 1 in the hierarchy. In the event there were no sales during the day or closing prices are not available, securities are valued at the last quoted bid price or may be valued using the last available price and are generally categorized as Level 2 in the hierarchy. For foreign equity securities, when market or security specific events arise, comparisons to the valuation of American Depositary Receipts (ADRs), futures contracts, Exchange-Traded Funds (ETFs) and certain indexes as well as quoted prices for similar securities may be used and would be categorized as Level 2 in the hierarchy. Utilizing these techniques may result in transfers between Level 1 and Level 2. For equity securities, including restricted securities, where observable inputs are limited, assumptions about market activity and risk are used and these securities may be categorized as Level 3 in the hierarchy.
Investments in open-end mutual funds, including the Fidelity Central Funds, are valued at their closing net asset value (NAV) each business day and are categorized as Level 1 in the hierarchy.
Changes in valuation techniques may result in transfers in or out of an assigned level within the disclosure hierarchy. The aggregate value of investments by input level as of June 30, 2016, including information on transfers between Levels 1 and 2, is included at the end of the Fund's Schedule of Investments.
Foreign Currency. The Fund may use foreign currency contracts to facilitate transactions in foreign-denominated securities. Gains and losses from these transactions may arise from changes in the value of the foreign currency or if the counterparties do not perform under the contracts' terms.
Foreign-denominated assets, including investment securities, and liabilities are translated into U.S. dollars at the exchange rates at period end. Purchases and sales of investment securities, income and dividends received and expenses denominated in foreign currencies are translated into U.S. dollars at the exchange rate in effect on the transaction date.
The effects of exchange rate fluctuations on investments are included with the net realized and unrealized gain (loss) on investment securities. Other foreign currency transactions resulting in realized and unrealized gain (loss) are disclosed separately.
Investment Transactions and Income. For financial reporting purposes, the Fund's investment holdings and NAV include trades executed through the end of the last business day of the period. The NAV per share for processing shareholder transactions is calculated as of the close of business of the New York Stock Exchange (NYSE), normally 4:00 p.m. Eastern time and includes trades executed through the end of the prior business day. Gains and losses on securities sold are determined on the basis of identified cost and may include proceeds received from litigation. Dividend income is recorded on the ex-dividend date, except for certain dividends from foreign securities where the ex-dividend date may have passed, which are recorded as soon as the Fund is informed of the ex-dividend date. Non-cash dividends included in dividend income, if any, are recorded at the fair market value of the securities received. Income and capital gain distributions from Fidelity Central Funds, if any, are recorded on the ex-dividend date. Distributions received on securities that represent a return of capital or capital gain are recorded as a reduction of cost of investments and/or as a realized gain. Subsequent to ex-dividend date the Fund determines the components of these distributions, based upon receipt of tax filings or other correspondence relating to the underlying investment. Investment income is recorded net of foreign taxes withheld where recovery of such taxes is uncertain.
Class Allocations and Expenses. Investment income, realized and unrealized capital gains and losses, common expenses of the Fund, and certain fund-level expense reductions, if any, are allocated daily on a pro-rata basis to each class based on the relative net assets of each class to the total net assets of the Fund. Each class differs with respect to transfer agent fees incurred. Certain expense reductions may also differ by class. For the reporting period, the allocated portion of income and expenses to each class as a percent of its average net assets may vary due to the timing of recording these transactions in relation to fluctuating net assets of the classes. Expenses directly attributable to a fund are charged to that fund. Expenses attributable to more than one fund are allocated among the respective funds on the basis of relative net assets or other appropriate methods. Expense estimates are accrued in the period to which they relate and adjustments are made when actual amounts are known.
Income Tax Information and Distributions to Shareholders. Each year, the Fund intends to qualify as a regulated investment company under Subchapter M of the Internal Revenue Code, including distributing substantially all of its taxable income and realized gains. As a result, no provision for U.S. Federal income taxes is required. The Fund files a U.S. federal tax return, in addition to state and local tax returns as required. The Fund's federal income tax returns are subject to examination by the Internal Revenue Service (IRS) for a period of three fiscal years after they are filed. State and local tax returns may be subject to examination for an additional fiscal year depending on the jurisdiction. Foreign taxes are provided for based on the Fund's understanding of the tax rules and rates that exist in the foreign markets in which it invests.
Distributions are declared and recorded on the ex-dividend date. Income dividends and capital gain distributions are declared separately for each class. Income and capital gain distributions are determined in accordance with income tax regulations, which may differ from GAAP.
Capital accounts within the financial statements are adjusted for permanent book-tax differences. These adjustments have no impact on net assets or the results of operations. Capital accounts are not adjusted for temporary book-tax differences which will reverse in a subsequent period.
Book-tax differences are primarily due to foreign currency transactions, passive foreign investment companies (PFIC), net operating losses and losses deferred due to wash sales.
The federal tax cost of investment securities and unrealized appreciation (depreciation) as of period end were as follows:
| Gross unrealized appreciation | $168,527,224 |
| Gross unrealized depreciation | (76,230,940) |
| Net unrealized appreciation (depreciation) on securities | $92,296,284 |
| Tax cost | $786,421,826 |
Trading (Redemption) Fees. Shares held by investors less than 60 days may be subject to a redemption fee equal to 1% of the NAV of shares redeemed. All redemption fees, which reduce the proceeds of the shareholder redemption, are retained by the Fund and accounted for as an addition to paid in capital.
Restricted Securities. The Fund may invest in securities that are subject to legal or contractual restrictions on resale. These securities generally may be resold in transactions exempt from registration or to the public if the securities are registered. Disposal of these securities may involve time-consuming negotiations and expense, and prompt sale at an acceptable price may be difficult. Information regarding restricted securities is included at the end of the Fund's Schedule of Investments.
4. Purchases and Sales of Investments.
Purchases and sales of securities, other than short-term securities, aggregated $299,832,043 and $419,272,508, respectively.
5. Fees and Other Transactions with Affiliates.
Management Fee. Fidelity SelectCo, LLC (the investment adviser) and its affiliates provide the Fund with investment management related services for which the Fund pays a monthly management fee. The management fee is the sum of an individual fund fee rate that is based on an annual rate of .30% of the Fund's average net assets and an annualized group fee rate that averaged .25% during the period. The group fee rate is based upon the average net assets of all the mutual funds advised by Fidelity Management & Research Company (FMR) and the investment adviser. The group fee rate decreases as assets under management increase and increases as assets under management decrease. For the reporting period, the total annualized management fee rate was .55% of the Fund's average net assets.
Transfer Agent Fees. Fidelity Investments Institutional Operations Company, Inc. (FIIOC), an affiliate of the investment adviser, is the Fund's transfer, dividend disbursing, and shareholder servicing agent. FIIOC receives an asset-based fee with respect to each class. Each class (with the exception of Investor Class) pays a fee for transfer agent services, typesetting, and printing and mailing of shareholder reports, excluding mailing of proxy statements, equal to an annual rate of .07% (.15% for Investor Class) of class-level average net assets. For the period, transfer agent fees for each class, were as follows:
| Initial Class | $59,922 |
| Investor Class | 506,728 |
| | $566,650 |
Accounting and Security Lending Fees. Fidelity Service Company, Inc. (FSC), an affiliate of the investment adviser, maintains the Fund's accounting records. The accounting fee is based on the level of average net assets for each month. Under a separate contract, FSC administers the security lending program. The security lending fee is based on the number and duration of lending transactions.
Brokerage Commissions. The Fund placed a portion of its portfolio transactions with brokerage firms which are affiliates of the investment adviser. Brokerage commissions are included in net realized gain (loss) and change in net unrealized appreciation (depreciation) in the Statement of Operations. The commissions paid to these affiliated firms were $7,894 for the period.
Interfund Lending Program. Pursuant to an Exemptive Order issued by the SEC, the Fund, along with other registered investment companies having management contracts with Fidelity Management & Research Company (FMR) or other affiliated entities of FMR, may participate in an interfund lending program. This program provides an alternative credit facility allowing the funds to borrow from, or lend money to, other participating affiliated funds. At period end, there were no interfund loans outstanding. The Fund's activity in this program during the period for which loans were outstanding was as follows:
| Borrower or Lender | Average Loan Balance | Weighted Average Interest Rate | Interest Expense |
| Borrower | $4,582,000 | .57% | $802 |
Interfund Trades. The Fund may purchase from or sell securities to other Fidelity Funds under procedures adopted by the Board. The procedures have been designed to ensure these interfund trades are executed in accordance with Rule 17a-7 of the 1940 Act. Interfund trades are included within the respective purchases and sales amounts shown in the Purchases and Sales of Investments note.
6. Committed Line of Credit.
The Fund participates with other funds managed by the investment adviser or an affiliate in a $4.25 billion credit facility (the "line of credit") to be utilized for temporary or emergency purposes to fund shareholder redemptions or for other short-term liquidity purposes. The Fund has agreed to pay commitment fees on its pro-rata portion of the line of credit, which amounted to $855 and is reflected in Miscellaneous expenses on the Statement of Operations. During the period, the Fund did not borrow on this line of credit.
7. Security Lending.
The Fund lends portfolio securities through a lending agent from time to time in order to earn additional income. On the settlement date of the loan, the Fund receives collateral (in the form of U.S. Treasury obligations, letters of credit and/or cash) against the loaned securities and maintains collateral in an amount not less than 100% of the market value of the loaned securities during the period of the loan. The market value of the loaned securities is determined at the close of business of the Fund and any additional required collateral is delivered to the Fund on the next business day. The Fund or borrower may terminate the loan at any time, and if the borrower defaults on its obligation to return the securities loaned because of insolvency or other reasons, the Fund may apply collateral received from the borrower against the obligation. The Fund may experience delays and costs in recovering the securities loaned. Any cash collateral received is invested in the Fidelity Securities Lending Cash Central Fund. The value of loaned securities and cash collateral at period end are disclosed on the Fund's Statement of Assets and Liabilities. Security lending income represents the income earned on investing cash collateral, less rebates paid to borrowers and any lending agent fees associated with the loan, plus any premium payments received for lending certain types of securities. Security lending income is presented in the Statement of Operations as a component of income from Fidelity Central Funds.
8. Expense Reductions.
Commissions paid to certain brokers with whom the investment adviser, or its affiliates, places trades on behalf of the Fund include an amount in addition to trade execution, which may be rebated back to the Fund to offset certain expenses. This amount totaled $34,876 for the period.
In addition, during the period the investment adviser reimbursed and/or waived a portion of the fund-level operating expenses in the amount of $3,689.
9. Distributions to Shareholders.
Distributions to shareholders of each class were as follows:
| | Six months ended
June 30, 2016 | Year ended December 31, 2015 |
| From net realized gain | | |
| Initial Class | $14,284,342 | $30,210,181 |
| Investor Class | 54,240,460 | 93,007,850 |
| Total | $68,524,802 | $123,218,031 |
10. Share Transactions.
Transactions for each class of shares were as follows:
| | Shares | Shares | Dollars | Dollars |
| | Six months ended
June 30, 2016 | Year ended December 31, 2015 | Six months ended
June 30, 2016 | Year ended December 31, 2015 |
| Initial Class | | | | |
| Shares sold | 213,852 | 1,478,196 | $4,681,644 | $41,537,933 |
| Reinvestment of distributions | 714,217 | 1,154,539 | 14,284,342 | 30,210,181 |
| Shares redeemed | (1,866,181) | (2,443,437) | (41,061,607) | (64,565,178) |
| Net increase (decrease) | (938,112) | 189,298 | $(22,095,621) | $7,182,936 |
| Investor Class | | | | |
| Shares sold | 443,638 | 7,956,795 | $9,717,310 | $222,275,001 |
| Reinvestment of distributions | 2,733,894 | 3,588,210 | 54,240,460 | 93,007,850 |
| Shares redeemed | (4,950,245) | (4,010,905) | (107,352,555) | (103,650,005) |
| Net increase (decrease) | (1,772,713) | 7,534,100 | $(43,394,785) | $211,632,846 |
11. Other.
The Fund's organizational documents provide former and current trustees and officers with a limited indemnification against liabilities arising in connection with the performance of their duties to the Fund. In the normal course of business, the Fund may also enter into contracts that provide general indemnifications. The Fund's maximum exposure under these arrangements is unknown as this would be dependent on future claims that may be made against the Fund. The risk of material loss from such claims is considered remote.
At the end of the period, the investment adviser or its affiliates were the owners of record of 100% of the total outstanding shares of the Fund.
Shareholder Expense Example
As a shareholder of the Fund, you incur two types of costs: (1) transaction costs, including redemption fees and (2) ongoing costs, including management fees and other Fund expenses. This Example is intended to help you understand your ongoing costs (in dollars) of investing in the Fund and to compare these costs with the ongoing costs of investing in other mutual funds.
The Example is based on an investment of $1,000 invested at the beginning of the period and held for the entire period (January 1, 2016 to June 30, 2016).
Actual Expenses
The first line of the accompanying table for each class of the Fund provides information about actual account values and actual expenses. You may use the information in this line, together with the amount you invested, to estimate the expenses that you paid over the period. Simply divide your account value by $1,000.00 (for example, an $8,600 account value divided by $1,000.00 = 8.6), then multiply the result by the number in the first line for a class of the Fund under the heading entitled "Expenses Paid During Period" to estimate the expenses you paid on your account during this period. The estimate of expenses does not include any fees or other expenses of any variable annuity or variable life insurance product. If they were, the estimate of expenses you paid during the period would be higher, and your ending account value would be lower. In addition, the Fund, as a shareholder in the underlying Fidelity Central Funds, will indirectly bear its pro-rata share of the fees and expenses incurred by the underlying Fidelity Central Funds. These fees and expenses are not included in the Fund's annualized expense ratio used to calculate the expense estimate in the table below.
Hypothetical Example for Comparison Purposes
The second line of the accompanying table for each class of the Fund provides information about hypothetical account values and hypothetical expenses based on a Class' actual expense ratio and an assumed rate of return of 5% per year before expenses, which is not the Class' actual return. The hypothetical account values and expenses may not be used to estimate the actual ending account balance or expenses you paid for the period. You may use this information to compare the ongoing costs of investing in the Fund and other funds. To do so, compare this 5% hypothetical example with the 5% hypothetical examples that appear in the shareholder reports of the other funds. The estimate of expenses does not include any fees or other expenses of any variable annuity or variable life insurance product. If they were, the estimate of expenses you paid during the period would be higher, and your ending account value would be lower. In addition, the Fund, as a shareholder in the underlying Fidelity Central Funds, will indirectly bear its pro-rata share of the fees and expenses incurred by the underlying Fidelity Central Funds. These fees and expenses are not included in the Fund's annualized expense ratio used to calculate the expense estimate in the table below.
Please note that the expenses shown in the table are meant to highlight your ongoing costs only and do not reflect any transaction costs. Therefore, the second line of the table is useful in comparing ongoing costs only, and will not help you determine the relative total costs of owning different funds. In addition, if these transactional costs were included, your costs would have been higher.
| | Annualized Expense Ratio-A | Beginning
Account Value
January 1, 2016 | Ending
Account Value
June 30, 2016 | Expenses Paid
During Period-B
January 1, 2016
to June 30, 2016 |
| Initial Class | .67% | | | |
| Actual | | $1,000.00 | $930.60 | $3.22 |
| Hypothetical-C | | $1,000.00 | $1,021.53 | $3.37 |
| Investor Class | .75% | | | |
| Actual | | $1,000.00 | $930.10 | $3.60 |
| Hypothetical-C | | $1,000.00 | $1,021.13 | $3.77 |
A Annualized expense ratio reflects expenses net of applicable fee waivers.
B Expenses are equal to each Class' annualized expense ratio, multiplied by the average account value over the period, multiplied by 182/366 (to reflect the one-half year period).
C 5% return per year before expenses
Board Approval of Investment Advisory Contracts and Management Fees
VIP Health Care Portfolio
Each year, the Board of Trustees, including the Independent Trustees (together, the Board), votes on the renewal of the management contract with Fidelity SelectCo, LLC (SelectCo), an affiliate of Fidelity Management & Research Company (FMR), and the sub-advisory agreements with affiliates of FMR (together, the Advisory Contracts) for the fund. The Board, assisted by the advice of fund counsel and Independent Trustees' counsel, requests and considers a broad range of information relevant to the renewal of the Advisory Contracts throughout the year.
The Board meets regularly and, at each of its meetings, covers an extensive agenda of topics and materials and considers factors that are relevant to its annual consideration of the renewal of the fund's Advisory Contracts, including the services and support provided to the fund and its shareholders. The Board has established four standing committees (Committees) — Operations, Audit, Fair Valuation, and Governance and Nominating — each composed of and chaired by Independent Trustees with varying backgrounds, to which the Board has assigned specific subject matter responsibilities in order to enhance effective decision-making by the Board. The Operations Committee, of which all of the Independent Trustees are members, meets regularly throughout the year and considers, among other matters, information specifically related to the annual consideration of the renewal of the fund's Advisory Contracts. The Board, acting directly and through its Committees, requests and receives information concerning the annual consideration of the renewal of the fund's Advisory Contracts. The Board also meets as needed to consider matters specifically related to the Board's annual consideration of the renewal of the Advisory Contracts. Members of the Board may also meet with trustees of other Fidelity funds through ad hoc joint committees to discuss certain matters relevant to all of the Fidelity funds.
At its January 2016 meeting, the Board unanimously determined to renew the fund's Advisory Contracts. In reaching its determination, the Board considered all factors it believed relevant, including (i) the nature, extent, and quality of the services to be provided to the fund and its shareholders (including the investment performance of the fund); (ii) the competitiveness of the fund's management fee and total expense ratio relative to peer funds; (iii) the total costs of the services to be provided by and the profits to be realized by Fidelity from its relationships with the fund; and (iv) the extent to which, if any, economies of scale exist and would be realized as the fund grows, and whether any economies of scale are appropriately shared with fund shareholders.
In considering whether to renew the Advisory Contracts for the fund, the Board reached a determination, with the assistance of fund counsel and Independent Trustees' counsel and through the exercise of its business judgment, that the renewal of the Advisory Contracts was in the best interests of the fund and its shareholders and that the compensation payable under the Advisory Contracts was fair and reasonable. The Board's decision to renew the Advisory Contracts was not based on any single factor, but rather was based on a comprehensive consideration of all the information provided to the Board at its meetings throughout the year. The Board, in reaching its determination to renew the Advisory Contracts, was aware that shareholders of the fund have a broad range of investment choices available to them, including a wide choice among funds offered by Fidelity's competitors, and that the fund's shareholders, who have the opportunity to review and weigh the disclosure provided by the fund in its prospectus and other public disclosures, have chosen to invest in this fund, which is part of the Fidelity family of funds.
Nature, Extent, and Quality of Services Provided. The Board considered the staffing of SelectCo and the sub-advisers (together with SelectCo, the Investment Advisers) as it relates to the fund, including the backgrounds of investment personnel of SelectCo, and also considered the fund's investment objective, strategies, and related investment philosophy. The Independent Trustees also had discussions with senior management of Fidelity's investment operations and investment groups. The Board considered the structure of the investment personnel compensation program and whether this structure provides appropriate incentives to act in the best interests of the fund. Additionally, the Board considered the portfolio managers' investments, if any, in the funds that they manage.
Resources Dedicated to Investment Management and Support Services. The Board reviewed the general qualifications and capabilities of the investment staff of the Investment Advisers, including their size, education, experience, and resources, as well as Fidelity's approach to recruiting, training, managing, and compensating investment personnel. The Board noted that Fidelity has continued to increase the resources devoted to non-U.S. offices, including expansion of Fidelity's global investment organization. The Board also noted that Fidelity's analysts have extensive resources, tools and capabilities that allow them to conduct sophisticated quantitative and fundamental analysis, as well as credit analysis of issuers, counterparties and guarantors. Further, the Board considered that Fidelity's investment professionals have sufficient access to global information and data so as to provide competitive investment results over time, and that those professionals also have access to sophisticated tools that permit them to assess portfolio construction and risk and performance attribution characteristics continuously, as well as to transmit new information and research conclusions rapidly around the world. Additionally, in its deliberations, the Board considered Fidelity's trading, risk management, compliance, and technology and operations capabilities and resources, which are integral parts of the investment management process.
Shareholder and Administrative Services. The Board considered (i) the nature, extent, quality, and cost of advisory, administrative, and shareholder services performed by the Investment Advisers and their affiliates under the Advisory Contracts and under separate agreements covering transfer agency, pricing and bookkeeping, and securities lending services for the fund; (ii) the nature and extent of the supervision of third party service providers, principally custodians, subcustodians, and pricing vendors; and (iii) the resources devoted to, and the record of compliance with, the fund's compliance policies and procedures. The Board also reviewed the allocation of fund brokerage, including allocations to brokers affiliated with the Investment Advisers, the use of brokerage commissions to pay fund expenses, and the use of "soft" commission dollars to pay for research services.
The Board noted that the growth of fund assets over time across the complex allows Fidelity to reinvest in the development of services designed to enhance the value or convenience of the Fidelity funds as investment vehicles. These services include 24-hour access to account information and market information through telephone representatives and over the Internet, investor education materials and asset allocation tools, and the expanded availability of Fidelity Investor Centers.
The Board noted that in 2014 the ad hoc Committee on Transfer Agency Fees was formed by it and the boards of certain other Fidelity funds to review the variety of transfer agency services and fee structures throughout the mutual fund industry compared to Fidelity's.
Investment in a Large Fund Family. The Board considered the benefits to shareholders of investing in a Fidelity fund, including the benefits of investing in a fund that is part of a large family of funds offering a variety of investment disciplines and providing a large variety of mutual fund investor services. The Board noted that Fidelity had taken, or had made recommendations that resulted in the Fidelity funds taking, a number of actions over the previous year that benefited particular funds, including (i) continuing to dedicate additional resources to investment research and to the support of the senior management team that oversees asset management; (ii) continuing efforts to enhance Fidelity's global research capabilities; (iii) launching new funds and making other enhancements to meet client needs; (iv) reducing management fees and total expenses for certain index funds; (v) continuing to launch dedicated lower cost underlying funds to meet portfolio construction needs related to expanding underlying fund options for Fidelity funds of funds, specifically for the Freedom Fund product lines; (vi) rationalizing product lines and gaining increased efficiencies through fund mergers; (vii) continuing to develop, acquire and implement systems and technology to improve services to the funds and shareholders, strengthen information security, and increase efficiency; (viii) implementing investment enhancements to further strengthen Fidelity's target date product line to increase investors' probability of success in achieving their goals; (ix) modifying the eligibility criteria for certain share classes to accommodate roll-over assets from employer-sponsored retirement plans; (x) launching a new Class W of the Freedom Index Funds to attract and retain Fidelity record-kept retirement plan assets; and (xi) implementing changes to Fidelity's money market fund product line in response to recent regulatory reforms.
Investment Performance. The Board considered whether the fund has operated in accordance with its investment objective, as well as its record of compliance with its investment restrictions and its performance history.
The Board took into account discussions with representatives of the Investment Advisers about fund investment performance that occur at Board meetings throughout the year. In this regard the Board noted that as part of regularly scheduled fund reviews and other reports to the Board on fund performance, the Board considers annualized return information for the fund, for different time periods, measured against a securities market index ("benchmark index"). In its evaluation of fund investment performance at meetings throughout the year, the Board gave particular attention to information indicating underperformance of certain Fidelity funds for specific time periods and discussed with the Investment Advisers the reasons for such underperformance.
In addition to reviewing absolute and relative fund performance, the Independent Trustees periodically consider the appropriateness of fund performance metrics in evaluating the results achieved. In general, the Independent Trustees believe that fund performance should be evaluated based on net performance (after fees and expenses) of both the highest performing and lowest performing fund share classes, where applicable, compared to appropriate benchmark indices, over appropriate time periods that may include full market cycles, taking into account relevant factors, including the following: general market conditions; issuer-specific information; and fund cash flows and other factors. Depending on the circumstances, the Independent Trustees may be satisfied with a fund's performance notwithstanding that it lags its benchmark index for certain periods.
The Independent Trustees recognize that shareholders evaluate performance on a net basis over their own holding periods, for which one-, three-, and five-year periods are often used as a proxy. For this reason, the performance information reviewed by the Board also included net cumulative total return information for the fund and an appropriate benchmark index for the most recent one-, three-, and five-year periods ended June 30, 2015.
Based on its review, the Board concluded that the nature, extent, and quality of services provided to the fund under the Advisory Contracts should benefit the shareholders of the fund.
Competitiveness of Management Fee and Total Expense Ratio. The Board considered the fund's management fee and total expense ratio compared to "mapped groups" of competitive funds and classes created for the purpose of facilitating the Trustees' analysis of the competitiveness of management fees and total expenses. Fidelity creates "mapped groups" by combining similar Lipper investment objective categories that have comparable investment mandates. For this purpose, all sector focused equity funds are grouped in the same mapped group. Combining Lipper investment objective categories aids the Board's management fee and total expense ratio comparisons by broadening the competitive group used for comparison.
Management Fee. The Board considered two proprietary management fee comparisons for the 12-month periods ended June 30 shown in basis points (BP) in the chart below. The group of Lipper funds used by the Board for management fee comparisons is referred to below as the "Total Mapped Group." The Total Mapped Group comparison focuses on a fund's standing in terms of gross management fees before expense reimbursements or caps relative to the total universe of funds with comparable investment mandates (
i.e., sector equities), regardless of whether their management fee structures also are comparable. Funds with comparable management fee structures have similar management fee contractual arrangements (
e.g., flat rate charged for advisory services, all-inclusive fee rate,
etc.). "TMG %" represents the percentage of funds in the Total Mapped Group that had management fees that were lower than the fund's. For example, a hypothetical TMG % of 20% would mean that 80% of the funds in the Total Mapped Group had higher, and 20% had lower, management fees than the fund. The fund's actual TMG %s and the number of funds in the Total Mapped Group are in the chart below. The "Asset-Size Peer Group" (ASPG) comparison focuses on a fund's standing relative to a subset of non-Fidelity funds within the Total Mapped Group that are similar in size and management fee structure. For example, if a fund is in the first quartile of the ASPG, the fund's management fee ranks in the least expensive or lowest 25% of funds in the ASPG. The ASPG represents at least 15% of the funds in the Total Mapped Group with comparable asset size and management fee structures, subject to a minimum of 50 funds (or all funds in the Total Mapped Group if fewer than 50). Additional information, such as the ASPG quartile in which the fund's management fee rate ranked, is also included in the chart and considered by the Board.
VIP Health Care Portfolio

The Board noted that the fund's management fee rate ranked below the median of its Total Mapped Group and below the median of its ASPG for the 12-month period ended June 30, 2015.
The Board noted that, in 2014, the ad hoc Committee on Group Fee was formed by it and the boards of other Fidelity funds to conduct an in-depth review of the "group fee" component of the management fee of funds with such management fee structures. Committee focus included the mechanics of the group fee, the competitive landscape of group fee structures, Fidelity funds with no group fee component and investment products not included in group fee assets. The Board also considered that, for funds subject to the group fee, FMR agreed to voluntarily waive fees over a specified period of time in amounts designed to account for assets converted from certain funds to certain collective investment trusts.
Based on its review, the Board concluded that the fund's management fee is fair and reasonable in light of the services that the fund receives and the other factors considered.
Total Expense Ratio. In its review of each class's total expense ratio, the Board considered the fund's management fee rate as well as other fund or class expenses, as applicable, such as transfer agent fees, pricing and bookkeeping fees, and custodial, legal, and audit fees. The Board also noted that Fidelity may agree to waive fees and expenses from time to time, and the extent to which, if any, it has done so for the fund. As part of its review, the Board also considered the current and historical total expense ratios of each class of the fund compared to competitive fund median expenses. Each class of the fund is compared to those funds and classes in the Total Mapped Group (used by the Board for management fee comparisons) that have a similar sales load structure.
The Board noted that the total expense ratio of each class ranked below the competitive median for the 12-month period ended June 30, 2015.
Fees Charged to Other Fidelity Clients. The Board also considered Fidelity fee structures and other information with respect to clients of Fidelity, such as other funds advised or subadvised by Fidelity, pension plan clients, and other institutional clients with similar mandates. The Board noted the findings of the 2013 ad hoc joint committee (created with the boards of other Fidelity funds), which reviewed and compared Fidelity's institutional investment advisory business with its business of providing services to the Fidelity funds, including the differences in services provided, fees charged, and costs incurred, as well as competition in their respective marketplaces.
Based on its review of total expense ratios and fees charged to other Fidelity clients, the Board concluded that the total expense ratio of each class of the fund was reasonable in light of the services that the fund and its shareholders receive and the other factors considered.
Costs of the Services and Profitability. The Board considered the revenues earned and the expenses incurred by Fidelity in conducting the business of developing, marketing, distributing, managing, administering and servicing the fund and servicing the fund's shareholders. The Board also considered the level of Fidelity's profits in respect of all the Fidelity funds.
On an annual basis, Fidelity presents to the Board information about the profitability of its relationship with the fund. Fidelity calculates profitability information for each fund, as well as aggregate profitability information for groups of Fidelity funds and all Fidelity funds, using a series of detailed revenue and cost allocation methodologies which originate with the books and records of Fidelity on which Fidelity's audited financial statements are based. The Audit Committee of the Board reviews any significant changes from the prior year's methodologies.
PricewaterhouseCoopers LLP (PwC), independent registered public accounting firm and auditor to Fidelity and certain Fidelity funds, has been engaged annually by the Board as part of the Board's assessment of the profitability analysis used by Fidelity. PwC's engagement includes the review and assessment of Fidelity's methodologies used in determining the revenues and expenses attributable to Fidelity's mutual fund business, and completion of agreed-upon procedures in respect of the mathematical accuracy of fund profitability and its conformity to established allocation methodologies. After considering PwC's reports issued under the engagement and information provided by Fidelity, the Board concluded that while other allocation methods may also be reasonable, Fidelity's profitability methodologies are reasonable in all material respects.
The Board also reviewed Fidelity's non-fund businesses and fall-out benefits related to the mutual fund business as well as cases where Fidelity's affiliates may benefit from or be related to the fund's business.
The Board considered the costs of the services provided by and the profits realized by Fidelity in connection with the operation of the fund and was satisfied that the profitability was not excessive.
Economies of Scale. The Board considered whether there have been economies of scale in respect of the management of the Fidelity funds, whether the Fidelity funds (including the fund) have appropriately benefited from any such economies of scale, and whether there is potential for realization of any further economies of scale. The Board considered the extent to which the fund will benefit from economies of scale as assets grow through increased services to the fund, through waivers or reimbursements, or through fee or expense ratio reductions. The Board also noted that in 2013, it and the boards of other Fidelity funds created an ad hoc committee (the Economies of Scale Committee) to analyze whether Fidelity attains economies of scale in respect of the management and servicing of the Fidelity funds, whether the Fidelity funds have appropriately benefited from such economies of scale, and whether there is potential for realization of any further economies of scale.
The Board recognized that the fund's management contract incorporates a "group fee" structure, which provides for lower group fee rates as total group assets increase, and for higher group fee rates as total group assets decrease (with "group assets" defined to include fund assets under SelectCo's management plus assets under FMR's management). SelectCo calculates the group fee rates based on a tiered asset "breakpoint" schedule that varies based on asset class. The Board considered that the group fee is designed to deliver the benefits of economies of scale to fund shareholders when total group assets increase, even if assets of any particular fund are unchanged or have declined, because some portion of Fidelity's costs are attributable to services provided to all Fidelity funds, and all funds benefit if those costs can be allocated among more assets. The Board concluded that, given the group fee structure, fund shareholders will benefit from lower management fees as group assets increase at the fund complex level, regardless of whether Fidelity achieves any such economies of scale.
The Board concluded, taking into account the analysis of the Economies of Scale Committee, that economies of scale, if any, are being appropriately shared between fund shareholders and Fidelity.
Additional Information Requested by the Board. In order to develop fully the factual basis for consideration of the Fidelity funds' Advisory Contracts, the Board requested and received additional information on certain topics, including: (i) Fidelity's fund profitability methodology, profitability trends for certain funds, and the impact of certain factors on fund profitability results; (ii) portfolio manager changes that have occurred during the past year and the amount of the investment that each portfolio manager has made in the Fidelity fund(s) that he or she manages; (iii) Fidelity's compensation structure for portfolio managers, research analysts, and other key personnel, including its effects on fund profitability; (iv) the arrangements with and compensation paid to certain fund sub-advisers on behalf of the Fidelity funds; (v) Fidelity's long-term expectations for its offerings in the workplace investing channel; (vi) the methodology with respect to competitive fund data and peer group classifications; (vii) Fidelity's transfer agent fee, expense, and service structures for different funds and classes, and the impact of outsourcing, the increased use of omnibus accounts, and lower pricing in the retirement channel; and (viii) explanations regarding the relative total expense ratios of certain funds and classes, total expense competitive trends and methodologies for total expense competitive comparisons, and actions that might be taken by Fidelity to reduce total expense ratios for certain funds and classes or to achieve further economies of scale.
Based on its evaluation of all of the conclusions noted above, and after considering all factors it believed relevant, the Board concluded that the advisory fee structures are fair and reasonable, and that the fund's Advisory Contracts should be renewed.
VHCIC-SANN-0816
1.817376.111
Fidelity® Variable Insurance Products: Industrials Portfolio
Semi-Annual Report June 30, 2016 |
|
Contents
To view a fund's proxy voting guidelines and proxy voting record for the 12-month period ended June 30, visit http://www.fidelity.com/proxyvotingresults or visit the Securities and Exchange Commission's (SEC) web site at http://www.sec.gov.
You may also call 1-877-208-0098 to request a free copy of the proxy voting guidelines.
Fidelity® Variable Insurance Products are separate account options which are purchased through a variable insurance contract.
Standard & Poor's, S&P and S&P 500 are registered service marks of The McGraw-Hill Companies, Inc. and have been licensed for use by Fidelity Distributors Corporation.
Other third-party marks appearing herein are the property of their respective owners.
All other marks appearing herein are registered or unregistered trademarks or service marks of FMR LLC or an affiliated company. © 2016 FMR LLC. All rights reserved.
This report and the financial statements contained herein are submitted for the general information of the shareholders of the Fund. This report is not authorized for distribution to prospective investors in the Fund unless preceded or accompanied by an effective prospectus.
A fund files its complete schedule of portfolio holdings with the SEC for the first and third quarters of each fiscal year on Form N-Q. Forms N-Q are available on the SEC’s web site at http://www.sec.gov. A fund's Forms N-Q may be reviewed and copied at the SEC’s Public Reference Room in Washington, DC. Information regarding the operation of the SEC's Public Reference Room may be obtained by calling 1-800-SEC-0330.
For a complete list of a fund's portfolio holdings, view the most recent holdings listing, semiannual report, or annual report on Fidelity's web site at http://www.fidelity.com, http://www.institutional.fidelity.com, or http://www.401k.com, as applicable.
NOT FDIC INSURED •MAY LOSE VALUE •NO BANK GUARANTEE
Neither the Fund nor Fidelity Distributors Corporation is a bank.
Investment Summary (Unaudited)
Top Ten Stocks as of June 30, 2016
| | % of fund's net assets | % of fund's net assets 6 months ago |
| General Electric Co. | 13.5 | 14.6 |
| Danaher Corp. | 6.8 | 7.5 |
| Honeywell International, Inc. | 5.8 | 4.7 |
| United Technologies Corp. | 4.8 | 4.8 |
| AECOM | 4.2 | 3.5 |
| J.B. Hunt Transport Services, Inc. | 4.1 | 5.3 |
| General Dynamics Corp. | 3.8 | 2.6 |
| Northrop Grumman Corp. | 3.8 | 2.6 |
| Raytheon Co. | 3.7 | 3.7 |
| Southwest Airlines Co. | 3.1 | 3.6 |
| | 53.6 | |
Top Industries (% of fund's net assets)
| As of June 30, 2016 |
| | Aerospace & Defense | 29.8% |
| | Industrial Conglomerates | 20.3% |
| | Machinery | 13.6% |
| | Electrical Equipment | 5.2% |
| | Road & Rail | 5.0% |
| | All Others* | 26.1% |

* Includes Short-Term investments and Net Other Assets (Liabilities).
| As of December 31, 2015 |
| | Aerospace & Defense | 30.8% |
| | Industrial Conglomerates | 22.1% |
| | Road & Rail | 7.3% |
| | Trading Companies & Distributors | 5.1% |
| | Commercial Services & Supplies | 4.8% |
| | All Others* | 29.9% |

* Includes Short-Term investments and Net Other Assets (Liabilities).
Investments June 30, 2016 (Unaudited)
Showing Percentage of Net Assets
| Common Stocks - 96.9% | | | |
| | | Shares | Value |
| Aerospace & Defense - 29.8% | | | |
| Aerospace & Defense - 29.8% | | | |
| BWX Technologies, Inc. | | 49,300 | $1,763,461 |
| General Dynamics Corp. | | 41,200 | 5,736,688 |
| Hexcel Corp. | | 40,400 | 1,682,256 |
| Honeywell International, Inc. | | 74,827 | 8,703,877 |
| Northrop Grumman Corp. | | 25,400 | 5,645,912 |
| Orbital ATK, Inc. | | 12,949 | 1,102,478 |
| Raytheon Co. | | 40,400 | 5,492,380 |
| Rockwell Collins, Inc. | | 12,718 | 1,082,811 |
| Teledyne Technologies, Inc. (a) | | 40,578 | 4,019,251 |
| Textron, Inc. | | 56,703 | 2,073,062 |
| United Technologies Corp. | | 70,423 | 7,221,879 |
| | | | 44,524,055 |
| Air Freight & Logistics - 0.7% | | | |
| Air Freight & Logistics - 0.7% | | | |
| C.H. Robinson Worldwide, Inc. | | 14,200 | 1,054,350 |
| Airlines - 3.1% | | | |
| Airlines - 3.1% | | | |
| Southwest Airlines Co. | | 117,900 | 4,622,859 |
| Building Products - 3.8% | | | |
| Building Products - 3.8% | | | |
| A.O. Smith Corp. | | 39,242 | 3,457,613 |
| Fortune Brands Home & Security, Inc. | | 37,100 | 2,150,687 |
| | | | 5,608,300 |
| Commercial Services & Supplies - 3.4% | | | |
| Commercial Printing - 1.0% | | | |
| Deluxe Corp. | | 23,000 | 1,526,510 |
| Office Services & Supplies - 2.4% | | | |
| Regus PLC | | 343,900 | 1,329,739 |
| West Corp. | | 110,806 | 2,178,446 |
| | | | 3,508,185 |
|
| TOTAL COMMERCIAL SERVICES & SUPPLIES | | | 5,034,695 |
|
| Construction & Engineering - 4.2% | | | |
| Construction & Engineering - 4.2% | | | |
| AECOM (a) | | 197,632 | 6,278,769 |
| Diversified Consumer Services - 1.0% | | | |
| Specialized Consumer Services - 1.0% | | | |
| ServiceMaster Global Holdings, Inc. (a) | | 38,600 | 1,536,280 |
| Electrical Equipment - 5.2% | | | |
| Electrical Components & Equipment - 5.2% | | | |
| AMETEK, Inc. | | 78,900 | 3,647,547 |
| Eaton Corp. PLC | | 54,700 | 3,267,231 |
| Regal Beloit Corp. | | 16,400 | 902,820 |
| | | | 7,817,598 |
| Industrial Conglomerates - 20.3% | | | |
| Industrial Conglomerates - 20.3% | | | |
| Danaher Corp. | | 100,185 | 10,118,685 |
| General Electric Co. | | 643,046 | 20,243,087 |
| | | | 30,361,772 |
| Machinery - 13.6% | | | |
| Construction Machinery & Heavy Trucks - 5.5% | | | |
| Allison Transmission Holdings, Inc. | | 32,401 | 914,680 |
| Caterpillar, Inc. | | 57,200 | 4,336,332 |
| Trinity Industries, Inc. | | 6,500 | 120,705 |
| Wabtec Corp. | | 39,900 | 2,802,177 |
| | | | 8,173,894 |
| Industrial Machinery - 8.1% | | | |
| Flowserve Corp. | | 20,800 | 939,536 |
| IDEX Corp. | | 32,040 | 2,630,484 |
| Ingersoll-Rand PLC | | 51,200 | 3,260,416 |
| Pentair PLC | | 42,400 | 2,471,496 |
| Rexnord Corp. (a) | | 67,300 | 1,321,099 |
| Snap-On, Inc. | | 8,500 | 1,341,470 |
| TriMas Corp. (a) | | 12,800 | 230,400 |
| | | | 12,194,901 |
|
| TOTAL MACHINERY | | | 20,368,795 |
|
| Professional Services - 2.6% | | | |
| Research & Consulting Services - 2.6% | | | |
| CEB, Inc. | | 25,700 | 1,585,176 |
| Verisk Analytics, Inc. (a) | | 29,252 | 2,371,752 |
| | | | 3,956,928 |
| Road & Rail - 5.0% | | | |
| Trucking - 5.0% | | | |
| J.B. Hunt Transport Services, Inc. | | 76,146 | 6,162,496 |
| Old Dominion Freight Lines, Inc. (a) | | 22,100 | 1,332,851 |
| | | | 7,495,347 |
| Trading Companies & Distributors - 4.2% | | | |
| Trading Companies & Distributors - 4.2% | | | |
| AerCap Holdings NV (a) | | 40,700 | 1,367,113 |
| HD Supply Holdings, Inc. (a) | | 100,900 | 3,513,338 |
| Wolseley PLC | | 26,952 | 1,395,672 |
| | | | 6,276,123 |
| TOTAL COMMON STOCKS | | | |
| (Cost $121,252,331) | | | 144,935,871 |
|
| Money Market Funds - 2.7% | | | |
| Fidelity Cash Central Fund, 0.43% (b) | | | |
| (Cost $4,085,500) | | 4,085,500 | 4,085,500 |
| TOTAL INVESTMENT PORTFOLIO - 99.6% | | | |
| (Cost $125,337,831) | | | 149,021,371 |
| NET OTHER ASSETS (LIABILITIES) - 0.4% | | | 606,154 |
| NET ASSETS - 100% | | | $149,627,525 |
Legend
(a) Non-income producing
(b) Affiliated fund that is generally available only to investment companies and other accounts managed by Fidelity Investments. The rate quoted is the annualized seven-day yield of the fund at period end. A complete unaudited listing of the fund's holdings as of its most recent quarter end is available upon request. In addition, each Fidelity Central Fund's financial statements are available on the SEC's website or upon request.
Affiliated Central Funds
Information regarding fiscal year to date income earned by the Fund from investments in Fidelity Central Funds is as follows:
| Fund | Income earned |
| Fidelity Cash Central Fund | $5,467 |
| Fidelity Securities Lending Cash Central Fund | 37 |
| Total | $5,504 |
Investment Valuation
The following is a summary of the inputs used, as of June 30, 2016, involving the Fund's assets and liabilities carried at fair value. The inputs or methodology used for valuing securities may not be an indication of the risk associated with investing in those securities. For more information on valuation inputs, and their aggregation into the levels used below, please refer to the Investment Valuation section in the accompanying Notes to Financial Statements.
| | Valuation Inputs at Reporting Date: |
| Description | Total | Level 1 | Level 2 | Level 3 |
| Investments in Securities: | | | | |
| Common Stocks | $144,935,871 | $142,210,460 | $2,725,411 | $-- |
| Money Market Funds | 4,085,500 | 4,085,500 | -- | -- |
| Total Investments in Securities: | $149,021,371 | $146,295,960 | $2,725,411 | $-- |
See accompanying notes which are an integral part of the financial statements.
Financial Statements
Statement of Assets and Liabilities
| | | June 30, 2016 (Unaudited) |
| Assets | | |
Investment in securities, at value — See accompanying schedule:
Unaffiliated issuers (cost $121,252,331) | $144,935,871 | |
| Fidelity Central Funds (cost $4,085,500) | 4,085,500 | |
| Total Investments (cost $125,337,831) | | $149,021,371 |
| Receivable for investments sold | | 889,134 |
| Receivable for fund shares sold | | 28,033 |
| Dividends receivable | | 206,205 |
| Distributions receivable from Fidelity Central Funds | | 710 |
| Prepaid expenses | | 104 |
| Other receivables | | 836 |
| Total assets | | 150,146,393 |
| Liabilities | | |
| Payable for investments purchased | $310,850 | |
| Payable for fund shares redeemed | 96,163 | |
| Accrued management fee | 68,578 | |
| Other affiliated payables | 20,988 | |
| Other payables and accrued expenses | 22,289 | |
| Total liabilities | | 518,868 |
| Net Assets | | $149,627,525 |
| Net Assets consist of: | | |
| Paid in capital | | $124,824,913 |
| Undistributed net investment income | | 549,809 |
| Accumulated undistributed net realized gain (loss) on investments and foreign currency transactions | | 569,263 |
| Net unrealized appreciation (depreciation) on investments | | 23,683,540 |
| Net Assets | | $149,627,525 |
| Initial Class: | | |
| Net Asset Value, offering price and redemption price per share ($34,475,767 ÷ 1,821,872 shares) | | $18.92 |
| Investor Class: | | |
| Net Asset Value, offering price and redemption price per share ($115,151,758 ÷ 6,123,156 shares) | | $18.81 |
See accompanying notes which are an integral part of the financial statements.
Statement of Operations
| | | Six months ended June 30, 2016 (Unaudited) |
| Investment Income | | |
| Dividends | | $1,084,807 |
| Income from Fidelity Central Funds | | 5,504 |
| Total income | | 1,090,311 |
| Expenses | | |
| Management fee | $393,829 | |
| Transfer agent fees | 91,600 | |
| Accounting and security lending fees | 27,887 | |
| Custodian fees and expenses | 4,755 | |
| Independent trustees' fees and expenses | 1,571 | |
| Audit | 20,578 | |
| Legal | 1,340 | |
| Miscellaneous | 790 | |
| Total expenses before reductions | 542,350 | |
| Expense reductions | (1,848) | 540,502 |
| Net investment income (loss) | | 549,809 |
| Realized and Unrealized Gain (Loss) | | |
| Net realized gain (loss) on: | | |
| Investment securities: | | |
| Unaffiliated issuers | 937,422 | |
| Foreign currency transactions | (208) | |
| Total net realized gain (loss) | | 937,214 |
Change in net unrealized appreciation (depreciation) on:
Investment securities | 4,365,268 | |
| Assets and liabilities in foreign currencies | 63 | |
| Total change in net unrealized appreciation (depreciation) | | 4,365,331 |
| Net gain (loss) | | 5,302,545 |
| Net increase (decrease) in net assets resulting from operations | | $5,852,354 |
See accompanying notes which are an integral part of the financial statements.
Statement of Changes in Net Assets
| | Six months ended June 30, 2016 (Unaudited) | Year ended December 31, 2015 |
| Increase (Decrease) in Net Assets | | |
| Operations | | |
| Net investment income (loss) | $549,809 | $1,198,734 |
| Net realized gain (loss) | 937,214 | 13,789,945 |
| Change in net unrealized appreciation (depreciation) | 4,365,331 | (18,122,864) |
| Net increase (decrease) in net assets resulting from operations | 5,852,354 | (3,134,185) |
| Distributions to shareholders from net investment income | – | (1,228,504) |
| Distributions to shareholders from net realized gain | (13,584,564) | (15,311,972) |
| Total distributions | (13,584,564) | (16,540,476) |
| Share transactions - net increase (decrease) | 11,079,392 | (6,897,803) |
| Redemption fees | 17,633 | 11,974 |
| Total increase (decrease) in net assets | 3,364,815 | (26,560,490) |
| Net Assets | | |
| Beginning of period | 146,262,710 | 172,823,200 |
| End of period | $149,627,525 | $146,262,710 |
| Other Information | | |
| Undistributed net investment income end of period | $549,809 | $– |
See accompanying notes which are an integral part of the financial statements.
Financial Highlights — VIP Industrials Portfolio Initial Class
| | Six months ended (Unaudited) June 30, | Years ended December 31, | | | | |
| | 2016 | 2015 | 2014 | 2013 | 2012 | 2011 |
| Selected Per–Share Data | | | | | | |
| Net asset value, beginning of period | $20.25 | $22.92 | $22.17 | $16.88 | $14.29 | $15.16 |
| Income from Investment Operations | | | | | | |
| Net investment income (loss)A | .08 | .17 | .18 | .17 | .21 | .13 |
| Net realized and unrealized gain (loss) | .51 | (.55) | 1.17 | 6.48 | 2.62 | (.85) |
| Total from investment operations | .59 | (.38) | 1.35 | 6.65 | 2.83 | (.72) |
| Distributions from net investment income | – | (.18) | (.20) | (.16) | (.24) | (.16) |
| Distributions from net realized gain | (1.92) | (2.11) | (.40) | (1.20) | – | – |
| Total distributions | (1.92) | (2.29) | (.60) | (1.36) | (.24) | (.16) |
| Redemption fees added to paid in capitalA | –B | –B | –B | –B | –B | .01 |
| Net asset value, end of period | $18.92 | $20.25 | $22.92 | $22.17 | $16.88 | $14.29 |
| Total ReturnC,D,E | 4.36% | (1.89)% | 6.21% | 39.80% | 19.82% | (4.65)% |
| Ratios to Average Net AssetsF,G | | | | | | |
| Expenses before reductions | .69%H | .69% | .69% | .72% | .74% | .74% |
| Expenses net of fee waivers, if any | .69%H | .69% | .69% | .72% | .74% | .74% |
| Expenses net of all reductions | .69%H | .69% | .69% | .72% | .73% | .73% |
| Net investment income (loss) | .83%H | .83% | .81% | .84% | 1.30% | .88% |
| Supplemental Data | | | | | | |
| Net assets, end of period (000 omitted) | $34,476 | $35,852 | $46,692 | $55,234 | $31,784 | $34,854 |
| Portfolio turnover rateI | 58%H | 69% | 70% | 64% | 80% | 111% |
A Calculated based on average shares outstanding during the period.
B Amount represents less than $.005 per share.
C Total returns for periods of less than one year are not annualized.
D Total returns do not reflect charges attributable to your insurance company's separate account. Inclusion of these charges would reduce the total returns shown.
E Total returns would have been lower if certain expenses had not been reduced during the applicable periods shown.
F Fees and expenses of any underlying Fidelity Central Funds are not included in the Fund's expense ratio. The Fund indirectly bears its proportionate share of the expenses of any underlying Fidelity Central Funds.
G Expense ratios reflect operating expenses of the class. Expenses before reductions do not reflect amounts reimbursed by the investment adviser or reductions from brokerage service arrangements or reductions from other expense offset arrangements and do not represent the amount paid by the class during periods when reimbursements or reductions occur. Expenses net of fee waivers reflect expenses after reimbursement by the investment adviser but prior to reductions from brokerage service arrangements or other expense offset arrangements. Expenses net of all reductions represent the net expenses paid by the class.
H Annualized
I Amount does not include the portfolio activity of any underlying Fidelity Central Funds.
See accompanying notes which are an integral part of the financial statements.
Financial Highlights — VIP Industrials Portfolio Investor Class
| | Six months ended (Unaudited) June 30, | Years ended December 31, | | | | |
| | 2016 | 2015 | 2014 | 2013 | 2012 | 2011 |
| Selected Per–Share Data | | | | | | |
| Net asset value, beginning of period | $20.15 | $22.82 | $22.07 | $16.81 | $14.24 | $15.10 |
| Income from Investment Operations | | | | | | |
| Net investment income (loss)A | .07 | .16 | .16 | .15 | .19 | .12 |
| Net realized and unrealized gain (loss) | .51 | (.56) | 1.17 | 6.46 | 2.61 | (.84) |
| Total from investment operations | .58 | (.40) | 1.33 | 6.61 | 2.80 | (.72) |
| Distributions from net investment income | – | (.17) | (.18) | (.15) | (.23) | (.15) |
| Distributions from net realized gain | (1.92) | (2.11) | (.40) | (1.20) | – | – |
| Total distributions | (1.92) | (2.27)B | (.58) | (1.35) | (.23) | (.15) |
| Redemption fees added to paid in capitalA | –C | –C | –C | –C | –C | .01 |
| Net asset value, end of period | $18.81 | $20.15 | $22.82 | $22.07 | $16.81 | $14.24 |
| Total ReturnD,E,F | 4.33% | (1.97)% | 6.16% | 39.72% | 19.65% | (4.70)% |
| Ratios to Average Net AssetsG,H | | | | | | |
| Expenses before reductions | .77%I | .77% | .77% | .80% | .82% | .82% |
| Expenses net of fee waivers, if any | .77%I | .77% | .77% | .80% | .82% | .82% |
| Expenses net of all reductions | .77%I | .77% | .77% | .79% | .81% | .81% |
| Net investment income (loss) | .75%I | .76% | .73% | .77% | 1.22% | .80% |
| Supplemental Data | | | | | | |
| Net assets, end of period (000 omitted) | $115,152 | $110,411 | $126,131 | $136,117 | $49,596 | $48,261 |
| Portfolio turnover rateJ | 58%I | 69% | 70% | 64% | 80% | 111% |
A Calculated based on average shares outstanding during the period.
B Total distributions of $2.27 per share is comprised of distributions from net investment income of $.166 and distributions from net realized gain of $2.105 per share.
C Amount represents less than $.005 per share.
D Total returns for periods of less than one year are not annualized.
E Total returns do not reflect charges attributable to your insurance company's separate account. Inclusion of these charges would reduce the total returns shown.
F Total returns would have been lower if certain expenses had not been reduced during the applicable periods shown.
G Fees and expenses of any underlying Fidelity Central Funds are not included in the Fund's expense ratio. The Fund indirectly bears its proportionate share of the expenses of any underlying Fidelity Central Funds.
H Expense ratios reflect operating expenses of the class. Expenses before reductions do not reflect amounts reimbursed by the investment adviser or reductions from brokerage service arrangements or reductions from other expense offset arrangements and do not represent the amount paid by the class during periods when reimbursements or reductions occur. Expenses net of fee waivers reflect expenses after reimbursement by the investment adviser but prior to reductions from brokerage service arrangements or other expense offset arrangements. Expenses net of all reductions represent the net expenses paid by the class.
I Annualized
J Amount does not include the portfolio activity of any underlying Fidelity Central Funds.
See accompanying notes which are an integral part of the financial statements.
Notes to Financial Statements (Unaudited)
For the period ended June 30, 2016
1. Organization.
VIP Industrials Portfolio (the Fund) is a non-diversified fund of Variable Insurance Products Fund IV (the Trust) and is authorized to issue an unlimited number of shares. The Trust is registered under the Investment Company Act of 1940, as amended (the 1940 Act), as an open-end management investment company organized as a Massachusetts business trust. Shares of the Fund may only be purchased by insurance companies for the purpose of funding variable annuity or variable life insurance contracts. The Fund offers the following classes of shares: Initial Class shares and Investor Class shares. All classes have equal rights and voting privileges, except for matters affecting a single class.
2. Investments in Fidelity Central Funds.
The Fund invests in Fidelity Central Funds, which are open-end investment companies generally available only to other investment companies and accounts managed by the investment adviser and its affiliates. The Fund's Schedule of Investments lists each of the Fidelity Central Funds held as of period end, if any, as an investment of the Fund, but does not include the underlying holdings of each Fidelity Central Fund. As an Investing Fund, the Fund indirectly bears its proportionate share of the expenses of the underlying Fidelity Central Funds.
The Money Market Central Funds seek preservation of capital and current income and are managed by Fidelity Investments Money Management, Inc. (FIMM), an affiliate of the investment adviser. Annualized expenses of the Money Market Central Funds as of their most recent shareholder report date are less than .005%.
A complete unaudited list of holdings for each Fidelity Central Fund is available upon request or at the Securities and Exchange Commission (the SEC) website at www.sec.gov. In addition, the financial statements of the Fidelity Central Funds are available on the SEC website or upon request.
3. Significant Accounting Policies.
The financial statements have been prepared in conformity with accounting principles generally accepted in the United States of America (GAAP), which require management to make certain estimates and assumptions at the date of the financial statements. Actual results could differ from those estimates. Subsequent events, if any, through the date that the financial statements were issued have been evaluated in the preparation of the financial statements. The following summarizes the significant accounting policies of the Fund:
Investment Valuation. Investments are valued as of 4:00 p.m. Eastern time on the last calendar day of the period. The Board of Trustees (the Board) has delegated the day to day responsibility for the valuation of the Fund's investments to the Fidelity SelectCo, LLC (SelectCo) Fair Value Committee (the Committee). In accordance with valuation policies and procedures approved by the Board, the Fund attempts to obtain prices from one or more third party pricing vendors or brokers to value its investments. When current market prices, quotations or currency exchange rates are not readily available or reliable, investments will be fair valued in good faith by the Committee, in accordance with procedures adopted by the Board. Factors used in determining fair value vary by investment type and may include market or investment specific events. The frequency with which these procedures are used cannot be predicted and they may be utilized to a significant extent. The Committee oversees the Fund's valuation policies and procedures and reports to the Board on the Committee's activities and fair value determinations. The Board monitors the appropriateness of the procedures used in valuing the Fund's investments and ratifies the fair value determinations of the Committee.
The Fund categorizes the inputs to valuation techniques used to value its investments into a disclosure hierarchy consisting of three levels as shown below:
- Level 1 – quoted prices in active markets for identical investments
- Level 2 – other significant observable inputs (including quoted prices for similar investments, interest rates, prepayment speeds, etc.)
- Level 3 – unobservable inputs (including the Fund's own assumptions based on the best information available)
Valuation techniques used to value the Fund's investments by major category are as follows:
Equity securities, including restricted securities, for which market quotations are readily available, are valued at the last reported sale price or official closing price as reported by a third party pricing vendor on the primary market or exchange on which they are traded and are categorized as Level 1 in the hierarchy. In the event there were no sales during the day or closing prices are not available, securities are valued at the last quoted bid price or may be valued using the last available price and are generally categorized as Level 2 in the hierarchy. For foreign equity securities, when market or security specific events arise, comparisons to the valuation of American Depositary Receipts (ADRs), futures contracts, Exchange-Traded Funds (ETFs) and certain indexes as well as quoted prices for similar securities may be used and would be categorized as Level 2 in the hierarchy. Utilizing these techniques may result in transfers between Level 1 and Level 2. For equity securities, including restricted securities, where observable inputs are limited, assumptions about market activity and risk are used and these securities may be categorized as Level 3 in the hierarchy.
Investments in open-end mutual funds, including the Fidelity Central Funds, are valued at their closing net asset value (NAV) each business day and are categorized as Level 1 in the hierarchy.
Changes in valuation techniques may result in transfers in or out of an assigned level within the disclosure hierarchy. The aggregate value of investments by input level as of June 30, 2016 is included at the end of the Fund's Schedule of Investments.
Foreign Currency. The Fund may use foreign currency contracts to facilitate transactions in foreign-denominated securities. Gains and losses from these transactions may arise from changes in the value of the foreign currency or if the counterparties do not perform under the contracts' terms.
Foreign-denominated assets, including investment securities, and liabilities are translated into U.S. dollars at the exchange rates at period end. Purchases and sales of investment securities, income and dividends received and expenses denominated in foreign currencies are translated into U.S. dollars at the exchange rate in effect on the transaction date.
The effects of exchange rate fluctuations on investments are included with the net realized and unrealized gain (loss) on investment securities. Other foreign currency transactions resulting in realized and unrealized gain (loss) are disclosed separately.
Investment Transactions and Income. For financial reporting purposes, the Fund's investment holdings and NAV include trades executed through the end of the last business day of the period. The NAV per share for processing shareholder transactions is calculated as of the close of business of the New York Stock Exchange (NYSE), normally 4:00 p.m. Eastern time and includes trades executed through the end of the prior business day. Gains and losses on securities sold are determined on the basis of identified cost and may include proceeds received from litigation. Dividend income is recorded on the ex-dividend date, except for certain dividends from foreign securities where the ex-dividend date may have passed, which are recorded as soon as the Fund is informed of the ex-dividend date. Non-cash dividends included in dividend income, if any, are recorded at the fair market value of the securities received. Income and capital gain distributions from Fidelity Central Funds, if any, are recorded on the ex-dividend date. Distributions received on securities that represent a return of capital or capital gain are recorded as a reduction of cost of investments and/or as a realized gain. Subsequent to ex-dividend date the Fund determines the components of these distributions, based upon receipt of tax filings or other correspondence relating to the underlying investment. Investment income is recorded net of foreign taxes withheld where recovery of such taxes is uncertain.
Class Allocations and Expenses. Investment income, realized and unrealized capital gains and losses, common expenses of the Fund, and certain fund-level expense reductions, if any, are allocated daily on a pro-rata basis to each class based on the relative net assets of each class to the total net assets of the Fund. Each class differs with respect to transfer agent fees incurred. Certain expense reductions may also differ by class. For the reporting period, the allocated portion of income and expenses to each class as a percent of its average net assets may vary due to the timing of recording these transactions in relation to fluctuating net assets of the classes. Expenses directly attributable to a fund are charged to that fund. Expenses attributable to more than one fund are allocated among the respective funds on the basis of relative net assets or other appropriate methods. Expense estimates are accrued in the period to which they relate and adjustments are made when actual amounts are known.
Income Tax Information and Distributions to Shareholders. Each year, the Fund intends to qualify as a regulated investment company under Subchapter M of the Internal Revenue Code, including distributing substantially all of its taxable income and realized gains. As a result, no provision for U.S. Federal income taxes is required. The Fund files a U.S. federal tax return, in addition to state and local tax returns as required. The Fund's federal income tax returns are subject to examination by the Internal Revenue Service (IRS) for a period of three fiscal years after they are filed. State and local tax returns may be subject to examination for an additional fiscal year depending on the jurisdiction. Foreign taxes are provided for based on the Fund's understanding of the tax rules and rates that exist in the foreign markets in which it invests.
Distributions are declared and recorded on the ex-dividend date. Income dividends and capital gain distributions are declared separately for each class. Income and capital gain distributions are determined in accordance with income tax regulations, which may differ from GAAP.
Capital accounts within the financial statements are adjusted for permanent book-tax differences. These adjustments have no impact on net assets or the results of operations. Capital accounts are not adjusted for temporary book-tax differences which will reverse in a subsequent period.
Book-tax differences are primarily due to foreign currency transactions, original issue discount and losses deferred due to wash sales.
The federal tax cost of investment securities and unrealized appreciation (depreciation) as of period end were as follows:
| Gross unrealized appreciation | $27,682,112 |
| Gross unrealized depreciation | (4,262,053) |
| Net unrealized appreciation (depreciation) on securities | $23,420,059 |
| Tax cost | $125,601,312 |
Trading (Redemption) Fees. Shares held by investors less than 60 days may be subject to a redemption fee equal to 1% of the NAV of shares redeemed. All redemption fees, which reduce the proceeds of the shareholder redemption, are retained by the Fund and accounted for as an addition to paid in capital.
4. Purchases and Sales of Investments.
Purchases and sales of securities, other than short-term securities, aggregated $41,183,882 and $44,271,059, respectively.
5. Fees and Other Transactions with Affiliates.
Management Fee. Fidelity SelectCo, LLC (the investment adviser) and its affiliates provide the Fund with investment management related services for which the Fund pays a monthly management fee. The management fee is the sum of an individual fund fee rate that is based on an annual rate of .30% of the Fund's average net assets and an annualized group fee rate that averaged .25% during the period. The group fee rate is based upon the average net assets of all the mutual funds advised by Fidelity Management & Research Company (FMR) and the investment adviser. The group fee rate decreases as assets under management increase and increases as assets under management decrease. For the reporting period, the total annualized management fee rate was .55% of the Fund's average net assets.
Transfer Agent Fees. Fidelity Investments Institutional Operations Company, Inc. (FIIOC), an affiliate of the investment adviser, is the Fund's transfer, dividend disbursing, and shareholder servicing agent. FIIOC receives an asset-based fee with respect to each class. Each class (with the exception of Investor Class) pays a fee for transfer agent services, typesetting and printing and mailing of shareholder reports, excluding mailing of proxy statements, equal to an annual rate of .07% (.15% for Investor Class) of class-level average net assets. For the period, transfer agent fees for each class were as follows:
| Initial Class | $11,225 |
| Investor Class | 80,375 |
| | $91,600 |
Accounting and Security Lending Fees. Fidelity Service Company, Inc. (FSC), an affiliate of the investment adviser, maintains the Fund's accounting records. The accounting fee is based on the level of average net assets for each month. Under a separate contract, FSC administers the security lending program. The security lending fee is based on the number and duration of lending transactions.
Brokerage Commissions. The Fund placed a portion of its portfolio transactions with brokerage firms which are affiliates of the investment adviser. Brokerage commissions are included in net realized gain (loss) and change in net unrealized appreciation (depreciation) in the Statement of Operations. The commissions paid to these affiliated firms were $838 for the period.
Interfund Trades. The Fund may purchase from or sell securities to other Fidelity Funds under procedures adopted by the Board. The procedures have been designed to ensure these interfund trades are executed in accordance with Rule 17a-7 of the 1940 Act. Interfund trades are included within the respective purchases and sales amounts shown in the Purchases and Sales of Investments note.
6. Committed Line of Credit.
The Fund participates with other funds managed by the investment adviser or an affiliate in a $4.25 billion credit facility (the "line of credit") to be utilized for temporary or emergency purposes to fund shareholder redemptions or for other short-term liquidity purposes. The Fund has agreed to pay commitment fees on its pro-rata portion of the line of credit, which amounted to $124 and is reflected in Miscellaneous expenses on the Statement of Operations. During the period, the Fund did not borrow on this line of credit.
7. Security Lending.
The Fund lends portfolio securities through a lending agent from time to time in order to earn additional income. On the settlement date of the loan, the Fund receives collateral (in the form of U.S. Treasury obligations, letters of credit and/or cash) against the loaned securities and maintains collateral in an amount not less than 100% of the market value of the loaned securities during the period of the loan. The market value of the loaned securities is determined at the close of business of the Fund and any additional required collateral is delivered to the Fund on the next business day. The Fund or borrower may terminate the loan at any time, and if the borrower defaults on its obligation to return the securities loaned because of insolvency or other reasons, the Fund may apply collateral received from the borrower against the obligation. The Fund may experience delays and costs in recovering the securities loaned. Any cash collateral received is invested in the Fidelity Securities Lending Cash Central Fund. At period end, there were no security loans outstanding. Security lending income represents the income earned on investing cash collateral, less rebates paid to borrowers and any lending agent fees associated with the loan, plus any premium payments received for lending certain types of securities. Security lending income is presented in the Statement of Operations as a component of income from Fidelity Central Funds. Total security lending income during the period amounted to $37.
8. Expense Reductions.
Commissions paid to certain brokers with whom the investment adviser, or its affiliates, places trades on behalf of the Fund include an amount in addition to trade execution, which may be rebated back to the Fund to offset certain expenses. This amount totaled $1,318 for the period. In addition, through arrangements with the Fund's custodian, credits realized as a result of certain uninvested cash balances were used to reduce the Fund's expenses. During the period, these credits reduced the Fund's custody expenses by $3.
In addition, during the period the investment adviser reimbursed and/or waived a portion of fund-level operating expenses in the amount of $527.
9. Distributions to Shareholders.
Distributions to shareholders of each class were as follows:
| | Six months ended
June 30, 2016 | Year ended December 31, 2015 |
| From net investment income | | |
| Initial Class | $– | $318,378 |
| Investor Class | – | 910,126 |
| Total | $– | $1,228,504 |
| From net realized gain | | |
| Initial Class | $3,274,688 | $4,034,538 |
| Investor Class | 10,309,876 | 11,277,434 |
| Total | $13,584,564 | $15,311,972 |
10. Share Transactions.
Transactions for each class of shares were as follows:
| | Shares | Shares | Dollars | Dollars |
| | Six months ended
June 30, 2016 | Year ended December 31, 2015 | Six months ended
June 30, 2016 | Year ended December 31, 2015 |
| Initial Class | | | | |
| Shares sold | 50,748 | 109,300 | $952,056 | $2,261,401 |
| Reinvestment of distributions | 199,433 | 208,401 | 3,274,688 | 4,352,916 |
| Shares redeemed | (198,698) | (584,161) | (3,706,623) | (12,393,683) |
| Net increase (decrease) | 51,483 | (266,460) | $520,121 | $(5,779,366) |
| Investor Class | | | | |
| Shares sold | 446,508 | 613,734 | $8,276,728 | $12,747,303 |
| Reinvestment of distributions | 631,346 | 586,625 | 10,309,876 | 12,187,560 |
| Shares redeemed | (435,251) | (1,247,826) | (8,027,333) | (26,053,300) |
| Net increase (decrease) | 642,603 | (47,467) | $10,559,271 | $(1,118,437) |
11. Other.
The Fund's organizational documents provide former and current trustees and officers with a limited indemnification against liabilities arising in connection with the performance of their duties to the Fund. In the normal course of business, the Fund may also enter into contracts that provide general indemnifications. The Fund's maximum exposure under these arrangements is unknown as this would be dependent on future claims that may be made against the Fund. The risk of material loss from such claims is considered remote.
At the end of the period, the investment adviser or its affiliates were the owners of record of 100% of the total outstanding shares of the Fund.
Board Approval of Investment Advisory Contracts and Management Fees
VIP Industrials Portfolio
Each year, the Board of Trustees, including the Independent Trustees (together, the Board), votes on the renewal of the management contract with Fidelity SelectCo, LLC (SelectCo), an affiliate of Fidelity Management & Research Company (FMR), and the sub-advisory agreements with affiliates of FMR (together, the Advisory Contracts) for the fund. The Board, assisted by the advice of fund counsel and Independent Trustees' counsel, requests and considers a broad range of information relevant to the renewal of the Advisory Contracts throughout the year.
The Board meets regularly and, at each of its meetings, covers an extensive agenda of topics and materials and considers factors that are relevant to its annual consideration of the renewal of the fund's Advisory Contracts, including the services and support provided to the fund and its shareholders. The Board has established four standing committees (Committees) — Operations, Audit, Fair Valuation, and Governance and Nominating — each composed of and chaired by Independent Trustees with varying backgrounds, to which the Board has assigned specific subject matter responsibilities in order to enhance effective decision-making by the Board. The Operations Committee, of which all of the Independent Trustees are members, meets regularly throughout the year and considers, among other matters, information specifically related to the annual consideration of the renewal of the fund's Advisory Contracts. The Board, acting directly and through its Committees, requests and receives information concerning the annual consideration of the renewal of the fund's Advisory Contracts. The Board also meets as needed to consider matters specifically related to the Board's annual consideration of the renewal of the Advisory Contracts. Members of the Board may also meet with trustees of other Fidelity funds through ad hoc joint committees to discuss certain matters relevant to all of the Fidelity funds.
At its January 2016 meeting, the Board unanimously determined to renew the fund's Advisory Contracts. In reaching its determination, the Board considered all factors it believed relevant, including (i) the nature, extent, and quality of the services to be provided to the fund and its shareholders (including the investment performance of the fund); (ii) the competitiveness of the fund's management fee and total expense ratio relative to peer funds; (iii) the total costs of the services to be provided by and the profits to be realized by Fidelity from its relationships with the fund; and (iv) the extent to which, if any, economies of scale exist and would be realized as the fund grows, and whether any economies of scale are appropriately shared with fund shareholders.
In considering whether to renew the Advisory Contracts for the fund, the Board reached a determination, with the assistance of fund counsel and Independent Trustees' counsel and through the exercise of its business judgment, that the renewal of the Advisory Contracts was in the best interests of the fund and its shareholders and that the compensation payable under the Advisory Contracts was fair and reasonable. The Board's decision to renew the Advisory Contracts was not based on any single factor, but rather was based on a comprehensive consideration of all the information provided to the Board at its meetings throughout the year. The Board, in reaching its determination to renew the Advisory Contracts, was aware that shareholders of the fund have a broad range of investment choices available to them, including a wide choice among funds offered by Fidelity's competitors, and that the fund's shareholders, who have the opportunity to review and weigh the disclosure provided by the fund in its prospectus and other public disclosures, have chosen to invest in this fund, which is part of the Fidelity family of funds.
Nature, Extent, and Quality of Services Provided. The Board considered the staffing of SelectCo and the sub-advisers (together with SelectCo, the Investment Advisers) as it relates to the fund, including the backgrounds of investment personnel of SelectCo, and also considered the fund's investment objective, strategies, and related investment philosophy. The Independent Trustees also had discussions with senior management of Fidelity's investment operations and investment groups. The Board considered the structure of the investment personnel compensation program and whether this structure provides appropriate incentives to act in the best interests of the fund. Additionally, the Board considered the portfolio managers' investments, if any, in the funds that they manage.
Resources Dedicated to Investment Management and Support Services. The Board reviewed the general qualifications and capabilities of the investment staff of the Investment Advisers, including their size, education, experience, and resources, as well as Fidelity's approach to recruiting, training, managing, and compensating investment personnel. The Board noted that Fidelity has continued to increase the resources devoted to non-U.S. offices, including expansion of Fidelity's global investment organization. The Board also noted that Fidelity's analysts have extensive resources, tools and capabilities that allow them to conduct sophisticated quantitative and fundamental analysis, as well as credit analysis of issuers, counterparties and guarantors. Further, the Board considered that Fidelity's investment professionals have sufficient access to global information and data so as to provide competitive investment results over time, and that those professionals also have access to sophisticated tools that permit them to assess portfolio construction and risk and performance attribution characteristics continuously, as well as to transmit new information and research conclusions rapidly around the world. Additionally, in its deliberations, the Board considered Fidelity's trading, risk management, compliance, and technology and operations capabilities and resources, which are integral parts of the investment management process.
Shareholder and Administrative Services. The Board considered (i) the nature, extent, quality, and cost of advisory, administrative, and shareholder services performed by the Investment Advisers and their affiliates under the Advisory Contracts and under separate agreements covering transfer agency, pricing and bookkeeping, and securities lending services for the fund; (ii) the nature and extent of the supervision of third party service providers, principally custodians, subcustodians, and pricing vendors; and (iii) the resources devoted to, and the record of compliance with, the fund's compliance policies and procedures. The Board also reviewed the allocation of fund brokerage, including allocations to brokers affiliated with the Investment Advisers, the use of brokerage commissions to pay fund expenses, and the use of "soft" commission dollars to pay for research services.
The Board noted that the growth of fund assets over time across the complex allows Fidelity to reinvest in the development of services designed to enhance the value or convenience of the Fidelity funds as investment vehicles. These services include 24-hour access to account information and market information through telephone representatives and over the Internet, investor education materials and asset allocation tools, and the expanded availability of Fidelity Investor Centers.
The Board noted that in 2014 the ad hoc Committee on Transfer Agency Fees was formed by it and the boards of certain other Fidelity funds to review the variety of transfer agency services and fee structures throughout the mutual fund industry compared to Fidelity's.
Investment in a Large Fund Family. The Board considered the benefits to shareholders of investing in a Fidelity fund, including the benefits of investing in a fund that is part of a large family of funds offering a variety of investment disciplines and providing a large variety of mutual fund investor services. The Board noted that Fidelity had taken, or had made recommendations that resulted in the Fidelity funds taking, a number of actions over the previous year that benefited particular funds, including (i) continuing to dedicate additional resources to investment research and to the support of the senior management team that oversees asset management; (ii) continuing efforts to enhance Fidelity's global research capabilities; (iii) launching new funds and making other enhancements to meet client needs; (iv) reducing management fees and total expenses for certain index funds; (v) continuing to launch dedicated lower cost underlying funds to meet portfolio construction needs related to expanding underlying fund options for Fidelity funds of funds, specifically for the Freedom Fund product lines; (vi) rationalizing product lines and gaining increased efficiencies through fund mergers; (vii) continuing to develop, acquire and implement systems and technology to improve services to the funds and shareholders, strengthen information security, and increase efficiency; (viii) implementing investment enhancements to further strengthen Fidelity's target date product line to increase investors' probability of success in achieving their goals; (ix) modifying the eligibility criteria for certain share classes to accommodate roll-over assets from employer-sponsored retirement plans; (x) launching a new Class W of the Freedom Index Funds to attract and retain Fidelity record-kept retirement plan assets; and (xi) implementing changes to Fidelity's money market fund product line in response to recent regulatory reforms.
Investment Performance. The Board considered whether the fund has operated in accordance with its investment objective, as well as its record of compliance with its investment restrictions and its performance history.
The Board took into account discussions with representatives of the Investment Advisers about fund investment performance that occur at Board meetings throughout the year. In this regard the Board noted that as part of regularly scheduled fund reviews and other reports to the Board on fund performance, the Board considers annualized return information for the fund, for different time periods, measured against a securities market index ("benchmark index"). In its evaluation of fund investment performance at meetings throughout the year, the Board gave particular attention to information indicating underperformance of certain Fidelity funds for specific time periods and discussed with the Investment Advisers the reasons for such underperformance.
In addition to reviewing absolute and relative fund performance, the Independent Trustees periodically consider the appropriateness of fund performance metrics in evaluating the results achieved. In general, the Independent Trustees believe that fund performance should be evaluated based on net performance (after fees and expenses) of both the highest performing and lowest performing fund share classes, where applicable, compared to appropriate benchmark indices, over appropriate time periods that may include full market cycles, taking into account relevant factors, including the following: general market conditions; issuer-specific information; and fund cash flows and other factors. Depending on the circumstances, the Independent Trustees may be satisfied with a fund's performance notwithstanding that it lags its benchmark index for certain periods.
The Independent Trustees recognize that shareholders evaluate performance on a net basis over their own holding periods, for which one-, three-, and five-year periods are often used as a proxy. For this reason, the performance information reviewed by the Board also included net cumulative total return information for the fund and an appropriate benchmark index for the most recent one-, three-, and five-year periods ended June 30, 2015.
Based on its review, the Board concluded that the nature, extent, and quality of services provided to the fund under the Advisory Contracts should benefit the shareholders of the fund.
Competitiveness of Management Fee and Total Expense Ratio. The Board considered the fund's management fee and total expense ratio compared to "mapped groups" of competitive funds and classes created for the purpose of facilitating the Trustees' analysis of the competitiveness of management fees and total expenses. Fidelity creates "mapped groups" by combining similar Lipper investment objective categories that have comparable investment mandates. For this purpose, all sector focused equity funds are grouped in the same mapped group. Combining Lipper investment objective categories aids the Board's management fee and total expense ratio comparisons by broadening the competitive group used for comparison.
Management Fee. The Board considered two proprietary management fee comparisons for the 12-month periods ended June 30 shown in basis points (BP) in the chart below. The group of Lipper funds used by the Board for management fee comparisons is referred to below as the "Total Mapped Group." The Total Mapped Group comparison focuses on a fund's standing in terms of gross management fees before expense reimbursements or caps relative to the total universe of funds with comparable investment mandates (
i.e., sector equities), regardless of whether their management fee structures also are comparable. Funds with comparable management fee structures have similar management fee contractual arrangements (
e.g., flat rate charged for advisory services, all-inclusive fee rate,
etc.). "TMG %" represents the percentage of funds in the Total Mapped Group that had management fees that were lower than the fund's. For example, a hypothetical TMG % of 20% would mean that 80% of the funds in the Total Mapped Group had higher, and 20% had lower, management fees than the fund. The fund's actual TMG %s and the number of funds in the Total Mapped Group are in the chart below. The "Asset-Size Peer Group" (ASPG) comparison focuses on a fund's standing relative to a subset of non-Fidelity funds within the Total Mapped Group that are similar in size and management fee structure. For example, if a fund is in the first quartile of the ASPG, the fund's management fee ranks in the least expensive or lowest 25% of funds in the ASPG. The ASPG represents at least 15% of the funds in the Total Mapped Group with comparable asset size and management fee structures, subject to a minimum of 50 funds (or all funds in the Total Mapped Group if fewer than 50). Additional information, such as the ASPG quartile in which the fund's management fee rate ranked, is also included in the chart and considered by the Board.
VIP Industrials Portfolio

The Board noted that the fund's management fee rate ranked below the median of its Total Mapped Group and below the median of its ASPG for the 12-month period ended June 30, 2015.
The Board noted that, in 2014, the ad hoc Committee on Group Fee was formed by it and the boards of other Fidelity funds to conduct an in-depth review of the "group fee" component of the management fee of funds with such management fee structures. Committee focus included the mechanics of the group fee, the competitive landscape of group fee structures, Fidelity funds with no group fee component and investment products not included in group fee assets. The Board also considered that, for funds subject to the group fee, FMR agreed to voluntarily waive fees over a specified period of time in amounts designed to account for assets converted from certain funds to certain collective investment trusts.
Based on its review, the Board concluded that the fund's management fee is fair and reasonable in light of the services that the fund receives and the other factors considered.
Total Expense Ratio. In its review of each class's total expense ratio, the Board considered the fund's management fee rate as well as other fund or class expenses, as applicable, such as transfer agent fees, pricing and bookkeeping fees, and custodial, legal, and audit fees. The Board also noted that Fidelity may agree to waive fees and expenses from time to time, and the extent to which, if any, it has done so for the fund. As part of its review, the Board also considered the current and historical total expense ratios of each class of the fund compared to competitive fund median expenses. Each class of the fund is compared to those funds and classes in the Total Mapped Group (used by the Board for management fee comparisons) that have a similar sales load structure.
The Board noted that the total expense ratio of each class ranked below the competitive median for the 12-month period ended June 30, 2015.
Fees Charged to Other Fidelity Clients. The Board also considered Fidelity fee structures and other information with respect to clients of Fidelity, such as other funds advised or subadvised by Fidelity, pension plan clients, and other institutional clients with similar mandates. The Board noted the findings of the 2013 ad hoc joint committee (created with the boards of other Fidelity funds), which reviewed and compared Fidelity's institutional investment advisory business with its business of providing services to the Fidelity funds, including the differences in services provided, fees charged, and costs incurred, as well as competition in their respective marketplaces.
Based on its review of total expense ratios and fees charged to other Fidelity clients, the Board concluded that the total expense ratio of each class of the fund was reasonable in light of the services that the fund and its shareholders receive and the other factors considered.
Costs of the Services and Profitability. The Board considered the revenues earned and the expenses incurred by Fidelity in conducting the business of developing, marketing, distributing, managing, administering and servicing the fund and servicing the fund's shareholders. The Board also considered the level of Fidelity's profits in respect of all the Fidelity funds.
On an annual basis, Fidelity presents to the Board information about the profitability of its relationship with the fund. Fidelity calculates profitability information for each fund, as well as aggregate profitability information for groups of Fidelity funds and all Fidelity funds, using a series of detailed revenue and cost allocation methodologies which originate with the books and records of Fidelity on which Fidelity's audited financial statements are based. The Audit Committee of the Board reviews any significant changes from the prior year's methodologies.
PricewaterhouseCoopers LLP (PwC), independent registered public accounting firm and auditor to Fidelity and certain Fidelity funds, has been engaged annually by the Board as part of the Board's assessment of the profitability analysis used by Fidelity. PwC's engagement includes the review and assessment of Fidelity's methodologies used in determining the revenues and expenses attributable to Fidelity's mutual fund business, and completion of agreed-upon procedures in respect of the mathematical accuracy of fund profitability and its conformity to established allocation methodologies. After considering PwC's reports issued under the engagement and information provided by Fidelity, the Board concluded that while other allocation methods may also be reasonable, Fidelity's profitability methodologies are reasonable in all material respects.
The Board also reviewed Fidelity's non-fund businesses and fall-out benefits related to the mutual fund business as well as cases where Fidelity's affiliates may benefit from or be related to the fund's business.
The Board considered the costs of the services provided by and the profits realized by Fidelity in connection with the operation of the fund and was satisfied that the profitability was not excessive.
Economies of Scale. The Board considered whether there have been economies of scale in respect of the management of the Fidelity funds, whether the Fidelity funds (including the fund) have appropriately benefited from any such economies of scale, and whether there is potential for realization of any further economies of scale. The Board considered the extent to which the fund will benefit from economies of scale as assets grow through increased services to the fund, through waivers or reimbursements, or through fee or expense ratio reductions. The Board also noted that in 2013, it and the boards of other Fidelity funds created an ad hoc committee (the Economies of Scale Committee) to analyze whether Fidelity attains economies of scale in respect of the management and servicing of the Fidelity funds, whether the Fidelity funds have appropriately benefited from such economies of scale, and whether there is potential for realization of any further economies of scale.
The Board recognized that the fund's management contract incorporates a "group fee" structure, which provides for lower group fee rates as total group assets increase, and for higher group fee rates as total group assets decrease (with "group assets" defined to include fund assets under SelectCo's management plus assets under FMR's management). SelectCo calculates the group fee rates based on a tiered asset "breakpoint" schedule that varies based on asset class. The Board considered that the group fee is designed to deliver the benefits of economies of scale to fund shareholders when total group assets increase, even if assets of any particular fund are unchanged or have declined, because some portion of Fidelity's costs are attributable to services provided to all Fidelity funds, and all funds benefit if those costs can be allocated among more assets. The Board concluded that, given the group fee structure, fund shareholders will benefit from lower management fees as group assets increase at the fund complex level, regardless of whether Fidelity achieves any such economies of scale.
The Board concluded, taking into account the analysis of the Economies of Scale Committee, that economies of scale, if any, are being appropriately shared between fund shareholders and Fidelity.
Additional Information Requested by the Board. In order to develop fully the factual basis for consideration of the Fidelity funds' Advisory Contracts, the Board requested and received additional information on certain topics, including: (i) Fidelity's fund profitability methodology, profitability trends for certain funds, and the impact of certain factors on fund profitability results; (ii) portfolio manager changes that have occurred during the past year and the amount of the investment that each portfolio manager has made in the Fidelity fund(s) that he or she manages; (iii) Fidelity's compensation structure for portfolio managers, research analysts, and other key personnel, including its effects on fund profitability; (iv) the arrangements with and compensation paid to certain fund sub-advisers on behalf of the Fidelity funds; (v) Fidelity's long-term expectations for its offerings in the workplace investing channel; (vi) the methodology with respect to competitive fund data and peer group classifications; (vii) Fidelity's transfer agent fee, expense, and service structures for different funds and classes, and the impact of outsourcing, the increased use of omnibus accounts, and lower pricing in the retirement channel; and (viii) explanations regarding the relative total expense ratios of certain funds and classes, total expense competitive trends and methodologies for total expense competitive comparisons, and actions that might be taken by Fidelity to reduce total expense ratios for certain funds and classes or to achieve further economies of scale.
Based on its evaluation of all of the conclusions noted above, and after considering all factors it believed relevant, the Board concluded that the advisory fee structures are fair and reasonable, and that the fund's Advisory Contracts should be renewed.
Shareholder Expense Example
As a shareholder of the Fund, you incur two types of costs: (1) transaction costs, including redemption fees and (2) ongoing costs, including management fees and other Fund expenses. This Example is intended to help you understand your ongoing costs (in dollars) of investing in the Fund and to compare these costs with the ongoing costs of investing in other mutual funds.
The Example is based on an investment of $1,000 invested at the beginning of the period and held for the entire period (January 1, 2016 to June 30, 2016).
Actual Expenses
The first line of the accompanying table for each class of the Fund provides information about actual account values and actual expenses. You may use the information in this line, together with the amount you invested, to estimate the expenses that you paid over the period. Simply divide your account value by $1,000.00 (for example, an $8,600 account value divided by $1,000.00 = 8.6), then multiply the result by the number in the first line for a class of the Fund under the heading entitled "Expenses Paid During Period" to estimate the expenses you paid on your account during this period. The estimate of expenses does not include any fees or other expenses of any variable annuity or variable life insurance product. If they were, the estimate of expenses you paid during the period would be higher, and your ending account value would be lower. In addition, the Fund, as a shareholder in the underlying Fidelity Central Funds, will indirectly bear its pro-rata share of the fees and expenses incurred by the underlying Fidelity Central Funds. These fees and expenses are not included in the Fund's annualized expense ratio used to calculate the expense estimate in the table below.
Hypothetical Example for Comparison Purposes
The second line of the accompanying table for each class of the Fund provides information about hypothetical account values and hypothetical expenses based on a Class' actual expense ratio and an assumed rate of return of 5% per year before expenses, which is not the Class' actual return. The hypothetical account values and expenses may not be used to estimate the actual ending account balance or expenses you paid for the period. You may use this information to compare the ongoing costs of investing in the Fund and other funds. To do so, compare this 5% hypothetical example with the 5% hypothetical examples that appear in the shareholder reports of the other funds. The estimate of expenses does not include any fees or other expenses of any variable annuity or variable life insurance product. If they were, the estimate of expenses you paid during the period would be higher, and your ending account value would be lower. In addition, the Fund, as a shareholder in the underlying Fidelity Central Funds, will indirectly bear its pro-rata share of the fees and expenses incurred by the underlying Fidelity Central Funds. These fees and expenses are not included in the Fund's annualized expense ratio used to calculate the expense estimate in the table below.
Please note that the expenses shown in the table are meant to highlight your ongoing costs only and do not reflect any transaction costs. Therefore, the second line of the table is useful in comparing ongoing costs only, and will not help you determine the relative total costs of owning different funds. In addition, if these transactional costs were included, your costs would have been higher.
| | Annualized Expense Ratio-A | Beginning
Account Value
January 1, 2016 | Ending
Account Value
June 30, 2016 | Expenses Paid
During Period-B
January 1, 2016
to June 30, 2016 |
| Initial Class | .69% | | | |
| Actual | | $1,000.00 | $1,043.60 | $3.51 |
| Hypothetical-C | | $1,000.00 | $1,021.43 | $3.47 |
| Investor Class | .77% | | | |
| Actual | | $1,000.00 | $1,043.30 | $3.91 |
| Hypothetical-C | | $1,000.00 | $1,021.03 | $3.87 |
A Annualized expense ratio reflects expenses net of applicable fee waivers.
B Expenses are equal to each Class' annualized expense ratio, multiplied by the average account value over the period, multiplied by 182/366 (to reflect the one-half year period).
C 5% return per year before expenses
VCYLIC-SANN-0816
1.817364.111
Fidelity® Variable Insurance Products: Materials Portfolio
Semi-Annual Report June 30, 2016 |
|
Contents
To view a fund's proxy voting guidelines and proxy voting record for the 12-month period ended June 30, visit http://www.fidelity.com/proxyvotingresults or visit the Securities and Exchange Commission's (SEC) web site at http://www.sec.gov.
You may also call 1-877-208-0098 to request a free copy of the proxy voting guidelines.
Fidelity® Variable Insurance Products are separate account options which are purchased through a variable insurance contract.
Standard & Poor's, S&P and S&P 500 are registered service marks of The McGraw-Hill Companies, Inc. and have been licensed for use by Fidelity Distributors Corporation.
Other third-party marks appearing herein are the property of their respective owners.
All other marks appearing herein are registered or unregistered trademarks or service marks of FMR LLC or an affiliated company. © 2016 FMR LLC. All rights reserved.
This report and the financial statements contained herein are submitted for the general information of the shareholders of the Fund. This report is not authorized for distribution to prospective investors in the Fund unless preceded or accompanied by an effective prospectus.
A fund files its complete schedule of portfolio holdings with the SEC for the first and third quarters of each fiscal year on Form N-Q. Forms N-Q are available on the SEC’s web site at http://www.sec.gov. A fund's Forms N-Q may be reviewed and copied at the SEC’s Public Reference Room in Washington, DC. Information regarding the operation of the SEC's Public Reference Room may be obtained by calling 1-800-SEC-0330.
For a complete list of a fund's portfolio holdings, view the most recent holdings listing, semiannual report, or annual report on Fidelity's web site at http://www.fidelity.com, http://www.institutional.fidelity.com, or http://www.401k.com, as applicable.
NOT FDIC INSURED •MAY LOSE VALUE •NO BANK GUARANTEE
Neither the Fund nor Fidelity Distributors Corporation is a bank.
Investment Summary (Unaudited)
Top Ten Stocks as of June 30, 2016
| | % of fund's net assets | % of fund's net assets 6 months ago |
| E.I. du Pont de Nemours & Co. | 15.0 | 12.1 |
| WestRock Co. | 7.5 | 9.0 |
| Monsanto Co. | 7.4 | 8.9 |
| Eastman Chemical Co. | 7.0 | 8.7 |
| Graphic Packaging Holding Co. | 5.6 | 4.2 |
| PPG Industries, Inc. | 5.2 | 4.8 |
| Ecolab, Inc. | 4.9 | 4.8 |
| Ball Corp. | 4.8 | 4.0 |
| The Dow Chemical Co. | 4.7 | 4.8 |
| Eagle Materials, Inc. | 4.4 | 3.5 |
| | 66.5 | |
Top Industries (% of fund's net assets)
| As of June 30, 2016 |
| | Chemicals | 69.8% |
| | Containers & Packaging | 19.6% |
| | Construction Materials | 4.4% |
| | Metals & Mining | 3.2% |
| | Trading Companies & Distributors | 0.7% |
| | All Others* | 2.3% |

* Includes Short-Term investments and Net Other Assets (Liabilities).
| As of December 31, 2015 |
| | Chemicals | 70.9% |
| | Containers & Packaging | 19.1% |
| | Construction Materials | 3.5% |
| | Metals & Mining | 3.2% |
| | Paper & Forest Products | 1.3% |
| | All Others* | 2.0% |

* Includes Short-Term investments and Net Other Assets (Liabilities).
Investments June 30, 2016 (Unaudited)
Showing Percentage of Net Assets
| Common Stocks - 97.7% | | | |
| | | Shares | Value |
| Chemicals - 69.8% | | | |
| Commodity Chemicals - 8.2% | | | |
| LyondellBasell Industries NV Class A | | 32,016 | $2,382,631 |
| Olin Corp. | | 32,000 | 794,880 |
| Orion Engineered Carbons SA | | 37,722 | 599,403 |
| Trinseo SA | | 9,800 | 420,714 |
| Westlake Chemical Corp. | | 6,200 | 266,104 |
| | | | 4,463,732 |
| Diversified Chemicals - 28.1% | | | |
| E.I. du Pont de Nemours & Co. | | 126,000 | 8,164,800 |
| Eastman Chemical Co. | | 56,635 | 3,845,517 |
| Ingevity Corp. (a) | | 22,733 | 773,831 |
| The Dow Chemical Co. | | 51,500 | 2,560,065 |
| | | | 15,344,213 |
| Fertilizers & Agricultural Chemicals - 11.3% | | | |
| Agrium, Inc. | | 6,100 | 551,901 |
| CF Industries Holdings, Inc. | | 49,200 | 1,185,720 |
| Monsanto Co. | | 38,927 | 4,025,441 |
| Potash Corp. of Saskatchewan, Inc. | | 25,400 | 412,864 |
| | | | 6,175,926 |
| Specialty Chemicals - 22.2% | | | |
| Ashland, Inc. | | 20,900 | 2,398,693 |
| Axalta Coating Systems (a) | | 7,200 | 191,016 |
| Ecolab, Inc. | | 22,528 | 2,671,821 |
| Frutarom Industries Ltd. | | 9,200 | 422,879 |
| NewMarket Corp. | | 1,929 | 799,339 |
| PPG Industries, Inc. | | 27,200 | 2,832,880 |
| Valspar Corp. | | 4,900 | 529,347 |
| W.R. Grace & Co. | | 31,546 | 2,309,483 |
| | | | 12,155,458 |
|
| TOTAL CHEMICALS | | | 38,139,329 |
|
| Construction Materials - 4.4% | | | |
| Construction Materials - 4.4% | | | |
| Eagle Materials, Inc. | | 31,488 | 2,429,299 |
| Containers & Packaging - 19.6% | | | |
| Metal & Glass Containers - 4.8% | | | |
| Ball Corp. (b) | | 36,700 | 2,653,043 |
| Paper Packaging - 14.8% | | | |
| Graphic Packaging Holding Co. | | 242,200 | 3,037,188 |
| Sealed Air Corp. | | 20,600 | 946,982 |
| WestRock Co. | | 105,298 | 4,092,933 |
| | | | 8,077,103 |
|
| TOTAL CONTAINERS & PACKAGING | | | 10,730,146 |
|
| Metals & Mining - 3.2% | | | |
| Diversified Metals & Mining - 3.2% | | | |
| Compass Minerals International, Inc. | | 11,800 | 875,442 |
| Rio Tinto PLC | | 27,500 | 854,330 |
| | | | 1,729,772 |
| Trading Companies & Distributors - 0.7% | | | |
| Trading Companies & Distributors - 0.7% | | | |
| Nexeo Solutions, Inc. (a) | | 6,000 | 53,880 |
| Nexeo Solutions, Inc. (a)(c) | | 39,000 | 332,709 |
| | | | 386,589 |
| TOTAL COMMON STOCKS | | | |
| (Cost $47,032,505) | | | 53,415,135 |
|
| Money Market Funds - 7.1% | | | |
| Fidelity Cash Central Fund, 0.43% (d) | | 1,191,972 | 1,191,972 |
| Fidelity Securities Lending Cash Central Fund, 0.46% (d)(e) | | 2,679,100 | 2,679,100 |
| TOTAL MONEY MARKET FUNDS | | | |
| (Cost $3,871,072) | | | 3,871,072 |
| TOTAL INVESTMENT PORTFOLIO - 104.8% | | | |
| (Cost $50,903,577) | | | 57,286,207 |
| NET OTHER ASSETS (LIABILITIES) - (4.8)% | | | (2,648,103) |
| NET ASSETS - 100% | | | $54,638,104 |
Legend
(a) Non-income producing
(b) Security or a portion of the security is on loan at period end.
(c) Restricted securities - Investment in securities not registered under the Securities Act of 1933 (excluding 144A issues). At the end of the period, the value of restricted securities (excluding 144A issues) amounted to $332,709 or 0.6% of net assets.
(d) Affiliated fund that is generally available only to investment companies and other accounts managed by Fidelity Investments. The rate quoted is the annualized seven-day yield of the fund at period end. A complete unaudited listing of the fund's holdings as of its most recent quarter end is available upon request. In addition, each Fidelity Central Fund's financial statements are available on the SEC's website or upon request.
(e) Investment made with cash collateral received from securities on loan.
Additional information on each restricted holding is as follows:
| Security | Acquisition Date | Acquisition Cost |
| Nexeo Solutions, Inc. | 6/9/16 | $390,000 |
Affiliated Central Funds
Information regarding fiscal year to date income earned by the Fund from investments in Fidelity Central Funds is as follows:
| Fund | Income earned |
| Fidelity Cash Central Fund | $1,888 |
| Fidelity Securities Lending Cash Central Fund | 3,154 |
| Total | $5,042 |
Investment Valuation
The following is a summary of the inputs used, as of June 30, 2016, involving the Fund's assets and liabilities carried at fair value. The inputs or methodology used for valuing securities may not be an indication of the risk associated with investing in those securities. For more information on valuation inputs, and their aggregation into the levels used below, please refer to the Investment Valuation section in the accompanying Notes to Financial Statements.
| | Valuation Inputs at Reporting Date: |
| Description | Total | Level 1 | Level 2 | Level 3 |
| Investments in Securities: | | | | |
| Common Stocks | $53,415,135 | $52,228,096 | $1,187,039 | $-- |
| Money Market Funds | 3,871,072 | 3,871,072 | -- | -- |
| Total Investments in Securities: | $57,286,207 | $56,099,168 | $1,187,039 | $-- |
Other Information
Distribution of investments by country or territory of incorporation, as a percentage of Total Net Assets, is as follows (Unaudited):
| United States of America | 89.3% |
| Netherlands | 4.4% |
| Luxembourg | 1.9% |
| Canada | 1.7% |
| United Kingdom | 1.6% |
| Others (Individually Less Than 1%) | 1.1% |
| | 100.0% |
See accompanying notes which are an integral part of the financial statements.
Financial Statements
Statement of Assets and Liabilities
| | | June 30, 2016 (Unaudited) |
| Assets | | |
Investment in securities, at value (including securities loaned of $2,653,043) — See accompanying schedule:
Unaffiliated issuers (cost $47,032,505) | $53,415,135 | |
| Fidelity Central Funds (cost $3,871,072) | 3,871,072 | |
| Total Investments (cost $50,903,577) | | $57,286,207 |
| Cash | | 17,510 |
| Receivable for investments sold | | 92,462 |
| Receivable for fund shares sold | | 2,469 |
| Dividends receivable | | 80,203 |
| Distributions receivable from Fidelity Central Funds | | 1,057 |
| Prepaid expenses | | 41 |
| Other receivables | | 743 |
| Total assets | | 57,480,692 |
| Liabilities | | |
| Payable for fund shares redeemed | $108,676 | |
| Accrued management fee | 25,648 | |
| Other affiliated payables | 7,930 | |
| Other payables and accrued expenses | 21,234 | |
| Collateral on securities loaned, at value | 2,679,100 | |
| Total liabilities | | 2,842,588 |
| Net Assets | | $54,638,104 |
| Net Assets consist of: | | |
| Paid in capital | | $48,046,355 |
| Undistributed net investment income | | 369,881 |
| Accumulated undistributed net realized gain (loss) on investments and foreign currency transactions | | (160,759) |
| Net unrealized appreciation (depreciation) on investments and assets and liabilities in foreign currencies | | 6,382,627 |
| Net Assets | | $54,638,104 |
| Initial Class: | | |
| Net Asset Value, offering price and redemption price per share ($11,320,253 ÷ 938,253 shares) | | $12.07 |
| Investor Class: | | |
| Net Asset Value, offering price and redemption price per share ($43,317,851 ÷ 3,592,583 shares) | | $12.06 |
See accompanying notes which are an integral part of the financial statements.
Statement of Operations
| | | Six months ended June 30, 2016 (Unaudited) |
| Investment Income | | |
| Dividends | | $569,306 |
| Income from Fidelity Central Funds | | 5,042 |
| Total income | | 574,348 |
| Expenses | | |
| Management fee | $136,947 | |
| Transfer agent fees | 32,250 | |
| Accounting and security lending fees | 9,749 | |
| Custodian fees and expenses | 4,686 | |
| Independent trustees' fees and expenses | 541 | |
| Audit | 20,662 | |
| Legal | 518 | |
| Miscellaneous | 305 | |
| Total expenses before reductions | 205,658 | |
| Expense reductions | (1,756) | 203,902 |
| Net investment income (loss) | | 370,446 |
| Realized and Unrealized Gain (Loss) | | |
| Net realized gain (loss) on: | | |
| Investment securities: | | |
| Unaffiliated issuers | 306,843 | |
| Foreign currency transactions | (1,127) | |
| Total net realized gain (loss) | | 305,716 |
Change in net unrealized appreciation (depreciation) on:
Investment securities | 36,129 | |
| Assets and liabilities in foreign currencies | 114 | |
| Total change in net unrealized appreciation (depreciation) | | 36,243 |
| Net gain (loss) | | 341,959 |
| Net increase (decrease) in net assets resulting from operations | | $712,405 |
See accompanying notes which are an integral part of the financial statements.
Statement of Changes in Net Assets
| | Six months ended June 30, 2016 (Unaudited) | Year ended December 31, 2015 |
| Increase (Decrease) in Net Assets | | |
| Operations | | |
| Net investment income (loss) | $370,446 | $725,536 |
| Net realized gain (loss) | 305,716 | 1,213,720 |
| Change in net unrealized appreciation (depreciation) | 36,243 | (7,132,161) |
| Net increase (decrease) in net assets resulting from operations | 712,405 | (5,192,905) |
| Distributions to shareholders from net investment income | (4,061) | (746,745) |
| Distributions to shareholders from net realized gain | (1,246,661) | (6,129,175) |
| Total distributions | (1,250,722) | (6,875,920) |
| Share transactions - net increase (decrease) | 3,929,801 | (9,007,350) |
| Redemption fees | 7,117 | 10,050 |
| Total increase (decrease) in net assets | 3,398,601 | (21,066,125) |
| Net Assets | | |
| Beginning of period | 51,239,503 | 72,305,628 |
| End of period | $54,638,104 | $51,239,503 |
| Other Information | | |
| Undistributed net investment income end of period | $369,881 | $3,496 |
See accompanying notes which are an integral part of the financial statements.
Financial Highlights — VIP Materials Portfolio Initial Class
| | Six months ended (Unaudited) June 30, | Years ended December 31, | | | | |
| | 2016 | 2015 | 2014 | 2013 | 2012 | 2011 |
| Selected Per–Share Data | | | | | | |
| Net asset value, beginning of period | $12.18 | $14.84 | $15.53 | $13.27 | $11.67 | $12.94 |
| Income from Investment Operations | | | | | | |
| Net investment income (loss)A | .09 | .17 | .15 | .11 | .12 | .16B |
| Net realized and unrealized gain (loss) | .11 | (1.33) | (.09) | 2.77 | 2.19 | (1.24) |
| Total from investment operations | .20 | (1.16) | .06 | 2.88 | 2.31 | (1.08) |
| Distributions from net investment income | –C | (.19) | (.15) | (.17) | (.12) | (.20) |
| Distributions from net realized gain | (.31) | (1.32) | (.60) | (.45) | (.59) | – |
| Total distributions | (.31) | (1.50)D | (.75) | (.62) | (.71) | (.20) |
| Redemption fees added to paid in capitalA | –C | –C | –C | –C | –C | .01 |
| Net asset value, end of period | $12.07 | $12.18 | $14.84 | $15.53 | $13.27 | $11.67 |
| Total ReturnE,F,G | 2.04% | (9.01)% | .37% | 22.15% | 20.15% | (8.20)% |
| Ratios to Average Net AssetsH,I | | | | | | |
| Expenses before reductions | .76%J | .75% | .75% | .76% | .75% | .76% |
| Expenses net of fee waivers, if any | .76%J | .75% | .74% | .76% | .75% | .76% |
| Expenses net of all reductions | .75%J | .75% | .73% | .75% | .74% | .75% |
| Net investment income (loss) | 1.54%J | 1.23% | 1.00% | .77% | .96% | 1.28%B |
| Supplemental Data | | | | | | |
| Net assets, end of period (000 omitted) | $11,320 | $11,432 | $17,469 | $21,067 | $25,025 | $27,414 |
| Portfolio turnover rateK | 51%J | 68% | 78% | 68% | 68% | 105% |
A Calculated based on average shares outstanding during the period.
B Net Investment income per share reflects a large, non-recurring dividend which amounted to $.05 per share. Excluding this non-recurring dividend, the ratio of net investment income (loss) to average net assets would have been .93%.
C Amount represents less than $.005 per share.
D Total distributions of $1.50 per share is comprised of distributions from net investment income of $.185 and distributions from net realized gain of $1.319 per share.
E Total returns for periods of less than one year are not annualized.
F Total returns do not reflect charges attributable to your insurance company's separate account. Inclusion of these charges would reduce the total returns shown.
G Total returns would have been lower if certain expenses had not been reduced during the applicable periods shown.
H Fees and expenses of any underlying Fidelity Central Funds are not included in the Fund's expense ratio. The Fund indirectly bears its proportionate share of the expenses of any underlying Fidelity Central Funds.
I Expense ratios reflect operating expenses of the class. Expenses before reductions do not reflect amounts reimbursed by the investment adviser or reductions from brokerage service arrangements or reductions from other expense offset arrangements and do not represent the amount paid by the class during periods when reimbursements or reductions occur. Expenses net of fee waivers reflect expenses after reimbursement by the investment adviser but prior to reductions from brokerage service arrangements or other expense offset arrangements. Expenses net of all reductions represent the net expenses paid by the class.
J Annualized
K Amount does not include the portfolio activity of any underlying Fidelity Central Funds.
See accompanying notes which are an integral part of the financial statements.
Financial Highlights — VIP Materials Portfolio Investor Class
| | Six months ended (Unaudited) June 30, | Years ended December 31, | | | | |
| | 2016 | 2015 | 2014 | 2013 | 2012 | 2011 |
| Selected Per–Share Data | | | | | | |
| Net asset value, beginning of period | $12.18 | $14.84 | $15.53 | $13.27 | $11.67 | $12.94 |
| Income from Investment Operations | | | | | | |
| Net investment income (loss)A | .09 | .16 | .14 | .10 | .11 | .15B |
| Net realized and unrealized gain (loss) | .10 | (1.33) | (.09) | 2.77 | 2.19 | (1.24) |
| Total from investment operations | .19 | (1.17) | .05 | 2.87 | 2.30 | (1.09) |
| Distributions from net investment income | –C | (.17) | (.14) | (.16) | (.11) | (.19) |
| Distributions from net realized gain | (.31) | (1.32) | (.60) | (.45) | (.59) | – |
| Total distributions | (.31) | (1.49) | (.74) | (.61) | (.70) | (.19) |
| Redemption fees added to paid in capitalA | –C | –C | –C | –C | –C | .01 |
| Net asset value, end of period | $12.06 | $12.18 | $14.84 | $15.53 | $13.27 | $11.67 |
| Total ReturnD,E,F | 1.96% | (9.09)% | .32% | 22.07% | 20.07% | (8.30)% |
| Ratios to Average Net AssetsG,H | | | | | | |
| Expenses before reductions | .84%I | .83% | .82% | .83% | .83% | .84% |
| Expenses net of fee waivers, if any | .84%I | .83% | .81% | .83% | .83% | .84% |
| Expenses net of all reductions | .83%I | .82% | .81% | .83% | .82% | .83% |
| Net investment income (loss) | 1.46%I | 1.16% | .93% | .69% | .88% | 1.20%B |
| Supplemental Data | | | | | | |
| Net assets, end of period (000 omitted) | $43,318 | $39,807 | $54,837 | $54,561 | $50,188 | $49,862 |
| Portfolio turnover rateJ | 51%I | 68% | 78% | 68% | 68% | 105% |
A Calculated based on average shares outstanding during the period.
B Net Investment income per share reflects a large, non-recurring dividend which amounted to $.05 per share. Excluding this non-recurring dividend, the ratio of net investment income (loss) to average net assets would have been .85%.
C Amount represents less than $.005 per share.
D Total returns for periods of less than one year are not annualized.
E Total returns do not reflect charges attributable to your insurance company's separate account. Inclusion of these charges would reduce the total returns shown.
F Total returns would have been lower if certain expenses had not been reduced during the applicable periods shown.
G Fees and expenses of any underlying Fidelity Central Funds are not included in the Fund's expense ratio. The Fund indirectly bears its proportionate share of the expenses of any underlying Fidelity Central Funds.
H Expense ratios reflect operating expenses of the class. Expenses before reductions do not reflect amounts reimbursed by the investment adviser or reductions from brokerage service arrangements or reductions from other expense offset arrangements and do not represent the amount paid by the class during periods when reimbursements or reductions occur. Expenses net of fee waivers reflect expenses after reimbursement by the investment adviser but prior to reductions from brokerage service arrangements or other expense offset arrangements. Expenses net of all reductions represent the net expenses paid by the class.
I Annualized
J Amount does not include the portfolio activity of any underlying Fidelity Central Funds.
See accompanying notes which are an integral part of the financial statements.
Notes to Financial Statements (Unaudited)
For the period ended June 30, 2016
1. Organization.
VIP Materials Portfolio (the Fund) is a non-diversified fund of Variable Insurance Products Fund IV (the Trust) and is authorized to issue an unlimited number of shares. The Trust is registered under the Investment Company Act of 1940, as amended (the 1940 Act), as an open-end management investment company organized as a Massachusetts business trust. Shares of the Fund may only be purchased by insurance companies for the purpose of funding variable annuity or variable life insurance contracts. The Fund offers the following classes of shares: Initial Class shares and Investor Class shares. All classes have equal rights and voting privileges, except for matters affecting a single class.
2. Investments in Fidelity Central Funds.
The Fund invests in Fidelity Central Funds, which are open-end investment companies generally available only to other investment companies and accounts managed by the investment adviser and its affiliates. The Fund's Schedule of Investments lists each of the Fidelity Central Funds held as of period end, if any, as an investment of the Fund, but does not include the underlying holdings of each Fidelity Central Fund. As an Investing Fund, the Fund indirectly bears its proportionate share of the expenses of the underlying Fidelity Central Funds.
The Money Market Central Funds seek preservation of capital and current income and are managed by Fidelity Investments Money Management, Inc. (FIMM), an affiliate of the investment adviser. Annualized expenses of the Money Market Central Funds as of their most recent shareholder report date are less than .005%.
A complete unaudited list of holdings for each Fidelity Central Fund is available upon request or at the Securities and Exchange Commission (the SEC) website at www.sec.gov. In addition, the financial statements of the Fidelity Central Funds are available on the SEC website or upon request.
3. Significant Accounting Policies.
The financial statements have been prepared in conformity with accounting principles generally accepted in the United States of America (GAAP), which require management to make certain estimates and assumptions at the date of the financial statements. Actual results could differ from those estimates. Subsequent events, if any, through the date that the financial statements were issued have been evaluated in the preparation of the financial statements. The following summarizes the significant accounting policies of the Fund:
Investment Valuation. Investments are valued as of 4:00 p.m. Eastern time on the last calendar day of the period. The Board of Trustees (the Board) has delegated the day to day responsibility for the valuation of the Fund's investments to the Fidelity SelectCo, LLC (SelectCo) Fair Value Committee (the Committee). In accordance with valuation policies and procedures approved by the Board, the Fund attempts to obtain prices from one or more third party pricing vendors or brokers to value its investments. When current market prices, quotations or currency exchange rates are not readily available or reliable, investments will be fair valued in good faith by the Committee, in accordance with procedures adopted by the Board. Factors used in determining fair value vary by investment type and may include market or investment specific events. The frequency with which these procedures are used cannot be predicted and they may be utilized to a significant extent. The Committee oversees the Fund's valuation policies and procedures and reports to the Board on the Committee's activities and fair value determinations. The Board monitors the appropriateness of the procedures used in valuing the Fund's investments and ratifies the fair value determinations of the Committee.
The Fund categorizes the inputs to valuation techniques used to value its investments into a disclosure hierarchy consisting of three levels as shown below:
- Level 1 – quoted prices in active markets for identical investments
- Level 2 – other significant observable inputs (including quoted prices for similar investments, interest rates, prepayment speeds, etc.)
- Level 3 – unobservable inputs (including the Fund's own assumptions based on the best information available)
Valuation techniques used to value the Fund's investments by major category are as follows:
Equity securities, including restricted securities, for which market quotations are readily available, are valued at the last reported sale price or official closing price as reported by a third party pricing vendor on the primary market or exchange on which they are traded and are categorized as Level 1 in the hierarchy. In the event there were no sales during the day or closing prices are not available, securities are valued at the last quoted bid price or may be valued using the last available price and are generally categorized as Level 2 in the hierarchy. For foreign equity securities, when market or security specific events arise, comparisons to the valuation of American Depositary Receipts (ADRs), futures contracts, Exchange-Traded Funds (ETFs) and certain indexes as well as quoted prices for similar securities may be used and would be categorized as Level 2 in the hierarchy. Utilizing these techniques may result in transfers between Level 1 and Level 2. For equity securities, including restricted securities, where observable inputs are limited, assumptions about market activity and risk are used and these securities may be categorized as Level 3 in the hierarchy.
Investments in open-end mutual funds, including the Fidelity Central Funds, are valued at their closing net asset value (NAV) each business day and are categorized as Level 1 in the hierarchy.
Changes in valuation techniques may result in transfers in or out of an assigned level within the disclosure hierarchy.
Foreign Currency. The Fund may use foreign currency contracts to facilitate transactions in foreign-denominated securities. Gains and losses from these transactions may arise from changes in the value of the foreign currency or if the counterparties do not perform under the contracts' terms.
Foreign-denominated assets, including investment securities, and liabilities are translated into U.S. dollars at the exchange rates at period end. Purchases and sales of investment securities, income and dividends received and expenses denominated in foreign currencies are translated into U.S. dollars at the exchange rate in effect on the transaction date.
The effects of exchange rate fluctuations on investments are included with the net realized and unrealized gain (loss) on investment securities. Other foreign currency transactions resulting in realized and unrealized gain (loss) are disclosed separately.
Investment Transactions and Income. For financial reporting purposes, the Fund's investment holdings and NAV include trades executed through the end of the last business day of the period. The NAV per share for processing shareholder transactions is calculated as of the close of business of the New York Stock Exchange (NYSE), normally 4:00 p.m. Eastern time and includes trades executed through the end of the prior business day. Gains and losses on securities sold are determined on the basis of identified cost and may include proceeds received from litigation. Dividend income is recorded on the ex-dividend date, except for certain dividends from foreign securities where the ex-dividend date may have passed, which are recorded as soon as the Fund is informed of the ex-dividend date. Non-cash dividends included in dividend income, if any, are recorded at the fair market value of the securities received. Income and capital gain distributions from Fidelity Central Funds, if any, are recorded on the ex-dividend date. Distributions received on securities that represent a return of capital or capital gain are recorded as a reduction of cost of investments and/or as a realized gain. Subsequent to ex-dividend date the Fund determines the components of these distributions, based upon receipt of tax filings or other correspondence relating to the underlying investment. Investment income is recorded net of foreign taxes withheld where recovery of such taxes is uncertain.
Class Allocations and Expenses. Investment income, realized and unrealized capital gains and losses, common expenses of the Fund, and certain fund-level expense reductions, if any, are allocated daily on a pro-rata basis to each class based on the relative net assets of each class to the total net assets of the Fund. Each class differs with respect to transfer agent fees incurred. Certain expense reductions may also differ by class. For the reporting period, the allocated portion of income and expenses to each class as a percent of its average net assets may vary due to the timing of recording these transactions in relation to fluctuating net assets of the classes. Expenses directly attributable to a fund are charged to that fund. Expenses attributable to more than one fund are allocated among the respective funds on the basis of relative net assets or other appropriate methods. Expense estimates are accrued in the period to which they relate and adjustments are made when actual amounts are known.
Income Tax Information and Distributions to Shareholders. Each year, the Fund intends to qualify as a regulated investment company under Subchapter M of the Internal Revenue Code, including distributing substantially all of its taxable income and realized gains. As a result, no provision for U.S. Federal income taxes is required. The Fund files a U.S. federal tax return, in addition to state and local tax returns as required. The Fund's federal income tax returns are subject to examination by the Internal Revenue Service (IRS) for a period of three fiscal years after they are filed. State and local tax returns may be subject to examination for an additional fiscal year depending on the jurisdiction. Foreign taxes are provided for based on the Fund's understanding of the tax rules and rates that exist in the foreign markets in which it invests.
Distributions are declared and recorded on the ex-dividend date. Income dividends and capital gain distributions are declared separately for each class. Income and capital gain distributions are determined in accordance with income tax regulations, which may differ from GAAP.
Capital accounts within the financial statements are adjusted for permanent book-tax differences. These adjustments have no impact on net assets or the results of operations. Capital accounts are not adjusted for temporary book-tax differences which will reverse in a subsequent period.
Book-tax differences are primarily due to foreign currency transactions, passive foreign investment companies (PFIC), original issue discount and losses deferred due to wash sales.
The federal tax cost of investment securities and unrealized appreciation (depreciation) as of period end were as follows:
| Gross unrealized appreciation | $8,342,567 |
| Gross unrealized depreciation | (2,402,667) |
| Net unrealized appreciation (depreciation) on securities | $5,939,900 |
| Tax cost | $51,346,307 |
Trading (Redemption) Fees. Shares held by investors less than 60 days may be subject to a redemption fee equal to 1% of the NAV of shares redeemed. All redemption fees, which reduce the proceeds of the shareholder redemption, are retained by the Fund and accounted for as an addition to paid in capital.
Restricted Securities. The Fund may invest in securities that are subject to legal or contractual restrictions on resale. These securities generally may be resold in transactions exempt from registration or to the public if the securities are registered. Disposal of these securities may involve time-consuming negotiations and expense, and prompt sale at an acceptable price may be difficult. Information regarding restricted securities is included at the end of the Fund's Schedule of Investments.
4. Purchases and Sales of Investments.
Purchases and sales of securities, other than short-term securities, aggregated $15,307,264 and $12,598,499, respectively.
5. Fees and Other Transactions with Affiliates.
Management Fee. Fidelity SelectCo, LLC (the investment adviser) and its affiliates provide the Fund with investment management related services for which the Fund pays a monthly management fee. The management fee is the sum of an individual fund fee rate that is based on an annual rate of .30% of the Fund's average net assets and an annualized group fee rate that averaged .25% during the period. The group fee rate is based upon the average net assets of all the mutual funds advised by Fidelity Management & Research Company (FMR) and the investment adviser. The group fee rate decreases as assets under management increase and increases as assets under management decrease. For the reporting period, the total annualized management fee rate was .55% of the Fund's average net assets.
Transfer Agent Fees. Fidelity Investments Institutional Operations Company, Inc. (FIIOC), an affiliate of the investment adviser, is the Fund's transfer, dividend disbursing, and shareholder servicing agent. FIIOC receives an asset-based fee with respect to each class. Each class (with the exception of Investor Class) pays a fee for transfer agent services, typesetting, and printing and mailing of shareholder reports, excluding mailing of proxy statements, equal to an annual rate of .07% (.15% for Investor Class) of class-level average net assets. For the period, transfer agent fees for each class were as follows:
| Initial Class | $3,582 |
| Investor Class | 28,668 |
| | $32,250 |
Accounting and Security Lending Fees. Fidelity Service Company, Inc. (FSC), an affiliate of the investment adviser, maintains the Fund's accounting records. The accounting fee is based on the level of average net assets for each month. Under a separate contract, FSC administers the security lending program. The security lending fee is based on the number and duration of lending transactions.
Brokerage Commissions. The Fund placed a portion of its portfolio transactions with brokerage firms which are affiliates of the investment adviser. Brokerage commissions are included in net realized gain (loss) and change in net unrealized appreciation (depreciation) in the Statement of Operations. The commissions paid to these affiliated firms were $282 for the period.
Interfund Trades. The Fund may purchase from or sell securities to other Fidelity Funds under procedures adopted by the Board. The procedures have been designed to ensure these interfund trades are executed in accordance with Rule 17a-7 of the 1940 Act. Interfund trades are included within the respective purchases and sales amounts shown in the Purchases and Sales of Investments note.
6. Committed Line of Credit.
The Fund participates with other funds managed by the investment adviser or an affiliate in a $4.25 billion credit facility (the "line of credit") to be utilized for temporary or emergency purposes to fund shareholder redemptions or for other short-term liquidity purposes. The Fund has agreed to pay commitment fees on its pro-rata portion of the line of credit, which amounted to $43 and is reflected in Miscellaneous expenses on the Statement of Operations. During the period, the Fund did not borrow on this line of credit.
7. Security Lending.
The Fund lends portfolio securities through a lending agent from time to time in order to earn additional income. On the settlement date of the loan, the Fund receives collateral (in the form of U.S. Treasury obligations, letters of credit and/or cash) against the loaned securities and maintains collateral in an amount not less than 100% of the market value of the loaned securities during the period of the loan. The market value of the loaned securities is determined at the close of business of the Fund and any additional required collateral is delivered to the Fund on the next business day. The Fund or borrower may terminate the loan at any time, and if the borrower defaults on its obligation to return the securities loaned because of insolvency or other reasons, the Fund may apply collateral received from the borrower against the obligation. The Fund may experience delays and costs in recovering the securities loaned. Any cash collateral received is invested in the Fidelity Securities Lending Cash Central Fund. The value of loaned securities and cash collateral at period end are disclosed on the Fund's Statement of Assets and Liabilities. Security lending income represents the income earned on investing cash collateral, less rebates paid to borrowers and any lending agent fees associated with the loan, plus any premium payments received for lending certain types of securities. Security lending income is presented in the Statement of Operations as a component of income from Fidelity Central Funds. Total security lending income during the period amounted to $3,154.
8. Expense Reductions.
Commissions paid to certain brokers with whom the investment adviser, or its affiliates, places trades on behalf of the Fund include an amount in addition to trade execution, which may be rebated back to the Fund to offset certain expenses. This amount totaled $1,569 for the period.
In addition, during the period the investment adviser reimbursed and/or waived a portion of fund-level operating expenses in the amount of $187.
9. Distributions to Shareholders.
Distributions to shareholders of each class were as follows:
| | Six months ended
June 30, 2016 | Year ended December 31, 2015 |
| From net investment income | | |
| Initial Class | $905 | $174,359 |
| Investor Class | 3,156 | 572,386 |
| Total | $4,061 | $746,745 |
| From net realized gain | | |
| Initial Class | $277,716 | $1,450,555 |
| Investor Class | 968,945 | 4,678,620 |
| Total | $1,246,661 | $6,129,175 |
10. Share Transactions.
Transactions for each class of shares were as follows:
| | Shares | Shares | Dollars | Dollars |
| | Six months ended
June 30, 2016 | Year ended December 31, 2015 | Six months ended
June 30, 2016 | Year ended December 31, 2015 |
| Initial Class | | | | |
| Shares sold | 95,301 | 104,321 | $1,154,806 | $1,435,872 |
| Reinvestment of distributions | 26,868 | 115,453 | 278,621 | 1,624,914 |
| Shares redeemed | (122,366) | (458,368) | (1,409,475) | (6,260,376) |
| Net increase (decrease) | (197) | (238,594) | $23,952 | $(3,199,590) |
| Investor Class | | | | |
| Shares sold | 517,141 | 529,379 | $6,234,146 | $7,121,617 |
| Reinvestment of distributions | 93,742 | 373,515 | 972,101 | 5,251,006 |
| Shares redeemed | (286,795) | (1,330,679) | (3,300,398) | (18,180,383) |
| Net increase (decrease) | 324,088 | (427,785) | $3,905,849 | $(5,807,760) |
11. Other.
The Fund's organizational documents provide former and current trustees and officers with a limited indemnification against liabilities arising in connection with the performance of their duties to the Fund. In the normal course of business, the Fund may also enter into contracts that provide general indemnifications. The Fund's maximum exposure under these arrangements is unknown as this would be dependent on future claims that may be made against the Fund. The risk of material loss from such claims is considered remote.
At the end of the period, the investment adviser or its affiliates were the owners of record of 100% of the total outstanding shares of the Fund.
Shareholder Expense Example
As a shareholder of the Fund, you incur two types of costs: (1) transaction costs, including redemption fees and (2) ongoing costs, including management fees and other Fund expenses. This Example is intended to help you understand your ongoing costs (in dollars) of investing in the Fund and to compare these costs with the ongoing costs of investing in other mutual funds.
The Example is based on an investment of $1,000 invested at the beginning of the period and held for the entire period (January 1, 2016 to June 30, 2016).
Actual Expenses
The first line of the accompanying table for each class of the Fund provides information about actual account values and actual expenses. You may use the information in this line, together with the amount you invested, to estimate the expenses that you paid over the period. Simply divide your account value by $1,000.00 (for example, an $8,600 account value divided by $1,000.00 = 8.6), then multiply the result by the number in the first line for a class of the Fund under the heading entitled "Expenses Paid During Period" to estimate the expenses you paid on your account during this period. The estimate of expenses does not include any fees or other expenses of any variable annuity or variable life insurance product. If they were, the estimate of expenses you paid during the period would be higher, and your ending account value would be lower. In addition, the Fund, as a shareholder in the underlying Fidelity Central Funds, will indirectly bear its pro-rata share of the fees and expenses incurred by the underlying Fidelity Central Funds. These fees and expenses are not included in the Fund's annualized expense ratio used to calculate the expense estimate in the table below.
Hypothetical Example for Comparison Purposes
The second line of the accompanying table for each class of the Fund provides information about hypothetical account values and hypothetical expenses based on a Class' actual expense ratio and an assumed rate of return of 5% per year before expenses, which is not the Class' actual return. The hypothetical account values and expenses may not be used to estimate the actual ending account balance or expenses you paid for the period. You may use this information to compare the ongoing costs of investing in the Fund and other funds. To do so, compare this 5% hypothetical example with the 5% hypothetical examples that appear in the shareholder reports of the other funds. The estimate of expenses does not include any fees or other expenses of any variable annuity or variable life insurance product. If they were, the estimate of expenses you paid during the period would be higher, and your ending account value would be lower. In addition, the Fund, as a shareholder in the underlying Fidelity Central Funds, will indirectly bear its pro-rata share of the fees and expenses incurred by the underlying Fidelity Central Funds. These fees and expenses are not included in the Fund's annualized expense ratio used to calculate the expense estimate in the table below.
Please note that the expenses shown in the table are meant to highlight your ongoing costs only and do not reflect any transaction costs. Therefore, the second line of the table is useful in comparing ongoing costs only, and will not help you determine the relative total costs of owning different funds. In addition, if these transactional costs were included, your costs would have been higher.
| | Annualized Expense Ratio-A | Beginning
Account Value
January 1, 2016 | Ending
Account Value
June 30, 2016 | Expenses Paid
During Period-B
January 1, 2016
to June 30, 2016 |
| Initial Class | .76% | | | |
| Actual | | $1,000.00 | $1,020.40 | $3.82 |
| Hypothetical-C | | $1,000.00 | $1,021.08 | $3.82 |
| Investor Class | .84% | | | |
| Actual | | $1,000.00 | $1,019.60 | $4.22 |
| Hypothetical-C | | $1,000.00 | $1,020.69 | $4.22 |
A Annualized expense ratio reflects expenses net of applicable fee waivers.
B Expenses are equal to each Class' annualized expense ratio, multiplied by the average account value over the period, multiplied by 182/366 (to reflect the one-half year period).
C 5% return per year before expenses
Board Approval of Investment Advisory Contracts and Management Fees
VIP Materials Portfolio
Each year, the Board of Trustees, including the Independent Trustees (together, the Board), votes on the renewal of the management contract with Fidelity SelectCo, LLC (SelectCo), an affiliate of Fidelity Management & Research Company (FMR), and the sub-advisory agreements with affiliates of FMR (together, the Advisory Contracts) for the fund. The Board, assisted by the advice of fund counsel and Independent Trustees' counsel, requests and considers a broad range of information relevant to the renewal of the Advisory Contracts throughout the year.
The Board meets regularly and, at each of its meetings, covers an extensive agenda of topics and materials and considers factors that are relevant to its annual consideration of the renewal of the fund's Advisory Contracts, including the services and support provided to the fund and its shareholders. The Board has established four standing committees (Committees) — Operations, Audit, Fair Valuation, and Governance and Nominating — each composed of and chaired by Independent Trustees with varying backgrounds, to which the Board has assigned specific subject matter responsibilities in order to enhance effective decision-making by the Board. The Operations Committee, of which all of the Independent Trustees are members, meets regularly throughout the year and considers, among other matters, information specifically related to the annual consideration of the renewal of the fund's Advisory Contracts. The Board, acting directly and through its Committees, requests and receives information concerning the annual consideration of the renewal of the fund's Advisory Contracts. The Board also meets as needed to consider matters specifically related to the Board's annual consideration of the renewal of the Advisory Contracts. Members of the Board may also meet with trustees of other Fidelity funds through ad hoc joint committees to discuss certain matters relevant to all of the Fidelity funds.
At its January 2016 meeting, the Board unanimously determined to renew the fund's Advisory Contracts. In reaching its determination, the Board considered all factors it believed relevant, including (i) the nature, extent, and quality of the services to be provided to the fund and its shareholders (including the investment performance of the fund); (ii) the competitiveness of the fund's management fee and total expense ratio relative to peer funds; (iii) the total costs of the services to be provided by and the profits to be realized by Fidelity from its relationships with the fund; and (iv) the extent to which, if any, economies of scale exist and would be realized as the fund grows, and whether any economies of scale are appropriately shared with fund shareholders.
In considering whether to renew the Advisory Contracts for the fund, the Board reached a determination, with the assistance of fund counsel and Independent Trustees' counsel and through the exercise of its business judgment, that the renewal of the Advisory Contracts was in the best interests of the fund and its shareholders and that the compensation payable under the Advisory Contracts was fair and reasonable. The Board's decision to renew the Advisory Contracts was not based on any single factor, but rather was based on a comprehensive consideration of all the information provided to the Board at its meetings throughout the year. The Board, in reaching its determination to renew the Advisory Contracts, was aware that shareholders of the fund have a broad range of investment choices available to them, including a wide choice among funds offered by Fidelity's competitors, and that the fund's shareholders, who have the opportunity to review and weigh the disclosure provided by the fund in its prospectus and other public disclosures, have chosen to invest in this fund, which is part of the Fidelity family of funds.
Nature, Extent, and Quality of Services Provided. The Board considered the staffing of SelectCo and the sub-advisers (together with SelectCo, the Investment Advisers) as it relates to the fund, including the backgrounds of investment personnel of SelectCo, and also considered the fund's investment objective, strategies, and related investment philosophy. The Independent Trustees also had discussions with senior management of Fidelity's investment operations and investment groups. The Board considered the structure of the investment personnel compensation program and whether this structure provides appropriate incentives to act in the best interests of the fund. Additionally, the Board considered the portfolio managers' investments, if any, in the funds that they manage.
Resources Dedicated to Investment Management and Support Services. The Board reviewed the general qualifications and capabilities of the investment staff of the Investment Advisers, including their size, education, experience, and resources, as well as Fidelity's approach to recruiting, training, managing, and compensating investment personnel. The Board noted that Fidelity has continued to increase the resources devoted to non-U.S. offices, including expansion of Fidelity's global investment organization. The Board also noted that Fidelity's analysts have extensive resources, tools and capabilities that allow them to conduct sophisticated quantitative and fundamental analysis, as well as credit analysis of issuers, counterparties and guarantors. Further, the Board considered that Fidelity's investment professionals have sufficient access to global information and data so as to provide competitive investment results over time, and that those professionals also have access to sophisticated tools that permit them to assess portfolio construction and risk and performance attribution characteristics continuously, as well as to transmit new information and research conclusions rapidly around the world. Additionally, in its deliberations, the Board considered Fidelity's trading, risk management, compliance, and technology and operations capabilities and resources, which are integral parts of the investment management process.
Shareholder and Administrative Services. The Board considered (i) the nature, extent, quality, and cost of advisory, administrative, and shareholder services performed by the Investment Advisers and their affiliates under the Advisory Contracts and under separate agreements covering transfer agency, pricing and bookkeeping, and securities lending services for the fund; (ii) the nature and extent of the supervision of third party service providers, principally custodians, subcustodians, and pricing vendors; and (iii) the resources devoted to, and the record of compliance with, the fund's compliance policies and procedures. The Board also reviewed the allocation of fund brokerage, including allocations to brokers affiliated with the Investment Advisers, the use of brokerage commissions to pay fund expenses, and the use of "soft" commission dollars to pay for research services.
The Board noted that the growth of fund assets over time across the complex allows Fidelity to reinvest in the development of services designed to enhance the value or convenience of the Fidelity funds as investment vehicles. These services include 24-hour access to account information and market information through telephone representatives and over the Internet, investor education materials and asset allocation tools, and the expanded availability of Fidelity Investor Centers.
The Board noted that in 2014 the ad hoc Committee on Transfer Agency Fees was formed by it and the boards of certain other Fidelity funds to review the variety of transfer agency services and fee structures throughout the mutual fund industry compared to Fidelity's.
Investment in a Large Fund Family. The Board considered the benefits to shareholders of investing in a Fidelity fund, including the benefits of investing in a fund that is part of a large family of funds offering a variety of investment disciplines and providing a large variety of mutual fund investor services. The Board noted that Fidelity had taken, or had made recommendations that resulted in the Fidelity funds taking, a number of actions over the previous year that benefited particular funds, including (i) continuing to dedicate additional resources to investment research and to the support of the senior management team that oversees asset management; (ii) continuing efforts to enhance Fidelity's global research capabilities; (iii) launching new funds and making other enhancements to meet client needs; (iv) reducing management fees and total expenses for certain index funds; (v) continuing to launch dedicated lower cost underlying funds to meet portfolio construction needs related to expanding underlying fund options for Fidelity funds of funds, specifically for the Freedom Fund product lines; (vi) rationalizing product lines and gaining increased efficiencies through fund mergers; (vii) continuing to develop, acquire and implement systems and technology to improve services to the funds and shareholders, strengthen information security, and increase efficiency; (viii) implementing investment enhancements to further strengthen Fidelity's target date product line to increase investors' probability of success in achieving their goals; (ix) modifying the eligibility criteria for certain share classes to accommodate roll-over assets from employer-sponsored retirement plans; (x) launching a new Class W of the Freedom Index Funds to attract and retain Fidelity record-kept retirement plan assets; and (xi) implementing changes to Fidelity's money market fund product line in response to recent regulatory reforms.
Investment Performance. The Board considered whether the fund has operated in accordance with its investment objective, as well as its record of compliance with its investment restrictions and its performance history.
The Board took into account discussions with representatives of the Investment Advisers about fund investment performance that occur at Board meetings throughout the year. In this regard the Board noted that as part of regularly scheduled fund reviews and other reports to the Board on fund performance, the Board considers annualized return information for the fund, for different time periods, measured against a securities market index ("benchmark index"). In its evaluation of fund investment performance at meetings throughout the year, the Board gave particular attention to information indicating underperformance of certain Fidelity funds for specific time periods and discussed with the Investment Advisers the reasons for such underperformance. The fund underperformed its benchmark for the one-, three-, and five-year periods ended June 30, 2015, and as a result, the Board will continue to discuss with SelectCo the steps it is taking to address the fund's performance.
In addition to reviewing absolute and relative fund performance, the Independent Trustees periodically consider the appropriateness of fund performance metrics in evaluating the results achieved. In general, the Independent Trustees believe that fund performance should be evaluated based on net performance (after fees and expenses) of both the highest performing and lowest performing fund share classes, where applicable, compared to appropriate benchmark indices, over appropriate time periods that may include full market cycles, taking into account relevant factors, including the following: general market conditions; issuer-specific information; and fund cash flows and other factors. Depending on the circumstances, the Independent Trustees may be satisfied with a fund's performance notwithstanding that it lags its benchmark index for certain periods.
The Independent Trustees recognize that shareholders evaluate performance on a net basis over their own holding periods, for which one-, three-, and five-year periods are often used as a proxy. For this reason, the performance information reviewed by the Board also included net cumulative total return information for the fund and an appropriate benchmark index for the most recent one-, three-, and five-year periods ended June 30, 2015.
Based on its review, the Board concluded that the nature, extent, and quality of services provided to the fund under the Advisory Contracts should benefit the shareholders of the fund.
Competitiveness of Management Fee and Total Expense Ratio. The Board considered the fund's management fee and total expense ratio compared to "mapped groups" of competitive funds and classes created for the purpose of facilitating the Trustees' analysis of the competitiveness of management fees and total expenses. Fidelity creates "mapped groups" by combining similar Lipper investment objective categories that have comparable investment mandates. For this purpose, all sector focused equity funds are grouped in the same mapped group. Combining Lipper investment objective categories aids the Board's management fee and total expense ratio comparisons by broadening the competitive group used for comparison.
Management Fee. The Board considered two proprietary management fee comparisons for the 12-month periods ended June 30 shown in basis points (BP) in the chart below. The group of Lipper funds used by the Board for management fee comparisons is referred to below as the "Total Mapped Group." The Total Mapped Group comparison focuses on a fund's standing in terms of gross management fees before expense reimbursements or caps relative to the total universe of funds with comparable investment mandates (
i.e., sector equities), regardless of whether their management fee structures also are comparable. Funds with comparable management fee structures have similar management fee contractual arrangements (
e.g., flat rate charged for advisory services, all-inclusive fee rate,
etc.). "TMG %" represents the percentage of funds in the Total Mapped Group that had management fees that were lower than the fund's. For example, a hypothetical TMG % of 20% would mean that 80% of the funds in the Total Mapped Group had higher, and 20% had lower, management fees than the fund. The fund's actual TMG %s and the number of funds in the Total Mapped Group are in the chart below. The "Asset-Size Peer Group" (ASPG) comparison focuses on a fund's standing relative to a subset of non-Fidelity funds within the Total Mapped Group that are similar in size and management fee structure. For example, if a fund is in the first quartile of the ASPG, the fund's management fee ranks in the least expensive or lowest 25% of funds in the ASPG. The ASPG represents at least 15% of the funds in the Total Mapped Group with comparable asset size and management fee structures, subject to a minimum of 50 funds (or all funds in the Total Mapped Group if fewer than 50). Additional information, such as the ASPG quartile in which the fund's management fee rate ranked, is also included in the chart and considered by the Board.
VIP Materials Portfolio

The Board noted that the fund's management fee rate ranked below the median of its Total Mapped Group and below the median of its ASPG for the 12-month period ended June 30, 2015.
The Board noted that, in 2014, the ad hoc Committee on Group Fee was formed by it and the boards of other Fidelity funds to conduct an in-depth review of the "group fee" component of the management fee of funds with such management fee structures. Committee focus included the mechanics of the group fee, the competitive landscape of group fee structures, Fidelity funds with no group fee component and investment products not included in group fee assets. The Board also considered that, for funds subject to the group fee, FMR agreed to voluntarily waive fees over a specified period of time in amounts designed to account for assets converted from certain funds to certain collective investment trusts.
Based on its review, the Board concluded that the fund's management fee is fair and reasonable in light of the services that the fund receives and the other factors considered.
Total Expense Ratio. In its review of each class's total expense ratio, the Board considered the fund's management fee rate as well as other fund or class expenses, as applicable, such as transfer agent fees, pricing and bookkeeping fees, and custodial, legal, and audit fees. The Board also noted that Fidelity may agree to waive fees and expenses from time to time, and the extent to which, if any, it has done so for the fund. As part of its review, the Board also considered the current and historical total expense ratios of each class of the fund compared to competitive fund median expenses. Each class of the fund is compared to those funds and classes in the Total Mapped Group (used by the Board for management fee comparisons) that have a similar sales load structure.
The Board noted that the total expense ratio of each class ranked below the competitive median for the 12-month period ended June 30, 2015.
Fees Charged to Other Fidelity Clients. The Board also considered Fidelity fee structures and other information with respect to clients of Fidelity, such as other funds advised or subadvised by Fidelity, pension plan clients, and other institutional clients with similar mandates. The Board noted the findings of the 2013 ad hoc joint committee (created with the boards of other Fidelity funds), which reviewed and compared Fidelity's institutional investment advisory business with its business of providing services to the Fidelity funds, including the differences in services provided, fees charged, and costs incurred, as well as competition in their respective marketplaces.
Based on its review of total expense ratios and fees charged to other Fidelity clients, the Board concluded that the total expense ratio of each class of the fund was reasonable in light of the services that the fund and its shareholders receive and the other factors considered.
Costs of the Services and Profitability. The Board considered the revenues earned and the expenses incurred by Fidelity in conducting the business of developing, marketing, distributing, managing, administering and servicing the fund and servicing the fund's shareholders. The Board also considered the level of Fidelity's profits in respect of all the Fidelity funds.
On an annual basis, Fidelity presents to the Board information about the profitability of its relationship with the fund. Fidelity calculates profitability information for each fund, as well as aggregate profitability information for groups of Fidelity funds and all Fidelity funds, using a series of detailed revenue and cost allocation methodologies which originate with the books and records of Fidelity on which Fidelity's audited financial statements are based. The Audit Committee of the Board reviews any significant changes from the prior year's methodologies.
PricewaterhouseCoopers LLP (PwC), independent registered public accounting firm and auditor to Fidelity and certain Fidelity funds, has been engaged annually by the Board as part of the Board's assessment of the profitability analysis used by Fidelity. PwC's engagement includes the review and assessment of Fidelity's methodologies used in determining the revenues and expenses attributable to Fidelity's mutual fund business, and completion of agreed-upon procedures in respect of the mathematical accuracy of fund profitability and its conformity to established allocation methodologies. After considering PwC's reports issued under the engagement and information provided by Fidelity, the Board concluded that while other allocation methods may also be reasonable, Fidelity's profitability methodologies are reasonable in all material respects.
The Board also reviewed Fidelity's non-fund businesses and fall-out benefits related to the mutual fund business as well as cases where Fidelity's affiliates may benefit from or be related to the fund's business.
The Board considered the costs of the services provided by and the profits realized by Fidelity in connection with the operation of the fund and was satisfied that the profitability was not excessive.
Economies of Scale. The Board considered whether there have been economies of scale in respect of the management of the Fidelity funds, whether the Fidelity funds (including the fund) have appropriately benefited from any such economies of scale, and whether there is potential for realization of any further economies of scale. The Board considered the extent to which the fund will benefit from economies of scale as assets grow through increased services to the fund, through waivers or reimbursements, or through fee or expense ratio reductions. The Board also noted that in 2013, it and the boards of other Fidelity funds created an ad hoc committee (the Economies of Scale Committee) to analyze whether Fidelity attains economies of scale in respect of the management and servicing of the Fidelity funds, whether the Fidelity funds have appropriately benefited from such economies of scale, and whether there is potential for realization of any further economies of scale.
The Board recognized that the fund's management contract incorporates a "group fee" structure, which provides for lower group fee rates as total group assets increase, and for higher group fee rates as total group assets decrease (with "group assets" defined to include fund assets under SelectCo's management plus assets under FMR's management). SelectCo calculates the group fee rates based on a tiered asset "breakpoint" schedule that varies based on asset class. The Board considered that the group fee is designed to deliver the benefits of economies of scale to fund shareholders when total group assets increase, even if assets of any particular fund are unchanged or have declined, because some portion of Fidelity's costs are attributable to services provided to all Fidelity funds, and all funds benefit if those costs can be allocated among more assets. The Board concluded that, given the group fee structure, fund shareholders will benefit from lower management fees as group assets increase at the fund complex level, regardless of whether Fidelity achieves any such economies of scale.
The Board concluded, taking into account the analysis of the Economies of Scale Committee, that economies of scale, if any, are being appropriately shared between fund shareholders and Fidelity.
Additional Information Requested by the Board. In order to develop fully the factual basis for consideration of the Fidelity funds' Advisory Contracts, the Board requested and received additional information on certain topics, including: (i) Fidelity's fund profitability methodology, profitability trends for certain funds, and the impact of certain factors on fund profitability results; (ii) portfolio manager changes that have occurred during the past year and the amount of the investment that each portfolio manager has made in the Fidelity fund(s) that he or she manages; (iii) Fidelity's compensation structure for portfolio managers, research analysts, and other key personnel, including its effects on fund profitability; (iv) the arrangements with and compensation paid to certain fund sub-advisers on behalf of the Fidelity funds; (v) Fidelity's long-term expectations for its offerings in the workplace investing channel; (vi) the methodology with respect to competitive fund data and peer group classifications; (vii) Fidelity's transfer agent fee, expense, and service structures for different funds and classes, and the impact of outsourcing, the increased use of omnibus accounts, and lower pricing in the retirement channel; and (viii) explanations regarding the relative total expense ratios of certain funds and classes, total expense competitive trends and methodologies for total expense competitive comparisons, and actions that might be taken by Fidelity to reduce total expense ratios for certain funds and classes or to achieve further economies of scale.
Based on its evaluation of all of the conclusions noted above, and after considering all factors it believed relevant, the Board concluded that the advisory fee structures are fair and reasonable, and that the fund's Advisory Contracts should be renewed.
VMATP-SANN-0816
1.851002.109
Fidelity® Variable Insurance Products: Real Estate Portfolio
Semi-Annual Report June 30, 2016 |
|
Contents
To view a fund's proxy voting guidelines and proxy voting record for the 12-month period ended June 30, visit http://www.fidelity.com/proxyvotingresults or visit the Securities and Exchange Commission's (SEC) web site at http://www.sec.gov.
You may also call 1-877-208-0098 to request a free copy of the proxy voting guidelines.
Fidelity® Variable Insurance Products are separate account options which are purchased through a variable insurance contract.
Standard & Poor's, S&P and S&P 500 are registered service marks of The McGraw-Hill Companies, Inc. and have been licensed for use by Fidelity Distributors Corporation.
Other third-party marks appearing herein are the property of their respective owners.
All other marks appearing herein are registered or unregistered trademarks or service marks of FMR LLC or an affiliated company. © 2016 FMR LLC. All rights reserved.
This report and the financial statements contained herein are submitted for the general information of the shareholders of the Fund. This report is not authorized for distribution to prospective investors in the Fund unless preceded or accompanied by an effective prospectus.
A fund files its complete schedule of portfolio holdings with the SEC for the first and third quarters of each fiscal year on Form N-Q. Forms N-Q are available on the SEC’s web site at http://www.sec.gov. A fund's Forms N-Q may be reviewed and copied at the SEC’s Public Reference Room in Washington, DC. Information regarding the operation of the SEC's Public Reference Room may be obtained by calling 1-800-SEC-0330.
For a complete list of a fund's portfolio holdings, view the most recent holdings listing, semiannual report, or annual report on Fidelity's web site at http://www.fidelity.com, http://www.institutional.fidelity.com, or http://www.401k.com, as applicable.
NOT FDIC INSURED •MAY LOSE VALUE •NO BANK GUARANTEE
Neither the Fund nor Fidelity Distributors Corporation is a bank.
Investment Summary (Unaudited)
Top Ten Stocks as of June 30, 2016
| | % of fund's net assets | % of fund's net assets 6 months ago |
| Simon Property Group, Inc. | 12.0 | 11.7 |
| Boston Properties, Inc. | 5.9 | 5.8 |
| Ventas, Inc. | 5.8 | 4.9 |
| Public Storage | 4.7 | 5.1 |
| Extra Space Storage, Inc. | 4.7 | 4.6 |
| AvalonBay Communities, Inc. | 4.2 | 3.0 |
| Mid-America Apartment Communities, Inc. | 3.6 | 3.1 |
| Essex Property Trust, Inc. | 3.6 | 4.9 |
| UDR, Inc. | 3.5 | 4.0 |
| Mack-Cali Realty Corp. | 3.4 | 3.0 |
| | 51.4 | |
Top Five REIT Sectors as of June 30, 2016
| | % of fund's net assets | % of fund's net assets 6 months ago |
| REITs - Apartments | 17.5 | 18.5 |
| REITs - Regional Malls | 15.7 | 15.5 |
| REITs - Office Property | 15.5 | 14.2 |
| REITs - Health Care | 11.7 | 10.6 |
| REITs - Shopping Centers | 9.8 | 8.9 |
Asset Allocation (% of fund's net assets)
| As of June 30, 2016 |
| | Stocks | 98.7% |
| | Short-Term Investments and Net Other Assets (Liabilities) | 1.3% |

| As of December 31, 2015 |
| | Stocks | 97.8% |
| | Short-Term Investments and Net Other Assets (Liabilities) | 2.2% |

Investments June 30, 2016 (Unaudited)
Showing Percentage of Net Assets
| Common Stocks - 98.7% | | | |
| | | Shares | Value |
| Hotels, Restaurants & Leisure - 1.0% | | | |
| Hotels, Resorts & Cruise Lines - 1.0% | | | |
| Hilton Worldwide Holdings, Inc. | | 248,000 | $5,587,440 |
| Real Estate Investment Trusts - 97.7% | | | |
| REITs - Apartments - 17.5% | | | |
| AvalonBay Communities, Inc. | | 132,542 | 23,909,251 |
| Equity Residential (SBI) | | 212,470 | 14,634,934 |
| Essex Property Trust, Inc. | | 90,739 | 20,696,659 |
| Mid-America Apartment Communities, Inc. | | 195,100 | 20,758,640 |
| UDR, Inc. | | 541,900 | 20,006,948 |
| | | | 100,006,432 |
| REITs - Diversified - 4.8% | | | |
| Digital Realty Trust, Inc. (a) | | 39,000 | 4,250,610 |
| DuPont Fabros Technology, Inc. | | 58,500 | 2,781,090 |
| Forest City Realty Trust, Inc. | | 459,621 | 10,254,145 |
| Liberty Property Trust (SBI) | | 168,200 | 6,680,904 |
| Vornado Realty Trust | | 33,510 | 3,355,021 |
| | | | 27,321,770 |
| REITs - Health Care - 11.7% | | | |
| HCP, Inc. | | 3,200 | 113,216 |
| Healthcare Realty Trust, Inc. | | 466,200 | 16,312,338 |
| Sabra Health Care REIT, Inc. | | 282,500 | 5,829,388 |
| Ventas, Inc. | | 452,510 | 32,951,778 |
| Welltower, Inc. | | 155,328 | 11,831,334 |
| | | | 67,038,054 |
| REITs - Hotels - 3.8% | | | |
| Ashford Hospitality Prime, Inc. | | 160,082 | 2,263,559 |
| Chesapeake Lodging Trust | | 54,500 | 1,267,125 |
| FelCor Lodging Trust, Inc. | | 1,262,786 | 7,867,157 |
| Host Hotels & Resorts, Inc. | | 642,078 | 10,408,084 |
| | | | 21,805,925 |
| REITs - Management/Investment - 3.4% | | | |
| Coresite Realty Corp. | | 110,200 | 9,773,638 |
| Empire State Realty Trust, Inc. | | 515,000 | 9,779,850 |
| | | | 19,553,488 |
| REITs - Manufactured Homes - 0.9% | | | |
| Equity Lifestyle Properties, Inc. | | 67,239 | 5,382,482 |
| REITs - Office Property - 15.5% | | | |
| Boston Properties, Inc. | | 253,877 | 33,486,376 |
| Douglas Emmett, Inc. | | 275,700 | 9,792,864 |
| Highwoods Properties, Inc. (SBI) | | 94,600 | 4,994,880 |
| Mack-Cali Realty Corp. | | 714,100 | 19,280,700 |
| New York (REIT), Inc. | | 155,500 | 1,438,375 |
| Parkway Properties, Inc. | | 260,800 | 4,363,184 |
| SL Green Realty Corp. | | 60,259 | 6,415,776 |
| VEREIT, Inc. | | 847,100 | 8,589,594 |
| | | | 88,361,749 |
| REITs - Regional Malls - 15.7% | | | |
| General Growth Properties, Inc. | | 410,100 | 12,229,182 |
| Pennsylvania Real Estate Investment Trust (SBI) | | 231,900 | 4,974,255 |
| Simon Property Group, Inc. | | 315,199 | 68,366,663 |
| Taubman Centers, Inc. | | 53,900 | 3,999,380 |
| | | | 89,569,480 |
| REITs - Shopping Centers - 9.8% | | | |
| Brixmor Property Group, Inc. | | 257,500 | 6,813,450 |
| Cedar Shopping Centers, Inc. | | 775,218 | 5,759,870 |
| Federal Realty Investment Trust (SBI) | | 82,800 | 13,707,540 |
| Kite Realty Group Trust | | 134,353 | 3,765,915 |
| Ramco-Gershenson Properties Trust (SBI) | | 272,000 | 5,333,920 |
| Urban Edge Properties | | 626,405 | 18,704,453 |
| WP Glimcher, Inc. | | 151,400 | 1,694,166 |
| | | | 55,779,314 |
| REITs - Storage - 9.4% | | | |
| Extra Space Storage, Inc. | | 289,100 | 26,753,314 |
| Public Storage | | 105,555 | 26,978,802 |
| | | | 53,732,116 |
| REITs - Warehouse/Industrial - 5.2% | | | |
| DCT Industrial Trust, Inc. | | 396,150 | 19,031,046 |
| Prologis, Inc. | | 140,937 | 6,911,550 |
| Terreno Realty Corp. | | 135,301 | 3,500,237 |
| | | | 29,442,833 |
|
| TOTAL REAL ESTATE INVESTMENT TRUSTS | | | 557,993,643 |
|
| TOTAL COMMON STOCKS | | | |
| (Cost $402,636,766) | | | 563,581,083 |
|
| Money Market Funds - 2.0% | | | |
| Fidelity Cash Central Fund, 0.43% (b) | | 8,846,734 | 8,846,734 |
| Fidelity Securities Lending Cash Central Fund, 0.46% (b)(c) | | 2,618,850 | 2,618,850 |
| TOTAL MONEY MARKET FUNDS | | | |
| (Cost $11,465,584) | | | 11,465,584 |
| TOTAL INVESTMENT PORTFOLIO - 100.7% | | | |
| (Cost $414,102,350) | | | 575,046,667 |
| NET OTHER ASSETS (LIABILITIES) - (0.7)% | | | (3,875,611) |
| NET ASSETS - 100% | | | $571,171,056 |
Legend
(a) Security or a portion of the security is on loan at period end.
(b) Affiliated fund that is generally available only to investment companies and other accounts managed by Fidelity Investments. The rate quoted is the annualized seven-day yield of the fund at period end. A complete unaudited listing of the fund's holdings as of its most recent quarter end is available upon request. In addition, each Fidelity Central Fund's financial statements are available on the SEC's website or upon request.
(c) Investment made with cash collateral received from securities on loan.
Affiliated Central Funds
Information regarding fiscal year to date income earned by the Fund from investments in Fidelity Central Funds is as follows:
| Fund | Income earned |
| Fidelity Cash Central Fund | $17,067 |
| Fidelity Securities Lending Cash Central Fund | 333 |
| Total | $17,400 |
Investment Valuation
All investments are categorized as Level 1 under the Fair Value Hierarchy. The inputs or methodology used for valuing securities may not be an indication of the risk associated with investing in those securities. For more information on valuation inputs please refer to the Investment Valuation section in the accompanying Notes to Financial Statements.
See accompanying notes which are an integral part of the financial statements.
Financial Statements
Statement of Assets and Liabilities
| | | June 30, 2016 (Unaudited) |
| Assets | | |
Investment in securities, at value (including securities loaned of $2,583,063) — See accompanying schedule:
Unaffiliated issuers (cost $402,636,766) | $563,581,083 | |
| Fidelity Central Funds (cost $11,465,584) | 11,465,584 | |
| Total Investments (cost $414,102,350) | | $575,046,667 |
| Cash | | 17 |
| Receivable for investments sold | | 4,550,671 |
| Receivable for fund shares sold | | 449,244 |
| Dividends receivable | | 1,433,901 |
| Distributions receivable from Fidelity Central Funds | | 2,994 |
| Prepaid expenses | | 352 |
| Other receivables | | 7,923 |
| Total assets | | 581,491,769 |
| Liabilities | | |
| Payable for investments purchased | $3,761,776 | |
| Payable for fund shares redeemed | 3,549,542 | |
| Accrued management fee | 250,931 | |
| Distribution and service plan fees payable | 41,724 | |
| Other affiliated payables | 63,918 | |
| Other payables and accrued expenses | 33,972 | |
| Collateral on securities loaned, at value | 2,618,850 | |
| Total liabilities | | 10,320,713 |
| Net Assets | | $571,171,056 |
| Net Assets consist of: | | |
| Paid in capital | | $393,729,117 |
| Undistributed net investment income | | 4,711,642 |
| Accumulated undistributed net realized gain (loss) on investments | | 11,785,980 |
| Net unrealized appreciation (depreciation) on investments | | 160,944,317 |
| Net Assets | | $571,171,056 |
| Initial Class: | | |
| Net Asset Value, offering price and redemption price per share ($110,932,410 ÷ 5,140,303 shares) | | $21.58 |
| Service Class: | | |
| Net Asset Value, offering price and redemption price per share ($4,615,996 ÷ 214,508 shares) | | $21.52 |
| Service Class 2: | | |
| Net Asset Value, offering price and redemption price per share ($203,356,477 ÷ 9,565,082 shares) | | $21.26 |
| Investor Class: | | |
| Net Asset Value, offering price and redemption price per share ($252,266,173 ÷ 11,750,217 shares) | | $21.47 |
See accompanying notes which are an integral part of the financial statements.
Statement of Operations
| | | Six months ended June 30, 2016 (Unaudited) |
| Investment Income | | |
| Dividends | | $6,770,948 |
| Income from Fidelity Central Funds | | 17,400 |
| Total income | | 6,788,348 |
| Expenses | | |
| Management fee | $1,432,242 | |
| Transfer agent fees | 263,220 | |
| Distribution and service plan fees | 241,489 | |
| Accounting and security lending fees | 100,008 | |
| Custodian fees and expenses | 13,860 | |
| Independent trustees' fees and expenses | 5,680 | |
| Audit | 24,844 | |
| Legal | 2,159 | |
| Miscellaneous | 3,100 | |
| Total expenses before reductions | 2,086,602 | |
| Expense reductions | (21,701) | 2,064,901 |
| Net investment income (loss) | | 4,723,447 |
| Realized and Unrealized Gain (Loss) | | |
| Net realized gain (loss) on: | | |
| Investment securities: | | |
| Unaffiliated issuers | 13,432,043 | |
| Total net realized gain (loss) | | 13,432,043 |
| Change in net unrealized appreciation (depreciation) on investment securities | | 36,137,528 |
| Net gain (loss) | | 49,569,571 |
| Net increase (decrease) in net assets resulting from operations | | $54,293,018 |
See accompanying notes which are an integral part of the financial statements.
Statement of Changes in Net Assets
| | Six months ended June 30, 2016 (Unaudited) | Year ended December 31, 2015 |
| Increase (Decrease) in Net Assets | | |
| Operations | | |
| Net investment income (loss) | $4,723,447 | $9,508,712 |
| Net realized gain (loss) | 13,432,043 | 10,463,855 |
| Change in net unrealized appreciation (depreciation) | 36,137,528 | (4,887,060) |
| Net increase (decrease) in net assets resulting from operations | 54,293,018 | 15,085,507 |
| Distributions to shareholders from net investment income | (185,038) | (9,395,711) |
| Distributions to shareholders from net realized gain | (2,564,090) | (11,624,079) |
| Total distributions | (2,749,128) | (21,019,790) |
| Share transactions - net increase (decrease) | (1,471,705) | 11,196,306 |
| Total increase (decrease) in net assets | 50,072,185 | 5,262,023 |
| Net Assets | | |
| Beginning of period | 521,098,871 | 515,836,848 |
| End of period | $571,171,056 | $521,098,871 |
| Other Information | | |
| Undistributed net investment income end of period | $4,711,642 | $173,233 |
See accompanying notes which are an integral part of the financial statements.
Financial Highlights — VIP Real Estate Portfolio Initial Class
| | Six months ended (Unaudited) June 30, | Years ended December 31, | | | | |
| | 2016 | 2015 | 2014 | 2013 | 2012 | 2011 |
| Selected Per–Share Data | | | | | | |
| Net asset value, beginning of period | $19.61 | $19.73 | $16.35 | $17.22 | $15.02 | $14.06 |
| Income from Investment Operations | | | | | | |
| Net investment income (loss)A | .19 | .38 | .35 | .29 | .27 | .23 |
| Net realized and unrealized gain (loss) | 1.88 | .33 | 4.53 | –B | 2.50 | .90 |
| Total from investment operations | 2.07 | .71 | 4.88 | .29 | 2.77 | 1.13 |
| Distributions from net investment income | (.01) | (.39) | (.31)C | (.33) | (.25) | (.17) |
| Distributions from net realized gain | (.10) | (.44) | (1.19)C | (.83) | (.32) | – |
| Total distributions | (.10)D | (.83) | (1.50) | (1.16) | (.57) | (.17) |
| Net asset value, end of period | $21.58 | $19.61 | $19.73 | $16.35 | $17.22 | $15.02 |
| Total ReturnE,F,G | 10.70% | 3.71% | 30.18% | 1.82% | 18.57% | 8.09% |
| Ratios to Average Net AssetsH,I | | | | | | |
| Expenses before reductions | .67%J | .67% | .68% | .69% | .70% | .71% |
| Expenses net of fee waivers, if any | .67%J | .67% | .68% | .68% | .70% | .71% |
| Expenses net of all reductions | .66%J | .67% | .67% | .68% | .69% | .70% |
| Net investment income (loss) | 1.94%J | 1.92% | 1.84% | 1.61% | 1.58% | 1.58% |
| Supplemental Data | | | | | | |
| Net assets, end of period (000 omitted) | $110,932 | $99,804 | $91,749 | $57,396 | $71,364 | $54,874 |
| Portfolio turnover rateK | 48%J | 72% | 65% | 59% | 52% | 61% |
A Calculated based on average shares outstanding during the period.
B Amount represents less than $.005 per share.
C The amounts shown reflect certain reclassifications related to book to tax differences that were made in the year shown.
D Total distributions of $0.10 per share is comprised of distributions from net investment income of $.007 and distributions from net realized gain of $.097 per share.
E Total returns for periods of less than one year are not annualized.
F Total returns do not reflect charges attributable to your insurance company's separate account. Inclusion of these charges would reduce the total returns shown.
G Total returns would have been lower if certain expenses had not been reduced during the applicable periods shown.
H Fees and expenses of any underlying Fidelity Central Funds are not included in the Fund's expense ratio. The Fund indirectly bears its proportionate share of the expenses of any underlying Fidelity Central Funds.
I Expense ratios reflect operating expenses of the class. Expenses before reductions do not reflect amounts reimbursed by the investment adviser or reductions from brokerage service arrangements or reductions from other expense offset arrangements and do not represent the amount paid by the class during periods when reimbursements or reductions occur. Expenses net of fee waivers reflect expenses after reimbursement by the investment adviser but prior to reductions from brokerage service arrangements or other expense offset arrangements. Expenses net of all reductions represent the net expenses paid by the class.
J Annualized
K Amount does not include the portfolio activity of any underlying Fidelity Central Funds.
See accompanying notes which are an integral part of the financial statements.
Financial Highlights — VIP Real Estate Portfolio Service Class
| | Six months ended (Unaudited) June 30, | Years ended December 31, | | | | |
| | 2016 | 2015 | 2014 | 2013 | 2012 | 2011 |
| Selected Per–Share Data | | | | | | |
| Net asset value, beginning of period | $19.56 | $19.68 | $16.32 | $17.20 | $15.00 | $14.04 |
| Income from Investment Operations | | | | | | |
| Net investment income (loss)A | .18 | .36 | .33 | .27 | .25 | .22 |
| Net realized and unrealized gain (loss) | 1.88 | .33 | 4.51 | .01B | 2.51 | .89 |
| Total from investment operations | 2.06 | .69 | 4.84 | .28 | 2.76 | 1.11 |
| Distributions from net investment income | (.01) | (.37) | (.29)C | (.32) | (.24) | (.15) |
| Distributions from net realized gain | (.10) | (.44) | (1.19)C | (.83) | (.32) | – |
| Total distributions | (.10)D | (.81) | (1.48) | (1.16)E | (.56) | (.15) |
| Net asset value, end of period | $21.52 | $19.56 | $19.68 | $16.32 | $17.20 | $15.00 |
| Total ReturnF,G,H | 10.68% | 3.61% | 29.98% | 1.73% | 18.49% | 7.96% |
| Ratios to Average Net AssetsI,J | | | | | | |
| Expenses before reductions | .77%K | .77% | .78% | .78% | .79% | .81% |
| Expenses net of fee waivers, if any | .77%K | .77% | .78% | .78% | .79% | .81% |
| Expenses net of all reductions | .76%K | .76% | .77% | .78% | .78% | .80% |
| Net investment income (loss) | 1.84%K | 1.82% | 1.75% | 1.52% | 1.49% | 1.48% |
| Supplemental Data | | | | | | |
| Net assets, end of period (000 omitted) | $4,616 | $4,060 | $4,056 | $3,255 | $1,634 | $597 |
| Portfolio turnover rateL | 48%K | 72% | 65% | 59% | 52% | 61% |
A Calculated based on average shares outstanding during the period.
B The amount shown for a share outstanding does not correspond with the aggregate net gain (loss) on investments for the period due to the timing of sales and repurchases of shares in relation to fluctuating market values of the investments of the Fund.
C The amounts shown reflect certain reclassifications related to book to tax differences that were made in the year shown.
D Total distributions of $0.10 per share is comprised of distributions from net investment income of $.007 and distributions from net realized gain of $.097 per share.
E Total distributions of $1.16 per share is comprised of distributions from net investment income of $.324 and distributions from net realized gain of $.833 per share.
F Total returns for periods of less than one year are not annualized.
G Total returns do not reflect charges attributable to your insurance company's separate account. Inclusion of these charges would reduce the total returns shown.
H Total returns would have been lower if certain expenses had not been reduced during the applicable periods shown.
I Fees and expenses of any underlying Fidelity Central Funds are not included in the Fund's expense ratio. The Fund indirectly bears its proportionate share of the expenses of any underlying Fidelity Central Funds.
J Expense ratios reflect operating expenses of the class. Expenses before reductions do not reflect amounts reimbursed by the investment adviser or reductions from brokerage service arrangements or reductions from other expense offset arrangements and do not represent the amount paid by the class during periods when reimbursements or reductions occur. Expenses net of fee waivers reflect expenses after reimbursement by the investment adviser but prior to reductions from brokerage service arrangements or other expense offset arrangements. Expenses net of all reductions represent the net expenses paid by the class.
K Annualized
L Amount does not include the portfolio activity of any underlying Fidelity Central Funds.
See accompanying notes which are an integral part of the financial statements.
Financial Highlights — VIP Real Estate Portfolio Service Class 2
| | Six months ended (Unaudited) June 30, | Years ended December 31, | | | | |
| | 2016 | 2015 | 2014 | 2013 | 2012 | 2011 |
| Selected Per–Share Data | | | | | | |
| Net asset value, beginning of period | $19.35 | $19.47 | $16.16 | $17.03 | $14.86 | $13.92 |
| Income from Investment Operations | | | | | | |
| Net investment income (loss)A | .16 | .33 | .30 | .24 | .22 | .19 |
| Net realized and unrealized gain (loss) | 1.85 | .33 | 4.46 | .01B | 2.48 | .89 |
| Total from investment operations | 2.01 | .66 | 4.76 | .25 | 2.70 | 1.08 |
| Distributions from net investment income | (.01) | (.34) | (.26)C | (.29) | (.21) | (.14) |
| Distributions from net realized gain | (.10) | (.44) | (1.19)C | (.83) | (.32) | – |
| Total distributions | (.10)D | (.78) | (1.45) | (1.12) | (.53) | (.14) |
| Net asset value, end of period | $21.26 | $19.35 | $19.47 | $16.16 | $17.03 | $14.86 |
| Total ReturnE,F,G | 10.53% | 3.49% | 29.80% | 1.61% | 18.30% | 7.78% |
| Ratios to Average Net AssetsH,I | | | | | | |
| Expenses before reductions | .92%J | .92% | .93% | .94% | .94% | .95% |
| Expenses net of fee waivers, if any | .92%J | .92% | .93% | .93% | .94% | .95% |
| Expenses net of all reductions | .91%J | .91% | .92% | .93% | .93% | .95% |
| Net investment income (loss) | 1.69%J | 1.67% | 1.60% | 1.37% | 1.33% | 1.34% |
| Supplemental Data | | | | | | |
| Net assets, end of period (000 omitted) | $203,356 | $194,640 | $200,481 | $165,134 | $145,738 | $127,231 |
| Portfolio turnover rateK | 48%J | 72% | 65% | 59% | 52% | 61% |
A Calculated based on average shares outstanding during the period.
B The amount shown for a share outstanding does not correspond with the aggregate net gain (loss) on investments for the period due to the timing of sales and repurchases of shares in relation to fluctuating market values of the investments of the Fund.
C The amounts shown reflect certain reclassifications related to book to tax differences that were made in the year shown.
D Total distributions of $0.10 per share is comprised of distributions from net investment income of $.007 and distributions from net realized gain of $.097 per share.
E Total returns for periods of less than one year are not annualized.
F Total returns do not reflect charges attributable to your insurance company's separate account. Inclusion of these charges would reduce the total returns shown.
G Total returns would have been lower if certain expenses had not been reduced during the applicable periods shown.
H Fees and expenses of any underlying Fidelity Central Funds are not included in the Fund's expense ratio. The Fund indirectly bears its proportionate share of the expenses of any underlying Fidelity Central Funds.
I Expense ratios reflect operating expenses of the class. Expenses before reductions do not reflect amounts reimbursed by the investment adviser or reductions from brokerage service arrangements or reductions from other expense offset arrangements and do not represent the amount paid by the class during periods when reimbursements or reductions occur. Expenses net of fee waivers reflect expenses after reimbursement by the investment adviser but prior to reductions from brokerage service arrangements or other expense offset arrangements. Expenses net of all reductions represent the net expenses paid by the class.
J Annualized
K Amount does not include the portfolio activity of any underlying Fidelity Central Funds.
See accompanying notes which are an integral part of the financial statements.
Financial Highlights — VIP Real Estate Portfolio Investor Class
| | Six months ended (Unaudited) June 30, | Years ended December 31, | | | | |
| | 2016 | 2015 | 2014 | 2013 | 2012 | 2011 |
| Selected Per–Share Data | | | | | | |
| Net asset value, beginning of period | $19.52 | $19.64 | $16.29 | $17.15 | $14.97 | $14.01 |
| Income from Investment Operations | | | | | | |
| Net investment income (loss)A | .18 | .36 | .33 | .28 | .25 | .22 |
| Net realized and unrealized gain (loss) | 1.87 | .33 | 4.50 | .01B | 2.49 | .90 |
| Total from investment operations | 2.05 | .69 | 4.83 | .29 | 2.74 | 1.12 |
| Distributions from net investment income | (.01) | (.37) | (.30)C | (.32) | (.24) | (.16) |
| Distributions from net realized gain | (.10) | (.44) | (1.19)C | (.83) | (.32) | – |
| Total distributions | (.10)D | (.81) | (1.48)E | (1.15) | (.56) | (.16) |
| Net asset value, end of period | $21.47 | $19.52 | $19.64 | $16.29 | $17.15 | $14.97 |
| Total ReturnF,G,H | 10.65% | 3.64% | 30.02% | 1.81% | 18.42% | 8.03% |
| Ratios to Average Net AssetsI,J | | | | | | |
| Expenses before reductions | .75%K | .75% | .76% | .77% | .78% | .79% |
| Expenses net of fee waivers, if any | .75%K | .75% | .76% | .76% | .78% | .79% |
| Expenses net of all reductions | .74%K | .74% | .75% | .76% | .77% | .78% |
| Net investment income (loss) | 1.86%K | 1.84% | 1.76% | 1.53% | 1.50% | 1.50% |
| Supplemental Data | | | | | | |
| Net assets, end of period (000 omitted) | $252,266 | $222,596 | $219,550 | $138,855 | $130,397 | $80,646 |
| Portfolio turnover rateL | 48%K | 72% | 65% | 59% | 52% | 61% |
A Calculated based on average shares outstanding during the period.
B The amount shown for a share outstanding does not correspond with the aggregate net gain (loss) on investments for the period due to the timing of sales and repurchases of shares in relation to fluctuating market values of the investments of the Fund.
C The amounts shown reflect certain reclassifications related to book to tax differences that were made in the year shown.
D Total distributions of $0.10 per share is comprised of distributions from net investment income of $.007 and distributions from net realized gain of $.097 per share.
E Total distributions of $1.48 per share is comprised of distributions from net investment income of $.296 and distributions from net realized gain of $1.188 per share.
F Total returns for periods of less than one year are not annualized.
G Total returns do not reflect charges attributable to your insurance company's separate account. Inclusion of these charges would reduce the total returns shown.
H Total returns would have been lower if certain expenses had not been reduced during the applicable periods shown.
I Fees and expenses of any underlying Fidelity Central Funds are not included in the Fund's expense ratio. The Fund indirectly bears its proportionate share of the expenses of any underlying Fidelity Central Funds.
J Expense ratios reflect operating expenses of the class. Expenses before reductions do not reflect amounts reimbursed by the investment adviser or reductions from brokerage service arrangements or reductions from other expense offset arrangements and do not represent the amount paid by the class during periods when reimbursements or reductions occur. Expenses net of fee waivers reflect expenses after reimbursement by the investment adviser but prior to reductions from brokerage service arrangements or other expense offset arrangements. Expenses net of all reductions represent the net expenses paid by the class.
K Annualized
L Amount does not include the portfolio activity of any underlying Fidelity Central Funds.
See accompanying notes which are an integral part of the financial statements.
Notes to Financial Statements (Unaudited)
For the period ended June 30, 2016
1. Organization.
VIP Real Estate Portfolio (the Fund) is a non-diversified fund of Variable Insurance Products Fund IV (the Trust) and is authorized to issue an unlimited number of shares. The Trust is registered under the Investment Company Act of 1940, as amended (the 1940 Act), as an open-end management investment company organized as a Massachusetts business trust. Shares of the Fund may only be purchased by insurance companies for the purpose of funding variable annuity or variable life insurance contracts. The Fund offers the following classes of shares: Initial Class shares, Service Class shares, Service Class 2 shares, and Investor Class shares. All classes have equal rights and voting privileges, except for matters affecting a single class.
2. Investments in Fidelity Central Funds.
The Fund invests in Fidelity Central Funds, which are open-end investment companies generally available only to other investment companies and accounts managed by the investment adviser and its affiliates. The Fund's Schedule of Investments lists each of the Fidelity Central Funds held as of period end, if any, as an investment of the Fund, but does not include the underlying holdings of each Fidelity Central Fund. As an Investing Fund, the Fund indirectly bears its proportionate share of the expenses of the underlying Fidelity Central Funds.
The Money Market Central Funds seek preservation of capital and current income and are managed by Fidelity Investments Money Management, Inc. (FIMM), an affiliate of the investment adviser. Annualized expenses of the Money Market Central Funds as of their most recent shareholder report date are less than .005%.
A complete unaudited list of holdings for each Fidelity Central Fund is available upon request or at the Securities and Exchange Commission (the SEC) website at www.sec.gov. In addition, the financial statements of the Fidelity Central Funds are available on the SEC website or upon request.
3. Significant Accounting Policies.
The financial statements have been prepared in conformity with accounting principles generally accepted in the United States of America (GAAP), which require management to make certain estimates and assumptions at the date of the financial statements. Actual results could differ from those estimates. Subsequent events, if any, through the date that the financial statements were issued have been evaluated in the preparation of the financial statements. The following summarizes the significant accounting policies of the Fund:
Investment Valuation. Investments are valued as of 4:00 p.m. Eastern time on the last calendar day of the period. The Board of Trustees (the Board) has delegated the day to day responsibility for the valuation of the Fund's investments to the Fidelity SelectCo, LLC (SelectCo) Fair Value Committee (the Committee). In accordance with valuation policies and procedures approved by the Board, the Fund attempts to obtain prices from one or more third party pricing vendors or brokers to value its investments. When current market prices, quotations or currency exchange rates are not readily available or reliable, investments will be fair valued in good faith by the Committee, in accordance with procedures adopted by the Board. Factors used in determining fair value vary by investment type and may include market or investment specific events. The frequency with which these procedures are used cannot be predicted and they may be utilized to a significant extent. The Committee oversees the Fund's valuation policies and procedures and reports to the Board on the Committee's activities and fair value determinations. The Board monitors the appropriateness of the procedures used in valuing the Fund's investments and ratifies the fair value determinations of the Committee.
The Fund categorizes the inputs to valuation techniques used to value its investments into a disclosure hierarchy consisting of three levels as shown below:
- Level 1 – quoted prices in active markets for identical investments
- Level 2 – other significant observable inputs (including quoted prices for similar investments, interest rates, prepayment speeds, etc.)
- Level 3 – unobservable inputs (including the Fund's own assumptions based on the best information available)
Valuation techniques used to value the Fund's investments by major category are as follows:
Equity securities, including restricted securities, for which market quotations are readily available, are valued at the last reported sale price or official closing price as reported by a third party pricing vendor on the primary market or exchange on which they are traded and are categorized as Level 1 in the hierarchy. In the event there were no sales during the day or closing prices are not available, securities are valued at the last quoted bid price or may be valued using the last available price and are generally categorized as Level 2 in the hierarchy. For foreign equity securities, when market or security specific events arise, comparisons to the valuation of American Depositary Receipts (ADRs), futures contracts, Exchange-Traded Funds (ETFs) and certain indexes as well as quoted prices for similar securities may be used and would be categorized as Level 2 in the hierarchy. Utilizing these techniques may result in transfers between Level 1 and Level 2. For equity securities, including restricted securities, where observable inputs are limited, assumptions about market activity and risk are used and these securities may be categorized as Level 3 in the hierarchy.
Investments in open-end mutual funds, including the Fidelity Central Funds, are valued at their closing net asset value (NAV) each business day and are categorized as Level 1 in the hierarchy.
Changes in valuation techniques may result in transfers in or out of an assigned level within the disclosure hierarchy.
Investment Transactions and Income. For financial reporting purposes, the Fund's investment holdings and NAV include trades executed through the end of the last business day of the period. The NAV per share for processing shareholder transactions is calculated as of the close of business of the New York Stock Exchange (NYSE), normally 4:00 p.m. Eastern time and includes trades executed through the end of the prior business day. Gains and losses on securities sold are determined on the basis of identified cost and may include proceeds received from litigation. Dividend income is recorded on the ex-dividend date, except for certain dividends from foreign securities where the ex-dividend date may have passed, which are recorded as soon as the Fund is informed of the ex-dividend date. Non-cash dividends included in dividend income, if any, are recorded at the fair market value of the securities received. Income and capital gain distributions from Fidelity Central Funds, if any, are recorded on the ex-dividend date. Distributions received on securities that represent a return of capital or capital gain are recorded as a reduction of cost of investments and/or as a realized gain. Subsequent to ex-dividend date the Fund determines the components of these distributions, based upon receipt of tax filings or other correspondence relating to the underlying investment.
Class Allocations and Expenses. Investment income, realized and unrealized capital gains and losses, common expenses of the Fund, and certain fund-level expense reductions, if any, are allocated daily on a pro-rata basis to each class based on the relative net assets of each class to the total net assets of the Fund. Each class differs with respect to transfer agent and distribution and service plan fees incurred. Certain expense reductions may also differ by class. For the reporting period, the allocated portion of income and expenses to each class as a percent of its average net assets may vary due to the timing of recording these transactions in relation to fluctuating net assets of the classes. Expenses directly attributable to a fund are charged to that fund. Expenses attributable to more than one fund are allocated among the respective funds on the basis of relative net assets or other appropriate methods. Expense estimates are accrued in the period to which they relate and adjustments are made when actual amounts are known.
Income Tax Information and Distributions to Shareholders. Each year, the Fund intends to qualify as a regulated investment company under Subchapter M of the Internal Revenue Code, including distributing substantially all of its taxable income and realized gains. As a result, no provision for U.S. Federal income taxes is required. The Fund files a U.S. federal tax return, in addition to state and local tax returns as required. The Fund's federal income tax returns are subject to examination by the Internal Revenue Service (IRS) for a period of three fiscal years after they are filed. State and local tax returns may be subject to examination for an additional fiscal year depending on the jurisdiction.
Distributions are declared and recorded on the ex-dividend date. Income dividends and capital gain distributions are declared separately for each class. Income and capital gain distributions are determined in accordance with income tax regulations, which may differ from GAAP.
Capital accounts within the financial statements are adjusted for permanent book-tax differences. These adjustments have no impact on net assets or the results of operations. Capital accounts are not adjusted for temporary book-tax differences which will reverse in a subsequent period.
Book-tax differences are primarily due to the short-term gain distributions from the Underlying Funds and losses deferred due to wash sales.
The federal tax cost of investment securities and unrealized appreciation (depreciation) as of period end were as follows:
| Gross unrealized appreciation | $167,141,851 |
| Gross unrealized depreciation | (7,453,124) |
| Net unrealized appreciation (depreciation) on securities | $159,688,727 |
| Tax cost | $415,357,940 |
4. Purchases and Sales of Investments.
Purchases and sales of securities, other than short-term securities, aggregated $131,967,780 and $123,165,128, respectively.
5. Fees and Other Transactions with Affiliates.
Management Fee. Fidelity SelectCo, LLC (the investment adviser) and its affiliates provide the Fund with investment management related services for which the Fund pays a monthly management fee. The management fee is the sum of an individual fund fee rate that is based on an annual rate of .30% of the Fund's average net assets and an annualized group fee rate that averaged .25% during the period. The group fee rate is based upon the average net assets of all the mutual funds advised by Fidelity Management & Research Company (FMR) and the investment adviser. The group fee rate decreases as assets under management increase and increases as assets under management decrease. For the reporting period, the total annualized management fee rate was .55% of the Fund's average net assets.
Distribution and Service Plan Fees. In accordance with Rule 12b-1 of the 1940 Act, the Fund has adopted separate 12b-1 Plans for each Service Class of shares. Each Service Class pays Fidelity Distributors Corporation (FDC), an affiliate of the investment adviser, a service fee. For the period, the service fee is based on an annual rate of .10% of Service Class' average net assets and .25% of Service Class 2's average net assets.
For the period, total fees, all of which were re-allowed to insurance companies for the distribution of shares and providing shareholder support services, were as follows:
| Service Class | $2,111 |
| Service Class 2 | 239,378 |
| | $241,489 |
Transfer Agent Fees. Fidelity Investments Institutional Operations Company, Inc. (FIIOC), an affiliate of the investment adviser, is the Fund's transfer, dividend disbursing, and shareholder servicing agent. FIIOC receives an asset-based fee with respect to each class. Each class (with the exception of Investor Class) pays a fee for transfer agent services, typesetting and printing and mailing of shareholder reports, excluding mailing of proxy statements, equal to an annual rate of .07%(.15% for Investor Class) of class-level average net assets. For the period, transfer agent fees for each class were as follows:
| Initial Class | $33,197 |
| Service Class | 1,394 |
| Service Class 2 | 63,196 |
| Investor Class | 165,433 |
| | $263,220 |
Accounting and Security Lending Fees. Fidelity Service Company, Inc. (FSC), an affiliate of the investment adviser, maintains the Fund's accounting records. The accounting fee is based on the level of average net assets for each month. Under a separate contract, FSC administers the security lending program. The security lending fee is based on the number and duration of lending transactions.
Brokerage Commissions. The Fund placed a portion of its portfolio transactions with brokerage firms which are affiliates of the investment adviser. Brokerage commissions are included in net realized gain (loss) and change in net unrealized appreciation (depreciation) in the Statement of Operations. The commissions paid to these affiliated firms were $1,091 for the period.
Interfund Trades. The Fund may purchase from or sell securities to other Fidelity Funds under procedures adopted by the Board. The procedures have been designed to ensure these interfund trades are executed in accordance with Rule 17a-7 of the 1940 Act. Interfund trades are included within the respective purchases and sales amounts shown in the Purchases and Sales of Investments note.
6. Committed Line of Credit.
The Fund participates with other funds managed by the investment adviser or an affiliate in a $4.25 billion credit facility (the "line of credit") to be utilized for temporary or emergency purposes to fund shareholder redemptions or for other short-term liquidity purposes. The Fund has agreed to pay commitment fees on its pro-rata portion of the line of credit, which amounted to $448 and is reflected in Miscellaneous expenses on the Statement of Operations. During the period, the Fund did not borrow on this line of credit.
7. Security Lending.
The Fund lends portfolio securities through a lending agent from time to time in order to earn additional income. On the settlement date of the loan, the Fund receives collateral (in the form of U.S. Treasury obligations, letters of credit and/or cash) against the loaned securities and maintains collateral in an amount not less than 100% of the market value of the loaned securities during the period of the loan. The market value of the loaned securities is determined at the close of business of the Fund and any additional required collateral is delivered to the Fund on the next business day. The Fund or borrower may terminate the loan at any time, and if the borrower defaults on its obligation to return the securities loaned because of insolvency or other reasons, the Fund may apply collateral received from the borrower against the obligation. The Fund may experience delays and costs in recovering the securities loaned. Any cash collateral received is invested in the Fidelity Securities Lending Cash Central Fund. The value of loaned securities and cash collateral at period end are disclosed on the Fund's Statement of Assets and Liabilities. Security lending income represents the income earned on investing cash collateral, less rebates paid to borrowers and any lending agent fees associated with the loan, plus any premium payments received for lending certain types of securities. Security lending income is presented in the Statement of Operations as a component of income from Fidelity Central Funds. Total security lending income during the period amounted to $333.
8. Expense Reductions.
Commissions paid to certain brokers with whom the investment adviser, or its affiliates, places trades on behalf of the Fund include an amount in addition to trade execution, which may be rebated back to the Fund to offset certain expenses. This amount totaled $19,860 for the period.
In addition, during the period the investment adviser reimbursed and/or waived a portion of fund-level operating expenses in the amount of $1,841.
9. Distributions to Shareholders.
Distributions to shareholders of each class were as follows:
| | Six months ended
June 30, 2016 | Year ended December 31, 2015 |
| From net investment income | | |
| Initial Class | $35,341 | $1,876,785 |
| Service Class | 1,471 | 74,715 |
| Service Class 2 | 69,202 | 3,396,742 |
| Investor Class | 79,024 | 4,047,469 |
| Total | $185,038 | $9,395,711 |
| From net realized gain | | |
| Initial Class | $489,721 | $2,154,318 |
| Service Class | 20,382 | 87,715 |
| Service Class 2 | 958,940 | 4,463,646 |
| Investor Class | 1,095,047 | 4,918,400 |
| Total | $2,564,090 | $11,624,079 |
10. Share Transactions.
Transactions for each class of shares were as follows:
| | Shares | Shares | Dollars | Dollars |
| | Six months ended
June 30, 2016 | Year ended December 31, 2015 | Six months ended
June 30, 2016 | Year ended December 31, 2015 |
| Initial Class | | | | |
| Shares sold | 414,309 | 1,580,142 | $8,209,044 | $32,090,007 |
| Reinvestment of distributions | 29,969 | 210,726 | 525,062 | 4,031,103 |
| Shares redeemed | (393,211) | (1,352,422) | (7,681,952) | (26,706,157) |
| Net increase (decrease) | 51,067 | 438,446 | $1,052,154 | $9,414,953 |
| Service Class | | | | |
| Shares sold | 40,309 | 50,439 | $777,877 | $993,059 |
| Reinvestment of distributions | 1,250 | 8,517 | 21,853 | 162,430 |
| Shares redeemed | (34,558) | (57,538) | (685,866) | (1,157,937) |
| Net increase (decrease) | 7,001 | 1,418 | $113,864 | $(2,448) |
| Service Class 2 | | | | |
| Shares sold | 1,297,610 | 3,606,249 | $25,557,192 | $70,363,168 |
| Reinvestment of distributions | 59,499 | 416,191 | 1,028,142 | 7,860,388 |
| Shares redeemed | (1,853,480) | (4,258,625) | (36,449,372) | (82,542,395) |
| Net increase (decrease) | (496,371) | (236,185) | $(9,864,038) | $(4,318,839) |
| Investor Class | | | | |
| Shares sold | 858,947 | 2,482,401 | $17,217,086 | $50,545,190 |
| Reinvestment of distributions | 67,321 | 470,583 | 1,174,071 | 8,965,869 |
| Shares redeemed | (580,913) | (2,729,055) | (11,164,842) | (53,408,419) |
| Net increase (decrease) | 345,355 | 223,929 | $7,226,315 | $6,102,640 |
11. Other.
The Fund's organizational documents provide former and current trustees and officers with a limited indemnification against liabilities arising in connection with the performance of their duties to the Fund. In the normal course of business, the Fund may also enter into contracts that provide general indemnifications. The Fund's maximum exposure under these arrangements is unknown as this would be dependent on future claims that may be made against the Fund. The risk of material loss from such claims is considered remote.
At the end of the period, the investment adviser or its affiliates were the owners of record of 55% of the total outstanding shares of the Fund and one otherwise unaffiliated shareholder was the owner of record of 29% of the total outstanding shares of the Fund.
Shareholder Expense Example
As a shareholder of the Fund, you incur two types of costs: (1) transaction costs, and (2) ongoing costs, including management fees, distribution and/or service (12b-1) fees and other Fund expenses. This Example is intended to help you understand your ongoing costs (in dollars) of investing in the Fund and to compare these costs with the ongoing costs of investing in other mutual funds.
The Example is based on an investment of $1,000 invested at the beginning of the period and held for the entire period (January 1, 2016 to June 30, 2016).
Actual Expenses
The first line of the accompanying table for each class of the Fund provides information about actual account values and actual expenses. You may use the information in this line, together with the amount you invested, to estimate the expenses that you paid over the period. Simply divide your account value by $1,000.00 (for example, an $8,600 account value divided by $1,000.00 = 8.6), then multiply the result by the number in the first line for a class of the Fund under the heading entitled "Expenses Paid During Period" to estimate the expenses you paid on your account during this period. The estimate of expenses does not include any fees or other expenses of any variable annuity or variable life insurance product. If they were, the estimate of expenses you paid during the period would be higher, and your ending account value would be lower. In addition, the Fund, as a shareholder in the underlying Fidelity Central Funds, will indirectly bear its pro-rata share of the fees and expenses incurred by the underlying Fidelity Central Funds. These fees and expenses are not included in the Fund's annualized expense ratio used to calculate the expense estimate in the table below.
Hypothetical Example for Comparison Purposes
The second line of the accompanying table for each class of the Fund provides information about hypothetical account values and hypothetical expenses based on a Class' actual expense ratio and an assumed rate of return of 5% per year before expenses, which is not the Class' actual return. The hypothetical account values and expenses may not be used to estimate the actual ending account balance or expenses you paid for the period. You may use this information to compare the ongoing costs of investing in the Fund and other funds. To do so, compare this 5% hypothetical example with the 5% hypothetical examples that appear in the shareholder reports of the other funds. The estimate of expenses does not include any fees or other expenses of any variable annuity or variable life insurance product. If they were, the estimate of expenses you paid during the period would be higher, and your ending account value would be lower. In addition, the Fund, as a shareholder in the underlying Fidelity Central Funds, will indirectly bear its pro-rata share of the fees and expenses incurred by the underlying Fidelity Central Funds. These fees and expenses are not included in the Fund's annualized expense ratio used to calculate the expense estimate in the table below.
Please note that the expenses shown in the table are meant to highlight your ongoing costs only and do not reflect any transaction costs. Therefore, the second line of the table is useful in comparing ongoing costs only, and will not help you determine the relative total costs of owning different funds.
| | Annualized Expense Ratio-A | Beginning
Account Value
January 1, 2016 | Ending
Account Value
June 30, 2016 | Expenses Paid
During Period-B
January 1, 2016
to June 30, 2016 |
| Initial Class | .67% | | | |
| Actual | | $1,000.00 | $1,107.00 | $3.51 |
| Hypothetical-C | | $1,000.00 | $1,021.53 | $3.37 |
| Service Class | .77% | | | |
| Actual | | $1,000.00 | $1,106.80 | $4.03 |
| Hypothetical-C | | $1,000.00 | $1,021.03 | $3.87 |
| Service Class 2 | .92% | | | |
| Actual | | $1,000.00 | $1,105.30 | $4.82 |
| Hypothetical-C | | $1,000.00 | $1,020.29 | $4.62 |
| Investor Class | .75% | | | |
| Actual | | $1,000.00 | $1,106.50 | $3.93 |
| Hypothetical-C | | $1,000.00 | $1,021.13 | $3.77 |
A Annualized expense ratio reflects expenses net of applicable fee waivers.
B Expenses are equal to each Class' annualized expense ratio, multiplied by the average account value over the period, multiplied by 182/366 (to reflect the one-half year period).
C 5% return per year before expenses
Board Approval of Investment Advisory Contracts and Management Fees
VIP Real Estate Portfolio
Each year, the Board of Trustees, including the Independent Trustees (together, the Board), votes on the renewal of the management contract with Fidelity SelectCo, LLC (SelectCo), an affiliate of Fidelity Management & Research Company (FMR), and the sub-advisory agreements with affiliates of FMR (together, the Advisory Contracts) for the fund. The Board, assisted by the advice of fund counsel and Independent Trustees' counsel, requests and considers a broad range of information relevant to the renewal of the Advisory Contracts throughout the year.
The Board meets regularly and, at each of its meetings, covers an extensive agenda of topics and materials and considers factors that are relevant to its annual consideration of the renewal of the fund's Advisory Contracts, including the services and support provided to the fund and its shareholders. The Board has established four standing committees (Committees) — Operations, Audit, Fair Valuation, and Governance and Nominating — each composed of and chaired by Independent Trustees with varying backgrounds, to which the Board has assigned specific subject matter responsibilities in order to enhance effective decision-making by the Board. The Operations Committee, of which all of the Independent Trustees are members, meets regularly throughout the year and considers, among other matters, information specifically related to the annual consideration of the renewal of the fund's Advisory Contracts. The Board, acting directly and through its Committees, requests and receives information concerning the annual consideration of the renewal of the fund's Advisory Contracts. The Board also meets as needed to consider matters specifically related to the Board's annual consideration of the renewal of the Advisory Contracts. Members of the Board may also meet with trustees of other Fidelity funds through ad hoc joint committees to discuss certain matters relevant to all of the Fidelity funds.
At its January 2016 meeting, the Board unanimously determined to renew the fund's Advisory Contracts. In reaching its determination, the Board considered all factors it believed relevant, including (i) the nature, extent, and quality of the services to be provided to the fund and its shareholders (including the investment performance of the fund); (ii) the competitiveness of the fund's management fee and total expense ratio relative to peer funds; (iii) the total costs of the services to be provided by and the profits to be realized by Fidelity from its relationships with the fund; and (iv) the extent to which, if any, economies of scale exist and would be realized as the fund grows, and whether any economies of scale are appropriately shared with fund shareholders.
In considering whether to renew the Advisory Contracts for the fund, the Board reached a determination, with the assistance of fund counsel and Independent Trustees' counsel and through the exercise of its business judgment, that the renewal of the Advisory Contracts was in the best interests of the fund and its shareholders and that the compensation payable under the Advisory Contracts was fair and reasonable. The Board's decision to renew the Advisory Contracts was not based on any single factor, but rather was based on a comprehensive consideration of all the information provided to the Board at its meetings throughout the year. The Board, in reaching its determination to renew the Advisory Contracts, was aware that shareholders of the fund have a broad range of investment choices available to them, including a wide choice among funds offered by Fidelity's competitors, and that the fund's shareholders, who have the opportunity to review and weigh the disclosure provided by the fund in its prospectus and other public disclosures, have chosen to invest in this fund, which is part of the Fidelity family of funds.
Nature, Extent, and Quality of Services Provided. The Board considered the staffing of SelectCo and the sub-advisers (together with SelectCo, the Investment Advisers) as it relates to the fund, including the backgrounds of investment personnel of SelectCo, and also considered the fund's investment objectives, strategies, and related investment philosophies. The Independent Trustees also had discussions with senior management of Fidelity's investment operations and investment groups. The Board considered the structure of the investment personnel compensation program and whether this structure provides appropriate incentives to act in the best interests of the fund. Additionally, the Board considered the portfolio managers' investments, if any, in the funds that they manage.
Resources Dedicated to Investment Management and Support Services. The Board reviewed the general qualifications and capabilities of the investment staff of the Investment Advisers, including their size, education, experience, and resources, as well as Fidelity's approach to recruiting, training, managing, and compensating investment personnel. The Board noted that Fidelity has continued to increase the resources devoted to non-U.S. offices, including expansion of Fidelity's global investment organization. The Board also noted that Fidelity's analysts have extensive resources, tools and capabilities that allow them to conduct sophisticated quantitative and fundamental analysis, as well as credit analysis of issuers, counterparties and guarantors. Further, the Board considered that Fidelity's investment professionals have sufficient access to global information and data so as to provide competitive investment results over time, and that those professionals also have access to sophisticated tools that permit them to assess portfolio construction and risk and performance attribution characteristics continuously, as well as to transmit new information and research conclusions rapidly around the world. Additionally, in its deliberations, the Board considered Fidelity's trading, risk management, compliance, and technology and operations capabilities and resources, which are integral parts of the investment management process.
Shareholder and Administrative Services. The Board considered (i) the nature, extent, quality, and cost of advisory, administrative, and shareholder services performed by the Investment Advisers and their affiliates under the Advisory Contracts and under separate agreements covering transfer agency, pricing and bookkeeping, and securities lending services for the fund; (ii) the nature and extent of the supervision of third party service providers, principally custodians, subcustodians, and pricing vendors; and (iii) the resources devoted to, and the record of compliance with, the fund's compliance policies and procedures. The Board also reviewed the allocation of fund brokerage, including allocations to brokers affiliated with the Investment Advisers, the use of brokerage commissions to pay fund expenses, and the use of "soft" commission dollars to pay for research services.
The Board noted that the growth of fund assets over time across the complex allows Fidelity to reinvest in the development of services designed to enhance the value or convenience of the Fidelity funds as investment vehicles. These services include 24-hour access to account information and market information through telephone representatives and over the Internet, investor education materials and asset allocation tools, and the expanded availability of Fidelity Investor Centers.
The Board noted that in 2014 the ad hoc Committee on Transfer Agency Fees was formed by it and the boards of certain other Fidelity funds to review the variety of transfer agency services and fee structures throughout the mutual fund industry compared to Fidelity's.
Investment in a Large Fund Family. The Board considered the benefits to shareholders of investing in a Fidelity fund, including the benefits of investing in a fund that is part of a large family of funds offering a variety of investment disciplines and providing a large variety of mutual fund investor services. The Board noted that Fidelity had taken, or had made recommendations that resulted in the Fidelity funds taking, a number of actions over the previous year that benefited particular funds, including (i) continuing to dedicate additional resources to investment research and to the support of the senior management team that oversees asset management; (ii) continuing efforts to enhance Fidelity's global research capabilities; (iii) launching new funds and making other enhancements to meet client needs; (iv) reducing management fees and total expenses for certain index funds; (v) continuing to launch dedicated lower cost underlying funds to meet portfolio construction needs related to expanding underlying fund options for Fidelity funds of funds, specifically for the Freedom Fund product lines; (vi) rationalizing product lines and gaining increased efficiencies through fund mergers; (vii) continuing to develop, acquire and implement systems and technology to improve services to the funds and shareholders, strengthen information security, and increase efficiency; (viii) implementing investment enhancements to further strengthen Fidelity's target date product line to increase investors' probability of success in achieving their goals; (ix) modifying the eligibility criteria for certain share classes to accommodate roll-over assets from employer-sponsored retirement plans; (x) launching a new Class W of the Freedom Index Funds to attract and retain Fidelity record-kept retirement plan assets; and (xi) implementing changes to Fidelity's money market fund product line in response to recent regulatory reforms.
Investment Performance. The Board considered whether the fund has operated in accordance with its investment objective, as well as its record of compliance with its investment restrictions and its performance history.
The Board took into account discussions with representatives of the Investment Advisers about fund investment performance that occur at Board meetings throughout the year. In this regard the Board noted that as part of regularly scheduled fund reviews and other reports to the Board on fund performance, the Board considers annualized return information for the fund, for different time periods, measured against a securities market index ("benchmark index"). In its evaluation of fund investment performance at meetings throughout the year, the Board gave particular attention to information indicating underperformance of certain Fidelity funds for specific time periods and discussed with the Investment Advisers the reasons for such underperformance.
In addition to reviewing absolute and relative fund performance, the Independent Trustees periodically consider the appropriateness of fund performance metrics in evaluating the results achieved. In general, the Independent Trustees believe that fund performance should be evaluated based on net performance (after fees and expenses) of both the highest performing and lowest performing fund share classes, where applicable, compared to appropriate benchmark indices, over appropriate time periods that may include full market cycles, taking into account relevant factors, including the following: general market conditions; issuer-specific information; and fund cash flows and other factors. Depending on the circumstances, the Independent Trustees may be satisfied with a fund's performance notwithstanding that it lags its benchmark index for certain periods.
The Independent Trustees recognize that shareholders evaluate performance on a net basis over their own holding periods, for which one-, three-, and five-year periods are often used as a proxy. For this reason, the performance information reviewed by the Board also included net cumulative total return information for the fund and an appropriate benchmark index for the most recent one-, three-, and five-year periods ended June 30, 2015.
Based on its review, the Board concluded that the nature, extent, and quality of services provided to the fund under the Advisory Contracts should benefit the shareholders of the fund.
Competitiveness of Management Fee and Total Expense Ratio. The Board considered the fund's management fee and total expense ratio compared to "mapped groups" of competitive funds and classes created for the purpose of facilitating the Trustees' analysis of the competitiveness of management fees and total expenses. Fidelity creates "mapped groups" by combining similar Lipper investment objective categories that have comparable investment mandates. For this purpose, all sector focused equity funds are grouped in the same mapped group. Combining Lipper investment objective categories aids the Board's management fee and total expense ratio comparisons by broadening the competitive group used for comparison.
Management Fee. The Board considered two proprietary management fee comparisons for the 12-month periods ended June 30 shown in basis points (BP) in the chart below. The group of Lipper funds used by the Board for management fee comparisons is referred to below as the "Total Mapped Group." The Total Mapped Group comparison focuses on a fund's standing in terms of gross management fees before expense reimbursements or caps relative to the total universe of funds with comparable investment mandates (
i.e., sector equities), regardless of whether their management fee structures also are comparable. Funds with comparable management fee structures have similar management fee contractual arrangements (
e.g., flat rate charged for advisory services, all-inclusive fee rate,
etc.). "TMG %" represents the percentage of funds in the Total Mapped Group that had management fees that were lower than the fund's. For example, a hypothetical TMG % of 20% would mean that 80% of the funds in the Total Mapped Group had higher, and 20% had lower, management fees than the fund. The fund's actual TMG %s and the number of funds in the Total Mapped Group are in the chart below. The "Asset-Size Peer Group" (ASPG) comparison focuses on a fund's standing relative to a subset of non-Fidelity funds within the Total Mapped Group that are similar in size and management fee structure. For example, if a fund is in the first quartile of the ASPG, the fund's management fee ranks in the least expensive or lowest 25% of funds in the ASPG. The ASPG represents at least 15% of the funds in the Total Mapped Group with comparable asset size and management fee structures, subject to a minimum of 50 funds (or all funds in the Total Mapped Group if fewer than 50). Additional information, such as the ASPG quartile in which the fund's management fee rate ranked, is also included in the chart and considered by the Board.
VIP Real Estate Portfolio

The Board noted that the fund's management fee rate ranked below the median of its Total Mapped Group and below the median of its ASPG for the 12-month period ended June 30, 2015.
The Board noted that, in 2014, the ad hoc Committee on Group Fee was formed by it and the boards of other Fidelity funds to conduct an in-depth review of the "group fee" component of the management fee of funds with such management fee structures. Committee focus included the mechanics of the group fee, the competitive landscape of group fee structures, Fidelity funds with no group fee component and investment products not included in group fee assets. The Board also considered that, for funds subject to the group fee, FMR agreed to voluntarily waive fees over a specified period of time in amounts designed to account for assets converted from certain funds to certain collective investment trusts.
Based on its review, the Board concluded that the fund's management fee is fair and reasonable in light of the services that the fund receives and the other factors considered.
Total Expense Ratio. In its review of each class's total expense ratio, the Board considered the fund's management fee rate as well as other fund or class expenses, as applicable, such as transfer agent fees, pricing and bookkeeping fees, fund-paid 12b-1 fees, and custodial, legal, and audit fees. The Board also noted that Fidelity may agree to waive fees and expenses from time to time, and the extent to which, if any, it has done so for the fund. As part of its review, the Board also considered the current and historical total expense ratios of each class of the fund compared to competitive fund median expenses. Each class of the fund is compared to those funds and classes in the Total Mapped Group (used by the Board for management fee comparisons) that have a similar sales load structure.
The Board noted that the total expense ratio of each class ranked below the competitive median for the 12-month period ended June 30, 2015.
Fees Charged to Other Fidelity Clients. The Board also considered Fidelity fee structures and other information with respect to clients of Fidelity, such as other funds advised or subadvised by Fidelity, pension plan clients, and other institutional clients with similar mandates. The Board noted the findings of the 2013 ad hoc joint committee (created with the boards of other Fidelity funds), which reviewed and compared Fidelity's institutional investment advisory business with its business of providing services to the Fidelity funds, including the differences in services provided, fees charged, and costs incurred, as well as competition in their respective marketplaces.
Based on its review of total expense ratios and fees charged to other Fidelity clients, the Board concluded that the total expense ratio of each class of the fund was reasonable in light of the services that the fund and its shareholders receive and the other factors considered.
Costs of the Services and Profitability. The Board considered the revenues earned and the expenses incurred by Fidelity in conducting the business of developing, marketing, distributing, managing, administering and servicing the fund and servicing the fund's shareholders. The Board also considered the level of Fidelity's profits in respect of all the Fidelity funds.
On an annual basis, Fidelity presents to the Board information about the profitability of its relationship with the fund. Fidelity calculates profitability information for each fund, as well as aggregate profitability information for groups of Fidelity funds and all Fidelity funds, using a series of detailed revenue and cost allocation methodologies which originate with the books and records of Fidelity on which Fidelity's audited financial statements are based. The Audit Committee of the Board reviews any significant changes from the prior year's methodologies.
PricewaterhouseCoopers LLP (PwC), independent registered public accounting firm and auditor to Fidelity and certain Fidelity funds, has been engaged annually by the Board as part of the Board's assessment of the profitability analysis used by Fidelity. PwC's engagement includes the review and assessment of Fidelity's methodologies used in determining the revenues and expenses attributable to Fidelity's mutual fund business, and completion of agreed-upon procedures in respect of the mathematical accuracy of fund profitability and its conformity to established allocation methodologies. After considering PwC's reports issued under the engagement and information provided by Fidelity, the Board concluded that while other allocation methods may also be reasonable, Fidelity's profitability methodologies are reasonable in all material respects.
The Board also reviewed Fidelity's non-fund businesses and fall-out benefits related to the mutual fund business as well as cases where Fidelity's affiliates may benefit from or be related to the fund's business.
The Board considered the costs of the services provided by and the profits realized by Fidelity in connection with the operation of the fund and was satisfied that the profitability was not excessive.
Economies of Scale. The Board considered whether there have been economies of scale in respect of the management of the Fidelity funds, whether the Fidelity funds (including the fund) have appropriately benefited from any such economies of scale, and whether there is potential for realization of any further economies of scale. The Board considered the extent to which the fund will benefit from economies of scale as assets grow through increased services to the fund, through waivers or reimbursements, or through fee or expense ratio reductions. The Board also noted that in 2013, it and the boards of other Fidelity funds created an ad hoc committee (the Economies of Scale Committee) to analyze whether Fidelity attains economies of scale in respect of the management and servicing of the Fidelity funds, whether the Fidelity funds have appropriately benefited from such economies of scale, and whether there is potential for realization of any further economies of scale.
The Board recognized that the fund's management contract incorporates a "group fee" structure, which provides for lower group fee rates as total group assets increase, and for higher group fee rates as total group assets decrease (with "group assets" defined to include fund assets under SelectCo's management plus assets under FMR's management). SelectCo calculates the group fee rates based on a tiered asset "breakpoint" schedule that varies based on asset class. The Board considered that the group fee is designed to deliver the benefits of economies of scale to fund shareholders when total group assets increase, even if assets of any particular fund are unchanged or have declined, because some portion of Fidelity's costs are attributable to services provided to all Fidelity funds, and all funds benefit if those costs can be allocated among more assets. The Board concluded that, given the group fee structure, fund shareholders will benefit from lower management fees as group assets increase at the fund complex level, regardless of whether Fidelity achieves any such economies of scale.
The Board concluded, taking into account the analysis of the Economies of Scale Committee, that economies of scale, if any, are being appropriately shared between fund shareholders and Fidelity.
Additional Information Requested by the Board. In order to develop fully the factual basis for consideration of the Fidelity funds' Advisory Contracts, the Board requested and received additional information on certain topics, including: (i) Fidelity's fund profitability methodology, profitability trends for certain funds, and the impact of certain factors on fund profitability results; (ii) portfolio manager changes that have occurred during the past year and the amount of the investment that each portfolio manager has made in the Fidelity fund(s) that he or she manages; (iii) Fidelity's compensation structure for portfolio managers, research analysts, and other key personnel, including its effects on fund profitability; (iv) the arrangements with and compensation paid to certain fund sub-advisers on behalf of the Fidelity funds; (v) Fidelity's long-term expectations for its offerings in the workplace investing channel; (vi) the methodology with respect to competitive fund data and peer group classifications; (vii) Fidelity's transfer agent fee, expense, and service structures for different funds and classes, and the impact of outsourcing, the increased use of omnibus accounts, and lower pricing in the retirement channel; and (viii) explanations regarding the relative total expense ratios of certain funds and classes, total expense competitive trends and methodologies for total expense competitive comparisons, and actions that might be taken by Fidelity to reduce total expense ratios for certain funds and classes or to achieve further economies of scale.
Based on its evaluation of all of the conclusions noted above, and after considering all factors it believed relevant, the Board concluded that the advisory fee structures are fair and reasonable, and that the fund's Advisory Contracts should be renewed.
VIPRE-SANN-0816
1.787989.113
Fidelity® Variable Insurance Products: Technology Portfolio
Semi-Annual Report June 30, 2016 |
|
Contents
To view a fund's proxy voting guidelines and proxy voting record for the 12-month period ended June 30, visit http://www.fidelity.com/proxyvotingresults or visit the Securities and Exchange Commission's (SEC) web site at http://www.sec.gov.
You may also call 1-877-208-0098 to request a free copy of the proxy voting guidelines.
Fidelity® Variable Insurance Products are separate account options which are purchased through a variable insurance contract.
Standard & Poor's, S&P and S&P 500 are registered service marks of The McGraw-Hill Companies, Inc. and have been licensed for use by Fidelity Distributors Corporation.
Other third-party marks appearing herein are the property of their respective owners.
All other marks appearing herein are registered or unregistered trademarks or service marks of FMR LLC or an affiliated company. © 2016 FMR LLC. All rights reserved.
This report and the financial statements contained herein are submitted for the general information of the shareholders of the Fund. This report is not authorized for distribution to prospective investors in the Fund unless preceded or accompanied by an effective prospectus.
A fund files its complete schedule of portfolio holdings with the SEC for the first and third quarters of each fiscal year on Form N-Q. Forms N-Q are available on the SEC’s web site at http://www.sec.gov. A fund's Forms N-Q may be reviewed and copied at the SEC’s Public Reference Room in Washington, DC. Information regarding the operation of the SEC's Public Reference Room may be obtained by calling 1-800-SEC-0330.
For a complete list of a fund's portfolio holdings, view the most recent holdings listing, semiannual report, or annual report on Fidelity's web site at http://www.fidelity.com, http://www.institutional.fidelity.com, or http://www.401k.com, as applicable.
NOT FDIC INSURED •MAY LOSE VALUE •NO BANK GUARANTEE
Neither the Fund nor Fidelity Distributors Corporation is a bank.
Investment Summary (Unaudited)
Top Ten Stocks as of June 30, 2016
| | % of fund's net assets | % of fund's net assets 6 months ago |
| Apple, Inc. | 9.9 | 8.5 |
| Facebook, Inc. Class A | 5.9 | 4.8 |
| Alphabet, Inc. Class C | 5.6 | 6.2 |
| Alphabet, Inc. Class A | 5.0 | 6.0 |
| Yahoo!, Inc. | 2.8 | 2.3 |
| Micron Technology, Inc. | 2.6 | 2.1 |
| Marvell Technology Group Ltd. | 2.4 | 1.9 |
| Salesforce.com, Inc. | 2.0 | 1.7 |
| Microsoft Corp. | 2.0 | 0.3 |
| Visa, Inc. Class A | 1.9 | 2.6 |
| | 40.1 | |
Top Industries (% of fund's net assets)
| As of June 30, 2016 |
| | Internet Software & Services | 29.4% |
| | Semiconductors & Semiconductor Equipment | 18.5% |
| | Software | 17.4% |
| | Technology Hardware, Storage & Peripherals | 10.7% |
| | IT Services | 6.3% |
| | All Others* | 17.7% |

* Includes Short-Term Investments and Net Other Assets (Liabilities)
| As of December 31, 2015 |
| | Internet Software & Services | 31.9% |
| | Semiconductors & Semiconductor Equipment | 15.8% |
| | Software | 13.4% |
| | Technology Hardware, Storage & Peripherals | 11.7% |
| | IT Services | 6.7% |
| | All Others* | 20.5% |

* Incudes Short-Term Investments and Net Other Assets (Liabilities)
Investments June 30, 2016 (Unaudited)
Showing Percentage of Net Assets
| Common Stocks - 97.2% | | | |
| | | Shares | Value |
| Automobiles - 1.6% | | | |
| Automobile Manufacturers - 1.6% | | | |
| Tesla Motors, Inc. (a) | | 20,600 | $4,372,968 |
| Biotechnology - 0.2% | | | |
| Biotechnology - 0.2% | | | |
| BeiGene Ltd. sponsored ADR | | 500 | 14,900 |
| Genscript Biotech Corp. | | 3,138,000 | 486,121 |
| | | | 501,021 |
| Chemicals - 0.2% | | | |
| Specialty Chemicals - 0.2% | | | |
| Duk San Neolux Co. Ltd. (a) | | 30,593 | 656,603 |
| Communications Equipment - 1.1% | | | |
| Communications Equipment - 1.1% | | | |
| ADTRAN, Inc. | | 29,200 | 544,580 |
| CommScope Holding Co., Inc. (a) | | 51,100 | 1,585,633 |
| Finisar Corp. (a) | | 700 | 12,257 |
| Infinera Corp. (a) | | 13,600 | 153,408 |
| Polycom, Inc. (a) | | 15 | 169 |
| Sandvine Corp. (U.K.) | | 19,488 | 40,124 |
| ShoreTel, Inc. (a) | | 9,900 | 66,231 |
| Wistron NeWeb Corp. | | 210,000 | 539,467 |
| | | | 2,941,869 |
| Diversified Consumer Services - 0.7% | | | |
| Education Services - 0.7% | | | |
| China Online Education Group sponsored ADR (a) | | 11,841 | 234,807 |
| New Oriental Education & Technology Group, Inc. sponsored ADR | | 37,600 | 1,574,688 |
| | | | 1,809,495 |
| Diversified Financial Services - 1.4% | | | |
| Other Diversified Financial Services - 1.4% | | | |
| Broadcom Ltd. | | 23,700 | 3,682,980 |
| Diversified Telecommunication Services - 0.4% | | | |
| Alternative Carriers - 0.3% | | | |
| 8x8, Inc. (a) | | 54,200 | 791,862 |
| Integrated Telecommunication Services - 0.1% | | | |
| Bharti Infratel Ltd. | | 76,427 | 391,566 |
|
| TOTAL DIVERSIFIED TELECOMMUNICATION SERVICES | | | 1,183,428 |
|
| Electrical Equipment - 0.3% | | | |
| Electrical Components & Equipment - 0.3% | | | |
| Lumenpulse, Inc. (a)(b) | | 50,000 | 626,185 |
| Nidec Corp. | | 3,200 | 243,594 |
| | | | 869,779 |
| Electronic Equipment & Components - 4.4% | | | |
| Electronic Components - 2.2% | | | |
| Alps Electric Co. Ltd. | | 13,100 | 248,878 |
| Amphenol Corp. Class A | | 7,000 | 401,310 |
| AVX Corp. | | 1,300 | 17,654 |
| Corning, Inc. | | 1,200 | 24,576 |
| DTS, Inc. (a) | | 400 | 10,580 |
| E Ink Holdings, Inc. GDR (a)(c) | | 1,000 | 5,527 |
| InvenSense, Inc. (a) | | 8,600 | 52,718 |
| Knowles Corp. (a) | | 6,827 | 93,393 |
| Largan Precision Co. Ltd. | | 22,000 | 2,037,853 |
| Ledlink Optics, Inc. | | 206,642 | 275,236 |
| Murata Manufacturing Co. Ltd. | | 3,500 | 392,401 |
| Polytronics Technology Corp. | | 87,000 | 157,223 |
| Samsung SDI Co. Ltd. | | 8,282 | 783,696 |
| Sunny Optical Technology Group Co. Ltd. | | 81,000 | 285,189 |
| Taiyo Yuden Co. Ltd. | | 9,300 | 81,170 |
| Vishay Intertechnology, Inc. | | 1,700 | 21,063 |
| Yageo Corp. | | 487,981 | 813,102 |
| Yaskawa Electric Corp. | | 3,000 | 39,169 |
| | | | 5,740,738 |
| Electronic Equipment & Instruments - 0.4% | | | |
| Chroma ATE, Inc. | | 428,775 | 1,026,438 |
| Control4 Corp. (a)(b) | | 9,900 | 80,784 |
| Firich Enterprise Co. Ltd. | | 11,235 | 21,862 |
| Itron, Inc. (a) | | 400 | 17,240 |
| VeriFone Systems, Inc. (a) | | 500 | 9,270 |
| | | | 1,155,594 |
| Electronic Manufacturing Services - 1.8% | | | |
| AIC, Inc. | | 6,000 | 17,431 |
| KEMET Corp. (a) | | 2,800 | 8,204 |
| Merry Electronics Co. Ltd. | | 196,000 | 428,552 |
| Multi-Fineline Electronix, Inc. (a) | | 411 | 9,535 |
| Trimble Navigation Ltd. (a) | | 179,470 | 4,371,889 |
| | | | 4,835,611 |
| Technology Distributors - 0.0% | | | |
| Anixter International, Inc. (a) | | 300 | 15,984 |
| Arrow Electronics, Inc. (a) | | 600 | 37,140 |
| | | | 53,124 |
|
| TOTAL ELECTRONIC EQUIPMENT & COMPONENTS | | | 11,785,067 |
|
| Health Care Equipment & Supplies - 0.1% | | | |
| Health Care Equipment - 0.1% | | | |
| China Medical Technologies, Inc. sponsored ADR (a) | | 300 | 0 |
| Intai Technology Corp. | | 64,000 | 350,287 |
| | | | 350,287 |
| Health Care Providers & Services - 0.0% | | | |
| Managed Health Care - 0.0% | | | |
| HealthEquity, Inc. (a) | | 600 | 18,231 |
| Health Care Technology - 1.3% | | | |
| Health Care Technology - 1.3% | | | |
| athenahealth, Inc. (a) | | 6,600 | 910,866 |
| M3, Inc. | | 18,400 | 642,160 |
| Medidata Solutions, Inc. (a) | | 39,500 | 1,851,365 |
| | | | 3,404,391 |
| Hotels, Restaurants & Leisure - 0.6% | | | |
| Casinos & Gaming - 0.4% | | | |
| 500.com Ltd. sponsored ADR Class A (a)(b) | | 59,100 | 982,242 |
| Hotels, Resorts & Cruise Lines - 0.2% | | | |
| Tuniu Corp. Class A sponsored ADR (a)(b) | | 65,300 | 550,479 |
|
| TOTAL HOTELS, RESTAURANTS & LEISURE | | | 1,532,721 |
|
| Household Durables - 0.6% | | | |
| Consumer Electronics - 0.3% | | | |
| Sky Light Holdings Ltd. | | 140,000 | 15,983 |
| Sony Corp. | | 29,200 | 860,290 |
| | | | 876,273 |
| Household Appliances - 0.3% | | | |
| iRobot Corp. (a) | | 500 | 17,540 |
| Techtronic Industries Co. Ltd. | | 146,500 | 611,784 |
| | | | 629,324 |
|
| TOTAL HOUSEHOLD DURABLES | | | 1,505,597 |
|
| Independent Power and Renewable Electricity Producers - 0.0% | | | |
| Renewable Electricity - 0.0% | | | |
| Vivint Solar, Inc. (a)(b) | | 3,800 | 11,666 |
| Industrial Conglomerates - 0.1% | | | |
| Industrial Conglomerates - 0.1% | | | |
| Toshiba Corp. (a) | | 80,000 | 217,920 |
| Internet & Catalog Retail - 1.8% | | | |
| Internet Retail - 1.8% | | | |
| Amazon.com, Inc. (a) | | 1,200 | 858,744 |
| Ctrip.com International Ltd. ADR (a) | | 6,600 | 271,920 |
| Etsy, Inc. (a) | | 900 | 8,631 |
| Groupon, Inc. Class A (a)(b) | | 156,900 | 509,925 |
| InterPark INT Corp. | | 464 | 6,679 |
| JD.com, Inc. sponsored ADR (a) | | 16,100 | 341,803 |
| Jumei International Holding Ltd. sponsored ADR (a) | | 123,500 | 510,055 |
| MakeMyTrip Ltd. (a) | | 3,400 | 50,524 |
| MySale Group PLC (a) | | 59,700 | 51,966 |
| Qunar Cayman Islands Ltd. sponsored ADR (a)(b) | | 71,114 | 2,118,486 |
| Vipshop Holdings Ltd. ADR (a) | | 14,700 | 164,199 |
| Wayfair LLC Class A (a)(b) | | 600 | 23,400 |
| | | | 4,916,332 |
| Internet Software & Services - 28.6% | | | |
| Internet Software & Services - 28.6% | | | |
| 58.com, Inc. ADR (a)(b) | | 111,280 | 5,106,639 |
| Alibaba Group Holding Ltd. sponsored ADR (a) | | 34,400 | 2,735,832 |
| Alphabet, Inc.: | | | |
| Class A | | 19,100 | 13,437,423 |
| Class C (a) | | 21,461 | 14,853,158 |
| Amber Road, Inc. (a)(b) | | 20,000 | 154,200 |
| Baidu.com, Inc. sponsored ADR (a) | | 700 | 115,605 |
| Bazaarvoice, Inc. (a) | | 600 | 2,406 |
| blinkx PLC (a) | | 50,400 | 19,992 |
| ChannelAdvisor Corp. (a) | | 45,800 | 663,642 |
| Cimpress NV (a) | | 600 | 55,488 |
| Cornerstone OnDemand, Inc. (a) | | 19,700 | 749,782 |
| Demandware, Inc. (a) | | 6,100 | 456,890 |
| eBay, Inc. (a) | | 2,400 | 56,184 |
| eGain Communications Corp. (a) | | 113,400 | 319,788 |
| Endurance International Group Holdings, Inc. (a) | | 92,500 | 831,575 |
| Facebook, Inc. Class A (a) | | 137,389 | 15,700,815 |
| Hortonworks, Inc. (a) | | 400 | 4,276 |
| Instructure, Inc. (a)(b) | | 16,653 | 316,407 |
| Leju Holdings Ltd. ADR (a) | | 654 | 3,041 |
| LivePerson, Inc. (a) | | 8,800 | 55,792 |
| LogMeIn, Inc. (a) | | 9,391 | 595,671 |
| MercadoLibre, Inc. | | 200 | 28,134 |
| MINDBODY, Inc. (b) | | 230,500 | 3,720,270 |
| New Relic, Inc. (a) | | 16,800 | 493,584 |
| Phoenix New Media Ltd. ADR (a)(b) | | 8,800 | 32,384 |
| Renren, Inc. ADR (a)(b) | | 52,500 | 93,975 |
| SciQuest, Inc. (a) | | 222,315 | 3,926,083 |
| SINA Corp. (a) | | 13,600 | 705,432 |
| SouFun Holdings Ltd. ADR (a)(b) | | 161,100 | 810,333 |
| Tencent Holdings Ltd. | | 19,300 | 442,736 |
| Twilio, Inc. (a) | | 1,100 | 40,150 |
| Twitter, Inc. (a) | | 6,100 | 103,151 |
| Weibo Corp. sponsored ADR (a)(b) | | 20,300 | 576,723 |
| Wix.com Ltd. (a) | | 20,600 | 625,210 |
| Xunlei Ltd. sponsored ADR (a) | | 192,407 | 1,008,213 |
| Yahoo!, Inc. (a) | | 196,300 | 7,373,028 |
| | | | 76,214,012 |
| IT Services - 6.3% | | | |
| Data Processing & Outsourced Services - 6.0% | | | |
| Alliance Data Systems Corp. (a) | | 400 | 78,368 |
| Amadeus IT Holding SA Class A | | 7,300 | 321,629 |
| eClerx Services Ltd. | | 6,580 | 141,131 |
| EVERTEC, Inc. | | 10,100 | 156,954 |
| Fidelity National Information Services, Inc. | | 14,900 | 1,097,832 |
| Fiserv, Inc. (a) | | 8,000 | 869,840 |
| FleetCor Technologies, Inc. (a) | | 13,900 | 1,989,507 |
| Global Payments, Inc. | | 23,900 | 1,705,982 |
| PayPal Holdings, Inc. (a) | | 2,400 | 87,624 |
| Paysafe Group PLC (a) | | 461,332 | 2,406,178 |
| Syntel, Inc. (a) | | 4,000 | 181,040 |
| Teletech Holdings, Inc. | | 4,994 | 135,487 |
| The Western Union Co. | | 4,100 | 78,638 |
| Total System Services, Inc. | | 15,900 | 844,449 |
| Travelport Worldwide Ltd. | | 51,000 | 657,390 |
| Visa, Inc. Class A | | 69,000 | 5,117,730 |
| | | | 15,869,779 |
| IT Consulting & Other Services - 0.3% | | | |
| China Information Technology, Inc. (a) | | 42 | 49 |
| IBM Corp. | | 100 | 15,178 |
| Lionbridge Technologies, Inc. (a) | | 132,300 | 522,585 |
| ServiceSource International, Inc. (a) | | 22,300 | 89,869 |
| Virtusa Corp. (a) | | 10,000 | 288,800 |
| | | | 916,481 |
|
| TOTAL IT SERVICES | | | 16,786,260 |
|
| Life Sciences Tools & Services - 0.1% | | | |
| Life Sciences Tools & Services - 0.1% | | | |
| JHL Biotech, Inc. (a) | | 94,814 | 229,263 |
| Media - 0.4% | | | |
| Advertising - 0.1% | | | |
| iCar Asia Ltd. (a) | | 224,524 | 143,170 |
| ReachLocal, Inc. (a) | | 14,600 | 66,430 |
| | | | 209,600 |
| Cable & Satellite - 0.3% | | | |
| DISH Network Corp. Class A (a) | | 500 | 26,200 |
| Naspers Ltd. Class N | | 4,800 | 732,936 |
| | | | 759,136 |
|
| TOTAL MEDIA | | | 968,736 |
|
| Metals & Mining - 0.0% | | | |
| Diversified Metals & Mining - 0.0% | | | |
| Timminco Ltd. (a) | | 700 | 0 |
| Road & Rail - 0.4% | | | |
| Trucking - 0.4% | | | |
| eHi Car Service Co. Ltd. sponsored ADR (a)(b) | | 106,250 | 1,074,188 |
| Semiconductors & Semiconductor Equipment - 18.5% | | | |
| Semiconductor Equipment - 1.8% | | | |
| Amkor Technology, Inc. (a) | | 133,800 | 769,350 |
| Applied Materials, Inc. | | 1,400 | 33,558 |
| Daqo New Energy Corp. ADR (a)(b) | | 39,500 | 891,515 |
| Entegris, Inc. (a) | | 55,800 | 807,426 |
| EO Technics Co. Ltd. | | 13,070 | 1,112,589 |
| SMA Solar Technology AG (b) | | 3,955 | 195,385 |
| SolarEdge Technologies, Inc. (a)(b) | | 10,600 | 207,760 |
| STR Holdings, Inc. (a) | | 433 | 127 |
| SunEdison Semiconductor Ltd. (a) | | 29,300 | 173,749 |
| Ultratech, Inc. (a) | | 26,600 | 611,002 |
| | | | 4,802,461 |
| Semiconductors - 16.7% | | | |
| Advanced Semiconductor Engineering, Inc. | | 1,500,700 | 1,710,044 |
| Advanced Semiconductor Engineering, Inc. sponsored ADR | | 244,200 | 1,362,636 |
| Applied Micro Circuits Corp. (a) | | 12,600 | 80,892 |
| ARM Holdings PLC sponsored ADR | | 1,400 | 63,714 |
| Cavium, Inc. (a) | | 8,991 | 347,053 |
| ChipMOS TECHNOLOGIES (Bermuda) Ltd. | | 70,880 | 1,283,637 |
| Dialog Semiconductor PLC (a) | | 24,100 | 722,119 |
| Diodes, Inc. (a) | | 3,600 | 67,644 |
| Energy Conversion Devices, Inc. (a) | | 2,100 | 0 |
| Everlight Electronics Co. Ltd. | | 292,000 | 477,748 |
| Himax Technologies, Inc. sponsored ADR | | 1,400 | 11,564 |
| Hua Hong Semiconductor Ltd. | | 442,000 | 413,991 |
| Inphi Corp. (a) | | 16,500 | 528,495 |
| Intersil Corp. Class A | | 42,500 | 575,450 |
| M/A-COM Technology Solutions Holdings, Inc. (a) | | 10,400 | 342,992 |
| Macronix International Co. Ltd. (a) | | 88,000 | 7,789 |
| MagnaChip Semiconductor Corp. (a) | | 8,400 | 47,544 |
| Marvell Technology Group Ltd. | | 669,300 | 6,378,429 |
| Maxim Integrated Products, Inc. | | 41,100 | 1,466,859 |
| MaxLinear, Inc. Class A (a) | | 160,700 | 2,889,386 |
| Melexis NV | | 2,710 | 170,292 |
| Micron Technology, Inc. (a) | | 494,100 | 6,798,816 |
| Microsemi Corp. (a) | | 9,882 | 322,944 |
| Monolithic Power Systems, Inc. | | 22,100 | 1,509,872 |
| NVIDIA Corp. | | 1,300 | 61,113 |
| NXP Semiconductors NV (a) | | 45,749 | 3,583,977 |
| ON Semiconductor Corp. (a) | | 120,400 | 1,061,928 |
| On-Bright Electronics, Inc. | | 15,000 | 99,753 |
| Power Integrations, Inc. | | 8,514 | 426,296 |
| Qorvo, Inc. (a) | | 48,100 | 2,658,006 |
| Qualcomm, Inc. | | 86,800 | 4,649,876 |
| Sanken Electric Co. Ltd. | | 75,000 | 232,529 |
| Silicon Laboratories, Inc. (a) | | 19,200 | 935,808 |
| Silicon Motion Technology Corp. sponsored ADR | | 19,500 | 932,100 |
| Siliconware Precision Industries Co. Ltd. sponsored ADR | | 13,800 | 105,708 |
| Sitronix Technology Corp. | | 44,000 | 144,471 |
| SK Hynix, Inc. | | 48,542 | 1,380,586 |
| Skyworks Solutions, Inc. | | 300 | 18,984 |
| SunPower Corp. (a)(b) | | 364 | 5,638 |
| Vanguard International Semiconductor Corp. | | 346,000 | 572,827 |
| YoungTek Electronics Corp. | | 175 | 263 |
| | | | 44,449,773 |
|
| TOTAL SEMICONDUCTORS & SEMICONDUCTOR EQUIPMENT | | | 49,252,234 |
|
| Software - 17.4% | | | |
| Application Software - 10.1% | | | |
| Adobe Systems, Inc. (a) | | 39,700 | 3,802,863 |
| ANSYS, Inc. (a) | | 8,400 | 762,300 |
| Atlassian Corp. PLC | | 900 | 23,310 |
| Autodesk, Inc. (a) | | 70,400 | 3,811,456 |
| Broadleaf Co. Ltd. | | 54,900 | 505,977 |
| BroadSoft, Inc. (a) | | 22,900 | 939,587 |
| Citrix Systems, Inc. (a) | | 9,800 | 784,882 |
| Descartes Systems Group, Inc. (a) | | 78,200 | 1,495,663 |
| HubSpot, Inc. (a) | | 2,500 | 108,550 |
| Idreamsky Technology Ltd. ADR (a)(b) | | 70,100 | 955,463 |
| Intuit, Inc. | | 13,700 | 1,529,057 |
| Jive Software, Inc. (a) | | 10,700 | 40,232 |
| Kingdee International Software Group Co. Ltd. | | 72,400 | 22,592 |
| Manhattan Associates, Inc. (a) | | 5,152 | 330,398 |
| MobileIron, Inc. (a)(b) | | 2,800 | 8,540 |
| Mobileye NV (a)(b) | | 37,900 | 1,748,706 |
| Parametric Technology Corp. (a) | | 8,300 | 311,914 |
| Pegasystems, Inc. | | 800 | 21,560 |
| Qlik Technologies, Inc. (a) | | 4,700 | 139,026 |
| Salesforce.com, Inc. (a) | | 68,600 | 5,447,526 |
| Sinosoft Tech Group Ltd. | | 600,000 | 341,632 |
| Splunk, Inc. (a) | | 12,700 | 688,086 |
| Ultimate Software Group, Inc. (a) | | 4,900 | 1,030,421 |
| Verint Systems, Inc. (a) | | 666 | 22,065 |
| Workday, Inc. Class A (a) | | 8,500 | 634,695 |
| Workiva, Inc. (a)(b) | | 21,300 | 290,958 |
| Xura, Inc. (a) | | 513 | 12,533 |
| Zendesk, Inc. (a) | | 39,000 | 1,028,820 |
| | | | 26,838,812 |
| Home Entertainment Software - 2.2% | | | |
| Electronic Arts, Inc. (a) | | 20,400 | 1,545,504 |
| NCSOFT Corp. | | 6,457 | 1,328,839 |
| NHN Entertainment Corp. (a) | | 9,392 | 529,426 |
| Nintendo Co. Ltd. | | 11,000 | 1,580,691 |
| Nintendo Co. Ltd. ADR | | 27,800 | 494,284 |
| Rosetta Stone, Inc. (a) | | 1,100 | 8,525 |
| WeMade Entertainment Co. Ltd. (a) | | 20,000 | 442,130 |
| | | | 5,929,399 |
| Systems Software - 5.1% | | | |
| Allot Communications Ltd. (a) | | 62,900 | 309,468 |
| CyberArk Software Ltd. (a) | | 9,800 | 476,182 |
| Fleetmatics Group PLC (a) | | 68,900 | 2,985,437 |
| Infoblox, Inc. (a) | | 700 | 13,132 |
| Microsoft Corp. | | 103,400 | 5,290,978 |
| NetSuite, Inc. (a) | | 31,900 | 2,322,320 |
| Proofpoint, Inc. (a) | | 19,600 | 1,236,564 |
| Rapid7, Inc. (a) | | 500 | 6,290 |
| Totvs SA | | 14,700 | 139,756 |
| VMware, Inc. Class A (a)(b) | | 13,800 | 789,636 |
| | | | 13,569,763 |
|
| TOTAL SOFTWARE | | | 46,337,974 |
|
| Technology Hardware, Storage & Peripherals - 10.7% | | | |
| Technology Hardware, Storage & Peripherals - 10.7% | | | |
| 3D Systems Corp. (a)(b) | | 2,050 | 28,065 |
| Apple, Inc. | | 275,815 | 26,367,910 |
| HP, Inc. | | 37,317 | 468,328 |
| HTC Corp. | | 121,000 | 392,337 |
| Intevac, Inc. (a) | | 1,500 | 8,520 |
| NEC Corp. | | 417,000 | 971,553 |
| Nimble Storage, Inc. (a) | | 30,300 | 241,188 |
| Pure Storage, Inc. Class A (a) | | 2,600 | 28,340 |
| Smart Technologies, Inc. Class A (a) | | 1,120 | 4,973 |
| | | | 28,511,214 |
| TOTAL COMMON STOCKS | | | |
| (Cost $221,622,030) | | | 259,134,236 |
|
| Preferred Stocks - 1.8% | | | |
| Convertible Preferred Stocks - 1.4% | | | |
| Internet & Catalog Retail - 0.6% | | | |
| Internet Retail - 0.6% | | | |
| China Internet Plus Holdings Ltd. Series B (d) | | 401,913 | 1,551,666 |
| Internet Software & Services - 0.8% | | | |
| Internet Software & Services - 0.8% | | | |
| Uber Technologies, Inc. Series D, 8.00% (a)(d) | | 45,124 | 2,200,798 |
| IT Services - 0.0% | | | |
| Data Processing & Outsourced Services - 0.0% | | | |
| Nutanix, Inc. Series E (a)(d) | | 6,397 | 85,336 |
|
| TOTAL CONVERTIBLE PREFERRED STOCKS | | | 3,837,800 |
|
| Nonconvertible Preferred Stocks - 0.4% | | | |
| Internet & Catalog Retail - 0.4% | | | |
| Internet Retail - 0.4% | | | |
| China Internet Plus Holdings Ltd. Series A-11 (d) | | 259,152 | 1,000,508 |
| TOTAL PREFERRED STOCKS | | | |
| (Cost $3,156,515) | | | 4,838,308 |
|
| Money Market Funds - 7.2% | | | |
| Fidelity Cash Central Fund, 0.43% (e) | | 4,648,675 | 4,648,675 |
| Fidelity Securities Lending Cash Central Fund, 0.46% (e)(f) | | 14,648,215 | 14,648,215 |
| TOTAL MONEY MARKET FUNDS | | | |
| (Cost $19,296,890) | | | 19,296,890 |
| TOTAL INVESTMENT PORTFOLIO - 106.2% | | | |
| (Cost $244,075,435) | | | 283,269,434 |
| NET OTHER ASSETS (LIABILITIES) - (6.2)% | | | (16,640,544) |
| NET ASSETS - 100% | | | $266,628,890 |
Legend
(a) Non-income producing
(b) Security or a portion of the security is on loan at period end.
(c) Security exempt from registration under Rule 144A of the Securities Act of 1933. These securities may be resold in transactions exempt from registration, normally to qualified institutional buyers. At the end of the period, the value of these securities amounted to $5,527 or 0.0% of net assets.
(d) Restricted securities - Investment in securities not registered under the Securities Act of 1933 (excluding 144A issues). At the end of the period, the value of restricted securities (excluding 144A issues) amounted to $4,838,308 or 1.8% of net assets.
(e) Affiliated fund that is generally available only to investment companies and other accounts managed by Fidelity Investments. The rate quoted is the annualized seven-day yield of the fund at period end. A complete unaudited listing of the fund's holdings as of its most recent quarter end is available upon request. In addition, each Fidelity Central Fund's financial statements are available on the SEC's website or upon request.
(f) Investment made with cash collateral received from securities on loan.
Additional information on each restricted holding is as follows:
| Security | Acquisition Date | Acquisition Cost |
| China Internet Plus Holdings Ltd. Series A-11 | 1/26/15 | $819,141 |
| China Internet Plus Holdings Ltd. Series B | 12/11/15 | $1,551,666 |
| Nutanix, Inc. Series E | 8/26/14 | $85,697 |
| Uber Technologies, Inc. Series D, 8.00% | 6/6/14 | $700,011 |
Affiliated Central Funds
Information regarding fiscal year to date income earned by the Fund from investments in Fidelity Central Funds is as follows:
| Fund | Income earned |
| Fidelity Cash Central Fund | $8,153 |
| Fidelity Securities Lending Cash Central Fund | 240,535 |
| Total | $248,688 |
Investment Valuation
The following is a summary of the inputs used, as of June 30, 2016, involving the Fund's assets and liabilities carried at fair value. The inputs or methodology used for valuing securities may not be an indication of the risk associated with investing in those securities. For more information on valuation inputs, and their aggregation into the levels used below, please refer to the Investment Valuation section in the accompanying Notes to Financial Statements.
| | Valuation Inputs at Reporting Date: |
| Description | Total | Level 1 | Level 2 | Level 3 |
| Investments in Securities: | | | | |
| Common Stocks | $259,134,236 | $229,659,018 | $29,475,218 | $-- |
| Preferred Stocks | 4,838,308 | -- | -- | 4,838,308 |
| Money Market Funds | 19,296,890 | 19,296,890 | -- | -- |
| Total Investments in Securities: | $283,269,434 | $248,955,908 | $29,475,218 | $4,838,308 |
The following is a summary of transfers between Level 1 and Level 2 for the period ended June 30, 2016. Transfers are assumed to have occurred at the beginning of the period, and are primarily attributable to the valuation techniques used for foreign equity securities, as discussed in the accompanying Notes to Financial Statements:
| Transfers | Total |
| Level 1 to Level 2 | $3,051,041 |
| Level 2 to Level 1 | $0 |
The following is a reconciliation of Investments in Securities and Derivative Instruments for which Level 3 inputs were used in determining value:
| Investments in Securities: | |
| Beginning Balance | $4,848,479 |
| Total Realized Gain (Loss) | -- |
| Total Unrealized Gain (Loss) | (10,171) |
| Cost of Purchases | -- |
| Proceeds of Sales | -- |
| Amortization/Accretion | -- |
| Transfers in to Level 3 | -- |
| Transfers out of Level 3 | -- |
| Ending Balance | $4,838,308 |
| The change in unrealized gain (loss) for the period attributable to Level 3 securities held at June 30, 2016 | $(10,171) |
The information used in the above reconciliation represents fiscal year to date activity for any Investments in Securities identified as using Level 3 inputs at either the beginning or the end of the current fiscal period Transfers in or out of Level 3 represent the beginning value of any Security or Instrument where a change in the pricing level occurred from the beginning to the end of the period. The cost of purchases and the proceeds of sales may include securities received or delivered through corporate actions or exchanges. Realized and unrealized gains (losses) disclosed in the reconciliation are included in Net Gain (Loss) on the Fund's Statement of Operations.
Other Information
Distribution of investments by country or territory of incorporation, as a percentage of Total Net Assets, is as follows (Unaudited):
| United States of America | 69.6% |
| Cayman Islands | 9.9% |
| Taiwan | 4.0% |
| Bermuda | 3.2% |
| Japan | 2.5% |
| Korea (South) | 2.2% |
| Netherlands | 2.0% |
| Singapore | 1.5% |
| Ireland | 1.1% |
| Others (Individually Less Than 1%) | 4.0% |
| | 100.0% |
See accompanying notes which are an integral part of the financial statements.
Financial Statements
Statement of Assets and Liabilities
| | | June 30, 2016 (Unaudited) |
| Assets | | |
Investment in securities, at value (including securities loaned of $14,467,222) — See accompanying schedule:
Unaffiliated issuers (cost $224,778,545) | $263,972,544 | |
| Fidelity Central Funds (cost $19,296,890) | 19,296,890 | |
| Total Investments (cost $244,075,435) | | $283,269,434 |
| Cash | | 167,317 |
| Receivable for investments sold | | 77,963 |
| Dividends receivable | | 149,681 |
| Distributions receivable from Fidelity Central Funds | | 28,334 |
| Prepaid expenses | | 195 |
| Other receivables | | 3,406 |
| Total assets | | 283,696,330 |
| Liabilities | | |
| Payable for investments purchased | $149,360 | |
| Payable for fund shares redeemed | 2,072,977 | |
| Accrued management fee | 124,616 | |
| Other affiliated payables | 38,145 | |
| Other payables and accrued expenses | 34,127 | |
| Collateral on securities loaned, at value | 14,648,215 | |
| Total liabilities | | 17,067,440 |
| Net Assets | | $266,628,890 |
| Net Assets consist of: | | |
| Paid in capital | | $236,190,224 |
| Undistributed net investment income | | 55,699 |
| Accumulated undistributed net realized gain (loss) on investments and foreign currency transactions | | (8,804,007) |
| Net unrealized appreciation (depreciation) on investments and assets and liabilities in foreign currencies | | 39,186,974 |
| Net Assets | | $266,628,890 |
| Initial Class: | | |
| Net Asset Value, offering price and redemption price per share ($61,279,551 ÷ 5,472,563 shares) | | $11.20 |
| Investor Class: | | |
| Net Asset Value, offering price and redemption price per share ($205,349,339 ÷ 18,531,188 shares) | | $11.08 |
See accompanying notes which are an integral part of the financial statements.
Statement of Operations
| | | Six months ended June 30, 2016 (Unaudited) |
| Investment Income | | |
| Dividends | | $834,134 |
| Income from Fidelity Central Funds (including $240,535 from security lending) | | 248,688 |
| Total income | | 1,082,822 |
| Expenses | | |
| Management fee | $749,682 | |
| Transfer agent fees | 175,208 | |
| Accounting and security lending fees | 55,507 | |
| Custodian fees and expenses | 16,974 | |
| Independent trustees' fees and expenses | 3,069 | |
| Audit | 31,359 | |
| Legal | 5,871 | |
| Miscellaneous | 1,492 | |
| Total expenses before reductions | 1,039,162 | |
| Expense reductions | (12,039) | 1,027,123 |
| Net investment income (loss) | | 55,699 |
| Realized and Unrealized Gain (Loss) | | |
| Net realized gain (loss) on: | | |
| Investment securities: | | |
| Unaffiliated issuers | (7,470,371) | |
| Foreign currency transactions | (13,799) | |
| Total net realized gain (loss) | | (7,484,170) |
Change in net unrealized appreciation (depreciation) on:
Investment securities (net of increase in deferred foreign taxes of $2,539) | (1,515,074) | |
| Assets and liabilities in foreign currencies | (306) | |
| Total change in net unrealized appreciation (depreciation) | | (1,515,380) |
| Net gain (loss) | | (8,999,550) |
| Net increase (decrease) in net assets resulting from operations | | $(8,943,851) |
See accompanying notes which are an integral part of the financial statements.
Statement of Changes in Net Assets
| | Six months ended June 30, 2016 (Unaudited) | Year ended December 31, 2015 |
| Increase (Decrease) in Net Assets | | |
| Operations | | |
| Net investment income (loss) | $55,699 | $289,337 |
| Net realized gain (loss) | (7,484,170) | 11,514,392 |
| Change in net unrealized appreciation (depreciation) | (1,515,380) | 2,787,400 |
| Net increase (decrease) in net assets resulting from operations | (8,943,851) | 14,591,129 |
| Distributions to shareholders from net investment income | – | (297,796) |
| Distributions to shareholders from net realized gain | (9,045,734) | (14,033,896) |
| Total distributions | (9,045,734) | (14,331,692) |
| Share transactions - net increase (decrease) | (27,495,537) | 61,674,493 |
| Redemption fees | 26,920 | 42,386 |
| Total increase (decrease) in net assets | (45,458,202) | 61,976,316 |
| Net Assets | | |
| Beginning of period | 312,087,092 | 250,110,776 |
| End of period | $266,628,890 | $312,087,092 |
| Other Information | | |
| Undistributed net investment income end of period | $55,699 | $– |
See accompanying notes which are an integral part of the financial statements.
Financial Highlights — VIP Technology Portfolio Initial Class
| | Six months ended (Unaudited) June 30, | Years ended December 31, | | | | |
| | 2016 | 2015 | 2014 | 2013 | 2012 | 2011 |
| Selected Per–Share Data | | | | | | |
| Net asset value, beginning of period | $11.91 | $11.83 | $12.43 | $10.33 | $9.81 | $11.28 |
| Income from Investment Operations | | | | | | |
| Net investment income (loss)A | .01 | .02 | .01 | .01 | .01 | (.03) |
| Net realized and unrealized gain (loss) | (.35) | .71 | 1.38 | 2.78 | 1.66 | (1.04) |
| Total from investment operations | (.34) | .73 | 1.39 | 2.79 | 1.67 | (1.07) |
| Distributions from net investment income | – | (.02) | (.01) | (.02) | – | – |
| Distributions from net realized gain | (.37) | (.63) | (1.98) | (.67) | (1.15) | (.40) |
| Total distributions | (.37) | (.65) | (1.99) | (.69) | (1.15) | (.40) |
| Redemption fees added to paid in capitalA,B | – | – | – | – | – | – |
| Net asset value, end of period | $11.20 | $11.91 | $11.83 | $12.43 | $10.33 | $9.81 |
| Total ReturnC,D,E | (2.38)% | 6.27% | 11.91% | 27.81% | 17.52% | (9.78)% |
| Ratios to Average Net AssetsF,G | | | | | | |
| Expenses before reductions | .70%H | .69% | .70% | .73% | .71% | .72% |
| Expenses net of fee waivers, if any | .70%H | .69% | .69% | .72% | .71% | .72% |
| Expenses net of all reductions | .69%H | .68% | .69% | .72% | .70% | .70% |
| Net investment income (loss) | .10%H | .16% | .13% | .10% | .09% | (.23)% |
| Supplemental Data | | | | | | |
| Net assets, end of period (000 omitted) | $61,280 | $70,596 | $69,964 | $61,534 | $60,849 | $69,912 |
| Portfolio turnover rateI | 37%H | 68% | 67% | 113% | 71% | 153% |
A Calculated based on average shares outstanding during the period.
B Amount represents less than $.005 per share.
C Total returns for periods of less than one year are not annualized.
D Total returns do not reflect charges attributable to your insurance company's separate account. Inclusion of these charges would reduce the total returns shown.
E Total returns would have been lower if certain expenses had not been reduced during the applicable periods shown.
F Fees and expenses of any underlying Fidelity Central Funds are not included in the Fund's expense ratio. The Fund indirectly bears its proportionate share of the expenses of any underlying Fidelity Central Funds.
G Expense ratios reflect operating expenses of the class. Expenses before reductions do not reflect amounts reimbursed by the investment adviser or reductions from brokerage service arrangements or reductions from other expense offset arrangements and do not represent the amount paid by the class during periods when reimbursements or reductions occur. Expenses net of fee waivers reflect expenses after reimbursement by the investment adviser but prior to reductions from brokerage service arrangements or other expense offset arrangements. Expenses net of all reductions represent the net expenses paid by the class.
H Annualized
I Amount does not include the portfolio activity of any underlying Fidelity Central Funds.
See accompanying notes which are an integral part of the financial statements.
Financial Highlights — VIP Technology Portfolio Investor Class
| | Six months ended (Unaudited) June 30, | Years ended December 31, | | | | |
| | 2016 | 2015 | 2014 | 2013 | 2012 | 2011 |
| Selected Per–Share Data | | | | | | |
| Net asset value, beginning of period | $11.79 | $11.73 | $12.34 | $10.26 | $9.75 | $11.22 |
| Income from Investment Operations | | | | | | |
| Net investment income (loss)A | –B | .01 | .01 | –B | –B | (.03) |
| Net realized and unrealized gain (loss) | (.34) | .69 | 1.36 | 2.76 | 1.66 | (1.05) |
| Total from investment operations | (.34) | .70 | 1.37 | 2.76 | 1.66 | (1.08) |
| Distributions from net investment income | – | (.01) | (.01) | (.01) | – | – |
| Distributions from net realized gain | (.37) | (.63) | (1.98) | (.67) | (1.15) | (.39) |
| Total distributions | (.37) | (.64) | (1.98)C | (.68) | (1.15) | (.39) |
| Redemption fees added to paid in capitalA | – | – | – | – | – | – |
| Net asset value, end of period | $11.08 | $11.79 | $11.73 | $12.34 | $10.26 | $9.75 |
| Total ReturnD,E,F | (2.41)% | 6.08% | 11.86% | 27.73% | 17.51% | (9.92)% |
| Ratios to Average Net AssetsG,H | | | | | | |
| Expenses before reductions | .78%I | .77% | .78% | .81% | .79% | .80% |
| Expenses net of fee waivers, if any | .78%I | .77% | .77% | .80% | .79% | .80% |
| Expenses net of all reductions | .77%I | .76% | .77% | .80% | .78% | .78% |
| Net investment income (loss) | .02%I | .08%B | .05% | .02% | .01% | (.31)% |
| Supplemental Data | | | | | | |
| Net assets, end of period (000 omitted) | $205,349 | $241,491 | $180,147 | $120,666 | $91,601 | $77,589 |
| Portfolio turnover rateJ | 37%I | 68% | 67% | 113% | 71% | 153% |
A Calculated based on average shares outstanding during the period.
B Amount represents less than $.005 per share.
C Total distributions of $1.98 per share is comprised of distributions from net investment income of $.005 and distributions from net realized gain of $1.977 per share.
D Total returns for periods of less than one year are not annualized.
E Total returns do not reflect charges attributable to your insurance company's separate account. Inclusion of these charges would reduce the total returns shown.
F Total returns would have been lower if certain expenses had not been reduced during the applicable periods shown.
G Fees and expenses of any underlying Fidelity Central Funds are not included in the Fund's expense ratio. The Fund indirectly bears its proportionate share of the expenses of any underlying Fidelity Central Funds.
H Expense ratios reflect operating expenses of the class. Expenses before reductions do not reflect amounts reimbursed by the investment adviser or reductions from brokerage service arrangements or reductions from other expense offset arrangements and do not represent the amount paid by the class during periods when reimbursements or reductions occur. Expenses net of fee waivers reflect expenses after reimbursement by the investment adviser but prior to reductions from brokerage service arrangements or other expense offset arrangements. Expenses net of all reductions represent the net expenses paid by the class.
I Annualized
J Amount does not include the portfolio activity of any underlying Fidelity Central Funds.
See accompanying notes which are an integral part of the financial statements.
Notes to Financial Statements (Unaudited)
For the period ended June 30, 2016
1. Organization.
VIP Technology Portfolio (the Fund) is a non-diversified fund of Variable Insurance Products Fund IV (the Trust) and is authorized to issue an unlimited number of shares. The Trust is registered under the Investment Company Act of 1940, as amended (the 1940 Act), as an open-end management investment company organized as a Massachusetts business trust. Shares of the Fund may only be purchased by insurance companies for the purpose of funding variable annuity or variable life insurance contracts. The Fund offers the following classes of shares: Initial Class shares and Investor Class shares. All classes have equal rights and voting privileges, except for matters affecting a single class. The Fund's investments in emerging markets can be subject to social, economic, regulatory, and political uncertainties and can be extremely volatile.
2. Investments in Fidelity Central Funds.
The Fund invests in Fidelity Central Funds, which are open-end investment companies generally available only to other investment companies and accounts managed by the investment adviser and its affiliates. The Fund's Schedule of Investments lists each of the Fidelity Central Funds held as of period end, if any, as an investment of the Fund, but does not include the underlying holdings of each Fidelity Central Fund. As an Investing Fund, the Fund indirectly bears its proportionate share of the expenses of the underlying Fidelity Central Funds.
The Money Market Central Funds seek preservation of capital and current income and are managed by Fidelity Investments Money Management, Inc. (FIMM), an affiliate of the investment adviser. Annualized expenses of the Money Market Central Funds as of their most recent shareholder report date are less than .005%.
A complete unaudited list of holdings for each Fidelity Central Fund is available upon request or at the Securities and Exchange Commission (the SEC) website at www.sec.gov. In addition, the financial statements of the Fidelity Central Funds are available on the SEC website or upon request.
3. Significant Accounting Policies.
The financial statements have been prepared in conformity with accounting principles generally accepted in the United States of America (GAAP), which require management to make certain estimates and assumptions at the date of the financial statements. Actual results could differ from those estimates. Subsequent events, if any, through the date that the financial statements were issued have been evaluated in the preparation of the financial statements. The following summarizes the significant accounting policies of the Fund:
Investment Valuation. Investments are valued as of 4:00 p.m. Eastern time on the last calendar day of the period. The Board of Trustees (the Board) has delegated the day to day responsibility for the valuation of the Fund's investments to the Fidelity SelectCo, LLC (SelectCo) Fair Value Committee (the Committee). In accordance with valuation policies and procedures approved by the Board, the Fund attempts to obtain prices from one or more third party pricing vendors or brokers to value its investments. When current market prices, quotations or currency exchange rates are not readily available or reliable, investments will be fair valued in good faith by the Committee, in accordance with procedures adopted by the Board. Factors used in determining fair value vary by investment type and may include market or investment specific events. The frequency with which these procedures are used cannot be predicted and they may be utilized to a significant extent. The Committee oversees the Fund's valuation policies and procedures and reports to the Board on the Committee's activities and fair value determinations. The Board monitors the appropriateness of the procedures used in valuing the Fund's investments and ratifies the fair value determinations of the Committee.
The Fund categorizes the inputs to valuation techniques used to value its investments into a disclosure hierarchy consisting of three levels as shown below:
- Level 1 – quoted prices in active markets for identical investments
- Level 2 – other significant observable inputs (including quoted prices for similar investments, interest rates, prepayment speeds, etc.)
- Level 3 – unobservable inputs (including the Fund's own assumptions based on the best information available)
Valuation techniques used to value the Fund's investments by major category are as follows:
Equity securities, including restricted securities, for which market quotations are readily available, are valued at the last reported sale price or official closing price as reported by a third party pricing vendor on the primary market or exchange on which they are traded and are categorized as Level 1 in the hierarchy. In the event there were no sales during the day or closing prices are not available, securities are valued at the last quoted bid price or may be valued using the last available price and are generally categorized as Level 2 in the hierarchy. For foreign equity securities, when market or security specific events arise, comparisons to the valuation of American Depositary Receipts (ADRs), futures contracts, Exchange-Traded Funds (ETFs) and certain indexes as well as quoted prices for similar securities may be used and would be categorized as Level 2 in the hierarchy. Utilizing these techniques may result in transfers between Level 1 and Level 2. For equity securities, including restricted securities, where observable inputs are limited, assumptions about market activity and risk are used and these securities may be categorized as Level 3 in the hierarchy. Equity securities, including restricted securities, for which observable inputs are not available are valued using alternate valuation approaches, including the market approach and the income approach and are categorized as Level 3 in the hierarchy. The market approach generally consists of using comparable market transactions while the income approach generally consists of using the net present value of estimated future cash flows, adjusted as appropriate for liquidity, credit, market and/or other risk factors.
Investments in open-end mutual funds, including the Fidelity Central Funds, are valued at their closing net asset value (NAV) each business day and are categorized as Level 1 in the hierarchy.
The following provides information on Level 3 securities held by the Fund that were valued at period end based on unobservable inputs. These amounts exclude valuations provided by a broker.
| Asset Type | Fair Value at 06/30/16 | Valuation Technique(s) | Unobservable Input | Amount or Range/Weighted Average | Impact to Valuation from an Increase in Input(a) |
| Equities | $4,838,308 | Last transaction price | Transaction price | $3.86 - $48.77 / $24.66 | Increase |
| | | Market approach | Discount rate | 20.0% | Decrease |
| | | Market comparable | EV/Sales multiple | 2.6 | Increase |
| | | Recovery value | Recovery rate | 0.0% | Increase |
(a) Represents the expected directional change in the fair value of the Level 3 investments that would result from an increase in the corresponding input. A decrease to the unobservable input would have the opposite effect. Significant changes in these inputs could result in significantly higher or lower fair value measurements.
Changes in valuation techniques may result in transfers in or out of an assigned level within the disclosure hierarchy. The aggregate value of investments by input level as of June 30, 2016, as well as a roll forward of Level 3 investments, is included at the end of the Fund's Schedule of Investments.
Foreign Currency. The Fund may use foreign currency contracts to facilitate transactions in foreign-denominated securities. Gains and losses from these transactions may arise from changes in the value of the foreign currency or if the counterparties do not perform under the contracts' terms.
Foreign-denominated assets, including investment securities, and liabilities are translated into U.S. dollars at the exchange rates at period end. Purchases and sales of investment securities, income and dividends received and expenses denominated in foreign currencies are translated into U.S. dollars at the exchange rate in effect on the transaction date.
The effects of exchange rate fluctuations on investments are included with the net realized and unrealized gain (loss) on investment securities. Other foreign currency transactions resulting in realized and unrealized gain (loss) are disclosed separately.
Investment Transactions and Income. For financial reporting purposes, the Fund's investment holdings and NAV include trades executed through the end of the last business day of the period. The NAV per share for processing shareholder transactions is calculated as of the close of business of the New York Stock Exchange (NYSE), normally 4:00 p.m. Eastern time and includes trades executed through the end of the prior business day. Gains and losses on securities sold are determined on the basis of identified cost and may include proceeds received from litigation. Dividend income is recorded on the ex-dividend date, except for certain dividends from foreign securities where the ex-dividend date may have passed, which are recorded as soon as the Fund is informed of the ex-dividend date. Non-cash dividends included in dividend income, if any, are recorded at the fair market value of the securities received. Income and capital gain distributions from Fidelity Central Funds, if any, are recorded on the ex-dividend date. Distributions received on securities that represent a return of capital or capital gain are recorded as a reduction of cost of investments and/or as a realized gain. Subsequent to ex-dividend date the Fund determines the components of these distributions, based upon receipt of tax filings or other correspondence relating to the underlying investment. Investment income is recorded net of foreign taxes withheld where recovery of such taxes is uncertain.
Class Allocations and Expenses. Investment income, realized and unrealized capital gains and losses, common expenses of the Fund, and certain fund-level expense reductions, if any, are allocated daily on a pro-rata basis to each class based on the relative net assets of each class to the total net assets of the Fund. Each class differs with respect to transfer agent fees incurred. Certain expense reductions may also differ by class. For the reporting period, the allocated portion of income and expenses to each class as a percent of its average net assets may vary due to the timing of recording these transactions in relation to fluctuating net assets of the classes. Expenses directly attributable to a fund are charged to that fund. Expenses attributable to more than one fund are allocated among the respective funds on the basis of relative net assets or other appropriate methods. Expense estimates are accrued in the period to which they relate and adjustments are made when actual amounts are known.
Income Tax Information and Distributions to Shareholders. Each year, the Fund intends to qualify as a regulated investment company under Subchapter M of the Internal Revenue Code, including distributing substantially all of its taxable income and realized gains. As a result, no provision for U.S. Federal income taxes is required. The Fund files a U.S. federal tax return, in addition to state and local tax returns as required. The Fund's federal income tax returns are subject to examination by the Internal Revenue Service (IRS) for a period of three fiscal years after they are filed. State and local tax returns may be subject to examination for an additional fiscal year depending on the jurisdiction. Foreign taxes are provided for based on the Fund's understanding of the tax rules and rates that exist in the foreign markets in which it invests. The Fund is subject to a tax imposed on capital gains by certain countries in which it invests. An estimated deferred tax liability for net unrealized appreciation on the applicable securities is included in Other payables and accrued expenses on the Statement of Assets & Liabilities.
Distributions are declared and recorded on the ex-dividend date. Income dividends and capital gain distributions are declared separately for each class. Income and capital gain distributions are determined in accordance with income tax regulations, which may differ from GAAP.
Capital accounts within the financial statements are adjusted for permanent book-tax differences. These adjustments have no impact on net assets or the results of operations. Capital accounts are not adjusted for temporary book-tax differences which will reverse in a subsequent period.
Book-tax differences are primarily due to foreign currency transactions, certain foreign taxes, passive foreign investment companies (PFIC) and losses deferred due to wash sales and excise tax regulations.
The federal tax cost of investment securities and unrealized appreciation (depreciation) as of period end were as follows:
| Gross unrealized appreciation | $61,548,502 |
| Gross unrealized depreciation | (22,815,108) |
| Net unrealized appreciation (depreciation) on securities | $38,733,394 |
| Tax cost | $244,536,040 |
Trading (Redemption) Fees. Shares held by investors less than 60 days may be subject to a redemption fee equal to 1% of the NAV of shares redeemed. All redemption fees, which reduce the proceeds of the shareholder redemption, are retained by the Fund and accounted for as an addition to paid in capital.
Restricted Securities. The Fund may invest in securities that are subject to legal or contractual restrictions on resale. These securities generally may be resold in transactions exempt from registration or to the public if the securities are registered. Disposal of these securities may involve time-consuming negotiations and expense, and prompt sale at an acceptable price may be difficult. Information regarding restricted securities is included at the end of the Fund's Schedule of Investments.
4. Purchases and Sales of Investments.
Purchases and sales of securities other than short-term securities, aggregated $51,141,496 and $82,583,454, respectively.
5. Fees and Other Transactions with Affiliates.
Management Fee. Fidelity SelectCo, LLC (the investment adviser) and its affiliates provide the Fund with investment management related services for which the Fund pays a monthly management fee. The management fee is the sum of an individual fund fee rate that is based on an annual rate of .30% of the Fund's average net assets and an annualized group fee rate that averaged .25% during the period. The group fee rate is based upon the average net assets of all the mutual funds advised by Fidelity Management & Research Company (FMR) and the investment adviser. The group fee rate decreases as assets under management increase and increases as assets under management decrease. For the reporting period, the total annualized management fee rate was .55% of the Fund's average net assets.
Transfer Agent Fees. Fidelity Investments Institutional Operations Company, Inc. (FIIOC), an affiliate of the investment adviser, is the Fund's transfer, dividend disbursing, and shareholder servicing agent. FIIOC receives an asset-based fee with respect to each class. Each class (with the exception of Investor Class) pays a fee for transfer agent services, typesetting, and printing and mailing of shareholder reports, excluding mailing of proxy statements, equal to an annual rate of .07% (.15% for Investor Class) of class-level average net assets. For the period, transfer agent fees for each class were as follows:
| Initial Class | $20,648 |
| Investor Class | 154,560 |
| | $175,208 |
Accounting and Security Lending Fees. Fidelity Service Company, Inc. (FSC), an affiliate of the investment adviser, maintains the Fund's accounting records. The accounting fee is based on the level of average net assets for each month. Under a separate contract, FSC administers the security lending program. The security lending fee is based on the number and duration of lending transactions.
Brokerage Commissions. The Fund placed a portion of its portfolio transactions with brokerage firms which are affiliates of the investment adviser. Brokerage commissions are included in net realized gain (loss) and change in net unrealized appreciation (depreciation) in the Statement of Operations. The commissions paid to these affiliated firms were $1,563 for the period.
Interfund Trades. The Fund may purchase from or sell securities to other Fidelity Funds under procedures adopted by the Board. The procedures have been designed to ensure these interfund trades are executed in accordance with Rule 17a-7 of the 1940 Act. Interfund trades are included within the respective purchases and sales amounts shown in the Purchases and Sales of Investments note.
6. Committed Line of Credit.
The Fund participates with other funds managed by the investment adviser or an affiliate in a $4.25 billion credit facility (the "line of credit") to be utilized for temporary or emergency purposes to fund shareholder redemptions or for other short-term liquidity purposes. The Fund has agreed to pay commitment fees on its pro-rata portion of the line of credit, which amounted to $249 and is reflected in Miscellaneous expenses on the Statement of Operations. During the period, the Fund did not borrow on this line of credit.
7. Security Lending.
The Fund lends portfolio securities through a lending agent from time to time in order to earn additional income. On the settlement date of the loan, the Fund receives collateral (in the form of U.S. Treasury obligations, letters of credit and/or cash) against the loaned securities and maintains collateral in an amount not less than 100% of the market value of the loaned securities during the period of the loan. The market value of the loaned securities is determined at the close of business of the Fund and any additional required collateral is delivered to the Fund on the next business day. The Fund or borrower may terminate the loan at any time, and if the borrower defaults on its obligation to return the securities loaned because of insolvency or other reasons, the Fund may apply collateral received from the borrower against the obligation. The Fund may experience delays and costs in recovering the securities loaned. Any cash collateral received is invested in the Fidelity Securities Lending Cash Central Fund. The value of loaned securities and cash collateral at period end are disclosed on the Fund's Statement of Assets and Liabilities. Security lending income represents the income earned on investing cash collateral, less rebates paid to borrowers and any lending agent fees associated with the loan, plus any premium payments received for lending certain types of securities. Security lending income is presented in the Statement of Operations as a component of income from Fidelity Central Funds.
8. Expense Reductions.
Commissions paid to certain brokers with whom the investment adviser, or its affiliates, places trades on behalf of the Fund include an amount in addition to trade execution, which may be rebated back to the Fund to offset certain expenses. This amount totaled $10,931 for the period. In addition, during the period the investment adviser reimbursed and/or waived a portion of fund-level operating expenses in the amount of $1,108.
9. Distributions to Shareholders.
Distributions to shareholders of each class were as follows:
| | Six months ended
June 30, 2016 | Year ended December 31, 2015 |
| From net investment income | | |
| Initial Class | $– | $99,395 |
| Investor Class | – | 198,401 |
| Total | $– | $297,796 |
| From net realized gain | | |
| Initial Class | $2,047,093 | $3,666,747 |
| Investor Class | 6,998,641 | 10,367,149 |
| Total | $9,045,734 | $14,033,896 |
10. Share Transactions.
Transactions for each class of shares were as follows:
| | Shares | Shares | Dollars | Dollars |
| | Six months ended
June 30, 2016 | Year ended December 31, 2015 | Six months ended
June 30, 2016 | Year ended December 31, 2015 |
| Initial Class | | | | |
| Shares sold | 188,369 | 827,052 | $2,097,368 | $9,981,643 |
| Reinvestment of distributions | 211,914 | 320,044 | 2,047,093 | 3,766,142 |
| Shares redeemed | (856,282) | (1,132,307) | (9,314,789) | (13,373,077) |
| Net increase (decrease) | (455,999) | 14,789 | $(5,170,328) | $374,708 |
| Investor Class | | | | |
| Shares sold | 835,465 | 5,695,629 | $8,997,338 | $67,818,059 |
| Reinvestment of distributions | 731,310 | 906,354 | 6,998,641 | 10,565,550 |
| Shares redeemed | (3,512,474) | (1,489,081) | (38,321,188) | (17,083,824) |
| Net increase (decrease) | (1,945,699) | 5,112,902 | $(22,325,209) | $61,299,785 |
11. Other.
The Fund's organizational documents provide former and current trustees and officers with a limited indemnification against liabilities arising in connection with the performance of their duties to the Fund. In the normal course of business, the Fund may also enter into contracts that provide general indemnifications. The Fund's maximum exposure under these arrangements is unknown as this would be dependent on future claims that may be made against the Fund. The risk of material loss from such claims is considered remote.
At the end of the period, the investment adviser or its affiliates were the owners of record of 99% of the total outstanding shares of the Fund.
Shareholder Expense Example
As a shareholder of a Fund, you incur two types of costs: (1) transaction costs, including redemption fees and (2) ongoing costs, including management fees and other Fund expenses. This Example is intended to help you understand your ongoing costs (in dollars) of investing in the Funds and to compare these costs with the ongoing costs of investing in other mutual funds.
The Example is based on an investment of $1,000 invested at the beginning of the period and held for the entire period (January 1, 2016 to June 30, 2016).
Actual Expenses
The first line of the accompanying table for each class of the Fund provides information about actual account values and actual expenses. You may use the information in this line, together with the amount you invested, to estimate the expenses that you paid over the period. Simply divide your account value by $1,000.00 (for example, an $8,600 account value divided by $1,000.00 = 8.6), then multiply the result by the number in the first line for a class of the Fund under the heading entitled "Expenses Paid During Period" to estimate the expenses you paid on your account during this period. The estimate of expenses does not include any fees or other expenses of any variable annuity or variable life insurance product. If they were, the estimate of expenses you paid during the period would be higher, and your ending account value would be lower. In addition, the Fund, as a shareholder in the underlying Fidelity Central Funds, will indirectly bear its pro-rata share of the fees and expenses incurred by the underlying Fidelity Central Funds. These fees and expenses are not included in the Fund's annualized expense ratio used to calculate the expense estimate in the table below.
Hypothetical Example for Comparison Purposes
The second line of the accompanying table for each class of the Fund provides information about hypothetical account values and hypothetical expenses based on a Class' actual expense ratio and an assumed rate of return of 5% per year before expenses, which is not the Class' actual return. The hypothetical account values and expenses may not be used to estimate the actual ending account balance or expenses you paid for the period. You may use this information to compare the ongoing costs of investing in the Fund and other funds. To do so, compare this 5% hypothetical example with the 5% hypothetical examples that appear in the shareholder reports of the other funds. The estimate of expenses does not include any fees or other expenses of any variable annuity or variable life insurance product. If they were, the estimate of expenses you paid during the period would be higher, and your ending account value would be lower. In addition, the Fund, as a shareholder in the underlying Fidelity Central Funds, will indirectly bear its pro-rata share of the fees and expenses incurred by the underlying Fidelity Central Funds. These fees and expenses are not included in the Fund's annualized expense ratio used to calculate the expense estimate in the table below.
Please note that the expenses shown in the table are meant to highlight your ongoing costs only and do not reflect any transaction costs. Therefore, the second line of the table is useful in comparing ongoing costs only, and will not help you determine the relative total costs of owning different funds. In addition, if these transactional costs were included, your costs would have been higher.
| | Annualized Expense Ratio-A | Beginning
Account Value
January 1, 2016 | Ending
Account Value
June 30, 2016 | Expenses Paid
During Period-B
January 1, 2016
to June 30, 2016 |
| Initial Class | .70% | | | |
| Actual | | $1,000.00 | $976.20 | $3.44 |
| Hypothetical-C | | $1,000.00 | $1,021.38 | $3.52 |
| Investor Class | .78% | | | |
| Actual | | $1,000.00 | $975.90 | $3.83 |
| Hypothetical-C | | $1,000.00 | $1,020.98 | $3.92 |
A Annualized expense ratio reflects expenses net of applicable fee waivers.
B Expenses are equal to each Class' annualized expense ratio, multiplied by the average account value over the period, multiplied by 182/366 (to reflect the one-half year period).
C 5% return per year before expenses
Board Approval of Investment Advisory Contracts and Management Fees
VIP Technology Portfolio
Each year, the Board of Trustees, including the Independent Trustees (together, the Board), votes on the renewal of the management contract with Fidelity SelectCo, LLC (SelectCo), an affiliate of Fidelity Management & Research Company (FMR), and the sub-advisory agreements with affiliates of FMR (together, the Advisory Contracts) for the fund. The Board, assisted by the advice of fund counsel and Independent Trustees' counsel, requests and considers a broad range of information relevant to the renewal of the Advisory Contracts throughout the year.
The Board meets regularly and, at each of its meetings, covers an extensive agenda of topics and materials and considers factors that are relevant to its annual consideration of the renewal of the fund's Advisory Contracts, including the services and support provided to the fund and its shareholders. The Board has established four standing committees (Committees) — Operations, Audit, Fair Valuation, and Governance and Nominating — each composed of and chaired by Independent Trustees with varying backgrounds, to which the Board has assigned specific subject matter responsibilities in order to enhance effective decision-making by the Board. The Operations Committee, of which all of the Independent Trustees are members, meets regularly throughout the year and considers, among other matters, information specifically related to the annual consideration of the renewal of the fund's Advisory Contracts. The Board, acting directly and through its Committees, requests and receives information concerning the annual consideration of the renewal of the fund's Advisory Contracts. The Board also meets as needed to consider matters specifically related to the Board's annual consideration of the renewal of the Advisory Contracts. Members of the Board may also meet with trustees of other Fidelity funds through ad hoc joint committees to discuss certain matters relevant to all of the Fidelity funds.
At its January 2016 meeting, the Board unanimously determined to renew the fund's Advisory Contracts. In reaching its determination, the Board considered all factors it believed relevant, including (i) the nature, extent, and quality of the services to be provided to the fund and its shareholders (including the investment performance of the fund); (ii) the competitiveness of the fund's management fee and total expense ratio relative to peer funds; (iii) the total costs of the services to be provided by and the profits to be realized by Fidelity from its relationships with the fund; and (iv) the extent to which, if any, economies of scale exist and would be realized as the fund grows, and whether any economies of scale are appropriately shared with fund shareholders.
In considering whether to renew the Advisory Contracts for the fund, the Board reached a determination, with the assistance of fund counsel and Independent Trustees' counsel and through the exercise of its business judgment, that the renewal of the Advisory Contracts was in the best interests of the fund and its shareholders and that the compensation payable under the Advisory Contracts was fair and reasonable. The Board's decision to renew the Advisory Contracts was not based on any single factor, but rather was based on a comprehensive consideration of all the information provided to the Board at its meetings throughout the year. The Board, in reaching its determination to renew the Advisory Contracts, was aware that shareholders of the fund have a broad range of investment choices available to them, including a wide choice among funds offered by Fidelity's competitors, and that the fund's shareholders, who have the opportunity to review and weigh the disclosure provided by the fund in its prospectus and other public disclosures, have chosen to invest in this fund, which is part of the Fidelity family of funds.
Nature, Extent, and Quality of Services Provided. The Board considered the staffing of SelectCo and the sub-advisers (together with SelectCo, the Investment Advisers) as it relates to the fund, including the backgrounds of investment personnel of SelectCo, and also considered the fund's investment objective, strategies, and related investment philosophy. The Independent Trustees also had discussions with senior management of Fidelity's investment operations and investment groups. The Board considered the structure of the investment personnel compensation program and whether this structure provides appropriate incentives to act in the best interests of the fund. Additionally, the Board considered the portfolio managers' investments, if any, in the funds that they manage.
Resources Dedicated to Investment Management and Support Services. The Board reviewed the general qualifications and capabilities of the investment staff of the Investment Advisers, including their size, education, experience, and resources, as well as Fidelity's approach to recruiting, training, managing, and compensating investment personnel. The Board noted that Fidelity has continued to increase the resources devoted to non-U.S. offices, including expansion of Fidelity's global investment organization. The Board also noted that Fidelity's analysts have extensive resources, tools and capabilities that allow them to conduct sophisticated quantitative and fundamental analysis, as well as credit analysis of issuers, counterparties and guarantors. Further, the Board considered that Fidelity's investment professionals have sufficient access to global information and data so as to provide competitive investment results over time, and that those professionals also have access to sophisticated tools that permit them to assess portfolio construction and risk and performance attribution characteristics continuously, as well as to transmit new information and research conclusions rapidly around the world. Additionally, in its deliberations, the Board considered Fidelity's trading, risk management, compliance, and technology and operations capabilities and resources, which are integral parts of the investment management process.
Shareholder and Administrative Services. The Board considered (i) the nature, extent, quality, and cost of advisory, administrative, and shareholder services performed by the Investment Advisers and their affiliates under the Advisory Contracts and under separate agreements covering transfer agency, pricing and bookkeeping, and securities lending services for the fund; (ii) the nature and extent of the supervision of third party service providers, principally custodians, subcustodians, and pricing vendors; and (iii) the resources devoted to, and the record of compliance with, the fund's compliance policies and procedures. The Board also reviewed the allocation of fund brokerage, including allocations to brokers affiliated with the Investment Advisers, the use of brokerage commissions to pay fund expenses, and the use of "soft" commission dollars to pay for research services.
The Board noted that the growth of fund assets over time across the complex allows Fidelity to reinvest in the development of services designed to enhance the value or convenience of the Fidelity funds as investment vehicles. These services include 24-hour access to account information and market information through telephone representatives and over the Internet, investor education materials and asset allocation tools, and the expanded availability of Fidelity Investor Centers.
The Board noted that in 2014 the ad hoc Committee on Transfer Agency Fees was formed by it and the boards of certain other Fidelity funds to review the variety of transfer agency services and fee structures throughout the mutual fund industry compared to Fidelity's.
Investment in a Large Fund Family. The Board considered the benefits to shareholders of investing in a Fidelity fund, including the benefits of investing in a fund that is part of a large family of funds offering a variety of investment disciplines and providing a large variety of mutual fund investor services. The Board noted that Fidelity had taken, or had made recommendations that resulted in the Fidelity funds taking, a number of actions over the previous year that benefited particular funds, including (i) continuing to dedicate additional resources to investment research and to the support of the senior management team that oversees asset management; (ii) continuing efforts to enhance Fidelity's global research capabilities; (iii) launching new funds and making other enhancements to meet client needs; (iv) reducing management fees and total expenses for certain index funds; (v) continuing to launch dedicated lower cost underlying funds to meet portfolio construction needs related to expanding underlying fund options for Fidelity funds of funds, specifically for the Freedom Fund product lines; (vi) rationalizing product lines and gaining increased efficiencies through fund mergers; (vii) continuing to develop, acquire and implement systems and technology to improve services to the funds and shareholders, strengthen information security, and increase efficiency; (viii) implementing investment enhancements to further strengthen Fidelity's target date product line to increase investors' probability of success in achieving their goals; (ix) modifying the eligibility criteria for certain share classes to accommodate roll-over assets from employer-sponsored retirement plans; (x) launching a new Class W of the Freedom Index Funds to attract and retain Fidelity record-kept retirement plan assets; and (xi) implementing changes to Fidelity's money market fund product line in response to recent regulatory reforms.
Investment Performance. The Board considered whether the fund has operated in accordance with its investment objective, as well as its record of compliance with its investment restrictions and its performance history.
The Board took into account discussions with representatives of the Investment Advisers about fund investment performance that occur at Board meetings throughout the year. In this regard the Board noted that as part of regularly scheduled fund reviews and other reports to the Board on fund performance, the Board considers annualized return information for the fund, for different time periods, measured against a securities market index ("benchmark index"). In its evaluation of fund investment performance at meetings throughout the year, the Board gave particular attention to information indicating underperformance of certain Fidelity funds for specific time periods and discussed with the Investment Advisers the reasons for such underperformance. The fund underperformed its benchmark for the one-, three-, and five-year periods ended June 30, 2015, and as a result, the Board will continue to discuss with SelectCo the steps it is taking to address the fund's performance.
In addition to reviewing absolute and relative fund performance, the Independent Trustees periodically consider the appropriateness of fund performance metrics in evaluating the results achieved. In general, the Independent Trustees believe that fund performance should be evaluated based on net performance (after fees and expenses) of both the highest performing and lowest performing fund share classes, where applicable, compared to appropriate benchmark indices, over appropriate time periods that may include full market cycles, taking into account relevant factors, including the following: general market conditions; issuer-specific information; and fund cash flows and other factors. Depending on the circumstances, the Independent Trustees may be satisfied with a fund's performance notwithstanding that it lags its benchmark index for certain periods.
The Independent Trustees recognize that shareholders evaluate performance on a net basis over their own holding periods, for which one-, three-, and five-year periods are often used as a proxy. For this reason, the performance information reviewed by the Board also included net cumulative total return information for the fund and an appropriate benchmark index for the most recent one-, three-, and five-year periods ended June 30, 2015.
Based on its review, the Board concluded that the nature, extent, and quality of services provided to the fund under the Advisory Contracts should benefit the shareholders of the fund.
Competitiveness of Management Fee and Total Expense Ratio. The Board considered the fund's management fee and total expense ratio compared to "mapped groups" of competitive funds and classes created for the purpose of facilitating the Trustees' analysis of the competitiveness of management fees and total expenses. Fidelity creates "mapped groups" by combining similar Lipper investment objective categories that have comparable investment mandates. For this purpose, all sector focused equity funds are grouped in the same mapped group. Combining Lipper investment objective categories aids the Board's management fee and total expense ratio comparisons by broadening the competitive group used for comparison.
Management Fee. The Board considered two proprietary management fee comparisons for the 12-month periods ended June 30 shown in basis points (BP) in the chart below. The group of Lipper funds used by the Board for management fee comparisons is referred to below as the "Total Mapped Group." The Total Mapped Group comparison focuses on a fund's standing in terms of gross management fees before expense reimbursements or caps relative to the total universe of funds with comparable investment mandates (
i.e., sector equities), regardless of whether their management fee structures also are comparable. Funds with comparable management fee structures have similar management fee contractual arrangements (
e.g., flat rate charged for advisory services, all-inclusive fee rate,
etc.). "TMG %" represents the percentage of funds in the Total Mapped Group that had management fees that were lower than the fund's. For example, a hypothetical TMG % of 20% would mean that 80% of the funds in the Total Mapped Group had higher, and 20% had lower, management fees than the fund. The fund's actual TMG %s and the number of funds in the Total Mapped Group are in the chart below. The "Asset-Size Peer Group" (ASPG) comparison focuses on a fund's standing relative to a subset of non-Fidelity funds within the Total Mapped Group that are similar in size and management fee structure. For example, if a fund is in the first quartile of the ASPG, the fund's management fee ranks in the least expensive or lowest 25% of funds in the ASPG. The ASPG represents at least 15% of the funds in the Total Mapped Group with comparable asset size and management fee structures, subject to a minimum of 50 funds (or all funds in the Total Mapped Group if fewer than 50). Additional information, such as the ASPG quartile in which the fund's management fee rate ranked, is also included in the chart and considered by the Board.
VIP Technology Portfolio
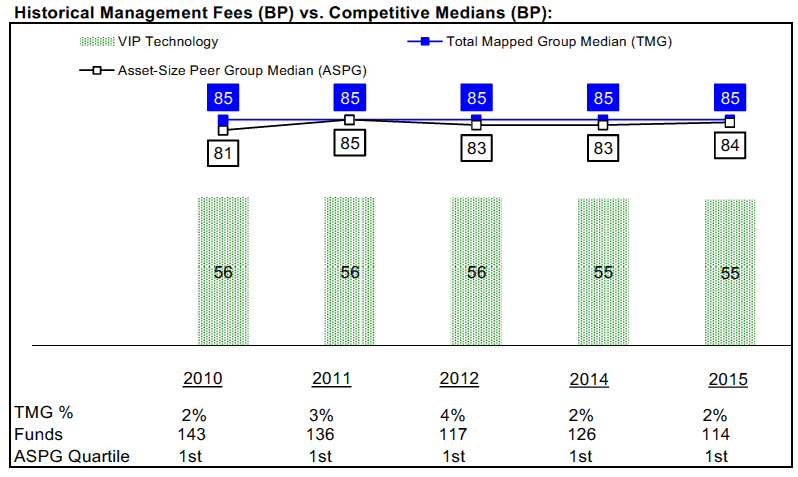
The Board noted that the fund's management fee rate ranked below the median of its Total Mapped Group and below the median of its ASPG for the 12-month period ended June 30, 2015.
The Board noted that, in 2014, the ad hoc Committee on Group Fee was formed by it and the boards of other Fidelity funds to conduct an in-depth review of the "group fee" component of the management fee of funds with such management fee structures. Committee focus included the mechanics of the group fee, the competitive landscape of group fee structures, Fidelity funds with no group fee component and investment products not included in group fee assets. The Board also considered that, for funds subject to the group fee, FMR agreed to voluntarily waive fees over a specified period of time in amounts designed to account for assets converted from certain funds to certain collective investment trusts.
Based on its review, the Board concluded that the fund's management fee is fair and reasonable in light of the services that the fund receives and the other factors considered.
Total Expense Ratio. In its review of each class's total expense ratio, the Board considered the fund's management fee rate as well as other fund or class expenses, as applicable, such as transfer agent fees, pricing and bookkeeping fees, and custodial, legal, and audit fees. The Board also noted that Fidelity may agree to waive fees and expenses from time to time, and the extent to which, if any, it has done so for the fund. As part of its review, the Board also considered the current and historical total expense ratios of each class of the fund compared to competitive fund median expenses. Each class of the fund is compared to those funds and classes in the Total Mapped Group (used by the Board for management fee comparisons) that have a similar sales load structure.
The Board noted that the total expense ratio of each class ranked below the competitive median for the 12-month period ended June 30, 2015.
Fees Charged to Other Fidelity Clients. The Board also considered Fidelity fee structures and other information with respect to clients of Fidelity, such as other funds advised or subadvised by Fidelity, pension plan clients, and other institutional clients with similar mandates. The Board noted the findings of the 2013 ad hoc joint committee (created with the boards of other Fidelity funds), which reviewed and compared Fidelity's institutional investment advisory business with its business of providing services to the Fidelity funds, including the differences in services provided, fees charged, and costs incurred, as well as competition in their respective marketplaces.
Based on its review of total expense ratios and fees charged to other Fidelity clients, the Board concluded that the total expense ratio of each class of the fund was reasonable in light of the services that the fund and its shareholders receive and the other factors considered.
Costs of the Services and Profitability. The Board considered the revenues earned and the expenses incurred by Fidelity in conducting the business of developing, marketing, distributing, managing, administering and servicing the fund and servicing the fund's shareholders. The Board also considered the level of Fidelity's profits in respect of all the Fidelity funds.
On an annual basis, Fidelity presents to the Board information about the profitability of its relationship with the fund. Fidelity calculates profitability information for each fund, as well as aggregate profitability information for groups of Fidelity funds and all Fidelity funds, using a series of detailed revenue and cost allocation methodologies which originate with the books and records of Fidelity on which Fidelity's audited financial statements are based. The Audit Committee of the Board reviews any significant changes from the prior year's methodologies.
PricewaterhouseCoopers LLP (PwC), independent registered public accounting firm and auditor to Fidelity and certain Fidelity funds, has been engaged annually by the Board as part of the Board's assessment of the profitability analysis used by Fidelity. PwC's engagement includes the review and assessment of Fidelity's methodologies used in determining the revenues and expenses attributable to Fidelity's mutual fund business, and completion of agreed-upon procedures in respect of the mathematical accuracy of fund profitability and its conformity to established allocation methodologies. After considering PwC's reports issued under the engagement and information provided by Fidelity, the Board concluded that while other allocation methods may also be reasonable, Fidelity's profitability methodologies are reasonable in all material respects.
The Board also reviewed Fidelity's non-fund businesses and fall-out benefits related to the mutual fund business as well as cases where Fidelity's affiliates may benefit from or be related to the fund's business.
The Board considered the costs of the services provided by and the profits realized by Fidelity in connection with the operation of the fund and was satisfied that the profitability was not excessive.
Economies of Scale. The Board considered whether there have been economies of scale in respect of the management of the Fidelity funds, whether the Fidelity funds (including the fund) have appropriately benefited from any such economies of scale, and whether there is potential for realization of any further economies of scale. The Board considered the extent to which the fund will benefit from economies of scale as assets grow through increased services to the fund, through waivers or reimbursements, or through fee or expense ratio reductions. The Board also noted that in 2013, it and the boards of other Fidelity funds created an ad hoc committee (the Economies of Scale Committee) to analyze whether Fidelity attains economies of scale in respect of the management and servicing of the Fidelity funds, whether the Fidelity funds have appropriately benefited from such economies of scale, and whether there is potential for realization of any further economies of scale.
The Board recognized that the fund's management contract incorporates a "group fee" structure, which provides for lower group fee rates as total group assets increase, and for higher group fee rates as total group assets decrease (with "group assets" defined to include fund assets under SelectCo's management plus assets under FMR's management). SelectCo calculates the group fee rates based on a tiered asset "breakpoint" schedule that varies based on asset class. The Board considered that the group fee is designed to deliver the benefits of economies of scale to fund shareholders when total group assets increase, even if assets of any particular fund are unchanged or have declined, because some portion of Fidelity's costs are attributable to services provided to all Fidelity funds, and all funds benefit if those costs can be allocated among more assets. The Board concluded that, given the group fee structure, fund shareholders will benefit from lower management fees as group assets increase at the fund complex level, regardless of whether Fidelity achieves any such economies of scale.
The Board concluded, taking into account the analysis of the Economies of Scale Committee, that economies of scale, if any, are being appropriately shared between fund shareholders and Fidelity.
Additional Information Requested by the Board. In order to develop fully the factual basis for consideration of the Fidelity funds' Advisory Contracts, the Board requested and received additional information on certain topics, including: (i) Fidelity's fund profitability methodology, profitability trends for certain funds, and the impact of certain factors on fund profitability results; (ii) portfolio manager changes that have occurred during the past year and the amount of the investment that each portfolio manager has made in the Fidelity fund(s) that he or she manages; (iii) Fidelity's compensation structure for portfolio managers, research analysts, and other key personnel, including its effects on fund profitability; (iv) the arrangements with and compensation paid to certain fund sub-advisers on behalf of the Fidelity funds; (v) Fidelity's long-term expectations for its offerings in the workplace investing channel; (vi) the methodology with respect to competitive fund data and peer group classifications; (vii) Fidelity's transfer agent fee, expense, and service structures for different funds and classes, and the impact of outsourcing, the increased use of omnibus accounts, and lower pricing in the retirement channel; and (viii) explanations regarding the relative total expense ratios of certain funds and classes, total expense competitive trends and methodologies for total expense competitive comparisons, and actions that might be taken by Fidelity to reduce total expense ratios for certain funds and classes or to achieve further economies of scale.
Based on its evaluation of all of the conclusions noted above, and after considering all factors it believed relevant, the Board concluded that the advisory fee structures are fair and reasonable, and that the fund's Advisory Contracts should be renewed.
VTECIC-SANN-0816
1.817388.111
Fidelity® Variable Insurance Products: Telecommunications Portfolio
Semi-Annual Report June 30, 2016 |
|
Contents
To view a fund's proxy voting guidelines and proxy voting record for the 12-month period ended June 30, visit http://www.fidelity.com/proxyvotingresults or visit the Securities and Exchange Commission's (SEC) web site at http://www.sec.gov.
You may also call 1-877-208-0098 to request a free copy of the proxy voting guidelines.
Fidelity® Variable Insurance Products are separate account options which are purchased through a variable insurance contract.
Standard & Poor's, S&P and S&P 500 are registered service marks of The McGraw-Hill Companies, Inc. and have been licensed for use by Fidelity Distributors Corporation.
Other third-party marks appearing herein are the property of their respective owners.
All other marks appearing herein are registered or unregistered trademarks or service marks of FMR LLC or an affiliated company. © 2016 FMR LLC. All rights reserved.
This report and the financial statements contained herein are submitted for the general information of the shareholders of the Fund. This report is not authorized for distribution to prospective investors in the Fund unless preceded or accompanied by an effective prospectus.
A fund files its complete schedule of portfolio holdings with the SEC for the first and third quarters of each fiscal year on Form N-Q. Forms N-Q are available on the SEC’s web site at http://www.sec.gov. A fund's Forms N-Q may be reviewed and copied at the SEC’s Public Reference Room in Washington, DC. Information regarding the operation of the SEC's Public Reference Room may be obtained by calling 1-800-SEC-0330.
For a complete list of a fund's portfolio holdings, view the most recent holdings listing, semiannual report, or annual report on Fidelity's web site at http://www.fidelity.com, http://www.institutional.fidelity.com, or http://www.401k.com, as applicable.
NOT FDIC INSURED •MAY LOSE VALUE •NO BANK GUARANTEE
Neither the Fund nor Fidelity Distributors Corporation is a bank.
Investment Summary (Unaudited)
Top Ten Stocks as of June 30, 2016
| | % of fund's net assets | % of fund's net assets 6 months ago |
| AT&T, Inc. | 21.6 | 25.0 |
| Verizon Communications, Inc. | 10.5 | 15.8 |
| T-Mobile U.S., Inc. | 5.0 | 5.0 |
| American Tower Corp. | 4.9 | 4.2 |
| Level 3 Communications, Inc. | 4.1 | 5.5 |
| SBA Communications Corp. Class A | 4.0 | 4.2 |
| Cogent Communications Group, Inc. | 3.0 | 4.3 |
| CenturyLink, Inc. | 2.9 | 2.9 |
| Zayo Group Holdings, Inc. | 2.9 | 0.7 |
| Vodafone Group PLC | 2.6 | 0.0 |
| | 61.5 | |
Top Industries (% of fund's net assets)
| As of June 30, 2016 |
| | Diversified Telecommunication Services | 67.2% |
| | Wireless Telecommunication Services | 14.4% |
| | Media | 7.7% |
| | Real Estate Investment Trusts | 4.9% |
| | Internet Software & Services | 0.9% |
| | All Others* | 4.9% |

* Includes Short-Term investments and Net Other Assets (Liabilities).
| As of December 31, 2015 |
| | Diversified Telecommunication Services | 71.4% |
| | Wireless Telecommunication Services | 16.7% |
| | Real Estate Investment Trusts | 5.2% |
| | Media | 4.2% |
| | Communications Equipment | 1.1% |
| | All Others* | 1.4% |

* Includes Short-Term investments and Net Other Assets (Liabilities).
Percentages shown as 0.0% may reflect amounts less than 0.05%.
Investments June 30, 2016 (Unaudited)
Showing Percentage of Net Assets
| Common Stocks - 94.9% | | | |
| | | Shares | Value |
| Communications Equipment - 0.2% | | | |
| Communications Equipment - 0.2% | | | |
| NetScout Systems, Inc. (a) | | 6,800 | $151,300 |
| Diversified Financial Services - 0.5% | | | |
| Other Diversified Financial Services - 0.5% | | | |
| Broadcom Ltd. | | 2,500 | 388,500 |
| Diversified Telecommunication Services - 65.9% | | | |
| Alternative Carriers - 17.9% | | | |
| 8x8, Inc. (a) | | 112,192 | 1,639,125 |
| Cogent Communications Group, Inc. | | 54,990 | 2,202,899 |
| Globalstar, Inc. (a)(b) | | 227,000 | 274,670 |
| Iliad SA | | 1,221 | 246,476 |
| Iridium Communications, Inc. (a)(b) | | 147,363 | 1,308,583 |
| Level 3 Communications, Inc. (a) | | 60,030 | 3,090,945 |
| Lumos Networks Corp. (a) | | 116,118 | 1,405,028 |
| Vonage Holdings Corp. (a) | | 165,700 | 1,010,770 |
| Zayo Group Holdings, Inc. (a) | | 76,700 | 2,142,231 |
| | | | 13,320,727 |
| Integrated Telecommunication Services - 48.0% | | | |
| AT&T, Inc. | | 371,118 | 16,036,008 |
| Atlantic Tele-Network, Inc. | | 16,000 | 1,244,960 |
| Bharti Infratel Ltd. | | 60,891 | 311,969 |
| CenturyLink, Inc. | | 73,890 | 2,143,549 |
| Cincinnati Bell, Inc. (a) | | 227,339 | 1,038,939 |
| Consolidated Communications Holdings, Inc. (b) | | 24,400 | 664,656 |
| FairPoint Communications, Inc. (a)(b) | | 22,000 | 322,960 |
| Frontier Communications Corp. (b) | | 351,414 | 1,735,985 |
| General Communications, Inc. Class A (a) | | 24,747 | 391,003 |
| IDT Corp. Class B | | 6,238 | 88,517 |
| SBA Communications Corp. Class A (a) | | 27,836 | 3,004,618 |
| Spark New Zealand Ltd. | | 158,282 | 401,197 |
| Verizon Communications, Inc. | | 139,071 | 7,765,725 |
| Windstream Holdings, Inc. (b) | | 59,300 | 549,711 |
| | | | 35,699,797 |
|
| TOTAL DIVERSIFIED TELECOMMUNICATION SERVICES | | | 49,020,524 |
|
| Internet Software & Services - 0.9% | | | |
| Internet Software & Services - 0.9% | | | |
| Gogo, Inc. (a)(b) | | 65,000 | 545,350 |
| GTT Communications, Inc. (a) | | 8,000 | 147,840 |
| | | | 693,190 |
| Media - 7.7% | | | |
| Cable & Satellite - 7.3% | | | |
| Altice NV Class A (a) | | 48,988 | 731,462 |
| Charter Communications, Inc. Class A | | 8,113 | 1,854,956 |
| Comcast Corp. Class A | | 16,400 | 1,069,116 |
| DISH Network Corp. Class A (a) | | 12,900 | 675,960 |
| Liberty Global PLC: | | | |
| Class C (a) | | 21,200 | 607,380 |
| LiLAC Class C (a) | | 536 | 17,415 |
| Megacable Holdings S.A.B. de CV unit | | 54,100 | 219,181 |
| NOS SGPS SA (a) | | 47,000 | 284,429 |
| | | | 5,459,899 |
| Movies & Entertainment - 0.4% | | | |
| Twenty-First Century Fox, Inc. Class A | | 9,600 | 259,680 |
|
| TOTAL MEDIA | | | 5,719,579 |
|
| Real Estate Investment Trusts - 4.9% | | | |
| Specialized REITs - 4.9% | | | |
| American Tower Corp. | | 32,082 | 3,644,836 |
| Software - 0.4% | | | |
| Application Software - 0.4% | | | |
| Synchronoss Technologies, Inc. (a) | | 9,300 | 296,298 |
| Wireless Telecommunication Services - 14.4% | | | |
| Wireless Telecommunication Services - 14.4% | | | |
| Boingo Wireless, Inc. (a) | | 42 | 375 |
| KDDI Corp. | | 18,300 | 556,498 |
| Millicom International Cellular SA | | 3,300 | 201,597 |
| Shenandoah Telecommunications Co. | | 24,374 | 952,048 |
| Sprint Corp. (a)(b) | | 264,116 | 1,196,445 |
| T-Mobile U.S., Inc. (a) | | 85,328 | 3,692,143 |
| Telephone & Data Systems, Inc. | | 61,225 | 1,815,934 |
| U.S. Cellular Corp. (a) | | 9,800 | 384,846 |
| Vodafone Group PLC | | 634,800 | 1,935,416 |
| | | | 10,735,302 |
| TOTAL COMMON STOCKS | | | |
| (Cost $60,963,207) | | | 70,649,529 |
|
| Nonconvertible Preferred Stocks - 1.3% | | | |
| Diversified Telecommunication Services - 1.3% | | | |
| Integrated Telecommunication Services - 1.3% | | | |
| Telecom Italia SpA (Risparmio Shares) | | 1,478,300 | 951,107 |
| TOTAL NONCONVERTIBLE PREFERRED STOCKS | | | |
| (Cost $1,019,548) | | | 951,107 |
|
| Money Market Funds - 9.7% | | | |
| Fidelity Cash Central Fund, 0.43% (c) | | 2,013,899 | 2,013,899 |
| Fidelity Securities Lending Cash Central Fund, 0.46% (c)(d) | | 5,196,350 | 5,196,350 |
| TOTAL MONEY MARKET FUNDS | | | |
| (Cost $7,210,249) | | | 7,210,249 |
| TOTAL INVESTMENT PORTFOLIO - 105.9% | | | |
| (Cost $69,193,004) | | | 78,810,885 |
| NET OTHER ASSETS (LIABILITIES) - (5.9)% | | | (4,419,216) |
| NET ASSETS - 100% | | | $74,391,669 |
Legend
(a) Non-income producing
(b) Security or a portion of the security is on loan at period end.
(c) Affiliated fund that is generally available only to investment companies and other accounts managed by Fidelity Investments. The rate quoted is the annualized seven-day yield of the fund at period end. A complete unaudited listing of the fund's holdings as of its most recent quarter end is available upon request. In addition, each Fidelity Central Fund's financial statements are available on the SEC's website or upon request.
(d) Investment made with cash collateral received from securities on loan.
Affiliated Central Funds
Information regarding fiscal year to date income earned by the Fund from investments in Fidelity Central Funds is as follows:
| Fund | Income earned |
| Fidelity Cash Central Fund | $3,198 |
| Fidelity Securities Lending Cash Central Fund | 18,169 |
| Total | $21,367 |
Investment Valuation
The following is a summary of the inputs used, as of June 30, 2016, involving the Fund's assets and liabilities carried at fair value. The inputs or methodology used for valuing securities may not be an indication of the risk associated with investing in those securities. For more information on valuation inputs, and their aggregation into the levels used below, please refer to the Investment Valuation section in the accompanying Notes to Financial Statements.
| | Valuation Inputs at Reporting Date: |
| Description | Total | Level 1 | Level 2 | Level 3 |
| Investments in Securities: | | | | |
| Common Stocks | $70,649,529 | $66,583,279 | $4,066,250 | $-- |
| Nonconvertible Preferred Stocks | 951,107 | -- | 951,107 | -- |
| Money Market Funds | 7,210,249 | 7,210,249 | -- | -- |
| Total Investments in Securities: | $78,810,885 | $73,793,528 | $5,017,357 | $-- |
See accompanying notes which are an integral part of the financial statements.
Financial Statements
Statement of Assets and Liabilities
| | | June 30, 2016 (Unaudited) |
| Assets | | |
Investment in securities, at value (including securities loaned of $5,091,926) — See accompanying schedule:
Unaffiliated issuers (cost $61,982,755) | $71,600,636 | |
| Fidelity Central Funds (cost $7,210,249) | 7,210,249 | |
| Total Investments (cost $69,193,004) | | $78,810,885 |
| Receivable for investments sold | | 687,320 |
| Receivable for fund shares sold | | 380,759 |
| Dividends receivable | | 36,910 |
| Distributions receivable from Fidelity Central Funds | | 4,788 |
| Prepaid expenses | | 18 |
| Other receivables | | 1,840 |
| Total assets | | 79,922,520 |
| Liabilities | | |
| Payable for investments purchased | $239,296 | |
| Payable for fund shares redeemed | 28,441 | |
| Accrued management fee | 31,580 | |
| Other affiliated payables | 9,817 | |
| Other payables and accrued expenses | 25,367 | |
| Collateral on securities loaned, at value | 5,196,350 | |
| Total liabilities | | 5,530,851 |
| Net Assets | | $74,391,669 |
| Net Assets consist of: | | |
| Paid in capital | | $64,792,930 |
| Undistributed net investment income | | 370,192 |
| Accumulated undistributed net realized gain (loss) on investments and foreign currency transactions | | (388,865) |
| Net unrealized appreciation (depreciation) on investments and assets and liabilities in foreign currencies | | 9,617,412 |
| Net Assets | | $74,391,669 |
| Initial Class: | | |
| Net Asset Value, offering price and redemption price per share ($14,198,666 ÷ 1,121,318 shares) | | $12.66 |
| Investor Class: | | |
| Net Asset Value, offering price and redemption price per share ($60,193,003 ÷ 4,783,598 shares) | | $12.58 |
See accompanying notes which are an integral part of the financial statements.
Statement of Operations
| | | Six months ended June 30, 2016 (Unaudited) |
| Investment Income | | |
| Dividends | | $582,635 |
| Income from Fidelity Central Funds | | 21,367 |
| Total income | | 604,002 |
| Expenses | | |
| Management fee | $131,173 | |
| Transfer agent fees | 31,513 | |
| Accounting and security lending fees | 9,585 | |
| Custodian fees and expenses | 14,740 | |
| Independent trustees' fees and expenses | 446 | |
| Audit | 22,540 | |
| Legal | 114 | |
| Miscellaneous | 140 | |
| Total expenses before reductions | 210,251 | |
| Expense reductions | (2,060) | 208,191 |
| Net investment income (loss) | | 395,811 |
| Realized and Unrealized Gain (Loss) | | |
| Net realized gain (loss) on: | | |
| Investment securities: | | |
| Unaffiliated issuers | (175,241) | |
| Foreign currency transactions | 572 | |
| Total net realized gain (loss) | | (174,669) |
Change in net unrealized appreciation (depreciation) on:
Investment securities | 7,472,340 | |
| Assets and liabilities in foreign currencies | (9) | |
| Total change in net unrealized appreciation (depreciation) | | 7,472,331 |
| Net gain (loss) | | 7,297,662 |
| Net increase (decrease) in net assets resulting from operations | | $7,693,473 |
See accompanying notes which are an integral part of the financial statements.
Statement of Changes in Net Assets
| | Six months ended June 30, 2016 (Unaudited) | Year ended December 31, 2015 |
| Increase (Decrease) in Net Assets | | |
| Operations | | |
| Net investment income (loss) | $395,811 | $312,537 |
| Net realized gain (loss) | (174,669) | 279,336 |
| Change in net unrealized appreciation (depreciation) | 7,472,331 | (372,405) |
| Net increase (decrease) in net assets resulting from operations | 7,693,473 | 219,468 |
| Distributions to shareholders from net investment income | – | (311,150) |
| Distributions to shareholders from net realized gain | (11,562) | (21,429) |
| Total distributions | (11,562) | (332,579) |
| Share transactions - net increase (decrease) | 38,793,863 | 8,141,341 |
| Redemption fees | (2,930) | 8,719 |
| Total increase (decrease) in net assets | 46,472,844 | 8,036,949 |
| Net Assets | | |
| Beginning of period | 27,918,825 | 19,881,876 |
| End of period | $74,391,669 | $27,918,825 |
| Other Information | | |
| Undistributed net investment income end of period | $370,192 | $– |
| Distributions in excess of net investment income end of period | $– | $(25,619) |
See accompanying notes which are an integral part of the financial statements.
Financial Highlights — VIP Telecommunications Portfolio Initial Class
| | Six months ended (Unaudited) June 30, | Years ended December 31, | | | | |
| | 2016 | 2015 | 2014 | 2013 | 2012 | 2011 |
| Selected Per–Share Data | | | | | | |
| Net asset value, beginning of period | $10.85 | $10.74 | $10.77 | $9.27 | $7.81 | $8.10 |
| Income from Investment Operations | | | | | | |
| Net investment income (loss)A | .10 | .15 | .36B | .17 | .17 | .13 |
| Net realized and unrealized gain (loss) | 1.71 | .10C | .03 | 1.77 | 1.41 | (.31) |
| Total from investment operations | 1.81 | .25 | .39 | 1.94 | 1.58 | (.18) |
| Distributions from net investment income | – | (.13)D | (.40) | (.15) | (.12) | (.12) |
| Distributions from net realized gain | –E | (.01)D | (.02) | (.30) | – | – |
| Total distributions | –E | (.14) | (.42) | (.45) | (.12) | (.12) |
| Redemption fees added to paid in capitalA | –E | –E | –E | .01 | –E | .01 |
| Net asset value, end of period | $12.66 | $10.85 | $10.74 | $10.77 | $9.27 | $7.81 |
| Total ReturnF,G,H | 16.73% | 2.34% | 3.59% | 21.28% | 20.24% | (2.00)% |
| Ratios to Average Net AssetsI,J | | | | | | |
| Expenses before reductions | .80%K | .88% | .96% | 1.02% | 1.11% | 1.18% |
| Expenses net of fee waivers, if any | .80%K | .88% | .95% | 1.00% | 1.00% | 1.00% |
| Expenses net of all reductions | .80%K | .87% | .93% | .99% | .99% | .98% |
| Net investment income (loss) | 1.70%K | 1.36% | 3.31%B | 1.64% | 1.94% | 1.58% |
| Supplemental Data | | | | | | |
| Net assets, end of period (000 omitted) | $14,199 | $4,839 | $3,723 | $4,535 | $6,823 | $3,062 |
| Portfolio turnover rateL | 69%K | 64% | 99% | 136% | 55% | 115% |
A Calculated based on average shares outstanding during the period.
B Net Investment income per share reflects a large, non-recurring dividend which amounted to $.21 per share. Excluding this non-recurring dividend, the ratio of net investment income (loss) to average net assets would have been 1.41%.
C The amount shown for a share outstanding does not correspond with the aggregate net gain (loss) on investments for the period due to the timing of sales and repurchases of shares in relation to fluctuating market values of the investments of the Fund.
D The amounts shown reflect certain reclassifications related to book to tax differences that were made in the year shown.
E Amount represents less than $.005 per share.
F Total returns for periods of less than one year are not annualized.
G Total returns do not reflect charges attributable to your insurance company's separate account. Inclusion of these charges would reduce the total returns shown.
H Total returns would have been lower if certain expenses had not been reduced during the applicable periods shown.
I Fees and expenses of any underlying Fidelity Central Funds are not included in the Fund's expense ratio. The Fund indirectly bears its proportionate share of the expenses of any underlying Fidelity Central Funds.
J Expense ratios reflect operating expenses of the class. Expenses before reductions do not reflect amounts reimbursed by the investment adviser or reductions from brokerage service arrangements or reductions from other expense offset arrangements and do not represent the amount paid by the class during periods when reimbursements or reductions occur. Expenses net of fee waivers reflect expenses after reimbursement by the investment adviser but prior to reductions from brokerage service arrangements or other expense offset arrangements. Expenses net of all reductions represent the net expenses paid by the class.
K Annualized
L Amount does not include the portfolio activity of any underlying Fidelity Central Funds.
See accompanying notes which are an integral part of the financial statements.
Financial Highlights — VIP Telecommunications Portfolio Investor Class
| | Six months ended (Unaudited) June 30, | Years ended December 31, | | | | |
| | 2016 | 2015 | 2014 | 2013 | 2012 | 2011 |
| Selected Per–Share Data | | | | | | |
| Net asset value, beginning of period | $10.79 | $10.67 | $10.71 | $9.22 | $7.78 | $8.07 |
| Income from Investment Operations | | | | | �� | |
| Net investment income (loss)A | .09 | .14 | .35B | .16 | .16 | .12 |
| Net realized and unrealized gain (loss) | 1.70 | .11C | .03 | 1.77 | 1.40 | (.30) |
| Total from investment operations | 1.79 | .25 | .38 | 1.93 | 1.56 | (.18) |
| Distributions from net investment income | – | (.12)D | (.40) | (.15) | (.12) | (.12) |
| Distributions from net realized gain | –E | (.01)D | (.02) | (.30) | – | – |
| Total distributions | –E | (.13) | (.42) | (.45) | (.12) | (.12) |
| Redemption fees added to paid in capitalA | –E | –E | –E | .01 | –E | .01 |
| Net asset value, end of period | $12.58 | $10.79 | $10.67 | $10.71 | $9.22 | $7.78 |
| Total ReturnF,G,H | 16.63% | 2.38% | 3.48% | 21.27% | 20.00% | (2.03)% |
| Ratios to Average Net AssetsI,J | | | | | | |
| Expenses before reductions | .88%K | .95% | 1.01% | 1.07% | 1.18% | 1.24% |
| Expenses net of fee waivers, if any | .88%K | .95% | .99% | 1.07% | 1.08% | 1.08% |
| Expenses net of all reductions | .88%K | .94% | .97% | 1.06% | 1.07% | 1.06% |
| Net investment income (loss) | 1.62%K | 1.29% | 3.27%B | 1.57% | 1.86% | 1.50% |
| Supplemental Data | | | | | | |
| Net assets, end of period (000 omitted) | $60,193 | $23,080 | $16,159 | $17,112 | $11,510 | $6,317 |
| Portfolio turnover rateL | 69%K | 64% | 99% | 136% | 55% | 115% |
A Calculated based on average shares outstanding during the period.
B Net Investment income per share reflects a large, non-recurring dividend which amounted to $.21 per share. Excluding this non-recurring dividend, the ratio of net investment income (loss) to average net assets would have been 1.37%.
C The amount shown for a share outstanding does not correspond with the aggregate net gain (loss) on investments for the period due to the timing of sales and repurchases of shares in relation to fluctuating market values of the investments of the Fund.
D The amounts shown reflect certain reclassifications related to book to tax differences that were made in the year shown.
E Amount represents less than $.005 per share.
F Total returns for periods of less than one year are not annualized.
G Total returns do not reflect charges attributable to your insurance company's separate account. Inclusion of these charges would reduce the total returns shown.
H Total returns would have been lower if certain expenses had not been reduced during the applicable periods shown.
I Fees and expenses of any underlying Fidelity Central Funds are not included in the Fund's expense ratio. The Fund indirectly bears its proportionate share of the expenses of any underlying Fidelity Central Funds.
J Expense ratios reflect operating expenses of the class. Expenses before reductions do not reflect amounts reimbursed by the investment adviser or reductions from brokerage service arrangements or reductions from other expense offset arrangements and do not represent the amount paid by the class during periods when reimbursements or reductions occur. Expenses net of fee waivers reflect expenses after reimbursement by the investment adviser but prior to reductions from brokerage service arrangements or other expense offset arrangements. Expenses net of all reductions represent the net expenses paid by the class.
K Annualized
L Amount does not include the portfolio activity of any underlying Fidelity Central Funds.
See accompanying notes which are an integral part of the financial statements.
Notes to Financial Statements (Unaudited)
For the period ended June 30, 2016
1. Organization.
VIP Telecommunications Portfolio (the Fund) is a non-diversified fund of Variable Insurance Products Fund IV (the Trust) and is authorized to issue an unlimited number of shares. The Trust is registered under the Investment Company Act of 1940, as amended (the 1940 Act), as an open-end management investment company organized as a Massachusetts business trust. Shares of the Fund may only be purchased by insurance companies for the purpose of funding variable annuity or variable life insurance contracts. The Fund offers the following classes of shares: Initial Class shares and Investor Class shares. All classes have equal rights and voting privileges, except for matters affecting a single class.
2. Investments in Fidelity Central Funds.
The Fund invests in Fidelity Central Funds, which are open-end investment companies generally available only to other investment companies and accounts managed by the investment adviser and its affiliates. The Fund's Schedule of Investments lists each of the Fidelity Central Funds held as of period end, if any, as an investment of the Fund, but does not include the underlying holdings of each Fidelity Central Fund. As an Investing Fund, the Fund indirectly bears its proportionate share of the expenses of the underlying Fidelity Central Funds.
The Money Market Central Funds seek preservation of capital and current income and are managed by Fidelity Investments Money Management, Inc. (FIMM), an affiliate of the investment adviser. Annualized expenses of the Money Market Central Funds as of their most recent shareholder report date are less than .005%.
A complete unaudited list of holdings for each Fidelity Central Fund is available upon request or at the Securities and Exchange Commission (the SEC) website at www.sec.gov. In addition, the financial statements of the Fidelity Central Funds are available on the SEC website or upon request.
3. Significant Accounting Policies.
The financial statements have been prepared in conformity with accounting principles generally accepted in the United States of America (GAAP), which require management to make certain estimates and assumptions at the date of the financial statements. Actual results could differ from those estimates. Subsequent events, if any, through the date that the financial statements were issued have been evaluated in the preparation of the financial statements. The following summarizes the significant accounting policies of the Fund:
Investment Valuation. Investments are valued as of 4:00 p.m. Eastern time on the last calendar day of the period. The Board of Trustees (the Board) has delegated the day to day responsibility for the valuation of the Fund's investments to the Fidelity Management & Research Company (FMR) Fair Value Committee (the Committee). In accordance with valuation policies and procedures approved by the Board, the Fund attempts to obtain prices from one or more third party pricing vendors or brokers to value its investments. When current market prices, quotations or currency exchange rates are not readily available or reliable, investments will be fair valued in good faith by the Committee, in accordance with procedures adopted by the Board. Factors used in determining fair value vary by investment type and may include market or investment specific events. The frequency with which these procedures are used cannot be predicted and they may be utilized to a significant extent. The Committee oversees the Fund's valuation policies and procedures and reports to the Board on the Committee's activities and fair value determinations. The Board monitors the appropriateness of the procedures used in valuing the Fund's investments and ratifies the fair value determinations of the Committee.
The Fund categorizes the inputs to valuation techniques used to value its investments into a disclosure hierarchy consisting of three levels as shown below:
- Level 1 – quoted prices in active markets for identical investments
- Level 2 – other significant observable inputs (including quoted prices for similar investments, interest rates, prepayment speeds, etc.)
- Level 3 – unobservable inputs (including the Fund's own assumptions based on the best information available)
Valuation techniques used to value the Fund's investments by major category are as follows:
Equity securities, including restricted securities, for which market quotations are readily available, are valued at the last reported sale price or official closing price as reported by a third party pricing vendor on the primary market or exchange on which they are traded and are categorized as Level 1 in the hierarchy. In the event there were no sales during the day or closing prices are not available, securities are valued at the last quoted bid price or may be valued using the last available price and are generally categorized as Level 2 in the hierarchy. For foreign equity securities, when market or security specific events arise, comparisons to the valuation of American Depositary Receipts (ADRs), futures contracts, Exchange-Traded Funds (ETFs) and certain indexes as well as quoted prices for similar securities may be used and would be categorized as Level 2 in the hierarchy. Utilizing these techniques may result in transfers between Level 1 and Level 2. For equity securities, including restricted securities, where observable inputs are limited, assumptions about market activity and risk are used and these securities may be categorized as Level 3 in the hierarchy.
Investments in open-end mutual funds, including the Fidelity Central Funds, are valued at their closing net asset value (NAV) each business day and are categorized as Level 1 in the hierarchy.
Changes in valuation techniques may result in transfers in or out of an assigned level within the disclosure hierarchy. The aggregate value of investments by input level as of June 30, 2016, is included at the end of the Fund's Schedule of Investments.
Foreign Currency. The Fund may use foreign currency contracts to facilitate transactions in foreign-denominated securities. Gains and losses from these transactions may arise from changes in the value of the foreign currency or if the counterparties do not perform under the contracts' terms.
Foreign-denominated assets, including investment securities, and liabilities are translated into U.S. dollars at the exchange rates at period end. Purchases and sales of investment securities, income and dividends received and expenses denominated in foreign currencies are translated into U.S. dollars at the exchange rate in effect on the transaction date.
The effects of exchange rate fluctuations on investments are included with the net realized and unrealized gain (loss) on investment securities. Other foreign currency transactions resulting in realized and unrealized gain (loss) are disclosed separately.
Investment Transactions and Income. For financial reporting purposes, the Fund's investment holdings and NAV include trades executed through the end of the last business day of the period. The NAV per share for processing shareholder transactions is calculated as of the close of business of the New York Stock Exchange (NYSE), normally 4:00 p.m. Eastern time and includes trades executed through the end of the prior business day. Gains and losses on securities sold are determined on the basis of identified cost. Dividend income is recorded on the ex-dividend date, except for certain dividends from foreign securities where the ex-dividend date may have passed, which are recorded as soon as the Fund is informed of the ex-dividend date. Non-cash dividends included in dividend income, if any, are recorded at the fair market value of the securities received. Income and capital gain distributions from Fidelity Central Funds, if any, are recorded on the ex-dividend date. Distributions received on securities that represent a return of capital or capital gain are recorded as a reduction of cost of investments and/or as a realized gain. Subsequent to ex-dividend date the Fund determines the components of these distributions, based upon receipt of tax filings or other correspondence relating to the underlying investment. Investment income is recorded net of foreign taxes withheld where recovery of such taxes is uncertain.
Class Allocations and Expenses. Investment income, realized and unrealized capital gains and losses, common expenses of the Fund, and certain fund-level expense reductions, if any, are allocated daily on a pro-rata basis to each class based on the relative net assets of each class to the total net assets of the Fund. Each class differs with respect to transfer agent fees incurred. Certain expense reductions may also differ by class. For the reporting period, the allocated portion of income and expenses to each class as a percent of its average net assets may vary due to the timing of recording these transactions in relation to fluctuating net assets of the classes. Expenses directly attributable to a fund are charged to that fund. Expenses attributable to more than one fund are allocated among the respective funds on the basis of relative net assets or other appropriate methods. Expense estimates are accrued in the period to which they relate and adjustments are made when actual amounts are known.
Income Tax Information and Distributions to Shareholders. Each year, the Fund intends to qualify as a regulated investment company under Subchapter M of the Internal Revenue Code, including distributing substantially all of its taxable income and realized gains. As a result, no provision for U.S. Federal income taxes is required. The Fund files a U.S. federal tax return, in addition to state and local tax returns as required. The Fund's federal income tax returns are subject to examination by the Internal Revenue Service (IRS) for a period of three fiscal years after they are filed. State and local tax returns may be subject to examination for an additional fiscal year depending on the jurisdiction. Foreign taxes are provided for based on the Fund's understanding of the tax rules and rates that exist in the foreign markets in which it invests.
Distributions are declared and recorded on the ex-dividend date. Income dividends and capital gain distributions are declared separately for each class. Income and capital gain distributions are determined in accordance with income tax regulations, which may differ from GAAP.
Capital accounts within the financial statements are adjusted for permanent book-tax differences. These adjustments have no impact on net assets or the results of operations. Capital accounts are not adjusted for temporary book-tax differences which will reverse in a subsequent period.
Book-tax differences are primarily due to foreign currency transactions, capital loss carryforwards, and losses deferred due to wash sales.
The federal tax cost of investment securities and unrealized appreciation (depreciation) as of period end were as follows:
| Gross unrealized appreciation | $10,503,122 |
| Gross unrealized depreciation | (1,251,073) |
| Net unrealized appreciation (depreciation) on securities | $9,252,049 |
| Tax cost | $69,558,836 |
The Fund intends to elect to defer to its next fiscal year approximately $25,776 of ordinary losses recognized during the period November 1, 2015 to December 31, 2015.
Trading (Redemption) Fees. Shares held by investors less than 60 days may be subject to a redemption fee equal to 1% of the NAV of shares redeemed. All redemption fees, which reduce the proceeds of the shareholder redemption, are retained by the Fund and accounted for as an addition to paid in capital.
4. Purchases and Sales of Investments.
Purchases and sales of securities, other than short-term securities, aggregated $52,983,639 and $16,391,897, respectively.
5. Fees and Other Transactions with Affiliates.
Management Fee. Fidelity SelectCo, LLC (the investment adviser) and its affiliates provide the Fund with investment management related services for which the Fund pays a monthly management fee. The management fee is the sum of an individual fund fee rate that is based on an annual rate of .30% of the Fund's average net assets and an annualized group fee rate that averaged .25% during the period. The group fee rate is based upon the average net assets of all the mutual funds advised by Fidelity Management & Research Company (FMR) and the investment adviser. The group fee rate decreases as assets under management increase and increases as assets under management decrease. For the reporting period, the total annualized management fee rate was .54% of the Fund's average net assets.
Transfer Agent Fees. Fidelity Investments Institutional Operations Company, Inc. (FIIOC), an affiliate of the investment adviser, is the Fund's transfer, dividend disbursing, and shareholder servicing agent. FIIOC receives an asset-based fee with respect to each class. Each class (with the exception of Investor Class) pays a fee for transfer agent services, typesetting and printing and mailing of shareholder reports, excluding mailing of proxy statements, equal to an annual rate of .07% (.15% for Investor Class) of class-level average net assets. For the period, transfer agent fees for each class, were as follows:
| Initial Class | $2,955 |
| Investor Class | 28,558 |
| | $31,513 |
Accounting and Security Lending Fees. Fidelity Service Company, Inc. (FSC), an affiliate of the investment adviser, maintains the Fund's accounting records. The accounting fee is based on the level of average net assets for each month. Under a separate contract, FSC administers the security lending program. The security lending fee is based on the number and duration of lending transactions.
Brokerage Commissions. The Fund placed a portion of its portfolio transactions with brokerage firms which are affiliates of the investment adviser. Brokerage commissions are included in net realized gain (loss) and change in net unrealized appreciation (depreciation) in the Statement of Operations. The commissions paid to these affiliated firms were $1,632 for the period.
Interfund Trades. The Fund may purchase from or sell securities to other Fidelity Funds under procedures adopted by the Board. The procedures have been designed to ensure these interfund trades are executed in accordance with Rule 17a-7 of the 1940 Act. Interfund trades are included within the respective purchases and sales amounts shown in the Purchases and Sales of Investments note.
6. Committed Line of Credit.
The Fund participates with other funds managed by the investment adviser or an affiliate in a $4.25 billion credit facility (the "line of credit") to be utilized for temporary or emergency purposes to fund shareholder redemptions or for other short-term liquidity purposes. The Fund has agreed to pay commitment fees on its pro-rata portion of the line of credit, which amounted to $25 and is reflected in Miscellaneous expenses on the Statement of Operations. During the period, the Fund did not borrow on this line of credit.
7. Security Lending.
The Fund lends portfolio securities through a lending agent from time to time in order to earn additional income. On the settlement date of the loan, the Fund receives collateral (in the form of U.S. Treasury obligations, letters of credit and/or cash) against the loaned securities and maintains collateral in an amount not less than 100% of the market value of the loaned securities during the period of the loan. The market value of the loaned securities is determined at the close of business of the Fund and any additional required collateral is delivered to the Fund on the next business day. The Fund or borrower may terminate the loan at any time, and if the borrower defaults on its obligation to return the securities loaned because of insolvency or other reasons, the Fund may apply collateral received from the borrower against the obligation. The Fund may experience delays and costs in recovering the securities loaned. Any cash collateral received is invested in the Fidelity Securities Lending Cash Central Fund. The value of loaned securities and cash collateral at period end are disclosed on the Fund's Statement of Assets and Liabilities. Security lending income represents the income earned on investing cash collateral, less rebates paid to borrowers and any lending agent fees associated with the loan, plus any premium payments received for lending certain types of securities. Security lending income is presented in the Statement of Operations as a component of income from Fidelity Central Funds. Total security lending income during the period amounted to $18,169.
8. Expense Reductions.
Commissions paid to certain brokers with whom the investment adviser, or its affiliates, places trades on behalf of the Fund include an amount in addition to trade execution, which may be rebated back to the Fund to offset certain expenses. This amount totaled $1,947 for the period. In addition, through arrangements with the Fund's custodian and each class' transfer agent, credits realized as a result of certain uninvested cash balances were used to reduce the Fund's expenses. During the period, these credits reduced the Fund's custody expenses by $15.
In addition, during the period the investment adviser reimbursed and/or waived a portion of fund-level operating expenses in the amount of $98.
9. Distributions to Shareholders.
Distributions to shareholders of each class were as follows:
| | Six months ended
June 30, 2016 | Year ended December 31, 2015 |
| From net investment income | | |
| Initial Class | $– | $55,523 |
| Investor Class | – | 255,627 |
| Total | $– | $311,150 |
| From net realized gain | | |
| Initial Class | $1,856 | $3,651 |
| Investor Class | 9,706 | 17,778 |
| Total | $11,562 | $21,429 |
10. Share Transactions.
Transactions for each class of shares were as follows:
| | Shares | Shares | Dollars | Dollars |
| | Six months ended
June 30, 2016 | Year ended December 31, 2015 | Six months ended
June 30, 2016 | Year ended December 31, 2015 |
| Initial Class | | | | |
| Shares sold | 793,590 | 219,127 | $9,374,012 | $2,438,121 |
| Reinvestment of distributions | 175 | 5,636 | 1,856 | 59,174 |
| Shares redeemed | (118,256) | (125,755) | (1,413,738) | (1,382,815) |
| Net increase (decrease) | 675,509 | 99,008 | $7,962,130 | $1,114,480 |
| Investor Class | | | | |
| Shares sold | 2,881,622 | 1,170,298 | $33,630,704 | $12,959,776 |
| Reinvestment of distributions | 921 | 26,188 | 9,706 | 273,405 |
| Shares redeemed | (237,846) | (571,453) | (2,808,677) | (6,206,320) |
| Net increase (decrease) | 2,644,697 | 625,033 | $30,831,733 | $7,026,861 |
11. Other.
The Fund's organizational documents provide former and current trustees and officers with a limited indemnification against liabilities arising in connection with the performance of their duties to the Fund. In the normal course of business, the Fund may also enter into contracts that provide general indemnifications. The Fund's maximum exposure under these arrangements is unknown as this would be dependent on future claims that may be made against the Fund. The risk of material loss from such claims is considered remote.
At the end of the period, the investment adviser or its affiliates were the owners of record of 100% of the total outstanding shares of the Fund.
Shareholder Expense Example
As a shareholder of the Fund, you incur two types of costs: (1) transaction costs, including redemption fees and (2) ongoing costs, including management fees and other Fund expenses. This Example is intended to help you understand your ongoing costs (in dollars) of investing in the Fund and to compare these costs with the ongoing costs of investing in other mutual funds.
The Example is based on an investment of $1,000 invested at the beginning of the period and held for the entire period (January 1, 2016 to June 30, 2016).
Actual Expenses
The first line of the accompanying table for each class of the Fund provides information about actual account values and actual expenses. You may use the information in this line, together with the amount you invested, to estimate the expenses that you paid over the period. Simply divide your account value by $1,000.00 (for example, an $8,600 account value divided by $1,000.00 = 8.6), then multiply the result by the number in the first line for a class of the Fund under the heading entitled "Expenses Paid During Period" to estimate the expenses you paid on your account during this period. The estimate of expenses does not include any fees or other expenses of any variable annuity or variable life insurance product. If they were, the estimate of expenses you paid during the period would be higher, and your ending account value would be lower. In addition, the Fund, as a shareholder in the underlying Fidelity Central Funds, will indirectly bear its pro-rata share of the fees and expenses incurred by the underlying Fidelity Central Funds. These fees and expenses are not included in the Fund's annualized expense ratio used to calculate the expense estimate in the table below.
Hypothetical Example for Comparison Purposes
The second line of the accompanying table for each class of the Fund provides information about hypothetical account values and hypothetical expenses based on a Class' actual expense ratio and an assumed rate of return of 5% per year before expenses, which is not the Class' actual return. The hypothetical account values and expenses may not be used to estimate the actual ending account balance or expenses you paid for the period. You may use this information to compare the ongoing costs of investing in the Fund and other funds. To do so, compare this 5% hypothetical example with the 5% hypothetical examples that appear in the shareholder reports of the other funds. The estimate of expenses does not include any fees or other expenses of any variable annuity or variable life insurance product. If they were, the estimate of expenses you paid during the period would be higher, and your ending account value would be lower. In addition, the Fund, as a shareholder in the underlying Fidelity Central Funds, will indirectly bear its pro-rata share of the fees and expenses incurred by the underlying Fidelity Central Funds. These fees and expenses are not included in the Fund's annualized expense ratio used to calculate the expense estimate in the table below.
Please note that the expenses shown in the table are meant to highlight your ongoing costs only and do not reflect any transaction costs. Therefore, the second line of the table is useful in comparing ongoing costs only, and will not help you determine the relative total costs of owning different funds. In addition, if these transactional costs were included, your costs would have been higher.
| | Annualized Expense Ratio-A | Beginning
Account Value
January 1, 2016 | Ending
Account Value
June 30, 2016 | Expenses Paid
During Period-B
January 1, 2016
to June 30, 2016 |
| Initial Class | .80% | | | |
| Actual | | $1,000.00 | $1,167.30 | $4.31 |
| Hypothetical-C | | $1,000.00 | $1,020.89 | $4.02 |
| Investor Class | .88% | | | |
| Actual | | $1,000.00 | $1,166.30 | $4.74 |
| Hypothetical-C | | $1,000.00 | $1,020.49 | $4.42 |
A Annualized expense ratio reflects expenses net of applicable fee waivers.
B Expenses are equal to each Class' annualized expense ratio, multiplied by the average account value over the period, multiplied by 182/366 (to reflect the one-half year period).
C 5% return per year before expenses
Board Approval of Investment Advisory Contracts and Management Fees
VIP Telecommunications Portfolio
Each year, the Board of Trustees, including the Independent Trustees (together, the Board), votes on the renewal of the management contract with Fidelity SelectCo, LLC (SelectCo), an affiliate of Fidelity Management & Research Company (FMR), and the sub-advisory agreements with affiliates of FMR (together, the Advisory Contracts) for the fund. The Board, assisted by the advice of fund counsel and Independent Trustees' counsel, requests and considers a broad range of information relevant to the renewal of the Advisory Contracts throughout the year.
The Board meets regularly and, at each of its meetings, covers an extensive agenda of topics and materials and considers factors that are relevant to its annual consideration of the renewal of the fund's Advisory Contracts, including the services and support provided to the fund and its shareholders. The Board has established four standing committees (Committees) — Operations, Audit, Fair Valuation, and Governance and Nominating — each composed of and chaired by Independent Trustees with varying backgrounds, to which the Board has assigned specific subject matter responsibilities in order to enhance effective decision-making by the Board. The Operations Committee, of which all of the Independent Trustees are members, meets regularly throughout the year and considers, among other matters, information specifically related to the annual consideration of the renewal of the fund's Advisory Contracts. The Board, acting directly and through its Committees, requests and receives information concerning the annual consideration of the renewal of the fund's Advisory Contracts. The Board also meets as needed to consider matters specifically related to the Board's annual consideration of the renewal of the Advisory Contracts. Members of the Board may also meet with trustees of other Fidelity funds through ad hoc joint committees to discuss certain matters relevant to all of the Fidelity funds.
At its January 2016 meeting, the Board unanimously determined to renew the fund's Advisory Contracts. In reaching its determination, the Board considered all factors it believed relevant, including (i) the nature, extent, and quality of the services to be provided to the fund and its shareholders (including the investment performance of the fund); (ii) the competitiveness of the fund's management fee and total expense ratio relative to peer funds; (iii) the total costs of the services to be provided by and the profits to be realized by Fidelity from its relationships with the fund; and (iv) the extent to which, if any, economies of scale exist and would be realized as the fund grows, and whether any economies of scale are appropriately shared with fund shareholders.
In considering whether to renew the Advisory Contracts for the fund, the Board reached a determination, with the assistance of fund counsel and Independent Trustees' counsel and through the exercise of its business judgment, that the renewal of the Advisory Contracts was in the best interests of the fund and its shareholders and that the compensation payable under the Advisory Contracts was fair and reasonable. The Board's decision to renew the Advisory Contracts was not based on any single factor, but rather was based on a comprehensive consideration of all the information provided to the Board at its meetings throughout the year. The Board, in reaching its determination to renew the Advisory Contracts, was aware that shareholders of the fund have a broad range of investment choices available to them, including a wide choice among funds offered by Fidelity's competitors, and that the fund's shareholders, who have the opportunity to review and weigh the disclosure provided by the fund in its prospectus and other public disclosures, have chosen to invest in this fund, which is part of the Fidelity family of funds.
Nature, Extent, and Quality of Services Provided. The Board considered the staffing of SelectCo and the sub-advisers (together with SelectCo, the Investment Advisers) as it relates to the fund, including the backgrounds of investment personnel of SelectCo, and also considered the fund's investment objective, strategies, and related investment philosophy. The Independent Trustees also had discussions with senior management of Fidelity's investment operations and investment groups. The Board considered the structure of the investment personnel compensation program and whether this structure provides appropriate incentives to act in the best interests of the fund. Additionally, the Board considered the portfolio managers' investments, if any, in the funds that they manage.
Resources Dedicated to Investment Management and Support Services. The Board reviewed the general qualifications and capabilities of the investment staff of the Investment Advisers, including their size, education, experience, and resources, as well as Fidelity's approach to recruiting, training, managing, and compensating investment personnel. The Board noted that Fidelity has continued to increase the resources devoted to non-U.S. offices, including expansion of Fidelity's global investment organization. The Board also noted that Fidelity's analysts have extensive resources, tools and capabilities that allow them to conduct sophisticated quantitative and fundamental analysis, as well as credit analysis of issuers, counterparties and guarantors. Further, the Board considered that Fidelity's investment professionals have sufficient access to global information and data so as to provide competitive investment results over time, and that those professionals also have access to sophisticated tools that permit them to assess portfolio construction and risk and performance attribution characteristics continuously, as well as to transmit new information and research conclusions rapidly around the world. Additionally, in its deliberations, the Board considered Fidelity's trading, risk management, compliance, and technology and operations capabilities and resources, which are integral parts of the investment management process.
Shareholder and Administrative Services. The Board considered (i) the nature, extent, quality, and cost of advisory, administrative, and shareholder services performed by the Investment Advisers and their affiliates under the Advisory Contracts and under separate agreements covering transfer agency, pricing and bookkeeping, and securities lending services for the fund; (ii) the nature and extent of the supervision of third party service providers, principally custodians, subcustodians, and pricing vendors; and (iii) the resources devoted to, and the record of compliance with, the fund's compliance policies and procedures. The Board also reviewed the allocation of fund brokerage, including allocations to brokers affiliated with the Investment Advisers, the use of brokerage commissions to pay fund expenses, and the use of "soft" commission dollars to pay for research services.
The Board noted that the growth of fund assets over time across the complex allows Fidelity to reinvest in the development of services designed to enhance the value or convenience of the Fidelity funds as investment vehicles. These services include 24-hour access to account information and market information through telephone representatives and over the Internet, investor education materials and asset allocation tools, and the expanded availability of Fidelity Investor Centers.
The Board noted that in 2014 the ad hoc Committee on Transfer Agency Fees was formed by it and the boards of certain other Fidelity funds to review the variety of transfer agency services and fee structures throughout the mutual fund industry compared to Fidelity's.
Investment in a Large Fund Family. The Board considered the benefits to shareholders of investing in a Fidelity fund, including the benefits of investing in a fund that is part of a large family of funds offering a variety of investment disciplines and providing a large variety of mutual fund investor services. The Board noted that Fidelity had taken, or had made recommendations that resulted in the Fidelity funds taking, a number of actions over the previous year that benefited particular funds, including (i) continuing to dedicate additional resources to investment research and to the support of the senior management team that oversees asset management; (ii) continuing efforts to enhance Fidelity's global research capabilities; (iii) launching new funds and making other enhancements to meet client needs; (iv) reducing management fees and total expenses for certain index funds; (v) continuing to launch dedicated lower cost underlying funds to meet portfolio construction needs related to expanding underlying fund options for Fidelity funds of funds, specifically for the Freedom Fund product lines; (vi) rationalizing product lines and gaining increased efficiencies through fund mergers; (vii) continuing to develop, acquire and implement systems and technology to improve services to the funds and shareholders, strengthen information security, and increase efficiency; (viii) implementing investment enhancements to further strengthen Fidelity's target date product line to increase investors' probability of success in achieving their goals; (ix) modifying the eligibility criteria for certain share classes to accommodate roll-over assets from employer-sponsored retirement plans; (x) launching a new Class W of the Freedom Index Funds to attract and retain Fidelity record-kept retirement plan assets; and (xi) implementing changes to Fidelity's money market fund product line in response to recent regulatory reforms.
Investment Performance. The Board considered whether the fund has operated in accordance with its investment objective, as well as its record of compliance with its investment restrictions and its performance history.
The Board took into account discussions with representatives of the Investment Advisers about fund investment performance that occur at Board meetings throughout the year. In this regard the Board noted that as part of regularly scheduled fund reviews and other reports to the Board on fund performance, the Board considers annualized return information for the fund, for different time periods, measured against a securities market index ("benchmark index"). In its evaluation of fund investment performance at meetings throughout the year, the Board gave particular attention to information indicating underperformance of certain Fidelity funds for specific time periods and discussed with the Investment Advisers the reasons for such underperformance.
In addition to reviewing absolute and relative fund performance, the Independent Trustees periodically consider the appropriateness of fund performance metrics in evaluating the results achieved. In general, the Independent Trustees believe that fund performance should be evaluated based on net performance (after fees and expenses) of both the highest performing and lowest performing fund share classes, where applicable, compared to appropriate benchmark indices, over appropriate time periods that may include full market cycles, taking into account relevant factors, including the following: general market conditions; issuer-specific information; and fund cash flows and other factors. Depending on the circumstances, the Independent Trustees may be satisfied with a fund's performance notwithstanding that it lags its benchmark index for certain periods.
The Independent Trustees recognize that shareholders evaluate performance on a net basis over their own holding periods, for which one-, three-, and five-year periods are often used as a proxy. For this reason, the performance information reviewed by the Board also included net cumulative total return information for the fund and an appropriate benchmark index for the most recent one-, three-, and five-year periods ended June 30, 2015.
Based on its review, the Board concluded that the nature, extent, and quality of services provided to the fund under the Advisory Contracts should benefit the shareholders of the fund.
Competitiveness of Management Fee and Total Expense Ratio. The Board considered the fund's management fee and total expense ratio compared to "mapped groups" of competitive funds and classes created for the purpose of facilitating the Trustees' analysis of the competitiveness of management fees and total expenses. Fidelity creates "mapped groups" by combining similar Lipper investment objective categories that have comparable investment mandates. For this purpose, all sector focused equity funds are grouped in the same mapped group. Combining Lipper investment objective categories aids the Board's management fee and total expense ratio comparisons by broadening the competitive group used for comparison.
Management Fee. The Board considered two proprietary management fee comparisons for the 12-month periods ended June 30 shown in basis points (BP) in the chart below. The group of Lipper funds used by the Board for management fee comparisons is referred to below as the "Total Mapped Group." The Total Mapped Group comparison focuses on a fund's standing in terms of gross management fees before expense reimbursements or caps relative to the total universe of funds with comparable investment mandates (
i.e., sector equities), regardless of whether their management fee structures also are comparable. Funds with comparable management fee structures have similar management fee contractual arrangements (
e.g., flat rate charged for advisory services, all-inclusive fee rate,
etc.). "TMG %" represents the percentage of funds in the Total Mapped Group that had management fees that were lower than the fund's. For example, a hypothetical TMG % of 20% would mean that 80% of the funds in the Total Mapped Group had higher, and 20% had lower, management fees than the fund. The fund's actual TMG %s and the number of funds in the Total Mapped Group are in the chart below. The "Asset-Size Peer Group" (ASPG) comparison focuses on a fund's standing relative to a subset of non-Fidelity funds within the Total Mapped Group that are similar in size and management fee structure. For example, if a fund is in the first quartile of the ASPG, the fund's management fee ranks in the least expensive or lowest 25% of funds in the ASPG. The ASPG represents at least 15% of the funds in the Total Mapped Group with comparable asset size and management fee structures, subject to a minimum of 50 funds (or all funds in the Total Mapped Group if fewer than 50). Additional information, such as the ASPG quartile in which the fund's management fee rate ranked, is also included in the chart and considered by the Board.
VIP Telecommunications Portfolio
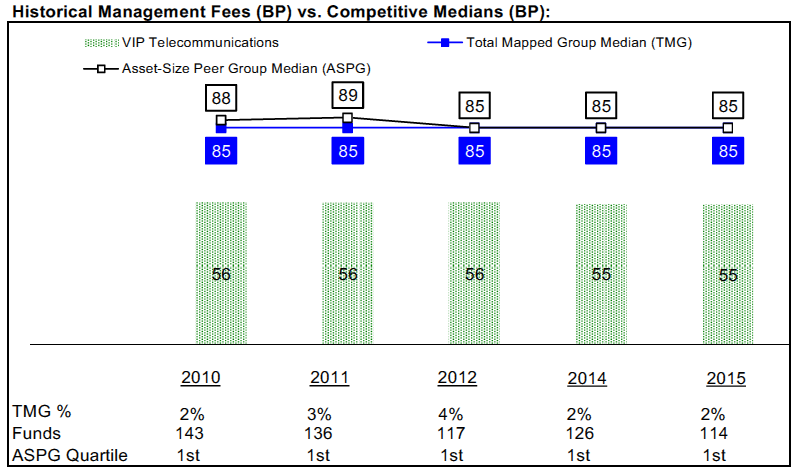
The Board noted that the fund's management fee rate ranked below the median of its Total Mapped Group and below the median of its ASPG for the 12-month period ended June 30, 2015.
The Board noted that, in 2014, the ad hoc Committee on Group Fee was formed by it and the boards of other Fidelity funds to conduct an in-depth review of the "group fee" component of the management fee of funds with such management fee structures. Committee focus included the mechanics of the group fee, the competitive landscape of group fee structures, Fidelity funds with no group fee component and investment products not included in group fee assets. The Board also considered that, for funds subject to the group fee, FMR agreed to voluntarily waive fees over a specified period of time in amounts designed to account for assets converted from certain funds to certain collective investment trusts.
Based on its review, the Board concluded that the fund's management fee is fair and reasonable in light of the services that the fund receives and the other factors considered.
Total Expense Ratio. In its review of each class's total expense ratio, the Board considered the fund's management fee rate as well as other fund or class expenses, as applicable, such as transfer agent fees, pricing and bookkeeping fees, and custodial, legal, and audit fees. The Board also noted that Fidelity may agree to waive fees and expenses from time to time, and the extent to which, if any, it has done so for the fund. As part of its review, the Board also considered the current and historical total expense ratios of each class of the fund compared to competitive fund median expenses. Each class of the fund is compared to those funds and classes in the Total Mapped Group (used by the Board for management fee comparisons) that have a similar sales load structure.
The Board noted that the total expense ratio of each class ranked below the competitive median for the 12-month period ended June 30, 2015.
Fees Charged to Other Fidelity Clients. The Board also considered Fidelity fee structures and other information with respect to clients of Fidelity, such as other funds advised or subadvised by Fidelity, pension plan clients, and other institutional clients with similar mandates. The Board noted the findings of the 2013 ad hoc joint committee (created with the boards of other Fidelity funds), which reviewed and compared Fidelity's institutional investment advisory business with its business of providing services to the Fidelity funds, including the differences in services provided, fees charged, and costs incurred, as well as competition in their respective marketplaces.
Based on its review of total expense ratios and fees charged to other Fidelity clients, the Board concluded that the total expense ratio of each class of the fund was reasonable in light of the services that the fund and its shareholders receive and the other factors considered.
Costs of the Services and Profitability. The Board considered the revenues earned and the expenses incurred by Fidelity in conducting the business of developing, marketing, distributing, managing, administering and servicing the fund and servicing the fund's shareholders. The Board also considered the level of Fidelity's profits in respect of all the Fidelity funds.
On an annual basis, Fidelity presents to the Board information about the profitability of its relationship with the fund. Fidelity calculates profitability information for each fund, as well as aggregate profitability information for groups of Fidelity funds and all Fidelity funds, using a series of detailed revenue and cost allocation methodologies which originate with the books and records of Fidelity on which Fidelity's audited financial statements are based. The Audit Committee of the Board reviews any significant changes from the prior year's methodologies.
PricewaterhouseCoopers LLP (PwC), independent registered public accounting firm and auditor to Fidelity and certain Fidelity funds, has been engaged annually by the Board as part of the Board's assessment of the profitability analysis used by Fidelity. PwC's engagement includes the review and assessment of Fidelity's methodologies used in determining the revenues and expenses attributable to Fidelity's mutual fund business, and completion of agreed-upon procedures in respect of the mathematical accuracy of fund profitability and its conformity to established allocation methodologies. After considering PwC's reports issued under the engagement and information provided by Fidelity, the Board concluded that while other allocation methods may also be reasonable, Fidelity's profitability methodologies are reasonable in all material respects.
The Board also reviewed Fidelity's non-fund businesses and fall-out benefits related to the mutual fund business as well as cases where Fidelity's affiliates may benefit from or be related to the fund's business.
The Board considered the costs of the services provided by and the profits realized by Fidelity in connection with the operation of the fund and was satisfied that the profitability was not excessive.
Economies of Scale. The Board considered whether there have been economies of scale in respect of the management of the Fidelity funds, whether the Fidelity funds (including the fund) have appropriately benefited from any such economies of scale, and whether there is potential for realization of any further economies of scale. The Board considered the extent to which the fund will benefit from economies of scale as assets grow through increased services to the fund, through waivers or reimbursements, or through fee or expense ratio reductions. The Board also noted that in 2013, it and the boards of other Fidelity funds created an ad hoc committee (the Economies of Scale Committee) to analyze whether Fidelity attains economies of scale in respect of the management and servicing of the Fidelity funds, whether the Fidelity funds have appropriately benefited from such economies of scale, and whether there is potential for realization of any further economies of scale.
The Board recognized that the fund's management contract incorporates a "group fee" structure, which provides for lower group fee rates as total group assets increase, and for higher group fee rates as total group assets decrease (with "group assets" defined to include fund assets under SelectCo's management plus assets under FMR's management). SelectCo calculates the group fee rates based on a tiered asset "breakpoint" schedule that varies based on asset class. The Board considered that the group fee is designed to deliver the benefits of economies of scale to fund shareholders when total group assets increase, even if assets of any particular fund are unchanged or have declined, because some portion of Fidelity's costs are attributable to services provided to all Fidelity funds, and all funds benefit if those costs can be allocated among more assets. The Board concluded that, given the group fee structure, fund shareholders will benefit from lower management fees as group assets increase at the fund complex level, regardless of whether Fidelity achieves any such economies of scale.
The Board concluded, taking into account the analysis of the Economies of Scale Committee, that economies of scale, if any, are being appropriately shared between fund shareholders and Fidelity.
Additional Information Requested by the Board. In order to develop fully the factual basis for consideration of the Fidelity funds' Advisory Contracts, the Board requested and received additional information on certain topics, including: (i) Fidelity's fund profitability methodology, profitability trends for certain funds, and the impact of certain factors on fund profitability results; (ii) portfolio manager changes that have occurred during the past year and the amount of the investment that each portfolio manager has made in the Fidelity fund(s) that he or she manages; (iii) Fidelity's compensation structure for portfolio managers, research analysts, and other key personnel, including its effects on fund profitability; (iv) the arrangements with and compensation paid to certain fund sub-advisers on behalf of the Fidelity funds; (v) Fidelity's long-term expectations for its offerings in the workplace investing channel; (vi) the methodology with respect to competitive fund data and peer group classifications; (vii) Fidelity's transfer agent fee, expense, and service structures for different funds and classes, and the impact of outsourcing, the increased use of omnibus accounts, and lower pricing in the retirement channel; and (viii) explanations regarding the relative total expense ratios of certain funds and classes, total expense competitive trends and methodologies for total expense competitive comparisons, and actions that might be taken by Fidelity to reduce total expense ratios for certain funds and classes or to achieve further economies of scale.
Based on its evaluation of all of the conclusions noted above, and after considering all factors it believed relevant, the Board concluded that the advisory fee structures are fair and reasonable, and that the fund's Advisory Contracts should be renewed.
VTELP-SANN-0816
1.851007.109
Fidelity® Variable Insurance Products: Utilities Portfolio
Semi-Annual Report June 30, 2016 |
|
Contents
To view a fund's proxy voting guidelines and proxy voting record for the 12-month period ended June 30, visit http://www.fidelity.com/proxyvotingresults or visit the Securities and Exchange Commission's (SEC) web site at http://www.sec.gov.
You may also call 1-877-208-0098 to request a free copy of the proxy voting guidelines.
Fidelity® Variable Insurance Products are separate account options which are purchased through a variable insurance contract.
Standard & Poor's, S&P and S&P 500 are registered service marks of The McGraw-Hill Companies, Inc. and have been licensed for use by Fidelity Distributors Corporation.
Other third-party marks appearing herein are the property of their respective owners.
All other marks appearing herein are registered or unregistered trademarks or service marks of FMR LLC or an affiliated company. © 2016 FMR LLC. All rights reserved.
This report and the financial statements contained herein are submitted for the general information of the shareholders of the Fund. This report is not authorized for distribution to prospective investors in the Fund unless preceded or accompanied by an effective prospectus.
A fund files its complete schedule of portfolio holdings with the SEC for the first and third quarters of each fiscal year on Form N-Q. Forms N-Q are available on the SEC’s web site at http://www.sec.gov. A fund's Forms N-Q may be reviewed and copied at the SEC’s Public Reference Room in Washington, DC. Information regarding the operation of the SEC's Public Reference Room may be obtained by calling 1-800-SEC-0330.
For a complete list of a fund's portfolio holdings, view the most recent holdings listing, semiannual report, or annual report on Fidelity's web site at http://www.fidelity.com, http://www.institutional.fidelity.com, or http://www.401k.com, as applicable.
NOT FDIC INSURED •MAY LOSE VALUE •NO BANK GUARANTEE
Neither the Fund nor Fidelity Distributors Corporation is a bank.
Investment Summary (Unaudited)
Top Ten Stocks as of June 30, 2016
| | % of fund's net assets | % of fund's net assets 6 months ago |
| NextEra Energy, Inc. | 14.4 | 17.1 |
| Sempra Energy | 11.0 | 9.7 |
| Dominion Resources, Inc. | 9.1 | 8.7 |
| PG&E Corp. | 7.7 | 4.8 |
| Avangrid, Inc. | 5.2 | 3.6 |
| Exelon Corp. | 5.0 | 11.7 |
| DTE Energy Co. | 4.7 | 4.0 |
| PPL Corp. | 3.5 | 4.8 |
| FirstEnergy Corp. | 3.4 | 3.4 |
| Edison International | 3.2 | 4.3 |
| | 67.2 | |
Top Industries (% of fund's net assets)
| As of June 30, 2016 |
| | Electric Utilities | 47.0% |
| | Multi-Utilities | 39.3% |
| | Independent Power and Renewable Electricity Producers | 7.4% |
| | Gas Utilities | 0.9% |
| | Oil, Gas & Consumable Fuels | 0.5% |
| | All Others* | 4.9% |

* Includes Short-Term investments and Net Other Assets (Liabilities).
| As of December 31, 2015 |
| | Electric Utilities | 46.7% |
| | Multi-Utilities | 33.6% |
| | Independent Power and Renewable Electricity Producers | 12.1% |
| | Media | 3.5% |
| | Real Estate Investment Trusts | 2.0% |
| | All Others* | 2.1% |

* Includes Short-Term investments and Net Other Assets (Liabilities).
Investments June 30, 2016 (Unaudited)
Showing Percentage of Net Assets
| Common Stocks - 95.1% | | | |
| | | Shares | Value |
| Electric Utilities - 47.0% | | | |
| Electric Utilities - 47.0% | | | |
| American Electric Power Co., Inc. | | 55,960 | $3,922,236 |
| Edison International | | 61,877 | 4,805,987 |
| Emera, Inc. | | 24,600 | 925,773 |
| Exelon Corp. | | 201,471 | 7,325,486 |
| FirstEnergy Corp. | | 143,823 | 5,020,861 |
| ITC Holdings Corp. | | 75,300 | 3,525,546 |
| NextEra Energy, Inc. | | 163,631 | 21,337,480 |
| OGE Energy Corp. | | 54,226 | 1,775,902 |
| PG&E Corp. | | 178,147 | 11,387,156 |
| PNM Resources, Inc. | | 78,000 | 2,764,320 |
| PPL Corp. | | 136,310 | 5,145,703 |
| Westar Energy, Inc. | | 25,500 | 1,430,295 |
| | | | 69,366,745 |
| Gas Utilities - 0.9% | | | |
| Gas Utilities - 0.9% | | | |
| South Jersey Industries, Inc. | | 42,900 | 1,356,498 |
| Independent Power and Renewable Electricity Producers - 7.4% | | | |
| Independent Power Producers & Energy Traders - 4.9% | | | |
| Calpine Corp. (a) | | 306,534 | 4,521,377 |
| Dynegy, Inc. (a) | | 96,439 | 1,662,608 |
| NRG Yield, Inc. Class C | | 26,499 | 413,119 |
| The AES Corp. | | 48,900 | 610,272 |
| | | | 7,207,376 |
| Renewable Electricity - 2.5% | | | |
| NextEra Energy Partners LP | | 79,716 | 2,421,772 |
| Pattern Energy Group, Inc. (b) | | 55,874 | 1,283,426 |
| | | | 3,705,198 |
|
| TOTAL INDEPENDENT POWER AND RENEWABLE ELECTRICITY PRODUCERS | | | 10,912,574 |
|
| Multi-Utilities - 39.3% | | | |
| Multi-Utilities - 39.3% | | | |
| Ameren Corp. | | 27,400 | 1,468,092 |
| Avangrid, Inc. | | 165,800 | 7,636,748 |
| Black Hills Corp. | | 53,115 | 3,348,370 |
| CenterPoint Energy, Inc. | | 113,614 | 2,726,736 |
| Dominion Resources, Inc. | | 172,235 | 13,422,274 |
| DTE Energy Co. | | 69,711 | 6,909,754 |
| NiSource, Inc. | | 91,628 | 2,429,975 |
| SCANA Corp. | | 50,572 | 3,826,278 |
| Sempra Energy | | 142,181 | 16,211,478 |
| | | | 57,979,705 |
| Oil, Gas & Consumable Fuels - 0.5% | | | |
| Oil & Gas Storage & Transport - 0.5% | | | |
| Cheniere Energy Partners LP Holdings LLC | | 41,900 | 835,067 |
| TOTAL COMMON STOCKS | | | |
| (Cost $114,255,630) | | | 140,450,589 |
|
| Money Market Funds - 5.9% | | | |
| Fidelity Cash Central Fund, 0.43% (c) | | 7,554,435 | 7,554,435 |
| Fidelity Securities Lending Cash Central Fund, 0.46% (c)(d) | | 1,179,900 | 1,179,900 |
| TOTAL MONEY MARKET FUNDS | | | |
| (Cost $8,734,335) | | | 8,734,335 |
| TOTAL INVESTMENT PORTFOLIO - 101.0% | | | |
| (Cost $122,989,965) | | | 149,184,924 |
| NET OTHER ASSETS (LIABILITIES) - (1.0)% | | | (1,540,373) |
| NET ASSETS - 100% | | | $147,644,551 |
Legend
(a) Non-income producing
(b) Security or a portion of the security is on loan at period end.
(c) Affiliated fund that is generally available only to investment companies and other accounts managed by Fidelity Investments. The rate quoted is the annualized seven-day yield of the fund at period end. A complete unaudited listing of the fund's holdings as of its most recent quarter end is available upon request. In addition, each Fidelity Central Fund's financial statements are available on the SEC's website or upon request.
(d) Investment made with cash collateral received from securities on loan.
Affiliated Central Funds
Information regarding fiscal year to date income earned by the Fund from investments in Fidelity Central Funds is as follows:
| Fund | Income earned |
| Fidelity Cash Central Fund | $11,924 |
| Fidelity Securities Lending Cash Central Fund | 3,685 |
| Total | $15,609 |
Investment Valuation
All investments are categorized as Level 1 under the Fair Value Hierarchy. The inputs or methodology used for valuing securities may not be an indication of the risk associated with investing in those securities. For more information on valuation inputs please refer to the Investment Valuation section in the accompanying Notes to Financial Statements.
See accompanying notes which are an integral part of the financial statements.
Financial Statements
Statement of Assets and Liabilities
| | | June 30, 2016 (Unaudited) |
| Assets | | |
Investment in securities, at value (including securities loaned of $1,178,361) — See accompanying schedule:
Unaffiliated issuers (cost $114,255,630) | $140,450,589 | |
| Fidelity Central Funds (cost $8,734,335) | 8,734,335 | |
| Total Investments (cost $122,989,965) | | $149,184,924 |
| Foreign currency held at value (cost $296,078) | | 296,078 |
| Receivable for investments sold | | 587,700 |
| Receivable for fund shares sold | | 306,539 |
| Dividends receivable | | 436,691 |
| Distributions receivable from Fidelity Central Funds | | 3,252 |
| Prepaid expenses | | 61 |
| Other receivables | | 2,201 |
| Total assets | | 150,817,446 |
| Liabilities | | |
| Payable for investments purchased | $1,888,678 | |
| Payable for fund shares redeemed | 55 | |
| Accrued management fee | 63,162 | |
| Other affiliated payables | 18,990 | |
| Other payables and accrued expenses | 22,110 | |
| Collateral on securities loaned, at value | 1,179,900 | |
| Total liabilities | | 3,172,895 |
| Net Assets | | $147,644,551 |
| Net Assets consist of: | | |
| Paid in capital | | $121,771,692 |
| Undistributed net investment income | | 1,247,087 |
| Accumulated undistributed net realized gain (loss) on investments and foreign currency transactions | | (1,566,528) |
| Net unrealized appreciation (depreciation) on investments and assets and liabilities in foreign currencies | | 26,192,300 |
| Net Assets | | $147,644,551 |
| Initial Class: | | |
| Net Asset Value, offering price and redemption price per share ($38,673,149 ÷ 2,463,677 shares) | | $15.70 |
| Investor Class: | | |
| Net Asset Value, offering price and redemption price per share ($108,971,402 ÷ 6,979,968 shares) | | $15.61 |
See accompanying notes which are an integral part of the financial statements.
Statement of Operations
| | | Six months ended June 30, 2016 (Unaudited) |
| Investment Income | | |
| Dividends | | $1,652,014 |
| Income from Fidelity Central Funds | | 15,609 |
| Total income | | 1,667,623 |
| Expenses | | |
| Management fee | $306,511 | |
| Transfer agent fees | 69,784 | |
| Accounting and security lending fees | 21,869 | |
| Custodian fees and expenses | 5,394 | |
| Independent trustees' fees and expenses | 1,116 | |
| Audit | 19,979 | |
| Legal | 343 | |
| Miscellaneous | 473 | |
| Total expenses before reductions | 425,469 | |
| Expense reductions | (4,933) | 420,536 |
| Net investment income (loss) | | 1,247,087 |
| Realized and Unrealized Gain (Loss) | | |
| Net realized gain (loss) on: | | |
| Investment securities: | | |
| Unaffiliated issuers | (714,094) | |
| Foreign currency transactions | 175 | |
| Total net realized gain (loss) | | (713,919) |
Change in net unrealized appreciation (depreciation) on:
Investment securities | 21,736,126 | |
| Assets and liabilities in foreign currencies | (2,557) | |
| Total change in net unrealized appreciation (depreciation) | | 21,733,569 |
| Net gain (loss) | | 21,019,650 |
| Net increase (decrease) in net assets resulting from operations | | $22,266,737 |
See accompanying notes which are an integral part of the financial statements.
Statement of Changes in Net Assets
| | Six months ended June 30, 2016 (Unaudited) | Year ended December 31, 2015 |
| Increase (Decrease) in Net Assets | | |
| Operations | | |
| Net investment income (loss) | $1,247,087 | $2,111,168 |
| Net realized gain (loss) | (713,919) | 1,363,662 |
| Change in net unrealized appreciation (depreciation) | 21,733,569 | (15,607,631) |
| Net increase (decrease) in net assets resulting from operations | 22,266,737 | (12,132,801) |
| Distributions to shareholders from net investment income | – | (1,900,414) |
| Distributions to shareholders from net realized gain | (1,735,380) | (3,942,558) |
| Total distributions | (1,735,380) | (5,842,972) |
| Share transactions - net increase (decrease) | 47,492,503 | (35,269,674) |
| Redemption fees | 16,530 | 33,598 |
| Total increase (decrease) in net assets | 68,040,390 | (53,211,849) |
| Net Assets | | |
| Beginning of period | 79,604,161 | 132,816,010 |
| End of period | $147,644,551 | $79,604,161 |
| Other Information | | |
| Undistributed net investment income end of period | $1,247,087 | $– |
See accompanying notes which are an integral part of the financial statements.
Financial Highlights — VIP Utilities Portfolio Initial Class
| | Six months ended (Unaudited) June 30, | Years ended December 31, | | | | |
| | 2016 | 2015 | 2014 | 2013 | 2012 | 2011 |
| Selected Per–Share Data | | | | | | |
| Net asset value, beginning of period | $13.17 | $15.62 | $13.45 | $11.41 | $10.93 | $9.84 |
| Income from Investment Operations | | | | | | |
| Net investment income (loss)A | .16 | .31 | .31 | .32 | .29 | .28 |
| Net realized and unrealized gain (loss) | 2.62 | (1.98) | 2.63 | 2.06 | .51 | 1.01 |
| Total from investment operations | 2.78 | (1.67) | 2.94 | 2.38 | .80 | 1.29 |
| Distributions from net investment income | – | (.33)B | (.27) | (.35) | (.32) | (.20) |
| Distributions from net realized gain | (.25) | (.45)B | (.51) | – | (.01) | – |
| Total distributions | (.25) | (.78) | (.77)C | (.35) | (.33) | (.20) |
| Redemption fees added to paid in capitalA | –D | –D | –D | .01 | .01 | –D |
| Net asset value, end of period | $15.70 | $13.17 | $15.62 | $13.45 | $11.41 | $10.93 |
| Total ReturnE,F,G | 21.50% | (10.78)% | 21.77% | 21.02% | 7.40% | 13.20% |
| Ratios to Average Net AssetsH,I | | | | | | |
| Expenses before reductions | .70%J | .71% | .70% | .74% | .74% | .80% |
| Expenses net of fee waivers, if any | .70%J | .71% | .70% | .73% | .74% | .79% |
| Expenses net of all reductions | .69%J | .70% | .69% | .71% | .71% | .77% |
| Net investment income (loss) | 2.28%J | 2.17% | 2.01% | 2.44% | 2.59% | 2.72% |
| Supplemental Data | | | | | | |
| Net assets, end of period (000 omitted) | $38,673 | $21,960 | $36,599 | $25,824 | $25,947 | $28,859 |
| Portfolio turnover rateK | 81%J | 88% | 113% | 156% | 181% | 174% |
A Calculated based on average shares outstanding during the period.
B The amounts shown reflect certain reclassifications related to book to tax differences that were made in the year shown.
C Total distributions of $.77 per share is comprised of distributions from net investment income of $.267 and distributions from net realized gain of $.506 per share.
D Amount represents less than $.005 per share.
E Total returns for periods of less than one year are not annualized.
F Total returns do not reflect charges attributable to your insurance company's separate account. Inclusion of these charges would reduce the total returns shown.
G Total returns would have been lower if certain expenses had not been reduced during the applicable periods shown.
H Fees and expenses of any underlying Fidelity Central Funds are not included in the Fund's expense ratio. The Fund indirectly bears its proportionate share of the expenses of any underlying Fidelity Central Funds.
I Expense ratios reflect operating expenses of the class. Expenses before reductions do not reflect amounts reimbursed by the investment adviser or reductions from brokerage service arrangements or reductions from other expense offset arrangements and do not represent the amount paid by the class during periods when reimbursements or reductions occur. Expenses net of fee waivers reflect expenses after reimbursement by the investment adviser but prior to reductions from brokerage service arrangements or other expense offset arrangements. Expenses net of all reductions represent the net expenses paid by the class.
J Annualized
K Amount does not include the portfolio activity of any underlying Fidelity Central Funds.
See accompanying notes which are an integral part of the financial statements.
Financial Highlights — VIP Utilities Portfolio Investor Class
| | Six months ended (Unaudited) June 30, | Years ended December 31, | | | | |
| | 2016 | 2015 | 2014 | 2013 | 2012 | 2011 |
| Selected Per–Share Data | | | | | | |
| Net asset value, beginning of period | $13.11 | $15.54 | $13.39 | $11.36 | $10.88 | $9.80 |
| Income from Investment Operations | | | | | | |
| Net investment income (loss)A | .16 | .30 | .29 | .30 | .28 | .27 |
| Net realized and unrealized gain (loss) | 2.59 | (1.96) | 2.62 | 2.06 | .51 | 1.01 |
| Total from investment operations | 2.75 | (1.66) | 2.91 | 2.36 | .79 | 1.28 |
| Distributions from net investment income | – | (.31)B | (.26) | (.34) | (.31) | (.20) |
| Distributions from net realized gain | (.25) | (.45)B | (.51) | – | (.01) | – |
| Total distributions | (.25) | (.77)C | (.76)D | (.34) | (.32) | (.20) |
| Redemption fees added to paid in capitalA | –E | –E | –E | .01 | .01 | –E |
| Net asset value, end of period | $15.61 | $13.11 | $15.54 | $13.39 | $11.36 | $10.88 |
| Total ReturnF,G,H | 21.37% | (10.80)% | 21.64% | 20.92% | 7.36% | 13.11% |
| Ratios to Average Net AssetsI,J | | | | | | |
| Expenses before reductions | .78%K | .79% | .78% | .82% | .82% | .88% |
| Expenses net of fee waivers, if any | .78%K | .79% | .78% | .81% | .82% | .88% |
| Expenses net of all reductions | .77%K | .78% | .77% | .79% | .79% | .85% |
| Net investment income (loss) | 2.19%K | 2.09% | 1.93% | 2.36% | 2.50% | 2.64% |
| Supplemental Data | | | | | | |
| Net assets, end of period (000 omitted) | $108,971 | $57,645 | $96,217 | $51,308 | $42,271 | $46,960 |
| Portfolio turnover rateL | 81%K | 88% | 113% | 156% | 181% | 174% |
A Calculated based on average shares outstanding during the period.
B The amounts shown reflect certain reclassifications related to book to tax differences that were made in the year shown.
C Total distributions of $.77 per share is comprised of distributions from net investment income of $.314 and distributions from net realized gain of $.454 per share.
D Total distributions of $.76 per share is comprised of distributions from net investment income of $.257 and distributions from net realized gain of $.506 per share.
E Amount represents less than $.005 per share.
F Total returns for periods of less than one year are not annualized.
G Total returns do not reflect charges attributable to your insurance company's separate account. Inclusion of these charges would reduce the total returns shown.
H Total returns would have been lower if certain expenses had not been reduced during the applicable periods shown.
I Fees and expenses of any underlying Fidelity Central Funds are not included in the Fund's expense ratio. The Fund indirectly bears its proportionate share of the expenses of any underlying Fidelity Central Funds.
J Expense ratios reflect operating expenses of the class. Expenses before reductions do not reflect amounts reimbursed by the investment adviser or reductions from brokerage service arrangements or reductions from other expense offset arrangements and do not represent the amount paid by the class during periods when reimbursements or reductions occur. Expenses net of fee waivers reflect expenses after reimbursement by the investment adviser but prior to reductions from brokerage service arrangements or other expense offset arrangements. Expenses net of all reductions represent the net expenses paid by the class.
K Annualized
L Amount does not include the portfolio activity of any underlying Fidelity Central Funds.
See accompanying notes which are an integral part of the financial statements.
Notes to Financial Statements (Unaudited)
For the period ended June 30, 2016
1. Organization.
VIP Utilities Portfolio (the Fund) is a non-diversified fund of Variable Insurance Products Fund IV (the Trust) and is authorized to issue an unlimited number of shares. The Trust is registered under the Investment Company Act of 1940, as amended (the 1940 Act), as an open-end management investment company organized as a Massachusetts business trust. Shares of the Fund may only be purchased by insurance companies for the purpose of funding variable annuity or variable life insurance contracts. The Fund offers the following classes of shares: Initial Class shares and Investor Class shares. All classes have equal rights and voting privileges, except for matters affecting a single class.
2. Investments in Fidelity Central Funds.
The Fund invests in Fidelity Central Funds, which are open-end investment companies generally available only to other investment companies and accounts managed by the investment adviser and its affiliates. The Fund's Schedule of Investments lists each of the Fidelity Central Funds held as of period end, if any, as an investment of the Fund, but does not include the underlying holdings of each Fidelity Central Fund. As an Investing Fund, the Fund indirectly bears its proportionate share of the expenses of the underlying Fidelity Central Funds.
The Money Market Central Funds seek preservation of capital and current income and are managed by Fidelity Investments Money Management, Inc. (FIMM), an affiliate of the investment adviser. Annualized expenses of the Money Market Central Funds as of their most recent shareholder report date are less than .005%.
A complete unaudited list of holdings for each Fidelity Central Fund is available upon request or at the Securities and Exchange Commission (the SEC) website at www.sec.gov. In addition, the financial statements of the Fidelity Central Funds are available on the SEC website or upon request.
3. Significant Accounting Policies.
The financial statements have been prepared in conformity with accounting principles generally accepted in the United States of America (GAAP), which require management to make certain estimates and assumptions at the date of the financial statements. Actual results could differ from those estimates. Subsequent events, if any, through the date that the financial statements were issued have been evaluated in the preparation of the financial statements. The following summarizes the significant accounting policies of the Fund:
Investment Valuation. Investments are valued as of 4:00 p.m. Eastern time on the last calendar day of the period. The Board of Trustees (the Board) has delegated the day to day responsibility for the valuation of the Fund's investments to the Fidelity SelectCo, LLC (SelectCo) Fair Value Committee (the Committee). In accordance with valuation policies and procedures approved by the Board, the Fund attempts to obtain prices from one or more third party pricing vendors or brokers to value its investments. When current market prices, quotations or currency exchange rates are not readily available or reliable, investments will be fair valued in good faith by the Committee, in accordance with procedures adopted by the Board. Factors used in determining fair value vary by investment type and may include market or investment specific events. The frequency with which these procedures are used cannot be predicted and they may be utilized to a significant extent. The Committee oversees the Fund's valuation policies and procedures and reports to the Board on the Committee's activities and fair value determinations. The Board monitors the appropriateness of the procedures used in valuing the Fund's investments and ratifies the fair value determinations of the Committee.
The Fund categorizes the inputs to valuation techniques used to value its investments into a disclosure hierarchy consisting of three levels as shown below:
- Level 1 – quoted prices in active markets for identical investments
- Level 2 – other significant observable inputs (including quoted prices for similar investments, interest rates, prepayment speeds, etc.)
- Level 3 – unobservable inputs (including the Fund's own assumptions based on the best information available)
Valuation techniques used to value the Fund's investments by major category are as follows:
Equity securities, including restricted securities, for which market quotations are readily available, are valued at the last reported sale price or official closing price as reported by a third party pricing vendor on the primary market or exchange on which they are traded and are categorized as Level 1 in the hierarchy. In the event there were no sales during the day or closing prices are not available, securities are valued at the last quoted bid price or may be valued using the last available price and are generally categorized as Level 2 in the hierarchy. For foreign equity securities, when market or security specific events arise, comparisons to the valuation of American Depositary Receipts (ADRs), futures contracts, Exchange-Traded Funds (ETFs) and certain indexes as well as quoted prices for similar securities may be used and would be categorized as Level 2 in the hierarchy. Utilizing these techniques may result in transfers between Level 1 and Level 2. For equity securities, including restricted securities, where observable inputs are limited, assumptions about market activity and risk are used and these securities may be categorized as Level 3 in the hierarchy.
Investments in open-end mutual funds, including the Fidelity Central Funds, are valued at their closing net asset value (NAV) each business day and are categorized as Level 1 in the hierarchy.
Changes in valuation techniques may result in transfers in or out of an assigned level within the disclosure hierarchy.
Foreign Currency. The Fund may use foreign currency contracts to facilitate transactions in foreign-denominated securities. Gains and losses from these transactions may arise from changes in the value of the foreign currency or if the counterparties do not perform under the contracts' terms.
Foreign-denominated assets, including investment securities, and liabilities are translated into U.S. dollars at the exchange rates at period end. Purchases and sales of investment securities, income and dividends received and expenses denominated in foreign currencies are translated into U.S. dollars at the exchange rate in effect on the transaction date.
The effects of exchange rate fluctuations on investments are included with the net realized and unrealized gain (loss) on investment securities. Other foreign currency transactions resulting in realized and unrealized gain (loss) are disclosed separately.
Investment Transactions and Income. For financial reporting purposes, the Fund's investment holdings and NAV include trades executed through the end of the last business day of the period. The NAV per share for processing shareholder transactions is calculated as of the close of business of the New York Stock Exchange (NYSE), normally 4:00 p.m. Eastern time and includes trades executed through the end of the prior business day. Gains and losses on securities sold are determined on the basis of identified cost. Dividend income is recorded on the ex-dividend date, except for certain dividends from foreign securities where the ex-dividend date may have passed, which are recorded as soon as the Fund is informed of the ex-dividend date. Non-cash dividends included in dividend income, if any, are recorded at the fair market value of the securities received. Income and capital gain distributions from Fidelity Central Funds, if any, are recorded on the ex-dividend date. Distributions received on securities that represent a return of capital or capital gain are recorded as a reduction of cost of investments and/or as a realized gain. Subsequent to ex-dividend date the Fund determines the components of these distributions, based upon receipt of tax filings or other correspondence relating to the underlying investment. Investment income is recorded net of foreign taxes withheld where recovery of such taxes is uncertain.
Class Allocations and Expenses. Investment income, realized and unrealized capital gains and losses, common expenses of the Fund, and certain fund-level expense reductions, if any, are allocated daily on a pro-rata basis to each class based on the relative net assets of each class to the total net assets of the Fund. Each class differs with respect to transfer agent fees incurred. Certain expense reductions may also differ by class. For the reporting period, the allocated portion of income and expenses to each class as a percent of its average net assets may vary due to the timing of recording these transactions in relation to fluctuating net assets of the classes. Expenses directly attributable to a fund are charged to that fund. Expenses attributable to more than one fund are allocated among the respective funds on the basis of relative net assets or other appropriate methods. Expense estimates are accrued in the period to which they relate and adjustments are made when actual amounts are known.
Income Tax Information and Distributions to Shareholders. Each year, the Fund intends to qualify as a regulated investment company under Subchapter M of the Internal Revenue Code, including distributing substantially all of its taxable income and realized gains. As a result, no provision for U.S. Federal income taxes is required. The Fund files a U.S. federal tax return, in addition to state and local tax returns as required. The Fund's federal income tax returns are subject to examination by the Internal Revenue Service (IRS) for a period of three fiscal years after they are filed. State and local tax returns may be subject to examination for an additional fiscal year depending on the jurisdiction. Foreign taxes are provided for based on the Fund's understanding of the tax rules and rates that exist in the foreign markets in which it invests.
Distributions are declared and recorded on the ex-dividend date. Income dividends and capital gain distributions are declared separately for each class. Income and capital gain distributions are determined in accordance with income tax regulations, which may differ from GAAP. These differences resulted in distribution reclassifications for the period ended December 31, 2015.
Capital accounts within the financial statements are adjusted for permanent book-tax differences. These adjustments have no impact on net assets or the results of operations. Capital accounts are not adjusted for temporary book-tax differences which will reverse in a subsequent period.
Book-tax differences are primarily due to futures contracts, foreign currency transactions, partnerships and losses deferred due to wash sales.
The federal tax cost of investment securities and unrealized appreciation (depreciation) as of period end were as follows:
| Gross unrealized appreciation | $27,044,090 |
| Gross unrealized depreciation | (1,586,161) |
| Net unrealized appreciation (depreciation) on securities | $25,457,929 |
| Tax cost | $123,726,995 |
Trading (Redemption) Fees. Shares held by investors less than 60 days may be subject to a redemption fee equal to 1% of the NAV of shares redeemed. All redemption fees, which reduce the proceeds of the shareholder redemption, are retained by the Fund and accounted for as an addition to paid in capital.
4. Purchases and Sales of Investments.
Purchases and sales of securities, other than short-term securities, aggregated $83,641,926 and $43,469,534, respectively.
5. Fees and Other Transactions with Affiliates.
Management Fee. Fidelity SelectCo, LLC (the investment adviser) and its affiliates provide the Fund with investment management related services for which the Fund pays a monthly management fee. The management fee is the sum of an individual fund fee rate that is based on an annual rate of .30% of the Fund's average net assets and an annualized group fee rate that averaged .25% during the period. The group fee rate is based upon the average net assets of all the mutual funds advised by Fidelity Management & Research Company (FMR) and the investment adviser. The group fee rate decreases as assets under management increase and increases as assets under management decrease. For the reporting period, the total annualized management fee rate was .54% of the Fund's average net assets.
Transfer Agent Fees. Fidelity Investments Institutional Operations Company, Inc. (FIIOC), an affiliate of the investment adviser, is the Fund's transfer, dividend disbursing, and shareholder servicing agent. FIIOC receives an asset-based fee with respect to each class. Each class (with the exception of Investor Class) pays a fee for transfer agent services, typesetting, and printing and mailing of shareholder reports, excluding mailing of proxy statements, equal to an annual rate of .07% (.15% for Investor Class) of class-level average net assets. For the period, transfer agent fees for each class were as follows:
| Initial Class | $10,006 |
| Investor Class | 59,778 |
| | $69,784 |
Accounting and Security Lending Fees. Fidelity Service Company, Inc. (FSC), an affiliate of the investment adviser, maintains the Fund's accounting records. The accounting fee is based on the level of average net assets for each month. Under a separate contract, FSC administers the security lending program. The security lending fee is based on the number and duration of lending transactions.
Brokerage Commissions. The Fund placed a portion of its portfolio transactions with brokerage firms which are affiliates of the investment adviser. Brokerage commissions are included in net realized gain (loss) and change in net unrealized appreciation (depreciation) in the Statement of Operations. The commissions paid to these affiliated firms were $2,022 for the period.
Interfund Trades. The Fund may purchase from or sell securities to other Fidelity Funds under procedures adopted by the Board. The procedures have been designed to ensure these interfund trades are executed in accordance with Rule 17a-7 of the 1940 Act. Interfund trades are included within the respective purchases and sales amounts shown in the Purchases and Sales of Investments note.
6. Committed Line of Credit.
The Fund participates with other funds managed by the investment adviser or an affiliate in a $4.25 billion credit facility (the "line of credit") to be utilized for temporary or emergency purposes to fund shareholder redemptions or for other short-term liquidity purposes. The Fund has agreed to pay commitment fees on its pro-rata portion of the line of credit, which amounted to $76 and is reflected in Miscellaneous expenses on the Statement of Operations. During the period, the Fund did not borrow on this line of credit.
7. Security Lending.
The Fund lends portfolio securities through a lending agent from time to time in order to earn additional income. On the settlement date of the loan, the Fund receives collateral (in the form of U.S. Treasury obligations, letters of credit and/or cash) against the loaned securities and maintains collateral in an amount not less than 100% of the market value of the loaned securities during the period of the loan. The market value of the loaned securities is determined at the close of business of the Fund and any additional required collateral is delivered to the Fund on the next business day. The Fund or borrower may terminate the loan at any time, and if the borrower defaults on its obligation to return the securities loaned because of insolvency or other reasons, the Fund may apply collateral received from the borrower against the obligation. The Fund may experience delays and costs in recovering the securities loaned. Any cash collateral received is invested in the Fidelity Securities Lending Cash Central Fund. The value of loaned securities and cash collateral at period end are disclosed on the Fund's Statement of Assets and Liabilities. Security lending income represents the income earned on investing cash collateral, less rebates paid to borrowers and any lending agent fees associated with the loan, plus any premium payments received for lending certain types of securities. Security lending income is presented in the Statement of Operations as a component of income from Fidelity Central Funds. Total security lending income during the period amounted to $3,685.
8. Expense Reductions.
Commissions paid to certain brokers with whom the investment adviser, or its affiliates, places trades on behalf of the Fund include an amount in addition to trade execution, which may be rebated back to the Fund to offset certain expenses. This amount totaled $4,646 for the period.
Through arrangements with the Fund's custodian and each class' transfer agent, credits realized as a result of certain uninvested cash balances were used to reduce the Fund's expenses. During the period, these credits reduced the Fund's custody expenses by $6.
In addition, the investment adviser reimbursed and/or waived a portion of fund-level operating expenses in the amount of $281.
9. Distributions to Shareholders.
Distributions to shareholders of each class were as follows:
| | Six months ended
June 30, 2016 | Year ended December 31, 2015 |
| From net investment income | | |
| Initial Class | $– | $538,338 |
| Investor Class | – | 1,362,076 |
| Total | $– | $1,900,414 |
| From net realized gain | | |
| Initial Class | $470,790 | $1,070,343 |
| Investor Class | 1,264,590 | 2,872,215 |
| Total | $1,735,380 | $3,942,558 |
10. Share Transactions.
Transactions for each class of shares were as follows:
| | Shares | Shares | Dollars | Dollars |
| | Six months ended
June 30, 2016 | Year ended December 31, 2015 | Six months ended
June 30, 2016 | Year ended December 31, 2015 |
| Initial Class | | | | |
| Shares sold | 930,202 | 216,532 | $13,134,687 | $3,268,091 |
| Reinvestment of distributions | 35,802 | 115,760 | 470,790 | 1,608,681 |
| Shares redeemed | (169,139) | (1,009,319) | (2,421,391) | (14,602,864) |
| Net increase (decrease) | 796,865 | (677,027) | $11,184,086 | $(9,726,092) |
| Investor Class | | | | |
| Shares sold | 2,707,171 | 756,021 | $38,204,029 | $11,154,388 |
| Reinvestment of distributions | 96,681 | 305,398 | 1,264,590 | 4,234,291 |
| Shares redeemed | (220,981) | (2,856,599) | (3,160,202) | (40,932,261) |
| Net increase (decrease) | 2,582,871 | (1,795,180) | $36,308,417 | $(25,543,582) |
11. Other.
The Fund's organizational documents provide former and current trustees and officers with a limited indemnification against liabilities arising in connection with the performance of their duties to the Fund. In the normal course of business, the Fund may also enter into contracts that provide general indemnifications. The Fund's maximum exposure under these arrangements is unknown as this would be dependent on future claims that may be made against the Fund. The risk of material loss from such claims is considered remote.
At the end of the period, the investment adviser or its affiliates were the owners of 100% of the total outstanding shares of the fund.
Shareholder Expense Example
As a shareholder of the Fund, you incur two types of costs: (1) transaction costs, including redemption fees and (2) ongoing costs, including management fees and other Fund expenses. This Example is intended to help you understand your ongoing costs (in dollars) of investing in the Fund and to compare these costs with the ongoing costs of investing in other mutual funds.
The Example is based on an investment of $1,000 invested at the beginning of the period and held for the entire period (January 1, 2016 to June 30, 2016).
Actual Expenses
The first line of the accompanying table for each class of the Fund provides information about actual account values and actual expenses. You may use the information in this line, together with the amount you invested, to estimate the expenses that you paid over the period. Simply divide your account value by $1,000.00 (for example, an $8,600 account value divided by $1,000.00 = 8.6), then multiply the result by the number in the first line for a class of the Fund under the heading entitled "Expenses Paid During Period" to estimate the expenses you paid on your account during this period. The estimate of expenses does not include any fees or other expenses of any variable annuity or variable life insurance product. If they were, the estimate of expenses you paid during the period would be higher, and your ending account value would be lower. In addition, the Fund, as a shareholder in the underlying Fidelity Central Funds, will indirectly bear its pro-rata share of the fees and expenses incurred by the underlying Fidelity Central Funds. These fees and expenses are not included in the Fund's annualized expense ratio used to calculate the expense estimate in the table below.
Hypothetical Example for Comparison Purposes
The second line of the accompanying table for each class of the Fund provides information about hypothetical account values and hypothetical expenses based on a Class' actual expense ratio and an assumed rate of return of 5% per year before expenses, which is not the Class' actual return. The hypothetical account values and expenses may not be used to estimate the actual ending account balance or expenses you paid for the period. You may use this information to compare the ongoing costs of investing in the Fund and other funds. To do so, compare this 5% hypothetical example with the 5% hypothetical examples that appear in the shareholder reports of the other funds. The estimate of expenses does not include any fees or other expenses of any variable annuity or variable life insurance product. If they were, the estimate of expenses you paid during the period would be higher, and your ending account value would be lower. In addition, the Fund, as a shareholder in the underlying Fidelity Central Funds, will indirectly bear its pro-rata share of the fees and expenses incurred by the underlying Fidelity Central Funds. These fees and expenses are not included in the Fund's annualized expense ratio used to calculate the expense estimate in the table below.
Please note that the expenses shown in the table are meant to highlight your ongoing costs only and do not reflect any transaction costs. Therefore, the second line of the table is useful in comparing ongoing costs only, and will not help you determine the relative total costs of owning different funds. In addition, if these transactional costs were included, your costs would have been higher.
| | Annualized Expense Ratio-A | Beginning
Account Value
January 1, 2016 | Ending
Account Value
June 30, 2016 | Expenses Paid
During Period-B
January 1, 2016
to June 30, 2016 |
| Initial Class | .70% | | | |
| Actual | | $1,000.00 | $1,215.00 | $3.86 |
| Hypothetical-C | | $1,000.00 | $1,021.38 | $3.52 |
| Investor Class | .78% | | | |
| Actual | | $1,000.00 | $1,213.70 | $4.29 |
| Hypothetical-C | | $1,000.00 | $1,020.98 | $3.92 |
A Annualized expense ratio reflects expenses net of applicable fee waivers.
B Expenses are equal to each Class' annualized expense ratio, multiplied by the average account value over the period, multiplied by 182/366 (to reflect the one-half year period).
C 5% return per year before expenses
Board Approval of Investment Advisory Contracts and Management Fees
VIP Utilities Portfolio
Each year, the Board of Trustees, including the Independent Trustees (together, the Board), votes on the renewal of the management contract with Fidelity SelectCo, LLC (SelectCo), an affiliate of Fidelity Management & Research Company (FMR), and the sub-advisory agreements with affiliates of FMR (together, the Advisory Contracts) for the fund. The Board, assisted by the advice of fund counsel and Independent Trustees' counsel, requests and considers a broad range of information relevant to the renewal of the Advisory Contracts throughout the year.
The Board meets regularly and, at each of its meetings, covers an extensive agenda of topics and materials and considers factors that are relevant to its annual consideration of the renewal of the fund's Advisory Contracts, including the services and support provided to the fund and its shareholders. The Board has established four standing committees (Committees) — Operations, Audit, Fair Valuation, and Governance and Nominating — each composed of and chaired by Independent Trustees with varying backgrounds, to which the Board has assigned specific subject matter responsibilities in order to enhance effective decision-making by the Board. The Operations Committee, of which all of the Independent Trustees are members, meets regularly throughout the year and considers, among other matters, information specifically related to the annual consideration of the renewal of the fund's Advisory Contracts. The Board, acting directly and through its Committees, requests and receives information concerning the annual consideration of the renewal of the fund's Advisory Contracts. The Board also meets as needed to consider matters specifically related to the Board's annual consideration of the renewal of the Advisory Contracts. Members of the Board may also meet with trustees of other Fidelity funds through ad hoc joint committees to discuss certain matters relevant to all of the Fidelity funds.
At its January 2016 meeting, the Board unanimously determined to renew the fund's Advisory Contracts. In reaching its determination, the Board considered all factors it believed relevant, including (i) the nature, extent, and quality of the services to be provided to the fund and its shareholders (including the investment performance of the fund); (ii) the competitiveness of the fund's management fee and total expense ratio relative to peer funds; (iii) the total costs of the services to be provided by and the profits to be realized by Fidelity from its relationships with the fund; and (iv) the extent to which, if any, economies of scale exist and would be realized as the fund grows, and whether any economies of scale are appropriately shared with fund shareholders.
In considering whether to renew the Advisory Contracts for the fund, the Board reached a determination, with the assistance of fund counsel and Independent Trustees' counsel and through the exercise of its business judgment, that the renewal of the Advisory Contracts was in the best interests of the fund and its shareholders and that the compensation payable under the Advisory Contracts was fair and reasonable. The Board's decision to renew the Advisory Contracts was not based on any single factor, but rather was based on a comprehensive consideration of all the information provided to the Board at its meetings throughout the year. The Board, in reaching its determination to renew the Advisory Contracts, was aware that shareholders of the fund have a broad range of investment choices available to them, including a wide choice among funds offered by Fidelity's competitors, and that the fund's shareholders, who have the opportunity to review and weigh the disclosure provided by the fund in its prospectus and other public disclosures, have chosen to invest in this fund, which is part of the Fidelity family of funds.
Nature, Extent, and Quality of Services Provided. The Board considered the staffing of SelectCo and the sub-advisers (together with SelectCo, the Investment Advisers) as it relates to the fund, including the backgrounds of investment personnel of SelectCo, and also considered the fund's investment objective, strategies, and related investment philosophy. The Independent Trustees also had discussions with senior management of Fidelity's investment operations and investment groups. The Board considered the structure of the investment personnel compensation program and whether this structure provides appropriate incentives to act in the best interests of the fund. Additionally, the Board considered the portfolio managers' investments, if any, in the funds that they manage.
Resources Dedicated to Investment Management and Support Services. The Board reviewed the general qualifications and capabilities of the investment staff of the Investment Advisers, including their size, education, experience, and resources, as well as Fidelity's approach to recruiting, training, managing, and compensating investment personnel. The Board noted that Fidelity has continued to increase the resources devoted to non-U.S. offices, including expansion of Fidelity's global investment organization. The Board also noted that Fidelity's analysts have extensive resources, tools and capabilities that allow them to conduct sophisticated quantitative and fundamental analysis, as well as credit analysis of issuers, counterparties and guarantors. Further, the Board considered that Fidelity's investment professionals have sufficient access to global information and data so as to provide competitive investment results over time, and that those professionals also have access to sophisticated tools that permit them to assess portfolio construction and risk and performance attribution characteristics continuously, as well as to transmit new information and research conclusions rapidly around the world. Additionally, in its deliberations, the Board considered Fidelity's trading, risk management, compliance, and technology and operations capabilities and resources, which are integral parts of the investment management process.
Shareholder and Administrative Services. The Board considered (i) the nature, extent, quality, and cost of advisory, administrative, and shareholder services performed by the Investment Advisers and their affiliates under the Advisory Contracts and under separate agreements covering transfer agency, pricing and bookkeeping, and securities lending services for the fund; (ii) the nature and extent of the supervision of third party service providers, principally custodians, subcustodians, and pricing vendors; and (iii) the resources devoted to, and the record of compliance with, the fund's compliance policies and procedures. The Board also reviewed the allocation of fund brokerage, including allocations to brokers affiliated with the Investment Advisers, the use of brokerage commissions to pay fund expenses, and the use of "soft" commission dollars to pay for research services.
The Board noted that the growth of fund assets over time across the complex allows Fidelity to reinvest in the development of services designed to enhance the value or convenience of the Fidelity funds as investment vehicles. These services include 24-hour access to account information and market information through telephone representatives and over the Internet, investor education materials and asset allocation tools, and the expanded availability of Fidelity Investor Centers.
The Board noted that in 2014 the ad hoc Committee on Transfer Agency Fees was formed by it and the boards of certain other Fidelity funds to review the variety of transfer agency services and fee structures throughout the mutual fund industry compared to Fidelity's.
Investment in a Large Fund Family. The Board considered the benefits to shareholders of investing in a Fidelity fund, including the benefits of investing in a fund that is part of a large family of funds offering a variety of investment disciplines and providing a large variety of mutual fund investor services. The Board noted that Fidelity had taken, or had made recommendations that resulted in the Fidelity funds taking, a number of actions over the previous year that benefited particular funds, including (i) continuing to dedicate additional resources to investment research and to the support of the senior management team that oversees asset management; (ii) continuing efforts to enhance Fidelity's global research capabilities; (iii) launching new funds and making other enhancements to meet client needs; (iv) reducing management fees and total expenses for certain index funds; (v) continuing to launch dedicated lower cost underlying funds to meet portfolio construction needs related to expanding underlying fund options for Fidelity funds of funds, specifically for the Freedom Fund product lines; (vi) rationalizing product lines and gaining increased efficiencies through fund mergers; (vii) continuing to develop, acquire and implement systems and technology to improve services to the funds and shareholders, strengthen information security, and increase efficiency; (viii) implementing investment enhancements to further strengthen Fidelity's target date product line to increase investors' probability of success in achieving their goals; (ix) modifying the eligibility criteria for certain share classes to accommodate roll-over assets from employer-sponsored retirement plans; (x) launching a new Class W of the Freedom Index Funds to attract and retain Fidelity record-kept retirement plan assets; and (xi) implementing changes to Fidelity's money market fund product line in response to recent regulatory reforms.
Investment Performance. The Board considered whether the fund has operated in accordance with its investment objective, as well as its record of compliance with its investment restrictions and its performance history.
The Board took into account discussions with representatives of the Investment Advisers about fund investment performance that occur at Board meetings throughout the year. In this regard the Board noted that as part of regularly scheduled fund reviews and other reports to the Board on fund performance, the Board considers annualized return information for the fund, for different time periods, measured against a securities market index ("benchmark index"). In its evaluation of fund investment performance at meetings throughout the year, the Board gave particular attention to information indicating underperformance of certain Fidelity funds for specific time periods and discussed with the Investment Advisers the reasons for such underperformance.
In addition to reviewing absolute and relative fund performance, the Independent Trustees periodically consider the appropriateness of fund performance metrics in evaluating the results achieved. In general, the Independent Trustees believe that fund performance should be evaluated based on net performance (after fees and expenses) of both the highest performing and lowest performing fund share classes, where applicable, compared to appropriate benchmark indices, over appropriate time periods that may include full market cycles, taking into account relevant factors, including the following: general market conditions; issuer-specific information; and fund cash flows and other factors. Depending on the circumstances, the Independent Trustees may be satisfied with a fund's performance notwithstanding that it lags its benchmark index for certain periods.
The Independent Trustees recognize that shareholders evaluate performance on a net basis over their own holding periods, for which one-, three-, and five-year periods are often used as a proxy. For this reason, the performance information reviewed by the Board also included net cumulative total return information for the fund and an appropriate benchmark index for the most recent one-, three-, and five-year periods ended June 30, 2015.
Based on its review, the Board concluded that the nature, extent, and quality of services provided to the fund under the Advisory Contracts should benefit the shareholders of the fund.
Competitiveness of Management Fee and Total Expense Ratio. The Board considered the fund's management fee and total expense ratio compared to "mapped groups" of competitive funds and classes created for the purpose of facilitating the Trustees' analysis of the competitiveness of management fees and total expenses. Fidelity creates "mapped groups" by combining similar Lipper investment objective categories that have comparable investment mandates. For this purpose, all sector focused equity funds are grouped in the same mapped group. Combining Lipper investment objective categories aids the Board's management fee and total expense ratio comparisons by broadening the competitive group used for comparison.
Management Fee. The Board considered two proprietary management fee comparisons for the 12-month periods ended June 30 shown in basis points (BP) in the chart below. The group of Lipper funds used by the Board for management fee comparisons is referred to below as the "Total Mapped Group." The Total Mapped Group comparison focuses on a fund's standing in terms of gross management fees before expense reimbursements or caps relative to the total universe of funds with comparable investment mandates (
i.e., sector equities), regardless of whether their management fee structures also are comparable. Funds with comparable management fee structures have similar management fee contractual arrangements (
e.g., flat rate charged for advisory services, all-inclusive fee rate,
etc.). "TMG %" represents the percentage of funds in the Total Mapped Group that had management fees that were lower than the fund's. For example, a hypothetical TMG % of 20% would mean that 80% of the funds in the Total Mapped Group had higher, and 20% had lower, management fees than the fund. The fund's actual TMG %s and the number of funds in the Total Mapped Group are in the chart below. The "Asset-Size Peer Group" (ASPG) comparison focuses on a fund's standing relative to a subset of non-Fidelity funds within the Total Mapped Group that are similar in size and management fee structure. For example, if a fund is in the first quartile of the ASPG, the fund's management fee ranks in the least expensive or lowest 25% of funds in the ASPG. The ASPG represents at least 15% of the funds in the Total Mapped Group with comparable asset size and management fee structures, subject to a minimum of 50 funds (or all funds in the Total Mapped Group if fewer than 50). Additional information, such as the ASPG quartile in which the fund's management fee rate ranked, is also included in the chart and considered by the Board.
VIP Utilities Portfolio

The Board noted that the fund's management fee rate ranked below the median of its Total Mapped Group and below the median of its ASPG for the 12-month period ended June 30, 2015.
The Board noted that, in 2014, the ad hoc Committee on Group Fee was formed by it and the boards of other Fidelity funds to conduct an in-depth review of the "group fee" component of the management fee of funds with such management fee structures. Committee focus included the mechanics of the group fee, the competitive landscape of group fee structures, Fidelity funds with no group fee component and investment products not included in group fee assets. The Board also considered that, for funds subject to the group fee, FMR agreed to voluntarily waive fees over a specified period of time in amounts designed to account for assets converted from certain funds to certain collective investment trusts.
Based on its review, the Board concluded that the fund's management fee is fair and reasonable in light of the services that the fund receives and the other factors considered.
Total Expense Ratio. In its review of each class's total expense ratio, the Board considered the fund's management fee rate as well as other fund or class expenses, as applicable, such as transfer agent fees, pricing and bookkeeping fees, and custodial, legal, and audit fees. The Board also noted that Fidelity may agree to waive fees and expenses from time to time, and the extent to which, if any, it has done so for the fund. As part of its review, the Board also considered the current and historical total expense ratios of each class of the fund compared to competitive fund median expenses. Each class of the fund is compared to those funds and classes in the Total Mapped Group (used by the Board for management fee comparisons) that have a similar sales load structure.
The Board noted that the total expense ratio of each class ranked below the competitive median for the 12-month period ended June 30, 2015.
Fees Charged to Other Fidelity Clients. The Board also considered Fidelity fee structures and other information with respect to clients of Fidelity, such as other funds advised or subadvised by Fidelity, pension plan clients, and other institutional clients with similar mandates. The Board noted the findings of the 2013 ad hoc joint committee (created with the boards of other Fidelity funds), which reviewed and compared Fidelity's institutional investment advisory business with its business of providing services to the Fidelity funds, including the differences in services provided, fees charged, and costs incurred, as well as competition in their respective marketplaces.
Based on its review of total expense ratios and fees charged to other Fidelity clients, the Board concluded that the total expense ratio of each class of the fund was reasonable in light of the services that the fund and its shareholders receive and the other factors considered.
Costs of the Services and Profitability. The Board considered the revenues earned and the expenses incurred by Fidelity in conducting the business of developing, marketing, distributing, managing, administering and servicing the fund and servicing the fund's shareholders. The Board also considered the level of Fidelity's profits in respect of all the Fidelity funds.
On an annual basis, Fidelity presents to the Board information about the profitability of its relationship with the fund. Fidelity calculates profitability information for each fund, as well as aggregate profitability information for groups of Fidelity funds and all Fidelity funds, using a series of detailed revenue and cost allocation methodologies which originate with the books and records of Fidelity on which Fidelity's audited financial statements are based. The Audit Committee of the Board reviews any significant changes from the prior year's methodologies.
PricewaterhouseCoopers LLP (PwC), independent registered public accounting firm and auditor to Fidelity and certain Fidelity funds, has been engaged annually by the Board as part of the Board's assessment of the profitability analysis used by Fidelity. PwC's engagement includes the review and assessment of Fidelity's methodologies used in determining the revenues and expenses attributable to Fidelity's mutual fund business, and completion of agreed-upon procedures in respect of the mathematical accuracy of fund profitability and its conformity to established allocation methodologies. After considering PwC's reports issued under the engagement and information provided by Fidelity, the Board concluded that while other allocation methods may also be reasonable, Fidelity's profitability methodologies are reasonable in all material respects.
The Board also reviewed Fidelity's non-fund businesses and fall-out benefits related to the mutual fund business as well as cases where Fidelity's affiliates may benefit from or be related to the fund's business.
The Board considered the costs of the services provided by and the profits realized by Fidelity in connection with the operation of the fund and was satisfied that the profitability was not excessive.
Economies of Scale. The Board considered whether there have been economies of scale in respect of the management of the Fidelity funds, whether the Fidelity funds (including the fund) have appropriately benefited from any such economies of scale, and whether there is potential for realization of any further economies of scale. The Board considered the extent to which the fund will benefit from economies of scale as assets grow through increased services to the fund, through waivers or reimbursements, or through fee or expense ratio reductions. The Board also noted that in 2013, it and the boards of other Fidelity funds created an ad hoc committee (the Economies of Scale Committee) to analyze whether Fidelity attains economies of scale in respect of the management and servicing of the Fidelity funds, whether the Fidelity funds have appropriately benefited from such economies of scale, and whether there is potential for realization of any further economies of scale.
The Board recognized that the fund's management contract incorporates a "group fee" structure, which provides for lower group fee rates as total group assets increase, and for higher group fee rates as total group assets decrease (with "group assets" defined to include fund assets under SelectCo's management plus assets under FMR's management). SelectCo calculates the group fee rates based on a tiered asset "breakpoint" schedule that varies based on asset class. The Board considered that the group fee is designed to deliver the benefits of economies of scale to fund shareholders when total group assets increase, even if assets of any particular fund are unchanged or have declined, because some portion of Fidelity's costs are attributable to services provided to all Fidelity funds, and all funds benefit if those costs can be allocated among more assets. The Board concluded that, given the group fee structure, fund shareholders will benefit from lower management fees as group assets increase at the fund complex level, regardless of whether Fidelity achieves any such economies of scale.
The Board concluded, taking into account the analysis of the Economies of Scale Committee, that economies of scale, if any, are being appropriately shared between fund shareholders and Fidelity.
Additional Information Requested by the Board. In order to develop fully the factual basis for consideration of the Fidelity funds' Advisory Contracts, the Board requested and received additional information on certain topics, including: (i) Fidelity's fund profitability methodology, profitability trends for certain funds, and the impact of certain factors on fund profitability results; (ii) portfolio manager changes that have occurred during the past year and the amount of the investment that each portfolio manager has made in the Fidelity fund(s) that he or she manages; (iii) Fidelity's compensation structure for portfolio managers, research analysts, and other key personnel, including its effects on fund profitability; (iv) the arrangements with and compensation paid to certain fund sub-advisers on behalf of the Fidelity funds; (v) Fidelity's long-term expectations for its offerings in the workplace investing channel; (vi) the methodology with respect to competitive fund data and peer group classifications; (vii) Fidelity's transfer agent fee, expense, and service structures for different funds and classes, and the impact of outsourcing, the increased use of omnibus accounts, and lower pricing in the retirement channel; and (viii) explanations regarding the relative total expense ratios of certain funds and classes, total expense competitive trends and methodologies for total expense competitive comparisons, and actions that might be taken by Fidelity to reduce total expense ratios for certain funds and classes or to achieve further economies of scale.
Based on its evaluation of all of the conclusions noted above, and after considering all factors it believed relevant, the Board concluded that the advisory fee structures are fair and reasonable, and that the fund's Advisory Contracts should be renewed.
VTELIC-SANN-0816
1.817394.111
Item 2.
Code of Ethics
Not applicable.
Item 3.
Audit Committee Financial Expert
Not applicable.
Item 4.
Principal Accountant Fees and Services
Not applicable.
Item 5.
Audit Committee of Listed Registrants
Not applicable.
Item 6.
Investments
(a)
Not applicable.
(b)
Not applicable
Item 7.
Disclosure of Proxy Voting Policies and Procedures for Closed-End Management Investment Companies
Not applicable.
Item 8.
Portfolio Managers of Closed-End Management Investment Companies
Not applicable.
Item 9.
Purchase of Equity Securities by Closed-End Management Investment Company and Affiliated Purchasers
Not applicable.
Item 10.
Submission of Matters to a Vote of Security Holders
There were no material changes to the procedures by which shareholders may recommend nominees to the Variable Insurance Products Fund IV’s Board of Trustees.
Item 11.
Controls and Procedures
(a)(i) The President and Treasurer and the Chief Financial Officer have concluded that the Variable Insurance Products Fund IV’s (the “Trust”) disclosure controls and procedures (as defined in Rule 30a-3(c) under the Investment Company Act) provide
reasonable assurances that material information relating to the Trust is made known to them by the appropriate persons, based on their evaluation of these controls and procedures as of a date within 90 days of the filing date of this report.
(a)(ii) There was no change in the Trust’s internal control over financial reporting (as defined in Rule 30a-3(d) under the Investment Company Act) that occurred during the second fiscal quarter of the period covered by this report that has materially affected, or is reasonably likely to materially affect, the Trust’s internal control over financial reporting.
Item 12.
Exhibits
| | |
(a) | (1) | Not applicable. |
(a) | (2) | Certification pursuant to Rule 30a-2(a) under the Investment Company Act of 1940 (17 CFR 270.30a-2(a)) is filed and attached hereto as Exhibit 99.CERT. |
(a) | (3) | Not applicable. |
(b) |
| Certification pursuant to Rule 30a-2(b) under the Investment Company Act of 1940 (17 CFR 270.30a-2(b)) is furnished and attached hereto as Exhibit 99.906CERT. |
SIGNATURES
Pursuant to the requirements of the Securities Exchange Act of 1934 and the Investment Company Act of 1940, the registrant has duly caused this report to be signed on its behalf by the undersigned, thereunto duly authorized.
Variable Insurance Products Fund IV
| |
By: | /s/Adrien E. Deberghes |
| Adrien E. Deberghes |
| President and Treasurer |
|
|
Date: | August 24, 2016 |
Pursuant to the requirements of the Securities Exchange Act of 1934 and the Investment Company Act of 1940, this report has been signed below by the following persons on behalf of the registrant and in the capacities and on the dates indicated.
| |
By: | /s/Adrien E. Deberghes |
| Adrien E. Deberghes |
| President and Treasurer |
|
|
Date: | August 24, 2016 |
| |
By: | /s/Howard J. Galligan III |
| Howard J. Galligan III |
| Chief Financial Officer |
|
|
Date: | August 24, 2016 |